Transmission of OFDM-UWB radio signals along multimode fiber in in-building networks Filipa Andreia Fernandes Henriques Dissertação para obtenção do Grau de Mestre em Engenharia Electrotécnica e de Computadores Júri Presidente: Prof. José Bioucas Dias Orientador: Prof. Adolfo da Visitação Tregeira Cartaxo Vogal: Prof. Paula Raquel Laurêncio 6 de Dezembro de 2010

Welcome message from author
This document is posted to help you gain knowledge. Please leave a comment to let me know what you think about it! Share it to your friends and learn new things together.
Transcript

Transmission of OFDM-UWB radio signals along multimode fiberin in-building networks
Filipa Andreia Fernandes Henriques
Dissertação para obtenção do Grau de Mestre em
Engenharia Electrotécnica e de Computadores
Júri
Presidente: Prof. José Bioucas Dias
Orientador: Prof. Adolfo da Visitação Tregeira Cartaxo
Vogal: Prof. Paula Raquel Laurêncio
6 de Dezembro de 2010

ii

Acknowledgments
First of all, I would like to thank to my supervisor, Professor Adolfo Cartaxo, for all the effort and
availability for helping me to complete successfully my master thesis. I would also like to thank him for
providing me access to all the materials I need during the development of this dissertation.
I would like to thank to my boyfriend André Neves for all the love, help, support and patience during
this chapter of my life. There is no words to describe how much it meant to me.
I would like to thank to my parents and to my close family for always giving me what I needed to be
happy. Their love and support helped me to get through the difficulties and always keep smiling.
I want to thank to my closest friends Rui Trindade, Nuno Couto, Filipe Wiener, André Chibeles,
André Esteves, Gonçalo Carmo, João Cabrita and Clara Sá Couto for being the best friends I could have.
I would like to thank to Instituto de Telecomunicações (IT) for providing me a monthly scholarship
and great facilities.
I would also like to thank to the PhD students Tiago Alves and Nelson da Costa, for all the availability
and kindness they had in answer to all my questions and helped me as much as they can.
iii

iv

Abstract
Nowadays, in-building networks are facing a new challenge of upgrading their capacity to exceeding
1 Gbit/s, in order to provide high definition television (HDTV) and new advanced multimedia-based
applications requiring even higher capacity than HDTV. The main characteristics of multimode fibers
(MMF) like the low cost and their efficiency in short-range links make these fibers adequate to be used
in in-building networks. The main features of orthogonal frequency division multiplexing (OFDM)
ultra-wideband (UWB) signals like the low intersymbol interference (ISI) and the tolerance to multipath
fading, make these signals appropriate to be used in MMF systems.
In this dissertation, the transmission of OFDM-UWB radio signals along multimode fibers in in-
building networks is analysed. A numerical model of the fiber modal dispersion is developed in MAT-
LAB. The transmission performance of the OFDM-UWB signals along the MMF is evaluated using the
semi-analytical Gaussian approach and the maximum distance for single and multi-band transmission is
assessed.
The numerical results show that the maximum transmission distance is very dependent on the power
launching conditions, on the fiber length and on the number of sub-bands used. The maximum assessed
distance ranges from 560 m (achieved for single-band transmission and for centred launching conditions)
to less than 50 m (achieved for simultaneous transmission of 3 OFDM-UWB sub-bands and for centred
launching conditions).
Keywords: Multimode optical fiber, OFDM-UWB signals, modal dispersion, launching conditions,
in-building networks.
v

vi
Resumo
Actualmente, as redes dentro de edifícios começam a ter necessidade de aumentar a sua capacidade
para débitos superiores a 1 Gbit/s, devido ao aparecimento da televisão de alta definição (HDTV) e outras
aplicações multimédia que exigem ainda mais capacidade que a HDTV. O custo reduzido das fibras
multimodo (MMF) e a sua elevada capacidade em ligações de curto alcance, tornam a sua utilização
vantajosa em redes ópticas dentro de edifícios. O uso de sinais de banda ultra-larga (UWB) e com
multiplexagem ortogonal por divisão na frequência (OFDM) de banda ultra-larga (UWB) é adequado
para a propagação em fibras multimodo devido à sua tolerância ao desvanecimento por multi-percurso e
à sua baixa interferência intersimbólica.
Nesta dissertação, a transmissão de sinais rádio OFDM-UWB em fibras multimodo é analisada. Esta
análise é feita através de um modelo numérico desenvolvido em MATLAB que simula a propagação nas
fibras multimodo.O desempenho do sistema é avaliado através do método gaussiano semi-analítico e as
distâncias máximas de transmissão para mono e multi-banda são identificadas.
Os resultados numéricos demonstram que a distância máxima de transmissão é fortemente depen-
dente das condições de lançamento de potência, do comprimento da fibra e do número de sub-bandas
usadas simultaneamente. A distância máxima de transmissão deste sistema varia entre 560 m (para
transmissão numa única banda e lançamento de potência centrado) e menos de 50 m (para transmissão
simultânea em três sub-bandas e lançamento de potência centrado).
Palavras-chave: Fibra óptica multimodo, sinais OFDM-UWB, dispersão modal, condições de
lançamento, redes ópticas dentro de edifícios.
vii

viii

Contents
1 Introduction 1
1.1 Scope of the work . . . . . . . . . . . . . . . . . . . . . . . . . . . . . . . . . . . . . . 1
1.2 Motivation . . . . . . . . . . . . . . . . . . . . . . . . . . . . . . . . . . . . . . . . . . 2
1.2.1 Evolution and challenges of the communication networks - Capacity demands . . 2
1.2.2 Optical fiber networks - Why to use multimode fibers? . . . . . . . . . . . . . . 5
1.3 Objectives and structure of the dissertation . . . . . . . . . . . . . . . . . . . . . . . . . 5
1.4 Contributions of this work . . . . . . . . . . . . . . . . . . . . . . . . . . . . . . . . . 6
2 OFDM-UWB system description and analysis 7
2.1 Description of the OFDM-UWB system . . . . . . . . . . . . . . . . . . . . . . . . . . 7
2.1.1 OFDM-UWB signals . . . . . . . . . . . . . . . . . . . . . . . . . . . . . . . . 8
2.1.2 OFDM-UWB transmitter . . . . . . . . . . . . . . . . . . . . . . . . . . . . . . 10
2.1.3 Mach-Zehnder modulator . . . . . . . . . . . . . . . . . . . . . . . . . . . . . 11
2.1.4 PIN . . . . . . . . . . . . . . . . . . . . . . . . . . . . . . . . . . . . . . . . . 13
2.1.5 OFDM-UWB receiver . . . . . . . . . . . . . . . . . . . . . . . . . . . . . . . 14
2.2 Back-to-back system results . . . . . . . . . . . . . . . . . . . . . . . . . . . . . . . . 15
2.2.1 Single-channel transmission . . . . . . . . . . . . . . . . . . . . . . . . . . . . 16
2.2.2 Multi-channel transmission . . . . . . . . . . . . . . . . . . . . . . . . . . . . . 17
2.3 Conclusions . . . . . . . . . . . . . . . . . . . . . . . . . . . . . . . . . . . . . . . . . 19
3 Propagation model of the step-index multimode fiber 21
3.1 Modal field theory . . . . . . . . . . . . . . . . . . . . . . . . . . . . . . . . . . . . . . 21
3.1.1 Field solutions in the core and cladding regions . . . . . . . . . . . . . . . . . . 22
3.1.2 Boundary conditions . . . . . . . . . . . . . . . . . . . . . . . . . . . . . . . . 26
3.2 Mode classification . . . . . . . . . . . . . . . . . . . . . . . . . . . . . . . . . . . . . 27
3.2.1 T E0,m and T M0,m modes . . . . . . . . . . . . . . . . . . . . . . . . . . . . . . 28
3.2.2 HEl+1,m modes . . . . . . . . . . . . . . . . . . . . . . . . . . . . . . . . . . . 30
ix
3.2.3 EHl−1,m modes . . . . . . . . . . . . . . . . . . . . . . . . . . . . . . . . . . . 32
3.3 Modal amplitude and modal power . . . . . . . . . . . . . . . . . . . . . . . . . . . . . 35
3.3.1 Source Field . . . . . . . . . . . . . . . . . . . . . . . . . . . . . . . . . . . . 37
3.4 Multimode fiber transfer function . . . . . . . . . . . . . . . . . . . . . . . . . . . . . . 40
3.4.1 Results analysis . . . . . . . . . . . . . . . . . . . . . . . . . . . . . . . . . . . 40
3.5 Conclusions . . . . . . . . . . . . . . . . . . . . . . . . . . . . . . . . . . . . . . . . . 47
4 Transmission along multimode fiber 49
4.1 Results for centred launching conditions . . . . . . . . . . . . . . . . . . . . . . . . . . 49
4.1.1 Single-band transmission . . . . . . . . . . . . . . . . . . . . . . . . . . . . . . 49
4.1.2 Multi-band transmission . . . . . . . . . . . . . . . . . . . . . . . . . . . . . . 55
4.2 Results for a launch offset of 20 µm . . . . . . . . . . . . . . . . . . . . . . . . . . . . 57
4.2.1 Single-band transmission . . . . . . . . . . . . . . . . . . . . . . . . . . . . . . 58
4.2.2 Multi-band transmission . . . . . . . . . . . . . . . . . . . . . . . . . . . . . . 62
4.3 Conclusions . . . . . . . . . . . . . . . . . . . . . . . . . . . . . . . . . . . . . . . . . 64
5 Conclusions and future work 67
5.1 Final Conclusions . . . . . . . . . . . . . . . . . . . . . . . . . . . . . . . . . . . . . . 67
5.2 Future Work . . . . . . . . . . . . . . . . . . . . . . . . . . . . . . . . . . . . . . . . . 68
A Mathematical Background 69
A.1 Relationships between Cartesian and cylindrical polar coordinates . . . . . . . . . . . . 69
A.2 Bessel Functions . . . . . . . . . . . . . . . . . . . . . . . . . . . . . . . . . . . . . . 69
B Numerical results for λ = 1310 nm 73
B.1 Mode Classification . . . . . . . . . . . . . . . . . . . . . . . . . . . . . . . . . . . . 73
B.2 Modal power distribution . . . . . . . . . . . . . . . . . . . . . . . . . . . . . . . . . . 77
C Mathematical derivation of the modal amplitude expression 81
D Coordinates System Conversion 83
E Optimizations 87
E.1 Mach-Zehnder Modulator . . . . . . . . . . . . . . . . . . . . . . . . . . . . . . . . . . 87
E.2 Order of the polynomial interpolator used to estimate the equalizer transfer function . . . 89
x

List of Figures
1.1 Growth of the internet users in the last 15 years (Source: http://www.internetworldstats.
com/emarketing.htm). The 2010 results are relative to the estimated number of users
in September of the same year. . . . . . . . . . . . . . . . . . . . . . . . . . . . . . . . 3
1.2 Representation of an in-building network (Source: http://alexandria.tue.nl/extra2/
200712406.pdf). . . . . . . . . . . . . . . . . . . . . . . . . . . . . . . . . . . . . . . 4
2.1 Block diagram of the OFDM-UWB system used in this work. . . . . . . . . . . . . . . . 7
2.2 Standardized sub-bands division. . . . . . . . . . . . . . . . . . . . . . . . . . . . . . . 8
2.3 Representative scheme of the time-frequency interleaving of the OFDM-UWB symbols. 9
2.4 Block diagram of the OFDM-UWB transmitter. . . . . . . . . . . . . . . . . . . . . . . 10
2.5 QPSK constellation generated at the OFDM-UWB transmitter. . . . . . . . . . . . . . . 10
2.6 OFDM-UWB signal at the transmitter’s output, in the time and frequency domain. . . . . 11
2.7 Mach-Zehnder modulator output for the first UWB sub-band, where fc represents the
optical carrier frequency. . . . . . . . . . . . . . . . . . . . . . . . . . . . . . . . . . . 12
2.8 Block diagram of the system PIN + pre-amplifier. . . . . . . . . . . . . . . . . . . . . . 13
2.9 Block diagram of the OFDM-UWB receiver. . . . . . . . . . . . . . . . . . . . . . . . . 14
2.10 Received I and Q components of the OFDM-UWB signal at the LPF’s output. . . . . . . 15
2.11 Block diagram of the OFDM-UWB system in back-to-back configuration. . . . . . . . . 15
2.12 Received constellations for the first and the second UWB sub-bands. . . . . . . . . . . . 16
2.13 Received constellations for the third and the fourth UWB sub-bands. . . . . . . . . . . . 16
2.14 Bit error ratio as a function of the optical power of the OFDM-UWB signal, for the first
and the second UWB sub-bands. The orange line represents a bit error ratio of 10−4. . . 17
2.15 Bit error ratio as a function of the optical power of the OFDM-UWB signal, for the third
and the fourth UWB sub-bands. The orange line represents a bit error ratio of 10−4. . . . 17
2.16 Received constellations for simultaneous transmission of the first two OFDM-UWB sub-
bands. . . . . . . . . . . . . . . . . . . . . . . . . . . . . . . . . . . . . . . . . . . . . 18
xi

2.17 Received constellations of the first and the second OFDM-UWB sub-band for simulta-
neous transmission of the first three OFDM-UWB sub-bands. . . . . . . . . . . . . . . . 18
2.18 Received constellation of the third OFDM-UWB sub-band for simultaneous transmission
of the first three OFDM-UWB sub-bands. . . . . . . . . . . . . . . . . . . . . . . . . . 18
2.19 Bit error ratio as a function of the optical power of the OFDM-UWB signal, for simul-
taneous transmission of two and three sub-bands. The orange line represents a bit error
ratio of 10−4. . . . . . . . . . . . . . . . . . . . . . . . . . . . . . . . . . . . . . . . . 19
3.1 Representation of the geometry used for the calculation of the modal dispersion in the
multimode fiber (Source: Light Emitting-Diodes, E. Schubert). . . . . . . . . . . . . . . 21
3.2 Representation of the chromatic dispersion effect in multimode fiber propagation. . . . . 22
3.3 Representation of the two coordinates systems used to represent the electric and magnetic
fields in the multimode fiber. . . . . . . . . . . . . . . . . . . . . . . . . . . . . . . . . 22
3.4 Representation of the Bessel function of the first kind for l = 0,1,2 and of the modified
Bessel function of the second kind for l = 0,1. (Source: Multi-gigabit Transmission
Over Multimode Optical Fiber: Theory and Design Methods for 10 GbE Systems, S.
Bottacchi) . . . . . . . . . . . . . . . . . . . . . . . . . . . . . . . . . . . . . . . . . . 25
3.5 Graphical solutions of the eigenvalue equation for T E0m and T M0m modes. The blue and
the green line represents the two parcels of the eigenequation presented in Equation 3.12,
respectively. The intersection of the eigenequation members gives the total number of
T E0m and T M0m modes. . . . . . . . . . . . . . . . . . . . . . . . . . . . . . . . . . . 29
3.6 Graphical solutions of the eigenvalue equation for HE1m modes. The blue and the green
line represents the two parcels of the eigenequation presented in Equation 3.13 for l = 0,
respectively. The intersection of the eigenequation members gives the total number of
HE1,m modes. . . . . . . . . . . . . . . . . . . . . . . . . . . . . . . . . . . . . . . . . 31
3.7 Graphical solutions of the eigenvalue equation for HE5m modes. The blue and the green
line represents the two parcels of the eigenequation presented in Equation 3.13 for l = 4,
respectively. The intersection of the eigenequation members gives the total number of
HE5,m modes. It is possible to see that for l = 4, the number of available solutions is
smaller than for l = 0. . . . . . . . . . . . . . . . . . . . . . . . . . . . . . . . . . . . . 31
3.8 Graphical solutions of the eigenvalue equation for HE18m modes.In this situation, there
is only one interception between the eigenequation members. . . . . . . . . . . . . . . . 32
3.9 Graphical solutions of the eigenvalue equation for HE19m modes. There is no intersection
between the eigenequation members, so this mode will never be sustained by the fiber
used. . . . . . . . . . . . . . . . . . . . . . . . . . . . . . . . . . . . . . . . . . . . . . 32
xii

3.10 Graphical solutions of the eigenvalue equation for EH1m modes. . . . . . . . . . . . . . 34
3.11 Graphical solutions of the eigenvalue equation for EH5m modes. . . . . . . . . . . . . . 34
3.12 Graphical solutions of the eigenvalue equation for EH16m modes. . . . . . . . . . . . . . 35
3.13 Graphical solutions of the eigenvalue equation for EH17m modes. There is no intersection
between the eigenequation members, so this mode will never be supported by the fiber
used. . . . . . . . . . . . . . . . . . . . . . . . . . . . . . . . . . . . . . . . . . . . . . 35
3.14 Representative scheme of the light launching from the SMF to the MMF. Only the core
of both fibers are represented, since the largest amount of power is contained in these
regions. . . . . . . . . . . . . . . . . . . . . . . . . . . . . . . . . . . . . . . . . . . . 37
3.15 Color representation of the amplitude distribution of the SMF electric field for a launch
power of 1 mW. . . . . . . . . . . . . . . . . . . . . . . . . . . . . . . . . . . . . . . . 40
3.16 Amplitude response for a fiber length of 100m and for centred fiber axes and for a launch
offset of 20 µm. The vertical colored lines represents the RF carrier frequency of each
of the 14 UWB sub-bands. . . . . . . . . . . . . . . . . . . . . . . . . . . . . . . . . . 41
3.17 Amplitude response for a fiber length of 500m and for centred fiber axes and for a launch
offset of 20 µm. The vertical colored lines represents the RF carrier frequency of each
of the 14 UWB sub-bands. . . . . . . . . . . . . . . . . . . . . . . . . . . . . . . . . . 41
3.18 Delay response for a fiber length of 100 m and for centred fiber axes and for a launch
offset of 20 µm. . . . . . . . . . . . . . . . . . . . . . . . . . . . . . . . . . . . . . . . 42
3.19 Delay response for a fiber length of 500 m and for centred fiber axes and for a launch
offset of 20 µm. . . . . . . . . . . . . . . . . . . . . . . . . . . . . . . . . . . . . . . . 43
3.20 Power fraction of the HE1m modes for a fiber length of 100 m and centred launching
conditions. In this situation, only the lower order HE1m modes are excited. . . . . . . . . 44
3.21 Power fraction of the HE1m and T E0m modes for a fiber length of 100 m and a launch
offset of 20 µm. . . . . . . . . . . . . . . . . . . . . . . . . . . . . . . . . . . . . . . 44
3.22 Power fraction of the EH(l−1),m modes for l = 2,4,6,8,10,12, for a fiber length of 100 m
and a launch offset of 20 µm. . . . . . . . . . . . . . . . . . . . . . . . . . . . . . . . . 44
3.23 Power fraction of the EH(l−1),m modes for l = 14,16 and HE(l+1),m modes for l = 2,4,6,
for a fiber length of 100 m and a launch offset of 20 µm. . . . . . . . . . . . . . . . . . 45
3.24 Power fraction of the HE(l+1),m modes for l = 8,10,12,14,16, for a fiber length of 100 m
and a launch offset of 20 µm. . . . . . . . . . . . . . . . . . . . . . . . . . . . . . . . 45
3.25 Modal amplitudes of the T E0,m and T M0,m modes. . . . . . . . . . . . . . . . . . . . . . 46
3.26 Modal amplitudes of the HEl+1,m modes, for the first eight values of the azimuth mode
number l. . . . . . . . . . . . . . . . . . . . . . . . . . . . . . . . . . . . . . . . . . . 46
xiii
3.27 Modal amplitudes of the EHl−1,m modes, for the first eight values of azimuth mode
number l. . . . . . . . . . . . . . . . . . . . . . . . . . . . . . . . . . . . . . . . . . . 46
4.1 Performance of the OFDM-UWB system for the first OFDM-UWB sub-band. The or-
ange line represents the target bit error ratio of this system. . . . . . . . . . . . . . . . . 50
4.2 Performance of the OFDM-UWB system for the second OFDM-UWB sub-band. The
orange line represents the target bit error ratio of this system. . . . . . . . . . . . . . . . 50
4.3 Performance of the OFDM-UWB system for the third OFDM-UWB sub-band. The or-
ange line represents the target bit error ratio of this system. . . . . . . . . . . . . . . . . 51
4.4 Performance of the OFDM-UWB system for the fourth OFDM-UWB sub-band. The
orange line represents the target bit error ratio of this system. . . . . . . . . . . . . . . . 51
4.5 Multimode fiber amplitude for a fiber length of 100 m, in the third UWB sub-band. . . . 52
4.6 Multimode fiber amplitude response for a fiber length of 100 m, in the fourth UWB
sub-band. . . . . . . . . . . . . . . . . . . . . . . . . . . . . . . . . . . . . . . . . . . 53
4.7 Equalizer transfer function for a fiber length of 600 m, in the third OFDM-UWB sub-band. 54
4.8 Received constellations for fiber lengths of 100 m and 500 m, in the third UWB sub-band. 54
4.9 Received constellations for a fiber length of 600 m, in the third UWB sub-band. . . . . . 55
4.10 Performance of the OFDM-UWB system for simultaneous transmission of the first and
the fourth UWB sub-bands. The orange line represents the target bit error ratio of the
system. . . . . . . . . . . . . . . . . . . . . . . . . . . . . . . . . . . . . . . . . . . . 56
4.11 Performance of the OFDM-UWB system for simultaneous transmission of the first, sec-
ond and third UWB sub-bands. The orange line represents the target bit error ratio of the
system. . . . . . . . . . . . . . . . . . . . . . . . . . . . . . . . . . . . . . . . . . . . 56
4.12 Received constellations for a fiber length of 200 m, in the case of having simultaneous
transmission of the first three sub-bands. . . . . . . . . . . . . . . . . . . . . . . . . . . 57
4.13 Received constellation for a fiber length of 200 m, in the case of having simultaneous
transmission of the first three sub-bands - UWB 3. . . . . . . . . . . . . . . . . . . . . . 57
4.14 Performance of the OFDM-UWB system of the first OFDM-UWB sub-band, for a launch
offset of 20 µm. The orange line represents the target bit error ratio of this system. . . . 58
4.15 Performance of the OFDM-UWB system of the second OFDM-UWB sub-band, for a
launch offset of 20 µm. The orange line represents the target bit error ratio of this system. 58
4.16 Performance of the OFDM-UWB system of the third OFDM-UWB sub-band, for a
launch offset of 20 µm. The orange line represents the target bit error ratio of this system. 59
4.17 Performance of the OFDM-UWB system of the fourth OFDM-UWB sub-band, for a
launch offset of 20 µ m. The orange line represents the target bit error ratio of this system. 59
xiv

4.18 Multimode fiber amplitude response of a fiber length of 100 m, in the third UWB sub-
band and for a launch offset of 20 µm. . . . . . . . . . . . . . . . . . . . . . . . . . . . 60
4.19 Multimode fiber amplitude response of a fiber length of 100 m, in the fourth UWB sub-
band and for a launch offset of 20 µm. . . . . . . . . . . . . . . . . . . . . . . . . . . . 61
4.20 Channel transfer functions for a launch offset of 20 µm in the fourth UWB sub-band, for
a fiber length of 270 m. . . . . . . . . . . . . . . . . . . . . . . . . . . . . . . . . . . . 61
4.21 Received constellations of the fourth UWB sub-band for a launch offset of 20 µm, for
fiber lengths of 100 m and 270 m. . . . . . . . . . . . . . . . . . . . . . . . . . . . . . 62
4.22 Received constellations of the fourth UWB sub-band for a launch offset of 20 µm for
fiber lengths of 300 m. . . . . . . . . . . . . . . . . . . . . . . . . . . . . . . . . . . . 62
4.23 Performance of the OFDM-UWB system for simultaneous transmission of the first and
second UWB sub-bands, for a launch offset of 20 µm. The orange line represents the
target bit error ratio of the system. . . . . . . . . . . . . . . . . . . . . . . . . . . . . . 63
4.24 Performance of the OFDM-UWB system for simultaneous transmission of the first, sec-
ond and third UWB sub-band, for a launch offset of 20 µm. The orange line represents
the target bit error ratio of the system. . . . . . . . . . . . . . . . . . . . . . . . . . . . 63
4.25 Received constellations for a fiber length of 300 m for a launch offset of 20 µm, of the
case of having simultaneous transmission of the first three sub-bands. . . . . . . . . . . 64
4.26 Received constellation for a fiber length of 300 m for a launch offset of 20 µm, in the
case of having simultaneous transmission of the first three sub-bands - UWB 3. . . . . . 64
B.1 Graphical solutions of the eigenvalue equation for T E0,m and T M,0m modes. . . . . . . . 74
B.2 Graphical solutions of the eigenvalue equation for HE1m modes. . . . . . . . . . . . . . 75
B.3 Eigenequation solutions near to the cut-off value. For the HE22,m, there is no intersec-
tions between the eigenequation members, so the HE21,m mode is the last allowed mode
for this fiber. . . . . . . . . . . . . . . . . . . . . . . . . . . . . . . . . . . . . . . . . . 75
B.4 Graphical solutions of the eigenvalue equation for EH1,m modes. . . . . . . . . . . . . . 76
B.5 Eigenequation solutions near to the cut-off value. For the EH20,m, there is no intersec-
tions between the eigenequation members, so the EH19,m mode is the last allowed mode
for this fiber. . . . . . . . . . . . . . . . . . . . . . . . . . . . . . . . . . . . . . . . . . 77
B.6 Power fraction of the HE1,m modes for centred launching conditions. In this situation,
only the lower order HE1,m modes are excited. . . . . . . . . . . . . . . . . . . . . . . . 77
B.7 Power fraction of the HE1,m and T E0,m modes for a launch offset of 20 µm. . . . . . . . 78
B.8 Power fraction of the EH(l−1),m modes for l = 2,4,6,8,10,12, for a launch offset of 20
µm. . . . . . . . . . . . . . . . . . . . . . . . . . . . . . . . . . . . . . . . . . . . . . 78
xv

B.9 Power fraction of the EH(l−1),m modes for l = 14,16,18,20, for a launch offset of 20 µm. 78
B.10 Power fraction of the HE(l+1),m modes for l = 4,6,8,10,12,14, for a launch offset of 20
µm. . . . . . . . . . . . . . . . . . . . . . . . . . . . . . . . . . . . . . . . . . . . . . 79
B.11 Power fraction of the HE(l+1),m modes for l = 14,16,18,20, for a launch offset of 20 µm. 79
D.1 Axial representation of the SMF and the MMF core radius. . . . . . . . . . . . . . . . . 83
D.2 Geometrical interpretation of the coordinates system conversion problem. . . . . . . . . 84
E.1 Received constellations for Vbias = 2Vπ
3 and a modulation index of 10% and for Vbias =Vπ
3
and a modulation index of 30%, respectively. . . . . . . . . . . . . . . . . . . . . . . . 88
E.2 Received constellation for a Vbias =Vπ
2 and a modulation index of 10%. . . . . . . . . . . 89
E.3 Received constellations for a fiber length of 500 m and signal transmission on the third
UWB sub-band and for a interpolation polynomial of order 1 and 6. . . . . . . . . . . . 90
E.4 Received constellations for a fiber length of 500 m, and signal transmission on the third
UWB sub-band and for interpolation polynomial of order 3. . . . . . . . . . . . . . . . 90
xvi

List of Tables
2.1 Parameters used for simulate the Mach-Zehnder modulator. . . . . . . . . . . . . . . . . 12
2.2 Parameters used for the electrical noise. . . . . . . . . . . . . . . . . . . . . . . . . . . 14
3.1 Transversal modal fields of the weakly guiding step-profile multimode fiber. . . . . . . . 26
3.2 Parameters used for simulate a step-profile multimode fiber. . . . . . . . . . . . . . . . . 27
3.3 Computed eigenvalue for T E0m and T M0m modes. . . . . . . . . . . . . . . . . . . . . . 29
3.4 Computed propagation constants for HEl+1,m modes for l = 0,1,2,3,4. . . . . . . . . . 30
3.5 Computed propagation constants for EHl−1,m modes for l = 2,3,4,5,6. . . . . . . . . . 33
3.6 Electromagnetic field of the single mode fiber. . . . . . . . . . . . . . . . . . . . . . . . 38
3.7 Parameters used for simulate a step-profile single mode fiber. . . . . . . . . . . . . . . . 39
3.8 Power coupling losses for different launching conditions. . . . . . . . . . . . . . . . . . 43
4.1 Performance of the overall system for fiber lengths of 100 m, 500 m and 1000 m, for the
first four UWB sub-bands. . . . . . . . . . . . . . . . . . . . . . . . . . . . . . . . . . 52
4.2 Performance of the overall system for a launch offset of 20 µm, for fiber lengths of 100
m, 500 m and 1000 m, for the first four UWB sub-bands. . . . . . . . . . . . . . . . . . 60
B.1 Computed eigenvalue for T E0,m and T M0,m modes. . . . . . . . . . . . . . . . . . . . . 73
B.2 Computed eigenvalue for HEl+1,m modes for l = 0,1,2,3,4. . . . . . . . . . . . . . . . 74
B.3 Computed eigenvalue for EHl−1,m modes for l = 2,3,4,5. . . . . . . . . . . . . . . . . . 76
E.1 Optimization of the modulation index and of the Vbias based on the BER and on the SNR
of the overall system. . . . . . . . . . . . . . . . . . . . . . . . . . . . . . . . . . . . . 88
E.2 Optimization of the polynomial interpolation order as a function of the SNR and of the
BER of the overall system. . . . . . . . . . . . . . . . . . . . . . . . . . . . . . . . . . 89
xvii

xviii

List of acronyms
3DHD 3D High definition
ADC Analogue to digital converter.
BER Bit error ratio
DAC Digital to analogue converter
FFT Fourier fast transform
HD High definition
IFFT Inverse fast fourier transform
IFT Inverse fourier transform
ISI Intersymbol interference
LASER Light amplification by stimulated emission of radiation.
LED Light emitting diode.
LPF Low pass filter
MMF Multimode fiber.
MZM Mach-Zehnder modulator.
M-PSK Phase Shift Key of order M
M-QAM Quadrature Amplitude Modulation of order M
OFDM Orthogonal frequency division multiplexing
OFDM-RX OFDM-UWB receiver
OFDM-TX OFDM-UWB transmitter
QPSK Quadrature phase shift key modulation
P2P Peer to peer
PIN Positive-intrinsic-negative
PSD Power spectral density
QAM Quadrature amplitude modulation
RF Radio frequency.
xix

SMF Single mode fiber.
SNR Signal to noise ratio
TFI time-frequency interleaving
UWB Ultra wide band.
xx

List of Symbols
0MMF Centre of Multimode fiber referential
0SMF Centre of Multimode fiber referential
ASMF Amplitude coefficient of the single mode fiber field
a Modal amplitude
Be,n Equivalent bandwidth of the electrical noise
ck Data symbols at the kth subcarrier
E Electric field
Eclad,n Normal electric field component in the cladding
Eco,n Normal electric field component in the core
Eclad,t Transversal electric field component in the cladding
Eco,t Transversal electric field component in the core
Erad Electric radiated modes
Es Source electric field
Et Transversal electric field component
Ez Longitudinal electric field component
EH Hybrid modes
e Envelop of electric field
et Transversal of electric field
Fl Normalized Bessel function of first kind of order l
f Operating frequency
fc Central frequency of an OFDM-UWB signal
fk Frequency of the kth subcarrier
fn,e Electrical noise figure
H Magnetic field
Hclad,n Transversal magnetic field component in the cladding
Hclad,t Transversal magnetic field component in the cladding
xxi

Hco,n Transversal magnetic field component in the core
Hco,t Transversal magnetic field component in the core
Hrad Magnetic radiated modes
Hs Source magnetic field
Ht Transversal magnetic field component
Hz Longitudinal magnetic field component
H f ilter Transfer function of OFDM receiver low pass filter
HMMF Multimode fiber transfer function
HE Hybrid modes
h Envelop of magnetic field
(h,b) Vector coordinates which represents the distances between the MMF and the SMF
centre in the MMF referential
ht Transversal of magnetic field
Jl Bessel function of first kind of order l
Kl Modified Bessel function of the second kind of order l
Kb Boltzman constant
k Free-space wavenumber
κ2 Transverse wave constant
LMMF Length of multimode fiber
l Radial dependence of each propagated
M Number of eigenvalue solutions available
m Azimuthal dependence of each propagated
Nsc Number of subcarriers
n Refractive index profile
nb Number of subband used
nclad Refractive index of the cladding region
nco Refractive index of the core region
nsm f ,clad Refractive index of the cladding region of the single mode fiber
nsm f ,co Refractive index of the core region of the single mode fiber
P Modal Power
Pclad Existing power in the cladding region
Pco Existing power in the core region
Pcoup Power coupling losses
PMMF Coupled power at the multimode fiber
PNoise Noise Power
xxii

PSignal Signal Power
PSMF Total power carried by the single mode fiber
Ptot Total bound power
p Fraction of power
pnoise,in Thermal noise spectral density
R Normalized radius
Rb Bit ratio
Rp Polarization resistance
S Pointing vector
Sz Longitudinal Pointing vector component√
Sc Electrical power spectral density noise
T Temperature
T E Transversal electric modes
T H Transversal magnetic modes
T s Symbol Period
U Normalized transversal frequency in core region
V Normalized frequency
Vbias bias point
VOFDM Voltage of the OFDM-UWB signal applied to the MZM arms
VRMS Square mean root voltage
Vπ Voltage needed to cause a π phase shift in each MZM arm
XMMF X axis of Multimode fiber referential
XSMF X axis of Single mode fiber referential
xMMF Multimode fiber coordinates of a point P
xSMF Single mode fiber coordinates of a point P
W Normalizer transversal frequency in cladding region
YMMF Y axis of Multimode fiber referential
YSMF Y axis of Single mode fiber referential
yMMF Multimode fiber coordinates of a point P
ySMF Single mode fiber coordinates of a point P
Z Free-space Impedance
α Attenuation coefficient
β Propagation constant or eigenvalue
ε0 Electric permittivity of free-space
λ Wavelength
xxiii

µ0 Magnetic permeability of free-space
ρ Fiber core radius
ρclad Fiber cladding radius
ρsm f ,clad Cladding radius of the single mode fiber
ρsm f ,co Core radius of the single mode fiber
σ2c Electrical noise or noise circuit
τ Delay per unit
∆ Profile height
∆2t Laplacian Vector
Ψ Solutions of the scalar wave equation
xxiv

Chapter 1
Introduction
In this chapter, the characteristics and current challenges of the optical fiber systems, namely the mul-
timode ones, are presented and discussed. In Section 1.2, the motivation of this work is presented. In
Section 1.3, the objectives and the structure of the dissertation are presented. The contributions of this
work are presented in Section 1.4.
1.1 Scope of the work
The human being always tried to communicate at long distances, firstly using smoke signs or even let-
ters, and more recently using telephones, internet and other even more sophisticated types of networks.
As the ways of communicating evolved, the structure that supported those networks had to evolve as
well. New communications systems started to emerge and soon it was possible to make a phone call
that travelled around the world before reaching its destination, [1]. Unfortunately, the expansion of the
network didn’t bring only benefits. The increasing number of telephones and the disadvantages of us-
ing cooper wires was brought to the light. The fact that the attenuation introduced by the cooper wire
network strongly increases with distance made undesirable the use of this kind of cables to bridges long
distances. To overcome these difficulties, the coaxial cable started being used. During the following
years, telecommunications networks continued to spread over the world. A great advance was made
when the first photograph was transmitted at a long distance through a telephone line [2]. The era of the
data communications has started. The internet started to rise and demand more bandwidth of the trans-
porting networks [3] [4]. The data traffic increased and become dominant, due to the variability of the
services offered. To face these new challenges, the actual coaxial networks were not enough. In the late
1970s, a new technology created to suppress the bandwidth needs had been invented: the optical fiber
cables [5]. This new technology allowed to improve data rate transmission and the network capacity.
Although the capacity in the access networks in already high, the tendency is that the demand for more
1

capacity continues growing. So, in order to keep up the capacity demands, the optical fiber network
performance needs to be improved. The use of technologies like the orthogonal frequency division mul-
tiplexing (OFDM) ultra-wide band (UWB) signals, due to its main features like, tolerance to multipath
and multi-band providing helps to enhance the multimode fiber (MMF) advantages in high-speed trans-
missions. The present dissertation focus on the problem of providing an efficient in-building network
structure to support an advanced communication system. The main objective of this work is to study and
characterize the OFDM-UWB signals transmission along multimode fiber in in-building networks.
1.2 Motivation
1.2.1 Evolution and challenges of the communication networks - Capacity demands
The human being is always communicating and trying to improve the existing communication systems,
in order to do it better and faster. The first long-distance communication system of the modern era ap-
peared about 1876 with the telephone invention by Alexander Bell [6]. This invention allowed people
to communicate by voice over distances of thousands of kilometers. With the world spread of the tele-
phone network, the high losses of the copper cables used in the transmission system and the increasing
of the voice traffic communications, stimulated the search for more efficient ways of communicating.
In 1970, the first optical fiber cables with attenuation losses of less than 20 dB/km [7] and its enhanced
features like high bandwidth, immunity to cross-talk, small size and weight, low cost and high raw ma-
terial availability, made optical fibers the main booster of the high-speed transmissions [8]. The benefits
of the optical fiber networks became even more clear with the appearance of the internet. The internet
appeared in the 1980s and quickly become one of the the most used technology used to transfer data in
long distance communications [9]. In the last 30 years, the internet has been growing at unprecedented
rates [10]. Figure 1.1 shows the growth of the internet users in the last 15 years.
2

Figure 1.1: Growth of the internet users in the last 15 years (Source: http://www.
internetworldstats.com/emarketing.htm). The 2010 results are relative to the estimated number
of users in September of the same year.
Figure 1.1 shows that in the last 15 years, the number of internet users has always been increasing,
reaching almost 2000 millions users by September 2010. It is also possible to see that the big boom of
the internet was from 2000 to 2010, when the internet users increased in 1500 millions. The ever growing
internet traffic demands a extremely high capacity of the optical networks.
The internet is the major traffic source of the current communication networks and the internet users
are becoming more and more demanding, demanding higher upload capacities [10]. The peer-to-peer
(P2P) technology present in the Emule and the social networks like the Facebook, twitter and Youtube
had a major contribute to the increase of the optical networks traffic. In the mid 1990s, the download
capacity in the access network was significantly higher than the upload capacity, since the internet was
only used to access information. The appearance of peer-to-peer and social networks changed the current
paradigm and stimulated the users to be more content producers. The current internet users like to share
all the available resources with each others like video, music, data, photos, games and text. And they
want to do it as faster and as much as they can. This new internet culture demands a more symmetric
network system, that can satisfy the needs of every single user, without limiting the overall system. So,
it is necessary to increase the up and down-link capacity of the current networks.
The high-definition television (HDTV) and the interactive contents offered by the principal TV op-
erators, also demand a higher capacity of the current networks. Nowadays, concepts like triple-play
(telephone, television and internet) are being sold by the major telecommunication companies. These
services usually use high speed internet connections that can go up to 200 Mbps [11]. The television
operators offer a large number of HD channels [12], that is likely to grow in the next years. Another
3
feature that will increase the data traffic in the networks is the widespread of the 3-Dimensional (3-D)
technology, or even the 3D-HD technology [13]. Some of the portuguese telecommunication operators
are also starting to offering 3-D contents, with experimental transmissions of some major events like
the 3-D transmission of the World-cup 2010 [14]. When these operators start to transmit most of their
contents in 3-D, the transport network will have to support a even bigger amount of traffic.
The introduction of interactive channels by the TV operators gives to the user the possibility to
participate actively in the program he/she is watching. This fact will also contribute to increase the data
traffic, not only in the downstream, but also in the upstream. Another service that is responsible for the
increasing of data in the networks is the video-on-demand. This service gives the user the possibility
to watch a movie, and to do so, the movie has to be downloaded to the users television set, [15]. If the
most of the users decided to ask for a video-on-demand in the same building, the current network does
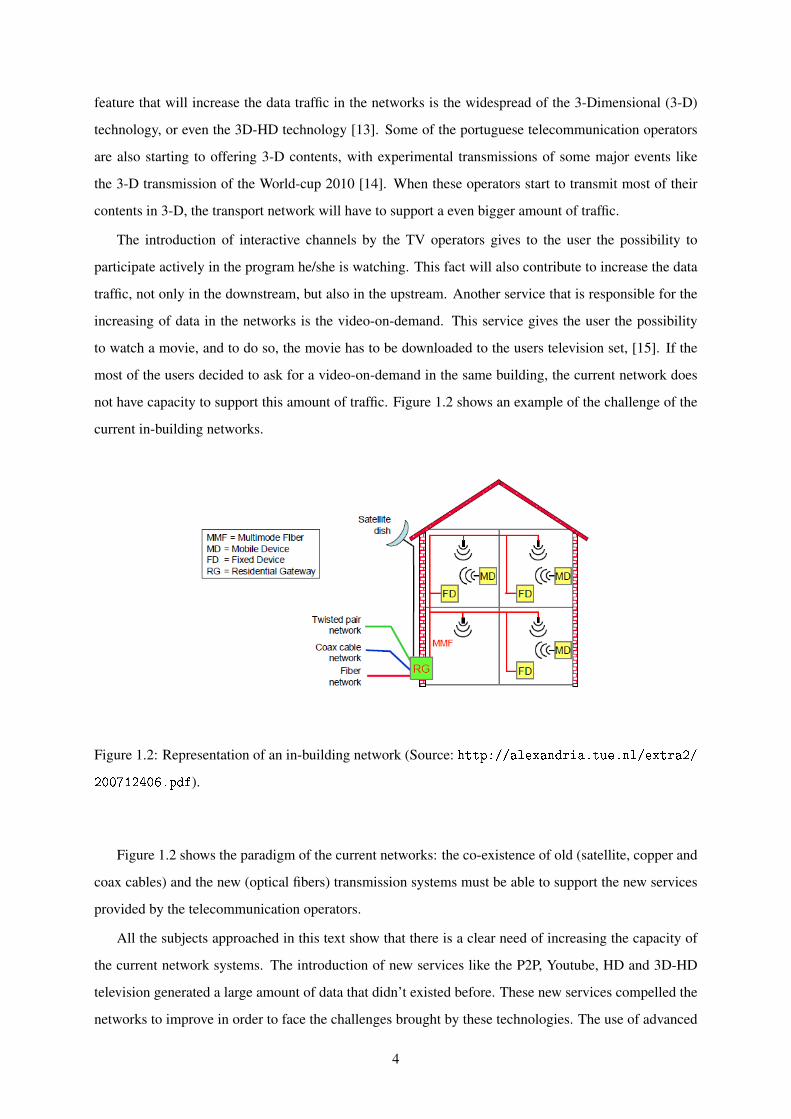
not have capacity to support this amount of traffic. Figure 1.2 shows an example of the challenge of the
current in-building networks.
Figure 1.2: Representation of an in-building network (Source: http://alexandria.tue.nl/extra2/
200712406.pdf).
Figure 1.2 shows the paradigm of the current networks: the co-existence of old (satellite, copper and
coax cables) and the new (optical fibers) transmission systems must be able to support the new services
provided by the telecommunication operators.
All the subjects approached in this text show that there is a clear need of increasing the capacity of
the current network systems. The introduction of new services like the P2P, Youtube, HD and 3D-HD
television generated a large amount of data that didn’t existed before. These new services compelled the
networks to improve in order to face the challenges brought by these technologies. The use of advanced
4

transmission systems based on optical fibers networks may be the answer for this problem.
1.2.2 Optical fiber networks - Why to use multimode fibers?
In the last few years, the optical fiber networks have been gradually replacing the cooper networks,
due to its increased transmission capabilities like high available bandwidth, low transmission losses and
immunity to electromagnetic interference. There are two types of optical fibers: the single-mode fiber
(SMF) and multimode fiber (MMF). The single-mode fiber has a core diameter small enough to only
support one mode, in opposition to the multimode fiber, which has a large core that can support hundreds
of modes in a single fiber [16]. The existence of more than one propagation mode in MMF leads to
the degradation of the performance of this type of fiber in long-distance transmission. Nevertheless, the
MMF are commonly used in short range optical networks. Another advantage of the multimode fibers
is that they are easy to handle, since they have a larger core size which gives more tolerance in the
required alignment for the light coupling in the MMF [17]. The multimode fiber has been widely used
in in-building and in-campus networks. The reason for that is that, in these networks, the length of fiber
required to complete the connections is smaller than a few hundred meters long, [17], which is perfectly
adequate to the MMF characteristics. The importance of providing low cost solutions made clear the
necessity of using MMF instead of other fiber solutions.
1.3 Objectives and structure of the dissertation
The main objectives of this dissertation are:
• To study and characterize the OFDM-UWB radio signals, in the time and frequency domain;
• To study the multimode fiber propagation theory and develop a numerical model based on that;
• To analyze the impact of the fiber transmission and the power launching conditions on the perfor-
mance of the system, by evaluating the degradation of the quality of the received signal and the bit
error probability;
• To assess the maximum transmission distance in single- and multi-channel OFDM-UWB systems
along multimode fiber.
This dissertation is organized in five chapters.
In Chapter 1, the evolution and the challenges of the current optical networks are presented and
analysed. The main characteristics of the multimode fibers are presented, namely why they are adequate
to be used in in-building networks. The objectives and the dissertation organization are also described in
this chapter. Finally, the main contributions of this work are presented.
5

In Chapter 2, the description of the OFDM-UWB transmission system is presented and analysed.
They main components of the system are presented and the performance of the OFDM-UWB system is
analysed in back-to-back configuration.
In Chapter 3, the multimode fiber propagation model is presented and discussed. A numerical model
is developed and the multimode fiber power transfer function is analysed for different power launching
conditions.
In Chapter 4, the performance of the OFDM-UWB system along multimode fiber is presented and
discussed. The maximum transmission distances is assessed for different launching conditions and for
single- and multi-band transmission.
In Chapter 5, the final conclusions of this work and suggestions for future work on this subject are
presented.
1.4 Contributions of this work
The main contributions of this work are:
• demonstration of the impact of the multimode fiber propagation on the performance of OFDM-
UWB signals;
• development of a multimode fiber propagation numerical model based on the modal dispersion;
• study of the contribution of each existing mode in the multimode fiber, to the multimode fiber
transfer function;
• demonstration of the impact of power launching conditions on the multimode fiber transfer func-
tion and on the performance of the overall system;
• demonstration of the reliability of the OFDM-UWB transmission system along the multimode
fiber for single-band transmission;
• demonstration of the impact of multi-band propagation on the performance of the overall system.
6

Chapter 2
OFDM-UWB system description and
analysis
In this chapter, the main components of the OFDM-UWB system are characterized. The block diagram
of the overall system used in this work is presented in Section 2.1. In Section 2.1.1, the OFDM-UWB
signals are presented. The OFDM-UWB transmitter is shown and analysed in Section 2.1.2. The Mach-
Zehnder modulator is presented in Section 2.1.3. The PIN is presented in Section 2.1.4. In Section 2.1.5,
the OFDM-UWB receiver is presented and studied. The system’s performance in back-to-back configu-
ration is shown in Section 2.2.
2.1 Description of the OFDM-UWB system
In Figure 2.1, a block diagram of the OFDM-UWB system used in this work is presented.
Figure 2.1: Block diagram of the OFDM-UWB system used in this work.
The first element of the OFDM-UWB system is the transmitter, where the OFD-UWB signals are
generated. Once these signals are built, the next step is to do the electro-optic conversion through the
Mach-Zehnder modulator, which allows the signal to be transmitted over the multimode optical fiber. At
the fiber’s output, the signal is converted from optic to electric by the Positive-Intrinsic-Negative (PIN),
and it is ready to be processed by the OFDM-UWB receiver. The main components of this system are
7

presented with more detail in the following sections.
2.1.1 OFDM-UWB signals
Ultra wide band (UWB) technology is being widely recognised due to its main features like low self-
interference, tolerance to multipath fading and low probability of interception [18]. This technology is
being used for high bitrate high definition (HD) in picocells, replacing the existing HD cabling [19].
UWB is a radio modulation technique with 500 MHz minimum bandwidth or, at least, 20% greater than
the centre frequency operation [20]. There are two UWB signal formats: Impulse Radio (IR) and OFDM-
UWB [21]. In this work, it is used the OFDM-UWB format, since it presents a better performance for
high bit rates [22].
This modulation format distributes the data over a large number of orthogonal subcarriers that are
spaced apart at frequencies multiples of inverse of the symbol periods, Ts. The main idea is that the
transmission channel affects each sub-carrier as a flat channel [23]. Some of the benefits of using OFDM
modulation are high-spectral efficiency, resiliency to radio frequency (RF) interference and lower multi-
path distortion [24]. The OFDM-UWB approach divides the UWB spectrum (3.1 to 10.6 GHz) into 14
sub-bands, each with 528 MHz wide [22], as it possible to see in Figure 2.2.
Figure 2.2: Standardized sub-bands division.
The center frequency of OFDM-UWB signal in each 528-MHz band is given by:
fRF [nb] = 2904+528nb, [MHz] nb = 1,2, . . . ,14 [MHz] (2.1)
where nb is the number of the sub-band used.
Each OFDM-UWB symbol is composed by 128 sub-carriers, carrying different types of information:
• 100 data sub-carriers, using simple modulations formats such as M-PSK and M-QAM;
• 12 pilots sub-carriers, which are used for distortion equalization;
8
• 10 guard sub-carriers, used for different purposes;
• 6 null sub-carriers, located at band edges in order to relax electrical filter requirements [25];
In this work, the 100 data sub-carriers are using QPSK modulation. The OFDM-UWB symbol results
from the superposition of all the sub-carriers used and has the duration of Ts seconds. The OFDM signal
s(t) is constructed using a inverse fourier transform (IFT) [26]:
s(t) =Nsc
∑k=1
cksk(t), (2.2)
with
sk(t) = e j2π fktΠ(t), Π(t) =
1 , 0 < t < Ts
0 , t ≤ 0 , Ts < t
where Nsc represents the number of sub-carriers, ck represents the data symbols at the kth sub-carrier
and fk represents the frequency of the sub-carrier number k.
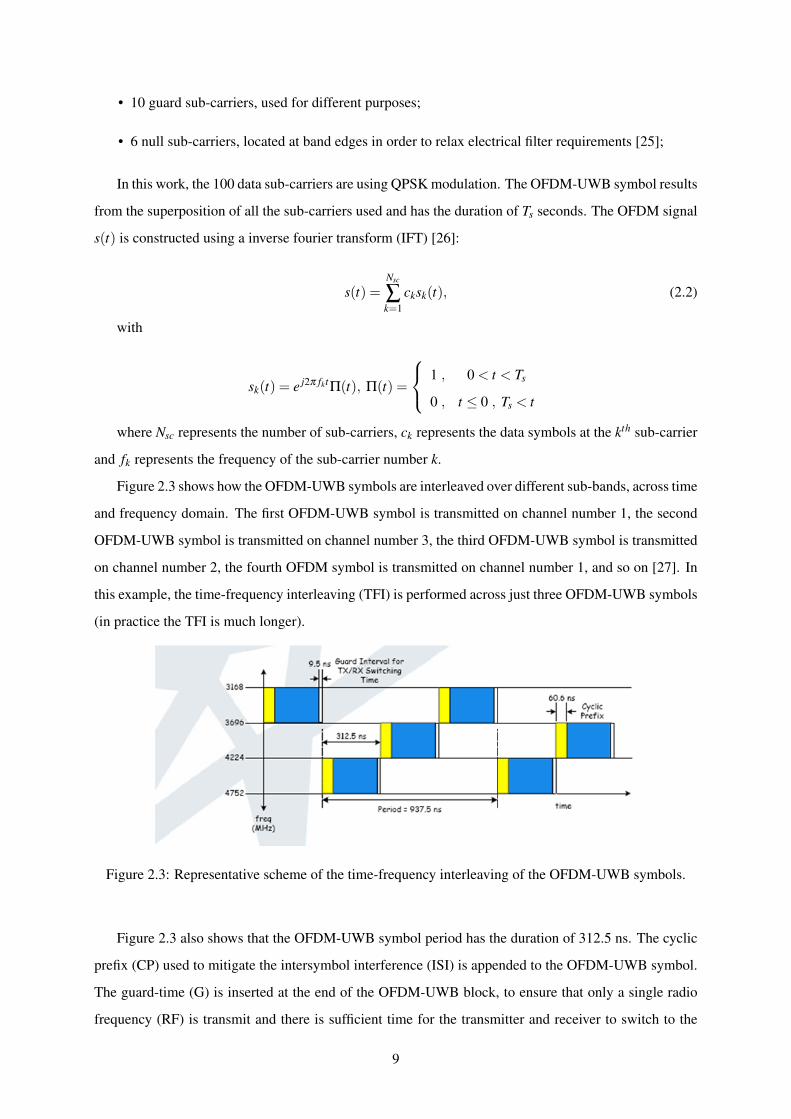
Figure 2.3 shows how the OFDM-UWB symbols are interleaved over different sub-bands, across time
and frequency domain. The first OFDM-UWB symbol is transmitted on channel number 1, the second
OFDM-UWB symbol is transmitted on channel number 3, the third OFDM-UWB symbol is transmitted
on channel number 2, the fourth OFDM symbol is transmitted on channel number 1, and so on [27]. In
this example, the time-frequency interleaving (TFI) is performed across just three OFDM-UWB symbols
(in practice the TFI is much longer).
Figure 2.3: Representative scheme of the time-frequency interleaving of the OFDM-UWB symbols.
Figure 2.3 also shows that the OFDM-UWB symbol period has the duration of 312.5 ns. The cyclic
prefix (CP) used to mitigate the intersymbol interference (ISI) is appended to the OFDM-UWB symbol.
The guard-time (G) is inserted at the end of the OFDM-UWB block, to ensure that only a single radio
frequency (RF) is transmit and there is sufficient time for the transmitter and receiver to switch to the
9

next channel [27]. The cyclic prefix duration is TCP = 60.6 ns and the guard-time duration is TG = 9.47
ns. The OFDM-UWB modulation/demodulation is implemented using the inverse fast Fourier transform
(IFFT)/fast Fourier transform (FFT), respectively.
2.1.2 OFDM-UWB transmitter
A block diagram of the OFDM-UWB transmitter is presented in Figure 2.4.
Figure 2.4: Block diagram of the OFDM-UWB transmitter.
An input binary deBruijn sequence with 213 symbols is converted into a complex-valued sequence
using QPSK modulation. Figure 2.5 show the QPSK constellation generated at the OFDM-UWB trans-
mitter input.
Figure 2.5: QPSK constellation generated at the OFDM-UWB transmitter.
After that, the complex-valued signal is converted from series to parallel and an inverse fast Fourier
transform (IFFT) is applied. At this point, the resulting complex signal is converted again but this
time from parallel to series. The transmitted signal is now splitted in an in-phase (I) component and in
a quadrature (Q) component, which contains the real and the imaginary values of the original signal,
10

respectively. These components are first converted to the analogue domain using digital-to-analogue
(DAC) converters. The analogue signals are then used to modulate cosine and sine waves at the carrier
frequency, respectively. A low pass filter (LPF) is now applied to each component, in order to reduce the
influence of the aliasing components on the system performance [28]. After that, the I and Q components
are up-converted to the carrier frequency of the UWB sub-band used. At the OFDM-UWB transmitter,
32 OFDM-UWB symbols are generated.
The bit rate of the system is given by [26]:
Rb =Nsc
Tslog2 M (2.3)
So, for Nsc = 100, Ts = 312.5 ns and M = 4, the system presents a bit rate of 640 Mbit/s.
Figure 2.6 shows the OFDM-UWB signal at the transmitter output, in the time and frequency domain,
for the first UWB sub-band ( fRF = 3.4 GHz). In the numerical simulation, a 6th order Bessel filter with
a -3 dB bandwith of 400 MHz is used.
(a) Time domain. (b) Frequency domain.
Figure 2.6: OFDM-UWB signal at the transmitter’s output, in the time and frequency domain.
In the time domain in Figure 2.6, it is possible to identify some OFDM-UWB blocks. In the frequency
domain, it possible to see that the signal is centred at the carrier frequency, fRF .
2.1.3 Mach-Zehnder modulator
The Mach-Zehnder modulator (MZM) performs the electro-optic conversion of the transmitted signal,
by modulating the amplitude of the carrier frequency. The envelope of the electric field at the modulator
output is given by [29]:
E(t) = E0(t)cos(
π
2Vπ
(2VOFDM(t)−Vbias)
)(2.4)
where E0(t) represents the electric field at the modulator input, Vπ represents the voltage needed to cause
11

a π phase shift in each MZM arm, VOFDM(t) represents the voltage of the OFDM-UWB signal applied
to the MZM arms and Vbias represents the bias point voltage.
The optical carrier is modulated according to the modulation index used. This parameter is given by
m = VRMSVbias
, where VRMS represents the root mean square (rms) voltage of the OFDM-UWB signal. So, the
modulation index determines the fraction of the OFDM-UWB signal used to modulate the transmitted
information. The higher is the modulation index, the higher will be the distortion of the signal, so it is
convenient to choose a modulation index adequate to the type of system used. Table 2.1 show the values
of Vπ and Vbias used to perform the numerical simulations presented in this dissertation. These values
were optimized in order to provide a good quality of the received signal when it is transmitted along the
multimode fiber. The optimizations performed to the MZM modulator are presented in the Appendix E.
Table 2.1: Parameters used for simulate the Mach-Zehnder modulator.
MZM Parameters
Vπ [V] 5
Vbias [V] 2.5
m [%] 10
Figure 2.7 shows the modulator output for the first UWB sub-band.
Figure 2.7: Mach-Zehnder modulator output for the first UWB sub-band, where fc represents the optical
carrier frequency.
The PSD at the modulator output presented in Figure 2.7 shows the OFDM-UWB signal centred at
− fRF and fRF .
12

2.1.4 PIN
The PIN performs the opto-electric conversion of the received signal. First, the signal is photodetected
and then is pre-amplified and filtered, before it reaches the OFDM-UWB receiver. A simplified scheme
of the system PIN + pre-amplifier is presented in Figure 2.8.
Figure 2.8: Block diagram of the system PIN + pre-amplifier.
The polarization resistor and the pre-amplifier introduce electrical noise into the system, due to the
existence of resistive and active elements on them, respectively. This electric noise is also known as
circuit noise and is represented by σ2c . The noise associated with the polarization resistor Rp, can be
determined by the current variance associated with it [30]:
σ2b =
4kBTRp
Be,n (2.5)
where kB is the Boltzman constant, T is the temperature (in Kelvin degrees), Rp is the polarization
resistor at the pre-amplifier input and Be,n is the equivalent bandwidth of the electric noise. The pre-
amplifier noise can be described by its noise figure, fn,e. So, the total noise circuit of the system is given
by the contributions of the resistive noise and of the amplifier noise figure:
σ2c = σ
2b · fn,e =
4kBTRp· fn,e·Be,n (2.6)
The expression of the circuit noise does not take into account the gain of the pre-amplifier. This de-
cision does not affect the performance of the system, since this gain is not considered in the transmission
of the OFDM-UWB signal [30]. Finally, from the analysis of the Equation 2.6 ,it is possible to determine
the power spectral density (PSD) of the circuit noise, once Be,n is the equivalent bandwidth of the electric
noise:
13
Sc( f ) =σ2
c
Be,n=
4kBTRp
fn,e (2.7)
Table 2.2 shows the numerical values used for the circuit noise of the OFDM-UWB system.
Table 2.2: Parameters used for the electrical noise.
Parameters
Boltzman constant kB = 1.38×10⁻²³ J/K
Polarization resistor Rp = 50 Ω
Temperature T = 290 K
Noise figure fn,e = 10
Electrical PSD noise
Sc( f ) = 3.2×10⁻²¹ A2/Hz
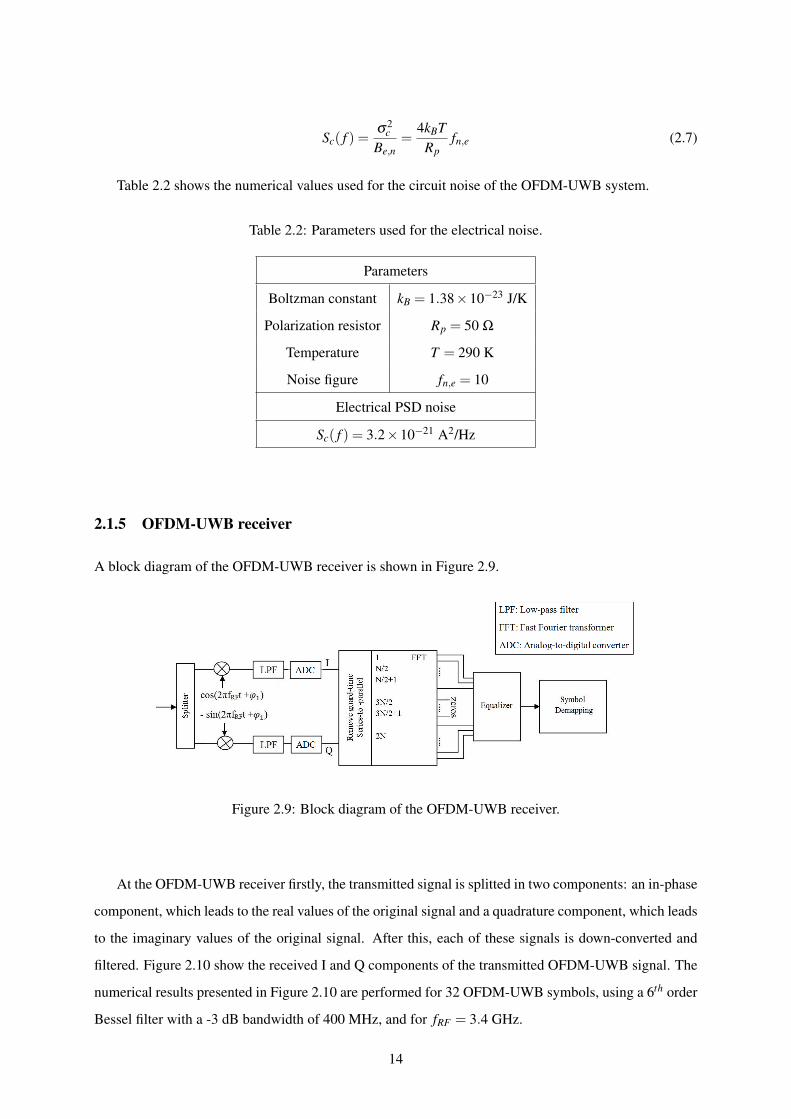
2.1.5 OFDM-UWB receiver
A block diagram of the OFDM-UWB receiver is shown in Figure 2.9.
Figure 2.9: Block diagram of the OFDM-UWB receiver.
At the OFDM-UWB receiver firstly, the transmitted signal is splitted in two components: an in-phase
component, which leads to the real values of the original signal and a quadrature component, which leads
to the imaginary values of the original signal. After this, each of these signals is down-converted and
filtered. Figure 2.10 show the received I and Q components of the transmitted OFDM-UWB signal. The
numerical results presented in Figure 2.10 are performed for 32 OFDM-UWB symbols, using a 6th order
Bessel filter with a -3 dB bandwidth of 400 MHz, and for fRF = 3.4 GHz.
14
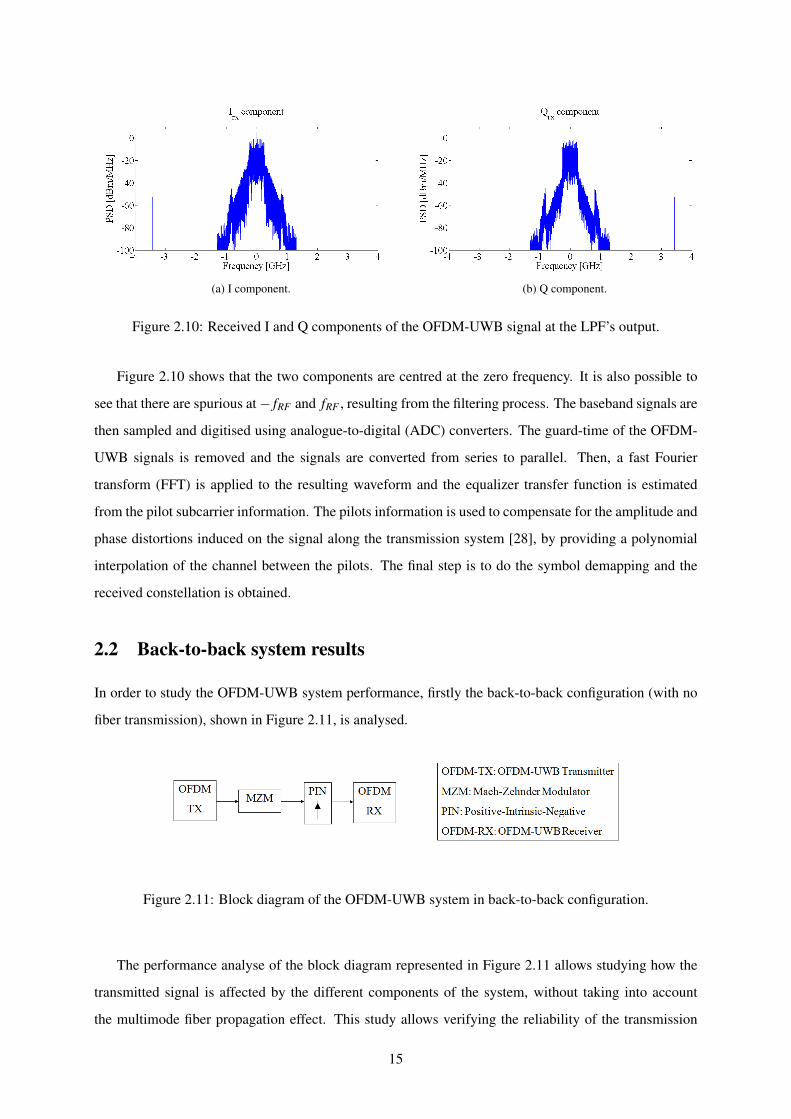
(a) I component. (b) Q component.
Figure 2.10: Received I and Q components of the OFDM-UWB signal at the LPF’s output.
Figure 2.10 shows that the two components are centred at the zero frequency. It is also possible to
see that there are spurious at− fRF and fRF , resulting from the filtering process. The baseband signals are
then sampled and digitised using analogue-to-digital (ADC) converters. The guard-time of the OFDM-
UWB signals is removed and the signals are converted from series to parallel. Then, a fast Fourier
transform (FFT) is applied to the resulting waveform and the equalizer transfer function is estimated
from the pilot subcarrier information. The pilots information is used to compensate for the amplitude and
phase distortions induced on the signal along the transmission system [28], by providing a polynomial
interpolation of the channel between the pilots. The final step is to do the symbol demapping and the
received constellation is obtained.
2.2 Back-to-back system results
In order to study the OFDM-UWB system performance, firstly the back-to-back configuration (with no
fiber transmission), shown in Figure 2.11, is analysed.
Figure 2.11: Block diagram of the OFDM-UWB system in back-to-back configuration.
The performance analyse of the block diagram represented in Figure 2.11 allows studying how the
transmitted signal is affected by the different components of the system, without taking into account
the multimode fiber propagation effect. This study allows verifying the reliability of the transmission
15

system. In the following sections, the results for single- and multi-band transmission are presented. The
bit error ratio (BER) of the system is determined by using the semi-analytic gaussian approach presented
in [31].
2.2.1 Single-channel transmission
Figure 2.12 and Figure 2.13 show the received constellations without noise at the OFDM-UWB receiver
output in back-to-back configuration, for the first four UWB sub-bands.
(a) First UWB sub-band. (b) Second UWB sub-band.
Figure 2.12: Received constellations for the first and the second UWB sub-bands.
(a) Third UWB sub-band. (b) Fourth UWB sub-band.
Figure 2.13: Received constellations for the third and the fourth UWB sub-bands.
The results presented in Figure 2.12 and in Figure 2.13 show that the received constellations for the
first four UWB sub-bands are identical. The received constellations are not equal to the sent one since the
system components are not ideal. The Bessel filters used in this system introduce some distortion into the
signal, originating the non-ideal constellations presented in Figure 2.12 and in Figure 2.13. Nevertheless,
the received constellations are very good, which allows a correct demapping of the received signal.
It is also interesting to study the dependence of the bit error ratio of the system on the signal optical
power. Figure 2.14 and Figure 2.15 show the bit error ratio as a function of the optical power of the
16

OFDM-UWB signal, for the first four OFDM-UWB sub-bands.
(a) First UWB sub-band. (b) Second UWB sub-band.
Figure 2.14: Bit error ratio as a function of the optical power of the OFDM-UWB signal, for the first and
the second UWB sub-bands. The orange line represents a bit error ratio of 10−4.
(a) Third UWB sub-band. (b) Fourth UWB sub-band.
Figure 2.15: Bit error ratio as a function of the optical power of the OFDM-UWB signal, for the third
and the fourth UWB sub-bands. The orange line represents a bit error ratio of 10−4.
Figure 2.14 and Figure 2.15 show that the BER of the system is quite similar for the four sub-bands
analysed in this work. It is also possible to see that the system presents a good performance, even for a
low optical power of the signal. For example, in order to have a BER of 10−4, it is only needed an optical
power of 0.01 mW.
2.2.2 Multi-channel transmission
Figure 2.16, Figure 2.17 and Figure 2.18 show the received constellations without noise at the OFDM-
UWB receiver output in back-to-back configuration, when more than one sub-band is used simultane-
ously. For the multi-band situation, it is assumed that the performance of the system is given by the
performance of the worst sub-band.
17

(a) First OFDM-UWB sub-band. (b) Second OFDM-UWB sub-band.
Figure 2.16: Received constellations for simultaneous transmission of the first two OFDM-UWB sub-
bands.
(a) First OFDM-UWB sub-band. (b) Second OFDM-UWB sub-band.
Figure 2.17: Received constellations of the first and the second OFDM-UWB sub-band for simultaneous
transmission of the first three OFDM-UWB sub-bands.
Figure 2.18: Received constellation of the third OFDM-UWB sub-band for simultaneous transmission
of the first three OFDM-UWB sub-bands.
The results presented in Figure 2.16, Figure 2.17 and Figure 2.18 show that the multi-band transmis-
sion has a significant impact on the received constellations. Figure 2.17 and Figure 2.18 show that the
18

performance of the system for simultaneous transmission of the first three UWB sub-bands is limited by
the performance of the first UWB sub-band, which presents a significant distortion when compared with
the other two sub-bands used in this multi-band transmission. So, the use of more than two sub-bands
simultaneously leads to the increase of the distortion of the received signal. One justification of this
effect is the interference between the UWB sub-bands, since adjacent sub-bands are used. Figure 2.19
presents the bit error ratio of the system as a function of the optical power of the OFDM-UWB signal,
for simultaneous transmission of two and three sub-bands.
(a) First two UWB sub-bands. (b) First three UWB sub-bands.
Figure 2.19: Bit error ratio as a function of the optical power of the OFDM-UWB signal, for simultaneous
transmission of two and three sub-bands. The orange line represents a bit error ratio of 10−4.
Figure 2.19 shows that the multi-band transmission has impact on the performance of the overall
system. It is possible to see that the higher is the number of sub-bands used, the higher is the power
needed to achieve the same bit error ratio. For example, in order to have a BER of 10−4, it is needed an
optical power of 0.015 mW, for the simultaneous transmission of two sub-bands, and an optical power
of 0.025 mW, for the simultaneous transmission of three sub-bands.
2.3 Conclusions
In this chapter, the main components of the OFDM-UWB system are presented and the performance of
the system in back-to-back configuration is analysed. The results presented in this chapter confirm that
the OFDM-UWB system used in this work presents a good performance (low distortion and a bit error
ratio inferior to 10−4) for single-band transmission (for an optical power equal or superior to 0.01 mW)
and for multi-band transmission (for an optical power equal or superior to 0.015 mW). The performance
of the system for simultaneous transmission of three UWB sub-bands is limited by the distortion of the
signal on the first OFDM-UWB sub-band, which presents a received constellation significantly worse
than for the other two UWB sub-bands used. The performance degradation of the system for this situation
is due to the interference between the UWB sub-bands.
19

20

Chapter 3
Propagation model of the step-index
multimode fiber
In this chapter, the mathematical theory of the propagation model of the step-index multimode fiber is
presented and discussed. In section 3.1, the modal field theory is presented and analysed. The number
of modes supported by the multimode fiber are presented in section 3.2. In section 3.3, the modal field
amplitudes and the modal powers are presented and studied. The multimode fiber transfer function and
its analysis are shown in section 3.4 and the conclusions are presented in Section 3.5.
3.1 Modal field theory
As it was mentioned in Chapter 1, due to its high core-size, multimode fibers can support more than one
propagation mode. This happens because the light inside the multimode fiber travels through several
different paths, which means that some rays will travel faster than others, as it is possible to see in
Figure 3.1, [25]. The rays that travel through shorter paths, which are the ones that will arrive first at the
fiber output, are called low order modes and the ones that travel through longer paths are denominated
as high order modes. This effect is known by intermodal or modal dispersion [30].
Figure 3.1: Representation of the geometry used for the calculation of the modal dispersion in the mul-
timode fiber (Source: Light Emitting-Diodes, E. Schubert).
21
Another effect that has a significant impact on the multimode fiber propagation is the chromatic
dispersion. This type of dispersion happens due to the different wavelengths that travel in the fiber have
different propagation velocities [30]. An illustrative example of the effect of the chromatic dispersion
in the multimode fiber propagation is shown in Figure 3.2. In this work, only the impact of the modal
dispersion is considered and studied. The chromatic dispersion effect is not taken into account due to the
extension of the developed work.
Figure 3.2: Representation of the chromatic dispersion effect in multimode fiber propagation.
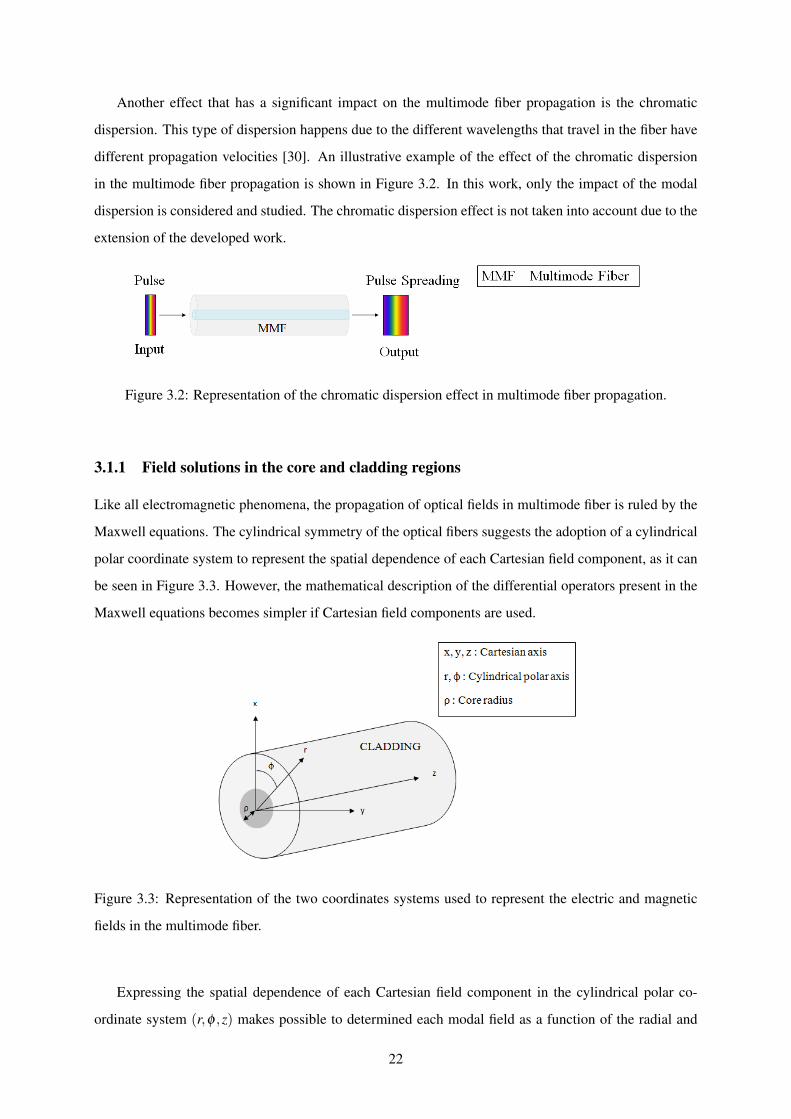
3.1.1 Field solutions in the core and cladding regions
Like all electromagnetic phenomena, the propagation of optical fields in multimode fiber is ruled by the
Maxwell equations. The cylindrical symmetry of the optical fibers suggests the adoption of a cylindrical
polar coordinate system to represent the spatial dependence of each Cartesian field component, as it can
be seen in Figure 3.3. However, the mathematical description of the differential operators present in the
Maxwell equations becomes simpler if Cartesian field components are used.
Figure 3.3: Representation of the two coordinates systems used to represent the electric and magnetic
fields in the multimode fiber.
Expressing the spatial dependence of each Cartesian field component in the cylindrical polar co-
ordinate system (r,φ ,z) makes possible to determined each modal field as a function of the radial and
22

azimuthal coordinates. Due to this fact, each propagated mode can be described by its radial and az-
imuthal mode number. In this dissertation, the m character is used to identify the radial dependence and
the l character is used to identify the azimuthal dependence of each propagated mode.
The existing electromagnetic fields of the multimode fiber are expressed by 3.1 [32]:
E(x,y,z) = ∑
l,malmElm(x,y,z)+Erad(x,y,z)
H(x,y,z) = ∑l,m
almHlm(x,y,z)+Hrad(x,y,z)
(3.1)
where lm represents the index of each propagated mode, alm represents the modal amplitude of the lm
propagated mode, Elm and Hlm represent the electric and magnetic field of the lm propagated mode,
respectively, and Erad and Hrad , represent the electric and magnetic radiated modes, respectively. The
electric and the magnetic field vectors E(x,y,z) and H(x,y,z) presented in Equation 3.1 can be separated
in two components: one representing the power that is guided along the fiber and the other one repre-
senting the power that is radiated from it. Since the optical fiber is a dielectric waveguide, the number
of guided modes supported by it is finite, in opposition to the radiated ones, which are infinite. In this
work, only the guided modes are considered, since theses are the modes that carry the biggest amount of
power [33].
The longitudinal dependence of each field component is represented by the complex phasor term
e j(wt−β z), characteristic of the time-harmonic field [32]:
Elm(x,y,z) = elm(x,y)e j(wt−βlmz)
Hlm(x,y,z) = hlm(x,y)e j(wt−βlmz)
(3.2)
where βlm represents the propagation constant or eigenvalue of each mode, and elm and hlm represent the
envelope of the electrical and magnetic field, respectively.
According to Snyder and Love [32], the wave equation for the step-index fiber presented in Equa-
tion 3.3 [34]:
∇t2 +n2k2−βlm
2Ψlm(r,φ) = 0 (3.3)
where Ψlm(r,φ) corresponds to solutions of the scalar wave equation of the electric or magnetic field
of each mode. The quantity κ2 ≡ n2k2− β 2lm is called transverse phase constant. In order to have a
consistent physical solution, κ2 > 0 is chosen in the core region, while κ2 < 0 is chosen for the cladding
23

region. The refractive-index in the core region is represented by nco and the refractive-index in the
cladding region is represented by nclad . Since nclad < nco for all modes, it is possible to determine the
following fundamental property of the propagation constant for every guided modes:
knclad < βlm < knco (3.4)
By solving the transversal Laplacian presented in cylindrical coordinates, it is possible to achieve the
following second order partial differential equations, for the two fiber regions [32]:
d2
dR2 +1R
ddR + 1
R2d2
dφ 2 +U2lm
Ψlm(Rρ,φ) = 0 , 0 ≤ R ≤ 1
d2
dR2 +1R
ddR + 1
R2d2
dφ 2 −W 2lm
Ψlm(Rρ,φ) = 0 , 1 ≤ R ≤ ∞
(3.5)
where R = r/ρ is the normalized radius, Ulm and Wlm are the normalized transversal frequencies in the
core and cladding region of each propagated mode, respectively:
Ulm = ρ√
k2n2co−β 2
lm
Wlm = ρ√
β 2lm− k2n2
clad
(3.6)
where ρ is the fiber core radius.
It is important to know that the sum of the squared values of the normalized transversal frequency in
the core and in the cladding region is a constant for the modal solution of the optical fiber. This quantity
is called normalized frequency or parameter V and is given by:
V≡√
U2lm +W 2
lm =2πρ
λ
√n2
co−n2clad (3.7)
The normalized frequency V gives also information about the type of fiber used: for values of V
between 0 and 2.405, the fiber propagates a single mode and for values superiors to 2.405 the fiber shows
multimode operation [32]. Another important dimensionless quantity is the profile height parameter,
which describes the relative difference between the core and the cladding refractive index:
∆ =nco−nclad
nco(3.8)
After established the modal parameters, it is possible to solve the differential wave equation. Analysing
Equation 3.5, it is possible to see that the differential wave equation coincides with the well-known Bessel
differential equation presented in Equation A.3 in Appendix A.
In fact, separable solutions of the wave equation, which are bounded everywhere, vary as Jl(UR)cos(lφ)
or Jl(UR)sin(lφ) in the core region and as Kl(WR)cos(lφ) or Kl(WR)sin(lφ) in the cladding region, for
l ≥ 0 [32]. Jl(UR) represents the Bessel function of the first kind and Kl(WR) represents the modified
24

Bessel function of the second kind. The Bessel function of first kind and the modified Bessel function of
the second kind are shown in Figure 3.4, [34].
Figure 3.4: Representation of the Bessel function of the first kind for l = 0,1,2 and of the modified
Bessel function of the second kind for l = 0,1. (Source: Multi-gigabit Transmission Over Multimode
Optical Fiber: Theory and Design Methods for 10 GbE Systems, S. Bottacchi)
The electromagnetic modes in all waveguide structures are classified according to their electric and
magnetic field components. Multimode fibers can support electromagnetic field solutions that can be
classified into the three following modes [34]:
• Transversal electric (TE) modes;
• Transversal magnetic (TM) modes;
• Degenerated hybrid modes.
The TE modes have no longitudinal component of the electric field and, consequently, lie on the
transversal plane to the waveguide axis, while the magnetic field has longitudinal and transversal com-
ponents. The (designated) TM modes have no longitudinal component of the magnetic field and, conse-
quently, lie on the transversal plane to the waveguide axis, while the electric field has both components.
Due to the weakly guiding properties of optical fibers designed for telecommunications purposes, there
is mode degeneracy. The degenerated EH and HE modes are called hybrid modes and they both have the
longitudinal component of the electric and magnetic field, simultaneously [34].
According to Snyder and Love [32], the transversal normalized modal fields of the weakly guiding
circular fibers are the ones presented in Table 3.1:
25

Table 3.1: Transversal modal fields of the weakly guiding step-profile multimode fiber.
Modal Field expressions
Mode eti hti
T E0,m xsin(φ)−ycos(φ)F1 nco
√ε0µ0xcos(φ)+ysin(φ)F1
T M0,m xcos(φ)+ysin(φ)F1 −nco
√ε0µ0xsin(φ)−ycos(φ)F1
HEl+1,m xcos(lφ)−ysin(lφ)Fl nco
√ε0µ0xsin(lφ)+ycos(lφ)Fl
EHl−1,m xcos(lφ)+ysin(lφ)Fl −nco
√ε0µ0xsin(lφ)−ycos(lφ)Fl
Fl = A Jl(UR)Jl(U) , 0 ≤ R ≤ 1
Fl =C Kl(WR)Kl(W ) , 1 ≤ R < ∞
for l = 0,1,2, ...
The characters A and C represent the integration constant pairs resulting from the solutions of the
wave (or eigenvalue) equation [34]. These constants can be determined by specifying the boundary
conditions at the fiber core-cladding interface.
3.1.2 Boundary conditions
Across the core-cladding interface of the step-index fiber, the boundary conditions of the electromagnetic
fields require the continuity of the both electric and magnetic fields [34]:
Eco,t = Eclad,t
n2coEco,n = n2
cladEclad,n
Hco,t = Hclad,t
Hco,n = Hclad,n
(3.9)
where Eco,t and Eclad,t represent the transversal component of the electric field in the core and in the
cladding region, respectively, Eco,n and Eclad,n represent the normal component of the electric field in
the core and cladding region, respectively, Hco,t and Hclad,t represent the transversal component of the
magnetic field in the core and in the cladding region, respectively, Hco,n and Hclad,n represent the normal
component of the magnetic field in the core and cladding region, respectively.
In summary, every component of the electromagnetic fields must be continuous across the core-
cladding interface. So, all the existing electric and magnetic fields must be equal at the radial coordinate
26

r = ρ or, equivalently, R= 1, which allows to determinate the unknown coefficients A and C. By applying
the boundary conditions to the field expressions presented in Table 3.1 at the core-cladding interface
(R = 1), it is easy to conclude that:
AJl(U)
Jl(U)=C
Kl(W )
Kl(W )(3.10)
⇔
A =C(3.11)
In this work, the chosen values for the unknown integration coefficients are A =C = 1.
3.2 Mode classification
The number of allowed modes in the multimode fiber is given by the number of solutions of the Equa-
tion 3.5, for every existing azimuth mode number. Once the azimuth mode number is fixed, due to the
smooth oscillatory behavior of the Bessel function of the first kind, a finite number of solutions is de-
termined. It is clear from the mathematical structure of the modal solutions in Equation 3.5, that the
azimuth mode number identifies the order of the Bessel functions in the core and cladding regions. So,
all the modes characterized by the same azimuth mode number have the same Bessel order function. The
radial mode number m acts like a scaling factor of the radial dependence [34].
By substituting Equation 3.6 in Equation3.5, it is possible to see that the only unknown variable in the
eigenvalue equation is the propagation constant βlm, since the fiber core radius ρ , the refractive indexes
nco and nclad and the operating wavelength λ are fixed and characteristics of the type of fiber used. The
physical multimode fiber parameters used in this dissertation are shown in Table 3.2.
Table 3.2: Parameters used for simulate a step-profile multimode fiber.
Fiber parameters
Multimode fiber core radius [µm] ρ = 25
Multimode fiber cladding radius [µm] ρclad = 125
Wavelength [nm] λ = 1550
Core refractive index nco = 1.48
Cladding refractive index nclad = 1.465
Attenuation coefficient [dB/km] α = 1.5 [35]
The attenuation coefficient value used is the one presented in standard TIA-568 C.3 for λ = 1300
nm. It was not found any information about the attenuation coefficient for λ = 1550 nm, so it is assumed
27

that it is the same as for λ = 1300 nm. This is a large value of the attenuation coefficient, once this
value was dimensioned for in-building installation, so it has to take into account the bends of the fiber
along the building and, eventually, the use of fiber slices, which contributes to increase the overall fiber
attenuation. Since this work is about in-building networks, it makes sense to use this value of attenuation
coefficient.
For every value of the azimuth mode number, the solutions of the eigenvalue equation are ordered
according to the radial mode number m, which can vary from one to the maximum number of eigensolu-
tions, for a given azimuth number. For each allowed mode, the solution of the eigenvalue equation relies
on the corresponding pair of the normalized frequencies in the core and cladding region.
It is important to note that the eigenvalue equation exhibits wavelength cut-off properties for all
guided modes except for the fundamental mode HE11, which has no wavelength cut-off and can always
be sustained by the fiber. This means that, when the multimode fiber reaches its cut-off value, it will
behave like a single mode fiber, carrying only one propagated mode [32].
Another important statement is that the same value of the propagation constant can be common to
different mode structures. This happens because for some different pairs of mode numbers, the eigen-
value equation has the same solution or, equivalently, the same propagation constant. This characteristic
leads to mode degeneracy. The mode structures with the same propagation constants can be grouped and
form the denominated linearly polarized (LP) mode groups [32]. In this work, the four types of allowed
modes, namely HE, TE, TM and EH modes are considered separately.
3.2.1 T E0,m and T M0,m modes
The T E0,m and T M0,m modes are obtained by setting l = 1 in Equation 3.5. Since both T E0,m and T M0,m
modes satisfies the same eigenvalue equation, they must necessarily have the same propagation constant
for every fixed radial mode number m [34].
Substituting l = 1 on Equation 3.5 and using the recurrence relationships presented in the Ap-
pendix A, allows to determine the propagation constant of each T E0,m and T M0,m mode by solving
numerically the following system [34]:
U0,mJ0(U0,m)J1(U0,m)
+W0,mK0(W0,m)K1(W0,m)
= 0
U0,m = ρ
√k2n2
co−β 20,m
W0,m = ρ
√β 2
0,m− k2n2clad
(3.12)
This system needs to be solved numerically. The only physical parameters envolved are the fiber core
28

radius ρ , the refractive indexes nco and nclad and the operating wavelength λ . In general, several solutions
are available and they can be ordered according to the increasing value of the propagation constant or,
equivalenty, to the decreasing value of U0,m [34], using the radial mode number m: β0,1 > β0,2 > ..... >
β0,M. The value M gives the number of eigensolutions available for the fixed azimuth number used (in
this case, l = 1) and for the selected fiber parameters.
The numerical solutions of the eigenvalue equation of the T E0,m and T M0,m modes, for the given set
of the fiber parameters presented in Table 3.2, are shown in Table 3.3. Figure 3.5 shows the graphical
solutions of equation 3.12 plotted as function of the propagation constant. The total number of T E0,m
and T M0,m modes is given by the number of intersections presented in the graphic of Figure 3.5.
Table 3.3: Computed eigenvalue for T E0m and T M0m modes.
T E0,m, T M0,m modes
m U0m W0m β0m [106m−1]
1 21.2671 1.1814 5.9388
2 18.5760 10.4220 5.9532
3 15.6611 14.4365 5.9666
4 12.6984 17.1007 5.9779
5 9.7103 18.9577 5.9868
6 6.0725 20.2178 5.9934
7 3.6627 20.9826 5.9976
Figure 3.5: Graphical solutions of the eigenvalue equation for T E0m and T M0m modes. The blue and the
green line represents the two parcels of the eigenequation presented in Equation 3.12, respectively. The
intersection of the eigenequation members gives the total number of T E0m and T M0m modes.
29

3.2.2 HEl+1,m modes
The HEl+1,m modes are obtained by setting l≥0 in the Equation 3.5. By using the recurrence relation-
ships presented in the Appendix A in the Equation 3.5, the propagation constant of each HEl+1,m modes
is determined by solving numerically the following system [34]:
Ul+1,mJl+1(Ul+1,m)Jl(Ul+1,m)
−Wl+1,mKl+1(Wl+1,m)Kl(Wl+1,m)
= 0
Ul+1,m = ρ
√k2n2
co−β 2l+1,m
Wl+1,m = ρ
√β 2
l+1,m− k2n2clad
(3.13)
In this case, the eigenvalue equation depends on the azimuth mode number. So, for each fixed
azimuth number, the Equation 3.13 will present several solutions. In Table 3.4, the numerical solutions
of the eigenvalue equation for the superior HEl+1,m modes are presented for l = 0,1,2,3,4.
Table 3.4: Computed propagation constants for HEl+1,m modes for l = 0,1,2,3,4.
HEl+1,m superior modes
m β1m [106m−1] β2m [106m−1] β3m[106m−1] β4m[106m−1] β5m [106m−1]
1 5.9459 5.9388 5.9463 5.9394 5.9476
2 5.9601 5.9532 5.9606 5.9542 5.9620
3 5.9725 5.9666 5.9730 5.9672 5.9744
4 5.9826 5.9779 5.9831 5.9789 5.9846
5 5.9903 5.9868 5.9908 5.9879 5.9924
6 5.9957 5.9934 5.9962 5.9945 —–
7 5.9987 5.9976 —– —– —–
Table 3.4 shows that, for any value of the azimuth mode number l, the number of solutions of the
eigenvalue equation is not constant. Instead, it decreases with the increase of the azimuth mode number
l.
The graphical solution of the eigenvalue equation for the HE1,m and HE5,m modes are shown in
Figure 3.6 and in Figure 3.7, respectively.
30

Figure 3.6: Graphical solutions of the eigenvalue equation for HE1m modes. The blue and the green line
represents the two parcels of the eigenequation presented in Equation 3.13 for l = 0, respectively. The
intersection of the eigenequation members gives the total number of HE1,m modes.
Figure 3.7: Graphical solutions of the eigenvalue equation for HE5m modes. The blue and the green line
represents the two parcels of the eigenequation presented in Equation 3.13 for l = 4, respectively. The
intersection of the eigenequation members gives the total number of HE5,m modes. It is possible to see
that for l = 4, the number of available solutions is smaller than for l = 0.
From Table 3.4 and from Equation 3.13, it is easy to verify that each azimuth mode number leads to
different solutions of the eigenvalue equation and, consequently, to different allowed modes in the mul-
timode fiber. The eigenvalue equation has solutions until the azimuth mode number does not exceed the
cut-off value. From that point on, there are no more intersections between the eigenequation members,
which will lead to no more mode solutions for that mode family [34].
Figure 3.8 shows the situation close to mode cut-off. In particular, for a fiber with the parameters
presented in Table 3.2, the mode HE18,1 is still supported but the successive mode HE19,1 is not, leading
31
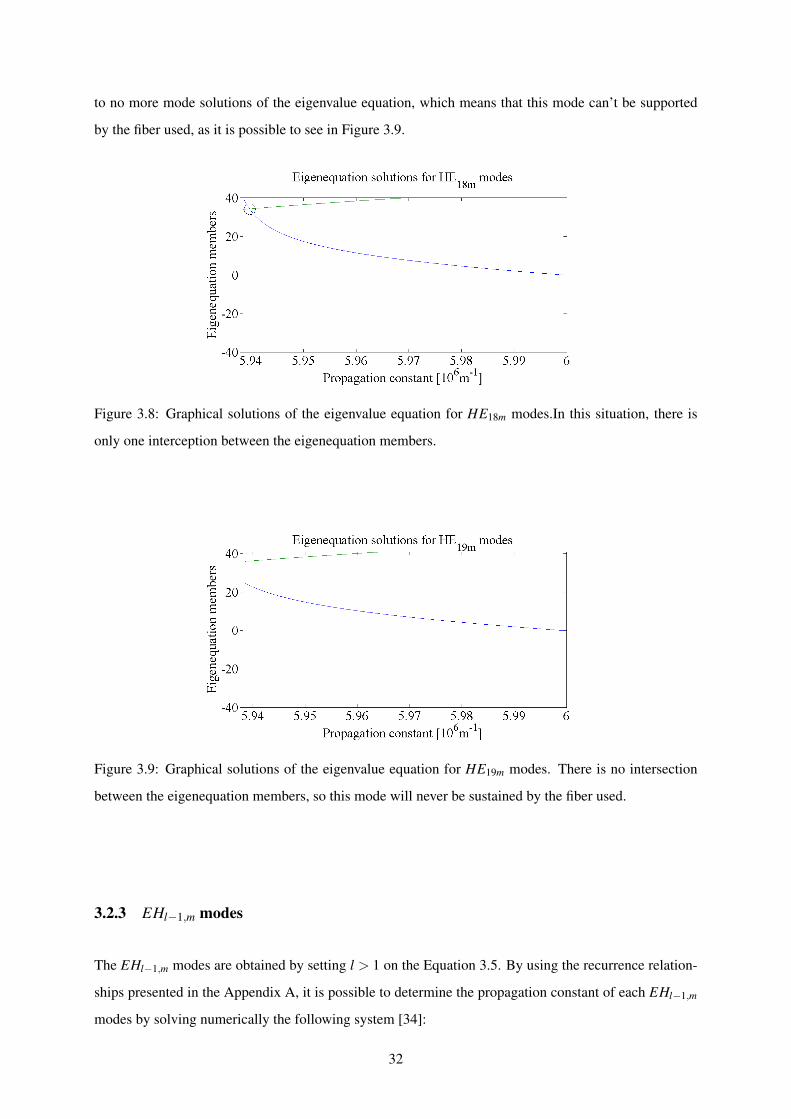
to no more mode solutions of the eigenvalue equation, which means that this mode can’t be supported
by the fiber used, as it is possible to see in Figure 3.9.
Figure 3.8: Graphical solutions of the eigenvalue equation for HE18m modes.In this situation, there is
only one interception between the eigenequation members.
Figure 3.9: Graphical solutions of the eigenvalue equation for HE19m modes. There is no intersection
between the eigenequation members, so this mode will never be sustained by the fiber used.
3.2.3 EHl−1,m modes
The EHl−1,m modes are obtained by setting l > 1 on the Equation 3.5. By using the recurrence relation-
ships presented in the Appendix A, it is possible to determine the propagation constant of each EHl−1,m
modes by solving numerically the following system [34]:
32

Ul−1,mJl−1(Ul−1,m)Jl(Ul−1,m)
+Wl−1,mKl−1(Wl−1,m)Kl(Wl−1,m)
= 0
Ul−1,m = ρ√
k2n2co−β 2
l−1,m
Wl−1,m = ρ
√β 2
l−1,m2− k2n2
clad
(3.14)
Once again, the eigenvalue equation depends on the azimuth mode number, which means that there
will be several solutions for every fixed azimuth number. In Table 3.5, the numerical solutions of the
eigenvalue equation for the EHl−1,m modes are presented for l = 2,3,4,5,6.
Table 3.5: Computed propagation constants for EHl−1,m modes for l = 2,3,4,5,6.
EHl−1,m superior modes
m β1m [106m−1] β2m[106m−1] β3m[106m−1] β4m[106m−1] β5m[106m−1]
1 5.9463 5.9394 5.9476 5.9409 5.9499
2 5.9606 5.9542 5.9620 5.9561 5.9645
3 5.9730 5.9676 5.9744 5.9696 5.9779
4 5.9831 5.9789 5.9846 5.9810 5.9874
5 5.9908 5.9879 5.9924 5.9901 —–
6 5.9962 5.9945 —– —– —–
Comparing the results presented in Table 3.5 with the results shown in Table 3.4, it is possible to
see that, for the same given azimuth mode number, the number of allowed EHl−1,m modes is one unit
smaller than the corresponding number of allowed HEl+1,m modes. For example, the HE2,m has seven
allowed modes, when the EH2,m has only six. Figure 3.10 and Figure 3.11 show the numerical solutions
of Equation 3.14 for the EH1,m and EH5,m modes.
33

Figure 3.10: Graphical solutions of the eigenvalue equation for EH1m modes.
Figure 3.11: Graphical solutions of the eigenvalue equation for EH5m modes.
As for the HEl+1,m, the eigenvalue equation only has solutions until the azimuth mode number does
not exceed the cut-off value. Figure 3.12 shows the situation close to mode cut-off, for a fiber with the
parameters presented in Table 3.2. The successive mode EH17,1 is no longer supported by this fiber,
leading to no more mode solutions of the eigenvalue equation, as it possible to see in Figure 3.13.
34

Figure 3.12: Graphical solutions of the eigenvalue equation for EH16m modes.
Figure 3.13: Graphical solutions of the eigenvalue equation for EH17m modes. There is no intersection
between the eigenequation members, so this mode will never be supported by the fiber used.
The number of allowed modes for λ = 1310 nm were also determined. These values are presented in
Appendix B. It is possible to see that for λ = 1310 nm, there are more allowed modes then for λ = 1550
nm, since the smaller is the wavelength, the higher is the number of allowed modes by the multimode
fiber. This consequence can be also achieved by the analysis of the V parameter.
3.3 Modal amplitude and modal power
The power generated by the electromagnetic fields of the optical fiber can be obtained from the Poynting
vector. The Poynting vector represents the electromagnetic power flux density across the unit surface
normal to the power flux direction [34]:
35

S≡ 12
ReE×H∗ (3.15)
By expressing the electromagnetic fields in the multimode fiber presented in Equation 3.1 in its
polar coordinates, and decomposing the general expression of electromagnetic field in its transversal and
longitudinal components, we can write:
E(ρ,φ) = ∑
l,malmEt,lm(ρ,φ)+Ez,lm(ρ,φ)z
H(ρ,φ) = ∑l,m
almHt,lm(ρ,φ)+Hz,lm(ρ,φ)z
(3.16)
where Et,lm and Ht,lm represent the electric and magnetic field transversal components, respectively, and
Ez,lm and Hz,lm represent the electric and magnetic field longitudinal components, respectively.
By substituting Equation 3.16 in Equation 3.15 and assuming that the transversal component of the
electromagnetic fields are real, it is possible to compute the corresponding longitudinal component of
Poynting vector in the direction of the fiber axis, for a given (l,m) mode:
Sz,lm(ρ,φ) =12|alm|2Et,lm(ρ,φ)×H∗t,lm(ρ,φ) · z (3.17)
The modal power Plm associated to each guided mode is given by the integration of the power flux
density across the infinite fiber section A∞ of that mode:
Plm =∫
A∞
Sz,lm(ρ,φ)dA =12|alm|2
∫A∞
Et,lm(ρ,φ)×H∗t,lm(ρ,φ) · zdA (3.18)
The total bound power Ptot is given by the sum of all allowed modes:
Ptot = ∑l,m
Plm =12 ∑
l,m|alm|2
∫A∞
Et,lm(ρ,φ)×H∗t,lm(ρ,φ) · zdA (3.19)
So, in order to determine the total power carried by the multimode fiber, it is necessary to determine
the modal amplitudes alm of each guided mode. To achieve this purpose, the orthogonal property of the
bound mode set needs to be used. This property is derived from the Maxwell reciprocity theorem applied
to a non-absorbing waveguide. The demonstration of this theorem is out of the scope of this work. A
careful demonstration of this property can be seen in [32].
The modal amplitude of each guided mode under the weakly guiding approximation is given by
Equation C.9(the mathematical derivation of the modal amplitude expression is presented in Appendix C):
al,m =
∫A∞Es(ρ,φ)× z×E∗t,lm(ρ,φ) · zdA∫
A∞|Et,lm(ρ,φ)|2dA
(3.20)
36

Equation C.9 shows that once the source field Es(ρ,φ) is known, the modal amplitude depends
exclusively on the transversal component of the electric field. The total power carried by each mode,
under the weakly guiding approximation, is given by the substitution of Equation C.9 on Equation 3.19:
Ptot =nco,clad
2Z0∑l,m
|∫
A∞Es(ρ,φ)× z×E∗t,lm(ρ,φ) · zdA|2∫
A∞|Et,lm(ρ,φ)|2dA
(3.21)
Equation C.9 shows that once the source field Es(ρ,φ) is known, the modal amplitude depends
exclusively on the transversal component of the electric field.
3.3.1 Source Field
At this point, it is important to define the optical source used in this work. The most common type
of source used to couple the light into a multimode fiber is from a single mode fiber. A representative
scheme of the light launching from a SMF to a MMF is shown in Figure 3.14.
Figure 3.14: Representative scheme of the light launching from the SMF to the MMF. Only the core of
both fibers are represented, since the largest amount of power is contained in these regions.
The small SMF core radius, where the most of the optical fiber power is contained, allows launching
the light in any point of the MMF region, exciting different types of modes. So, by choosing the point in
the MMF where we want to couple the power launched from the SMF, it is possible to study the modal
power distribution in the multimode fiber, because different launch conditions will excite different types
of modes. In order to do that, it is necessary to establish a relationship between the MMF coordinates
and the SMF coordinates. The method developed to achieve this purpose is presented in the Appendix D.
A single mode fiber, in opposition to the multimode fiber, supports only one mode: the fundamental
HE11 mode [18]. So, the field expression of the single mode fiber is similar the expression of the
multimode fiber HE11 mode, presented in Table 3.1.
37

Table 3.6: Electromagnetic field of the single mode fiber.
Fundamental HE11 mode
eti hti
xF0 nsm f ,co
√ε0µ0
yF0
F0 = ASMFJ0(UR)J0(U) , 0 ≤ R ≤ 1
F0 = ASMFK0(WR)K0(W ) , 1 ≤ R < ∞
where ASMF represents the field amplitude coefficient and nsm f ,co represents the refractive index of
the core region of the single mode fiber. Assuming the source is linearly polarized along the x axis,
Es(ρ,φ) = Es(ρ,φ)x, the modal amplitude expression presented in Equation C.9 can be simplified:
al,m =
∫A∞
Es(ρ,φ)E∗x,lm(ρ,φ)dA∫A∞|Et,lm(ρ,φ)|2dA
(3.22)
The next step is to determine the amplitude coefficient of the source electric field ASMF . The ampli-
tude coefficient can be obtained by manipulating the expression of the total power carried by the fiber
PSMF [33]:
PSMF =12
∫ 2π
0
∫∞
0(ExHy
∗−EyHx∗)rdrdφ (3.23)
The total power carried by the SMF is obtained by summing the existing power in the core and
cladding regions, PSMF = Pco +Pclad . So, it is possible to split Equation 3.23 in two parcels, one rep-
resenting the power contained in the core region and the other representing the power contained in the
cladding region:
Pco =12
∫ 2π
0
∫ρ
0(ExHy
∗−EyHx∗)rdrdφ (3.24)
Pclad =12
∫ 2π
0
∫∞
ρ
(ExHy∗−EyHx
∗)rdrdφ (3.25)
By substituting the SMF field expression presented in Table 3.6 in Equation 3.24 and in Equation 3.25
and using the indefinite Bessel integrals presented in the Appendix A, the following expressions are
obtained:
Pco =πnsm f ,co
J20 (U)
√ε0
µ0A2
SMF
∫ρ
0J2
0
(Urρ
)rdrdφ =
ρ2πnsm f ,co
2
√ε0
µ0A2
SMF
1+
J21 (U)
J20 (U)
(3.26)
38

Pclad =πnsm f ,clad
K20 (W )
√ε0
µ0A2
SMF
∫∞
ρ
K20
(Wrρ
)rdrdφ =
ρ2πnsm f ,clad
2
√ε0
µ0A2
SMF
K2
1 (W )
K20 (W )
−1
(3.27)
Summing the power in the core and cladding regions and solving the result in order to ASMF , the
amplitude coefficient of the SMF field is obtained:
ASMF =
√√√√ 2PSMF
ρ2π
√ε0µ0
nsm f ,co
(1+ J2
1 (U)
J20 (U)
)+nsm f ,clad
(K2
1 (W )
K20 (W )−1) (3.28)
So, it is obvious from Equation 3.23 that, by imposing the power transmitted by the electric source
field, it is possible to determine the amplitude coefficient of the SMF field ASMF .
The physical parameters of the single mode fiber used in this work are presented in Table 3.7.
Table 3.7: Parameters used for simulate a step-profile single mode fiber.
SMF parameters
Core radius [µm] ρsm f ,co = 4
Cladding radius [µm] ρsm f ,clad = 125
Wavelength [nm] λ = 1550
Core refractive index nsm f ,co = 1.48
Cladding refractive index nsm f ,clad = 1.477
A graphical interpretation of the amplitude distribution of the SMF electrical field, for the set of
parameters presented in Table 3.7 is shown in Figure 3.15. The values of the vacuum electric permittivity
and of the vacuum magnetic permeability are, respectively, ε0 = 8.854×10⁻¹² F/m and µ0 = 4π×10−7
H/m.
39
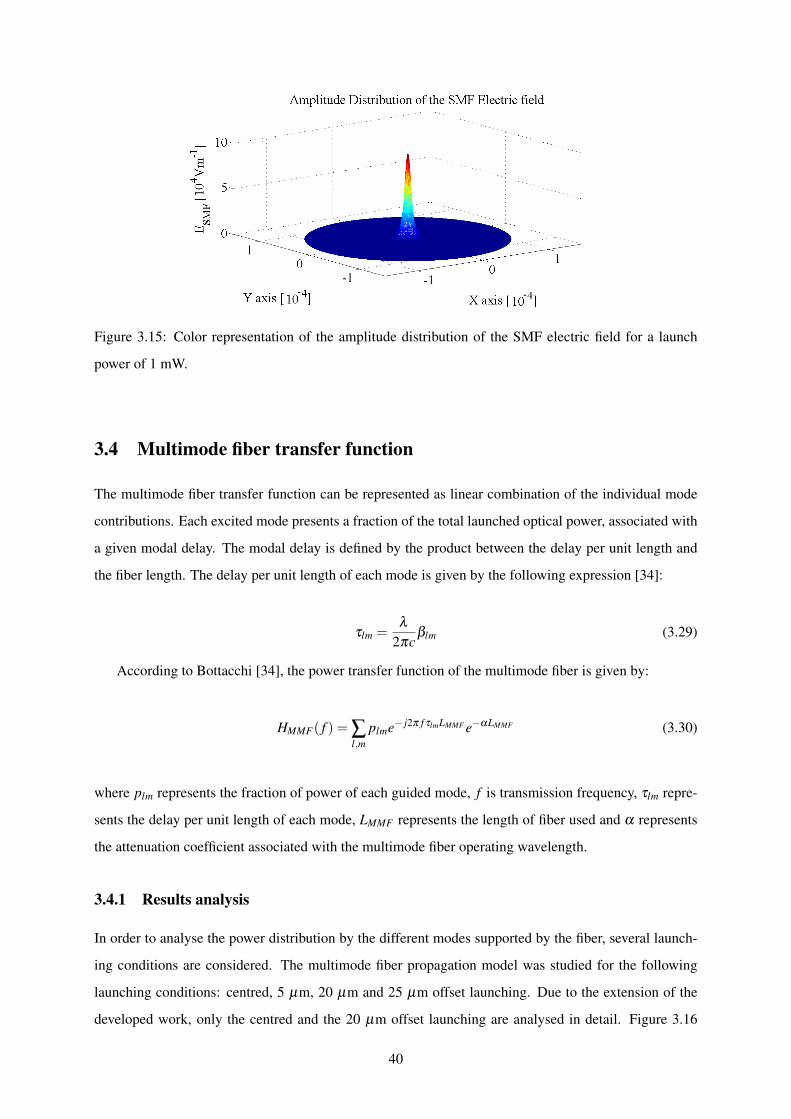
Figure 3.15: Color representation of the amplitude distribution of the SMF electric field for a launch
power of 1 mW.
3.4 Multimode fiber transfer function
The multimode fiber transfer function can be represented as linear combination of the individual mode
contributions. Each excited mode presents a fraction of the total launched optical power, associated with
a given modal delay. The modal delay is defined by the product between the delay per unit length and
the fiber length. The delay per unit length of each mode is given by the following expression [34]:
τlm =λ
2πcβlm (3.29)
According to Bottacchi [34], the power transfer function of the multimode fiber is given by:
HMMF( f ) = ∑l,m
plme− j2π f τlmLMMF e−αLMMF (3.30)
where plm represents the fraction of power of each guided mode, f is transmission frequency, τlm repre-
sents the delay per unit length of each mode, LMMF represents the length of fiber used and α represents
the attenuation coefficient associated with the multimode fiber operating wavelength.
3.4.1 Results analysis
In order to analyse the power distribution by the different modes supported by the fiber, several launch-
ing conditions are considered. The multimode fiber propagation model was studied for the following
launching conditions: centred, 5 µm, 20 µm and 25 µm offset launching. Due to the extension of the
developed work, only the centred and the 20 µm offset launching are analysed in detail. Figure 3.16
40

and Figure 3.17 show the multimode amplitude responses for two different launching conditions of the
optical source: zero and 20 µm offset, for fiber lengths of 100 m and 500 m, respectively.
Figure 3.16: Amplitude response for a fiber length of 100m and for centred fiber axes and for a launch
offset of 20 µm. The vertical colored lines represents the RF carrier frequency of each of the 14 UWB
sub-bands.
Figure 3.17: Amplitude response for a fiber length of 500m and for centred fiber axes and for a launch
offset of 20 µm. The vertical colored lines represents the RF carrier frequency of each of the 14 UWB
sub-bands.
The first important conclusion to take from the analysis of the amplitude frequency responses is that,
for non-centred launching conditions of the source optical power, there is power coupling losses. These
losses are due to the misalignment between the SMF and the MMF core axes. The power coupling losses
can be determined by the following expression [30]:
Lc = 10log(
PSMF
PMMF
)(3.31)
41

So, for an offset launching of 20 µm, there are coupling losses of 2.8dB. From Figure 3.16 and
Figure 3.17, it is possible to concluded that the multimode fiber frequency response is quite different from
one subband to another. The RF carriers, which are located in a smoother region of the multimode fiber
frequency response, will transmit information with better quality than the ones located in peak regions.
This result will be confirmed and analysed in detail in Chapter 4. Another important and expected result
is that, the amplitude response of the multimode mode fiber has significantly smoother behavior for a
fiber length of 100 m than for a fiber of 500 m. This happens because the length of the fiber has a direct
impact on the modal delay which, consequently, affects the multimode fiber amplitude response, as it
possible to see in Equation 3.30. The higher is the length of the fiber, the higher is the modal delay.
This effect creates more distortion in the transfer function and leads to a significant degradation of the
amplitude and delay responses, as it possible to see by comparing the results presented in Figure 3.18
and in Figure 3.19.
Figure 3.18: Delay response for a fiber length of 100 m and for centred fiber axes and for a launch offset
of 20 µm.
42

Figure 3.19: Delay response for a fiber length of 500 m and for centred fiber axes and for a launch offset
of 20 µm.
It is important to understand the dependence of the power coupling losses on the launching offset.
Table 3.8 shows the power coupling losses for all the launching conditions analysed in this work.
Table 3.8: Power coupling losses for different launching conditions.
Offset [µm] Pcoup[dB]
0 0
5 1.7
20 2.8
25 4.5
Table 3.8 shows that the increase of the offset of launching conditions increases the power coupling
losses. This happens due to the increase of the distance between the SMF and the MMF centres, which
increases the fibers misalignment. The offset increasing also leads to the cladding region proximity,
where is more difficult to couple power without losses [26].
Another important feature of the multimode fiber propagation model is the modal power distribution.
This distribution is strongly dependent on the launching conditions. Figure 3.20 presents the power
fraction distribution for the existing fiber modes plotted as a function of its modal delay, for centred
launching conditions. Figure 3.21, Figure 3.22, Figure 3.23 and Figure 3.24 show the power fraction
distribution for the existing fiber modes plotted as function of its modal delay, for a 20 µm launch offset.
The modal power distribution for λ = 1310 nm is presented in the Appendix B.
43

Figure 3.20: Power fraction of the HE1m modes for a fiber length of 100 m and centred launching
conditions. In this situation, only the lower order HE1m modes are excited.
(a) HE1m modes. (b) T E0m modes.
Figure 3.21: Power fraction of the HE1m and T E0m modes for a fiber length of 100 m and a launch offset
of 20 µm.
(a) EH1m, EH3m and EH5m modes. (b) EH7m, EH9m and EH11m modes.
Figure 3.22: Power fraction of the EH(l−1),m modes for l = 2,4,6,8,10,12, for a fiber length of 100 m
and a launch offset of 20 µm.
44

(a) EH13m and EH15m modes. (b) HE3m, HE5m and HE7m modes.
Figure 3.23: Power fraction of the EH(l−1),m modes for l = 14,16 and HE(l+1),m modes for l = 2,4,6,
for a fiber length of 100 m and a launch offset of 20 µm.
(a) HE9m, HE11m and HE13m modes. (b) HE15m and HE17m modes.
Figure 3.24: Power fraction of the HE(l+1),m modes for l = 8,10,12,14,16, for a fiber length of 100 m
and a launch offset of 20 µm.
Analysing the modal power distribution of the existing modes, several conclusions can be obtained.
Figure 3.20 shows that, for centred launching conditions, only the lower order modes are excited. In the
case of having non-centred launching conditions, the largest amount of power coupled at the multimode
fiber is distributed by higher order modes, as it is possible to see in Figure 3.21, Figure 3.22, Figure 3.23
and Figure 3.24. This results are consistent with the results presented in [36].
An important feature of the modal power distribution in the multimode fiber is that, for each mode
type, the modes with a higher modal delay, which are the ones with a higher value of the radial mode
number m, have more power coupled than the lowest ones, for the two analysed power launching con-
ditions. This means that the higher modes within each mode type, carry more power, as it is possible to
see, for example, in Figure 3.20 and 3.21.
Another important conclusion is that, for non-centred launching conditions, only the T E0m and the
odd EH(l−1),m and HE(l+1),m modes have coupled power. This characteristic is also observed for the 5
45

µm and 25 µm launch offset. The simulations results show that this happens due to the small modal
amplitude values presented by these modes. Figure 3.25, Figure 3.26 and Figure 3.27 show the modal
amplitude values for the first eight modes.
(a) T E0m modes. (b) T M0m modes.
Figure 3.25: Modal amplitudes of the T E0,m and T M0,m modes.
(a) HEl+1,m modes for l=0, 2, 4, 6. (b) HEl+1,m modes for l=1, 3, 5, 7.
Figure 3.26: Modal amplitudes of the HEl+1,m modes, for the first eight values of the azimuth mode
number l.
(a) EHl−1,m modes for l=2, 4, 6, 8. (b) EHl−1,m modes for l=3, 5, 7, 9.
Figure 3.27: Modal amplitudes of the EHl−1,m modes, for the first eight values of azimuth mode number
l.
46

Figures 3.25, 3.26 and 3.27 show that the modal amplitudes of the T M0,m and of the odd HEl+1,m
and EHl−1,m modes are significantly smaller than the ones of the T E0,m and the ones of the even HEl+1,m
and EHl−1,m modes. Since the modal power is affected by the modal amplitudes through its square (as
it is possible to see in Equation 3.18), it is obvious that these modes do not have power coupled to them.
In order to try to justify this effect, it is necessary to analyse the modal amplitude expression of each
type of mode. Substituting the field expressions presented in Table 3.1 in the Equation 3.22, the modal
amplitude of each mode type is obtained:
aT E0,m =
∫A∞
J0(USMF R)J0(USMF )
J1(UR)J1(U) sin(φ)dA∫
A∞
J21 (U)
J12(U)
dA(3.32)
aT M0,m =
∫A∞
J0(USMF R)J0(USMF )
J1(UR)J1(U) cos(φ)dA∫
A∞
J21 (U)
J12(U)
dA(3.33)
aHEl+1,m =
∫A∞
J0(USMF R)J0(USMF )
Jl(UR)Jl(U) cos(lφ)dA∫
A∞
J2l (U)
Jl2(U)
dA(3.34)
aEHl−1,m =
∫A∞
J0(USMF R)J0(USMF )
Jl(UR)Jl(U) cos(lφ)dA∫
A∞
J2l (U)
Jl2(U)
dA(3.35)
Analysing Equations 3.32, 3.33, 3.34 and 3.35, several conclusions can be obtained. It is possible to
see that, for a x-polarized source, the expression of the modal amplitudes of the HEl+1,m and EHl−1,m
modes is the same. This result is expected since they both have a dependence on the cos(lφ) for its x
component of the electrical field. It is also possible to see that the expression of the modal amplitude of
the T M0m modes is a particular case of the HEl+1,m and EHl−1,m modal amplitudes expression (for l = 1,
the expression of the modal amplitudes of these three types of modes is the same). Another important
fact is that all the modes that do not carry power have a azimuthal dependence on cos(lφ). Although
this is a necessary condition, this is not a sufficient one, since the even HEl+1,m and EHl−1,m modes
have dependence on the cos(lφ) and they do have power coupled. Nevertheless, the dependence of the x
component of the multimode electric field on the odd order Bessel function combined with the cos(lφ)
dependence is common to all of these modes. A further analyse on this subject on future studies should
be accomplished, in order to try to explain this behavior.
3.5 Conclusions
In this chapter, the principal features of the multimode fiber propagation are analysed. The four existing
types of modes are identified and its modal field expressions are presented. The modal amplitude and
the modal power expressions are presented and the power transfer function of the multimode fiber is
47

obtained. The results show that the smoothness of the multimode fiber frequency response is highly
dependent on the UWB band used and on the fiber length. The study of the modal power distribution
dependence on the launching conditions showed that a higher offset contributes to the existence of higher
power coupled to the high order modes and, consequently, to the appearance of higher coupling losses.
The increase of the launch offset increases the power coupling losses, due to the misalignment between
the fibers. This work also showed that not all the existing modes have power coupled and that the modes
with a higher radial number have more power coupled than the other ones.
48

Chapter 4
Transmission along multimode fiber
In this chapter, the transmission performance of the OFDM-UWB system is presented and analysed. As
it was mentioned on Chapter 2, the inly noise source of the system is the electric noise associated to the
opto-electric conversion performed by the PIN. The bit error ratio of the system is determined by the
semi-analytic gaussian approach [31]. The performance of the system for centred launching conditions
is presented in Section 4.1. In Section 4.2, the performance of the system for a launch offset of 20 µm is
presented.
4.1 Results for centred launching conditions
The maximum assessed distance will be limited by the degradation/distortion of the transmitted signal.
In order to analyse the system performance, it is necessary to analyse the bit error ratio of the overall
system and the received constellations at the OFDM-UWB receiver output and determine which is the
most limiting factor. It was defined that the target bit error ratio of the system is 10−4, since with this
value it is possible to use effectively forward error correction (FEC) algorithms and improve the system
performance. The numerical results obtained in this chapter are obtained for a launch power of 1 mW,
for a Mach-Zehnder modulator with a modulation index of 10% and a Vbias point of 2.5 V and for Bessel
filters of 6th order with a -3 dB bandwith of 400 MHz. The multimode fiber presents an attenuation of
1.5 dB/km. The equalizer transfer function is obtained by a polynomial interpolation of 3rd order. The
modulation index value, as well as the order of the equalization polynomial used in these simulations,
are optimized. These optimizations are presented in Appendix E.
4.1.1 Single-band transmission
Figure 4.1, Figure 4.2, Figure 4.3 and Figure 4.4 show the performance of the system for the first four
UWB sub-bands, respectively.
49

Figure 4.1: Performance of the OFDM-UWB system for the first OFDM-UWB sub-band. The orange
line represents the target bit error ratio of this system.
Figure 4.2: Performance of the OFDM-UWB system for the second OFDM-UWB sub-band. The orange
line represents the target bit error ratio of this system.
50
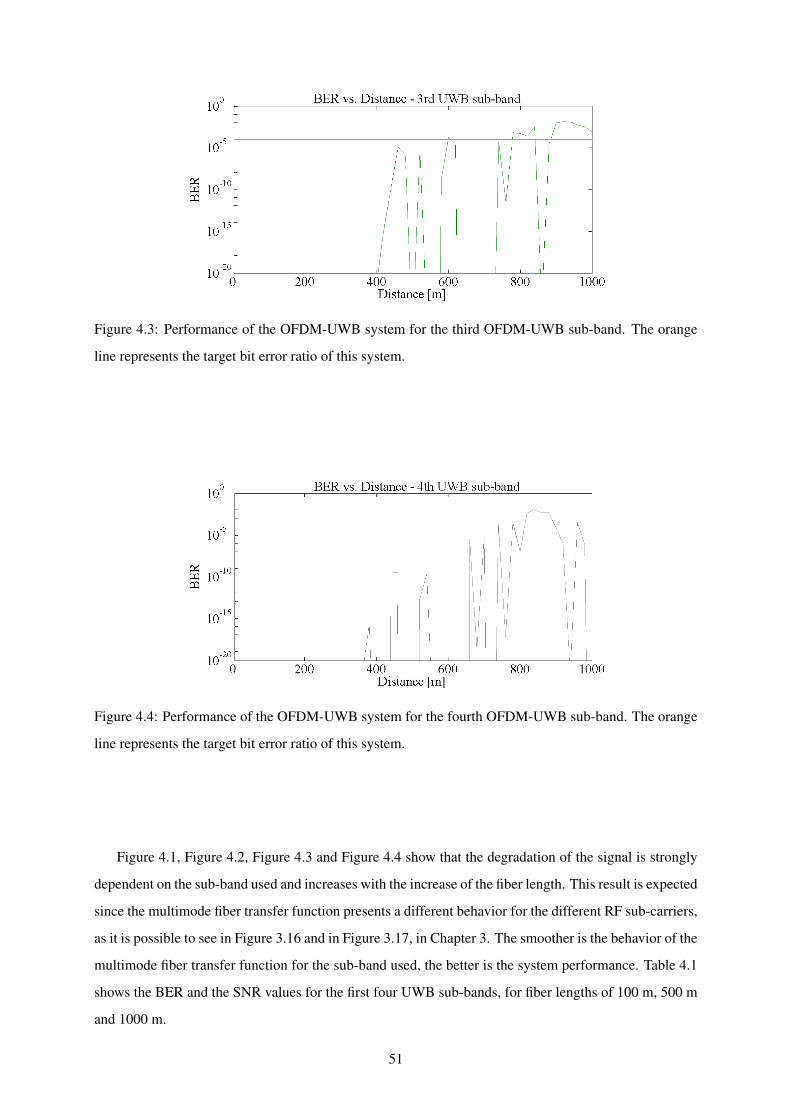
Figure 4.3: Performance of the OFDM-UWB system for the third OFDM-UWB sub-band. The orange
line represents the target bit error ratio of this system.
Figure 4.4: Performance of the OFDM-UWB system for the fourth OFDM-UWB sub-band. The orange
line represents the target bit error ratio of this system.
Figure 4.1, Figure 4.2, Figure 4.3 and Figure 4.4 show that the degradation of the signal is strongly
dependent on the sub-band used and increases with the increase of the fiber length. This result is expected
since the multimode fiber transfer function presents a different behavior for the different RF sub-carriers,
as it is possible to see in Figure 3.16 and in Figure 3.17, in Chapter 3. The smoother is the behavior of the
multimode fiber transfer function for the sub-band used, the better is the system performance. Table 4.1
shows the BER and the SNR values for the first four UWB sub-bands, for fiber lengths of 100 m, 500 m
and 1000 m.
51

Table 4.1: Performance of the overall system for fiber lengths of 100 m, 500 m and 1000 m, for the first
four UWB sub-bands.
UWB sub-band
Fiber length [m]
100 500 1000
BER SNR [dB] BER SNR [dB] BER SNR [dB]
1 < 10−20 34.8 8.6×10⁻¹³ 34.1 4.3×10⁻³ 33.4
2 < 10−20 37.0 < 10−20 35.4 2.2×10⁻³ 33.2
3 < 10−20 39.0 < 10−20 31.6 7.76×10⁻⁴ 33.1
4 < 10−20 33.4 < 10−20 34.8 < 10−20 33.4
From the analysis of the results presented in Table 4.1, it is possible to conclude that the good
performance of the system is obtained due to its high SNR. The noise power has a low fixed value and
the MMF transmission losses are quite low (for example, for 1000 m the transmission losses are 1.5 dB).
So, the high SNR values result from the high signal power injected in the MMF. The differences between
the SNR values for the same fiber length and different sub-bands can be explained by the MMF transfer
function. Figure 4.5 and Figure 4.6 show the multimode fiber amplitude response for a fiber length of
100 m, in the third and the fourth UWB sub-bands, respectively.
Figure 4.5: Multimode fiber amplitude for a fiber length of 100 m, in the third UWB sub-band.
52

Figure 4.6: Multimode fiber amplitude response for a fiber length of 100 m, in the fourth UWB sub-band.
As it is possible to see in Figure 4.5 and in Figure 4.6, the amplitude response of the MMF fiber is
very dependent on the sub-band use. The carrier frequency located on the third OFDM-UWB sub-band
( fRF =4.488 GHz) has an amplitude 2.6 dB higher than the carrier located on the fourth OFDM-UWB
sub-band ( fRF =5.016 GHz). So, the OFDM-UWB signal power is higher when the third UWB sub-band
is used which, consequently, generates a higher SNR. Another curious fact is that, for a fiber length of
1000 m, the system presents a bit error ratio inferior to 10−20, for a transmission in the fourth OFDM-
UWB sub-band. In fact, by looking at Figure 4.1, Figure 4.2, Figure 4.3 and Figure 4.4, it is possible to
see that the fourth sub-band is the only sub-band that presents a BER value inferior to 10−4. This happens
due to the irregular behavior of the MMF transfer function, which can present very different values for
the same fiber length, as long as the OFDM-UWB signals are transmitted in different sub-bands.
The maximum assessed distance is limited by the performance for the worst sub-band. It is possible
to conclude from the analysis of the Figure 4.1, Figure 4.2, Figure 4.3 and Figure 4.4 that the worst
sub-band is the third one, since it exceeds the target bit error ratio for a smaller distance than the other
sub-bands used. So, the maximum assessed distance which guarantees a bit error ratio inferior to 10−4
is 600 m.
Another important component of the system that can limit the system performance is the equalizer.
Figure 4.7 shows the equalizer transfer function, the polynomial interpolation and the pilots positions for
a fiber length of 600 m, in the third UWB sub-band.
53

(a) Amplitude. (b) Phase.
Figure 4.7: Equalizer transfer function for a fiber length of 600 m, in the third OFDM-UWB sub-band.
The results presented in Figure 4.7 show that the real channel and the equalizer transfer function
are very different from each other. Although the equalizer tries to estimate the channel, its polynomial
interpolation is not rigorous enough to do a satisfying estimation of the channel between the pilots. The
channel presents a very sharp and irregular behaviour, which makes the polynomial interpolation too
simple to estimate the channel. It is obvious from this analysis that the equalizer used in this system
it is not a good estimator of this channel. The system performance can be improved by using a better
equalizer.
Figure 4.8 and Figure 4.9 show the received constellations without noise, in the third UWB sub-band,
for fiber lengths of 100 m, 500 m and 600 m, respectively.
(a) Fiber length of 100 m. (b) Fiber length of 500 m.
Figure 4.8: Received constellations for fiber lengths of 100 m and 500 m, in the third UWB sub-band.
54

Figure 4.9: Received constellations for a fiber length of 600 m, in the third UWB sub-band.
Analysing the results presented in Figure 4.9 and Figure 4.8, it can be concluded that the distortion of
the received constellations increases with the increase of the fiber length. In fact, for a fiber length of 600
m, which is the situation close to the target bit error ratio, the received constellation presents a very high
distortion. In this situation, the OFDM-UWB receiver is not able to decode the signal properly, since
some of the received constellation points are spread all over the complex plan. So, the signal distortion
limits the maximum assessed distance. In order to determine which is the maximum assessed distance of
this ystem for a BER of 10−4 with low distortion of the signal, some simulations were performed and the
main conclusion is that, in order to have a perfectly decoded and demaped received constellation (this
means, four agglomerations of points sufficiently apart from each other), the fiber length must not exceed
560 m. So, for single-band transmission and centred launching conditions, the OFDM-UWB system is
mainly limited by signal distortion and the maximum assessed distance is 560 m.
4.1.2 Multi-band transmission
It is also be interesting to study the performance of the system in a multi-band environment. Figure 4.10
and Figure 4.11 show the system performance when two and three OFDM-UWB sub-bands are trans-
mitted simultaneously, respectively. The performance of the overall system is given by the performance
of the worst sub-band.
55

Figure 4.10: Performance of the OFDM-UWB system for simultaneous transmission of the first and the
fourth UWB sub-bands. The orange line represents the target bit error ratio of the system.
Figure 4.11: Performance of the OFDM-UWB system for simultaneous transmission of the first, second
and third UWB sub-bands. The orange line represents the target bit error ratio of the system.
Analysing Figure 4.10 and Figure 4.11, it is possible to see that the degradation of the system in-
creases substantially when more than one sub-band is used simultaneously. For the case presented in
Figure 4.10, the sub-band that presents the worst performance is the first one. In this situation, the max-
imum assessed distance which guarantees a BER inferior to 10−4 is 380 m, which is 180 m less than
when only a sub-band is used. In the situation presented in Figure 4.11, the performance of the system
decreases drastically. When three sub-bands are transmitting simultaneously, the maximum assessed dis-
tance is reduced to less than 50 m. Figure 4.12 and Figure 4.13 show the received constellations for a
fiber length of 200 m, in the case of having simultaneous transmission of the first three sub-bands.
56

(a) UWB 1 (b) UWB 2
Figure 4.12: Received constellations for a fiber length of 200 m, in the case of having simultaneous
transmission of the first three sub-bands.
Figure 4.13: Received constellation for a fiber length of 200 m, in the case of having simultaneous
transmission of the first three sub-bands - UWB 3.
Figure 4.12 and Figure 4.13 show that, although the second and the third UWB sub-band presents
a good received constellation, the constellation presented in the first sub-band presents some significant
distortion. This sub-band limits the performance of the overall system. One possible explanation of this
effect is the interference between sub-bands. A further study of this subject will allow to confirm if the
sub-band interference is responsible for the performance degradation of multi-band transmission.
4.2 Results for a launch offset of 20 µm
The previous BER curves and constellations were obtained of centred launching conditions. The analysis
is now repeated for a 20 µm launch offset, in order to study the impact of having high-order modes
excitation.
57

4.2.1 Single-band transmission
Figure 4.14, Figure 4.15, Figure 4.16 and Figure 4.17 present the bit error ratio of the first four UWB
sub-bands, respectively.
Figure 4.14: Performance of the OFDM-UWB system of the first OFDM-UWB sub-band, for a launch
offset of 20 µm. The orange line represents the target bit error ratio of this system.
Figure 4.15: Performance of the OFDM-UWB system of the second OFDM-UWB sub-band, for a launch
offset of 20 µm. The orange line represents the target bit error ratio of this system.
58

Figure 4.16: Performance of the OFDM-UWB system of the third OFDM-UWB sub-band, for a launch
offset of 20 µm. The orange line represents the target bit error ratio of this system.
Figure 4.17: Performance of the OFDM-UWB system of the fourth OFDM-UWB sub-band, for a launch
offset of 20 µ m. The orange line represents the target bit error ratio of this system.
Figure 4.14, Figure 4.15, Figure 4.16 and Figure 4.17 show that the degradation of the OFDM-UWB
system for a launch offset of 20 µm is considerably higher than for centred launch conditions. As it
was mentioned previous on the text, the performance of the overall system is limited by the performance
of the worst sub-band. For a launch offset of 20 µm, the sub-band which presents a shorter distance
for the target bit error rate (10−4) is the fourth one. So, under this condition, the maximum assessed
distance which guarantees a good performance of the OFDM-UWB system is about 270 m, less 330 m
than for centred launching conditions. Table 4.2 shows the BER and the SNR values of the first four
UWB sub-bands, for fiber lengths of 100 m, 500 m and 1000 m.
59
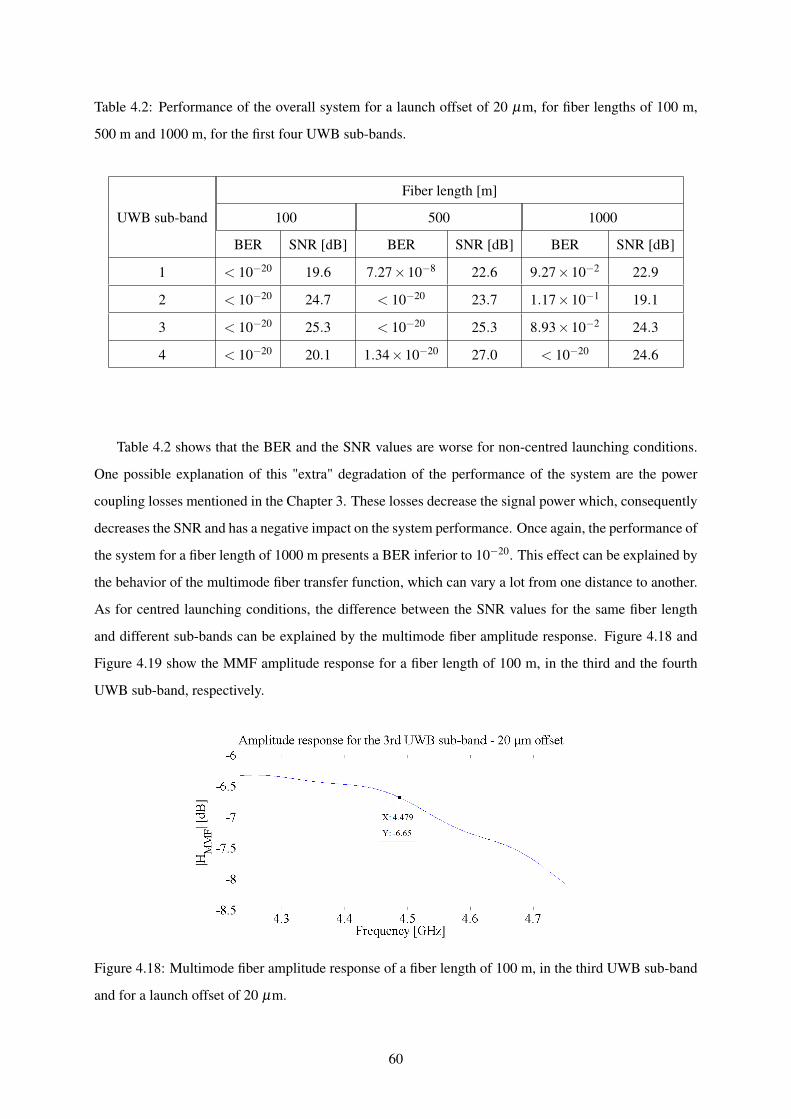
Table 4.2: Performance of the overall system for a launch offset of 20 µm, for fiber lengths of 100 m,
500 m and 1000 m, for the first four UWB sub-bands.
UWB sub-band
Fiber length [m]
100 500 1000
BER SNR [dB] BER SNR [dB] BER SNR [dB]
1 < 10−20 19.6 7.27×10⁻⁸ 22.6 9.27×10⁻² 22.9
2 < 10−20 24.7 < 10−20 23.7 1.17×10⁻¹ 19.1
3 < 10−20 25.3 < 10−20 25.3 8.93×10⁻² 24.3
4 < 10−20 20.1 1.34×10⁻²⁰ 27.0 < 10−20 24.6
Table 4.2 shows that the BER and the SNR values are worse for non-centred launching conditions.
One possible explanation of this "extra" degradation of the performance of the system are the power
coupling losses mentioned in the Chapter 3. These losses decrease the signal power which, consequently
decreases the SNR and has a negative impact on the system performance. Once again, the performance of
the system for a fiber length of 1000 m presents a BER inferior to 10−20. This effect can be explained by
the behavior of the multimode fiber transfer function, which can vary a lot from one distance to another.
As for centred launching conditions, the difference between the SNR values for the same fiber length
and different sub-bands can be explained by the multimode fiber amplitude response. Figure 4.18 and
Figure 4.19 show the MMF amplitude response for a fiber length of 100 m, in the third and the fourth
UWB sub-band, respectively.
Figure 4.18: Multimode fiber amplitude response of a fiber length of 100 m, in the third UWB sub-band
and for a launch offset of 20 µm.
60

Figure 4.19: Multimode fiber amplitude response of a fiber length of 100 m, in the fourth UWB sub-band
and for a launch offset of 20 µm.
Since the MMF transfer function for a launch offset of 20µm is sharper and more irregular than the
centred one, a higher degradation and distortion of the OFDM-UWB signal is expected. It is possible to
see in Figure 4.18 and Figure 4.19 that the carrier frequency located on the third OFDM-UWB sub-band
has an amplitude about 3.3 dB higher than the carrier located on the fourth UWB sub-band. This effect
leads to a higher SNR on the third sub-band.
Figure 4.20 shows the equalizer transfer function, the real channel and the pilots positions for a fiber
length of 270 m, in the fourth UWB sub-band.
(a) Amplitude. (b) Phase.
Figure 4.20: Channel transfer functions for a launch offset of 20 µm in the fourth UWB sub-band, for a
fiber length of 270 m.
Figure 4.20 shows that the polynomial estimation of the channel given by the pilots information is
very different from the real one. As a consequence of that fact, the equalizer can’t provide a rigorous
estimative of the channel between the pilots. The obtained results confirm that the equalizer used in this
system is not adequate to estimate the MMF transfer function. A bad equalizer contributes to the increase
of the distortion and the degradation of the system performance.
61

Figure 4.21 and Figure 4.22 show the received constellations for the fourth UWB sub-band (which
is the sub-band that limits the system performance), respectively, for fiber lengths of 100 m, 270 m and
300 m.
(a) Fiber length of 100 m. (b) Fiber length of 270 m.
Figure 4.21: Received constellations of the fourth UWB sub-band for a launch offset of 20 µm, for fiber
lengths of 100 m and 270 m.
Figure 4.22: Received constellations of the fourth UWB sub-band for a launch offset of 20 µm for fiber
lengths of 300 m.
Figure 4.21 and Figure 4.22 show that, like for the centred launching conditions, when we have a
launch offset of 20 µm, the increase of the fiber length also increases the distortion of the transmitted
signal. The QPSK received constellation can only be demaped correctly for a fiber length equal or inferior
to 270 m. The numerical results show that for fiber lengths exceeding 270 m, the received constellation
presents a very high distortion, what makes not possible to demap the received constellation correctly.
So, for a launch offset of 20 µm, the maximum assessed distance is 270 m.
4.2.2 Multi-band transmission
The use of a multi-band OFDM-UWB system will certainly have a strong impact on the BER of the
overall system. Figure 4.23 and Figure 4.24 present the BER of the system for a launch offset of 20 µm,
62

when two and three OFDM-UWB sub-bands are transmitted simultaneously, respectively.
Figure 4.23: Performance of the OFDM-UWB system for simultaneous transmission of the first and
second UWB sub-bands, for a launch offset of 20 µm. The orange line represents the target bit error
ratio of the system.
Figure 4.24: Performance of the OFDM-UWB system for simultaneous transmission of the first, second
and third UWB sub-band, for a launch offset of 20 µm. The orange line represents the target bit error
ratio of the system.
As it was seen for the centred launching conditions, the use of the multi-band technique increases the
degradation of the performance of the overall system. In the case of having two sub-bands transmitting
simultaneously, the maximum transmission distance is slightly superior to 200 m. For the transmission
of three sub-bands simultaneously, the maximum transmission distance is less than 100 m. Nevertheless,
this value is superior to the centred launching conditions, for the same conditions. Figure 4.25 and Fig-
63

ure 4.26 show the received constellations for a fiber length of 300 m, in the case of having simultaneous
transmission of the first three sub-bands.
(a) UWB 1 (b) UWB 2
Figure 4.25: Received constellations for a fiber length of 300 m for a launch offset of 20 µm, of the case
of having simultaneous transmission of the first three sub-bands.
Figure 4.26: Received constellation for a fiber length of 300 m for a launch offset of 20 µm, in the case
of having simultaneous transmission of the first three sub-bands - UWB 3.
Figure 4.25 and Figure 4.26 show that the received constellation which presents the worst quality is
the one transmitted on the first UWB sub-band. As it was mentioned before in the text, a further study
on the impact of having interference between the sub-bands would help to explain the reduction of the
maximum assessed distance for multi-band situation.
4.3 Conclusions
In this chapter, the OFDM-UWB transmission system over multimode fiber has been analysed under
several conditions. The performance of the system is strongly dependent on the MMF transfer function
behavior and on the sub-bands used. The most restrictive factor of the multimode fiber transmission is
the fiber length, once the higher is the length, the higher is the modal delay, which leads to a higher
degradation (since it presents more dips) of the MMF transfer function.
64

Another important constraint of the performance of the system is the launching condition. The
power coupling losses associated with the excitation of the high-order modes contributes to a significant
decrease of the system performance. The transmission of multi-band OFDM-UWB signals also degrades
significantly the performance of the system, for both launching conditions considered. It was concluded
that the equalizer used in the OFDM-UWB receiver is not appropriate for the multimode fiber propaga-
tion system, since it can’t estimate correctly the channel behaviour. Due to this fact, the equalizer won’t
be able to do a correct compensation of the channel transfer function between the pilots sub-carriers.
The use of an equalizer that can perform a good estimation of the channel will contribute to improve the
overall system performance.
65

66

Chapter 5
Conclusions and future work
In this chapter, the final conclusions and some suggestions for the future work in this subject are pre-
sented.
5.1 Final Conclusions
In this dissertation, the transmission of OFDM-UWB signals along multimode fiber is studied and eval-
uated through a numerical simulation. The increasing capacity demands of the current networks and the
advantages of using multimode fiber optical systems are presented in Chapter 1.
In Chapter 2, the main components of the OFDM-UWB system are presented and analysed. Once
this system transmits OFDM-UWB signals, its characteristics and its main advantages are presented.
The system analysis in back-to-back configuration allowed to evaluate the performance of the system
without multimode fiber transmission. The obtained results show that system performance depends on
the number of sub-bands used.
In Chapter 3, the model of the multimode fiber propagation is developed from the theoretical model.
The obtained results showed that the launching conditions, the fiber length and the carrier frequency
of the UWB sub-band used have a significant impact on the multimode fiber transfer function. The
excitation of higher order modes by setting non-centred launching conditions introduces coupling losses
and contributes to the degradation of the multimode fiber transfer function.
In Chapter 4, the overall system performance is evaluated based on the bit error ratio, on the signal
to noise ratio and on the received constellations. Three main conclusions are achieved: the launching
conditions, the multimode fiber length and the number of UWB sub-bands used have a strong impact on
the system performance. The maximum assessed distance for single-channel transmission and centred
launching conditions is 560 m, while for a launch offset of 20 µm the maximum distance is only 270
m. In the case of having multi-band transmission of two sub-bands, for centred launching conditions the
67

maximum transmission distance is 380 m and for a launch offset of 20 µm, the maximum transmission
distance is 210 m. For the simultaneous transmission of the first three UWB sub-bands, the maximum
transmission distance is less than 50 m, for centred launching conditions, and less than 100 m, for a
launch offset of 20 µm. It was also concluded that the equalizer used in this simulator is not appropriated
to the multimode fiber propagation, since it can’t estimate correctly the channel’s behavior between the
pilots. A suggestion that will improve the system’s performance is to use an equalizer more able to the
channel’s estimation between the pilots.
5.2 Future Work
The most obvious future direction of this dissertation is to improve the MMF link by enhancing the
bandwidth-distance while reducing the system complexity and cost. As a result of the developed work
in this dissertation, some suggestions for future work to continue/complement this subject are:
• study the use of equalizers more efficient than the one considered in this dissertation;
• study the impact of having chromatic dispersion on the multimode fiber propagation model;
• study the impact of having non-linear effects on the multimode fiber propagation model;
• study the use of other modulation techniques for the OFDM sub-carriers like, for example, 16-
QAM.
68

Appendix A
Mathematical Background
In this section, some mathematical relationships are presented [32]. Applying these expressions allows
to simplify some of the equations presented in this dissertation.
A.1 Relationships between Cartesian and cylindrical polar coordinates x = r cos(φ)
y = r sin(φ)(A.1)
r =
√x2 + y2
φ = arctan yx
(A.2)
A.2 Bessel Functions
Bessel function equation
x2 d2
dx2 + xddx
+(x2−α2)
y = 0 (A.3)
Bessel function of first kind and of the modified Bessel function of the second kind - Recurrence
relations
J−l(r) = −1lJl(r) (A.4)
K−l(r) = Kl(r) (A.5)
69

Jl(r) =r2lJl−1(r)+ Jl+1(r) (A.6)
Jl+1(r) =lr
Jl(r)−
dJl(r)dr
(A.7)
Jl−1(r) =lr
Jl(r)+
dJl(r)dr
(A.8)
dJl(r)dr
=12Jl−1(r)− Jl+1(r) (A.9)
dJ0(r)dr
=−J1(r) (A.10)
Kl(r) =r2lKl+1(r)−Kl−1(r) (A.11)
Kl+1(r) =lr
Kl(r)−
dKl(r)dr
(A.12)
Kl−1(r) =−lr
Kl(r)−
dKl(r)dr
(A.13)
dKl(r)dr
=−12Kl−1(r)+Kl+1(r) (A.14)
dK0(r)dr
=−K1(r) (A.15)
Bessel function of first kind and of the modified Bessel function of the second kind - Indefinite
integrals
∫rJ0(ar)dr =
aa
J1(ar) (A.16)
∫rJl
2(ar)dr =r2
2
J2l (ar)− Jl−1(ar)Jl+1(ar)
(A.17)
∫rJ0
2(ar)dr =r2
2
J20 (ar)+ J2
1 (ar)
(A.18)
∫ J12(ar)2
dr =−12
J20 (ar)+ J2
1 (ar)
(A.19)
70

∫rJl(ar)Jl(br)dr =
r2
a2−b2
bJ2
l (ar)Jl−1(br)−aJl(br)Jl−1(ar)
(A.20)
∫rKl
2(ar)dr =r2
2
K2l (ar)−Kl−1(ar)Kl+1(ar)
(A.21)
∫rK0
2(ar)dr =r2
2
K20 (ar)−K1(ar)2 (A.22)
∫rKl(ar)Kl(br)dr =
r2
a2−b2
bK2
l (ar)Kl+1(br)−aKl(br)Kl+1(ar)
(A.23)
∫rJl(ar)Kl(br)dr =
r2
a2−b2
aK2
l (ar)Jl+1(br)−bJl(br)Kl+1(ar)
(A.24)
71

72

Appendix B
Numerical results for λ = 1310 nm
B.1 Mode Classification
T E0,m and T M0,m modes
The propagation constants of the T E0,m and T M0,m modes for can be determined numerically by solving
the Equation 3.12. The obtained results are presented in Table B.1. A graphical interpretation of the
results is shown in Figure B.1.
Table B.1: Computed eigenvalue for T E0,m and T M0,m modes.
T E0,m, T M0,m modes
m u0m w0m β0m [106m−1]
1 24.5605 5.6504 7.0302
2 21.7216 12.7797 7.0452
3 18.7756 16.8114 7.0587
4 15.7935 19.6395 7.0704
5 12.7915 21.7146 7.0801
6 9.7752 23.2291 7.0878
7 6.7447 24.2828 7.0934
8 3.6850 24.9312 7.0970
73

Figure B.1: Graphical solutions of the eigenvalue equation for T E0,m and T M,0m modes.
The T E0,m and T M0,m modes have one more mode for λ = 1310 nm than the for the corresponding
modes for λ = 1550 nm.
HEl+1,m modes
For every fixed value of l, the propagation constants of the HEl+1,m modes are determined numerically
by solving the Equation 3.13, for l = 0, and Equation 3.13, for l ≥ 1. The obtained results are presented
in Table B.2, for l = 0,1,2,3,4. A graphical interpretation of the eigenequation solutions for the HE1m
modes is shown in Figure B.2. The number of the allowed modes is given by the number of intersections
in the graphic.
Table B.2: Computed eigenvalue for HEl+1,m modes for l = 0,1,2,3,4.
HEl+1,m modes
m ulm wlm β1m[106m−1] β2m[106m−1] β3m[106m−1] β4m[106m−1]
1 25.2048 0.0000 7.0377 7.0302 7.0381 7.0309
2 25.1923 0.7036 7.0521 7.0452 7.0525 7.0460
3 25.1797 1.0618 7.0647 7.0587 7.0651 7.0595
4 25.1672 1.3266 7.0754 7.0704 7.0758 7.0712
5 25.1546 1.5467 7.0841 7.0801 7.0845 7.0809
6 25.1420 1.7392 7.0908 7.0878 7.0912 7.0886
7 25.1294 1.9124 7.0954 7.0934 7.0958 7.0943
8 25.1169 2.0711 7.0980 7.0970 ——— ———
74

Figure B.2: Graphical solutions of the eigenvalue equation for HE1m modes.
Like for λ = 1550 nm, there is a cut-off value that when is exceeded, no more mode numbers are al-
lowed. For λ = 1310 nm, the last allowed mode is the HE21,m. For the successive HE22,m, the eigenequa-
tion does not present any solution, as it is possible to see in Figure B.3.
(a) HE21,m modes. (b) HE22,m modes.
Figure B.3: Eigenequation solutions near to the cut-off value. For the HE22,m, there is no intersections
between the eigenequation members, so the HE21,m mode is the last allowed mode for this fiber.
EHl−1,m modes
The propagation constants of the EHl−1,m modes can be determined numerically by solving the Equa-
tion 3.14, for l > 1.Table B.3 show the numerical results for l = 1,2,3,4. A graphical interpretation of
the results for the EH1,m modes is shown in Figure B.4. The number of the allowed modes is given by
the number of intersections of the eigenequation members.
75
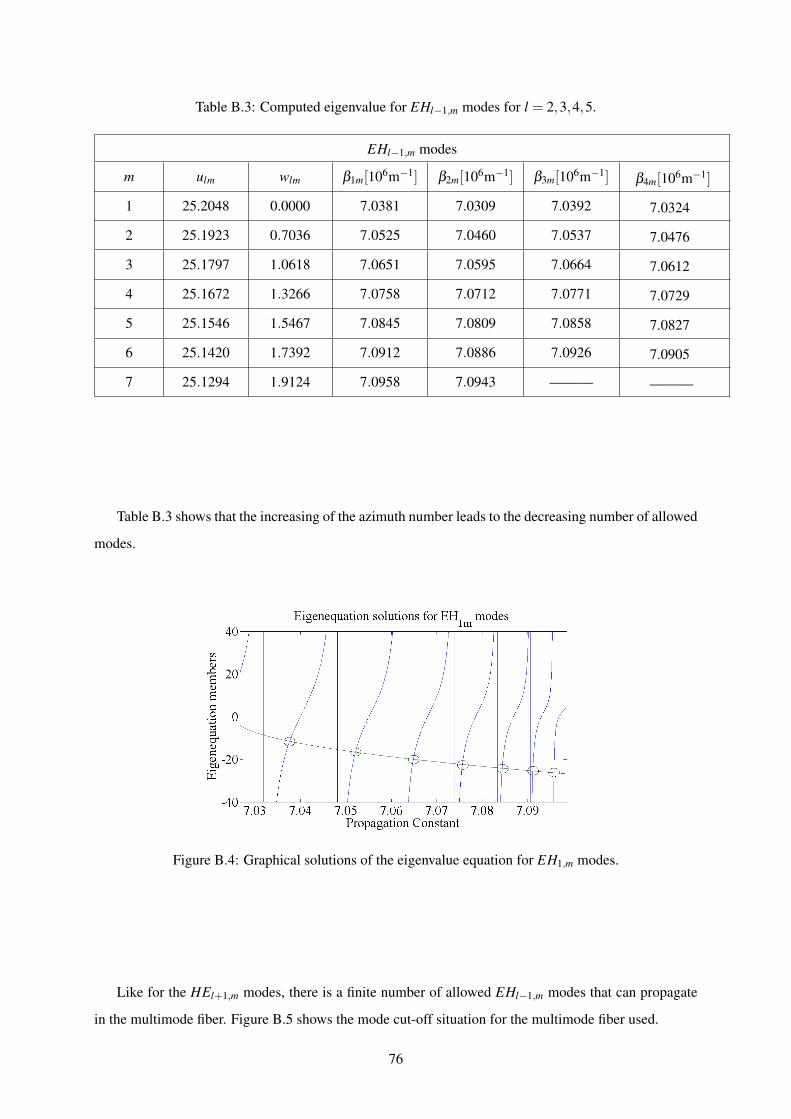
Table B.3: Computed eigenvalue for EHl−1,m modes for l = 2,3,4,5.
EHl−1,m modes
m ulm wlm β1m[106m−1] β2m[106m−1] β3m[106m−1] β4m[106m−1]
1 25.2048 0.0000 7.0381 7.0309 7.0392 7.0324
2 25.1923 0.7036 7.0525 7.0460 7.0537 7.0476
3 25.1797 1.0618 7.0651 7.0595 7.0664 7.0612
4 25.1672 1.3266 7.0758 7.0712 7.0771 7.0729
5 25.1546 1.5467 7.0845 7.0809 7.0858 7.0827
6 25.1420 1.7392 7.0912 7.0886 7.0926 7.0905
7 25.1294 1.9124 7.0958 7.0943 ——— ———
Table B.3 shows that the increasing of the azimuth number leads to the decreasing number of allowed
modes.
Figure B.4: Graphical solutions of the eigenvalue equation for EH1,m modes.
Like for the HEl+1,m modes, there is a finite number of allowed EHl−1,m modes that can propagate
in the multimode fiber. Figure B.5 shows the mode cut-off situation for the multimode fiber used.
76

(a) EH19,m modes. (b) EH20,m modes.
Figure B.5: Eigenequation solutions near to the cut-off value. For the EH20,m, there is no intersections
between the eigenequation members, so the EH19,m mode is the last allowed mode for this fiber.
This results are coincident with the results obtained in [34].
B.2 Modal power distribution
In the following figures, the modal power distribution for centred and launch offset of 20 µm for fiber
length of 100 m are presented.
Figure B.6: Power fraction of the HE1,m modes for centred launching conditions. In this situation, only
the lower order HE1,m modes are excited.
77

(a) HE1m modes. (b) T E0m modes.
Figure B.7: Power fraction of the HE1,m and T E0,m modes for a launch offset of 20 µm.
(a) EH1m, EH3m and EH5m modes. (b) EH7m, EH9m and EH11m modes.
Figure B.8: Power fraction of the EH(l−1),m modes for l = 2,4,6,8,10,12, for a launch offset of 20 µm.
(a) EH13m, EH15m and EH17m modes. (b) EH19m modes.
Figure B.9: Power fraction of the EH(l−1),m modes for l = 14,16,18,20, for a launch offset of 20 µm.
78

(a) HE3m, HE5m and HE7m modes. (b) HE9m, HE11m and HE13m modes.
Figure B.10: Power fraction of the HE(l+1),m modes for l = 4,6,8,10,12,14, for a launch offset of 20
µm.
(a) HE15m, HE17m and HE19m modes. (b) HE21m modes.
Figure B.11: Power fraction of the HE(l+1),m modes for l = 14,16,18,20, for a launch offset of 20 µm.
Since there are more allowed modes for λ = 1310 nm than for λ = 1550 nm, for non-centred launch-
ing conditions, the total launched power is split for more modes.
79

80

Appendix C
Mathematical derivation of the modal
amplitude expression
In this section, the mathematical derivation of the modal amplitude expression is presented.
Assuming that the fiber is a non-absorbing waveguide, the electromagnetic modal fields satisfy the
following orthogonality condition [34]:
∫A∞
Et,lm(ρ,φ)×H∗t,lm(ρ,φ) · zdA = 0, (C.1)
In order to proceed with the derivation of the modal amplitudes as consequent to a given source
field excitation, the total electromagnetic field must be equalized at the launching section at z = 0. The
total field expansion in Equation 3.16, evaluated at the launching section at z = 0, must coincide with
the source electromagnetic field Es,Hs. Due to this fact, and assuming that the longitudinal dependence
of the source field can be factorized using the same phase factor e j(wt−βsz) shown in Equation 3.2, the
electromagnetic field expansion can be written as [34]:
Es(ρ,φ) = ∑l,m
almEt,lm(ρ,φ)+Ez,lm(ρ,φ)z (C.2)
Hs(ρ,φ) = ∑l,m
almHt,lm(ρ,φ)+Hz,lm(ρ,φ)z (C.3)
For each generic bound mode characterized by the index (l,m), the following vector product is
formed by the integration over the infinite fiber cross-section A∞ between the source electric field Es and
the complex conjugate of the normalized magnetic field H∗s :
81

∫A∞Es(ρ,φ)×H∗s (ρ,φ) · zdA =
=∫
A∞∑l,m
alm[Et,lm(ρ,φ)+Ez,lm(ρ,φ)z]× [H∗t,lm(ρ,φ)+H∗z,lm(ρ,φ)z] · zdA
(C.4)
Simplifying and manipulating Equation C.4, allows to determinate the general expression of the
modal amplitude of each (l,m) mode:
al,m =
∫A∞Es(ρ,φ)×H∗t,l,m(ρ,φ) · zdA∫
A∞Et,l,m(ρ,φ)×H∗t,l,m(ρ,φ) · zdA
(C.5)
Weakly guiding approximation
The modal fields presented in Table 3.1 are defined for weakly guiding waveguides, so it is possible to
simplify the modal amplitude expression presented in Equation C.5, once the following expression is
valid under the weakly guiding approximation [34]:
Ht,lm(ρ,φ)∼=nco,clad
Z0z×Et,lm(ρ,φ) (C.6)
where Z0 =√
µ0ε0
represents the vacuum impedance, µ0 and ε0 represents the vacuum magnetic and
electric permittivity, respectively.
Applying the weakly waveguide approximation presented in Equation C.6 and the vector identity e×
(z×e) = z to the integrand functions of the modal amplitude expression, simplifies the modal amplitude
integrand functions:
Et,lm(ρ,φ)×H∗t,lm(ρ,φ) · z =nco,clad
Z0Et,lm(ρ,φ)× [z×E∗t,l,m(ρ,φ)] · z =
nco,clad
Z0|Et,l,m(ρ,φ)|2 (C.7)
Es(ρ,φ)×H∗t,lm(ρ,φ) · z =nco,clad
Z0Es(ρ,φ)× z×E∗t,lm(ρ,φ) · z (C.8)
This means that, under the weakly waveguide approximation, the modal amplitude in Equation C.5
can be expressed only in terms of the electric field. Substituting Equation C.7 and Equation C.8 in
Equation C.5, the modal amplitude of each guided mode under the weakly guiding approximation is
obtained:
al,m =
∫A∞Es(ρ,φ)× z×E∗t,lm(ρ,φ) · zdA∫
A∞|Et,lm(ρ,φ)|2dA
(C.9)
Once the source field Es(ρ,φ) is known, the modal amplitude depends exclusively on the transversal
component of the electric field.
82

Appendix D
Coordinates System Conversion
In this work, it is assumed that the source field is launched from a single mode fiber, as it was mentioned
in the section 3.3.1. In Figure D.1, a schematic representation of the SMF and MMF core radius is
presented.
Figure D.1: Axial representation of the SMF and the MMF core radius.
As it is possible to see in Figure D.1, unless for the case of having centred launching conditions, the
SMF and the MMF referential is not the same. So, in order to do the light launch from the SMF to the
MMF, it is necessary to identify how they are related with each other.
In order to have a direct correspondence between the SMF and the MMF referentials, a coordinates
system conversion is required. Figure D.2 shows the geometrical interpretation of the coordinates system
conversion.
83

Figure D.2: Geometrical interpretation of the coordinates system conversion problem.
The first step is to determine the SMF coordinates as a function of the MMF coordinates. Assuming
that the relative position of the two core centres is known:
(0MMF ,0SMF) = (h,b) (D.1)
where h represents the horizontal coordinate and b represents the vertical coordinate of the vector
that gives the distance between the two core centres, in the MMF referential. The SMF coordinates of
a given arbitrary point P written as a function of its MMF coordinates, are given by the sum of the two
vectors represented in blue and red in Figure D.1:
−→P = (xSMF ,ySMF) = (xMMF ,yMMF)− (h,b) = (xMMF −h,yMMF −b) (D.2)
Simplifying,
xSMF = xMMF −h
ySMF = yMMF −b(D.3)
Since the electromagnetic field used in the multimode fiber propagation model is presented in polar
coordinates, it is necessary to convert the Cartesian coordinates of the point P into polar coordinates.
In the Appendix A, the relationships between Cartesian and cylindrical coordinates are presented. Sub-
stituting Equation A.1 and Equation A.2 in Equation D.3, allows to determined a general expression to
convert a point in the SMF referential to the MMF referential, in cylindrical polar coordinates is obtained:
rSMF =√
r2MMF −2rMMF(bsinφMMF +hcosφMMF +b2 +h2) (D.4)
84

φSMF = arctanrMMF sinφMMF +brMMF cosφMMF +h
(D.5)
85

86

Appendix E
Optimizations
In this chapter, the optimizations of the OFDM-UWB system over the multimode fiber are presented.
In Section E.1, the optimization of the modulation index and the Vbias of the Mach-Zehnder modulator
are presented. The optimization of the order of the interpolation polynomial used to determinate the
equalizer transfer function is presented in Section E.2.
E.1 Mach-Zehnder Modulator
In order to improve the system performance, it is necessary to determine which is the modulation index
and the Vbias point of the Mach-Zehnder modulator that leads to the best combination of the BER/SNR
values. This combination will lead to the increase of the performance of the overall system. Table E.1
shows the results of the optimization of the Mach-Zehnder modulator. These optimizations are performed
for a fiber length of 500 m and for a signal transmission on the third UWB sub-band, which is the sub-
band that presents the highest value of BER.
87

Table E.1: Optimization of the modulation index and of the Vbias based on the BER and on the SNR of
the overall system.
Vbias
Modulation Index [%]
2 10 30
BER SNR [dB] BER SNR [dB] BER SNR [dB]Vπ
6 8.5×10⁻³ 9.3 2.6×10⁻⁷ 23.3 < 10−20 32.4Vπ
3 2×10⁻⁵ 20.1 < 10−20 33.9 < 10−20 41.9Vπ
2 1.2×10⁻⁸ 24.9 < 10−20 38.4 1.1×10⁻² 44.82Vπ
3 4.2×10⁻¹⁰ 26.1 < 10−20 39.3 0.17 44.15Vπ
6 2.6×10⁻⁷ 23.3 < 10−20 36.0 0.31 39.3
Table E.1 shows that the values around Vbias =Vπ
2 are the ones that present a better BER/SNR relation.
This is expected since this is the most linear point of the Mach-Zehnder modulator characteristic. It
is possible to see that the better results are achieved for the combinations: i) Vbias =Vπ
2 , modulation
index= 10%, ii) Vbias =2Vπ
3 , modulation index= 10% and iii) Vbias =Vπ
3 , modulation index= 30%. As
it was mentioned in Chapter 2, the increase of the modulation index and to place the Vbias point in
a non linear region of the modulator characteristic, increases the fiber distortion, as it can be seen in
Figure E.1 and in Figure E.2. So, the optimal values for the Mach-Zehnder modulator used in this work
are Vbias =Vπ
2 , modulation index= 10%.
(a) Modulation Index = 10% , Vbias = 2Vπ
3 (b) Modulation Index = 30% , Vbias =Vπ
3
Figure E.1: Received constellations for Vbias = 2Vπ
3 and a modulation index of 10% and for Vbias =Vπ
3
and a modulation index of 30%, respectively.
88

Figure E.2: Received constellation for a Vbias =Vπ
2 and a modulation index of 10%.
E.2 Order of the polynomial interpolator used to estimate the equalizer
transfer function
The overall system performance is very dependent on the equalization process of the transmitted signal.
By changing the order of the polynomial used to perform the interpolation of the estimated channel
between the pilots, it is possible to alter substantially the quality of the received signal. Table E.2 shows
the BER and the SNR values obtained by changing the polynomial order of the equalizer for a fiber
length of 500 m and signal transmission of the third UWB sub-band. The results present in E.2 were
obtained for a launch power of 1 mW in the MMF.
Table E.2: Optimization of the polynomial interpolation order as a function of the SNR and of the BER
of the overall system.
Equalizer order BER SNR [dB]
1 5.6×10⁻⁷ 37.6
3 < 10−20 37.6
6 < 10−20 37.6
The first obvious conclusion is that the change of the equalizer order does not change the SNR. This
result is expected since the polynomial order does not affect the signal power. It is very clear from
Table E.2 that a linear regression (which corresponds to use a polynomial order of 1) is not sufficient to
have an acceptable BER. The other two values of the polynomial order used presented a good value of
BER that are both inferior to < 10−4. In order to decide which is the most appropriate value for the order
of the polynomial interpolator of the equalizer, it is necessary to analyse the received constellations.
Figure E.3 show the received constellation for a polynomial interpolation of order 1 and 6.
89

(a) Equalizer of order 1. (b) Equalizer of order 6.
Figure E.3: Received constellations for a fiber length of 500 m and signal transmission on the third UWB
sub-band and for a interpolation polynomial of order 1 and 6.
Figure E.4: Received constellations for a fiber length of 500 m, and signal transmission on the third
UWB sub-band and for interpolation polynomial of order 3.
Comparing Figure E.4 with Figure E.3, it is possible to see that the received constellation for a
equalizer of order 3 is the one that presents better a better result. So, the optimal order of the equalizer
used in this work is 3.
90

Bibliography
[1] Webb and Associates. The 1930s (The Great Depression: Rebuilding). on
http://www.webbconsult.com/1930.html, October 2010.
[2] Webb and Associates. The 1920s (The Roaring Twenties). on
http://www.webbconsult.com/1920.html, October 2010.
[3] Webb and Associates. The 1960s (Into a New Age of Technology). on
http://www.webbconsult.com/1960.html, October 2010.
[4] Webb and Associates. The 1970s (Growth and Regulation). on
http://www.webbconsult.com/1970.html, October 2010.
[5] Webb and Associates. The 1980s (Divestiture and a "Whole New Ballgame"). on
http://www.webbconsult.com/1980.html, October 2010.
[6] AT&T. Inventing the Telephone. on www.corp.att.com/history/inventing.html, October 2010.
[7] V. Alwayn. Fiber-Optic Technologies - A Brief History of Fiber-Optic Communications. on
www.ciscopress.com/articles/article.asp?p=170740,ciscopress, October 2010.
[8] S. Kuram. Advantages of the optical fibers - Optical fibers communications. on
http://knol.google.com/k/sudharani-kuram/advantages-of-optical-fibres/3tq1bhnm4l2up/6, Octo-
ber 2010.
[9] B. Leiner, V. Cerf, D. Clark, R. Kahn, L. Kleinrock, D. Lynch, J. Postel, L. Roberts and S. Wolff.
A Brief History of the Internet. on www.isoc.org/internet/history/brief.shtml, October 2010.
[10] K. Coffman and A. Odlyzko. Growth of the Internet - in Optical Fibre Telecommunications. Aca-
demic Press, IVB, 2002.
[11] PT Comunicações. A melhor fibra aos melhores preços. on
http://www.meo.pt/aderir/fibra/pacotes/Pages/tvnetvoz.aspx, October 2010.
91

[12] Zon Multimédia. Pacotes de canais - Grelha digital cabo. on
http://www.zon.pt/Televisao/cabo/canaisporpacote.aspx, October 2010.
[13] Digital Tv Europe.net. Play it again. on http://www.digitaltveurope.net/feature/29-sep-10/play-it-
again, October 2010.
[14] PT Comunicações. 3D no meo. on http://www.meo.pt/conhecer/tv/3d/Pages/default.aspx, October
2010.
[15] Zon Multimédia. Decida o que quer ver. on http://www.zon.pt/Videoclube/IntroducaoVideoclube.aspx,
October 2010.
[16] ARC Electronics. Brief over view of fiber optic cables - advantages over copper. on
http://www.arcelect.com/fibercable.htm, October 2010.
[17] C. Tsekrekos. Mode group diversity multiplexing in multimode fiber transmission systems. on
http://alexandria.tue.nl/extra2/200712406.pdf, October 2010.
[18] R. Paschotta. Encyclopedia of Laser Physics and Technology. Wiley-VCH, October 2008.
[19] C. Duan et al. Transmitting Multiple HD Video Streams over UWB links. Consumer Communica-
tions and Networking Conference, 2006.
[20] FCC 02-48. Revision of Part 15 of the Commission Rules Regarding Ultra-Wideband Transmission
Systems. FCC, April 2008.
[21] M. Benedetto and G. Giancola. Understanding Ultra Wideband Radio Fundamentals. Prentice
Hall, July 2004.
[22] R. Llorente, T. Alves, M. Morant, M. Beltran, J. Perez, A. Cartaxo and J. Marti. Optical Distribution
of OFDM and Impulse Radio UWB in FTTH Networks. OFC/NFOEC, 2008.
[23] A. Cartaxo. OFDM-based optical communications systems. February 2010.
[24] J. Armstrong. OFDM for Optical Communications. Journal of Lightwave Technology, vol:27,
pages 189–204, 2009.
[25] E. Schubert. Light Emitting-Diodes. Cambridge University press, June 2006.
[26] Arden Photonics. Modal launch conditions - measurement and control . on
www.ardenphotonics.com/datasheets/wpmodcon.pdf, June 2010.
[27] J. Balakrishnan A. Batra and A. Dabak. Multiband OFDM: Why it Wins for UWB. EETIMES
Design, June 2003.
92

[28] T. Alves and A. Cartaxo. Performance Degradation Due to OFDM-UWB Radio Signal Transmis-
sion Along Dispersive Single-Mode Fiber. IEEE Photonics Technology Letters, vol.21, No.3, pages
158–160, February 2009.
[29] G. Agrawal. Lightwave technology components and devices. John Wiley & Sons, pages 37–52,
2005.
[30] A. Cartaxo. Transmissão por fibra optica. IST - folhas de apoio a disciplina de sistemas e redes de
telecomunicações, March 2005.
[31] T. Alves and A. Cartaxo. Semi-analytical approach for performance evaluation of direct-detection
OFDM optical communication systems . Optics Express, Vol. 17, pages 18714–18729, 2009.
[32] A. Snyder and J. Love. Optical Waveguide Theory. Chapman and Hall, Ltd, pages 205–335, 1983.
[33] D.Marcuse. Theory of Dielectric Optical Waveguides. Academic Press, Inc, pages 60–82, 1991.
[34] S. Bottacchi. Multi-gigabit Transmission Over Multimode Optical Fiber: Theory and Design Meth-
ods for 10 GbE Systems. John Wiley & Sons, Inc., pages 307–374, 2006.
[35] Corning - White paper. TIA-568 Rev. C Impact on Optical Connectivity. on
http://catalog2.corning.com/CorningCableSystems/media/NAFTA/White_ Papers/LAN-1135-
EN.pdf, page 3, April 2009.
[36] A.Castro,V. Teichman,D. Mello and A.Cartaxo. Impact of the Launch Conditions on the Transfer
Function of Multimode Fibers. Porto, June 2010.
93
Related Documents