Towards Textual Reporting in Learning Analytics Dashboards A. Ramos-Soto, M. Lama, B. V´ azquez-Barreiros, A. Bugar´ ın, M. Mucientes, S. Barro Research Center on Information Technologies (CiTIUS) University of Santiago de Compostela, Spain {alejandro.ramos, manuel.lama, borja.vazquez, alberto.bugarin.diz, manuel.mucientes, senen.barro}@usc.es Abstract—In this paper we present the SoftLearn Activity Reporter (SLAR) service which automatically generates textual short-term reports about learners’ behavior in virtual learning environments. Through this approach, we show how textual reporting is a coherent way of providing information that can complement (and even enhance) visual statistics and help teachers to understand in a comprehensible manner the behavior of their students during the course. This solution extracts relevant information from the students’ activity and encodes it into intermediate descriptions using linguistic variables and temporal references, which are subsequently translated into texts in natural language. The examples of application on real data from an undergraduate course supported by the SoftLearn platform show that automatic textual reporting is a valuable complementary tool for explaining teachers and learners the information comprised in a Learning Analytics Dashboard. I. I NTRODUCTION One of the most active areas in learning analytics [1] is the development of user interfaces that enable both teachers and learners to understand and optimize what is happening in a course. In this context, learning analytics dashboards (LADs) [2] have emerged as applications that support a variety of forms to visualize and interact with the data collected in a learning environment. Typically, LADs are oriented to a specific learning context and therefore they include graphical tools specifically designed for achieving a purpose such as detecting isolated learners [3], understanding collaboration process among learners in social environments [4] or visualiz- ing the effort indicators of learners to evaluate their progress during a course [5]. A good review and evaluation of LADs is found in [6]. However, most of the LADs are entirely based on graphical visualizations that are not easy to interpret by many teachers and learners, especially when the amount of data to visualize along the time dimension is very high (e.g., interactions among learners in collaborative and/or social environments). To overcome this issue and facilitate LADs understanding, we propose the development of tools and techniques which automatically generate linguistic descriptions of the data shown in the graphical visualization tools. We do not consider these linguistic descriptions, also known as textual reports, as an alternative to the graphical visualization tools, but as a com- plementary tool that explains in plain natural language what teachers and learners are visualizing. This is the focus of the paper. The research field of linguistic descriptions of data (LDD) [7] intends to automatically produce natural language texts that convey the most relevant information contained (and usually hidden) in the data. It uses a number of modeling techniques taken from the soft computing domain (fuzzy sets and re- lations, linguistic variables, etc.) that are able to adequately manage the inherent imprecision of the natural language in the generated texts. Either alone or in combination with other natural language generation data-to-text (D2T) techniques [8], [9], LDD models and techniques have been used in a number of fields of application for textual reporting in domains such as meteorology forecasts, domestic power supply or economy, among many others (for more details see the review in [10]). To the best of our knowledge, none of the LDD or D2T techniques we are aware of have been used until now in the field of learning technologies as a tool to provide learners and/or teachers with linguistic reports automatically generated from the data produced in the learning process, with the only exceptions of [11], which generates feedback reports for students based on several performance factors, and [12], which focuses on describing the learner’s rating in a specific learning activity. In this paper, we present the SoftLearn Activity Reporter (SLAR) service, which automatically generates textual reports of the learners’ activity that takes place in a virtual learning environment. This tool has been integrated as a service in SoftLearn [13], [14], a process mining-based platform that facilitates teachers the learners’ assessment. SLAR extracts the relevant information from the data collected by SoftLearn, creating intermediate descriptions through linguistic variables and temporal references, which are later translated into natural language texts. We have tested this LDD tool using real data provided by 72 learners enrolled in the Educational Technology undergraduate course of the Degree in Pedagogy at the Faculty of Education of the University of Santiago de Compostela. The paper is structured as follows: Section II describes the LDD approach which automatically generates textual reports; Section II-B presents a number of examples that help to understand how the textual reports are generated; and Section III summarizes the main contributions of the paper. II. AUTOMATIC TEXTUAL REPORTING IN SOFTLEARN SoftLearn [13] [14] is an assessment platform that operates as one of the learning analytics services of a big data-based 2015 IEEE 15th International Conference on Advanced Learning Technologies 978-1-4673-7334-0/15 $31.00 © 2015 IEEE DOI 10.1109/ICALT.2015.96 260

Welcome message from author
This document is posted to help you gain knowledge. Please leave a comment to let me know what you think about it! Share it to your friends and learn new things together.
Transcript

Towards Textual Reporting in Learning AnalyticsDashboards
A. Ramos-Soto, M. Lama, B. Vazquez-Barreiros, A. Bugarın, M. Mucientes, S. BarroResearch Center on Information Technologies (CiTIUS)
University of Santiago de Compostela, Spain{alejandro.ramos, manuel.lama, borja.vazquez, alberto.bugarin.diz, manuel.mucientes, senen.barro}@usc.es
Abstract—In this paper we present the SoftLearn ActivityReporter (SLAR) service which automatically generates textualshort-term reports about learners’ behavior in virtual learningenvironments. Through this approach, we show how textualreporting is a coherent way of providing information that cancomplement (and even enhance) visual statistics and help teachersto understand in a comprehensible manner the behavior oftheir students during the course. This solution extracts relevantinformation from the students’ activity and encodes it intointermediate descriptions using linguistic variables and temporalreferences, which are subsequently translated into texts in naturallanguage. The examples of application on real data from anundergraduate course supported by the SoftLearn platform showthat automatic textual reporting is a valuable complementary toolfor explaining teachers and learners the information comprisedin a Learning Analytics Dashboard.
I. INTRODUCTION
One of the most active areas in learning analytics [1] isthe development of user interfaces that enable both teachersand learners to understand and optimize what is happeningin a course. In this context, learning analytics dashboards(LADs) [2] have emerged as applications that support a varietyof forms to visualize and interact with the data collected ina learning environment. Typically, LADs are oriented to aspecific learning context and therefore they include graphicaltools specifically designed for achieving a purpose such asdetecting isolated learners [3], understanding collaborationprocess among learners in social environments [4] or visualiz-ing the effort indicators of learners to evaluate their progressduring a course [5]. A good review and evaluation of LADsis found in [6].
However, most of the LADs are entirely based on graphicalvisualizations that are not easy to interpret by many teachersand learners, especially when the amount of data to visualizealong the time dimension is very high (e.g., interactionsamong learners in collaborative and/or social environments).To overcome this issue and facilitate LADs understanding,we propose the development of tools and techniques whichautomatically generate linguistic descriptions of the data shownin the graphical visualization tools. We do not consider theselinguistic descriptions, also known as textual reports, as analternative to the graphical visualization tools, but as a com-plementary tool that explains in plain natural language whatteachers and learners are visualizing. This is the focus of thepaper.
The research field of linguistic descriptions of data (LDD)[7] intends to automatically produce natural language texts thatconvey the most relevant information contained (and usuallyhidden) in the data. It uses a number of modeling techniquestaken from the soft computing domain (fuzzy sets and re-lations, linguistic variables, etc.) that are able to adequatelymanage the inherent imprecision of the natural language inthe generated texts. Either alone or in combination with othernatural language generation data-to-text (D2T) techniques [8],[9], LDD models and techniques have been used in a numberof fields of application for textual reporting in domains suchas meteorology forecasts, domestic power supply or economy,among many others (for more details see the review in [10]).To the best of our knowledge, none of the LDD or D2Ttechniques we are aware of have been used until now in thefield of learning technologies as a tool to provide learnersand/or teachers with linguistic reports automatically generatedfrom the data produced in the learning process, with theonly exceptions of [11], which generates feedback reports forstudents based on several performance factors, and [12], whichfocuses on describing the learner’s rating in a specific learningactivity.
In this paper, we present the SoftLearn Activity Reporter(SLAR) service, which automatically generates textual reportsof the learners’ activity that takes place in a virtual learningenvironment. This tool has been integrated as a service inSoftLearn [13], [14], a process mining-based platform thatfacilitates teachers the learners’ assessment. SLAR extractsthe relevant information from the data collected by SoftLearn,creating intermediate descriptions through linguistic variablesand temporal references, which are later translated into naturallanguage texts. We have tested this LDD tool using realdata provided by 72 learners enrolled in the EducationalTechnology undergraduate course of the Degree in Pedagogyat the Faculty of Education of the University of Santiago deCompostela.
The paper is structured as follows: Section II describes theLDD approach which automatically generates textual reports;Section II-B presents a number of examples that help tounderstand how the textual reports are generated; and SectionIII summarizes the main contributions of the paper.
II. AUTOMATIC TEXTUAL REPORTING IN SOFTLEARN
SoftLearn [13] [14] is an assessment platform that operatesas one of the learning analytics services of a big data-based
2015 IEEE 15th International Conference on Advanced Learning Technologies
978-1-4673-7334-0/15 $31.00 © 2015 IEEE
DOI 10.1109/ICALT.2015.96
260

Fig. 1. General overview of SoftLearn dashboard for teachers including automatically generated natural language activity reports.
architecture specifically designed to capture, store and makeavailable in real time the large amounts of data generatedby the students of a course. In this architecture, a learningactivity sensor captures the students’ events that produce thelearning relevant data. Data is stored in a graph-based databasethrough Experience API interfaces and is sent in real timeto the learning analytics services of the architecture. Theseservices, like SoftLearn, are in charge of processing the datato extract valuable information about the learning processes.In this architecture, SoftLearn allows teachers to assess theperformance of the students, providing information about theirlearning process and behavior throughout the course. Thegraphical user interface of the SoftLearn e-learning platform[13] allows teachers to (i) understand the learners’ behaviorthrough the visualization of the learning paths followed by thelearners and (ii) also facilitates the evaluation of the learningactivities carried out by learners during the course. Regardingthe latter, the dashboard in SoftLearn provides in a graphicalway different statistics about the students and their activitylevels in the different portfolio elements of the course, such asblogs, comments, bookmarks, etc (Fig. 1).
In this context, the functionality of the dashboard hasbeen now extended and enhanced with the inclusion of theSLAR service which provides automatically generated naturallanguage reports built from every student activity data ineach portfolio element. These reports allow teachers to betterunderstand the students activity, which can also be visualizedthrough time charts, facilitating the students assessment bymeans of a rubric based on the students learning process, its so-cial interaction, motivation, collaboration with other students,and content structure. SLAR is based on linguistic descriptiontechniques adapted from the soft-computing field and naturallanguage generation data-to-text (D2T) systems. In particular,it follows a similar approach as GALiWeather [7], a naturallanguage weather forecast generation service.
A. Service architectureThe approach we have developed automatically converts
student activity data into textual reports through a two-staged
pipeline process (Fig. 2). In the first stage the service extractsthe relevant information from the student’s activity data asa set of language-independent linguistic terms (also knownas intermediate linguistic descriptions [7]). This informationserves as input to the second stage, in which the final textualreports are generated through the use of natural languagetemplates.
1) Service input data: As mentioned above, SoftLearn dis-tinguishes several portfolio elements. These include blogs,files, twits, comments, bookmarks and pages. For each of them,the activity level of every student in a given course is trackedon a daily basis. As a consequence, a teacher can visualizethe involvement of a student during the course period throughSoftLearn dashboard. For example, Fig. 1 shows the activityof a certain student in the portfolio element “Comments” forthe whole course period.
In this context, the report generation system provides textualinformation for each individual portfolio element from itsassociated activity data.
2) First stage: Linguistic description generation method:The first stage of our solution obtains an intermediate linguisticdescription for a student’s activity in every portfolio elementwithin a temporal window: semester, course, etc. Each descrip-tion is a set of linguistic labels and relevant data extracted fromthe student’s activity data series (Fig. 1) about several relevantfeatures:• Participation level. Provides information about the ab-
solute participation of the student.
LINGUISTIC DESCRIPTIONOPERATORS
TEXT GENERATIONMODULE
RELEVANT INFORMATION
STUDENT ACTIVITY REPORT
STUDENT ACTIVITY
DATA
LINGUISTIC VARIABLES
REPORT TEMPLATES
Fig. 2. General schema of the SLAR (SoftLearn Activity Reporter) servicefor the automatic generation of natural language reports.
261

SOFTLEARN REPORTING SERVICE
LINGUISTIC DESCRIPTION MODULE
PARTICIPATIONOPERATOR
FREQUENCY OPERATOR
REGULARITYOPERATOR
IMPACTOPERATOR
TIME SCOPEOPERATOR
INACTIVITYOPERATOR
NATURAL LANGUAGE MODULE
PARTICIPATIONREPORT
GENERATOR
PARTICIPATION DETAILS REPORT
GENERATOR
IMPACTREPORT
GENERATOR
STUDENT ELEMENT PORTFOLIOACTIVITY DATA
BLOGS
TWITS
BOOKMARKS
FILES
COMMENTS
PAGES
STUDENT ELEMENT PORTFOLIOACTIVITY TEXTUAL REPORTS
BLOGS
TWITS
BOOKMARKS
FILES
COMMENTS
PAGES
FEATURE DEFINITIONS (LINGUISTIC VARIABLES)
NATURAL LANGUAGE TEMPLATES
Fig. 3. Module correspondence between the linguistic description and report generation stages.
• Regularity. Provides information about how regular alearner is in his/her activity, i.e., how much the student’sinactivity period lengths deviate from the average inac-tivity length.
• Frequency. Provides information about how frequent astudent is in his/her activity, i.e., the less time betweentracked activity the more frequent the student is.
• Activity time scope. Provides information about thelearner’s activity temporal window within the courseperiod, i.e., when the student starts participating andwhen this activity ends.
• Inactivity periods. Provides information about the periodlength of most inactivity.
• Impact. Provides information about the impact of thestudent’s activity from data about the number of ”likes”and comments received from other learners as a resultof his/her activity.
For each of these features we have defined a set of termsor labels that categorize the different possibilities that may beof interest to consider and implemented associated operatorswhich select the fittest label for each feature. Table I displaysthe defined labels for each feature. These can be independentlydefined and configured for each portfolio element (for instance,the definition of HIGH participation in “Comments” might bedifferent from its definition in “Blogs”, since to participate inthe latter usually requires more effort from the learner).
TABLE I. LABELS DEFINED FOR EACH OF THE SOFTLEARNINDICATORS
Feature LabelsParticipation level VERY LOW, LOW, NORMAL, HIGH, VERY HIGHRegularity STRICTLY REGULAR, REGULAR, HARDLY REGU-
LAR, IRREGULAR, VERY IRREGULARFrequency VERY LOW, LOW, NORMAL, HIGH, VERY HIGHActivity time scope BEGINNING, HALF, END (of the course period)Inactivity Numeric valueImpact VERY LOW, LOW, NORMAL, HIGH, VERY HIGH
Regarding the feature operators, these receive as input theactivity data and their corresponding label set (except the“Inactivity” operator, which does not use labels) and performseveral calculations to determine the label better describingthe original input data. As an example output result of theseoperators, Table II shows a linguistic description includingrelevant information about the activity data shown in Fig. 1.
This extracted information in form of intermediate linguisticdescriptions serves as input to the second module, whose taskis to translate the language-independent descriptions into easilycomprehensible natural language texts.
3) Second stage: Natural language generation: The nat-ural language generation stage of this application consistsof a domain-specific module which has also been dividedinto different logical components. From a global perspective,each of these components receives the intermediate linguisticdescription (Table II) generated by their associated operatorsand generates the textual reports.
More specifically, we divided the task of producing thefinal reports into three components. The first one deals withthe existence of student activity and the activity level (thisinformation is provided by the operator for the “Participationlevel” feature). The second one provides additional informationabout this activity, through the aggregation of the informationprovided by the “Regularity”, “Frequency”, “Activity timescope” and “Inactivity” feature operators. Finally, the thirdcomponent produces reports about the learner’s activity impacton other students.
The reports produced by these three components are fused
TABLE II. EXAMPLE OF A LINGUISTIC DESCRIPTION FOR THEACTIVITY DATA IN FIG. 1.
Participation level VERY HIGHRegularity REGULARFrequency HIGHActivity time scope BEGINNING - ENDInactivity 16Impact LOW
262
and finally returned as single natural language text which isthen displayed in SoftLearn’s dashboard. Figure 3 providesa detailed graphic description of how each feature in thelinguistic description stage relates to each component in theNLG stage, thus extending the schema in Fig. 2.
We have defined language-specific templates in structuredtext files containing generic natural language sentences foreach report generator component. These are loaded by theservice and provided to their corresponding NLG component.Using the information contained in the intermediate linguisticdescription, each NLG component identifies the scenario casesdefined in the templates and maps the linguistic terms from thedescription into natural language expressions.
This technology allows us not only to provide reports indifferent languages just by changing the output templates,but also to support alternative templates for the same outputlanguage in order to provide different ways of expressing thesame information. This helps when dealing with repetitivenessissues when reading several reports at a time.
B. Reporting examples
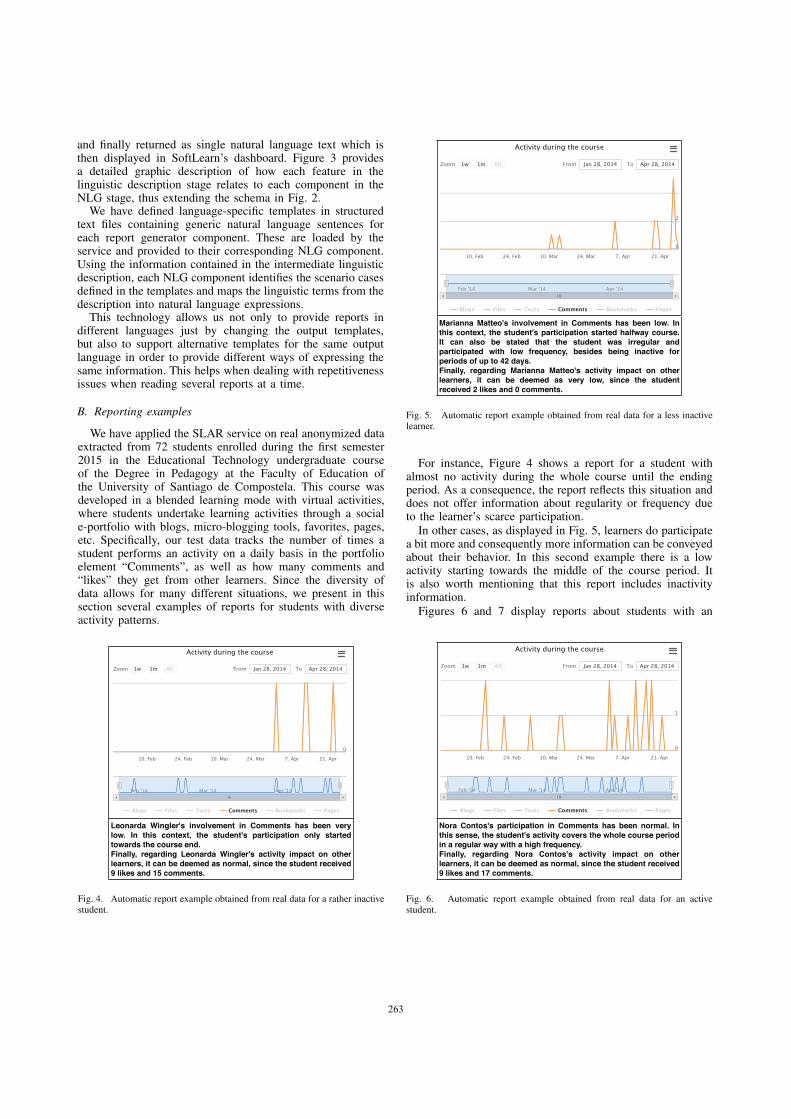
We have applied the SLAR service on real anonymized dataextracted from 72 students enrolled during the first semester2015 in the Educational Technology undergraduate courseof the Degree in Pedagogy at the Faculty of Education ofthe University of Santiago de Compostela. This course wasdeveloped in a blended learning mode with virtual activities,where students undertake learning activities through a sociale-portfolio with blogs, micro-blogging tools, favorites, pages,etc. Specifically, our test data tracks the number of times astudent performs an activity on a daily basis in the portfolioelement “Comments”, as well as how many comments and“likes” they get from other learners. Since the diversity ofdata allows for many different situations, we present in thissection several examples of reports for students with diverseactivity patterns.
Zoom From Jan 28, 2014 To Apr 28, 2014
Activity during the course
Blogs Files Twits Comments Bookmarks Pages
10. Feb 24. Feb 10. Mar 24. Mar 7. Apr 21. Apr
Feb '14 Mar '14 Apr '14
0
1w 1m All
Leonarda Wingler's involvement in Comments has been very low. In this context, the student's participation only started towards the course end.Finally, regarding Leonarda Wingler's activity impact on other learners, it can be deemed as normal, since the student received 9 likes and 15 comments.
Fig. 4. Automatic report example obtained from real data for a rather inactivestudent.
Zoom From Jan 28, 2014 To Apr 28, 2014
Activity during the course
Blogs Files Twits Comments Bookmarks Pages
10. Feb 24. Feb 10. Mar 24. Mar 7. Apr 21. Apr
Feb '14 Mar '14 Apr '14
0
2
1w 1m All
Marianna Matteo's involvement in Comments has been low. In this context, the student's participation started halfway course. It can also be stated that the student was irregular and participated with low frequency, besides being inactive for periods of up to 42 days.Finally, regarding Marianna Matteo's activity impact on other learners, it can be deemed as very low, since the student received 2 likes and 0 comments.
Fig. 5. Automatic report example obtained from real data for a less inactivelearner.
For instance, Figure 4 shows a report for a student withalmost no activity during the whole course until the endingperiod. As a consequence, the report reflects this situation anddoes not offer information about regularity or frequency dueto the learner’s scarce participation.
In other cases, as displayed in Fig. 5, learners do participatea bit more and consequently more information can be conveyedabout their behavior. In this second example there is a lowactivity starting towards the middle of the course period. Itis also worth mentioning that this report includes inactivityinformation.
Figures 6 and 7 display reports about students with an
Zoom From Jan 28, 2014 To Apr 28, 2014
Activity during the course
Blogs Files Twits Comments Bookmarks Pages
10. Feb 24. Feb 10. Mar 24. Mar 7. Apr 21. Apr
Feb '14 Mar '14 Apr '14
0
1
1w 1m All
Nora Contos's participation in Comments has been normal. In this sense, the student's activity covers the whole course period in a regular way with a high frequency.Finally, regarding Nora Contos's activity impact on other learners, it can be deemed as normal, since the student received 9 likes and 17 comments.
Fig. 6. Automatic report example obtained from real data for an activestudent.
263

Zoom From Jan 28, 2014 To Apr 28, 2014
Activity during the course
Blogs Files Twits Comments Bookmarks Pages
10. Feb 24. Feb 10. Mar 24. Mar 7. Apr 21. Apr
Feb '14 Mar '14 Apr '14
0
2
1w 1m All
Rosanna Cookson's involvement in Comments has been very high. In this context, the student's participation lasts the whole course. It can also be stated that the student was very regular and participated with high frequency.Finally, regarding Rosanna Cookson's activity impact on other learners, it can be deemed as very high, since the student received 36 likes and 19 comments.
Fig. 7. Automatic report example obtained from real data for a very activelearner.
opposite behavior to the previous first two examples. In fact,a quick look at both activity plots shows that the learners inthe last two examples might follow similar activity patterns.However, the reports prove that, despite their apparent visualsimilarity, some significant differences exist between them.
Actually, according to the textual reports, the student’sparticipation in Fig. 6 is normal, whereas the learner’s activityin Fig. 7 is very high. Such apparent incoherence is explained ifwe carefully observe that the plot scales are different, showingthat the student with normal participation only participatestwice a day at most and the learner with very high involvementoften reaches three and up to four activities per participationday.
In this sense, and especially for Fig. 6 and Fig. 7, the textualreports are a coherent way of providing objective informationthat can complement visual dashboards and help teachers tounderstand in a comprehensible manner (natural language) thebehavior of their students.
III. CONCLUSIONS
We have presented the SoftLearn Activity Reporter (SLAR)service that automatically generates textual short-term reportsfor the students’ behavior in virtual learning environments.This solution combines linguistic descriptions of data tech-niques together with a template-based Natural Language Gen-eration (NLG) approach. SLAR has been integrated in the Soft-Learn platform to complement and enhance the informationprovided by its graphical visualization tools with the textualreports of the data shown in those tools, helping teachers tounderstand in a comprehensible manner the students’ behaviorduring the course. Furthermore, we have tested our solutionwith real data generated by 72 learners of the EducationalTechnology undergraduate course of the Degree in Pedagogyat the Faculty of Education of the University of Santiago deCompostela.
ACKNOWLEDGEMENTS
This work was supported by the Spanish Ministry ofEconomy and Competitiveness under grants TIN2011-22935,TIN2011-29827-C02-02 and TIN2014-56633-C3-1-R and theGalician Ministry of Education under grants EM2014/012 andCN2012/151. A. Ramos-Soto is supported by the SpanishMinistry for Economy and Competitiveness (FPI FellowshipProgram).
REFERENCES
[1] G. Siemens and D. Gasevic, “Guest editorial - learning and knowledgeanalytics,” Educational Technology & Society, vol. 15, no. 3, pp. 1–2,2012.
[2] K. Verbert, E. Duval, J. Klerkx, S. Govaerts, and J. L. Santos, “Learn-ing analytics dashboard applications,” American Behavioral Scientist,vol. 57, no. 10, pp. 1500–1509, 2013.
[3] S. Dawson, A. Bakharia, and E. Heathcote, “SNAPP: Realising theaffordances of realtime sna within networked learning environments,”in 7th International Conference on Networked Learning, L. Dirckinck-Holmfeld, V. Hodgson, C. Jones, M. de Laat, D. M. David, andT. Ryberg, Eds. Lancaster: Lancaster University, 2010, pp. 125–133.
[4] R. M. Maldonado, J. Kay, K. Yacef, and B. Schwendimann, “Aninteractive teacher’s dashboard for monitoring groups in a multi-tabletoplearning environment,” in 11th International Conference on IntelligentTutoring Systems (ITS 2012), ser. Lecture Notes in Computer Science,S. A. Cerri, J. C. William, G. Papadourakis, and K. Panourgia, Eds.,vol. 7315. Springer, 2012, pp. 482–492.
[5] S. Govaerts, K. Verbert, E. Duval, and A. Pardo, “The student activitymeter for awareness and self-reflection,” in Conference on HumanFactors in Computing Systems CHI 2012, Extended Abstracts Volume,J. A. Konstan, E. H. Chi, and K. Hook, Eds. ACM, 2012, pp. 869–884.
[6] K. Verbert, S. Govaerts, E. Duval, J. L. Santos, F. V. Assche, G. Parra,and J. Klerkx, “Learning dashboards: an overview and future researchopportunities,” Personal and Ubiquitous Computing, vol. 18, no. 6, pp.1499–1514, 2014.
[7] A. Ramos-Soto, A. Bugarın, S. Barro, and J. Taboada, “Linguisticdescriptions for automatic generation of textual short-term weatherforecasts on real prediction data,” IEEE Transactions on Fuzzy Systems,vol. 23, no. 1, pp. 44–57, 2015.
[8] E. Reiter and R. Dale, Building Natural Language Generation Systems.Cambridge University Press, 2000.
[9] E. Reiter, “An architecture for data-to-text systems,” in Proceedingsof the 11th European Workshop on Natural Language Generation,S. Busemann, Ed., pp. 97–104.
[10] A. Ramos-Soto, A. Bugarın, and S. Barro, “On the role of linguisticdescriptions of data in the building of natural language generationsystems,” Fuzzy Sets and Systems. Accepted., 2015.
[11] D. Gkatzia, H. Hastie, S. Janarthanam, and O. Lemon, Proceedings ofthe 14th European Workshop on Natural Language Generation. As-sociation for Computational Linguistics, 2013, ch. Generating StudentFeedback from Time-Series Data Using Reinforcement Learning, pp.115–124.
[12] M. Sanchez-Torrubia, C. Torres-Blanc, and G. Trivino, “An approachto automatic learning assessment based on the computational theoryof perceptions,” Expert Systems with Applications, vol. 39, no. 15, pp.12 177–12 191, 2012.
[13] B. Vazquez-Barreiros, M. Lama, M. Mucientes, and J. C. Vidal, “Soft-learn: A process mining platform for the discovery of learning paths,”in 14th International Conference on Advanced Learning Technologies(ICALT 2014). IEEE Press, 2014, pp. 373–375.
[14] “Softlearn demo,” Last visited April 10th 2015. [Online]. Available:http://tec.citius.usc.es/SoftLearn/
264
Related Documents