1 Title page Title: Validity of the EQ-5D-5L and EQ-5D-3L in patients with Crohn’s disease Authors: Fanni Rencz 1,2 , Peter L. Lakatos 3,4 , László Gulácsi 1 , Valentin Brodszky 1 , Zsuzsanna Kürti 3 , Szilvia Lovas 5 , János Banai 6 , László Herszényi 6 , Tamás Cserni 1,7 , Tamás Molnár 8 , Márta Péntek 1* , Károly Palatka 5* 1- Department of Health Economics, Corvinus University of Budapest, Fővám tér 8. H-1093, Budapest, Hungary 2- Hungarian Academy of Sciences, Premium Postdoctoral Research Program, Nádor u. 7., H-1051 Budapest, Hungary 3- 1st Department of Medicine, Semmelweis University, Korányi Sándor u. 2/a, H-1083 Budapest, Hungary 4- Division of Gastroenterology, McGill University, MUHC, Montreal General Hospital, 1650 Ave. Cedar, D16.173.1, Montreal, QC, H3G 1A4, Canada. 5- Division of Gastroenterology, Department of Internal Medicine, University of Debrecen, Nagyerdei krt. 98. H-4032 Debrecen, Hungary 6- Medical Centre, Hungarian Defence Forces, Podmaniczky u. 109-111. H-1062 Budapest, Hungary

Welcome message from author
This document is posted to help you gain knowledge. Please leave a comment to let me know what you think about it! Share it to your friends and learn new things together.
Transcript
1
Title page
Title: Validity of the EQ-5D-5L and EQ-5D-3L in patients with Crohn’s disease
Authors:
Fanni Rencz1,2, Peter L. Lakatos3,4, László Gulácsi1, Valentin Brodszky1, Zsuzsanna Kürti3,
Szilvia Lovas5, János Banai6, László Herszényi6, Tamás Cserni1,7, Tamás Molnár8,
Márta Péntek1*, Károly Palatka5*
1- Department of Health Economics, Corvinus University of Budapest, Fővám tér 8. H-1093,
Budapest, Hungary
2- Hungarian Academy of Sciences, Premium Postdoctoral Research Program, Nádor u. 7.,
H-1051 Budapest, Hungary
3- 1st Department of Medicine, Semmelweis University, Korányi Sándor u. 2/a, H-1083
Budapest, Hungary
4- Division of Gastroenterology, McGill University, MUHC, Montreal General Hospital,
1650 Ave. Cedar, D16.173.1, Montreal, QC, H3G 1A4, Canada.
5- Division of Gastroenterology, Department of Internal Medicine, University of Debrecen,
Nagyerdei krt. 98. H-4032 Debrecen, Hungary
6- Medical Centre, Hungarian Defence Forces, Podmaniczky u. 109-111. H-1062 Budapest,
Hungary
2
7- Faculty of Economics, Corvinus University of Budapest, Fővám tér 8. H-1093, Budapest,
Hungary
8- 1st Department of Internal Medicine, University of Szeged, Korányi fasor 8-10. H-6720
Szeged, Hungary
*M. Péntek and K. Palatka have equally contributed to this work.
ORCID IDs:
Fanni Rencz: 0000-0001-9674-620X
Peter L. Lakatos: 0000-0002-3948-6488
László Gulácsi: 0000-0002-9285-8746
Valentin Brodszky: 0000-0002-6095-2295
Zsuzsanna Kürti: 0000-0001-8671-6576
László Herszényi: 0000-0002-7454-4401
Tamás Molnár: 000-0003-2571-3595
Márta Péntek: 0000-0001-9636-6012
Károly Palatka: 0000-0001-7924-7951
Compliance with Ethical Standards
Funding statement: None.
Conflict of interest: The authors declare that they have no conflict of interest.
Ethical standard: All procedures performed in studies involving human participants were in
accordance with the ethical standards of the institutional and/or national research committee
and with the 1964 Helsinki declaration and its later amendments or comparable ethical
standards. The study protocol was approved by the National Scientific and Ethical Committee
of Hungary (Reference No. 49548-4/2016/EKU).
Informed consent: Informed consent was obtained from all participants included in the study.
Acknowledgment: This research was supported by the Higher Education Institutional
Excellence Program of the Ministry of Human Capacities in the framework of the 'Financial
and Public Services' research project (1783-3/2018/FEKUTSTRAT) at Corvinus University of
Budapest. FR is a postdoctoral research fellow at the Hungarian Academy of Sciences (MTA-
BCE PPD 462025). TC’s work was supported by the New National Excellence Programme of
the Ministry of Human Capacities of Hungary (ÚNKP-17-2-II-BCE-38). The authors are

3
grateful to Drs Lóránt Gönczi, Eszter Schäfer, Tamás Szamosi, Ferenc Zsigmond and Marianna
Rutka for their contribution to the data collection.
Corresponding author:
Fanni Rencz MD, MSc, PhD
Department of Health Economics
Corvinus University of Budapest
Address: Fővám tér 8., H-1093 Budapest, Hungary
E-mail: [email protected]
4
Abstract
Purpose: The EuroQol five-dimension questionnaire (EQ-5D) is the most commonly used
instrument to obtain utility values for cost-effectiveness analyses of treatments for Crohn’s
disease (CD). We aimed to compare the measurement properties of the two adult versions of
EQ-5D (EQ-5D-3L and EQ-5D-5L) in patients with CD.
Methods: Between 2016 and 2017, a multicentre cross-sectional survey was carried out.
Consecutive outpatients with CD completed the 3L, 5L and EQ visual analogue scale (VAS).
Disease severity was graded by the Crohn's Disease Activity Index (CDAI) and Perianal
Disease Activity Index (PDAI). The 3L and 5L were compared in terms of feasibility,
agreement, ceiling effect, redistribution properties, discriminatory power, convergent and
known-groups validity.
Results: 206 patients (54.9% male, mean age 35±11y) participated in the survey. For 3L, 25
unique health states were observed versus 59 for the 5L. The overall ceiling effect decreased
from 29.6% (3L) to 25.5% (5L). Absolute discriminatory power improved (mean Shannon
index 0.84 vs. 1.18). The 3L correlated stronger with EQ VAS and CDAI scores, whereas the
5L with PDAI. The 5L demonstrated a better known-groups validity on the basis of age,
perianal fistulas, extraintestinal manifestations and disability.
Conclusions: This is the first study to report the impact of CD on quality of life using the EQ-
5D-5L questionnaire. The 5L seems to perform better than 3L in terms of feasibility, ceiling
effect, discriminatory power and known-groups validity. Understanding the differences in
psychometrics between the 3L and 5L is essential as they have substantial implications for
financial decision-making about CD treatments.

5
Keywords:
Crohn’s disease; health-related quality of life; EQ-5D; psychometrics
6
Introduction
Crohn’s disease (CD) is a chronic inflammatory disorder of the gastrointestinal tract affecting
over 2 million people in Europe [1,2]. Patients with CD may present a broad spectrum of
symptoms including diarrhea, abdominal pain, rectal bleeding, fever, fatigue and mental
problems [3]. Over time complications such as strictures, fistulas, abscesses and extraintestinal
manifestations (e.g. arthritis, uveitis/iritis or skin inflammation) may develop in up to 50% of
CD patients [3,4]. The chronic relapsing nature of the disease has a detrimental impact on
patients’ health-related quality of life (HRQoL) [5]
In the past 15 years, the introduction of biological drugs has revolutionised the treatment of
CD. Biologics are costly alternatives compared to conventional treatments; thus, evidence on
their cost-effectiveness is required for reimbursement decisions [6-9]. In many countries
including the US, Canada, Australia, the UK, France, Belgium, the Netherlands, Spain,
Hungary and Poland, the EuroQol five-dimension questionnaire (EQ-5D) is among the
preferred tools to measure HRQoL for cost-effectiveness analyses by national health
technology assessment agencies [10-17]. So far, the EQ-5D has been used in a number of cost-
effectiveness analyses of biologics and biosimilars to value the health gains from treatment [18-
22]. According to a recent systematic literature review, the EQ-5D is the most frequently
applied generic preference-based measure of HRQoL in CD patients [23].
Two versions of the EQ-5D were developed for use on adult populations, the EQ-5D-3L
(hereafter 3L) in 1990 and the EQ-5D-5L (hereafter 5L) in 2011 [24]. Nearly 20 studies in CD,
involving observational studies and randomised controlled trials [23], applied the 3L version,
for which validity and reliability had been demonstrated in this patient population [25,26]. The
5L, an expanded version of the 3L, was introduced by the EuroQol Group with the intention of
reducing ceiling effects and improving discriminatory power [27,28]. A number of studies have
7
confirmed the improved psychometric properties of the 5L in both general population and
patient samples, including cancer, chronic hepatic diseases, diabetes, osteoarthritis, psoriasis
and stroke [29]. No studies have reported on HRQoL in patients with CD as assessed by the
5L, and only two published clinical trial protocols, planning to use the 5L questionnaire in CD
patients, are present [30,31]. Nevertheless, as of the time this manuscript was written, results
are not yet available.
Given the growing number of biological and biosimilar treatments available for CD [7,9,32] an
increased use of the 5L is expected in the years to come. Understanding the differences in
psychometrics between the 3L and 5L is essential as they might have substantial implications
for clinical and financial decision-making. Therefore, the objective of the current study is to
assess the validity of the 5L and to compare its measurement properties to that of the 3L in the
same set of patients with CD. We aim to test the following psychometric properties: feasibility,
agreement, ceiling effect, redistribution properties, discriminatory power, convergent and
known-groups validity.
Materials and methods
Study design and patient population
Between October 2016 and September 2017, a multicentre, cross-sectional survey was
conducted at three academic gastroenterology departments and an inflammatory bowel diseases
centre in three large cities (Budapest, Debrecen and Szeged) in Hungary. Consecutive
outpatients over 18 years of age diagnosed with CD were enrolled. The survey comprised of a
paper-based questionnaire, first part of which was completed by the patients, and the second by
their gastroenterologist. Patients were asked about socio-demographic characteristics, general
health status and HRQoL. Gastroenterologists provided data about medical history, clinical
8
characteristics, disease severity and treatments. Permission for conducting the study was
granted by the National Scientific and Ethical Committee of Hungary (Reference No. 49548-
4/2016/EKU). All patients signed an informed consent form before collection of any data.
Measures
All patients completed a set of questionnaires including the validated Hungarian versions of the
5L, 3L, EQ visual analogue scale (VAS), Patients' Global Assessment VAS (PGA VAS),
Patients' Global Assessment on fistula symptoms VAS, a pain VAS and a worst pain
experienced in the past 3 months VAS.
EQ-5D-3L and EQ-5D-5L questionnaires
The EQ-5D is a generic, self-reported measure of current health that consists of a five-item
descriptive system and a visual analogue scale (EQ VAS) [33,34]. The descriptive system has
two versions, namely the 3L and 5L, both involving five health dimensions (mobility, self-care,
usual activities, pain/discomfort and anxiety/depression). The EQ VAS records the patient’s
current self-rated health on a 20-cm-long vertical scale ranging from 0 (‘The worst imaginable
health state’) to 100 (‘The best imaginable health state’).
In each dimension of the 3L version, subjects may choose from three response levels (no
problems=1, some/moderate problems=2, extreme problems/unable to/confined to bed=3)
allowing to define a total of 35 (=243) unique health states. In the 5L the response levels are
expanded to five categories in each dimension (no problems=1, slight problems=2, moderate
problems=3, severe problems=4 and unable to/extreme problems=5) providing 55 (=3125)
distinct health states. It is worthy of note that the wording of levels is standardised in the 5L
9
[27]. The intermediate level is consistently ‘moderate’ in all dimensions of the 5L, and the worst
level of mobility has been changed from ‘confined to bed’ (3L) to ‘unable to walk about’ (5L).
In the Hungarian EQ-5D, another amendment was made when switching from the 3L to the 5L
in order to be harmonized with other language variants, the label of ‘anxiety/depression’ was
reworded, ‘szorongás/lehangoltság’(=anxiety/feeling blue) in the 3L was replaced by
‘szorongás/depresszió’ (=anxiety/depression) in the 5L [35].In accordance with earlier studies,
the 5L preceded the 3L in the questionnaire, in order to prevent the underuse of level 2 and 4
on the 5L [36]. To avoid duplication in data collection, the EQ VAS was completed only once
(right after the 5L descriptive system).
The EQ-5D responses may be converted into an EQ-5D index score (utility value) reflecting
social preferences for each specific health state [37]. In absence of national value sets in
Hungary, the 3L value set for the UK by Dolan [38] and the 5L value set for England by Devlin
et al.[39] were applied in this study to derive EQ-5D index scores. The major reason for this
choice was that the UK/English value set is recommended to use in countries with no national
tariffs [14]. In these value sets, the ‘11111’ descriptive health state equals to 1 (full health),
whilst the two worst health states, the ‘33333’ in the 3L and the ‘55555’ in the 5L correspond
to -0.594 and -0.285, respectively [38,39].
Crohn's Disease Activity Index (CDAI)
The CDAI is a widely used outcome measure to evaluate disease activity in patients with CD
[40]. It is primarily based on an eight-item list of clinical symptoms or laboratory findings in
the past seven days, including the number of liquid or soft stools per day, abdominal pain,
general well-being, presence of extraintestinal manifestations, treatment with antidiarrheal
drugs, presence of an abdominal mass, haematocrit and body weight. Total score is calculated
10
by physicians as a sum of products of the items multiplied by weighting factors. CDAI total
scores range from 0 to 600, where a higher score represents worse disease activity. Established
cut-offs are as follows: <150 non-active disease or remission, 150-219 mildly active, 220-449
moderately active and 450-600 severely active disease [41].
Perianal disease Activity Index (PDAI)
PDAI is a validated scoring system to evaluate severity of perianal fistulising CD [42]. The
PDAI includes five items (i.e. discharge, pain/restriction of activities, restriction of sexual
activity, type of perianal disease and degree of induration), each of them is rated on a five-point
scale ranging from no symptoms (=0) to severe symptoms (=4). Total PDAI score varies
between 0 and 20, where a higher score indicates a more severe disease. PDAI of ≤4 identifies
inactive disease requiring no therapy, whereas a PDAI of >4 suggests active disease [43].
Visual analogue scales
To assess disease severity and fistula-related disease severity the Patient's Global Assessment
(PGA) VAS, and Patients' Global Assessment on fistula symptoms VAS (0-100) were
administered, both providing a range of scores from 0-100, where 0 indicated ‘not severe at all’
and 100 represented ‘very severe’.
The current and worst CD-related pain intensities experienced by the patients in the past three
months were recorded on a horizontal VAS with the endpoints of ‘no pain at all’ (=0) and ‘pain
as bad as it could be’ (=100) [44].
Statistical analyses
11
Data analysis was performed according to the criteria proposed in previous studies attempting
to compare the measurement properties of the 3L and 5L in other populations [36,45-47].
Feasibility
We computed the proportion of patients not answering to a few (i.e. partially incomplete
questionnaire) or all dimensions (i.e. incomplete questionnaire) of the EQ-5D. Feasibility was
compared by calculating the percentage of missing values for all dimensions of the 3L and 5L.
Agreement
The agreements among the 3L and 5L EQ-5D index scores were examined using an intraclass
correlation coefficient (ICC) and a Bland-Altman plot. A two-way random model with absolute
agreement was applied to obtain an ICC value [48]. Agreement is considered poor for ICC
values between 0 and 0.39, fair between 0.40 and 0.59, good between 0.60 and 0.74 and
excellent between 0.75 and 1 [49]. The Bland-Altman plot shows the differences between 3L
and 5L index scores (y-axis) and the means of these scores (x-axis) [50].
Ceiling effect
The proportion of patients reporting ‘no problems’ was calculated for each dimension of the
descriptive system. We also computed the proportion of patients reporting ‘no problems’ in all
five dimensions (11111 vector). We assumed that the ceiling effect would be lower for 5L
compared with 3L suggesting a better discriminatory power of the 5L version. We estimated
the absolute and relative reduction when going from 3L to 5L. The relative reduction (%) was
computed as:
12
𝑐𝑒𝑖𝑙𝑖𝑛𝑔3𝐿 − 𝑐𝑒𝑖𝑙𝑖𝑛𝑔5𝐿𝑐𝑒𝑖𝑙𝑖𝑛𝑔3𝐿
× 100
Redistribution properties
Redistribution properties were defined as proportions of 3L-5L response pairs in each
dimension from the same patient [36]. We computed the percentage of consistent and
inconsistent 3L-5L response pairs as well as the average size of inconsistency for each
dimension. A response pair was considered inconsistent when a 3L response was two or more
levels away from the 5L response; for example, in any dimension, a patient marks level 1 in the
3L but level 3 in the 5L version. The mean size of inconsistency was calculated according to
the following weights: 0 = responses differ by a maximum of one level (i.e. consistent response
pair), 1 = responses differ by two levels, 2 = responses differ by three levels and 3 = responses
differ by four levels [36].
Discriminatory power
One may hypothesise that the 5L with its two extra levels has a better discriminatory potential
(informativity). However, the discriminatory power improves only if the new levels are
effectively used. To test this, we calculated Shannon and Shannon Evenness indices for each
dimension separately [51,52]. The Shannon index (H’) was defined as:
𝐻′ = −∑𝑝𝑖𝑙𝑜𝑔2𝑝𝑖
𝐿
𝑖=1
where L denotes the number of levels in a dimension of the descriptive system, and pi is the
proportion of observations in the ith level (i = 1, …, L). The optimal amount of information is
captured when the responses are evenly distributed across levels (i.e. rectangular distribution).
13
In this case, H’ reaches its maximum value at log2L which equates to 1.58 for the 3L and 2.32
for the 5L. The higher the H’, the more information is obtained and the better the discriminatory
power is.
The Shannon Evenness index (J’), combines the evenness (rectangularity) of a distribution and
the number of levels used. J’ was calculated by using the following formula:
𝐽′ =𝐻′
𝐻′𝑚𝑎𝑥 , where H’max =log2L.
A higher J’ of the 5L expresses a better discriminatory power, while a lower J’ indicates a loss
in potential of the 5-level dimensions compared to the 3L.
Convergent and known-groups validity
Convergent validity of the EQ-5D dimensions and index scores with EQ VAS, CDAI, PDAI,
PGA VAS, PGA fistula VAS, pain VAS and worst pain VAS was tested by Spearman’s rank
order correlations. The correlation coefficient (rs) was interpreted as follows: very weak
correlation rs<0.2, weak correlation 0.20≤rs<0.4, moderate correlation 0.4≤rs<0.6 and strong
correlation 0.6≤rs≤1 [53]. Known-groups validity was evaluated for age groups and all relevant
clinical characteristics. We hypothesised that patients with older age, more severe disease,
perianal fistulas, extraintestinal manifestations, disability or permanent stoma have lower EQ-
5D index scores. Wilcoxon signed-rank test was applied to test the difference between 3L and
5L index scores across these groups, whereas Mann-Whitney U or Kruskal Wallis H tests were
used to assess between-group differences in the 3L and 5L. All the statistics were two-sided,
and p<0.05 was considered statistically significant. Data were analysed by using IBM SPSS
22.0. Armonk, NY: IBM Corp (2013).
14
Results
Patient characteristics
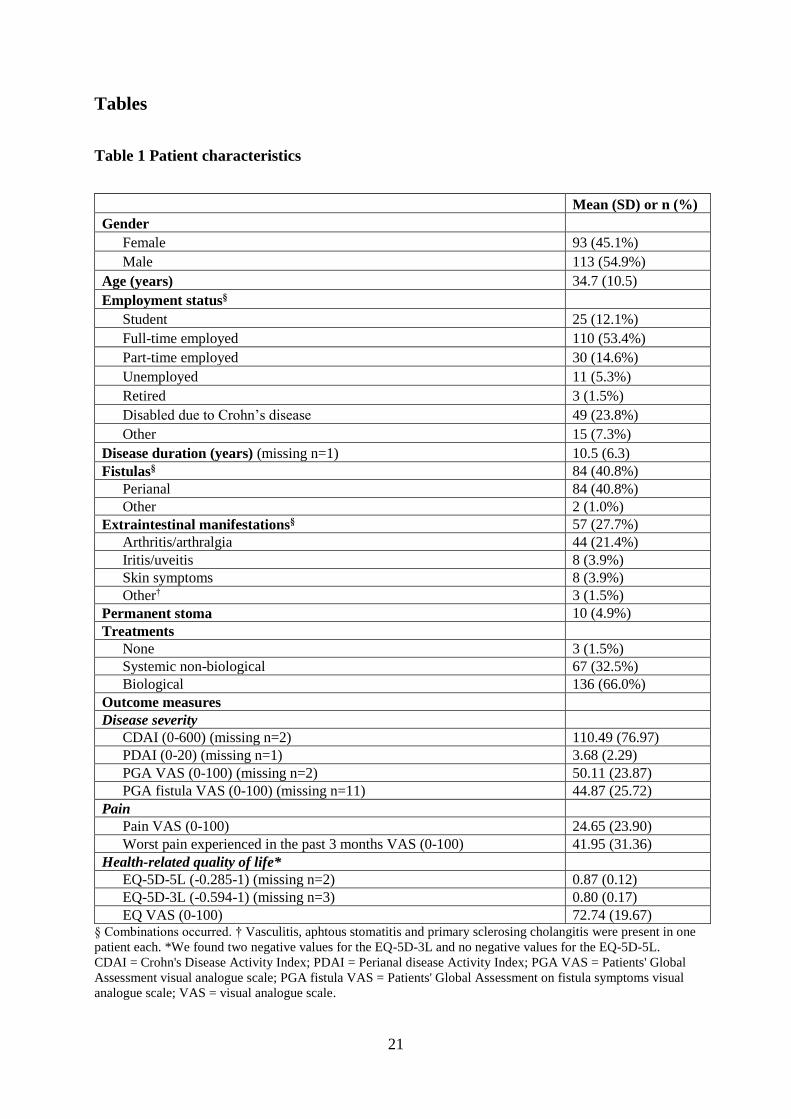
A total of 206 eligible patients with CD completed the survey (Table 1). The majority of the
sample were men (54.9%), and the mean age was 34.7 years (range 18-70). Mean disease
duration was 10.5 (SD 6.3) years. At the time of the survey, 41% had a fistulising disease, and
approximately one-third of these had active perianal fistula(s). Extraintestinal manifestations
were present in 27.7% of cases. Among the patients, 66% received biological therapy:
infliximab (46.6%), adalimumab (17.5%) and vedolizumab (1.9%). There were 10 (4.9%)
patients in the sample with a permanent stoma. According to CDAI scores, three-quarter of the
patients were in symptomatic remission. Mean disease severity, global assessment and pain
scale scores are described in Table 1.
Feasibility
No questionnaires were returned blank, but there were three and two partially incomplete 3L
and 5L descriptive systems, respectively. In all but one cases, the number of missing answers
per patient was only one. There were no missing values on the EQ VAS.
Agreement
Overall, a good agreement was observed between the 3L and 5L (ICC=0.707, 95% CI 0.363-
0.844; p<0.0001). Mean 3L index scores were significantly lower compared to the 5L
15
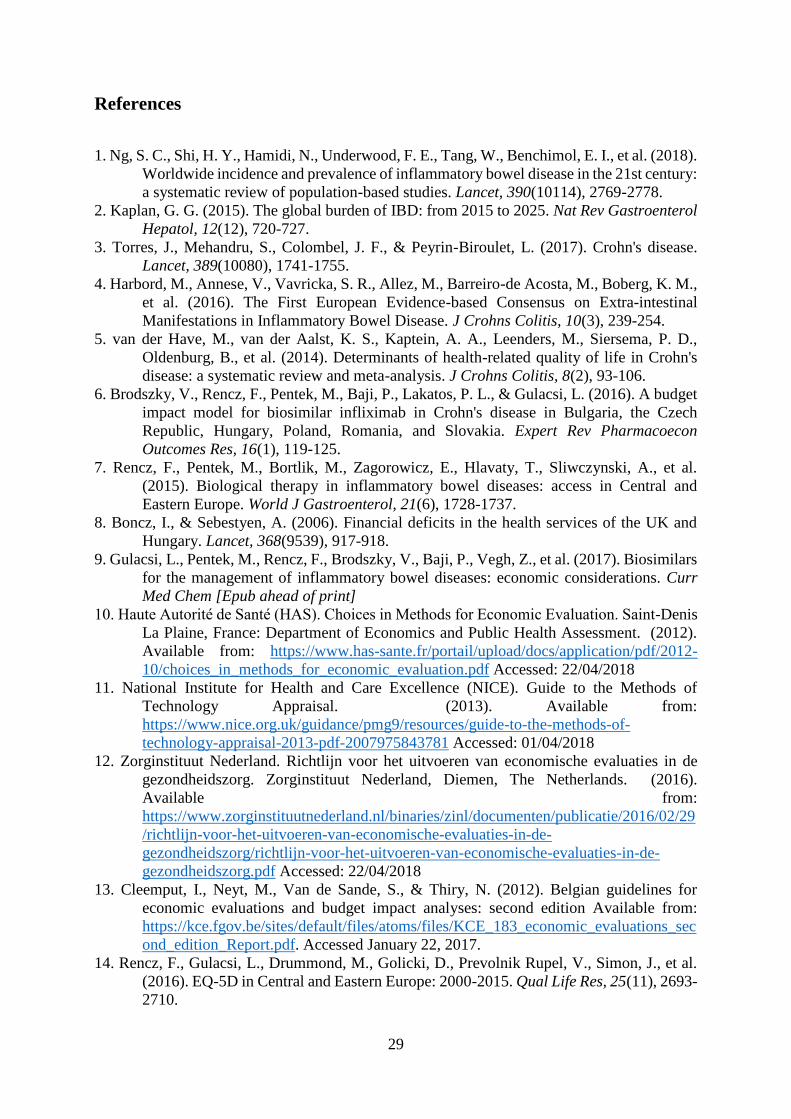
(0.80±0.20 and 0.87±0.12; p<0.0001). The Bland-Altman plot confirmed the good level of
agreement between the two measures (Fig.2). Differences between index scores tended to
increase at lower mean values.
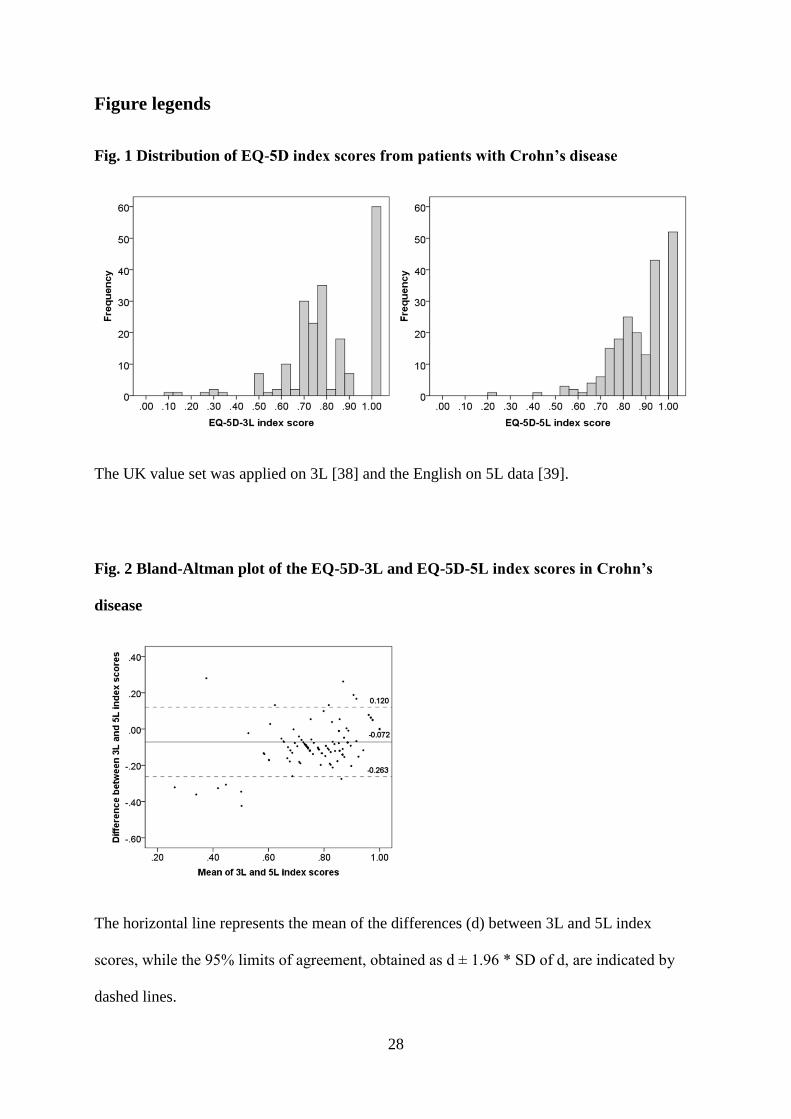
Distribution and ceiling effect
For 3L, 25 unique health states were observed versus 59 for the 5L. Distribution of EQ-5D
index scores is presented in Fig.1. There were two negative values in the 3L and none in the
5L.
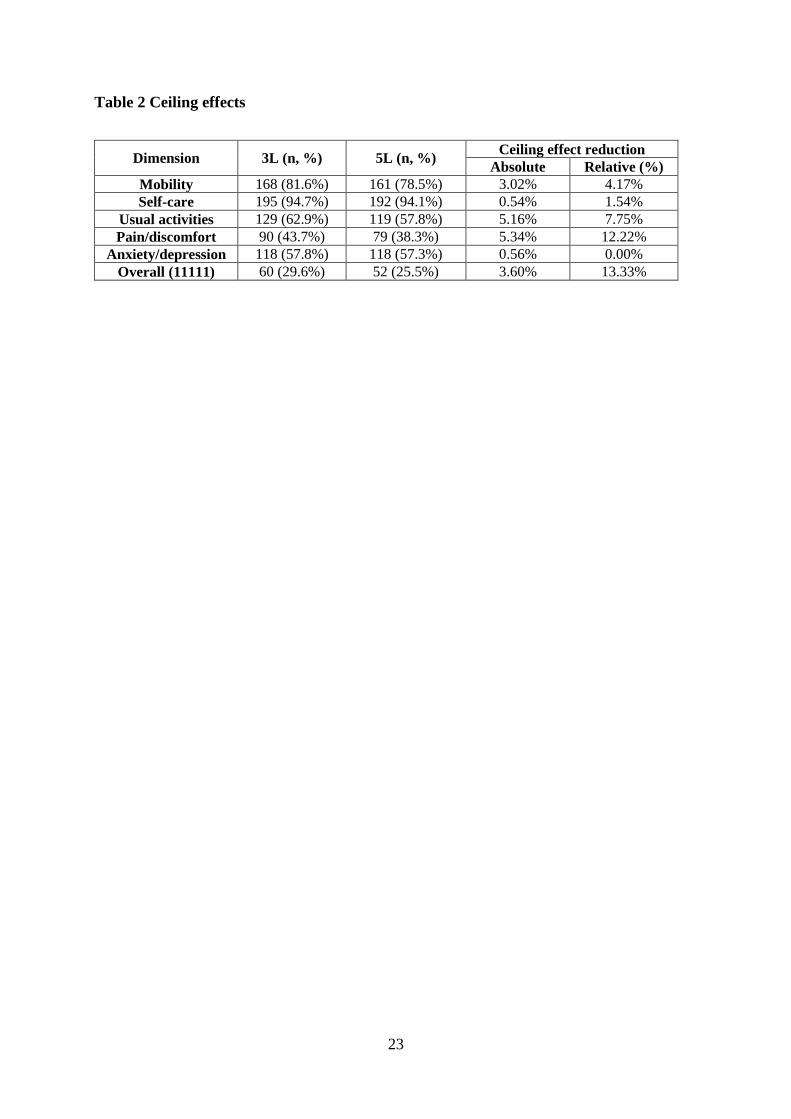
Patients reported the least problems with self-care (rate of ‘1’ responses: 94.7% in 3L and
94.1% in 5L), whereas the most problems occurred with pain/discomfort (rate of ‘1’ responses:
43.7% in 3L and 38.3% in 5L) (Table 2). The other three dimensions varied in between. The
proportion of ‘11111’ profiles (index score=1) decreased from 29.6% on the 3L to 25.5% on
the 5L indicating an overall absolute ceiling effect reduction of 4.1% and a relative ceiling
effect reduction of 13.3%. Absolute and relative ceiling effect reductions were the highest for
the mobility and the lowest for the anxiety/depression item. There were a total of nine (4.4%)
‘100’ responses on the EQ VAS.
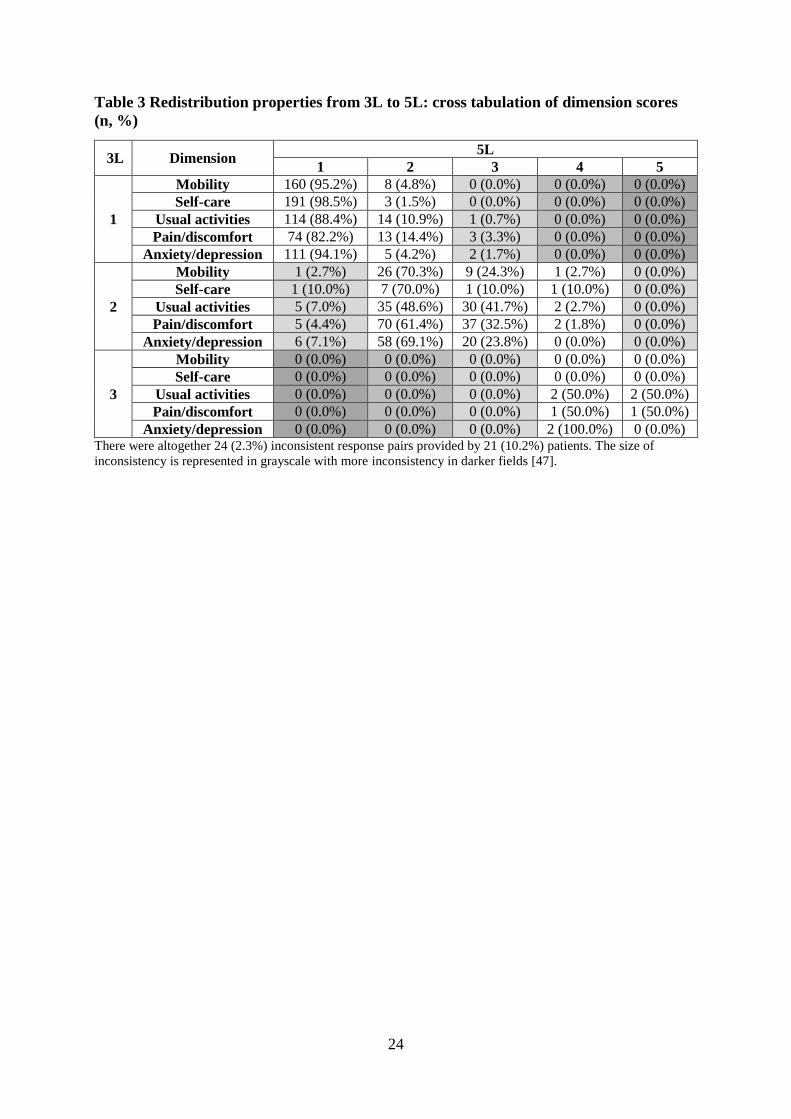
Redistribution properties and inconsistencies
Cross-tabulations of responses to the 3L and 5L showed that responses covered all levels for
both EQ-5D versions (Table 3). No 3L responses were more than two levels away from their
5L response pairs. Only 24 (2.3%) response pairs did not meet the criteria for consistency, and
these were given by 21 (10.2%) patients. The average size of overall inconsistency was very
low (1.0). The lowest rate of inconsistent responses was observed in mobility and self-care
16
dimensions (0.5%), whereas the highest in the pain/discomfort and anxiety/depression
dimensions (3.9%) (Table 4).
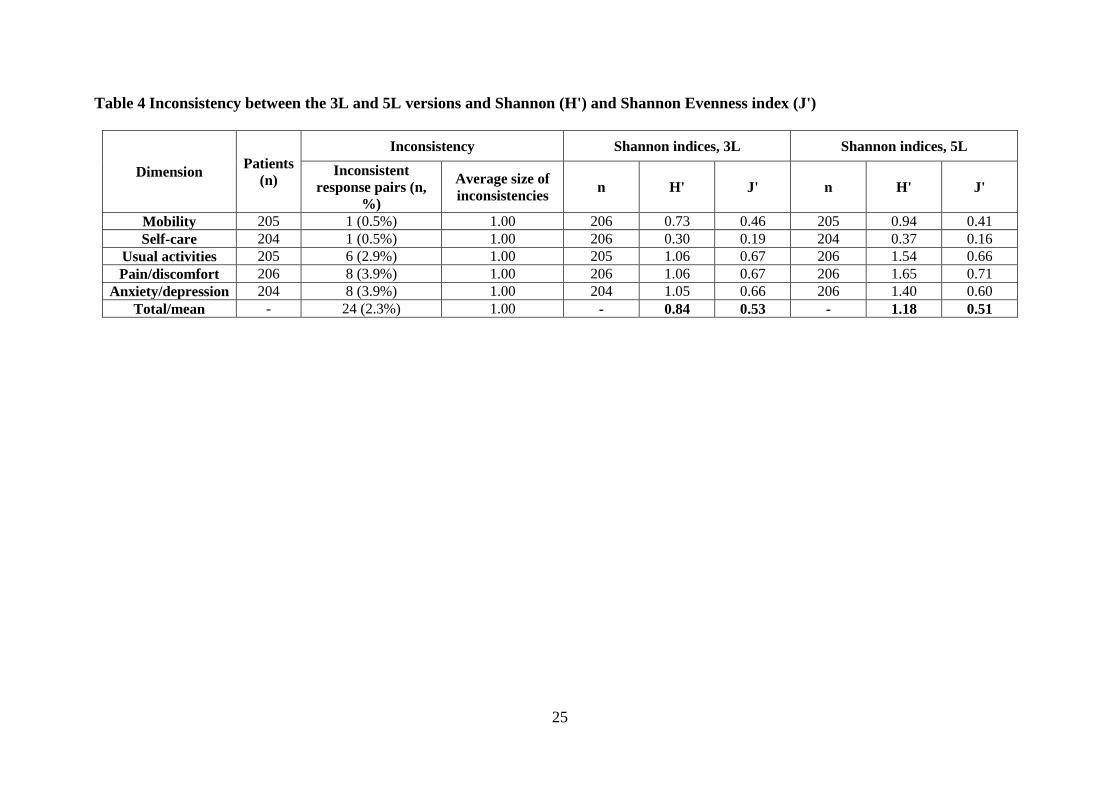
Discriminatory power
When moving from 3L to 5L, absolute discriminatory power (Shannon index, H’) improved
across all dimensions (3L 0.30 to 1.06 vs. 5L 0.37 to 1.65) indicating that the extra levels were
effectively used (Table 4). The average H’ value improved from 0.84 for the 3L to 1.18 for the
5L. Relative discriminatory power (Shannon Evenness index, J’) marginally increased for the
dimension of pain/discomfort, while declined for the other four dimensions. The average values
of J’ for the 3L and 5L were 0.53 and 0.51, respectively.
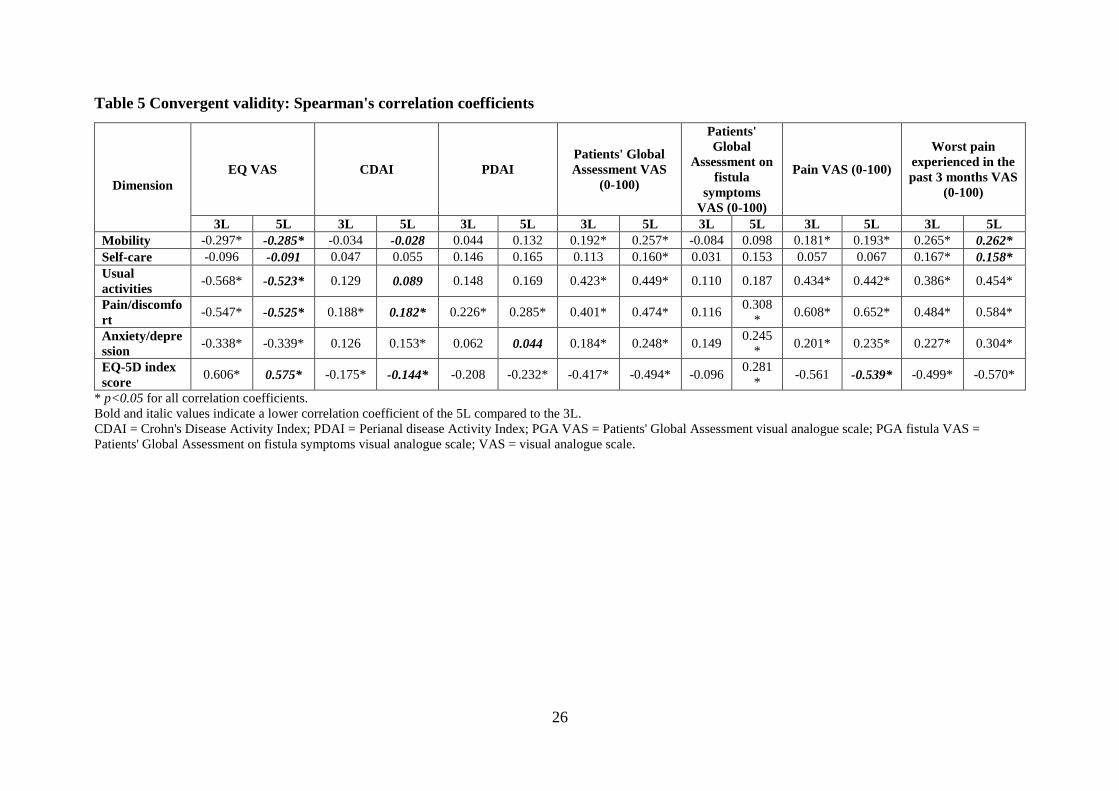
Convergent validity
With respect to index scores, the 3L and 5L produced a strong and a moderate-to-strong
correlation with EQ VAS, respectively (Table 5). The 3L indicated better correlations with EQ
VAS for all dimensions except for anxiety/depression. For individual dimensions, the minimum
value of correlation coefficient was found for self-care (-0.096) and the maximum for usual
activities (-0.568). In contrast, in 5L, correlation coefficients with EQ VAS ranged from -0.091
(self-care) to -0.525 (pain/discomfort).
For both EQ-5D versions, very weak correlations were observed with CDAI scores across all
dimensions, with a better overall performance of the 3L. As opposed to these, in all but one
dimensions the 5L provided stronger correlations with PDAI and in all dimensions with PGA
VAS, PGA fistula VAS and current pain VAS. Considering the worst pain experienced in the
17
past 3 months, the 5L exhibited a better convergent validity for the usual activities,
pain/discomfort and anxiety/depression domains.
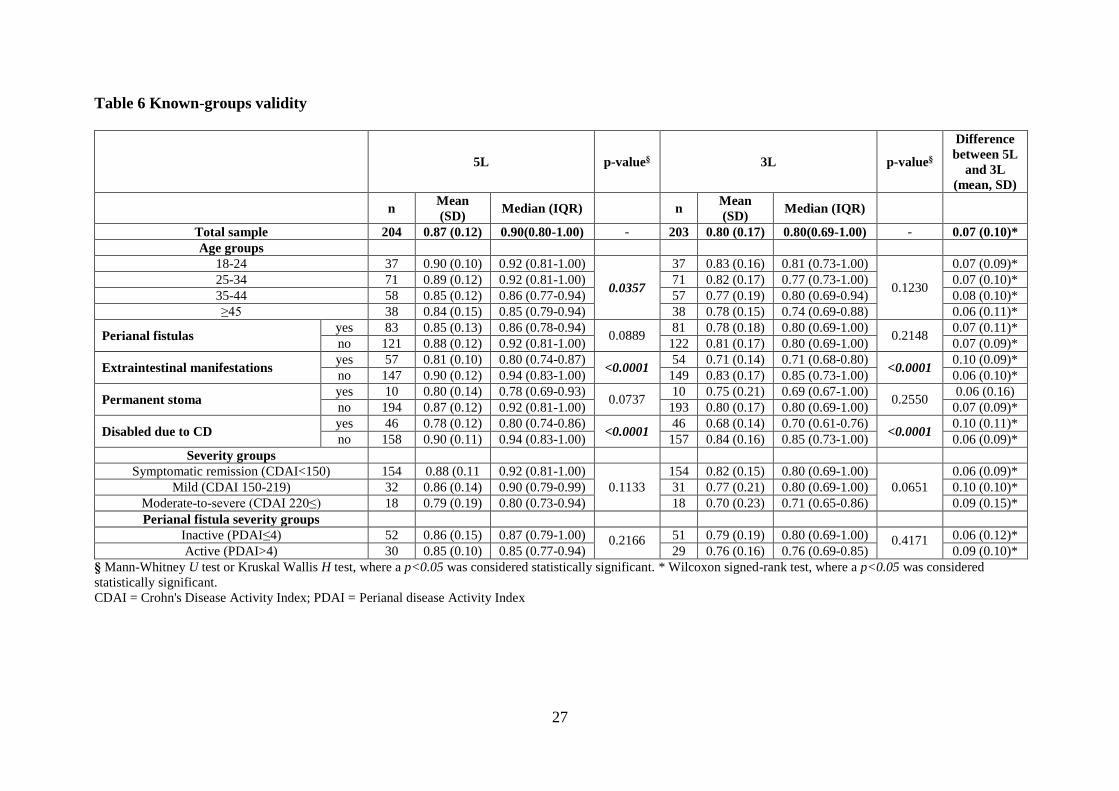
Known-groups validity
The mean and median of 5L were higher than the corresponding mean and median of 3L in all
subgroups of patients (Table 6). Subjects with extraintestinal manifestations and those who
were disabled due to CD tended to have significantly lower index scores, as measured by both
instruments (p<0.05). The 5L was able to better distinguish between groups based on age,
perianal fistulas and permanent stoma.
Discussion
This study aimed to compare the psychometric properties of two versions of the EQ-5D
questionnaire in a sample of patients diagnosed with CD. A good agreement was found between
the two instruments, albeit, one might expect higher ICC value than 0.707, given the same
underlying construct. In comparison, ICC values of 0.759 and 0.94 were reported in a young
adult general population in Portugal and among patients with psoriasis in Greece, respectively
[56,57]. In accordance with earlier studies, the Bland-Altman plot confirmed a strong
agreement between the two measures [56,57].
One of the primary aims in introducing the 5L was to reduce the number of patients with 11111
(full health) responses. As expected, the expansion of the response levels in the EQ-5D
descriptive system decreased ceiling effect, especially in the pain/discomfort and usual
activities dimensions. The proportion of CD patients reporting no problems declined by 4.1%.
This is similar to the magnitude of reduction in ceiling effect observed in chronic hepatic
18
diseases (2.9%) and psoriasis (4.2%) [54,35]. Nevertheless, it is considerably smaller compared
to those found in patients with hepatitis B (16.7%) and diabetes (20.0%) [55,58].
According to a recent systematic review by Buchholz et al. 14 previous studies involving
various patient or general population samples have analysed the informativity of the 5L and 3L
by computing Shannon indices [29]. In all of these studies, the H’ was higher for the 5L than
for the 3L indicating that more information is captured by the 5L. The J’ was, however, higher
for the 5L in nine studies and slightly lower in five studies – similarly to our study in patients
with CD. A possible explanation for this is the very limited use of levels 4 and 5 in the 5L and
level 3 in the 3L because of the high number of patients in remission or with mildly active
disease.
With regard to convergent and known-groups validity with the reference measures, some
differences were identified between the 3L and 5L. In our study the 5L performed better in 24
out of the 35 correlation coefficients (69%). This figure is in accordance with previous studies
in which some disease-specific outcome measures correlated better with the 5L, while others
with the 3L. For example, the 5L demonstrated slightly better convergence validity with
Psoriasis Area and Severity Index but not with the Dermatology Life Quality Index (DLQI) in
psoriasis [35], with the Eastern Cancer Oncology Group (ECOG) and the European
Organisation for Research and Treatment of Cancer Quality of Life Questionnaire Core 30
(EORTC QLQ 30) scales in cancer [60], and none of Barthel Index and modified Rankin scale
in stroke [61]. We observed that the 5L exhibited weaker correlations with EQ VAS in CD (4/5
dimensions). For the sake of comparison, the 5L produced higher correlation coefficients in
patients with hepatitis B (4/5 dimensions) [55], cancer (5/5 dimensions) [60] and total hip
arthroplasty (4/5 dimensions) [62], but not in psoriasis (1/5 dimension) [35]. The underlying
reasons for such differences may be attributed to the variations in patient populations including
the characteristics and severity of the disease, and the extent of use of response levels on the
19
EQ-5D descriptive system by patients with different conditions. In terms of known-groups
validity, the 5L was able to more precisely detect differences between subgroups of patients
based on age and important clinical characteristics. Both versions detected significantly lower
EQ-5D index scores in patients with extraintestinal manifestations. As mentioned previously,
arthritis/arthralgia has represented the majority of these extraintestinal symptoms which can be
relatively easily captured by the mobility dimension of the EQ-5D.
As opposed to patient-reported scales, both systems showed weak or very weak correlations
with measures of disease severity assessed by physicians (CDAI and PDAI). Previous studies
found moderate or strong correlations between the 3L index and CDAI scores [25,26,63]. This
difference may be attributable to variations in the composition of patient populations examined
in these studies (e.g. disease characteristics and severity, type of treatment). Other sources of
difference lie in the time horizon of the EQ-5D and CDAI (today vs. previous seven days), the
interobserver variability [64] and the accuracy of CDAI score calculation. The CDAI is based
on symptoms, signs and blood test results, and studies reported that a poor correlation exists
between CDAI scores and endoscopic indices [65-67]. Consequently, the weak correlation
between the EQ-5D and CDAI does not imply that the EQ-5D can poorly distinguish severity
groups of CD patients.
Large systematic differences between 3L and 5L index scores can be observed, which are
resulting from how individuals respond to the changed descriptive system and from the
differences between the 3L (UK) and the 5L (English) value sets [68,69]. As shown in a recent
study by Hernández Alava et al. the 3L and 5L utilities are not interchangeable, as they can
produce substantially different cost-effectiveness results [70]. To put this into context,
biological treatments for CD mostly improve HRQoL, rather than reducing mortality; thus, a
drug would be deemed as more cost-effective if the 3L had been used in place of the 5L.
20
Examining how the differences between the 3L and 5L results impact existing cost-
effectiveness analyses of biologics and biosimilars might be an important future challenge.
The multicentre design that involved four clinics from three different cities, the heterogeneous
patient population and the large number of outcome measures utilised in the survey can be
considered as strengths of the study. This is the first study in the literature to compare the
measurement properties of the 3L and 5L in CD patients; additionally, the first to report the
impact of CD on HRQoL using the 5L version of the questionnaire.
The greatest limitation of the study is that patients in severe health states were underrepresented
in the sample, mostly because two-third of our patients were treated with biologics.
Nonetheless, the patient population was heterogeneous in terms of clinical manifestation of the
disease, which was excellent for the purpose of study. A further limitation of our study is the
moderate sample size. Finally, we did not test some other important psychometric properties
such as sensitivity and test-retest reliability, which could not be investigated here because of
the cross-sectional nature of the survey.
In conclusion, in patients with CD, the 5L performed well in terms of feasibility, agreement,
ceiling effect, consistency, absolute discriminatory power and known-groups validity.
Nonetheless, it somewhat lagged behind the 3L in convergent validity with EQ VAS and CDAI.
Further longitudinal studies are needed that compare the responsiveness and reliability of the
two descriptive systems. Another future research direction is to examine the relationship of EQ-
5D index scores and endoscopic markers that might better reflect disease severity than CDAI
scores.
21
Tables
Table 1 Patient characteristics
Mean (SD) or n (%)
Gender
Female 93 (45.1%)
Male 113 (54.9%)
Age (years) 34.7 (10.5)
Employment status§
Student 25 (12.1%)
Full-time employed 110 (53.4%)
Part-time employed 30 (14.6%)
Unemployed 11 (5.3%)
Retired 3 (1.5%)
Disabled due to Crohn’s disease 49 (23.8%)
Other 15 (7.3%)
Disease duration (years) (missing n=1) 10.5 (6.3)
Fistulas§ 84 (40.8%)
Perianal 84 (40.8%)
Other 2 (1.0%)
Extraintestinal manifestations§ 57 (27.7%)
Arthritis/arthralgia 44 (21.4%)
Iritis/uveitis 8 (3.9%)
Skin symptoms 8 (3.9%)
Other† 3 (1.5%)
Permanent stoma 10 (4.9%)
Treatments
None 3 (1.5%)
Systemic non-biological 67 (32.5%)
Biological 136 (66.0%)
Outcome measures
Disease severity
CDAI (0-600) (missing n=2) 110.49 (76.97)
PDAI (0-20) (missing n=1) 3.68 (2.29)
PGA VAS (0-100) (missing n=2) 50.11 (23.87)
PGA fistula VAS (0-100) (missing n=11) 44.87 (25.72)
Pain
Pain VAS (0-100) 24.65 (23.90)
Worst pain experienced in the past 3 months VAS (0-100) 41.95 (31.36)
Health-related quality of life*
EQ-5D-5L (-0.285-1) (missing n=2) 0.87 (0.12)
EQ-5D-3L (-0.594-1) (missing n=3) 0.80 (0.17)
EQ VAS (0-100) 72.74 (19.67) § Combinations occurred. † Vasculitis, aphtous stomatitis and primary sclerosing cholangitis were present in one
patient each. *We found two negative values for the EQ-5D-3L and no negative values for the EQ-5D-5L.
CDAI = Crohn's Disease Activity Index; PDAI = Perianal disease Activity Index; PGA VAS = Patients' Global
Assessment visual analogue scale; PGA fistula VAS = Patients' Global Assessment on fistula symptoms visual
analogue scale; VAS = visual analogue scale.

22
Higher scores represent worse health state for all outcome measures with the exception of EQ-5D-3L, EQ-5D-
5L and EQ VAS.
23
Table 2 Ceiling effects
Dimension 3L (n, %) 5L (n, %) Ceiling effect reduction
Absolute Relative (%)
Mobility 168 (81.6%) 161 (78.5%) 3.02% 4.17%
Self-care 195 (94.7%) 192 (94.1%) 0.54% 1.54%
Usual activities 129 (62.9%) 119 (57.8%) 5.16% 7.75%
Pain/discomfort 90 (43.7%) 79 (38.3%) 5.34% 12.22%
Anxiety/depression 118 (57.8%) 118 (57.3%) 0.56% 0.00%
Overall (11111) 60 (29.6%) 52 (25.5%) 3.60% 13.33%
24
Table 3 Redistribution properties from 3L to 5L: cross tabulation of dimension scores
(n, %)
3L Dimension 5L
1 2 3 4 5
1
Mobility 160 (95.2%) 8 (4.8%) 0 (0.0%) 0 (0.0%) 0 (0.0%)
Self-care 191 (98.5%) 3 (1.5%) 0 (0.0%) 0 (0.0%) 0 (0.0%)
Usual activities 114 (88.4%) 14 (10.9%) 1 (0.7%) 0 (0.0%) 0 (0.0%)
Pain/discomfort 74 (82.2%) 13 (14.4%) 3 (3.3%) 0 (0.0%) 0 (0.0%)
Anxiety/depression 111 (94.1%) 5 (4.2%) 2 (1.7%) 0 (0.0%) 0 (0.0%)
2
Mobility 1 (2.7%) 26 (70.3%) 9 (24.3%) 1 (2.7%) 0 (0.0%)
Self-care 1 (10.0%) 7 (70.0%) 1 (10.0%) 1 (10.0%) 0 (0.0%)
Usual activities 5 (7.0%) 35 (48.6%) 30 (41.7%) 2 (2.7%) 0 (0.0%)
Pain/discomfort 5 (4.4%) 70 (61.4%) 37 (32.5%) 2 (1.8%) 0 (0.0%)
Anxiety/depression 6 (7.1%) 58 (69.1%) 20 (23.8%) 0 (0.0%) 0 (0.0%)
3
Mobility 0 (0.0%) 0 (0.0%) 0 (0.0%) 0 (0.0%) 0 (0.0%)
Self-care 0 (0.0%) 0 (0.0%) 0 (0.0%) 0 (0.0%) 0 (0.0%)
Usual activities 0 (0.0%) 0 (0.0%) 0 (0.0%) 2 (50.0%) 2 (50.0%)
Pain/discomfort 0 (0.0%) 0 (0.0%) 0 (0.0%) 1 (50.0%) 1 (50.0%)
Anxiety/depression 0 (0.0%) 0 (0.0%) 0 (0.0%) 2 (100.0%) 0 (0.0%) There were altogether 24 (2.3%) inconsistent response pairs provided by 21 (10.2%) patients. The size of
inconsistency is represented in grayscale with more inconsistency in darker fields [47].
25
Table 4 Inconsistency between the 3L and 5L versions and Shannon (H') and Shannon Evenness index (J')
Dimension Patients
(n)
Inconsistency Shannon indices, 3L Shannon indices, 5L
Inconsistent
response pairs (n,
%)
Average size of
inconsistencies n H' J' n H' J'
Mobility 205 1 (0.5%) 1.00 206 0.73 0.46 205 0.94 0.41
Self-care 204 1 (0.5%) 1.00 206 0.30 0.19 204 0.37 0.16
Usual activities 205 6 (2.9%) 1.00 205 1.06 0.67 206 1.54 0.66
Pain/discomfort 206 8 (3.9%) 1.00 206 1.06 0.67 206 1.65 0.71
Anxiety/depression 204 8 (3.9%) 1.00 204 1.05 0.66 206 1.40 0.60
Total/mean - 24 (2.3%) 1.00 - 0.84 0.53 - 1.18 0.51
26
Table 5 Convergent validity: Spearman's correlation coefficients
Dimension
EQ VAS CDAI PDAI
Patients' Global
Assessment VAS
(0-100)
Patients'
Global
Assessment on
fistula
symptoms
VAS (0-100)
Pain VAS (0-100)
Worst pain
experienced in the
past 3 months VAS
(0-100)
3L 5L 3L 5L 3L 5L 3L 5L 3L 5L 3L 5L 3L 5L
Mobility -0.297* -0.285* -0.034 -0.028 0.044 0.132 0.192* 0.257* -0.084 0.098 0.181* 0.193* 0.265* 0.262*
Self-care -0.096 -0.091 0.047 0.055 0.146 0.165 0.113 0.160* 0.031 0.153 0.057 0.067 0.167* 0.158*
Usual
activities -0.568* -0.523* 0.129 0.089 0.148 0.169 0.423* 0.449* 0.110 0.187 0.434* 0.442* 0.386* 0.454*
Pain/discomfo
rt -0.547* -0.525* 0.188* 0.182* 0.226* 0.285* 0.401* 0.474* 0.116
0.308
* 0.608* 0.652* 0.484* 0.584*
Anxiety/depre
ssion -0.338* -0.339* 0.126 0.153* 0.062 0.044 0.184* 0.248* 0.149
0.245
* 0.201* 0.235* 0.227* 0.304*
EQ-5D index
score 0.606* 0.575* -0.175* -0.144* -0.208 -0.232* -0.417* -0.494* -0.096
0.281
* -0.561 -0.539* -0.499* -0.570*
* p<0.05 for all correlation coefficients.
Bold and italic values indicate a lower correlation coefficient of the 5L compared to the 3L.
CDAI = Crohn's Disease Activity Index; PDAI = Perianal disease Activity Index; PGA VAS = Patients' Global Assessment visual analogue scale; PGA fistula VAS =
Patients' Global Assessment on fistula symptoms visual analogue scale; VAS = visual analogue scale.
27
Table 6 Known-groups validity
5L p-value§ 3L p-value§
Difference
between 5L
and 3L
(mean, SD)
n
Mean
(SD) Median (IQR) n
Mean
(SD) Median (IQR)
Total sample 204 0.87 (0.12) 0.90(0.80-1.00) - 203 0.80 (0.17) 0.80(0.69-1.00) - 0.07 (0.10)*
Age groups
18-24 37 0.90 (0.10) 0.92 (0.81-1.00)
0.0357
37 0.83 (0.16) 0.81 (0.73-1.00)
0.1230
0.07 (0.09)*
25-34 71 0.89 (0.12) 0.92 (0.81-1.00) 71 0.82 (0.17) 0.77 (0.73-1.00) 0.07 (0.10)*
35-44 58 0.85 (0.12) 0.86 (0.77-0.94) 57 0.77 (0.19) 0.80 (0.69-0.94) 0.08 (0.10)*
≥45 38 0.84 (0.15) 0.85 (0.79-0.94) 38 0.78 (0.15) 0.74 (0.69-0.88) 0.06 (0.11)*
Perianal fistulas yes 83 0.85 (0.13) 0.86 (0.78-0.94)
0.0889 81 0.78 (0.18) 0.80 (0.69-1.00)
0.2148 0.07 (0.11)*
no 121 0.88 (0.12) 0.92 (0.81-1.00) 122 0.81 (0.17) 0.80 (0.69-1.00) 0.07 (0.09)*
Extraintestinal manifestations yes 57 0.81 (0.10) 0.80 (0.74-0.87)
<0.0001 54 0.71 (0.14) 0.71 (0.68-0.80)
<0.0001 0.10 (0.09)*
no 147 0.90 (0.12) 0.94 (0.83-1.00) 149 0.83 (0.17) 0.85 (0.73-1.00) 0.06 (0.10)*
Permanent stoma yes 10 0.80 (0.14) 0.78 (0.69-0.93)
0.0737 10 0.75 (0.21) 0.69 (0.67-1.00)
0.2550 0.06 (0.16)
no 194 0.87 (0.12) 0.92 (0.81-1.00) 193 0.80 (0.17) 0.80 (0.69-1.00) 0.07 (0.09)*
Disabled due to CD yes 46 0.78 (0.12) 0.80 (0.74-0.86)
<0.0001 46 0.68 (0.14) 0.70 (0.61-0.76)
<0.0001 0.10 (0.11)*
no 158 0.90 (0.11) 0.94 (0.83-1.00) 157 0.84 (0.16) 0.85 (0.73-1.00) 0.06 (0.09)*
Severity groups
Symptomatic remission (CDAI<150) 154 0.88 (0.11 0.92 (0.81-1.00)
0.1133
154 0.82 (0.15) 0.80 (0.69-1.00)
0.0651
0.06 (0.09)*
Mild (CDAI 150-219) 32 0.86 (0.14) 0.90 (0.79-0.99) 31 0.77 (0.21) 0.80 (0.69-1.00) 0.10 (0.10)*
Moderate-to-severe (CDAI 220≤) 18 0.79 (0.19) 0.80 (0.73-0.94) 18 0.70 (0.23) 0.71 (0.65-0.86) 0.09 (0.15)*
Perianal fistula severity groups
Inactive (PDAI≤4) 52 0.86 (0.15) 0.87 (0.79-1.00) 0.2166 51 0.79 (0.19) 0.80 (0.69-1.00) 0.4171 0.06 (0.12)*
Active (PDAI>4) 30 0.85 (0.10) 0.85 (0.77-0.94) 29 0.76 (0.16) 0.76 (0.69-0.85) 0.09 (0.10)*
§ Mann-Whitney U test or Kruskal Wallis H test, where a p<0.05 was considered statistically significant. * Wilcoxon signed-rank test, where a p<0.05 was considered
statistically significant.
CDAI = Crohn's Disease Activity Index; PDAI = Perianal disease Activity Index
28
Figure legends
Fig. 1 Distribution of EQ-5D index scores from patients with Crohn’s disease
The UK value set was applied on 3L [38] and the English on 5L data [39].
Fig. 2 Bland-Altman plot of the EQ-5D-3L and EQ-5D-5L index scores in Crohn’s
disease
The horizontal line represents the mean of the differences (d) between 3L and 5L index
scores, while the 95% limits of agreement, obtained as d ± 1.96 * SD of d, are indicated by
dashed lines.
29
References
1. Ng, S. C., Shi, H. Y., Hamidi, N., Underwood, F. E., Tang, W., Benchimol, E. I., et al. (2018).
Worldwide incidence and prevalence of inflammatory bowel disease in the 21st century:
a systematic review of population-based studies. Lancet, 390(10114), 2769-2778.
2. Kaplan, G. G. (2015). The global burden of IBD: from 2015 to 2025. Nat Rev Gastroenterol
Hepatol, 12(12), 720-727.
3. Torres, J., Mehandru, S., Colombel, J. F., & Peyrin-Biroulet, L. (2017). Crohn's disease.
Lancet, 389(10080), 1741-1755.
4. Harbord, M., Annese, V., Vavricka, S. R., Allez, M., Barreiro-de Acosta, M., Boberg, K. M.,
et al. (2016). The First European Evidence-based Consensus on Extra-intestinal
Manifestations in Inflammatory Bowel Disease. J Crohns Colitis, 10(3), 239-254.
5. van der Have, M., van der Aalst, K. S., Kaptein, A. A., Leenders, M., Siersema, P. D.,
Oldenburg, B., et al. (2014). Determinants of health-related quality of life in Crohn's
disease: a systematic review and meta-analysis. J Crohns Colitis, 8(2), 93-106.
6. Brodszky, V., Rencz, F., Pentek, M., Baji, P., Lakatos, P. L., & Gulacsi, L. (2016). A budget
impact model for biosimilar infliximab in Crohn's disease in Bulgaria, the Czech
Republic, Hungary, Poland, Romania, and Slovakia. Expert Rev Pharmacoecon
Outcomes Res, 16(1), 119-125.
7. Rencz, F., Pentek, M., Bortlik, M., Zagorowicz, E., Hlavaty, T., Sliwczynski, A., et al.
(2015). Biological therapy in inflammatory bowel diseases: access in Central and
Eastern Europe. World J Gastroenterol, 21(6), 1728-1737.
8. Boncz, I., & Sebestyen, A. (2006). Financial deficits in the health services of the UK and
Hungary. Lancet, 368(9539), 917-918.
9. Gulacsi, L., Pentek, M., Rencz, F., Brodszky, V., Baji, P., Vegh, Z., et al. (2017). Biosimilars
for the management of inflammatory bowel diseases: economic considerations. Curr
Med Chem [Epub ahead of print]
10. Haute Autorité de Santé (HAS). Choices in Methods for Economic Evaluation. Saint-Denis
La Plaine, France: Department of Economics and Public Health Assessment. (2012).
Available from: https://www.has-sante.fr/portail/upload/docs/application/pdf/2012-
10/choices_in_methods_for_economic_evaluation.pdf Accessed: 22/04/2018
11. National Institute for Health and Care Excellence (NICE). Guide to the Methods of
Technology Appraisal. (2013). Available from:
https://www.nice.org.uk/guidance/pmg9/resources/guide-to-the-methods-of-
technology-appraisal-2013-pdf-2007975843781 Accessed: 01/04/2018
12. Zorginstituut Nederland. Richtlijn voor het uitvoeren van economische evaluaties in de
gezondheidszorg. Zorginstituut Nederland, Diemen, The Netherlands. (2016).
Available from:
https://www.zorginstituutnederland.nl/binaries/zinl/documenten/publicatie/2016/02/29
/richtlijn-voor-het-uitvoeren-van-economische-evaluaties-in-de-
gezondheidszorg/richtlijn-voor-het-uitvoeren-van-economische-evaluaties-in-de-
gezondheidszorg.pdf Accessed: 22/04/2018
13. Cleemput, I., Neyt, M., Van de Sande, S., & Thiry, N. (2012). Belgian guidelines for
economic evaluations and budget impact analyses: second edition Available from:
https://kce.fgov.be/sites/default/files/atoms/files/KCE_183_economic_evaluations_sec
ond_edition_Report.pdf. Accessed January 22, 2017.
14. Rencz, F., Gulacsi, L., Drummond, M., Golicki, D., Prevolnik Rupel, V., Simon, J., et al.
(2016). EQ-5D in Central and Eastern Europe: 2000-2015. Qual Life Res, 25(11), 2693-
2710.
30
15. Rowen, D., Azzabi Zouraq, I., Chevrou-Severac, H., & van Hout, B. (2017). International
Regulations and Recommendations for Utility Data for Health Technology Assessment.
Pharmacoeconomics, 35(Suppl 1), 11-19.
16. Sanders, G. D., Neumann, P. J., Basu, A., Brock, D. W., Feeny, D., Krahn, M., et al. (2016).
Recommendations for Conduct, Methodological Practices, and Reporting of Cost-
effectiveness Analyses: Second Panel on Cost-Effectiveness in Health and Medicine.
JAMA, 316(10), 1093-1103.
17. Canadian Agency for Drugs and Technologies in Health. Guidelines for the Economic
Evaluation of Health Technologies. (2006). Available from:
https://www.cadth.ca/media/pdf/186_EconomicGuidelines_e.pdf Accessed:
04/12/2017
18. Huoponen, S., & Blom, M. (2015). A Systematic Review of the Cost-Effectiveness of
Biologics for the Treatment of Inflammatory Bowel Diseases. PLoS One, 10(12),
e0145087.
19. Pillai, N., Dusheiko, M., Burnand, B., & Pittet, V. (2017). A systematic review of cost-
effectiveness studies comparing conventional, biological and surgical interventions for
inflammatory bowel disease. PLoS One, 12(10), e0185500.
20. Rencz, F., Gulacsi, L., Pentek, M., Gecse, K. B., Dignass, A., Halfvarson, J., et al. (2017).
Cost-utility of biological treatment sequences for luminal Crohn's disease in Europe.
Expert Rev Pharmacoecon Outcomes Res, 17(6), 597-606.
21. Punekar, Y. S., Sunderland, T., Hawkins, N., & Lindsay, J. (2010). Cost-effectiveness of
scheduled maintenance treatment with infliximab for pediatric Crohn's disease. Value
Health, 13(2), 188-195.
22. Baji, P., Gulácsi, L., Brodszky, V., Végh, Z., Danese, S., Irving, P. M., et al. (2018). Cost-
effectiveness of biological treatment sequences for fistulising Crohn’s disease across
Europe. United European Gastroenterology Journal, 6(2), 310-321.
23. Malinowski, K. P., & Kawalec, P. (2016). Health utility of patients with Crohn's disease
and ulcerative colitis: a systematic review and meta-analysis. Expert Rev Pharmacoecon
Outcomes Res, 16(4), 441-453.
24. Brooks, R. (2012). The EuroQol Group After 25 Years: Springer Science & Business Media.
25. Konig, H. H., Ulshofer, A., Gregor, M., von Tirpitz, C., Reinshagen, M., Adler, G., et al.
(2002). Validation of the EuroQol questionnaire in patients with inflammatory bowel
disease. Eur J Gastroenterol Hepatol, 14(11), 1205-1215.
26. Stark, R. G., Reitmeir, P., Leidl, R., & Konig, H. H. (2010). Validity, reliability, and
responsiveness of the EQ-5D in inflammatory bowel disease in Germany. Inflamm
Bowel Dis, 16(1), 42-51.
27. Herdman, M., Gudex, C., Lloyd, A., Janssen, M., Kind, P., Parkin, D., et al. (2011).
Development and preliminary testing of the new five-level version of EQ-5D (EQ-5D-
5L). Qual Life Res, 20(10), 1727-1736.
28. Janssen, M. F., Pickard, A. S., Golicki, D., Gudex, C., Niewada, M., Scalone, L., et al.
(2013). Measurement properties of the EQ-5D-5L compared to the EQ-5D-3L across
eight patient groups: a multi-country study. Qual Life Res, 22(7), 1717-1727.
29. Buchholz, I., Janssen, M. F., Kohlmann, T., & Feng, Y. S. (2018). A Systematic Review of
Studies Comparing the Measurement Properties of the Three-Level and Five-Level
Versions of the EQ-5D. Pharmacoeconomics, 36(6), 645-661.
30. Norton, C., Dibley, L. B., Hart, A., Duncan, J., Emmanuel, A., Knowles, C. H., et al. (2015).
Faecal incontinence intervention study (FINS): self-management booklet information
with or without nurse support to improve continence in people with inflammatory bowel
disease: study protocol for a randomized controlled trial. Trials, 16, 444.
31
31. Tew, G. A., Carpenter, R., Seed, M., Anderson, S., Langmead, L., Fairhurst, C., et al.
(2017). Feasibility of high-intensity interval training and moderate-intensity continuous
training in adults with inactive or mildly active Crohn's disease: study protocol for a
randomised controlled trial. Pilot Feasibility Stud, 3, 17.
32. Pentek, M., Lakatos, P. L., Oorsprong, T., Gulacsi, L., Pavlova, M., Groot, W., et al. (2017).
Access to biologicals in Crohn's disease in ten European countries. World J
Gastroenterol, 23(34), 6294-6305.
33. EuroQol, G. (1990). EuroQol--a new facility for the measurement of health-related quality
of life. Health Policy, 16(3), 199-208.
34. Brooks, R. (1996). EuroQol: the current state of play. Health Policy, 37(1), 53-72.
35. Poor, A. K., Rencz, F., Brodszky, V., Gulacsi, L., Beretzky, Z., Hidvegi, B., et al. (2017).
Measurement properties of the EQ-5D-5L compared to the EQ-5D-3L in psoriasis
patients. Qual Life Res, 26(12), 3409-3419.
36. Janssen, M. F., Birnie, E., Haagsma, J. A., & Bonsel, G. J. (2008). Comparing the standard
EQ-5D three-level system with a five-level version. Value Health, 11(2), 275-284.
37. van Hout, B., Janssen, M. F., Feng, Y. S., Kohlmann, T., Busschbach, J., Golicki, D., et al.
(2012). Interim scoring for the EQ-5D-5L: mapping the EQ-5D-5L to EQ-5D-3L value
sets. Value Health, 15(5), 708-715.
38. Dolan, P. (1997). Modeling valuations for EuroQol health states. Med Care, 35(11), 1095-
1108.
39. Devlin, N. J., Shah, K. K., Feng, Y., Mulhern, B., & van Hout, B. (2018). Valuing health-
related quality of life: An EQ-5D-5L value set for England. Health Econ, 27(1), 7-22.
40. Winship, D. H., Summers, R. W., Singleton, J. W., Best, W. R., Becktel, J. M., Lenk, L. F.,
et al. (1979). National Cooperative Crohn's Disease Study: study design and conduct of
the study. Gastroenterology, 77(4 Pt 2), 829-842.
41. Sandborn, W. J., Feagan, B. G., Hanauer, S. B., Lochs, H., Lofberg, R., Modigliani, R., et
al. (2002). A review of activity indices and efficacy endpoints for clinical trials of
medical therapy in adults with Crohn's disease. Gastroenterology, 122(2), 512-530.
42. Irvine, E. J. (1995). Usual therapy improves perianal Crohn's disease as measured by a new
disease activity index. McMaster IBD Study Group. J Clin Gastroenterol, 20(1), 27-32.
43. Losco, A., Vigano, C., Conte, D., Cesana, B. M., & Basilisco, G. (2009). Assessing the
activity of perianal Crohn's disease: comparison of clinical indices and computer-
assisted anal ultrasound. Inflamm Bowel Dis, 15(5), 742-749.
44. Ripamonti, C. I. (2012). Pain management. Ann Oncol, 23 Suppl 10, x294-301.
45. Janssen, M. F., Birnie, E., & Bonsel, G. J. (2008). Quantification of the level descriptors for
the standard EQ-5D three-level system and a five-level version according to two
methods. Qual Life Res, 17(3), 463-473.
46. Pickard, A. S., De Leon, M. C., Kohlmann, T., Cella, D., & Rosenbloom, S. (2007).
Psychometric comparison of the standard EQ-5D to a 5 level version in cancer patients.
Med Care, 45(3), 259-263.
47. Buchholz, I., Thielker, K., Feng, Y. S., Kupatz, P., & Kohlmann, T. (2015). Measuring
changes in health over time using the EQ-5D 3L and 5L: a head-to-head comparison of
measurement properties and sensitivity to change in a German inpatient rehabilitation
sample. Qual Life Res, 24(4), 829-835.
48. Shrout, P. E., & Fleiss, J. L. (1979). Intraclass correlations: uses in assessing rater reliability.
Psychol Bull, 86(2), 420-428.
49. Cicchetti, D. (1994). Guidelines, criteria, and rules of thumb for evaluating normed and
standardized assessment instruments in psychology. Psychol Assess, 6(4), 284–290.
50. Bland, J. M., & Altman, D. G. (1986). Statistical methods for assessing agreement between
two methods of clinical measurement. Lancet, 1(8476), 307-310.
32
51. Shannon, C. E. (1948). The mathematical theory of communication. The Bell System
Technical Journal, 27, 379–423.
52. Shannon, C. E., & Weaver, W. (1949). The Mathematical Theory of Communication.
Urbana: University of Illinois Press, 104-107.
53. Swinscow, T., & Campbell, M. (2002). Statistics at square one. London, United Kingdom:
BMJ.
54. Scalone, L., Ciampichini, R., Fagiuoli, S., Gardini, I., Fusco, F., Gaeta, L., et al. (2013).
Comparing the performance of the standard EQ-5D 3L with the new version EQ-5D 5L
in patients with chronic hepatic diseases. Qual Life Res, 22(7), 1707-1716.
55. Jia, Y. X., Cui, F. Q., Li, L., Zhang, D. L., Zhang, G. M., Wang, F. Z., et al. (2014).
Comparison between the EQ-5D-5L and the EQ-5D-3L in patients with hepatitis B.
Qual Life Res, 23(8), 2355-2363.
56. Ferreira, L. N., Ferreira, P. L., Ribeiro, F. P., & Pereira, L. N. (2016). Comparing the
performance of the EQ-5D-3L and the EQ-5D-5L in young Portuguese adults. Health
Qual Life Outcomes, 14(1), 89.
57. Yfantopoulos, J., Chantzaras, A., & Kontodimas, S. (2017). Assessment of the
psychometric properties of the EQ-5D-3L and EQ-5D-5L instruments in psoriasis. Arch
Dermatol Res, 309(5), 357-370.
58. Pan, C. W., Sun, H. P., Wang, X., Ma, Q., Xu, Y., Luo, N., et al. (2015). The EQ-5D-5L
index score is more discriminative than the EQ-5D-3L index score in diabetes patients.
Qual Life Res, 24(7), 1767-1774.
59. Janssen, M. F., Bonsel, G. J., & Luo, N. (2018). Is EQ-5D-5L Better Than EQ-5D-3L? A
Head-to-Head Comparison of Descriptive Systems and Value Sets from Seven
Countries. Pharmacoeconomics [Epub ahead of print]
60. Kim, S. H., Kim, H. J., Lee, S. I., & Jo, M. W. (2012). Comparing the psychometric
properties of the EQ-5D-3L and EQ-5D-5L in cancer patients in Korea. Qual Life Res,
21(6), 1065-1073.
61. Golicki, D., Niewada, M., Karlinska, A., Buczek, J., Kobayashi, A., Janssen, M. F., et al.
(2015). Comparing responsiveness of the EQ-5D-5L, EQ-5D-3L and EQ VAS in stroke
patients. Qual Life Res, 24(6), 1555-1563.
62. Greene, M. E., Rader, K. A., Garellick, G., Malchau, H., Freiberg, A. A., & Rolfson, O.
(2015). The EQ-5D-5L Improves on the EQ-5D-3L for Health-related Quality-of-life
Assessment in Patients Undergoing Total Hip Arthroplasty. Clin Orthop Relat Res,
473(11), 3383-3390.
63. Buxton, M. J., Lacey, L. A., Feagan, B. G., Niecko, T., Miller, D. W., & Townsend, R. J.
(2007). Mapping from disease-specific measures to utility: an analysis of the
relationships between the Inflammatory Bowel Disease Questionnaire and Crohn's
Disease Activity Index in Crohn's disease and measures of utility. Value Health, 10(3),
214-220.
64. de Dombal, F. T., & Softley, A. (1987). IOIBD report no 1: Observer variation in calculating
indices of severity and activity in Crohn's disease. International Organisation for the
Study of Inflammatory Bowel Disease. Gut, 28(4), 474-481.
65. Khanna, R., Nelson, S. A., Feagan, B. G., D'Haens, G., Sandborn, W. J., Zou, G. Y., et al.
(2016). Endoscopic scoring indices for evaluation of disease activity in Crohn's disease.
Cochrane Database Syst Rev(8), CD010642.
66. Peyrin-Biroulet, L., Panes, J., Sandborn, W. J., Vermeire, S., Danese, S., Feagan, B. G., et
al. (2016). Defining Disease Severity in Inflammatory Bowel Diseases: Current and
Future Directions. Clin Gastroenterol Hepatol, 14(3), 348-354 e317.

33
67. Regueiro, M., Kip, K. E., Schraut, W., Baidoo, L., Sepulveda, A. R., Pesci, M., et al. (2011).
Crohn's disease activity index does not correlate with endoscopic recurrence one year
after ileocolonic resection. Inflamm Bowel Dis, 17(1), 118-126.
68. Mulhern, B., Feng, Y., Shah, K., Janssen, M. F., Herdman, M., van Hout, B., et al. (2018 ).
Comparing the UK EQ-5D-3L and English EQ-5D-5L Value Sets.
Pharmacoeconomics, 36(6), 699-713.
69. Devlin, N., Brazier, J., Pickard, A. S., & Stolk, E. (2018). 3L, 5L, What the L? A NICE
Conundrum. Pharmacoeconomics, 36(6), 637-640.
70. Hernandez Alava, M., Wailoo, A., Grimm, S., Pudney, S., Gomes, M., Sadique, Z., et al.
(2018). EQ-5D-5L versus EQ-5D-3L: The Impact on Cost Effectiveness in the United
Kingdom. Value Health, 21(1), 49-56.
Related Documents