Title Progressive collapse resistance of RC beam-column sub- assemblages Author(s) Yu, Jun; Tan, Kang Hai Citation Yu, J., & Tan, K. H. (2010). Progressive Collapse Resistance of RC Beam-Column Sub-assemblages. Design and Analysis of Protective Structures (3rd:2010:Singapore) Date 2010 URL http://hdl.handle.net/10220/7034 Rights © 2010 Design and Analysis of Protective Structures. This is the author created version of a work that has been peer reviewed and accepted for publication by Design and Analysis of Protective Structures. It incorporates referee’s comments but changes resulting from the publishing process, such as copyediting, structural formatting, may not be reflected in this document. The official conference website is: http://www.cee.ntu.edu.sg/Conferences/daps2010/index. htm.

Welcome message from author
This document is posted to help you gain knowledge. Please leave a comment to let me know what you think about it! Share it to your friends and learn new things together.
Transcript
Title Progressive collapse resistance of RC beam-column sub-assemblages
Author(s) Yu, Jun; Tan, Kang Hai
Citation
Yu, J., & Tan, K. H. (2010). Progressive CollapseResistance of RC Beam-Column Sub-assemblages.Design and Analysis of Protective Structures(3rd:2010:Singapore)
Date 2010
URL http://hdl.handle.net/10220/7034
Rights
© 2010 Design and Analysis of Protective Structures. This is the author created version of a work that has beenpeer reviewed and accepted for publication by Designand Analysis of Protective Structures. It incorporatesreferee’s comments but changes resulting from thepublishing process, such as copyediting, structuralformatting, may not be reflected in this document. Theofficial conference website is:http://www.cee.ntu.edu.sg/Conferences/daps2010/index.htm.
Progressive Collapse Resistance of RC Beam-Column Sub-assemblages
Jun YU 1*
, Kang Hai TAN 2
1* School of Civil and Environmental Engineering, Nanyang Technological University, Nanyang Avenue, 639798
Singapore ([email protected]) 2School of Civil and Environmental Engineering, Nanyang Technological University, Nanyang Avenue, 639798
Singapore ([email protected])
Abstract
To investigate the structural resistance of reinforced concrete frames to mitigate progressive collapse,
testing was conducted on two simplified RC beam-column sub-assemblages which were designed in accordance
with ACI 318-05, with seismic or non-seismic detailing, under middle-column-removal scenarios. The sub-
assemblages consisted of a two-span beam, a middle beam-column joint and two column stubs at both ends of
the beam. Test results show that under increasing load at the middle beam-column joint, flexural action and
compressive arch action are mobilised sequentially, followed by catenary action when the middle joint has
undergone large deformations. Plus, the resistance of compressive arch action (with large axial compression in
the beam) and catenary action (with axial tension along the beam) is greater than the flexural capacity based on
conventional sectional plastic hinge analysis. Detailed information from the embedded strain gauges on
longitudinal steel reinforcement along the whole beam was used to shed light on the development of structural
mechanisms. Moreover, interaction diagrams of axial forces and bending moments at critical sections, such as
joint interfaces and beam ends, were analysed to further illustrate different mechanisms. Finally, the analytical
methods to calculate the respective capacities of flexural action and compressive arch action are presented in this
paper.
Keywords: progressive collapse; flexural action; compressive arch action; catenary action; reinforced concrete
1. Introduction
With the threat of terrorist attack looming large, the ability of a building to mitigate progressive
collapse is of key interest to government agencies. The indirect method and the alternate load path
(ALP) method are quite popular in current building codes [1~3]. The indirect method is a descriptive
approach of providing minimum level of connectivity and integrity among various structural
components. However, the effect of the indirect method according to modern building codes [1~3] is
rarely verified by test results. The ALP method is the first proposed quantifiable model for designing
robust buildings [4]. Therefore, it can be used to check the effect of the indirect method.
In these codes, the ALP method is a quasi-static approach and is conducted for a building by
introducing a column or a bearing wall removal scenario. However, the assessment of the ultimate
capacity of a building is limited to the ultimate state of flexural mechanism, i.e. the occurrence of
plastic hinges at critical sections. Moreover, the plastic moments are computed without considering
the presence of axial forces along the beams with the supporting column removed. In fact, the
existence of beam axial forces can enhance the resistance of a local damaged building [5~6].
Therefore, this approach recommended by the codes can be too conservative.
To investigate the resistance of reinforced concrete frames to mitigate progressive collapse,
quasi-static tests were conducted on two RC beam-column sub-assemblage specimens which consisted
of a two-span beam, a middle beam-column joint and column stubs at both ends of the beam. Test
results indicated that three mechanisms of the test specimens can be mobilised sequentially to mitigate
progressive collapse, i.e. flexural action, compressive arch action and catenary action. Particularly, the
last two mechanisms are still not incorporated into current design and not well-known for designers.
This paper illustrates the development of different mechanisms through the detailed information of
strain gauge readings and sectional analyses. Finally, the analytical methods to compute the respective
capacities of flexural action and compressive arch action are presented in this paper.
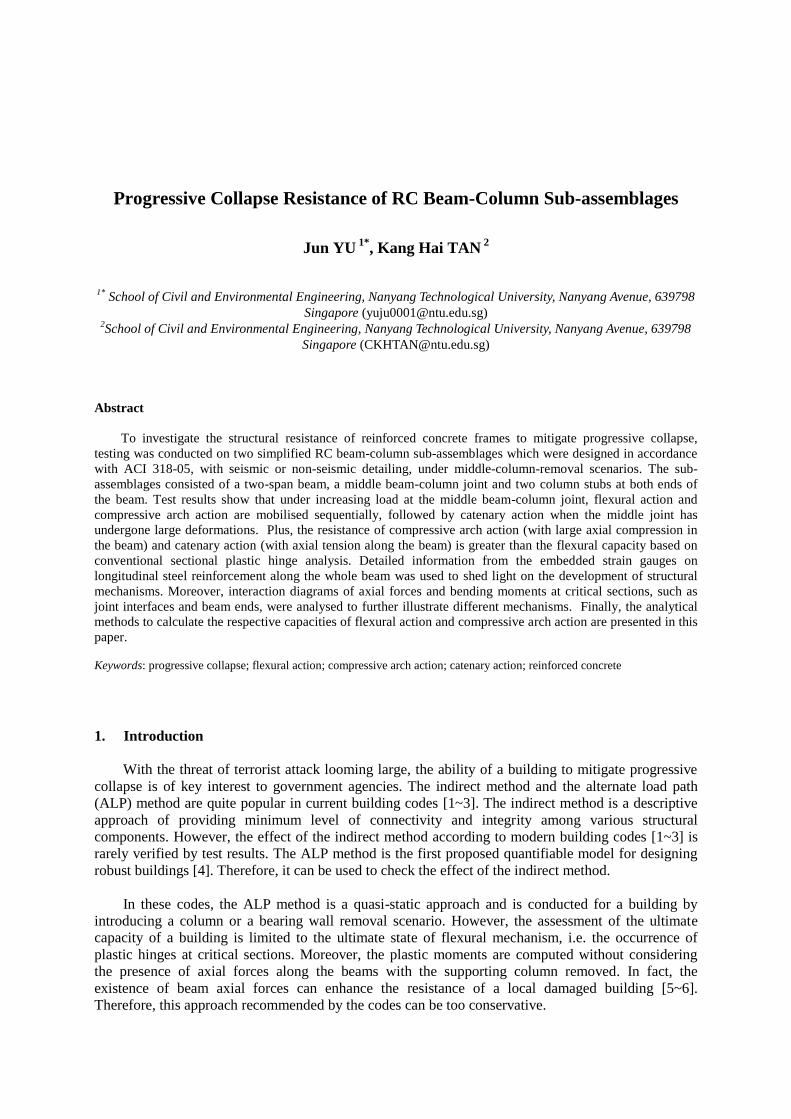
2. Test Description
The two specimens were designed in accordance with ACI 318-05 [7] with seismic and non-
seismic detailing to study the effect of the detailing of specimens on the development of different
structural mechanisms. The dimensions of the specimens and boundary conditions are shown in Fig.1.
Each end was restrained by two rods and a pin on rollers. The detailing of the specimens is shown in
Fig.2, and more information about specimen design is presented in reference 8, but the basic
information of the specimens is listed in Table 1.
L 250 L
h
P
(a) Front view
250
250
b
400
450
(b) Top view
Fig.1 Test specimens and boundary conditions
250
End stubMiddle column stub
2T10 2T10
1000 1000
400
2750 250
R6@50 R6@100 R6@50
120
60
520 500
900
1T13+2T10 2T10 1T13+2T10
(a) Seismic specimen S1
250
End stubMiddle column stub
2T10 2T10
925 925
400
2750 250
R6@100 410
120
60
900
3T10 2T10 3T10
(b) Non-Seismic specimen S2
Fig.2 The detailing of simplified beam-column sub-assemblages (unit: mm)
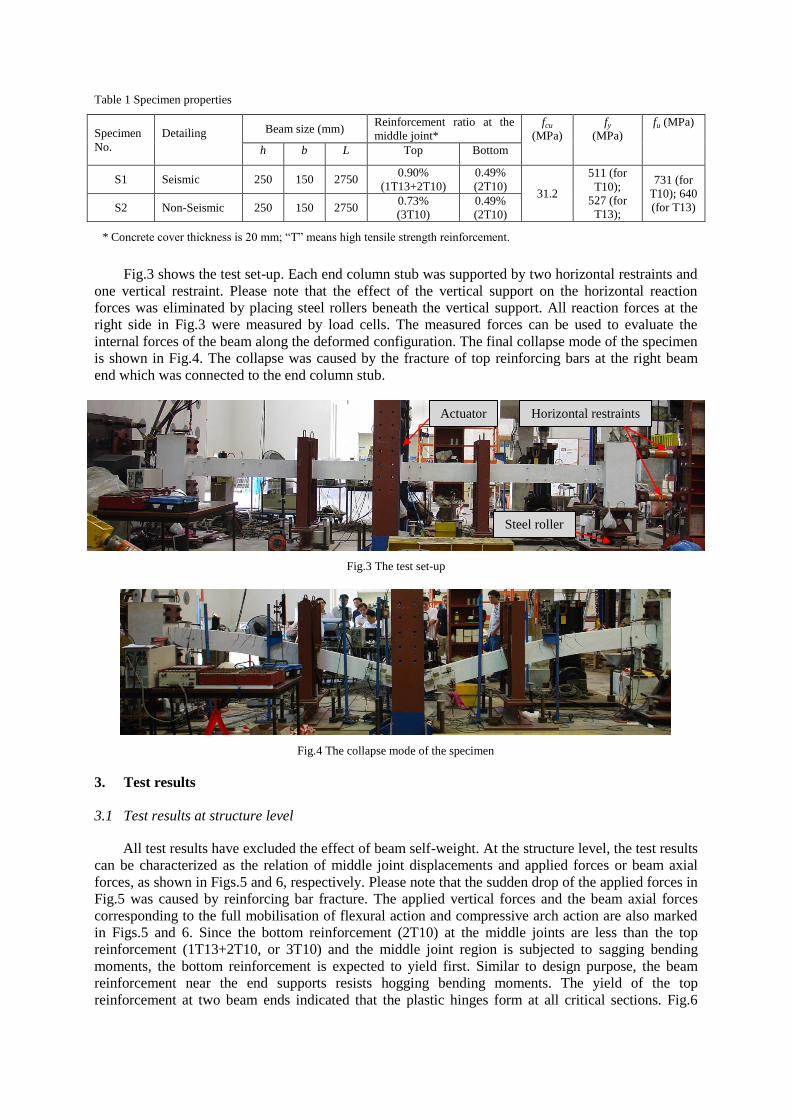
Table 1 Specimen properties
Specimen
No.
Detailing
Beam size (mm) Reinforcement ratio at the
middle joint*
fcu
(MPa)
fy
(MPa)
fu (MPa)
h b L Top Bottom
S1 Seismic 250 150 2750 0.90%
(1T13+2T10)
0.49%
(2T10) 31.2
511 (for
T10);
527 (for
T13);
731 (for
T10); 640
(for T13) S2 Non-Seismic 250 150 2750 0.73%
(3T10)
0.49%
(2T10)
* Concrete cover thickness is 20 mm; “T” means high tensile strength reinforcement.
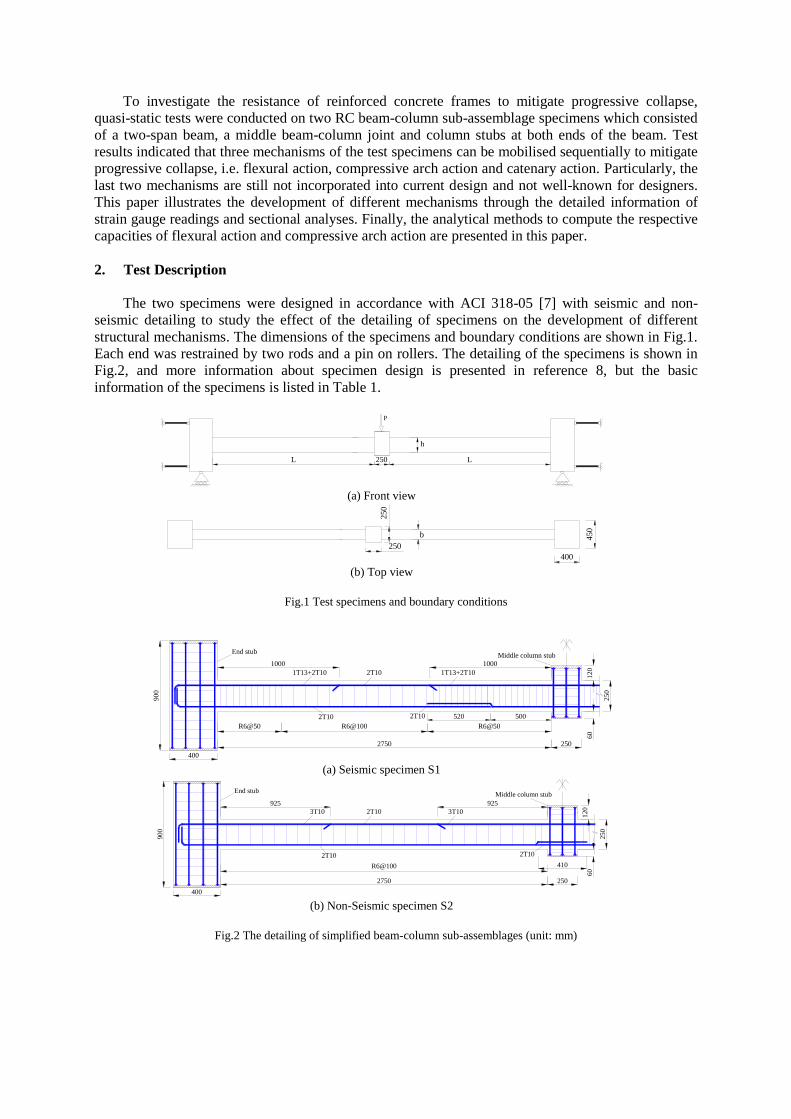
Fig.3 shows the test set-up. Each end column stub was supported by two horizontal restraints and
one vertical restraint. Please note that the effect of the vertical support on the horizontal reaction
forces was eliminated by placing steel rollers beneath the vertical support. All reaction forces at the
right side in Fig.3 were measured by load cells. The measured forces can be used to evaluate the
internal forces of the beam along the deformed configuration. The final collapse mode of the specimen
is shown in Fig.4. The collapse was caused by the fracture of top reinforcing bars at the right beam
end which was connected to the end column stub.
Fig.3 The test set-up
Fig.4 The collapse mode of the specimen
3. Test results
3.1 Test results at structure level
All test results have excluded the effect of beam self-weight. At the structure level, the test results
can be characterized as the relation of middle joint displacements and applied forces or beam axial
forces, as shown in Figs.5 and 6, respectively. Please note that the sudden drop of the applied forces in
Fig.5 was caused by reinforcing bar fracture. The applied vertical forces and the beam axial forces
corresponding to the full mobilisation of flexural action and compressive arch action are also marked
in Figs.5 and 6. Since the bottom reinforcement (2T10) at the middle joints are less than the top
reinforcement (1T13+2T10, or 3T10) and the middle joint region is subjected to sagging bending
moments, the bottom reinforcement is expected to yield first. Similar to design purpose, the beam
reinforcement near the end supports resists hogging bending moments. The yield of the top
reinforcement at two beam ends indicated that the plastic hinges form at all critical sections. Fig.6
Horizontal restraints
Steel roller
Actuator
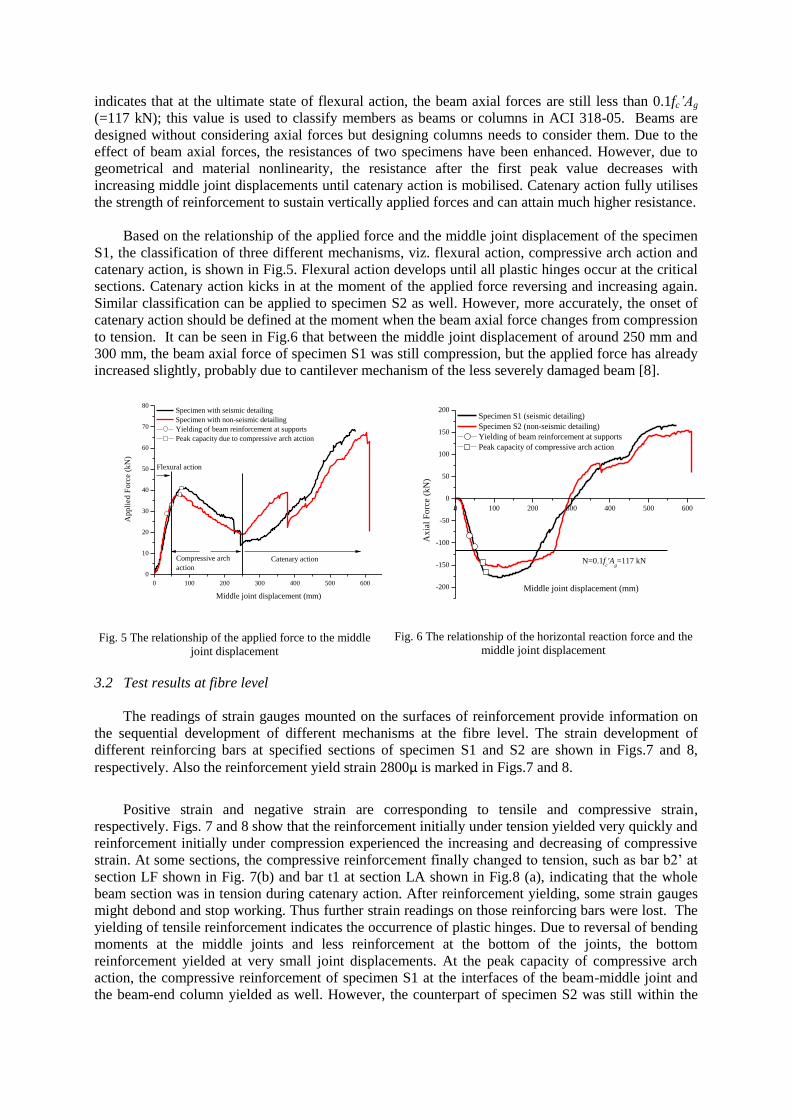
indicates that at the ultimate state of flexural action, the beam axial forces are still less than 0.1fc’Ag
(=117 kN); this value is used to classify members as beams or columns in ACI 318-05. Beams are
designed without considering axial forces but designing columns needs to consider them. Due to the
effect of beam axial forces, the resistances of two specimens have been enhanced. However, due to
geometrical and material nonlinearity, the resistance after the first peak value decreases with
increasing middle joint displacements until catenary action is mobilised. Catenary action fully utilises
the strength of reinforcement to sustain vertically applied forces and can attain much higher resistance.
Based on the relationship of the applied force and the middle joint displacement of the specimen
S1, the classification of three different mechanisms, viz. flexural action, compressive arch action and
catenary action, is shown in Fig.5. Flexural action develops until all plastic hinges occur at the critical
sections. Catenary action kicks in at the moment of the applied force reversing and increasing again.
Similar classification can be applied to specimen S2 as well. However, more accurately, the onset of
catenary action should be defined at the moment when the beam axial force changes from compression
to tension. It can be seen in Fig.6 that between the middle joint displacement of around 250 mm and
300 mm, the beam axial force of specimen S1 was still compression, but the applied force has already
increased slightly, probably due to cantilever mechanism of the less severely damaged beam [8].
0 100 200 300 400 500 600
0
10
20
30
40
50
60
70
80
Flexural action
Compressive arch
action
Ap
pli
ed
Fo
rce (
kN
)
Middle joint displacement (mm)
Specimen with seismic detailing
Specimen with non-seismic detailing
Yielding of beam reinforcement at supports
Peak capacity due to compressive arch atction
Catenary action
Fig. 5 The relationship of the applied force to the middle
joint displacement
0 100 200 300 400 500 600
-200
-150
-100
-50
0
50
100
150
200
Ax
ial
Fo
rce (
kN
)
Middle joint displacement (mm)
Specimen S1 (seismic detailing)
Specimen S2 (non-seismic detailing)
Yielding of beam reinforcement at supports
Peak capacity of compressive arch action
N=0.1fc'A
g=117 kN
Fig. 6 The relationship of the horizontal reaction force and the
middle joint displacement
3.2 Test results at fibre level
The readings of strain gauges mounted on the surfaces of reinforcement provide information on
the sequential development of different mechanisms at the fibre level. The strain development of
different reinforcing bars at specified sections of specimen S1 and S2 are shown in Figs.7 and 8,
respectively. Also the reinforcement yield strain 2800μ is marked in Figs.7 and 8.
Positive strain and negative strain are corresponding to tensile and compressive strain,
respectively. Figs. 7 and 8 show that the reinforcement initially under tension yielded very quickly and
reinforcement initially under compression experienced the increasing and decreasing of compressive
strain. At some sections, the compressive reinforcement finally changed to tension, such as bar b2’ at
section LF shown in Fig. 7(b) and bar t1 at section LA shown in Fig.8 (a), indicating that the whole
beam section was in tension during catenary action. After reinforcement yielding, some strain gauges
might debond and stop working. Thus further strain readings on those reinforcing bars were lost. The
yielding of tensile reinforcement indicates the occurrence of plastic hinges. Due to reversal of bending
moments at the middle joints and less reinforcement at the bottom of the joints, the bottom
reinforcement yielded at very small joint displacements. At the peak capacity of compressive arch
action, the compressive reinforcement of specimen S1 at the interfaces of the beam-middle joint and
the beam-end column yielded as well. However, the counterpart of specimen S2 was still within the
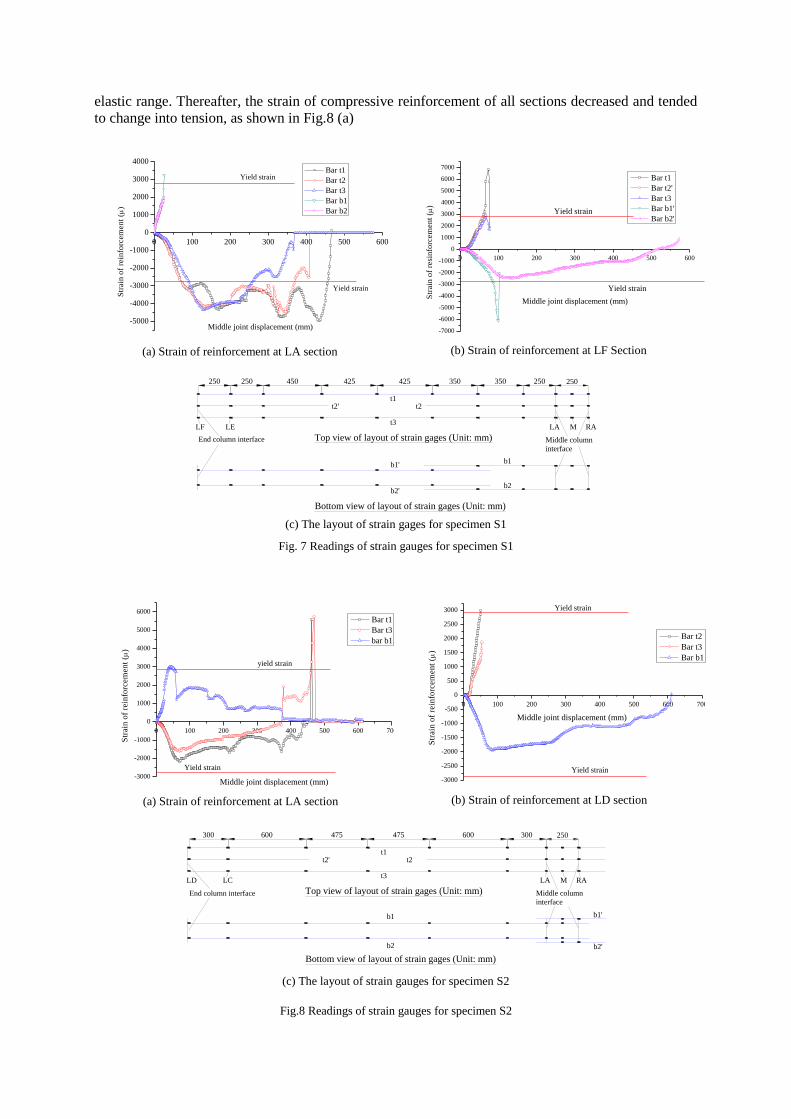
elastic range. Thereafter, the strain of compressive reinforcement of all sections decreased and tended
to change into tension, as shown in Fig.8 (a)
0 100 200 300 400 500 600
-5000
-4000
-3000
-2000
-1000
0
1000
2000
3000
4000
Yield strain
Str
ain
of
rein
forc
em
en
t (
)
Bar t1
Bar t2
Bar t3
Bar b1
Bar b2
Yield strain
Middle joint displacement (mm)
(a) Strain of reinforcement at LA section
0 100 200 300 400 500 600
-7000
-6000
-5000
-4000
-3000
-2000
-1000
0
1000
2000
3000
4000
5000
6000
7000
Str
ain
of
resi
nfo
rcem
en
t (
)
Middle joint displacement (mm)
Bar t1
Bar t2'
Bar t3
Bar b1'
Bar b2'Yield strain
Yield strain
(b) Strain of reinforcement at LF Section
250350350
Top view of layout of strain gages (Unit: mm)
Bottom view of layout of strain gages (Unit: mm)
425425450250250
Middle column
interface
End column interface
250
t1t2
t3
b1
b2'
t2'
LA RAM
b1'
b2
LELF
(c) The layout of strain gages for specimen S1
Fig. 7 Readings of strain gauges for specimen S1
0 100 200 300 400 500 600 700
-3000
-2000
-1000
0
1000
2000
3000
4000
5000
6000
Str
ain
of
rein
forc
em
en
t (
)
Middle joint displacement (mm)
Bar t1
Bar t3
bar b1
yield strain
Yield strain
(a) Strain of reinforcement at LA section
0 100 200 300 400 500 600 700
-3000
-2500
-2000
-1500
-1000
-500
0
500
1000
1500
2000
2500
3000
Str
ain
of
rein
forc
em
en
t (
)
Middle joint displacement (mm)
Bar t2
Bar t3
Bar b1
Yield strain
Yield strain
(b) Strain of reinforcement at LD section
300600
Top view of layout of strain gages (Unit: mm)
Bottom view of layout of strain gages (Unit: mm)
475475600300
Middle column
interfaceEnd column interface
250
t1t2
t3
b1
b2'
t2'
LA RAM
b1'
b2
LCLD
(c) The layout of strain gauges for specimen S2
Fig.8 Readings of strain gauges for specimen S2
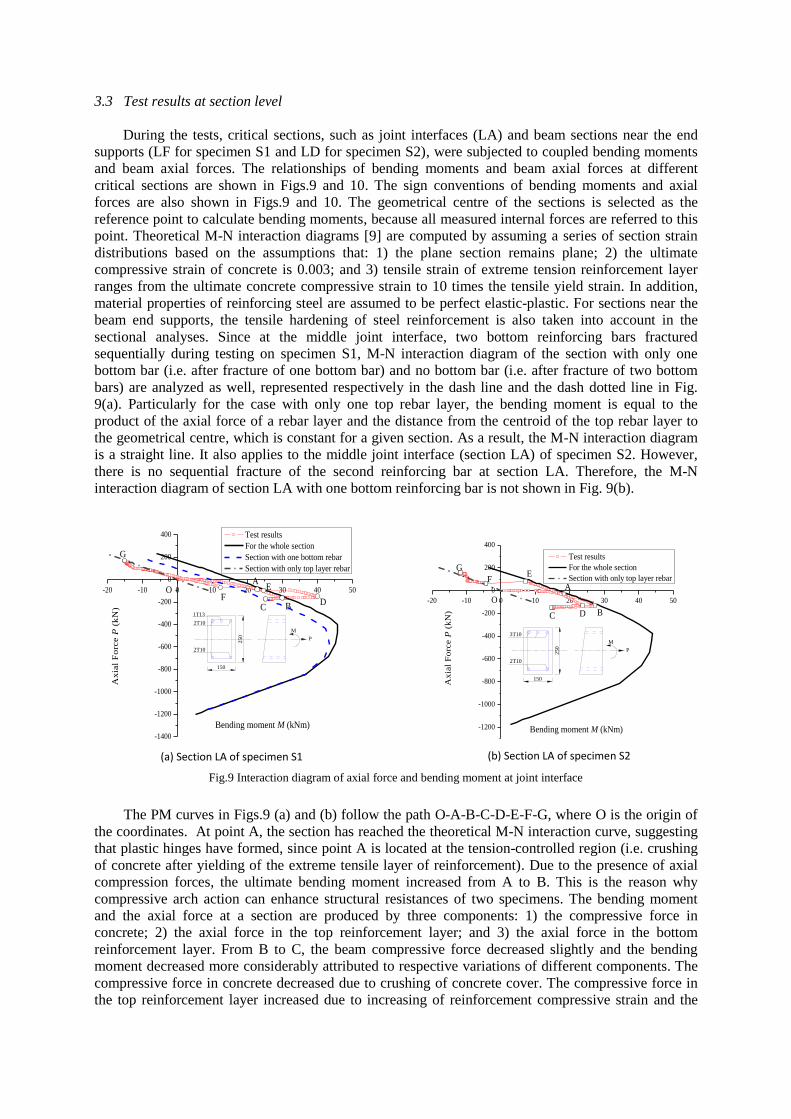
3.3 Test results at section level
During the tests, critical sections, such as joint interfaces (LA) and beam sections near the end
supports (LF for specimen S1 and LD for specimen S2), were subjected to coupled bending moments
and beam axial forces. The relationships of bending moments and beam axial forces at different
critical sections are shown in Figs.9 and 10. The sign conventions of bending moments and axial
forces are also shown in Figs.9 and 10. The geometrical centre of the sections is selected as the
reference point to calculate bending moments, because all measured internal forces are referred to this
point. Theoretical M-N interaction diagrams [9] are computed by assuming a series of section strain
distributions based on the assumptions that: 1) the plane section remains plane; 2) the ultimate
compressive strain of concrete is 0.003; and 3) tensile strain of extreme tension reinforcement layer
ranges from the ultimate concrete compressive strain to 10 times the tensile yield strain. In addition,
material properties of reinforcing steel are assumed to be perfect elastic-plastic. For sections near the
beam end supports, the tensile hardening of steel reinforcement is also taken into account in the
sectional analyses. Since at the middle joint interface, two bottom reinforcing bars fractured
sequentially during testing on specimen S1, M-N interaction diagram of the section with only one
bottom bar (i.e. after fracture of one bottom bar) and no bottom bar (i.e. after fracture of two bottom
bars) are analyzed as well, represented respectively in the dash line and the dash dotted line in Fig.
9(a). Particularly for the case with only one top rebar layer, the bending moment is equal to the
product of the axial force of a rebar layer and the distance from the centroid of the top rebar layer to
the geometrical centre, which is constant for a given section. As a result, the M-N interaction diagram
is a straight line. It also applies to the middle joint interface (section LA) of specimen S2. However,
there is no sequential fracture of the second reinforcing bar at section LA. Therefore, the M-N
interaction diagram of section LA with one bottom reinforcing bar is not shown in Fig. 9(b).
Fig.9 Interaction diagram of axial force and bending moment at joint interface
The PM curves in Figs.9 (a) and (b) follow the path O-A-B-C-D-E-F-G, where O is the origin of
the coordinates. At point A, the section has reached the theoretical M-N interaction curve, suggesting
that plastic hinges have formed, since point A is located at the tension-controlled region (i.e. crushing
of concrete after yielding of the extreme tensile layer of reinforcement). Due to the presence of axial
compression forces, the ultimate bending moment increased from A to B. This is the reason why
compressive arch action can enhance structural resistances of two specimens. The bending moment
and the axial force at a section are produced by three components: 1) the compressive force in
concrete; 2) the axial force in the top reinforcement layer; and 3) the axial force in the bottom
reinforcement layer. From B to C, the beam compressive force decreased slightly and the bending
moment decreased more considerably attributed to respective variations of different components. The
compressive force in concrete decreased due to crushing of concrete cover. The compressive force in
the top reinforcement layer increased due to increasing of reinforcement compressive strain and the
-20 -10 0 10 20 30 40 50
-1400
-1200
-1000
-800
-600
-400
-200
0
200
400
Ax
ial
Fo
rce P
(k
N)
Test results
For the whole section
Section with one bottom rebar
Section with only top layer rebar
Bending moment M (kNm)
A
BCD
EF
G
O
150
250
P
M
2T10
2T10
1T13
(a) Section LA of specimen S1
-20 -10 0 10 20 30 40 50
-1200
-1000
-800
-600
-400
-200
0
200
400
Ax
ial
Fo
rce P
(k
N)
Test results
For the whole section
Section with only top layer rebar
Bending moment M (kNm)
A
BC D
EF
G
O
150
250
P
M
2T10
3T10
(b) Section LA of specimen S2
tension force in the bottom reinforcement layer remained unchanged due to increased reinforcement
tensile strain still at yielding plateau. Moreover, the reduced compressive force in concrete was less
than the increased compressive force in top reinforcement, resulting in the axial compression increased
slightly from B to C. However, the bending moment decreased more considerably because of the
larger lever arms of the concrete compressive force and the smaller lever arms of the reinforcement
compressive force. From C to D, the combination of these three components gave a slightly reduced
beam axial compression and an increased bending moment. The tension force in the bottom
reinforcement increased due to tension hardening. The compressive force in concrete increased due to
confinement effect and the compressive force in the top layer reinforcement decreased slightly due to
a slight reduction of reinforcement compressive strain when the middle joint displacement was
between 100 and 200 mm as shown in Figs.7(a) and 8(a). Please note that due to tension hardening of
reinforcement and confinement effect on concrete, the coupled bending moment and beam axial force
can even exceed the computed M-N interaction diagram of specimen S1. Since the confinement effect
of specimen S1 (seismic-detailing) was greater than that of specimen S2 (non-seismic detailing), the
middle joint interface of S1 could sustain a much greater bending moment (around 40 kNm at point D)
than that of S2 (around 23 kNm at point D) . From the path D to E for S1, one bottom reinforcing bar
fractured and the PM curve regressed towards the theoretical M-N interaction diagram of the section
with one bottom reinforcing bar. However, before reaching that theoretical curve, another bottom bar
fractured, as shown from E to F in Fig.9 (a). Eventually, the section contained only the top layer
reinforcement. For specimen S2, only one bottom reinforcing bar fractured as shown from point E to F
in Fig.9 (b), but another bottom bar failed without fracture. Within the path FG, the bending moment
was merely caused by the tension centroid not coinciding with the reference point.
0 10 20 30 40 50
-1200
-1000
-800
-600
-400
-200
0
200
400
Ax
ial
forc
e P
(k
N)
Section LF
Section LE
w/ considering steel hardening
w/o considering steel hardening
Bending moment M (kNm)
(a) Seismic detailing specimen S1
0 10 20 30 40 50
-1200
-1000
-800
-600
-400
-200
0
200
400
Ax
ial
forc
e P
(k
N)
Beam end
250 mm to beam end
w/ considering steel hardening
w/o considering steel hardening
Bending moment M (kNm)
(b) Non-seismic detailing specimen S2
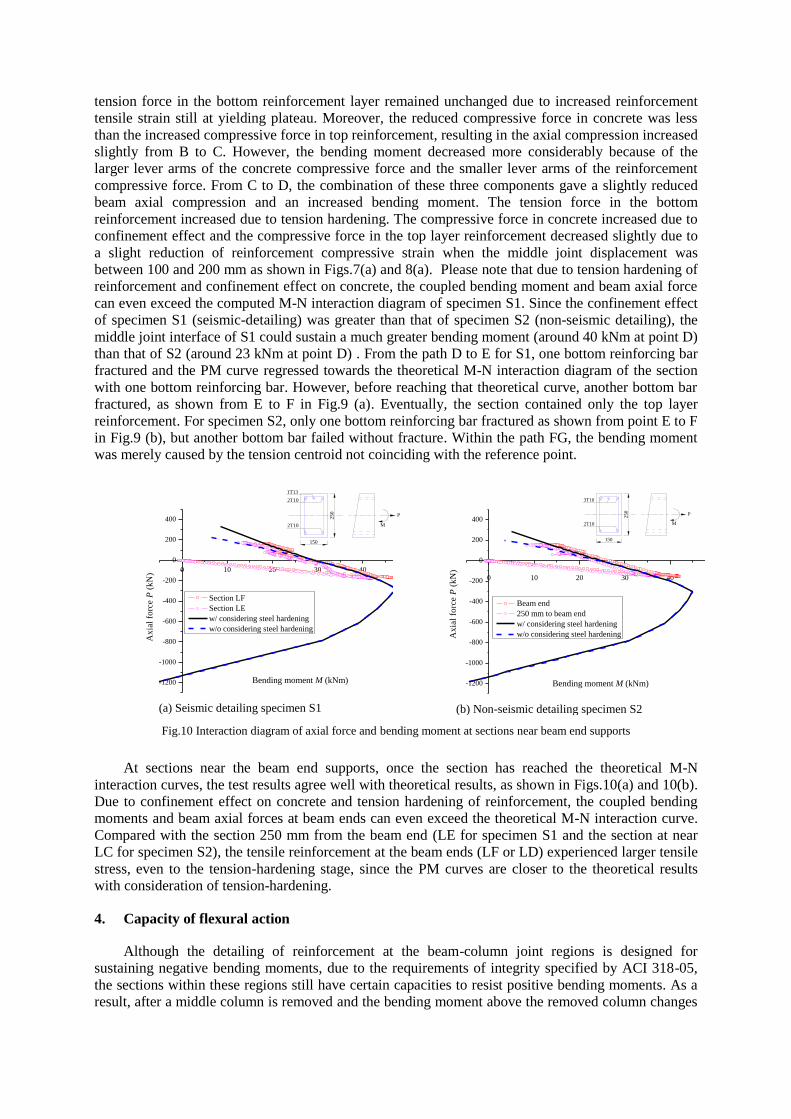
Fig.10 Interaction diagram of axial force and bending moment at sections near beam end supports
At sections near the beam end supports, once the section has reached the theoretical M-N
interaction curves, the test results agree well with theoretical results, as shown in Figs.10(a) and 10(b).
Due to confinement effect on concrete and tension hardening of reinforcement, the coupled bending
moments and beam axial forces at beam ends can even exceed the theoretical M-N interaction curve.
Compared with the section 250 mm from the beam end (LE for specimen S1 and the section at near
LC for specimen S2), the tensile reinforcement at the beam ends (LF or LD) experienced larger tensile
stress, even to the tension-hardening stage, since the PM curves are closer to the theoretical results
with consideration of tension-hardening.
4. Capacity of flexural action
Although the detailing of reinforcement at the beam-column joint regions is designed for
sustaining negative bending moments, due to the requirements of integrity specified by ACI 318-05,
the sections within these regions still have certain capacities to resist positive bending moments. As a
result, after a middle column is removed and the bending moment above the removed column changes
150
250
P
2T10
2T10
1T13
M
150
25
0
P
2T10
3T10
M
its direction, flexural action can sustain certain external loads. The capacity of flexural action is
determined by the yielding moments at critical sections without considering the existence of beam
axial forces. In this case, the plastic hinges occurred at the middle beam-column joint interface and the
beam-end column stub interface. The positive bending moment of the middle beam-column joint
interface is denoted as Mnm, and the negative bending moment of the beam-end column stub interface
is denoted as Mne. Then the capacity of flexural action can be computed as
2 /fu nm neP M M L (1)
where L is shown in Fig.1; Mnm and Mne are nominal bending moments of specified sections without
considering the strength reduction factors specified by building codes.
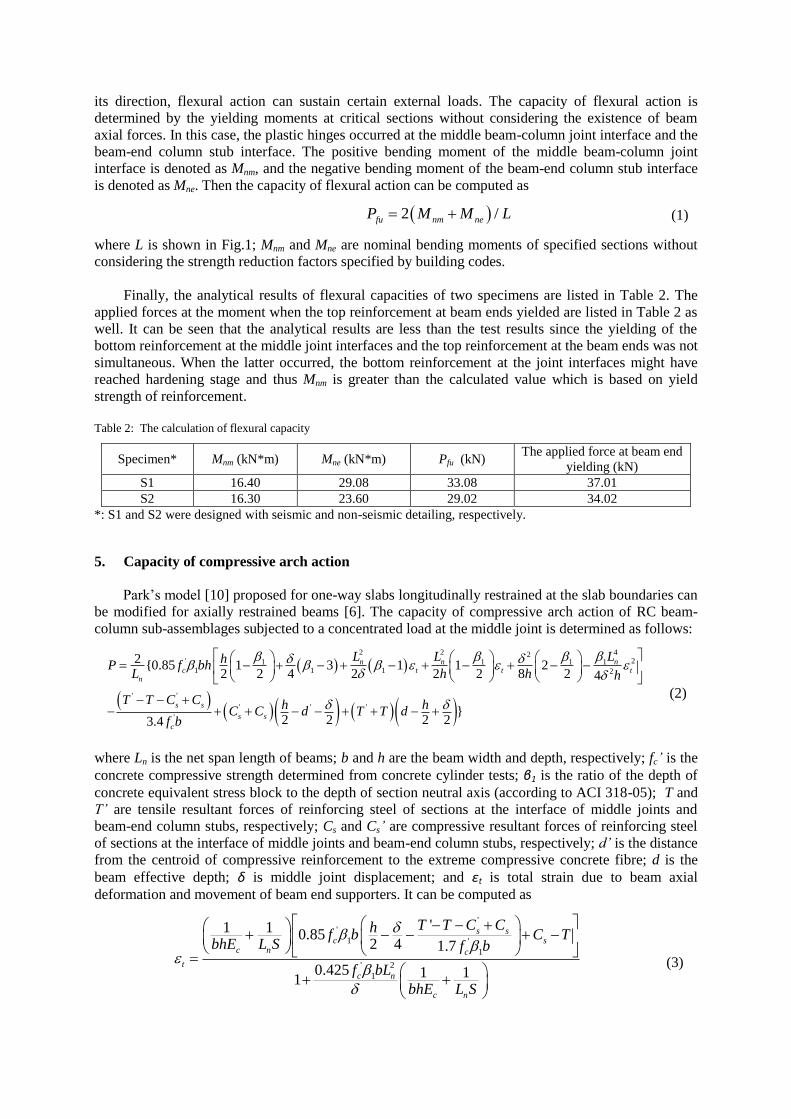
Finally, the analytical results of flexural capacities of two specimens are listed in Table 2. The
applied forces at the moment when the top reinforcement at beam ends yielded are listed in Table 2 as
well. It can be seen that the analytical results are less than the test results since the yielding of the
bottom reinforcement at the middle joint interfaces and the top reinforcement at the beam ends was not
simultaneous. When the latter occurred, the bottom reinforcement at the joint interfaces might have
reached hardening stage and thus Mnm is greater than the calculated value which is based on yield
strength of reinforcement.
Table 2: The calculation of flexural capacity
Specimen* Mnm (kN*m) Mne (kN*m) Pfu (kN) The applied force at beam end
yielding (kN)
S1 16.40 29.08 33.08 37.01
S2 16.30 23.60 29.02 34.02
*: S1 and S2 were designed with seismic and non-seismic detailing, respectively.
5. Capacity of compressive arch action
Park’s model [10] proposed for one-way slabs longitudinally restrained at the slab boundaries can
be modified for axially restrained beams [6]. The capacity of compressive arch action of RC beam-
column sub-assemblages subjected to a concentrated load at the middle joint is determined as follows:
2 2 42' 211 1 1
1 1 1 2
' '
' ' '
'
2{0.85 1 3 1 1 2
2 2 4 2 2 2 8 2 4
}2 2 2 23.4
n n nc t t t
n
s s
s s
c
L L LhP f bh
L h h h
T T C C h hC C d T T d
f b
(2)
where Ln is the net span length of beams; b and h are the beam width and depth, respectively; fc’ is the
concrete compressive strength determined from concrete cylinder tests; β1 is the ratio of the depth of
concrete equivalent stress block to the depth of section neutral axis (according to ACI 318-05); T and
T’ are tensile resultant forces of reinforcing steel of sections at the interface of middle joints and
beam-end column stubs, respectively; Cs and Cs’ are compressive resultant forces of reinforcing steel
of sections at the interface of middle joints and beam-end column stubs, respectively; d’ is the distance
from the centroid of compressive reinforcement to the extreme compressive concrete fibre; d is the
beam effective depth; δ is middle joint displacement; and εt is total strain due to beam axial
deformation and movement of beam end supporters. It can be computed as
''
1 '
1
' 2
1
'1 10.85
2 4 1.7
0.425 1 11
s sc s
c n c
t
c n
c n
T T C Chf b C T
bhE L S f b
f bL
bhE L S
(3)
where S is the stiffness of horizontal restraints, and Ec is elastic modulus of concrete.
Based on reinforcement strains obtained in the tests, as shown in Figs.6 and 7, T and T’ can be
determined according to yield strength of steel reinforcement. However, there is no convincing proof
to determine Cs and Cs’ based on yield strength. For convenience, Cs and Cs’ are tentatively calculated
based on yield strength.
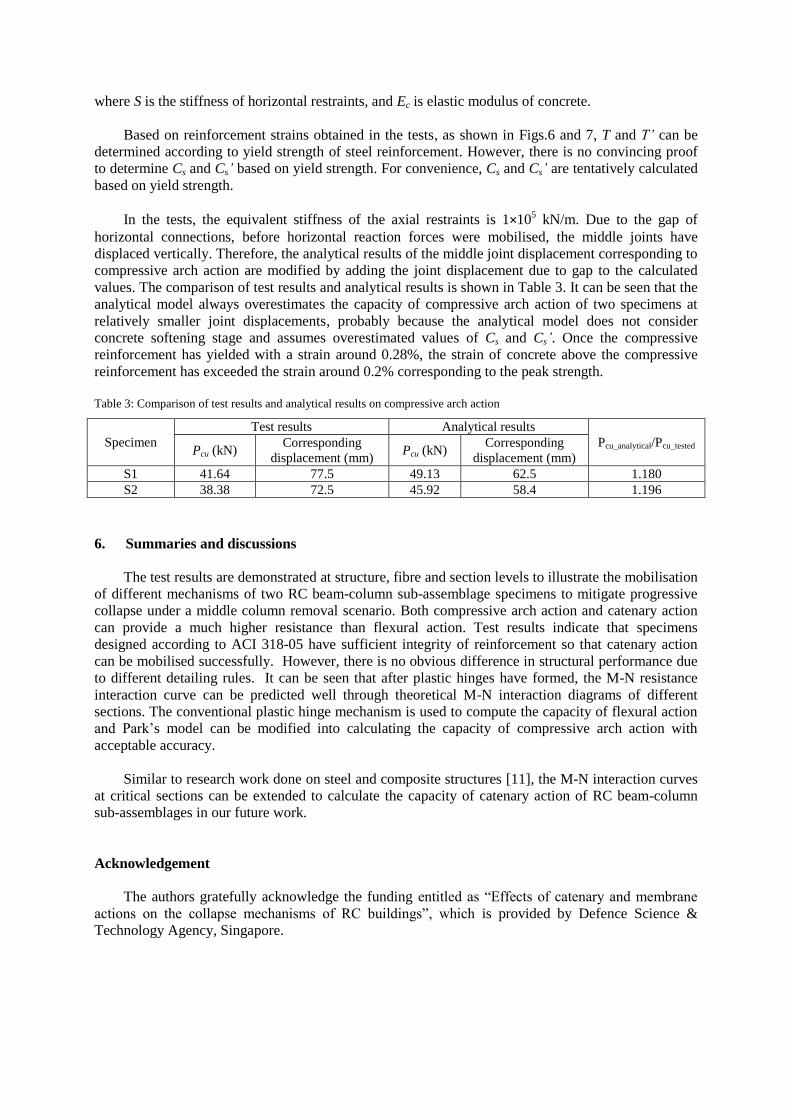
In the tests, the equivalent stiffness of the axial restraints is 1×10⁵ kN/m. Due to the gap of
horizontal connections, before horizontal reaction forces were mobilised, the middle joints have
displaced vertically. Therefore, the analytical results of the middle joint displacement corresponding to
compressive arch action are modified by adding the joint displacement due to gap to the calculated
values. The comparison of test results and analytical results is shown in Table 3. It can be seen that the
analytical model always overestimates the capacity of compressive arch action of two specimens at
relatively smaller joint displacements, probably because the analytical model does not consider
concrete softening stage and assumes overestimated values of Cs and Cs’. Once the compressive
reinforcement has yielded with a strain around 0.28%, the strain of concrete above the compressive
reinforcement has exceeded the strain around 0.2% corresponding to the peak strength.
Table 3: Comparison of test results and analytical results on compressive arch action
Specimen
Test results Analytical results
Pcu_analytical/Pcu_tested Pcu (kN) Corresponding
displacement (mm) Pcu (kN)
Corresponding
displacement (mm)
S1 41.64 77.5 49.13 62.5 1.180
S2 38.38 72.5 45.92 58.4 1.196
6. Summaries and discussions
The test results are demonstrated at structure, fibre and section levels to illustrate the mobilisation
of different mechanisms of two RC beam-column sub-assemblage specimens to mitigate progressive
collapse under a middle column removal scenario. Both compressive arch action and catenary action
can provide a much higher resistance than flexural action. Test results indicate that specimens
designed according to ACI 318-05 have sufficient integrity of reinforcement so that catenary action
can be mobilised successfully. However, there is no obvious difference in structural performance due
to different detailing rules. It can be seen that after plastic hinges have formed, the M-N resistance
interaction curve can be predicted well through theoretical M-N interaction diagrams of different
sections. The conventional plastic hinge mechanism is used to compute the capacity of flexural action
and Park’s model can be modified into calculating the capacity of compressive arch action with
acceptable accuracy.
Similar to research work done on steel and composite structures [11], the M-N interaction curves
at critical sections can be extended to calculate the capacity of catenary action of RC beam-column
sub-assemblages in our future work.
Acknowledgement
The authors gratefully acknowledge the funding entitled as “Effects of catenary and membrane
actions on the collapse mechanisms of RC buildings”, which is provided by Defence Science &
Technology Agency, Singapore.
REFERENCES
[1] American Society of Civil Engineers (ASCE)., Minimum Design Loads for Buildings and Other
Structures, ASCE/SEI 7-05, American Society of Civil Engineers, Reston, Virginia, 2005.
[2] General Services Administration (GSA)., Progressive Collapse Analysis and Design Guidelines
for New Federal Office Buildings and Major Modernization Projects, Washington, DC, 2003
[3] Department of Defense (DOD)., Design of Buildings to Resist Progressive Collapse. Unified
Facilities Criteria (UFC) 4-023-03, 25 January, 2005.
[4] Gurley, C. R., Progressive Collapse and Earthquake Resistance, Practice Periodical on Structural
Design and Construction, V.13, No.1, pp. 19-23, February 2008.
[5] Orton, S. L., Development of a CFRP System to Provide Continuity in Existing Reinforced
Concrete Buildings Vulnerable to Progressive Collapse, Austin, University of Texas. Doctor of
Philosophy, 2007.
[6] Su, Y. P., Tian, Y., and Song, X.S., Progressive collapse resistance of axially-restrained frame
beams, ACI Structural Journal, V. 106, N.5, pp. 600-607, September-October 2009.
[7] ACI Committee 318., Building Code Requirements for Structural Concrete (ACI 318-05),
American Concrete Institute, Farmington Hills, Michigan, 2005.
[8] Yu J., and Tan K. H. Experimental study on catenary action of RC beam-column sub-
assemblages, 3 rd fib International Congress 2010, Washington D. C. (submitted)
[9] MacGregor, J. G., and Wight, J. K., Reinforced concrete mechanics and design. 4th Edition in SI
Units, Princeton Hall, 1111 pp, 2006.
[10] Park, R., and Gamble, W. L., Reinforced concrete slabs, 2nd
edition, John Wiley & Sons, 716 pp,
2000.
[11] Demonceau, J. F., Steel and composite building frames: sway response under conventional
loading and development of membrane effects in beams further to an exceptional action, Faculte
des Sciences Appliquees. Liege, Belgium, University of Liege. Doctor of Philosophy, 2007.
Speaker’s biography
Yu Jun is a Ph.D. Student in School of Civil & Environmental Engineering, Nanyang
Technological University, Singapore. He received his BS (Eng) and MS (Eng) from Zhejiang
University, China. His research interests are testing and numerical modeling on progressive collapse
analysis of reinforced concrete structures subjected to extreme loadings.
Related Documents