Three-Wall Segment (TriSeg) Model Describing Mechanics and Hemodynamics of Ventricular Interaction JOOST LUMENS, 1,2 TAMMO DELHAAS, 1 BORUT KIRN, 2,3 and THEO ARTS 2 1 Department of Physiology, Cardiovascular Research Institute Maastricht (CARIM), Maastricht University, PO Box 616, 6200 MD Maastricht, The Netherlands; 2 Department of Biomedical Engineering, Cardiovascular Research Institute Maastricht (CARIM), Maastricht University, Maastricht, The Netherlands; and 3 Institute of Physiology, School of Medicine, University of Ljubljana, Ljubljana, Slovenia (Received 26 November 2008; accepted 30 July 2009; published online 29 August 2009) Abstract—A mathematical model (TriSeg model) of ventric- ular mechanics incorporating mechanical interaction of the left and right ventricular free walls and the interventricular septum is presented. Global left and right ventricular pump mechanics were related to representative myofiber mechanics in the three ventricular walls, satisfying the principle of conservation of energy. The walls were mechanically coupled satisfying tensile force equilibrium in the junction. Wall sizes and masses were rendered by adaptation to normalize mechanical myofiber load to physiological standard levels. The TriSeg model was implemented in the previously published lumped closed-loop CircAdapt model of heart and circulation. Simulation results of cardiac mechanics and hemodynamics during normal ventricular loading, acute pulmonary hypertension, and chronic pulmonary hyperten- sion (including load adaptation) agreed with clinical data as obtained in healthy volunteers and pulmonary hypertension patients. In chronic pulmonary hypertension, the model predicted right ventricular free wall hypertrophy, increased systolic pulmonary flow acceleration, and increased right ventricular isovolumic contraction and relaxation times. Furthermore, septal curvature decreased linearly with its transmural pressure difference. In conclusion, the TriSeg model enables realistic simulation of ventricular mechanics including interaction between left and right ventricular pump mechanics, dynamics of septal geometry, and myofiber mechanics in the three ventricular walls. Keywords—Pulmonary hypertension, Septal motion, Adap- tation, Stress, Strain, Myofiber, Cardiac mechanics. NOMENCLATURE General LV Left ventricle/ventricular RV Right ventricle/ventricular LW Left ventricular free wall SW Septal wall RW Right ventricular free wall Geometry-Related Parameters V LV Left ventricular cavity volume (m 3 ) V RV Right ventricular cavity volume (m 3 ) V w Wall volume of ventricular wall segment (m 3 ) V m Volume of spherical cap, formed by midwall surface of wall segment (m 3 ) A m Midwall surface area of curved wall segment (m 2 ) C m Curvature of midwall surface (reciprocal of radius) (m 1 ) x m Maximal axial distance from midwall sur- face to origin (m) y m Radius of midwall junction circle (m) z Ratio of wall thickness to midwall radius of curvature of curved wall segment a Half the opening angle of spherical midwall surface e f Natural myofiber strain Force-Related Parameters p LV Left ventricular cavity pressure (Pa) p RV Right ventricular cavity pressure (Pa) p Trans Transmural pressure difference across curved wall segment (Pa) r f Cauchy myofiber stress (Pa) T m Representative midwall tension (N m 1 ) T x Axial midwall tension component (N m 1 ) T y Radial midwall tension component (N m 1 ) INTRODUCTION The left (LV) and right (RV) ventricular cavities of the normal human heart are separated from the Address correspondence to Joost Lumens, Department of Phys- iology, Cardiovascular Research Institute Maastricht (CARIM), Maastricht University, PO Box 616, 6200 MD Maastricht, The Netherlands. Electronic mail: [email protected] Annals of Biomedical Engineering, Vol. 37, No. 11, November 2009 (Ó 2009) pp. 2234–2255 DOI: 10.1007/s10439-009-9774-2 0090-6964/09/1100-2234/0 Ó 2009 The Author(s). This article is published with open access at Springerlink.com 2234

Welcome message from author
This document is posted to help you gain knowledge. Please leave a comment to let me know what you think about it! Share it to your friends and learn new things together.
Transcript

Three-Wall Segment (TriSeg) Model Describing Mechanics
and Hemodynamics of Ventricular Interaction
JOOST LUMENS,1,2 TAMMO DELHAAS,1 BORUT KIRN,2,3 and THEO ARTS2
1Department of Physiology, Cardiovascular Research Institute Maastricht (CARIM), Maastricht University, PO Box 616,6200 MD Maastricht, The Netherlands; 2Department of Biomedical Engineering, Cardiovascular Research Institute Maastricht(CARIM), Maastricht University, Maastricht, The Netherlands; and 3Institute of Physiology, School of Medicine, University
of Ljubljana, Ljubljana, Slovenia
(Received 26 November 2008; accepted 30 July 2009; published online 29 August 2009)
Abstract—A mathematical model (TriSeg model) of ventric-ular mechanics incorporating mechanical interaction of theleft and right ventricular free walls and the interventricularseptum is presented. Global left and right ventricular pumpmechanics were related to representative myofiber mechanicsin the three ventricular walls, satisfying the principle ofconservation of energy. The walls were mechanically coupledsatisfying tensile force equilibrium in the junction. Wall sizesand masses were rendered by adaptation to normalizemechanical myofiber load to physiological standard levels.The TriSeg model was implemented in the previouslypublished lumped closed-loop CircAdapt model of heartand circulation. Simulation results of cardiac mechanics andhemodynamics during normal ventricular loading, acutepulmonary hypertension, and chronic pulmonary hyperten-sion (including load adaptation) agreed with clinical data asobtained in healthy volunteers and pulmonary hypertensionpatients. In chronic pulmonary hypertension, the modelpredicted right ventricular free wall hypertrophy, increasedsystolic pulmonary flow acceleration, and increased rightventricular isovolumic contraction and relaxation times.Furthermore, septal curvature decreased linearly with itstransmural pressure difference. In conclusion, the TriSegmodel enables realistic simulation of ventricular mechanicsincluding interaction between left and right ventricular pumpmechanics, dynamics of septal geometry, and myofibermechanics in the three ventricular walls.
Keywords—Pulmonary hypertension, Septal motion, Adap-
tation, Stress, Strain, Myofiber, Cardiac mechanics.
NOMENCLATURE
General
LV Left ventricle/ventricularRV Right ventricle/ventricular
LW Left ventricular free wallSW Septal wallRW Right ventricular free wall
Geometry-Related Parameters
VLV Left ventricular cavity volume (m3)VRV Right ventricular cavity volume (m3)Vw Wall volume of ventricular wall segment (m3)Vm Volume of spherical cap, formed by
midwall surface of wall segment (m3)Am Midwall surface area of curved wall
segment (m2)Cm Curvature of midwall surface (reciprocal of
radius) (m�1)xm Maximal axial distance from midwall sur-
face to origin (m)ym Radius of midwall junction circle (m)z Ratio of wall thickness to midwall radius of
curvature of curved wall segmenta Half the opening angle of spherical midwall
surfaceef Natural myofiber strain
Force-Related Parameters
pLV Left ventricular cavity pressure (Pa)pRV Right ventricular cavity pressure (Pa)pTrans Transmural pressure difference across
curved wall segment (Pa)rf Cauchy myofiber stress (Pa)Tm Representative midwall tension (N m�1)Tx Axial midwall tension component (N m�1)Ty Radial midwall tension component (N m�1)
INTRODUCTION
The left (LV) and right (RV) ventricular cavities ofthe normal human heart are separated from the
Address correspondence to Joost Lumens, Department of Phys-
iology, Cardiovascular Research Institute Maastricht (CARIM),
Maastricht University, PO Box 616, 6200 MD Maastricht, The
Netherlands. Electronic mail: [email protected]
Annals of Biomedical Engineering, Vol. 37, No. 11, November 2009 (� 2009) pp. 2234–2255
DOI: 10.1007/s10439-009-9774-2
0090-6964/09/1100-2234/0 � 2009 The Author(s). This article is published with open access at Springerlink.com
2234

intrathoracic space by the left and right ventricular freewalls, respectively (Fig. 1a). The cavities are mutuallyseparated by the septal wall. In order to simulate LVand RV mechanics and hemodynamics, the closeanatomic coupling between these two ventricles mustbe considered. Experimental data demonstrate that achange in loading condition of either ventricle directlyinfluences pump function of the other ventri-cle.5,21,50,55,68 It is also well recognized that septalgeometry and motion depend on transseptal pressuredifference.36,37,51 This dependency is best illustrated byflattening of the septum with increase of RV pressurerelative to LV pressure (Fig. 1b). Septal geometry and
motion appeared to be of diagnostic and predictivesignificance in patients with pulmonary hyperten-sion.32,35
Several mathematical models of ventricularmechanics have been developed to quantify the effectof ventricular interaction on cardiac function. In sev-eral lumped models of ventricular hemodynam-ics,7,13,41,43,48,53,56,60,61 ventricular interaction isdescribed by empirically determined coupling coeffi-cients, quantifying interventricular cross-talk of pres-sures and volumes. The model designed by Beyar et al.7
describes ventricular interaction in a more mechanisticway. In this model, LV and RV cavities are enclosed bythree ventricular walls. For given ventricular pressures,the mechanical equilibrium of tensile forces in thejunction of the walls is used as constraint to predictventricular geometry. The model is restricted todescription of passive mechanics of walls lackingcontractile myofiber properties. More recently, 3Dfinite element models of the cardiac ventricles wereused to simulate ventricular pump function and localtissue mechanics,34,47,66 inherently including ventricu-lar interaction via the septum. In comparison withlumped models of global ventricular mechanics, finiteelement models allow description of regional wallmechanics and geometry. Consequently, these modelsare computationally demanding.
For study of beat-to-beat hemodynamics andmechanics of heart and blood vessels, Arts et al. pre-viously developed the closed-loop CircAdapt model ofheart and circulation.3 In this model, mechanicalinteraction of the LV and RV has been simulated by acommon outer wall, having a transmural pressureequal to RV pressure, encapsulating an inner wall,which represents the left ventricle.1 The inner wallencapsulates the LV cavity only and has a transmuralpressure equal to the difference between LV and RVpressure. Under normal ventricular loading conditions,this model enables realistic simulation of global LVand RV pump mechanics.1,3 However, this model set-up presumes RV pressure to be substantially lowerthan LV pressure during the whole cardiac cycle. Thiscondition is not satisfied with pulmonary hypertensionor with left-to-right asynchrony of electrical activation.Furthermore, septal geometry cannot be simulated.Thus, this model cannot be used to interpret thismeasurable signal that contains important informationabout the difference between LV and RV pressure.35,51
Therefore, we designed the TriSeg model of ventricularmechanics that realistically incorporates ventricularinteraction via the interventricular septum.
In the TriSeg model, three wall segments, i.e., theLV free wall (LW), septal wall (SW), and RV free wall(RW), meet in a junction margin, thus encapsulatingthe LV and RV cavities (Fig. 2a). LW and RW
FIGURE 1. Two typical 2D echocardiographic imagesshowing end-diastolic parasternal short-axis views of thehearts of a normal individual (a) and a pulmonary hyperten-sion patient (b). Note that the septum is flattened with pul-monary hypertension. Cross-sections of left (LV) and right(RV) ventricular cavities, LV free wall (LW), septal wall (SW),and RV free wall (RW) are indicated. The bright dots indicatethe cross-section of the junction margin of the walls. In theright upper corner, image plane orientation (gray plane) isindicated in a schematic representation of the cardiac ventri-cles.
TriSeg Model of Ventricular Interaction 2235

geometries are calculated starting from an initial esti-mate of SW geometry. For each wall segment, myofi-ber strain is calculated from midwall surface arearelative to a reference area. From myofiber strain,myofiber stress is determined using constitutive equa-tions describing sarcomere mechanics. Substitution ofmyofiber stress in the known geometry of the wallsresults in representative midwall tension, acting on thejunction line. Next, septal geometry is adjusted so thatequilibrium of tension is achieved, i.e., summed tensionat the junction of the three walls is equal to zero. As aresult, geometries of the three wall segments and thetwo cavities are known, together with stresses, ten-sions, and pressures.
The TriSeg model of ventricular mechanics isdesigned to be incorporated as a module in the existingCircAdapt model simulating mechanics and hemody-namics of the whole circulation.3 According to theprinciples of CircAdapt, size and mass of the wallsegments are determined by adaptation so thatmechanical load of the myofibers is normalized to
physiological standard levels.3,4 The TriSeg model, asintegrated in the CircAdapt model, has been tested bysimulation of time-dependent LV and RV mechanicsand hemodynamics under normal ventricular loadingconditions as well as with acute and chronic pulmon-ary hypertension (PH). PH has been simulated to testwhether the TriSeg model realistically relates septalgeometry to transseptal pressure. Simulation resultshave been compared with previously published exper-imental data on ventricular hemodynamics9,62 and onthe relation between septal geometry and transmuralpressure17,51 in healthy volunteers and in patients withchronic PH.
METHODS
General Design of the TriSeg Model
The design of the new TriSeg model of ventricularmechanics should enable incorporation as a module inthe existing CircAdapt model that simulates mechanics
α
(a) (b)
(c)
FIGURE 2. TriSeg model of ventricular mechanics. (a) The TriSeg model (gray shading) incorporated in the modular CircAdaptmodel of the systemic (syst) and pulmonary (pulm) circulations.3 Three thick-walled spherical segments representing LV free wall(LW), RV free wall (RW), and septal wall (SW) form a ventricular composite consisting of a left ventricular (LV) cavity, with volumeVLV and pressure pLV, and a right ventricular (RV) cavity, with volume VRV and pressure pRV. (b) Cross-section of the ventricularcomposite through the axis of rotational symmetry (x). The ventricular walls are coupled mechanically at the common junctioncircle where their midwall surfaces (thick lines) meet. This junction circle perpendicularly intersects the plane of drawing (opendots). The midwall surface divides the wall with wall volume Vw in two shells of equal volume. The center of the junction circle isthe origin (0) of the cylindrical coordinate system applied. Note that x-direction is defined positive toward the RV free wall. (c)Cross-section of a single wall segment through the axis of rotational symmetry. Note that only midwall geometry is shown. Theshaded area indicates midwall volume Vm enclosed between the midwall surface and the junction plane. Midwall volume Vm, areaAm, and curvature Cm (reciprocal of radius of curvature) depend on distance xm and radius ym of the boundary circle. Each wall isloaded by transmural pressure difference resulting in a representative midwall tension Tm. With half opening angle a, Tm isresolved in an axial (Tx) and a radial (Ty) component.
LUMENS et al.2236

and hemodynamics of the whole circulation.3 There-fore, the TriSeg model calculates LV and RV pressures(pLV and pRV, respectively) as functions of LV and RVcavity volumes (VLV and VRV, respectively). Mechan-ics of ventricular interaction is incorporated assuminga simplified ventricular composite geometry (Fig. 2a).The three ventricular walls LW, SW, and RW aremodeled to be thick-walled and spherical with a com-mon junction circle with midwall radius ym (Fig. 2b).Midwall is defined as the spherical surface that divideswall volume Vw in an inner and an outer shell of equalvolume. Midwall volume Vm is the volume enclosed bythe midwall surface and the plane of the junction circle(Fig. 2c). The center of the junction circle is the originof the applied cylindrical coordinate system (Fig. 2b).The x-direction is perpendicular to the plane of thejunction circle and is defined positive toward the RVfree wall. The y-coordinate represents the radial dis-tance to the x-axis. The spherical midwall surface of awall segment intersects the x-axis at value xm (Fig. 2c).
In presenting the TriSeg model, the following levelsare distinguished: (1) ventricular hemodynamics, (2)ventricular composite mechanics, (3) ventricular wallsegment mechanics, (4) curved wall patch mechanics,and (5) myofiber mechanics. Starting from LV and RVvolumes, the sequence of calculations needed to obtain
LV and RV pressures has been illustrated in Fig. 3.The ventricular hemodynamics section serves asinterface with the CircAdapt model of the whole cir-culation.3 In the ventricular composite section, LV andRV volumes are used to calculate LV and RV pres-sures, applying a model of wall mechanics to eachventricular wall segment. In the ventricular wall seg-ment section, volume Vm and boundary radius ym of aspherical wall segment are used to calculate the axialand radial vector components Tx and Ty, respectively,at the common junction circle from representativemidwall tension Tm, applying a model of the mechanicsof a curved wall patch. Such patch is defined as afraction of a spherical wall segment with an arbitrarilyshaped boundary and with midwall area Am and cur-vature Cm. Curvature is defined as the reciprocal ofradius of curvature, having the advantage of being welldefined for a flat wall. In the section of curved wallpatch mechanics, Am and Cm are used to calculaterepresentative midwall tension Tm, applying a model ofmyofiber mechanics. In the myofiber mechanics sec-tion, natural myofiber strain ef is converted to Cauchymyofiber stress rf, using a constitutive law of themyofiber. This model of myofiber mechanics has beenheuristically obtained from reported physiologicalexperiments.
CircAdaptModel
VentricularHemodynamics
VentricularComposite
VentricularWall Segment
CurvedWall Patch
Myofiber
SarcomereModel
Appendix B
Tx,TotTy,Tot
ym,estVm,SW,est
Equilibriumof Forces
Vm,iym,i
Ty,iTx,i
pTrans,i
Tm,i
Am,iCm,i εf,i
σf,i
VLVVRV
pLVpRV
Eqs. 1-4 Eqs. 9-11
Eqs.5-6
Eqs. 7-8 Eqs. 12-14
Eq. 15
Eq. 16
FIGURE 3. Flowchart of the TriSeg model of left (LV) and right (RV) ventricular mechanics. Applied equations are indicated bytheir numbers. The ventricular hemodynamics section serves as interface with the CircAdapt model of the whole circulation. In theventricular composite section, for each wall i, midwall boundary radius (ym,i) and midwall volume (Vm,i) are calculated from LV andRV volumes (VLV and VRV, respectively) and septal geometry. Septal geometry is initially defined by estimates of boundary radius(ym,est) and midwall volume (Vm,SW,est). LV free wall, septum, and RV free wall are indicated by i 5 LW, SW, and RW, respectively.The first dashed arrow indicates calculation of axial (Tx,i) and radial (Ty,i) wall tension components and transmural pressure(pTrans,i). LV and RV pressure (pLV and pRV, respectively) and a new estimate of septal geometry is obtained from the summed axial(Tx,Tot) and radial (Ty,Tot) tension components. If septal geometry is sufficiently accurate by iteration, the solution is accepted.Because direct calculation along the dashed arrow is not possible, the sequence of calculations has to follow the solid lines. Foreach wall segment, midwall area (Am,i) and curvature (Cm,i) are calculated. Wall tension (Tm,i) is calculated following the seconddashed arrow and renders wall tension components and transmural pressure. Again, direct calculation is not possible. Therefore,in the myofiber section, midwall area and curvature are used to calculate myofiber strain (ef,i). Myofiber strain is converted tomyofiber stress (rf,i) using a model of sarcomere mechanics. Myofiber stress and wall segment geometry are used to calculate walltension. By cascading the different sections, calculations can be performed sequentially along the pathways marked by solid lines.
TriSeg Model of Ventricular Interaction 2237

Ventricular Composite Mechanics
In this section, it is shown how cavity volumes VLV
and VRV are used to calculate pressures pLV and pRV.For that purpose, a model of ventricular wall segmentmechanics is applied that renders axial and radialtension components (Tx and Ty, respectively) fromrepresentative midwall tension as a function of themidwall volume (Vm) and junction radius (ym) of thespherical wall segment. This latter model will bederived in the next section discussing mechanics of theventricular wall segment.
The geometry of the ventricular composite (Figs. 2band 2c) is defined by the common radius ym of the walljunction and the enclosed midwall cap volumes Vm,LW,Vm,SW, and Vm,RW of the wall segments LW, SW, andRW, respectively. Septal midwall volume Vm,SW andjunction radius ym are initially estimated by the solu-tions as obtained in the preceding time point, i.e.,Vm,SW,est and ym,est, respectively:
ym ¼ ym;est ð1Þ
Vm;SW ¼ Vm;SW;est ð2Þ
The latter estimates, together with ventricular cavityvolumes VLV and VRV as given directly by the Circ-Adapt model, render an estimate of ventricular com-posite geometry. Using the fact that ventricular cavityvolume added to half of wall volume Vw of theenclosing wall segments renders the sum of midwallvolumes, it is found:
Vm;LW ¼ �VLV �1
2Vw;LW �
1
2Vw;SW þ Vm;SW ð3Þ
Vm;RW ¼ þVRV þ1
2Vw;RW þ
1
2Vw;SW þ Vm;SW ð4Þ
Note that the sign of midwall volume Vm is positive ifwall curvature is convex to the positive x-direction(Fig. 2b). Thus, for a normal heart, the sign is negativefor LW and positive for RW and SW.
For each wall segment i, Vm,i and ym,i are used tocalculate axial and radial tension components Tx,i andTy,i, as well as transmural pressure pTrans,i. This is doneby applying a model of ventricular wall segmentmechanics as discussed in the next section. The axialtension components of the three wall segments Tx,LW,Tx,SW, and Tx,RW are summed to calculate the net axialtension Tx,Tot in the junction. Similarly, the net radialtension Ty,Tot in the junction is obtained. The initialestimates of ym and Vm,SW (Eqs. 1 and 2) are adjustednumerically so that for the summed tension compo-nents it holds:
Tx;Totðym;Vm;SWÞ ¼ 0 ð5Þ
Ty;Totðym;Vm;SWÞ ¼ 0 ð6Þ
Having solved Eqs. (5) and (6), and assuming thepressure surrounding the ventricular composite to bezero, for LV and RV pressures it holds:
pLV ¼ �pTrans;LW ð7Þ
pRV ¼ þpTrans;RW ð8Þ
Note that the minus sign for pLV is caused by thedefinition of pTrans, which is positive for a negativex-gradient of pressure in the wall segment.
Mechanics of the Ventricular Wall Segment
In this section, it is shown for a wall segment(Fig. 2c) how Vm and ym are used to calculate axialand radial midwall tension components Tx and Ty, andtransmural pressure pTrans. For that purpose, a modelof the mechanics of a curved wall patch is applied.Such curved wall patch is defined as a fraction of aspherical wall segment with midwall surface area Am
and curvature Cm. This latter model renders repre-sentative midwall tension from midwall surface areaAm and curvature Cm and will be derived in the nextsection discussing mechanics of the curved wall patch.
Wall segment geometry ismost conveniently describedby radius ym of the junction circle and distance xmbetween plane of junction circle and center of midwallsurface (Fig. 2c).Vm,Am, andCmdependonxmandymby
Vm ¼p6xmðx2m þ 3y2mÞ ð9Þ
Am ¼ pðx2m þ y2mÞ ð10Þ
Cm ¼2xm
ðx2m þ y2mÞð11Þ
First, xm is calculated from ym and Vm by solving Eq.(9). Second, Am and Cm are determined with Eqs. (10)and (11). Next, Am and Cm are used to calculate rep-resentative midwall tension Tm, applying a model ofthe mechanics of a curved wall patch as discussed inthe next section.
At the circular boundary of the midwall surface(Fig. 2c), geometric parameters xm and ym, and mid-wall tension Tm are used to calculate axial (Tx) andradial (Ty) tension components:
Tx ¼ Tm � sin a with sin a ¼ 2xmymx2m þ y2m
ð12Þ
Ty ¼ Tm � cos a with cos a ¼ �x2m þ y2m
x2m þ y2mð13Þ
LUMENS et al.2238
The symbol a represents half opening angle of thecircular wall segment (Fig. 2c).
Transmural pressure pTrans equals total axial force.Consequently, pTrans is calculated by multiplying Tx bythe ratio of length of the junction contour (2pym) toarea of the junction circle (pym
2 ):
pTrans ¼2Tx
ymð14Þ
Mechanics of the Curved Wall Patch
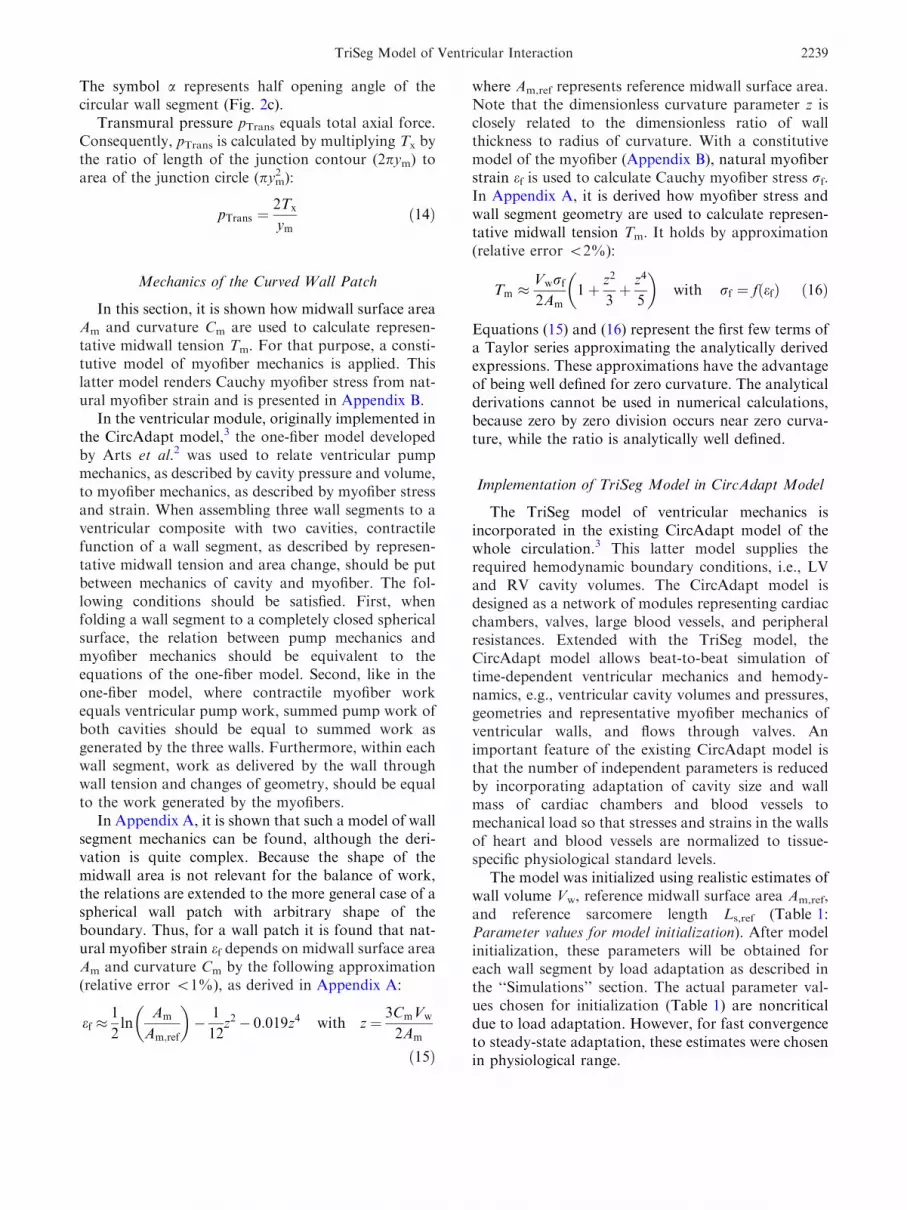
In this section, it is shown how midwall surface areaAm and curvature Cm are used to calculate represen-tative midwall tension Tm. For that purpose, a consti-tutive model of myofiber mechanics is applied. Thislatter model renders Cauchy myofiber stress from nat-ural myofiber strain and is presented in Appendix B.
In the ventricular module, originally implemented inthe CircAdapt model,3 the one-fiber model developedby Arts et al.2 was used to relate ventricular pumpmechanics, as described by cavity pressure and volume,to myofiber mechanics, as described by myofiber stressand strain. When assembling three wall segments to aventricular composite with two cavities, contractilefunction of a wall segment, as described by represen-tative midwall tension and area change, should be putbetween mechanics of cavity and myofiber. The fol-lowing conditions should be satisfied. First, whenfolding a wall segment to a completely closed sphericalsurface, the relation between pump mechanics andmyofiber mechanics should be equivalent to theequations of the one-fiber model. Second, like in theone-fiber model, where contractile myofiber workequals ventricular pump work, summed pump work ofboth cavities should be equal to summed work asgenerated by the three walls. Furthermore, within eachwall segment, work as delivered by the wall throughwall tension and changes of geometry, should be equalto the work generated by the myofibers.
In Appendix A, it is shown that such a model of wallsegment mechanics can be found, although the deri-vation is quite complex. Because the shape of themidwall area is not relevant for the balance of work,the relations are extended to the more general case of aspherical wall patch with arbitrary shape of theboundary. Thus, for a wall patch it is found that nat-ural myofiber strain ef depends on midwall surface areaAm and curvature Cm by the following approximation(relative error <1%), as derived in Appendix A:
ef �1
2ln
Am
Am;ref
� �� 1
12z2� 0:019z4 with z¼ 3CmVw
2Am
ð15Þ
where Am,ref represents reference midwall surface area.Note that the dimensionless curvature parameter z isclosely related to the dimensionless ratio of wallthickness to radius of curvature. With a constitutivemodel of the myofiber (Appendix B), natural myofiberstrain ef is used to calculate Cauchy myofiber stress rf.In Appendix A, it is derived how myofiber stress andwall segment geometry are used to calculate represen-tative midwall tension Tm. It holds by approximation(relative error <2%):
Tm �Vwrf
2Am1þ z2
3þ z4
5
� �with rf ¼ fðefÞ ð16Þ
Equations (15) and (16) represent the first few terms ofa Taylor series approximating the analytically derivedexpressions. These approximations have the advantageof being well defined for zero curvature. The analyticalderivations cannot be used in numerical calculations,because zero by zero division occurs near zero curva-ture, while the ratio is analytically well defined.
Implementation of TriSeg Model in CircAdapt Model
The TriSeg model of ventricular mechanics isincorporated in the existing CircAdapt model of thewhole circulation.3 This latter model supplies therequired hemodynamic boundary conditions, i.e., LVand RV cavity volumes. The CircAdapt model isdesigned as a network of modules representing cardiacchambers, valves, large blood vessels, and peripheralresistances. Extended with the TriSeg model, theCircAdapt model allows beat-to-beat simulation oftime-dependent ventricular mechanics and hemody-namics, e.g., ventricular cavity volumes and pressures,geometries and representative myofiber mechanics ofventricular walls, and flows through valves. Animportant feature of the existing CircAdapt model isthat the number of independent parameters is reducedby incorporating adaptation of cavity size and wallmass of cardiac chambers and blood vessels tomechanical load so that stresses and strains in the wallsof heart and blood vessels are normalized to tissue-specific physiological standard levels.
The model was initialized using realistic estimates ofwall volume Vw, reference midwall surface area Am,ref,and reference sarcomere length Ls,ref (Table 1:Parameter values for model initialization). After modelinitialization, these parameters will be obtained foreach wall segment by load adaptation as described inthe ‘‘Simulations’’ section. The actual parameter val-ues chosen for initialization (Table 1) are noncriticaldue to load adaptation. However, for fast convergenceto steady-state adaptation, these estimates were chosenin physiological range.
TriSeg Model of Ventricular Interaction 2239

The set of differential equations that describe theCircAdapt model, including the TriSeg module, wassolved by numerical integration with time steps of 2 msusing the ODE113 function in MATLAB 7.1.0(MathWorks, Natick, MA). Simulation time of a sin-gle cardiac cycle was less than 7 s on a Windows XPTM
platform (version 2002) with a 2.00 GHz Intel�
CoreTM2 Duo T7250 processor and 1 GB of RAM.
Simulations
The TriSeg model, as integrated in the CircAdaptmodel, was tested by simulation of human ventricularmechanics and hemodynamics with (1) normal ven-tricular loading conditions (NORM), (2) acute pul-monary hypertension (PHAc), and (3) chronicpulmonary hypertension including adaptation(PHCh). All simulations are presented with similarvalues of mean systemic blood flow (cardiac output),cardiac cycle time (heart rate), and mean systemicarterial blood pressure, simulating hemodynamics atrest (Table 1: Hemodynamics at rest).
NORM Simulation
The diameter of large blood vessels was assumed tobe determined by adaptation to mean chronic cir-cumstances, which state is most closely described by
the condition of rest (Table 1: Hemodynamics at rest).However, geometry of the heart and wall thickness oflarge blood vessels were considered to be a result ofadaptation to a state of moderate exercise, thus simu-lating the effect of relatively short periods of trainingby exercise. The applied simulation protocol ofadaptation has been described earlier.3 Briefly reca-pitulating, with resting hemodynamics (Table 1:Hemodynamics at rest), diameters of the large bloodvessels were adapted until mean blood flow velocityreached the set point value (Table 1: Set point valuesfor adaptation). Next, a moderate state of exercise wassimulated by tripling cardiac output and doublingheart rate (Table 1: Interventions with exercise). Underthese circumstances, wall volume (Vw) and referencemidwall surface area (Am,ref) of all cardiac wall seg-ments were adapted until maximum and minimumsarcomere length as well as maximum passive myofiberstress reached the set point values of adaptation withexercise (Table 1). Also, wall thickness of the bloodvessels was adapted until maximum wall stress wasequal to the set point value (Table 1). Next, hemody-namics were returned to rest conditions and the above-mentioned adaptation protocol was repeated two orthree times until steady-state geometry was reached(<1% deviation from set point values). In total,finding the steady-state adapted NORM simulationrequired simulation of about 100–200 cardiac cycles.
TABLE 1. Input parameter values for NORM and PH simulations.
Parameter Unit Value
Hemodynamics at rest
Mean systemic arterial blood pressure kPa 12.2
Mean systemic blood flow mL s�1 85
Cardiac cycle time s 0.850
Mean pulmonary arteriovenous pressure drop kPa 1.5 (NORM)
Interventions with exercise
Mean systemic blood flow mL s�1 255
Cardiac cycle time s 0.425
Set point values for adaptation
Mean flow velocity in large blood vessels (rest) m s�1 0.17
Maximum vascular wall stress (exercise) kPa 500
Maximum sarcomere length (exercise) lm 2.2
Minimum sarcomere length (exercise) lm 1.75
Maximum passive myofiber stress (exercise) kPa 10 (LW), 8 (SW), 20 (RW)
Interventions with PH simulations
Mean pulmonary arteriovenous pressure drop kPa 3.0 (PHAc1 and PHCh1),
4.5 (PHAc2 and PHCh2),
6.0 (PHAc3 and PHCh3)
Parameter values for model initialization
Wall volume (Vw) mL 75 (LW), 40 (SW), 30 (RW)
Reference midwall surface area (Am,ref) cm2 80 (LW), 45 (SW), 100 (RW)
Reference sarcomere length (Ls,ref) lm 2.0 (LW, SW, and RW)
Septal midwall volume (Vm,SW) mL 42
Radius of midwall junction circle (ym) cm 3.3
LW, left ventricular free wall; NORM, normal simulation; PHAc, acute pulmonary hypertension simulation;
PHCh, chronic pulmonary hypertension simulation; RW, right ventricular free wall; SW, septal wall.
LUMENS et al.2240

PHAc and PHCh Simulations
The NORM simulation was used as point ofdeparture for simulation of ventricular mechanicsand hemodynamics with increased pulmonary resis-tance. Steady-state simulations (PHAc1, PHAc2, andPHAc3), representing increasing degrees of acute pul-monary hypertension, were obtained by acute increaseof mean pulmonary arteriovenous pressure drop inthree steps without adaptation (Table 1: Interventionswith PH simulations). Finally, adaptation was appliedto the three steady-state PHAc simulations followingthe same protocol used for the NORM simulation.This resulted in three steady-state simulations (PHCh1,PHCh2, and PHCh3, respectively), representing grad-ually increasing degrees of chronic pulmonary hyper-tension at rest.
Simulation Data Analysis
Ventricular Pump Mechanics and Hemodynamics
Simulated time courses of normal (NORM) LV andRV pressures, volumes, and flows were compared withphysiological data obtained in normal sub-jects.26,29,54,62,63 Area of ventricular pressure–volumerelation was calculated to quantify ventricular pumpstroke work (Wstroke) for the LV and RV. Time coursesof blood flow velocities through the mitral, aortic, tri-cuspid, and pulmonary valves were used to study theeffects of chronic pulmonary hypertension on ventric-ular hemodynamics. For comparison with clinical dataobtained in healthy subjects and in patients withchronic pulmonary hypertension,9,62 several timingparameters of RV hemodynamics were quantified forthe NORM and PHCh simulations. RV ejection time(ET) was quantified as the time from pulmonary valveopening to closure, acceleration time of pulmonaryflow (AT) as the time from pulmonary valve opening tomoment of maximal pulmonary flow velocity, RV iso-volumic contraction time (ICT) as the time from tri-cuspid valve closure to pulmonary valve opening, andRV isovolumic relaxation time (IRT) as the time frompulmonary valve closure to tricuspid valve opening.
Tissue Mechanics
Area of myofiber stress–strain relation was calcu-lated to quantify stroke work density (wstroke) for theLW, SW, and RW. Stroke work density was defined ascontractile myofiber stroke work per unit of tissuevolume.
Ventricular Wall Geometry
End-diastolic wall thicknesses (Hed) were calculatedas wall volume divided by end-diastolic midwall
surface area. End-diastole was defined as the momentof mitral valve closure. Furthermore, time courses ofLW, SW, and RW midwall curvatures were used toassess acute and chronic effects of increase of pul-monary resistance on wall curvatures. The relationbetween septal geometry and the transseptal pressuregradient in the TriSeg model was compared with therelation found in patients with and without chronicpulmonary hypertension.17 For that purpose, curva-ture ratio (CR) was calculated as the SW/LW midwallcurvature ratio at the moment of aortic valve closure,whereas transmural pressure ratio (PR) was defined asthe difference between maximum LV and RV pressuresdivided by maximum LV pressure.
RESULTS
Simulation of Normal Physiology (NORM)
Figure 4 shows simulated time courses of ventricularcavity pressures and volumes, aortic and pulmonaryartery pressures, and flows through arterial and atrio-ventricular valves under normal ventricular loadingconditions (NORM). These time courses show agree-ment with physiological data on the following aspects:(1) LV and RV cavity pressures and volumes rise at theend of diastole as a result of atrial contraction, (2) timecourses of mitral and tricuspid valve flows show anearly passive filling wave (E) followed by a clearlyseparated late filling wave (A) resulting from atrialcontraction,26 (3) LV and RV end-diastolic volumes arenot significantly different,54 (4) RV ejection starts ear-lier and ends later than LV ejection,29 and (5) durationsof LV isovolumic contraction and relaxation exceed thecorresponding RV time intervals (Fig. 4, bottompanel).62,63 Steady-state adaptation rendered LW, SW,and RW wall volumes of 76, 38, and 31 mL, respec-tively. Wall thicknessesHed,LW andHed,SW were almostequal and three times as large as Hed,RW (Table 2).
Simulations of Acute Pulmonary Hypertension (PHAc)
The upper panel row of Fig. 5 illustrates simulatedventricular pressure–volume loops under normalloading conditions (NORM) and with acutelyincreased pulmonary resistance (PHAc1, PHAc2, andPHAc3). With increasing pulmonary resistance, RVcavity volume, systolic and diastolic RV pressures,mean pulmonary artery pressure, and RV pump work(Table 3) increased, while LV cavity volume and pumpwork were relatively unaffected. The middle panel rowof Fig. 5 shows stress–strain loops of the myofibers inthe ventricular wall segments. Acute rise of pulmonaryresistance caused increase of RW myofiber stress,myofiber strain, and stroke work density, while it
TriSeg Model of Ventricular Interaction 2241

caused decrease of LW and SW stroke work densities(Table 3). The lower panel row of Fig. 5 illustratestime courses of LW, SW, and RW midwall curvatures.With increasing pulmonary resistance, SW midwallcurvature decreased predominantly during diastole. Inthe PHAc3 simulation, the septum even flattened tozero curvature and bulged shortly toward the LV freewall (negative curvature) during early diastole. LWand RW curvatures appeared relatively insensitive toacute changes of pulmonary resistance. With increas-ing pulmonary resistance (Table 2), Hed,RW decreasedmaximally by 26% in PHAc3 relative to NORM,Hed,LW decreased maximally by 8%, whereas Hed,SW
increased only 1%.
Simulations of Chronic PulmonaryHypertension (PHCh)
Figure 6 illustrates graphs of the same variables aspresented in Fig. 5, but now rendered after adaptationto increased pulmonary resistance (PHCh1, PHCh2,and PHCh3). Like in absence of adaptation, systolicand diastolic RV pressures, mean pulmonary arterypressure, and RV pump work were elevated withchronic pulmonary hypertension (Table 3), while LVpump function remained relatively unaffected. Incontrast to the PHAc simulations, RV cavity volumedecreased 8% in the PHCh3 simulation (Fig. 6). Themyofiber stress–strain loops in Fig. 6 show thatadaptation resulted in a more homogeneous distribu-tion of stroke work density in the ventricular walls(Table 3). In the PHCh3 simulation, RW stroke workdensity was increased (20%), whereas LW and SWstroke work densities were decreased (7 and 5%,respectively) relative to the NORM simulation.Increase of pulmonary resistance with load adaptationresulted in the following changes of ventriculargeometry. Mean SW curvature (Fig. 6) decreased lin-early with increasing pulmonary resistance, while theshape of the time course was preserved. LW and RW
RV
LV
fillingejection
IRIC IC
0 0.4 0.8 1.20
100
200
time [s]
volu
me
[ml] VRV
VLV
0
2
4
pres
sure
[kP
a]
pRV
ppa
0
200
400
flow
[ml/s
]
qpv qtrA
EA
0
5
10
15
0
200
400
pres
sure
[kP
a]flo
w [m
l/s]
pLV
pao
qao qmi
A E A
FIGURE 4. Simulated time courses of normal (NORM) LV andRV hemodynamics at rest. The bar plot (bottom panel) dis-plays RV and LV ejection, filling, and isovolumic contractionand relaxation periods. Note that simulation duration amountsto one and a half cardiac cycle. Symbols: A, late active ven-tricular filling wave; E, early passive ventricular filling wave;IC, isovolumic contraction; IR, isovolumic relaxation; LV, leftventricular; pao, aortic pressure; pLV, left ventricular pressure;ppa, pulmonary artery pressure; pRV, right ventricular pres-sure; qao, aortic valve flow; qmi, mitral valve flow; qpv, pul-monary valve flow; qtr, tricuspid valve flow; RV, rightventricular; VLV, left ventricular cavity volume; and VRV, rightventricular cavity volume.
TABLE 2. Simulation results: ventricular wall thickness.
Parameter Unit NORM
PHAc PHCh
1 2 3 1 2 3
End-diastolic wall thickness
Hed,LW mm 7.9 7.8 7.6 7.3 8.3 8.2 8.3
Hed,SW mm 6.8 6.9 7.0 6.9 6.7 6.9 6.5
Hed,RW mm 2.3 2.1 2.0 1.7 3.3 4.2 5.1
Hed, end-diastolic wall thickness; LV, left ventricular; LW, left ven-
tricular free wall; NORM, normal simulation; PHAc, acute pul-
monary hypertension simulation; PHCh, chronic pulmonary
hypertension simulation; RV, right ventricular; RW, right ventricular
free wall; SW, septal wall.
LUMENS et al.2242

50 100 1500
5
10
15
50 100 150 200 250 300
-0.2 -0.1 0 0.1 0.20
50
100
150
200
-0.2 -0.1 0 0.1 0.2
0 0.2 0.4 0.6 0.8 0 0.2 0.4 0.6 0.8 0 0.2 0.4 0.6 0.8
-0.2 -0.1 0 0.1 0.2
myofiber strain [-] myofiber strain [-]myofiber strain [-]
time [s] time [s]time [s]
volume [ml] volume [ml]
pres
sure
[kP
a]m
yofib
er s
tres
s [k
Pa]
mid
wal
l cur
vatu
re [c
m-1
]
LV RV
LW SW RW
LW* SW RW
0
0.1
0.2
0.3
LVejection
LVejection
LVejection
NORM
PHAc2PHAc1
PHAc3
FIGURE 5. Simulated ventricular pressure–volume loops, myofiber stress–strain loops, and time courses of midwall curvaturesunder normal (NORM) and acute pulmonary hypertensive (PHAc1, PHAc2, and PHAc3) ventricular loading conditions. Acuteincrease of pulmonary resistance resulted in RV dilatation, increased RV pump work, increased contractile work density in the RVfree wall, and decreased septal midwall curvature. Simulation duration amounts to one cardiac cycle. LV ejection is indicated in thecurvature plots. Abbreviations: LV, left ventricular; LW, left ventricular free wall; RV, right ventricular; RW, right ventricular freewall; and SW, septal wall. *Note that the absolute value of LW midwall curvature is used for graphical representation, while thiscurvature is defined to be negative in the TriSeg model.
TABLE 3. Simulation results: pulmonary artery pressures and ventricular work.
Parameter Unit NORM
PHAc PHCh
1 2 3 1 2 3
Ventricular pump stroke work
Wstroke,LV Pa m3 1.04 1.04 1.03 1.02 1.05 1.04 1.04
Wstroke,RV Pa m3 0.22 0.32 0.42 0.51 0.35 0.48 0.61
Stroke work density
wstroke,LW kPa 9.41 9.54 9.32 8.66 8.88 8.90 8.78
wstroke,SW kPa 8.94 8.28 7.54 6.15 9.19 8.66 8.49
wstroke,RW kPa 7.91 11.66 15.94 21.59 8.59 9.13 9.48
Mean pulmonary artery pressure
ppa kPa 2.04 3.56 5.11 6.77 3.53 5.00 6.47
LV, left ventricular; LW, left ventricular free wall; NORM, normal simulation; PHAc, acute pulmonary hypertension
simulation; PHCh, chronic pulmonary hypertension simulation; ppa, mean pulmonary artery pressure; RV, right
ventricular; RW, right ventricular free wall; SW, septal wall; wstroke, stroke work density; Wstroke, ventricular pump
stroke work.
TriSeg Model of Ventricular Interaction 2243

curvatures were practically unaffected. Relative to theNORM simulation, Hed,RW increased up to 120% inPHCh3, whereas changes of Hed,LW and Hed,SW weresmall (<5%) (Table 2).
In Fig. 7, time courses of LV and RV inflow andoutflow velocities are shown for the NORM and PHChsimulations. With increasing pulmonary resistance,pulmonary and tricuspid valve flow velocities changedsignificantly relative to the NORM simulation,whereas aortic and mitral valve flow velocities re-mained relatively unaffected. Furthermore, in Fig. 7,RV ejection time (ET), acceleration time of pulmonaryflow (AT), RV isovolumic contraction time (ICT), andRV isovolumic relaxation time (IRT) are indicated forthe NORM simulation. In Fig. 8, changes of these
timing parameters are compared with the changes asobserved in clinical studies among normal individualsand patients with chronic pulmonary hypertension.9,62
In the simulations, chronic increase of pulmonaryresistance caused decrease of AT and AT/ET-ratio,indicating increase of pulmonary flow curve skewness.This is in accordance with measurements as obtainedin patients with chronic pulmonary hypertension.9
Furthermore, simulated ICT and IRT lengthened(maximally 163% and 47% in the PHCh3 simulation,respectively). The ratio of total RV isovolumic time(ICT + IRT) to ET almost doubled. Again, the sim-ulated changes were similar to the changes as observedin patients with pulmonary hypertension.62 Further-more, the tricuspid early filling wave narrowed and the
60 80 100 120 140 1600
5
10
15
60 80 100 120 140 160
-0.2 -0.1 0 0.10
20
40
60
-0.2 -0.1 0 0.1 -0.2 -0.1 0 0.1
0 0.2 0.4 0.6 0.8 0 0.2 0.4 0.6 0.8 0 0.2 0.4 0.6 0.8
myofiber strain [-] myofiber strain [-]myofiber strain [-]
time [s] time [s]time [s]
volume [ml] volume [ml]
pres
sure
[kP
a]m
yofib
er s
tres
s [k
Pa]
mid
wal
l cur
vatu
re [c
m-1
]
LV RV
LW SW RW
LW* SW RW
NORM
PHCh2PHCh1
PHCh3
0
0.1
0.2
0.3
LVejection
LVejection
LVejection
FIGURE 6. Simulated ventricular pressure–volume loops, myofiber stress–strain loops, and time courses of midwall curvaturesunder normal (NORM) and chronic pulmonary hypertensive (PHCh1, PHCh2, and PHCh3) ventricular loading conditions. Chronicincrease of pulmonary resistance including adaptation resulted in increase of RV pump work, homogeneity of contractile workdensities in the walls, and linear decrease of septal midwall curvature. Simulation duration amounts to one cardiac cycle. LVejection is indicated in the curvature plots. Abbreviations: LV, left ventricular; LW, left ventricular free wall; RV, right ventricular;RW, right ventricular free wall; and SW, septal wall. *Note that the absolute value of LW midwall curvature is used for graphicalrepresentation, while this curvature is defined to be negative in the TriSeg model.
LUMENS et al.2244

tricuspid E/A-ratio of peak atrioventricular flow dur-ing early filling (E) to that during atrial contraction (A)decreased from 1.49 in the NORM simulation to unityin the PHCh3 simulation.
Figure 9 shows simulated time courses of SW/LWtransmural pressure ratio and SW/LW midwall cur-vature ratio. SW transmural pressure was quantified asLV cavity pressure minus RV cavity pressure, whileLW transmural pressure was quantified as LV cavitypressure. At each time point in the cardiac cycle, both
ratios decreased linearly with increase of pulmonaryresistance.
Both CR and PR decreased with increase of pul-monary resistance (Table 4). Figure 10 shows therelation between CR and PR, as derived from theNORM and PHCh simulations, as well as the relationfound among patients with and without pulmonaryhypertension.17 In this latter patient population, pul-monary hypertension was defined as an RV systolicpressure >40 mmHg. Linear regression analysis ofdata points as derived from the NORM and PHChsimulations revealed a strong correlation (r2 = 1.00,SEE = 0.008) between CR and PRwith similar slope asthe relation found in patients (r2 = 0.73, SEE = 0.044).In the simulations, however, an offset was found,shifting the relation to higher CR values (Fig. 10). It isnoted (not shown) that although acute change (±20%)of mean systemic flow or mean arterial blood pressureaffected CR and PR, their interdependence followed thelinear relation as derived from the chronic simulationswithin 2% deviation. The same holds for the datapoints derived from the PHAc1 and PHAc2 simula-tions, while for the PHAc3 simulation the deviation wasmore than 10% (Table 4, not shown in Fig. 10).
DISCUSSION
The newly designed TriSeg model of ventricularmechanics incorporates mechanical interaction of theLV free wall, RV free wall, and septal wall resulting ina strong coupling of LV and RV pump mechanics andhemodynamics. The TriSeg model was successfullyimplemented as a module in the available CircAdaptmodel, simulating cardiac mechanics and hemody-namics of the closed-loop circulation. Effects of ven-tricular interaction on cardiac mechanics andhemodynamics were assessed by simulation of pul-monary hypertension in the acute phase as well as inthe chronic phase, the latter implying adaptation ofventricular geometry to mechanical load. For chronicpulmonary hypertension, simulated ventricular geom-etry, hemodynamics, and septal mechanics agreedsurprisingly well with corresponding measurements inpatients.
Model Assumptions
In the TriSeg model, ventricular geometry wasapproximated by three thick-walled spherical segmentsencapsulating the LV and RV cavities (Fig. 2a). Inreality, the ventricular cavities are enclosed by trun-cated ellipsoidal muscular walls and the noncontractilebasal sheet with valves.58 The simplification to spher-ical segments without a noncontractile sheet resulted in
0
0.5
1
0
0.2
0.4
pulm
onar
y va
lve
flow
vel
ocity
[m/s
]tr
icus
pid
valv
eflo
w v
eloc
ity [m
/s]
EA
NORM
PHCh2PHCh1
PHCh3
0
0.5
1
0
0.2
0.4
aort
ic v
alve
f low
vel
ocity
[m/s
]m
itral
val
veflo
w v
eloc
ity [m
/s]
AE
ETICT IRT
AT
0 0.2 0.4 0.6 0.8
time [s]
FIGURE 7. Simulated time courses of pulmonary and tri-cuspid valve flow velocities (upper two panels) show length-ening of RV isovolumic contraction, shortening of RVejection, and increase of pulmonary flow acceleration afteradaptation to increased pulmonary resistance (PHCh1,PHCh2, and PHCh3). Aortic and mitral valve flow velocities(lower two panels) appear relatively insensitive to increase ofpulmonary resistance. Simulation duration amounts to onecardiac cycle. The following time intervals are indicated forthe NORM simulation: AT, acceleration time of pulmonaryvalve flow; ET, RV ejection time; ICT, RV isovolumic con-traction time; and IRT, RV isovolumic relaxation time. Sym-bols: A, late active ventricular filling wave; and E, earlypassive ventricular filling wave.
TriSeg Model of Ventricular Interaction 2245

a general underestimation of ventricular dimensions.Although the fact that there are indications thatbending stiffness of the myocardium may be importantfor simulation of septal geometry,7,21 we neglected thiseffect for simplicity. Despite these inaccuracies, relativechanges of dimensions during the cardiac cycle as aresult of adaptation were simulated realistically.
In the TriSeg model, myofiber strain was estimatedfrom midwall curvature, area, and wall volume byapplication of the one-fiber model2 to a spherical wallsegment (Eq. 15 and Appendix A). The one-fibermodel has been shown to be insensitive to actual wallgeometry by assuming conservation of energy andhomogeneity of fiber stress in the wall.2 So, weexpected that the present relation for transmuralpressure as a function of midwall surface area and
curvature was also applicable to the real, more irreg-ular cardiac geometry, although this fact has not beenproven.
The analytically derived dependency of myofiberstrain on wall segment geometry (Eq. A7) appearedcontinuous and differentiable around z = 0. To avoidnumerical inaccuracy near zero curvature, because ofzero-division, a fourth-order Taylor series approxi-mation (Eq. 15) was used instead. For similar reasons,Eq. (A4) for midwall tension was also approximatedby a fourth-order Taylor series (Eq. 16). Within thephysiological range of ventricular geometry, the errorsof the approximations as compared to the analyticallyderived relations were smaller than 1% and 2% forstrain and tension, respectively. With respect to totalventricular pump work, total myofiber stroke work
1 2 3
0
100
200
300
400
500
0
40
80
120
160
200
0
0.1
0.2
0.3
0.4
0.5
0
0.4
0.8
1.2
0.2
0.6
1
NORM
1
2
3
PHCh1
PHCh2
PHCh3
Normal
PulmonaryHypertension
Simulations Patient data byBossone et al.9
1 2 3 1 2 3 1 2 3
1 2 31 2 3
Tim
e [m
s]Ti
me
[ms]
Tim
e R
atio
[-]
Tim
e R
atio
[-]
AT ET AT
ICT IRT
ET
ICT+IRTET
Normal
PulmonaryHypertension
Patient data byTei et al.62
FIGURE 8. Comparison of simulated and patient data on timing of RV hemodynamics. Simulated changes of AT, ET, ICT, and IRTas chronic response to increased pulmonary resistance agree with measurements obtained in healthy normals and patients withpulmonary hypertension [adapted from Bossone et al.9 (upper row) and Tei et al.62 (lower row)]. Patient data are presented by meanvalues with standard deviations indicated by error bars. Symbols: AT, pulmonary flow acceleration time; ET, RV ejection time; ICT,RV isovolumic contraction time; and IRT, RV isovolumic relaxation time.
LUMENS et al.2246

was overestimated less than 2.6%, whereas total tensilestroke work at the midwall surface was underestimatedless than 0.5%.
In the NORM and PHCh simulations, a load-con-trolling adaptation mechanism was applied to rendersize and mass of each wall segment. The appliedadaptation rules required prescribed values for maxi-mum and minimum sarcomere lengths and for maxi-mum passive myofiber stress in each wall segment(Table 1). Maximum and minimum sarcomere lengthswere derived from experiments on isolated cardiacmuscle of the rat.15,31,64 Maximum passive myofiberstress was chosen as adaptation stimulus becauseexperimental data obtained in dogs with chronic vol-ume overload suggested that end-diastolic myofiberstress and ejection strain were important mechanical
stimuli for hypertrophy, while peak systolic myofiberstress appeared irrelevant.22 However, when assumingsimilar values of maximum passive myofiber stress inthe three ventricular walls of the TriSeg model, ven-tricular geometry did not develop anatomically accu-rate. Therefore, in our model, we adjusted levels ofmaximum diastolic stress per wall segment (Table 1) sothat after adaptation the weight ratios for the wallsagreed with findings in healthy volunteers.19,28
In this study, the external pressure surrounding theLV and RV free walls was assumed to be zero. The realheart is surrounded by the pericardium, which con-strains increase of total heart volume during volumeoverload. Under resting conditions, the pericardium isbelieved to play a minor role, setting pericardial pres-sure close to zero.42,46,67 However, with acute increaseof total heart volume, the pericardium affects cardiachemodynamics and interaction of the cardiac cham-bers significantly.6,11,25 In our simulations of acutepulmonary hypertension (PHAc), the effect of thepericardium should be considered because of severeRV dilatation (Fig. 5). In the PHAc3 simulation, RVcavity volume even increased by 120% relative to the
0
0.5
1
0 0.2 0.4 0.6 0.80
0.5
1
SW
/LW
tran
smur
alpr
essu
re r
atio
[-]
SW
/LW
mid
wal
lcu
rvat
ure
ratio
[-]
time [s]
NORM PHCh2PHCh1 PHCh3
LVejection
FIGURE 9. Simulated time courses of SW/LW transmuralpressure ratio (upper panel) and SW/LW midwall curvatureratio (lower panel) appear similar revealing a linear relationbetween both ratios at each time point in the cardiac cycle.Simulation duration amounts to one cardiac cycle. Duration ofLV ejection is indicated by vertical dashed lines.
TABLE 4. Simulation results: curvature ratio and transmuralpressure ratio.
Parameter Unit NORM
PHAc PHCh
1 2 3 1 2 3
CR – 0.94 0.85 0.72 0.54 0.81 0.67 0.55
PR – 0.78 0.68 0.57 0.46 0.65 0.52 0.40
CR, septal-to-LV free wall midwall curvature ratio at the moment of
aortic valve closure; NORM, normal simulation; PHAc, acute pul-
monary hypertension simulation; PHCh, chronic pulmonary
hypertension simulation; PR, systolic septal-to-LV free wall trans-
mural pressure ratio.
Patient data:Patients without PHPatients with PH
0 0.2 0.4 0.6 0.8 1
0.2
0.4
0.6
0.8
1
PR [-]
CR
[-]
Flatseptum
Curvedseptum
-0.2
-0.4
Simulation data:NORMPHCh
-0.2-0.4
CR = 1.06 PR + 0.12
CR = 1.03 PR + 0.01
FIGURE 10. Simulation results on the correlation betweencurvature ratio CR and transmural pressure ratio PR (black datapoints), see text for definitions, as compared with the relationextracted from data (gray data points) obtained in patients withand without pulmonary hypertension (PH 5 RV systolic pres-sure > 40 mmHg) [adapted from Dellegrottaglie et al.17]. Linearregression analysis of data points as derived from the NORMand PHCh simulations revealed a strong correlation (bold blackline, r2 5 1.00, SEE 5 0.008) between CR and PR with similarslope as the relation found in patients (thick gray dashed line,r2 5 0.73, SEE 5 0.044). The thin dashed lines indicate the 95%confidence interval of linear regression fit to the patient data.Linear regression formulas are shown for simulated as well asmeasured data points. Symbols: r, regression residual andSEE, standard error of the estimate.
TriSeg Model of Ventricular Interaction 2247

NORM simulation. Together with the changes of rightatrial and LV cavity volumes (45% increase and 10%decrease, respectively), total heart volume increased by25%. In the chronic PH simulations, the effect of thepericardium on ventricular mechanics is likely to be ofminor importance, because measurements demon-strated adaptive dilatation of the pericardium inpatients with chronic pulmonary hypertension.8,24
Comparison of Model Simulations with Measurements
The relation between curvature ratio CR andtransmural pressure ratio PR as extracted from theNORM and PHCh simulations (Fig. 10) agreed quitewell with the relation as found in a patient groupconsisting of patients with and without chronic pul-monary hypertension.17 The relations were about lin-ear with equal slope. In the simulations, however, anoffset was found, shifting the relation to higher CRvalues, implying overestimation of septal curvature fora given right-to-left pressure ratio.
The overestimation of septal curvature may havemany causes. In the model, wall geometry was consid-ered spherical having a clear unique radius of curvatureby definition. The real ventricular walls are not spheri-cal,58 implying that radii of curvature along the cir-cumferential and base-to-apex direction are different.Also, the junction of the real ventricular walls issmoothed over the wall boundaries, thus further hin-dering a clear definition of curvature. Besides an error inthe curvature ratio as derived from the simulations, theoffset might originate from a systematic error in thepressure or curvature measurements obtained inpatients as discussed by Dellegrottaglie et al.17 None-theless, the linear relationship between CR and PRmight be a useful tool for noninvasive estimation ofsystolic RV cavity pressure in patients with RV pressureoverload.17,35,51 In the simulations, the linear relationappeared also valid (<2% deviation) for the PHAc1and PHAc2 simulations (Table 4) as well as after acutechanges (±20%) of mean arterial pressure and cardiacoutput in the chronic pulmonary hypertension simula-tions (not shown in Fig. 10). The latter findings sug-gested that the linear relation between CR and PR isinsensitive to acute changes of hemodynamic status.
Experimental studies with acute manipulation oftransseptal pressure difference as well as clinical studiesamong patients with chronic pulmonary hypertensionshowed that septal curvature and position of the sep-tum between the LV and RV free walls dependinstantaneously on transseptal pressure differ-ence.10,20,21,35,36,52 This dependency was found duringsystole as well as diastole. Similar dependencies werefound in our simulations of pulmonary hypertension.Septal curvature decreased with increase of pulmonary
resistance (Figs. 5 and 6). Furthermore, leftward shiftof the septum, increase of RV volume, and decrease ofLV volume with acute increase of pulmonary resis-tance (Fig. 5), as predicted by the TriSeg model, werealso predicted by Kerckhoffs et al.34 using a finiteelement model of the ventricles coupled to a lumpedcirculation model.
Simulations and clinical observations were inagreement concerning changes in timing of cardiac flowevents due to pulmonary hypertension (Figs. 7 and 8).For example, acceleration time of pulmonary flowvelocity was significantly decreased and varied linearlywith mean pulmonary artery pressure.9,14 Furthermore,RV isovolumic contraction and relaxation timesincreased while pulmonary ejection time decreased.62,70
Moreover, tricuspid E/A-ratio was decreased inpatients with chronic pulmonary hypertension indi-cating deterioration of RV diastolic function.71
Ventricular wall volumes and end-diastolic wallthicknesses (Table 2) in the NORM simulation were allabout 25% smaller than values measured in healthyvolunteers.19,28,57 This difference most likely resultedfrom an overestimation of contractility used in thesarcomere mechanics model (Appendix B, Eq. B7),causing walls to be thinner after adaptation tomechanical load. Furthermore, pulmonary accelera-tion and ejection times as derived from the NORMsimulation (Fig. 8) were underestimated as comparedto data obtained in healthy individuals.9,27 A probablecause is inaccuracy in the model description of sarco-mere mechanics, which is primarily derived fromexperiments on isolated cardiac muscle of therat.15,31,64 Human myocardium under in vivo condi-tions is likely to behave differently.
In the PHCh simulations, LV pump function andhemodynamics were relatively unaffected by increaseof pulmonary resistance (Figs. 6 and 7). Also in ratswith chronic pulmonary hypertension, resting LVpump function remains unaffected as long as themyocardium is able to compensate for increased tissueload by structural adaptation.23 Furthermore, in thePHCh simulations, the RV free wall hypertrophied andRV cavity volume decreased (Table 2 and Fig. 6).These geometric changes were in agreement withexperimental observations in rats with mild chronicpulmonary hypertension.49 In the latter study, chronicpulmonary artery banding resulted in an increase ofRV systolic pressure from 33 to 71 mmHg. Thisincrease of RV afterload resulted in 76% increase ofthickness of the RV free wall and 14% decrease of RVfree wall area, which suggests a small reduction in RVcavity volume. In our simulations, RV systolic pressureincreased from 27 mmHg in the NORM simulation to72 mmHg in the PHCh3 simulation (Fig. 6), end-dia-stolic wall thickness increased 120% (Table 2), and RV
LUMENS et al.2248

cavity volume decreased 8%. In another animal studyin rats,44 it was shown that structural adaptation tochronic increase of RV afterload was associated withconcentric hypertrophy up to a certain level. Beyondthis level, however, the myocardium could not fullycompensate for further load increase. Consequently,the RV cavity dilated, mainly due to dilatation of theRV free wall. In patients with severe chronic pul-monary hypertension, RV free wall hypertrophy isfound to occur together with RV dilatation.12,30 Sec-ondary to RV failure, systolic and diastolic LV func-tion deteriorate by ventricular interaction.38,39 As aresult, cardiac performance deteriorates and exercisecapacity reduces.12,45 These phenomena indicating RVfailure were also found in our PHAc simulations.
In the PHAc simulations, the myocardial tissue wasunable to compensate for increasedRVafterloadby loadadaptation. As a result, mechanical myofiber load wasinhomogeneously distributed over the ventricular walls(Table 3 and Fig. 5). RW stroke work density increasedwith increase of RV afterload, whereas LW and SWstroke work densities decreased. In the PHAc3 simula-tion, RW stroke work density was increased by almost200% with respect to the NORM simulation. Whenassuming stroke work density to be correlated to oxygenconsumption,59 this implies an increase of oxygendemand by the RV free wall. Since oxygen supply is notincluded in our model, the potential effect of perfusionimposed limitations on myocardial performance isunknown in our simulations of pulmonaryhypertension.
In patients with pulmonary hypertension, tricuspidregurgitation often occurs due to RV and tricuspidannular dilatation.18,65 In our simulations, tricuspidvalve regurgitation was not included. In the PHAc3simulation, RV end-diastolic volume was increased byalmost 100% with respect to the NORM simulation. Itis likely that the absence of tricuspid regurgitationresulted in underestimation of RV volume overload inthe PHAc simulations.
The TriSeg model was successfully integrated as amodule in the CircAdapt model of the closed-loopcardiovascular system. As shown previously, theCircAdapt environment is flexible by its modular setupand enables realistic simulation of cardiovascularmechanics and hemodynamics under normal as well asvarious pathological conditions.3,33,40 A set of physi-ological adaptation rules, expressing structural adap-tation of the system to mechanical load, makes themodel self-structuring and reduces the number ofindependent model parameters. For each ventricularwall segment in the TriSeg model, wall volume, mid-wall area, and reference sarcomere length were variedso that mechanical myofiber load was normalized to aknown physiological level, which was assumed to bethe same for all ventricular walls. The field of
application of the CircAdapt model was substantiallyenlarged by implementation of the TriSeg model. Inthe future, the combined model may be used to studyfundamental research questions concerning ventricularinteraction and its role in cardiac pathologies. Forexample, specific material properties may be changedper wall segment in order to study effects of hetero-geneity of wall properties on cardiac mechanics andhemodynamics, e.g., asynchronous mechanical activa-tion (and pacing) or a localized myocardial infarct.33,40
Although the TriSeg model can be easily modified toinclude a description of inhomogeneous myocardialwall properties, a finite element model of cardiacmechanics is more accurate and better suited todescribe local inhomogeneities in mechanical load. Forpatient-specific modeling of the circulation, the modelshould simulate many cycles in order to find a bestmatch with the available set of measurements. For thatpurpose, the TriSeg model is to be preferred becausecalculation effort was about 1,000 times less than thatof a finite element approach. The finite element modelis absolutely needed to estimate and evaluate possibleerrors introduced by the applied simplifications of theTriSeg model. Currently, the CircAdapt model withthe TriSeg module will be evaluated in its possibility tosimulate hemodynamics of pulmonary hypertensionpatient specifically.
CONCLUSIONS
We presented the TriSeg model of ventricularmechanics and hemodynamics incorporating mechan-ical interaction of the LV free wall, RV free wall, andseptal wall, resulting in a strong coupling of LV andRV hemodynamics. The model enables calculation ofLV and RV pressures given the respective cavity vol-umes. LV and RV hemodynamics are related to myo-fiber mechanics in the three ventricular walls, satisfyingthe principle of conservation of energy. The threeventricular walls are mechanically coupled satisfyingequilibrium of tensile forces in their junction. Afterimplementation as a module in the lumped closed-loopCircAdapt model of heart and circulation, the TriSegmodel enables simulation of ventricular hemodynamicsand wall mechanics as functions of time.
Simulations of cardiac mechanics and hemody-namics during normal ventricular loading, acute pul-monary hypertension, and chronic pulmonaryhypertension after load adaptation agreed with clinicaldata as obtained in normal subjects and in chronicpulmonary hypertension patients. With increasinglevels of chronic pulmonary hypertension, the TriSegmodel predicted increase of systolic pulmonary flowacceleration, increase of isovolumic contraction and
TriSeg Model of Ventricular Interaction 2249

relaxation times, and linear decrease of septal-to-LVfree wall curvature ratio. Summarizing, the TriSegmodel realistically describes ventricular mechanicsincluding the interaction between left and right ven-tricular pump mechanics, dynamics of septal geometry,and contractile myofiber function in the three ven-tricular walls.
APPENDIX A: DERIVATIONS OF MECHANICS
OF THE CURVED WALL PATCH
This appendix contains the analytical derivations ofEqs. (15) and (16) relating mechanics of the curvedwall patch to myofiber mechanics. For the derivationof Eq. (16), calculating representative midwall tensionTm from myofiber stress, the logarithmic one-fibermodel relating global ventricular pump mechanics tomyofiber mechanics is used.2 Applying the definition ofmidwall surface as used in Eqs. (3) and (4), for the ratioof transmural pressure pTrans to myofiber stress rf in aclosed thick-walled sphere with midwall volume Vm
and wall volume Vw, it holds:
pTransrf¼ 1
3ln
1þ z
1� z
� �����sphere
with z ¼ Vw
2Vm
����sphere
ðA1Þ
where the definition of z is equivalent to the moregeneral definition used in Eq. (15) for a curved wallpatch. For a closed sphere with midwall surface areaAm and curvature Cm, the relation between pTrans andrepresentative midwall tension Tm is determined byconservation of energy, i.e.,
pTransdVm ¼ TmdAmjsphere ðA2Þ
where dVm and dAm represent small increments of mid-wall volume and area, respectively. Substitution ofVm =
(4/3)pr3, Am = 4pr2, and r = 1/Cm in Eq. (A2) yields:
pTrans ¼ 2TmCm ðA3Þ
Note that Eq. (A3) represents Laplace’s lawexpressed in such a way that the applied scalar definitionof Tm satisfies conservation of energy (Eq. A2).Althoughwe have derived Eq. (A3) for a complete sphere,it also holds for a fraction of the same sphere, sinceboth curvatureCm and tension Tm are local parameters.Thus, Eq. (A3) may also be applied to a spherical wallsegment (Fig. 2c). Substituting Eq. (A3) in Eq. (A1)and applying Cm = (2Amz)/(3Vw) renders for repre-sentative midwall tension Tm in a curved wall patch:
Tm ¼rfVw
2Am� 12z
ln1þ z
1� z
� �ðA4Þ
Note that this latter function is continuous aroundzero curvature. To avoid numerical inaccuracy near
z = 0, Eq. (A4) is replaced by its close fourth-orderpolynomial approximation as specified in Eq. (16)(relative error <2%).
For the derivation of Eq. (15), myofiber strain ef isconsidered a function of two variables, i.e., Am andCm. Applying the principle of conservation of energy,work of the wall by a small area change dAm withtension Tm equals work of the myofibers by a changeof natural myofiber strain def with Cauchy myofiberstress rf:
TmdAm ¼ Vwrfdef ðA5Þ
Rearranging Eq. (A5), substituting Tm with Eq. (A4),and keeping Cm constant renders the following partialderivative:
@ef@Am
¼ 1
4Amzln
1þ z
1� z
� �with z ¼ 3CmVw
2AmðA6Þ
A standard mathematical solution technique is used tofind the general solution of the first-order partial dif-ferential equation in Eq. (A6).16 For that purpose, ef iswritten as the sum of a strain term ef,AC and a strainterm ef,C:
ef ¼ ef;ACðAm;CmÞ þ ef;CðCmÞ ðA7Þ
First, integration of Eq. (A6) with respect to Am
renders strain term ef,AC under the condition that Cm
remains constant during integration:
ef;ACðAm;CmÞ ¼1
2ln
Am
Am;ref
� �þ 1
4zlnð1þ zÞ1þz
ð1� zÞ1�z
!
ðA8Þ
where Am,ref represents a reference value of midwallsurface area Am. Below, the term ef,C will be derived fora relatively simple special case of inflating a closedsphere. The thus found expression is valid for allcombinations of Am and Cm. For a closed thick-walledsphere myofiber strain ef is known as a function of Vm.Using the principle that work as generated by themyofibers equals pump work, it holds:
Vwrfdef ¼ pTransdVmjsphere ðA9Þ
Substitution of Eq. (A1) in Eq. (A9) renders for aclosed sphere:
defdVm
¼ 1
3Vwln
1þ z
1� z
� �����sphere
ðA10Þ
Then, midwall volume Vm and curvature ratio z areexpressed as functions of curvature Cm:
Vm ¼4p3C3
m
����sphere
ðA11Þ
LUMENS et al.2250

z ¼ 3VwC3m
8p
����sphere
ðA12Þ
Substitution of Eqs. (A11) and (A12) in Eq. (A10)results in a differential equation in Cm only. Integra-tion of this differential equation with respect to Cm
yields an expression of myofiber strain ef for a closedsphere as function of Cm (full equation given inAppendix C):
ef ¼ fðCmÞjsphere ðA13Þ
Applying Eq. (A8) to a closed sphere with curvatureCm and substituting the resulting expression as well asEq. (A13) in Eq. (A7), results in the unknown strainterm ef,C (full equation given in Appendix C):
ef;CðCmÞ ¼ efjsphere�ef;ACðAm;CmÞ��sphere
ðA14Þ
Finally, substitution of Eqs. (A8) and (A14) inEq. (A7) yields a complicated analytical expression ofnatural myofiber strain ef in a curved wall patch(Appendix C). Mathematica 5.2 (Wolfram Research,Inc) was used to obtain a simpler fourth-order poly-nomial fit as specified in Eq. (15). This latter expressionclosely approximates the analytical derivation (relativeerror <1%).
APPENDIX B: MODEL OF MYOFIBER
MECHANICS
In this appendix, the applied heuristic relation ispresented that converts natural myofiber strain ef toCauchy myofiber stress rf. This empirical representa-tion of sarcomere contraction simulates experimentson isolated rat cardiac muscle.15,64 Parameter valuesare given in Table B1.
Natural myofiber strain is converted to sarcomerelength Ls by
Ls ¼ Ls;refeef ðB1Þ
The sarcomere has been modeled as a passive ele-ment in parallel with a series combination of a con-tractile element and series elastic element. The time-dependent behavior is described by two state variables,i.e., contractile element length Lsc and mechanicalactivation C. This latter activation parameter is phys-iologically related to intracellular calcium concentra-tion. The time derivative of Lsc depends linearly onlength of the series elastic element (Ls – Lsc) and equalszero for isometric contraction:
dLsc
dt¼ Ls � Lsc
Lse;iso� 1
� �vmax ðB2Þ
where vmax represents velocity of sarcomere shorteningwith zero load and Lse,iso length of the isometricallystressed series elastic element (Table B1). Dependenceon vmax represents the myofiber force–velocity relationso that shortening velocity increases with appliedexternal force.
The time derivative of C is heuristically obtained,having separate terms to describe rise and decay ofmechanical activation C:
dC
dt¼ 1
sR� CLðLscÞ � FriseðtÞ þ
1
sD� Crest � C
1þ e TðLscÞ�tð Þ=sD
ðB3Þ
Parameters sR and sD are scaling rise and decay time,respectively (Table B1). Symbols t and Crest representtime and diastolic resting level of activation, respec-tively. Functions CL, Frise, and T describe increase ofactivation with sarcomere length, rise of mechanicalactivation, and decrease of activation duration withdecrease of sarcomere length, respectively:
CLðLscÞ ¼ tanh 4:0ðLsc � Lsc0Þ2� �
ðB4Þ
FriseðtÞ ¼ 0:02 � x3ð8� xÞ2e�x
with x ¼ min 8;maxð0; t=sRÞð Þ (B5)
TðLscÞ ¼ sscð0:29þ 0:3LscÞ ðB6Þ
where Lsc0 and ssc represent contractile element lengthwith zero load and a time factor scaling duration ofcontraction, respectively (Table B1).
Active myofiber stress rf,act depends on length ofseries elastic element, Lsc, and C:
rf;act ¼ ract � C � ðLsc � Lsc0Þ �Ls � Lsc
Lse;isoðB7Þ
TABLE B1. Parameter values of the sarcomere mechanicsmodel.
Symbol Unit Value Parameter description
Crest – 0.02 Diastolic resting level of activation
Lsc0 lm 1.51 Contractile element length
with zero active stress
Ls,ref lm 2.0 Reference sarcomere length
at zero strain
Lse,iso lm 0.04 Length of isometrically stressed
series elastic element
vmax lm s�1 7 Sarcomere shortening velocity
with zero load
sD ms 32 Factor scaling contraction decay time
sR ms 48 Factor scaling contraction rise time
ssc ms 425 Factor scaling duration of contraction
ract kPa 120 Factor scaling active myofiber stress
rpas kPa 7 Factor scaling passive myofiber
stress
TriSeg Model of Ventricular Interaction 2251

In order to simulate the contributions of titin as wellas collagen to passive myocardial stiffness,69 passivestress rf,pas represents a soft behavior for low myofiberstrain and a stiff behavior for large positive strain:
rf;pas ¼ rpas
�36 �maxð0; ef � 0:1Þ2 þ 0:1ðef � 0:1Þ
þ 0:0025e30ef�
(B8)
The value of rpas has been adapted so that atmaximum sarcomere length with exercise, passivemyofiber stress assumes the maximum value (Table 1:Set point values for adaptation). Total Cauchy myofiberstress rf is the sum of active and passive stress:
rfðefÞ ¼ rf;pas þ rf;act ðB9Þ
The latter result has been substituted in Eq. (16).
APPENDIX C: POLYNOMIAL SERIES
APPROXIMATIONS
The polynomial series approximation given byEq. (15) is obtained from the analytical solutionexpressing natural myofiber strain in terms of Am andCm (Eq. A7) by applying the following steps:
1. Expression of myofiber strain ef for a closedsphere (use Am = 4p/Cm
2 ) as function of Cm
(Eq. A13) yields:
efjsphere¼ � lnðCmÞ þlnð8pÞ
3þ GðxÞ
6ðC1aÞ
GðxÞ ¼ 1
x� ln ð1þ xÞ1þx
ð1� xÞ1�x
!ðC1bÞ
x ¼ zjsphere¼3C3
mVw
8pðC1cÞ
2. Applying Eq. (A8) to a closed sphere (useAm = 4p/Cm
2 ) yields:
ef;AC
��sphere¼ � lnðCmÞ þ
1
2� ln 4p
Am;ref
� �þ GðxÞ
4
ðC2Þ
Substitution of Eqs. (C1a) and (C2) inEq. (A14) yields for strain term ef,C:
ef;C ¼lnð8pÞ
3� 1
2� ln 4p
Am;ref
� �� GðxÞ
12ðC3Þ
The thus found expression for ef,C, which holdsfor the special case of inflating a sphere, is validfor all combinations of Am and Cm.
3. Substitution of Eqs. (C3) and (A8) in Eq. (A7)yields the general analytical solution of naturalmyofiber strain ef in a curved wall patch:
ef ¼lnð8pÞ
3� 1
2� ln 4p
Am;ref
� �þ 1
2� ln Am
Am;ref
� �
� GðxÞ12þ GðzÞ
4(C4)
4. In order to facilitate series approximation, z =
K/A and x = K3 are substituted in Eq. (C4):
ef ¼lnð8pÞ
3� 1
2� ln 4p
Am;ref
� �þ 1
2� ln Am
Am;ref
� �
� 1
12K3� ln ð1þ K3Þ1þK
3
ð1� K3Þ1�K3
!
þ A
4K� ln
1þ KA
� �1þKA
1� KA
� �1�KA
0@
1A (C5a)
with A and K representing normalized area andcurvature, respectively:
A ¼ Amffiffiffiffiffiffiffiffiffiffiffiffi9pV2
w3p ðC5bÞ
K ¼ Cm
2
ffiffiffiffiffiffiffiffiffi3Vw
p3
rðC5cÞ
5. Thefirst two termsofEq. (C5a) are constant strainoffsets and are therefore eliminated from thestrain relation,whichdescribes the transition froma reference to a new state with state variables Am
and Cm. Taylor series approximation of this sim-plified version of Eq. (C5a) yields:
ef¼1
2�ln Am
Am;ref
� �� K2
12A2� K4
40A4þOðK6Þ ðC6Þ
where O(K6) represents the higher order terms.
6. It is used that z = K/A. Furthermore, the fourth-order polynomial approximation of naturalmyofiber strain in a curved wall patch (Eq. 15) isobtained after slight adjustment of the fourth-order term of Eq. (C6) for best accuracy withinthe whole range of operation (|z|< 0.8).
The polynomial series approximation given byEq. (16) is obtained from the analytical solutionexpressing representative midwall tension in terms ofAm,Cm, and rf (Eq. A4) by applying the following steps:
1. Substitution of z ¼ 3CmVw=2Am in Eq. (A4)yields:
Tm
rf¼ 1
6Cmln
2Am þ 3CmVw
2Am � 3CmVw
� �ðC7Þ
LUMENS et al.2252

2. Similar to what has been done to obtain Eq.(C5a), A and K are substituted in Eq. (C7) tofacilitate series approximation:
Tm
rf¼ L
6Kln
1þ KA
1� KA
!ðC8aÞ
with
L ¼ 1
2
ffiffiffiffiffiffiffiffiffi3Vw
p3
rðC8bÞ
3. Taylor series approximation of Eq. (C8a)yields:
Tm
rf¼ L
3Aþ LK2
9A3þ LK4
15A5þOðK6Þ ðC9Þ
where O(K6) represents the higher order terms,which are neglected in the TriSeg model.
4. Finally, the fourth-order polynomial approxi-mation of representative midwall tension(Eq. 16), is obtained by rearranging Eq. (C9)and using z = K/A.
ACKNOWLEDGMENTS
We gratefully acknowledge the financial support ofActelion Pharmaceuticals Nederland B.V. (Woerden,The Netherlands) and the Netherlands Heart Foun-dation Grant 2007B203.
OPEN ACCESS
This article is distributed under the terms of theCreative Commons Attribution Noncommercial Li-cense which permits any noncommercial use, distri-bution, and reproduction in any medium, provided theoriginal author(s) and source are credited.
REFERENCES
1Arts, T., P. Bovendeerd, T. Delhaas, and F. Prinzen.Modeling the relation between cardiac pump function andmyofiber mechanics. J. Biomech. 36:731–736, 2003.2Arts, T., P. H. Bovendeerd, F. W. Prinzen, and R. S.Reneman. Relation between left ventricular cavity pressureand volume and systolic fiber stress and strain in the wall.Biophys. J. 59:93–102, 1991.3Arts, T., T. Delhaas, P. Bovendeerd, X. Verbeek, andF. W. Prinzen. Adaptation to mechanical load determinesshape and properties of heart and circulation: the Circ-Adapt model. Am. J. Physiol. Heart Circ. Physiol.288:H1943–H1954, 2005.4Arts, T., F. W. Prinzen, L. H. Snoeckx, J. M. Rijcken, andR. S. Reneman. Adaptation of cardiac structure by
mechanical feedback in the environment of the cell: amodel study. Biophys. J. 66:953–961, 1994.5Baker, A. E., R. Dani, E. R. Smith, J. V. Tyberg, andI. Belenkie. Quantitative assessment of independent con-tributions of pericardium and septum to direct ventricularinteraction. Am. J. Physiol. 275:H476–H483, 1998.6Belenkie, I., R. Dani, E. R. Smith, and J. V. Tyberg. Theimportance of pericardial constraint in experimental pul-monary embolism and volume loading. Am. Heart J.123:733–742, 1992.7Beyar, R., S. J. Dong, E. R. Smith, I. Belenkie, and J. V.Tyberg. Ventricular interaction and septal deformation: amodel compared with experimental data. Am. J. Physiol.265:H2044–H2056, 1993.8Blanchard, D. G., and H. C. Dittrich. Pericardial adapta-tion in severe chronic pulmonary hypertension. An intra-operative transesophageal echocardiographic study.Circulation 85:1414–1422, 1992.9Bossone, E., E. Avelar, D. S. Bach, B. Gillespie,M. Rubenfire, and W. F. Armstrong. Diagnostic value ofresting tricuspid regurgitation velocity and right ventricu-lar ejection flow parameters for the detection of exerciseinduced pulmonary arterial hypertension. Int. J. Card.Imaging 16:429–436, 2000.
10Brinker, J. A., J. L. Weiss, D. L. Lappe, J. L. Rabson,W. R. Summer, S. Permutt, and M. L. Weisfeldt. Leftwardseptal displacement during right ventricular loading inman. Circulation 61:626–633, 1980.
11Calvin, J. E. Optimal right ventricular filling pressures andthe role of pericardial constraint in right ventricularinfarction in dogs. Circulation 84:852–861, 1991.
12Chemla, D., V. Castelain, P. Herve, Y. Lecarpentier, andS. Brimioulle. Haemodynamic evaluation of pulmonaryhypertension. Eur. Respir. J. 20:1314–1331, 2002.
13Chung, D. C., S. C. Niranjan, J. W. Clark, Jr., A. Bidani,W. E. Johnston, J. B. Zwischenberger, and D. L. Traber. Adynamic model of ventricular interaction and pericardialinfluence. Am. J. Physiol. 272:H2942–H2962, 1997.
14Dabestani, A., G. Mahan, J. M. Gardin, K. Takenaka,C. Burn, A. Allfie, and W. L. Henry. Evaluation of pul-monary artery pressure and resistance by pulsed Dopplerechocardiography. Am. J. Cardiol. 59:662–668, 1987.
15de Tombe, P. P., and H. E. ter Keurs. Force and velocity ofsarcomere shortening in trabeculae from rat heart. Effectsof temperature. Circ. Res. 66:1239–1254, 1990.
16Debnath, L. Nonlinear Partial Differential Equations forScientists and Engineers (2nd ed.). Boston: Birkhauser,p. 737, 2005.
17Dellegrottaglie, S., J. Sanz, M. Poon, J. F. Viles-Gonzalez,R. Sulica, M. Goyenechea, F. Macaluso, V. Fuster, andS. Rajagopalan. Pulmonary hypertension: accuracy ofdetection with left ventricular septal-to-free wall curvatureratio measured at cardiac MR. Radiology 243:63–69, 2007.
18Dittrich, H. C., H. A. McCann, and D. G. Blanchard.Cardiac structure and function in chronic thromboembolicpulmonary hypertension. Am. J. Card. Imaging 8:18–27,1994.
19Doherty, 3rd, N. E., N. Fujita, G. R. Caputo, and C. B.Higgins. Measurement of right ventricular mass in normaland dilated cardiomyopathic ventricles using cine magneticresonance imaging. Am. J. Cardiol. 69:1223–1228, 1992.
20Dong, S. J., A. P. Crawley, J. H. MacGregor, Y. F.Petrank, D. W. Bergman, I. Belenkie, E. R. Smith, J. V.Tyberg, and R. Beyar. Regional left ventricular systolicfunction in relation to the cavity geometry in patients with
TriSeg Model of Ventricular Interaction 2253

chronic right ventricular pressure overload. A three-dimensional tagged magnetic resonance imaging study.Circulation 91:2359–2370, 1995.
21Dong, S. J., E. R. Smith, and J. V. Tyberg. Changes in theradius of curvature of the ventricular septum at end dias-tole during pulmonary arterial and aortic constrictions inthe dog. Circulation 86:1280–1290, 1992.
22Donker, D. W., P. G. Volders, T. Arts, B. C. Bekkers,L. Hofstra, R. L. Spatjens, J. D. Beekman, M. Borgers,H. J. Crijns, and M. A. Vos. End-diastolic myofiber stressand ejection strain increase with ventricular volume over-load—serial in vivo analyses in dogs with complete atrio-ventricular block. Basic Res. Cardiol. 100:372–382, 2005.
23Faber,M. J.,M.Dalinghaus, I.M.Lankhuizen, P. Steendijk,W.C.Hop,R.G. Schoemaker,D. J.Duncker, J.M. Lamers,and W. A. Helbing. Right and left ventricular function afterchronic pulmonary artery banding in rats assessed withbiventricular pressure–volume loops. Am. J. Physiol. HeartCirc. Physiol. 291:H1580–H1586, 2006.
24Freeman, G. L., and M. M. LeWinter. Pericardial adap-tations during chronic cardiac dilation in dogs. Circ. Res.54:294–300, 1984.
25Freeman, G. L., and M. M. LeWinter. Role of parietalpericardium in acute, severe mitral regurgitation in dogs.Am. J. Cardiol. 54:217–219, 1984.
26Fujii, J., Y. Yazaki, H. Sawada, T. Aizawa, H. Watanabe,and K. Kato. Noninvasive assessment of left and rightventricular filling in myocardial infarction with a two-dimensional Doppler echocardiographic method. J. Am.Coll. Cardiol. 5:1155–1160, 1985.
27Gardin, J. M., C. S. Burn, W. J. Childs, and W. L. Henry.Evaluation of blood flow velocity in the ascending aortaand main pulmonary artery of normal subjects by Dopplerechocardiography. Am. Heart J. 107:310–319, 1984.
28Hajduczok, Z. D., R. M. Weiss, W. Stanford, and M. L.Marcus. Determination of right ventricular mass inhumans and dogs with ultrafast cardiac computed tomo-graphy. Circulation 82:202–212, 1990.
29Hirschfeld, S., R. Meyer, D. C. Schwartz, J. Korfhagen,and S. Kaplan. Measurement of right and left ventricularsystolic time intervals by echocardiography. Circulation51:304–309, 1975.
30Horan, L. G., N. C. Flowers, and C. J. Havelda. Relationbetween right ventricular mass and cavity size: an analysisof 1500 human hearts. Circulation 64:135–138, 1981.
31Hunter, P. J., A. D. McCulloch, and H. E. ter Keurs.Modelling the mechanical properties of cardiac muscle.Prog. Biophys. Mol. Biol. 69:289–331, 1998.
32Kaul, S. The interventricular septum in health and disease.Am. Heart J. 112:568–581, 1986.
33Kerckhoffs, R. C., J. Lumens, K. Vernooy, J. H. Omens,L. J. Mulligan, T. Delhaas, T. Arts, A. D. McCulloch, andF. W. Prinzen. Cardiac resynchronization: insight fromexperimental and computational models. Prog. Biophys.Mol. Biol. 97:543–561, 2008.
34Kerckhoffs, R. C., M. L. Neal, Q. Gu, J. B.Bassingthwaighte, J. H. Omens, and A. D. McCulloch.Coupling of a 3D finite element model of cardiac ventric-ular mechanics to lumped systems models of the systemicand pulmonic circulation. Ann. Biomed. Eng. 35:1–18, 2007.
35King, M. E., H. Braun, A. Goldblatt, R. Liberthson, andA. E. Weyman. Interventricular septal configuration as apredictor of right ventricular systolic hypertension in chil-dren: a cross-sectional echocardiographic study. Circulation68:68–75, 1983.
36Kingma, I., J. V. Tyberg, and E. R. Smith. Effects of dia-stolic transseptal pressure gradient on ventricular septalposition and motion. Circulation 68:1304–1314, 1983.
37Little, W. C., R. C. Reeves, J. Arciniegas, R. E. Katholi,and E. W. Rogers. Mechanism of abnormal interventricu-lar septal motion during delayed left ventricular activation.Circulation 65:1486–1491, 1982.
38Louie, E. K., S. S. Lin, S. I. Reynertson, B. H. Brundage,S. Levitsky, and S. Rich. Pressure and volume loading ofthe right ventricle have opposite effects on left ventricularejection fraction. Circulation 92:819–824, 1995.
39Louie, E. K., S. Rich, S. Levitsky, and B. H. Brundage.Doppler echocardiographic demonstration of the differen-tial effects of right ventricular pressure and volume over-load on left ventricular geometry and filling. J. Am. Coll.Cardiol. 19:84–90, 1992.
40Lumens, J., T. Delhaas, B. Kirn, and T. Arts. Modelingventricular interaction: a multiscale approach from sarco-mere mechanics to cardiovascular system hemodynamics.Pac. Symp. Biocomput. 378–389, 2008.
41Luo, C., D. L. Ware, J. B. Zwischenberger, and J. W.Clark, Jr. Using a human cardiopulmonary model to studyand predict normal and diseased ventricular mechanics,septal interaction, and atrio-ventricular blood flow pat-terns. Cardiovasc. Eng. 7:17–31, 2007.
42Mangano, D. T., D. C. Van Dyke, R. F. Hickey, and R. J.Ellis. Significance of the pericardium in human subjects:effects on left ventricular volume, pressure and ejection.J. Am. Coll. Cardiol. 6:290–295, 1985.
43Maughan, W. L., K. Sunagawa, and K. Sagawa. Ventric-ular systolic interdependence: volume elastance model inisolated canine hearts. Am. J. Physiol. 253:H1381–H1390,1987.
44Minami, S., T. Onodera, F. Okazaki, H. Miyazaki,S. Ohsawa, and S. Mochizuki. Myocyte morphologicalcharacteristics differ between the phases of pulmonaryhypertension-induced ventricular hypertrophy and failure.Int. Heart J. 47:629–637, 2006.
45Miyamoto, S., N. Nagaya, T. Satoh, S. Kyotani,F. Sakamaki, M. Fujita, N. Nakanishi, and K. Miyatake.Clinical correlates and prognostic significance of six-minutewalk test in patients with primary pulmonary hypertension.Comparison with cardiopulmonary exercise testing. Am. J.Respir. Crit. Care Med. 161:487–492, 2000.
46Morris-Thurgood, J. A., and M. P. Frenneaux. Diastolicventricular interaction and ventricular diastolic filling.Heart Fail. Rev. 5:307–323, 2000.
47Nash, M. P., and P. J. Hunter. Computational mechanicsof the heart: from tissue structure to ventricular function.J. Elast. 61:113–141, 2000.
48Olansen, J. B., J. W. Clark, D. Khoury, F. Ghorbel, andA. Bidani. A closed-loop model of the canine cardiovas-cular system that includes ventricular interaction. Comput.Biomed. Res. 33:260–295, 2000.
49Olivetti, G., R. Ricci, C. Lagrasta, E. Maniga, E. H.Sonnenblick, and P. Anversa. Cellular basis of wall remod-eling in long-term pressure overload-induced right ventric-ular hypertrophy in rats. Circ. Res. 63:648–657, 1988.
50Olsen, C. O., G. S. Tyson, G. W. Maier, J. A. Spratt, J. W.Davis, and J. S. Rankin. Dynamic ventricular interaction inthe conscious dog. Circ. Res. 52:85–104, 1983.
51Reisner, S. A., Z. Azzam, M. Halmann, D. Rinkevich,S. Sideman, W. Markiewicz, and R. Beyar. Septal/free wallcurvature ratio: a noninvasive index of pulmonary arterialpressure. J. Am. Soc. Echocardiogr. 7:27–35, 1994.
LUMENS et al.2254

52Roeleveld, R. J., J. T. Marcus, T. J. Faes, T. J. Gan,A. Boonstra, P. E. Postmus, and A. Vonk-Noordegraaf.Interventricular septal configuration at mr imaging andpulmonary arterial pressure in pulmonary hypertension.Radiology 234:710–717, 2005.
53Santamore, W. P., and D. Burkhoff. Hemodynamic con-sequences of ventricular interaction as assessed by modelanalysis. Am. J. Physiol. 260:H146–H157, 1991.
54Sechtem, U., P. W. Pflugfelder, R. G. Gould, M. M.Cassidy, and C. B. Higgins. Measurement of right and leftventricular volumes in healthy individuals with cine MRimaging. Radiology 163:697–702, 1987.
55Slinker, B. K., and S. A. Glantz. End-systolic and end-diastolic ventricular interaction. Am. J. Physiol. 251:H1062–H1075, 1986.
56Smith, B. W., J. G. Chase, G. M. Shaw, and R. I. Nokes.Simulating transient ventricular interaction using a mini-mal cardiovascular system model. Physiol. Meas. 27:165–179, 2006.
57Stolzmann, P., H. Scheffel, S. Leschka, T. Schertler,T. Frauenfelder, P. A. Kaufmann, B. Marincek, andH. Alkadhi. Reference values for quantitative left ventric-ular and left atrial measurements in cardiac computedtomography. Eur. Radiol. 18:1625–1634, 2008.
58Streeter Jr., D. D. Gross morphology and fiber geometry ofthe heart. In: Handbook of Physiology, edited by R. M.Berne, N. Sperelakis, and S. R. Geiger. Bethesda, MD:American Physiological Society, 1979, pp. 61–112.
59Suga, H., T. Hayashi, and M. Shirahata. Ventricular sys-tolic pressure–volume area as predictor of cardiac oxygenconsumption. Am. J. Physiol. 240:H39–H44, 1981.
60Sun, Y.,M. Beshara, R. J. Lucariello, and S. A. Chiaramida.A comprehensivemodel for right-left heart interaction underthe influence of pericardium and baroreflex. Am. J. Physiol.272:H1499–H1515, 1997.
61Taher, M. F., W. P. Santamore, and D. K. Bogen. Ven-tricular interaction is described by three coupling coeffi-cients. Am. J. Physiol. 266:H228–H234, 1994.
62Tei, C., K. S. Dujardin, D. O. Hodge, K. R. Bailey, M. D.McGoon, A. J. Tajik, and S. B. Seward. Doppler echo-cardiographic index for assessment of global right ven-tricular function. J. Am. Soc. Echocardiogr. 9:838–847,1996.
63Tei, C., K. S. Dujardin, D. O. Hodge, R. A. Kyle, A. J.Tajik, and J. B. Seward. Doppler index combining systolicand diastolic myocardial performance: clinical value incardiac amyloidosis. J. Am. Coll. Cardiol. 28:658–664,1996.
64ter Keurs, H. E., W. H. Rijnsburger, R. van Heuningen,and M. J. Nagelsmit. Tension development and sarcomerelength in rat cardiac trabeculae. Evidence of length-dependent activation. Circ. Res. 46:703–714, 1980.
65Thistlethwaite, P.A., andS.W. Jamieson. Tricuspid valvulardisease in the patient with chronic pulmonary thromboem-bolic disease. Curr. Opin. Cardiol. 18:111–116, 2003.
66Usyk, T. P., I. J. Le Grice, and A. D. McCulloch. Com-putational model of three-dimensional cardiac electrome-chanics. Comput. Vis. Sci. 4:249–257, 2002.
67Watkins, M. W., and M. M. LeWinter. Physiologic role ofthe normal pericardium. Annu. Rev. Med. 44:171–180,1993.
68Weber, K. T., J. S. Janicki, S. Shroff, and A. P. Fishman.Contractile mechanics and interaction of the right and leftventricles. Am. J. Cardiol. 47:686–695, 1981.
69Wu, Y., O. Cazorla, D. Labeit, S. Labeit, and H. Granzier.Changes in titin and collagen underlie diastolic stiffnessdiversity of cardiac muscle. J. Mol. Cell. Cardiol. 32:2151–2162, 2000.
70Yeo, T. C., K. S. Dujardin, C. Tei, D. W. Mahoney, M. D.McGoon, and J. B. Seward. Value of a Doppler-derivedindex combining systolic and diastolic time intervals inpredicting outcome in primary pulmonary hypertension.Am. J. Cardiol. 81:1157–1161, 1998.
71Yu, C. M., J. E. Sanderson, S. Chan, L. Yeung, Y. T.Hung, and K. S. Woo. Right ventricular diastolic dys-function in heart failure. Circulation 93:1509–1514, 1996.
TriSeg Model of Ventricular Interaction 2255
Related Documents