NAVAL POSTGRADUATE SCHOOL Monterey, California THESIS CONCEPTUAL DESIGN TOOLS FOR THE NPS SPACECRAFT DESIGN CENTER by Michael N. Abreu September 2001 Thesis Advisor: Brij N. Agrawal Second Reader: Joseph Aguilar Christopher Taylor Approved for public release; distribution is unlimited

Welcome message from author
This document is posted to help you gain knowledge. Please leave a comment to let me know what you think about it! Share it to your friends and learn new things together.
Transcript
NAVAL POSTGRADUATE SCHOOL Monterey, California
THESIS
CONCEPTUAL DESIGN TOOLS FOR THE NPS SPACECRAFT DESIGN CENTER
by
Michael N. Abreu
September 2001
Thesis Advisor: Brij N. Agrawal Second Reader: Joseph Aguilar Christopher Taylor
Approved for public release; distribution is unlimited
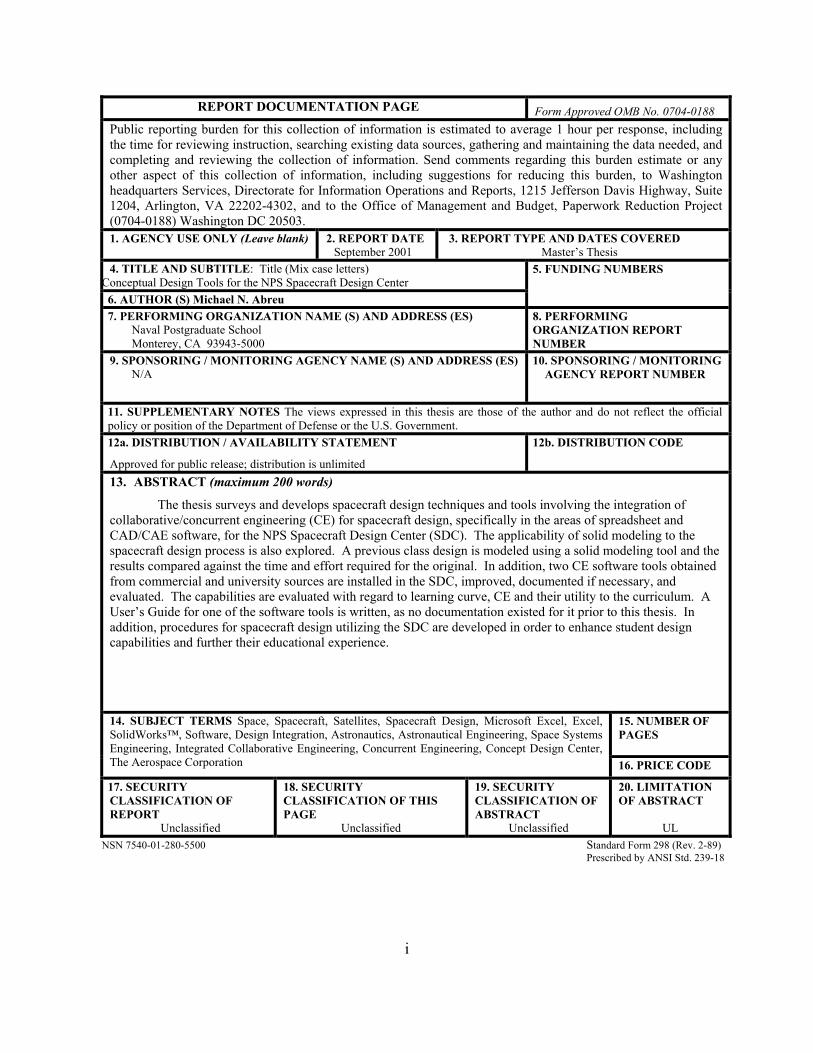
REPORT DOCUMENTATION PAGE Form Approved OMB No. 0704-0188 Public reporting burden for this collection of information is estimated to average 1 hour per response, including the time for reviewing instruction, searching existing data sources, gathering and maintaining the data needed, and completing and reviewing the collection of information. Send comments regarding this burden estimate or any other aspect of this collection of information, including suggestions for reducing this burden, to Washington headquarters Services, Directorate for Information Operations and Reports, 1215 Jefferson Davis Highway, Suite 1204, Arlington, VA 22202-4302, and to the Office of Management and Budget, Paperwork Reduction Project (0704-0188) Washington DC 20503. 1. AGENCY USE ONLY (Leave blank)
2. REPORT DATE September 2001
3. REPORT TYPE AND DATES COVERED Master’s Thesis
4. TITLE AND SUBTITLE: Title (Mix case letters) Conceptual Design Tools for the NPS Spacecraft Design Center 6. AUTHOR (S) Michael N. Abreu
5. FUNDING NUMBERS
7. PERFORMING ORGANIZATION NAME (S) AND ADDRESS (ES) Naval Postgraduate School Monterey, CA 93943-5000
8. PERFORMING ORGANIZATION REPORT NUMBER
9. SPONSORING / MONITORING AGENCY NAME (S) AND ADDRESS (ES) N/A
10. SPONSORING / MONITORING AGENCY REPORT NUMBER
11. SUPPLEMENTARY NOTES The views expressed in this thesis are those of the author and do not reflect the official policy or position of the Department of Defense or the U.S. Government. 12a. DISTRIBUTION / AVAILABILITY STATEMENT
Approved for public release; distribution is unlimited
12b. DISTRIBUTION CODE
13. ABSTRACT (maximum 200 words)
The thesis surveys and develops spacecraft design techniques and tools involving the integration of collaborative/concurrent engineering (CE) for spacecraft design, specifically in the areas of spreadsheet and CAD/CAE software, for the NPS Spacecraft Design Center (SDC). The applicability of solid modeling to the spacecraft design process is also explored. A previous class design is modeled using a solid modeling tool and the results compared against the time and effort required for the original. In addition, two CE software tools obtained from commercial and university sources are installed in the SDC, improved, documented if necessary, and evaluated. The capabilities are evaluated with regard to learning curve, CE and their utility to the curriculum. A User’s Guide for one of the software tools is written, as no documentation existed for it prior to this thesis. In addition, procedures for spacecraft design utilizing the SDC are developed in order to enhance student design capabilities and further their educational experience.
15. NUMBER OF PAGES
14. SUBJECT TERMS Space, Spacecraft, Satellites, Spacecraft Design, Microsoft Excel, Excel, SolidWorks™, Software, Design Integration, Astronautics, Astronautical Engineering, Space Systems Engineering, Integrated Collaborative Engineering, Concurrent Engineering, Concept Design Center, The Aerospace Corporation 16. PRICE CODE
17. SECURITY CLASSIFICATION OF REPORT
Unclassified
18. SECURITY CLASSIFICATION OF THIS PAGE
Unclassified
19. SECURITY CLASSIFICATION OF ABSTRACT
Unclassified
20. LIMITATION OF ABSTRACT
UL
NSN 7540-01-280-5500 Standard Form 298 (Rev. 2-89) Prescribed by ANSI Std. 239-18
i

THIS PAGE INTENTIONALLY LEFT BLANK
ii
iii

THIS PAGE INTENTIONALLY LEFT BLANK
iv
ABSTRACT
The thesis surveys and develops spacecraft design techniques and tools involving
the integration of collaborative/concurrent engineering (CE) for spacecraft design,
specifically in the areas of spreadsheet and CAD/CAE software, for the NPS Spacecraft
Design Center (SDC). The applicability of solid modeling to the spacecraft design
process is also explored. A previous class design is modeled using a solid modeling tool
and the results compared against the time and effort required for the original. In addition,
two CE software tools obtained from commercial and university sources are installed in
the SDC, improved, documented if necessary, and evaluated. The capabilities are
evaluated with regard to learning curve, CE and their utility to the curriculum. A User’s
Guide for one of the software tools is written, as no documentation existed for it prior to
this thesis. In addition, procedures for spacecraft design utilizing the SDC are developed
in order to enhance student design capabilities and further their educational experience.
v

THIS PAGE INTENTIONALLY LEFT BLANK
vi

DISCLAIMER
The views expressed in this thesis are those of the author and do not reflect the
official policy or position of the United States Navy, Department of Defense or the U.S.
Government.
While every attempt has been made to thoroughly document the software and its
modifications described herein, the author makes no guarantees as to the performance of
the software. As with any new software tool, the reader should take precautions to
validate all equations, computations, and functional integrity during use.
vii

THIS PAGE INTENTIONALLY LEFT BLANK
viii
TABLE OF CONTENTS
I. INTRODUCTION........................................................................................................1 A. BACKGROUND ..............................................................................................1 B. SCOPE ..............................................................................................................3
II. THE CONCEPT DESIGN CENTER.........................................................................7 A. OVERVIEW.....................................................................................................7 B. TEAM, PROCESS, AND FACILITY............................................................8
III. SOLID MODELING AND INTEGRATED DESIGN............................................13 A. REVOLUTION IN THE DESIGN PROCESS............................................13 B. INTEGRATION INTO SPACECRAFT DESIGN .....................................15
IV. CDC AND THE NPS SPACECRAFT DESIGN CENTER ...................................27 A. OVERVIEW...................................................................................................27 B. SYSTEMS WORKBOOK.............................................................................28
1. Inputs ..................................................................................................29 2. Outputs................................................................................................29 3. Guidelines ...........................................................................................30 4. Summary.............................................................................................31 5. Audit....................................................................................................44 6. TRL .....................................................................................................45 7. Calculations ........................................................................................46
C. SOLIDWORKS™ AND DRAWCRAFT INTEGRATION.......................47 D. CDC DATA TRANSFER AND CONTROL ARCHITECTURE .............50
1. File and Link Structure .....................................................................50 2. Data Flow Architecture .....................................................................52 3. Modifying Links, Adding Workbooks and Sheets ..........................53 4. Cautions ..............................................................................................55
E. VISUAL BASIC FOR APPLICATIONS (VBA) CODE............................55 1. Overview .............................................................................................55 2. Auto Open Macro ..............................................................................57 3. Update Macro.....................................................................................58 4. Save Data Macro................................................................................60 5. Audit Links Macro.............................................................................61 6. Display Links and Software Information Macros ..........................62 7. Modifications, Additions, and Cautions ..........................................63
V. SPACECRAFT DESIGN AT THE NPS SDC.........................................................65 A. SDC DESCRIPTION.....................................................................................65 B. SYSTEM/SUBSYSTEM SETUP..................................................................66 C. DESIGN ..........................................................................................................67 D. DOCUMENTATION/DESIGN ARCHIVING ...........................................68
VI. SUMMARY, CONCLUSIONS, AND RECOMMENDATIONS ..........................71 A. SUMMARY ....................................................................................................71
ix
B. CONCLUSIONS ............................................................................................72 C. RECOMMENDATIONS...............................................................................73
APPENDIX A. POINTS OF CONTACT............................................................................75
APPENDIX B. CDC SYSTEMS WORKBOOK SHEETS ...............................................77
APPENDIX C. SYSTEMS WORKBOOK VBA CODE ...................................................85
LIST OF REFERENCES......................................................................................................95
INITIAL DISTRIBUTION LIST .........................................................................................97
x
LIST OF FIGURES
Figure 2.1 The CDC Space Segment Team (courtesy of The Aerospace Corporation). ..........8 Figure 2.2 CDC facility (courtesy of The Aerospace Corporation)..........................................9 Figure 3.1 SolidWorks™ model by Michael Davis [From: Ref. 3]. .....................................15 Figure 3.2 Mithra spacecraft in the launch vehicle fairing.....................................................17 Figure 3.3 Mithra Relay Mirror satellite.................................................................................18 Figure 3.4 Mithra bus assembly..............................................................................................19 Figure 3.5 Mithra equipment bays, AutoCAD. ......................................................................20 Figure 3.6 Mithra bays depicted with SolidWorks™.............................................................20 Figure 3.7 Mass properties in SolidWorks™. ........................................................................22 Figure 3.8 SolidWorks™ model of Delta III LV fairing, Mithra bus attached. ......................23 Figure 3.9 Mithra bus moved within Delta III fairing, collision detection on.........................25 Figure 4.1 Systems workbook, Inputs worksheet. ..................................................................29 Figure 4.2 Systems Outputs sheet linked to the Summary sheet. ...........................................30 Figure 4.3 Guidelines sheet.....................................................................................................31 Figure 4.4 Summary sheet data transfer control section.........................................................32 Figure 4.5 Inputs section of the Systems Summary sheet. .....................................................33 Figure 4.6 The Orbit Parameters section of the Systems Summary sheet. .............................34 Figure 4.7 Mass and Power section of the Summary sheet. ...................................................35 Figure 4.8 Satellite Summary section. ....................................................................................36 Figure 4.9 Total time spent in daylight and eclipse. ...............................................................37 Figure 4.10 Convergence section.............................................................................................39 Figure 4.11 Percent Change Calculation controls....................................................................40 Figure 4.12 Percent change alert..............................................................................................40 Figure 4.13 Activated Launch Mass Convergence chart. ........................................................42 Figure 4.14 Launch Mass Convergence, source range set to update times two. .....................43 Figure 4.15 Launch Mass Convergence, source range set to update times three. ...................44 Figure 4.16 Audit sheet............................................................................................................45 Figure 4.17 NASA TRL Levels (From: Ref. 4). Arrow denotes increasing risk...................46 Figure 4.18 Mars Polar Lander model created by Caltech. .....................................................47 Figure 4.19 Thruster cluster created in SolidWorks™ with DrawCraft. .................................48 Figure 4.20 SolidWorks™ Mass Properties. ...........................................................................49 Figure 4.21 Workbooks in D:\\Aerospace Tools\CDC............................................................51 Figure 4.22 Subsystem Output sheet to Systems Input sheet. .................................................52 Figure 4.23 CDC Data Transfer and Control Architecture......................................................53 Figure 4.24 Links control box..................................................................................................54 Figure 4.25 First section of VBA code before modification. ..................................................56 Figure 4.26 First section of code after modification................................................................57 Figure 4.27 Auto Open macro. ................................................................................................58 Figure 4.28 Update subroutine, beginning section. .................................................................58 Figure 4.29 Update macro code. ..............................................................................................59 Figure 4.30 SaveData subroutine.............................................................................................61
xi

Figure 4.31 Audit Links macro................................................................................................62 Figure 4.32 Display Links and Software Information macros.................................................63 Figure 5.1 Spacecraft Design Center layout. ..........................................................................65 Figure 5.2 The NPS Spacecraft Design Center.......................................................................66
xii
ACKNOWLEDGMENTS
I would like to thank The Aerospace Corporation, specifically Joseph Aguilar and
Christopher Taylor, without whose excellent support and guidance this thesis would not
have been possible. Special thanks goes to Christopher Taylor for providing launch
vehicle fairing models to the NPS Spacecraft Design Center, a significant contribution to
spacecraft solid modeling within the Space Systems Engineering curriculum. Also,
thanks to Dr. Joel Sercel and the California Institute of Technology for providing
software developed at their Laboratory for Spacecraft and Mission Design for use in our
curriculum. It contributed significantly to this thesis and my education. Finally, my
sincere appreciation goes to Professor Brij Agrawal, who supported this effort from the
beginning, both financially and academically, and who demonstrated his commitment to
providing Space Systems Engineering students with the best tools possible in order to
further their education.
I want to thank my wife, Jennifer, for all her support during our two and a half
years at NPS. Though I dragged you from your home to a place where you knew no one
but me, a tremendously difficult challenge for you, and you handled it magnificently,
despite having to put up with me. Through all the difficulties of life, there is no better
friend I could ever hope to have. Your spirit, energy, and love carried me through many
difficult moments, even if you didn’t know it at the time. Though I was trying to become
more intelligent with my class work, the smartest thing I did during this tour was to
marry you.
xiii
I. INTRODUCTION
A. BACKGROUND
The capability to rapidly integrate design ideas and concepts into a formal process
for production has come a substantial distance since the advent of Computer-Aided
Design (CAD), Computer-Aided Manufacturing (CAM), and Computer-Aided
Engineering (CAE) tools. Thirty years ago, drawings throughout the world were
produced manually on paper. Changes meant erasing and redrawing, along with the
possibility of a brand new drawing being necessary. The process was also dependent on
a human being to recognize the need for changes to affected documents and to make
those changes when necessary. Collaborative design consisted of weekly meetings at
best, with the product design process limited to paper only. [Ref. 1] Since then, CAD has
added revolutionary capabilities to the engineering process known as Integrated
Collaborative/Concurrent Engineering (ICE/CE), and essentially changed the way
product design is conducted.
Collaborative or concurrent engineering is a philosophy that enables product
development by a team to be conducted in a real-time, iterative fashion. It is a powerful
collection of processes and tools focused on making the team interaction and design
extremely efficient, from initial concept to the manufacturing floor. The philosophy
entails enabling a design team with the proper tools to successfully complete the design,
and a process to guide them through the iterative process. The process uses rules of
thumb, experience-based design techniques, analytic equations, and algorithms combined
with the use of spreadsheet software to help the team successful complete a design,
within a dramatically reduced timeframe as compared to previous spacecraft design
processes. This process has been greatly improved with the advent of solid modeling
tools for the personal computer (PC) that have improved dramatically in the last five
years.
The revolution in CAD/CAE was born in November of 1982: the first CAD
program to run on a PC was introduced by Autodesk in the form of AutoCAD.
Combined with the production of the first IBM PC that same year, the catalyst for
1
widespread use of PC-based design tools was in place. The introduction and rapid
improvement of PC’s fueled the competition and capability of CAD systems intensely.
In 1987, AutoCAD included Application Program Interfaces (API’s) so that programmers
could interface the CAD system with other software programs using C code. This
provided software programmers to create applications that were considered “add-ons” to
the main kernel program. The evolution of CAD/CAM was by this time so feverish that
by the end of the 1980’s over 600 add-on applications were available for AutoCAD [Ref.
1]. The overwhelming success of AutoCAD was fuel for others to increase their efforts
in the area of solid modeling software environment development. The only problem with
the increase in capability was the relatively high cost of the software, between $50,000
and $100,000 per seat.
By the early 1990’s, the utility and enormous advantage of CAD/CAM/CAE had
been proven beyond a doubt, enabled by intense competition, microprocessor speed and
Moore’s Law, and ever-advancing graphical display capabilities. Commercial products
were available with various levels of capabilities at mostly very expensive prices. All of
these systems were exceptional in their ability to model physical designs accurately
within specified tolerances for transport to electronic drawings and manufacturing
facilities. The area where they were lacking, however, was in concurrent/collaborative
engineering (CE) capability and its associated tools. This process is critical to
successfully take a product through the design and manufacturing process, from concept
definition and exploration to initial model development and analysis all the way to
product engineering drawings, manufacturing, and assembly. This has led to the CE
philosophy creating a fundamental paradigm shift in the product design industry. At a
rapid pace, engineers across design disciplines are turning to software tools and facilities
where they can pool their collective knowledge all at the same time utilizing a
streamlined process. With the combination of further dramatic increases in CPU speed
and graphics capability in the late 1990’s and the significant reduction in cost and
increase of functionality of solid modeling software, product design companies have
begun an intense increase in the use of solid modeling software, integrating them into a
CE process [Ref. 2].
2
The creation of powerful, flexible spreadsheet software in the early 1990’s paved
the way for eventual integration of solid modeling tools for under $10,000 per seat with
spreadsheet-based analysis for conceptual product design. Since spacecraft design
involves large quantities of relatively straightforward calculations and data manipulation
for various spacecraft subsystems, it was inevitable that spreadsheets would become the
tool of choice for spacecraft conceptual design. Solid modeling combined with
spreadsheet-based analysis offers a way for the design team to rapidly visualize the
product, easily modify and improve the model, quickly assess impacts to the whole
caused by changes to the parts of the spacecraft, transfer initial models to finite element
analysis programs, and continue with the same models directly to the manufacturing
floor. This combination has produced nothing short of a revolution in the product design
industry. From automobiles to spacecraft, virtually every component in the product will
go through a CE/CAD/-CAE/CAM cycle before final assembly. Although each company
and research agency has developed different processes for collaborative engineering, one
of the most successful being embraced today involves the three aspects of CE: design
team, dedicated team facility, and tools and processes that enable and guide the team
through the rapid design. [Ref. 5] The Naval Postgraduate School (NPS) Spacecraft
Design Center (SDC) aims to provide these three key tenets of CE to space systems
engineering students for the very first time.
B. SCOPE
The fundamental processes that make up a design are similar across engineering
disciplines. This process, however, is currently undergoing a major shift in focus. Over
the recent years, the aerospace industry, along with major commercial and government
entities, has developed facilities, processes, and tools to implement the CE philosophy.
With the rapid advance in technology having no end in sight, the importance of CE and
its integration into the design process has grown into an undeniable force. The
methodology used in the engineering process, from concept design to manufacturing, is
crucial for a systems engineer to understand properly. A new and increasingly critical
part of the integration of technology into the design process is the use of solid modeling
tools. Therefore, it is imperative that engineering students at NPS who may go on to
3
serve in space acquisition programs understand the rapidly advancing tools and processes
that enable the design, testing, and manufacture of a spacecraft.
The thesis first explores and describes The Aerospace Corporation’s Concept
Design Center (CDC), a powerful concurrent engineering methodology process. The
CDC uses Microsoft Excel to assist in the design of a space system. The spreadsheet
tools are used at the focus of their process, serving as the primary source of real-time
knowledge sharing for conceptual spacecraft design. The CDC was witnessed firsthand
by the author prior to the installation of the tool in the SDC. The background is critical to
understanding the full capabilities of this type of approach to spacecraft design and its
applicability to the SDC.
The thesis then provides supporting evidence of the revolution in solid modeling
as applied to the concurrent engineering process. Across the product design industry and
engineering disciplines, solid modeling is being infused into the design process at a rapid
pace. This integration, when fueled by the increase of computer processor and graphics
capabilities, is changing the fundamental way engineering design takes place. The utility
and integration of solid modeling software into the CE process for the CDC spreadsheets
at NPS is also evaluated. The Aerospace Corporation utilizes solid modeling capability
by including a Configuration seat separately during their design process using
SolidWorks™, a powerful, versatile, solid modeling package obtained under an
educational license for under $500. In addition, a copy of California Institute of
Technology’s rapid solid modeling tool, DrawCraft, is used in a concurrent design
method to generate conceptual spacecraft. DrawCraft is interfaced with SolidWorks™,
and both are installed in the SDC. The utility of integrating DrawCraft/SolidWorks™
into the CDC process is evaluated with respect to learning curve, ease of use, time to
generate a solid model, and model modification flexibility. The capabilities of
SolidWorks™ with respect to the design process, the use of graphics and animations in
presentations and reports, and exporting of solid geometry to finite element analysis
(FEA) programs is explored and the results presented. Application to the Space Systems
Engineering curriculum is evaluated using a spacecraft design generated in AA4871, the
capstone design course, as a test case. The author was involved in the design as a
4
structures engineer. Points of contact for personnel involved in supporting, developing
and maintaining all software presented are located in Appendix A.
Thirdly, the thesis details the integration of the CDC spreadsheets into the NPS
SDC, part of the Spacecraft Research and Design Center (SRDC). The software was
obtained courtesy of The Aerospace Corporation. The tool is the first fully functioning
concurrent engineering software to be available in the NPS SDC, and is one of the most
powerful conceptual spacecraft design tools available in industry today. The installation
and modification of the tool is described and documented, including all pertinent
information for proper use in the integrated engineering environment. Since the CDC
was seen in use by the author, the firsthand knowledge of witnessing the expert team in
action flavors the NPS process as written. Only the systems portion of the tool is
considered in depth, as complete documentation of each subsystem is a task that is
possibly beyond the reach of a single thesis.
Finally, the CDC spreadsheet data transfer architecture, procedures for future
modification of the tool and its Visual Basic code, and a recommended design process for
the NPS SDC are discussed. The data transfer architecture is critical to understand in
order to add or modify workbooks to the overall system. Modification and description of
the software code is undertaken, written in Microsoft Visual Basic for Applications
(VBA). The extreme value of this work has been expressed by The Aerospace Company
as no user’s guide has been written to date. The application of the CDC process and the
software it uses toward the NPS curriculum is evaluated primarily based on the following
factors: ease of use, maintenance requirements, depth, and ability to reduce spacecraft
design time in AA4871. A comparison is undertaken based on the author’s experience in
the capstone course prior to the software installation. Printouts of worksheets in the
Systems workbook are included in the appendix. The completed User’s Guide is attached
as a separate document.
5

THIS PAGE INTENTIONALLY LEFT BLANK
6
II. THE CONCEPT DESIGN CENTER
A. OVERVIEW
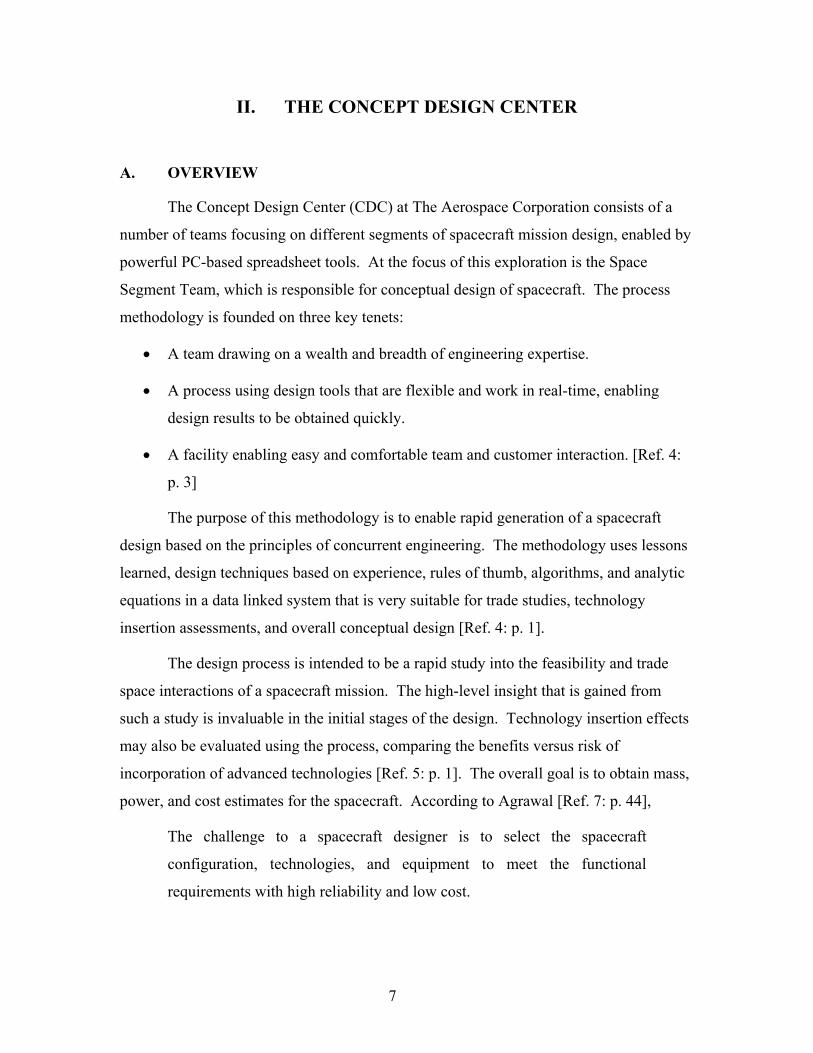
The Concept Design Center (CDC) at The Aerospace Corporation consists of a
number of teams focusing on different segments of spacecraft mission design, enabled by
powerful PC-based spreadsheet tools. At the focus of this exploration is the Space
Segment Team, which is responsible for conceptual design of spacecraft. The process
methodology is founded on three key tenets:
• A team drawing on a wealth and breadth of engineering expertise.
• A process using design tools that are flexible and work in real-time, enabling
design results to be obtained quickly.
• A facility enabling easy and comfortable team and customer interaction. [Ref. 4:
p. 3]
The purpose of this methodology is to enable rapid generation of a spacecraft
design based on the principles of concurrent engineering. The methodology uses lessons
learned, design techniques based on experience, rules of thumb, algorithms, and analytic
equations in a data linked system that is very suitable for trade studies, technology
insertion assessments, and overall conceptual design [Ref. 4: p. 1].
The design process is intended to be a rapid study into the feasibility and trade
space interactions of a spacecraft mission. The high-level insight that is gained from
such a study is invaluable in the initial stages of the design. Technology insertion effects
may also be evaluated using the process, comparing the benefits versus risk of
incorporation of advanced technologies [Ref. 5: p. 1]. The overall goal is to obtain mass,
power, and cost estimates for the spacecraft. According to Agrawal [Ref. 7: p. 44],
The challenge to a spacecraft designer is to select the spacecraft
configuration, technologies, and equipment to meet the functional
requirements with high reliability and low cost.
7
B. TEAM, PROCESS, AND FACILITY
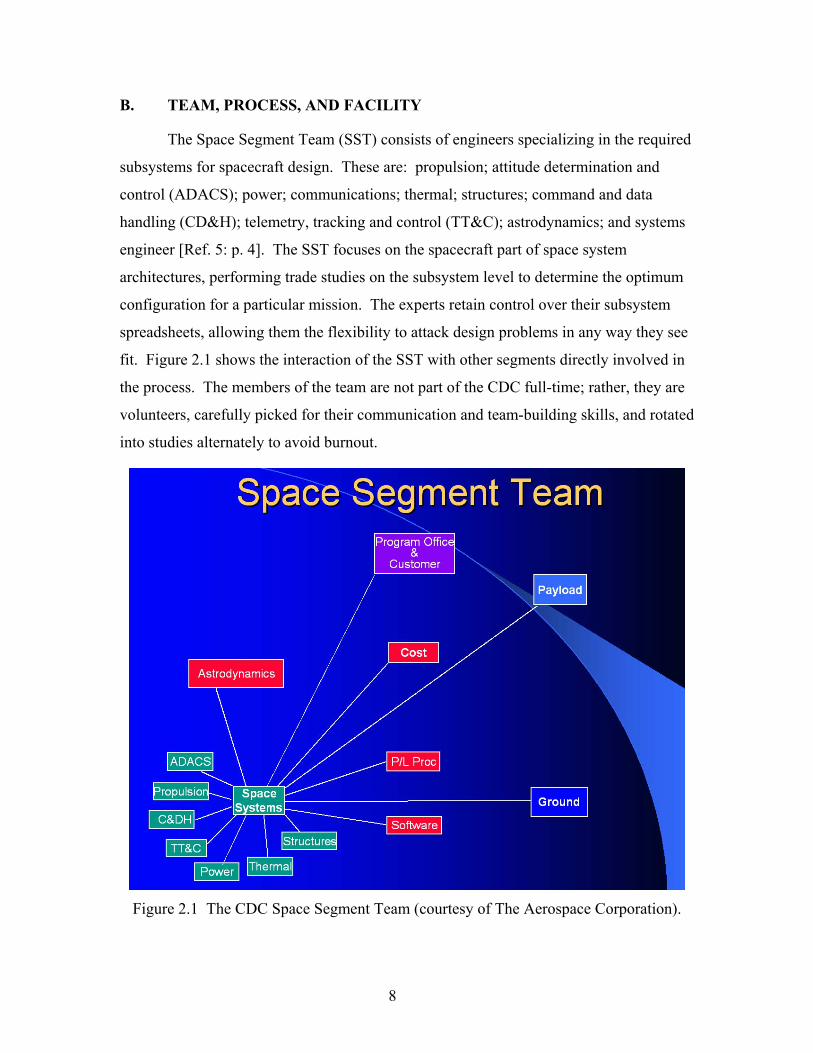
The Space Segment Team (SST) consists of engineers specializing in the required
subsystems for spacecraft design. These are: propulsion; attitude determination and
control (ADACS); power; communications; thermal; structures; command and data
handling (CD&H); telemetry, tracking and control (TT&C); astrodynamics; and systems
engineer [Ref. 5: p. 4]. The SST focuses on the spacecraft part of space system
architectures, performing trade studies on the subsystem level to determine the optimum
configuration for a particular mission. The experts retain control over their subsystem
spreadsheets, allowing them the flexibility to attack design problems in any way they see
fit. Figure 2.1 shows the interaction of the SST with other segments directly involved in
the process. The members of the team are not part of the CDC full-time; rather, they are
volunteers, carefully picked for their communication and team-building skills, and rotated
into studies alternately to avoid burnout.
Figure 2.1 The CDC Space Segment Team (courtesy of The Aerospace Corporation).
8
The integrated design process utilizes three distinct phases. First, the customer
reviews requirements with the team members in order to provide enough information to
prepare for the actual design session, and to structure the trades that will take place in the
sessions [Ref. 5: p. 2]. This takes place in meetings over a period of two to four weeks.
The team members prepare software models and conduct research into the intended
design. The next phase, the actual design sessions, occur in periods of four hours over a
timeframe of a few days. The sessions consist of real-time collaborative interaction
between all study participants. The team uses Microsoft Excel to share data between
subsystem workbooks by linking parameters between them, allowing for both manual and
automatic updating of data. The team discusses design issues amongst each other and
with the customer, and iterates the design parameters until a satisfactory configuration is
reached. The systems engineer coordinates the efforts of the team and ensures all
parameters are kept within study bounds. The documentation phase follows, where
customer requests for modifications are taken into consideration when preparing the
extensive report on the design session and its results. Team members are responsible for
their section of the report, with the process taking three to four weeks to complete.
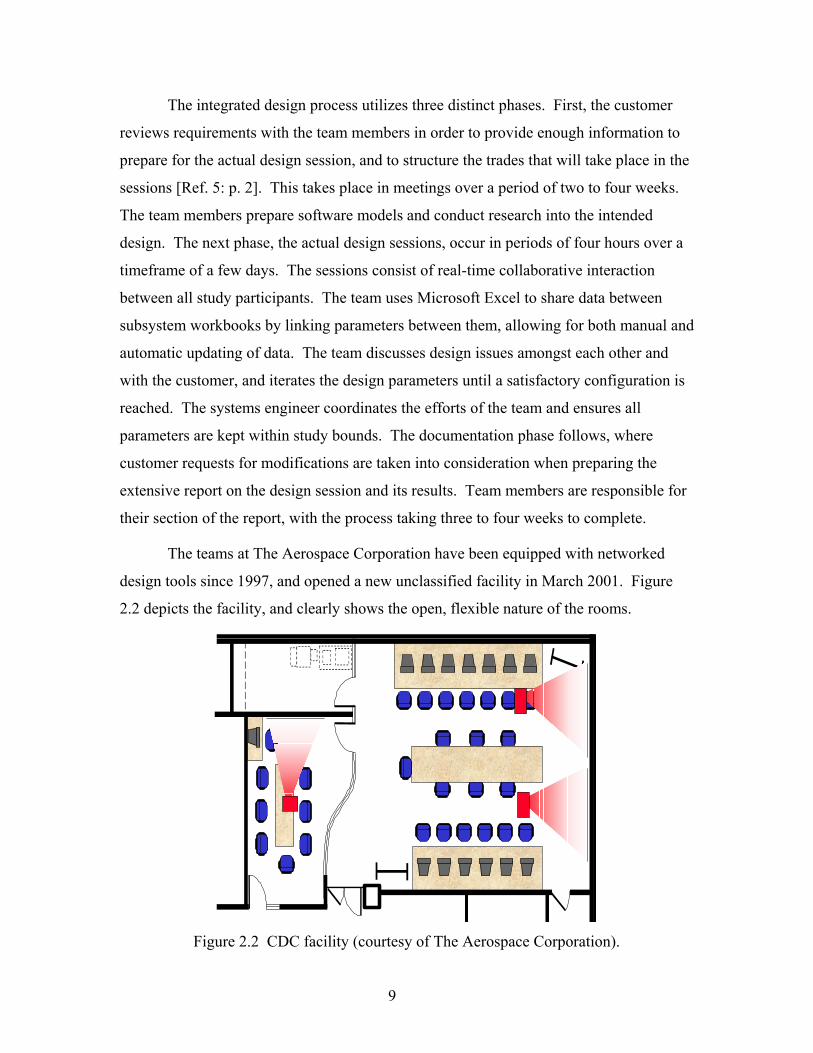
The teams at The Aerospace Corporation have been equipped with networked
design tools since 1997, and opened a new unclassified facility in March 2001. Figure
2.2 depicts the facility, and clearly shows the open, flexible nature of the rooms.
Figure 2.2 CDC facility (courtesy of The Aerospace Corporation).
9
The PC’s share a common network, with pertinent software programs installed on
each machine, enabling subsystem engineers to perform real-time analysis. The
spreadsheets are linked using Excel’s Object Linking and Embedding utility. This
enables the real-time linking of parameters between subsystems. Databases are used by
each subsystem to choose components for a particular configuration. Visual Basic for
Applications (VBA) code enables the systems engineer to control the flow of data during
the study. The facility also has two overhead projectors and screens that are controlled
by a LCD touch screen interfaced to a video switched control system, allowing any
computer monitor to be shown to the study participants. The conference room at the back
of the facility is where the study planning takes place. Printers and a copier are located in
the adjacent room in order to provide hardcopies of design session information to study
participants.
The combination of tools, process, and facility presents a versatile, powerful way
to design spacecraft. Each subsystem workbook is maintained by experts, and each study
session is choreographed with the data flowing through the central point of the systems
engineer. Off-line tool capability adds to the arsenal of design tools so that engineers can
run real-time simulations and quickly recover the results into their spreadsheets. The
tools available include solid modeling software in the form of SolidWorks™ and
PCSOAP, an orbital analysis program. Since the advent of the CDC, The Aerospace
Corporation has decreased the time and cost for spacecraft design by up to 70%. This has
allowed them to increase the number of design studies significantly while continuing to
expand the capabilities of the tool.
The CDC’s spreadsheet tool does have limitations. Cost estimation is performed
using cost estimating relationships (CER’s) as opposed to using component costs and
building an estimate from the “ground up”. This is being addressed by Aerospace, but
the rapidly changing cost of components combined with vendor unwillingness to share
cost data severely hampers any bottom up cost estimation effort. The subsystems are also
as limited as the equations utilized and the engineers applying them. The engineers must
manually optimize their subsystems based on their experience and requirements
information rather than utilize a software optimization routine or analytical optimization
equations. However, this manual optimization may very well be the lynchpin of the
10
CDC’s software design tools. The component databases also are limited in that they must
be rigorously maintained in order to keep the designs based on real-world components.
The CDC software tools are clearly extremely valuable for the rapid design of
spacecraft, despite their limitations. The real-time sharing of data and collaboration with
customers and team members fosters a healthy environment for discussion of alternatives
and allows the design to take place in a minimum amount of time. Performance, risk, and
cost assessments of the design can be quickly evaluated, as they never have before.
Interdependencies of subsystems are made clear, and comparisons of components in the
design may be evaluated. Finally, the systems engineering process may be seen in real-
time, further adding to the experience and expertise of all team members. This process
and its associated tools are critical for the systems engineer to understand properly. This
chapter is fitting to end with an outlook from Wertz [Ref. 8: p. 50].
… models being developed throughout the aerospace community are
attempting to automate this basic design process of evaluating the system-
wide implication of changes. In due course, system engineers may
become technologically obsolete. Much like modern chess players, the
challenge to future systems engineers will be to stay ahead of the
computer in being creative and innovative.
11

THIS PAGE INTENTIONALLY LEFT BLANK
12
III. SOLID MODELING AND INTEGRATED DESIGN
A. REVOLUTION IN THE DESIGN PROCESS
Michael Davis, founder of Headstuf Product Development [Ref. 2], described the
capabilities of solid modeling as follows:
Young people have no idea how powerful a concept this is. Software at
last that can build what you think, the way you think? Amazing. In
relative historical terms, this is such a very new concept. [Ref. 2]
The foundation of design and product development used to rely on two separate
entities: the designer and the engineer. The introduction of parametric solid modeling
tools in the mid-eighties was the herald of a new era in product design. Parametric
Technologies released Pro-Engineer, a parametric software design tool. At this point,
most companies were still focused on separate design and engineering development
processes, not focusing their efforts toward an integrated process. This is partly due to
the extreme cost of CAD workstations at the time, which could easily run in excess of
$100,000 per seat [Ref. 2]. The market suddenly became flooded with modeling tools
that threatened to break the mold of the dedicated CAD workstation.
The fact that solid modeling has come into the design process as a fully
recognized major contributing factor only recently is due to the power of the personal
computer and the advances in 3-D graphics capabilities that have come with it in the late
1990’s. Currently, solid modeling packages are available for reasonably powerful
desktop computers for under $10,000, an order of magnitude cost decrease in less than
ten years of development. There are many advantages that solid modeling offers the
design process, and when combined with continuing decreasing cost and increasing
capability, they are the reason the revolution in product design is taking place.
Visualization, analysis, revision speed, drawing creation, and data sharing are just some
of the benefits of a good solid modeling tool.
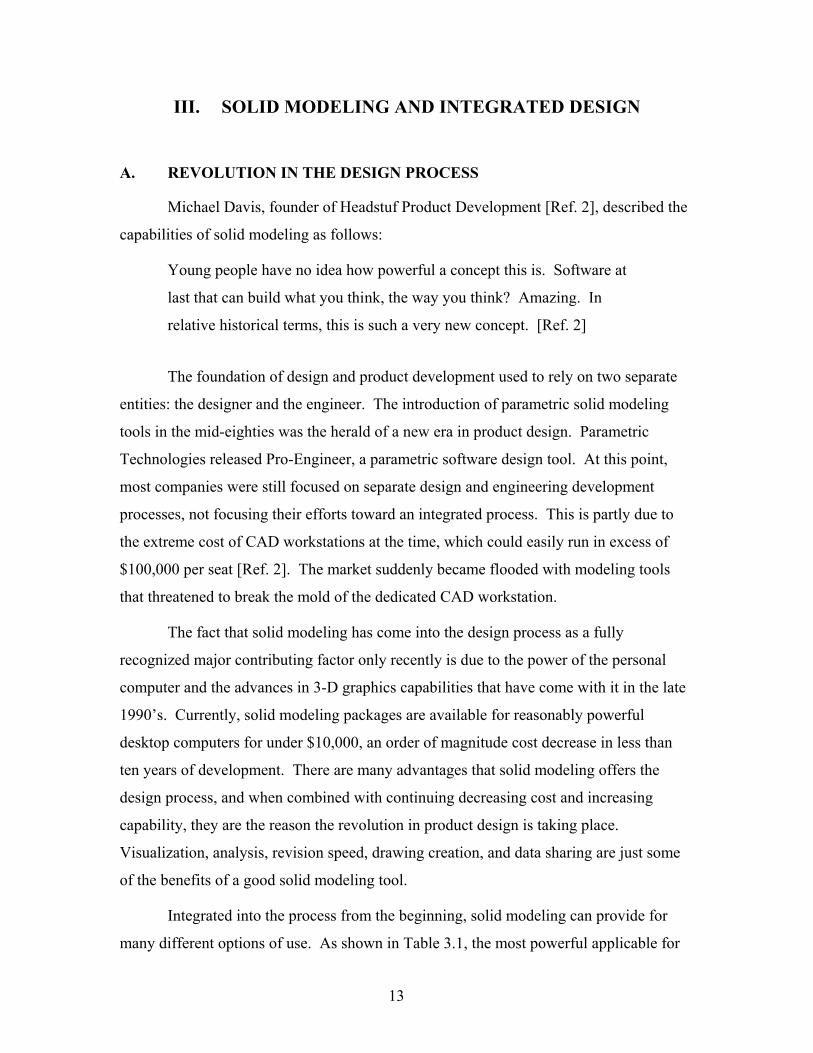
Integrated into the process from the beginning, solid modeling can provide for
many different options of use. As shown in Table 3.1, the most powerful applicable for
13
use in the SDC are the first three listed: product visualization, analysis, and revision
speed. It is critical that engineers as well as the customer have an idea of what the
spacecraft will look like as early as possible in the process.
Table 3.1 Features and benefits of solid modeling [From: Ref. 3].
It is also very important to create an initial configuration quickly, verify that the
spacecraft will fit in the launch vehicle fairing in the stowed configuration, and make
revisions as necessary. If requirements change often, as experienced by the author in the
AA4871 concept design of the Mithra spacecraft for the Air Force Research Laboratory,
they can be incorporated into the design quickly and easily.
Having a solid model and solid assembly is important for accurate mass property
calculations and interference checking, and for transfer of geometry into analysis
software. The model is created only once, and revisions automatically update related
dimensions within the model. This allows the engineer to spend more time in analysis or
trade space studies, where comparisons of various components in the design yield more
benefits from the time invested.
14
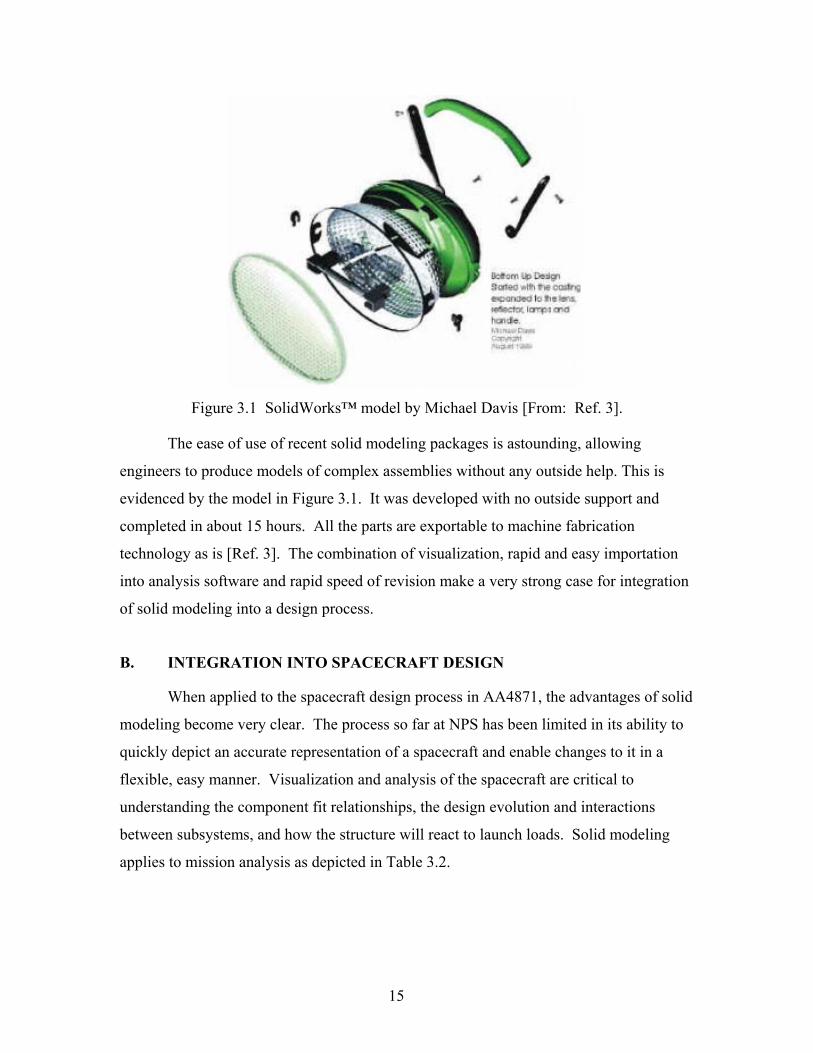
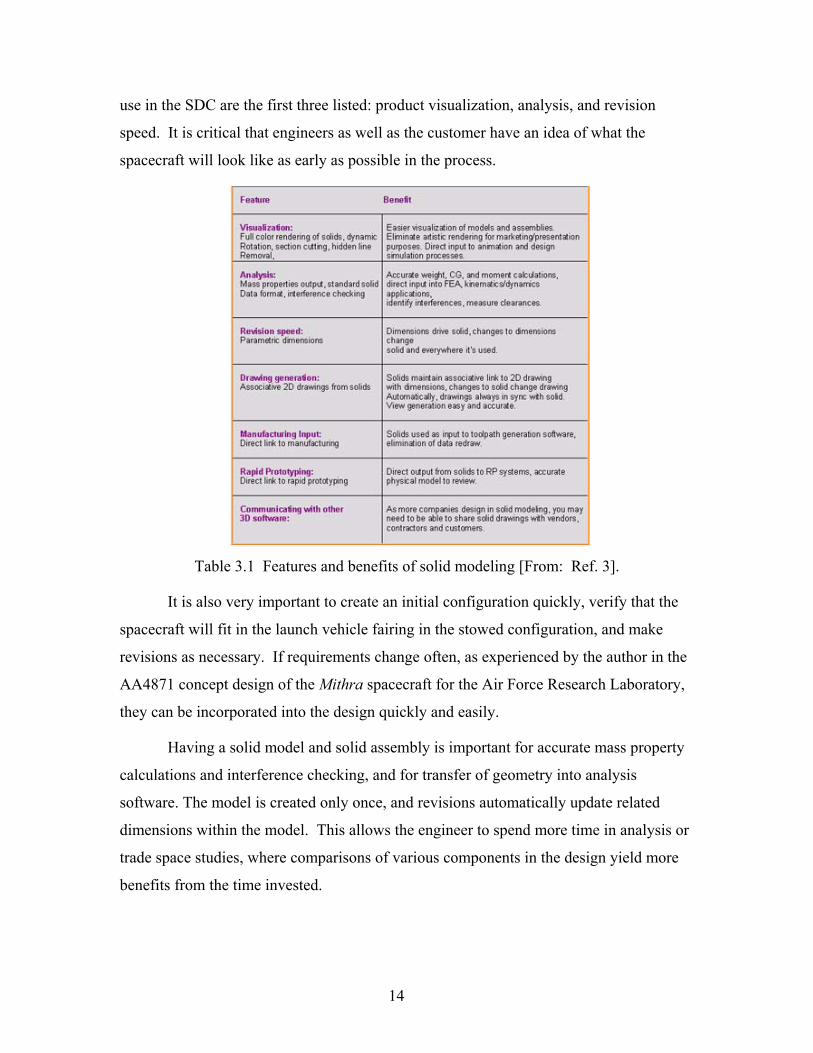
Figure 3.1 SolidWorks™ model by Michael Davis [From: Ref. 3].
The ease of use of recent solid modeling packages is astounding, allowing
engineers to produce models of complex assemblies without any outside help. This is
evidenced by the model in Figure 3.1. It was developed with no outside support and
completed in about 15 hours. All the parts are exportable to machine fabrication
technology as is [Ref. 3]. The combination of visualization, rapid and easy importation
into analysis software and rapid speed of revision make a very strong case for integration
of solid modeling into a design process.
B. INTEGRATION INTO SPACECRAFT DESIGN
When applied to the spacecraft design process in AA4871, the advantages of solid
modeling become very clear. The process so far at NPS has been limited in its ability to
quickly depict an accurate representation of a spacecraft and enable changes to it in a
flexible, easy manner. Visualization and analysis of the spacecraft are critical to
understanding the component fit relationships, the design evolution and interactions
between subsystems, and how the structure will react to launch loads. Solid modeling
applies to mission analysis as depicted in Table 3.2.
15
Analysis Type
Goal Solid Modeling
Applicability
Feasibility
Assessment
To establish whether an objective is achievable and
its approximate degree of complexity (limited detail) Yes
Sizing
Estimate
To estimate basic parameters such as size, weight,
power or cost (limited detail) Yes
Point Design To demonstrate feasibility and establish a baseline
for comparison of alternatives (limited detail) Yes
Trade Study To establish the relative advantages of alternative
approaches or options (expanded detail) Yes
Performance
Assessment
To quantify performance parameters (e.g.,
resolution, timeliness) for a particular approach
(expanded detail)
Yes
Utility
Assessment
To quantify how well the system can meet overall
mission objectives (expanded detail) Yes
Table 3.2 Mission Analysis Hierarchy [After: Ref. 8: p. 51].
Mission analysis is defined as the process of quantifying the system parameters
and the resulting performance [Ref. 8: p. 49]. The ability to conduct each type of
analysis is enhanced by the use of models, allowing engineers to make decisions based on
fully visualized, easily modifiable configurations. Although the course requirements of
AA4871 are geared towards mission analysis to the point of completing a limited
performance assessment, the use of solid models when integrated with the CDC
spreadsheets will enhance the course scope, enable more trade space to be explored,
allow more detail in the performance assessment, and contribute significantly to the
utility assessment.
In order to attempt to understand the true power of solid modeling, it is
appropriate to undertake a thorough comparison with the author’s previous experience in
the AA4871 course. Many hours were spent by the systems engineer in the design class
to generate an accurate 2-D drawing of the Mithra spacecraft. As the configuration
16
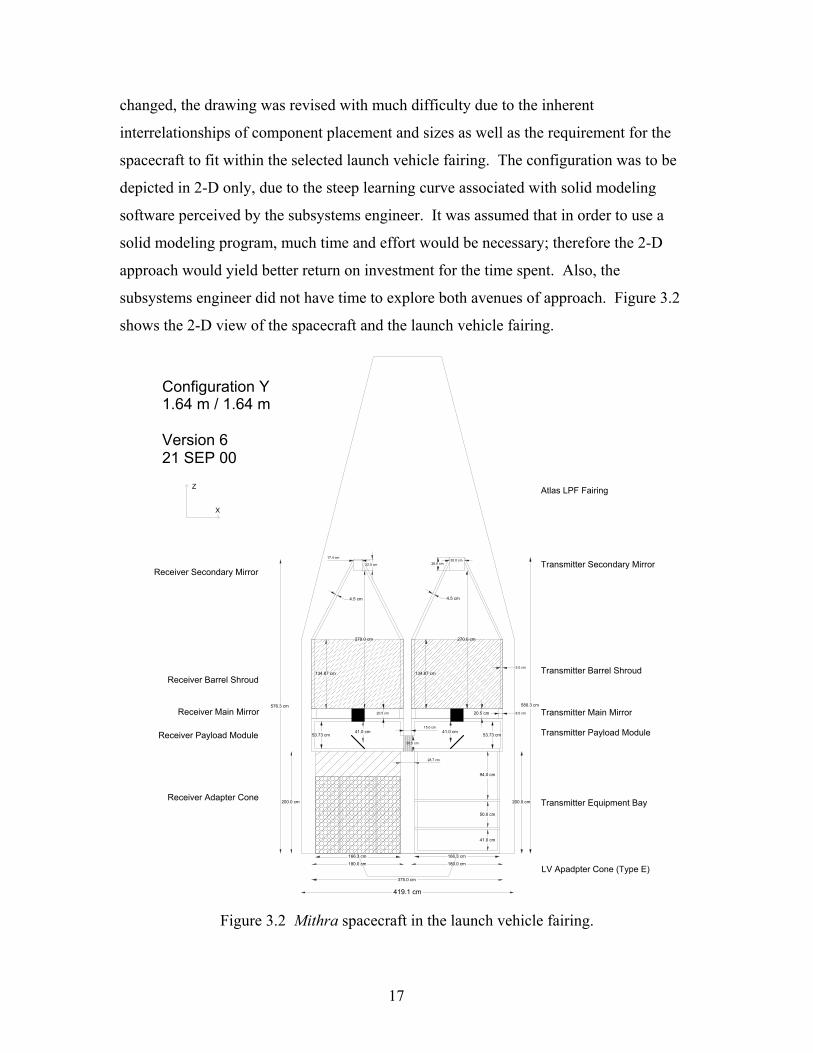
changed, the drawing was revised with much difficulty due to the inherent
interrelationships of component placement and sizes as well as the requirement for the
spacecraft to fit within the selected launch vehicle fairing. The configuration was to be
depicted in 2-D only, due to the steep learning curve associated with solid modeling
software perceived by the subsystems engineer. It was assumed that in order to use a
solid modeling program, much time and effort would be necessary; therefore the 2-D
approach would yield better return on investment for the time spent. Also, the
subsystems engineer did not have time to explore both avenues of approach. Figure 3.2
shows the 2-D view of the spacecraft and the launch vehicle fairing.
Receiver Adapter Cone
Receiver Payload Module
Transmitter Main Mirror
Transmitter Payload Module
Transmitter Equipment Bay
LV Apadpter Cone (Type E)
Atlas LPF Fairing
Transmitter Secondary Mirror
Receiver Main Mirror
Configuration Y1.64 m / 1.64 m
Version 621 SEP 00
Z
X
375.0 cm
419.1 cm
4.5 cm4.5 cm
270.0 cm
53.73 cm
94.0 cm
50.0 cm
41.0 cm
200.0 cm200.0 cm
53.73 cm41.0 cm 41.0 cm
270.0 cm
580.3 cm576.3 cm
166.3 cm
180.0 cm
166.3 cm
180.0 cm
20.5 cm 20.5 cm 8.0 cm
5.0 cm
134.87 cm 134.87 cm
30.0 cm26.0 cm
17.4 cm
22.0 cm
28.7 cm
15.0 cm
Transmitter Barrel ShroudReceiver Barrel Shroud
Receiver Secondary Mirror
30.5 cm
Figure 3.2 Mithra spacecraft in the launch vehicle fairing.
17
The author, as the structures engineer, could not begin to construct a detailed
finite element model (FEM) for analysis until the final configuration was set, since the
learning curve for the analysis software was exceptionally steep, ascertained after lengthy
tutorial sessions. This is the case with many complex FEM packages, since they were
initially designed for analysis rather than 3-D modeling.
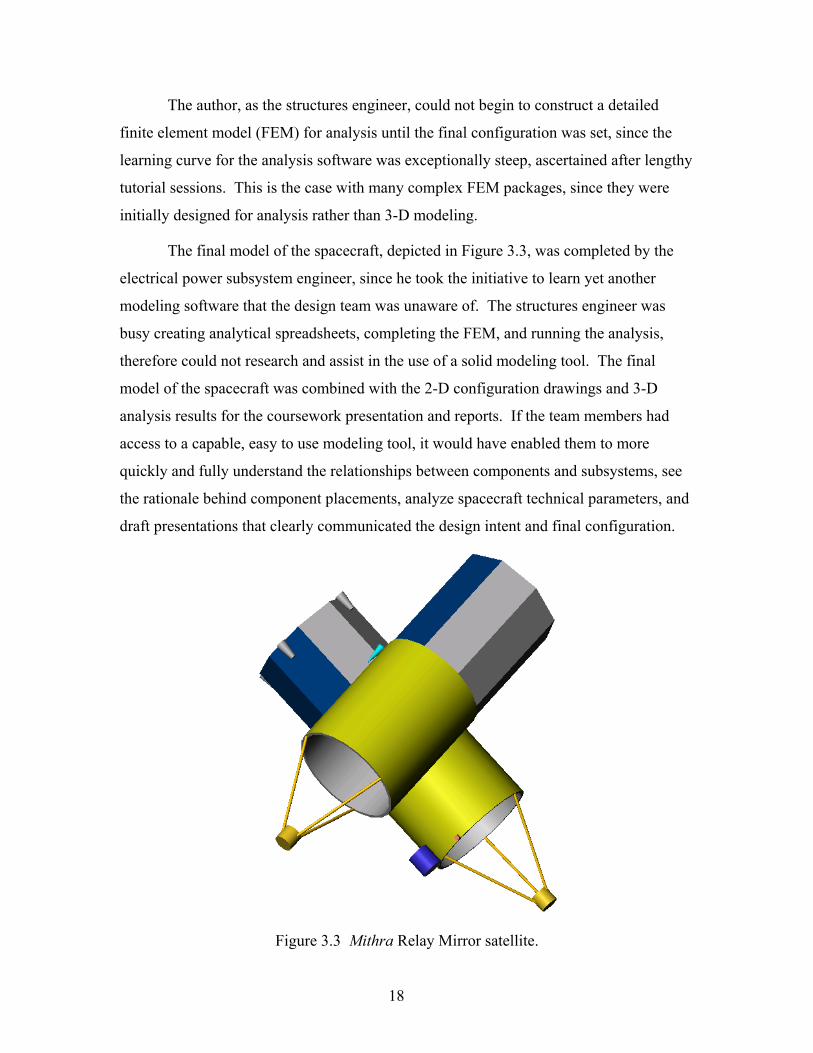
The final model of the spacecraft, depicted in Figure 3.3, was completed by the
electrical power subsystem engineer, since he took the initiative to learn yet another
modeling software that the design team was unaware of. The structures engineer was
busy creating analytical spreadsheets, completing the FEM, and running the analysis,
therefore could not research and assist in the use of a solid modeling tool. The final
model of the spacecraft was combined with the 2-D configuration drawings and 3-D
analysis results for the coursework presentation and reports. If the team members had
access to a capable, easy to use modeling tool, it would have enabled them to more
quickly and fully understand the relationships between components and subsystems, see
the rationale behind component placements, analyze spacecraft technical parameters, and
draft presentations that clearly communicated the design intent and final configuration.
Figure 3.3 Mithra Relay Mirror satellite.
18
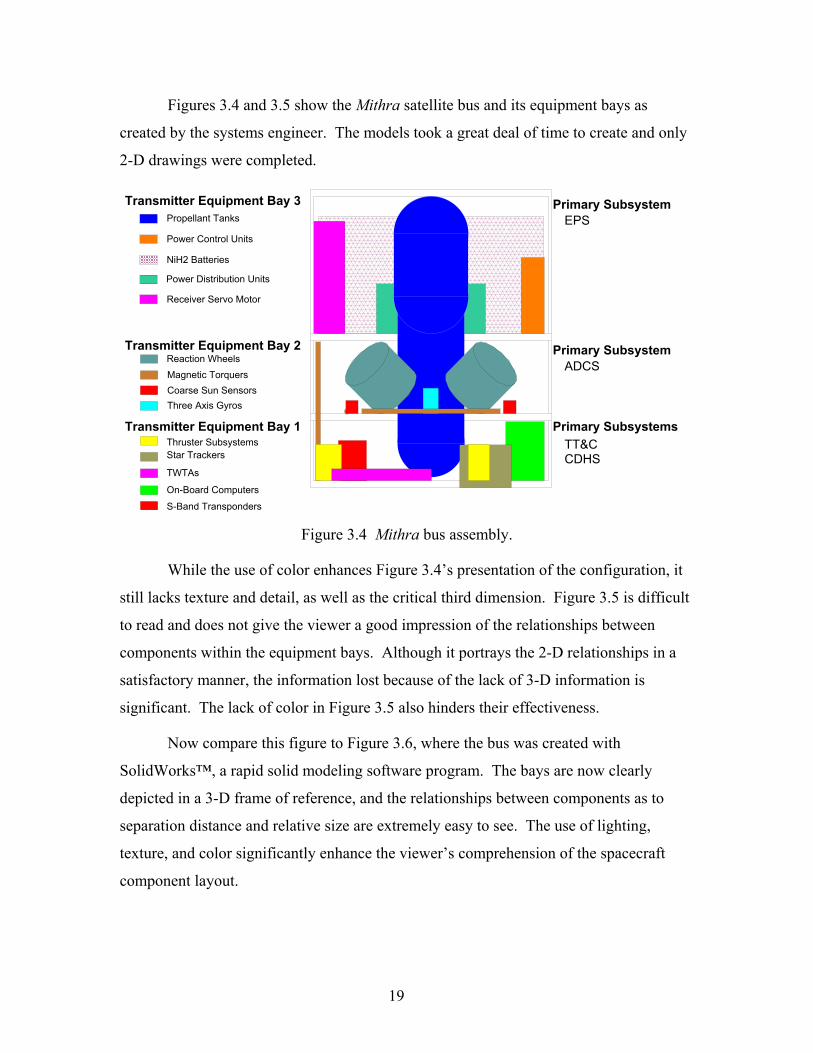
Figures 3.4 and 3.5 show the Mithra satellite bus and its equipment bays as
created by the systems engineer. The models took a great deal of time to create and only
2-D drawings were completed.
Transmitter Equipment Bay 3
Transmitter Equipment Bay 2
Transmitter Equipment Bay 1
Propellant Tanks
NiH2 Batteries
Power Control Units
Power Distribution Units
Receiver Servo Motor
Reaction WheelsMagnetic TorquersCoarse Sun SensorsThree Axis Gyros
Thruster SubsystemsStar Trackers
TWTAs
On-Board ComputersS-Band Transponders
EPS
ADCS
TT&CCDHS
Primary Subsystem
Primary Subsystem
Primary Subsystems
Figure 3.4 Mithra bus assembly.
While the use of color enhances Figure 3.4’s presentation of the configuration, it
still lacks texture and detail, as well as the critical third dimension. Figure 3.5 is difficult
to read and does not give the viewer a good impression of the relationships between
components within the equipment bays. Although it portrays the 2-D relationships in a
satisfactory manner, the information lost because of the lack of 3-D information is
significant. The lack of color in Figure 3.5 also hinders their effectiveness.
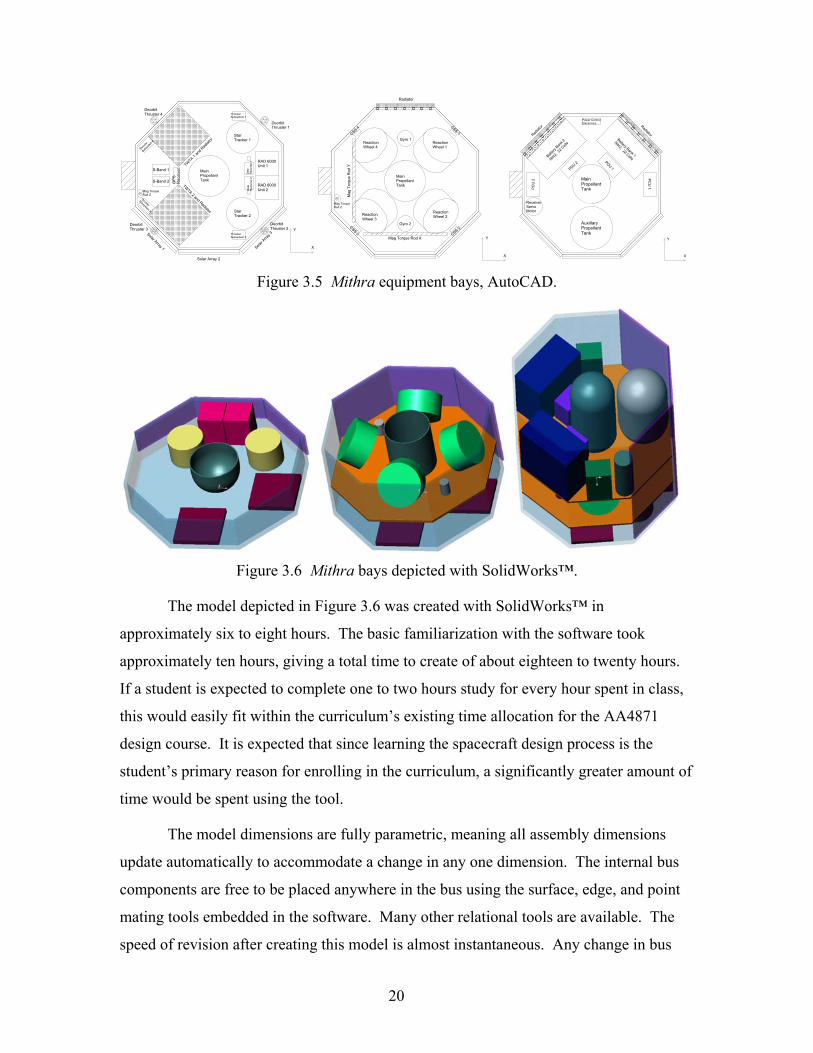
Now compare this figure to Figure 3.6, where the bus was created with
SolidWorks™, a rapid solid modeling software program. The bays are now clearly
depicted in a 3-D frame of reference, and the relationships between components as to
separation distance and relative size are extremely easy to see. The use of lighting,
texture, and color significantly enhance the viewer’s comprehension of the spacecraft
component layout.
19
TWTA 1 an
d Rad
iator
TWTA 2 and Radiator
S-Band 2
RAD 6000Unit 1
RAD 6000Unit 2
StarTracker 1
StarTracker 2
S-Band 1
Dat
aR
ecor
der 1
Dat
aR
ecor
der 2
MainPropellantTank
X
Y
Mag TorqueRod Z
DeorbitThruster 4
GPS
Rec
eive
r
ThrusterSubsystem 1
Solar Array 1
Solar Array 2
Solar A
rray 3
DeorbitThruster 1
DeorbitThruster 3
DeorbitThruster 2
ThrusterSubsystem 3
ThrusterSubsystem 2
Thruste
r
Subsy
stem 4 Reaction
Wheel 1
Mag Torque Rod X
Gyro 1
Gyro 2
Y
X
ReactionWheel 2Reaction
Wheel 3
ReactionWheel 4
CSS 1
CSS 2CSS 3
CSS 4
Mag
Tor
que
Rod
Y
Mag TorqueRod Z
MainPropellantTank
Radiator
ReceiverServoMotor
PDU 2
Y
X
Battery
Bank 2
NiH2, 22
Cell
s
Main PropellantTank
Battery Bank 1
NiH2, 22 CellsPDU 1
PCU
1PCU
2
Power ControlElectronics
AuxillaryPropellantTank
Radiat
or Radiator
Figure 3.5 Mithra equipment bays, AutoCAD.
Figure 3.6 Mithra bays depicted with SolidWorks™.
The model depicted in Figure 3.6 was created with SolidWorks™ in
approximately six to eight hours. The basic familiarization with the software took
approximately ten hours, giving a total time to create of about eighteen to twenty hours.
If a student is expected to complete one to two hours study for every hour spent in class,
this would easily fit within the curriculum’s existing time allocation for the AA4871
design course. It is expected that since learning the spacecraft design process is the
student’s primary reason for enrolling in the curriculum, a significantly greater amount of
time would be spent using the tool.
The model dimensions are fully parametric, meaning all assembly dimensions
update automatically to accommodate a change in any one dimension. The internal bus
components are free to be placed anywhere in the bus using the surface, edge, and point
mating tools embedded in the software. Many other relational tools are available. The
speed of revision after creating this model is almost instantaneous. Any change in bus
20
side panel length changes the shelf lengths and solar panel lengths, and maintains all
relations for the interior bay components. For example, the large batteries are placed
against the exterior wall of Bay 3 (rightmost view of Figure 3.6), so if the main bus
structure dimension changes in any way, the batteries remain in their proper positions
against the wall. In addition, dimensions for any part may be displayed, as well as offsets
or reference dimensions, if any. If the relations are chosen carefully and monitored each
time a change is made, the model will maintain excellent situational relationships and
continue to provide valuable visualization information. All parts are easily moved
between bays, enabling the configurations engineer with tremendous flexibility in
component placement, enhancing the number of configurations within the equipment
bays that can be attempted before deciding on the final one.
SolidWorks™ also allows solid parts to be hidden or set to levels of transparency
so that parts within assemblies are easily seen. Figure 3.6 shows the bus outer structure,
solar panels, and batteries semi-transparent. This offers another powerful visualization
option to the structures/configuration engineer. Features may also be hidden temporarily
in order to better see layered components. The model can be rotated easily and different
section views can be created quickly, enabling the entire design team to see relationships
between components. This especially aids the Thermal subsystem engineer, since it is
necessary to determine the relative placement of components before conducting a rough
thermal analysis. The model may be exported into a thermal analysis program with the
desired components already in place.
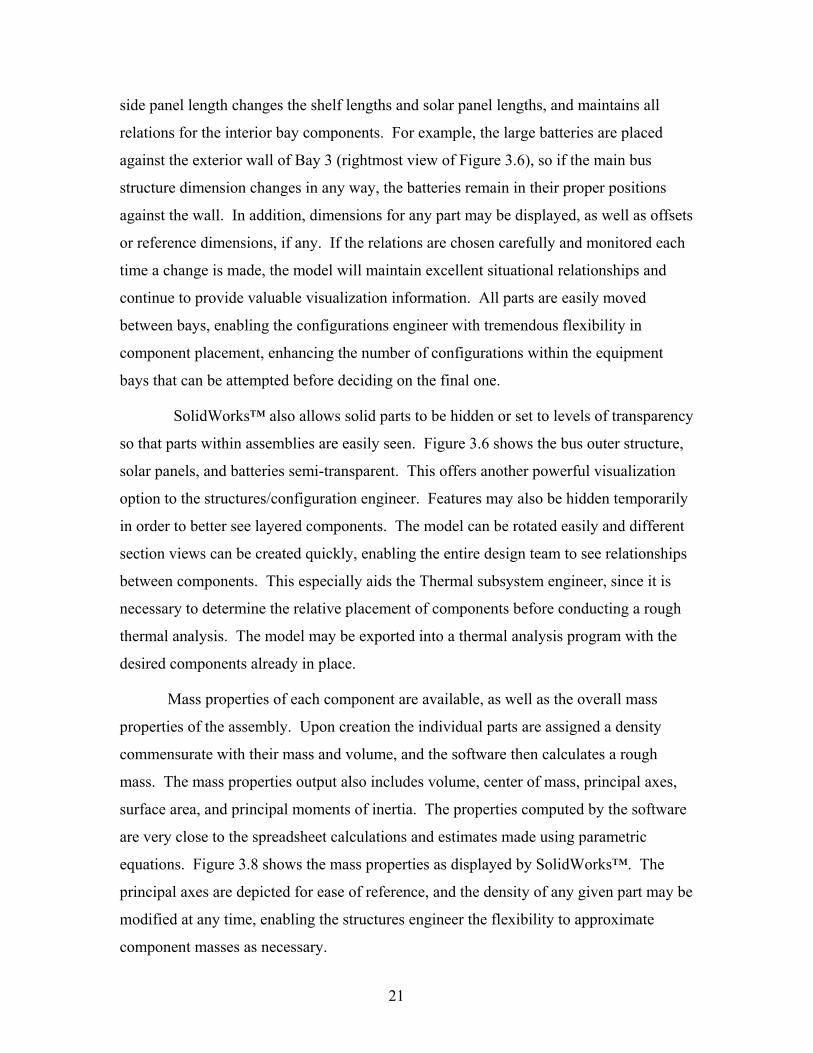
Mass properties of each component are available, as well as the overall mass
properties of the assembly. Upon creation the individual parts are assigned a density
commensurate with their mass and volume, and the software then calculates a rough
mass. The mass properties output also includes volume, center of mass, principal axes,
surface area, and principal moments of inertia. The properties computed by the software
are very close to the spreadsheet calculations and estimates made using parametric
equations. Figure 3.8 shows the mass properties as displayed by SolidWorks™. The
principal axes are depicted for ease of reference, and the density of any given part may be
modified at any time, enabling the structures engineer the flexibility to approximate
component masses as necessary.
21
These mass properties are crucial for the attitude dynamics & control engineers to
properly assess the necessary sizes of reaction wheels for the design. The mass and
location of components are also critical to the launch vehicle, as the center of mass must
be within safe vertical and horizontal operating envelopes of the launch vehicle fairing
for stability and control purposes. If any component must be moved, it can be done so
readily and the new mass properties calculated immediately. This gives the systems and
structures engineer flexibility and speed in revision, which was lacking in the mass
property calculations for the original Mithra design.
Figure 3.7 Mass properties in SolidWorks™.
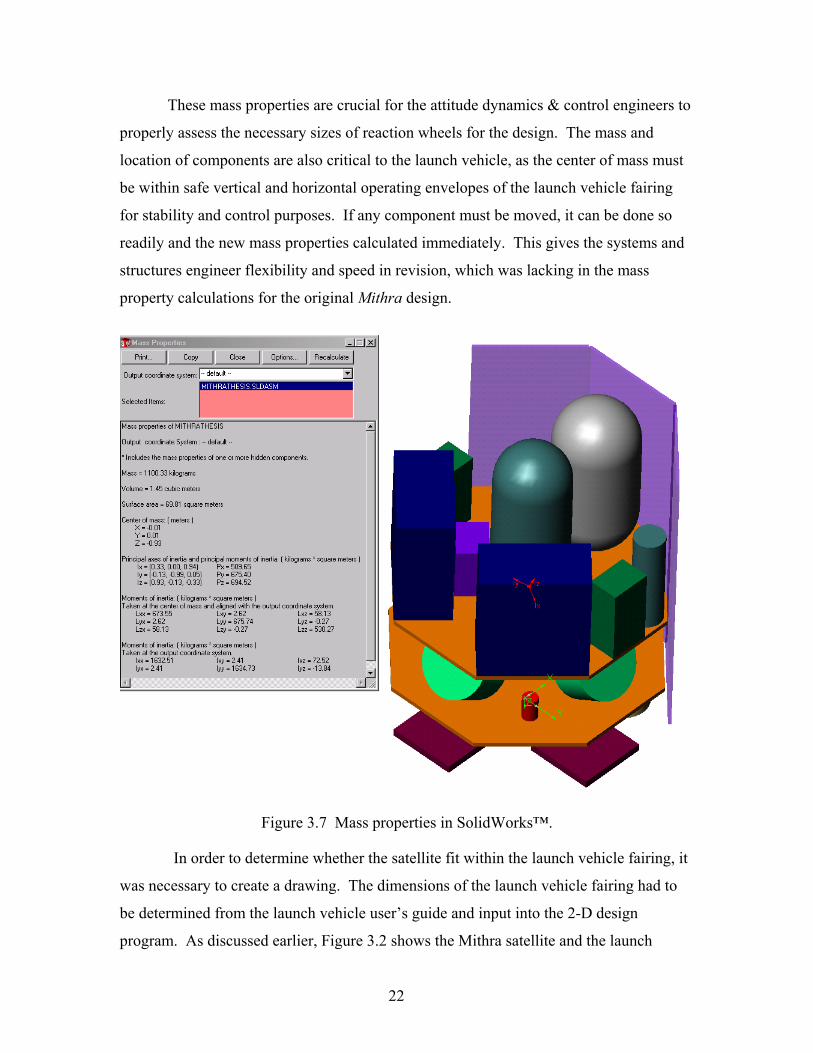
In order to determine whether the satellite fit within the launch vehicle fairing, it
was necessary to create a drawing. The dimensions of the launch vehicle fairing had to
be determined from the launch vehicle user’s guide and input into the 2-D design
program. As discussed earlier, Figure 3.2 shows the Mithra satellite and the launch
22
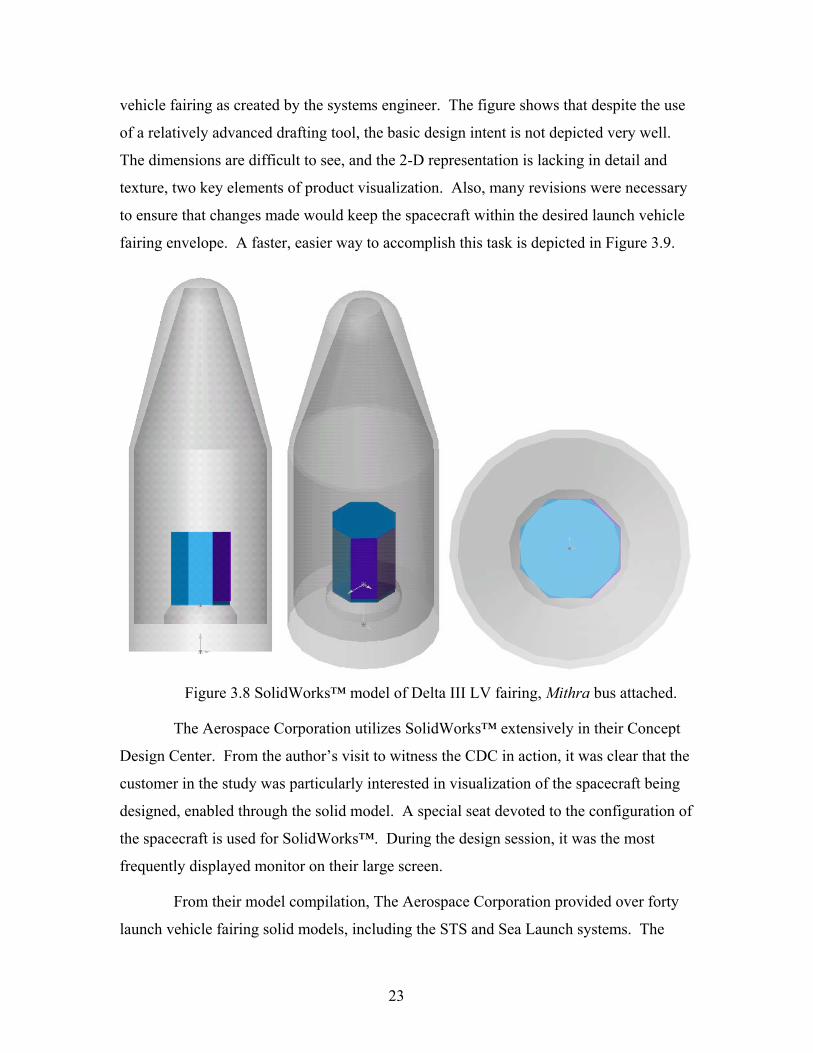
vehicle fairing as created by the systems engineer. The figure shows that despite the use
of a relatively advanced drafting tool, the basic design intent is not depicted very well.
The dimensions are difficult to see, and the 2-D representation is lacking in detail and
texture, two key elements of product visualization. Also, many revisions were necessary
to ensure that changes made would keep the spacecraft within the desired launch vehicle
fairing envelope. A faster, easier way to accomplish this task is depicted in Figure 3.9.
Figure 3.8 SolidWorks™ model of Delta III LV fairing, Mithra bus attached.
The Aerospace Corporation utilizes SolidWorks™ extensively in their Concept
Design Center. From the author’s visit to witness the CDC in action, it was clear that the
customer in the study was particularly interested in visualization of the spacecraft being
designed, enabled through the solid model. A special seat devoted to the configuration of
the spacecraft is used for SolidWorks™. During the design session, it was the most
frequently displayed monitor on their large screen.
From their model compilation, The Aerospace Corporation provided over forty
launch vehicle fairing solid models, including the STS and Sea Launch systems. The
23
availability of these models, created directly from the launch vehicle user’s guides,
provides the systems and configurations engineer a clear advantage over 2-D methods
when trying to determine whether a complex satellite design will fit within a given fairing
in the launch configuration. The engineer simply has to create a new assembly in
SolidWorks™, open the satellite and launch vehicle fairing files, and drag and drop the
origins of both parts onto the origin of the new assembly. The spacecraft may then be
moved and relations put in place or removed to properly orient it with respect to the
fairing. Though the three pictures in the figure above do not depict dimensions, they can
be easily turned on and off, enlarged or reduced, and placed in any way desired in
relation to the model. The model may be rotated to any view desired, shading and
transparency modified, and colors changed at any time. This 3-D capability obviously
gives a much clearer visual image of the satellite within the launch vehicle.
Figure 3.9 shows a very powerful feature that enables the systems or
configuration engineer to determine fit within the launch vehicle fairing. The Collision
Detection feature is turned on prior to moving an assembly or part, and gives visual and
audio alerts when parts are detected as having collided. This process has been done
previously using 2-D drafting estimation and revision techniques; now it can be done in
3-D, a much more powerful tool for complex assemblies. The figure shows the Mithra
bus placed in the Delta III launch vehicle fairing such that an alert is displayed, showing
the surfaces that have been detected as having collided. In this case, the outer panel of
the spacecraft bus has collided with the inner fairing wall.
24
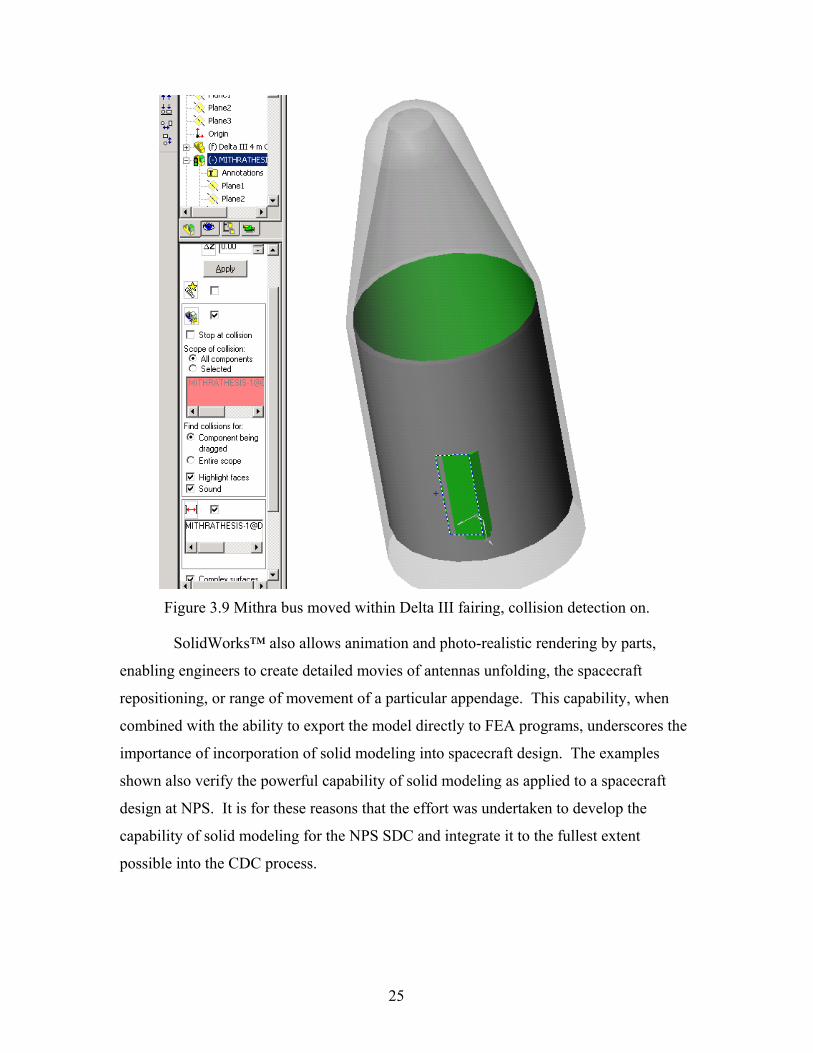
Figure 3.9 Mithra bus moved within Delta III fairing, collision detection on.
SolidWorks™ also allows animation and photo-realistic rendering by parts,
enabling engineers to create detailed movies of antennas unfolding, the spacecraft
repositioning, or range of movement of a particular appendage. This capability, when
combined with the ability to export the model directly to FEA programs, underscores the
importance of incorporation of solid modeling into spacecraft design. The examples
shown also verify the powerful capability of solid modeling as applied to a spacecraft
design at NPS. It is for these reasons that the effort was undertaken to develop the
capability of solid modeling for the NPS SDC and integrate it to the fullest extent
possible into the CDC process.
25

THIS PAGE INTENTIONALLY LEFT BLANK
26
IV. CDC AND THE NPS SPACECRAFT DESIGN CENTER
A. OVERVIEW
The Aerospace Corporation provided the Excel architecture used in the CDC to
the NPS SDC in calendar year 2000. This was done because there was no iterative, real-
time design capability within the NPS Space Systems Engineering curriculum, leaving
students at a disadvantage when it comes to understanding the real-world process that
space systems engineers must go through in order to design a spacecraft. The software
was then modified and installed by the author for test and evaluation, with consideration
towards future use in the Space Systems Engineering curriculum. The effort was
undertaken to provide the capstone design course, AA4871, a better way to conduct
spacecraft design while furthering the educational experience of the class. In addition,
the long-term goal of a student-designed and NPS-built small satellite would be furthered
by the addition of a rapid conceptual design tool. Another reason for the effort is the fact
that a User’s Guide to the CDC did not exist prior to this thesis, despite the
overwhelming success of the tool at Aerospace and other organizations, including the Jet
Propulsion Laboratory in Pasadena, California. Currently, Aerospace systems engineers
must train new personnel by having them witness the design process firsthand and
allowing them to access the subsystem spreadsheets, with no preparation or manual
available for study or guidance.
The CDC suite consists of linked spreadsheets within Microsoft Excel with
macros controlling key data transfer functions. It should be noted that real-time verbal
and written interaction between subsystems is an essential part of a successful CDC
process. The overall graphic representation of the CDC software was extensively
modified prior to full installation in order to enhance the user interface experience and to
reflect the cooperation, professionalism, and outstanding relationship existing between
The Aerospace Corporation, the NPS SDC, and the Aeronautics and Astronautics
Department.
The NPS SDC lab manager and Professor Brij Agrawal control the original,
properly functioning copy of the CDC software. Dual backups of the spreadsheets were
27
deposited with the lab manager in case reinstallation is necessary, since he is responsible
for all hardware and software installed in the lab. When discussing VBA code in this and
subsequent chapters, the terms “macro” and “subroutine” are used interchangeably.
In order to provide for security and proper use of the tool, it is important to note
the role of NPS network administrators. They retain overall authority and responsibility
for the use and maintenance of the workstations/network associated with the SDC in
accordance with NPS computer use policies. It is imperative that they are consulted on
all network issues, in addition to the lab manager. This enables controlled points of
access to the software, thereby allowing proper use and development of the tool.
The User’s Guide approaches the CDC software from a systems perspective,
concentrating on the Systems workbook and it’s inherent control of the data flow and
overall guidance of the design process. A detailed description of the Systems workbook
is presented followed by the overall data transfer architecture, specifics on link structure,
and the associated Visual Basic for Applications (VBA) code. A section on modification
to the link system, workbooks and code is also included. Details of each subsystem are
left to the user for investigation, since proper documentation and understanding of each
one is a task beyond the scope of one thesis.
The CDC User’s Guide is not intended to be an authoritative, all-encompassing or
restrictive manual on the software and its setup. The NPS SDC users are free to modify
workbooks and add functions wherever improvement is warranted upon the approval of
Professor Brij Agrawal. Modifications should take place with the full understanding of
the implications as delineated in this thesis.
B. SYSTEMS WORKBOOK
The systems workbook contains seven sheets: Inputs, Outputs, Guidelines,
Summary, Audit, TRL, and Calculations. The primary sheets used for data transfer
control are Inputs, Outputs, Summary, and Audit. The Guidelines, TRL and Calculations
sheets are for reference only. Comments were inserted for many of the cells in each
worksheet to serve as an in-use guide for the workbook. This section details the Systems
28
workbook in order to enable systems engineers to realize the proper use and functionality
of this crucial part of the CDC tool.
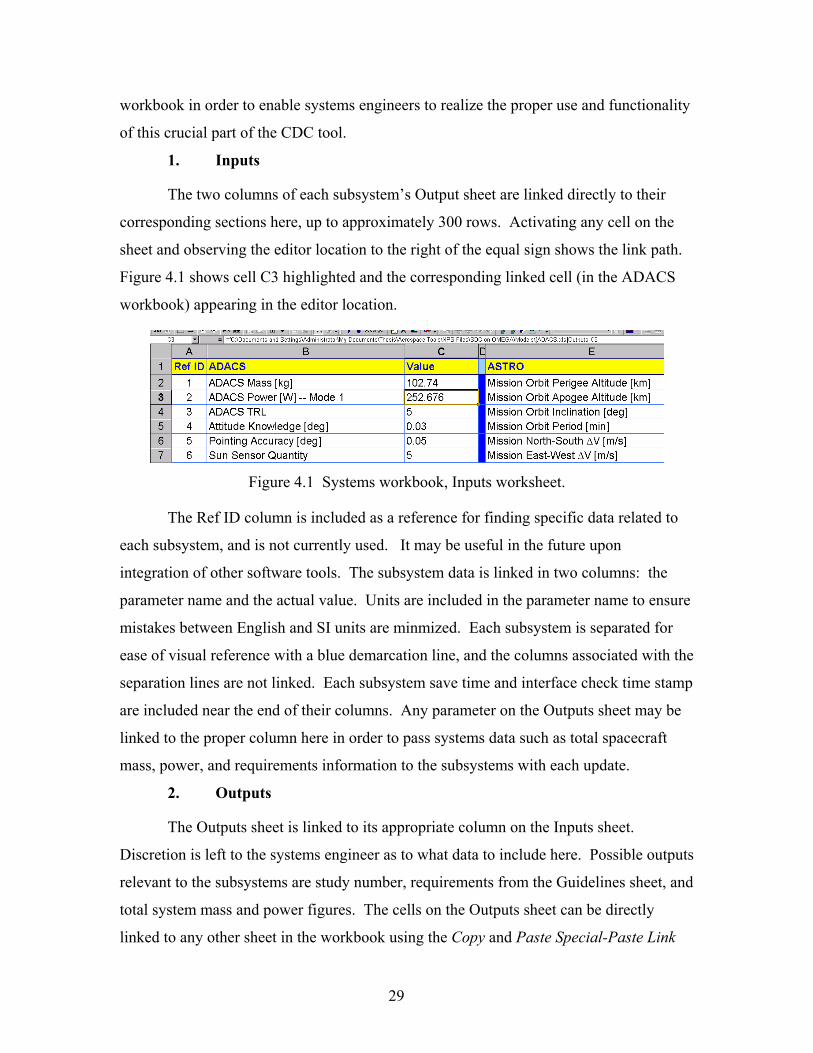
1. Inputs
The two columns of each subsystem’s Output sheet are linked directly to their
corresponding sections here, up to approximately 300 rows. Activating any cell on the
sheet and observing the editor location to the right of the equal sign shows the link path.
Figure 4.1 shows cell C3 highlighted and the corresponding linked cell (in the ADACS
workbook) appearing in the editor location.
Figure 4.1 Systems workbook, Inputs worksheet.
The Ref ID column is included as a reference for finding specific data related to
each subsystem, and is not currently used. It may be useful in the future upon
integration of other software tools. The subsystem data is linked in two columns: the
parameter name and the actual value. Units are included in the parameter name to ensure
mistakes between English and SI units are minmized. Each subsystem is separated for
ease of visual reference with a blue demarcation line, and the columns associated with the
separation lines are not linked. Each subsystem save time and interface check time stamp
are included near the end of their columns. Any parameter on the Outputs sheet may be
linked to the proper column here in order to pass systems data such as total spacecraft
mass, power, and requirements information to the subsystems with each update.
2. Outputs
The Outputs sheet is linked to its appropriate column on the Inputs sheet.
Discretion is left to the systems engineer as to what data to include here. Possible outputs
relevant to the subsystems are study number, requirements from the Guidelines sheet, and
total system mass and power figures. The cells on the Outputs sheet can be directly
linked to any other sheet in the workbook using the Copy and Paste Special-Paste Link
29
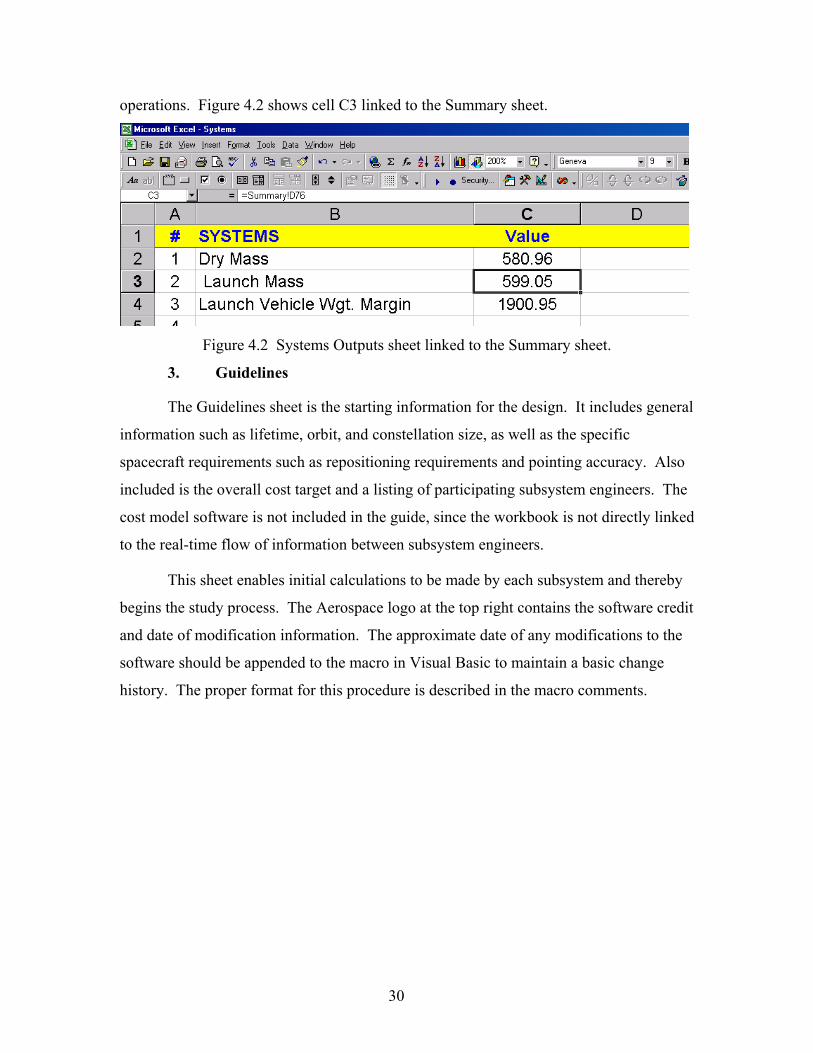
operations. Figure 4.2 shows cell C3 linked to the Summary sheet.
Figure 4.2 Systems Outputs sheet linked to the Summary sheet.
3. Guidelines
The Guidelines sheet is the starting information for the design. It includes general
information such as lifetime, orbit, and constellation size, as well as the specific
spacecraft requirements such as repositioning requirements and pointing accuracy. Also
included is the overall cost target and a listing of participating subsystem engineers. The
cost model software is not included in the guide, since the workbook is not directly linked
to the real-time flow of information between subsystem engineers.
This sheet enables initial calculations to be made by each subsystem and thereby
begins the study process. The Aerospace logo at the top right contains the software credit
and date of modification information. The approximate date of any modifications to the
software should be appended to the macro in Visual Basic to maintain a basic change
history. The proper format for this procedure is described in the macro comments.
30
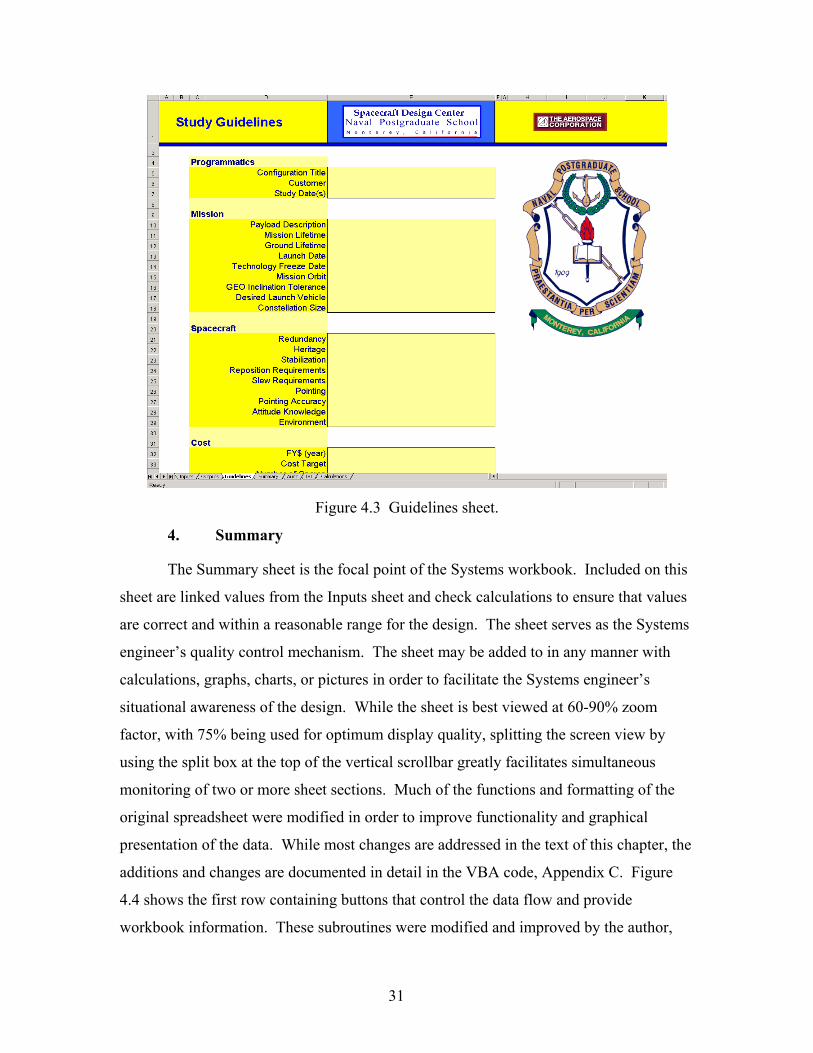
Figure 4.3 Guidelines sheet.
4. Summary
The Summary sheet is the focal point of the Systems workbook. Included on this
sheet are linked values from the Inputs sheet and check calculations to ensure that values
are correct and within a reasonable range for the design. The sheet serves as the Systems
engineer’s quality control mechanism. The sheet may be added to in any manner with
calculations, graphs, charts, or pictures in order to facilitate the Systems engineer’s
situational awareness of the design. While the sheet is best viewed at 60-90% zoom
factor, with 75% being used for optimum display quality, splitting the screen view by
using the split box at the top of the vertical scrollbar greatly facilitates simultaneous
monitoring of two or more sheet sections. Much of the functions and formatting of the
original spreadsheet were modified in order to improve functionality and graphical
presentation of the data. While most changes are addressed in the text of this chapter, the
additions and changes are documented in detail in the VBA code, Appendix C. Figure
4.4 shows the first row containing buttons that control the data flow and provide
workbook information. These subroutines were modified and improved by the author,
31
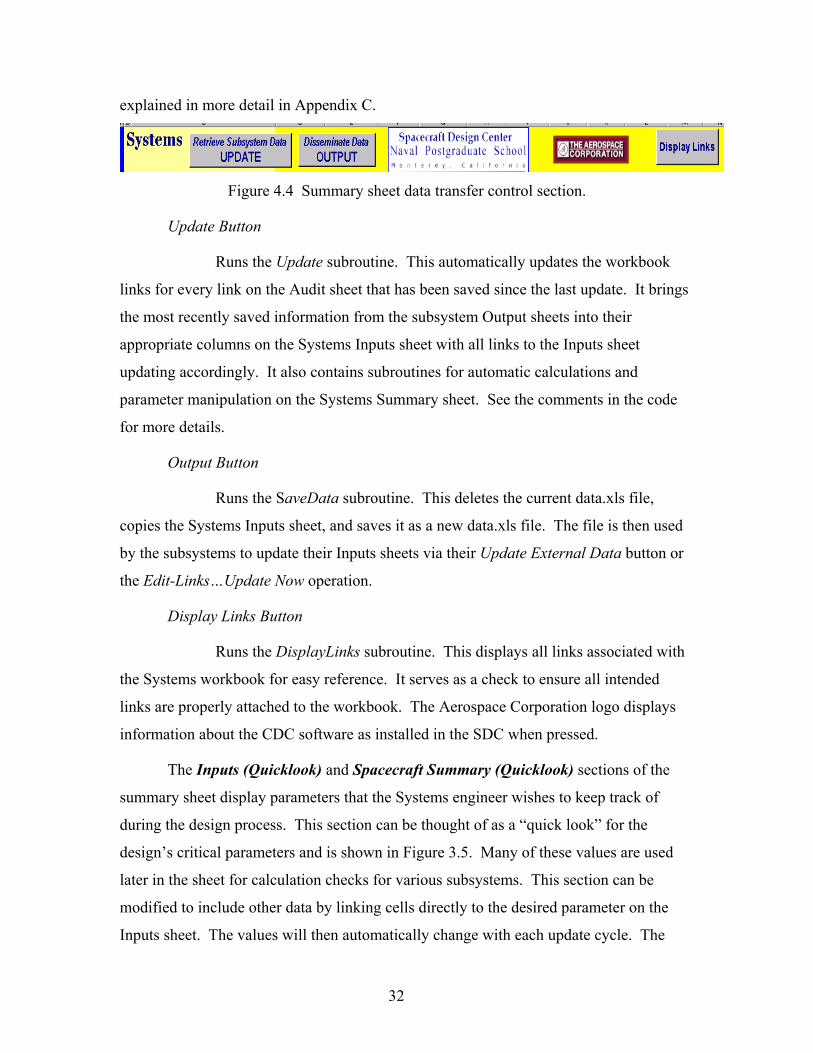
explained in more detail in Appendix C.
Figure 4.4 Summary sheet data transfer control section.
Update Button
Runs the Update subroutine. This automatically updates the workbook
links for every link on the Audit sheet that has been saved since the last update. It brings
the most recently saved information from the subsystem Output sheets into their
appropriate columns on the Systems Inputs sheet with all links to the Inputs sheet
updating accordingly. It also contains subroutines for automatic calculations and
parameter manipulation on the Systems Summary sheet. See the comments in the code
for more details.
Output Button
Runs the SaveData subroutine. This deletes the current data.xls file,
copies the Systems Inputs sheet, and saves it as a new data.xls file. The file is then used
by the subsystems to update their Inputs sheets via their Update External Data button or
the Edit-Links…Update Now operation.
Display Links Button
Runs the DisplayLinks subroutine. This displays all links associated with
the Systems workbook for easy reference. It serves as a check to ensure all intended
links are properly attached to the workbook. The Aerospace Corporation logo displays
information about the CDC software as installed in the SDC when pressed.
The Inputs (Quicklook) and Spacecraft Summary (Quicklook) sections of the
summary sheet display parameters that the Systems engineer wishes to keep track of
during the design process. This section can be thought of as a “quick look” for the
design’s critical parameters and is shown in Figure 3.5. Many of these values are used
later in the sheet for calculation checks for various subsystems. This section can be
modified to include other data by linking cells directly to the desired parameter on the
Inputs sheet. The values will then automatically change with each update cycle. The
32
systems engineer retains the option to directly enter a value in a cell to override the
subsystem inputs. If this is done, the link to the inputs sheet must be reestablished before
the next update, otherwise the cell must continue to be updated manually. Note that the
Communications subsystem is divided into TT&C and C&DH. These two subsystems
may be under the purview of one engineer, but frequently are considered separate in their
functions. If it is necessary to model a specific communications payload, the mass and
power estimates may be entered manually in the Payload area of the Mass and Power
section. Any other subsystem created by a design team may have its inputs inserted here,
but care must be taken with the cell references as written in the VBA code.
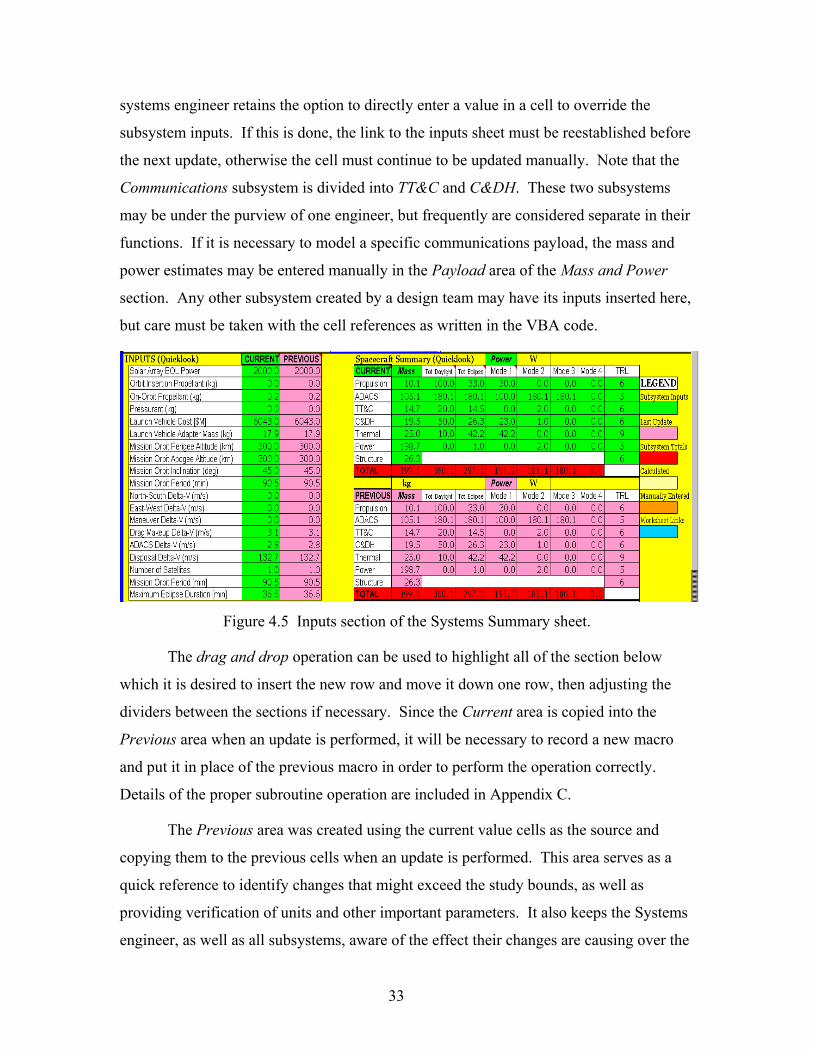
Figure 4.5 Inputs section of the Systems Summary sheet.
The drag and drop operation can be used to highlight all of the section below
which it is desired to insert the new row and move it down one row, then adjusting the
dividers between the sections if necessary. Since the Current area is copied into the
Previous area when an update is performed, it will be necessary to record a new macro
and put it in place of the previous macro in order to perform the operation correctly.
Details of the proper subroutine operation are included in Appendix C.
The Previous area was created using the current value cells as the source and
copying them to the previous cells when an update is performed. This area serves as a
quick reference to identify changes that might exceed the study bounds, as well as
providing verification of units and other important parameters. It also keeps the Systems
engineer, as well as all subsystems, aware of the effect their changes are causing over the
33
design iteration. A macro was recorded when creating the areas highlighted in Figure
4.5. The Copy and Paste Special-Values operation was used on the Current areas and the
values placed in the Previous cells. The macros were then included at the beginning of
the update subroutine, as detailed in Appendix C. This has the effect of transferring the
current values to the previous values whenever the Update button is depressed, prior to
retrieving the new values from the subsystems. Any other parameters of interest can be
added to the Current and Previous areas by minimal additions to the code. The
comments in the VBA code detail this procedure.
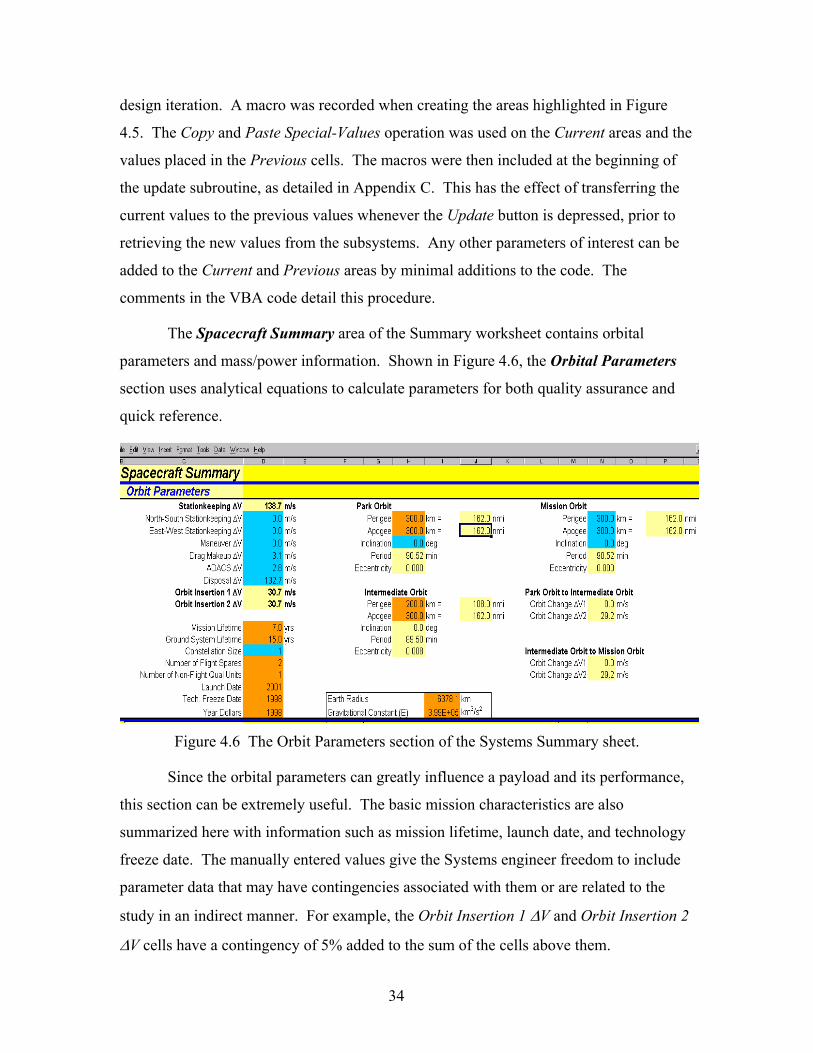
The Spacecraft Summary area of the Summary worksheet contains orbital
parameters and mass/power information. Shown in Figure 4.6, the Orbital Parameters
section uses analytical equations to calculate parameters for both quality assurance and
quick reference.
Figure 4.6 The Orbit Parameters section of the Systems Summary sheet.
Since the orbital parameters can greatly influence a payload and its performance,
this section can be extremely useful. The basic mission characteristics are also
summarized here with information such as mission lifetime, launch date, and technology
freeze date. The manually entered values give the Systems engineer freedom to include
parameter data that may have contingencies associated with them or are related to the
study in an indirect manner. For example, the Orbit Insertion 1 ∆V and Orbit Insertion 2
∆V cells have a contingency of 5% added to the sum of the cells above them.
34
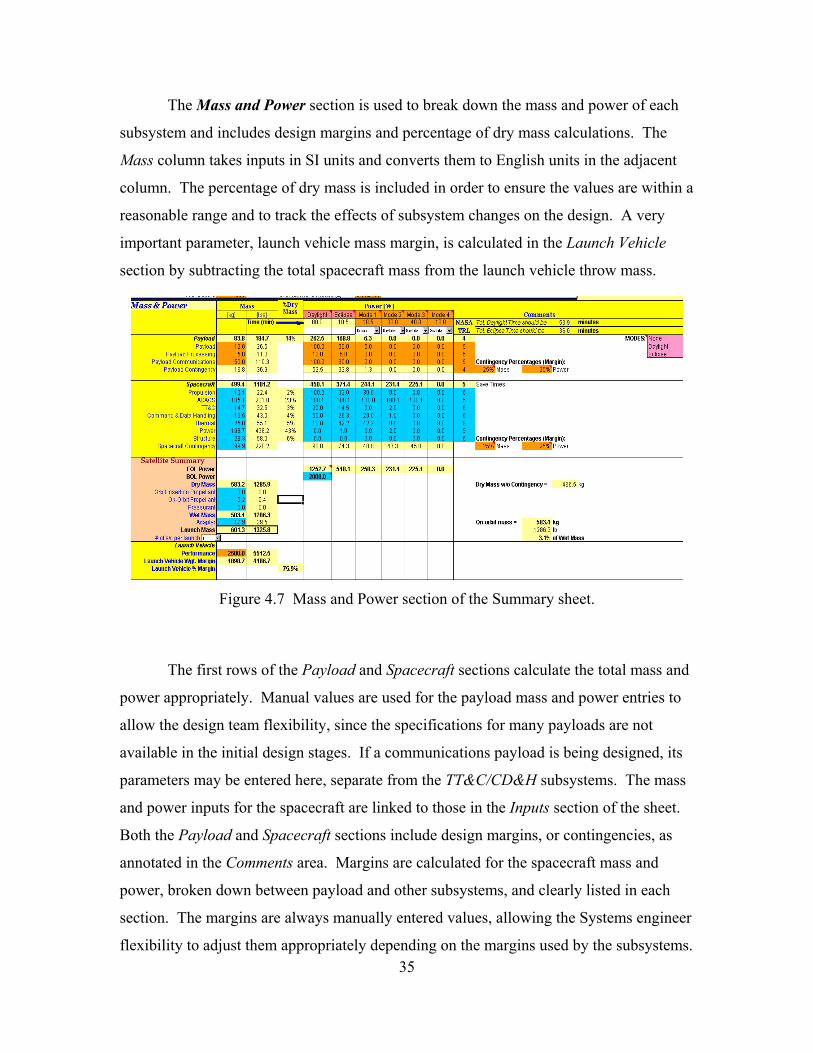
The Mass and Power section is used to break down the mass and power of each
subsystem and includes design margins and percentage of dry mass calculations. The
Mass column takes inputs in SI units and converts them to English units in the adjacent
column. The percentage of dry mass is included in order to ensure the values are within a
reasonable range and to track the effects of subsystem changes on the design. A very
important parameter, launch vehicle mass margin, is calculated in the Launch Vehicle
section by subtracting the total spacecraft mass from the launch vehicle throw mass.
Figure 4.7 Mass and Power section of the Summary sheet.
The first rows of the Payload and Spacecraft sections calculate the total mass and
power appropriately. Manual values are used for the payload mass and power entries to
allow the design team flexibility, since the specifications for many payloads are not
available in the initial design stages. If a communications payload is being designed, its
parameters may be entered here, separate from the TT&C/CD&H subsystems. The mass
and power inputs for the spacecraft are linked to those in the Inputs section of the sheet.
Both the Payload and Spacecraft sections include design margins, or contingencies, as
annotated in the Comments area. Margins are calculated for the spacecraft mass and
power, broken down between payload and other subsystems, and clearly listed in each
section. The margins are always manually entered values, allowing the Systems engineer
flexibility to adjust them appropriately depending on the margins used by the subsystems. 35
Typical values of preliminary design margins range from 25% for new equipment to 5%
for known hardware [Ref. 8:p. 317]. According to Joseph Aguilar of The Aerospace
Corporation, the margins for conceptual design, which takes place in the CDC, should not
fall below 25%. The decision must be made early in the design process as to the use of
margins by the subsystems in order to ensure proper use of this critical design factor. In
the SDC, the subsystem component lists may be used for general design guidance where
available. However, the design team should take into consideration that The Aerospace
Corporation generally does not specify hardware at the component level.
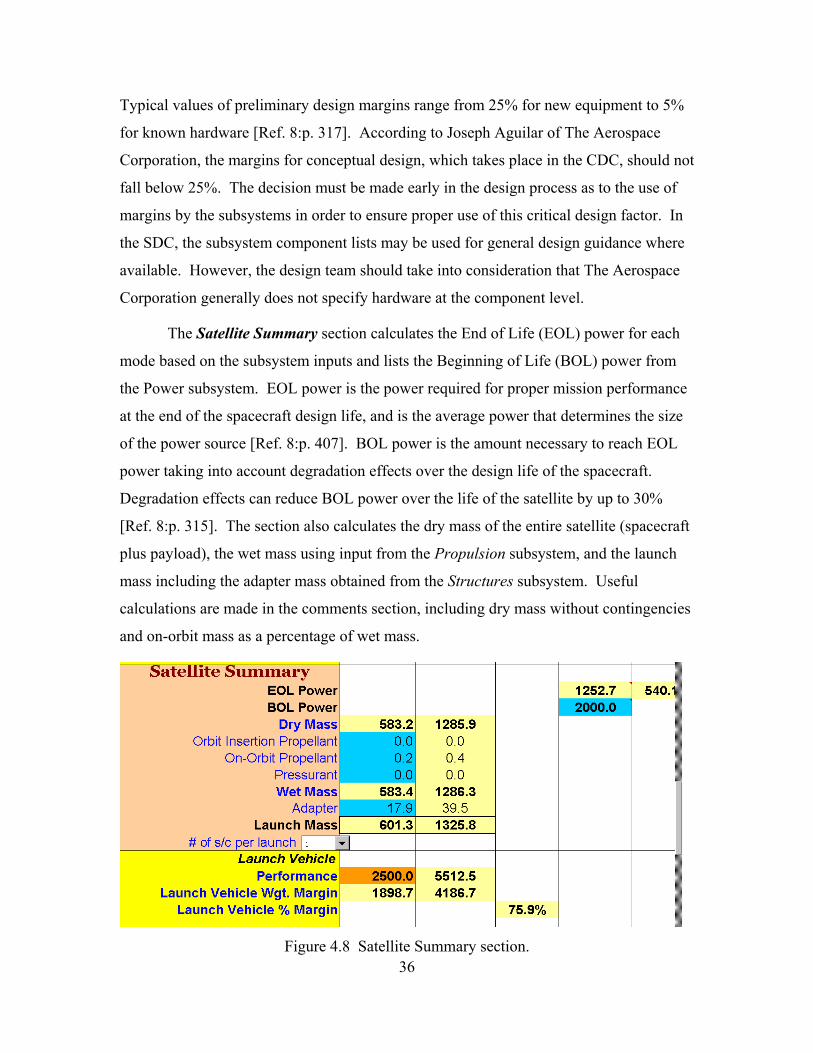
The Satellite Summary section calculates the End of Life (EOL) power for each
mode based on the subsystem inputs and lists the Beginning of Life (BOL) power from
the Power subsystem. EOL power is the power required for proper mission performance
at the end of the spacecraft design life, and is the average power that determines the size
of the power source [Ref. 8:p. 407]. BOL power is the amount necessary to reach EOL
power taking into account degradation effects over the design life of the spacecraft.
Degradation effects can reduce BOL power over the life of the satellite by up to 30%
[Ref. 8:p. 315]. The section also calculates the dry mass of the entire satellite (spacecraft
plus payload), the wet mass using input from the Propulsion subsystem, and the launch
mass including the adapter mass obtained from the Structures subsystem. Useful
calculations are made in the comments section, including dry mass without contingencies
and on-orbit mass as a percentage of wet mass.
36Figure 4.8 Satellite Summary section.
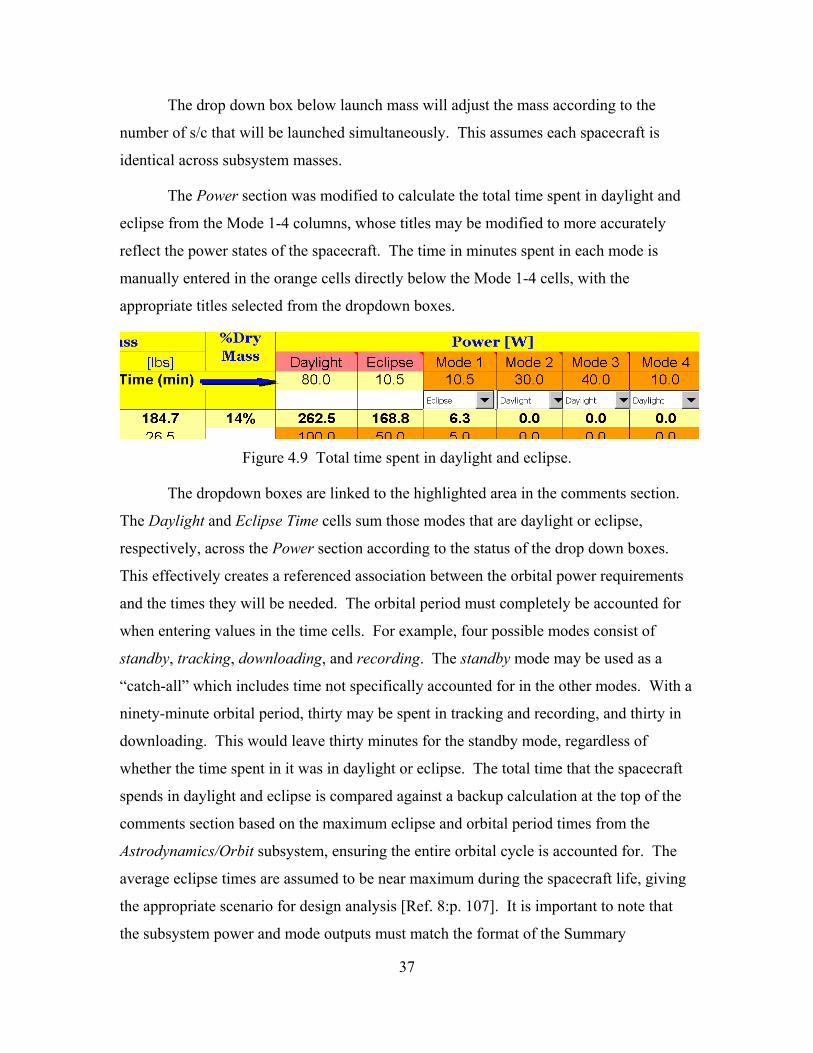
The drop down box below launch mass will adjust the mass according to the
number of s/c that will be launched simultaneously. This assumes each spacecraft is
identical across subsystem masses.
The Power section was modified to calculate the total time spent in daylight and
eclipse from the Mode 1-4 columns, whose titles may be modified to more accurately
reflect the power states of the spacecraft. The time in minutes spent in each mode is
manually entered in the orange cells directly below the Mode 1-4 cells, with the
appropriate titles selected from the dropdown boxes.
Figure 4.9 Total time spent in daylight and eclipse.
The dropdown boxes are linked to the highlighted area in the comments section.
The Daylight and Eclipse Time cells sum those modes that are daylight or eclipse,
respectively, across the Power section according to the status of the drop down boxes.
This effectively creates a referenced association between the orbital power requirements
and the times they will be needed. The orbital period must completely be accounted for
when entering values in the time cells. For example, four possible modes consist of
standby, tracking, downloading, and recording. The standby mode may be used as a
“catch-all” which includes time not specifically accounted for in the other modes. With a
ninety-minute orbital period, thirty may be spent in tracking and recording, and thirty in
downloading. This would leave thirty minutes for the standby mode, regardless of
whether the time spent in it was in daylight or eclipse. The total time that the spacecraft
spends in daylight and eclipse is compared against a backup calculation at the top of the
comments section based on the maximum eclipse and orbital period times from the
Astrodynamics/Orbit subsystem, ensuring the entire orbital cycle is accounted for. The
average eclipse times are assumed to be near maximum during the spacecraft life, giving
the appropriate scenario for design analysis [Ref. 8:p. 107]. It is important to note that
the subsystem power and mode outputs must match the format of the Summary
37
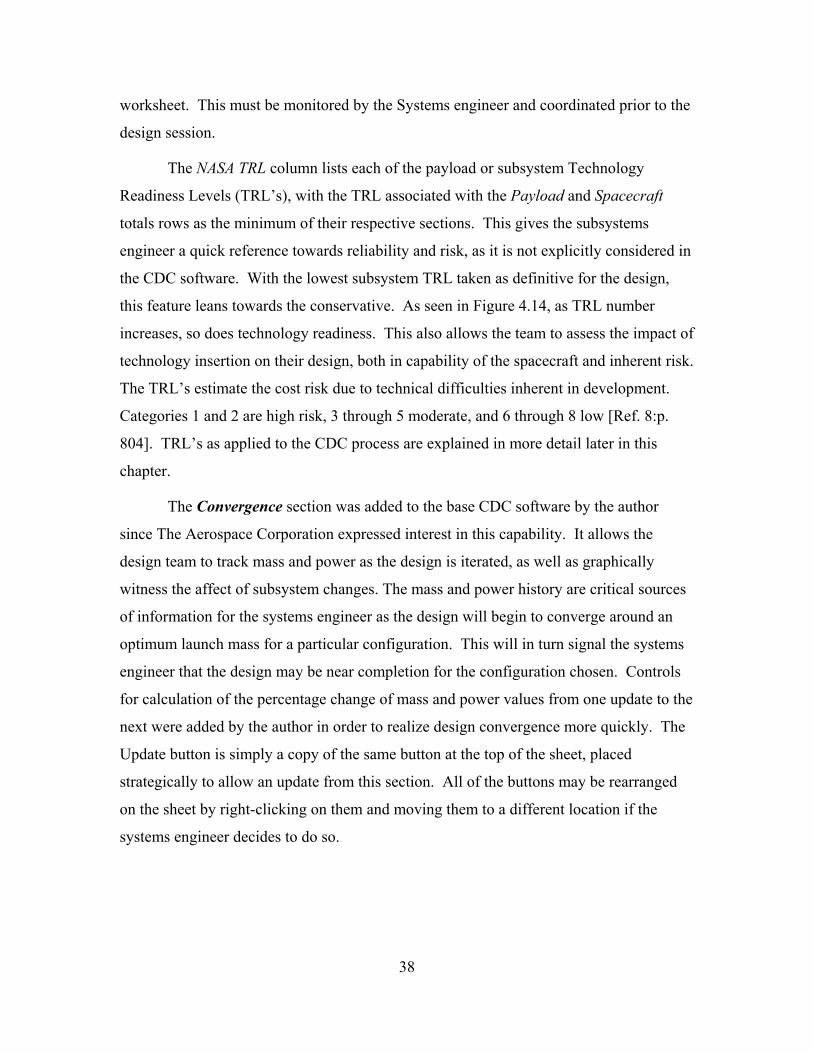
worksheet. This must be monitored by the Systems engineer and coordinated prior to the
design session.
The NASA TRL column lists each of the payload or subsystem Technology
Readiness Levels (TRL’s), with the TRL associated with the Payload and Spacecraft
totals rows as the minimum of their respective sections. This gives the subsystems
engineer a quick reference towards reliability and risk, as it is not explicitly considered in
the CDC software. With the lowest subsystem TRL taken as definitive for the design,
this feature leans towards the conservative. As seen in Figure 4.14, as TRL number
increases, so does technology readiness. This also allows the team to assess the impact of
technology insertion on their design, both in capability of the spacecraft and inherent risk.
The TRL’s estimate the cost risk due to technical difficulties inherent in development.
Categories 1 and 2 are high risk, 3 through 5 moderate, and 6 through 8 low [Ref. 8:p.
804]. TRL’s as applied to the CDC process are explained in more detail later in this
chapter.
The Convergence section was added to the base CDC software by the author
since The Aerospace Corporation expressed interest in this capability. It allows the
design team to track mass and power as the design is iterated, as well as graphically
witness the affect of subsystem changes. The mass and power history are critical sources
of information for the systems engineer as the design will begin to converge around an
optimum launch mass for a particular configuration. This will in turn signal the systems
engineer that the design may be near completion for the configuration chosen. Controls
for calculation of the percentage change of mass and power values from one update to the
next were added by the author in order to realize design convergence more quickly. The
Update button is simply a copy of the same button at the top of the sheet, placed
strategically to allow an update from this section. All of the buttons may be rearranged
on the sheet by right-clicking on them and moving them to a different location if the
systems engineer decides to do so.
38
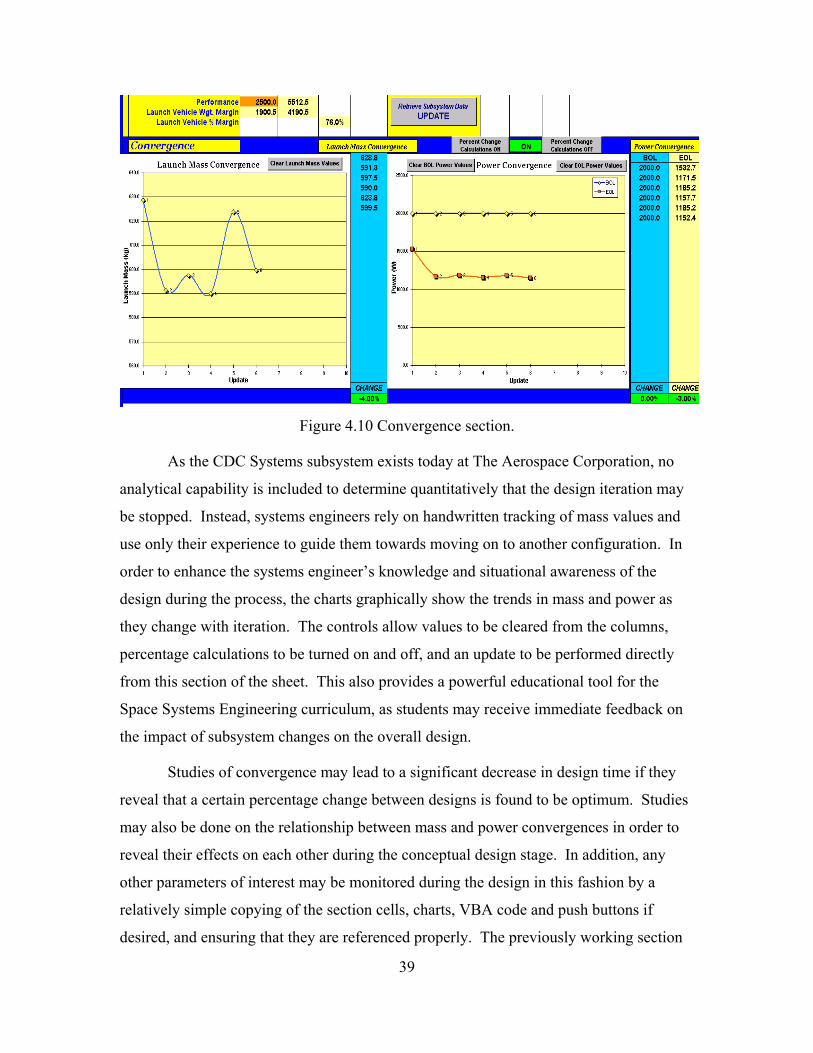
Figure 4.10 Convergence section.
As the CDC Systems subsystem exists today at The Aerospace Corporation, no
analytical capability is included to determine quantitatively that the design iteration may
be stopped. Instead, systems engineers rely on handwritten tracking of mass values and
use only their experience to guide them towards moving on to another configuration. In
order to enhance the systems engineer’s knowledge and situational awareness of the
design during the process, the charts graphically show the trends in mass and power as
they change with iteration. The controls allow values to be cleared from the columns,
percentage calculations to be turned on and off, and an update to be performed directly
from this section of the sheet. This also provides a powerful educational tool for the
Space Systems Engineering curriculum, as students may receive immediate feedback on
the impact of subsystem changes on the overall design.
Studies of convergence may lead to a significant decrease in design time if they
reveal that a certain percentage change between designs is found to be optimum. Studies
may also be done on the relationship between mass and power convergences in order to
reveal their effects on each other during the conceptual design stage. In addition, any
other parameters of interest may be monitored during the design in this fashion by a
relatively simple copying of the section cells, charts, VBA code and push buttons if
desired, and ensuring that they are referenced properly. The previously working section
39
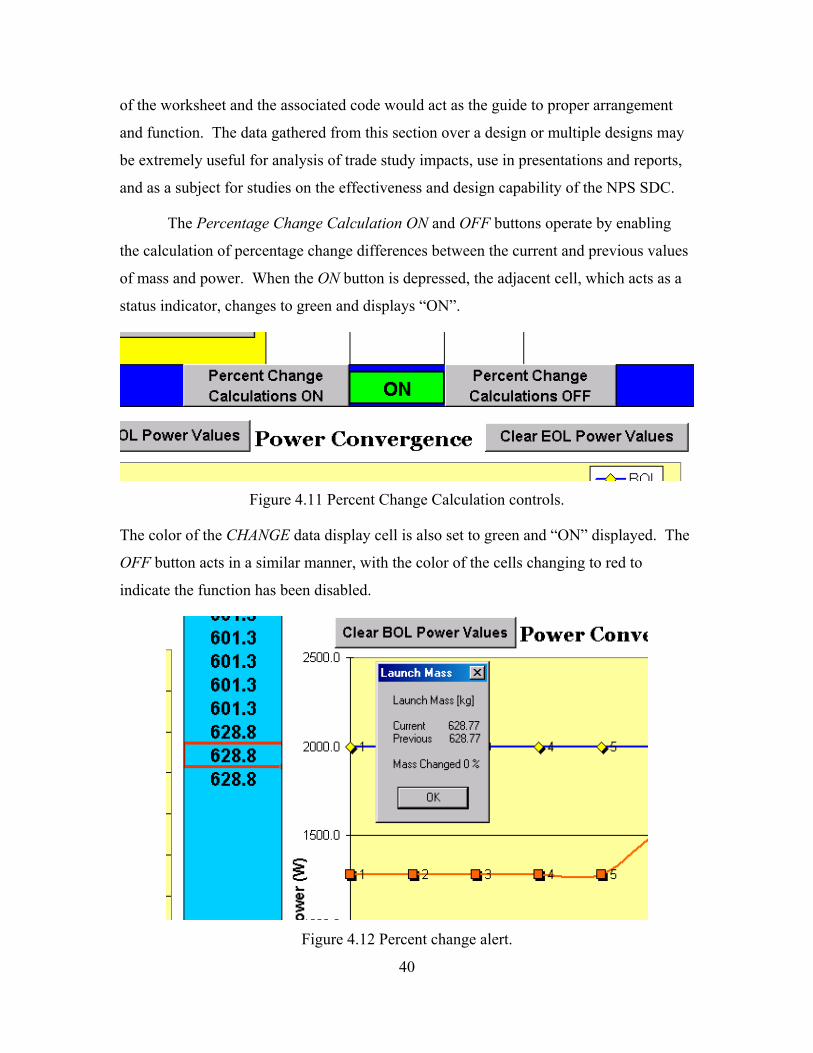
of the worksheet and the associated code would act as the guide to proper arrangement
and function. The data gathered from this section over a design or multiple designs may
be extremely useful for analysis of trade study impacts, use in presentations and reports,
and as a subject for studies on the effectiveness and design capability of the NPS SDC.
The Percentage Change Calculation ON and OFF buttons operate by enabling
the calculation of percentage change differences between the current and previous values
of mass and power. When the ON button is depressed, the adjacent cell, which acts as a
status indicator, changes to green and displays “ON”.
Figure 4.11 Percent Change Calculation controls.
The color of the CHANGE data display cell is also set to green and “ON” displayed. The
OFF button acts in a similar manner, with the color of the cells changing to red to
indicate the function has been disabled.
Figure 4.12 Percent change alert.
40
The code performs the calculation when an update is performed if it is enabled,
evidenced by the green “ON” in the status cell. It finds the last two values in each
column and displays the difference as a percentage relative to the previous value using
the general formula (Current-Previous)/Previous. The values and percentage change are
then displayed using message boxes in order to quickly and clearly alert the Systems
engineer to the changes and are then placed in the appropriate CHANGE data display cell.
The CHANGE data display cell is manually formatted to display the value as a
percentage, while the formatting for the message box alerts is done in the VBA code.
The OFF button inhibits the performance of the calculations. When the ON button is
depressed during the iterative process, the last calculated value of percent change is
replaced with “ON” in the data display cell beneath the respective columns. The raw
code and associated comments may be found within the VBA code section of this
document.
Since the functionality is embedded in the update macro, each time the Update
button is pressed the new value of launch mass and EOL/BOL power are taken from the
Launch Mass cell and the EOL/BOL Power cells and written to the appropriate columns.
The columns are linked as the data source for the charts, thus updating the chart
automatically. When a new study begins or it becomes necessary to clear the charts at
any time, the Launch Mass Convergence and Power Convergence columns (chart source
columns) can be cleared of data by depressing the Clear button corresponding to the
column of interest. The function may also be performed by activating the cells of
interest, right clicking, and using the Clear Contents operation. If the button is used to
clear the data, it cannot be recovered, while using the Clear Contents operation enables
recovery using the Undo button.
41
The source data range may be changed by activating the chart of interest, right
clicking, selecting Source Data…, and modifying the Data Range field as appropriate.
The source data range is outlined in blue when the chart area is activated. Initially, the
source data range is kept relatively small in order for the chart to present the information
effectively. As the design is iterated, the source data range may be increased as
necessary by activating the chart and dragging the range outlined in blue to the
appropriate size. The clear buttons are not available when the chart is active.
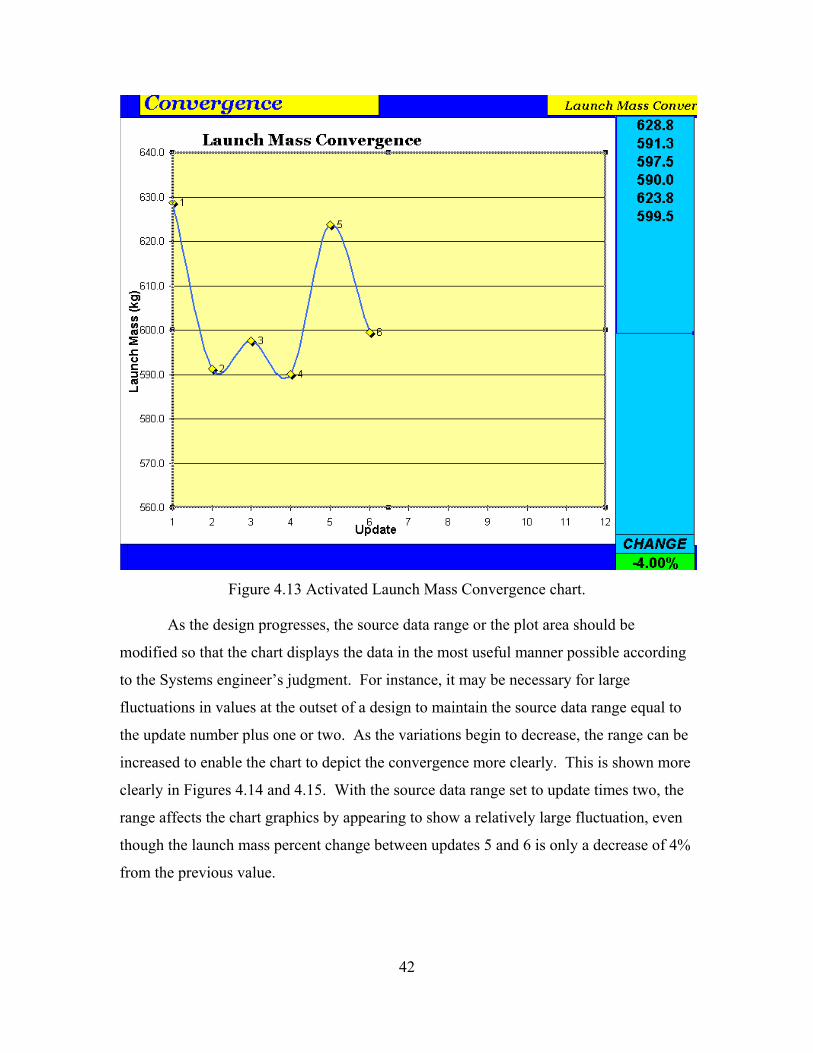
Figure 4.13 Activated Launch Mass Convergence chart.
As the design progresses, the source data range or the plot area should be
modified so that the chart displays the data in the most useful manner possible according
to the Systems engineer’s judgment. For instance, it may be necessary for large
fluctuations in values at the outset of a design to maintain the source data range equal to
the update number plus one or two. As the variations begin to decrease, the range can be
increased to enable the chart to depict the convergence more clearly. This is shown more
clearly in Figures 4.14 and 4.15. With the source data range set to update times two, the
range affects the chart graphics by appearing to show a relatively large fluctuation, even
though the launch mass percent change between updates 5 and 6 is only a decrease of 4%
from the previous value.
42
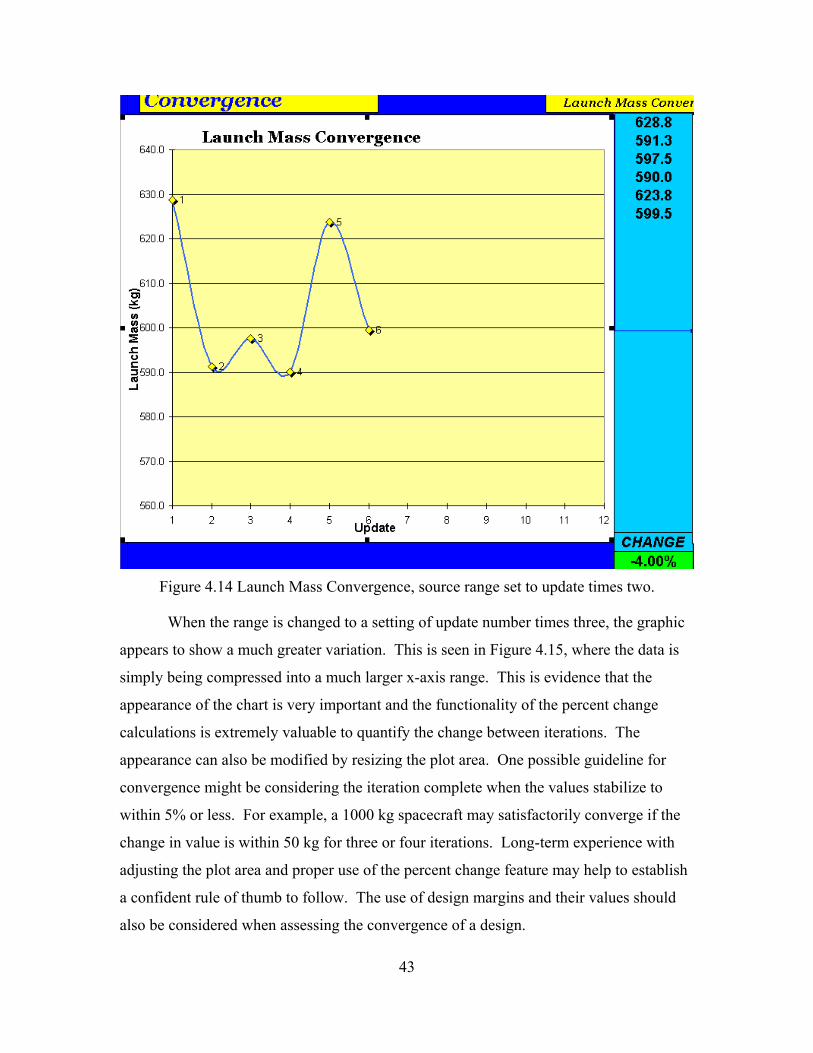
Figure 4.14 Launch Mass Convergence, source range set to update times two.
When the range is changed to a setting of update number times three, the graphic
appears to show a much greater variation. This is seen in Figure 4.15, where the data is
simply being compressed into a much larger x-axis range. This is evidence that the
appearance of the chart is very important and the functionality of the percent change
calculations is extremely valuable to quantify the change between iterations. The
appearance can also be modified by resizing the plot area. One possible guideline for
convergence might be considering the iteration complete when the values stabilize to
within 5% or less. For example, a 1000 kg spacecraft may satisfactorily converge if the
change in value is within 50 kg for three or four iterations. Long-term experience with
adjusting the plot area and proper use of the percent change feature may help to establish
a confident rule of thumb to follow. The use of design margins and their values should
also be considered when assessing the convergence of a design.
43
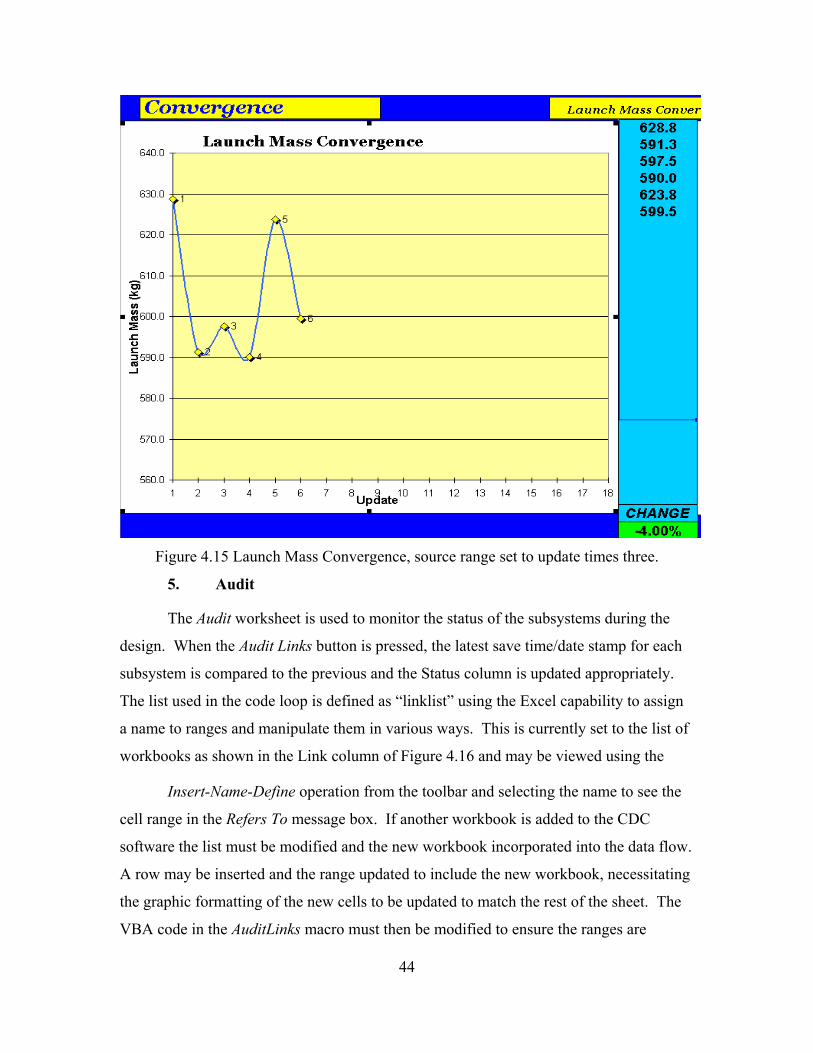
Figure 4.15 Launch Mass Convergence, source range set to update times three.
5. Audit
The Audit worksheet is used to monitor the status of the subsystems during the
design. When the Audit Links button is pressed, the latest save time/date stamp for each
subsystem is compared to the previous and the Status column is updated appropriately.
The list used in the code loop is defined as “linklist” using the Excel capability to assign
a name to ranges and manipulate them in various ways. This is currently set to the list of
workbooks as shown in the Link column of Figure 4.16 and may be viewed using the
Insert-Name-Define operation from the toolbar and selecting the name to see the
cell range in the Refers To message box. If another workbook is added to the CDC
software the list must be modified and the new workbook incorporated into the data flow.
A row may be inserted and the range updated to include the new workbook, necessitating
the graphic formatting of the new cells to be updated to match the rest of the sheet. The
VBA code in the AuditLinks macro must then be modified to ensure the ranges are
44
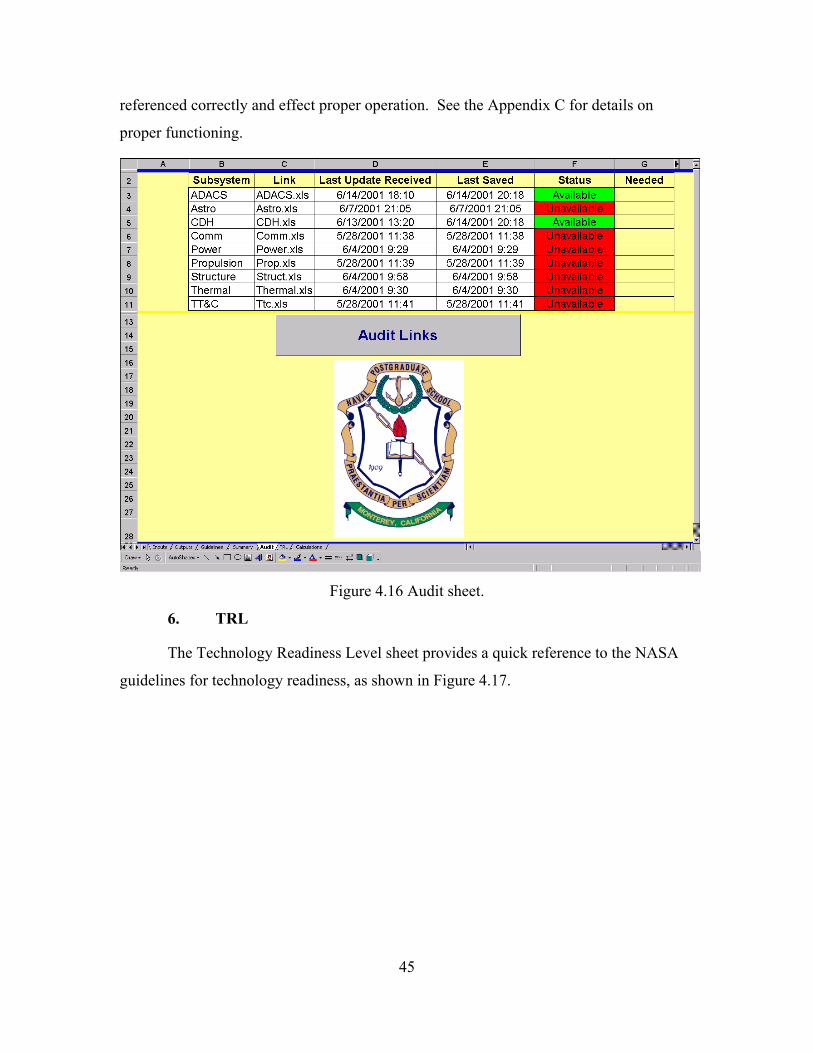
referenced correctly and effect proper operation. See the Appendix C for details on
proper functioning.
Figure 4.16 Audit sheet.
6. TRL
The Technology Readiness Level sheet provides a quick reference to the NASA
guidelines for technology readiness, as shown in Figure 4.17.
45
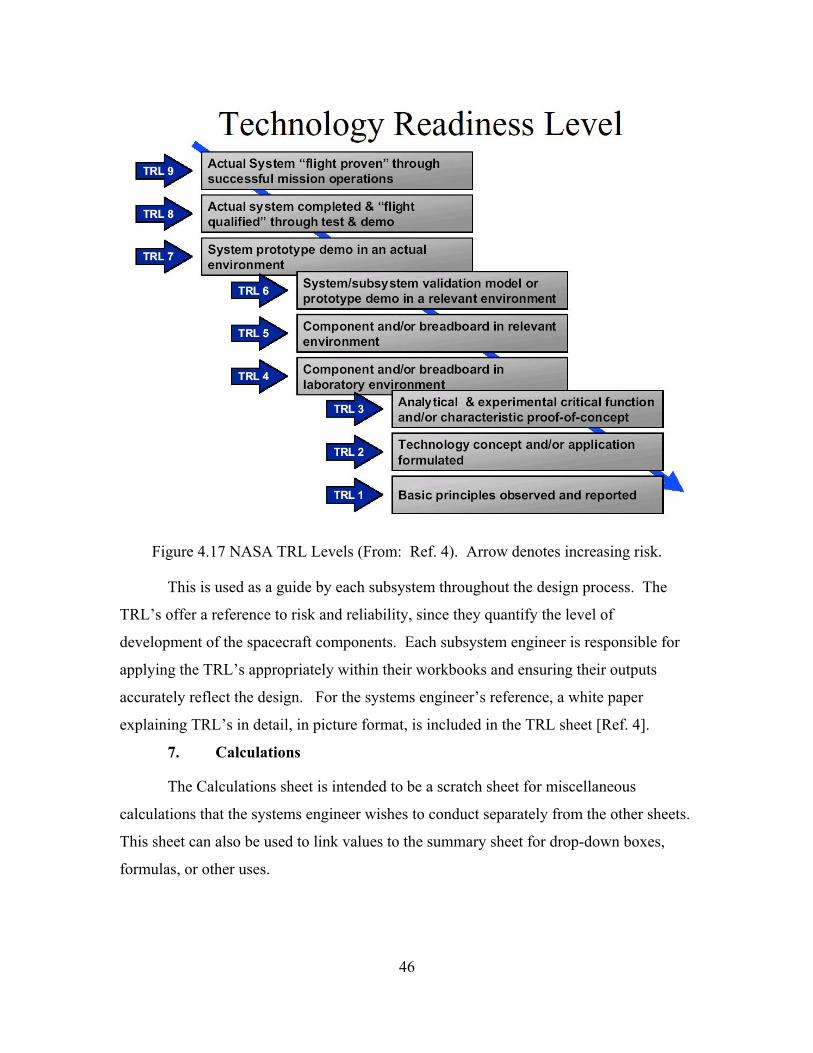
Figure 4.17 NASA TRL Levels (From: Ref. 4). Arrow denotes increasing risk.
This is used as a guide by each subsystem throughout the design process. The
TRL’s offer a reference to risk and reliability, since they quantify the level of
development of the spacecraft components. Each subsystem engineer is responsible for
applying the TRL’s appropriately within their workbooks and ensuring their outputs
accurately reflect the design. For the systems engineer’s reference, a white paper
explaining TRL’s in detail, in picture format, is included in the TRL sheet [Ref. 4].
7. Calculations
The Calculations sheet is intended to be a scratch sheet for miscellaneous
calculations that the systems engineer wishes to conduct separately from the other sheets.
This sheet can also be used to link values to the summary sheet for drop-down boxes,
formulas, or other uses.
46
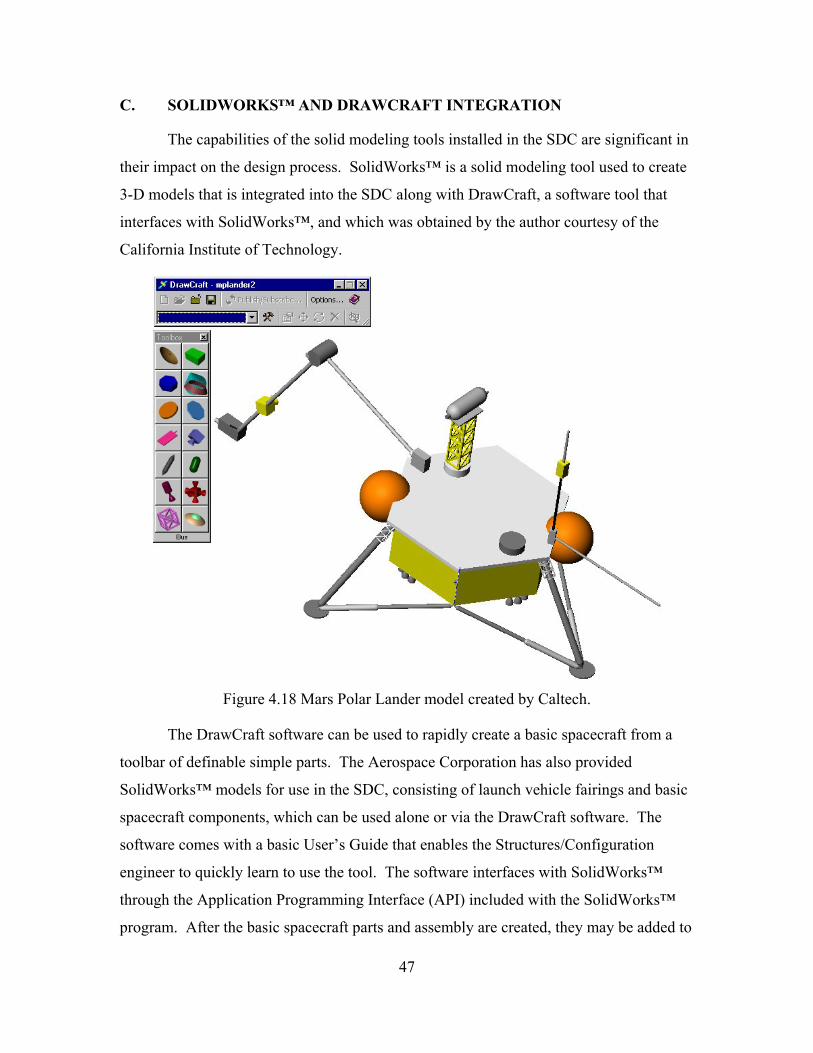
C. SOLIDWORKS™ AND DRAWCRAFT INTEGRATION
The capabilities of the solid modeling tools installed in the SDC are significant in
their impact on the design process. SolidWorks™ is a solid modeling tool used to create
3-D models that is integrated into the SDC along with DrawCraft, a software tool that
interfaces with SolidWorks™, and which was obtained by the author courtesy of the
California Institute of Technology.
Figure 4.18 Mars Polar Lander model created by Caltech.
The DrawCraft software can be used to rapidly create a basic spacecraft from a
toolbar of definable simple parts. The Aerospace Corporation has also provided
SolidWorks™ models for use in the SDC, consisting of launch vehicle fairings and basic
spacecraft components, which can be used alone or via the DrawCraft software. The
software comes with a basic User’s Guide that enables the Structures/Configuration
engineer to quickly learn to use the tool. The software interfaces with SolidWorks™
through the Application Programming Interface (API) included with the SolidWorks™
program. After the basic spacecraft parts and assembly are created, they may be added to
47
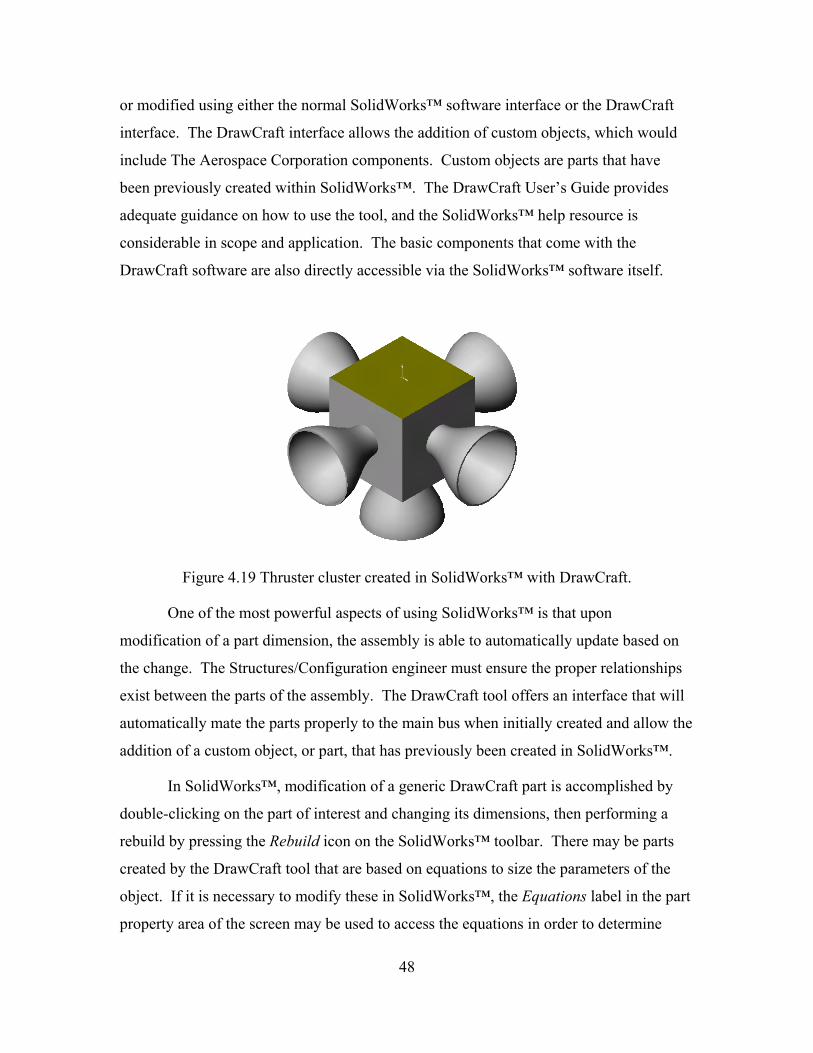
or modified using either the normal SolidWorks™ software interface or the DrawCraft
interface. The DrawCraft interface allows the addition of custom objects, which would
include The Aerospace Corporation components. Custom objects are parts that have
been previously created within SolidWorks™. The DrawCraft User’s Guide provides
adequate guidance on how to use the tool, and the SolidWorks™ help resource is
considerable in scope and application. The basic components that come with the
DrawCraft software are also directly accessible via the SolidWorks™ software itself.
Figure 4.19 Thruster cluster created in SolidWorks™ with DrawCraft.
One of the most powerful aspects of using SolidWorks™ is that upon
modification of a part dimension, the assembly is able to automatically update based on
the change. The Structures/Configuration engineer must ensure the proper relationships
exist between the parts of the assembly. The DrawCraft tool offers an interface that will
automatically mate the parts properly to the main bus when initially created and allow the
addition of a custom object, or part, that has previously been created in SolidWorks™.
In SolidWorks™, modification of a generic DrawCraft part is accomplished by
double-clicking on the part of interest and changing its dimensions, then performing a
rebuild by pressing the Rebuild icon on the SolidWorks™ toolbar. There may be parts
created by the DrawCraft tool that are based on equations to size the parameters of the
object. If it is necessary to modify these in SolidWorks™, the Equations label in the part
property area of the screen may be used to access the equations in order to determine
48
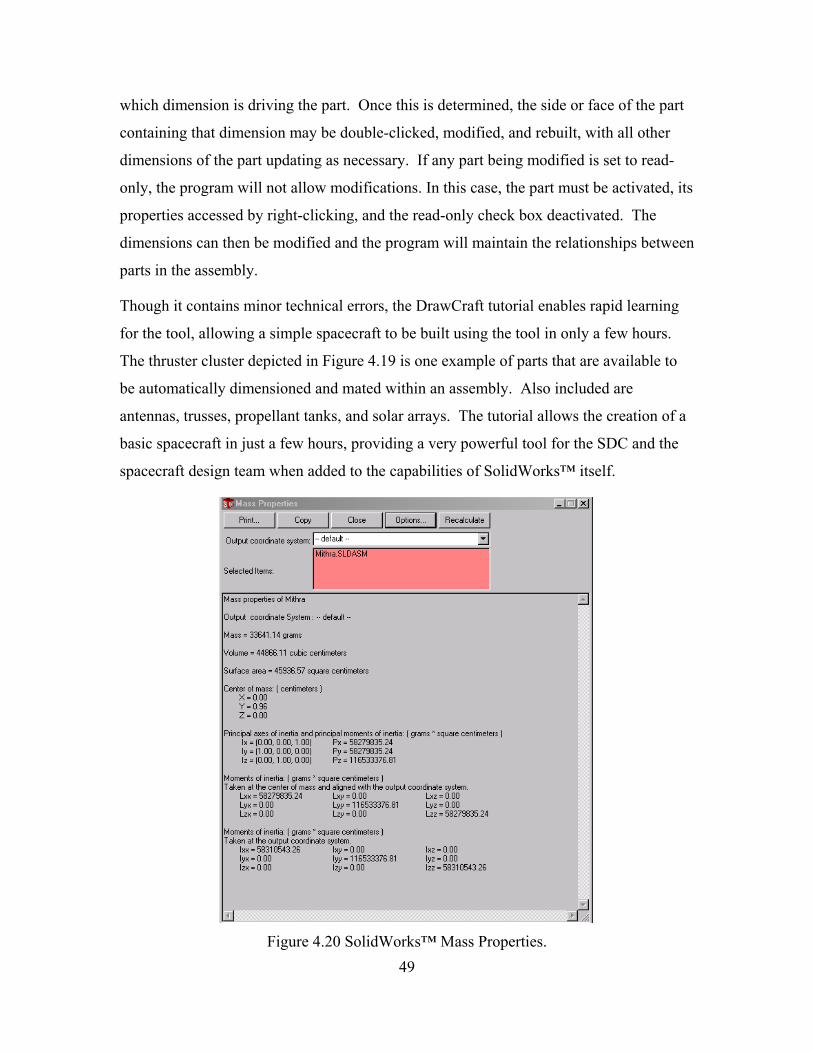
which dimension is driving the part. Once this is determined, the side or face of the part
containing that dimension may be double-clicked, modified, and rebuilt, with all other
dimensions of the part updating as necessary. If any part being modified is set to read-
only, the program will not allow modifications. In this case, the part must be activated, its
properties accessed by right-clicking, and the read-only check box deactivated. The
dimensions can then be modified and the program will maintain the relationships between
parts in the assembly.
Though it contains minor technical errors, the DrawCraft tutorial enables rapid learning
for the tool, allowing a simple spacecraft to be built using the tool in only a few hours.
The thruster cluster depicted in Figure 4.19 is one example of parts that are available to
be automatically dimensioned and mated within an assembly. Also included are
antennas, trusses, propellant tanks, and solar arrays. The tutorial allows the creation of a
basic spacecraft in just a few hours, providing a very powerful tool for the SDC and the
spacecraft design team when added to the capabilities of SolidWorks™ itself.
Figure 4.20 SolidWorks™ Mass Properties.
49
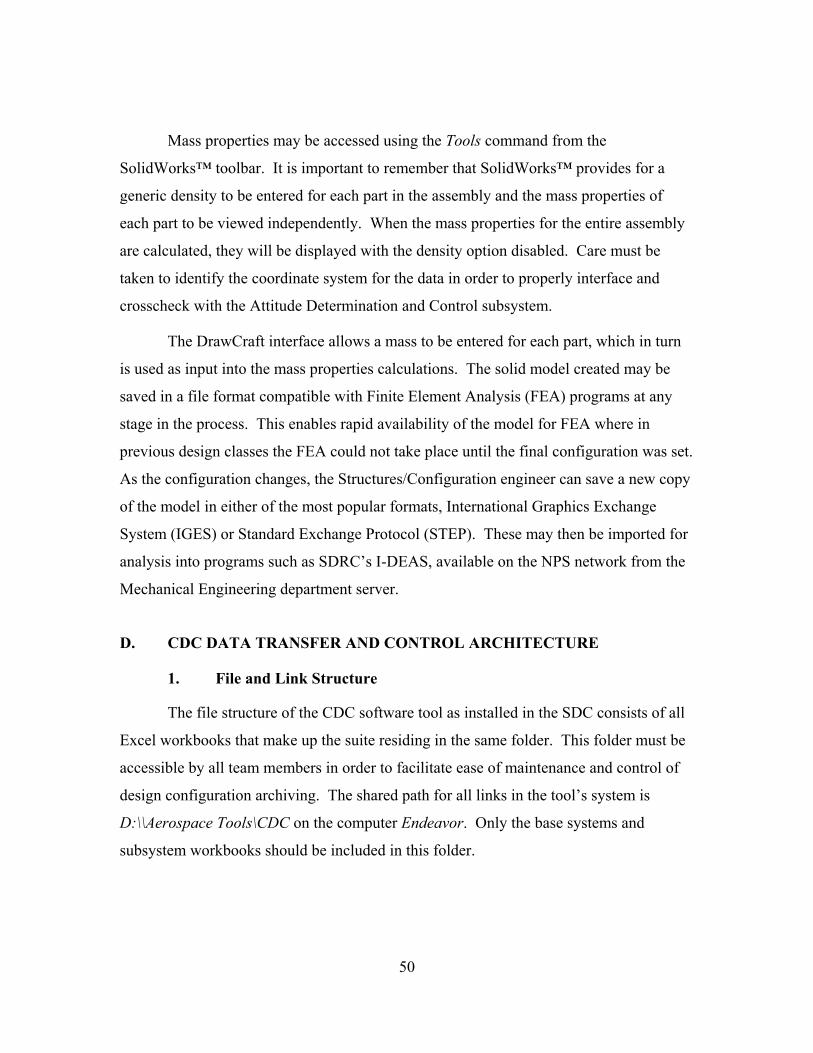
Mass properties may be accessed using the Tools command from the
SolidWorks™ toolbar. It is important to remember that SolidWorks™ provides for a
generic density to be entered for each part in the assembly and the mass properties of
each part to be viewed independently. When the mass properties for the entire assembly
are calculated, they will be displayed with the density option disabled. Care must be
taken to identify the coordinate system for the data in order to properly interface and
crosscheck with the Attitude Determination and Control subsystem.
The DrawCraft interface allows a mass to be entered for each part, which in turn
is used as input into the mass properties calculations. The solid model created may be
saved in a file format compatible with Finite Element Analysis (FEA) programs at any
stage in the process. This enables rapid availability of the model for FEA where in
previous design classes the FEA could not take place until the final configuration was set.
As the configuration changes, the Structures/Configuration engineer can save a new copy
of the model in either of the most popular formats, International Graphics Exchange
System (IGES) or Standard Exchange Protocol (STEP). These may then be imported for
analysis into programs such as SDRC’s I-DEAS, available on the NPS network from the
Mechanical Engineering department server.
D. CDC DATA TRANSFER AND CONTROL ARCHITECTURE
1. File and Link Structure
The file structure of the CDC software tool as installed in the SDC consists of all
Excel workbooks that make up the suite residing in the same folder. This folder must be
accessible by all team members in order to facilitate ease of maintenance and control of
design configuration archiving. The shared path for all links in the tool’s system is
D:\\Aerospace Tools\CDC on the computer Endeavor. Only the base systems and
subsystem workbooks should be included in this folder.
50
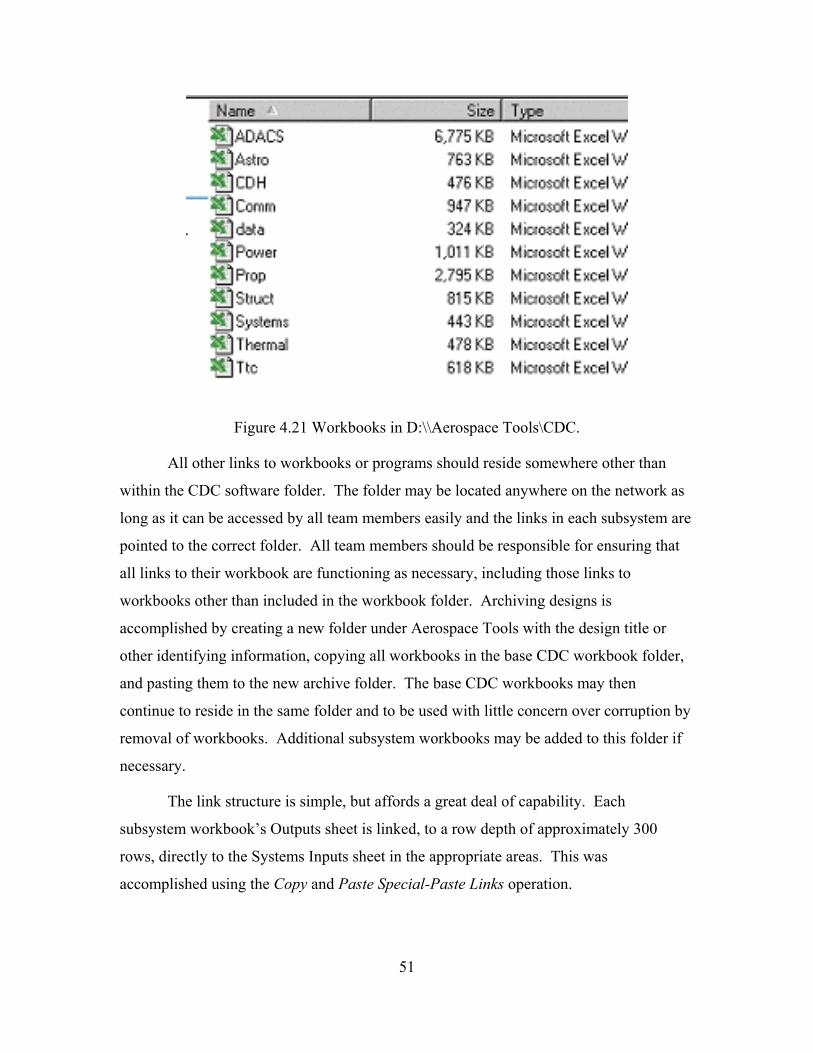
Figure 4.21 Workbooks in D:\\Aerospace Tools\CDC.
All other links to workbooks or programs should reside somewhere other than
within the CDC software folder. The folder may be located anywhere on the network as
long as it can be accessed by all team members easily and the links in each subsystem are
pointed to the correct folder. All team members should be responsible for ensuring that
all links to their workbook are functioning as necessary, including those links to
workbooks other than included in the workbook folder. Archiving designs is
accomplished by creating a new folder under Aerospace Tools with the design title or
other identifying information, copying all workbooks in the base CDC workbook folder,
and pasting them to the new archive folder. The base CDC workbooks may then
continue to reside in the same folder and to be used with little concern over corruption by
removal of workbooks. Additional subsystem workbooks may be added to this folder if
necessary.
The link structure is simple, but affords a great deal of capability. Each
subsystem workbook’s Outputs sheet is linked, to a row depth of approximately 300
rows, directly to the Systems Inputs sheet in the appropriate areas. This was
accomplished using the Copy and Paste Special-Paste Links operation.
51
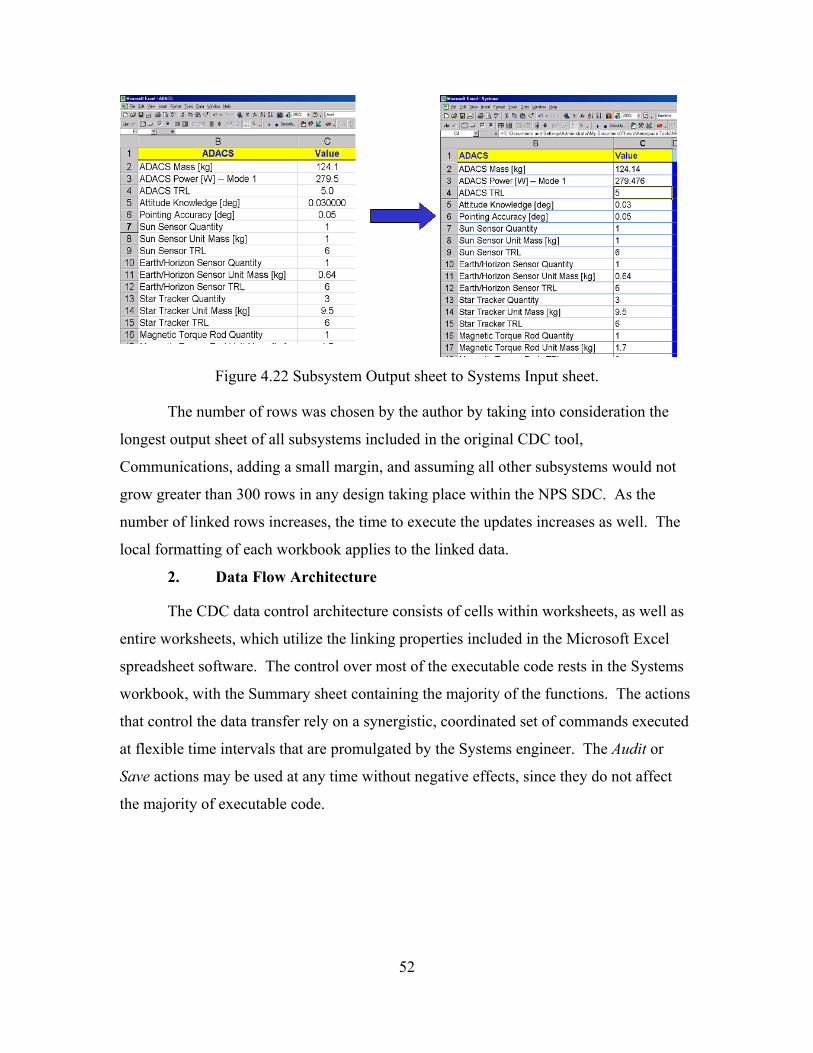
Figure 4.22 Subsystem Output sheet to Systems Input sheet.
The number of rows was chosen by the author by taking into consideration the
longest output sheet of all subsystems included in the original CDC tool,
Communications, adding a small margin, and assuming all other subsystems would not
grow greater than 300 rows in any design taking place within the NPS SDC. As the
number of linked rows increases, the time to execute the updates increases as well. The
local formatting of each workbook applies to the linked data.
2. Data Flow Architecture
The CDC data control architecture consists of cells within worksheets, as well as
entire worksheets, which utilize the linking properties included in the Microsoft Excel
spreadsheet software. The control over most of the executable code rests in the Systems
workbook, with the Summary sheet containing the majority of the functions. The actions
that control the data transfer rely on a synergistic, coordinated set of commands executed
at flexible time intervals that are promulgated by the Systems engineer. The Audit or
Save actions may be used at any time without negative effects, since they do not affect
the majority of executable code.
52
Figure 4.23 CDC Data Transfer and Control Architecture
The Audit button is used to determine when the subsystems of interest have
completed a save, signaling to the Systems engineer that an update may be warranted.
When the UPDATE button is pressed, the update macro is executed. All subsystem links
to the input sheet are updated, including the Output sheet of the Systems workbook. The
code then modifies the Systems Summary sheet as described earlier.
The OUTPUT button is depressed when the Systems engineer has examined the
data and is prepared to send it to the subsystems. This deletes the data workbook and
copies the Systems Inputs sheet into a new one. This is done in order to allow subsystems
the flexibility, since an automatic transfer directly to them could interrupt their current
calculations. When the subsystems are ready to receive the new data, the Update
External Data button on their sheets is used to place it in their own Inputs sheet.
3. Modifying Links, Adding Workbooks and Sheets
The links are controlled by the Edit-Links… operation as used from the command
bar. The Links message box shows all links to the current workbook and gives the user
options to execute on them. If it is desired to add another workbook to the inputs sheet, it
must first reside in the Models folder wherever the CDC software is being run from.
53
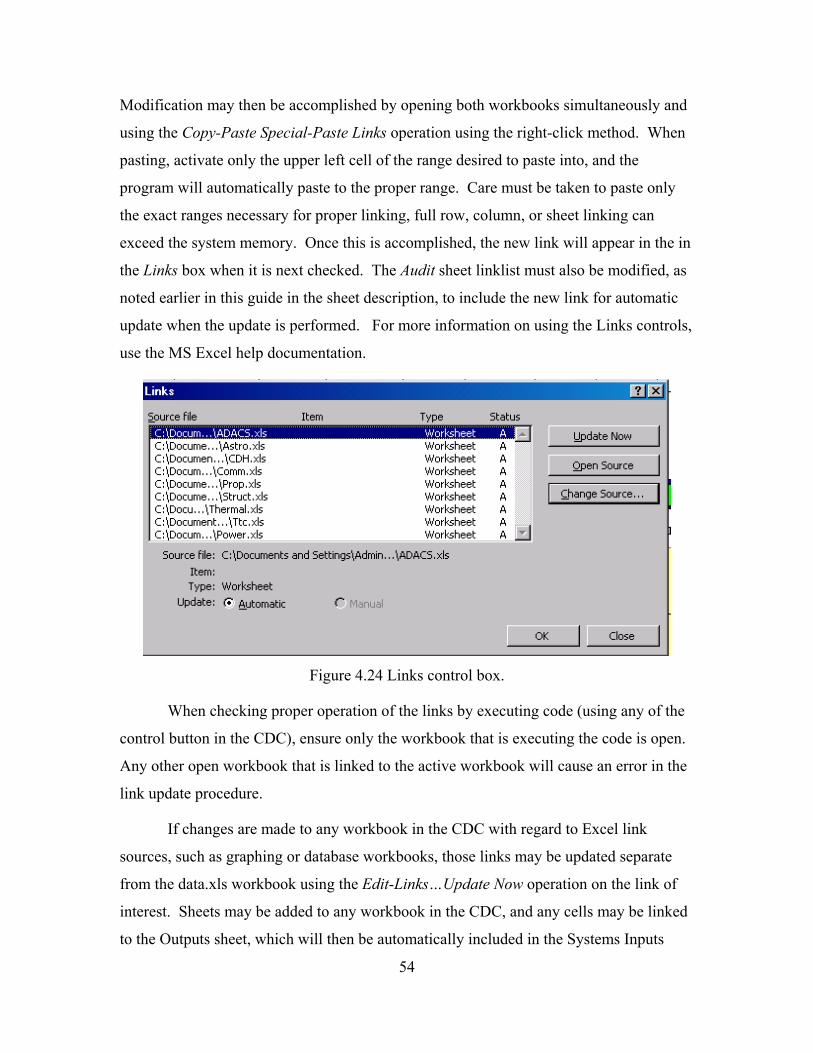
Modification may then be accomplished by opening both workbooks simultaneously and
using the Copy-Paste Special-Paste Links operation using the right-click method. When
pasting, activate only the upper left cell of the range desired to paste into, and the
program will automatically paste to the proper range. Care must be taken to paste only
the exact ranges necessary for proper linking, full row, column, or sheet linking can
exceed the system memory. Once this is accomplished, the new link will appear in the in
the Links box when it is next checked. The Audit sheet linklist must also be modified, as
noted earlier in this guide in the sheet description, to include the new link for automatic
update when the update is performed. For more information on using the Links controls,
use the MS Excel help documentation.
Figure 4.24 Links control box.
When checking proper operation of the links by executing code (using any of the
control button in the CDC), ensure only the workbook that is executing the code is open.
Any other open workbook that is linked to the active workbook will cause an error in the
link update procedure.
If changes are made to any workbook in the CDC with regard to Excel link
sources, such as graphing or database workbooks, those links may be updated separate
from the data.xls workbook using the Edit-Links…Update Now operation on the link of
interest. Sheets may be added to any workbook in the CDC, and any cells may be linked
to the Outputs sheet, which will then be automatically included in the Systems Inputs
54
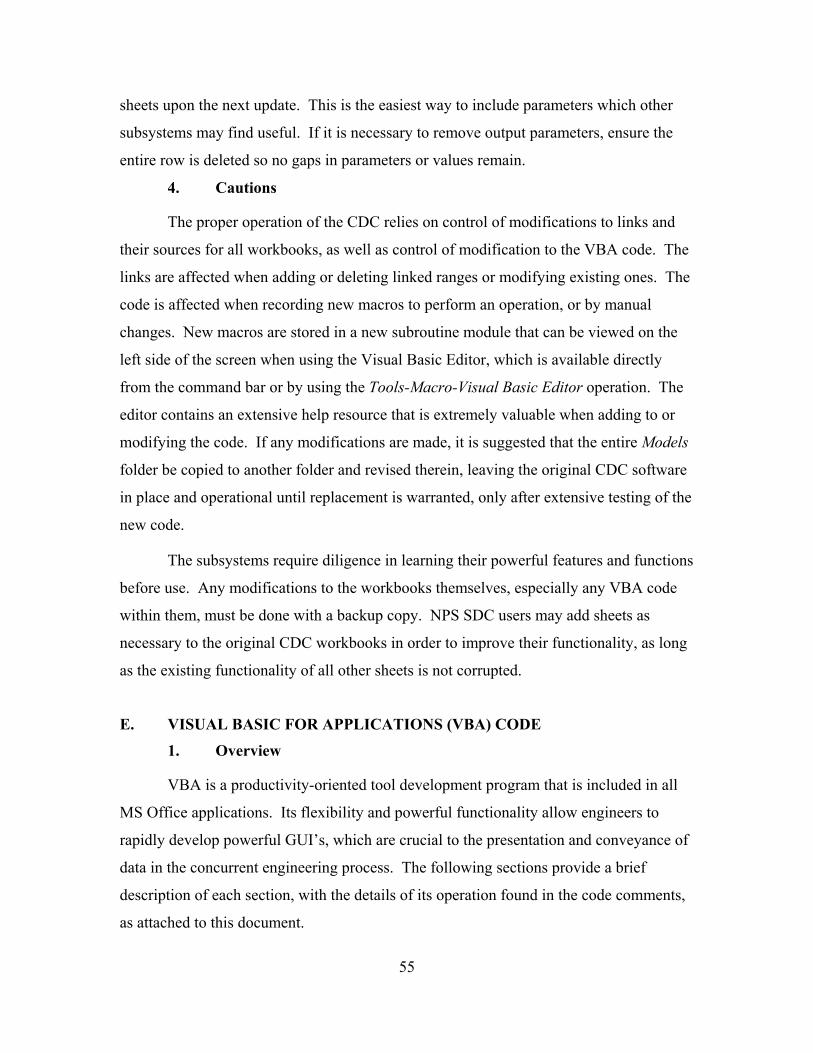
sheets upon the next update. This is the easiest way to include parameters which other
subsystems may find useful. If it is necessary to remove output parameters, ensure the
entire row is deleted so no gaps in parameters or values remain.
4. Cautions
The proper operation of the CDC relies on control of modifications to links and
their sources for all workbooks, as well as control of modification to the VBA code. The
links are affected when adding or deleting linked ranges or modifying existing ones. The
code is affected when recording new macros to perform an operation, or by manual
changes. New macros are stored in a new subroutine module that can be viewed on the
left side of the screen when using the Visual Basic Editor, which is available directly
from the command bar or by using the Tools-Macro-Visual Basic Editor operation. The
editor contains an extensive help resource that is extremely valuable when adding to or
modifying the code. If any modifications are made, it is suggested that the entire Models
folder be copied to another folder and revised therein, leaving the original CDC software
in place and operational until replacement is warranted, only after extensive testing of the
new code.
The subsystems require diligence in learning their powerful features and functions
before use. Any modifications to the workbooks themselves, especially any VBA code
within them, must be done with a backup copy. NPS SDC users may add sheets as
necessary to the original CDC workbooks in order to improve their functionality, as long
as the existing functionality of all other sheets is not corrupted.
E. VISUAL BASIC FOR APPLICATIONS (VBA) CODE
1. Overview
VBA is a productivity-oriented tool development program that is included in all
MS Office applications. Its flexibility and powerful functionality allow engineers to
rapidly develop powerful GUI’s, which are crucial to the presentation and conveyance of
data in the concurrent engineering process. The following sections provide a brief
description of each section, with the details of its operation found in the code comments,
as attached to this document.
55
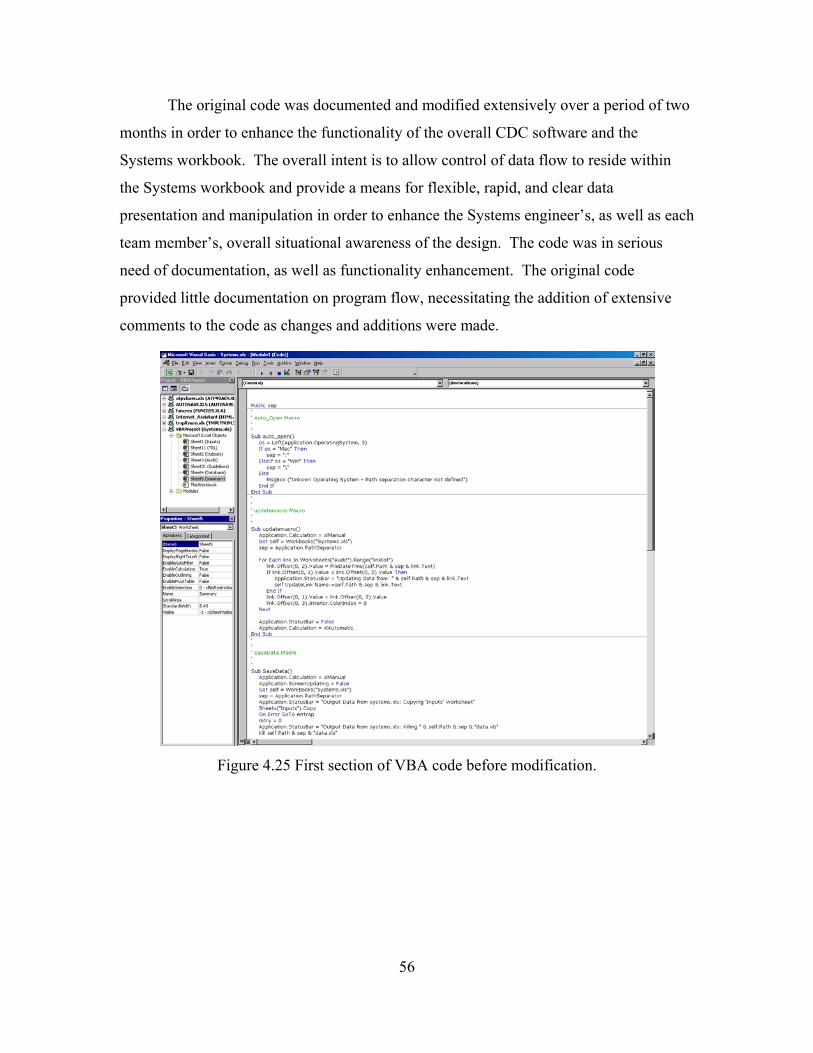
The original code was documented and modified extensively over a period of two
months in order to enhance the functionality of the overall CDC software and the
Systems workbook. The overall intent is to allow control of data flow to reside within
the Systems workbook and provide a means for flexible, rapid, and clear data
presentation and manipulation in order to enhance the Systems engineer’s, as well as each
team member’s, overall situational awareness of the design. The code was in serious
need of documentation, as well as functionality enhancement. The original code
provided little documentation on program flow, necessitating the addition of extensive
comments to the code as changes and additions were made.
Figure 4.25 First section of VBA code before modification.
56
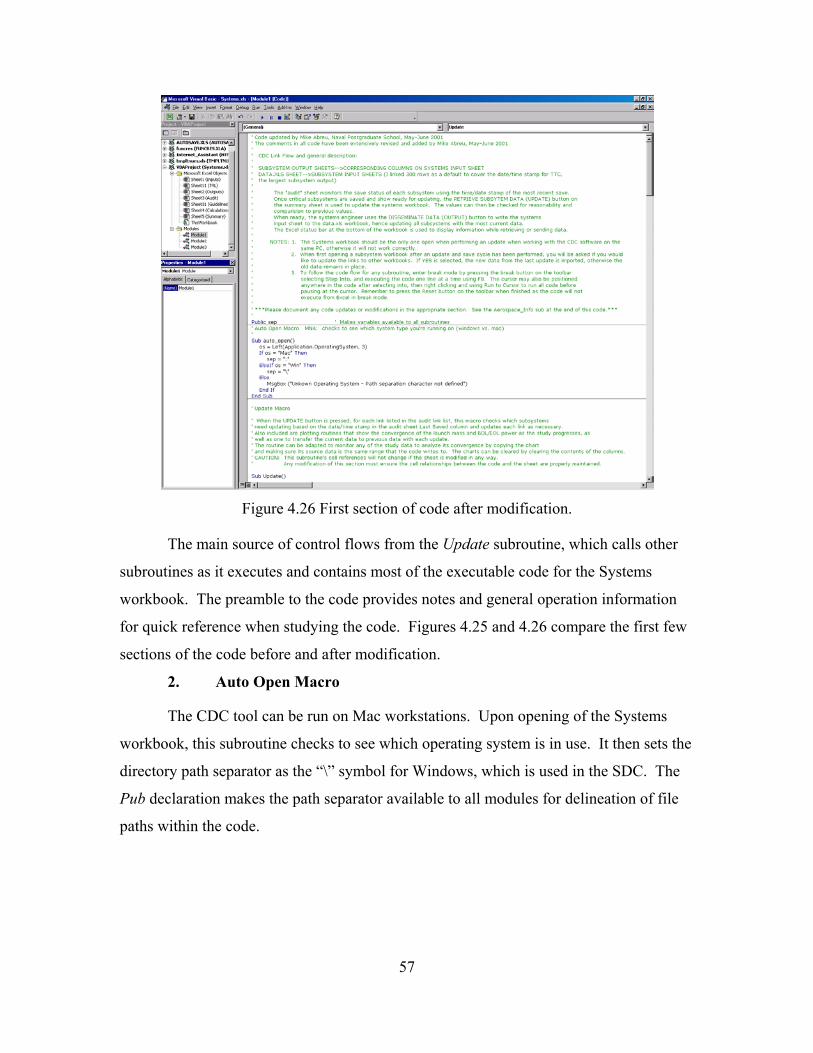
Figure 4.26 First section of code after modification.
The main source of control flows from the Update subroutine, which calls other
subroutines as it executes and contains most of the executable code for the Systems
workbook. The preamble to the code provides notes and general operation information
for quick reference when studying the code. Figures 4.25 and 4.26 compare the first few
sections of the code before and after modification.
2. Auto Open Macro
The CDC tool can be run on Mac workstations. Upon opening of the Systems
workbook, this subroutine checks to see which operating system is in use. It then sets the
directory path separator as the “\” symbol for Windows, which is used in the SDC. The
Pub declaration makes the path separator available to all modules for delineation of file
paths within the code.
57
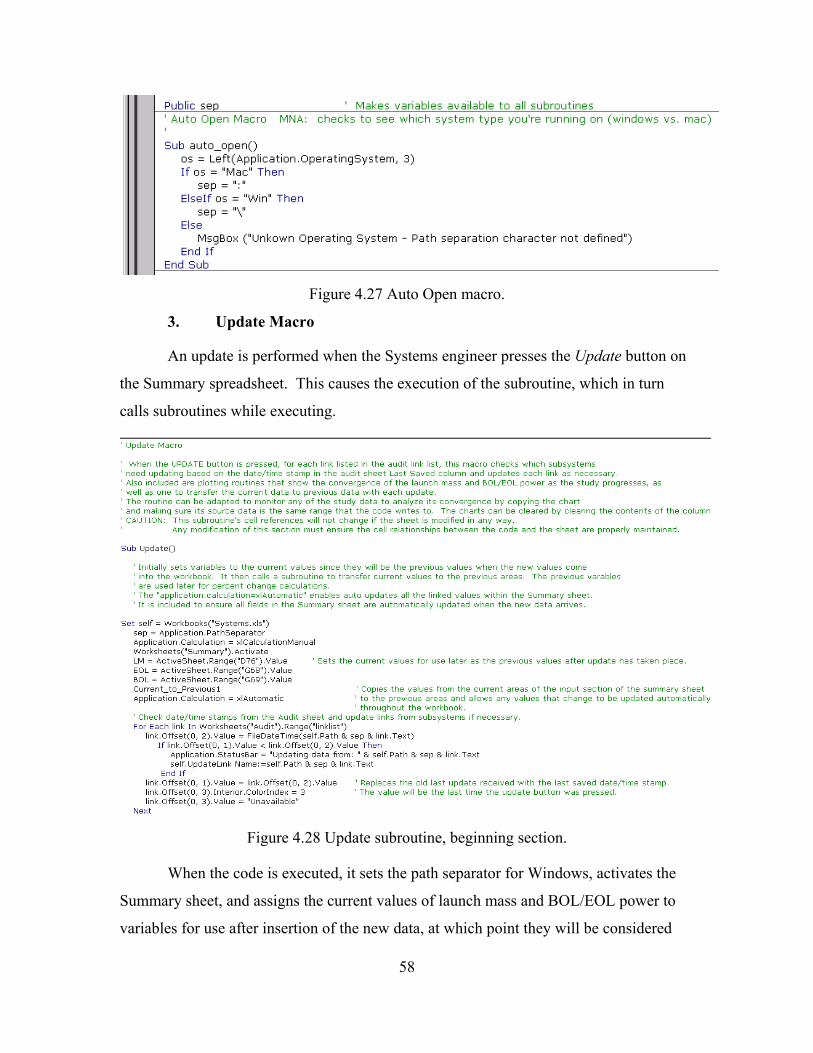
Figure 4.27 Auto Open macro.
3. Update Macro
An update is performed when the Systems engineer presses the Update button on
the Summary spreadsheet. This causes the execution of the subroutine, which in turn
calls subroutines while executing.
Figure 4.28 Update subroutine, beginning section.
When the code is executed, it sets the path separator for Windows, activates the
Summary sheet, and assigns the current values of launch mass and BOL/EOL power to
variables for use after insertion of the new data, at which point they will be considered
58
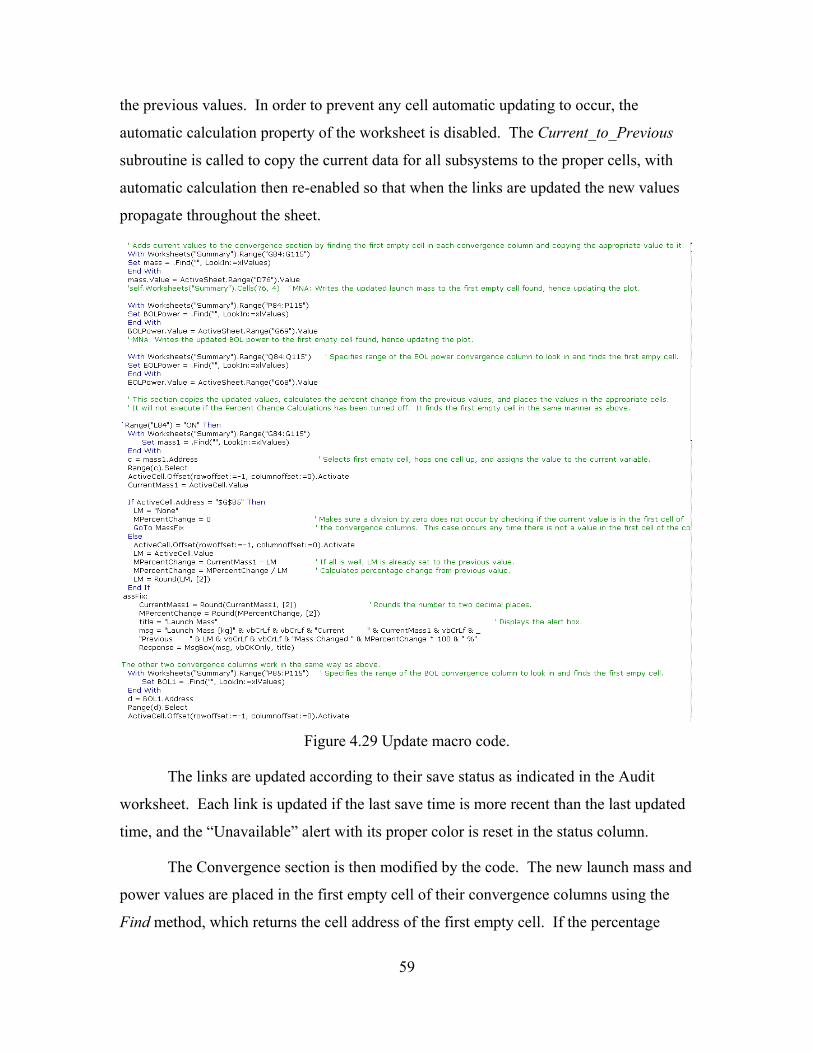
the previous values. In order to prevent any cell automatic updating to occur, the
automatic calculation property of the worksheet is disabled. The Current_to_Previous
subroutine is called to copy the current data for all subsystems to the proper cells, with
automatic calculation then re-enabled so that when the links are updated the new values
propagate throughout the sheet.
Figure 4.29 Update macro code.
The links are updated according to their save status as indicated in the Audit
worksheet. Each link is updated if the last save time is more recent than the last updated
time, and the “Unavailable” alert with its proper color is reset in the status column.
The Convergence section is then modified by the code. The new launch mass and
power values are placed in the first empty cell of their convergence columns using the
Find method, which returns the cell address of the first empty cell. If the percentage
59
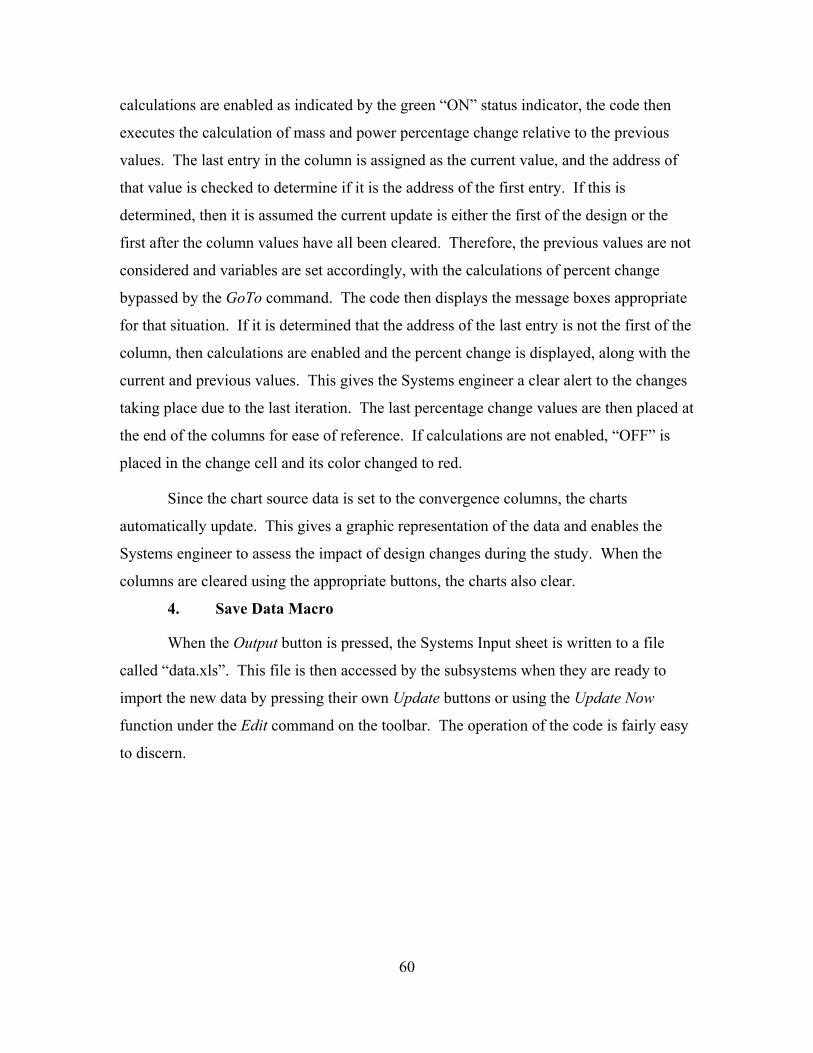
calculations are enabled as indicated by the green “ON” status indicator, the code then
executes the calculation of mass and power percentage change relative to the previous
values. The last entry in the column is assigned as the current value, and the address of
that value is checked to determine if it is the address of the first entry. If this is
determined, then it is assumed the current update is either the first of the design or the
first after the column values have all been cleared. Therefore, the previous values are not
considered and variables are set accordingly, with the calculations of percent change
bypassed by the GoTo command. The code then displays the message boxes appropriate
for that situation. If it is determined that the address of the last entry is not the first of the
column, then calculations are enabled and the percent change is displayed, along with the
current and previous values. This gives the Systems engineer a clear alert to the changes
taking place due to the last iteration. The last percentage change values are then placed at
the end of the columns for ease of reference. If calculations are not enabled, “OFF” is
placed in the change cell and its color changed to red.
Since the chart source data is set to the convergence columns, the charts
automatically update. This gives a graphic representation of the data and enables the
Systems engineer to assess the impact of design changes during the study. When the
columns are cleared using the appropriate buttons, the charts also clear.
4. Save Data Macro
When the Output button is pressed, the Systems Input sheet is written to a file
called “data.xls”. This file is then accessed by the subsystems when they are ready to
import the new data by pressing their own Update buttons or using the Update Now
function under the Edit command on the toolbar. The operation of the code is fairly easy
to discern.
60
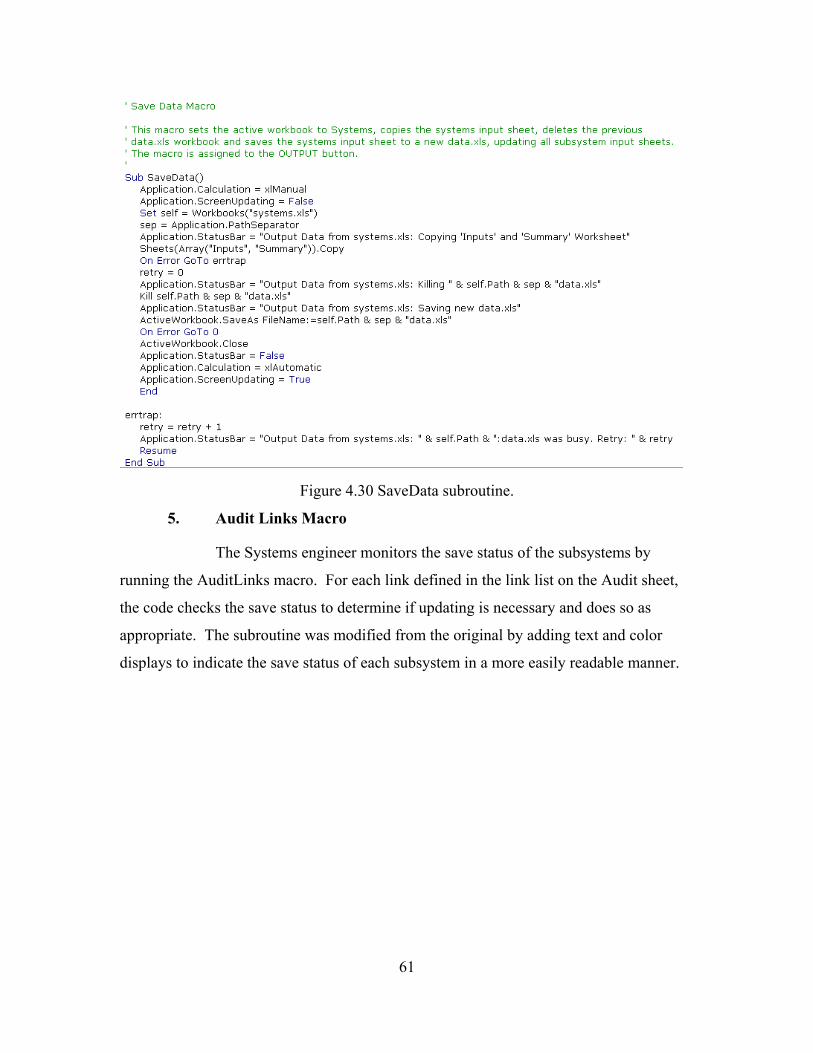
Figure 4.30 SaveData subroutine.
5. Audit Links Macro
The Systems engineer monitors the save status of the subsystems by
running the AuditLinks macro. For each link defined in the link list on the Audit sheet,
the code checks the save status to determine if updating is necessary and does so as
appropriate. The subroutine was modified from the original by adding text and color
displays to indicate the save status of each subsystem in a more easily readable manner.
61
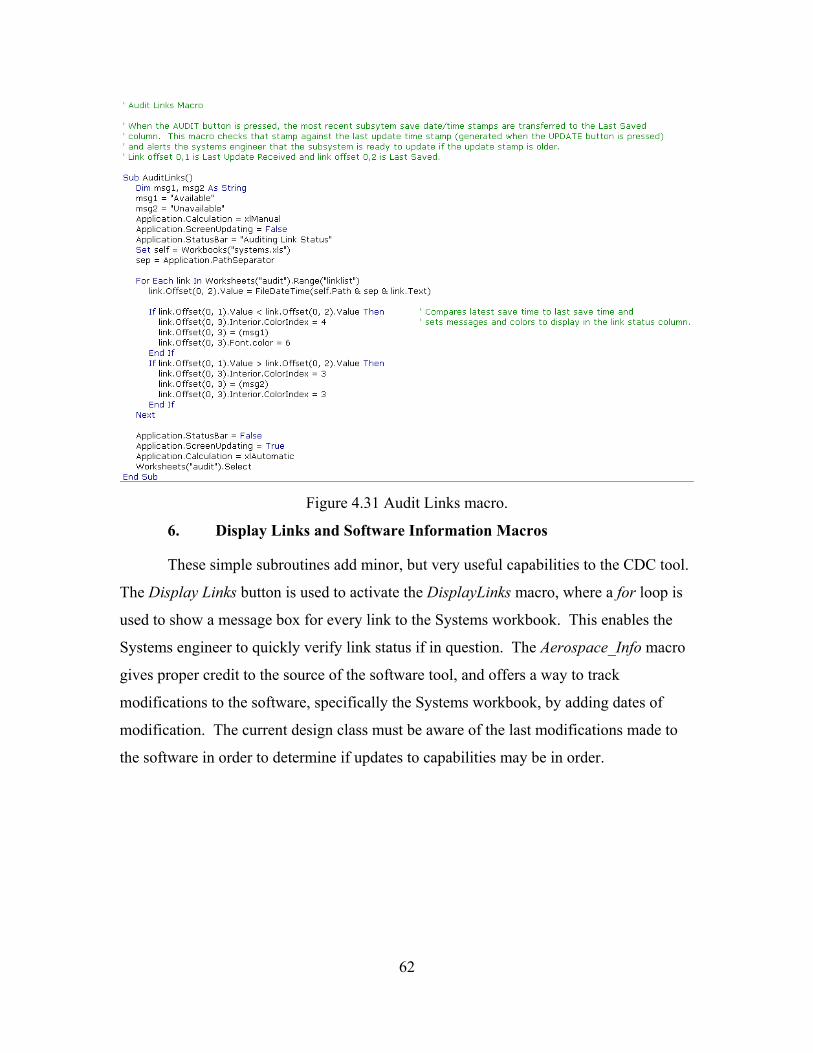
Figure 4.31 Audit Links macro.
6. Display Links and Software Information Macros
These simple subroutines add minor, but very useful capabilities to the CDC tool.
The Display Links button is used to activate the DisplayLinks macro, where a for loop is
used to show a message box for every link to the Systems workbook. This enables the
Systems engineer to quickly verify link status if in question. The Aerospace_Info macro
gives proper credit to the source of the software tool, and offers a way to track
modifications to the software, specifically the Systems workbook, by adding dates of
modification. The current design class must be aware of the last modifications made to
the software in order to determine if updates to capabilities may be in order.
62
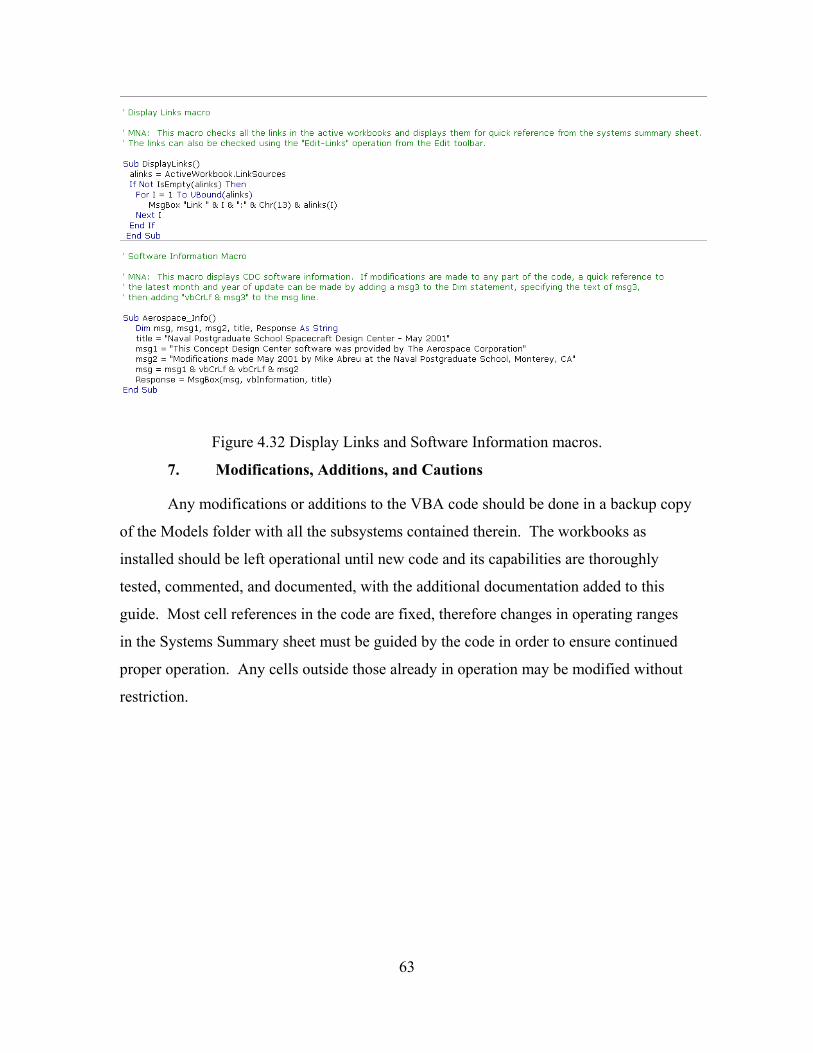
Figure 4.32 Display Links and Software Information macros.
7. Modifications, Additions, and Cautions
Any modifications or additions to the VBA code should be done in a backup copy
of the Models folder with all the subsystems contained therein. The workbooks as
installed should be left operational until new code and its capabilities are thoroughly
tested, commented, and documented, with the additional documentation added to this
guide. Most cell references in the code are fixed, therefore changes in operating ranges
in the Systems Summary sheet must be guided by the code in order to ensure continued
proper operation. Any cells outside those already in operation may be modified without
restriction.
63

THIS PAGE INTENTIONALLY LEFT BLANK
64
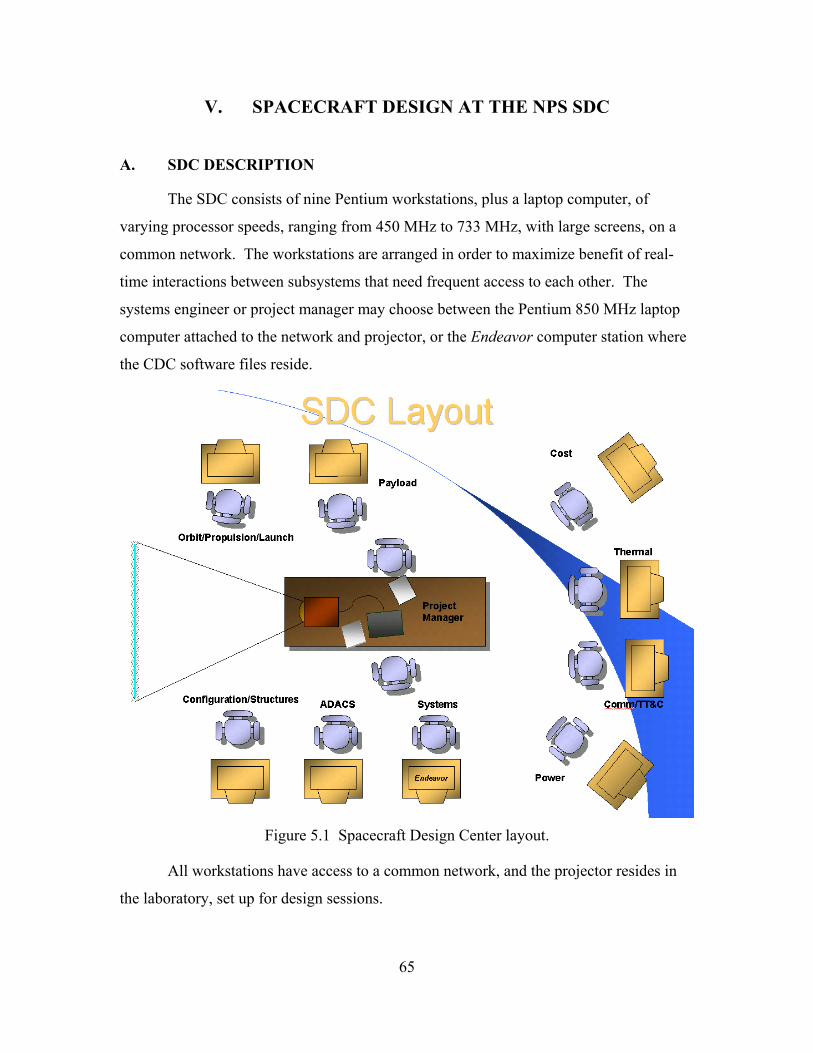
V. SPACECRAFT DESIGN AT THE NPS SDC
A. SDC DESCRIPTION
The SDC consists of nine Pentium workstations, plus a laptop computer, of
varying processor speeds, ranging from 450 MHz to 733 MHz, with large screens, on a
common network. The workstations are arranged in order to maximize benefit of real-
time interactions between subsystems that need frequent access to each other. The
systems engineer or project manager may choose between the Pentium 850 MHz laptop
computer attached to the network and projector, or the Endeavor computer station where
the CDC software files reside.
Figure 5.1 Spacecraft Design Center layout.
All workstations have access to a common network, and the projector resides in
the laboratory, set up for design sessions.
65
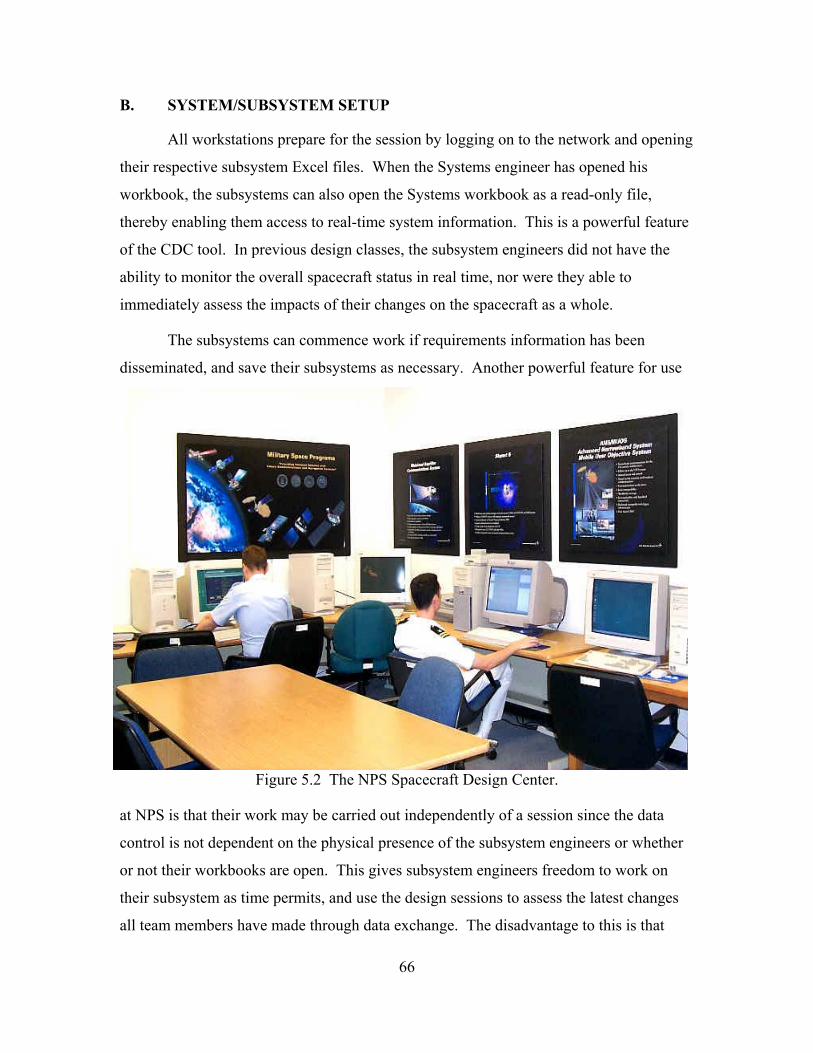
B. SYSTEM/SUBSYSTEM SETUP
All workstations prepare for the session by logging on to the network and opening
their respective subsystem Excel files. When the Systems engineer has opened his
workbook, the subsystems can also open the Systems workbook as a read-only file,
thereby enabling them access to real-time system information. This is a powerful feature
of the CDC tool. In previous design classes, the subsystem engineers did not have the
ability to monitor the overall spacecraft status in real time, nor were they able to
immediately assess the impacts of their changes on the spacecraft as a whole.
The subsystems can commence work if requirements information has been
disseminated, and save their subsystems as necessary. Another powerful feature for use
Figure 5.2 The NPS Spacecraft Design Center.
at NPS is that their work may be carried out independently of a session since the data
control is not dependent on the physical presence of the subsystem engineers or whether
or not their workbooks are open. This gives subsystem engineers freedom to work on
their subsystem as time permits, and use the design sessions to assess the latest changes
all team members have made through data exchange. The disadvantage to this is that
66
data from other subsystems will not be available immediately, leaving the subsystem
engineer to work on his workbook alone. During a regular session with all team
members present, all data is available under control of the Subsystem engineer.
Preparation for sessions is necessary, since trade studies encompass various
possible configurations of the spacecraft. It is the project manager’s responsibility, along
with the Systems engineer, to ensure that bounds and requirements for each configuration
are distributed to team members well prior to a session. For instance, it may be required
to assess the effect of different orbits on payload performance. The number of orbits to
be evaluated and their parameters, as well as any other subsystem requirements that may
flow from them, should be identified beforehand so that all members can prepare
properly for the session. In addition, the impact of technology insertion on a design may
be assessed; with one configuration utilizing flight-proven, reliable components while
another is significantly more advanced. The associated risk with advanced technology
should be taken into account for both cost estimates and impact on the component
assembly and testing schedule.
It is important to note that adequate time for a design class will not be available to
complete a design in one day. It should be the project manager’s responsibility to stop
the session when necessary and continue work later whenever it is possible.
C. DESIGN
The major challenge is to obtain the initial design for the spacecraft. Subsequent
iterations will be modifications to the original. The design begins by the Systems
engineer initializing the system parameters in his Guidelines and Outputs sheets, then
running an output, so that each team member’s subsystem model may then access the
initial study parameters. He then uses the Audit Links button on the Audit sheet to
determine if the subsystems have been saved as team members work on their workbooks.
The subsystems manually enter or link cells for the requirements information as it applies
to them, and begin configuring their worksheets as necessary. The Systems engineer
monitors the progress of the subsystems and coordinates the flow of data among the
team. He also periodically updates the master list of design requirements parameters. As
67
team members work on their subsystems, they exchange ideas about design issues with
their teammates.
When the Systems engineer is satisfied that an update is warranted, he announces
that an update is about to be performed. Upon receipt of the new data, the Systems
engineer analyzes any changes and the quality of parameters, ensuring they are within
study bounds. If any parameters are out of bounds, the subsystems should be notified and
an investigation made into the source of the inconsistency. When the Systems engineer is
ready to send the data to the subsystems, he performs the output and announces to the
team that an update is available. The subsystems may then import the data using their
Update buttons, as well as check their read-only copies of the Systems workbook to
assess the spacecraft status. Team members at any time may explain subsystem design
issues to the entire team so that everyone understands how the design is evolving. This
understanding is critical to the education of a Space Systems engineer; therefore, the
subsystem explanations must be given a chance to take place.
During the design, the configuration/structures engineer may be utilizing both
Excel and SolidWorks™ to perform his analysis. The solid modeling is an addition to
the CDC software. Although it is not fully integrated into the process, it performs a
valuable role in visualizing the spacecraft design and ensuring that the stowed
configuration is appropriate for the launch vehicle selected. In previous spacecraft
designs at NPS, this capability was not available, leading to much delay in structural
analysis and attitude control calculations since modifications to the configuration could
not be assessed completely on a real-time basis.
D. DOCUMENTATION/DESIGN ARCHIVING
When the study has been completed, the design must be archived for future
reference for documentation or class presentation purposes by copying the Models folder
to the Archive folder and renaming it to the design title, with the date completed included
if so desired. This allows one archive folder to maintain the continuity of design
produced in the SDC. It is important to note that design iterations may be run from the
archive folder if so desired, but the intent is to maintain one operational source rather
68

than create multiple ones. This is done in order to avoid problems with links or the data
transfer and control structure.
69

THIS PAGE INTENTIONALLY LEFT BLANK
70
VI. SUMMARY, CONCLUSIONS, AND RECOMMENDATIONS
A. SUMMARY
This thesis explored and described The Aerospace Corporation’s Concept Design
Center and its associated Excel-based software tool as witnessed firsthand by the author
prior to the installation of the tool in the SDC. It then provided supporting evidence of
the revolution in solid modeling as applied to the concurrent engineering process. The
utility and integration of solid modeling software into the CE process for the CDC
software tool at NPS was also evaluated. This was done based on The Aerospace
Corporation’s utilization of a solid modeling capability in their design process by
including a specific Configuration engineering seat in their facility.
California Institute of Technology’s rapid solid modeling tool DrawCraft, which
is integrated with SolidWorks™, was used in a concurrent design method to generate
conceptual spacecraft. The utility of integrating DrawCraft/SolidWorks™ into the CDC
process was evaluated with respect to learning curve, ease of use, time to generate a solid
model, and model modification flexibility. The capabilities of SolidWorks™ with
respect to the design process, the use of graphics and animations in presentations and
reports, and exporting of solid geometry to finite element analysis (FEA) programs was
explored as well and found to be robust. Application to the Space Systems Engineering
curriculum was evaluated using a spacecraft design generated in AA4871, the capstone
design course, as a test case.
The CDC software tool was integrated into the NPS SDC, and is the first fully
functioning concurrent engineering software to be available for the curriculum’s use.
The installation and modification of the tool was described and documented, including all
pertinent information for proper use in the integrated engineering environment.
Specifically, improvements were made to the Systems workbook by the addition of
current and previous parameter display areas, as well as the addition of a launch mass and
power convergence section, in order to facilitate design situational awareness by the
team. Since the CDC was seen in use by the author, the firsthand knowledge of
71
witnessing the expert team in action flavored the NPS modifications and process as
written.
The CDC software data transfer architecture, procedures for future modification
of the tool and its Visual Basic for Applications code, and a recommended design process
for the NPS SDC were developed and discussed. The software’s data transfer
architecture is critical to understand in order to add or modify workbooks to the
spreadsheet software structure. Modification and description of the software code were
undertaken in order to improve the functionality, ease of use, and graphical display of
systems data for the design team. The extreme value of this work has been expressed by
The Aerospace Corporation as no user’s guide for the CDC Excel software has been
written to date. The application of the CDC software toward the NPS curriculum was
evaluated relative to the spacecraft design in AA4871. A comparison was undertaken
based on the author’s experience as a structures engineer in the course, prior to the
software installation.
B. CONCLUSIONS
The Concept Design Center process and software combined with solid modeling
tools is a very powerful team for spacecraft design at NPS. Along with the facility, these
things all work to benefit the design team. The tools provide a design capability to the
NPS SDC that did not exist prior to their modification and installation. The abilities of
the CDC software in particular extend beyond what is necessary for the curriculum, yet it
provides a solid foundation for students to understand the complex interactions of a real-
world spacecraft conceptual design. The modifications to the Systems workbook
increase the level of team awareness of the design by allowing them to track specific
changes in mass and power between iterations. The convergence section, in particular, is
provides the team with a percentage change calculation warning between iterations and a
graphical tracking mechanism for mass and power of the spacecraft, two of the three
most important parameters of spacecraft design. The documentation serves to guide the
NPS space systems engineering curriculum in their future modification of the tool,
72
provide a detailed description of the inner workings of the CDC processes and tools, and
enable a capability that did not previously exist formally in the SDC.
Solid modeling tools provide an extremely powerful visualization capability and
are a critical integrative facet of the process. SolidWorks™ and DrawCraft provide the
design team the ability to rapidly create a model, make changes to it, visualize the
spacecraft in 3-D, extract and verify critical design information such as total mass and
moments of inertia, and export the model to a finite element analysis program. These
parameters may then be compared against spreadsheet or analytical calculations in order
to assess their equivalency. This is done in a relatively easy manner compared to the
author’s experience in AA4871, and in a considerably shorter time. The additions of
launch vehicle fairing models provided by The Aerospace Corporation and easily
modifiable generic spacecraft components available through the DrawCraft software are
significant contributions towards solid modeling capability at the SDC. In addition,
curriculum students now have a vehicle to enhance their understanding of the revolution
in solid modeling and product design taking place in both government and commercial
endeavors, adding a critical facet to their education as space systems engineers.
C. RECOMMENDATIONS
The CDC software can be modified by student design teams and brought to a
level of complexity, either more or less than exists today, that more accurately
contributes to the education and class design needs of the curriculum and AA4871. The
data control structure and code documentation has been verified by The Aerospace
Corporation as being valuable to their systems engineers, as no formal training
methodology is in place and a user’s guide was nonexistent prior to this thesis. The
documentation serves to guide the NPS space systems engineering curriculum in their
future modification of the tool, and provides a detailed description of the inner workings
of the CDC. This documentation should be updated further as the details of the software
functionality become more evident with its use.
Studies may be conducted into the utility of the added convergence section of the
Systems workbook Summary sheet. Since the evaluation of an iterated design is
73

currently done manually by estimation based on experience, the studies may shed more
light on the correlation between specific subsystem changes and total mass and power
fluctuations, and their cumulative effects on the overall design. Studies may also show if
these fluctuations can be determined quantitatively as being sufficient to stop design
iteration. If this were the case, a reduction in the number of iterations to design stoppage
would result in reduced total iteration time, thus decreasing the cost of the design in a
commercial setting.
The integration of concurrent engineering methodology and integrated
collaborative engineering principles into the design process at NPS has potential for
significantly enhancing the level of quality, comprehension, depth, and scope of future
spacecraft designs. Student knowledge of the real-world design process is now available,
serving to enhance their space systems engineering education. Though the process is
necessarily different from that of The Aerospace Corporation, it still provides the design
team a versatile, flexible approach to maintaining their situational awareness of the
design throughout its iteration. Improvements to the process are inevitably necessary,
since this marks the first true implementation of the integrated concurrent engineering
process into the SDC. All NPS users of the tools should strive to incorporate and
document such changes with the consent of the curriculum manager. It will be necessary
to judge the true impact of the process on spacecraft design at NPS. This may be
accomplished by the solicitation of feedback from design teams, assessing the real-time
effects of the process and tools using previous designs and experience as benchmarks,
and conducting comparisons of the product of designs; namely the final design report.
74
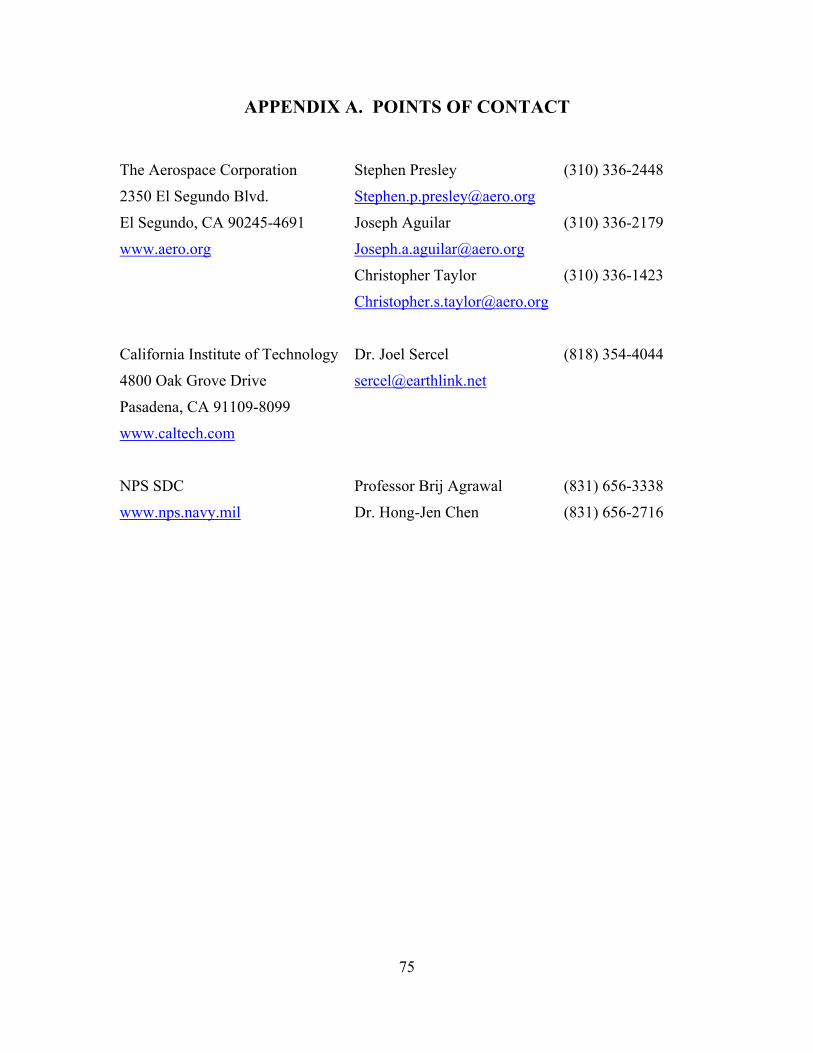
APPENDIX A. POINTS OF CONTACT
The Aerospace Corporation
2350 El Segundo Blvd.
El Segundo, CA 90245-4691
www.aero.org
Stephen Presley
Joseph Aguilar
Christopher Taylor
(310) 336-2448
(310) 336-2179
(310) 336-1423
California Institute of Technology
4800 Oak Grove Drive
Pasadena, CA 91109-8099
www.caltech.com
Dr. Joel Sercel
(818) 354-4044
NPS SDC
www.nps.navy.mil
Professor Brij Agrawal
Dr. Hong-Jen Chen
(831) 656-3338
(831) 656-2716
75

THIS PAGE INTENTIONALLY LEFT BLANK
76
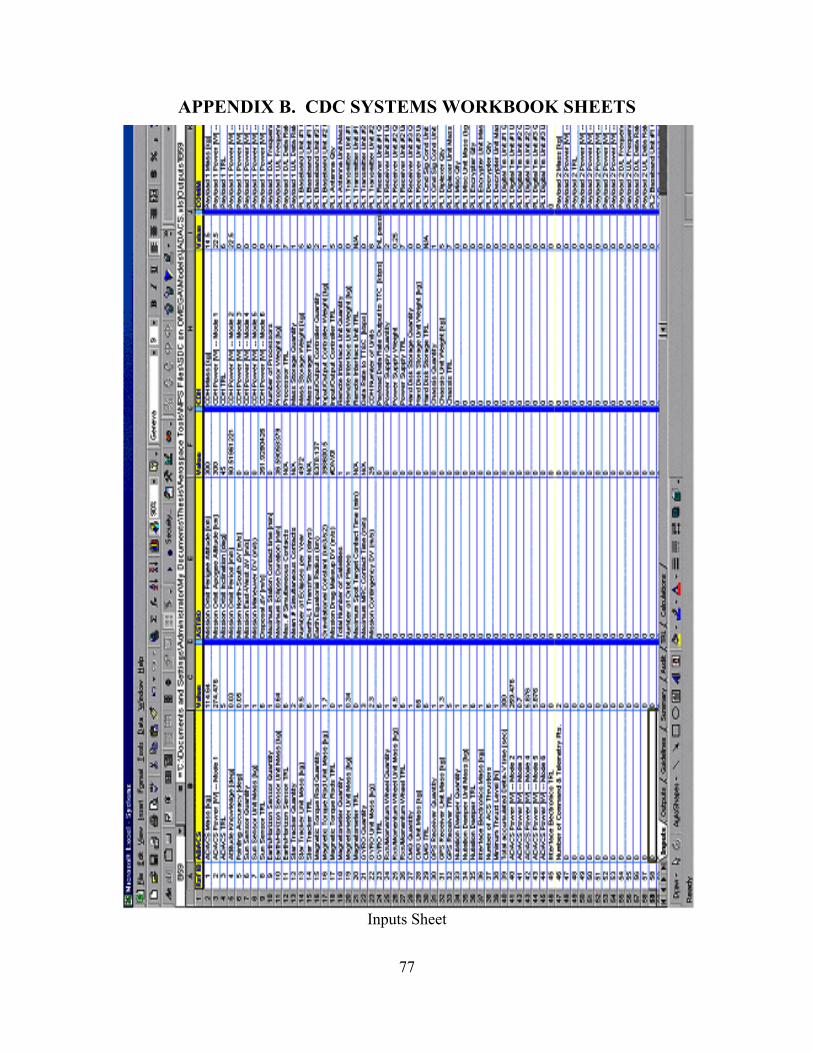
APPENDIX B. CDC SYSTEMS WORKBOOK SHEETS
Inputs Sheet
77
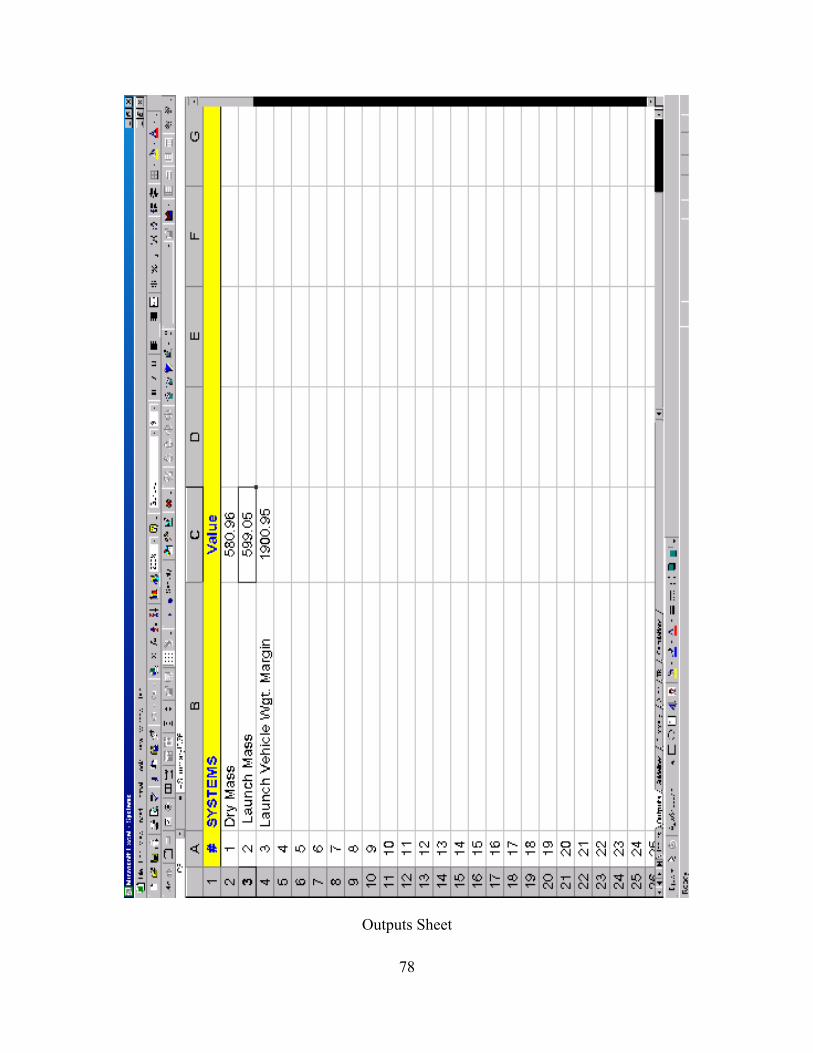
Outputs Sheet
78
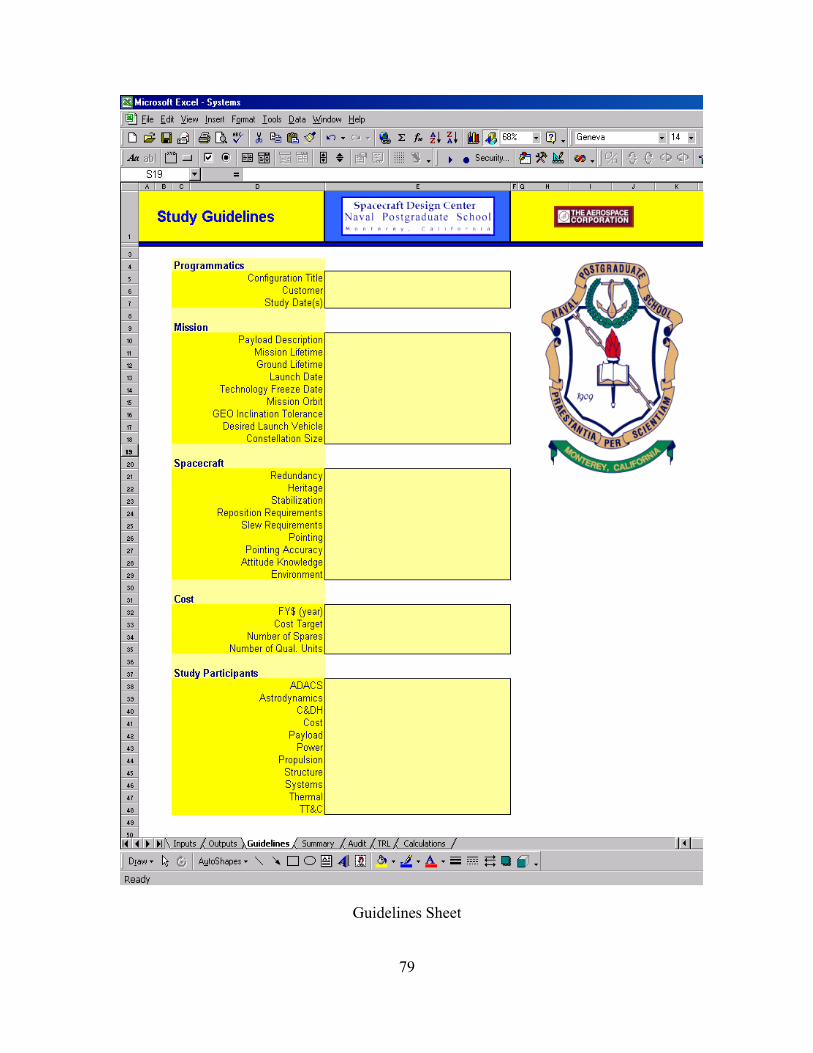
Guidelines Sheet
79
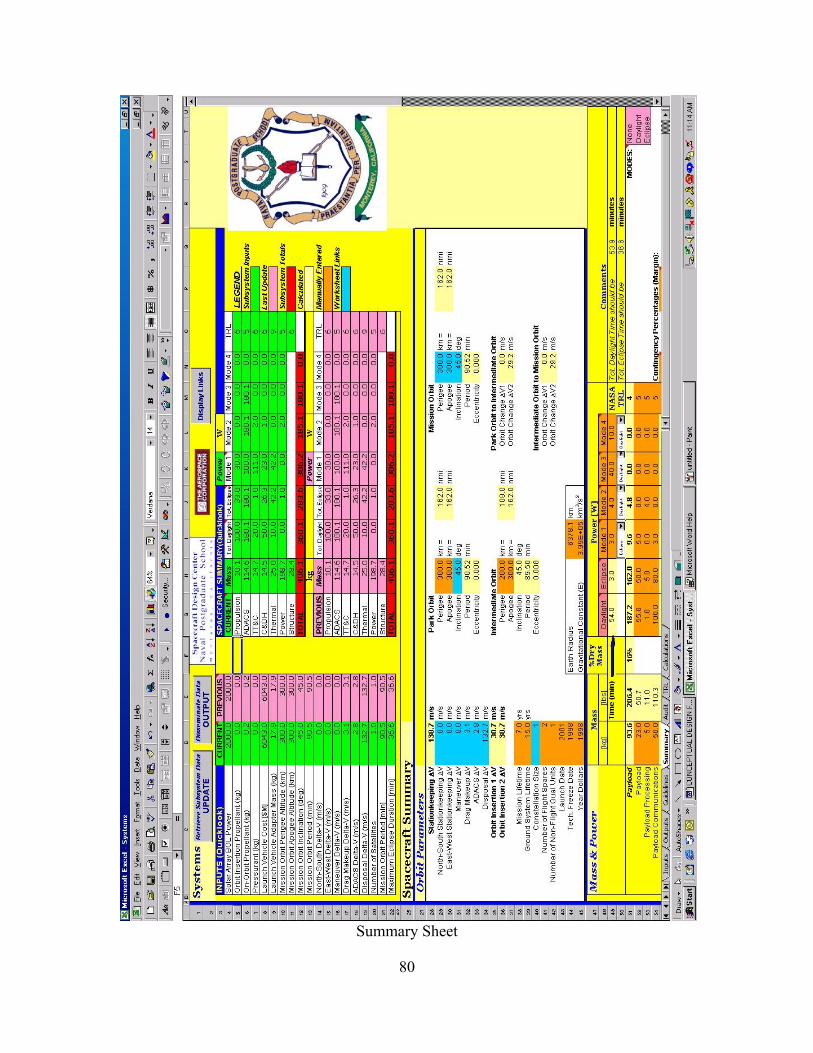
Summary Sheet
80
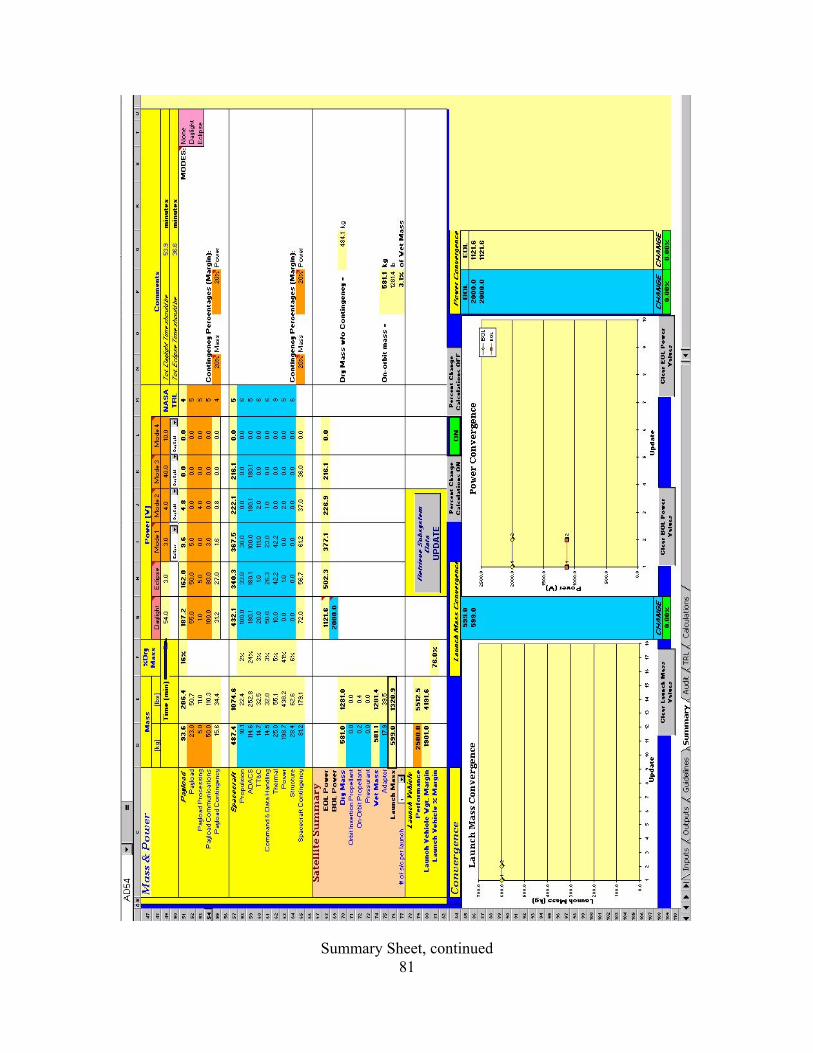
81Summary Sheet, continued
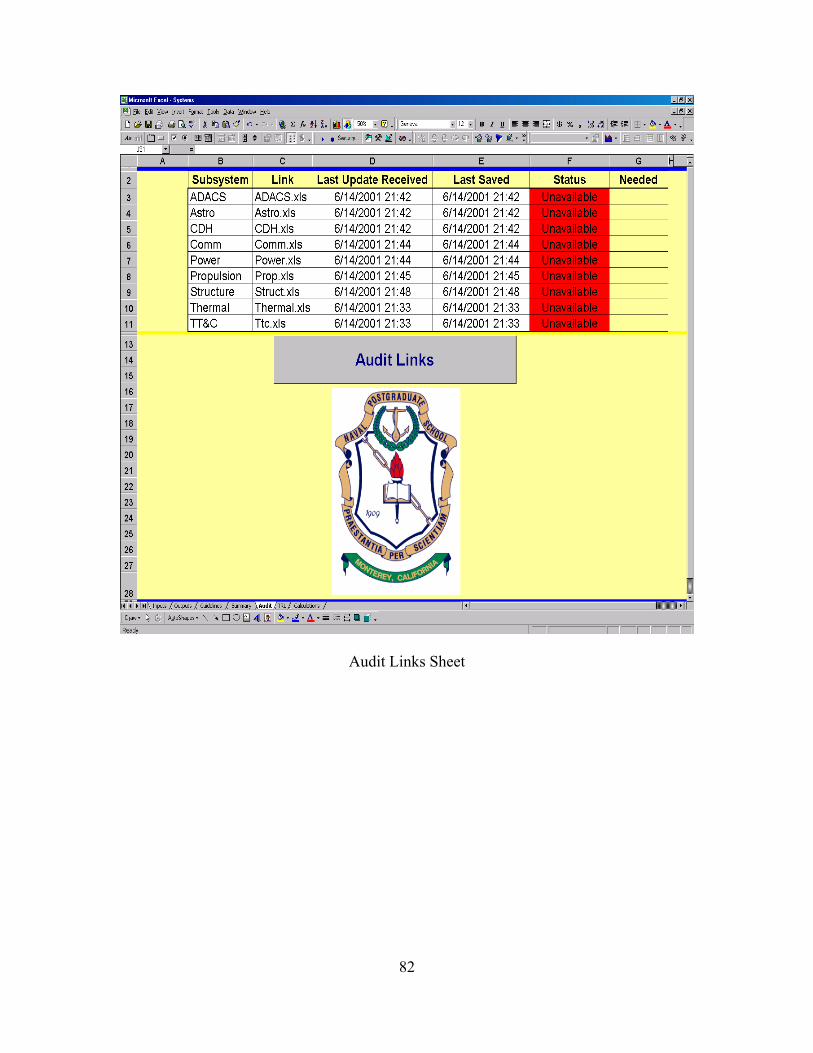
Audit Links Sheet
82
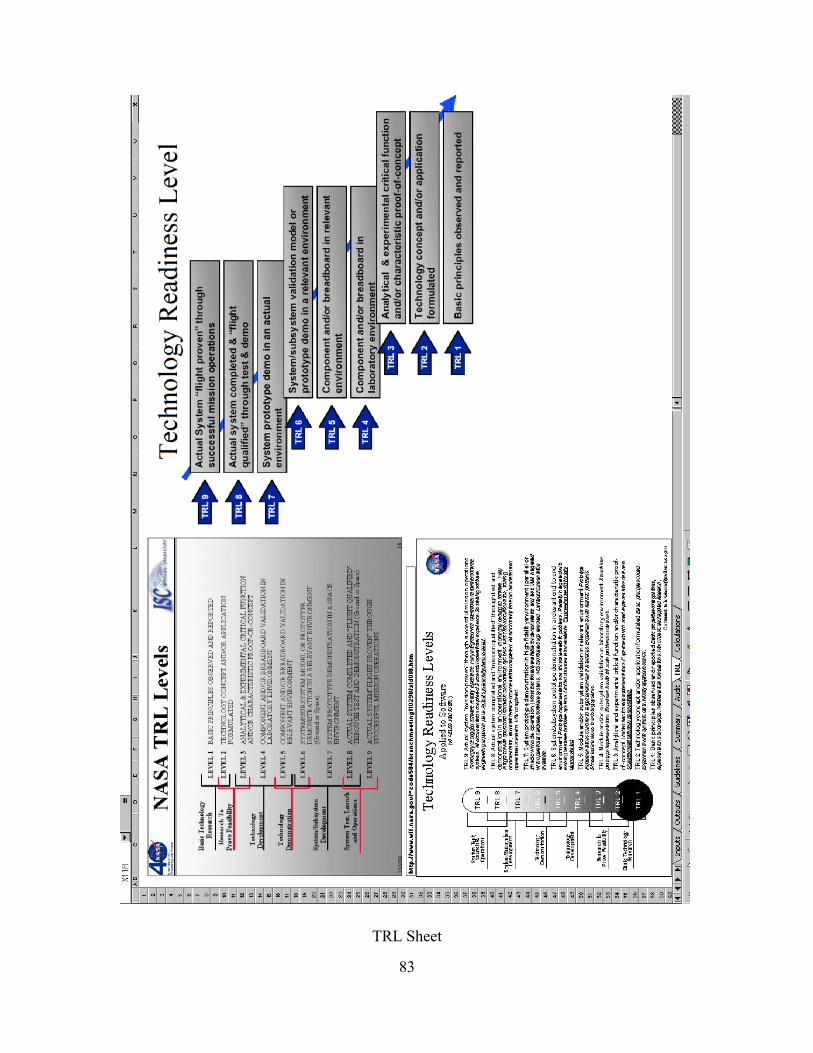
TRL Sheet
83

THIS PAGE INTENTIONALLY LEFT BLANK
84
APPENDIX C. SYSTEMS WORKBOOK VBA CODE
' CDC Code updated by Mike Abreu, Naval Postgraduate School, May-June 2001
' The comments in all code have been extensively revised and added to by Mike Abreu, May-June 2001
'
' CDC Link Flow and general description:
'
' SUBSYSTEM OUTPUT SHEETS-->CORRESPONDING COLUMNS ON SYSTEMS INPUT SHEET
' DATA.XLS SHEET-->SUBSYSTEM INPUT SHEETS (I linked 300 rows as a default to cover the date/time stamp for TTC,
' the largest subsystem output)
'
' The "audit" sheet monitors the save status of each subsystem using the time/date stamp of the most recent save.
' Once critical subsystems are saved and show ready for updating, the RETRIEVE SUBSYTEM DATA (UPDATE) button on
' the summary sheet is used to update the systems workbook. The values can then be checked for reasonability and
' comparision to previous values.
' When ready, the systems engineer uses the DISSEMINATE DATA (OUTPUT) button to write the systems
' input sheet to the data.xls workbook, hence updating all subsystems with the most current data.
' The Excel status bar at the bottom of the workbook is used to display information while retrieving or sending data.
'
' NOTES: 1. The Systems workbook should be the only one open when performing an update when working with the CDC software on the
' same PC, otherwise it will not work correctly.
' 2. When first opening a subsystem workbook after an update and save cycle has been performed, you will be asked if you would
' like to update the links to other workbooks. If YES is selected, the new data from the last update is imported, otherwise the
' old data remains in place.
' 3. To follow the code flow for any subroutine, enter break mode by pressing the break button on the toolbar
' selecting Step Into, and executing the code one line at a time using F8. The cursor may also be positioned
' anywhere in the code after selecting into, then right clicking and using Run to Cursor to run all code before
' pausing at the cursor. Remember to press the Reset button on the toolbar when finished as the code will not
' execute from Excel in break mode.
'
' ***Please document any code updates or modifications in the appropriate section. See the Aerospace_Info sub at the end of this code.***
'
Public sep ' Makes variables available to all subroutines
' Auto Open macro, checks to see which system type you're running on (windows vs. mac), and assigns the directory path separator
' appropriately.
'
Sub auto_open()
os = Left(Application.OperatingSystem, 3)
If os = "Mac" Then
85
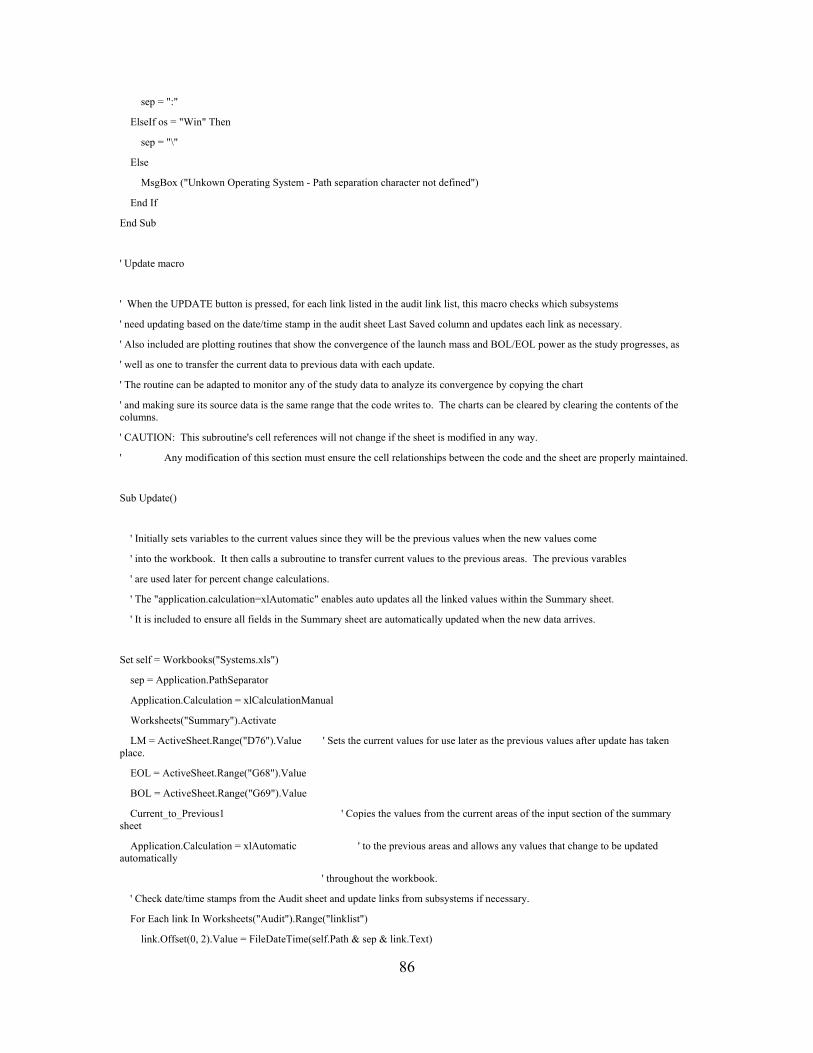
sep = ":"
ElseIf os = "Win" Then
sep = "\"
Else
MsgBox ("Unkown Operating System - Path separation character not defined")
End If
End Sub
' Update macro
' When the UPDATE button is pressed, for each link listed in the audit link list, this macro checks which subsystems
' need updating based on the date/time stamp in the audit sheet Last Saved column and updates each link as necessary.
' Also included are plotting routines that show the convergence of the launch mass and BOL/EOL power as the study progresses, as
' well as one to transfer the current data to previous data with each update.
' The routine can be adapted to monitor any of the study data to analyze its convergence by copying the chart
' and making sure its source data is the same range that the code writes to. The charts can be cleared by clearing the contents of the columns.
' CAUTION: This subroutine's cell references will not change if the sheet is modified in any way.
' Any modification of this section must ensure the cell relationships between the code and the sheet are properly maintained.
Sub Update()
' Initially sets variables to the current values since they will be the previous values when the new values come
' into the workbook. It then calls a subroutine to transfer current values to the previous areas. The previous varables
' are used later for percent change calculations.
' The "application.calculation=xlAutomatic" enables auto updates all the linked values within the Summary sheet.
' It is included to ensure all fields in the Summary sheet are automatically updated when the new data arrives.
Set self = Workbooks("Systems.xls")
sep = Application.PathSeparator
Application.Calculation = xlCalculationManual
Worksheets("Summary").Activate
LM = ActiveSheet.Range("D76").Value ' Sets the current values for use later as the previous values after update has taken place.
EOL = ActiveSheet.Range("G68").Value
BOL = ActiveSheet.Range("G69").Value
Current_to_Previous1 ' Copies the values from the current areas of the input section of the summary sheet
Application.Calculation = xlAutomatic ' to the previous areas and allows any values that change to be updated automatically
' throughout the workbook.
' Check date/time stamps from the Audit sheet and update links from subsystems if necessary.
For Each link In Worksheets("Audit").Range("linklist")
link.Offset(0, 2).Value = FileDateTime(self.Path & sep & link.Text)
86
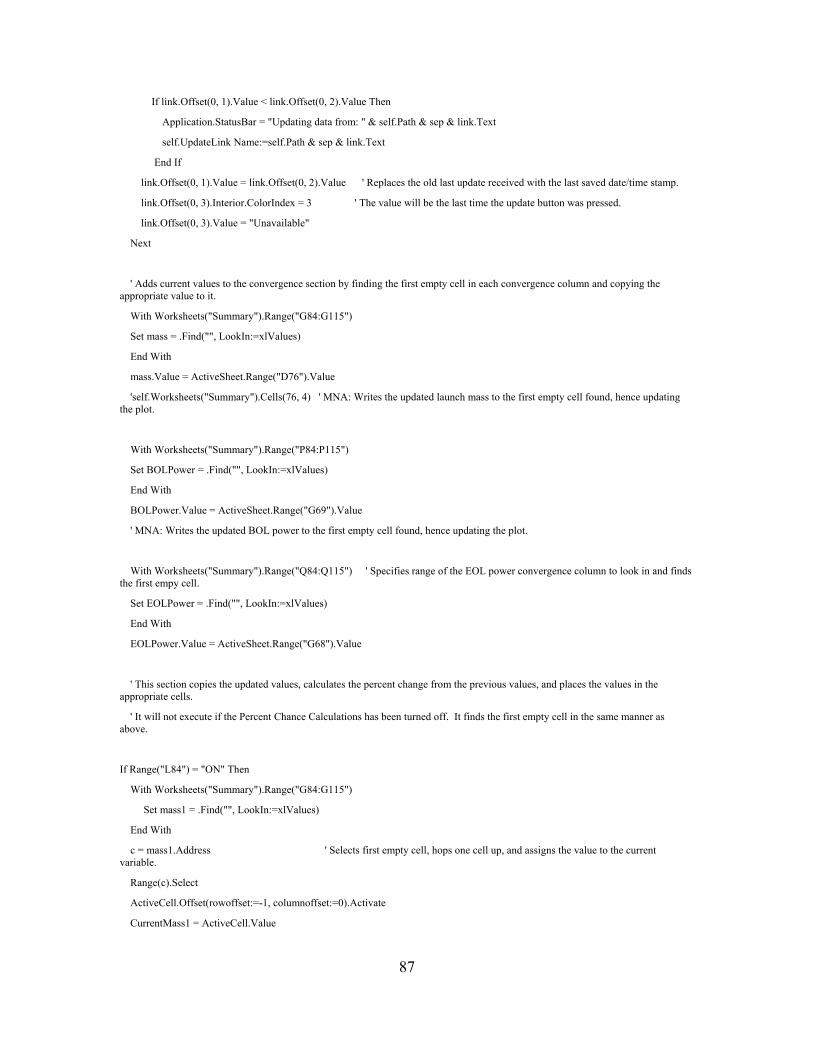
If link.Offset(0, 1).Value < link.Offset(0, 2).Value Then
Application.StatusBar = "Updating data from: " & self.Path & sep & link.Text
self.UpdateLink Name:=self.Path & sep & link.Text
End If
link.Offset(0, 1).Value = link.Offset(0, 2).Value ' Replaces the old last update received with the last saved date/time stamp.
link.Offset(0, 3).Interior.ColorIndex = 3 ' The value will be the last time the update button was pressed.
link.Offset(0, 3).Value = "Unavailable"
Next
' Adds current values to the convergence section by finding the first empty cell in each convergence column and copying the appropriate value to it.
With Worksheets("Summary").Range("G84:G115")
Set mass = .Find("", LookIn:=xlValues)
End With
mass.Value = ActiveSheet.Range("D76").Value
'self.Worksheets("Summary").Cells(76, 4) ' MNA: Writes the updated launch mass to the first empty cell found, hence updating the plot.
With Worksheets("Summary").Range("P84:P115")
Set BOLPower = .Find("", LookIn:=xlValues)
End With
BOLPower.Value = ActiveSheet.Range("G69").Value
' MNA: Writes the updated BOL power to the first empty cell found, hence updating the plot.
With Worksheets("Summary").Range("Q84:Q115") ' Specifies range of the EOL power convergence column to look in and finds the first empy cell.
Set EOLPower = .Find("", LookIn:=xlValues)
End With
EOLPower.Value = ActiveSheet.Range("G68").Value
' This section copies the updated values, calculates the percent change from the previous values, and places the values in the appropriate cells.
' It will not execute if the Percent Chance Calculations has been turned off. It finds the first empty cell in the same manner as above.
If Range("L84") = "ON" Then
With Worksheets("Summary").Range("G84:G115")
Set mass1 = .Find("", LookIn:=xlValues)
End With
c = mass1.Address ' Selects first empty cell, hops one cell up, and assigns the value to the current variable.
Range(c).Select
ActiveCell.Offset(rowoffset:=-1, columnoffset:=0).Activate
CurrentMass1 = ActiveCell.Value
87
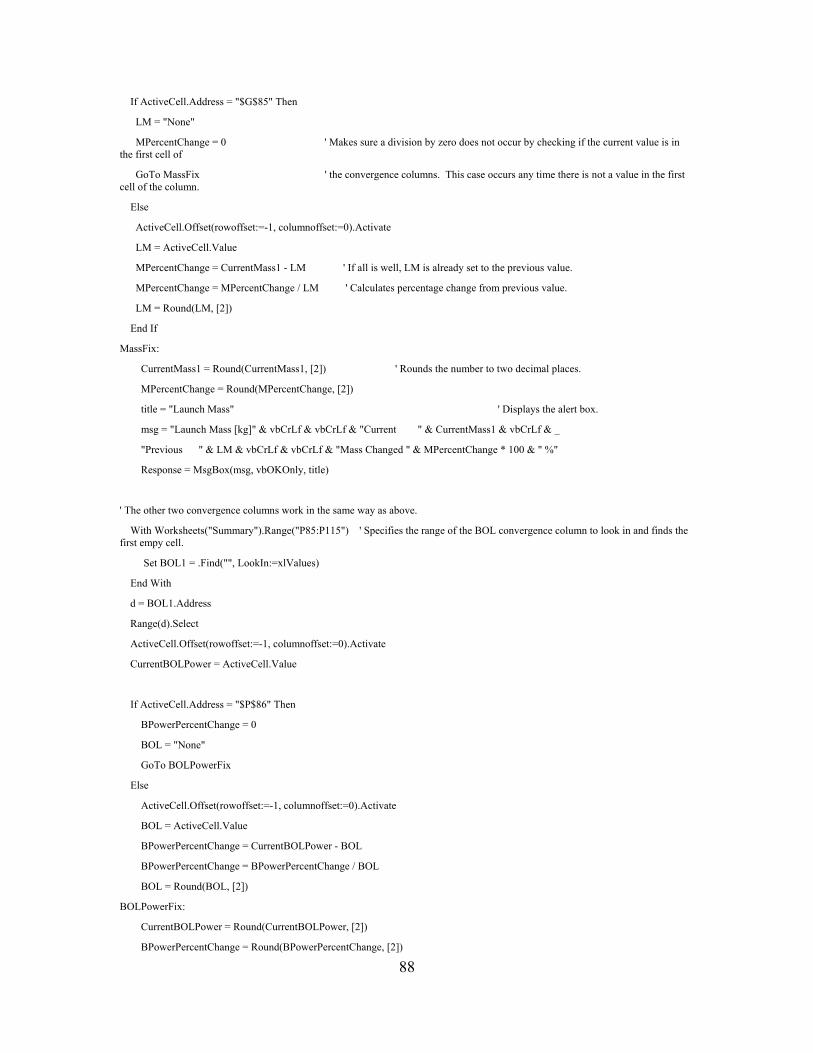
If ActiveCell.Address = "$G$85" Then
LM = "None"
MPercentChange = 0 ' Makes sure a division by zero does not occur by checking if the current value is in the first cell of
GoTo MassFix ' the convergence columns. This case occurs any time there is not a value in the first cell of the column.
Else
ActiveCell.Offset(rowoffset:=-1, columnoffset:=0).Activate
LM = ActiveCell.Value
MPercentChange = CurrentMass1 - LM ' If all is well, LM is already set to the previous value.
MPercentChange = MPercentChange / LM ' Calculates percentage change from previous value.
LM = Round(LM, [2])
End If
MassFix:
CurrentMass1 = Round(CurrentMass1, [2]) ' Rounds the number to two decimal places.
MPercentChange = Round(MPercentChange, [2])
title = "Launch Mass" ' Displays the alert box.
msg = "Launch Mass [kg]" & vbCrLf & vbCrLf & "Current " & CurrentMass1 & vbCrLf & _
"Previous " & LM & vbCrLf & vbCrLf & "Mass Changed " & MPercentChange * 100 & " %"
Response = MsgBox(msg, vbOKOnly, title)
' The other two convergence columns work in the same way as above.
With Worksheets("Summary").Range("P85:P115") ' Specifies the range of the BOL convergence column to look in and finds the first empy cell.
Set BOL1 = .Find("", LookIn:=xlValues)
End With
d = BOL1.Address
Range(d).Select
ActiveCell.Offset(rowoffset:=-1, columnoffset:=0).Activate
CurrentBOLPower = ActiveCell.Value
If ActiveCell.Address = "$P$86" Then
BPowerPercentChange = 0
BOL = "None"
GoTo BOLPowerFix
Else
ActiveCell.Offset(rowoffset:=-1, columnoffset:=0).Activate
BOL = ActiveCell.Value
BPowerPercentChange = CurrentBOLPower - BOL
BPowerPercentChange = BPowerPercentChange / BOL
BOL = Round(BOL, [2])
BOLPowerFix:
CurrentBOLPower = Round(CurrentBOLPower, [2])
BPowerPercentChange = Round(BPowerPercentChange, [2])
88
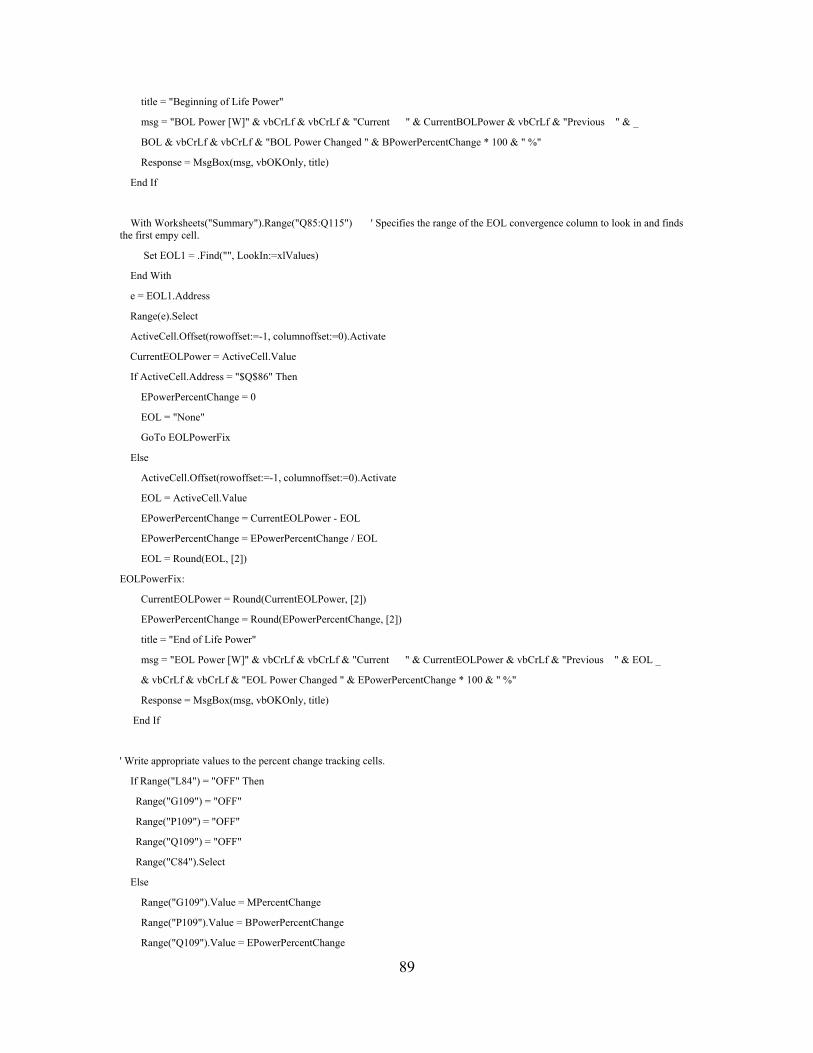
title = "Beginning of Life Power"
msg = "BOL Power [W]" & vbCrLf & vbCrLf & "Current " & CurrentBOLPower & vbCrLf & "Previous " & _
BOL & vbCrLf & vbCrLf & "BOL Power Changed " & BPowerPercentChange * 100 & " %"
Response = MsgBox(msg, vbOKOnly, title)
End If
With Worksheets("Summary").Range("Q85:Q115") ' Specifies the range of the EOL convergence column to look in and finds the first empy cell.
Set EOL1 = .Find("", LookIn:=xlValues)
End With
e = EOL1.Address
Range(e).Select
ActiveCell.Offset(rowoffset:=-1, columnoffset:=0).Activate
CurrentEOLPower = ActiveCell.Value
If ActiveCell.Address = "$Q$86" Then
EPowerPercentChange = 0
EOL = "None"
GoTo EOLPowerFix
Else
ActiveCell.Offset(rowoffset:=-1, columnoffset:=0).Activate
EOL = ActiveCell.Value
EPowerPercentChange = CurrentEOLPower - EOL
EPowerPercentChange = EPowerPercentChange / EOL
EOL = Round(EOL, [2])
EOLPowerFix:
CurrentEOLPower = Round(CurrentEOLPower, [2])
EPowerPercentChange = Round(EPowerPercentChange, [2])
title = "End of Life Power"
msg = "EOL Power [W]" & vbCrLf & vbCrLf & "Current " & CurrentEOLPower & vbCrLf & "Previous " & EOL _
& vbCrLf & vbCrLf & "EOL Power Changed " & EPowerPercentChange * 100 & " %"
Response = MsgBox(msg, vbOKOnly, title)
End If
' Write appropriate values to the percent change tracking cells.
If Range("L84") = "OFF" Then
Range("G109") = "OFF"
Range("P109") = "OFF"
Range("Q109") = "OFF"
Range("C84").Select
Else
Range("G109").Value = MPercentChange
Range("P109").Value = BPowerPercentChange
Range("Q109").Value = EPowerPercentChange
89
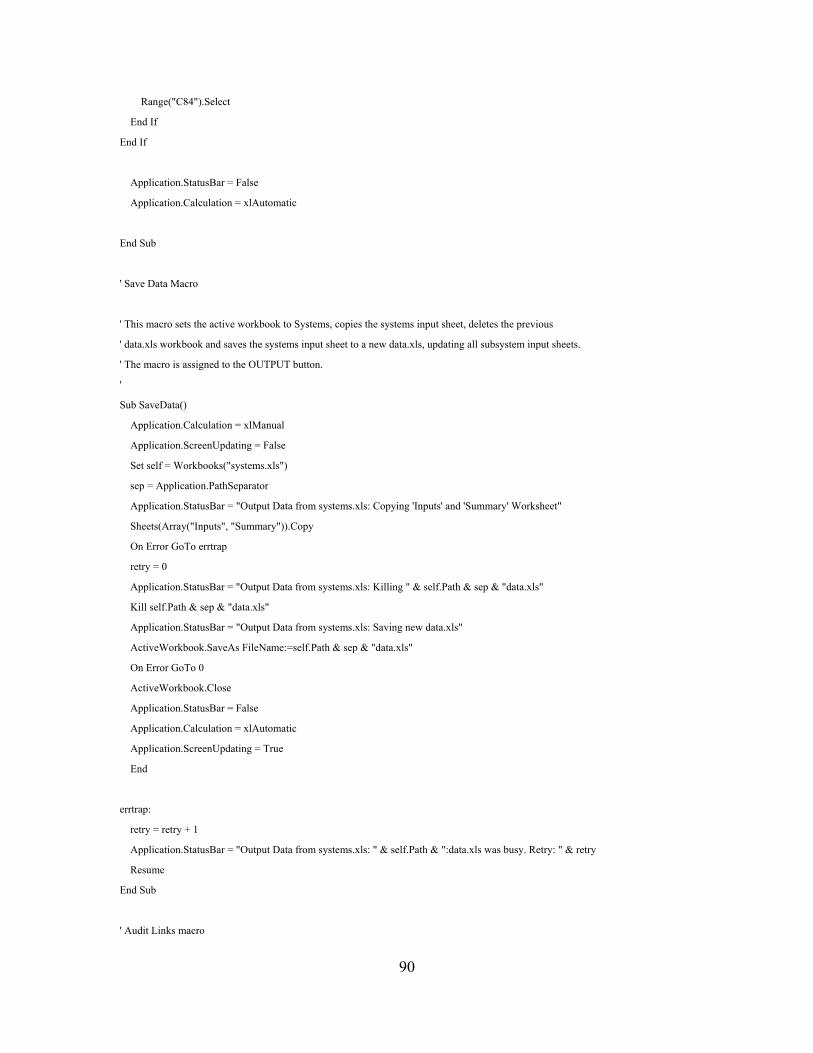
Range("C84").Select
End If
End If
Application.StatusBar = False
Application.Calculation = xlAutomatic
End Sub
' Save Data Macro
' This macro sets the active workbook to Systems, copies the systems input sheet, deletes the previous
' data.xls workbook and saves the systems input sheet to a new data.xls, updating all subsystem input sheets.
' The macro is assigned to the OUTPUT button.
'
Sub SaveData()
Application.Calculation = xlManual
Application.ScreenUpdating = False
Set self = Workbooks("systems.xls")
sep = Application.PathSeparator
Application.StatusBar = "Output Data from systems.xls: Copying 'Inputs' and 'Summary' Worksheet"
Sheets(Array("Inputs", "Summary")).Copy
On Error GoTo errtrap
retry = 0
Application.StatusBar = "Output Data from systems.xls: Killing " & self.Path & sep & "data.xls"
Kill self.Path & sep & "data.xls"
Application.StatusBar = "Output Data from systems.xls: Saving new data.xls"
ActiveWorkbook.SaveAs FileName:=self.Path & sep & "data.xls"
On Error GoTo 0
ActiveWorkbook.Close
Application.StatusBar = False
Application.Calculation = xlAutomatic
Application.ScreenUpdating = True
End
errtrap:
retry = retry + 1
Application.StatusBar = "Output Data from systems.xls: " & self.Path & ":data.xls was busy. Retry: " & retry
Resume
End Sub
' Audit Links macro
90
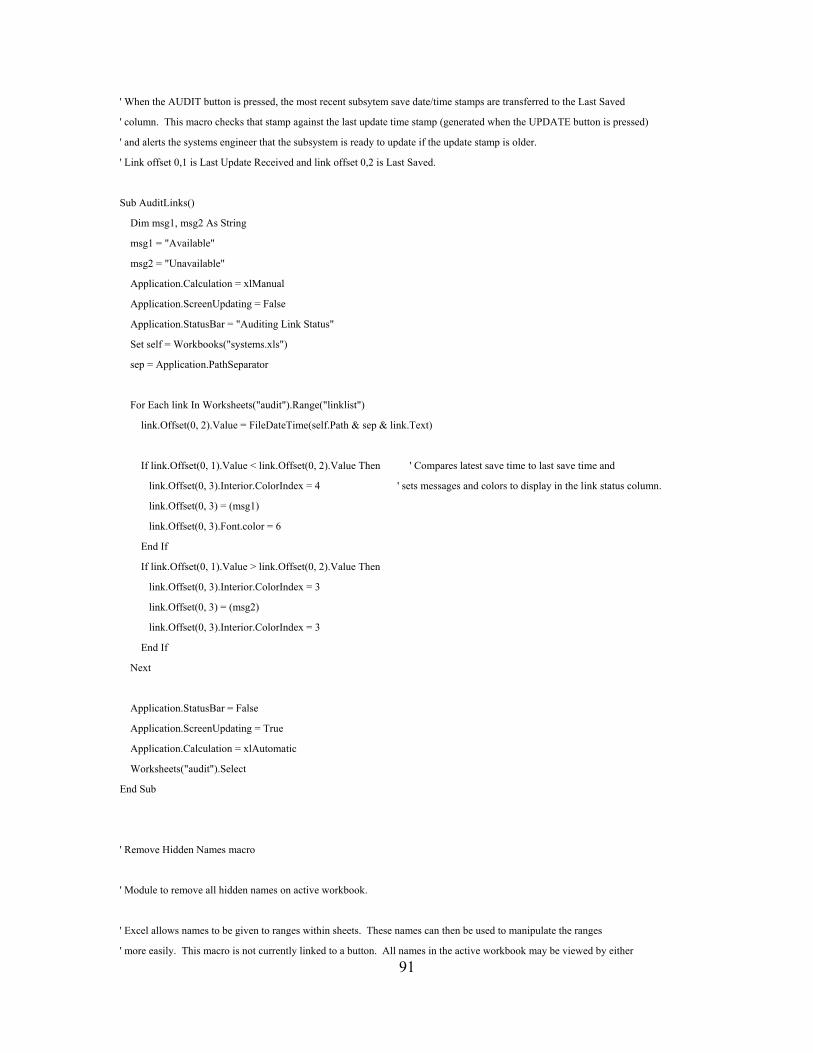
' When the AUDIT button is pressed, the most recent subsytem save date/time stamps are transferred to the Last Saved
' column. This macro checks that stamp against the last update time stamp (generated when the UPDATE button is pressed)
' and alerts the systems engineer that the subsystem is ready to update if the update stamp is older.
' Link offset 0,1 is Last Update Received and link offset 0,2 is Last Saved.
Sub AuditLinks()
Dim msg1, msg2 As String
msg1 = "Available"
msg2 = "Unavailable"
Application.Calculation = xlManual
Application.ScreenUpdating = False
Application.StatusBar = "Auditing Link Status"
Set self = Workbooks("systems.xls")
sep = Application.PathSeparator
For Each link In Worksheets("audit").Range("linklist")
link.Offset(0, 2).Value = FileDateTime(self.Path & sep & link.Text)
If link.Offset(0, 1).Value < link.Offset(0, 2).Value Then ' Compares latest save time to last save time and
link.Offset(0, 3).Interior.ColorIndex = 4 ' sets messages and colors to display in the link status column.
link.Offset(0, 3) = (msg1)
link.Offset(0, 3).Font.color = 6
End If
If link.Offset(0, 1).Value > link.Offset(0, 2).Value Then
link.Offset(0, 3).Interior.ColorIndex = 3
link.Offset(0, 3) = (msg2)
link.Offset(0, 3).Interior.ColorIndex = 3
End If
Next
Application.StatusBar = False
Application.ScreenUpdating = True
Application.Calculation = xlAutomatic
Worksheets("audit").Select
End Sub
' Remove Hidden Names macro
' Module to remove all hidden names on active workbook.
' Excel allows names to be given to ranges within sheets. These names can then be used to manipulate the ranges
91' more easily. This macro is not currently linked to a button. All names in the active workbook may be viewed by either
' running this macro manually from the command bar above or using the Insert-Names-Define operation from Excel to
' view and/or modify names and ranges. See VBA Help on Names for more information.
Sub Remove_Hidden_Names()
' Dimension variables.
Dim xName As Variant
Dim Result As Variant
Dim Vis As Variant
'Loop once for each name in the workbook.
For Each xName In ActiveWorkbook.Names
'If a name is not visible (it is hidden)...
If xName.Visible = True Then
Vis = "Visible"
Else
Vis = "Hidden"
End If
'...ask whether or not to delete the name.
Result = MsgBox(prompt:="Delete " & Vis & " Name " & _
Chr(10) & xName.Name & "?" & Chr(10) & _
"Which refers to: " & Chr(10) & xName.RefersTo, _
Buttons:=vbYesNo)
'If the result is true, then delete the name.
If Result = vbYes Then xName.Delete
'Loop to the next name.
Next xName
End Sub
' Display Links macro
' MNA: This macro checks all the links in the active workbooks and displays them for quick reference from the systems summary sheet.
' The links can also be checked using the "Edit-Links" operation from the Edit toolbar.
Sub DisplayLinks()
alinks = ActiveWorkbook.LinkSources
If Not IsEmpty(alinks) Then
For I = 1 To UBound(alinks)
92

MsgBox "Link " & I & ":" & Chr(13) & alinks(I)
Next I
End If
End Sub
' Software Information Macro
' MNA: This macro displays CDC software information. If modifications are made to any part of the code, a quick reference to
' the latest month and year of update can be made by adding a msg3 to the Dim statement, specifying the text of msg3,
' then adding "vbCrLf & msg3" to the msg line.
Sub Aerospace_Info()
Dim msg, msg1, msg2, title, Response As String
title = "Naval Postgraduate School Spacecraft Design Center - May 2001"
msg1 = "This Concept Design Center software was provided by The Aerospace Corporation"
msg2 = "Modifications made May 2001 by Mike Abreu at the Naval Postgraduate School, Monterey, CA"
msg = msg1 & vbCrLf & vbCrLf & msg2
Response = MsgBox(msg, vbInformation, title)
End Sub
93

THIS PAGE INTENTIONALLY LEFT BLANK
94
LIST OF REFERENCES
1. Bozdoc, M., MB Solutions, “The History of CAD.” [http://www.bozdoc.f2s.com/CAD-History.htm]. February 2001.
2. Davis, Michael, Headstuf Product Development, MCADVision, MCADCafe, “A
Fundamental Shift in the Product Design Paradigm,” 2001. [http://www.headstuf.com].
3. Gasper, Joel, Synergis Technologies, MCADVision, MCADCafe, “Improving the
Design Process with Solids Modeling,”, 2001. [http://www.mcadcafe.com/MCADVision].
4. Aguilar, Joseph A., Dawdy, Andrew B., and Law, Glenn W., “The Aerospace
Corporation’s Concept Design Center,” Proceedings of the Eighth Annual International Symposium of the International Council on Systems Engineering (INCOSE), January 1998.
5. The Aerospace Corporation, Scope vs. Detail: The Teams of the Concept Design
Center, by Joseph A. Aguilar and Andrew Dawdy. 6. The Aerospace Corporation, Implementing a Collaborative Conceptual Design
System (The Human Element is the Most Powerful Part of the System), by Jon Neff and Stephen Presley, 1999.
7. Agrawal, B.N., Design of Geosynchronous Spacecraft, Prentice-Hall, Inc., 1986. 8. Larson, W.J. and Wertz, J.R., Space Mission Analysis and Design, 3rd ed.,
Microcosm, Inc., 1999. 9. Walkenbach, John, Excel 2000 Programming for Dummies, IDG Books Worldwide,
Inc., 1999. 10. The Aerospace Corporation, Crosslink magazine, “Concurrent Design at Aerospace,”
Winter 2000/2001.
95

THIS PAGE INTENTIONALLY LEFT BLANK
96
INITIAL DISTRIBUTION LIST
1. Defense Technical Information Center Ft. Belvoir, VA
2. Dudley Knox Library Naval Postgraduate School Monterey, CA
3. Prof. Max Platzer Naval Postgraduate School Monterey, CA
4. Prof. Brij N. Agrawal Naval Postgraduate School Monterey, CA
[email protected] 5. Mr. Joseph Aguilar The Aerospace Corporation El Segundo, CA [email protected]
6. Mr. Christopher Taylor The Aerospace Corporation El Segundo, CA
7. Mr. Stephen Presley The Aerospace Corporation El Segundo, CA [email protected]
8. Dr. Joel Sercel California Institute of Technology Pasadena, CA
97
Related Documents