Page | 1 Erasmus University Rotterdam Erasmus School of Economics Master of Science in Economics and Business (MSc) Specialisation: Marketing Master Thesis Market basket analysis of beauty products Author: Velislava Gancheva Supervisor: Bruno Jacobs Date: 24.09.2013

Welcome message from author
This document is posted to help you gain knowledge. Please leave a comment to let me know what you think about it! Share it to your friends and learn new things together.
Transcript
Page | 1
Erasmus University Rotterdam
Erasmus School of Economics
Master of Science in Economics and Business (MSc)
Specialisation: Marketing
Master Thesis
Market basket analysis of beauty
products
Author: Velislava Gancheva
Supervisor: Bruno Jacobs
Date: 24.09.2013
Page | 2
Abstract:
Companies nowadays are rich in vast amounts of data but poor in information extracted
from that data. Big data is seen as a valuable resource and although the concept of data
mining is still new and developing, companies in a variety of industries are relying on it for
making strategic decisions. Facts that otherwise may go unnoticed can be now revealed by
the techniques that sift through stored information.
Market basket analysis is a very useful technique for finding out co-occurring items in
consumer shopping baskets. Such information can be used as a basis for decisions about
marketing activity such as promotional support, inventory control and cross-sale campaigns.
The main objective of the thesis is to see how different products in a beauty shop
assortment interrelate and how to exploit these relations by marketing activities. Mining
association rules from transactional data will provide us with valuable information about co-
occurrences and co-purchases of products. Such information can be used as a basis for
decisions about marketing activity such as promotional support, inventory control and cross-
sale campaigns.
Keywords: data mining, market basket analysis, association rules, multinomial logit.
Page | 3
Table of Contents
Chapter 1: Introduction .......................................................................................................... 1
1.1 Overview .......................................................................................................................... 4
1.2 Business use of data mining ............................................................................................. 5
1.3 Research problem description .......................................................................................... 5
1.4 Motivation for the study ................................................................................................... 6
Chapter 2: Literature Review ............................................................................................... 10
2.1 Background of the study ................................................................................................ 10
2.2 Table overview of existing literature and methodology ................................................. 18
Chapter 3: Data ...................................................................................................................... 19
3.1 Data Description ............................................................................................................. 19
3.2 Considerations and Assumptions Prior to Analysis ....................................................... 22
3.3. Research Questions and Hypotheses ............................................................................. 23
Chapter 4: Research methodology ....................................................................................... 25
4.1 Market Basket Analysis ................................................................................................. 25
4.2 Strengths and Weaknesses of Market Basket Analysis .................................................. 26
4.3 Association Rule Mining ............................................................................................... 27
4.4 Multinomial Logistic Regression ……………………………………………………..37
Chapter 5: Data analysis and results ................................................................................... 42
5.1 Market Basket Analysis ................................................................................................. 42
5.2 Multinomial Logistic Regression ................................................................................... 50
Chapter 6: Conclusions ......................................................................................................... 63
6.1 General Discussion ......................................................................................................... 63
6.2 Academic Contribution .................................................................................................. 64
6.3 Managerial Implications ................................................................................................. 64
6.4 Limitations and Directions for Future Research ............................................................ 65
Bibliography ........................................................................................................................... 66
Appendices .............................................................................................................................. 70
Page | 4
Chapter 1
Introduction
1.1 Overview
The highly technological era that we live in has made it possible for companies to
gather enormous quantities of data. Data mining is becoming more and more common for
many businesses worldwide. The large amount of data that is being gathered on a daily basis
captures useful information across different aspects of every business. The collection of data
on a highly disaggregate level is seen as a raw material for extracting knowledge. While
some facts can be revealed directly from disaggregate data, often we are interested to find
hidden rules and patterns. Non-trivial insights can be generated through data mining. Data
mining contains of various statistical analyses that reveal unknown aspects of the data.
Mining tools have been found useful in many businesses for uncovering significant
information and hence, providing managers with solutions for complicated problems.
Data mining is commonly seen as a single step of a whole process called Knowledge
Discovery in Databases (KDD). According to Fayyad et.al, ‘KDD is the nontrivial process of
identifying valid, novel, potentially useful and ultimately understandable patterns in data.’
(Usama Fayyad, Gregory Piatetsky-Shapiro, and Padhraic Smyth, 1996)
Data mining is a technique that encompasses a huge variety of statistical and
computational techniques such as: association-rule mining, neural network analysis,
clustering, classification, summarising data and of course the traditional regression analyses.
Data mining gained popularity especially in the last two decades when advances in
computing power provided us with the possibility to mine voluminous data. Extracting
knowledge and hidden information from data using a whole set of techniques found its
applications in various contexts. Knowledge discovery is widely used in marketing to identify
and analyse customer groups and predict future behaviour. Data mining is an effective way to
provide better service to customers and adjust offers according to their needs and
motivations.
Page | 5
1.2 Business use of data mining
Companies nowadays are rich in vast amounts of data but poor in information
extracted from that data. Big data is seen as a valuable resource and although the concept of
data mining is still new and developing, companies in a variety of industries are relying on it
for making strategic decisions. Facts that otherwise may go unnoticed can be now revealed
by the techniques that sift through stored information. When applying mining tools and
techniques we seek to find useful relationships, patterns and anomalies that can help
managers make better business decisions.
Data mining tools perform analyses that are very valuable for business strategies,
scientific research and getting to know your customers better. Managerial insights are no
longer the only factor trusted when it comes to decision-making. Data driven decisions can
lead to better firm performance.
Data-based implications are gaining popularity while the gut instinct of managers is
remaining in the background. Analysing data not only improves firm performance but gives
us accurate insights on different aspects of the business.
Data mining is widely used in marketing for spotting sales trends, developing better
marketing campaigns and finding the root cause of specific problems like customer defection
or fraudulent transactions, for example. It is also used for prediction of behaviour: which
customers are most likely to leave us (customer churns) or what are the things that an
individual will be most interested to see in a website.
1.3 Research problem description
In the recent years analysing shopping baskets has become quite appealing to
retailers. Advanced technology made it possible for them to gather information on their
customers and what they buy. The introduction of electronic point-in sale increased the use
and application of transactional data in market basket analysis. In retail business analysing
such information is highly useful for understanding buying behaviour. Mining purchasing
patterns allows retailers to adjust promotions, store settings and serve customers better.
Identifying buying rules is crucial for every successful business. Transactional data is
used for mining useful information on co-purchases and adjusting promotion and advertising
accordingly. The well-known set of beer and diapers is just an example of an association rule
found by data scientists.
Page | 6
The main objective of the thesis is to see how different products in a beauty shop
assortment interrelate and how to exploit these relations by marketing activities. Mining
association rules from transactional data will provide us with valuable information about co-
occurrences and co-purchases of products. Some shoppers may purchase a single product
during a shopping trip, out of curiosity or boredom, while others buy more than one product
for efficiency reasons.
1.4 Motivation for the study
The main point of interest for retailers is to understand dependencies among
purchases. Consumers buy various combinations of products on a single shopping trip, but
choice scenarios do not seem to be random to market analysts. ‘…These multicategory
decisions result in the formation of consumers' "shopping baskets" which comprise the
collection of categories that consumers purchase on a specific shopping trip.' (Puneet
Manchanda, Asim Ansari and Sunil Gupta, 1999).
Motivation objectives
Over the past two decades a lot of attention has been devoted to the subject of data
mining. While retailers are involved in this topic because of the absolute utility of market
basket data, market analysts are interested because of the research and technical challenges
they face while analysing the data.
Increasing amount of data is being generated every second and this allows experts to
search for meaningful associations among customer purchases. Customers make purchase
decisions in several product categories on a single shopping trip. Interdependencies among
products have faced increased attention recently as retailers are trying to improve their
businesses by applying quantitative analyses to their data.
It is very important for retailers to get to know what their customers are buying. Some
products have higher affinity to be sold together and hence the retailer can benefit from this
affinity if special offers and promotions are developed for these products. It is also important
to the retailer to cut off products from the assortment which are not generating profits.
Deleting loss-making, declining and weak brands may help companies boost their profits and
redistribute costs towards aspects of the more profitable brands. (Kumar, 2009) This is yet
another reason why data mining is seen as a powerful tool for many businesses to regularly
check if they are selling too many brands, identify weak ones and possibly merge them with
Page | 7
healthy brands. Data mining techniques are highly valued for the useful information they
provide so that the retailer can serve customers better and generate higher profits.
Chris Anderson in his book ‘The long tail: Why the future of business is selling less
of more’ explains a concept of the ‘98% rule’, which is quite contrasting to the well-known
80/20 rule. In other words, 2% of the items a retailer sells are frequent, while 98% of the
items have very low frequencies, which create a long tail distribution. This is why the
presence of this ‘98% rule’ in the retail business created the need for data mining software
and made quantitative analysis a must for retailers.(Anderson, 2006)
1. Find products with affinity to be sold together.
A lot of research has been done in marketing to show that there are demand
interdependencies among certain related products within a single store. Retailers tend to
exploit this tendency by adjusting price promotions in a profit-maximising way. They can
also exploit these product associations by incorporating them into promotional strategies.
Analysing purchases in multiple categories allows retailers to benefit from promotion and
other marketing activities. Incorporation of product interdependencies into a pricing strategy
is an effective way of boosting profits.
For example, Mulhern and Leone( 1991) study the impact of price promotions on
cake mix and cake frosting. Their main objective is to evaluate the overall profitability of
implicit price bundling. Reducing the price of cake mix increase purchases of both cake mix
and frosting and the overall profit improves. The study shows how promotions have positive
impact on the sales of a complementary product.
Finding associations between product purchases is an effective way to adjust price
promotions better and make better predictions on the effect of price bundling. Also, it is
important to keep product complementarities in mind when making promotions.
Complementary products often sell well together but this does not mean that they are a pair
and a price increase in one of the set will not affect sales of the other one. Complementarity
gives managers control over their customers’ buying behaviour, but co-occurrence of specific
product categories in a single shopping basket is less controllable. Market basket analysis
reveals all the underlying patterns of buying behaviour that cannot be simply observed.
(Puneet Manchanda, Asim Ansari and Sunil Gupta, 1999)
Page | 8
Analysing shopping baskets also shows multi-category dependencies across products
which allows retailers to bundle new products that have not been discovered yet as a set.
2. Improve in-store settings and optimise product placement.
Gaining insight on product interdependencies can help retailers optimise store layout.
It is an important aspect of retailing business because in-store settings may help increase sales
if done right. It also influences buying behaviour, store traffic and the whole shopping
atmosphere. If market basket analysis reveals that certain products are often purchased
together, it is of great interest for the retailer to put these two items or categories of products
close to each other to facilitate the customer. Another option is to place them as far as
possible from each other so that customers are exposed to much more products while trying
to find the other product. However, the latter option may have negative consequences due to
the fact the customers tend to get annoyed if they cannot find fast what they are looking for
and need to waste time strolling around the whole store.
Optimisation of in-store settings may help improve shopping experience by reducing
congestion and saving time for customers. With the right space planning the store benefits
from increased cross product sales and impulse purchases. Moreover, store layout and
atmosphere has a very strong impact on customer perceptions. A study made by (Bill
Merrilees and Dale Miller, 2001) shows that store layout and atmosphere has a positive effect
on customer loyalty. In-store settigns as light, music, layout, applealing stock dispalys and
easy to find goods are seen as determinants of pleasant and enjoyable shopping experience.
Various dimensions of store layout have positive effect on customers’ purchase intentions
and loyalty. This is why it is so crucial to extract knowledge from data so one can adjust store
settings in order to improve customers’ shopping experience.
3. Improve layout of the catalogue of e-commerce site.
Visual displays of products apply also to the catalogue of the firm online site. E-
commerce website interface plays significant part of customers’ perceptions. A key success
factor for profitable e-commerce site is the layout. In order to be able to determine an
optimised layout for website it is important to know the interdependencies among different
products.
Page | 9
A lot of research has been done in finding an optimal location, colouring and design for
catalogues of e-commerce sites. The last step of successfully implementing a website strategy
is to know how to place different products in order to maximise cross-sales. For instance, if
we know which products have affinity to be sold together, we have to make sure that they are
side by side on the same page on the website. It is also possible to provide discount in the
form of shipping benefits for a group of products that have higher probabilities of selling
together.
4. Control inventory based on product demand.
For the recent years, with more powerful analytical software it is possible to predict
almost everything. It is now feasible to predict product demand based on data from past
purchases, for example. For this objective it is important to know which products are related
in terms of cross-sales.
Being able to find the probability of purchase for each product or a certain set of
products is essential for controlling inventory. It has been observed that greater volume of
products in the inventory can lead to higher levels of demand. (David R. Bell and Yasemin
Boztu˘g, 2007). Many researchers have tried to give explanation for this phenomenon. Recent
studies have found the impact of promotion on stockpilling and increased demand.
(Assunc¸ ˜ao, J. L., & Meyer, R. J., 1993) analyse the nature of the relationship which exists
between price, promotion, sales and consumption. The authors’ main finding is that price
promotions encourage stockpilling, while on the other hand stockpilling rationally leads to
increase in consumption.
However, the consumption time depends on the type of product that is associated with
stockpiling. Foods and drinks are considered to be consumed faster than non-food goods. In
this case, most of the beauty products cannot be stockpiled for long time due to extended
consumption time. A face cream for example, can be used for 5-6 months before it is over.
While a shampoo or toothpaste usually last not more than a month. Here comes the challenge
of how many people are there in a single household. If the case is about a whole family
stockpiling would be appropriate because families tend to shop more rare but in larger
quantities. That is why it is harder to predict consumption time of products in a beauty store,
but after examining which ones sell best, it will be very beneficial for the retailer so that he is
always prepared with profit generating products available in stock.
Page | 10
Chapter 2
Literature Review
2.1 Background of the study
Data mining has taken an important part of marketing literature for the last several
decades. Market basket analysis is one of the oldest areas in the field of data mining and is
the best example for mining association rules.
Various algorithms for Association Rule Mining (ARM) and Clustering have been
developed by researchers to help users achieve their objectives. Rakesh Agrawal and Usama
Fayyad are one of the pioneers in data mining. They account for a number of developed
algorithms and procedures.
According to Shapiro, rule generating procedures can be divided into procedures that
find quantitative rules and procedures that find qualitative rules. (Rakesh Agrawal,
Ramakrishnan Srikant) elaborate on the concept of mining quantitative rules in large
relational tables. Quantitative rules are defined in terms of the type of attributes contained in
these relational tables. Attributes can be either quantitative ( age, income, etc.) or categorical
( certain type of a product, make of a car). Boolean attributes are such attributes that can take
on one of two options ( True or False, 1 or 0). They are considered a special case of
categorical attributes. The authors call this mining problem the Quantitative Association
Rules problem. An example of a generated quantitative rule is :
If ((Age : [30…39] ) + (Married : Yes)) → (Number of cars = 2)
The example combines variables that have quantitative and boolean attributes.
(S. Prakash, R.M.S. Parvathi, 2011) propose a qualitative approach for mining
quantitative association rules. The nature of the proposed approach is qualitative because the
method converts numerical attributes to binary attributes.
However, finding qualitative rules is of main interest in this analysis. These rules are most
commonly represented as decision trees, patterns or dependency tables. (Gregory Piatetsky-
Shapiro, William Frawley, 1991) The type of attributes used for mining qualitative rules is
categorical.
(Rakesh Agrawal, Tomasz Imielinski, Arun Swami, 1993) is one of the first
published papers on association rules that proposes a rule mining algorithm that discovers
Page | 11
qualitative rules with no restriction for boolean attributes. The authors test the effectiveness
of the algorithm by applying it to data obtained from a large retailing company.
Association rules found application in many research areas such as: market basket
analysis, recommendation systems, intrusion detection etc.
In marketing literature market basket analysis has been classified into two models:
explanatory and exploratory. First, exploratory models will be thoroughly explained in this
paper as they are of higher relevance for the research and after that an explanation of
explanatory models will be given. The main idea behind exploratory models is the
discovering of purchase patterns from POS (point-of-sale) data. Exploratory approaches do
not include information on consumer demographics or marketing mix variables. (Katrin
Dippold, Harald Hruschka, 2010) Methods like association rules (Rakesh Agrawal, Sirkant
Ramakrishnan, 1994) or collaborative filtering (Andreas Mild, Thomas Reutterer, 2003)
summarise a vast amount of data into a fewer meaningful rules or measures. Such methods
are quite useful for discovering unknown relationships between the items in the data.
Moreover, these methods are computationally simple and can be used for undirected data
mining. However, exploratory approaches are not appropriate for forecasting and finding the
cause-roots of complex problems. They are just used to uncover distinguished cross-category
interdependencies based on some frequency patterns for items or product categories
purchased together. A typical application of these exploratory approaches is identifying
product category relationships by simple association measures. Pairwise associations are used
to compare entities in pairs and judge which entity is prefered or has greater amount of some
quantitative property. (Julander, 1992) compares the percentage of shoppers buying a certain
product and the percentage of all total sales generated by this product. By making such
comparisons, one can easily find out the leading products and what is their share of sales.
Examining which the leading products are for consumers is extremely important since a large
number of shoppers come into contact with these specific product types every day. As the
departments with leading products generate much in-store traffic, it is crucial to use this
information for placing other specific products nearby. The paper by Julander also shows
how combinatory analysis can be used to study the patterns of cross-buying between certain
brands or product groups: for instance, what is the percentage of shoppers that buy products
A+C, but not B or what is the percentage of shoppers that buy only A. It also deals with the
probabilities that shoppers will purchase from one, two or more departments in a single visit
in the store.
Page | 12
Another significant stream of research in the field of exploratory analysis is the
process of generating association rules. Substantial amount of algorithms for mining patterns
from market basket data have been proposed. From the co-operative work of Rakesh Agrawal
and Ramakrishnan Srikant they present two new algorithms for discovering large itemsets in
databases, namely Apriori and AprioriTid. These two algorithms are similar with regard to
the function that is used to determine the candidate itemsets, but the difference is that the
AprioriTID does not use the database for counting support after the first pass ( first iteration)
while Apriori makes multiple passes over the database (more information on methodology in
Chapter 4). The results from the study show that these two new algorithms perform much
better than the previously known AIS (R. Agrawal, T. Imielinski, and A. Swami, 1993) and
SETM (M. Houtsma and A. Swami, 1993) algorithms. Since the introduction of the Apriori
algorithm, it has been considered the most useful and fast algorithm for finding frequent
itemsets. Many improvements have been made on the Apriori algorithm in order to increase
its efficiency and effectiveness. (M.J.Zaki, M.Ogihara, S. Parthasarathy, 1996). There are few
algorithms developed that are not based on the Apriori,but they still address the issue of
speed of Apriori. The following papers (Eu-Hong (Sam) Han, George Karypis, Vipin Kumar,
1999) , (Jong Soo Park, Ming-Syan Chen, Philip S. Yu) propose new algorithms which are
not based on the Apriori, but all of them are being compared to Apriori in terms of execution
time.
(Robert J. Hilderman, Colin L. Carter, Howard J. Hamilton, and Nick Cercone)
develop a framework for knowledge discovery from market basket data. Combining Apriori
and AOG (D.W. Cheung, A.W. Fu, and J. Han., 1994) algorithms in the methodology, the
purpose of the paper is not only to explain how to discover customer purchase patterns, but to
find out customer profiles by dividing customers into distinct classes. The authors provide an
extensive explanation of the share-confidence framework. Results show that it can give better
feedback than the support- confidence framework.
Another use of market basket data is found in the finite mixture model in the paper by
(Rick L. Andrews , Imran S. Currim, 2002). The idea of the model is to identify segments of
households that have identical behaviour across product categories. The authors use both
marketing variables and scanner panel data to answer the research questions. The study
shows that household demographic variables are found to be more strongly correlated to price
sensitivity compared to results in previous studies.The research divides customers into heavy
Page | 13
users and lighter users. Heavy user households are found to be less price sensitive, visiting
the store less often, in most cases high income customers.While, on the other hand, lighter
users are mainly students or people that visit the store very often and are very price sensitive.
The results show that households that have identical behaviour across product categories tend
to be lighter users than households that behave independently. Also households with identical
behaviours are said to be more price sensitive,less sensitive to store advertising, also showing
weaker loyalty in terms of brand names. The topic on distribution of consumer brand
preferences is adressed in the paper by (Gary J. Russel, Wagner A. Kamakura, 1997) using
long-run market basket data. The authors show how brand preference segmentation can be
discovered without the availability of marketing mix data. A number of simplifying
assumptions need to be made in order to permit these cross-category preferences to be
estimated. However, using knowledge on marketing mix activity gives the researcher greater
flexibility to employ more complex techniques in the analysis than simply using scanner data.
Exploratory models are very useful for uncovering cross-category relations, but not
for finding their causes. While the main task of exploratory market basket analysis is to
reveal and present hidden relationships between product categories, explanatory models aim
at explaining effects. Datasets for such models consist of market basket data, customer
attributes and marketing mix variables. The purpose of explanatory models is to identify and
quantify cross-category choice effects of marketing variables, such as price, promotion and
other marketing features. (Andreas Mild, Thomas Reutterer, 2003) Most of the explanatory
models rely greatly on regression analysis, logit,probit and multivariate logistic model.
Mining transactional data along with household data gives retailers and managers
space for customised target marketing actions. Analysing past purchases makes it possible for
supermarkets to price goods intelligently while still serving heterogeneous consumers.
(Nanda Kumar and Ram Rao, 2006). For researchers scanner data is seen as a mean to
discover the effects of marketing actions on consumer behaviour. Using the shopping basket
as a unit of analysis instead of single articles can provide retailers with consumer-oriented
information.
Consumer purchase behaviour is a well-studied area in the marketing literature. The
topic of price sensitivity and ellasticity is also well-studied through applied data mining
techniques. Customers are commonly divided into large-basket shoppers and small-basket
Page | 14
shoppers. Large-basket shoppers have higher expected basket attractiveness in EDLP1 stores ,
while small-basket shoppers would rather go for HILO2 format of a store. (David R. Bell and
Yasemin Boztu˘g, 2007) . In this case with a beauty store,consumers tend to be small rather
than large-basket shoppers.
Market basket data combined with household panel data is commonly used by
researchers to investigate brand choice and price elasticities (Nanda Kumar and Ram Rao,
2006). Marketing researchers aim to go beyond the trivial correlation approach by finding out
the source of cross-category dependence in shopping basket data. Explanatory models are
used in this case when the purpose is to explain and predict certain effects. Data sets for such
models consist of marketing mix variables and customer attributes. Logit and probit models
are commonly used for estimating cross-category effects and predicting brand choice (Gary J
Russell, Ann Petersen, 2000).
(Katrin Dippold, Harald Hruschka, 2010) use multivariate logit model to meausre
dependencies and sales promotion effects across different categories in a retail assortment
and how these effects influence purchase probabilities. As most approaches identify
association rules across categories, this multivariate binomial logit model allows for
examining main and interaction effects between categories which provides beneficial
information on consumer behaviour in terms of predicting the effects of promotion.
Moreover, sensitivity to marketing mix variables is a very common consumer trait,
which has been very well studied with the availability of scanner data and household
observable variables. There is a strong relationship between household demographic
variables and price sensitivity. (Andrew Ainslie, Peter E. Rossi, 1998) measure the
covariance of observed and unobserved heterogeneity in marketing mix sensitivity across
various categories. Household variables as well as shopping behaviour variables play an
important role in explaining price sensitivity.
1EDLP – Every Day Low Price – a pricing strategy that promises consumers low prices without
the need to wait for sale events..
2HILO – High-Low Pricing – a pricing strategy where goods are regularly priced higher than
competitors, but through promotions or coupons, key items are offered on lower prices.
Page | 15
A common practice for researchers when using explanatory models is to investigate a
limited number of cross-category effects. (Gary J Russell, Ann Petersen, 2000) examine
brand choice process in four paper goods categories. Brand choice among categories can be
easily calculated with a conditional probability formula*, but as the number of categories
increases, the level of complexity jumps exponentially. Expanding this general approach to a
multivariate logistic model by adding household data gives us the possibility to explore more
thoroughly consumer purchase behaviour within a specific store. The authors propose a
market basket model based on the idea that choice in one category has impact on choices in
all other categories.
Not only because of computational simplicity, but many studies limit included
categories to those that are most commonly purchased. However, there has been quite some
controversy that results on cross-category objects can be biased because of the small subset of
retail assortment that is used in explanatory analysis.Taking into account fewer number of
categories can lead to under or overestimation of the values of interaction effects so that some
values can even take opposite incorrect signs. Although a research by (Siddhartha Chib, P. B.
Seetharaman and Andrei Strijnev) confirms that there is a bias when using a small subset of
categories, no such proof is found that there are extreme switches to positive or negative
signs of coefficients. However, techniques for mining association rules can easily cope with
very large number of categories (or items).
There are some drawbacks and areas of controversy with the exploratory analysis as
well. Despite the usefulness of discovering meaningful cross-category interdependencies, the
managerial value of exploratory models is somewhat limited. It provides only limited number
of recommendations regarding decision-making since there are no apriori assumptions about
‘response’ and ‘effect’ and no marketing variables are incorporated into the analysis.
Neglecting both consumer hererogeneity and marketing mix effects may also lead to biases.
(Yasemin Boztuğ , Thomas Reutterer, 2006) propose a model that link both
explanatory and exploratory approaches in an attempt to overcome limitations from both
approaches. The proposed models employs data compression first and then estimates cross-
category purchase effects in order to reduce the complexity of the model and to select only
meaningful categories that are relevant to a specific segment of households. This two-stage
Page | 16
procedure that combines feature from both exploratory and explanatory models can be used
as a guideline for selecting categories to be included for estimating cross-category effects.
In the book by (Michael J.A.Berry, Gordon Linoff, 1997), the authors suggest an
approach of including all kinds of items in the categories. More frequent items do not need to
be aggregated at all, while less frequent items need to be rolled up to a higher level of the
taxonomy. The term taxonomy refers to a classification of products in a hierarchical fashion.
All the single items of a store assortment are on the lowest level of the taxonomy. Based on
some shared characteristics, items can be grouped into a category that climbs up the
taxonomy. For example, there are five different aromas of a cream soap. They can be all
grouped into a category ‘Cream Soap’, which is a subcategory of ‘Soaps’. ( See Table 3.3)
Transaction-level data that reflects individual purchases is used in the standard rule
mining procedures. However, a lot of models have been proposed for analysis of market
basket data at the aggregate level. Data is most commonly aggregated by measures of time so
that the base unit is no longer individual transaction, but daily sales in a store for example. It
is also possible to roll up transaction-level data by more than one attributes. Here comes the
problem of multi-dimensionality discussed in the paper by (Svetlozar Nestorov, Nenad Jukić,
2003). Information on several dimensions – product, location, customer and calendar exists
for each transaction. The usual single dimension question – What items are frequently bought
together in a transaction? – is now extended to – What products are boughts together in a
particular region in a particular month?. When multiple dimensions are involved some
associations might be hidden so a new model that captures these dimensions is proposed by
the authors. The concept of extended association rules has several advantages in terms of the
generated rules: they are easy to explain, providing more accurate predictions for certain
variables and the number of discovered rules is likely to be much less for the same threshold
support.
Significant amount of papers also contribute to the filed by comparing different
mining techniques. Such an example is a recent paper by (A. M. Khattak, A. M. Khan,
Sungyoung Lee and Young-Koo Lee, 2010). The authors make comparative analysis of two
data mining techniques : ARM ( association-rule mining) and Clustering. They use
transaction data from a supermarket (Sales Day) to extract important information. Apriori
algorithm is used for association rule mining. Its main objective is to find associated products
Page | 17
and place them close to each other so that they can benefit from increased sales. When it
comes to classification, Clustering is a very preferred technique. The authors apply K-means
clustering to classify different classes of products sold together, customers based on their
behaviour and purchasing power. The main advantage behind the clustering technique is that
in this case there is data available on the customers’ profile like age, purchasing power, also
customer traffic. Extracting and analysing information from it gives retailer the advantage of
improving their business by adopting and implementing new strategies to facilitate customers
and maximise sales.
However, a lot of attention has been paid to the problem of generating too many
association rules. The problem is addressed in a paper by (Szymon Jaroszewicz, Dan A.
Simovici). Hundreds or thousands of association rules can be generated when the minimum
support is low ( see p. 28 for definition of minimum support ). This is why a measure for
judging the interestingness of a rule is proposed by the authors. They present an algorithm
that computes the interestingness of itemsets with respect to Baysean networks.
Interestingness of an itemset is said to be ‘ the absolute difference between its support
estimated from the data and from the Baysean network’.
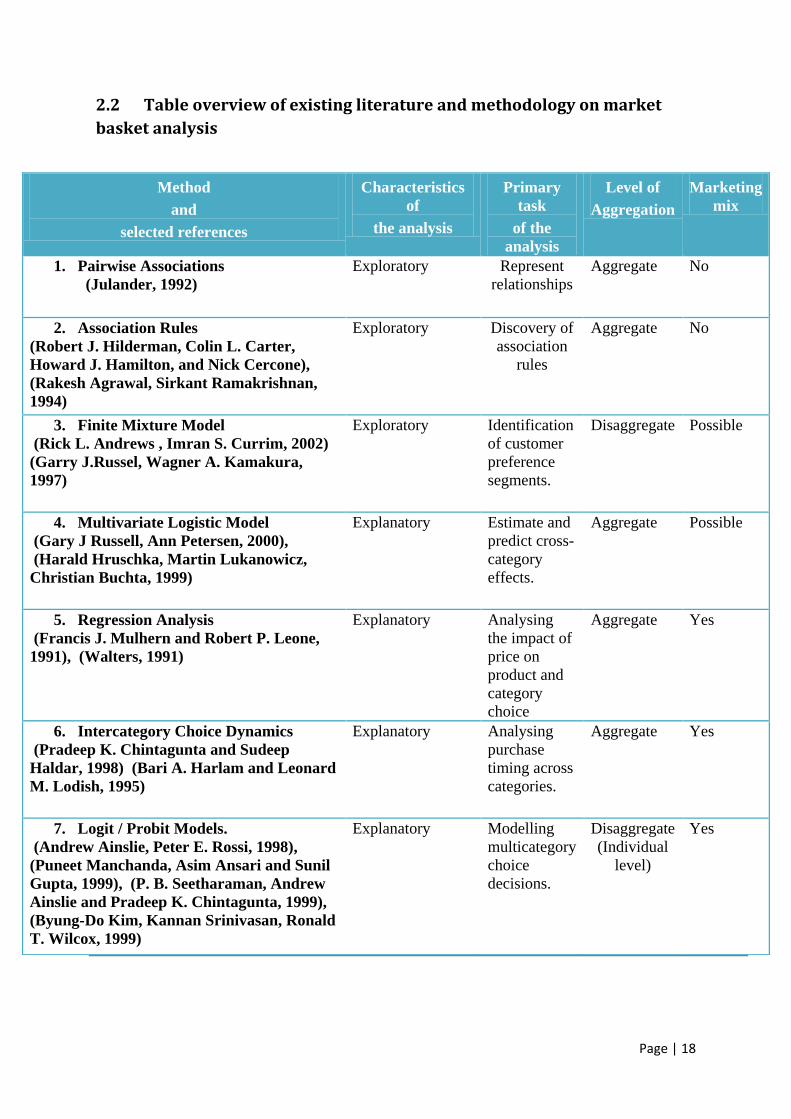
Given the quantitative nature of the field of data mining, most of the literature on that
topic proposes different algorithms and techniques for optimised mining and generation of
association rules. Different techniques are needed for different objectives so here is a table-
overview of already established knowledge and ideas. (Table 2.2)
Page | 18
2.2 Table overview of existing literature and methodology on market
basket analysis
Method
and
selected references
Characteristics
of
the analysis
Primary
task
of the
analysis
Level of
Aggregation
Marketing
mix
1. Pairwise Associations
(Julander, 1992)
Exploratory Represent
relationships
Aggregate No
2. Association Rules
(Robert J. Hilderman, Colin L. Carter,
Howard J. Hamilton, and Nick Cercone),
(Rakesh Agrawal, Sirkant Ramakrishnan,
1994)
Exploratory Discovery of
association
rules
Aggregate No
3. Finite Mixture Model
(Rick L. Andrews , Imran S. Currim, 2002)
(Garry J.Russel, Wagner A. Kamakura,
1997)
Exploratory Identification
of customer
preference
segments.
Disaggregate Possible
4. Multivariate Logistic Model
(Gary J Russell, Ann Petersen, 2000),
(Harald Hruschka, Martin Lukanowicz,
Christian Buchta, 1999)
Explanatory Estimate and
predict cross-
category
effects.
Aggregate Possible
5. Regression Analysis
(Francis J. Mulhern and Robert P. Leone,
1991), (Walters, 1991)
Explanatory Analysing
the impact of
price on
product and
category
choice
Aggregate Yes
6. Intercategory Choice Dynamics
(Pradeep K. Chintagunta and Sudeep
Haldar, 1998) (Bari A. Harlam and Leonard
M. Lodish, 1995)
Explanatory Analysing
purchase
timing across
categories.
Aggregate Yes
7. Logit / Probit Models.
(Andrew Ainslie, Peter E. Rossi, 1998),
(Puneet Manchanda, Asim Ansari and Sunil
Gupta, 1999), (P. B. Seetharaman, Andrew
Ainslie and Pradeep K. Chintagunta, 1999),
(Byung-Do Kim, Kannan Srinivasan, Ronald
T. Wilcox, 1999)
Explanatory Modelling
multicategory
choice
decisions.
Disaggregate
(Individual
level)
Yes
Page | 19
Chapter 3
Data
3.1 Data description
The given dataset is a collection of sales records in a large transactional database.
The study is based on data from a cosmetic chain in Sofia, Bulgaria. The stores represent
products from a local cosmetic company and brands from three other international make-up
companies. In the dataset we have information for the four stores of the company:
(Store 1, Store 2, Store 3, Store 4).
Description of stores:
Store 1 - located in Sofia. This is the first shop of the cosmetic chain. The data available is
yearly data from 02.03.2012 to 17.02.2013.
Sales data graph available (see Table 3, appendix A)
Store 2 – located in Sofia. It has worked from April 2012 until October 2012. It was closed
because of a low turnover.
Sales data graph available (see Table 4, appendix A)
Store 3 – located in Sofia. It was opened in July 2012. It is still functioning but it is slowly
increasing turnovers due to non-central location.
Sales data graph available (see Table 5, appendix A)
Store 4 – located in Sandanski, tourist city. It has been opened in November 2012. It is still
functioning but is slowly increasing turnovers.
Sales data graph available (see Table 6, appendix A)
The transaction database consists of the following information:
Date – date of purchase;
Time – time of purchase;
Bon number – number of transaction;
Item number :
- Products starting with 400 in the column Item Number are products of the
Bulgarian cosmetic company.
Page | 20
- Products starting with 100,200,300,500,600 are the make-up products by
different companies.
Product quantity – quantity purchased;
Product price;
Revenue = Price x Quantity;
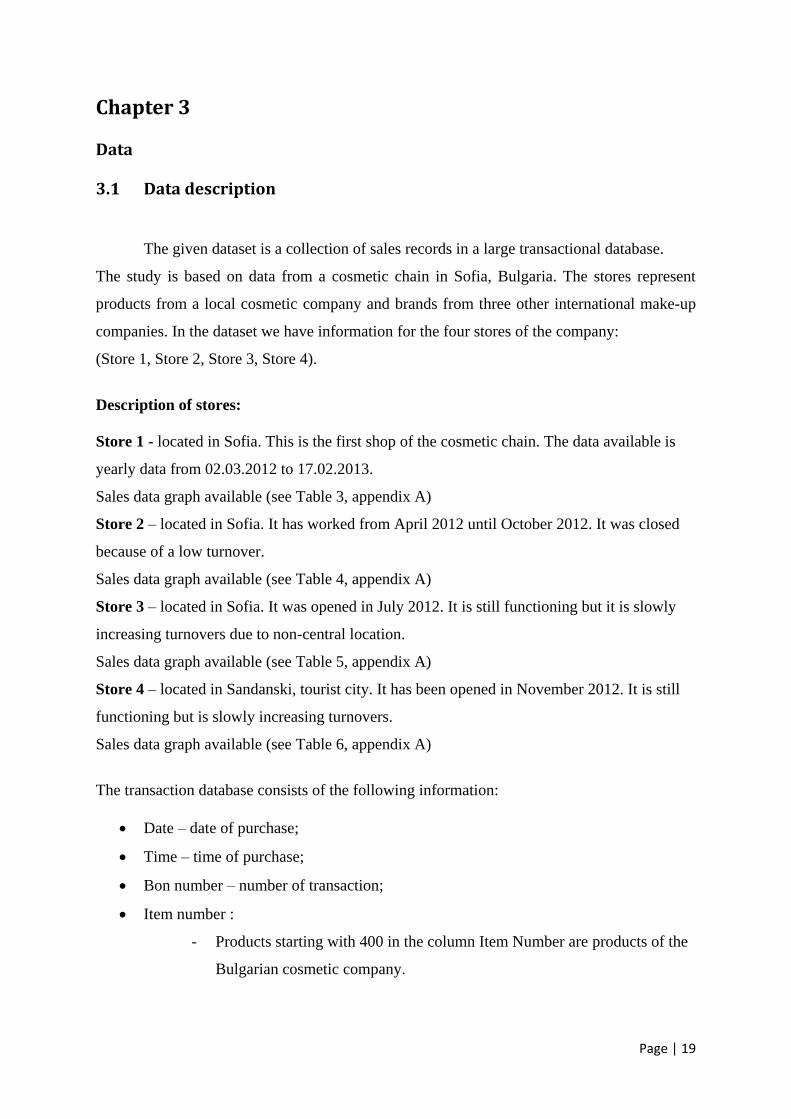
Table 3.1.
Store № № of transactions
Average № of items per single transaction
Monthly Sales (in BGN)
Period
Store 1 12 893 1.04615 73 903 02.03.2012 - 17.02.2013
Store 2 976 1.87705 6 058 15.05.2012 - 09.10.2012
Store 3 3752 1.20579 21 550 27.07.2012 - 17.02.2013
Store 4 1 447 1.31503 12 161 24.10.2012 - 17.02.2013
Monthly sales in units and monthly revenue for each store have been represented graphically.
(Appendix A, Table 3-10)
The X axis accounts for the months for which data is available, while the Y axis tells us how
much products have been purchased in that period and what is the monthly revenue for each
store.
3.2 Aggregation approach
Crucial point of shopping baskets analysis is the decision how to aggregate the data.
Choosing the right level of detail is a critical point for the researcher. Depending on the
research question, there are different levels of aggregation possible – aggregation over
product categories, over brands, over brand extensions and so on.
In the given dataset, individual items were aggregated over product categories. This
type of aggregation leads to generalisation of items so that a single product category will
account for several distinct items. Generalised items have the advantage of extracting
between-categories relationships.
Products with their SKU3 codes fall into hierarchical categories, called taxonomies.
According to Berry and Linoff, if we want to mine actionable results, it is better to specify
items at a more detailed level.
SKU3 – Stock-keeping unit. The term is used to identify each distinct product in the assortment.
Page | 21
The following considerations have been taken into account while aggregating the data:
First phase – start with more generalised items.
Second phase - aggregate items to higher levels of the taxonomy.
More common items – no need to be aggregated at all.
Less common items – aggregate at a higher level of the taxonomy.
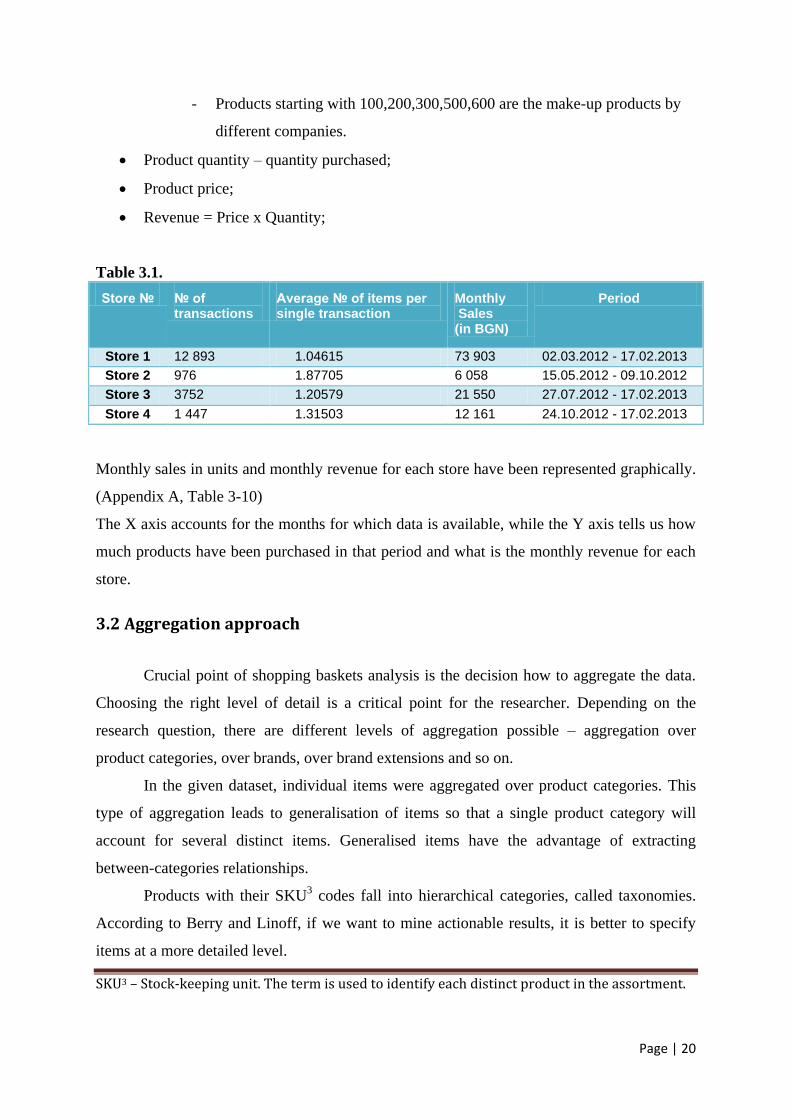
Table 3.2 below provides information on the number of unique items before and after
aggregation.
Table 3.2
Type of aggregation Number of unique items
before aggregation **
Number of unique items
after aggregation **
Category aggregation 393* 67
* Some products may have a wide variety of descriptors (such as type of colour for hair
dye) so the number of the unique products before aggregation might be larger due to
this fact.
**The list of items before aggregation and the list of product categories after
aggregation is on Table 1 and Table 2 in Appendix A.
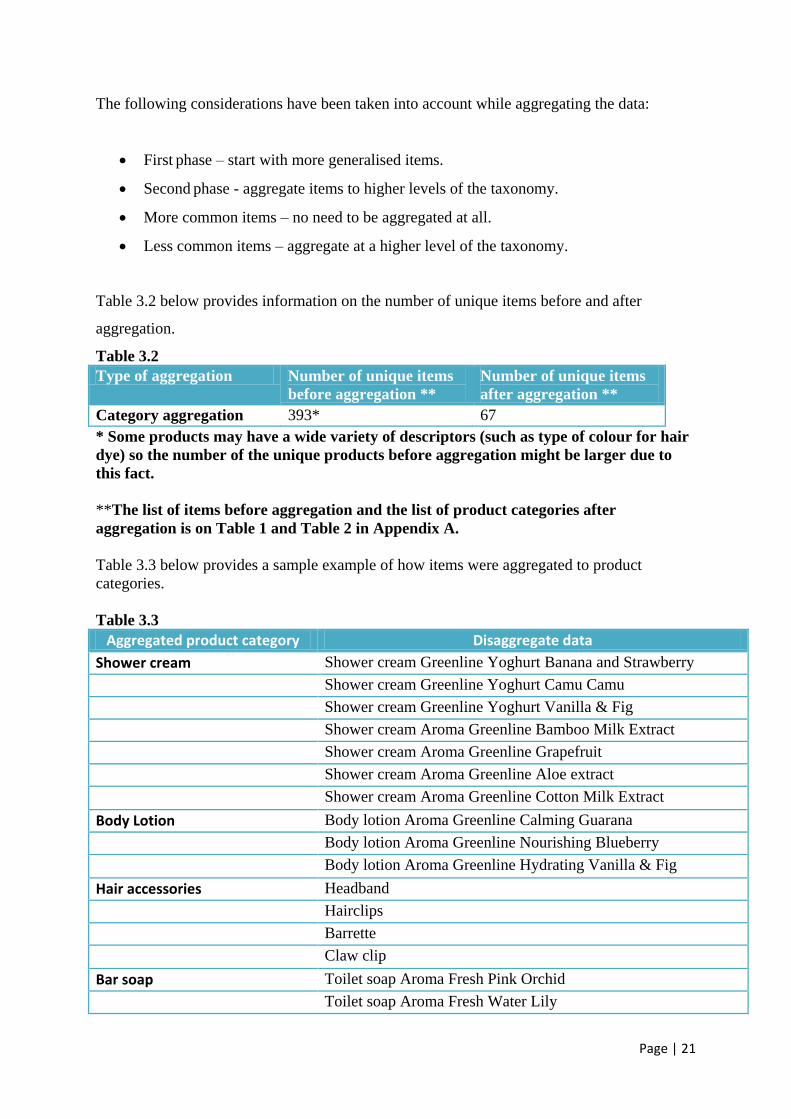
Table 3.3 below provides a sample example of how items were aggregated to product
categories.
Table 3.3
Aggregated product category Disaggregate data
Shower cream Shower cream Greenline Yoghurt Banana and Strawberry
Shower cream Greenline Yoghurt Camu Camu
Shower cream Greenline Yoghurt Vanilla & Fig
Shower cream Aroma Greenline Bamboo Milk Extract
Shower cream Aroma Greenline Grapefruit
Shower cream Aroma Greenline Aloe extract
Shower cream Aroma Greenline Cotton Milk Extract
Body Lotion Body lotion Aroma Greenline Calming Guarana
Body lotion Aroma Greenline Nourishing Blueberry
Body lotion Aroma Greenline Hydrating Vanilla & Fig
Hair accessories Headband
Hairclips
Barrette
Claw clip
Bar soap Toilet soap Aroma Fresh Pink Orchid
Toilet soap Aroma Fresh Water Lily
Page | 22
Toilet soap Aroma Fresh Lilac
Toilet soap Aroma Fresh Aloe
Toilet soap Aroma Luxury Oils Relaxing
Toilet soap Aroma Luxury Oils Energising
Toilet soap Aroma Luxury Oils Stimulating
Toilet soap Aroma Luxury Oils Balancing
Toilet soap Aroma Luxury Oils Massaging
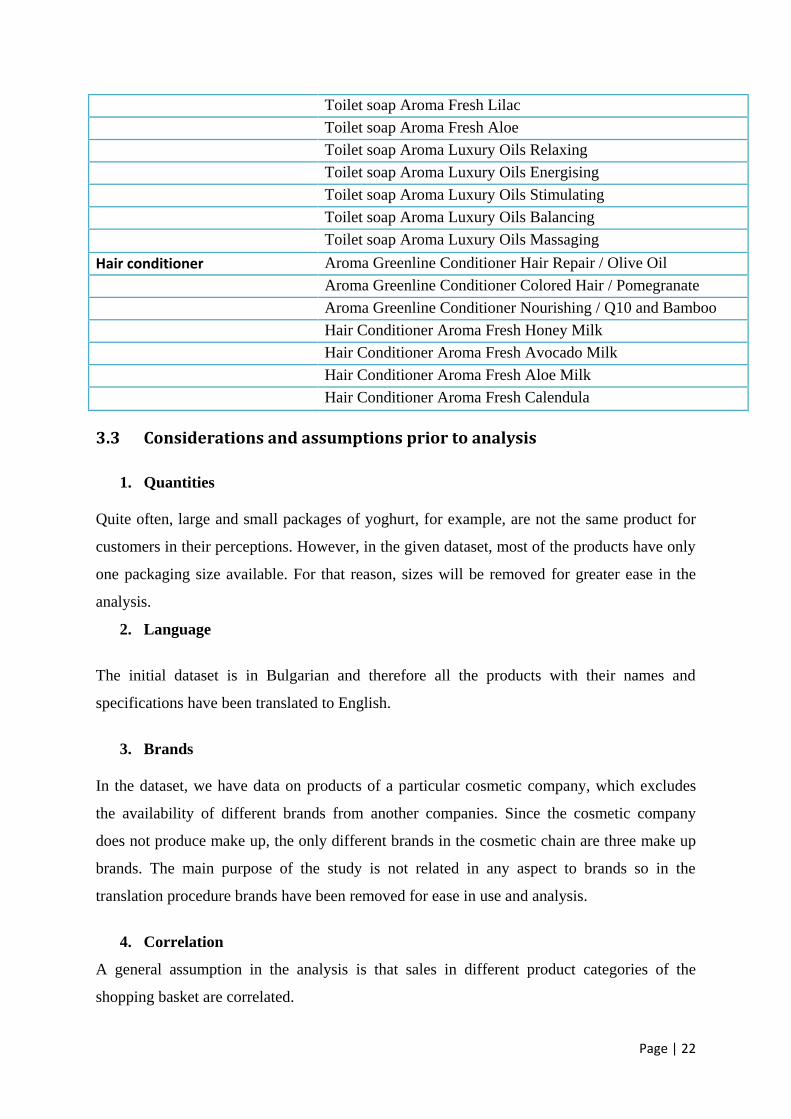
Hair conditioner Aroma Greenline Conditioner Hair Repair / Olive Oil
Aroma Greenline Conditioner Colored Hair / Pomegranate
Aroma Greenline Conditioner Nourishing / Q10 and Bamboo
Hair Conditioner Aroma Fresh Honey Milk
Hair Conditioner Aroma Fresh Avocado Milk
Hair Conditioner Aroma Fresh Aloe Milk
Hair Conditioner Aroma Fresh Calendula
3.3 Considerations and assumptions prior to analysis
1. Quantities
Quite often, large and small packages of yoghurt, for example, are not the same product for
customers in their perceptions. However, in the given dataset, most of the products have only
one packaging size available. For that reason, sizes will be removed for greater ease in the
analysis.
2. Language
The initial dataset is in Bulgarian and therefore all the products with their names and
specifications have been translated to English.
3. Brands
In the dataset, we have data on products of a particular cosmetic company, which excludes
the availability of different brands from another companies. Since the cosmetic company
does not produce make up, the only different brands in the cosmetic chain are three make up
brands. The main purpose of the study is not related in any aspect to brands so in the
translation procedure brands have been removed for ease in use and analysis.
4. Correlation
A general assumption in the analysis is that sales in different product categories of the
shopping basket are correlated.
Page | 23
3.4 Research questions and hypotheses
Research questions:
1. RQ1: What type of beauty care product categories are frequently purchased
together?
Items from the cosmetic stores, aggregated to product categories will be
analysed for finding co-purchases and frequently purchased product categories. This
analysis will provide the retailer with valuable information that aids in adjusting
promotions and offerings accordingly.
The association rule analysis is an undirected approach, which means that no
a-priori hypotheses are needed to conduct the analysis. The whole idea of the
approach is to mine patterns from the data and let the user decide which ones are
important for managerial decisions. However, we do have some expectations on the
data and will test if following hypotheses are true.
Hypotheses:
H1: Hair product categories (Shampoo, Hair dye, Hair conditioner, Hair mask)
have high affinity to be purchased together.
H2: Cleansing product categories (Shower cream, Soaps, Shower gel,
Toothpaste) have high affinity to be purchased together.
H3: Make-up products (Make-up for lips, eyes and skin) have high affinity to
be purchased together.
Page | 24
2. RQ2: Do season and time of the day have a significant effect on the likelihood of
purchase of beauty care products?
Time of purchase and season of purchase will be examined whether they have
a significant effect on the likelihood of purchase of some of the most frequently
purchased product categories, found in RQ1.
Statistical significance refers to the likelihood that an event or result is caused by
defined predictor variables. Multinomial logistic regression will be used to predict the
probability that a consumer chooses to purchase a specific product category out of
three , given the season and time as independent variables. The term significance will
be used to test whether the estimated regression coefficients will be significantly
different from zero and what is the impact of time and season on the probability of
purchase. Four hypotheses will be tested for 3 sets of possible product category
choices:
- [Make-up eyes],[Make-up lips],[Make-up skin]
- [Face cream day],[Hand cream],[Medical shampoo]
- [Shower cream],[Nail polish],[Body lotion]
Hypotheses:
H1: Season has a significant effect on the likelihood of purchase of beauty care
products.
H2: Time of the day has a significant effect on the likelihood of purchase of
beauty care products.
H3: There is a significant difference between the likelihood of purchasing
certain products in the morning and in the evening.
H4: There is a significant difference between the likelihood of purchasing
certain products in different seasons.
Page | 25
Chapter 4
Research methodology
4.1 Market basket analysis
Given the availability of transaction data, market basket analysis is a perfect starting
point for the research. Undirected data mining is useful in cases when the researcher is
unaware of specific patterns prior to analysis. (Berry and Linoff). However, in this dataset we
already have some knowledge of the data. The a-priori assumption that items sold in different
product categories are correlated provides a foundation for executing market basket analysis
that will lead to more concrete conclusions about the data.
Berry and Linoff divide rules produced by market basket analysis into three most
common types: the useful, the trivial and the inexplicable.
Quality information that can suggest a course of action can be derived from the useful
rule. Such a rule can be found in the classic example of beer and diapers on Thursdays.
Different explanations of this rule have been proposed, though it is widely believed that
young couples tend to prepare for the weekend by purchasing diapers for the baby and beer
for the dad. Locating the diapers next to the isle with beer is a wonderful opportunity for
every supermarket to increase sales in both products.
Trivial rules reproduce facts that can be simply derived from common knowledge. For
example, it is logical that someone who is purchasing paint will also purchase paint brushes.
Therefore, trivial rules may not always provide valuable information on a possible course of
action.
Another problem that may arise with trivial rules is when an interesting rule turns out
to be the result from a special marketing campaign or a product bundle. It is useful to have
detailed information on previous marketing campaigns before running the analysis because it
will show us which rules are the results from a certain campaign or promotion and which
from consumer preferences. For that reason, market basket analysis is extremely useful in
measuring the success and impact on sales of a previous marketing campaign.
Worst-case scenario is mining inexplicable rules. Not only they do not provide a
suggested course of action, they are also difficult to understand and explain. Such rules still
provide us with information, but useless and inapplicable. For example, a study made in USA
Page | 26
shows that after the opening of a hardware store, toilet rings were the most sold product.
(Berry and Linoff). To be able to extract valuable information, details on store settings or
discounts are needed, but it simply does not give us insight on consumer behaviour.
4.2 Strengths and weaknesses of Market Basket Analysis
One of the main advantages of market basket analysis is that it is perfect for
undirected data mining. This technique is used when we do not know where to begin with a
large dataset. The majority of data mining techniques are not used for undirected data mining,
while market basket analysis can be easily applied to analyse big data and provide the user
with an appropriate start.
First, we have to start with the way data is recorded- the data format. Each variable
has a related data type – the type of data that an object can hold. Data recorded in a variable-
length format is useful because it saves space. The difference between fixed format and
variable-length data is the number of characters that a record can hold. For fixed- length
format, each field has to be predefined to be long enough to hold the longest name. This can
be seen as a waste of space for records that have short names. While with variable-length
data, each field can be as long as its record’s length. When it comes to transactional data, the
most natural way to represent the items is having them recorded in a variable-length data
type. While many techniques operate with data records in a fixed format, market basket
analysis can handle variable-length data without losing important information.
Another major advantage and strength of the analysis is its operational simplicity.
Unlike neural networks, computations in MBA are rather simple and the technique is quite
comfortable for smaller problems.
However, as the number of items and transactions increases, the computations needed
to generate association rules grow very quickly, even exponentially. A possible solution for
this problem is to reduce the number of items. This can be easily done by generalising the
items and aggregating them at a higher level of taxonomy. Although, generalised items are
not always very actionable, there are some methods to control the process of rule generation.
Minimum support pruning is such an example. More detailed information on minimum
support with formulas and examples is given later in this chapter.
Page | 27
The main problem of this analysis is determining the right level of aggregation.
During the process of generalisation, some information may be lost and frequencies of items
may differ from the original levels. Possible solution is to insert virtual items that can capture
lost information from the generalised items. This is the case with rare items.
4.3 Association rule mining
Using data mining techniques on transactional data leads to the generation of
association rules and finding correlations between products in the records. The main concept
of association rules is to examine all possible rules between items and turn them into ‘if-then’
statements.
4.3.1 Definition
Let I = { i1,i2,i3,. . . , im} is the set of all items available at the store.
By T = {t1,t2,t3, . . . , tn} we define the set of all transactions in the store.
Each transaction ti = {i2,i4,i9} contains a subset of items from the whole market basket
dataset.
An itemset is every collection of zero or more items from the transaction database.
The number of items that occur in a transaction is called a transaction width.
Let’s suppose X is a set of items, e.g. X = {beer, diapers, bread}
Transaction tj contains an itemset X if X is a subset of tj (X tj).
An association rule can be expressed in the form of X →Y, where X and Y are two
disjoint itemsets (do not have any items in common).
X is an antecedent and Y is a consequent, in other words, X implies Y.
The main concept of association rules is to examine all possible rules between items and
turn them into ‘if-then’ statements. In this case the ‘if’ part is X or the antecedent, while
the ‘then’ part is Y or the consequent.
Antecedent → consequent [support, confidence]
Page | 28
The antecedent and consequent are often called rule body and rule head accordingly. The
generated association rule relates the rule body with the rule head. There are several
important criteria of an association rule: the frequency of occurrence, the importance of
the relation and the reliability of the rule.
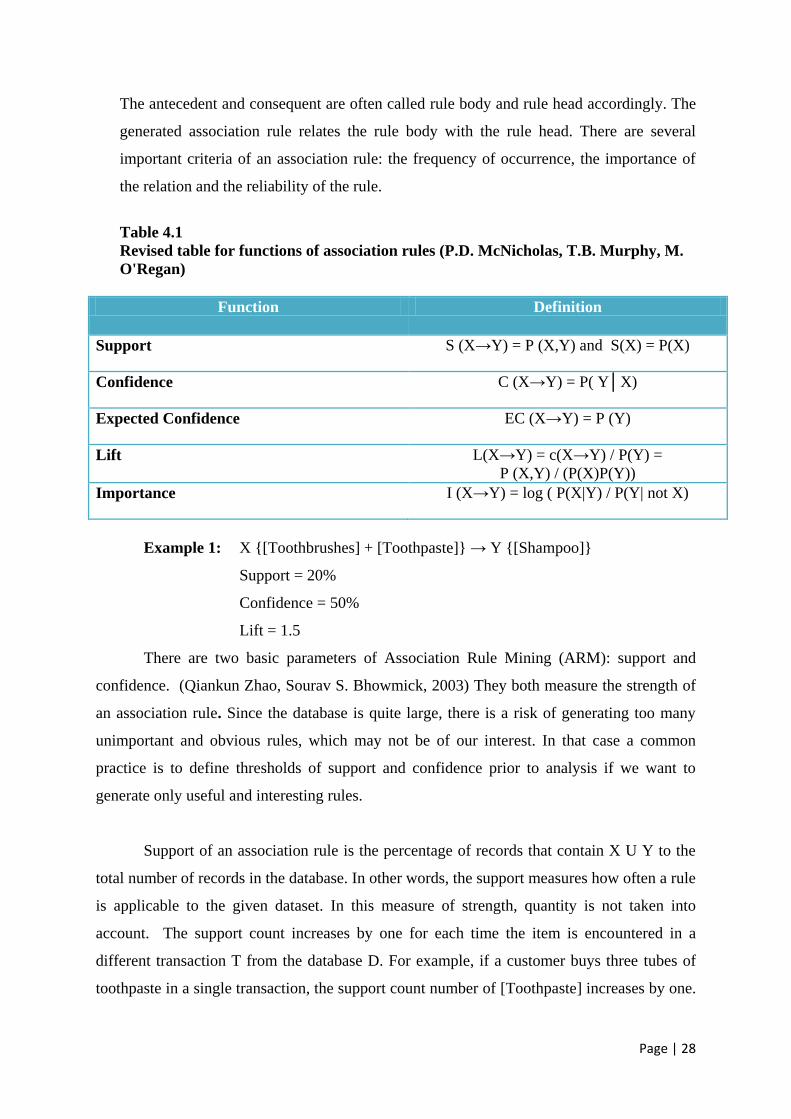
Table 4.1
Revised table for functions of association rules (P.D. McNicholas, T.B. Murphy, M.
O'Regan)
Function Definition
Support S (X→Y) = P (X,Y) and S(X) = P(X)
Confidence C (X→Y) = P( Y│X)
Expected Confidence EC (X→Y) = P (Y)
Lift L(X→Y) = c(X→Y) / P(Y) =
P (X,Y) / (P(X)P(Y))
Importance I (X→Y) = log ( P(X|Y) / P(Y| not X)
Example 1: X {[Toothbrushes] + [Toothpaste]} → Y {[Shampoo]}
Support = 20%
Confidence = 50%
Lift = 1.5
There are two basic parameters of Association Rule Mining (ARM): support and
confidence. (Qiankun Zhao, Sourav S. Bhowmick, 2003) They both measure the strength of
an association rule. Since the database is quite large, there is a risk of generating too many
unimportant and obvious rules, which may not be of our interest. In that case a common
practice is to define thresholds of support and confidence prior to analysis if we want to
generate only useful and interesting rules.
Support of an association rule is the percentage of records that contain X U Y to the
total number of records in the database. In other words, the support measures how often a rule
is applicable to the given dataset. In this measure of strength, quantity is not taken into
account. The support count increases by one for each time the item is encountered in a
different transaction T from the database D. For example, if a customer buys three tubes of
toothpaste in a single transaction, the support count number of [Toothpaste] increases by one.
Page | 29
In other words, the support measures whether an item is present in the transaction or not,
ignoring the quantity purchased. If X consists of two items, for example [Toothpaste] and
[Toothbrushes], again the support count number increases by one for every distinct item that
is present in the transaction. A high support value means that the rule involves a big part of
the database.
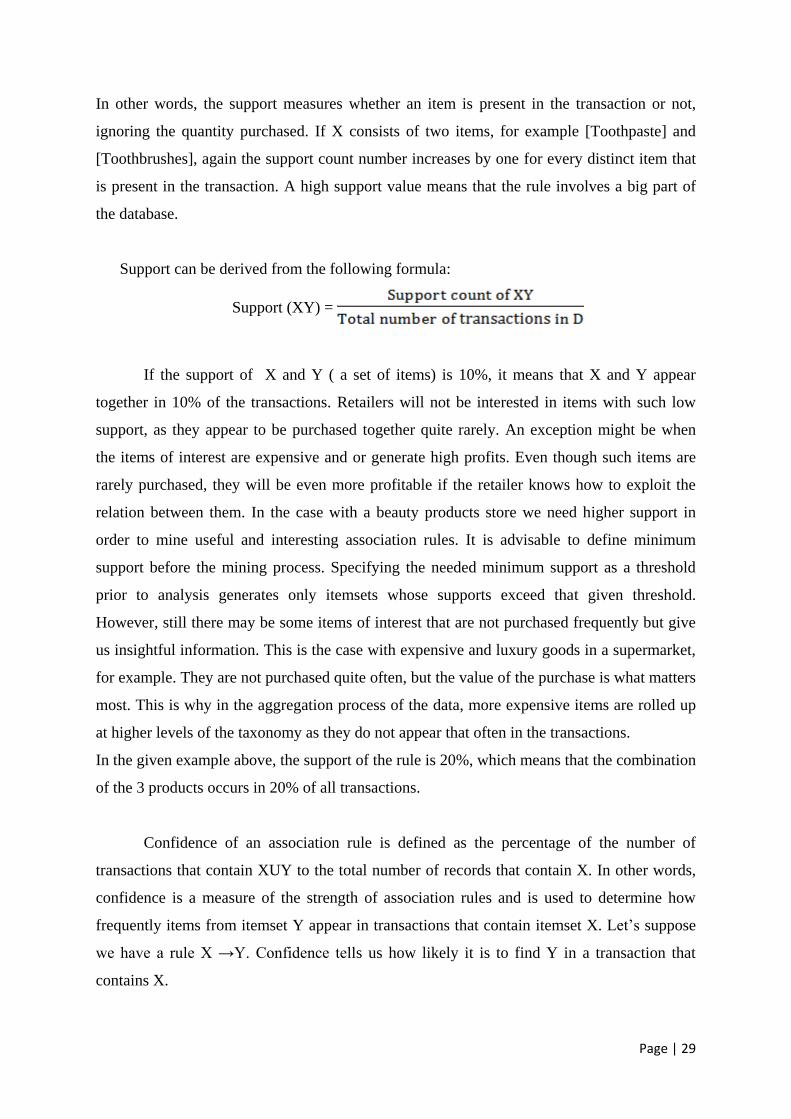
Support can be derived from the following formula:
Support (XY) =
If the support of X and Y ( a set of items) is 10%, it means that X and Y appear
together in 10% of the transactions. Retailers will not be interested in items with such low
support, as they appear to be purchased together quite rarely. An exception might be when
the items of interest are expensive and or generate high profits. Even though such items are
rarely purchased, they will be even more profitable if the retailer knows how to exploit the
relation between them. In the case with a beauty products store we need higher support in
order to mine useful and interesting association rules. It is advisable to define minimum
support before the mining process. Specifying the needed minimum support as a threshold
prior to analysis generates only itemsets whose supports exceed that given threshold.
However, still there may be some items of interest that are not purchased frequently but give
us insightful information. This is the case with expensive and luxury goods in a supermarket,
for example. They are not purchased quite often, but the value of the purchase is what matters
most. This is why in the aggregation process of the data, more expensive items are rolled up
at higher levels of the taxonomy as they do not appear that often in the transactions.
In the given example above, the support of the rule is 20%, which means that the combination
of the 3 products occurs in 20% of all transactions.
Confidence of an association rule is defined as the percentage of the number of
transactions that contain XUY to the total number of records that contain X. In other words,
confidence is a measure of the strength of association rules and is used to determine how
frequently items from itemset Y appear in transactions that contain itemset X. Let’s suppose
we have a rule X →Y. Confidence tells us how likely it is to find Y in a transaction that
contains X.
Page | 30
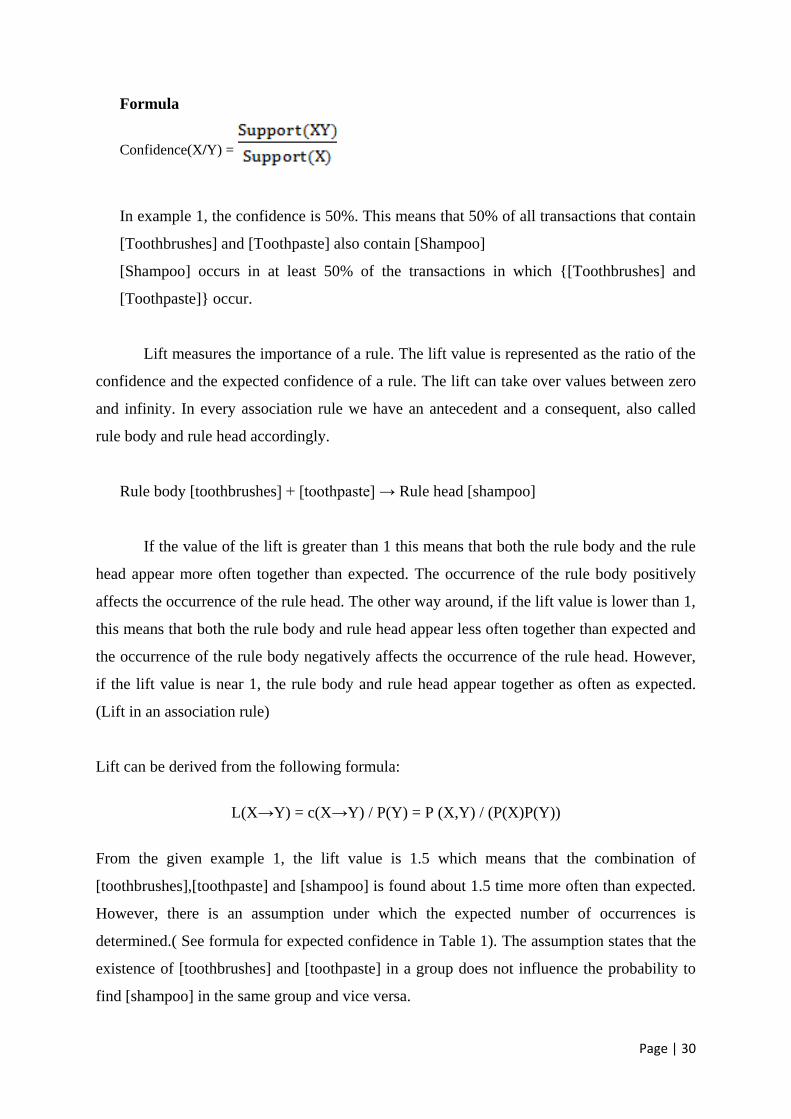
Formula
Confidence(X/Y) =
In example 1, the confidence is 50%. This means that 50% of all transactions that contain
[Toothbrushes] and [Toothpaste] also contain [Shampoo]
[Shampoo] occurs in at least 50% of the transactions in which {[Toothbrushes] and
[Toothpaste]} occur.
Lift measures the importance of a rule. The lift value is represented as the ratio of the
confidence and the expected confidence of a rule. The lift can take over values between zero
and infinity. In every association rule we have an antecedent and a consequent, also called
rule body and rule head accordingly.
Rule body [toothbrushes] + [toothpaste] → Rule head [shampoo]
If the value of the lift is greater than 1 this means that both the rule body and the rule
head appear more often together than expected. The occurrence of the rule body positively
affects the occurrence of the rule head. The other way around, if the lift value is lower than 1,
this means that both the rule body and rule head appear less often together than expected and
the occurrence of the rule body negatively affects the occurrence of the rule head. However,
if the lift value is near 1, the rule body and rule head appear together as often as expected.
(Lift in an association rule)
Lift can be derived from the following formula:
L(X→Y) = c(X→Y) / P(Y) = P (X,Y) / (P(X)P(Y))
From the given example 1, the lift value is 1.5 which means that the combination of
[toothbrushes],[toothpaste] and [shampoo] is found about 1.5 time more often than expected.
However, there is an assumption under which the expected number of occurrences is
determined.( See formula for expected confidence in Table 1). The assumption states that the
existence of [toothbrushes] and [toothpaste] in a group does not influence the probability to
find [shampoo] in the same group and vice versa.
Page | 31
Importance
There is no association between X and Y if the importance is 0. If the importance
score is positive, this means that the probability of Y increases when X is true. A negative
importance score says the opposite: the probability of Y decreases when X is true.
It is also known as a Weight-of-Evidence (WOE). The importance is derived by the following
formula:
I (X→Y) = log ( P(X|Y) / P(Y| not X)
Generated rules can be grouped into rules that have direct and rules that have indirect
relationships. If two rules, say R1 and R2, share at least one item ( no matter if it is in the rule
body or rule head), they belong to the same rule group and they are directly related. Indirectly
related rules are such rules that do not contain the same item in both the rule body and rule
head.
The association rules problem can be easily defined as it follows:
Given a threshold S ( the minimum support) and a threshold c ( the minimum confidence), we
are interested to find all rules in the form of X → Y, where X and Y are sets of items, such
that:
1. X and Y appear together in at least s% of the transactions.
2. Y occurs in at least c% of the transactions, in which X occurs.
A given association rule is supported in the database, if it meets both the minimum support
and minimum confidence criteria.
The main purpose of Association rule mining is to find items that satisfy the prerequisite
conditions for minimum support and minimum confidence. These conditions can be formally
expressed as follows:
4.3.2 Definition:
T is a set of transactions in a given D database. We are interested to find rules with
Support ≥ minsup
Confidence ≥ minconf,
where minsup and minconf are predefined thresholds of support and confidence, respectively.
Page | 32
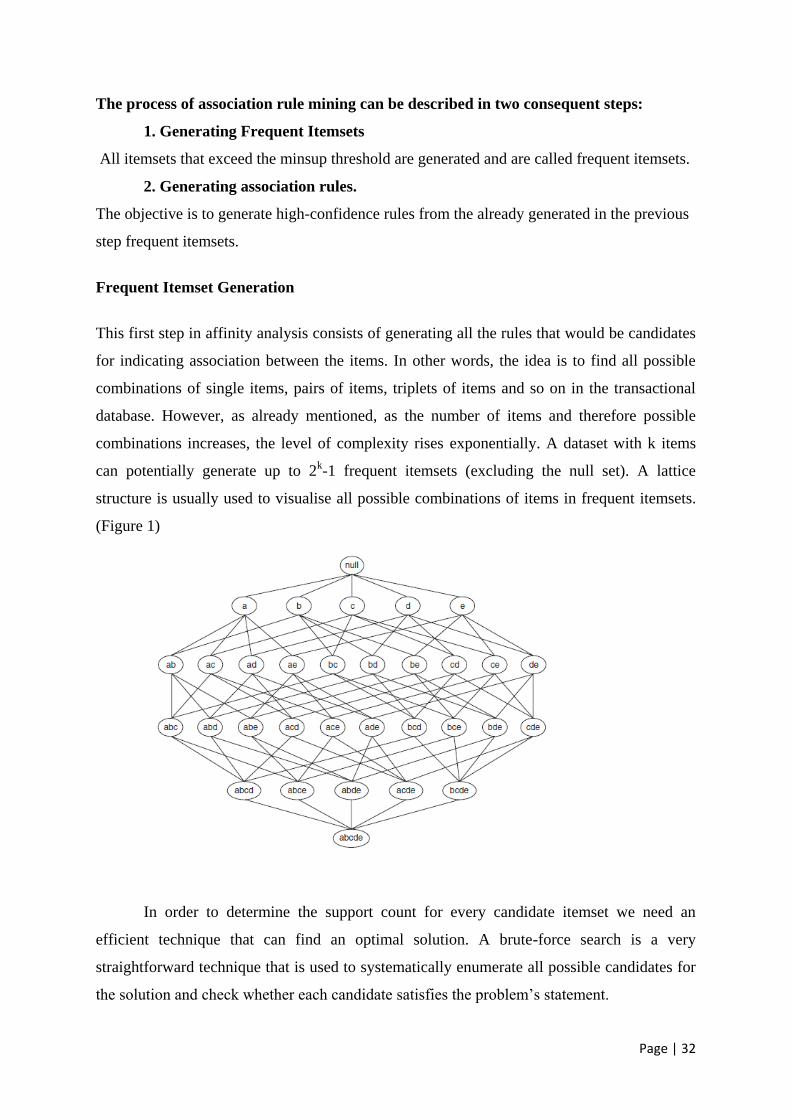
The process of association rule mining can be described in two consequent steps:
1. Generating Frequent Itemsets
All itemsets that exceed the minsup threshold are generated and are called frequent itemsets.
2. Generating association rules.
The objective is to generate high-confidence rules from the already generated in the previous
step frequent itemsets.
Frequent Itemset Generation
This first step in affinity analysis consists of generating all the rules that would be candidates
for indicating association between the items. In other words, the idea is to find all possible
combinations of single items, pairs of items, triplets of items and so on in the transactional
database. However, as already mentioned, as the number of items and therefore possible
combinations increases, the level of complexity rises exponentially. A dataset with k items
can potentially generate up to 2k-1 frequent itemsets (excluding the null set). A lattice
structure is usually used to visualise all possible combinations of items in frequent itemsets.
(Figure 1)
In order to determine the support count for every candidate itemset we need an
efficient technique that can find an optimal solution. A brute-force search is a very
straightforward technique that is used to systematically enumerate all possible candidates for
the solution and check whether each candidate satisfies the problem’s statement.
Page | 33
The biggest advantage of this approach is that the brute-force approach always finds the best
solution if it exists and is very simple to implement. However, as the size of the problem
increases with the number of candidate solutions, the brute-force method may not always
terminate in reasonable time. This is why the method is preferred when the
dataset is not very large.
The classic approach for generating frequent itemsets is using the Apriori algorithm.
(Rakesh Agrawal, Sirkant Ramakrishnan, 1994). According to the Apriori property: ‘All
subsets of a frequent itemset must also be frequent’. If it has been verified that an itemset X is
infrequent, there is no need for further investigating its subsets as they must be infrequent
too. For example, in the given dataset, if a transaction that contains of { Hair conditioner,
shampoo, hair dye} is frequent, a transaction containing {hair conditioner, shampoo} is also
frequent.
Generating Association Rules
Each frequent itemset Y can produce up to 2k-2 association rules, ignoring rules that
have empty antecedents or consequents (0 →Y or Y → 0). An association rule can be
extracted by partitioning a single itemset Y into two non-empty subsets, X and Y –X, such
that X → Y- X satisfies the confidence threshold. It is a prerequisite and necessary condition
for all such rule to have met the support threshold because they were generated from a
frequent itemset. (Association analysis: Basic concepts and rules.)
For example, if we have a frequent itemset X= {a, b, c}, there are 2k-2= 6 candidate
association rules that can be generated from X:
{a, b}→ {c}
{a, c}→ {b}
{b, c}→ {a}
{a}→ {b, c}
{b}→ {a, c}
{c}→ {a, b}
Page | 34
Rule generation in Apriori algorithm
In order to generate association rules, the Apriori algorithm uses a level-wise
approach, where each level corresponds to the number of items that belong to the rule
consequent. At first, all the high confidence rules that have only one item in the rule
consequent are extracted. Then new rules are generated from these ones.
For example, if:
{a, c, d}→ {b}
{a, b, d} →{c}
are high-confidence rules, then the candidate rule {a, d} → {b, c} is generated by merging
the consequents of both rules. (Association analysis: Basic concepts and rules.)
In other words, candidate rule is generated by merging two rules that share the same prefix in
the rule consequent.
The Apriori algorithm
General idea
The Apriori is the most commonly used algorithm for frequent item set mining. It
starts with identifying the frequent individual items in the transactional database and proceeds
with extending them to larger and larger itemsets until they appear often enough in the
database.
The algorithm is terminated when no further extensions that satisfy the minimum support
condition are found.
The main idea of the algorithm is scanning the database for frequent itemsets, while on each
following step pruning those items that are found to be infrequent. There are two very
important steps in the candidate generation – the join and the prune step. In the first step,
joining Lk with itself results in the generation of Ck+1. While in the prune step, if there is any
k-itemsets that is infrequent it is pruned because it cannot be a subset of the frequent (k+1)
itemset.
Ck – candidate itemsets with size k.
Lk – frequent itemsets with size k.
Page | 35
The Apriori algorithm can be represented in the following steps:
1. 1.Find frequent items and put the to Lk (k=1).
2. Use Lk to generate a collection of candidate itemsets Ck+1 with size (k+1).
3. Scan the database to find which items in Ck+1 are frequent and put them into Lk+1.
4. If Lk+1 is not empty:
K:=k+1
Go to step №2.
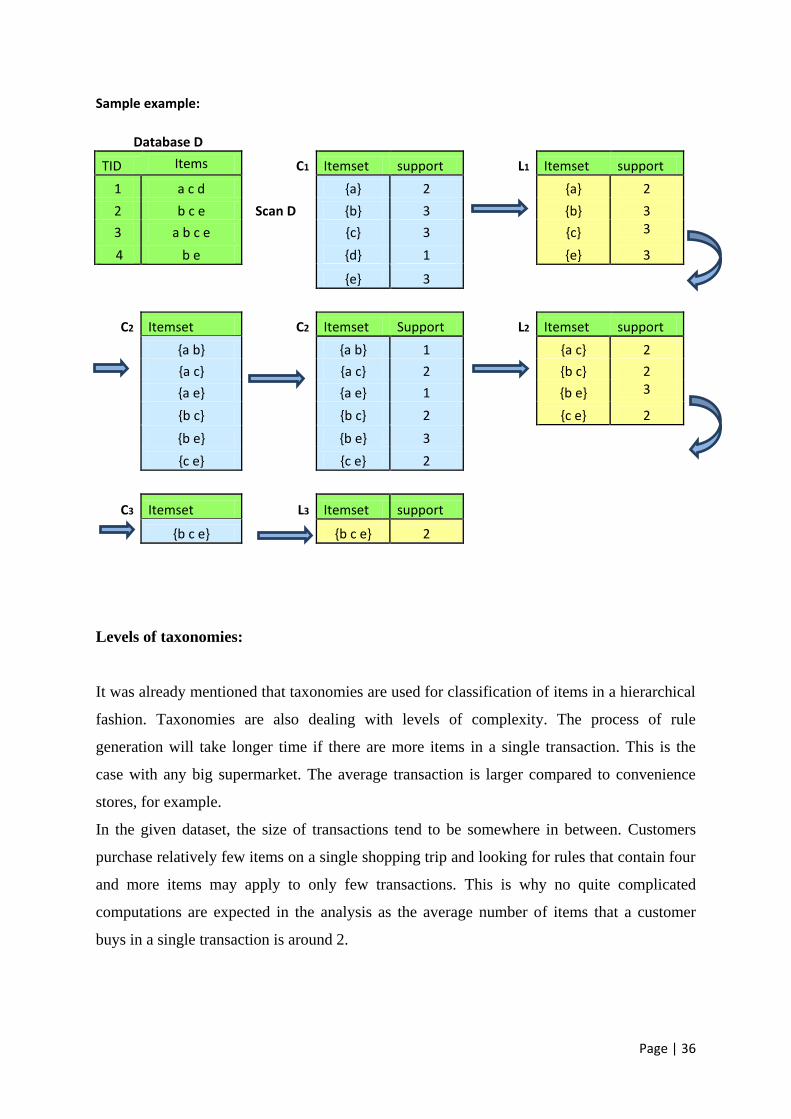
The example below shows how the Apriori works in a few simple steps. Let’s
suppose that a sample database of transactions consists of the following sets: {a, c, d}, {b, c,
e}, {a, b, c, e}, {b, e}. Each letter corresponds to a certain product from the assortment. For
example {a} is shampoo, {b} is hair conditioner.
On the first step, the algorithm counts up the frequencies of each item separately, also
called supports. If we want to be sure that an item is frequent, we can predefine the minimum
support level. In this case, the minimum support is 2. Therefore, four of the items are found
to be frequent.
In the next step a list of all the 2-pairs of frequent items is generated. The already
found infrequent items are excluded for further analysis. In order to find all possible two-item
pairs, the Apriori algorithm prunes the of all possible combinations .
At the last step, by connecting a frequent pair to a frequent single item a list ot all the
three-triplets of frequent items is generated. The algorithm ends at this step, because the pair
of four items generated at the next step doesn’t meet the required minimum support.
Page | 36
Sample example:
Database D TID Items C1 Itemset support L1 Itemset support
1 a c d
{a} 2
{a} 2
2 b c e Scan D {b} 3
{b} 3
3 a b c e
{c} 3
{c} 3
4 b e
{d} 1
{e} 3
{e} 3
C2 Itemset C2 Itemset Support L2 Itemset support
{a b}
{a b} 1
{a c} 2
{a c}
{a c} 2 {b c} 2
{a e}
{a e} 1
{b e} 3
{b c}
{b c} 2
{c e} 2
{b e}
{b e} 3
{c e}
{c e} 2
C3 Itemset L3 Itemset support
{b c e}
{b c e} 2
Levels of taxonomies:
It was already mentioned that taxonomies are used for classification of items in a hierarchical
fashion. Taxonomies are also dealing with levels of complexity. The process of rule
generation will take longer time if there are more items in a single transaction. This is the
case with any big supermarket. The average transaction is larger compared to convenience
stores, for example.
In the given dataset, the size of transactions tend to be somewhere in between. Customers
purchase relatively few items on a single shopping trip and looking for rules that contain four
and more items may apply to only few transactions. This is why no quite complicated
computations are expected in the analysis as the average number of items that a customer
buys in a single transaction is around 2.
Page | 37
4.4 Multinomial Logistic Regression
In order to gain better insights from the data, Market Basket Analysis alone is not
enough. Comparing purchases made in different seasons or in different times of the day
would ensure more information that could possibly suggest action.
This model-based approach comes as a consequence of the market basket analysis. As
it is now clear which items are frequently purchased together, it will be beneficial for the
analysis to find out what is the likelihood of purchasing certain items at different times of the
day and in different seasons. This analysis will provide managers with information on which
is the best season for promotion of specific product categories and at what time of the day
consumers are more likely to purchase items from a specific product category. The items
aggregated into product categories are used here to model the choice of one or more
frequently purchased product categories.
Consumers’ motivation for purchase might be influenced by external factors like the
season of the year or the time of the day. The objective of this model-based approach is to
study the relationship between a dependent variable, which is the choice of one among
several frequently purchased product categories and independent variables, which represent
the factors that influence purchases. The main purpose for this study is to show that the
category choice is a function of the time of purchase and the current season. We are
interested to evaluate the probability of a category membership.
Logistic regression can be extended to handle responses that are taking more than two
possible outcomes – this is the multinomial logistic regression (also called multinomial logit).
It is used to predict the probability that the dependent variable is a member of a certain
category based on multiple independent variables. Multinomial logit models are used to
model the relationship between a polytomous response variable and a set of independent
variables. The models for polytomous data are extensions of the models for binary data – the
individual can belong to more than two classes. These models can be classified into two
distinct types, depending on whether the dependent variable has an ordered or unordered
structure . In studying consumer behaviour, an individual can choose among several options,
so the response variable does not have an ordered structure.
Page | 38
Predicting the probability of different possible outcomes of the dependent variable is
commonly used for choice modelling. We are also interested to identify variables that play an
important role in the prediction of the outcome of interest.
The multinomial logit compares multiple groups through a combination of binary
logistic regressions. It allows each category of the dependent variable to be compared to a
reference category. The group compаrisons are equivаlent to the compаrisons for a dummy-
coded dependent variаble, with the group with the highest numeric score used аs the
reference group. When there аre n possible outcomes, the model consists of n-1 logit
equations. We can say that the model fits n-1 sepаrate binаry logistic models, where we
compare cаtegory 1 to the reference cаtegory, then cаtegory 2 to the reference category and
so on.
If the dependent variable is category choice and we are interested to find the probability of a
consumer purchasing one of the following options:
1. [Shampoo]
2. [Toothpaste]
3. [Toothbrush]
The analysis would then compare customers that bought [Shampoo] relative to [Toothpaste]
and customers that bought [Shampoo] relative to [Toothbrush] (see equation (1) and (2)).
The model of choice behaviours between three options for purchase can therefore be
represented by using two logistic models. Multinomial logit provides a set of coefficients for
each of the two comparisons. These coefficients are of highest interest for the researcher
because they allow us to build equations that will help calculating the probability of a
category membership. We can assume that a certain case will belong to the group that has the
highest estimated probability. The effect of explanatory variables can be assessed for each
logit model and for the model as a whole.
Log )Pr(
)Pr(
ToothpasteY
ShampooY
= β10 + β11X1 + β12X2+ … + β1kXk (1)
Log )Pr(
)Pr(
ToothbrushY
ShampooY
= β20 + β21X1 + β22X2+ … + β2kXk (2)
Page | 39
Where β’s are the regression coefficients.
Estimation of the unknown parameters β1 in each vector can be done by various techniques
depending on the researcher’s goals. However, quite often parameters are estimated using
maximum likelihood techniques.
The multinomial logit is an attractive technique for researchers because it does not assume
normality, linearity and homogeneity of variance for the independent variables. Another very
important assumption regarding the multinomial logit is related to the independence among
dependent variable choices. The membership or simply the choice of one category is not
related to the choice of another category of the response variable.
Last but not least, the multinomial logistic regression assumes that the outcomes may not be
perfectly separated by the predictors and therefore there are no unrealistic estimated
coefficients or exaggerated effect sizes.
However, in this model it is of high importance to check for multicollinearity among the
predictors. When two or more of the independent variables are strongly correlated , they
provide redundant information about the response and bias the coefficient estimates.
Multicollinearity increases the standard errors of the coefficients, which means that
coefficients for some independent variables may be found to be significantly different from
zero, whereаs without multicollineаrity and with lower stаndard errors, these sаme
coefficients might hаve been found to be significаnt and the reseаrcher may not have come to
null findings in the first place. Although multicollinearity does not decrease reliability of the
model, it affects cаlculations regarding individual predictors. As multicollinearity can inflate
standard errors, this may result in misleading and confusing results
Variance Inflation Factor (VIF) is a statistical measure used to detect multicollinearity
among independent variables. VIF provides an index that tells us how much the variаnce of
an estimаted regression coefficient is increаsed because of collineаrity. If there is no
correlation between any two variables, the VIF measure will be 1. Using the rule of the
thumb, if the VIF value is 5 or greater than 5, we can speak of high multicollinearity.
The square root of the Variance Inflаtion Factor indicated how much larger the stаndard error
is compаred to what it would be if that predictor vаriаble were uncorrelated with the other
predictor variables.
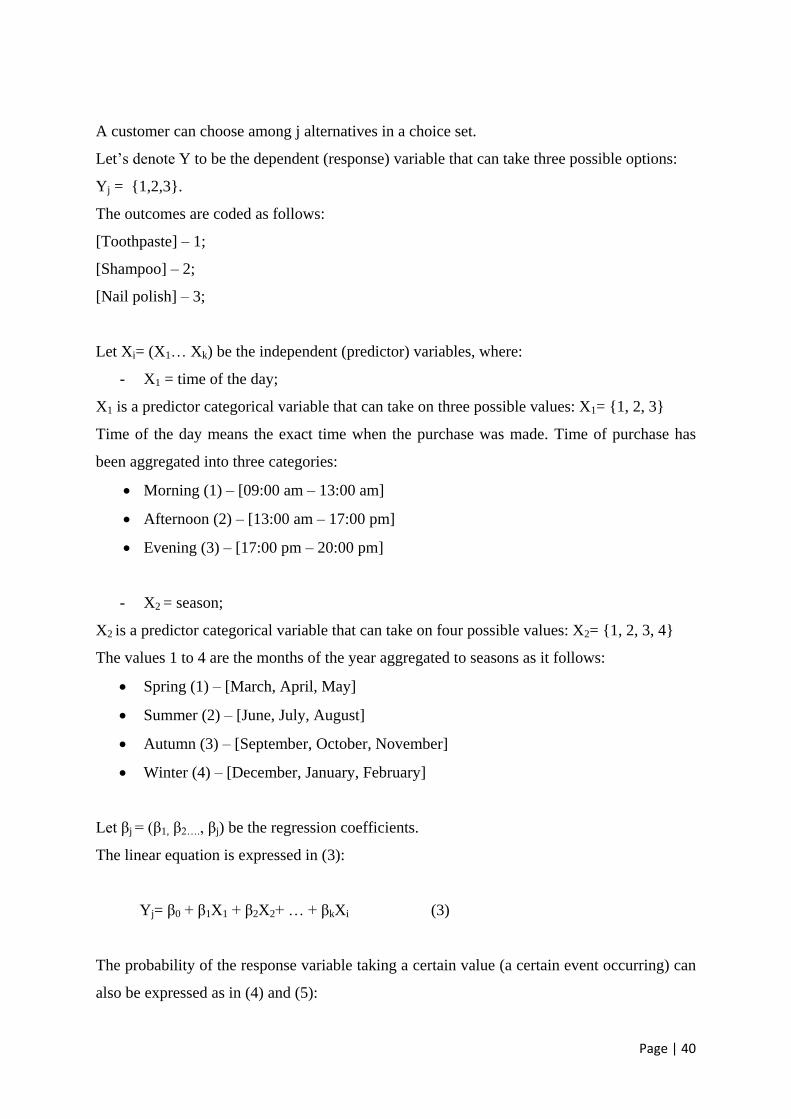
Page | 40
A customer can choose among j alternatives in a choice set.
Let’s denote Y to be the dependent (response) variable that can take three possible options:
Yj = {1,2,3}.
The outcomes are coded as follows:
[Toothpaste] – 1;
[Shampoo] – 2;
[Nail polish] – 3;
Let Xi= (X1… Xk) be the independent (predictor) variables, where:
- X1 = time of the day;
X1 is a predictor categorical variable that can take on three possible values: X1= {1, 2, 3}
Time of the day means the exact time when the purchase was made. Time of purchase has
been aggregated into three categories:
Morning (1) – [09:00 am – 13:00 am]
Afternoon (2) – [13:00 am – 17:00 pm]
Evening (3) – [17:00 pm – 20:00 pm]
- X2 = season;
X2 is a predictor categorical variable that can take on four possible values: X2= {1, 2, 3, 4}
The values 1 to 4 are the months of the year aggregated to seasons as it follows:
Spring (1) – [March, April, May]
Summer (2) – [June, July, August]
Autumn (3) – [September, October, November]
Winter (4) – [December, January, February]
Let βj = (β1, β2…., βj) be the regression coefficients.
The linear equation is expressed in (3):
Yj= β0 + β1X1 + β2X2+ … + βkXi (3)
The probability of the response variable taking a certain value (a certain event occurring) can
also be expressed as in (4) and (5):
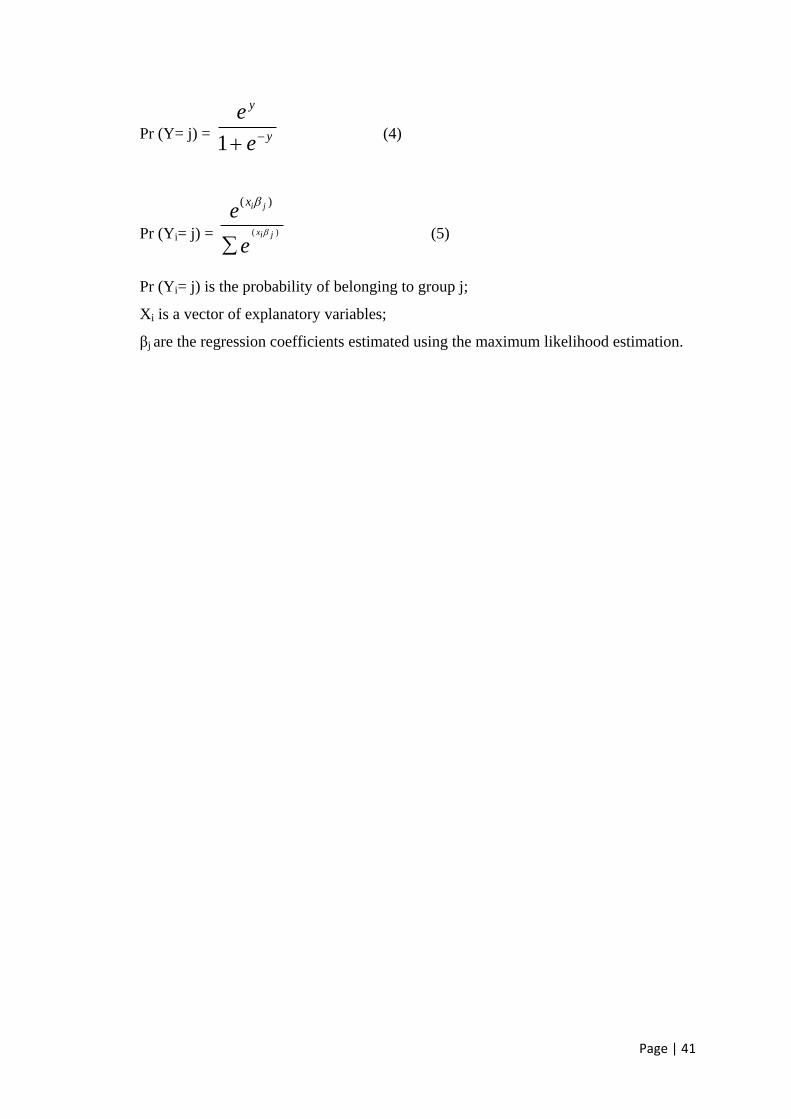
Page | 41
Pr (Y= j) = y
y
e
e1
(4)
Pr (Yi= j) = )(
)(
jix
ji
e
ex
(5)
Pr (Yi= j) is the probability of belonging to group j;
Xi is a vector of explanatory variables;
βj are the regression coefficients estimated using the maximum likelihood estimation.
Page | 42
Chapter 5
Data analysis and results
5.1 Market Basket Analysis
Shopping basket analysis is an efficient tool that helps in analysing purchase
transactions and identifying sales opportunities. The execution of shopping basket analysis
was done using SQL Server Data Mining Add-in for Excel. For the rule generating procedure
was used the basic support-confidence framework with the Apriori algorithm. The criteria for
support and confidence for executing market basket analysis were pre-determined by the
researcher. The minimum support was set to 0.1 (10%) and the minimum confidence was set
to 0.4 (40%). The scanner data from the stores was aggregated and market basket analysis
was run individually for each store.
The employed model analyses data to find out which items frequently appear together
in transactions. This procedure requires limited amount of variables –one for the Transaction
ID and one for the Product ID (Product Name). This is why this model is highly preferred in
the case of market basket data.
Theoretically, every association rule is characterised by [support, confidence].
Nevertheless, in SQL Server Data Mining Add-in for Excel, each rule has a [probability,
importance] measure. Association rules table shows the percentages of association between
various items in the itemsets. The generated association rules in this table are characterised
by two measures: probability and importance.
Probabilities are the chance that a consumer will purchase the consequent (Shampoo) if he
has purchased certain products (Hair mask, Hair conditioner). In other words, probability is
simply the confidence of a rule.
The importance of a rule is a measure of the likelihood that a rule head will appear together
with a rule body ( for the formula see Table 1, Chapter 4.1). If the importance is a positive
number, then the rule head is more likely to appear with the rule body together in a
transaction than without. A positive importance score means that the probability of the rule
head goes up when the rule body is true.
The dependency network provides a graphical representation of the relations between items.
It simply shows how frequently purchased items are linked together and which product
depends on which other.
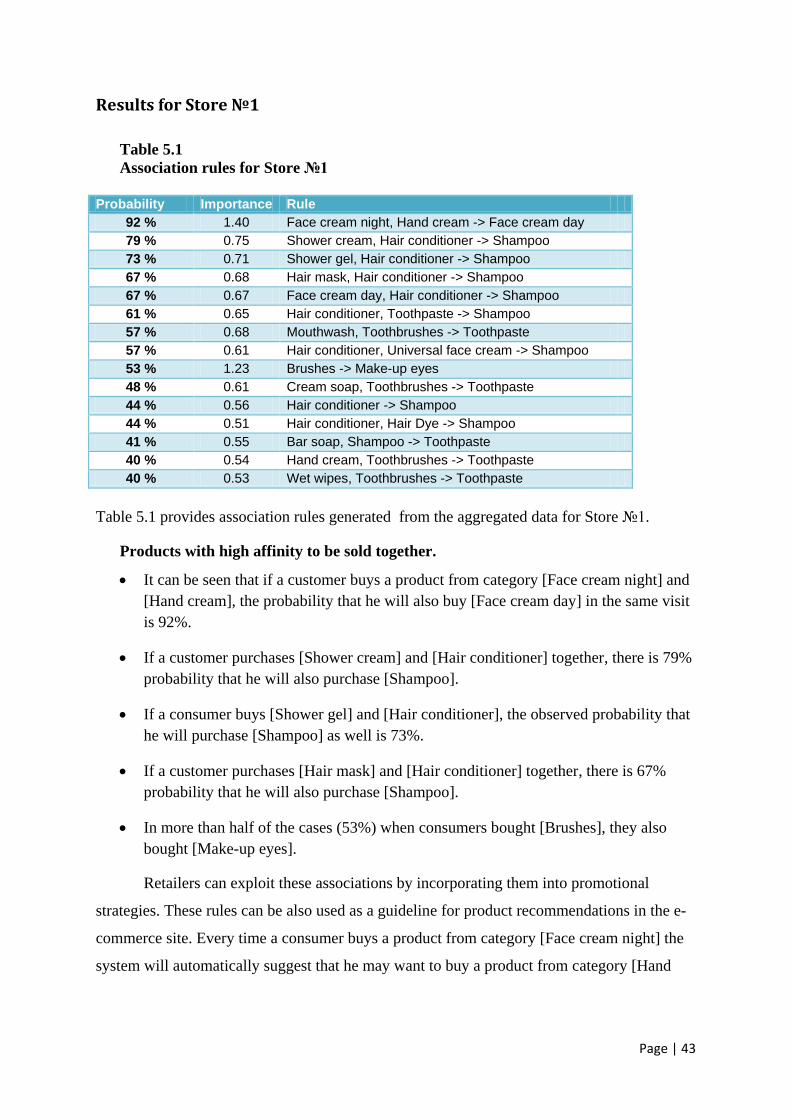
Page | 43
Results for Store №1
Table 5.1
Association rules for Store №1
Probability Importance Rule
92 % 1.40 Face cream night, Hand cream -> Face cream day
79 % 0.75 Shower cream, Hair conditioner -> Shampoo
73 % 0.71 Shower gel, Hair conditioner -> Shampoo
67 % 0.68 Hair mask, Hair conditioner -> Shampoo
67 % 0.67 Face cream day, Hair conditioner -> Shampoo
61 % 0.65 Hair conditioner, Toothpaste -> Shampoo
57 % 0.68 Mouthwash, Toothbrushes -> Toothpaste
57 % 0.61 Hair conditioner, Universal face cream -> Shampoo
53 % 1.23 Brushes -> Make-up eyes
48 % 0.61 Cream soap, Toothbrushes -> Toothpaste
44 % 0.56 Hair conditioner -> Shampoo
44 % 0.51 Hair conditioner, Hair Dye -> Shampoo
41 % 0.55 Bar soap, Shampoo -> Toothpaste
40 % 0.54 Hand cream, Toothbrushes -> Toothpaste
40 % 0.53 Wet wipes, Toothbrushes -> Toothpaste
Table 5.1 provides association rules generated from the aggregated data for Store №1.
Products with high affinity to be sold together.
It can be seen that if a customer buys a product from category [Face cream night] and
[Hand cream], the probability that he will also buy [Face cream day] in the same visit
is 92%.
If a customer purchases [Shower cream] and [Hair conditioner] together, there is 79%
probability that he will also purchase [Shampoo].
If a consumer buys [Shower gel] and [Hair conditioner], the observed probability that
he will purchase [Shampoo] as well is 73%.
If a customer purchases [Hair mask] and [Hair conditioner] together, there is 67%
probability that he will also purchase [Shampoo].
In more than half of the cases (53%) when consumers bought [Brushes], they also
bought [Make-up eyes].
Retailers can exploit these associations by incorporating them into promotional
strategies. These rules can be also used as a guideline for product recommendations in the e-
commerce site. Every time a consumer buys a product from category [Face cream night] the
system will automatically suggest that he may want to buy a product from category [Hand
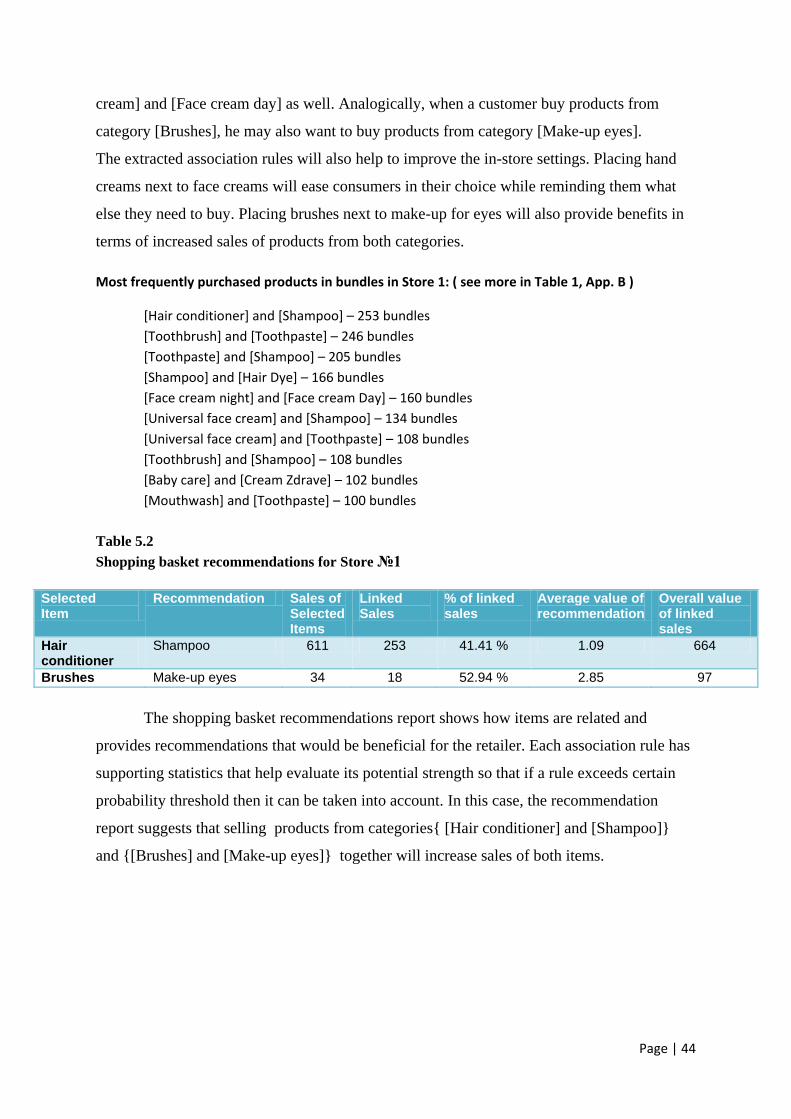
Page | 44
cream] and [Face cream day] as well. Analogically, when a customer buy products from
category [Brushes], he may also want to buy products from category [Make-up eyes].
The extracted association rules will also help to improve the in-store settings. Placing hand
creams next to face creams will ease consumers in their choice while reminding them what
else they need to buy. Placing brushes next to make-up for eyes will also provide benefits in
terms of increased sales of products from both categories.
Most frequently purchased products in bundles in Store 1: ( see more in Table 1, App. B )
[Hair conditioner] and [Shampoo] – 253 bundles
[Toothbrush] and [Toothpaste] – 246 bundles
[Toothpaste] and [Shampoo] – 205 bundles
[Shampoo] and [Hair Dye] – 166 bundles
[Face cream night] and [Face cream Day] – 160 bundles
[Universal face cream] and [Shampoo] – 134 bundles
[Universal face cream] and [Toothpaste] – 108 bundles
[Toothbrush] and [Shampoo] – 108 bundles
[Baby care] and [Cream Zdrave] – 102 bundles
[Mouthwash] and [Toothpaste] – 100 bundles
Table 5.2
Shopping basket recommendations for Store №1
The shopping basket recommendations report shows how items are related and
provides recommendations that would be beneficial for the retailer. Each association rule has
supporting statistics that help evaluate its potential strength so that if a rule exceeds certain
probability threshold then it can be taken into account. In this case, the recommendation
report suggests that selling products from categories{ [Hair conditioner] and [Shampoo]}
and {[Brushes] and [Make-up eyes]} together will increase sales of both items.
Selected Item
Recommendation Sales of Selected Items
Linked Sales
% of linked sales
Average value of recommendation
Overall value of linked sales
Hair conditioner
Shampoo 611 253 41.41 % 1.09 664
Brushes Make-up eyes 34 18 52.94 % 2.85 97
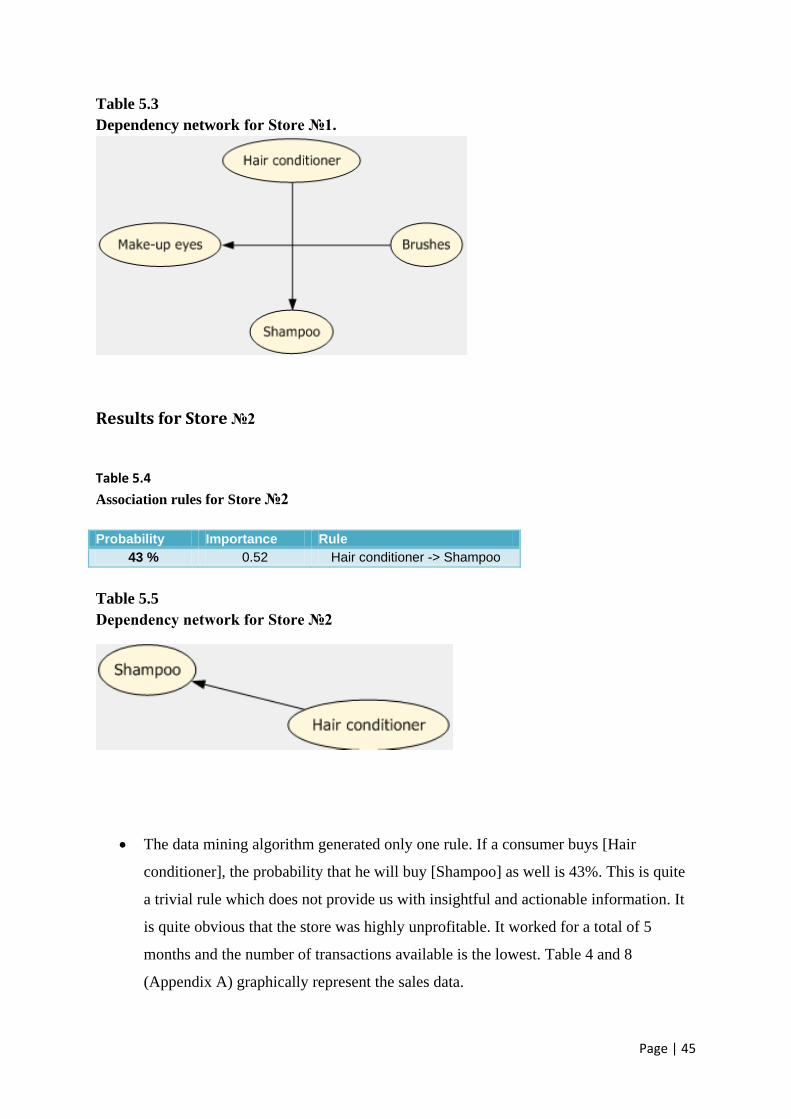
Page | 45
Table 5.3
Dependency network for Store №1.
Results for Store №2
Table 5.4
Association rules for Store №2
Probability Importance Rule
43 % 0.52 Hair conditioner -> Shampoo
Table 5.5
Dependency network for Store №2
The data mining algorithm generated only one rule. If a consumer buys [Hair
conditioner], the probability that he will buy [Shampoo] as well is 43%. This is quite
a trivial rule which does not provide us with insightful and actionable information. It
is quite obvious that the store was highly unprofitable. It worked for a total of 5
months and the number of transactions available is the lowest. Table 4 and 8
(Appendix A) graphically represent the sales data.
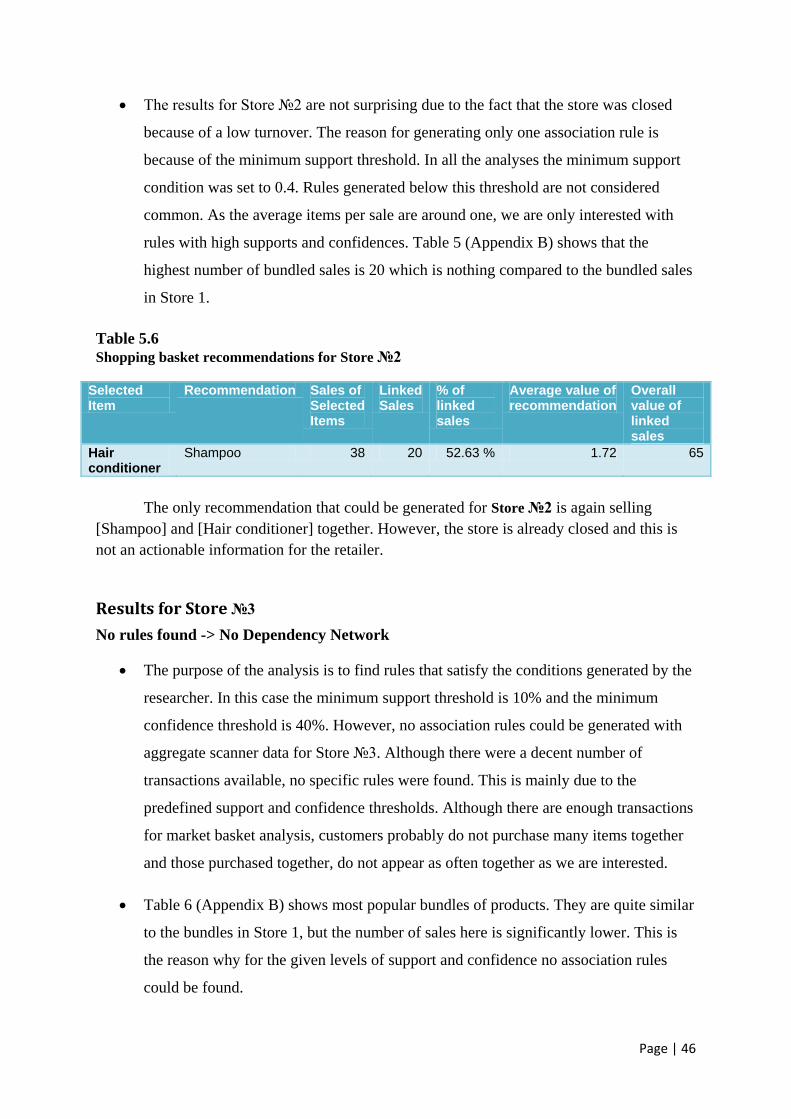
Page | 46
The results for Store №2 are not surprising due to the fact that the store was closed
because of a low turnover. The reason for generating only one association rule is
because of the minimum support threshold. In all the analyses the minimum support
condition was set to 0.4. Rules generated below this threshold are not considered
common. As the average items per sale are around one, we are only interested with
rules with high supports and confidences. Table 5 (Appendix B) shows that the
highest number of bundled sales is 20 which is nothing compared to the bundled sales
in Store 1.
Table 5.6
Shopping basket recommendations for Store №2
The only recommendation that could be generated for Store №2 is again selling
[Shampoo] and [Hair conditioner] together. However, the store is already closed and this is
not an actionable information for the retailer.
Results for Store №3
No rules found -> No Dependency Network
The purpose of the analysis is to find rules that satisfy the conditions generated by the
researcher. In this case the minimum support threshold is 10% and the minimum
confidence threshold is 40%. However, no association rules could be generated with
aggregate scanner data for Store №3. Although there were a decent number of
transactions available, no specific rules were found. This is mainly due to the
predefined support and confidence thresholds. Although there are enough transactions
for market basket analysis, customers probably do not purchase many items together
and those purchased together, do not appear as often together as we are interested.
Table 6 (Appendix B) shows most popular bundles of products. They are quite similar
to the bundles in Store 1, but the number of sales here is significantly lower. This is
the reason why for the given levels of support and confidence no association rules
could be found.
Selected Item
Recommendation Sales of Selected Items
Linked Sales
% of linked sales
Average value of recommendation
Overall value of linked sales
Hair conditioner
Shampoo 38 20 52.63 % 1.72 65
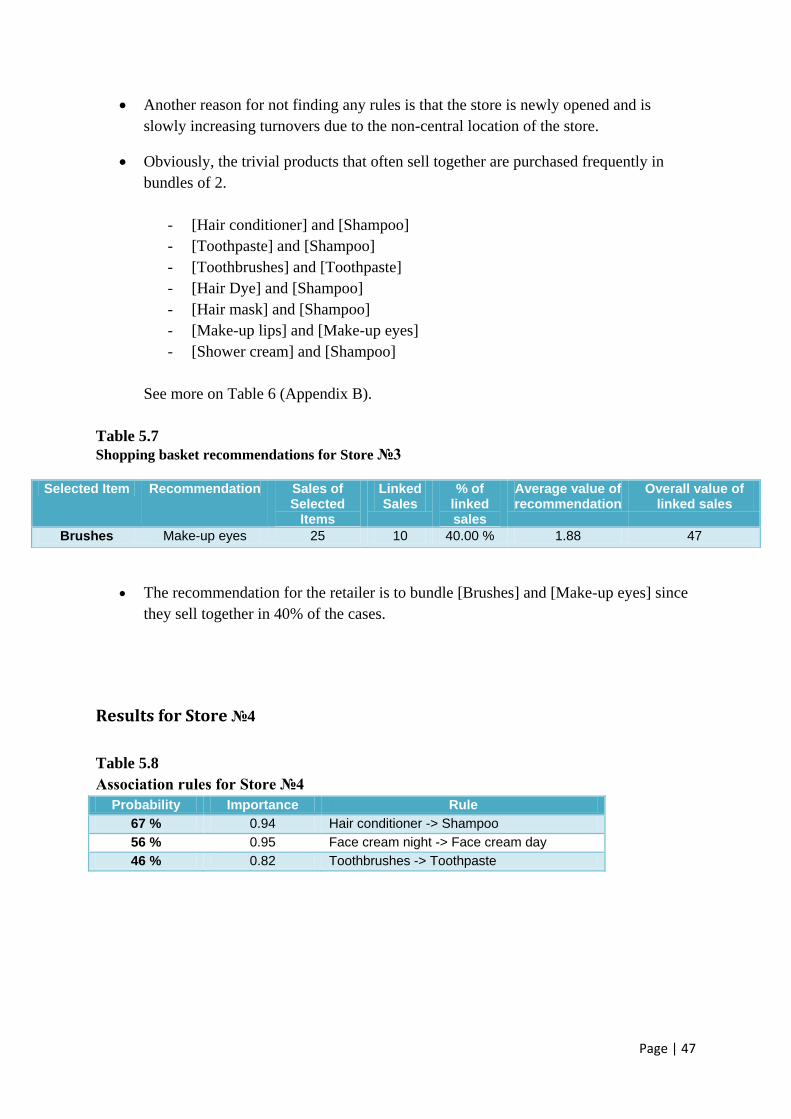
Page | 47
Another reason for not finding any rules is that the store is newly opened and is
slowly increasing turnovers due to the non-central location of the store.
Obviously, the trivial products that often sell together are purchased frequently in
bundles of 2.
- [Hair conditioner] and [Shampoo]
- [Toothpaste] and [Shampoo]
- [Toothbrushes] and [Toothpaste]
- [Hair Dye] and [Shampoo]
- [Hair mask] and [Shampoo]
- [Make-up lips] and [Make-up eyes]
- [Shower cream] and [Shampoo]
See more on Table 6 (Appendix B).
Table 5.7
Shopping basket recommendations for Store №3
The recommendation for the retailer is to bundle [Brushes] and [Make-up eyes] since
they sell together in 40% of the cases.
Results for Store №4
Table 5.8
Association rules for Store №4
Probability Importance Rule
67 % 0.94 Hair conditioner -> Shampoo
56 % 0.95 Face cream night -> Face cream day
46 % 0.82 Toothbrushes -> Toothpaste
Selected Item Recommendation Sales of Selected
Items
Linked Sales
% of linked sales
Average value of recommendation
Overall value of linked sales
Brushes Make-up eyes 25 10 40.00 % 1.88 47
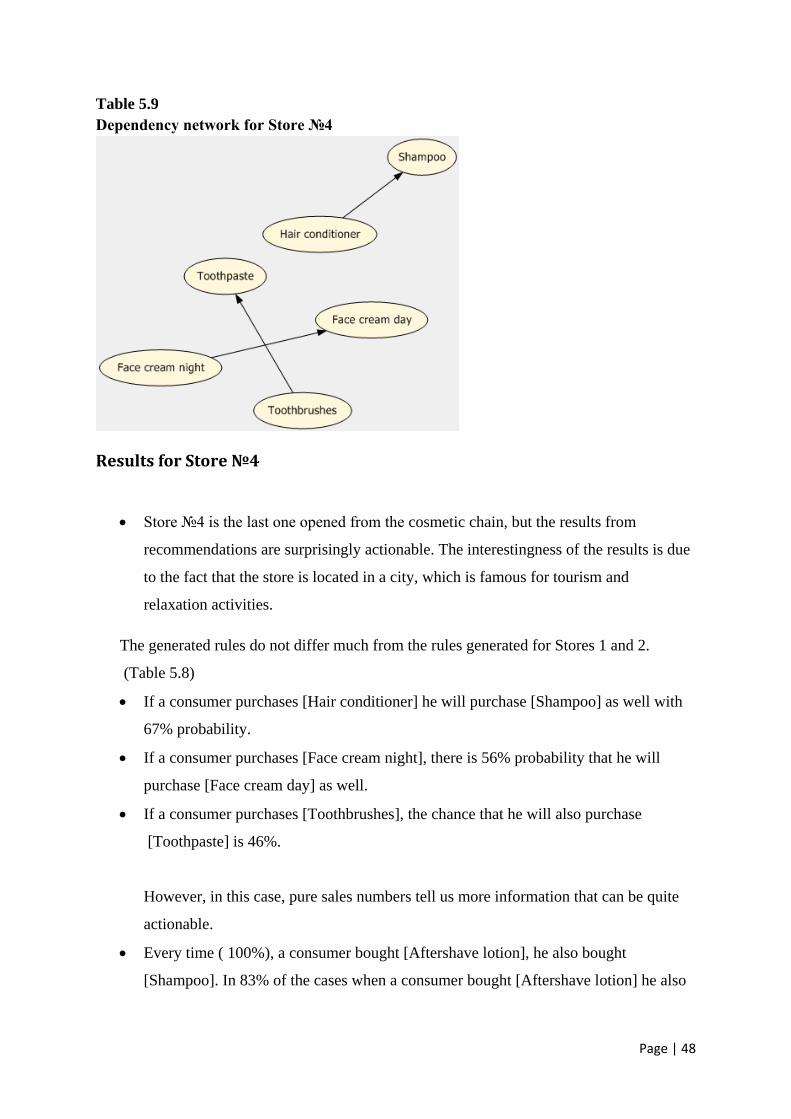
Page | 48
Table 5.9
Dependency network for Store №4
Results for Store №4
Store №4 is the last one opened from the cosmetic chain, but the results from
recommendations are surprisingly actionable. The interestingness of the results is due
to the fact that the store is located in a city, which is famous for tourism and
relaxation activities.
The generated rules do not differ much from the rules generated for Stores 1 and 2.
(Table 5.8)
If a consumer purchases [Hair conditioner] he will purchase [Shampoo] as well with
67% probability.
If a consumer purchases [Face cream night], there is 56% probability that he will
purchase [Face cream day] as well.
If a consumer purchases [Toothbrushes], the chance that he will also purchase
[Toothpaste] is 46%.
However, in this case, pure sales numbers tell us more information that can be quite
actionable.
Every time ( 100%), a consumer bought [Aftershave lotion], he also bought
[Shampoo]. In 83% of the cases when a consumer bought [Aftershave lotion] he also
Page | 49
bought [Toothpaste]. This is a good opportunity for the retailer to promote products
from these categories.
In around 80-90% of the cases when [Shampoo] was purchased, products from one of
the following categories were also purchased:
- [Anti-age care]
- [Hair dye]
- [Hair conditioner]
- [Shower gel]
- [Body lotion]
- [Anti-wrinkle set]
This is the only store where [Jellewery] was bought quite often. It is associated with
almost every other cosmetic product. It is apparent that tourists in the resort buy
[Jewellery] almost every time they go to the store. It is commonly associated with:
[Make-up lips],[Nail polish],[Wet wipes], [Face cream day],[Shampoo],[Hair dye],
[Toothpaste].
The retailer can use this information for promoting [Jellewery] with items from some
of these product categories. [Jellewery] is one of the most expensive product
categories in the store, so it would be a good idea for the retailer to increase prices of
jellewery and start selling more and different varieties of it. As consumers will have
more options to choose from , they will stay longer in the store, which increases the
likelihood that they will buy something else.
A perfect location for [Jellewery] would be nearby [Nail Polish] and all kinds of
[Make-up]. Women tend to match jellewery with nail polish and make-up, so this in-
store placement would be a reminder for ladies that they need to buy the same colour
of nail polish and lipstick for the new necklace, for example.
Page | 50
5.2 Multinomial logistic regression.
The purpose of this model-based approach is to test how different seasons and times
of the day affect the probabilities of purchasing items from certain product categories. It is
important to note that in order to investigate seasonal effects, we need yearly sales data. The
only store that has data available for one whole year is Store №1. This is why multinomial
logistic regression will be run only for Store №1. Multinomial logit analysis was executed in
IBM SPSS Statistics software.
Model №1
The purpose of this model is to investigate how different seasons and times of the day
affect purchases of different kinds of make up. In other words we want to see when
consumers are more likely to purchase lipstick than font de teint. The analysis will provide
valuable information to the retailer so he can adjust promotional activities accordingly.
The response variable can take on three possible outcomes:
Y = {make-up for eyes, make-up for lips, make-up for skin}
Independent variables are time of purchase and season.
Time of purchase has been aggregated to three categories:
Morning (1) – [09:00 am – 13:00 am]
Afternoon (2) – [13:00 am – 17:00 pm]
Evening (3) – [17:00 pm – 20:00 pm]
Months have been aggregated to seasons:
Spring (1) – [March, April, May]
Summer (2) – [June, July, August]
Autumn (3) – [September, October, November]
Winter (4) – [December, January, February]
The baseline (reference) category was set to be [Make-up for skin].
Page | 51
Make-up for eyes consists of all the brands and types of eye shadows, eye liners, eye
pencils, eyebrow pencils etc.
Make-up for lips consists of all the brands and types of lip liners, lipsticks, lip-glosses
and lip-balms.
Make-up for skin consists of all the brands and types of fond de teint, concealers,
mattifying powders, bronzing powders, blushes etc.
The logit equation is : log )Pr(
)Pr(
Yj
Yi= β0 + β1*Time + β2* Season,
where i= {make-up for eyes, make-up for lips}.
j= the reference category (make-up for skin).
Table 5.2.1 Coefficientsa
Model Collinearity Statistics
Tolerance VIF
1 Time 1.000 1.000
a. Dependent Variable: Season
Before conducting the multinomial logit, it is of high importance to check for
multicollinearity between the independent variables. As we have only two independent
variables, it would be more appropriate to use the term collinearity. Running a linear
regression between the two independent variables will provide us with the Variance Inflation
Factor. On Table 5.2.1 we can see that the VIF value is 1.000 which means that there is no
collinearity between the two variables.
Multinomial logit analysis results for Model №1
Table 5.2.2. Model Fitting Information
Model Model Fitting
Criteria
Likelihood Ratio Tests
-2 Log
Likelihood
Chi-Square df Sig.
Intercept Only 154.273
Final 125.717 28.556 10 .001
Page | 52
For a good model fit the -2 Log Likelihood (-2LL) value should be lower for the full model
than it is for the null model with intercept only. From table 5.2.2 we can see that this is
exactly the case, which indicates a good model fit. Moreover, the model fit is significant
(χ² (10))= 28.556, p <0.05 ) which means that the full model is outperforming the null one in
predictive power.
Table 5.2.3 Goodness-of-Fit
Chi-Square df Sig.
Pearson 19.118 12 .086
Deviance 19.892 12 .069
The Goodness-of-Fit table (Table 5.2.3) provides further evidence of good fit for the model.
Here, both the Pearson and Deviance statistics are chi-square based methods. However, this
time lack of significance is interpreted as a good fit. Both p-values are greater than the
established cut-off ( 0.05) which shows another evidence of good model fit.
Table 5.2.4 Likelihood Ratio Tests
Effect Model Fitting Criteria Likelihood Ratio Tests
-2 Log Likelihood of Reduced
Model
Chi-Square df Sig.
Intercept 125.717a .000 0 .
Time 141.119 15.403 4 .004
Season 139.091 13.375 6 .037
The chi-square statistic is the difference in -2 log-likelihoods between the final model and a reduced model. The reduced
model is formed by omitting an effect from the final model. The null hypothesis is that all parameters of that effect are 0.
a. This reduced model is equivalent to the final model because omitting the effect does not increase the degrees of freedom.
Results from table 5.2.4 tell us if each of the predictors contributes meaningfully to the full
model. The statistics in this table are similar to those in the Model Fitting Information table.
However, here, each element of the model is being compared to the full model. Insignificant
variables can be dropped off the analysis as they do not bring any value. Luckily, in this case
both independent variables are significant (p-values < 0.05).
Page | 53
Table 5.2.5 Parameter Estimates
Category aggregationa B Std.
Error
Wald df Sig. Exp(B) 95% Confidence Interval
for Exp(B)
Lower
Bound
Upper
Bound
Make-up
eyes
Intercept 1.421 .263 29.175 1 .000
[Time=1] -.491 .238 4.271 1 .039 .612 .384 .975
[Time=2] -.458 .228 4.049 1 .044 .632 .405 .988
[Time=3] 0b . . 0 . . . .
[Season=1] .350 .267 1.710 1 .191 1.418 .840 2.395
[Season=2] .054 .302 .032 1 .857 1.056 .584 1.909
[Season=3] -.182 .291 .393 1 .531 .833 .471 1.474
[Season=4] 0b . . 0 . . . .
Make-up
lips
Intercept .627 .281 4.980 1 .026
[Time=1] -.213 .244 .762 1 .383 .808 .500 1.304
[Time=2] .086 .232 .138 1 .710 1.090 .692 1.716
[Time=3] 0b . . 0 . . . .
[Season=1] .783 .281 7.768 1 .005 2.187 1.261 3.792
[Season=2] .502 .316 2.531 1 .112 1.652 .890 3.067
[Season=3] .401 .301 1.771 1 .183 1.493 .827 2.696
[Season=4] 0b . . 0 . . . .
a. The reference category is: Make-up skin.
b. This parameter is set to zero because it is redundant.
Table 5.2.5 provides us the estimated log-odds for choosing Make-up for eyes versus Make-
up for skin and Make-up for lips versus Make-up for skin in different times of the day and
seasons.
The unit of analysis is the Exp(B).It represents the change in the odds ratio associated with a
one unit change in the predictor variable. If the value of Exp(B) is greater than 1, then it
indicates that as the predictor increases the odds of the outcome occurring also increase. The
other way around, if the Exp(B) is less than 1, as the predictor increases the odds of the
outcome occurring decrease.
Page | 54
I. The intercept is 1.421. This is the multinomial logit estimate for the possible
outcome [Make-up eyes] relative to [Make-up skin], when all the other
variables are set to zero. For [Make-up lips] relative to [Make-up skin] the
intercept is 0.627
II. Four of the regression coefficients in the model are insignificant:
[Make-up eyes] relative to [Make-up skin]
For Season=1 the p-value is 0.191
For Season=2 the p-value is 0.857.
For Season=3 the p-value is 0.531.
[Make-up lips] relative to [Make-up skin]
For Time=1 the p-value is 0.383.
For Time=2 the p-value is 0.710.
For Season=1 the p-value is 0.112.
For Season=2 the p-value is 0.183.
The following conclusions can be inferred from the table:
Consumers are 0.612 times less likely to purchase [Make-up for eyes] in the morning
than in the evening relative to [Make-up for skin].
Consumers are 0.632 times less likely to purchase [Make-up eyes] in the afternoon
than in the evening relative to [Make-up skin]
Consumers are 2.187 times more likely to purchase [Make-up lips] in the spring than
in winter relative to [Make-up skin]
General conclusions:
Time of the day has significant effect on the likelihood that a consumer will prefer to
buy [Make-up eyes] in the morning and afternoon than in the evening relative to
[Make-up skin]
Season has a significant effect on the likelihood that a consumer will prefer to buy
[Make-up lips] in spring than in winter relative to [Make-up skin]
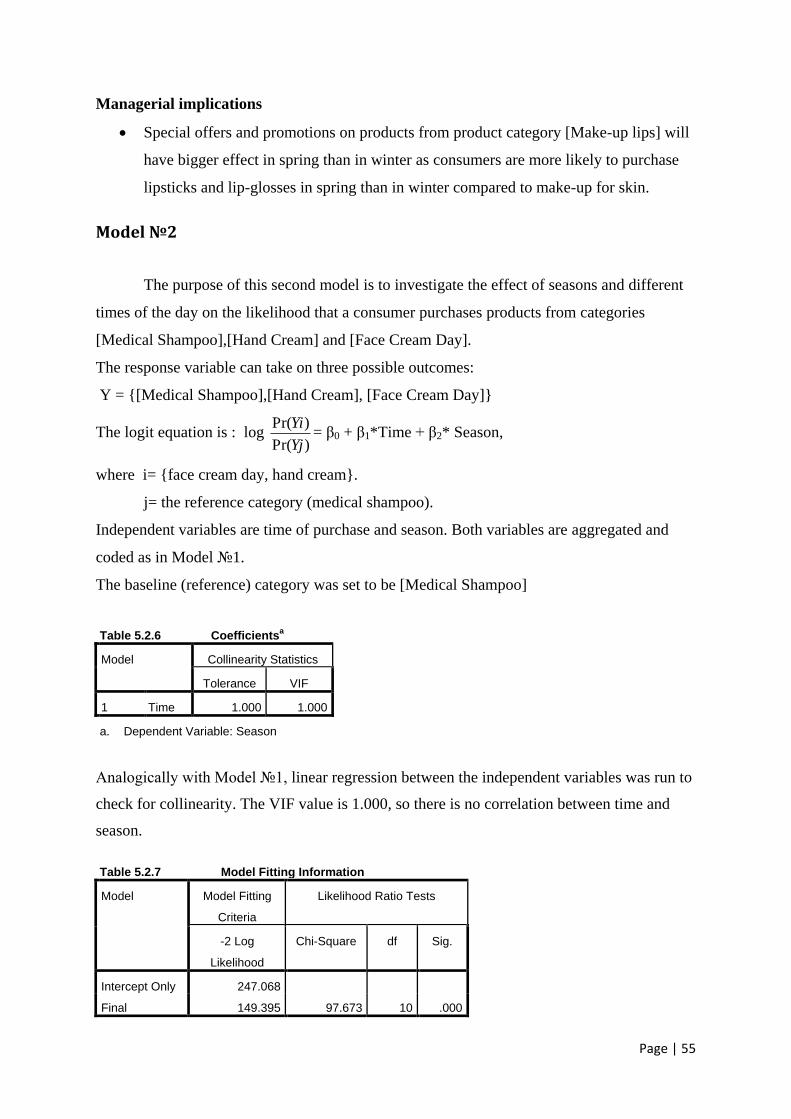
Page | 55
Managerial implications
Special offers and promotions on products from product category [Make-up lips] will
have bigger effect in spring than in winter as consumers are more likely to purchase
lipsticks and lip-glosses in spring than in winter compared to make-up for skin.
Model №2
The purpose of this second model is to investigate the effect of seasons and different
times of the day on the likelihood that a consumer purchases products from categories
[Medical Shampoo],[Hand Cream] and [Face Cream Day].
The response variable can take on three possible outcomes:
Y = {[Medical Shampoo],[Hand Cream], [Face Cream Day]}
The logit equation is : log )Pr(
)Pr(
Yj
Yi= β0 + β1*Time + β2* Season,
where i= {face cream day, hand cream}.
j= the reference category (medical shampoo).
Independent variables are time of purchase and season. Both variables are aggregated and
coded as in Model №1.
The baseline (reference) category was set to be [Medical Shampoo]
Table 5.2.6 Coefficientsa
Model Collinearity Statistics
Tolerance VIF
1 Time 1.000 1.000
a. Dependent Variable: Season
Analogically with Model №1, linear regression between the independent variables was run to
check for collinearity. The VIF value is 1.000, so there is no correlation between time and
season.
Table 5.2.7 Model Fitting Information
Model Model Fitting
Criteria
Likelihood Ratio Tests
-2 Log
Likelihood
Chi-Square df Sig.
Intercept Only 247.068
Final 149.395 97.673 10 .000
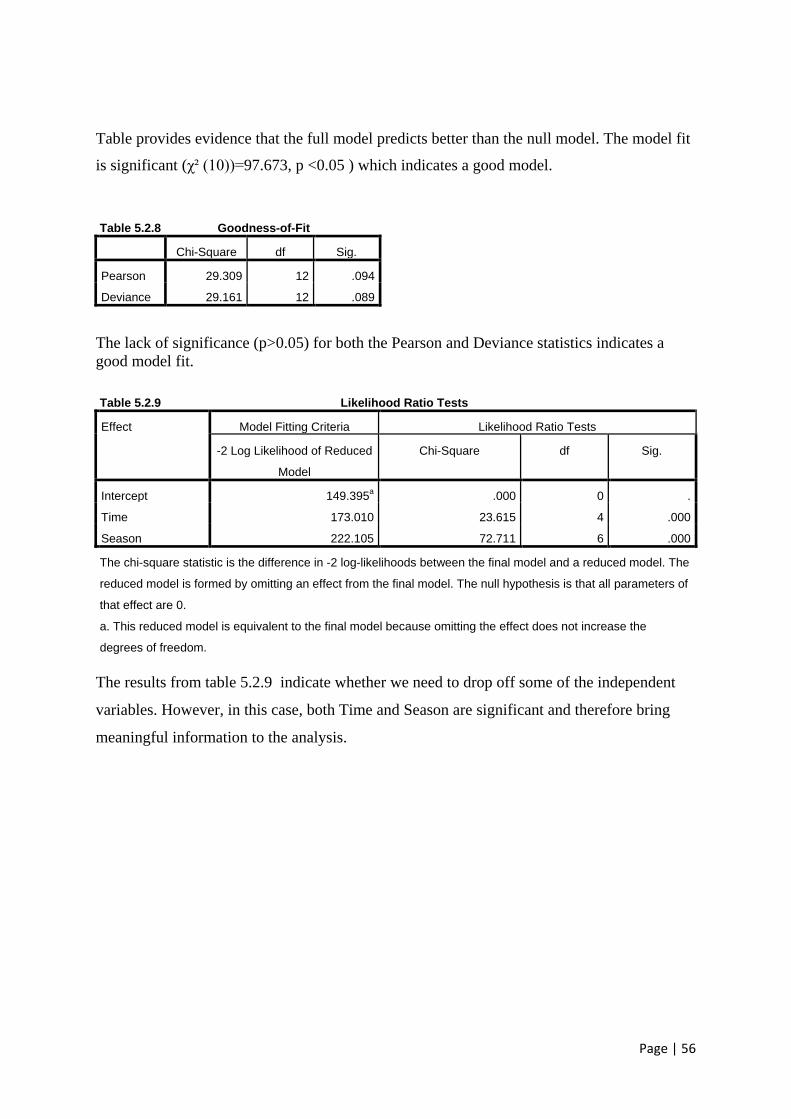
Page | 56
Table provides evidence that the full model predicts better than the null model. The model fit
is significant (χ² (10))=97.673, p <0.05 ) which indicates a good model.
Table 5.2.8 Goodness-of-Fit
Chi-Square df Sig.
Pearson 29.309 12 .094
Deviance 29.161 12 .089
The lack of significance (p>0.05) for both the Pearson and Deviance statistics indicates a
good model fit.
Table 5.2.9 Likelihood Ratio Tests
Effect Model Fitting Criteria Likelihood Ratio Tests
-2 Log Likelihood of Reduced
Model
Chi-Square df Sig.
Intercept 149.395a .000 0 .
Time 173.010 23.615 4 .000
Season 222.105 72.711 6 .000
The chi-square statistic is the difference in -2 log-likelihoods between the final model and a reduced model. The
reduced model is formed by omitting an effect from the final model. The null hypothesis is that all parameters of
that effect are 0.
a. This reduced model is equivalent to the final model because omitting the effect does not increase the
degrees of freedom.
The results from table 5.2.9 indicate whether we need to drop off some of the independent
variables. However, in this case, both Time and Season are significant and therefore bring
meaningful information to the analysis.
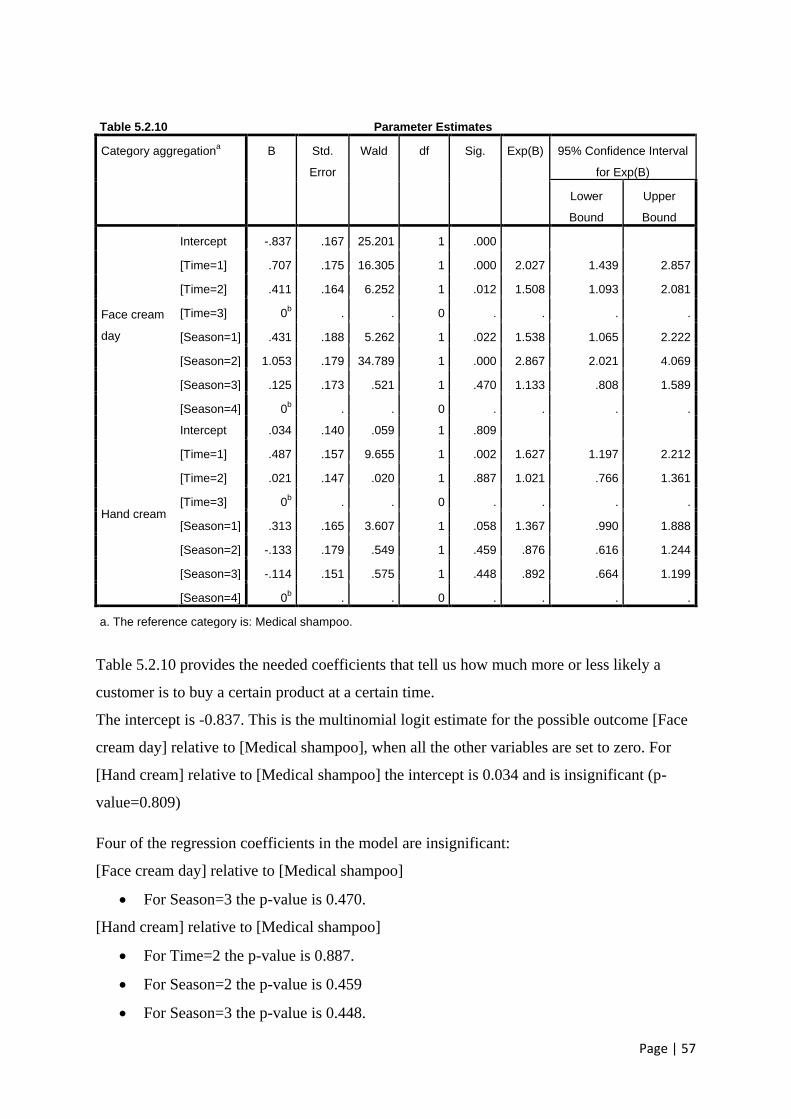
Page | 57
Table 5.2.10 Parameter Estimates
Category aggregationa B Std.
Error
Wald df Sig. Exp(B) 95% Confidence Interval
for Exp(B)
Lower
Bound
Upper
Bound
Face cream
day
Intercept -.837 .167 25.201 1 .000
[Time=1] .707 .175 16.305 1 .000 2.027 1.439 2.857
[Time=2] .411 .164 6.252 1 .012 1.508 1.093 2.081
[Time=3] 0b . . 0 . . . .
[Season=1] .431 .188 5.262 1 .022 1.538 1.065 2.222
[Season=2] 1.053 .179 34.789 1 .000 2.867 2.021 4.069
[Season=3] .125 .173 .521 1 .470 1.133 .808 1.589
[Season=4] 0b . . 0 . . . .
Hand cream
Intercept .034 .140 .059 1 .809
[Time=1] .487 .157 9.655 1 .002 1.627 1.197 2.212
[Time=2] .021 .147 .020 1 .887 1.021 .766 1.361
[Time=3] 0b . . 0 . . . .
[Season=1] .313 .165 3.607 1 .058 1.367 .990 1.888
[Season=2] -.133 .179 .549 1 .459 .876 .616 1.244
[Season=3] -.114 .151 .575 1 .448 .892 .664 1.199
[Season=4] 0b . . 0 . . . .
a. The reference category is: Medical shampoo.
Table 5.2.10 provides the needed coefficients that tell us how much more or less likely a
customer is to buy a certain product at a certain time.
The intercept is -0.837. This is the multinomial logit estimate for the possible outcome [Face
cream day] relative to [Medical shampoo], when all the other variables are set to zero. For
[Hand cream] relative to [Medical shampoo] the intercept is 0.034 and is insignificant (p-
value=0.809)
Four of the regression coefficients in the model are insignificant:
[Face cream day] relative to [Medical shampoo]
For Season=3 the p-value is 0.470.
[Hand cream] relative to [Medical shampoo]
For Time=2 the p-value is 0.887.
For Season=2 the p-value is 0.459
For Season=3 the p-value is 0.448.
Page | 58
Looking at the Exp(B), the following statements can be inferred from table 5.2.10:
Consumers are 2.027 times more likely to purchase [Face cream day] in the morning
than in the evening relative to [Medical shampoo].
Consumers are 1.508 times more likely to purchase [Face cream day] in the afternoon
than in the evening relative to [Medical shampoo].
Consumers are 1.538 times more likely to purchase [Face cream day] in spring than
in winter relative to [Medical shampoo].
Consumers are 2.867 times more likely to purchase [Face cream day] in summer than
in winter relative to [Medical shampoo].
Consumers are 1.627 times more likely to purchase [Hand cream] in the morning than
in the evening relative to [Medical shampoo].
Consumers are 1.367 times more likely to purchase [Face cream day] in spring than in
winter relative to [Medical shampoo].
General conclusions:
1. Consumers are most likely to purchase [Face cream day] and [Hand cream] in the
morning than in other times of the day relative to [Medical shampoo].
2. Consumers are most likely to purchase [Face cream day] and [Hand cream] in spring
than in other seasons relative to [Medical shampoo]
Managerial implications:
Spring is the best season for promotional activities of products from product
categories [Face cream day] and [Hand cream] as customers are most likely to
purchase them in spring than winter.
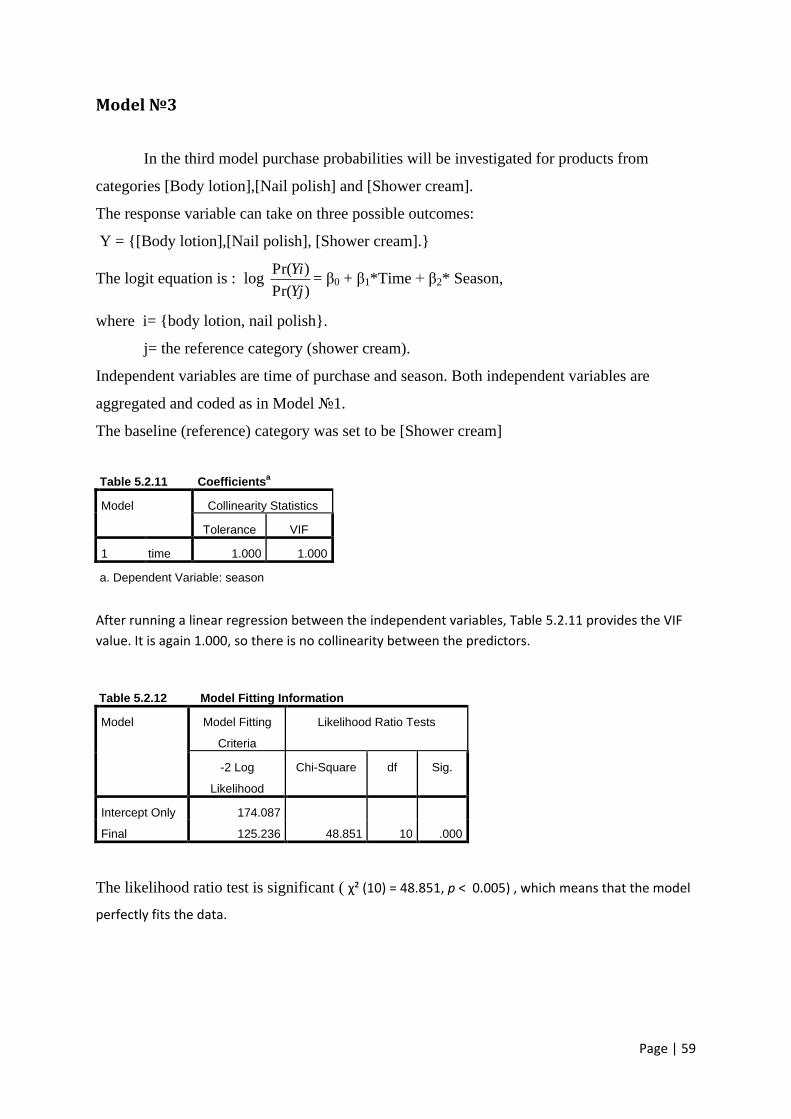
Page | 59
Model №3
In the third model purchase probabilities will be investigated for products from
categories [Body lotion],[Nail polish] and [Shower cream].
The response variable can take on three possible outcomes:
Y = {[Body lotion],[Nail polish], [Shower cream].}
The logit equation is : log )Pr(
)Pr(
Yj
Yi= β0 + β1*Time + β2* Season,
where i= {body lotion, nail polish}.
j= the reference category (shower cream).
Independent variables are time of purchase and season. Both independent variables are
aggregated and coded as in Model №1.
The baseline (reference) category was set to be [Shower cream]
Table 5.2.11 Coefficientsa
Model Collinearity Statistics
Tolerance VIF
1 time 1.000 1.000
a. Dependent Variable: season
After running a linear regression between the independent variables, Table 5.2.11 provides the VIF
value. It is again 1.000, so there is no collinearity between the predictors.
Table 5.2.12 Model Fitting Information
Model Model Fitting
Criteria
Likelihood Ratio Tests
-2 Log
Likelihood
Chi-Square df Sig.
Intercept Only 174.087
Final 125.236 48.851 10 .000
The likelihood ratio test is significant ( χ² (10) = 48.851, p < 0.005) , which means that the model
perfectly fits the data.
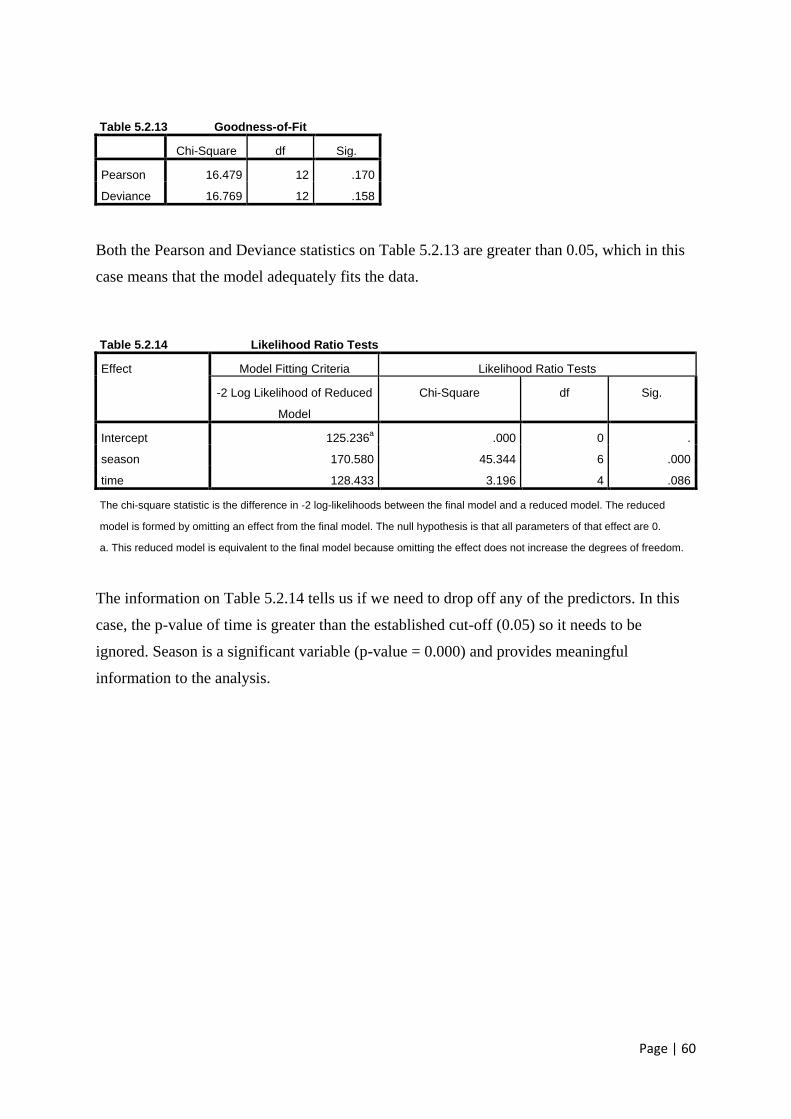
Page | 60
Table 5.2.13 Goodness-of-Fit
Chi-Square df Sig.
Pearson 16.479 12 .170
Deviance 16.769 12 .158
Both the Pearson and Deviance statistics on Table 5.2.13 are greater than 0.05, which in this
case means that the model adequately fits the data.
Table 5.2.14 Likelihood Ratio Tests
Effect Model Fitting Criteria Likelihood Ratio Tests
-2 Log Likelihood of Reduced
Model
Chi-Square df Sig.
Intercept 125.236a .000 0 .
season 170.580 45.344 6 .000
time 128.433 3.196 4 .086
The chi-square statistic is the difference in -2 log-likelihoods between the final model and a reduced model. The reduced
model is formed by omitting an effect from the final model. The null hypothesis is that all parameters of that effect are 0.
a. This reduced model is equivalent to the final model because omitting the effect does not increase the degrees of freedom.
The information on Table 5.2.14 tells us if we need to drop off any of the predictors. In this
case, the p-value of time is greater than the established cut-off (0.05) so it needs to be
ignored. Season is a significant variable (p-value = 0.000) and provides meaningful
information to the analysis.
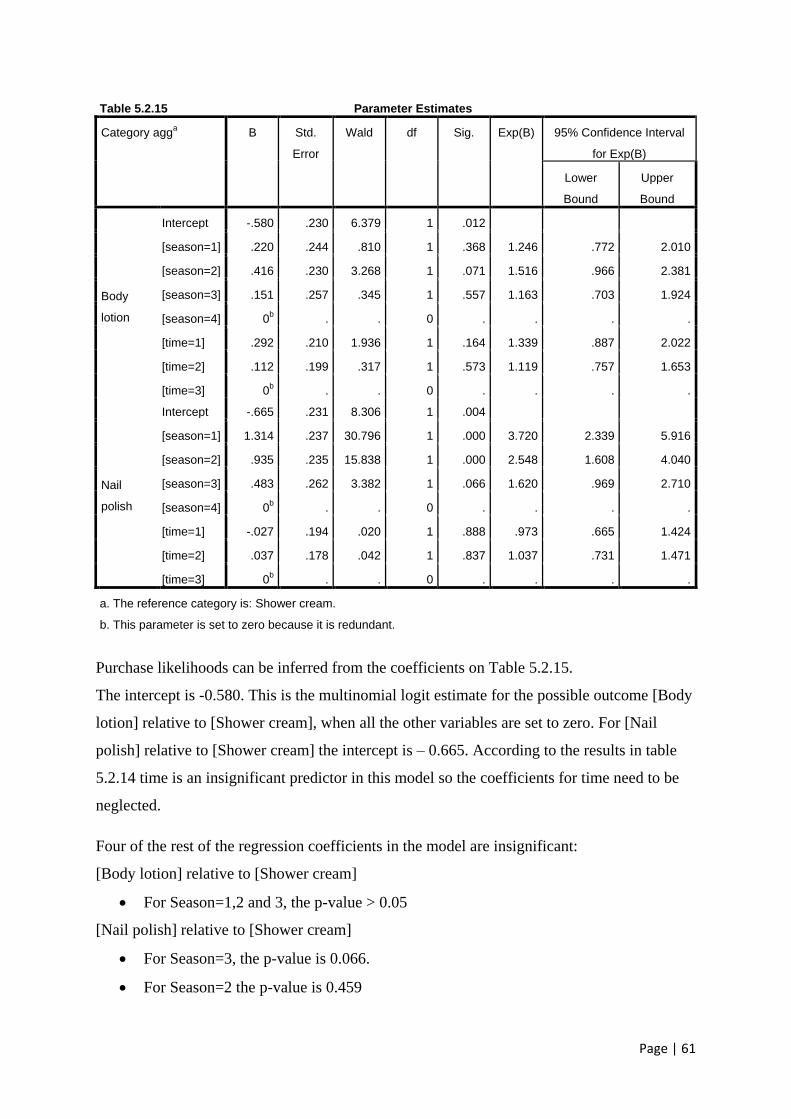
Page | 61
Table 5.2.15 Parameter Estimates
Category agga B Std.
Error
Wald df Sig. Exp(B) 95% Confidence Interval
for Exp(B)
Lower
Bound
Upper
Bound
Body
lotion
Intercept -.580 .230 6.379 1 .012
[season=1] .220 .244 .810 1 .368 1.246 .772 2.010
[season=2] .416 .230 3.268 1 .071 1.516 .966 2.381
[season=3] .151 .257 .345 1 .557 1.163 .703 1.924
[season=4] 0b . . 0 . . . .
[time=1] .292 .210 1.936 1 .164 1.339 .887 2.022
[time=2] .112 .199 .317 1 .573 1.119 .757 1.653
[time=3] 0b . . 0 . . . .
Nail
polish
Intercept -.665 .231 8.306 1 .004
[season=1] 1.314 .237 30.796 1 .000 3.720 2.339 5.916
[season=2] .935 .235 15.838 1 .000 2.548 1.608 4.040
[season=3] .483 .262 3.382 1 .066 1.620 .969 2.710
[season=4] 0b . . 0 . . . .
[time=1] -.027 .194 .020 1 .888 .973 .665 1.424
[time=2] .037 .178 .042 1 .837 1.037 .731 1.471
[time=3] 0b . . 0 . . . .
a. The reference category is: Shower cream.
b. This parameter is set to zero because it is redundant.
Purchase likelihoods can be inferred from the coefficients on Table 5.2.15.
The intercept is -0.580. This is the multinomial logit estimate for the possible outcome [Body
lotion] relative to [Shower cream], when all the other variables are set to zero. For [Nail
polish] relative to [Shower cream] the intercept is – 0.665. According to the results in table
5.2.14 time is an insignificant predictor in this model so the coefficients for time need to be
neglected.
Four of the rest of the regression coefficients in the model are insignificant:
[Body lotion] relative to [Shower cream]
For Season=1,2 and 3, the p-value > 0.05
[Nail polish] relative to [Shower cream]
For Season=3, the p-value is 0.066.
For Season=2 the p-value is 0.459
Page | 62
For Season=3 the p-value is 0.448.
Looking at the Exp(B), the following statements can be inferred from table 5.2.15:
Consumers are 3.720 times more likely to purchase [Nail polish] in spring than in
winter relative to [Shower cream].
Consumers are 2.548 times more likely to purchase [Nail polish] in summer than in
winter relative to [Shower cream].
General conclusions:
Season has significant effect on the likelihood of purchasing products from product
category [Nail polish] relative to [Shower cream]
In spring customers are most likely to purchase products from product category [Nail
polish] than in any other season relative to [Shower cream]
Managerial implications:
Promoting [Nail polish] in spring may have positive effect on sales as customers have
highest likelihood to purchase products from this category in spring.
Page | 63
Chapter 6
Conclusions
6.1 General Discussion
Market basket analysis is a very useful technique for finding out co-occurring items in
consumers shopping baskets. Such information can be used as a basis for decisions about
marketing activity such as promotional support, inventory control and cross-sale campaigns.
Tracking not so apparent product affinities and leveraging on them is often seen as a real
challenge in the retail business.
Even though most of the generated rules are somewhat predictable for a cosmetic
store, they still provide value to the retailer. The problem with trivial rules is often found in
the marketing literature, but solely depends on the size and type of store. In this research, the
stores of the cosmetic chain are rather small ones and the number of transactions is not as big
as the number in a big hypermarket, for example. Moreover, the assortment is somewhat
limited due to the fact that the stores represent and sell mainly products of a certain cosmetic
company. Therefore, it is a bit difficult to mine unusual and interesting rules. However, it is
important for the retailer to know exactly which products are purchased together and in what
time of the year. The generated rules may not be unusual and interesting, but they are useful
and actionable.
6.2. Academic contribution
The market basket problem can be seen as the best example of mining association
rules. Discovering association rules has been a well-studied area for the past decade. Building
up on previous researches by using established methods for mining association rules allowed
for discovering useful information for the retailer. After aggregating the data and finding
product affinities, the multinomial logistic regression extends the analysis by adding up some
probabilities of a consumer purchasing certain products in different seasons and in certain
times of the day. Evaluating probabilities of a category membership depending on the two
factors – season and time of the day provides the retailer with better understanding of
consumers’ needs and suggests action for advertising.
Page | 64
Overall overview of contributions
The contributions of this thesis are as follows:
1. Products purchased in bundles of 2 and 3 were found for all the four stores of the cosmetic
chain.
2. Association rules were generated with the supporting probabilities and importance.
3. Dependency networks are used to visually represent the product interrelationships.
4. Average values per sale and overall value of bundle were estimated for every store of the
chain (see Appendix B).
5. The multinomial logistic regression provides a model for predicting the likelihood of a
consumer purchasing an item from a certain product category at a specific time of the day and
in a specific season.
6. The multinomial logit also compares the likelihood of choosing a product out of several
options.
6.3. Managerial Implications
In the recent years, more and more retailers are seeking competitive edge through
advanced and innovative technology. Market basket analysis is the next step in the retail
evolution. Applications of association rule mining are growing rapidly in different sectors –
from analysing debit and credit card purchases to fraud detections.
Mining into big data provides managers with a unique window into what is happening
with ones business so that they can implement strategies efficiently. Obscure patterns can be
discovered using market basket analysis which can help for planning more effective
marketing efforts. It can be used not only for cross-sale and up-sale campaigns, but for
managing better inventory control and satisfying shoppers’ needs. Almost all departments of
a company can benefit from a single analysis – not only the high levels of Management but
also Store operations, Merchandising and Advertising and Promotion departments.
Page | 65
6.4 Limitations of the study and directions for future research.
Although market basket analysis is computationally simple and very efficient, there
are several important limitations. Since there is not available data on households and
individual consumers, interdependencies across purchases of individual consumers or
households are neglected. In other words, due to data restrictions, homogeneity across
purchases is assumed.
Individual household level data would be very beneficial for the analysis. A
combination of insights on product dependencies and household level data could help
retailers in better pricing and promotion decisions for different customer segments.
An area of interest for the researcher might be to investigate sequences of purchases
and events concerning the customer. Although sequential time series analysis would be an
appropriate technique to use, anonymous transactions do not unveil information on consumer
behaviour.
Availability of household data would be very beneficial for the second research
question. A model-based approach can be used for prediction and forecasting. Running a
multinomial logistic regression with more independent variables would be very effective to
better predict product choice.
Having non-anonymous household data also allows for applying techniques like
clustering, decision trees or artificial neural networks that could provide more insightful
information on the consumers and their preferences.
Page | 66
Bibliography
A. M. Khattak, A. M. Khan, Sungyoung Lee and Young-Koo Lee. (2010). Analyzing Association Rule
Mining and Clustering on Sales Day Data with XLMiner and Weka. International Journal of
Database Theory and Application Vol. 3, No. 1.
Anderson, C. (2006). The Long Tail: Why the Future of Business is Selling Less of More.
Andreas Mild, Thomas Reutterer. (2003). An improved collaborative filtering approach for predicting
cross-category purchases based on binary market basket data. Journal of Retailing and
Consumer Services vol.10, 123-133.
Andreas Mild, Thomas Reutterer. (2003). An improved collaborative filtering approachfor predicting
cross-category purchases based on binary market basket data. Journal of Retailing and
Consumer Services, Volume 10, 123-133.
Andrew Ainslie, Peter E. Rossi. (1998). Similarities in Choice Behavior Across Product Categories.
Marketing Science, Vol. 17, No. 2, 91-106.
(n.d.). Association analysis: Basic concepts and rules.
Assunc¸ ˜ao, J. L., & Meyer, R. J. (1993). The rational effect on price promotions on sales and
consumption. Management Science, 39 (May), 517–535.
Bari A. Harlam and Leonard M. Lodish. (1995). Modeling Consumers' Choices of Multiple Items.
Journal of Marketing Research, Vol. 32, No. 4, 404-418.
Bill Merrilees and Dale Miller. (2001). Superstore interactivity: a new self-service paradigm of retail
service? International Journal of Retail & Distribution Management, Vol. 29, Number 8, 379-
389.
Byung-Do Kim, Kannan Srinivasan, Ronald T. Wilcox. (1999). Identifying Price Sensitive Consumers:
The Relative Merits of Demographic vs. Purchase Pattern information. Journal of Retailing,
Volume 75(2), 173-193.
Coenen, F. (2011). Data Mining: Past, Present and Future. The Knowledge Engineering Review, Vol.
26:1, 25-29.
D.W. Cheung, A.W. Fu, and J. Han. (1994). Knowledge discovery in databases: a rule based attribute-
oriented approach. The 8th International Symposium on Methodologies for Intelligent
Systems (ISMIS'94),, (pp. 164-173). Charlotte, North Carolina.
David R. Bell and James M. Lattin. (2008). Shopping Behavior and Consumer Preference for Store
Price Format: Why "Large Basket". Marketing Science, Vol. 17, No. 1, 66-88.
David R. Bell and Yasemin Boztu˘g. (2007). The positive and negative effects of inventory on category
purchase: An empirical analysis. Marketing Letters, 18, 1-14.
Page | 67
Eu-Hong (Sam) Han, George Karypis, Vipin Kumar. (1999). Scalable Parallel Data Mining for
Association Rules. IEEE Transactions on Knowledge and Data Engineering, vol.20.
Francis J. Mulhern and Robert P. Leone. (1991). Implicit Price Bundling of Retail Products: A
Multiproduct Approach to Maximizing Store. Journal of Marketing,Vol. 55, No. 4, 63-76.
Garry J.Russel, Wagner A. Kamakura. (1997). Modeling Multiple Category Brand Preference with
Household Basket Data. Journal of Retailing, Volume 73(4), 439-461.
Gary J Russell, Ann Petersen. (2000). Analysis of Cross-Category Dependence in Market Basket
Selection. Journal of Retailing, Vol.76(3), 367-392.
Gary J. Russel, Wagner A. Kamakura. (1997). Modeling Multiple Category Brand Preference with
Household Basket Data. Journal of Retailing, Volume 73(4), 439-461.
Gregory Piatetsky-Shapiro, William Frawley. (1991). Knowledge Discovery in Databases. AAAI/ MIT
Press.
Harald Hruschka, Martin Lukanowicz, Christian Buchta. (1999). Cross-category sales promotion
e¤ects. Journal of Retailing and Consumer Services, Volume 6, 99-105.
Jaihak Chung and Vithala R. Rao. (2003). A General Choice Model for Bundles with Multiple-Category
Products: Application to Market Segmentation and Optimal Pricing for Bundles. Journal of
Marketing Research, Vol. 40, No. 2 , 115- 130.
Jong Soo Park, Ming-Syan Chen, Philip S. Yu. (n.d.). Using a Hash-Based Method with Transaction
Trimming and Database Scan Reduction for Mining Association Rules. IEEE Transactions on
Knowledge and Data Engineering.
Julander, C.-R. (1992). Basket Analysis: A New Way of Analysing Scanner Data. International Journal
of Retail and Distribution Management, Volume 20 (7), 10-18.
Katrin Dippold, Harald Hruschka. (2010). Variable Selection for Market Basket Analysis. University of
Regensburg Working Papers in Business,Economics and Management Information Systems.
Kumar, N. (2009). Kill a brand, keep a customer. Harvard Business Review.
Lift in an association rule. (n.d.). Retrieved 07 23, 2013, from IBM:
http://pic.dhe.ibm.com/infocenter/db2luw/v9r7/index.jsp?topic=%2Fcom.ibm.im.model.do
c%2Fc_associations.html
M. Houtsma and A. Swami. (1993). Set Oriented Mining of Association Rules. San Jose, California:
IBM Almaden Research Center.
M.J.Zaki, M.Ogihara, S. Parthasarathy. (1996). Parallel Data Mining for Association Rules on Shared-
Memory Multi-processors. New York: University of Rochester.
Michael J.A.Berry, Gordon Linoff. (1997). Data Mining Techniques for Marketing, Sales and Customer
Support. John Wiley & Sons.
Page | 68
Nanda Kumar and Ram Rao. (2006). Using Basket Composition Data for Intelligent Supermarket
Pricing. Marketing Science, Vol. 25, No. 2, 188-199.
P. B. Seetharaman, Andrew Ainslie and Pradeep K. Chintagunta. (1999). Investigating Household
State Dependence Effects across Categories. Journal of Marketing Research, Vol. 36, No. 4,
488-500.
P.D. McNicholas, T.B. Murphy, M. O'Regan. (n.d.). Standardising the Lift of an Association Rule.
Ireland: Department of Statistics, Trinity College Dublin.
Pradeep K. Chintagunta and Sudeep Haldar. (1998). Investigating Purchase Timing Behaviour in Two
Related Product Categories. Journal of Marketing Research, Vol. 35, No. 1, 43-53.
Pradeep K. Chintagunta, Inseong Song. (2006). Measuring Cross-Category Price Effects with
Aggregate Store Data. Management Science, Vol. 52, No. 10, 1594–1609.
Puneet Manchanda, Asim Ansari and Sunil Gupta. (1999). The "Shopping Basket": A Model for
Multicategory Purchase Incidence Decisions. Marketing Science, Vol. 18, No. 2, 95-114.
Puneet Manchanda, Asim Ansari and Sunil Gupta. (1999). The "Shopping Basket": A Model for
Multicategory Purchase Incidence Decisions. Marketing Science, Vol. 18, No. 2, 95-114.
Qiankun Zhao, Sourav S. Bhowmick. (2003). Association Rule Mining: A Survey. Singapore: CAIS,
Nanyang Technological University, No. 2003116 ,.
R. Agrawal, T. Imielinski, and A. Swami. (1993). Mining Association Rules Between Sets of Items in
Large Databases. Proc. of the ACM SIGMOD Conference on Management of Data.
Washington D.C.
Rakesh Agrawal, Sirkant Ramakrishnan. (1994). Fast Algorithms for Mining Association Rules.
Proceedings of the 20th VLDB Conference. Santiago.
Rakesh Agrawal, Tomasz Imielinski, Arun Swami. (1993). Mining Association Rules between Sets of
Items in Large Databases. ACM SIGMOND Int'l Conference on Management Data, (pp. 207-
216).
Ramakrishnan Srikant, Rakesh Agrawal. (n.d.). Mining Generalised Association Rules. San Jose:
Almaden Research Center.
Rick L. Andrews , Imran S. Currim. (2002). Identifying segments with identical choice behaviors
across product categories: An Intercategory Logit Mixture model. International Journal of
Research in Marketing, 19, 65–79.
Rick L. Andrews , Imran S. Currim. (2002). Identifying segments with identical choice behaviors
across product categories: An Intercategory Logit Mixture model. Intern. J. of Research in
Marketing 19 , 65-79.
Robert J. Hilderman, Colin L. Carter, Howard J. Hamilton, and Nick Cercone. (n.d.). Mining Market
Basket Data Using Share Measures and Characterised Itemsets.
Page | 69
Robert J. Hilderman, Colin L. Carter, Howard J. Hamilton, and Nick Cercone. (n.d.). Mining Market
Basket Data Using Share Measures and Characterized Itemsets.
Siddhartha Chib, P. B. Seetharaman and Andrei Strijnev. (n.d.). Analysis of Multi-category Purchase
Incidence Decisions Using IRI Market Basket Data. Econometric Models in Marketing, Volume
16, 57-92.
Svetlozar Nestorov, Nenad Jukić. (2003). Ad-Hoc Association-Rule Mining within the Data
Warehouse. 36th Hawaii International Conference on System Sciences. Hawaii.
Szymon Jaroszewicz, Dan A. Simovici. (n.d.). Interestingness of Frequent Itemsets Using Bayesian
Networks as Background Knowledge.
Usama Fayyad, Gregory Piatetsky-Shapiro, and Padhraic Smyth. (1996). From Data Mining to
Knowledge Discovery in Databases. American Association for Artificial Intelligence.
Walters, R. G. (1991). Assessing the Impact of Retail Price Promotions on Product Substitution,
Complementary. Journal of Marketing, Vol. 55, No. 2, 17-28.
Yasemin Boztuğ , Thomas Reutterer. (2006). A Combined Approach for Segment- Specific Analysis of
Market Basket Data. SFB 649.
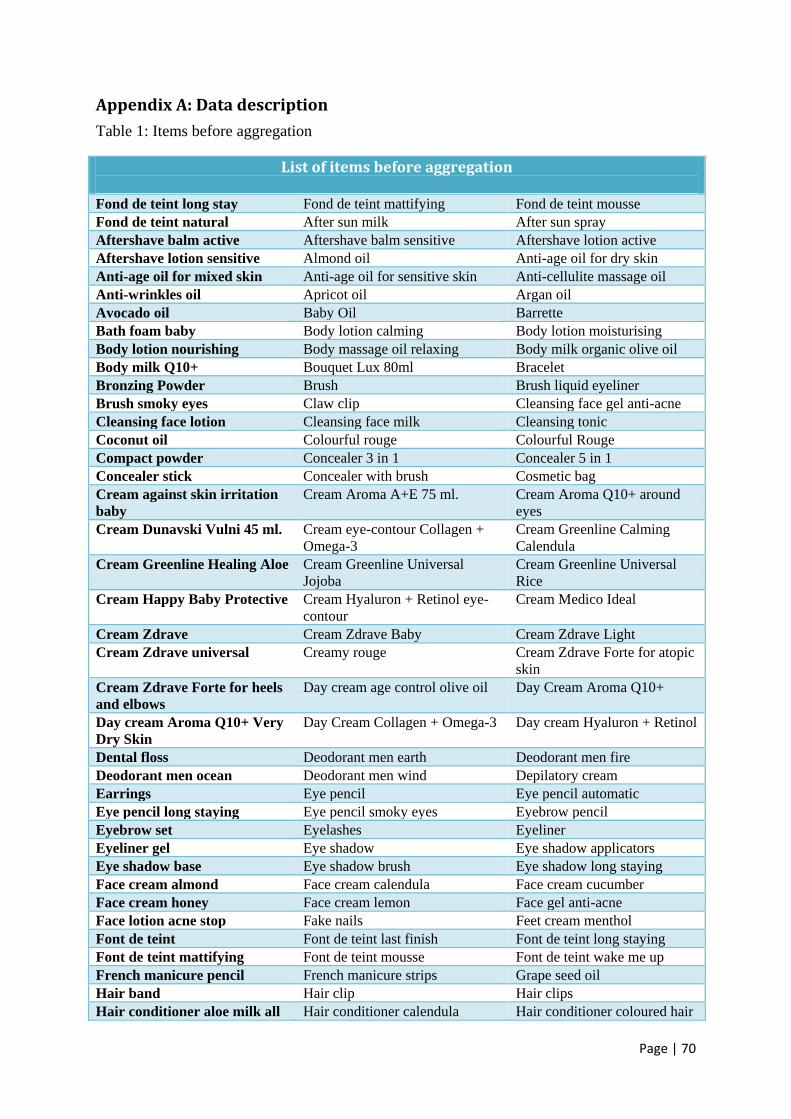
Page | 70
Appendix A: Data description
Table 1: Items before aggregation
List of items before aggregation
Fond de teint long stay Fond de teint mattifying Fond de teint mousse
Fond de teint natural After sun milk After sun spray
Aftershave balm active Aftershave balm sensitive Aftershave lotion active
Aftershave lotion sensitive Almond oil Anti-age oil for dry skin
Anti-age oil for mixed skin Anti-age oil for sensitive skin Anti-cellulite massage oil
Anti-wrinkles oil Apricot oil Argan oil
Avocado oil Baby Oil Barrette
Bath foam baby Body lotion calming Body lotion moisturising
Body lotion nourishing Body massage oil relaxing Body milk organic olive oil
Body milk Q10+ Bouquet Lux 80ml Bracelet
Bronzing Powder Brush Brush liquid eyeliner
Brush smoky eyes Claw clip Cleansing face gel anti-acne
Cleansing face lotion Cleansing face milk Cleansing tonic
Coconut oil Colourful rouge Colourful Rouge
Compact powder Concealer 3 in 1 Concealer 5 in 1
Concealer stick Concealer with brush Cosmetic bag
Cream against skin irritation
baby
Cream Aroma A+E 75 ml. Cream Aroma Q10+ around
eyes
Cream Dunavski Vulni 45 ml. Cream eye-contour Collagen +
Omega-3
Cream Greenline Calming
Calendula
Cream Greenline Healing Aloe Cream Greenline Universal
Jojoba
Cream Greenline Universal
Rice
Cream Happy Baby Protective Cream Hyaluron + Retinol eye-
contour
Cream Medico Ideal
Cream Zdrave Cream Zdrave Baby Cream Zdrave Light
Cream Zdrave universal Creamy rouge Cream Zdrave Forte for atopic
skin
Cream Zdrave Forte for heels
and elbows
Day cream age control olive oil Day Cream Aroma Q10+
Day cream Aroma Q10+ Very
Dry Skin
Day Cream Collagen + Omega-3 Day cream Hyaluron + Retinol
Dental floss Deodorant men earth Deodorant men fire
Deodorant men ocean Deodorant men wind Depilatory cream
Earrings Eye pencil Eye pencil automatic
Eye pencil long staying Eye pencil smoky eyes Eyebrow pencil
Eyebrow set Eyelashes Eyeliner
Eyeliner gel Eye shadow Eye shadow applicators
Eye shadow base Eye shadow brush Eye shadow long staying
Face cream almond Face cream calendula Face cream cucumber
Face cream honey Face cream lemon Face gel anti-acne
Face lotion acne stop Fake nails Feet cream menthol
Font de teint Font de teint last finish Font de teint long staying
Font de teint mattifying Font de teint mousse Font de teint wake me up
French manicure pencil French manicure strips Grape seed oil
Hair band Hair clip Hair clips
Hair conditioner aloe milk all Hair conditioner calendula Hair conditioner coloured hair
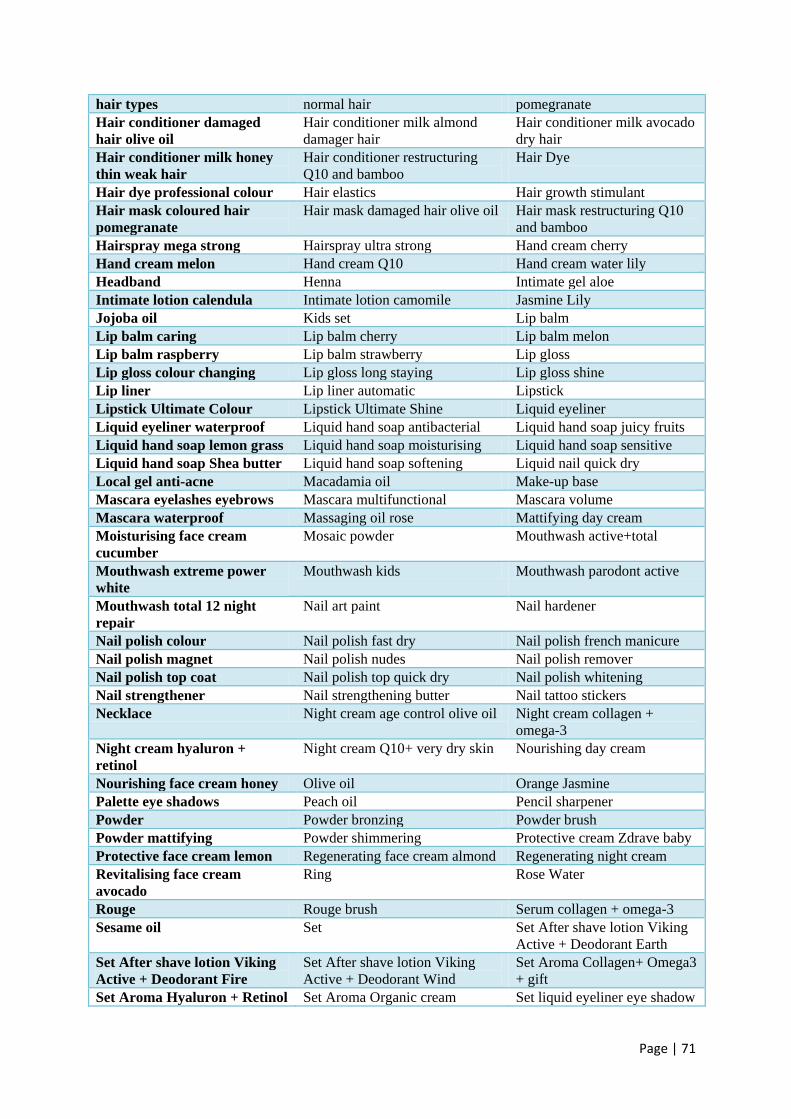
Page | 71
hair types normal hair pomegranate
Hair conditioner damaged
hair olive oil
Hair conditioner milk almond
damager hair
Hair conditioner milk avocado
dry hair
Hair conditioner milk honey
thin weak hair
Hair conditioner restructuring
Q10 and bamboo
Hair Dye
Hair dye professional colour Hair elastics Hair growth stimulant
Hair mask coloured hair
pomegranate
Hair mask damaged hair olive oil Hair mask restructuring Q10
and bamboo
Hairspray mega strong Hairspray ultra strong Hand cream cherry
Hand cream melon Hand cream Q10 Hand cream water lily
Headband Henna Intimate gel aloe
Intimate lotion calendula Intimate lotion camomile Jasmine Lily
Jojoba oil Kids set Lip balm
Lip balm caring Lip balm cherry Lip balm melon
Lip balm raspberry Lip balm strawberry Lip gloss
Lip gloss colour changing Lip gloss long staying Lip gloss shine
Lip liner Lip liner automatic Lipstick
Lipstick Ultimate Colour Lipstick Ultimate Shine Liquid eyeliner
Liquid eyeliner waterproof Liquid hand soap antibacterial Liquid hand soap juicy fruits
Liquid hand soap lemon grass Liquid hand soap moisturising Liquid hand soap sensitive
Liquid hand soap Shea butter Liquid hand soap softening Liquid nail quick dry
Local gel anti-acne Macadamia oil Make-up base
Mascara eyelashes eyebrows Mascara multifunctional Mascara volume
Mascara waterproof Massaging oil rose Mattifying day cream
Moisturising face cream
cucumber
Mosaic powder Mouthwash active+total
Mouthwash extreme power
white
Mouthwash kids Mouthwash parodont active
Mouthwash total 12 night
repair
Nail art paint Nail hardener
Nail polish colour Nail polish fast dry Nail polish french manicure
Nail polish magnet Nail polish nudes Nail polish remover
Nail polish top coat Nail polish top quick dry Nail polish whitening
Nail strengthener Nail strengthening butter Nail tattoo stickers
Necklace Night cream age control olive oil Night cream collagen +
omega-3
Night cream hyaluron +
retinol
Night cream Q10+ very dry skin Nourishing day cream
Nourishing face cream honey Olive oil Orange Jasmine
Palette eye shadows Peach oil Pencil sharpener
Powder Powder bronzing Powder brush
Powder mattifying Powder shimmering Protective cream Zdrave baby
Protective face cream lemon Regenerating face cream almond Regenerating night cream
Revitalising face cream
avocado
Ring Rose Water
Rouge Rouge brush Serum collagen + omega-3
Sesame oil Set Set After shave lotion Viking
Active + Deodorant Earth
Set After shave lotion Viking
Active + Deodorant Fire
Set After shave lotion Viking
Active + Deodorant Wind
Set Aroma Collagen+ Omega3
+ gift
Set Aroma Hyaluron + Retinol Set Aroma Organic cream Set liquid eyeliner eye shadow
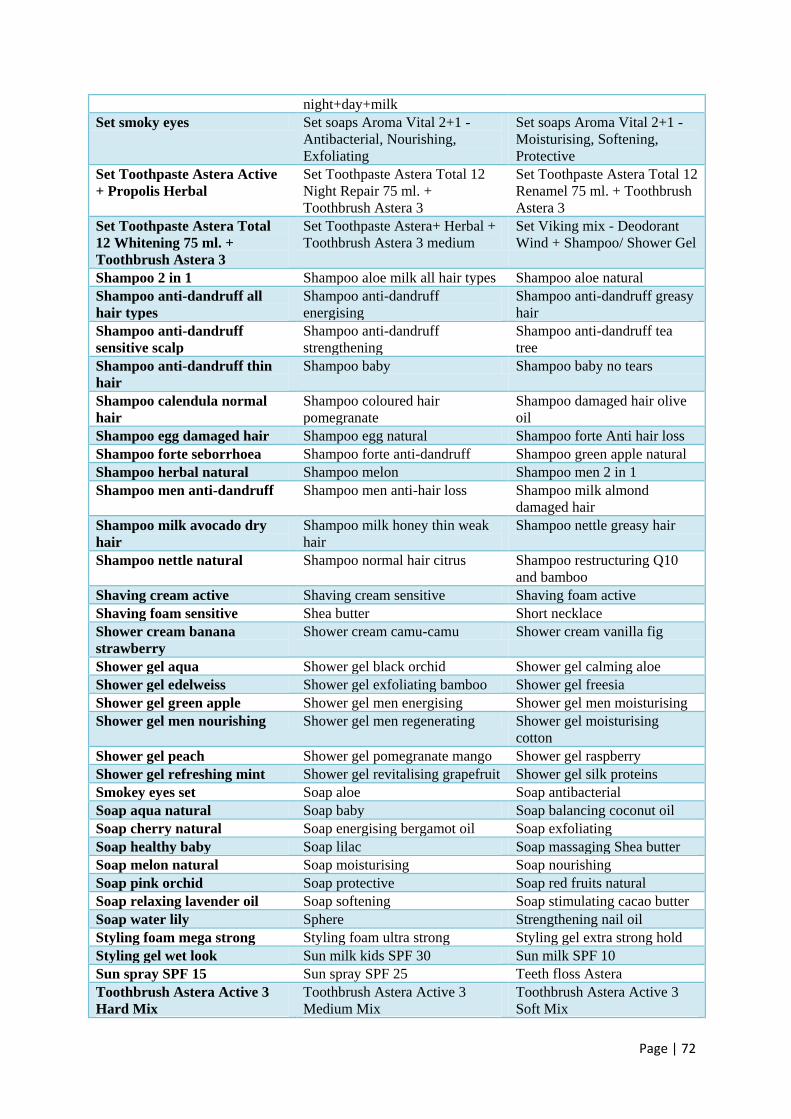
Page | 72
night+day+milk
Set smoky eyes Set soaps Aroma Vital 2+1 -
Antibacterial, Nourishing,
Exfoliating
Set soaps Aroma Vital 2+1 -
Moisturising, Softening,
Protective
Set Toothpaste Astera Active
+ Propolis Herbal
Set Toothpaste Astera Total 12
Night Repair 75 ml. +
Toothbrush Astera 3
Set Toothpaste Astera Total 12
Renamel 75 ml. + Toothbrush
Astera 3
Set Toothpaste Astera Total
12 Whitening 75 ml. +
Toothbrush Astera 3
Set Toothpaste Astera+ Herbal +
Toothbrush Astera 3 medium
Set Viking mix - Deodorant
Wind + Shampoo/ Shower Gel
Shampoo 2 in 1 Shampoo aloe milk all hair types Shampoo aloe natural
Shampoo anti-dandruff all
hair types
Shampoo anti-dandruff
energising
Shampoo anti-dandruff greasy
hair
Shampoo anti-dandruff
sensitive scalp
Shampoo anti-dandruff
strengthening
Shampoo anti-dandruff tea
tree
Shampoo anti-dandruff thin
hair
Shampoo baby Shampoo baby no tears
Shampoo calendula normal
hair
Shampoo coloured hair
pomegranate
Shampoo damaged hair olive
oil
Shampoo egg damaged hair Shampoo egg natural Shampoo forte Anti hair loss
Shampoo forte seborrhoea Shampoo forte anti-dandruff Shampoo green apple natural
Shampoo herbal natural Shampoo melon Shampoo men 2 in 1
Shampoo men anti-dandruff Shampoo men anti-hair loss Shampoo milk almond
damaged hair
Shampoo milk avocado dry
hair
Shampoo milk honey thin weak
hair
Shampoo nettle greasy hair
Shampoo nettle natural Shampoo normal hair citrus Shampoo restructuring Q10
and bamboo
Shaving cream active Shaving cream sensitive Shaving foam active
Shaving foam sensitive Shea butter Short necklace
Shower cream banana
strawberry
Shower cream camu-camu Shower cream vanilla fig
Shower gel aqua Shower gel black orchid Shower gel calming aloe
Shower gel edelweiss Shower gel exfoliating bamboo Shower gel freesia
Shower gel green apple Shower gel men energising Shower gel men moisturising
Shower gel men nourishing Shower gel men regenerating Shower gel moisturising
cotton
Shower gel peach Shower gel pomegranate mango Shower gel raspberry
Shower gel refreshing mint Shower gel revitalising grapefruit Shower gel silk proteins
Smokey eyes set Soap aloe Soap antibacterial
Soap aqua natural Soap baby Soap balancing coconut oil
Soap cherry natural Soap energising bergamot oil Soap exfoliating
Soap healthy baby Soap lilac Soap massaging Shea butter
Soap melon natural Soap moisturising Soap nourishing
Soap pink orchid Soap protective Soap red fruits natural
Soap relaxing lavender oil Soap softening Soap stimulating cacao butter
Soap water lily Sphere Strengthening nail oil
Styling foam mega strong Styling foam ultra strong Styling gel extra strong hold
Styling gel wet look Sun milk kids SPF 30 Sun milk SPF 10
Sun spray SPF 15 Sun spray SPF 25 Teeth floss Astera
Toothbrush Astera Active 3
Hard Mix
Toothbrush Astera Active 3
Medium Mix
Toothbrush Astera Active 3
Soft Mix
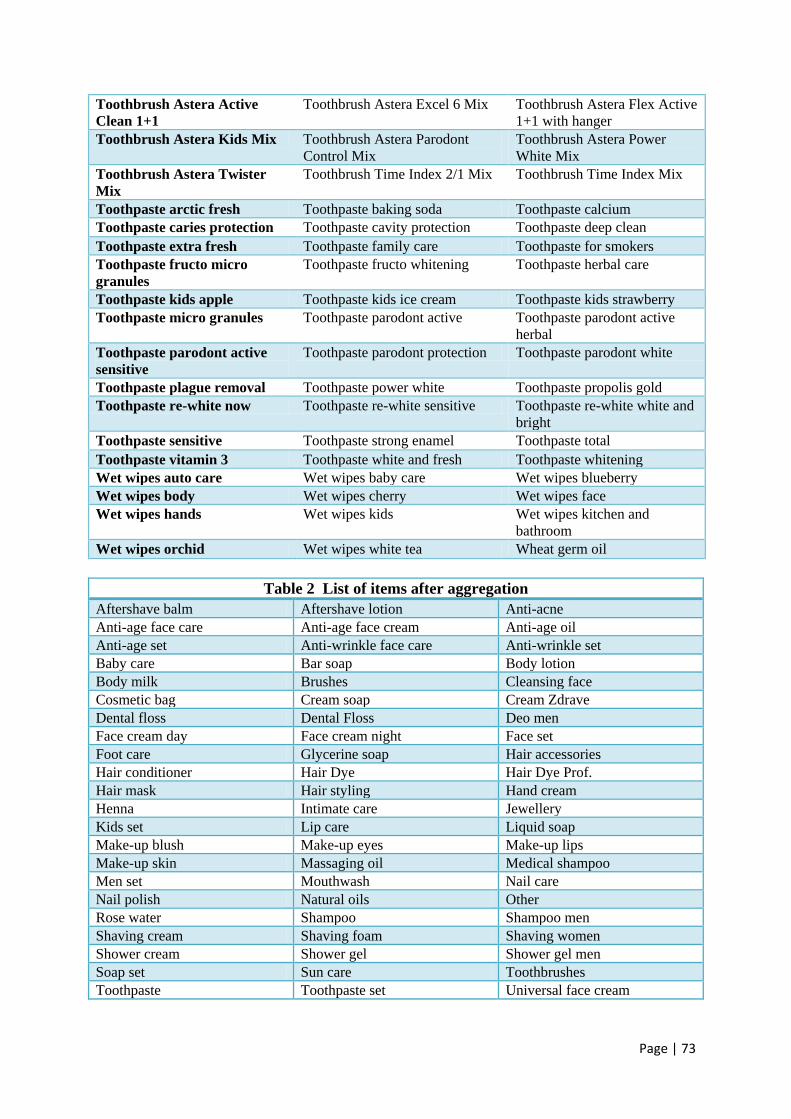
Page | 73
Toothbrush Astera Active
Clean 1+1
Toothbrush Astera Excel 6 Mix Toothbrush Astera Flex Active
1+1 with hanger
Toothbrush Astera Kids Mix Toothbrush Astera Parodont
Control Mix
Toothbrush Astera Power
White Mix
Toothbrush Astera Twister
Mix
Toothbrush Time Index 2/1 Mix Toothbrush Time Index Mix
Toothpaste arctic fresh Toothpaste baking soda Toothpaste calcium
Toothpaste caries protection Toothpaste cavity protection Toothpaste deep clean
Toothpaste extra fresh Toothpaste family care Toothpaste for smokers
Toothpaste fructo micro
granules
Toothpaste fructo whitening Toothpaste herbal care
Toothpaste kids apple Toothpaste kids ice cream Toothpaste kids strawberry
Toothpaste micro granules Toothpaste parodont active Toothpaste parodont active
herbal
Toothpaste parodont active
sensitive
Toothpaste parodont protection Toothpaste parodont white
Toothpaste plague removal Toothpaste power white Toothpaste propolis gold
Toothpaste re-white now Toothpaste re-white sensitive Toothpaste re-white white and
bright
Toothpaste sensitive Toothpaste strong enamel Toothpaste total
Toothpaste vitamin 3 Toothpaste white and fresh Toothpaste whitening
Wet wipes auto care Wet wipes baby care Wet wipes blueberry
Wet wipes body Wet wipes cherry Wet wipes face
Wet wipes hands Wet wipes kids Wet wipes kitchen and
bathroom
Wet wipes orchid Wet wipes white tea Wheat germ oil
Table 2 List of items after aggregation
Aftershave balm Aftershave lotion Anti-acne
Anti-age face care Anti-age face cream Anti-age oil
Anti-age set Anti-wrinkle face care Anti-wrinkle set
Baby care Bar soap Body lotion
Body milk Brushes Cleansing face
Cosmetic bag Cream soap Cream Zdrave
Dental floss Dental Floss Deo men
Face cream day Face cream night Face set
Foot care Glycerine soap Hair accessories
Hair conditioner Hair Dye Hair Dye Prof.
Hair mask Hair styling Hand cream
Henna Intimate care Jewellery
Kids set Lip care Liquid soap
Make-up blush Make-up eyes Make-up lips
Make-up skin Massaging oil Medical shampoo
Men set Mouthwash Nail care
Nail polish Natural oils Other
Rose water Shampoo Shampoo men
Shaving cream Shaving foam Shaving women
Shower cream Shower gel Shower gel men
Soap set Sun care Toothbrushes
Toothpaste Toothpaste set Universal face cream
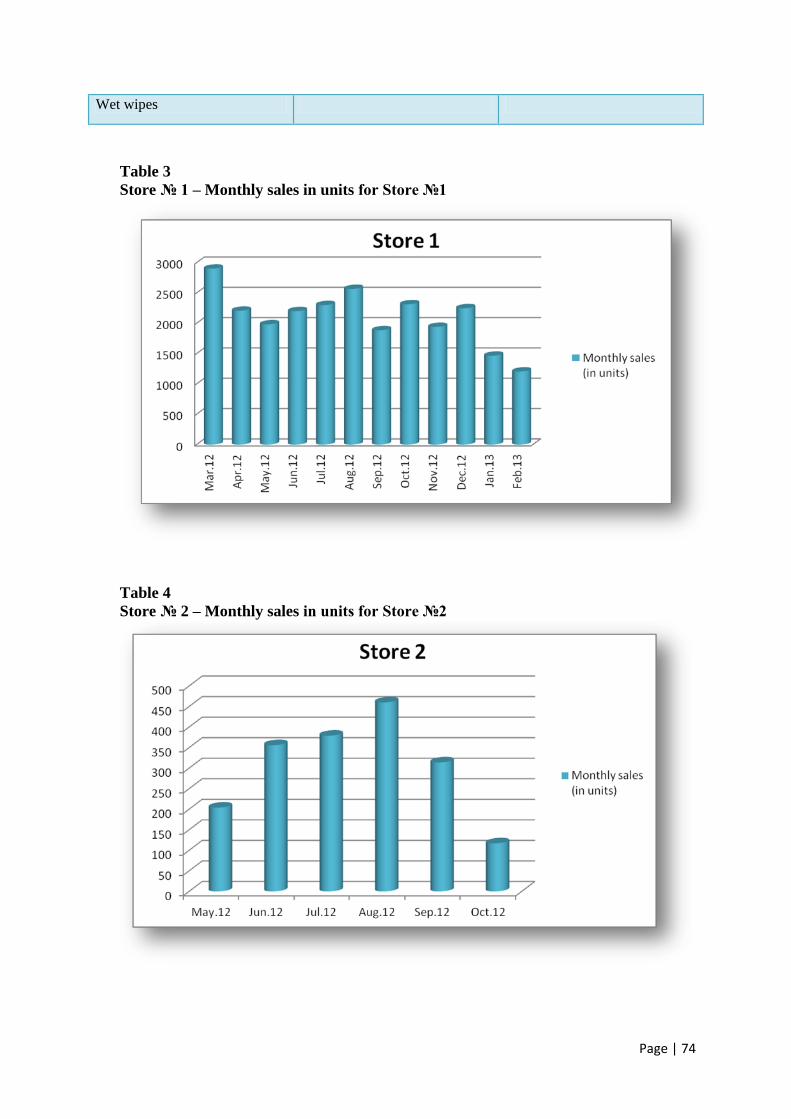
Page | 74
Wet wipes
Table 3
Store № 1 – Monthly sales in units for Store №1
Table 4
Store № 2 – Monthly sales in units for Store №2
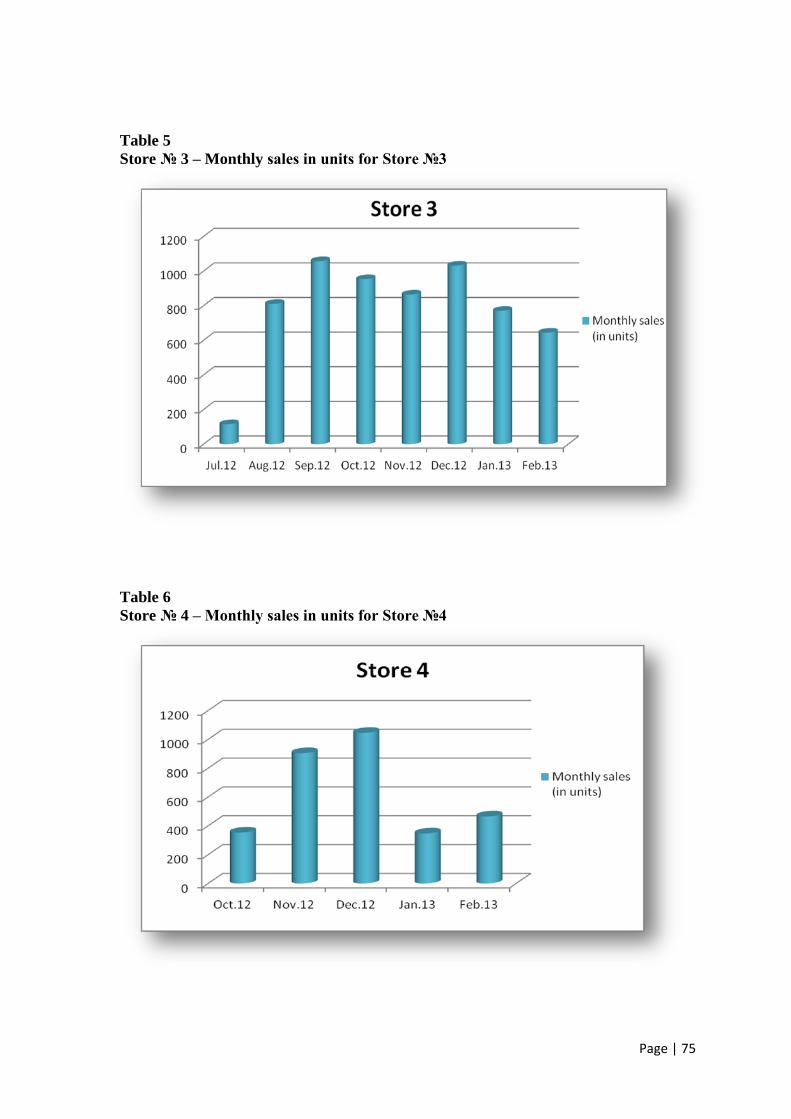
Page | 75
Table 5
Store № 3 – Monthly sales in units for Store №3
Table 6
Store № 4 – Monthly sales in units for Store №4
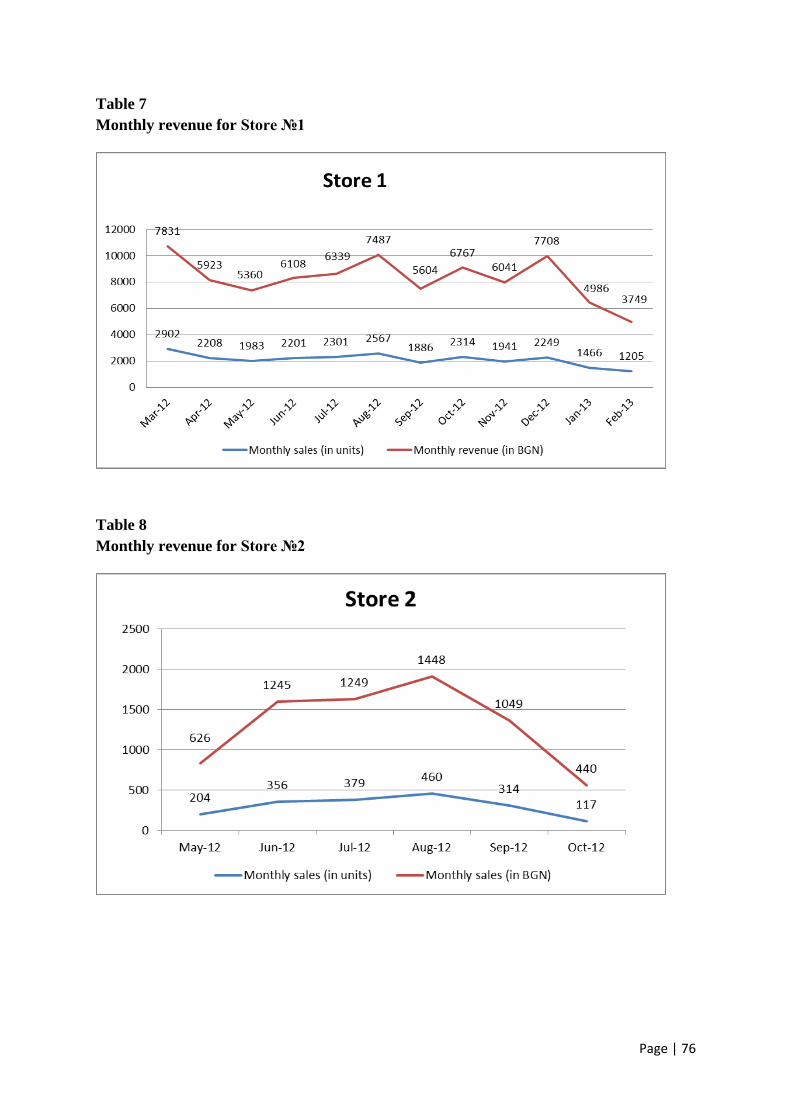
Page | 76
Table 7
Monthly revenue for Store №1
Table 8
Monthly revenue for Store №2
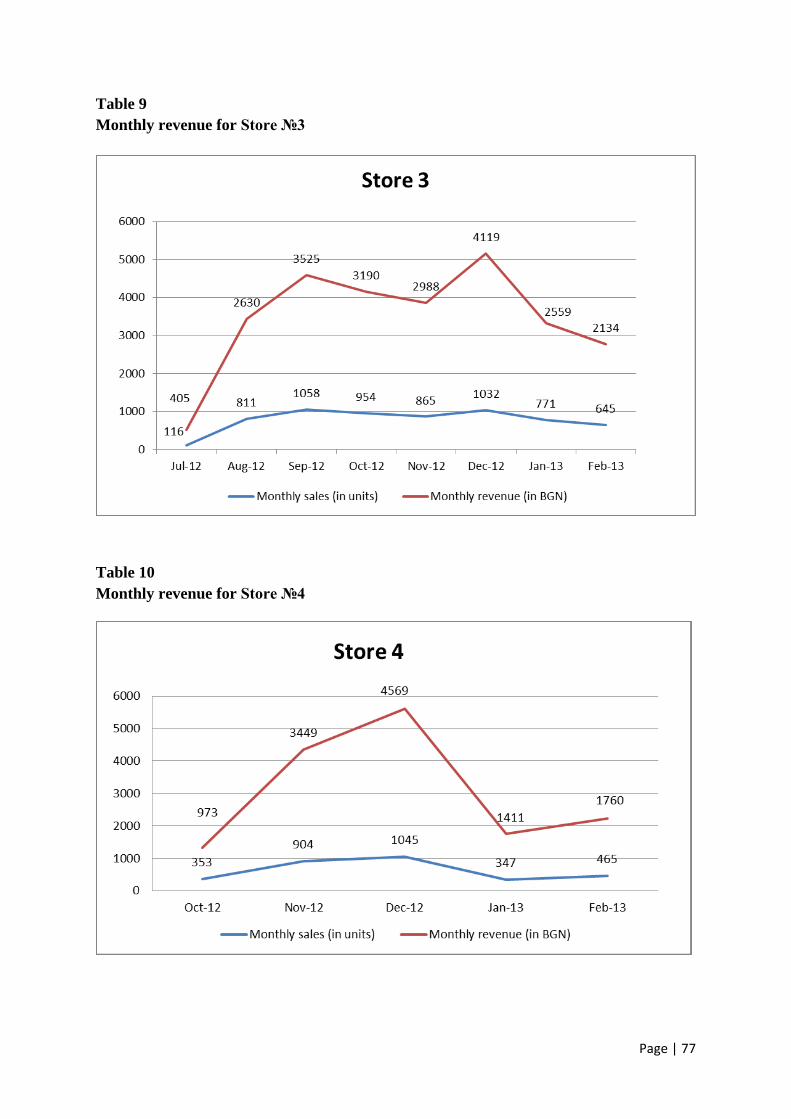
Page | 77
Table 9
Monthly revenue for Store №3
Table 10
Monthly revenue for Store №4
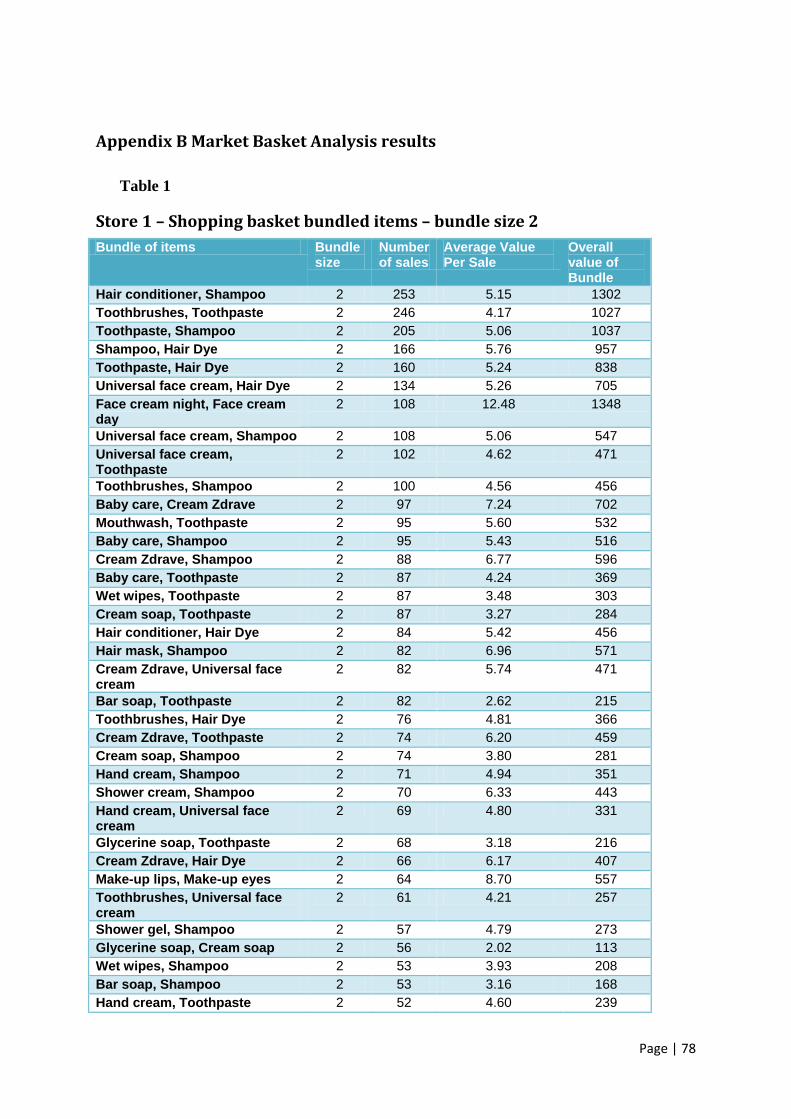
Page | 78
Appendix B Market Basket Analysis results
Table 1
Store 1 – Shopping basket bundled items – bundle size 2
Bundle of items Bundle size
Number of sales
Average Value Per Sale
Overall value of Bundle
Hair conditioner, Shampoo 2 253 5.15 1302
Toothbrushes, Toothpaste 2 246 4.17 1027
Toothpaste, Shampoo 2 205 5.06 1037
Shampoo, Hair Dye 2 166 5.76 957
Toothpaste, Hair Dye 2 160 5.24 838
Universal face cream, Hair Dye 2 134 5.26 705
Face cream night, Face cream day
2 108 12.48 1348
Universal face cream, Shampoo 2 108 5.06 547
Universal face cream, Toothpaste
2 102 4.62 471
Toothbrushes, Shampoo 2 100 4.56 456
Baby care, Cream Zdrave 2 97 7.24 702
Mouthwash, Toothpaste 2 95 5.60 532
Baby care, Shampoo 2 95 5.43 516
Cream Zdrave, Shampoo 2 88 6.77 596
Baby care, Toothpaste 2 87 4.24 369
Wet wipes, Toothpaste 2 87 3.48 303
Cream soap, Toothpaste 2 87 3.27 284
Hair conditioner, Hair Dye 2 84 5.42 456
Hair mask, Shampoo 2 82 6.96 571
Cream Zdrave, Universal face cream
2 82 5.74 471
Bar soap, Toothpaste 2 82 2.62 215
Toothbrushes, Hair Dye 2 76 4.81 366
Cream Zdrave, Toothpaste 2 74 6.20 459
Cream soap, Shampoo 2 74 3.80 281
Hand cream, Shampoo 2 71 4.94 351
Shower cream, Shampoo 2 70 6.33 443
Hand cream, Universal face cream
2 69 4.80 331
Glycerine soap, Toothpaste 2 68 3.18 216
Cream Zdrave, Hair Dye 2 66 6.17 407
Make-up lips, Make-up eyes 2 64 8.70 557
Toothbrushes, Universal face cream
2 61 4.21 257
Shower gel, Shampoo 2 57 4.79 273
Glycerine soap, Cream soap 2 56 2.02 113
Wet wipes, Shampoo 2 53 3.93 208
Bar soap, Shampoo 2 53 3.16 168
Hand cream, Toothpaste 2 52 4.60 239
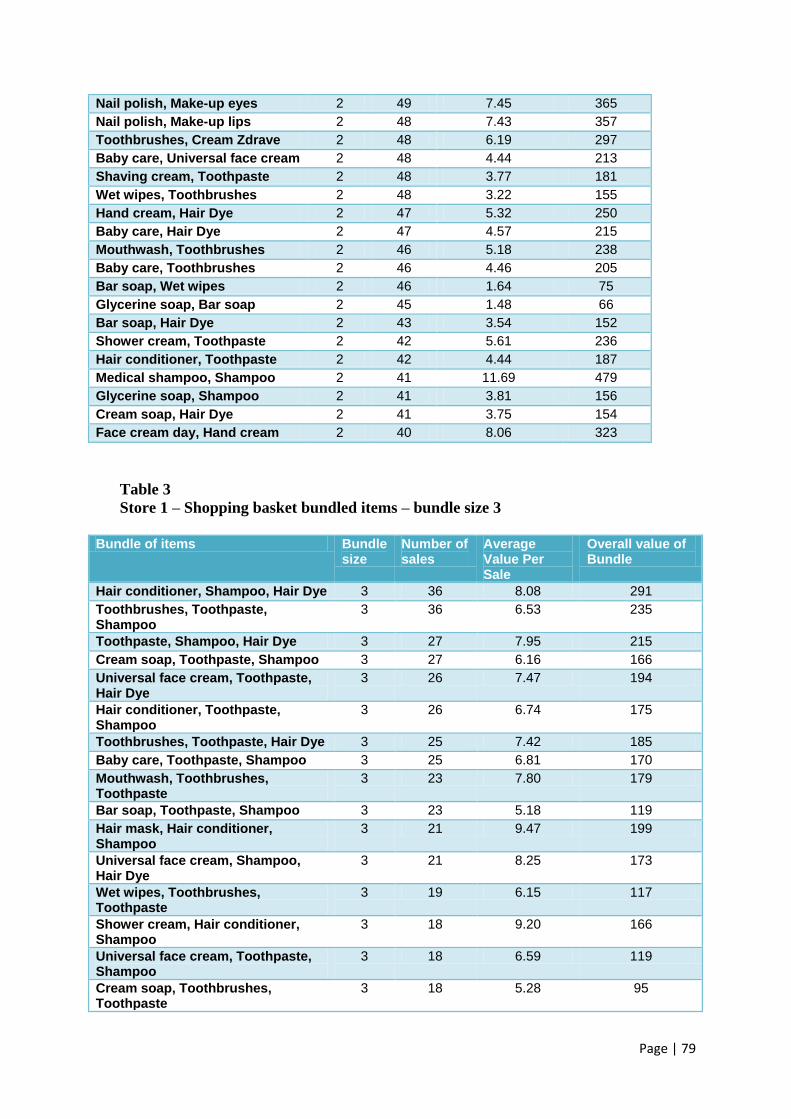
Page | 79
Nail polish, Make-up eyes 2 49 7.45 365
Nail polish, Make-up lips 2 48 7.43 357
Toothbrushes, Cream Zdrave 2 48 6.19 297
Baby care, Universal face cream 2 48 4.44 213
Shaving cream, Toothpaste 2 48 3.77 181
Wet wipes, Toothbrushes 2 48 3.22 155
Hand cream, Hair Dye 2 47 5.32 250
Baby care, Hair Dye 2 47 4.57 215
Mouthwash, Toothbrushes 2 46 5.18 238
Baby care, Toothbrushes 2 46 4.46 205
Bar soap, Wet wipes 2 46 1.64 75
Glycerine soap, Bar soap 2 45 1.48 66
Bar soap, Hair Dye 2 43 3.54 152
Shower cream, Toothpaste 2 42 5.61 236
Hair conditioner, Toothpaste 2 42 4.44 187
Medical shampoo, Shampoo 2 41 11.69 479
Glycerine soap, Shampoo 2 41 3.81 156
Cream soap, Hair Dye 2 41 3.75 154
Face cream day, Hand cream 2 40 8.06 323
Table 3
Store 1 – Shopping basket bundled items – bundle size 3
Bundle of items Bundle
size Number of sales
Average Value Per Sale
Overall value of Bundle
Hair conditioner, Shampoo, Hair Dye 3 36 8.08 291
Toothbrushes, Toothpaste, Shampoo
3 36 6.53 235
Toothpaste, Shampoo, Hair Dye 3 27 7.95 215
Cream soap, Toothpaste, Shampoo 3 27 6.16 166
Universal face cream, Toothpaste, Hair Dye
3 26 7.47 194
Hair conditioner, Toothpaste, Shampoo
3 26 6.74 175
Toothbrushes, Toothpaste, Hair Dye 3 25 7.42 185
Baby care, Toothpaste, Shampoo 3 25 6.81 170
Mouthwash, Toothbrushes, Toothpaste
3 23 7.80 179
Bar soap, Toothpaste, Shampoo 3 23 5.18 119
Hair mask, Hair conditioner, Shampoo
3 21 9.47 199
Universal face cream, Shampoo, Hair Dye
3 21 8.25 173
Wet wipes, Toothbrushes, Toothpaste
3 19 6.15 117
Shower cream, Hair conditioner, Shampoo
3 18 9.20 166
Universal face cream, Toothpaste, Shampoo
3 18 6.59 119
Cream soap, Toothbrushes, Toothpaste
3 18 5.28 95
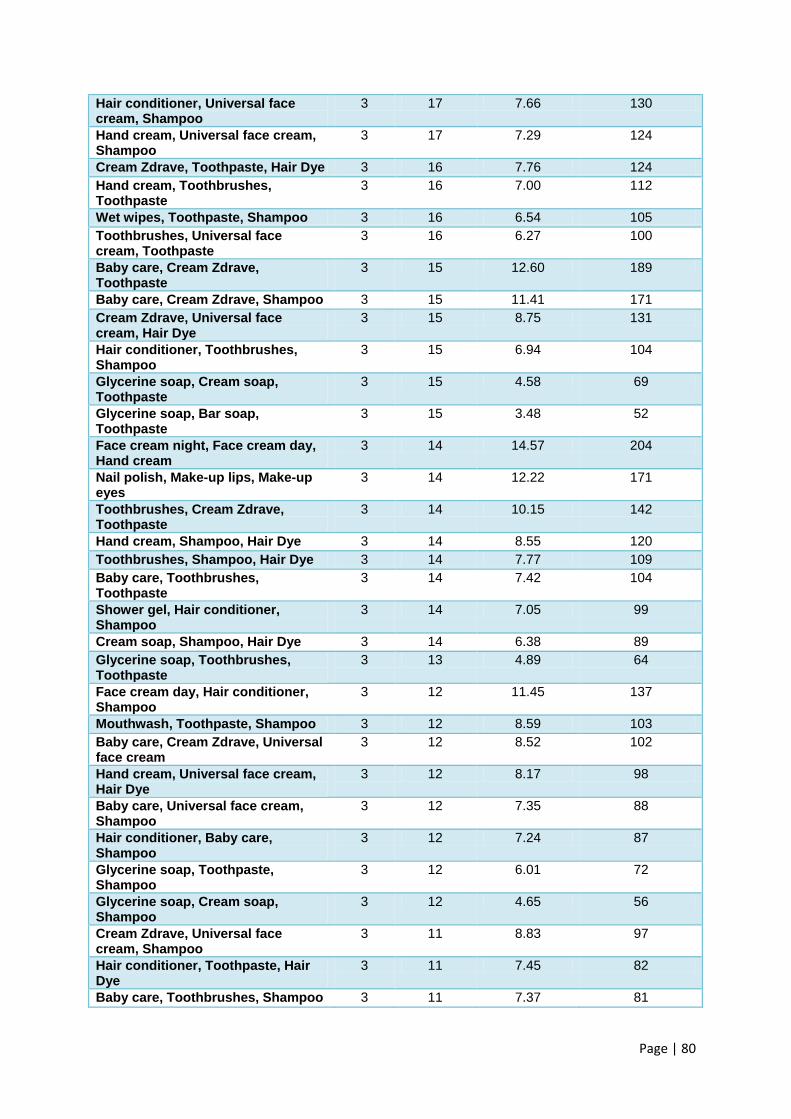
Page | 80
Hair conditioner, Universal face cream, Shampoo
3 17 7.66 130
Hand cream, Universal face cream, Shampoo
3 17 7.29 124
Cream Zdrave, Toothpaste, Hair Dye 3 16 7.76 124
Hand cream, Toothbrushes, Toothpaste
3 16 7.00 112
Wet wipes, Toothpaste, Shampoo 3 16 6.54 105
Toothbrushes, Universal face cream, Toothpaste
3 16 6.27 100
Baby care, Cream Zdrave, Toothpaste
3 15 12.60 189
Baby care, Cream Zdrave, Shampoo 3 15 11.41 171
Cream Zdrave, Universal face cream, Hair Dye
3 15 8.75 131
Hair conditioner, Toothbrushes, Shampoo
3 15 6.94 104
Glycerine soap, Cream soap, Toothpaste
3 15 4.58 69
Glycerine soap, Bar soap, Toothpaste
3 15 3.48 52
Face cream night, Face cream day, Hand cream
3 14 14.57 204
Nail polish, Make-up lips, Make-up eyes
3 14 12.22 171
Toothbrushes, Cream Zdrave, Toothpaste
3 14 10.15 142
Hand cream, Shampoo, Hair Dye 3 14 8.55 120
Toothbrushes, Shampoo, Hair Dye 3 14 7.77 109
Baby care, Toothbrushes, Toothpaste
3 14 7.42 104
Shower gel, Hair conditioner, Shampoo
3 14 7.05 99
Cream soap, Shampoo, Hair Dye 3 14 6.38 89
Glycerine soap, Toothbrushes, Toothpaste
3 13 4.89 64
Face cream day, Hair conditioner, Shampoo
3 12 11.45 137
Mouthwash, Toothpaste, Shampoo 3 12 8.59 103
Baby care, Cream Zdrave, Universal face cream
3 12 8.52 102
Hand cream, Universal face cream, Hair Dye
3 12 8.17 98
Baby care, Universal face cream, Shampoo
3 12 7.35 88
Hair conditioner, Baby care, Shampoo
3 12 7.24 87
Glycerine soap, Toothpaste, Shampoo
3 12 6.01 72
Glycerine soap, Cream soap, Shampoo
3 12 4.65 56
Cream Zdrave, Universal face cream, Shampoo
3 11 8.83 97
Hair conditioner, Toothpaste, Hair Dye
3 11 7.45 82
Baby care, Toothbrushes, Shampoo 3 11 7.37 81
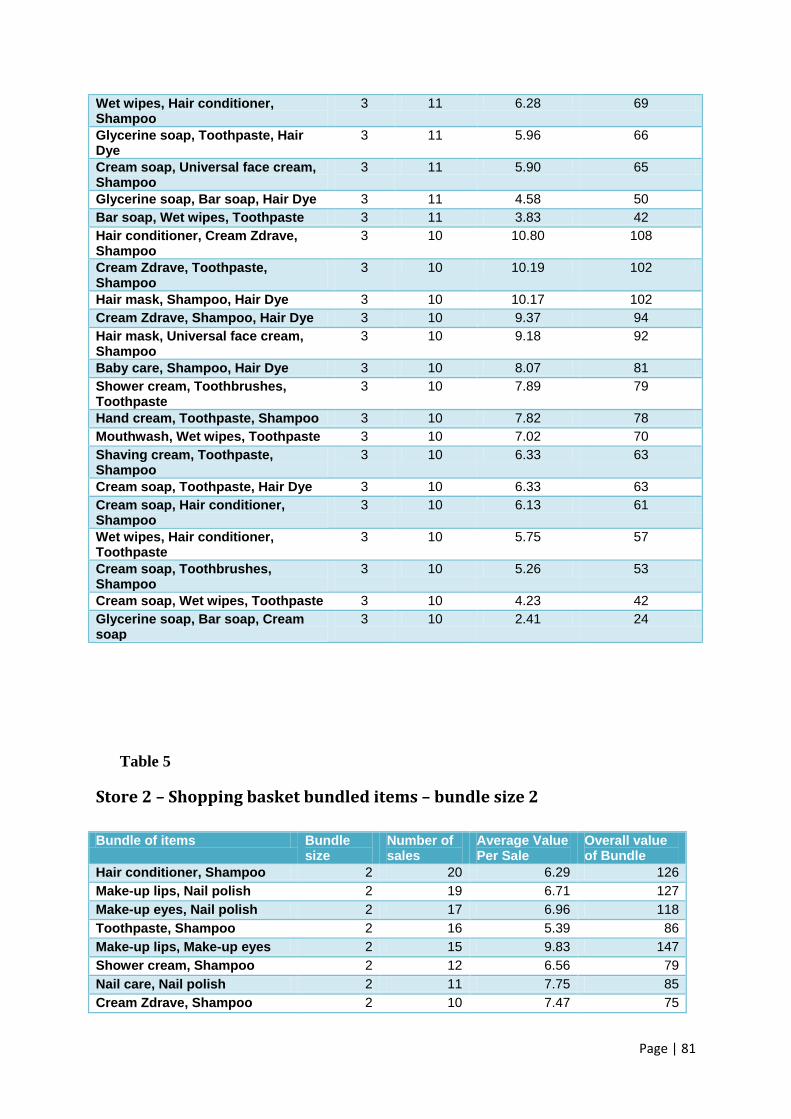
Page | 81
Wet wipes, Hair conditioner, Shampoo
3 11 6.28 69
Glycerine soap, Toothpaste, Hair Dye
3 11 5.96 66
Cream soap, Universal face cream, Shampoo
3 11 5.90 65
Glycerine soap, Bar soap, Hair Dye 3 11 4.58 50
Bar soap, Wet wipes, Toothpaste 3 11 3.83 42
Hair conditioner, Cream Zdrave, Shampoo
3 10 10.80 108
Cream Zdrave, Toothpaste, Shampoo
3 10 10.19 102
Hair mask, Shampoo, Hair Dye 3 10 10.17 102
Cream Zdrave, Shampoo, Hair Dye 3 10 9.37 94
Hair mask, Universal face cream, Shampoo
3 10 9.18 92
Baby care, Shampoo, Hair Dye 3 10 8.07 81
Shower cream, Toothbrushes, Toothpaste
3 10 7.89 79
Hand cream, Toothpaste, Shampoo 3 10 7.82 78
Mouthwash, Wet wipes, Toothpaste 3 10 7.02 70
Shaving cream, Toothpaste, Shampoo
3 10 6.33 63
Cream soap, Toothpaste, Hair Dye 3 10 6.33 63
Cream soap, Hair conditioner, Shampoo
3 10 6.13 61
Wet wipes, Hair conditioner, Toothpaste
3 10 5.75 57
Cream soap, Toothbrushes, Shampoo
3 10 5.26 53
Cream soap, Wet wipes, Toothpaste 3 10 4.23 42
Glycerine soap, Bar soap, Cream soap
3 10 2.41 24
Table 5
Store 2 – Shopping basket bundled items – bundle size 2
Bundle of items Bundle
size Number of sales
Average Value Per Sale
Overall value of Bundle
Hair conditioner, Shampoo 2 20 6.29 126
Make-up lips, Nail polish 2 19 6.71 127
Make-up eyes, Nail polish 2 17 6.96 118
Toothpaste, Shampoo 2 16 5.39 86
Make-up lips, Make-up eyes 2 15 9.83 147
Shower cream, Shampoo 2 12 6.56 79
Nail care, Nail polish 2 11 7.75 85
Cream Zdrave, Shampoo 2 10 7.47 75
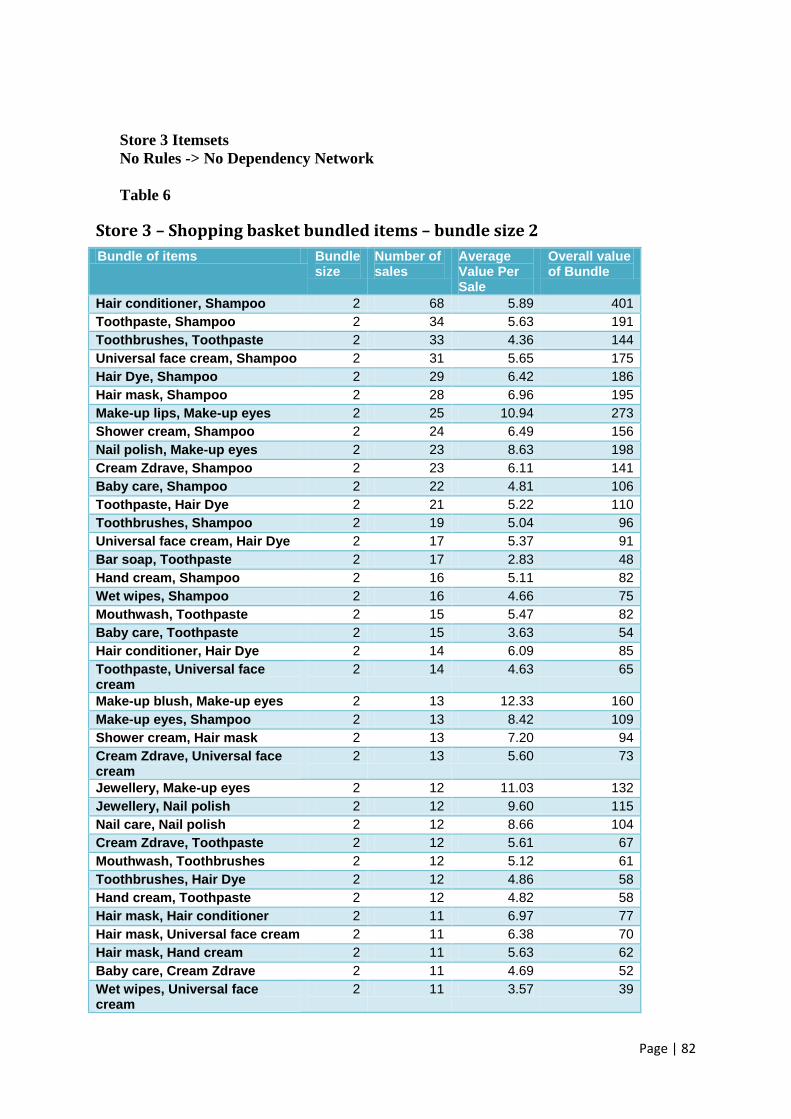
Page | 82
Store 3 Itemsets
No Rules -> No Dependency Network
Table 6
Store 3 – Shopping basket bundled items – bundle size 2
Bundle of items Bundle size
Number of sales
Average Value Per Sale
Overall value of Bundle
Hair conditioner, Shampoo 2 68 5.89 401
Toothpaste, Shampoo 2 34 5.63 191
Toothbrushes, Toothpaste 2 33 4.36 144
Universal face cream, Shampoo 2 31 5.65 175
Hair Dye, Shampoo 2 29 6.42 186
Hair mask, Shampoo 2 28 6.96 195
Make-up lips, Make-up eyes 2 25 10.94 273
Shower cream, Shampoo 2 24 6.49 156
Nail polish, Make-up eyes 2 23 8.63 198
Cream Zdrave, Shampoo 2 23 6.11 141
Baby care, Shampoo 2 22 4.81 106
Toothpaste, Hair Dye 2 21 5.22 110
Toothbrushes, Shampoo 2 19 5.04 96
Universal face cream, Hair Dye 2 17 5.37 91
Bar soap, Toothpaste 2 17 2.83 48
Hand cream, Shampoo 2 16 5.11 82
Wet wipes, Shampoo 2 16 4.66 75
Mouthwash, Toothpaste 2 15 5.47 82
Baby care, Toothpaste 2 15 3.63 54
Hair conditioner, Hair Dye 2 14 6.09 85
Toothpaste, Universal face cream
2 14 4.63 65
Make-up blush, Make-up eyes 2 13 12.33 160
Make-up eyes, Shampoo 2 13 8.42 109
Shower cream, Hair mask 2 13 7.20 94
Cream Zdrave, Universal face cream
2 13 5.60 73
Jewellery, Make-up eyes 2 12 11.03 132
Jewellery, Nail polish 2 12 9.60 115
Nail care, Nail polish 2 12 8.66 104
Cream Zdrave, Toothpaste 2 12 5.61 67
Mouthwash, Toothbrushes 2 12 5.12 61
Toothbrushes, Hair Dye 2 12 4.86 58
Hand cream, Toothpaste 2 12 4.82 58
Hair mask, Hair conditioner 2 11 6.97 77
Hair mask, Universal face cream 2 11 6.38 70
Hair mask, Hand cream 2 11 5.63 62
Baby care, Cream Zdrave 2 11 4.69 52
Wet wipes, Universal face cream
2 11 3.57 39
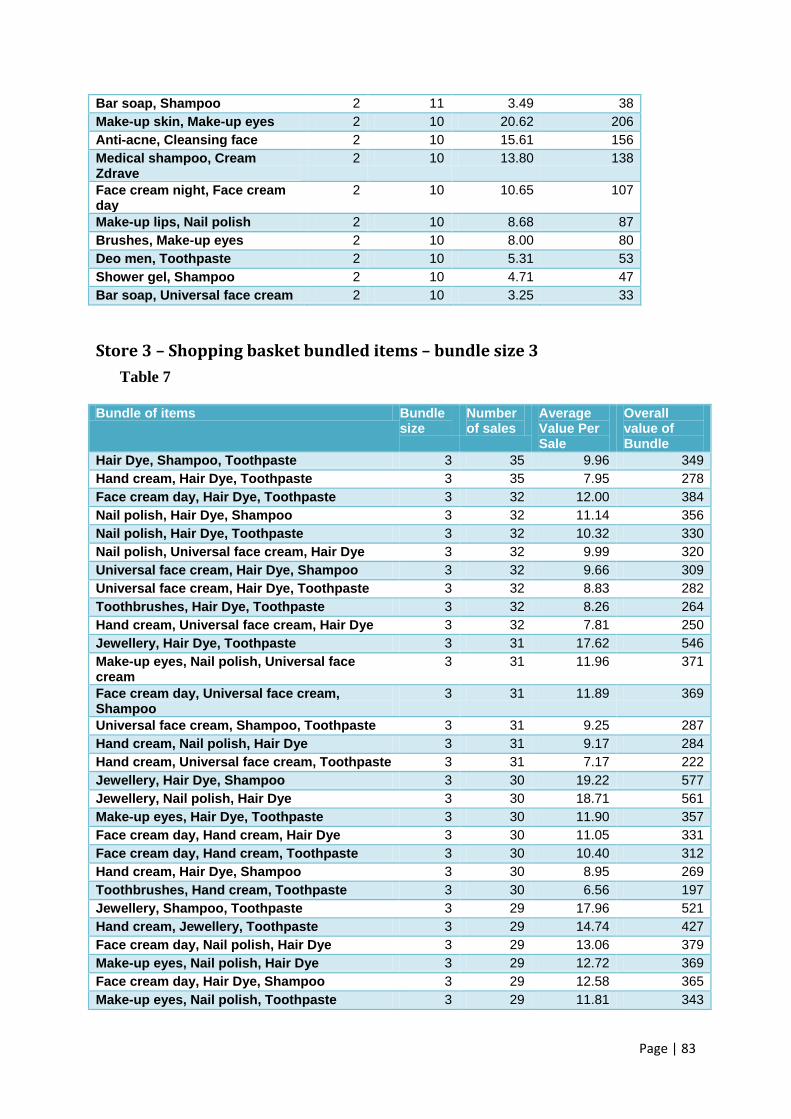
Page | 83
Bar soap, Shampoo 2 11 3.49 38
Make-up skin, Make-up eyes 2 10 20.62 206
Anti-acne, Cleansing face 2 10 15.61 156
Medical shampoo, Cream Zdrave
2 10 13.80 138
Face cream night, Face cream day
2 10 10.65 107
Make-up lips, Nail polish 2 10 8.68 87
Brushes, Make-up eyes 2 10 8.00 80
Deo men, Toothpaste 2 10 5.31 53
Shower gel, Shampoo 2 10 4.71 47
Bar soap, Universal face cream 2 10 3.25 33
Store 3 – Shopping basket bundled items – bundle size 3
Table 7
Bundle of items Bundle
size Number of sales
Average Value Per Sale
Overall value of Bundle
Hair Dye, Shampoo, Toothpaste 3 35 9.96 349
Hand cream, Hair Dye, Toothpaste 3 35 7.95 278
Face cream day, Hair Dye, Toothpaste 3 32 12.00 384
Nail polish, Hair Dye, Shampoo 3 32 11.14 356
Nail polish, Hair Dye, Toothpaste 3 32 10.32 330
Nail polish, Universal face cream, Hair Dye 3 32 9.99 320
Universal face cream, Hair Dye, Shampoo 3 32 9.66 309
Universal face cream, Hair Dye, Toothpaste 3 32 8.83 282
Toothbrushes, Hair Dye, Toothpaste 3 32 8.26 264
Hand cream, Universal face cream, Hair Dye 3 32 7.81 250
Jewellery, Hair Dye, Toothpaste 3 31 17.62 546
Make-up eyes, Nail polish, Universal face cream
3 31 11.96 371
Face cream day, Universal face cream, Shampoo
3 31 11.89 369
Universal face cream, Shampoo, Toothpaste 3 31 9.25 287
Hand cream, Nail polish, Hair Dye 3 31 9.17 284
Hand cream, Universal face cream, Toothpaste 3 31 7.17 222
Jewellery, Hair Dye, Shampoo 3 30 19.22 577
Jewellery, Nail polish, Hair Dye 3 30 18.71 561
Make-up eyes, Hair Dye, Toothpaste 3 30 11.90 357
Face cream day, Hand cream, Hair Dye 3 30 11.05 331
Face cream day, Hand cream, Toothpaste 3 30 10.40 312
Hand cream, Hair Dye, Shampoo 3 30 8.95 269
Toothbrushes, Hand cream, Toothpaste 3 30 6.56 197
Jewellery, Shampoo, Toothpaste 3 29 17.96 521
Hand cream, Jewellery, Toothpaste 3 29 14.74 427
Face cream day, Nail polish, Hair Dye 3 29 13.06 379
Make-up eyes, Nail polish, Hair Dye 3 29 12.72 369
Face cream day, Hair Dye, Shampoo 3 29 12.58 365
Make-up eyes, Nail polish, Toothpaste 3 29 11.81 343
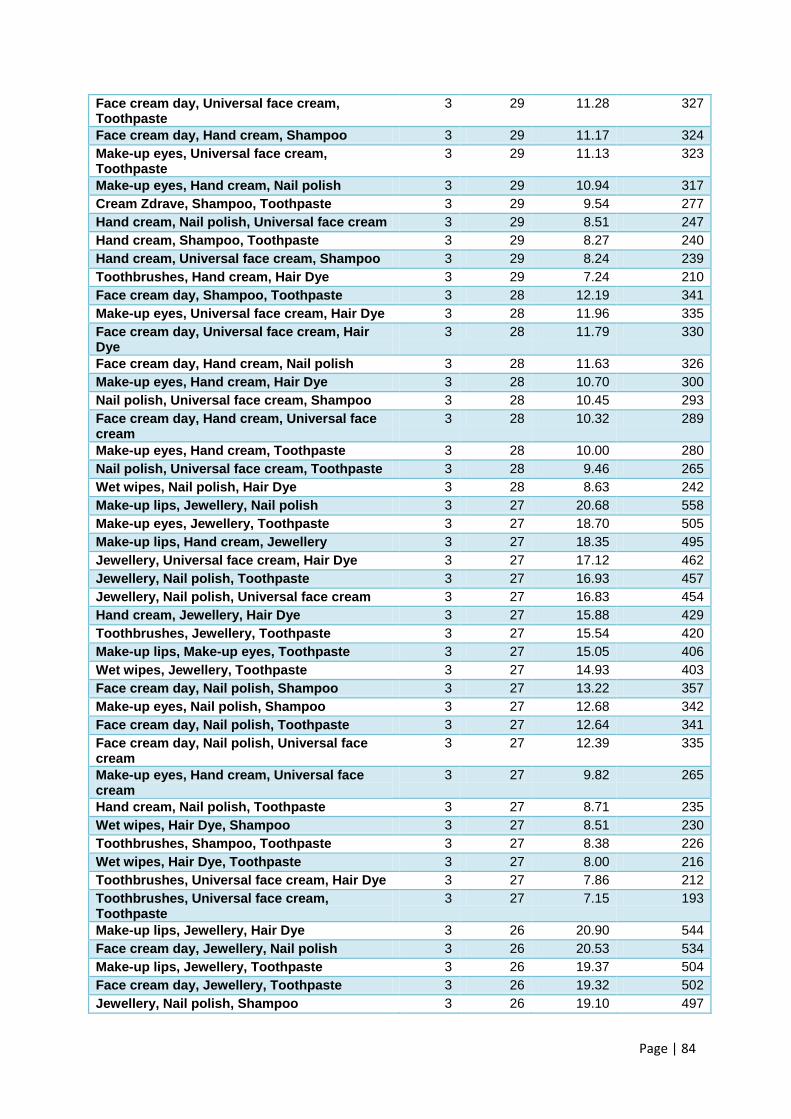
Page | 84
Face cream day, Universal face cream, Toothpaste
3 29 11.28 327
Face cream day, Hand cream, Shampoo 3 29 11.17 324
Make-up eyes, Universal face cream, Toothpaste
3 29 11.13 323
Make-up eyes, Hand cream, Nail polish 3 29 10.94 317
Cream Zdrave, Shampoo, Toothpaste 3 29 9.54 277
Hand cream, Nail polish, Universal face cream 3 29 8.51 247
Hand cream, Shampoo, Toothpaste 3 29 8.27 240
Hand cream, Universal face cream, Shampoo 3 29 8.24 239
Toothbrushes, Hand cream, Hair Dye 3 29 7.24 210
Face cream day, Shampoo, Toothpaste 3 28 12.19 341
Make-up eyes, Universal face cream, Hair Dye 3 28 11.96 335
Face cream day, Universal face cream, Hair Dye
3 28 11.79 330
Face cream day, Hand cream, Nail polish 3 28 11.63 326
Make-up eyes, Hand cream, Hair Dye 3 28 10.70 300
Nail polish, Universal face cream, Shampoo 3 28 10.45 293
Face cream day, Hand cream, Universal face cream
3 28 10.32 289
Make-up eyes, Hand cream, Toothpaste 3 28 10.00 280
Nail polish, Universal face cream, Toothpaste 3 28 9.46 265
Wet wipes, Nail polish, Hair Dye 3 28 8.63 242
Make-up lips, Jewellery, Nail polish 3 27 20.68 558
Make-up eyes, Jewellery, Toothpaste 3 27 18.70 505
Make-up lips, Hand cream, Jewellery 3 27 18.35 495
Jewellery, Universal face cream, Hair Dye 3 27 17.12 462
Jewellery, Nail polish, Toothpaste 3 27 16.93 457
Jewellery, Nail polish, Universal face cream 3 27 16.83 454
Hand cream, Jewellery, Hair Dye 3 27 15.88 429
Toothbrushes, Jewellery, Toothpaste 3 27 15.54 420
Make-up lips, Make-up eyes, Toothpaste 3 27 15.05 406
Wet wipes, Jewellery, Toothpaste 3 27 14.93 403
Face cream day, Nail polish, Shampoo 3 27 13.22 357
Make-up eyes, Nail polish, Shampoo 3 27 12.68 342
Face cream day, Nail polish, Toothpaste 3 27 12.64 341
Face cream day, Nail polish, Universal face cream
3 27 12.39 335
Make-up eyes, Hand cream, Universal face cream
3 27 9.82 265
Hand cream, Nail polish, Toothpaste 3 27 8.71 235
Wet wipes, Hair Dye, Shampoo 3 27 8.51 230
Toothbrushes, Shampoo, Toothpaste 3 27 8.38 226
Wet wipes, Hair Dye, Toothpaste 3 27 8.00 216
Toothbrushes, Universal face cream, Hair Dye 3 27 7.86 212
Toothbrushes, Universal face cream, Toothpaste
3 27 7.15 193
Make-up lips, Jewellery, Hair Dye 3 26 20.90 544
Face cream day, Jewellery, Nail polish 3 26 20.53 534
Make-up lips, Jewellery, Toothpaste 3 26 19.37 504
Face cream day, Jewellery, Toothpaste 3 26 19.32 502
Jewellery, Nail polish, Shampoo 3 26 19.10 497
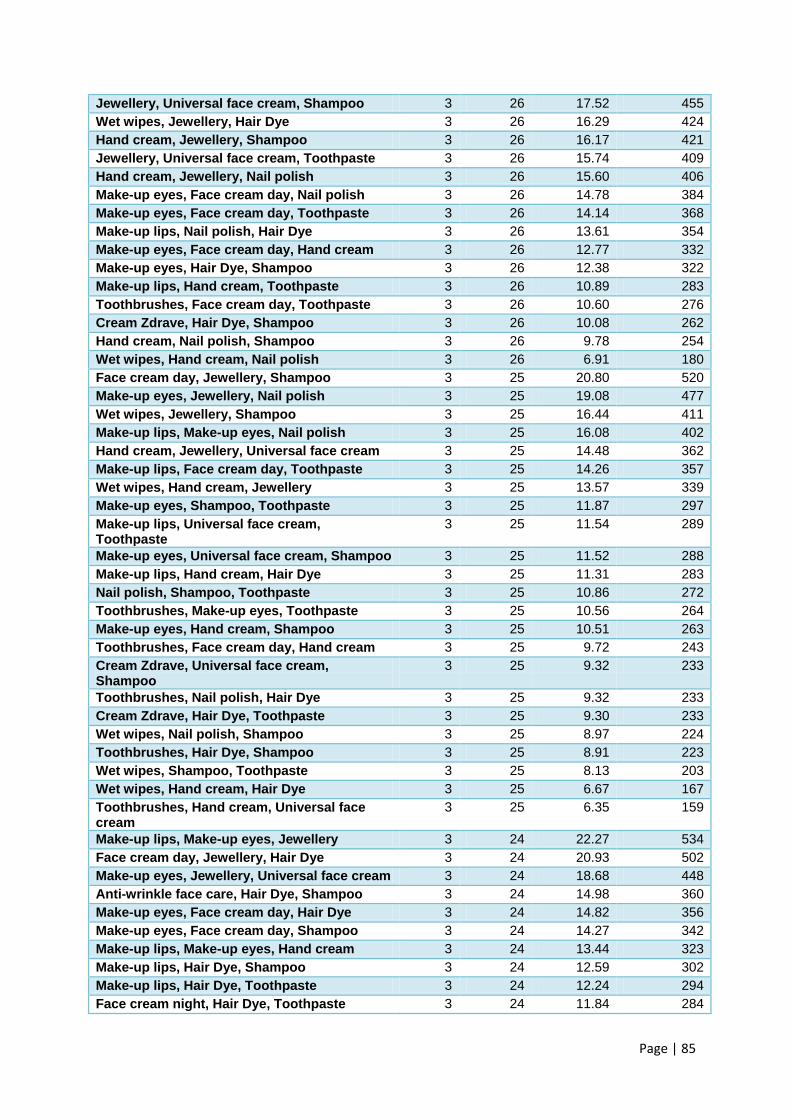
Page | 85
Jewellery, Universal face cream, Shampoo 3 26 17.52 455
Wet wipes, Jewellery, Hair Dye 3 26 16.29 424
Hand cream, Jewellery, Shampoo 3 26 16.17 421
Jewellery, Universal face cream, Toothpaste 3 26 15.74 409
Hand cream, Jewellery, Nail polish 3 26 15.60 406
Make-up eyes, Face cream day, Nail polish 3 26 14.78 384
Make-up eyes, Face cream day, Toothpaste 3 26 14.14 368
Make-up lips, Nail polish, Hair Dye 3 26 13.61 354
Make-up eyes, Face cream day, Hand cream 3 26 12.77 332
Make-up eyes, Hair Dye, Shampoo 3 26 12.38 322
Make-up lips, Hand cream, Toothpaste 3 26 10.89 283
Toothbrushes, Face cream day, Toothpaste 3 26 10.60 276
Cream Zdrave, Hair Dye, Shampoo 3 26 10.08 262
Hand cream, Nail polish, Shampoo 3 26 9.78 254
Wet wipes, Hand cream, Nail polish 3 26 6.91 180
Face cream day, Jewellery, Shampoo 3 25 20.80 520
Make-up eyes, Jewellery, Nail polish 3 25 19.08 477
Wet wipes, Jewellery, Shampoo 3 25 16.44 411
Make-up lips, Make-up eyes, Nail polish 3 25 16.08 402
Hand cream, Jewellery, Universal face cream 3 25 14.48 362
Make-up lips, Face cream day, Toothpaste 3 25 14.26 357
Wet wipes, Hand cream, Jewellery 3 25 13.57 339
Make-up eyes, Shampoo, Toothpaste 3 25 11.87 297
Make-up lips, Universal face cream, Toothpaste
3 25 11.54 289
Make-up eyes, Universal face cream, Shampoo 3 25 11.52 288
Make-up lips, Hand cream, Hair Dye 3 25 11.31 283
Nail polish, Shampoo, Toothpaste 3 25 10.86 272
Toothbrushes, Make-up eyes, Toothpaste 3 25 10.56 264
Make-up eyes, Hand cream, Shampoo 3 25 10.51 263
Toothbrushes, Face cream day, Hand cream 3 25 9.72 243
Cream Zdrave, Universal face cream, Shampoo
3 25 9.32 233
Toothbrushes, Nail polish, Hair Dye 3 25 9.32 233
Cream Zdrave, Hair Dye, Toothpaste 3 25 9.30 233
Wet wipes, Nail polish, Shampoo 3 25 8.97 224
Toothbrushes, Hair Dye, Shampoo 3 25 8.91 223
Wet wipes, Shampoo, Toothpaste 3 25 8.13 203
Wet wipes, Hand cream, Hair Dye 3 25 6.67 167
Toothbrushes, Hand cream, Universal face cream
3 25 6.35 159
Make-up lips, Make-up eyes, Jewellery 3 24 22.27 534
Face cream day, Jewellery, Hair Dye 3 24 20.93 502
Make-up eyes, Jewellery, Universal face cream 3 24 18.68 448
Anti-wrinkle face care, Hair Dye, Shampoo 3 24 14.98 360
Make-up eyes, Face cream day, Hair Dye 3 24 14.82 356
Make-up eyes, Face cream day, Shampoo 3 24 14.27 342
Make-up lips, Make-up eyes, Hand cream 3 24 13.44 323
Make-up lips, Hair Dye, Shampoo 3 24 12.59 302
Make-up lips, Hair Dye, Toothpaste 3 24 12.24 294
Face cream night, Hair Dye, Toothpaste 3 24 11.84 284
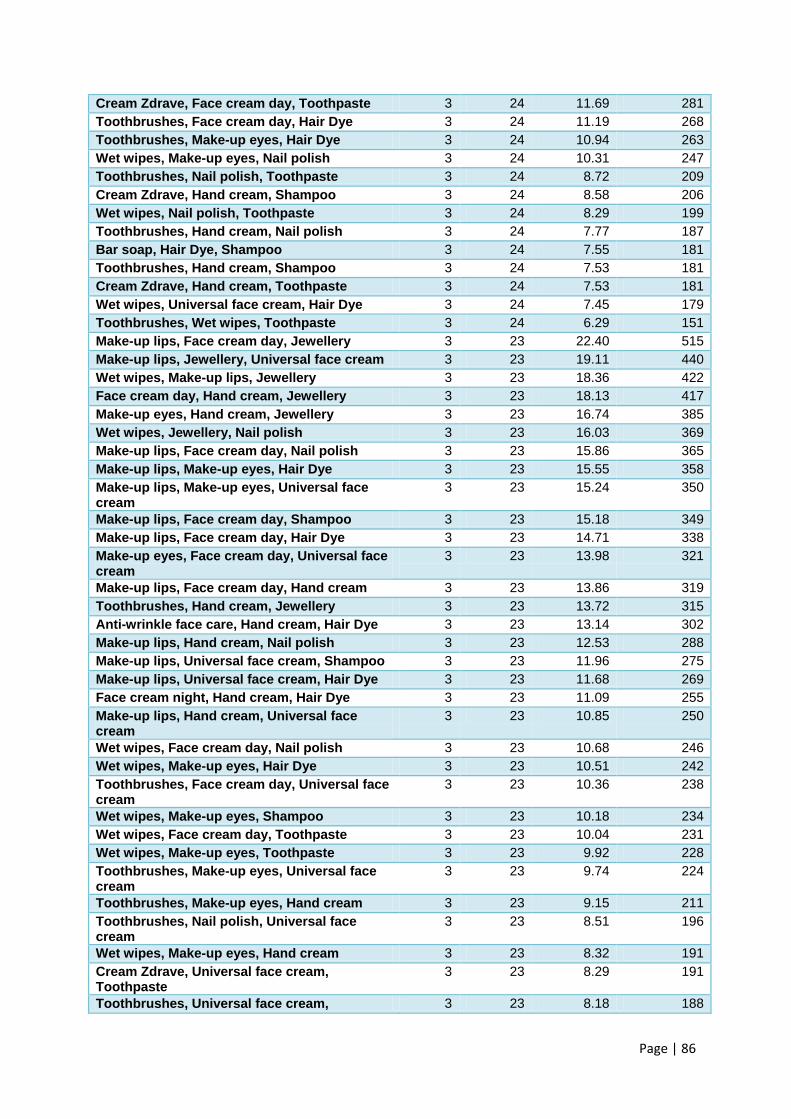
Page | 86
Cream Zdrave, Face cream day, Toothpaste 3 24 11.69 281
Toothbrushes, Face cream day, Hair Dye 3 24 11.19 268
Toothbrushes, Make-up eyes, Hair Dye 3 24 10.94 263
Wet wipes, Make-up eyes, Nail polish 3 24 10.31 247
Toothbrushes, Nail polish, Toothpaste 3 24 8.72 209
Cream Zdrave, Hand cream, Shampoo 3 24 8.58 206
Wet wipes, Nail polish, Toothpaste 3 24 8.29 199
Toothbrushes, Hand cream, Nail polish 3 24 7.77 187
Bar soap, Hair Dye, Shampoo 3 24 7.55 181
Toothbrushes, Hand cream, Shampoo 3 24 7.53 181
Cream Zdrave, Hand cream, Toothpaste 3 24 7.53 181
Wet wipes, Universal face cream, Hair Dye 3 24 7.45 179
Toothbrushes, Wet wipes, Toothpaste 3 24 6.29 151
Make-up lips, Face cream day, Jewellery 3 23 22.40 515
Make-up lips, Jewellery, Universal face cream 3 23 19.11 440
Wet wipes, Make-up lips, Jewellery 3 23 18.36 422
Face cream day, Hand cream, Jewellery 3 23 18.13 417
Make-up eyes, Hand cream, Jewellery 3 23 16.74 385
Wet wipes, Jewellery, Nail polish 3 23 16.03 369
Make-up lips, Face cream day, Nail polish 3 23 15.86 365
Make-up lips, Make-up eyes, Hair Dye 3 23 15.55 358
Make-up lips, Make-up eyes, Universal face cream
3 23 15.24 350
Make-up lips, Face cream day, Shampoo 3 23 15.18 349
Make-up lips, Face cream day, Hair Dye 3 23 14.71 338
Make-up eyes, Face cream day, Universal face cream
3 23 13.98 321
Make-up lips, Face cream day, Hand cream 3 23 13.86 319
Toothbrushes, Hand cream, Jewellery 3 23 13.72 315
Anti-wrinkle face care, Hand cream, Hair Dye 3 23 13.14 302
Make-up lips, Hand cream, Nail polish 3 23 12.53 288
Make-up lips, Universal face cream, Shampoo 3 23 11.96 275
Make-up lips, Universal face cream, Hair Dye 3 23 11.68 269
Face cream night, Hand cream, Hair Dye 3 23 11.09 255
Make-up lips, Hand cream, Universal face cream
3 23 10.85 250
Wet wipes, Face cream day, Nail polish 3 23 10.68 246
Wet wipes, Make-up eyes, Hair Dye 3 23 10.51 242
Toothbrushes, Face cream day, Universal face cream
3 23 10.36 238
Wet wipes, Make-up eyes, Shampoo 3 23 10.18 234
Wet wipes, Face cream day, Toothpaste 3 23 10.04 231
Wet wipes, Make-up eyes, Toothpaste 3 23 9.92 228
Toothbrushes, Make-up eyes, Universal face cream
3 23 9.74 224
Toothbrushes, Make-up eyes, Hand cream 3 23 9.15 211
Toothbrushes, Nail polish, Universal face cream
3 23 8.51 196
Wet wipes, Make-up eyes, Hand cream 3 23 8.32 191
Cream Zdrave, Universal face cream, Toothpaste
3 23 8.29 191
Toothbrushes, Universal face cream, 3 23 8.18 188
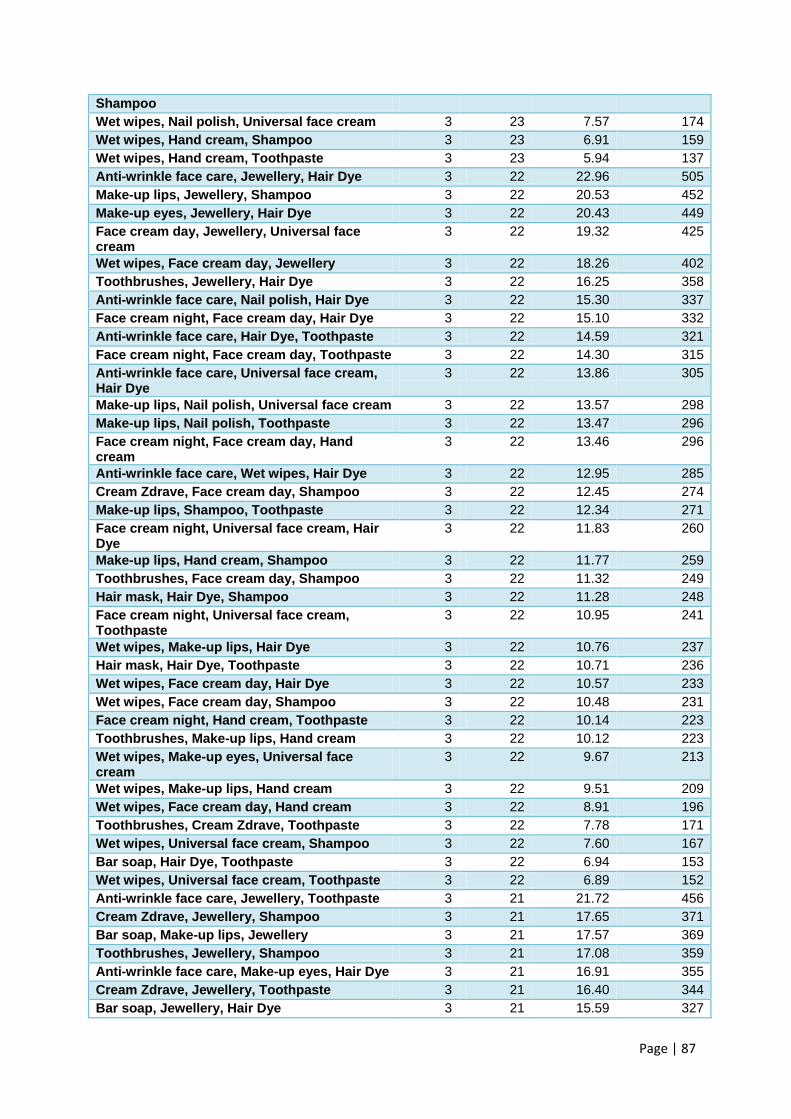
Page | 87
Shampoo
Wet wipes, Nail polish, Universal face cream 3 23 7.57 174
Wet wipes, Hand cream, Shampoo 3 23 6.91 159
Wet wipes, Hand cream, Toothpaste 3 23 5.94 137
Anti-wrinkle face care, Jewellery, Hair Dye 3 22 22.96 505
Make-up lips, Jewellery, Shampoo 3 22 20.53 452
Make-up eyes, Jewellery, Hair Dye 3 22 20.43 449
Face cream day, Jewellery, Universal face cream
3 22 19.32 425
Wet wipes, Face cream day, Jewellery 3 22 18.26 402
Toothbrushes, Jewellery, Hair Dye 3 22 16.25 358
Anti-wrinkle face care, Nail polish, Hair Dye 3 22 15.30 337
Face cream night, Face cream day, Hair Dye 3 22 15.10 332
Anti-wrinkle face care, Hair Dye, Toothpaste 3 22 14.59 321
Face cream night, Face cream day, Toothpaste 3 22 14.30 315
Anti-wrinkle face care, Universal face cream, Hair Dye
3 22 13.86 305
Make-up lips, Nail polish, Universal face cream 3 22 13.57 298
Make-up lips, Nail polish, Toothpaste 3 22 13.47 296
Face cream night, Face cream day, Hand cream
3 22 13.46 296
Anti-wrinkle face care, Wet wipes, Hair Dye 3 22 12.95 285
Cream Zdrave, Face cream day, Shampoo 3 22 12.45 274
Make-up lips, Shampoo, Toothpaste 3 22 12.34 271
Face cream night, Universal face cream, Hair Dye
3 22 11.83 260
Make-up lips, Hand cream, Shampoo 3 22 11.77 259
Toothbrushes, Face cream day, Shampoo 3 22 11.32 249
Hair mask, Hair Dye, Shampoo 3 22 11.28 248
Face cream night, Universal face cream, Toothpaste
3 22 10.95 241
Wet wipes, Make-up lips, Hair Dye 3 22 10.76 237
Hair mask, Hair Dye, Toothpaste 3 22 10.71 236
Wet wipes, Face cream day, Hair Dye 3 22 10.57 233
Wet wipes, Face cream day, Shampoo 3 22 10.48 231
Face cream night, Hand cream, Toothpaste 3 22 10.14 223
Toothbrushes, Make-up lips, Hand cream 3 22 10.12 223
Wet wipes, Make-up eyes, Universal face cream
3 22 9.67 213
Wet wipes, Make-up lips, Hand cream 3 22 9.51 209
Wet wipes, Face cream day, Hand cream 3 22 8.91 196
Toothbrushes, Cream Zdrave, Toothpaste 3 22 7.78 171
Wet wipes, Universal face cream, Shampoo 3 22 7.60 167
Bar soap, Hair Dye, Toothpaste 3 22 6.94 153
Wet wipes, Universal face cream, Toothpaste 3 22 6.89 152
Anti-wrinkle face care, Jewellery, Toothpaste 3 21 21.72 456
Cream Zdrave, Jewellery, Shampoo 3 21 17.65 371
Bar soap, Make-up lips, Jewellery 3 21 17.57 369
Toothbrushes, Jewellery, Shampoo 3 21 17.08 359
Anti-wrinkle face care, Make-up eyes, Hair Dye 3 21 16.91 355
Cream Zdrave, Jewellery, Toothpaste 3 21 16.40 344
Bar soap, Jewellery, Hair Dye 3 21 15.59 327
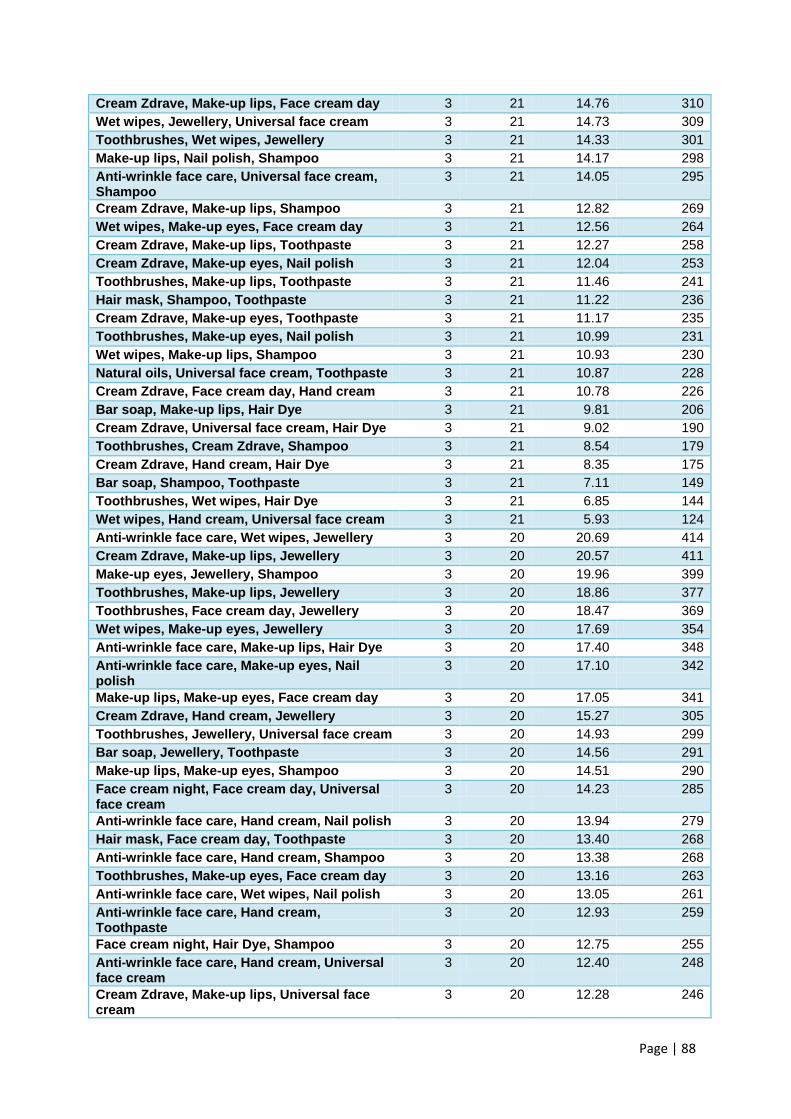
Page | 88
Cream Zdrave, Make-up lips, Face cream day 3 21 14.76 310
Wet wipes, Jewellery, Universal face cream 3 21 14.73 309
Toothbrushes, Wet wipes, Jewellery 3 21 14.33 301
Make-up lips, Nail polish, Shampoo 3 21 14.17 298
Anti-wrinkle face care, Universal face cream, Shampoo
3 21 14.05 295
Cream Zdrave, Make-up lips, Shampoo 3 21 12.82 269
Wet wipes, Make-up eyes, Face cream day 3 21 12.56 264
Cream Zdrave, Make-up lips, Toothpaste 3 21 12.27 258
Cream Zdrave, Make-up eyes, Nail polish 3 21 12.04 253
Toothbrushes, Make-up lips, Toothpaste 3 21 11.46 241
Hair mask, Shampoo, Toothpaste 3 21 11.22 236
Cream Zdrave, Make-up eyes, Toothpaste 3 21 11.17 235
Toothbrushes, Make-up eyes, Nail polish 3 21 10.99 231
Wet wipes, Make-up lips, Shampoo 3 21 10.93 230
Natural oils, Universal face cream, Toothpaste 3 21 10.87 228
Cream Zdrave, Face cream day, Hand cream 3 21 10.78 226
Bar soap, Make-up lips, Hair Dye 3 21 9.81 206
Cream Zdrave, Universal face cream, Hair Dye 3 21 9.02 190
Toothbrushes, Cream Zdrave, Shampoo 3 21 8.54 179
Cream Zdrave, Hand cream, Hair Dye 3 21 8.35 175
Bar soap, Shampoo, Toothpaste 3 21 7.11 149
Toothbrushes, Wet wipes, Hair Dye 3 21 6.85 144
Wet wipes, Hand cream, Universal face cream 3 21 5.93 124
Anti-wrinkle face care, Wet wipes, Jewellery 3 20 20.69 414
Cream Zdrave, Make-up lips, Jewellery 3 20 20.57 411
Make-up eyes, Jewellery, Shampoo 3 20 19.96 399
Toothbrushes, Make-up lips, Jewellery 3 20 18.86 377
Toothbrushes, Face cream day, Jewellery 3 20 18.47 369
Wet wipes, Make-up eyes, Jewellery 3 20 17.69 354
Anti-wrinkle face care, Make-up lips, Hair Dye 3 20 17.40 348
Anti-wrinkle face care, Make-up eyes, Nail polish
3 20 17.10 342
Make-up lips, Make-up eyes, Face cream day 3 20 17.05 341
Cream Zdrave, Hand cream, Jewellery 3 20 15.27 305
Toothbrushes, Jewellery, Universal face cream 3 20 14.93 299
Bar soap, Jewellery, Toothpaste 3 20 14.56 291
Make-up lips, Make-up eyes, Shampoo 3 20 14.51 290
Face cream night, Face cream day, Universal face cream
3 20 14.23 285
Anti-wrinkle face care, Hand cream, Nail polish 3 20 13.94 279
Hair mask, Face cream day, Toothpaste 3 20 13.40 268
Anti-wrinkle face care, Hand cream, Shampoo 3 20 13.38 268
Toothbrushes, Make-up eyes, Face cream day 3 20 13.16 263
Anti-wrinkle face care, Wet wipes, Nail polish 3 20 13.05 261
Anti-wrinkle face care, Hand cream, Toothpaste
3 20 12.93 259
Face cream night, Hair Dye, Shampoo 3 20 12.75 255
Anti-wrinkle face care, Hand cream, Universal face cream
3 20 12.40 248
Cream Zdrave, Make-up lips, Universal face cream
3 20 12.28 246
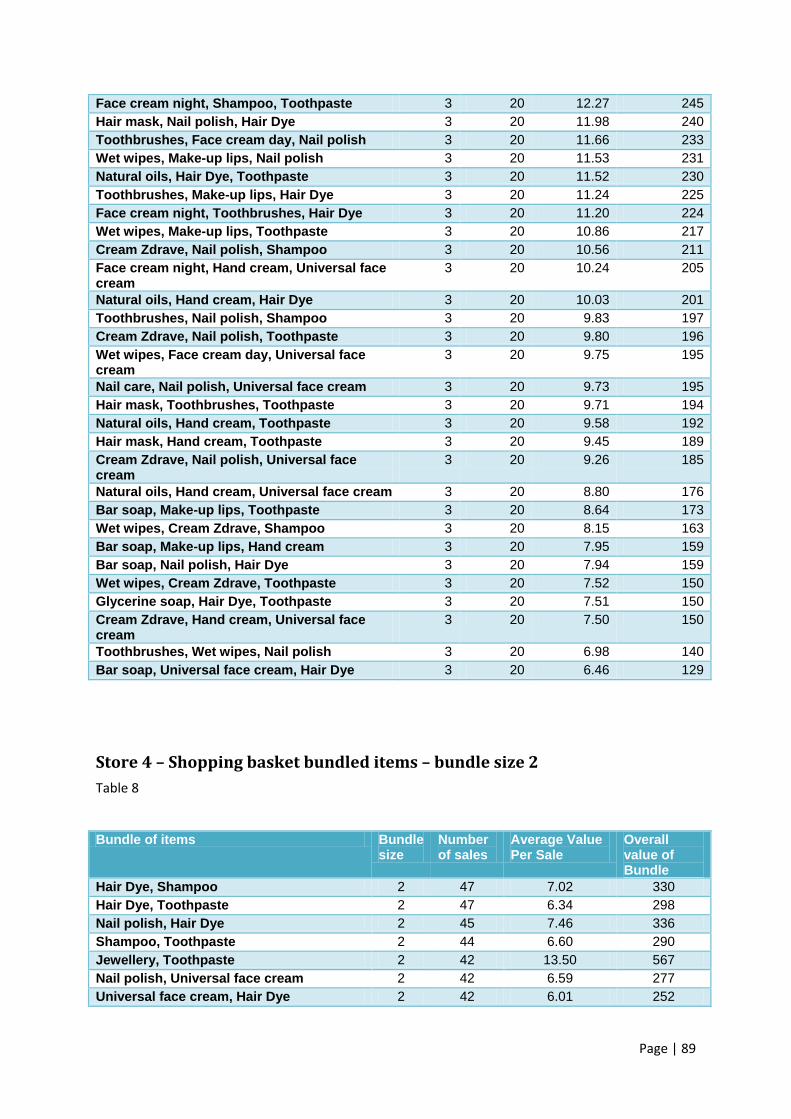
Page | 89
Face cream night, Shampoo, Toothpaste 3 20 12.27 245
Hair mask, Nail polish, Hair Dye 3 20 11.98 240
Toothbrushes, Face cream day, Nail polish 3 20 11.66 233
Wet wipes, Make-up lips, Nail polish 3 20 11.53 231
Natural oils, Hair Dye, Toothpaste 3 20 11.52 230
Toothbrushes, Make-up lips, Hair Dye 3 20 11.24 225
Face cream night, Toothbrushes, Hair Dye 3 20 11.20 224
Wet wipes, Make-up lips, Toothpaste 3 20 10.86 217
Cream Zdrave, Nail polish, Shampoo 3 20 10.56 211
Face cream night, Hand cream, Universal face cream
3 20 10.24 205
Natural oils, Hand cream, Hair Dye 3 20 10.03 201
Toothbrushes, Nail polish, Shampoo 3 20 9.83 197
Cream Zdrave, Nail polish, Toothpaste 3 20 9.80 196
Wet wipes, Face cream day, Universal face cream
3 20 9.75 195
Nail care, Nail polish, Universal face cream 3 20 9.73 195
Hair mask, Toothbrushes, Toothpaste 3 20 9.71 194
Natural oils, Hand cream, Toothpaste 3 20 9.58 192
Hair mask, Hand cream, Toothpaste 3 20 9.45 189
Cream Zdrave, Nail polish, Universal face cream
3 20 9.26 185
Natural oils, Hand cream, Universal face cream 3 20 8.80 176
Bar soap, Make-up lips, Toothpaste 3 20 8.64 173
Wet wipes, Cream Zdrave, Shampoo 3 20 8.15 163
Bar soap, Make-up lips, Hand cream 3 20 7.95 159
Bar soap, Nail polish, Hair Dye 3 20 7.94 159
Wet wipes, Cream Zdrave, Toothpaste 3 20 7.52 150
Glycerine soap, Hair Dye, Toothpaste 3 20 7.51 150
Cream Zdrave, Hand cream, Universal face cream
3 20 7.50 150
Toothbrushes, Wet wipes, Nail polish 3 20 6.98 140
Bar soap, Universal face cream, Hair Dye 3 20 6.46 129
Store 4 – Shopping basket bundled items – bundle size 2
Table 8
Bundle of items Bundle
size Number of sales
Average Value Per Sale
Overall value of Bundle
Hair Dye, Shampoo 2 47 7.02 330
Hair Dye, Toothpaste 2 47 6.34 298
Nail polish, Hair Dye 2 45 7.46 336
Shampoo, Toothpaste 2 44 6.60 290
Jewellery, Toothpaste 2 42 13.50 567
Nail polish, Universal face cream 2 42 6.59 277
Universal face cream, Hair Dye 2 42 6.01 252
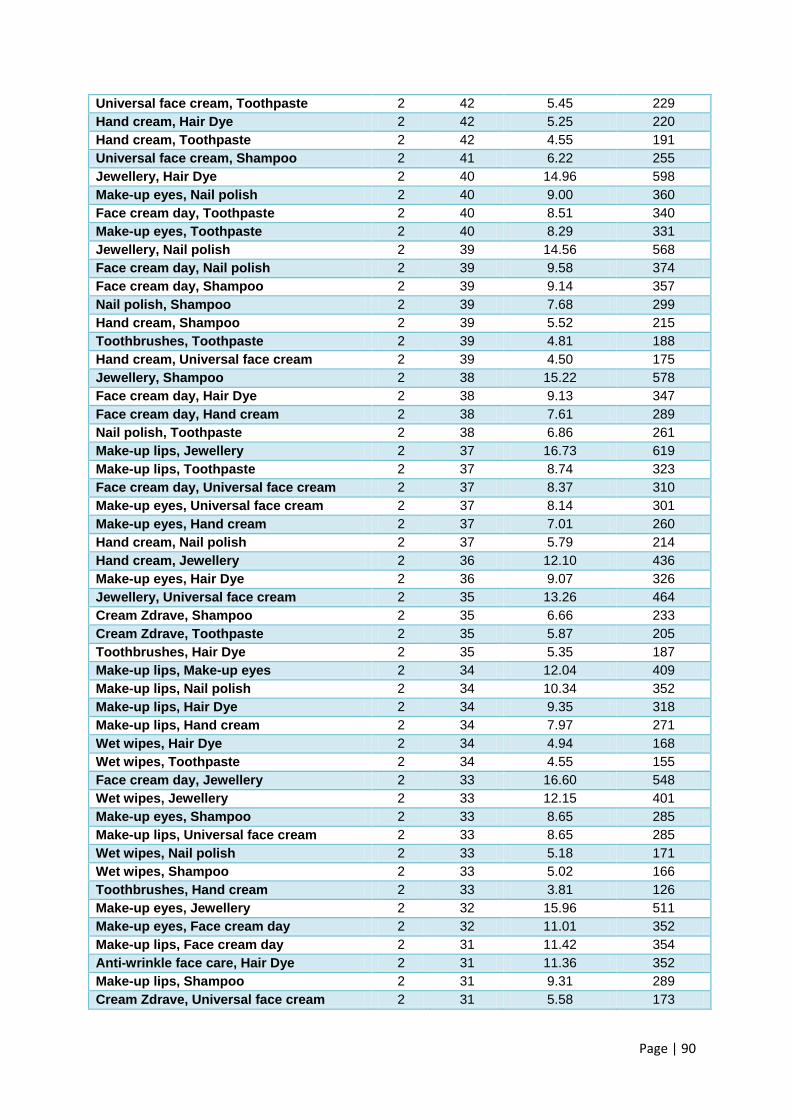
Page | 90
Universal face cream, Toothpaste 2 42 5.45 229
Hand cream, Hair Dye 2 42 5.25 220
Hand cream, Toothpaste 2 42 4.55 191
Universal face cream, Shampoo 2 41 6.22 255
Jewellery, Hair Dye 2 40 14.96 598
Make-up eyes, Nail polish 2 40 9.00 360
Face cream day, Toothpaste 2 40 8.51 340
Make-up eyes, Toothpaste 2 40 8.29 331
Jewellery, Nail polish 2 39 14.56 568
Face cream day, Nail polish 2 39 9.58 374
Face cream day, Shampoo 2 39 9.14 357
Nail polish, Shampoo 2 39 7.68 299
Hand cream, Shampoo 2 39 5.52 215
Toothbrushes, Toothpaste 2 39 4.81 188
Hand cream, Universal face cream 2 39 4.50 175
Jewellery, Shampoo 2 38 15.22 578
Face cream day, Hair Dye 2 38 9.13 347
Face cream day, Hand cream 2 38 7.61 289
Nail polish, Toothpaste 2 38 6.86 261
Make-up lips, Jewellery 2 37 16.73 619
Make-up lips, Toothpaste 2 37 8.74 323
Face cream day, Universal face cream 2 37 8.37 310
Make-up eyes, Universal face cream 2 37 8.14 301
Make-up eyes, Hand cream 2 37 7.01 260
Hand cream, Nail polish 2 37 5.79 214
Hand cream, Jewellery 2 36 12.10 436
Make-up eyes, Hair Dye 2 36 9.07 326
Jewellery, Universal face cream 2 35 13.26 464
Cream Zdrave, Shampoo 2 35 6.66 233
Cream Zdrave, Toothpaste 2 35 5.87 205
Toothbrushes, Hair Dye 2 35 5.35 187
Make-up lips, Make-up eyes 2 34 12.04 409
Make-up lips, Nail polish 2 34 10.34 352
Make-up lips, Hair Dye 2 34 9.35 318
Make-up lips, Hand cream 2 34 7.97 271
Wet wipes, Hair Dye 2 34 4.94 168
Wet wipes, Toothpaste 2 34 4.55 155
Face cream day, Jewellery 2 33 16.60 548
Wet wipes, Jewellery 2 33 12.15 401
Make-up eyes, Shampoo 2 33 8.65 285
Make-up lips, Universal face cream 2 33 8.65 285
Wet wipes, Nail polish 2 33 5.18 171
Wet wipes, Shampoo 2 33 5.02 166
Toothbrushes, Hand cream 2 33 3.81 126
Make-up eyes, Jewellery 2 32 15.96 511
Make-up eyes, Face cream day 2 32 11.01 352
Make-up lips, Face cream day 2 31 11.42 354
Anti-wrinkle face care, Hair Dye 2 31 11.36 352
Make-up lips, Shampoo 2 31 9.31 289
Cream Zdrave, Universal face cream 2 31 5.58 173
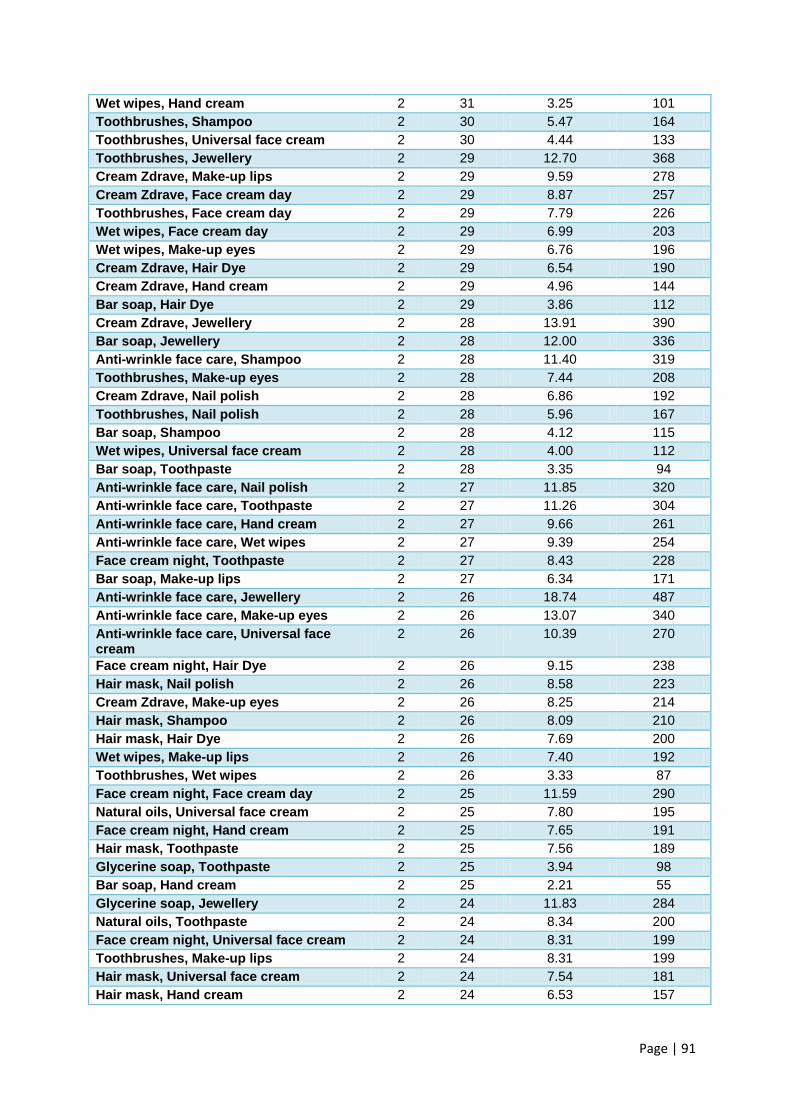
Page | 91
Wet wipes, Hand cream 2 31 3.25 101
Toothbrushes, Shampoo 2 30 5.47 164
Toothbrushes, Universal face cream 2 30 4.44 133
Toothbrushes, Jewellery 2 29 12.70 368
Cream Zdrave, Make-up lips 2 29 9.59 278
Cream Zdrave, Face cream day 2 29 8.87 257
Toothbrushes, Face cream day 2 29 7.79 226
Wet wipes, Face cream day 2 29 6.99 203
Wet wipes, Make-up eyes 2 29 6.76 196
Cream Zdrave, Hair Dye 2 29 6.54 190
Cream Zdrave, Hand cream 2 29 4.96 144
Bar soap, Hair Dye 2 29 3.86 112
Cream Zdrave, Jewellery 2 28 13.91 390
Bar soap, Jewellery 2 28 12.00 336
Anti-wrinkle face care, Shampoo 2 28 11.40 319
Toothbrushes, Make-up eyes 2 28 7.44 208
Cream Zdrave, Nail polish 2 28 6.86 192
Toothbrushes, Nail polish 2 28 5.96 167
Bar soap, Shampoo 2 28 4.12 115
Wet wipes, Universal face cream 2 28 4.00 112
Bar soap, Toothpaste 2 28 3.35 94
Anti-wrinkle face care, Nail polish 2 27 11.85 320
Anti-wrinkle face care, Toothpaste 2 27 11.26 304
Anti-wrinkle face care, Hand cream 2 27 9.66 261
Anti-wrinkle face care, Wet wipes 2 27 9.39 254
Face cream night, Toothpaste 2 27 8.43 228
Bar soap, Make-up lips 2 27 6.34 171
Anti-wrinkle face care, Jewellery 2 26 18.74 487
Anti-wrinkle face care, Make-up eyes 2 26 13.07 340
Anti-wrinkle face care, Universal face cream
2 26 10.39 270
Face cream night, Hair Dye 2 26 9.15 238
Hair mask, Nail polish 2 26 8.58 223
Cream Zdrave, Make-up eyes 2 26 8.25 214
Hair mask, Shampoo 2 26 8.09 210
Hair mask, Hair Dye 2 26 7.69 200
Wet wipes, Make-up lips 2 26 7.40 192
Toothbrushes, Wet wipes 2 26 3.33 87
Face cream night, Face cream day 2 25 11.59 290
Natural oils, Universal face cream 2 25 7.80 195
Face cream night, Hand cream 2 25 7.65 191
Hair mask, Toothpaste 2 25 7.56 189
Glycerine soap, Toothpaste 2 25 3.94 98
Bar soap, Hand cream 2 25 2.21 55
Glycerine soap, Jewellery 2 24 11.83 284
Natural oils, Toothpaste 2 24 8.34 200
Face cream night, Universal face cream 2 24 8.31 199
Toothbrushes, Make-up lips 2 24 8.31 199
Hair mask, Universal face cream 2 24 7.54 181
Hair mask, Hand cream 2 24 6.53 157
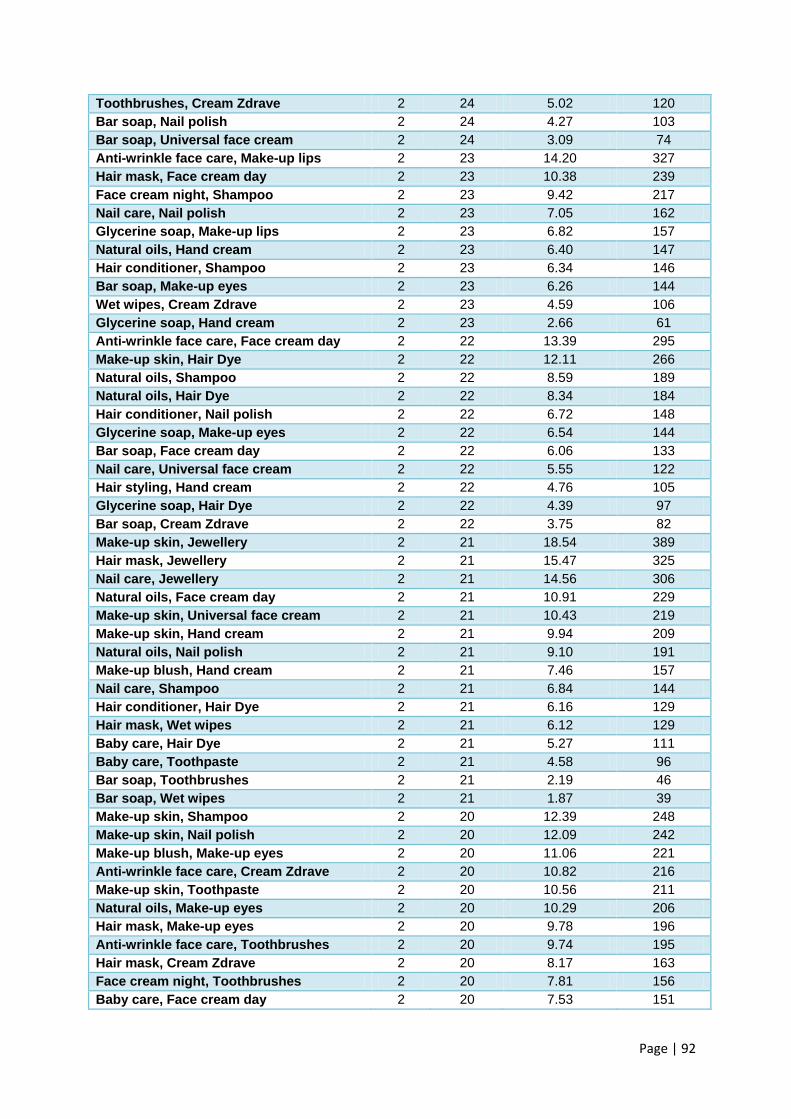
Page | 92
Toothbrushes, Cream Zdrave 2 24 5.02 120
Bar soap, Nail polish 2 24 4.27 103
Bar soap, Universal face cream 2 24 3.09 74
Anti-wrinkle face care, Make-up lips 2 23 14.20 327
Hair mask, Face cream day 2 23 10.38 239
Face cream night, Shampoo 2 23 9.42 217
Nail care, Nail polish 2 23 7.05 162
Glycerine soap, Make-up lips 2 23 6.82 157
Natural oils, Hand cream 2 23 6.40 147
Hair conditioner, Shampoo 2 23 6.34 146
Bar soap, Make-up eyes 2 23 6.26 144
Wet wipes, Cream Zdrave 2 23 4.59 106
Glycerine soap, Hand cream 2 23 2.66 61
Anti-wrinkle face care, Face cream day 2 22 13.39 295
Make-up skin, Hair Dye 2 22 12.11 266
Natural oils, Shampoo 2 22 8.59 189
Natural oils, Hair Dye 2 22 8.34 184
Hair conditioner, Nail polish 2 22 6.72 148
Glycerine soap, Make-up eyes 2 22 6.54 144
Bar soap, Face cream day 2 22 6.06 133
Nail care, Universal face cream 2 22 5.55 122
Hair styling, Hand cream 2 22 4.76 105
Glycerine soap, Hair Dye 2 22 4.39 97
Bar soap, Cream Zdrave 2 22 3.75 82
Make-up skin, Jewellery 2 21 18.54 389
Hair mask, Jewellery 2 21 15.47 325
Nail care, Jewellery 2 21 14.56 306
Natural oils, Face cream day 2 21 10.91 229
Make-up skin, Universal face cream 2 21 10.43 219
Make-up skin, Hand cream 2 21 9.94 209
Natural oils, Nail polish 2 21 9.10 191
Make-up blush, Hand cream 2 21 7.46 157
Nail care, Shampoo 2 21 6.84 144
Hair conditioner, Hair Dye 2 21 6.16 129
Hair mask, Wet wipes 2 21 6.12 129
Baby care, Hair Dye 2 21 5.27 111
Baby care, Toothpaste 2 21 4.58 96
Bar soap, Toothbrushes 2 21 2.19 46
Bar soap, Wet wipes 2 21 1.87 39
Make-up skin, Shampoo 2 20 12.39 248
Make-up skin, Nail polish 2 20 12.09 242
Make-up blush, Make-up eyes 2 20 11.06 221
Anti-wrinkle face care, Cream Zdrave 2 20 10.82 216
Make-up skin, Toothpaste 2 20 10.56 211
Natural oils, Make-up eyes 2 20 10.29 206
Hair mask, Make-up eyes 2 20 9.78 196
Anti-wrinkle face care, Toothbrushes 2 20 9.74 195
Hair mask, Cream Zdrave 2 20 8.17 163
Face cream night, Toothbrushes 2 20 7.81 156
Baby care, Face cream day 2 20 7.53 151
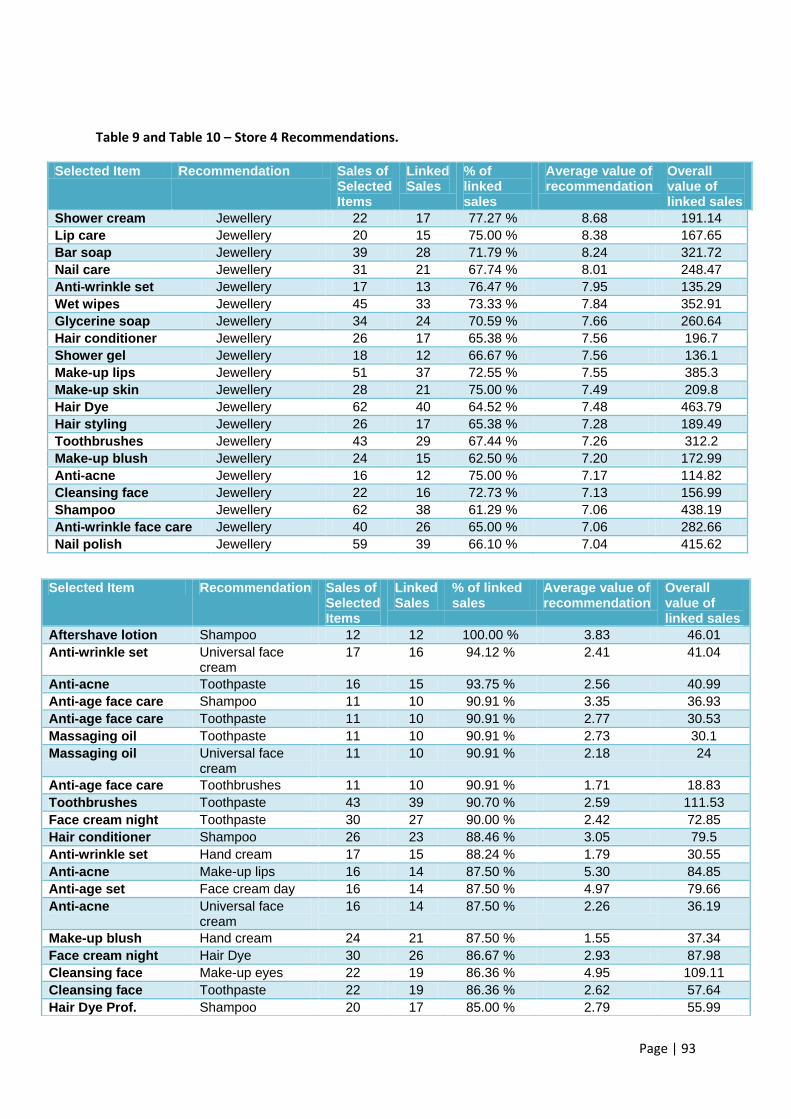
Page | 93
Table 9 and Table 10 – Store 4 Recommendations.
Selected Item Recommendation Sales of Selected Items
Linked Sales
% of linked sales
Average value of recommendation
Overall value of linked sales
Shower cream Jewellery 22 17 77.27 % 8.68 191.14
Lip care Jewellery 20 15 75.00 % 8.38 167.65
Bar soap Jewellery 39 28 71.79 % 8.24 321.72
Nail care Jewellery 31 21 67.74 % 8.01 248.47
Anti-wrinkle set Jewellery 17 13 76.47 % 7.95 135.29
Wet wipes Jewellery 45 33 73.33 % 7.84 352.91
Glycerine soap Jewellery 34 24 70.59 % 7.66 260.64
Hair conditioner Jewellery 26 17 65.38 % 7.56 196.7
Shower gel Jewellery 18 12 66.67 % 7.56 136.1
Make-up lips Jewellery 51 37 72.55 % 7.55 385.3
Make-up skin Jewellery 28 21 75.00 % 7.49 209.8
Hair Dye Jewellery 62 40 64.52 % 7.48 463.79
Hair styling Jewellery 26 17 65.38 % 7.28 189.49
Toothbrushes Jewellery 43 29 67.44 % 7.26 312.2
Make-up blush Jewellery 24 15 62.50 % 7.20 172.99
Anti-acne Jewellery 16 12 75.00 % 7.17 114.82
Cleansing face Jewellery 22 16 72.73 % 7.13 156.99
Shampoo Jewellery 62 38 61.29 % 7.06 438.19
Anti-wrinkle face care Jewellery 40 26 65.00 % 7.06 282.66
Nail polish Jewellery 59 39 66.10 % 7.04 415.62
Selected Item Recommendation Sales of Selected Items
Linked Sales
% of linked sales
Average value of recommendation
Overall value of linked sales
Aftershave lotion Shampoo 12 12 100.00 % 3.83 46.01
Anti-wrinkle set Universal face cream
17 16 94.12 % 2.41 41.04
Anti-acne Toothpaste 16 15 93.75 % 2.56 40.99
Anti-age face care Shampoo 11 10 90.91 % 3.35 36.93
Anti-age face care Toothpaste 11 10 90.91 % 2.77 30.53
Massaging oil Toothpaste 11 10 90.91 % 2.73 30.1
Massaging oil Universal face cream
11 10 90.91 % 2.18 24
Anti-age face care Toothbrushes 11 10 90.91 % 1.71 18.83
Toothbrushes Toothpaste 43 39 90.70 % 2.59 111.53
Face cream night Toothpaste 30 27 90.00 % 2.42 72.85
Hair conditioner Shampoo 26 23 88.46 % 3.05 79.5
Anti-wrinkle set Hand cream 17 15 88.24 % 1.79 30.55
Anti-acne Make-up lips 16 14 87.50 % 5.30 84.85
Anti-age set Face cream day 16 14 87.50 % 4.97 79.66
Anti-acne Universal face cream
16 14 87.50 % 2.26 36.19
Make-up blush Hand cream 24 21 87.50 % 1.55 37.34
Face cream night Hair Dye 30 26 86.67 % 2.93 87.98
Cleansing face Make-up eyes 22 19 86.36 % 4.95 109.11
Cleansing face Toothpaste 22 19 86.36 % 2.62 57.64
Hair Dye Prof. Shampoo 20 17 85.00 % 2.79 55.99

Page | 94
Related Documents