The Human Gut Microbiome in HIV infection Yolanda Guillén Montalbán, PhD Microbial Genomics AIDS Research Institute, Irsicaixa Hospital Universitari Germans Trias i Pujol

Welcome message from author
This document is posted to help you gain knowledge. Please leave a comment to let me know what you think about it! Share it to your friends and learn new things together.
Transcript
TheHumanGutMicrobiomeinHIVinfection
YolandaGuillénMontalbán,PhDMicrobialGenomics
AIDSResearchInstitute,IrsicaixaHospitalUniversitariGermansTriasiPujol
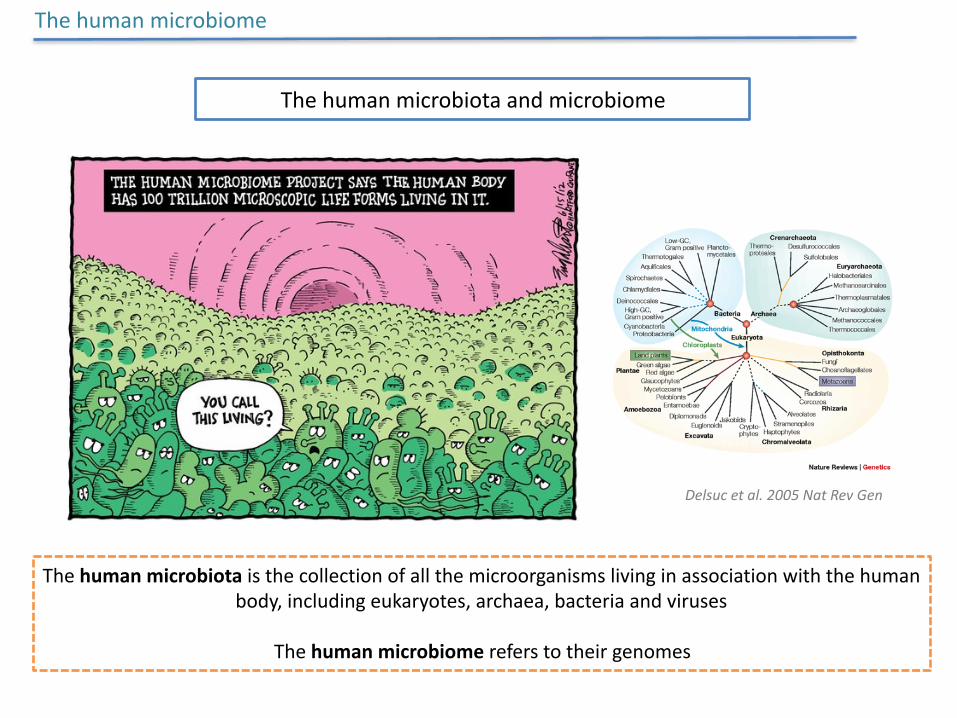
Thehumanmicrobiotaandmicrobiome
Thehumanmicrobiotaisthecollectionofallthemicroorganismslivinginassociationwiththehumanbody,includingeukaryotes,archaea,bacteriaandviruses
Thehumanmicrobiomereferstotheirgenomes
Thehumanmicrobiome
Delsucetal.2005NatRevGen
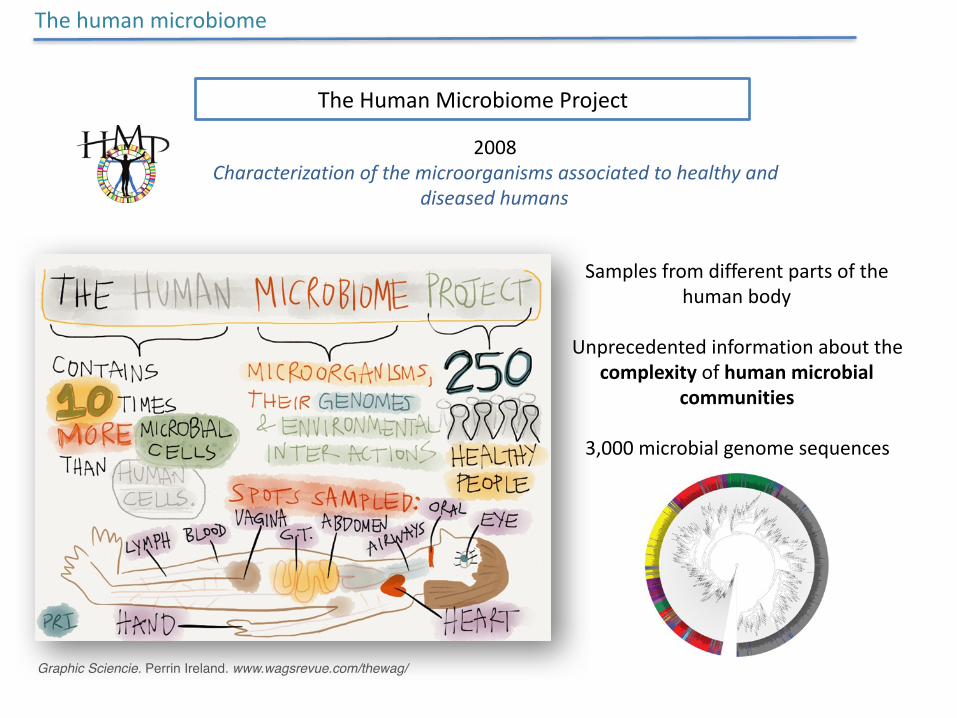
TheHumanMicrobiomeProject
2008Characterizationofthemicroorganismsassociatedtohealthyand
diseasedhumans
Samplesfromdifferentpartsofthehumanbody
Unprecedentedinformationaboutthecomplexityofhumanmicrobial
communities
3,000microbialgenomesequences
Graphic Sciencie. Perrin Ireland. www.wagsrevue.com/thewag/
Thehumanmicrobiome
Thehumanmicrobiome
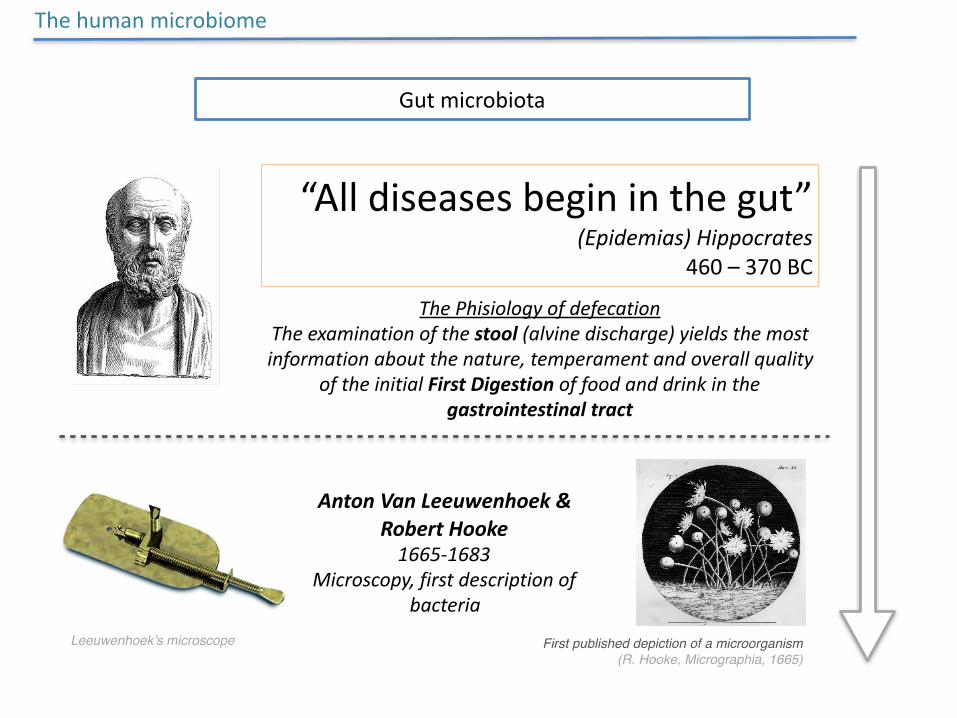
“Alldiseasesbegininthegut”(Epidemias)Hippocrates
460–370BC
Gutmicrobiota
ThePhisiologyofdefecationTheexaminationofthestool(alvinedischarge)yieldsthemostinformationaboutthenature,temperamentandoverallquality
oftheinitialFirstDigestionoffoodanddrinkinthegastrointestinaltract
AntonVanLeeuwenhoek&RobertHooke1665-1683
Microscopy,firstdescriptionofbacteria
neous generation’, which was a popular concept at the time (and not decisively disprovenas a phenomenon until the mid-nineteenth century, by Pasteur).
IDENTITY OF HOOKE’S MOULD
In Micrographia, Hooke provided the first illustrations of microfungi (Scheme XII, Fig.1). From the diagram and the detailed description, microbiologists10 have concluded thathis specimen can be identified as the widely distributed microfungus Mucor. There aremany species of Mucor, frequently referred to as ‘bread moulds’, which occur commonly
Discovery of microorganisms by Hooke and Leeuwenhoek 191
Figure 1. Microscopic view of a ‘hairy mould’ colony described by Robert Hooke in 1665 (in Micrographia). Thisimage was the first published depiction of a microorganism. The reproductive structures (sporangia) are characteris-tic of the microfungus Mucor. Sporangia in different stages are identified by the letters A, B, C, and D. Hookeincluded a scale reference; the length of the bar under the diagram represents 1/32 inch. (Reproduced courtesy of TheLilly Library, Indiana University, Bloomington, Indiana.)
rsnr.royalsocietypublishing.orgDownloaded from
Leeuwenhoek’s microscope First published depiction of a microorganism (R. Hooke, Micrographia, 1665)
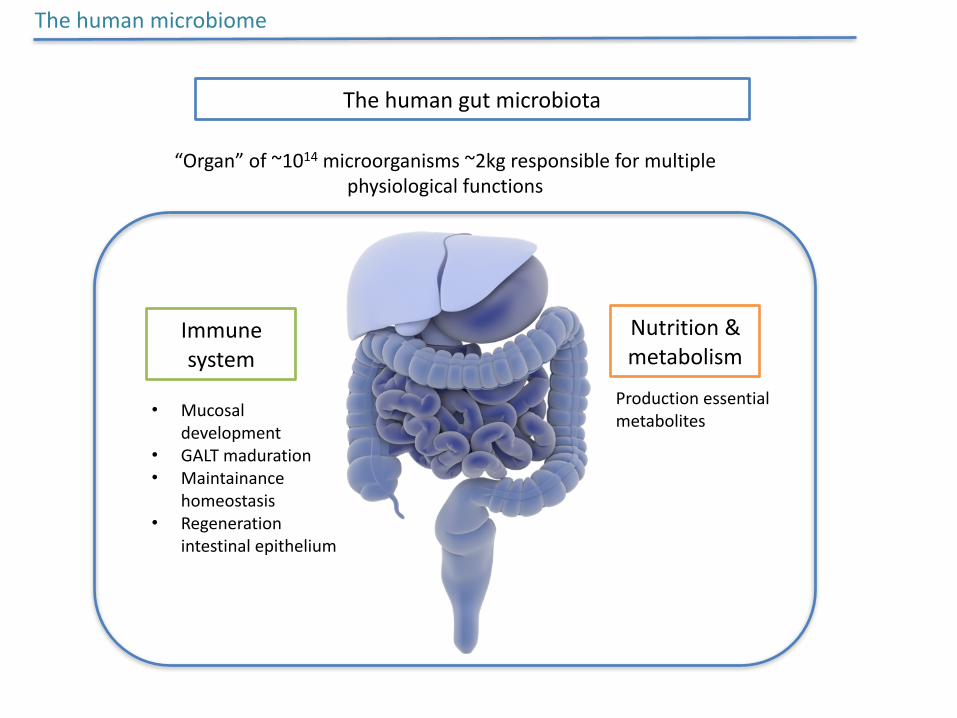
Thehumangutmicrobiota
“Organ”of~1014microorganisms~2kgresponsibleformultiplephysiologicalfunctions
Immunesystem
Nutrition&metabolism
• Mucosaldevelopment
• GALTmaduration• Maintainance
homeostasis• Regeneration
intestinalepithelium
Productionessentialmetabolites
Thehumanmicrobiome
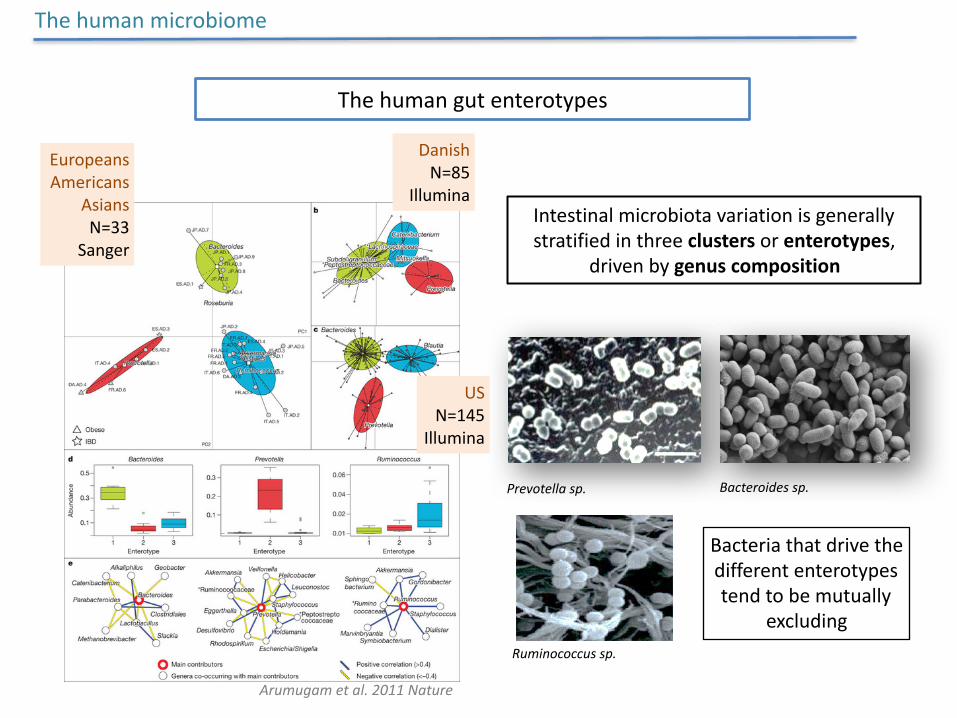
Thehumangutenterotypes
Intestinalmicrobiotavariationisgenerallystratifiedinthreeclustersorenterotypes,
drivenbygenuscomposition
Prevotellasp. Bacteroidessp.
Ruminococcussp.
Thehumanmicrobiome
Arumugametal.2011Nature
EuropeansAmericans
AsiansN=33
Sanger
DanishN=85
Illumina
USN=145
Illumina
Bacteriathatdrivethedifferententerotypestendtobemutually
excluding
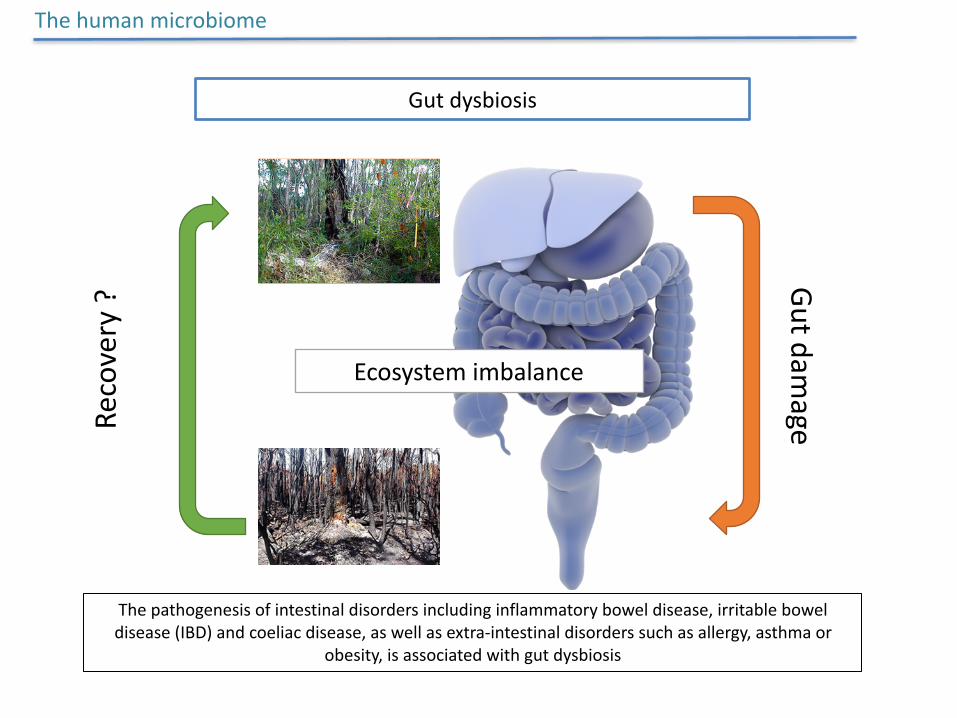
GutdysbiosisRe
covery?
Gutdamage
Ecosystemimbalance
Thehumanmicrobiome
Thepathogenesisofintestinaldisordersincludinginflammatoryboweldisease,irritableboweldisease(IBD)andcoeliacdisease,aswellasextra-intestinaldisorderssuchasallergy,asthmaor
obesity,isassociatedwithgutdysbiosis
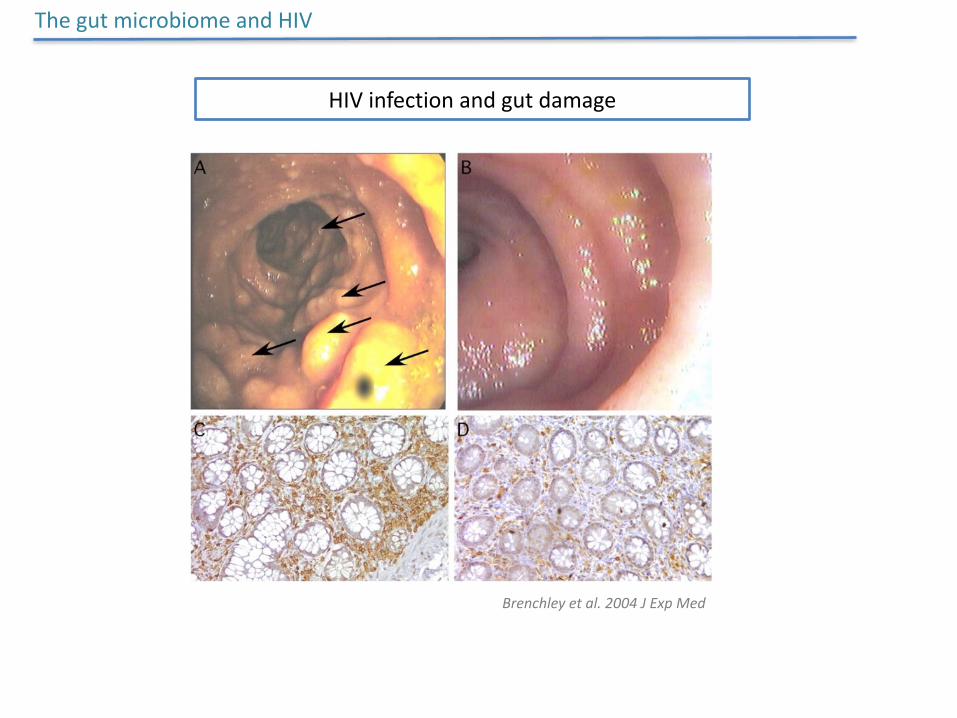
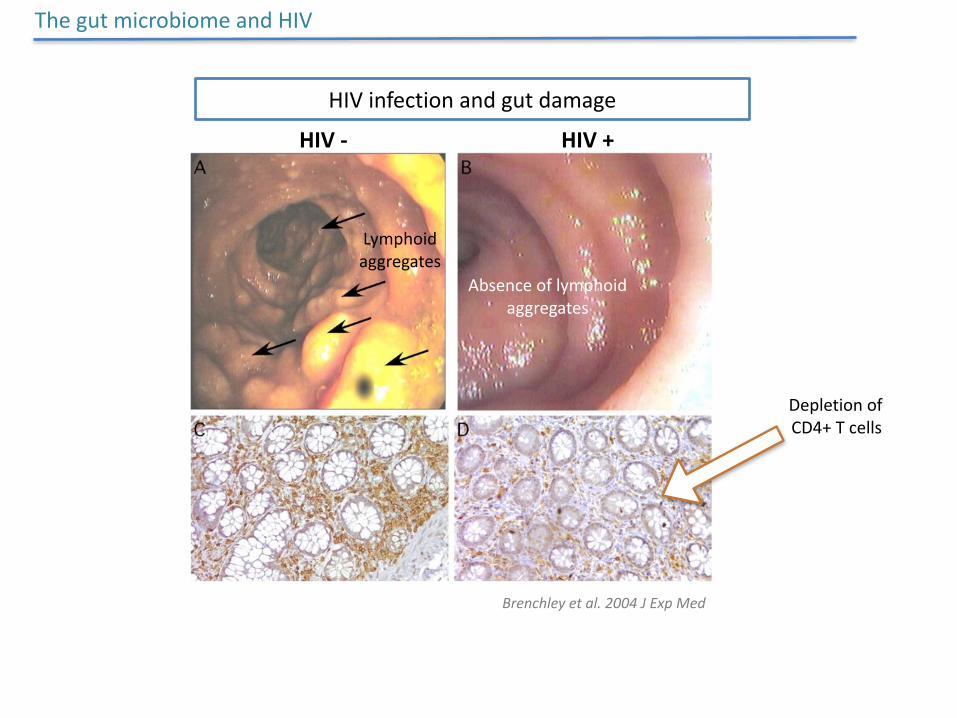
HIVinfectionandgutdamage
ThegutmicrobiomeandHIV
Brenchleyetal.2004JExpMed
HIVinfectionandgutdamage
ThegutmicrobiomeandHIV
Brenchleyetal.2004JExpMed
HIV- HIV+
DepletionofCD4+Tcells
Lymphoidaggregates
Absenceoflymphoidaggregates
Influence of the gut microbiota on HIV-1 infection
Chronic infection
Exploringthegutmicrobialcommunities
HIV-1 specific gut dysbiosis?
RandomshotgunTargetgenesurvey(16SrRNA)
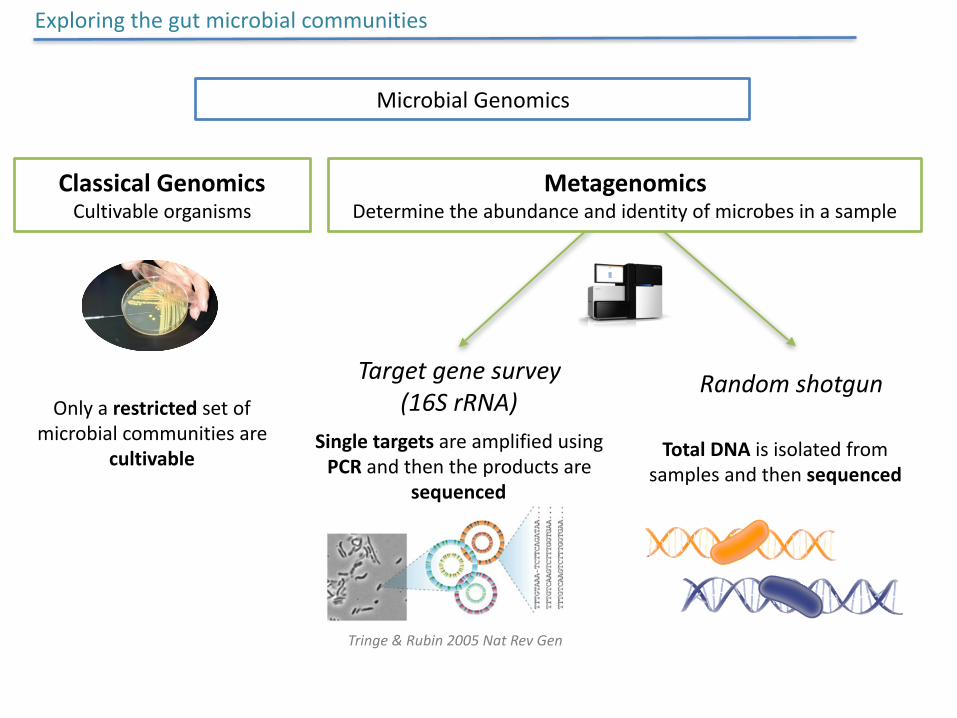
MicrobialGenomics
MetagenomicsDeterminetheabundanceandidentityofmicrobesinasample
SingletargetsareamplifiedusingPCRandthentheproductsare
sequenced
TotalDNAisisolatedfromsamplesandthensequenced
ClassicalGenomicsCultivableorganisms
Exploringthegutmicrobialcommunities
Onlyarestrictedsetofmicrobialcommunitiesare
cultivable
Tringe&Rubin2005NatRevGen
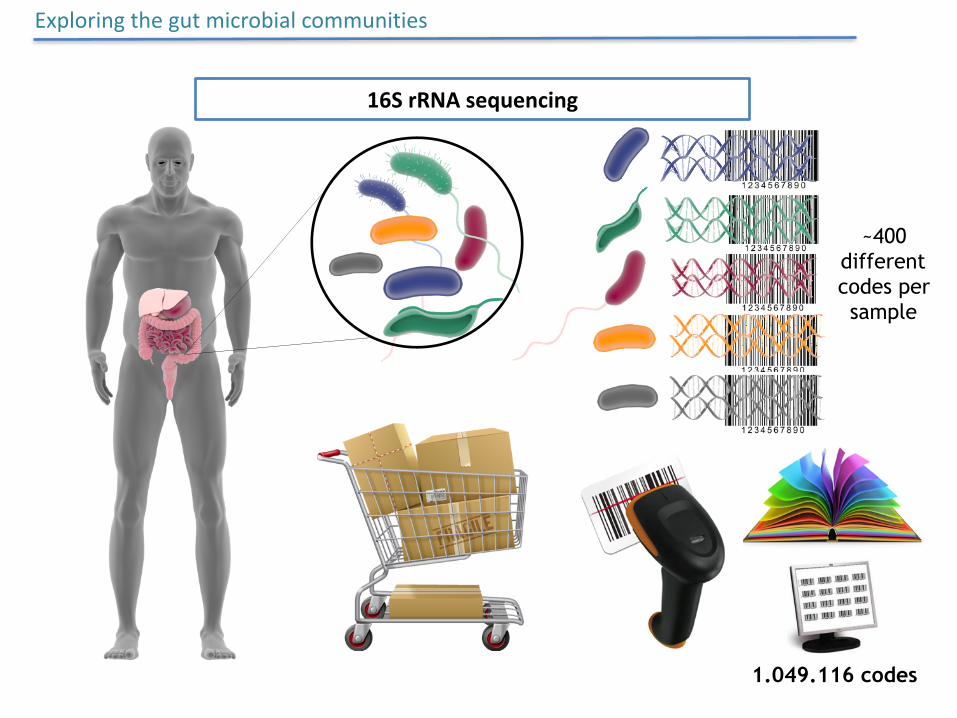
1.049.116 codes
~400 different codes per sample
Exploringthegutmicrobialcommunities
16SrRNAsequencing
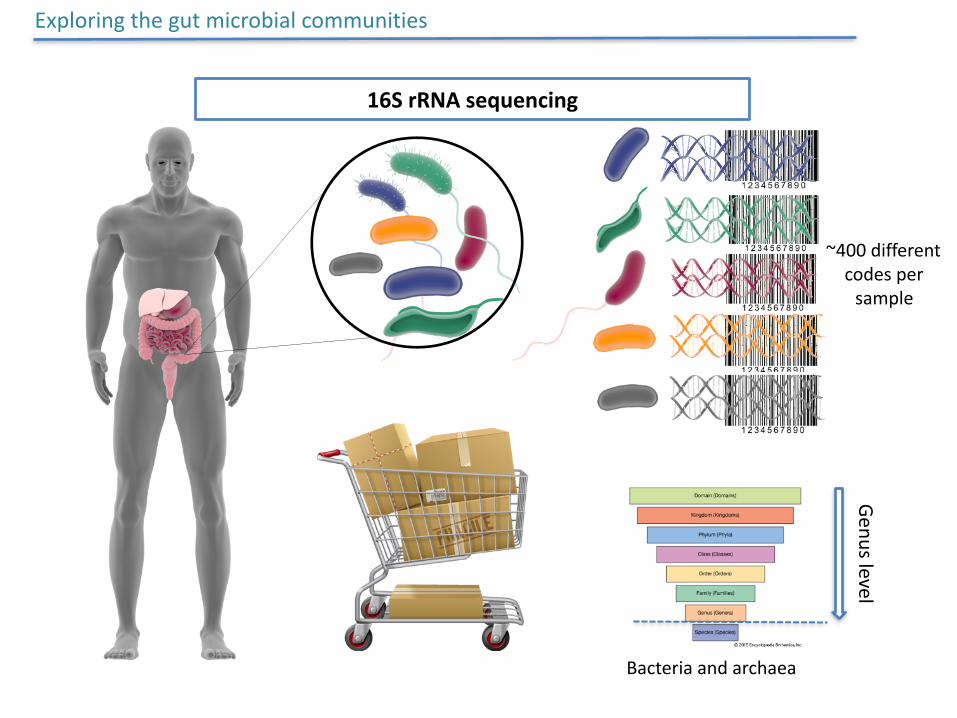
~400differentcodespersample
Exploringthegutmicrobialcommunities
16SrRNAsequencingGenuslevel
Bacteriaandarchaea
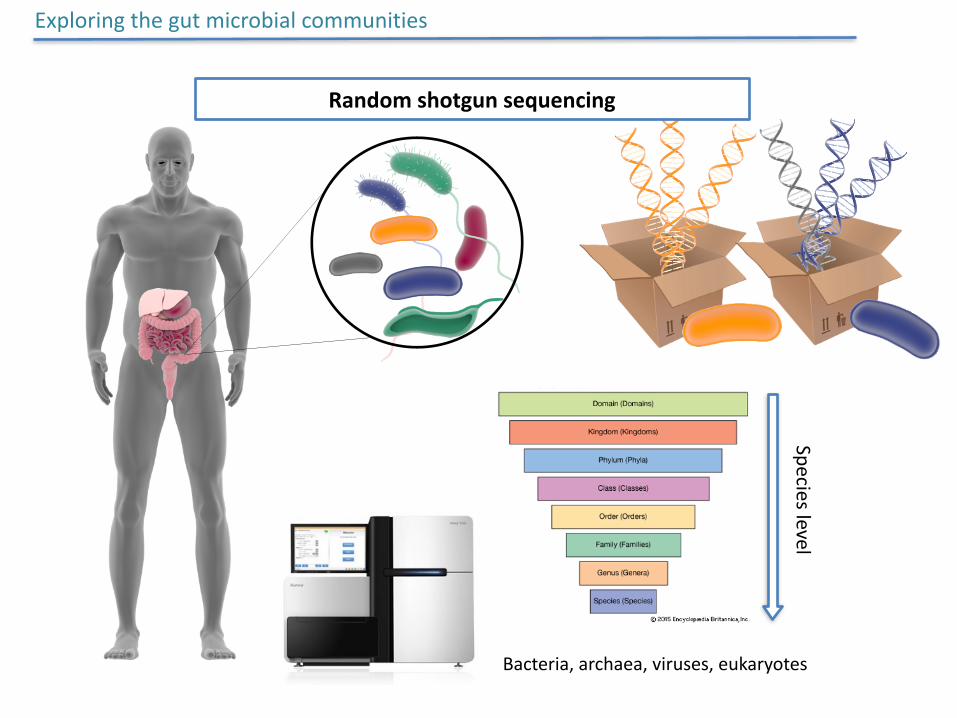
Randomshotgunsequencing
Exploringthegutmicrobialcommunities
Specieslevel
Bacteria,archaea,viruses,eukaryotes
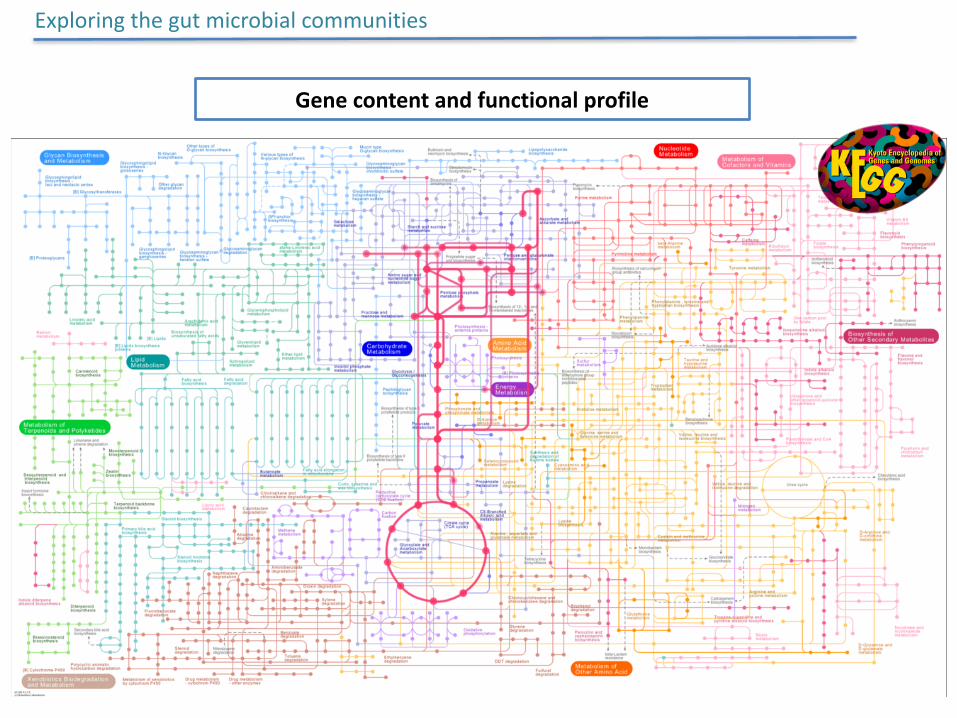
Exploringthegutmicrobialcommunities
Genecontentandfunctionalprofile
TheMetaHIVProject
HIV-1 specific gut dysbiosis?
PartI
PartII
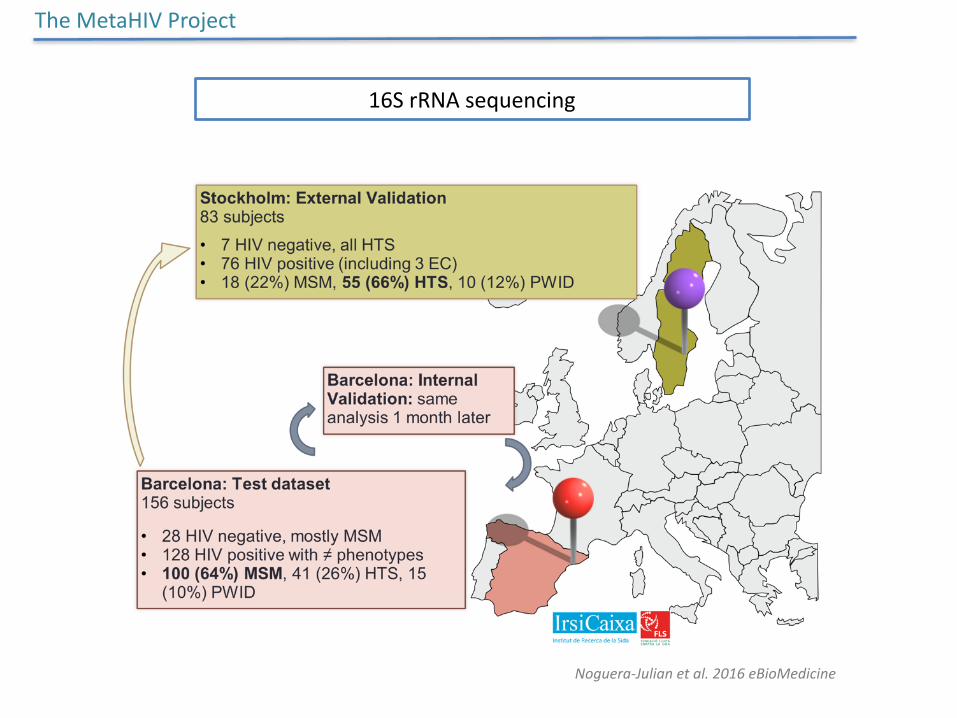
16SrRNAsequencing
TheMetaHIVProject
Noguera-Julianetal.2016eBioMedicine
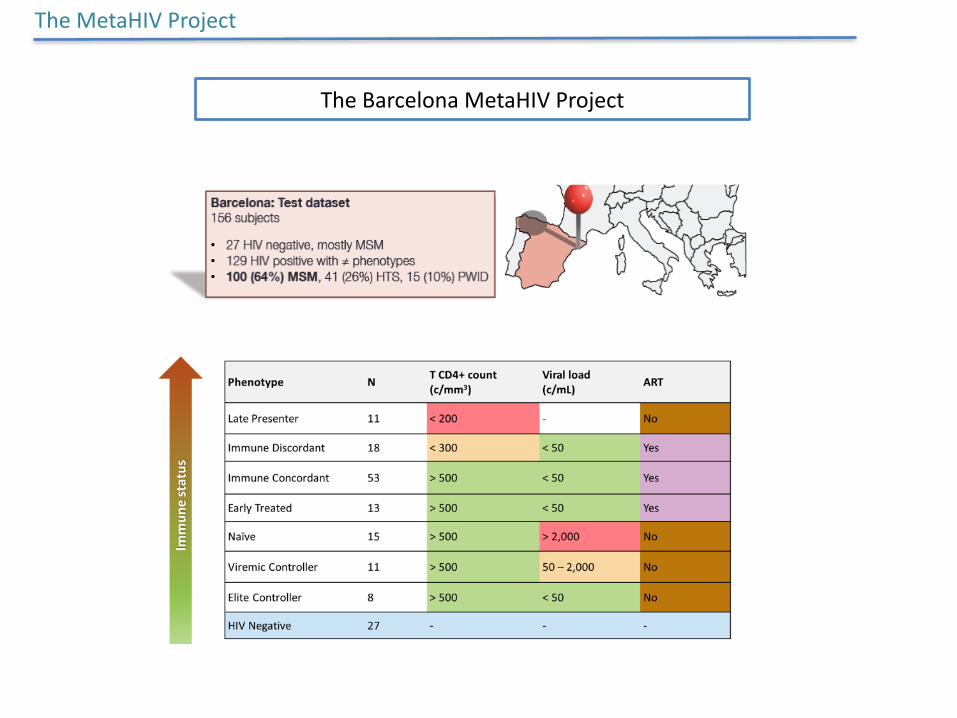
TheBarcelonaMetaHIVProject
TheMetaHIVProject
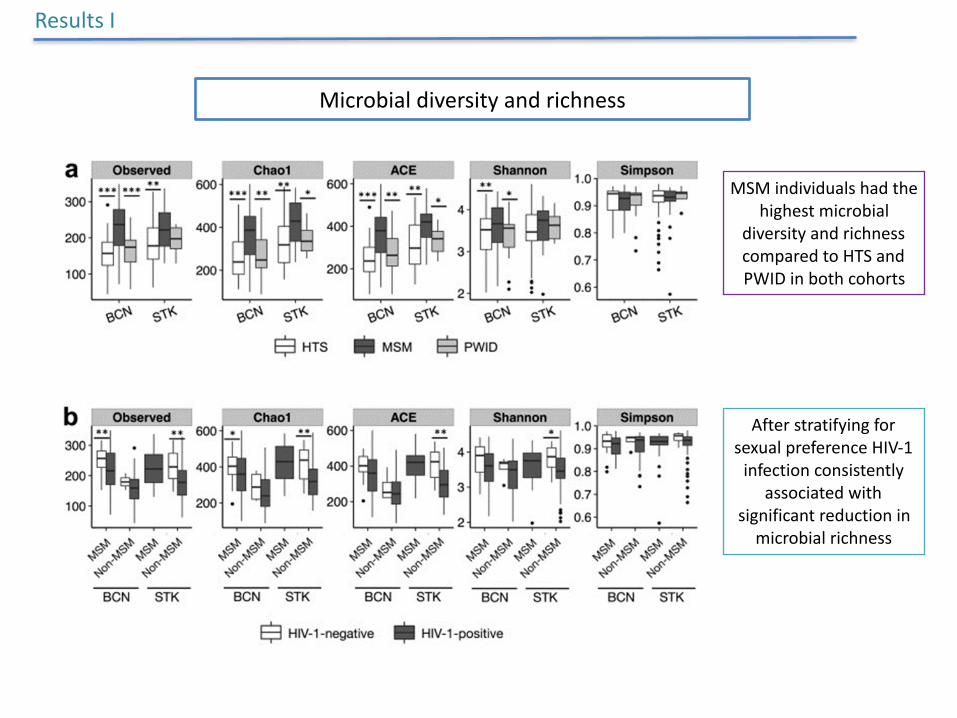
Microbialdiversityandrichness
ResultsI
MSMindividualshadthehighestmicrobial
diversityandrichnesscomparedtoHTSandPWIDinbothcohorts
AfterstratifyingforsexualpreferenceHIV-1infectionconsistently
associatedwithsignificantreductioninmicrobialrichness
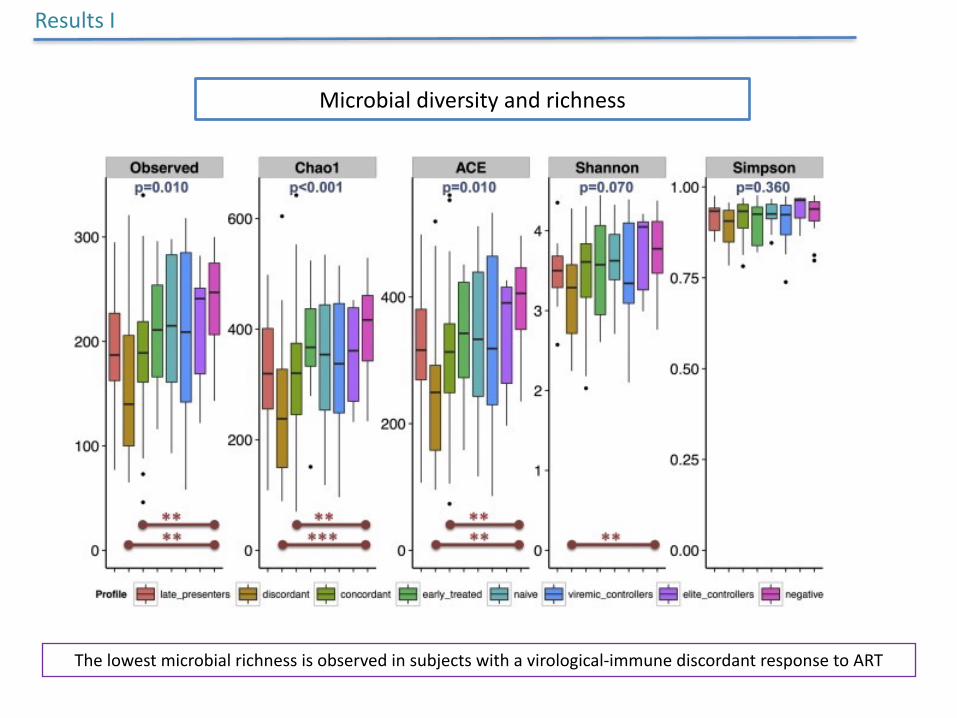
Microbialdiversityandrichness
ResultsI
Thelowestmicrobialrichnessisobservedinsubjectswithavirological-immunediscordantresponsetoART
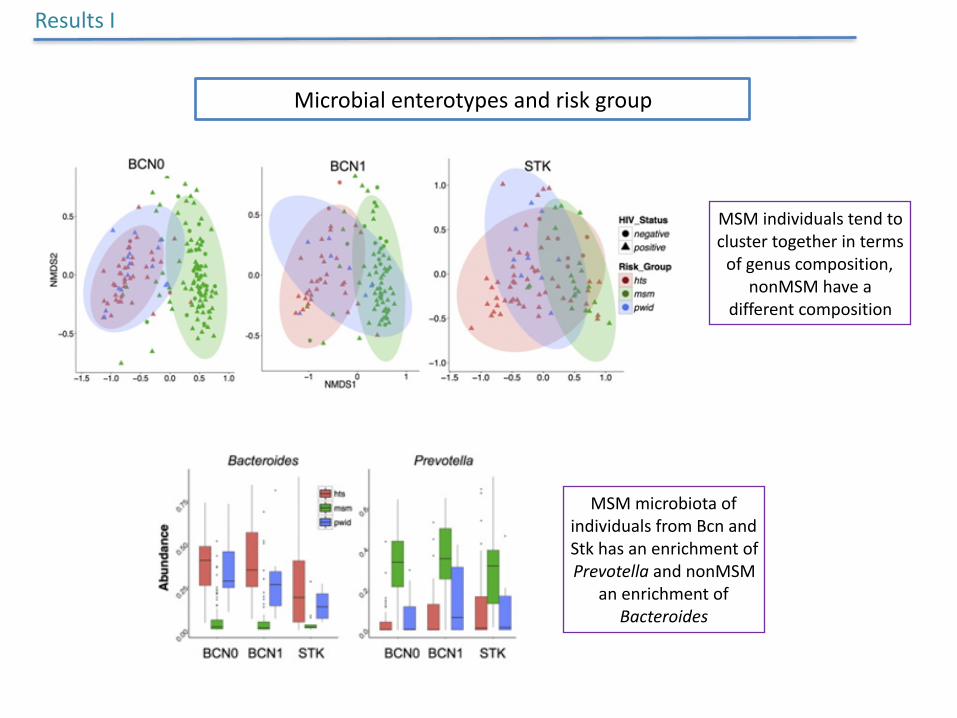
Microbialenterotypesandriskgroup
ResultsI
MSMindividualstendtoclustertogetherintermsofgenuscomposition,
nonMSMhaveadifferentcomposition
MSMmicrobiotaofindividualsfromBcnandStkhasanenrichmentofPrevotellaandnonMSM
anenrichmentofBacteroides
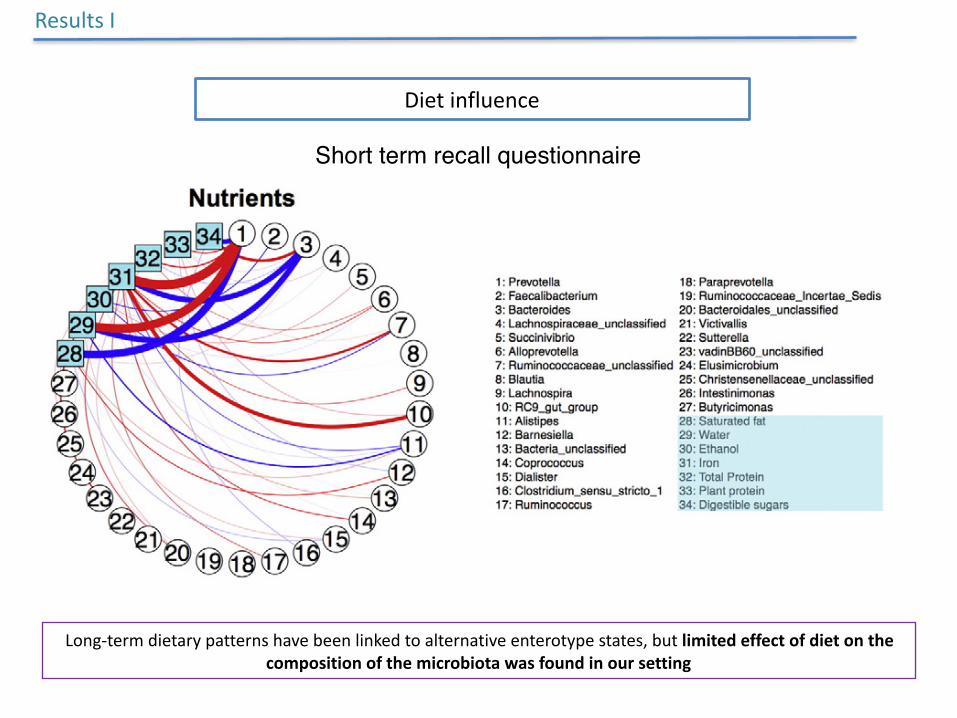
Dietinfluence
ResultsI
Short term recall questionnaire
presence of at least 2 clusters of fecal microbiomes in both cities(Fig. 4c). Such clusters were enriched either in Bacteroides orPrevotella, and had a similar bacterial composition to the correspondingpreviously described enterotypes (Arumugam et al., 2011; Koren et al.,2013) (Supplementary Fig. 3). As expected from previous work on gutenterotypes, there were strong positive correlations between the genusBacteroides and Parabacteroides, Barnesiella, Alistipes and Odoribacter,as well as between Prevotella and Alloprevotella, Catenibacterium,Mitsuokella and Intestinimonas, among others (Fig. 3), highlighting thatdifferences between the groups extended beyond a single genus. The
genera correlating with Prevotella were negatively correlated withBacteroides and vice versa. Moreover, themicrobiomes of the Bacteroidesand Prevotella clusters showed remarkably different functional profiles(Supplementary Figs. 4 and 5), also in agreement with previousenterotype descriptions (Arumugam et al., 2011).
3.4. Factors Associated With the Fecal Microbiota Composition
Weexplored variables potentially influencing the composition of thefecal microbiomes, according to a univariate ADONIS test of ecological
Fig. 6. Limited effect of diet on the composition of the microbiome. a) Subjects belonging to the Prevotella cluster and men who had sex with men (MSM) had significantly higher totalenergy intake. Therefore, all subsequent nutritional analyses were normalized for this factor. b) Main associations between bacterial genera, normalized amounts of nutrients (left)and food portions (right), according to a Dirichlet multinomial regression model. Positive and negative associations are shown in red and blue, respectively. Line thickness isproportional to the strength of the association. c) Of all links identified by the Dirichlet approach, the only significant differences between groups after adjusting for multiplecomparisons (Benjamini–Hochberg FDR b 0.1) were increased consumption of meat in the cluster Bacteroides and increased intake of dietary water in MSM. d) Spearman correlationsbetween normalized amounts of nutrients and Bray–Curtis distance to the furthest subject in the opposite cluster. Negative correlations imply increased amounts of nutrient withshorter distance to each cluster. Therefore, values in red and blue represent increased and decreased amounts of nutrients within each cluster, respectively. Although, in general,the direction of the correlations was concordant with previous publications, note the small effect sizes (R2 below the color key). None of the comparisons were statistically significantafter correction for multiple comparisons (Benjamini–Hochberg FDR b 0.1); Permanova p = 0.20 for overall differences between clusters. e, f) Mean and 95% confidence intervals forthe differences between clusters in consumption of nutrients (e) and portions of food (f). Comparisons were significant if the 95 confidence interval did not cross 0 (dashed red line).
143M. Noguera-Julian et al. / EBioMedicine 5 (2016) 135–146
Long-termdietarypatternshavebeenlinkedtoalternativeenterotypestates,butlimitedeffectofdietonthecompositionofthemicrobiotawasfoundinoursetting
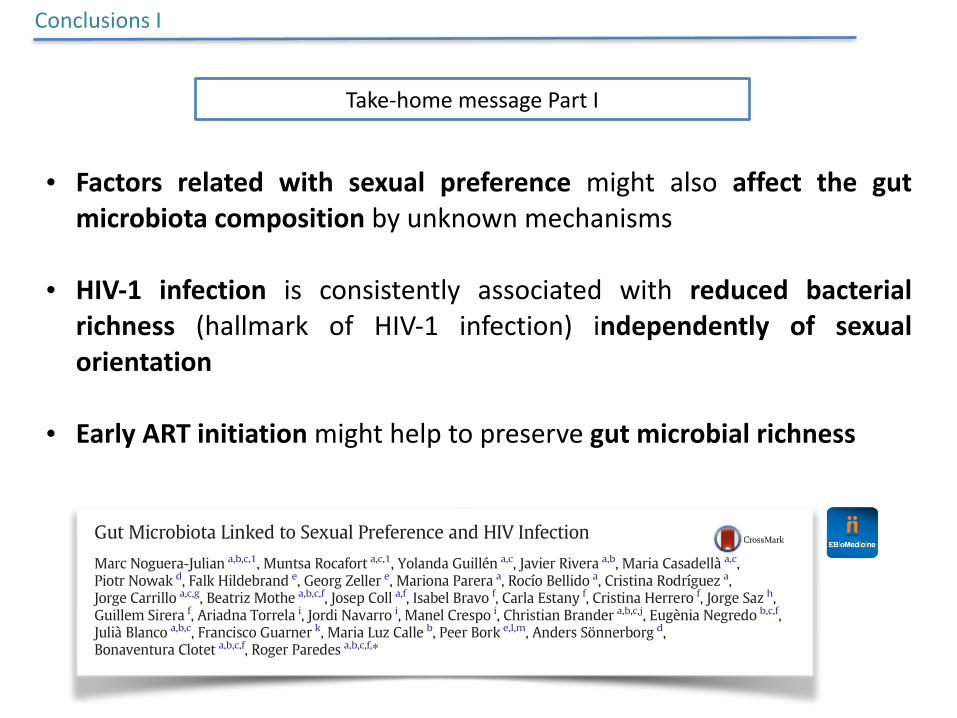
Take-homemessagePartI
ConclusionsI
• Factors related with sexual preference might also affect the gutmicrobiotacompositionbyunknownmechanisms
• HIV-1 infection is consistently associated with reduced bacterialrichness (hallmark of HIV-1 infection) independently of sexualorientation
• EarlyARTinitiationmighthelptopreservegutmicrobialrichness
Research Paper
Gut Microbiota Linked to Sexual Preference and HIV Infection
Marc Noguera-Julian a,b,c,1, Muntsa Rocafort a,c,1, Yolanda Guillén a,c, Javier Rivera a,b, Maria Casadellà a,c,Piotr Nowak d, Falk Hildebrand e, Georg Zeller e, Mariona Parera a, Rocío Bellido a, Cristina Rodríguez a,Jorge Carrillo a,c,g, Beatriz Mothe a,b,c,f, Josep Coll a,f, Isabel Bravo f, Carla Estany f, Cristina Herrero f, Jorge Saz h,Guillem Sirera f, Ariadna Torrela i, Jordi Navarro i, Manel Crespo i, Christian Brander a,b,c,j, Eugènia Negredo b,c,f,Julià Blanco a,b,c, Francisco Guarner k, Maria Luz Calle b, Peer Bork e,l,m, Anders Sönnerborg d,Bonaventura Clotet a,b,c,f, Roger Paredes a,b,c,f,⁎a IrsiCaixa AIDS Research Institute, Ctra de Canyet s/n, 08916 Badalona, Catalonia, Spainb Universitat de Vic-Universitat Central de Catalunya, C. Sagrada Família 7, 08500 Vic, Catalonia, Spainc Universitat Autònoma de Barcelona, 08193 Bellaterra, Catalonia, Spaind Department of Medicine, Unit of Infectious Diseases, Karolinska University Hospital, Karolinska Institutet, Huddinge 141, 86, Stockholm, Swedene Structural and Computational Biology, European Molecular Biology Laboratory, Meyerhofstrasse 1, 69117 Heidelberg, Germanyf HIV Unit & Lluita Contra la SIDA Foundation, Hospital Universitari Germans Trias i Pujol, Ctra de Canyet s/n, 08916 Badalona, Catalonia, Spaing ISGLOBAL, Carrer Rosselló, 132, 08036 Barcelona, Catalonia, Spainh BCN Checkpoint, Carrer del Comte Borrell, 164, 08015 Barcelona, Catalonia, Spaini Infectious Diseases Unit, Hospital Universitari Vall d'Hebrón, Passeig de la Vall d'Hebrón, 119–129, 08035 Barcelona, Catalonia, Spainj Institució Catalana de Recerca i Estudis Avançats (ICREA), Barcelona, Catalonia, Spaink Digestive Diseases Department, Vall d'Hebrón Institute of Research, Hospital Universitari Vall d'Hebrón, Passeig de la Vall d'Hebrón, 119–129, 08035 Barcelona, Catalonia, Spainl Max-Delbrück-Centre for Molecular Medicine, Robert-Rössle-Str. 10, 13092 Berlin, Germanym Molecular Medicine Partnership Unit, EMBL, Meyerhofstrasse 1, 69117 Heidelberg, Germany
a b s t r a c ta r t i c l e i n f o
Article history:Received 9 December 2015Received in revised form 12 January 2016Accepted 27 January 2016Available online 28 January 2016
The precise effects of HIV-1 on the gut microbiome are unclear. Initial cross-sectional studies providedcontradictory associations between microbial richness and HIV serostatus and suggested shifts from Bacteroidesto Prevotella predominance following HIV-1 infection, which have not been found in animal models or in studiesmatched for HIV-1 transmission groups. In two independent cohorts of HIV-1-infected subjects and HIV-1-negative controls in Barcelona (n=156) and Stockholm (n=84),menwho have sexwithmen (MSM) predom-inantly belonged to the Prevotella-rich enterotypewhereasmost non-MSMsubjectswere enriched in Bacteroides,independently of HIV-1 status, and with only a limited contribution of diet effects. Moreover, MSM had a signif-icantly richer and more diverse fecal microbiota than non-MSM individuals. After stratifying for sexual orienta-tion, there was no solid evidence of an HIV-specific dysbiosis. However, HIV-1 infection remained consistentlyassociated with reduced bacterial richness, the lowest bacterial richness being observed in subjects with avirological-immune discordant response to antiretroviral therapy. Our findings indicate that HIV gutmicrobiomestudies must control for HIV risk factors and suggest interventions on gut bacterial richness as possible novelavenues to improve HIV-1-associated immune dysfunction.
© 2016 The Authors. Published by Elsevier B.V. This is an open access article under the CC BY license(http://creativecommons.org/licenses/by/4.0/).
Keywords:HIV-1MicrobiomeMicrobiota16S rDNAPrevotellaBacteroides
1. Introduction
The main clinical problems of people living with HIV (PLWH)in areas with adequate healthcare standards and continued antire-troviral therapy (ART) supply are increasingly related to prematureaging (Paiardini and Müller-Trutwin, 2013). That is, a precocious
development of type 2 diabetes, dislipidemia, cardiovascular diseases,osteoporosis and frailty syndrome. Such diseases have been related tostructural or metabolic perturbations in the gut microbiota of non-HIV-infected subjects (Claesson et al., 2012; Koeth et al., 2013; LeChatelier et al., 2013; Tang et al., 2013) whereas, in PLWH, have beenlinked to chronic inflammation, immune activation and endotoxemia(Brenchley et al., 2006; Douek, 2003; Sandler and Douek, 2012). Thusthere is considerable interest in understanding the role of the humangut microbiome in HIV pathogenesis and, in particular, its ability toperpetuate chronic inflammation and foster immune senescence. Thishas immediate clinical implications because, in theory, it might be
EBioMedicine 5 (2016) 135–146
⁎ Corresponding author at: HIV Unit and IrsiCaixa AIDS Research Institute, Ctra deCanyet s/n, 08916 Badalona, Catalonia, Spain.
E-mail address: [email protected] (R. Paredes).1 Contributed equally to this work.
http://dx.doi.org/10.1016/j.ebiom.2016.01.0322352-3964/© 2016 The Authors. Published by Elsevier B.V. This is an open access article under the CC BY license (http://creativecommons.org/licenses/by/4.0/).
Contents lists available at ScienceDirect
EBioMedicine
j ourna l homepage: www.eb iomed ic ine .com
TheMetaHIVProject
HIV-1 specific gut dysbiosis?
PartI
PartII
0e+00
1e�06
2e�06
250000 500000 750000
0.00000
0.00025
0.00050
0.00075
0.00100
3500 4000 4500 5000 5500
0
25
50
75
100
late p
rese
nter
disco
rdan
t
conc
ordan
t
early
-trea
ted
ART naive
virem
ic co
ntroll
er
elite
contr
oller
HIV-1
nega
tive
Fre
quen
cy (
%)
0e+00
1e�06
2e�06
3e�06
250000 500000 750000
Gene richness, all subjects
HIV-1 negative
HIV-1 positive
0e+00
1e�06
2e�06
3e�06
4e�06
Gene richness, MSM
400000 800000600000
2
9
3
15
11
42
5
8
7
8
6
5
3
5
16
11
a b
c d
e
Den
sity
Den
sity
LGC HGC
HIV-1 positive
HIV-1 negative
Gene counts (10 M) KEGG counts (10 M)
Gene counts (10 M) Gene counts (10 M)
2p-value = 0.001
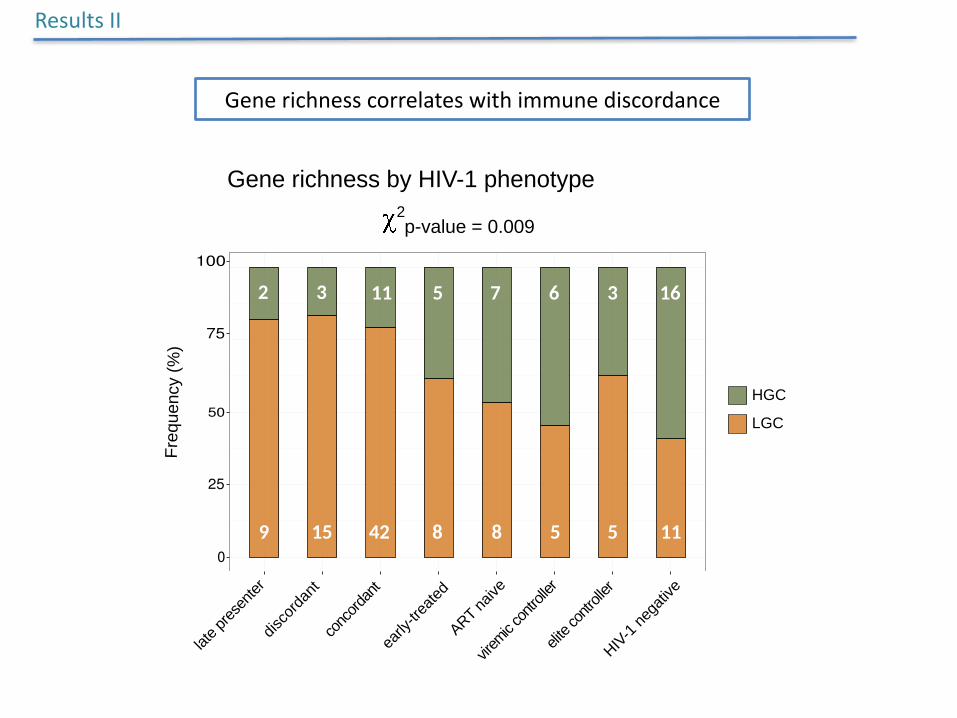
2p-value = 0.009
2p-value = 0.055
Gene richness KEGG richness
Gene richness by HIV-1 phenotype
HGC
LGC
f Gene richness by nadir CD4+ T-cell counts
< 10
0
100 -
200
200 -
500
> 50
0
0
25
50
75
100
18
1
18
4
34
16
21
15
11
16
2p-value = 0.002
HIV-1
nega
tive
CD4+ T cells / mm3
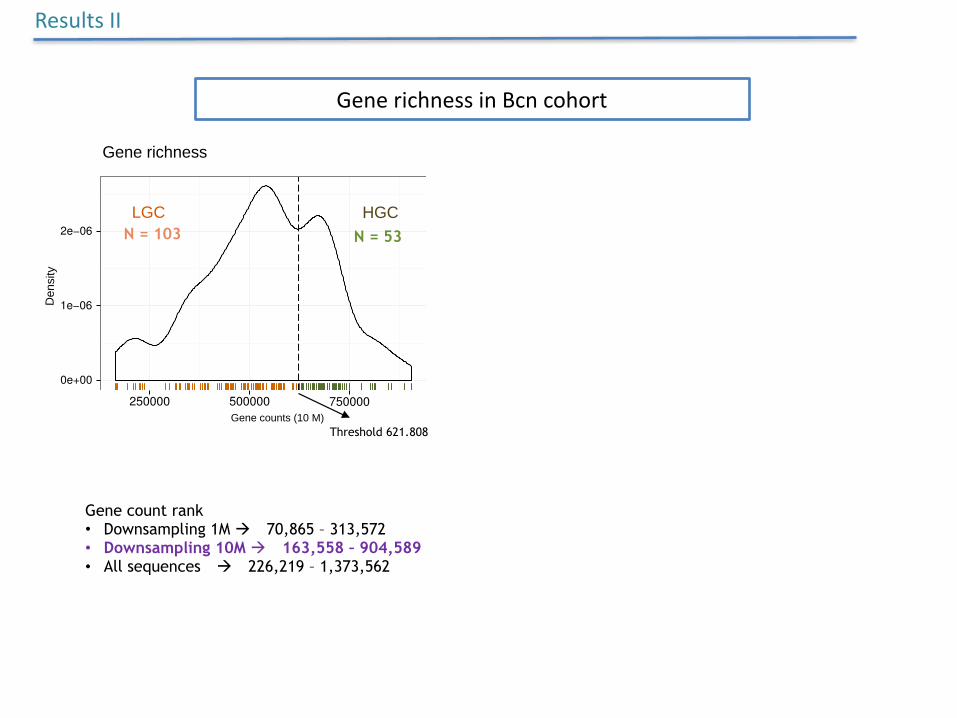
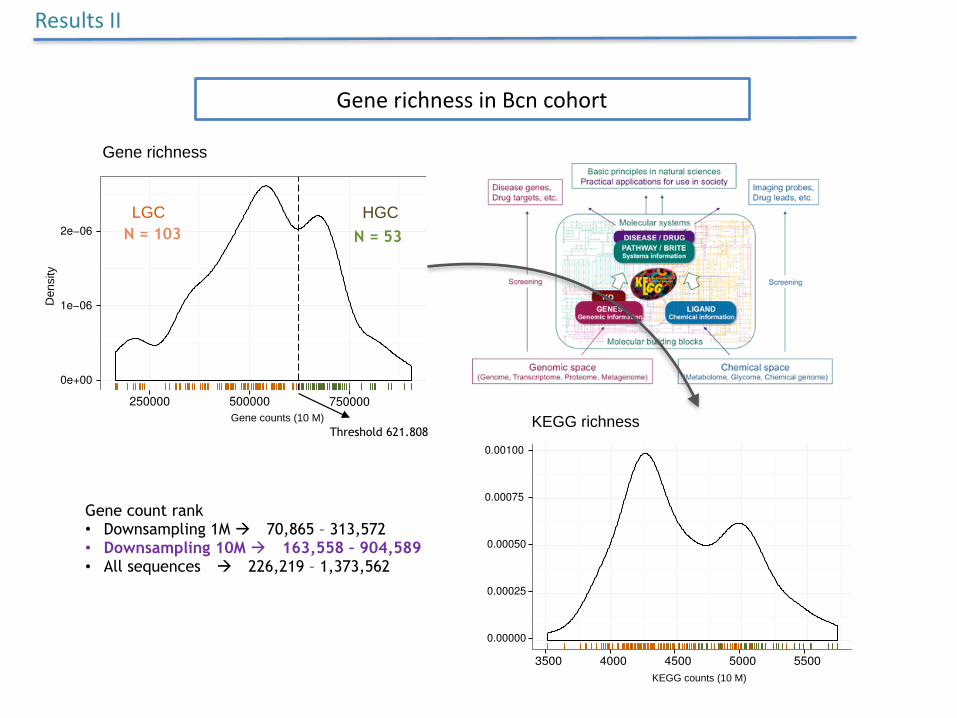
Gene count rank • Downsampling 1M à 70,865 – 313,572 • Downsampling 10M à 163,558 – 904,589 • All sequences à 226,219 – 1,373,562
N = 103 N = 53
Threshold 621.808
GenerichnessinBcncohort
ResultsII
0e+00
1e�06
2e�06
250000 500000 750000
0.00000
0.00025
0.00050
0.00075
0.00100
3500 4000 4500 5000 5500
0
25
50
75
100
late p
rese
nter
disco
rdan
t
conc
ordan
t
early
-trea
ted
ART naive
virem
ic co
ntroll
er
elite
contr
oller
HIV-1
nega
tive
Fre
quen
cy (
%)
0e+00
1e�06
2e�06
3e�06
250000 500000 750000
Gene richness, all subjects
HIV-1 negative
HIV-1 positive
0e+00
1e�06
2e�06
3e�06
4e�06
Gene richness, MSM
400000 800000600000
2
9
3
15
11
42
5
8
7
8
6
5
3
5
16
11
a b
c d
e
Den
sity
Den
sity
LGC HGC
HIV-1 positive
HIV-1 negative
Gene counts (10 M) KEGG counts (10 M)
Gene counts (10 M) Gene counts (10 M)
2p-value = 0.001
2p-value = 0.009
2p-value = 0.055
Gene richness KEGG richness
Gene richness by HIV-1 phenotype
HGC
LGC
f Gene richness by nadir CD4+ T-cell counts
< 10
0
100 -
200
200 -
500
> 50
0
0
25
50
75
100
18
1
18
4
34
16
21
15
11
16
2p-value = 0.002
HIV-1
nega
tive
CD4+ T cells / mm3
0e+00
1e�06
2e�06
250000 500000 750000
0.00000
0.00025
0.00050
0.00075
0.00100
3500 4000 4500 5000 5500
0
25
50
75
100
late p
rese
nter
disco
rdan
t
conc
ordan
t
early
-trea
ted
ART naive
virem
ic co
ntroll
er
elite
contr
oller
HIV-1
nega
tive
Fre
quen
cy (
%)
0e+00
1e�06
2e�06
3e�06
250000 500000 750000
Gene richness, all subjects
HIV-1 negative
HIV-1 positive
0e+00
1e�06
2e�06
3e�06
4e�06
Gene richness, MSM
400000 800000600000
2
9
3
15
11
42
5
8
7
8
6
5
3
5
16
11
a b
c d
e
Den
sity
Den
sity
LGC HGC
HIV-1 positive
HIV-1 negative
Gene counts (10 M) KEGG counts (10 M)
Gene counts (10 M) Gene counts (10 M)
2p-value = 0.001
2p-value = 0.009
2p-value = 0.055
Gene richness KEGG richness
Gene richness by HIV-1 phenotype
HGC
LGC
f Gene richness by nadir CD4+ T-cell counts
< 10
0
100 -
200
200 -
500
> 50
0
0
25
50
75
100
18
1
18
4
34
16
21
15
11
16
2p-value = 0.002
HIV-1
nega
tive
CD4+ T cells / mm3
LGC HGC
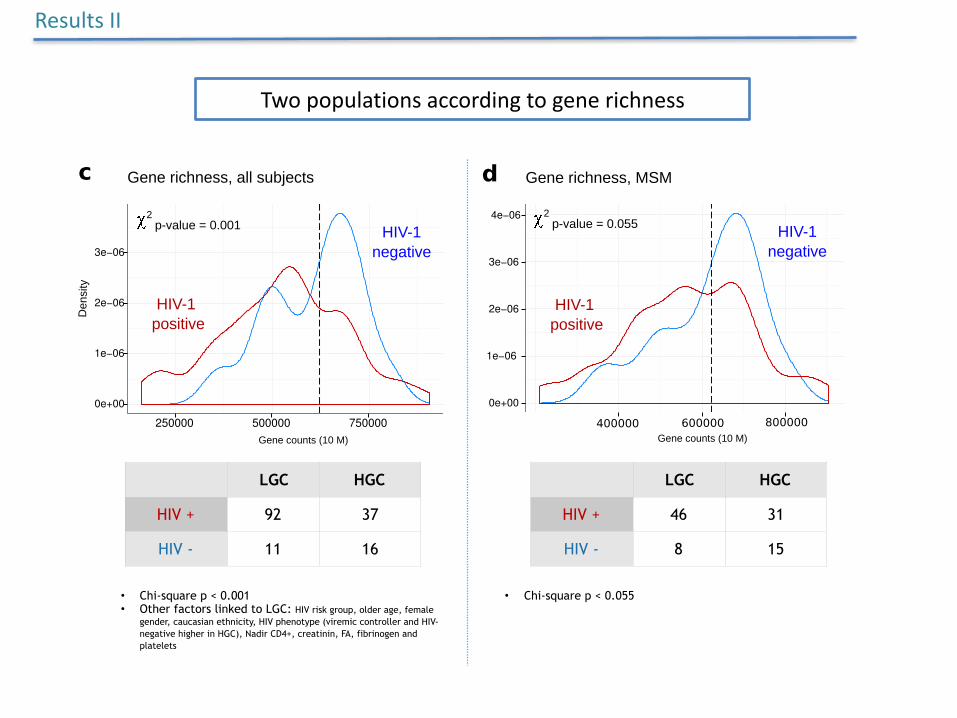
HIV + 92 37
HIV - 11 16
• Chi-square p < 0.001 • Other factors linked to LGC: HIV risk group, older age, female
gender, caucasian ethnicity, HIV phenotype (viremic controller and HIV-negative higher in HGC), Nadir CD4+, creatinin, FA, fibrinogen and platelets
LGC HGC
HIV + 46 31
HIV - 8 15
• Chi-square p < 0.055
Twopopulationsaccordingtogenerichness
ResultsII
0e+00
1e�06
2e�06
250000 500000 750000
0.00000
0.00025
0.00050
0.00075
0.00100
3500 4000 4500 5000 5500
0
25
50
75
100
late p
rese
nter
disco
rdan
t
conc
ordan
t
early
-trea
ted
ART naive
virem
ic co
ntroll
er
elite
contr
oller
HIV-1
nega
tive
Fre
quen
cy (
%)
0e+00
1e�06
2e�06
3e�06
250000 500000 750000
Gene richness, all subjects
HIV-1 negative
HIV-1 positive
0e+00
1e�06
2e�06
3e�06
4e�06
Gene richness, MSM
400000 800000600000
2
9
3
15
11
42
5
8
7
8
6
5
3
5
16
11
a b
c d
eD
ensi
tyD
ensi
ty
LGC HGC
HIV-1 positive
HIV-1 negative
Gene counts (10 M) KEGG counts (10 M)
Gene counts (10 M) Gene counts (10 M)
2p-value = 0.001
2p-value = 0.009
2p-value = 0.055
Gene richness KEGG richness
Gene richness by HIV-1 phenotype
HGC
LGC
f Gene richness by nadir CD4+ T-cell counts
< 10
0
100 -
200
200 -
500
> 50
0
0
25
50
75
100
18
1
18
4
34
16
21
15
11
16
2p-value = 0.002
HIV-1
nega
tive
CD4+ T cells / mm3
Generichnesscorrelateswithimmunediscordance
ResultsII
0e+00
1e�06
2e�06
250000 500000 750000
0.00000
0.00025
0.00050
0.00075
0.00100
3500 4000 4500 5000 5500
0
25
50
75
100
late p
rese
nter
disco
rdan
t
conc
ordan
t
early
-trea
ted
ART naive
virem
ic co
ntroll
er
elite
contr
oller
HIV-1
nega
tive
Fre
quen
cy (
%)
0e+00
1e�06
2e�06
3e�06
250000 500000 750000
Gene richness, all subjects
HIV-1 negative
HIV-1 positive
0e+00
1e�06
2e�06
3e�06
4e�06
Gene richness, MSM
400000 800000600000
2
9
3
15
11
42
5
8
7
8
6
5
3
5
16
11
a b
c d
e
Den
sity
Den
sity
LGC HGC
HIV-1 positive
HIV-1 negative
Gene counts (10 M) KEGG counts (10 M)
Gene counts (10 M) Gene counts (10 M)
2p-value = 0.001
2p-value = 0.009
2p-value = 0.055
Gene richness KEGG richness
Gene richness by HIV-1 phenotype
HGC
LGC
f Gene richness by nadir CD4+ T-cell counts
< 10
0
100 -
200
200 -
500
> 50
0
0
25
50
75
100
18
1
18
4
34
16
21
15
11
16
2p-value = 0.002
HIV-1
nega
tive
CD4+ T cells / mm3
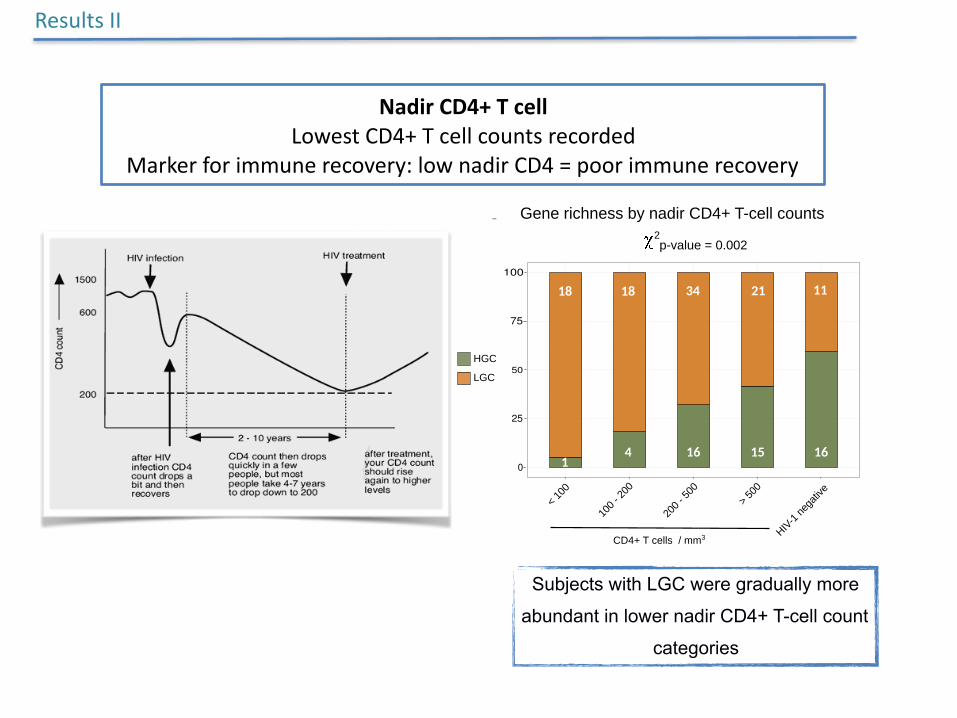
Subjects with LGC were gradually more
abundant in lower nadir CD4+ T-cell count
categories
NadirCD4+TcellLowestCD4+Tcellcountsrecorded
Markerforimmunerecovery:lownadirCD4=poorimmunerecovery
ResultsII
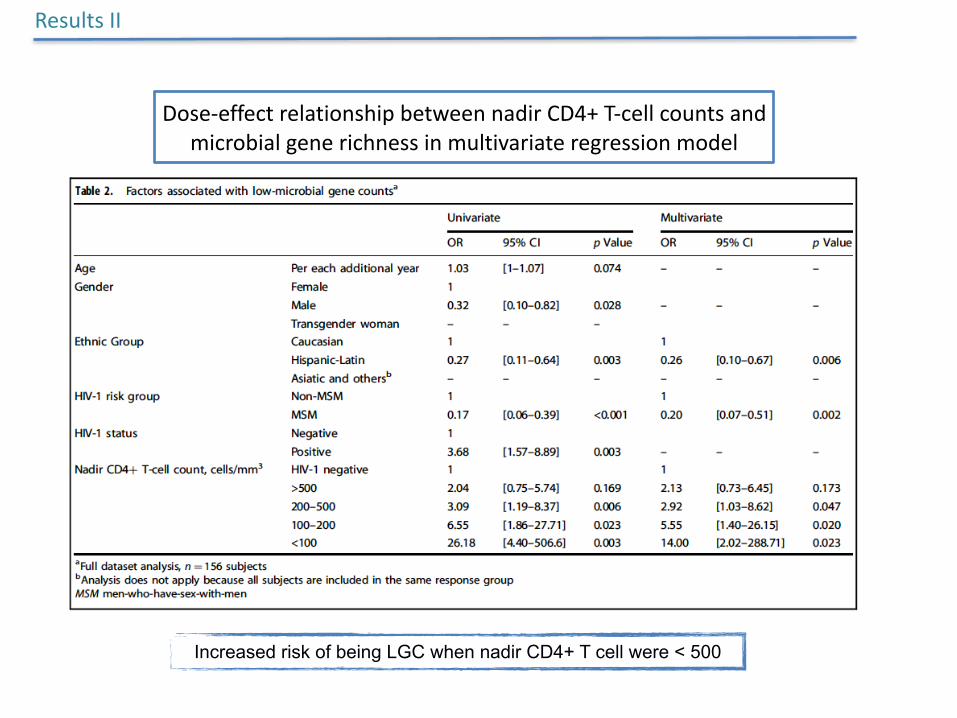
Increased risk of being LGC when nadir CD4+ T cell were < 500
Dose-effectrelationshipbetweennadirCD4+T-cellcountsandmicrobialgenerichnessinmultivariateregressionmodel
ResultsII
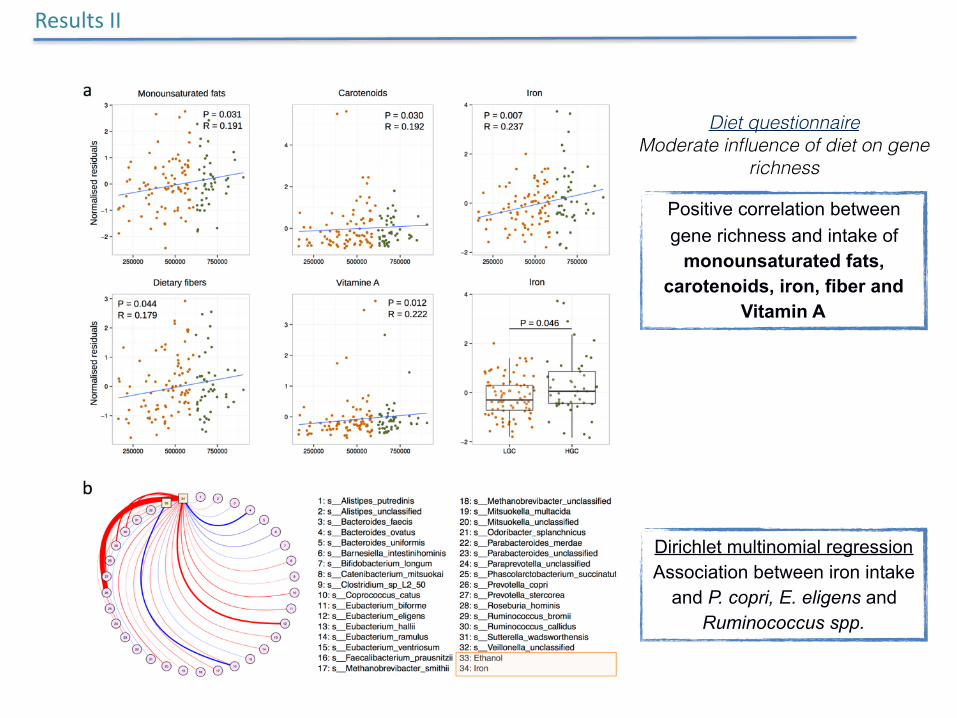
Positive correlation between gene richness and intake of
monounsaturated fats, carotenoids, iron, fiber and
Vitamin A
Dirichlet multinomial regression Association between iron intake
and P. copri, E. eligens and Ruminococcus spp.
Diet questionnaire Moderate influence of diet on gene
richness
ResultsII
0 1 2 3 4 5
Sutterella wadsworthensisBacteroides stercoris
Parabacteroides merdaeLachnospiraceae bacterium 1 4 56FAA
Bacteroides thetaiotaomicronBacteroides clarusPrevotella copri
Ruminococcus bromiiEubacterium biformeCoprococcus comes
Ruminococcus flavefaciensOxalobacter formigenes
Butyrivibrio crossotusOlsenella unclassified
Roseburia hominisMethanosphaera stadtmanae
Eubacterium siraeumCollinsella aerofaciensRuminococcus obeumAlistipes senegalensis
Coprococcus catusEubacterium eligens
Dorea formicigeneransMethanobrevibacter unclassified
Methanobrevibacter smithiiSubdoligranulum unclassified
0.00
-0.5
0
0.50
-0.2
5
0.25
Subdoligranulum unclassifedMethanobrevibacter smithii
Methanobrevibacter unclassifiedCoprococcus catus
Methanosphaera stadtmanaeCoprococcus comesEubacterium biforme
Olsenella unclassifiedButyrivibrio crossotus
Parabacteroides unclassifiedBacteroides ovatusRoseburia hominis
Eubacterium siraeumPrevotella copri
Prevotella stercoreaCatenibacterium mitsuokai
Ruminococcus obeumEubacterium ramulusEubacterium eligens
Ruminococcus flavefaciensBrachyspira unclassified
Dorea formicigeneransSutterella wadsworthensis
Parabacteroides merdaeRuminococcus callidus
Faecalibacterium prausnitziiDorea longicatena
Phascolarctobacterium succinatutensRuminococcus bromii
Alistipes senegalensis
AUC
0.9170.8820.8420.823
0.704
0.7530.7710.7680.729
0.7020.7350.7100.7110.5540.7310.7420.7000.7170.6960.6960.682
genehiv
HGCHGCLGCLGC
Totalge
2e+4e+6e+8e+
0 0.5 1.0
1.0
0.5
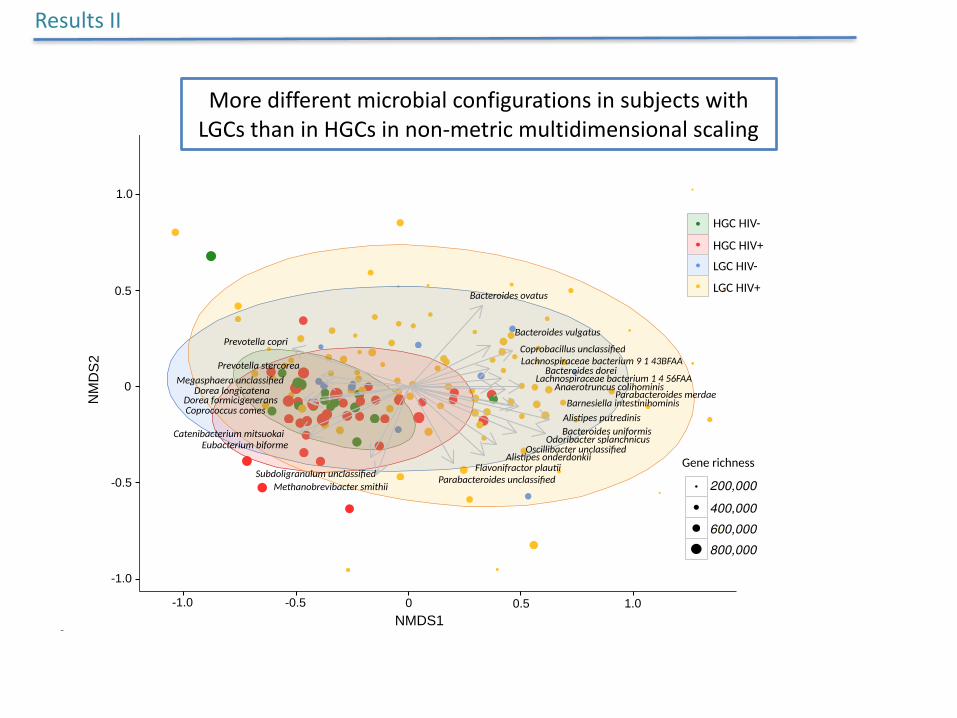
Prevotella copri
Gene richness
200,000
400,000
600,000
800,000
NMDS1
NM
DS
2
-1.0 -0.5
0
-0.5
-1.0
Prevotella stercoreaMegasphaera unclassified
Dorea longicatenaDorea formicigeneransCoprococcus comes
Catenibacterium mitsuokaiEubacterium biforme
Subdoligranulum unclassifiedMethanobrevibacter smithii
Bacteroides ovatus
Bacteroides vulgatus
Coprobacillus unclassifiedLachnospiraceae bacterium 9 1 43BFAA
Bacteroides doreiLachnospiraceae bacterium 1 4 56FAA
Anaerotruncus colihominisParabacteroides merdae
Barnesiella intes�nihominisAlis�pes putredinisBacteroides uniformis
Odoribacter splanchnicusOscillibacter unclassified
Alis�pes onderdonkiiFlavonifractor plau�i
Parabacteroides unclassified
HGC HIV-
HGC HIV+
LGC HIV-
LGC HIV+
0.7190.6420.7080.6890.6880.7040.6810.6510.634
a
MSMno
nMSM
Spearman's rho
Mean Decrease Gini
b c
Ace
But
For
Pro
Lac
Suc
CH
4
Eth
Met
Gra
m
+++++
++++
+
++++---
---
-
-
--
v
v
SCFA
Acid Alcoho
l
Gas
* * * * * * * * *
MoredifferentmicrobialconfigurationsinsubjectswithLGCsthaninHGCsinnon-metricmultidimensionalscaling
ResultsII
0 1 2 3 4 5
Sutterella wadsworthensisBacteroides stercoris
Parabacteroides merdaeLachnospiraceae bacterium 1 4 56FAA
Bacteroides thetaiotaomicronBacteroides clarusPrevotella copri
Ruminococcus bromiiEubacterium biformeCoprococcus comes
Ruminococcus flavefaciensOxalobacter formigenes
Butyrivibrio crossotusOlsenella unclassified
Roseburia hominisMethanosphaera stadtmanae
Eubacterium siraeumCollinsella aerofaciensRuminococcus obeumAlistipes senegalensis
Coprococcus catusEubacterium eligens
Dorea formicigeneransMethanobrevibacter unclassified
Methanobrevibacter smithiiSubdoligranulum unclassified
0.00
-0.5
0
0.50
-0.2
5
0.25
Subdoligranulum unclassifedMethanobrevibacter smithii
Methanobrevibacter unclassifiedCoprococcus catus
Methanosphaera stadtmanaeCoprococcus comesEubacterium biforme
Olsenella unclassifiedButyrivibrio crossotus
Parabacteroides unclassifiedBacteroides ovatusRoseburia hominis
Eubacterium siraeumPrevotella copri
Prevotella stercoreaCatenibacterium mitsuokai
Ruminococcus obeumEubacterium ramulusEubacterium eligens
Ruminococcus flavefaciensBrachyspira unclassified
Dorea formicigeneransSutterella wadsworthensis
Parabacteroides merdaeRuminococcus callidus
Faecalibacterium prausnitziiDorea longicatena
Phascolarctobacterium succinatutensRuminococcus bromii
Alistipes senegalensis
AUC
0.9170.8820.8420.823
0.704
0.7530.7710.7680.729
0.7020.7350.7100.7110.5540.7310.7420.7000.7170.6960.6960.682
genehiv
HGCHGCLGCLGC
Totalge
2e+4e+6e+8e+
0 0.5 1.0
1.0
0.5
Prevotella copri
Gene richness
200,000
400,000
600,000
800,000
NMDS1
NM
DS
2
-1.0 -0.5
0
-0.5
-1.0
Prevotella stercoreaMegasphaera unclassified
Dorea longicatenaDorea formicigeneransCoprococcus comes
Catenibacterium mitsuokaiEubacterium biforme
Subdoligranulum unclassifiedMethanobrevibacter smithii
Bacteroides ovatus
Bacteroides vulgatus
Coprobacillus unclassifiedLachnospiraceae bacterium 9 1 43BFAA
Bacteroides doreiLachnospiraceae bacterium 1 4 56FAA
Anaerotruncus colihominisParabacteroides merdae
Barnesiella intes�nihominisAlis�pes putredinisBacteroides uniformis
Odoribacter splanchnicusOscillibacter unclassified
Alis�pes onderdonkiiFlavonifractor plau�i
Parabacteroides unclassified
HGC HIV-
HGC HIV+
LGC HIV-
LGC HIV+
0.7190.6420.7080.6890.6880.7040.6810.6510.634
a
MSMno
nMSM
Spearman's rho
Mean Decrease Gini
b c
Ace
But
For
Pro
Lac
Suc
CH
4
Eth
Met
Gra
m
+++++
++++
+
++++---
---
-
-
--
v
v
SCFA
Acid Alcoho
l
Gas
* * * * * * * * *
ResultsII
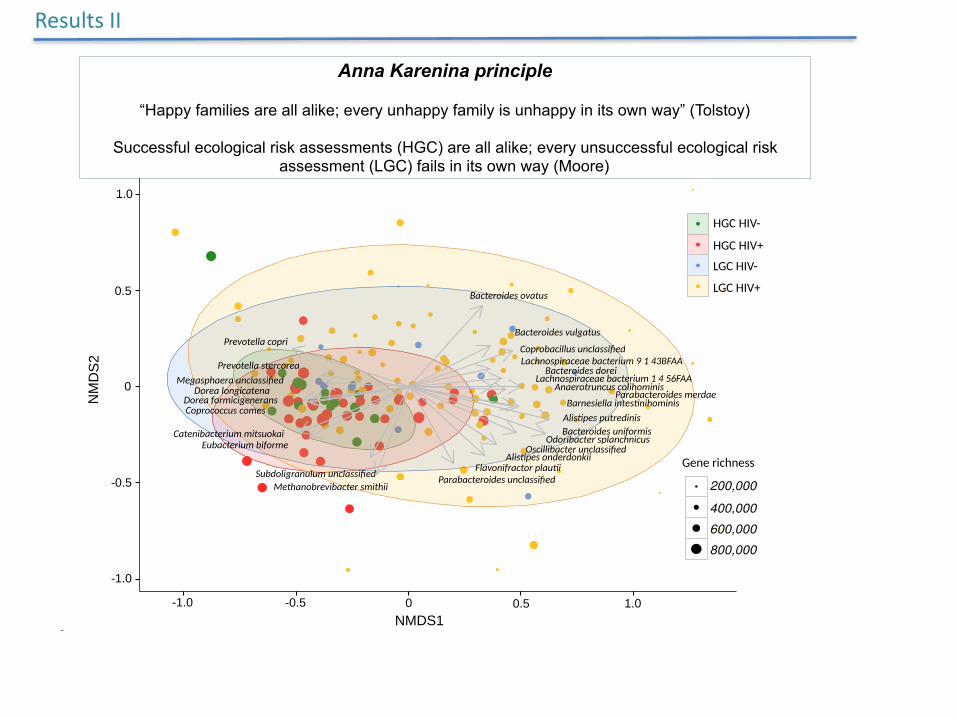
Anna Karenina principle
“Happy families are all alike; every unhappy family is unhappy in its own way” (Tolstoy)
Successful ecological risk assessments (HGC) are all alike; every unsuccessful ecological risk assessment (LGC) fails in its own way (Moore)
0 1 2 3 4 5
Sutterella wadsworthensisBacteroides stercoris
Parabacteroides merdaeLachnospiraceae bacterium 1 4 56FAA
Bacteroides thetaiotaomicronBacteroides clarusPrevotella copri
Ruminococcus bromiiEubacterium biformeCoprococcus comes
Ruminococcus flavefaciensOxalobacter formigenes
Butyrivibrio crossotusOlsenella unclassified
Roseburia hominisMethanosphaera stadtmanae
Eubacterium siraeumCollinsella aerofaciensRuminococcus obeumAlistipes senegalensis
Coprococcus catusEubacterium eligens
Dorea formicigeneransMethanobrevibacter unclassified
Methanobrevibacter smithiiSubdoligranulum unclassified
0.00
-0.5
0
0.50
-0.2
5
0.25
Subdoligranulum unclassifedMethanobrevibacter smithii
Methanobrevibacter unclassifiedCoprococcus catus
Methanosphaera stadtmanaeCoprococcus comesEubacterium biforme
Olsenella unclassifiedButyrivibrio crossotus
Parabacteroides unclassifiedBacteroides ovatusRoseburia hominis
Eubacterium siraeumPrevotella copri
Prevotella stercoreaCatenibacterium mitsuokai
Ruminococcus obeumEubacterium ramulusEubacterium eligens
Ruminococcus flavefaciensBrachyspira unclassified
Dorea formicigeneransSutterella wadsworthensis
Parabacteroides merdaeRuminococcus callidus
Faecalibacterium prausnitziiDorea longicatena
Phascolarctobacterium succinatutensRuminococcus bromii
Alistipes senegalensis
AUC
0.9170.8820.8420.823
0.704
0.7530.7710.7680.729
0.7020.7350.7100.7110.5540.7310.7420.7000.7170.6960.6960.682
NMDS1
NM
DS
2
-1.0 -0.5
0
-0.5
-1.0
0.7190.6420.7080.6890.6880.7040.6810.6510.634
a
MSMno
nMSM
Spearman's rho
Mean Decrease Gini
b c
Ace
But
For
Pro
Lac
Suc
CH
4
Eth
Met
Gra
m
+++++
++++
+
++++---
---
-
-
--
v
v
SCFA
Acid Alcoho
l
Gas
* * * * * * * * *
ResultsII
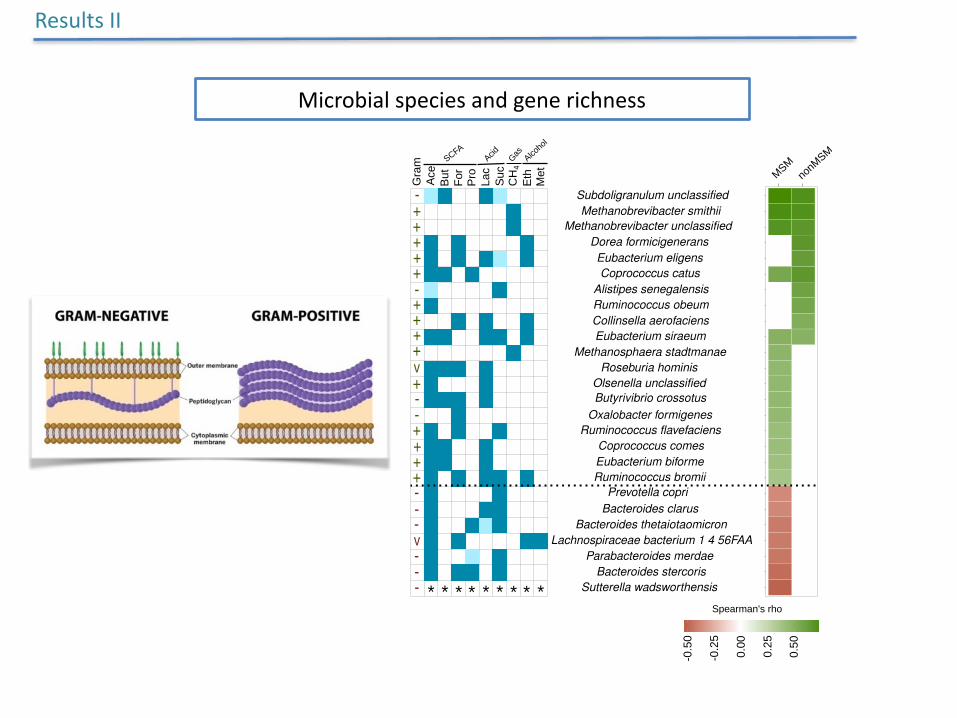
Microbialspeciesandgenerichness
MSM
nonM
SM
−0.4
0.0
0.4
0.8
ko00680 Methane metabolism
ko00072 Synthesis and degradation of ketone bodiesko00970 AminoacyltRNA biosynthesis
ko00620 Pyruvate metabolismko00906 Carotenoid biosynthesis
ko05120 Epithelial cell signaling in Helicobacter pylori infectionko03010 Ribosome
ko00071 Fatty acid degradationko00380 Tryptophan metabolism
ko03022 Basal transcription factors
ko05100 Bacterial invasion of epithelial cellsko00561 Glycerolipid metabolism
ko00260 Glycine, serine and threonine metabolism
ko00643 Styrene degradationko00240 Pyrimidine metabolism
ko00010 Glycolysis / Gluconeogenesis
ko03430 Mismatch repairko03420 Nucleotide excision repair
ko00230 Purine metabolism
ko02010 ABC transportersko00564 Glycerophospholipid metabolism
ko03060 Protein export
ko00622 Xylene degradation
ko03030 DNA replicationko03440 Homologous recombination
ko00450 Selenocompound metabolism
ko03410 Base excision repair
ko04122 Sulfur relay system
ko00624 Polycyclic aromatic hydrocarbon degradationko00650 Butanoate metabolism
ko00400 Phenylalanine, tyrosine and tryptophan biosynthesisko00785 Lipoic acid metabolism
ko00520 Amino sugar and nucleotide sugar metabolismko00281 Geraniol degradation
ko00780 Biotin metabolism
ko00311 Penicillin and cephalosporin biosynthesisko00500 Starch and sucrose metabolism
ko00540 Lipopolysaccharide biosynthesisko00511 Other glycan degradation
ko00051 Fructose and mannose metabolism
ko00052 Galactose metabolism
ko00040 Pentose and glucuronate interconversionsko00600 Sphingolipid metabolism
a
1e+05
2e+05
3e+05
Glucose-6-phosphate dehydrogenase
1e+05
2e+05
3e+05
20000
40000
6-phosphogluconate dehydrogenase Glutathione reductase
Glutathione peroxidase
1e+05
2e+05
3e+05Thioredoxin reductase
9e+05
6e+05
3e+05
Peroxiredoxin AhpC5e+05
4e+05
3e+05
2e+05
1e+05
Peroxiredoxin Q/BCP Atypical 2-Cys peroxiredoxin Catalase
Superoxide dismutase Fe-Mn Bacterioferritin
4e+05
3e+05
2e+05
1e+05
4e+05
3e+05
2e+05
1e+05
200000
150000
100000
50000
0 0 0
0 0
0 0
4e+05
3e+05
2e+05
1e+05
0
3e+05
2e+05
1e+05
0
Nadir CD4+ T cells / mm3
negative
HIV-1 infected
Spearman's rho
Rea
d co
unts
Rea
d co
unts
Rea
d co
unts
Rea
d co
unts
bP = 7.2e-05 P = 5.4e-04 P = 0.054
P = 0.171 P = 0.565 P = 1.4e-04
P = 0.085 P = 1.6e-05 P = 1.5e-04
P = 4.6e-04 P = 0.007
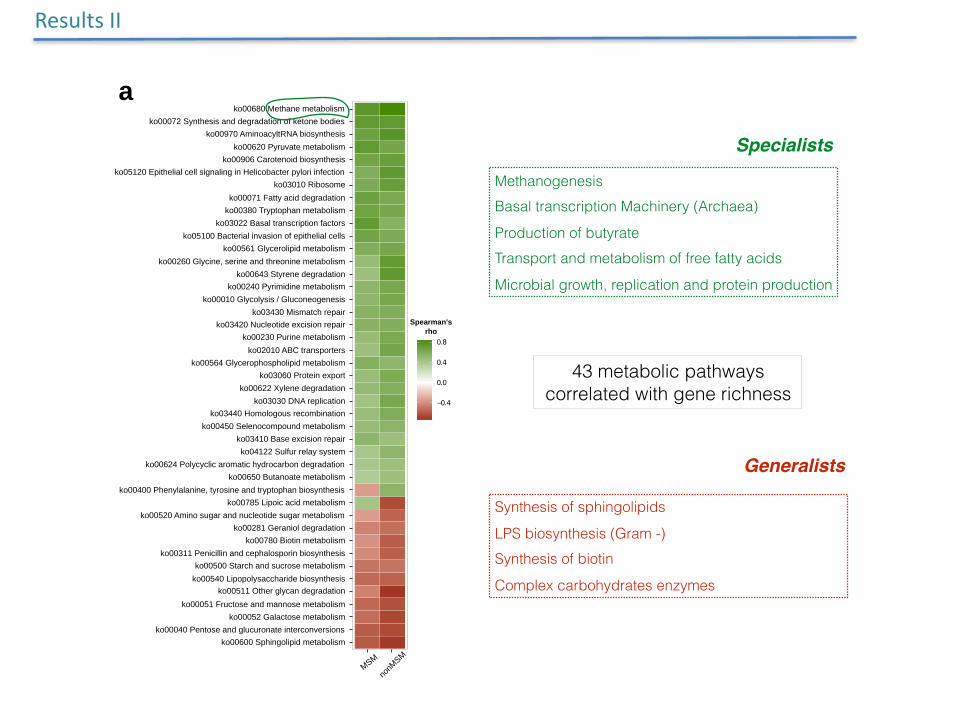
Methanogenesis Basal transcription Machinery (Archaea)
Production of butyrate Transport and metabolism of free fatty acids
Microbial growth, replication and protein production
Synthesis of sphingolipids
LPS biosynthesis (Gram -) Synthesis of biotin
Complex carbohydrates enzymes
Specialists
Generalists
43 metabolic pathways correlated with gene richness
ResultsII
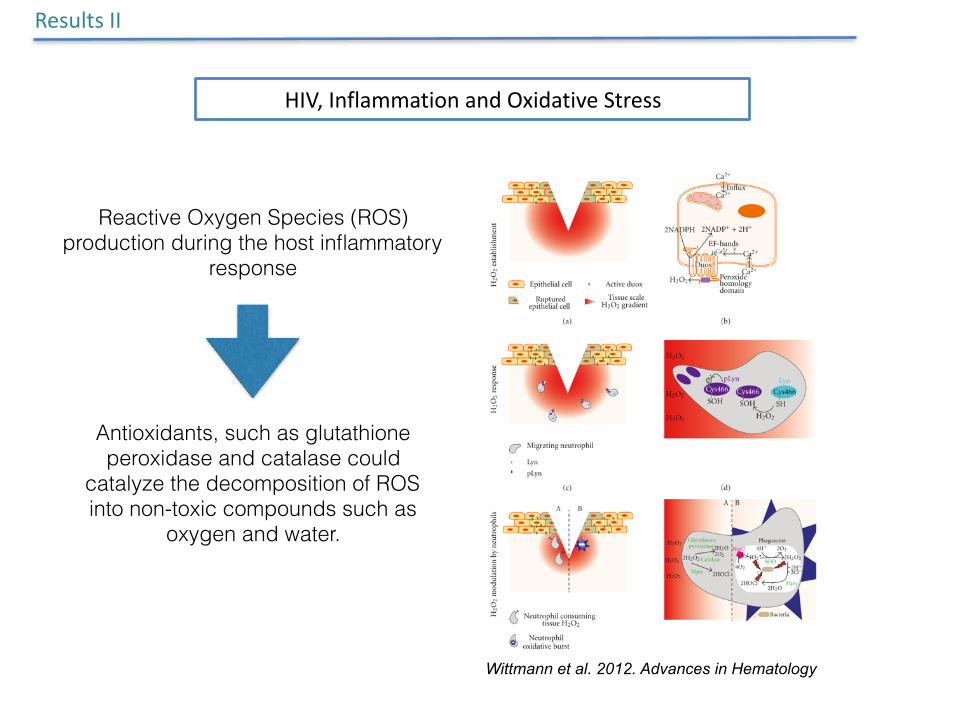
Reactive Oxygen Species (ROS) production during the host inflammatory
response
Antioxidants, such as glutathione peroxidase and catalase could
catalyze the decomposition of ROS into non-toxic compounds such as
oxygen and water.
ResultsII
HIV,InflammationandOxidativeStress
Wittmann et al. 2012. Advances in Hematology
MSM
nonM
SM
−0.4
0.0
0.4
0.8
ko00680 Methane metabolism
ko00072 Synthesis and degradation of ketone bodiesko00970 AminoacyltRNA biosynthesis
ko00620 Pyruvate metabolismko00906 Carotenoid biosynthesis
ko05120 Epithelial cell signaling in Helicobacter pylori infectionko03010 Ribosome
ko00071 Fatty acid degradationko00380 Tryptophan metabolism
ko03022 Basal transcription factors
ko05100 Bacterial invasion of epithelial cellsko00561 Glycerolipid metabolism
ko00260 Glycine, serine and threonine metabolism
ko00643 Styrene degradationko00240 Pyrimidine metabolism
ko00010 Glycolysis / Gluconeogenesis
ko03430 Mismatch repairko03420 Nucleotide excision repair
ko00230 Purine metabolism
ko02010 ABC transportersko00564 Glycerophospholipid metabolism
ko03060 Protein export
ko00622 Xylene degradation
ko03030 DNA replicationko03440 Homologous recombination
ko00450 Selenocompound metabolism
ko03410 Base excision repair
ko04122 Sulfur relay system
ko00624 Polycyclic aromatic hydrocarbon degradationko00650 Butanoate metabolism
ko00400 Phenylalanine, tyrosine and tryptophan biosynthesisko00785 Lipoic acid metabolism
ko00520 Amino sugar and nucleotide sugar metabolismko00281 Geraniol degradation
ko00780 Biotin metabolism
ko00311 Penicillin and cephalosporin biosynthesisko00500 Starch and sucrose metabolism
ko00540 Lipopolysaccharide biosynthesisko00511 Other glycan degradation
ko00051 Fructose and mannose metabolism
ko00052 Galactose metabolism
ko00040 Pentose and glucuronate interconversionsko00600 Sphingolipid metabolism
1e+05
2e+05
3e+05
Glucose-6-phosphate dehydrogenase
1e+05
2e+05
3e+05
20000
40000
6-phosphogluconate dehydrogenase Glutathione reductase Glutathione peroxidase
1e+05
2e+05
3e+05
Thioredoxin reductase
9e+05
6e+05
3e+05
Peroxiredoxin AhpC5e+05
4e+05
3e+05
2e+05
1e+05
Peroxiredoxin Q/BCP Atypical 2-Cys peroxiredoxin
Catalase Superoxide dismutase Fe-Mn Bacterioferritin Methionine sulfoxide reductase A
4e+05
3e+05
2e+05
1e+05
4e+05
3e+05
2e+05
1e+05
200000
150000
100000
50000
200000
150000
100000
50000
0 0 0
0 0
0
4e+05
3e+05
2e+05
1e+05
0
3e+05
2e+05
1e+05
0 0
Spearman's rho
KE
GG
cop
ies
KE
GG
cop
ies
KE
GG
cop
ies
G6PDH
6PGD
GR
GPx
AHPC
BCP
TPX
CAT
SOD2
MSRA
0 3 6Wilcoxon test statistic
Alistipes onderdonkii
Alistipes putredinis
Bacteroidales_noname ph8
Bacteroides caccae
Bacteroides clarus
Bacteroides coprocola
Bacteroides dorei
Bacteroides eggerthii
Bacteroides faecis
Bacteroides finegoldii
Bacteroides fragilis
Bacteroides massiliensis
Bacteroides ovatus
Bacteroides plebeius
Bacteroides salyersiae
Bacteroides stercoris
Bacteroides thetaiotaomicron
Bacteroides uniformis
Bacteroides vulgatus
Barnesiella intestinihominis
Odoribacter splanchnicus
Parabacteroides distasonis
Parabacteroides merdae
Prevotella copri
Prevotella stercorea
Acidaminococcus unclassified
Butyrivibrio crossotus
Catenibacterium mitsuokai
Clostridium L2_50
Dorea longicatena
Erysipelotrichaceae_noname biforme
Eubacterium eligens
Eubacterium rectale
Eubacterium siraeum
Faecalibacterium prausnitzii
Roseburia hominis
Roseburia intestinalis
Roseburia inulinivorans
Ruminococcus bromii
Streptococcus salivarius
Subdoligranulum unclassified
Escherichia coli
Haemophilus parainfluenzae
Sutterella wadsworthensis
C2likevirus C2unclassified
Other taxa(154)
LGC enriched KEGG enzymes
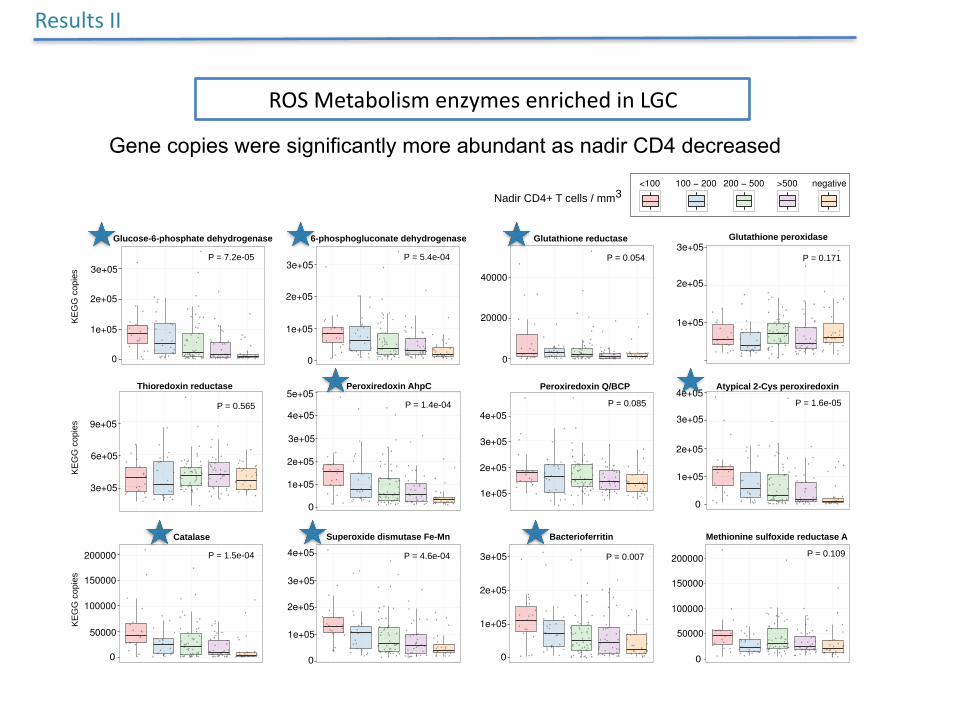
<100 100 � 200 200 � 500 >500
Nadir CD4+ T cells / mm3negative
P = 7.2e-05 P = 5.4e-04 P = 0.054 P = 0.171
P = 0.565 P = 1.4e-04 P = 0.085 P = 1.6e-05
P = 1.5e-04 P = 4.6e-04 P = 0.007 P = 0.109
Gene copies were significantly more abundant as nadir CD4 decreased
ResultsII
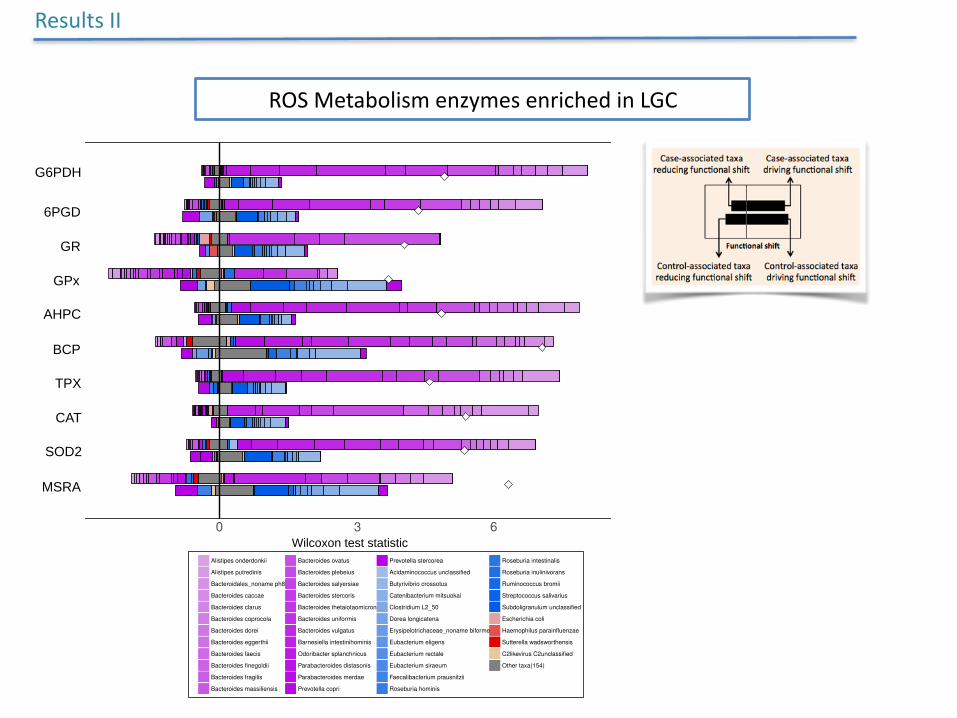
ROSMetabolismenzymesenrichedinLGC
MSM
nonM
SM
−0.4
0.0
0.4
0.8
ko00680 Methane metabolism
ko00072 Synthesis and degradation of ketone bodiesko00970 AminoacyltRNA biosynthesis
ko00620 Pyruvate metabolismko00906 Carotenoid biosynthesis
ko05120 Epithelial cell signaling in Helicobacter pylori infectionko03010 Ribosome
ko00071 Fatty acid degradationko00380 Tryptophan metabolism
ko03022 Basal transcription factors
ko05100 Bacterial invasion of epithelial cellsko00561 Glycerolipid metabolism
ko00260 Glycine, serine and threonine metabolism
ko00643 Styrene degradationko00240 Pyrimidine metabolism
ko00010 Glycolysis / Gluconeogenesis
ko03430 Mismatch repairko03420 Nucleotide excision repair
ko00230 Purine metabolism
ko02010 ABC transportersko00564 Glycerophospholipid metabolism
ko03060 Protein export
ko00622 Xylene degradation
ko03030 DNA replicationko03440 Homologous recombination
ko00450 Selenocompound metabolism
ko03410 Base excision repair
ko04122 Sulfur relay system
ko00624 Polycyclic aromatic hydrocarbon degradationko00650 Butanoate metabolism
ko00400 Phenylalanine, tyrosine and tryptophan biosynthesisko00785 Lipoic acid metabolism
ko00520 Amino sugar and nucleotide sugar metabolismko00281 Geraniol degradation
ko00780 Biotin metabolism
ko00311 Penicillin and cephalosporin biosynthesisko00500 Starch and sucrose metabolism
ko00540 Lipopolysaccharide biosynthesisko00511 Other glycan degradation
ko00051 Fructose and mannose metabolism
ko00052 Galactose metabolism
ko00040 Pentose and glucuronate interconversionsko00600 Sphingolipid metabolism
1e+05
2e+05
3e+05
Glucose-6-phosphate dehydrogenase
1e+05
2e+05
3e+05
20000
40000
6-phosphogluconate dehydrogenase Glutathione reductase Glutathione peroxidase
1e+05
2e+05
3e+05
Thioredoxin reductase
9e+05
6e+05
3e+05
Peroxiredoxin AhpC5e+05
4e+05
3e+05
2e+05
1e+05
Peroxiredoxin Q/BCP Atypical 2-Cys peroxiredoxin
Catalase Superoxide dismutase Fe-Mn Bacterioferritin Methionine sulfoxide reductase A
4e+05
3e+05
2e+05
1e+05
4e+05
3e+05
2e+05
1e+05
200000
150000
100000
50000
200000
150000
100000
50000
0 0 0
0 0
0
4e+05
3e+05
2e+05
1e+05
0
3e+05
2e+05
1e+05
0 0
Spearman's rho
KE
GG
cop
ies
KE
GG
cop
ies
KE
GG
cop
ies
G6PDH
6PGD
GR
GPx
AHPC
BCP
TPX
CAT
SOD2
MSRA
0 3 6Wilcoxon test statistic
Alistipes onderdonkii
Alistipes putredinis
Bacteroidales_noname ph8
Bacteroides caccae
Bacteroides clarus
Bacteroides coprocola
Bacteroides dorei
Bacteroides eggerthii
Bacteroides faecis
Bacteroides finegoldii
Bacteroides fragilis
Bacteroides massiliensis
Bacteroides ovatus
Bacteroides plebeius
Bacteroides salyersiae
Bacteroides stercoris
Bacteroides thetaiotaomicron
Bacteroides uniformis
Bacteroides vulgatus
Barnesiella intestinihominis
Odoribacter splanchnicus
Parabacteroides distasonis
Parabacteroides merdae
Prevotella copri
Prevotella stercorea
Acidaminococcus unclassified
Butyrivibrio crossotus
Catenibacterium mitsuokai
Clostridium L2_50
Dorea longicatena
Erysipelotrichaceae_noname biforme
Eubacterium eligens
Eubacterium rectale
Eubacterium siraeum
Faecalibacterium prausnitzii
Roseburia hominis
Roseburia intestinalis
Roseburia inulinivorans
Ruminococcus bromii
Streptococcus salivarius
Subdoligranulum unclassified
Escherichia coli
Haemophilus parainfluenzae
Sutterella wadsworthensis
C2likevirus C2unclassified
Other taxa(154)
LGC enriched KEGG enzymes
<100 100 � 200 200 � 500 >500
Nadir CD4+ T cells / mm3negative
P = 7.2e-05 P = 5.4e-04 P = 0.054 P = 0.171
P = 0.565 P = 1.4e-04 P = 0.085 P = 1.6e-05
P = 1.5e-04 P = 4.6e-04 P = 0.007 P = 0.109
MSM
nonM
SM
−0.4
0.0
0.4
0.8
ko00680 Methane metabolism
ko00072 Synthesis and degradation of ketone bodiesko00970 AminoacyltRNA biosynthesis
ko00620 Pyruvate metabolismko00906 Carotenoid biosynthesis
ko05120 Epithelial cell signaling in Helicobacter pylori infectionko03010 Ribosome
ko00071 Fatty acid degradationko00380 Tryptophan metabolism
ko03022 Basal transcription factors
ko05100 Bacterial invasion of epithelial cellsko00561 Glycerolipid metabolism
ko00260 Glycine, serine and threonine metabolism
ko00643 Styrene degradationko00240 Pyrimidine metabolism
ko00010 Glycolysis / Gluconeogenesis
ko03430 Mismatch repairko03420 Nucleotide excision repair
ko00230 Purine metabolism
ko02010 ABC transportersko00564 Glycerophospholipid metabolism
ko03060 Protein export
ko00622 Xylene degradation
ko03030 DNA replicationko03440 Homologous recombination
ko00450 Selenocompound metabolism
ko03410 Base excision repair
ko04122 Sulfur relay system
ko00624 Polycyclic aromatic hydrocarbon degradationko00650 Butanoate metabolism
ko00400 Phenylalanine, tyrosine and tryptophan biosynthesisko00785 Lipoic acid metabolism
ko00520 Amino sugar and nucleotide sugar metabolismko00281 Geraniol degradation
ko00780 Biotin metabolism
ko00311 Penicillin and cephalosporin biosynthesisko00500 Starch and sucrose metabolism
ko00540 Lipopolysaccharide biosynthesisko00511 Other glycan degradation
ko00051 Fructose and mannose metabolism
ko00052 Galactose metabolism
ko00040 Pentose and glucuronate interconversionsko00600 Sphingolipid metabolism
1e+05
2e+05
3e+05
Glucose-6-phosphate dehydrogenase
1e+05
2e+05
3e+05
20000
40000
6-phosphogluconate dehydrogenase Glutathione reductase Glutathione peroxidase
1e+05
2e+05
3e+05
Thioredoxin reductase
9e+05
6e+05
3e+05
Peroxiredoxin AhpC5e+05
4e+05
3e+05
2e+05
1e+05
Peroxiredoxin Q/BCP Atypical 2-Cys peroxiredoxin
Catalase Superoxide dismutase Fe-Mn Bacterioferritin Methionine sulfoxide reductase A
4e+05
3e+05
2e+05
1e+05
4e+05
3e+05
2e+05
1e+05
200000
150000
100000
50000
200000
150000
100000
50000
0 0 0
0 0
0
4e+05
3e+05
2e+05
1e+05
0
3e+05
2e+05
1e+05
0 0
Spearman's rho
KE
GG
cop
ies
KE
GG
cop
ies
KE
GG
cop
ies
G6PDH
6PGD
GR
GPx
AHPC
BCP
TPX
CAT
SOD2
MSRA
0 3 6K07304
K04564
K03781
K11065
K03564
K03386
K00432
K00383
K00033
K00036
0 6
Func
tion
Wilcoxon test statistic
Alistipes onderdonkii
Alistipes putredinis
Bacteroidales_noname ph8
Bacteroides caccae
Bacteroides clarus
Bacteroides coprocola
Bacteroides dorei
Bacteroides eggerthii
Bacteroides faecis
Bacteroides finegoldii
Bacteroides fragilis
Bacteroides massiliensis
Bacteroides ovatus
Bacteroides plebeius
Bacteroides salyersiae
Bacteroides stercoris
Bacteroides thetaiotaomicron
Bacteroides uniformis
Bacteroides vulgatus
Barnesiella intestinihominis
Odoribacter splanchnicus
Parabacteroides distasonis
Parabacteroides merdae
Prevotella copri
Prevotella stercorea
Acidaminococcus unclassified
Butyrivibrio crossotus
Catenibacterium mitsuokai
Clostridium L2_50
Dorea longicatena
Erysipelotrichaceae_noname biforme
Eubacterium eligens
Eubacterium rectale
Eubacterium siraeum
Faecalibacterium prausnitzii
Roseburia hominis
Roseburia intestinalis
Roseburia inulinivorans
Ruminococcus bromii
Streptococcus salivarius
Subdoligranulum unclassified
Escherichia coli
Haemophilus parainfluenzae
Sutterella wadsworthensis
C2likevirus C2unclassified
Other taxa(154)
LGC enriched KEGG enzymes
<100 100 � 200 200 � 500 >500
Nadir CD4+ T cells / mm3negative
P = 7.2e-05 P = 5.4e-04 P = 0.054 P = 0.171
P = 0.565 P = 1.4e-04 P = 0.085 P = 1.6e-05
P = 1.5e-04 P = 4.6e-04 P = 0.007 P = 0.109
ROSMetabolismenzymesenrichedinLGC
ResultsII
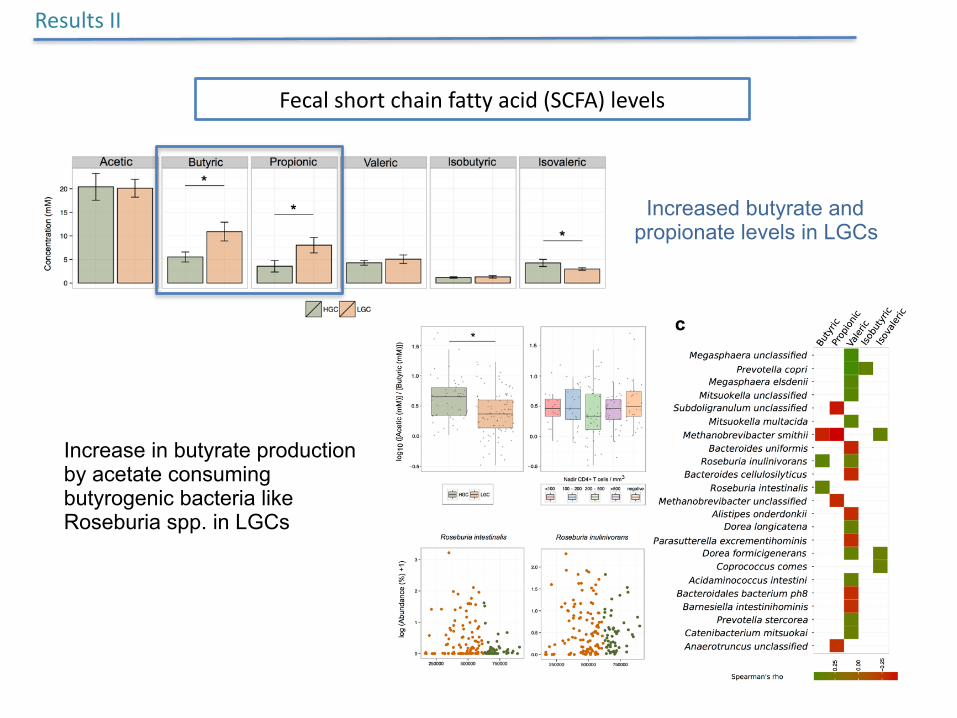
Increased butyrate and propionate levels in LGCs
ResultsII
Fecalshortchainfattyacid(SCFA)levels
Increase in butyrate production by acetate consuming butyrogenic bacteria like Roseburia spp. in LGCs
ResultsII
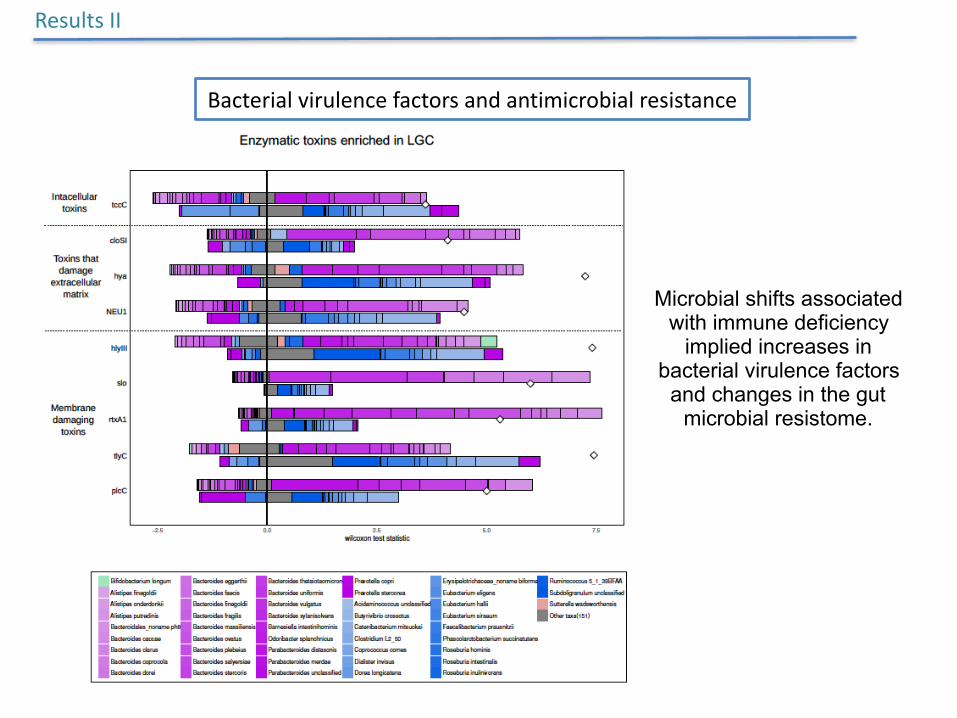
Bacterialvirulencefactorsandantimicrobialresistance
Microbial shifts associated with immune deficiency
implied increases in bacterial virulence factors
and changes in the gut microbial resistome.
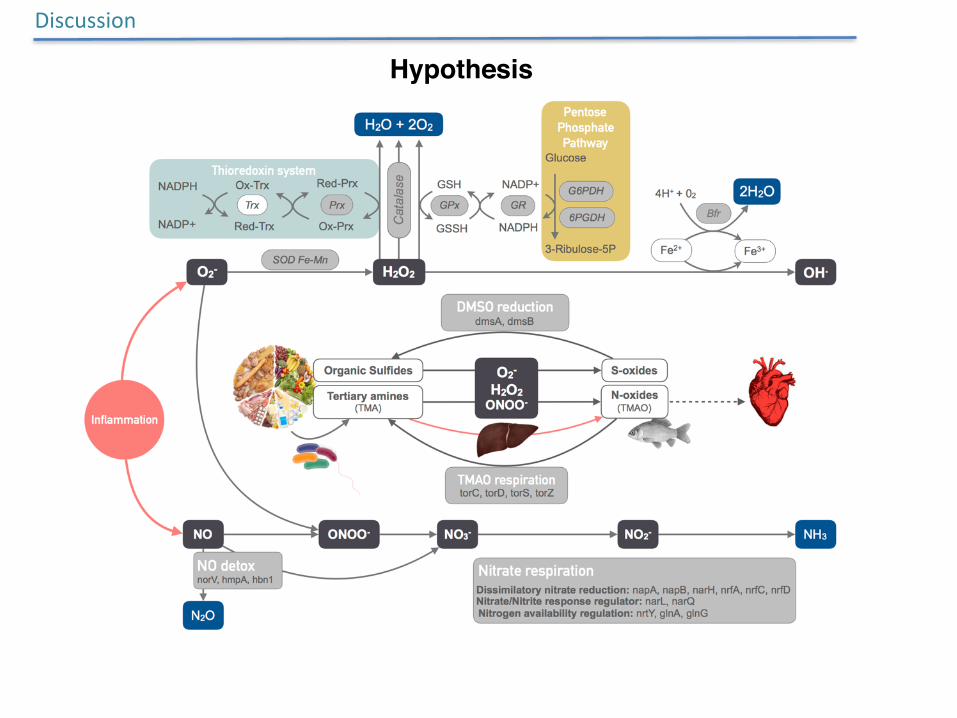
Discussion
Hypothesis
• HIV-1-induced immune deficiency is strongly linked to reduced microbial richness and results in significant shifts in the composition and function of the gut microbiome.
• Gut microbiome shifts observed in HIV-1 are not necessarily unique to the infection, but instead, share important characteristics with those seen in other diseases featuring gut inflammation
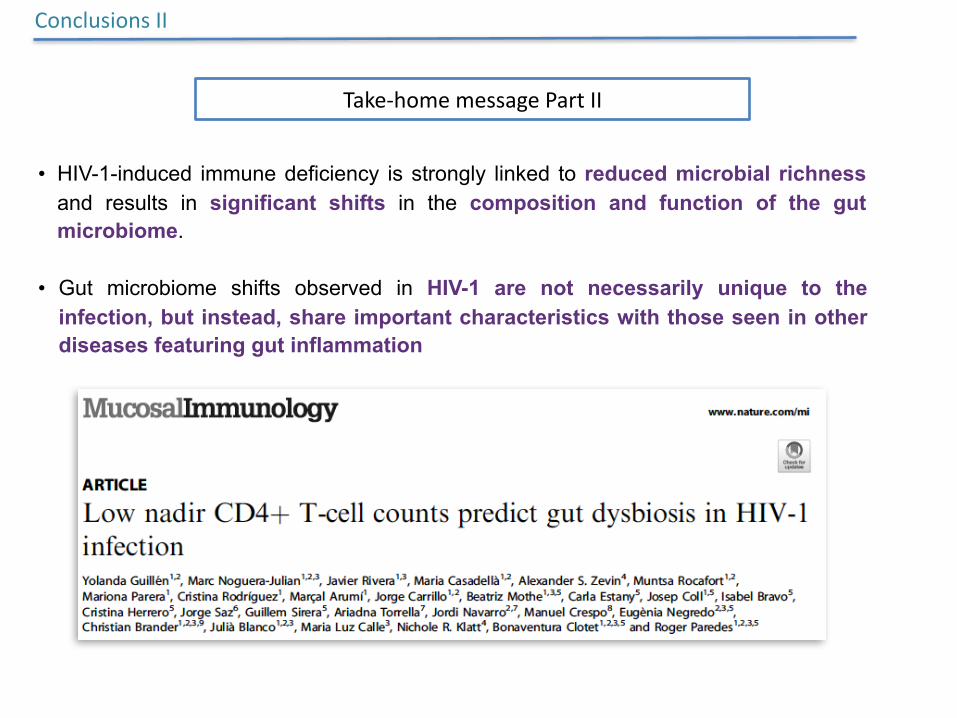
ConclusionsII
Take-homemessagePartII
HIV-1eradication
Influence of the gut microbiota on HIV-1 eradication
HIV-1eradication
Williams et al. Curr Op HIV 2017
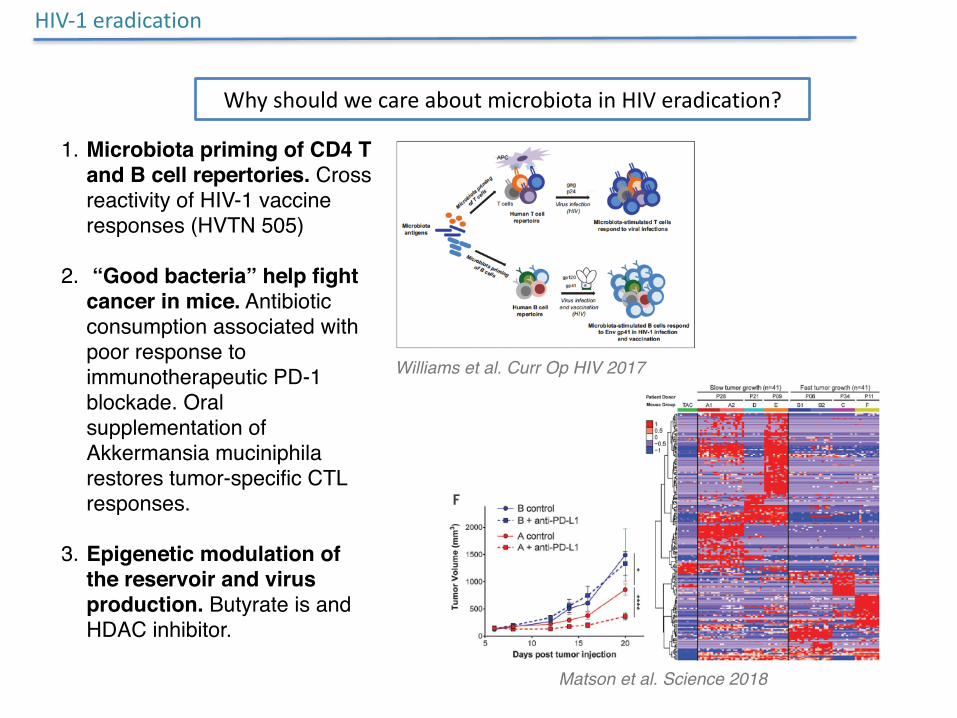
WhyshouldwecareaboutmicrobiotainHIVeradication?
1. Microbiota priming of CD4 T and B cell repertories. Cross reactivity of HIV-1 vaccine responses (HVTN 505)
2. “Good bacteria” help fight cancer in mice. Antibiotic consumption associated with poor response to immunotherapeutic PD-1 blockade. Oral supplementation of Akkermansia muciniphila restores tumor-specific CTL responses.
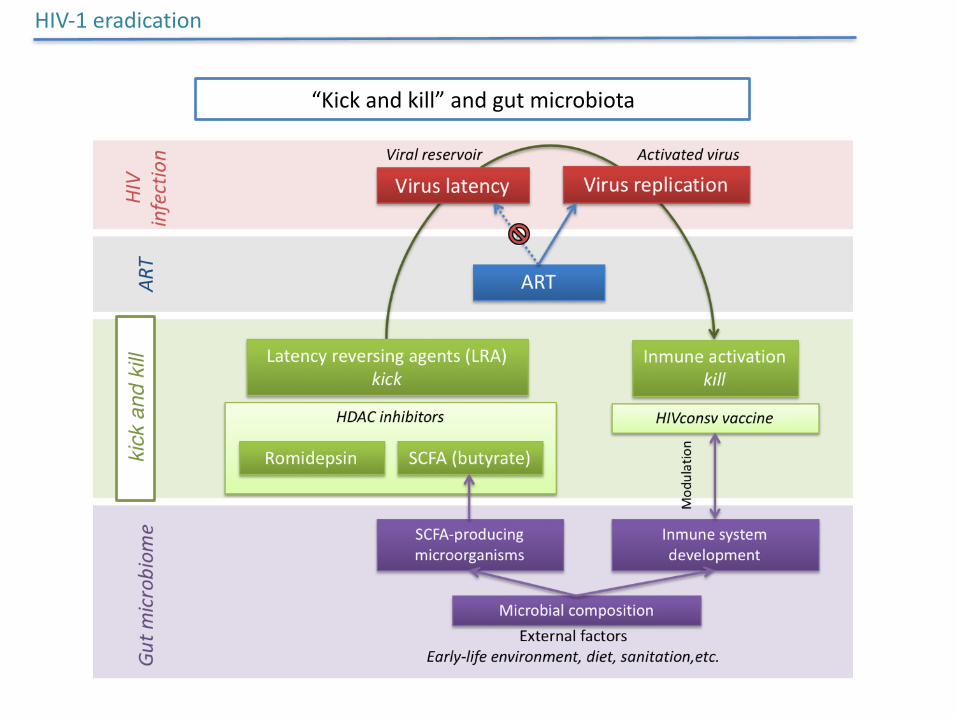
3. Epigenetic modulation of the reservoir and virus production. Butyrate is and HDAC inhibitor.
Matson et al. Science 2018
HIV-1eradication
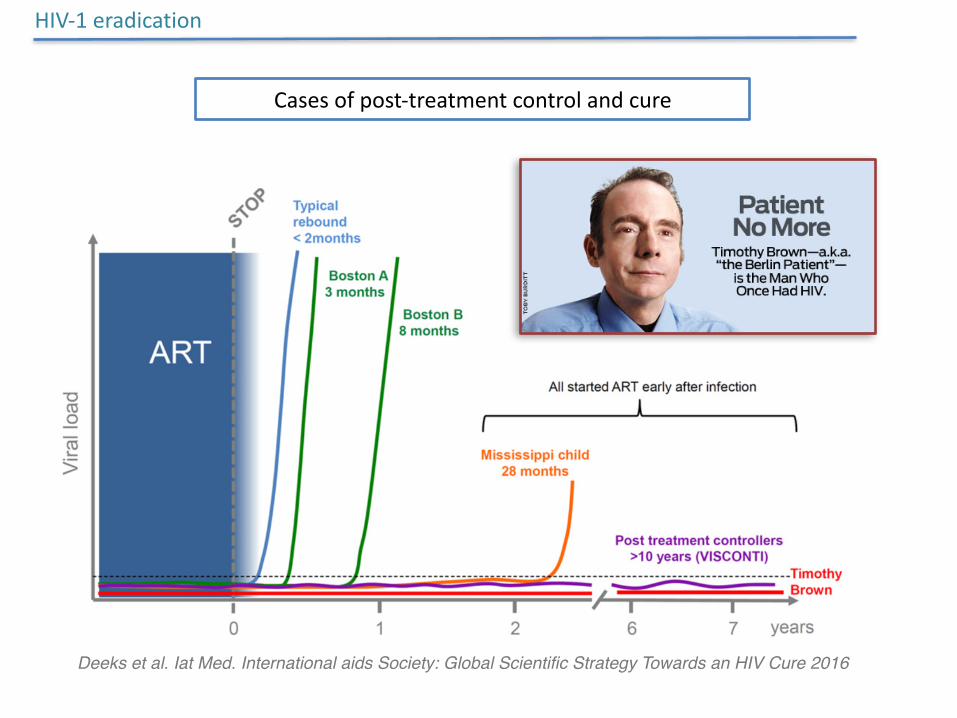
Casesofpost-treatmentcontrolandcure
Deeks et al. Iat Med. International aids Society: Global Scientific Strategy Towards an HIV Cure 2016
HIV-1eradication
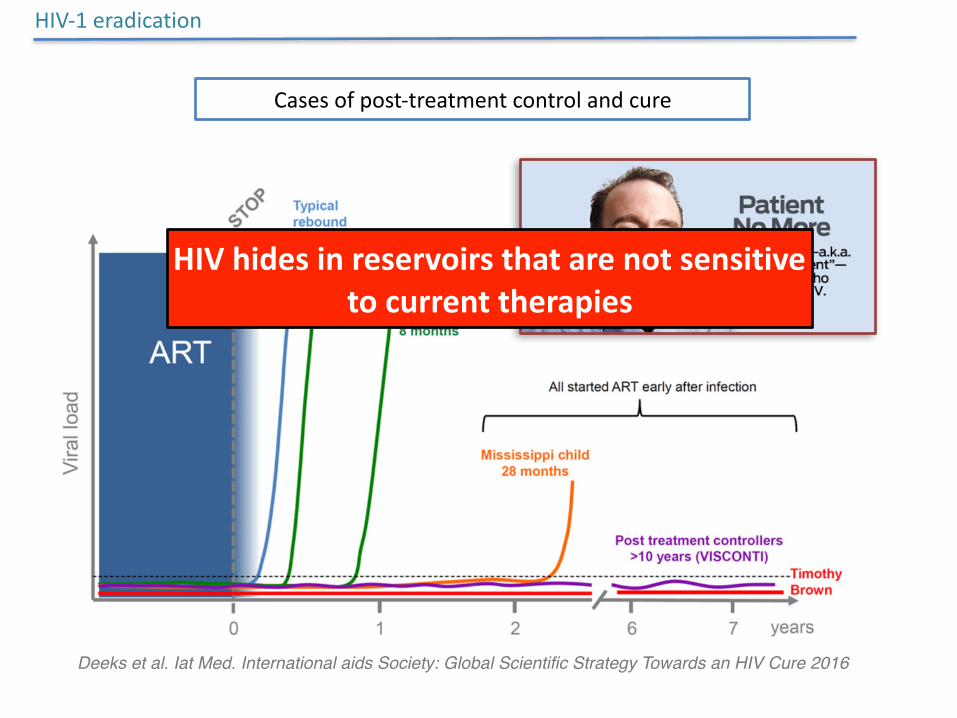
Casesofpost-treatmentcontrolandcure
Deeks et al. Iat Med. International aids Society: Global Scientific Strategy Towards an HIV Cure 2016
HIVhidesinreservoirsthatarenotsensitivetocurrenttherapies
HIV-1eradication
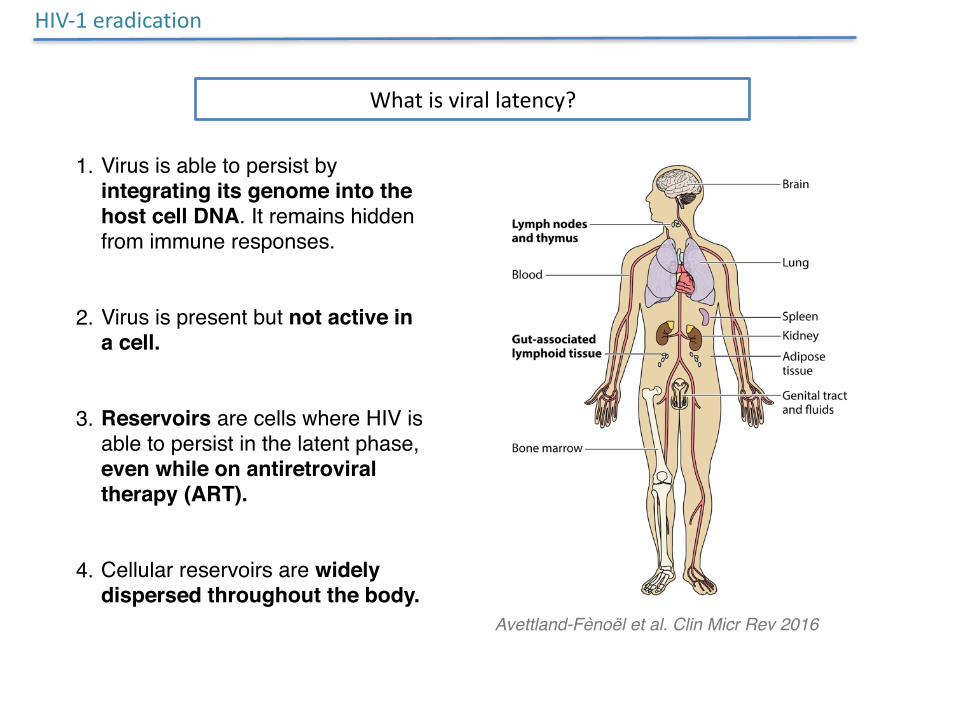
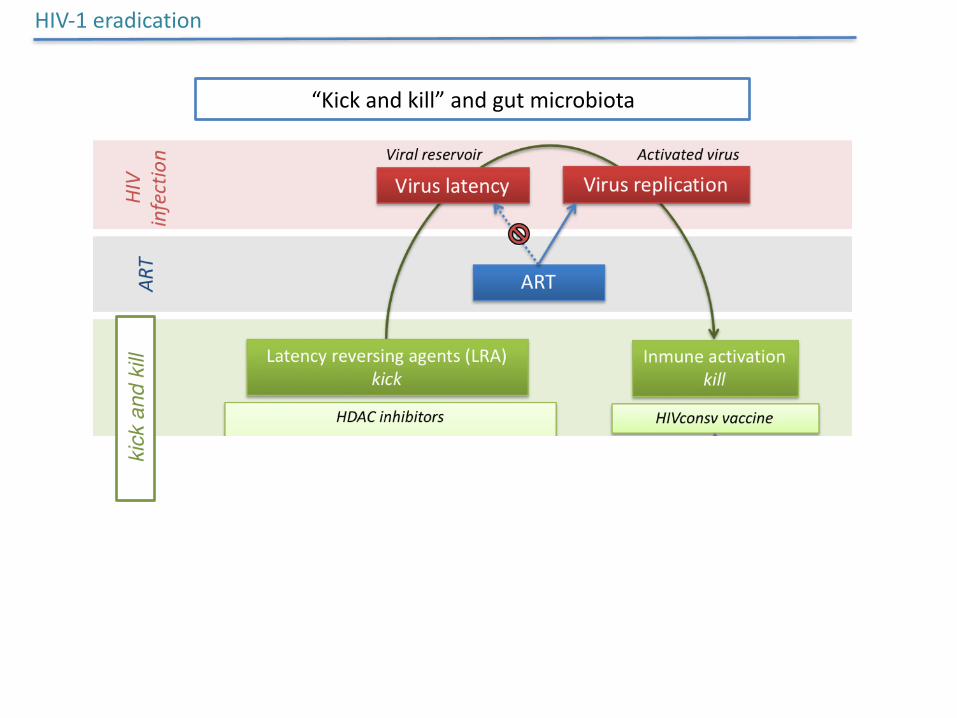
Whatisvirallatency?
1. Virus is able to persist by integrating its genome into the host cell DNA. It remains hidden from immune responses.
2. Virus is present but not active in a cell.
3. Reservoirs are cells where HIV is able to persist in the latent phase, even while on antiretroviral therapy (ART).
4. Cellular reservoirs are widely dispersed throughout the body.
Avettland-Fènoël et al. Clin Micr Rev 2016
HIV-1eradication
“Kickandkill”andgutmicrobiotaki
ck a
nd k
ill
HIV-1eradication
“Kickandkill”andgutmicrobiotaki
ck a
nd k
ill
HIV-1eradication
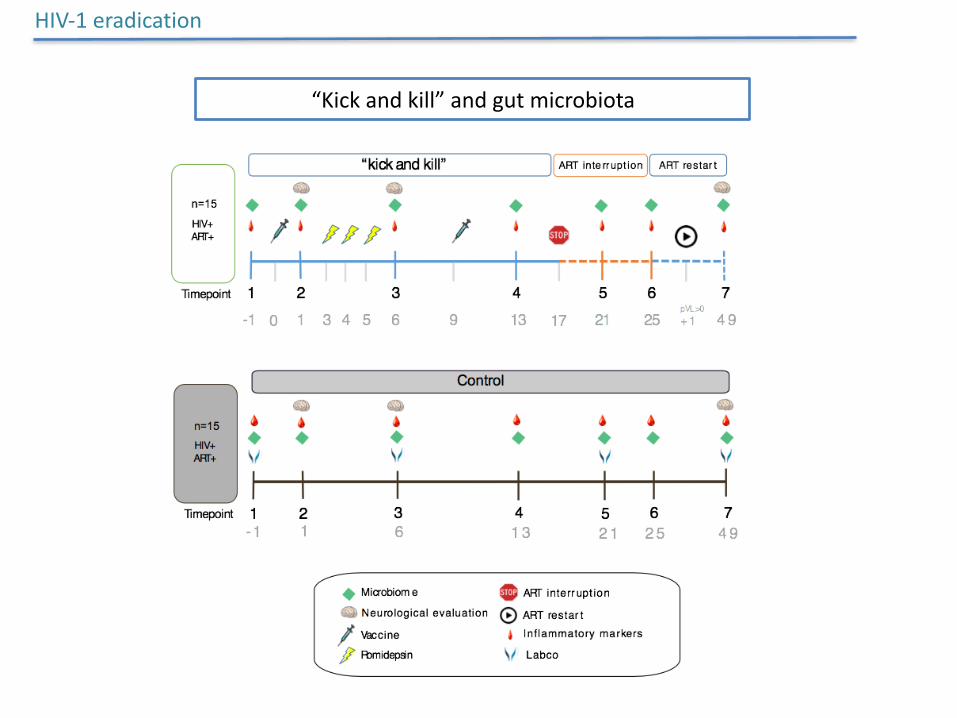
“Kickandkill”andgutmicrobiota
HIV-1eradication
“Kickandkill”andgutmicrobiota
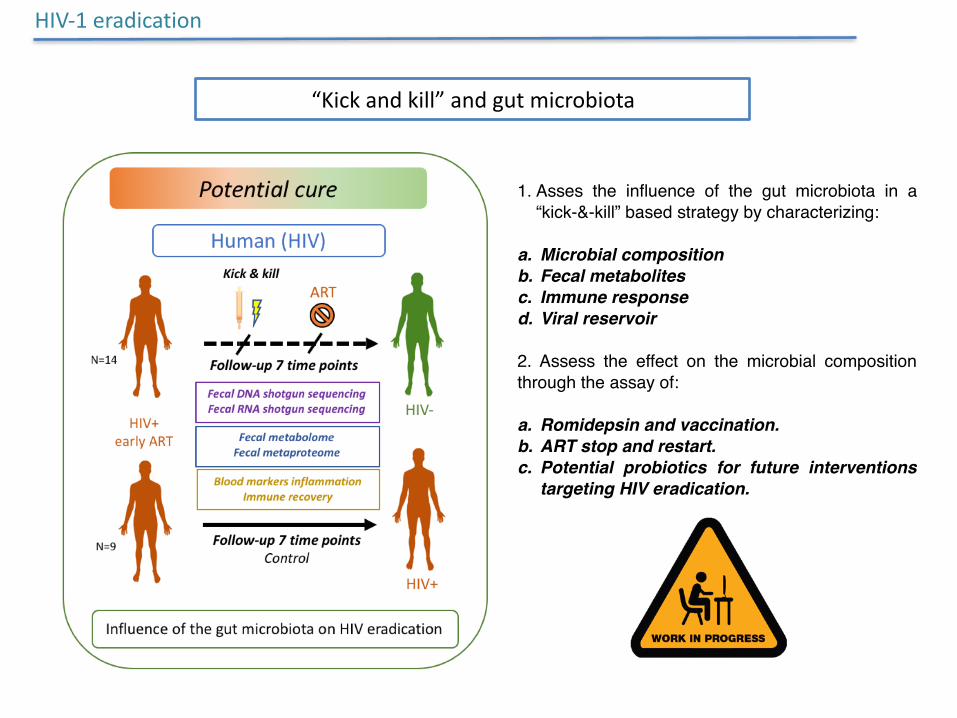
1. Asses the influence of the gut microbiota in a “kick-&-kill” based strategy by characterizing:
a. Microbial compositionb. Fecal metabolitesc. Immune responsed. Viral reservoir
2. Assess the effect on the microbial composition through the assay of:
a. Romidepsin and vaccination.b. ART stop and restart.c. Potential probiotics for future interventions
targeting HIV eradication.
HIV-1eradication
Related Documents