CHRISTIAN CONRAD MICHAEL J. LAMLA The High-Frequency Response of the EUR-USD Exchange Rate to ECB Communication We investigate the impact of the European Central Bank’s monetary policy communication during the press conference held after the monthly Gov- erning Council meeting on the EUR-USD exchange rate in high frequency. Based on the method of Content Analysis, we construct communication indicators for the introductory statement and find that communication with respect to future price developments is most relevant. In response to state- ments about increasing risks to price stability the EUR appreciates on im- pact. To the contrary, communication about economic activity and monetary aggregates does not generate significant exchange rate reactions. JEL codes: C22, E52, E58, F31 Keywords: central bank communication, exchange rate, expectations, long memory GARCH processes, monetary policy announcements, Taylor rules. IN THIS PAPER, we investigate the high-frequency impact of the European Central Bank’s (ECB) monetary policy communication on the EUR-USD exchange rate for the 89 meeting days of the ECB’s Governing Council within the pe- riod January 1999–October 2006. A meeting day consists of the announcement of the next key interest rate via a press release at 13.45 Central European Time (CET) and the press conference which starts at 14.30 CET with the introductory statement and ends with a question and answer session (Q&A). 1 All three events are of major impor- tance. First, the reaction of the market participants to the interest rate announcement 1. Throughout the paper all dates are reported as CET. For insightful suggestions and constructive comments we thank Kenneth D. West, the editor, and two anonymous referees. We also thank Helge Berger, Thomas Eife, Switgard Feuerstein, Enno Mammen, Thomas Maag, Pierre-Guillaume M´ eon, Heiner Mikosch, Sarah M. Lein, Jan-Egbert Sturm, and the participants of the 22nd Annual Meeting of the European Economic Association (Budapest, Hungary, 2007) for their helpful comments and suggestions. The usual disclaimer applies. CHRISTIAN CONRAD is an Assistant Professor for Empirical Economics, Faculty of Economics and Social Studies, University of Heidelberg (E-mail: christian.conrad@ awi.uni-heidelberg.de). MICHAEL J. LAMLA is a Researcher at the KOF Swiss Economic Insti- tute, ETH Zurich (E-mail: [email protected]). Received November 21, 2007; and accepted in revised form April 23, 2010. Journal of Money, Credit and Banking, Vol. 42, No. 7 (October 2010) C 2010 The Ohio State University

Welcome message from author
This document is posted to help you gain knowledge. Please leave a comment to let me know what you think about it! Share it to your friends and learn new things together.
Transcript

CHRISTIAN CONRAD
MICHAEL J. LAMLA
The High-Frequency Response of the EUR-USD
Exchange Rate to ECB Communication
We investigate the impact of the European Central Bank’s monetary policycommunication during the press conference held after the monthly Gov-erning Council meeting on the EUR-USD exchange rate in high frequency.Based on the method of Content Analysis, we construct communicationindicators for the introductory statement and find that communication withrespect to future price developments is most relevant. In response to state-ments about increasing risks to price stability the EUR appreciates on im-pact. To the contrary, communication about economic activity and monetaryaggregates does not generate significant exchange rate reactions.
JEL codes: C22, E52, E58, F31Keywords: central bank communication, exchange rate, expectations, longmemory GARCH processes, monetary policy announcements, Taylor rules.
IN THIS PAPER, we investigate the high-frequency impact of theEuropean Central Bank’s (ECB) monetary policy communication on the EUR-USDexchange rate for the 89 meeting days of the ECB’s Governing Council within the pe-riod January 1999–October 2006. A meeting day consists of the announcement of thenext key interest rate via a press release at 13.45 Central European Time (CET) andthe press conference which starts at 14.30 CET with the introductory statement andends with a question and answer session (Q&A).1All three events are of major impor-tance. First, the reaction of the market participants to the interest rate announcement
1. Throughout the paper all dates are reported as CET.
For insightful suggestions and constructive comments we thank Kenneth D. West, the editor, and twoanonymous referees. We also thank Helge Berger, Thomas Eife, Switgard Feuerstein, Enno Mammen,Thomas Maag, Pierre-Guillaume Meon, Heiner Mikosch, Sarah M. Lein, Jan-Egbert Sturm, and theparticipants of the 22nd Annual Meeting of the European Economic Association (Budapest, Hungary,2007) for their helpful comments and suggestions. The usual disclaimer applies.
CHRISTIAN CONRAD is an Assistant Professor for Empirical Economics, Faculty ofEconomics and Social Studies, University of Heidelberg (E-mail: [email protected]). MICHAEL J. LAMLA is a Researcher at the KOF Swiss Economic Insti-tute, ETH Zurich (E-mail: [email protected]).
Received November 21, 2007; and accepted in revised form April 23, 2010.
Journal of Money, Credit and Banking, Vol. 42, No. 7 (October 2010)C© 2010 The Ohio State University

1392 : MONEY, CREDIT AND BANKING
depends on how well the public has anticipated the policymakers’ decision. Second,the market participants’ assessment of the policymakers’ communication in the in-troductory statement is a relevant ingredient to expectation formation regarding thefuture path of monetary policy. The subsequent movement of the exchange rate canbe considered to reflect the market participants’ view of the ECB’s policy function.Finally, the Q&A session is an important outlet for complementing and clarifyingthe interest rate decision and the content of the introductory statement. An econo-metric approach that allows to trace the effects of all three communication eventsrequires two ingredients: an appropriate modeling of the intraday high-frequencymovements of the EUR-USD exchange rate and a meaningful quantification of theECB’s communication.
In our econometric methodology we follow Andersen and Bollerslev (1997, 1998)who show that high-frequency exchange rate returns are characterized by a strongintraday periodicity in their conditional variance that can be naturally separatedinto three components: (i) a deterministic periodic component (including day-of-the-week and calender effects), (ii) announcement effects, and (iii) ARCH effects.From their studies it is evident that the “estimation and extraction of the intradayperiodic component is both feasible and indispensable for a meaningful intradaydynamic analysis” (Andersen and Bollerslev 1997, p. 116). Hence, in a first step, wefilter the high-frequency returns using a control sample from which both the intradayseasonal pattern and U.S. announcement effects are extracted. For this purpose, wedevelop a new procedure based on nonparametric kernel smoothing techniques. Forthe simultaneous analysis of the effects of the press release and the press conferencethis smoothing step is essential. While at 13.45 market volatility is usually low, it ismuch higher at 14.30 because of the release of U.S. macroeconomic announcementsat that time. Our approach guarantees that this regular increase in volatility is notattributed to the ECB press conference.
Since the filtered absolute returns reveal a clear pattern of long memory andpersistence, we follow Han (2008) and estimate an AR-FIGARCH specificationfor the filtered 5-minute returns to which we add controls for surprise interest rateannouncements, the content of the introductory statement as well as the Q&A sessionin both the mean and the variance. By doing so, we can directly monitor the impact ofall three communication events on the market in real time and bypass problems withregards to causality and identification. To assess the impact of the press conference,we rely on a set of newly constructed communication indicators. We have set up thesecommunication indicators based on a coding of the introductory statement providedby the media research institute Mediatenor. The coding is conducted using the methodof Content Analysis.2 Besides capturing the content of the introductory statement, thismethod fulfils the criteria of being objective and reproducible. Our indicators captureinformation on expected developments in the four major policy-relevant areas, that
2. For more details on Mediatenor and the method of Content Analysis, see Section 2.4.

CHRISTIAN CONRAD AND MICHAEL J. LAMLA : 1393
is, the real economy, prices, monetary aggregates, as well as the EUR-USD exchangerate.
Our main findings can be summarized as follows. A surprise monetary policytightening/easing leads to a significant appreciation/depreciation of the EUR withinthe first 30 minutes following the press release. This result is in line with the recentfindings in Kearns and Manners (2006) and Faust et al. (2007) for other central banksthat point toward a positive relationship between unexpected interest rate changesand exchange rate movements.
The introductory statement mainly provides forward-looking information andthereby guides market participants’ expectations concerning the ECB’s future in-terest rate setting. Concerning the content of communication, our main finding isthat the exchange rate reacts most strongly to communication about future pricedevelopments. In response to statements about rising/falling inflation rates the EURappreciates/depreciates on impact. This result is very much in line with the predic-tions made by a recent strand of literature that links monetary policy interest raterules to exchange rate behavior. Engel and West (2006) and subsequently Clarida andWaldman (2008) argue that a country’s currency should appreciate in response to aninflation surprise if the central bank follows a Taylor rule and markets believe that itwill react to the news of higher inflation by raising interest rates aggressively, that is,if markets believe that the Taylor-rule coefficient on the inflation gap is sufficientlylarge.
The Engel and West (2006) argument implies that from the reaction of the exchangerate we can learn about the central bank’s policy function and thereby about how acentral bank conducts monetary policy. We interpret our findings as evidence forthe strong emphasis that the ECB puts on its main objective, namely, maintainingprice stability. Communication on rising/falling inflation rates is perceived as a clearindication for increasing/decreasing future interest rates and, therefore, leads to anappreciation/depreciation of the EUR. In sharp contrast, communication about the realeconomy or monetary aggregates does not generate significant market reactions. Thefirst observation is a reflection of the market participants’ belief that the ECB attacheslow weight on output growth, the second observation questions the importance ofthe “monetary pillar” in the ECB’s strategy. Besides statements about future pricedevelopments, only communication about the expected development of the exchangerate appears to be relevant. The ECB has the potential to speak up the EUR. Finally,by splitting our sample, we provide tentative evidence for the hypothesis that theintroductory statement has recently gained importance.
While our study is the first to investigate the effects of the introductory state-ment on the EUR-USD exchange rate, there are several recent studies on the ef-fects of ECB communication on the short- and medium-term horizons of the yieldcurve (for a summary of the literature on central bank communication, see Blinderet al. 2008). Ehrmann and Fratzscher (2007, 2009) and Lamla and Lein (Forth-coming) provide uniform evidence that—among the different issues addressed inECB communication—statements on future price developments are most importantand that market interest rates increase in response to statements, which indicate a
1394 : MONEY, CREDIT AND BANKING
Introductory Statement
ca.14.4514.30
Press Release Interest Rate
Decision
13.45 ca.15.15
Question and Answer Session
Press Conference
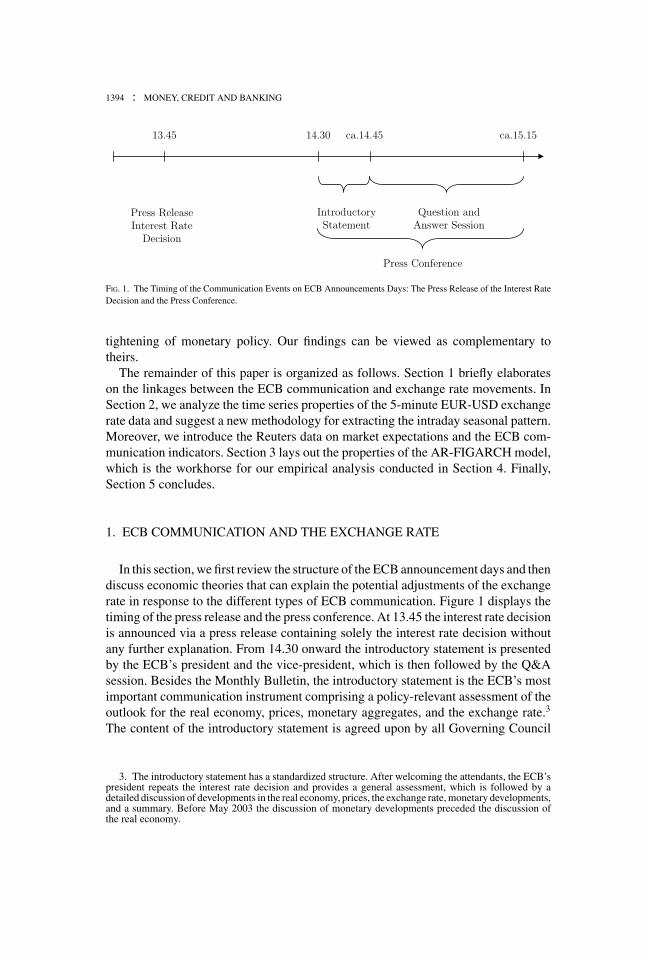
FIG. 1. The Timing of the Communication Events on ECB Announcements Days: The Press Release of the Interest RateDecision and the Press Conference.
tightening of monetary policy. Our findings can be viewed as complementary totheirs.
The remainder of this paper is organized as follows. Section 1 briefly elaborateson the linkages between the ECB communication and exchange rate movements. InSection 2, we analyze the time series properties of the 5-minute EUR-USD exchangerate data and suggest a new methodology for extracting the intraday seasonal pattern.Moreover, we introduce the Reuters data on market expectations and the ECB com-munication indicators. Section 3 lays out the properties of the AR-FIGARCH model,which is the workhorse for our empirical analysis conducted in Section 4. Finally,Section 5 concludes.
1. ECB COMMUNICATION AND THE EXCHANGE RATE
In this section, we first review the structure of the ECB announcement days and thendiscuss economic theories that can explain the potential adjustments of the exchangerate in response to the different types of ECB communication. Figure 1 displays thetiming of the press release and the press conference. At 13.45 the interest rate decisionis announced via a press release containing solely the interest rate decision withoutany further explanation. From 14.30 onward the introductory statement is presentedby the ECB’s president and the vice-president, which is then followed by the Q&Asession. Besides the Monthly Bulletin, the introductory statement is the ECB’s mostimportant communication instrument comprising a policy-relevant assessment of theoutlook for the real economy, prices, monetary aggregates, and the exchange rate.3
The content of the introductory statement is agreed upon by all Governing Council
3. The introductory statement has a standardized structure. After welcoming the attendants, the ECB’spresident repeats the interest rate decision and provides a general assessment, which is followed by adetailed discussion of developments in the real economy, prices, the exchange rate, monetary developments,and a summary. Before May 2003 the discussion of monetary developments preceded the discussion ofthe real economy.

CHRISTIAN CONRAD AND MICHAEL J. LAMLA : 1395
members. The end of the introductory statement is not a priori fixed in time as itdepends on the judgement of the Governing Council to what extent the relevanttopics are addressed. On average it ends around 14.45. The Q&A session that followsthereafter provides an opportunity for media representatives from around the worldto ask for a further explanation of the monetary policy decision.
The direction in which an interest rate surprise will move the exchange rate is apriori uncertain and depends on the market participants’ beliefs about the model ofexchange rate determination. In the short-run, uncovered interest rate parity (UIP)implies an appreciation/depreciation of the home currency in response to a surprisemonetary tightening/easing. This theoretical prediction is widely confirmed in em-pirical studies for other central banks such as the Federal Reserve or the Bank ofEngland (see, e.g., Zettelmeyer 2004, Kearns and Manners 2006, Faust et al. 2007).Given that evidence, we expect an appreciation/depreciation of the EUR in responseto a positive/negative interest rate surprise of the ECB.4
The linkage between the ECB’s press conference and the exchange rate has not yetbeen examined in the literature. Since the introductory statement contains news aboutthe ECB’s assessment of developments in areas most relevant for the future courseof monetary policy, these news might change market expectations and consequentlyinduce movements in the exchange rate. For example, if the ECB communicatesa positive inflation surprise, purchasing power parity (PPP) would suggest that theEUR should depreciate in the long-run. However, what about the short-run reaction?A recent strand of literature argues that the immediate response of the exchangerate to such statements depends on the central bank’s policy function. Engel andWest (2006) and subsequently Clarida and Waldman (2008) were the first to explorethe implications of monetary policy interest rate rules for the behavior of exchangerates. In their framework, a Taylor-type monetary policy rule in conjunction withUIP implies that bad news on inflation can be good news for the exchange rate.Thus, while PPP predicts that the exchange rate should depreciate in the long-run, theimmediate response is ambiguous. On the one hand a rising price level weakens theexchange rate; on the other hand the expectation of rising interest rates strengthensthe currency. The latter effect can dominate if the central bank is sufficiently credibleand raises interest rates sufficiently aggressively to combat an inflationary shock.Following the arguments in Engel and West (2006) and Clarida and Waldman (2008)and given that price stability is the ECB’s main objective, ECB communication onrising future inflation may be expected to lead to an appreciation of the EUR.
Similarly, the question whether there is a reaction to communication on the realeconomy or monetary developments will depend on the market participants’ beliefsabout the central bank reaction function. The recent papers by Lamla and Lein
4. The medium- to long-term response might be different. Built into standard macroeconomic models,like, for instance, Dornbusch (1976), UIP predicts a gradual depreciation of the home currency afterthe “overshooting” following a surprise monetary tightening. However, empirical evidence suggests thatpositive interest rate differentials are associated with persistent appreciations of the domestic currency,which is interpreted as “delayed overshooting” (see, e.g., Eichenbaum and Evans 1995). Hence, UIP is farfrom being empirically uncontroversial.

1396 : MONEY, CREDIT AND BANKING
(Forthcoming) and Ehrmann and Fratzscher (2007, 2009) suggest that the ECB’scommunication on price developments is perceived as being much more importantthan its communication on growth or monetary developments. Specifically, Lamlaand Lein (Forthcoming) provide evidence that ECB communication on rising/fallingfuture inflation rates leads to increasing/decreasing market interest rates by creatingexpectations of a tightening/easing of monetary policy.
The effectiveness of central banks in influencing exchange rates by means of oralinterventions has been analyzed, for instance, by Jansen and de Haan (2007), Beine,Janssen, and Lecourt (2009), and Fratzscher (2008a, 2008b). In particular, the resultsreported in Fratzscher suggest that oral interventions are an effective tool for movingthe exchange rate in the desired direction, while at the same time they may evenreduce volatility.
The main purpose of the Q&A session is not to add new information but to clarifythe intentions and the assessments of the decision makers. Thus, we expect that itis relevant only in those circumstances in which the clarification role is particularlyimportant, for example, if there is high uncertainty regarding the state and outlook ofthe economy (Ehrmann and Fratzscher 2009).
2. DATA
2.1 Exchange Rate Data
Our original sample consists of irregularly spaced tick-by-tick quotes of the EUR-USD exchange rate for all 417 Thursdays in the period of January 1999 to October2006 obtained from Olsen and Associates.5 We focus on Thursdays only, because theECB’s Governing Council meetings usually take place on Thursdays and it is wellknown that the intraday volatility pattern may vary across the days of the week.6 Onemajor reason for the existence of this pattern is the regular release of macroeconomicannouncements. In case of Thursdays, in particular the weekly U.S. jobless claimsrelease is closely watched by market participants and influences the intraday volatilityshape.
Each quote contains a bid and an ask price along with the time stamp to the nearestsecond. Taking the immediately preceding and following quotation at the end of each5-minute interval, we obtain the log price by linearly interpolating the average ofthe log bid and the log ask at each 5-minute mark.7 Five-minute returns are thenconstructed as the change in these 5-minute log prices. The returns are denoted by
5. We define the exchange rate such that an upward movement implies an appreciation of the EURrelative to the USD.
6. There are only four exceptions from this rule. On those 4 days the decision was made on a Wednesday.7. This approach to calculating equidistant prices is the standard procedure used in the literature on
announcement effects (see, e.g., Andersen et al. 2003). Alternatively, we could define the average of thelast log bid and log ask at the end of each interval to be the equidistant price, which would avoid theinterpolation. However, given the high frequency of the quotes, there is virtually no difference betweenthe two methods.

CHRISTIAN CONRAD AND MICHAEL J. LAMLA : 1397
2 4 6 8 10 12 14 16 18 20 22 24
0.01
0.02
0.03
0.04
0.05
0.06
0.07
0.08
FIG. 2. The Average Absolute Five-Minute EUR-USD Returns for the 89 ECB Announcement Days (Dashed Line) and328 Control Days (Solid Line) for Each 5-Minute Interval During a Trading Day (24 Hours).
NOTE: Average absolute 5-minute returns are defined as 1K
∑Kk=1 |Rk,n |, where Rk,n denotes the 5-minute returns, K the
number of announcement/control days, and n = 1, . . . , 288 the intervals.
Rk,n, k = 1, . . . , K and n = 1, . . . , N , where K is the number of days in our sampleand N = 288 is the number of 5-minute intervals per day. Among all Thursdays thereare 89 ECB monetary policy decision days. The remaining “nonannouncement” dayswill serve as control days. The standard summary statistics (not reported) for the ECBannouncement days and the control days are virtually identical. The sample meanof the 5-minute returns is indistinguishable from zero at any standard significancelevel. While the skewness is not significantly different from zero, there is evidencefor excess kurtosis. Hence, the 5-minute return distribution is symmetric around zerobut non-Gaussian, which is also confirmed by the Jarque-Bera statistic. As oftenreported for high-frequency data, there is some evidence of serial correlation for lowlags in the 5-minute EUR-USD returns, possibly due to microstructure effects. To bemore specific, the first-order autocorrelation coefficient is −0.048 and −0.063 for thecontrol and announcement days, respectively. No significant correlations are foundfor higher lags. In contrast, the squared and absolute returns are highly correlatedeven for long lags. In the following, we will analyze these intertemporal dependenciesin the absolute returns in more detail.
The average absolute returns over the 5-minute intervals for the 328 control days(solid) and the 89 announcement days (dashed) are shown in Figure 2. From thisfigure it is clear that the absolute return series display a pronounced intraday volatilitypattern. This pattern is closely linked to the cycle of market activity in the Asian,

1398 : MONEY, CREDIT AND BANKING
-0.020
-0.010
0.000
0.010
0.020
0.030
0.040
0.050
0.060
0.070
13:00 13:15 13:30 13:45 14:00 14:15 14:30 14:45 15:00 15:15 15:30
FIG. 3. The Difference between the Average Absolute 5-Minute EUR-USD Returns on Announcement and Control Daysin the Time Period 13.00–15.30.
NOTE: Average absolute 5-minute returns are defined as in Figure 2. Note that in the text the high average absolute returnfrom 13.45 to 13.50 is referred to as the jump/spike at 13.45.
European, and U.S. financial centers (for details see, e.g., Andersen and Bollerslev1998). The solid line reveals two jumps in volatility during the trading day: a firstone at 14.30 and a second one at 16.00.8 While the first volatility spike is inducedby major macroeconomic news announcements that take place in the U.S. at 14.30(specifically, the weekly U.S. jobless claims release), the second volatility spike at16.00 is mainly due to options expiry. The dashed line, which is associated with theECB announcement days reveals an intraday volatility pattern that is almost identicalto the one of the control days for most of the trading day. However, exactly at the timeof the ECB press release and during the press conference one can observe distinctdifferences.
Figure 3 allows for a more detailed view on the important time period between13.00 and 15.30. The solid line represents the difference between the average absolute5-minute EUR-USD returns on announcement and control days. Clearly, we observea sharp increase in volatility at 13.45. Since neither in the U.S. nor in Europe anyother macroeconomic news is released at 13.45, the dramatic increase in volatilityat 13.45 must reflect how market participants process the news associated with theECB’s monetary policy decision made public via the press release. Around 14.30
8. Note that the jump at 14.30 is reflected in the return between 14.30 and 14.35 and, therefore, in thehigh average absolute value of Rk,14.30−14.35.

CHRISTIAN CONRAD AND MICHAEL J. LAMLA : 1399
the difference in the two volatilities is almost zero. This is not surprising, since theECB’s president begins the introductory statement by welcoming all the participantsand a reiteration of the policy decision, and hence no news is revealed in the first fewminutes. Therefore, at 14.30 both announcement and control days are dominated bythe macroeconomic announcements released in the U.S. However, while on controldays the volatility immediately falls back at 14.35, there is a second spike at 14.40 onthe announcement days reflecting the new information revealed by the communicationduring the press conference. A third spike is observed around 14.55 and possibly dueto the Q&A session. Thereafter, the difference in the volatilities of announcementand control days is again declining, indicating that after the ECB press conferencethere is no systematic difference in the two types of days.
The systematic movements in the daily volatility pattern of the EUR-USD exchangerate have consequences for the dependencies between lagged absolute returns. Theautocorrelation functions of the absolute return series over one (left panel, solidline) and five (right panel, solid line) consecutive Thursdays are shown in Figure 4.The sample autocorrelations are characterized by a “distorted U-shape” behavior.Although our return data are subject to breaks every 288 observations (recall thatour analysis is based on Thursdays only), the estimated shape of the autocorrelationfunction is basically the same as reported in Andersen and Bollerslev (1997). Thiscan be explained by the fact that the intraday periodic component is essentiallydeterministic (see Section 2.2). Even though the breaks do not affect the generalshape, they might be expected to dampen the autocorrelations.
2.2 Modeling the Periodic Intraday Pattern
In this section, we propose a new method for filtering out the periodic intradayseasonal component from the high-frequency return series. The procedure is based ona nonparametric kernel estimate of the intraday volatility pattern and—in contrast toprevious approaches—does not require the subjective choice of potentially importantpoints in time and the length of their effect on volatility. The typical pattern of aThursday including the U.S. announcement effects will be extracted from the controldays, which have—apart from the effects of the ECB announcements—the sameintraday seasonal pattern as the announcement days. The announcement day returnsare then filtered by those estimates. By doing so, the proposed procedure takes intoaccount intraday seasonality but at the same time ensures that we do not explain awaywhat we are actually interested in. As in Andersen and Bollerslev (1997), we assumethe following structure for the intraday returns
Rk,n = E(Rk,n) +√
hksn Zk,n√N
, (1)
where E(Rk,n) denotes the unconditional expectation of the 5-minute returns, hk
is the conditional variance of day k, and sn is a deterministic periodic componentfor the nth intraday interval. The innovations Zk,n are assumed to be independently

1400 : MONEY, CREDIT AND BANKING
025
5075
100
125
150
175
200
225
250
275
0.00
0.05
0.10
0.15
0.20
0.25
010
020
030
040
050
060
070
080
090
010
0011
0012
0013
0014
00
0.00
0.05
0.10
0.15
0.20
0.25
FIG
.4.
The
Solid
Bla
ckL
ines
Are
the
Sam
ple
Aut
ocor
rela
tion
Func
tions
ofth
eA
bsol
ute
5-M
inut
eE
UR
-USD
Ret
urns
,|R
t,k|,f
oron
eT
hurs
day
(Lef
tPa
nel,
288
Five
-Min
ute
Inte
rval
s)an
dFi
veC
onse
cutiv
eT
hurs
days
(Rig
htPa
nel,
1440
Five
-Min
ute
Inte
rval
s).T
heG
ray
Lin
e(R
ight
Pane
l)Is
the
Aut
ocor
rela
tion
Func
tion
ofth
eA
bsol
ute
Filte
red
EC
BA
nnou
ncem
entD
ayR
etur
ns,|R
k,n|,a
sD
efine
din
Sect
ion
2.2.
NO
TE:D
ashe
dlin
esar
e95
%co
nfide
nce
band
s.

CHRISTIAN CONRAD AND MICHAEL J. LAMLA : 1401
and identically distributed (i.i.d.) with mean zero and unit variance. Moreover, weassume that the Zk,n are independent of hk . We estimate the seasonal componentfrom a regression using a log-square transformation of equation (1), which can berewritten as
rk,n ≡ 2 log(|Rk,n − E(Rk,n)|) − log(hk) + log(N ) = log(s2
n
) + log(Z2
k,n
)= f (n) + uk,n, (2)
where the error term, uk,n ≡ log(Z2k,n) − E(log(Z2
k,n)), is mean zero and i.i.d. Anestimable version of equation (2) is obtained by replacing E(Rk,n) and hk by suitableestimates, which leads to a series rk,n . We estimate E(Rk,n) by the sample mean ofthe 5-minute returns and hk by the realized volatility of the respective day, that is, byhk = ∑N
n=1 R2k,n , which exploits contemporaneous intraday information.
Andersen and Bollerslev (1997) model f (n) parametrically in a fashion that requiresa specification of possibly important announcements and knowledge of the exacttiming of each particular announcement. We instead rely on nonparametric kernelsmoothing. We regress rk,n nonparametrically on a grid x = 1, . . . , N of 5-minuteintervals over the trading day. This can be naturally done by using a Nadaraya-Watsonkernel estimator of f (x) which is given by
fb(x) =
K∑k=1
N∑n=1
Kb(n − x )rk,n
KN∑
n=1
Kb(n − x)
, (3)
where Kb(·) = b−1K(·/b) with K being a kernel function and b the bandwidth pa-rameter. We apply the procedure to the control days only. Thereby, we extract theshape of the seasonal component of a typical Thursday including U.S. announcementeffects but not the effects due to ECB announcements. In a first step we choose aglobal bandwidth bg by cross-validation. This results in an accurate estimate of theoverall intraday volatility pattern. In order to accommodate the effects of the U.S.announcements, we locally apply a smaller bandwidth bl < bg chosen according to amodified version of the Lepski, Mammen, and Spokoiny (1997) rule.9 This approachallows for an endogenous search for “important” announcements whereby the datadetermine for how long those announcements affect the volatility. The upper panelof Figure 5 graphs the fit f (x) across the 24-hour trading day in comparison to theaverage absolute returns of the ECB announcement days.10 The middle panel allowsfor a more detailed view on the important period between 12.00 and 18.00 and, forreasons of comparison, additionally includes the average absolute returns for the
9. More details on the choice of the local bandwidth can be found in the working paper version of thisarticle.
10. To compare the estimates with the absolute returns we have to convert the intraday seasonalitypattern through the transformation |Rk,n − E(Rk,n)| =
√hk exp ( f (n)/2) exp (uk,n /2)√
N.

1402 : MONEY, CREDIT AND BANKING
2 4 6 8 10 12 14 16 18 20 22 24
0.025
0.050
0.075
12 13 14 15 16 17 18
0.025
0.050
0.075
2 4 6 8 10 12 14 16 18 20 22 24
0.025
0.050
0.075
FIG. 5. The Upper Panel Graphs the Nonparametric Fit [as Defined in Equation (3)] to the Intraday Seasonality forAll Control Days (Dotted Line) Together with the Average Absolute Returns (as Defined in Figure 2) for All ECBAnnouncement Days (Dashed Line). The Middle Panel Shows the Important Time Period between 12.00 and 18.00and Additionally Includes the Average Absolute Returns for the Control Days (Solid Line). The Lower Panel Graphsthe Average Absolute Filtered Returns for the ECB Announcement Days, That Is, 1
K
∑Kk=1 |Rk,n |, Where the Rk,n Are
defined in Section 2.2, K Denotes the Number of ECB Announcement Days and n = 1, . . . , 288 the Intervals.
control days. Finally, the filtered 5-minutes returns are obtained as Rk,n ≡ Rk,n /sn ,whereby the sn are standardized such that 1/N
∑Nn=1 sn = 1. The filtered returns are
plotted in the lower panel of Figure 5. Clearly, both the intraday volatility patternas well as the effects due to U.S. announcements have been removed, while ECBannouncement effects have been preserved.
This impression is also confirmed by investigating the autocorrelation functionof the absolute filtered returns presented in Figure 4 (right panel, gray line), whichappears to be free of seasonality. However, while the autocorrelations of the absolutevalues of the filtered series initially decay rapidly, they are characterized by anextremely slow rate of decay thereafter. This type of decay is typical for long memoryprocesses associated with autocorrelations decaying as j2d−1, where d denotes theorder of fractional integration (see, e.g., Baillie, Cecen, and Han 2000).
2.3 Reuters Data on Surprises
In order to construct a surprise measure with respect to the monetary policy decisionwe follow Andersen et al. (2003) and Clarida and Waldman (2008), who make useof survey data. Although it is sometimes argued that survey-based measures maybe “stale” in comparison to market-based expectations, this should not be the case

CHRISTIAN CONRAD AND MICHAEL J. LAMLA : 1403
if the survey is taken very close to the time of the announcement.11 We base oursurprise measure on the Reuters Survey of Professional Forecasters: 1 week ahead ofthe Governing Council meeting Reuters asks up to 80 financial analysts about theirexpectations concerning the key interest rate being decided upon by the members ofthe Governing Council. The monetary policy surprise is calculated as the differencebetween the interest rate announced in the press release on the meeting day and themean (respectively, the median) of the ex ante expectations of the analysts. In thefollowing, we will denote the mean surprise measure by srk,13.45. In order to be able todetect asymmetric responses of the exchange rate to positive and negative surprises,we split srk,13.45 into sr+
k,13.45 and sr−k,13.45. All results presented in Section 4 are based
on mean surprises. Only for the exploratory analysis in Section 2.5 do we employmedian surprises.
2.4 ECB Communication Indicators
The construction of our communication indicators closely follows the proceduresdescribed in Ehrmann and Fratzscher (2007) and Fratzscher (2008a, 2008b) and isbased on a classification of statements referred to as Content Analysis (see, e.g.,Holsti 1969). We commissioned Mediatenor, a media research institute, with theprocess of classification. Mediatenor has a long history of handling press releases, noself-interest in a specific outcome, and, most importantly, guarantees a high degreeof objectivity and reproducibility.
Overall, the content of the 89 introductory statements in the period January 1999until October 2006 has been coded. Each sentence has been split up into “informationunits,” which are defined by a combination of a topic (prices, growth, etc.), a tendencyof development (decrease, no change, increase) and a tense (past, present and past,present, present and future, future). Any change in the topic, the tendency of develop-ment or the tense is considered as a new information unit. For our purpose we extractinformation about the following topics: the real economy, prices, money growth, andthe exchange rate. For each of those topics we calculate a communication indicatorthat reflects the ECB’s expectations concerning rising relative to falling values. Sinceour intention is to construct forward-looking measures, we solely use statementswith tense categorized as present and future or future. For example, the indicator thatmeasures communication about future price developments on announcement day kin the time period 14.30–14.50 is calculated as
CIk,14.30−14.50 = 1
m
m∑i=1
CIk,14.30−14.50,i , (4)
11. For example, Balduzzi et al. (1998) show that the International Money Market Services forecastsare unbiased and not stale (see also the discussion in Andersen et al. 2003, pp. 44, 45).

1404 : MONEY, CREDIT AND BANKING
where each CIk,14.30−14.50,i represents the coding of an information unit with
CIk,14.30−14.50,i =
⎧⎪⎨⎪⎩
+1 increasing prices
0 no change in prices
−1 decreasing prices,
(5)
and m is the number of information units with content related to future price devel-opments. For the construction of CIk,14.30−14.50 we use statements dealing with theconsumer price index, prices in general, wages, and oil price developments. The otherindicators are constructed in an analogous way: for the real economy, we employ state-ments on GDP, GDP growth, investment, and industrial production; for the exchangerate and monetary growth, we only include statements on these specific topics. Clearly,two critical aspects in Content Analysis are the risk of misclassification and the needto guarantee the reproducibility of the results (see, e.g., Neuendorf 2002). For thisreason we did not classify the introductory statements based on our own judgementbut asked Mediatenor to do so. Table A1 in the Appendix contains example sentencestaken from selected introductory statements and the corresponding coding as receivedfrom Mediatenor. Furthermore, as the introductory statement on announcement day khas to be seen in relation to the previous introductory statements, we follow Ehrmannand Fratzscher (2007) and create variables which measure the “stock” of communi-cation. For example, the corresponding indicator for communication on future pricedevelopments is constructed as CI
lk,14.30−14.50 = ∑l
j=1 CIk− j,14.30−14.50, where l mea-sures the “memory” of the stock variable. We expect the effect of the stock variablesto be negative, because the impact of a certain statement is likely to be weaker if theprevious communication had a similar content. In the empirical analysis we employboth the current value of the communication indicator and the indicator of the stockof communication accumulated during the last 3 months; that is, we choose l = 3.Figure 6 depicts the index on future price developments CIk,14.30−14.50 together withthe ECB’s main refinancing rate. From the graph it appears that our index leads theinterest rate cycle. This would be perfectly in line with the ECB’s intention to preparemarkets for possible actions well in advance. An overview of all four indicators isprovided by Table 1, which presents the absolute and relative number of informationunits classified as increasing/no change/falling.
Finally, it should be noted that in contrast to the policy surprise variables describedin Section 2.3 our communication indicators do not distinguish between the expectedand unexpected content of communication.
2.5 A Closer Look at the Data
Table 2 depicts the movement in the average absolute 5-minute returns duringthe time span of interest (13.40–15.30) for all control days, all announcement days,announcement days with no median surprise, and announcement days with median

CHRISTIAN CONRAD AND MICHAEL J. LAMLA : 1405
FIG. 6. The ECB Key Refinancing Rate (Solid Line, Left Scale) and the Communication Indicator on Future PriceDevelopments, CIk,14.30−14.50 (Dots, Right Scale), Which Is Defined in Equation (4).
NOTE: CIk,14.30−14.50 is restricted to the range −1 to +1, whereby positive/negative values indicate increasing/decreasingrisks to price stability.
TABLE 1
MONETARY POLICY COMMUNICATION IN THE INTRODUCTORY STATEMENTS
Rising No change Falling
Price developments 117 11% 907 83% 66 6%Real economy 517 40% 740 57% 44 3%Monetary aggregates 106 13% 694 85% 19 2%Exchange rate 6 28% 14 67% 1 5%
NOTE: The communication in the introductory statements is split up into information units that are then coded according to the tendencyof development (as defined in equation (5)). The table reports the absolute and relative number of information units that were classified asrising/no change/falling within the four categories of interest. The four categories are defined in Section 2.4.
surprise.12 The three largest volatilities in each column are marked by three, two, andone asterisks, respectively, whereby three asterisks signify the largest volatility. Thelargest volatility in each row is marked as a bold number. Due to the U.S. announce-ments at 14.30, the control days reveal a single peak in volatility reflected in the highaverage absolute return from 14.30 to 14.35. Thereafter, volatility immediately be-gins to fall back. The announcement days are characterized by three volatility peaks.The first and largest is due to the ECB press release at 13.45, the second (as withthe control days) at 14.30, and the third due to the introductory statement between
12. In this instance we use median surprises because they occur less frequently and are more “sub-stantial” than mean surprises and hence allow for a “strong” separation of our sample in surprise andno-surprise days.

1406 : MONEY, CREDIT AND BANKING
TABLE 2
AVERAGE ABSOLUTE 5-MINUTE EUR-USD RETURNS
CD AD NSD SD
13.35–13.40 0.030 0.027 0.026 0.03913.40–13.45 0.028 0.037 0.037 0.03913.45–13.50 0.037 0.087∗∗∗ 0.065∗∗ 0.260∗∗∗13.50–13.55 0.036 0.046 0.041 0.088∗13.55–14.00 0.031 0.047 0.044 0.07614.00–14.05 0.034 0.051 0.047 0.08514.05–14.10 0.033 0.042 0.040 0.05114.10–14.15 0.035 0.050 0.042 0.114∗∗14.15–14.20 0.033 0.042 0.038 0.07214.20–14.25 0.035 0.041 0.038 0.06814.25–14.30 0.032 0.042 0.040 0.06214.30–14.35 0.073∗∗∗ 0.068∗∗ 0.070∗∗∗ 0.05214.35–14.40 0.053∗∗ 0.056 0.055 0.06614.40–14.45 0.045∗ 0.066∗ 0.065∗∗ 0.06814.45–14.50 0.044 0.052 0.053 0.04614.50–14.55 0.042 0.061 0.059∗ 0.07414.55–15.00 0.043 0.054 0.050 0.08115.00–15.05 0.042 0.048 0.048 0.05215.05–15.10 0.038 0.042 0.040 0.05915.10–15.15 0.039 0.047 0.046 0.05515.15–15.20 0.039 0.043 0.043 0.04515.20–15.25 0.035 0.037 0.036 0.04815.25–15.30 0.037 0.044 0.045 0.035Daily mean 0.027 0.028 0.028 0.033
NOTE: CD refers to the 328 control days, AD to the 89 announcement days. NSD (no surprise days)/SD (surprise days) refers to the79/10 announcement days on which the interest rate decision was equal to/different from the median of the Reuters Survey of ProfessionalForecasters. Each column presents the average absolute 5-minute returns for the respective days and intervals. The three largest volatilities ineach column are marked by three, two, and one asterisks, respectively. The largest volatility in each row is marked as a bold number.
14.40 and 14.45. The announcement days with no surprise have four major volatilitypeaks. A first one is again induced by the U.S. announcements, and two further onesare due to the ECB introductory statement and the press release. Interestingly, thereis a fourth peak during the Q&A session. Finally, announcement days with surprisesare characterized by the huge increase in volatility right after the press release. Com-paring the volatility across samples, surprise days clearly dominate at each point intime (with only three exceptions) as well as over the entire day (evident from the lastrow of Table 2).
In summary, this exercise suggests that both the press release and the press confer-ence have a strong impact on the volatility of the EUR-USD exchange rate. Moreover,there is clear evidence for the outstanding role of interest rate surprises.
3. THE FIGARCH MODEL
The decay behavior of the autocorrelation function of the absolute filtered returnseries described in Section 2.2 suggests that the conditional variance of the filteredreturn series should be modeled as a fractionally integrated process. Among theGARCH-type models that allow for such a behavior in the conditional variance, the

CHRISTIAN CONRAD AND MICHAEL J. LAMLA : 1407
Fractionally Integrated GARCH (FIGARCH) model proposed by Baillie, Bollerslev,and Mikkelsen (1996) is the most prominent one.
The econometric model we apply to the filtered return series is autoregressive inthe mean with residuals that follow a FIGARCH process. In both equations—theconditional mean and variance—we allow for explanatory variables, namely, thesurprise measures, the communication indicators, and controls for the Q&A session.For the mean equation we assume the following autoregressive structure for thefiltered returns Rk,n including I1 exogenous regressors Xk,n,i :
Rk,n = μ +P∑
j=1
ϕ j Rk,n− j +I1∑
i=1
δi Xk,n,i + εk,n. (6)
The innovations εk,n follow a FIGARCH(p, d, q) process defined by εk,n =Zk,n
√hk,n where Zk,n is a sequence of i.i.d. random variables with E(Zk,n) = 0, σ 2
Z =E(Z2
k,n), and
B(L)hk,n = ω +I2∑
i=1
ωi Wk,n,i + (B(L) − (1 − L)d�(L))ε2k,n (7)
for some ω ∈ R+, lag polynomials �(L) = 1 − ∑q
i=1 φi Li , B(L) = 1 − ∑pi=1 βi Li ,
and 0 ≤ d ≤ 1 being the fractional differencing parameter. As in equation (6) forthe mean, we allow for I2 exogenous regressors Wk,n,i in the conditional varianceequation. For instance, the conditional variance at 13.50 will be explained by theinterest rate surprise realized at 13.45, that is, we explain hk,13.50 by choosing Wk,n,i
as sr+k,13.45 and |sr−
k,13.45|. Details on the estimation of the AR-FIGARCH modelwith explanatory variables in the conditional mean and volatility can be found in theworking paper version of this article. For an in depth discussion of the properties ofthe FIGARCH model—including non-negativity conditions—see Conrad and Haag(2006) and Conrad (2010).
4. EMPIRICAL RESULTS
4.1 Pure AR-FIGARCH Models
Before we analyze the effects of the monetary policy decisions on the level andvolatility of the EUR-USD exchange rate in detail, we present in Table 3, PanelA, estimation results from AR-FIGARCH models for the control sample and theannouncement days without including any exogenous regressors.13 The serial cor-relation in the filtered 5-minute return series is well captured by the inclusion of
13. The control sample consists of 89 days, the same number of days that we have for ECB announce-ment days. The control days were chosen randomly from Thursdays either 1 week before or 1 week afterthe announcement day.
1408 : MONEY, CREDIT AND BANKING
TABLE 3
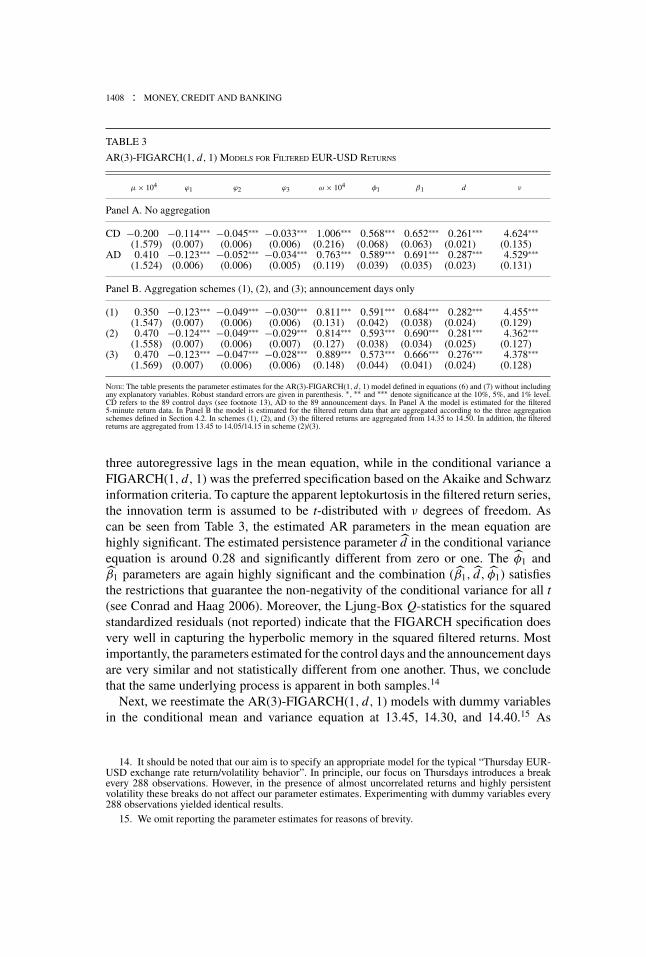
AR(3)-FIGARCH(1, d, 1) MODELS FOR FILTERED EUR-USD RETURNS
μ × 104 ϕ1 ϕ2 ϕ3 ω × 104 φ1 β1 d ν
Panel A. No aggregation
CD −0.200 −0.114∗∗∗ −0.045∗∗∗ −0.033∗∗∗ 1.006∗∗∗ 0.568∗∗∗ 0.652∗∗∗ 0.261∗∗∗ 4.624∗∗∗(1.579) (0.007) (0.006) (0.006) (0.216) (0.068) (0.063) (0.021) (0.135)
AD 0.410 −0.123∗∗∗ −0.052∗∗∗ −0.034∗∗∗ 0.763∗∗∗ 0.589∗∗∗ 0.691∗∗∗ 0.287∗∗∗ 4.529∗∗∗(1.524) (0.006) (0.006) (0.005) (0.119) (0.039) (0.035) (0.023) (0.131)
Panel B. Aggregation schemes (1), (2), and (3); announcement days only
(1) 0.350 −0.123∗∗∗ −0.049∗∗∗ −0.030∗∗∗ 0.811∗∗∗ 0.591∗∗∗ 0.684∗∗∗ 0.282∗∗∗ 4.455∗∗∗(1.547) (0.007) (0.006) (0.006) (0.131) (0.042) (0.038) (0.024) (0.129)
(2) 0.470 −0.124∗∗∗ −0.049∗∗∗ −0.029∗∗∗ 0.814∗∗∗ 0.593∗∗∗ 0.690∗∗∗ 0.281∗∗∗ 4.362∗∗∗(1.558) (0.007) (0.006) (0.007) (0.127) (0.038) (0.034) (0.025) (0.127)
(3) 0.470 −0.123∗∗∗ −0.047∗∗∗ −0.028∗∗∗ 0.889∗∗∗ 0.573∗∗∗ 0.666∗∗∗ 0.276∗∗∗ 4.378∗∗∗(1.569) (0.007) (0.006) (0.006) (0.148) (0.044) (0.041) (0.024) (0.128)
NOTE: The table presents the parameter estimates for the AR(3)-FIGARCH(1, d, 1) model defined in equations (6) and (7) without includingany explanatory variables. Robust standard errors are given in parenthesis. ∗ , ∗∗ and ∗∗∗ denote significance at the 10%, 5%, and 1% level.CD refers to the 89 control days (see footnote 13), AD to the 89 announcement days. In Panel A the model is estimated for the filtered5-minute return data. In Panel B the model is estimated for the filtered return data that are aggregated according to the three aggregationschemes defined in Section 4.2. In schemes (1), (2), and (3) the filtered returns are aggregated from 14.35 to 14.50. In addition, the filteredreturns are aggregated from 13.45 to 14.05/14.15 in scheme (2)/(3).
three autoregressive lags in the mean equation, while in the conditional variance aFIGARCH(1, d, 1) was the preferred specification based on the Akaike and Schwarzinformation criteria. To capture the apparent leptokurtosis in the filtered return series,the innovation term is assumed to be t-distributed with ν degrees of freedom. Ascan be seen from Table 3, the estimated AR parameters in the mean equation arehighly significant. The estimated persistence parameter d in the conditional varianceequation is around 0.28 and significantly different from zero or one. The φ1 andβ1 parameters are again highly significant and the combination (β1, d, φ1) satisfiesthe restrictions that guarantee the non-negativity of the conditional variance for all t(see Conrad and Haag 2006). Moreover, the Ljung-Box Q-statistics for the squaredstandardized residuals (not reported) indicate that the FIGARCH specification doesvery well in capturing the hyperbolic memory in the squared filtered returns. Mostimportantly, the parameters estimated for the control days and the announcement daysare very similar and not statistically different from one another. Thus, we concludethat the same underlying process is apparent in both samples.14
Next, we reestimate the AR(3)-FIGARCH(1, d, 1) models with dummy variablesin the conditional mean and variance equation at 13.45, 14.30, and 14.40.15 As
14. It should be noted that our aim is to specify an appropriate model for the typical “Thursday EUR-USD exchange rate return/volatility behavior”. In principle, our focus on Thursdays introduces a breakevery 288 observations. However, in the presence of almost uncorrelated returns and highly persistentvolatility these breaks do not affect our parameter estimates. Experimenting with dummy variables every288 observations yielded identical results.
15. We omit reporting the parameter estimates for reasons of brevity.

CHRISTIAN CONRAD AND MICHAEL J. LAMLA : 1409
expected, for the control days none of the dummies is significant, indicating thatthe filtered control day returns are free of any effects due to macroeconomicannouncements. The picture for the announcement days is very different. Whilewe find no significant effects in the mean, the dummies in the variance are highlysignificant at 13.45 and 14.40, but not at 14.30. This outcome is convincing. First,only surprise news (which are not adequately captured by a simple dummy variable)should have an effect on the exchange rate return, while as reported in Andersen etal. (2003) the volatility obeys a pure announcement effect. Second, the effects due tothe U.S. announcements, which were clearly visible in Table 2 are no longer evidentin the filtered series. Finally, we controlled for the possibility that news may leak intothe markets before the official release date. However, any additional dummy variablebefore the press release at 13.45 turned out to be insignificant. In summary, the newlyproposed filtering approach appears to be well suited in our context.
4.2 The Explanatory Power of Surprises and Communication
In the following section we use the Reuters surprise data and the communicationindicators to investigate whether the movements in the mean and variance can beexplained by the sign and the size of those variables. Table 4 presents our mainresults. For utmost transparency the results are structured in the following way. First,we estimate the magnitude and the direction of the response to the press release overdifferent time horizons. For this we choose intervals of 5, 20, and 30 minutes, referredto as aggregation schemes (1), (2), and (3). This allows us to infer the path of theimpulse response over time, that is, to judge whether there is an immediate response,whether the response is building up, or whether there is a backlash. In the practicalestimation for the 20- (30-) minute time horizon, this means that we replace thefour (six) filtered 5-minute returns between 13.45 and 14.05 (13.45–14.15) by one20- (30-) minute return, denoted by Rk,13.45−14.05(Rk,13.45−14.15).16 Second, becauseour communication indicators are based on the average of the coding of severalstatements that are made in the period 14.30–14.50, we replace in all aggregationschemes the three 5-minute filtered returns between 14.35 and 14.50 by one 15-minute return, denoted by Rk,14.35−14.50.17 This allows us to measure the overallimpact of the communication on the return during the introductory statement. PanelB of Table 3 provides the parameter estimates for the AR-FIGARCH model underthe three aggregation schemes without including any explanatory variables. Thoseestimates are virtually identical with the ones obtained in Panel A with no aggregation.These results show that the aggregation has negligible effects on the structural AR-FIGARCH parameters, that is, on the estimated time series dynamics.
16. To be more specific: for example, for the 20-minute time horizon we replace the stacked vectorof observations (. . . , Rk,13.45, Rk,13.50, . . . , Rk,14.05, Rk,14.10, . . .)′ by (. . . , Rk,13.45, Rk,13.45−14.05, Rk,14.10, . . .)′
where Rk,13.45−14.05 = Rk,13.50 + Rk,13.55 + Rk,14.00 + Rk,14.05 for k = 1, . . . , K .17. The return from 14.30 to 14.35 is excluded from the aggregation scheme because the introductory
statement is unlikely to reveal new information to the market in the first few minutes (for the reasonsdescribed in Section 2.1).

1410 : MONEY, CREDIT AND BANKING
TABLE 4
THE IMPACT OF SURPRISES AND COMMUNICATION ON THE FILTERED EUR-USD RETURNS
(1) (2) (3)
Rk,13.45−13.50 Rk,14.35−14.50 Rk,13.45−14.05 Rk,14.35−14.50 Rk,13.45−14.15 Rk,14.35−14.50
Panel A. Mean equation
sr+k,13.45 0.7026∗∗∗ 1.9256∗∗∗ 0.6383∗∗
(0.2522) (0.2452) (0.3155)[0.86] [2.42] [0.82]
|sr−k,13.45| −0.0875 −0.9149∗∗ −1.6755∗∗∗
(0.3949) (0.4613) (0.5003)[−0.11] [−1.15] [−2.14]
CIk,14.30−14.50 0.0677∗∗ 0.0637∗∗ 0.0516∗(0.0345) (0.0252) (0.0286)[0.11] [0.11] [0.09]
CI3
k,14.30–14.50 −0.0203 −0.0249 −0.0192(0.0129) (0.0173) (0.0132)
[−0.03] [−0.04] [−0.03]C Ek,14.30−14.50 0.1083∗∗ 0.0859∗ 0.0906∗
(0.0496) (0.0505) (0.0539)[0.18] [0.14] [0.15]
Panel B. Variance equation
sr+k,13.45 0.4416∗∗ 0.7341∗∗ 0.9492∗∗∗
(0.2031) (0.3169) (0.3668)|sr−
k,13.45| 0.3208 0.6782∗ 0.3409(0.2297) (0.3650) (0.2239)
|CIk,14.30−14.50| 0.0352∗∗∗ 0.0330∗∗∗ 0.0311∗∗∗(0.0112) (0.0118) (0.0104)
|C Ek,14.30−14.50| 0.0064 0.0048 0.0062(0.0272) (0.0126) (0.0253)
NOTES: The table presents the parameter estimates for the explanatory variables included in the AR(3)-FIGARCH(1, d, 1) model defined inequations (6) and (7). Columns (1), (2), and (3) display the estimation results for the filtered returns, Rk,n , which were aggregated according tothe three schemes defined in Section 4.2. Robust standard errors are given in parenthesis. ∗ , ∗∗ and ∗∗∗ denote significance at the 10%, 5%, and1% level. sr+
k,13.45 measures positive mean surprises, |sr−k,13.45| the absolute value of negative mean surprises (for the exact definitions, see
Section 2.3). CIk,14.30−14.50, CI3k,14.30−14.50 and C Ek,14.30−14.50 are the communication indicators with respect to the future development
of prices and the exchange rate (as defined in Section 2.4). The numbers in brackets are the percentage effects of a one unit increase in theexplanatory variables on the raw returns (see the discussion in Section 4.2).
After a preliminary analysis, we decided to split the interest rate surprise measureinto positive and negative surprises in order to control for potential asymmetries.Evidence for asymmetric responses of exchange rates to news is reported, for ex-ample, in Andersen et al. (2003), Ehrmann and Fratzscher (2005), and Han (2008).It is generally found that bad news have greater impacts than good news. Andersenet al. (2003) argue that these asymmetric responses may be driven by different degreesof uncertainty with respect to the underlying state of the economy (see also Veronesi1999).
Initially we included the four forward-looking communication indicators on thereal economy, prices, monetary aggregates, and the exchange rate in their basic andstock (for different choices of l) versions. However, only communication on inflationand the exchange rate appeared to significantly drive the exchange rate. The findingthat news on inflation and exchange rates matter most intuitively makes sense since
CHRISTIAN CONRAD AND MICHAEL J. LAMLA : 1411
(i) news on future price developments should be naturally the most important messageas it is the ECB’s primary objective to achieve price stability and (ii) exchange ratesshould directly be affected by an assessment of the central bank. The finding thatcommunication about the real economy did not have significant effects squares withthe recent results in Ehrmann and Fratzscher (2007), who also report that markets donot react to the ECB’s statements about the economic outlook and argue that this isa reflection of the strong emphasis on price stability in the ECB’s policy function.Finally, the fact that news on the monetary aggregate are insignificant is in line withrecent research that questions the importance of the “monetary pillar” (see, e.g.,Berger, de Haan, and Sturm Forthcoming). For space considerations we omit theparameter estimates of those insignificant variables from Table 4. In addition, wecontrolled for a possible impact of the Q&A session by employing dummy variablesfor the period 14.50–15.15. Those were not found to be significant.18
Turning to the estimation results a compelling picture emerges. Table 4 presentsthe coefficient estimates for the three aggregation schemes. The table reads as fol-lows. Each column (1)–(3) presents coefficient estimates from the same regressionexcept that the time horizon for the response to the interest rate announcement isenlarged from 5 to 20 to 30 minutes. Panel A presents estimation results for the meanequation while Panel B contains the coefficient estimates for the variance equation.Each column (1)–(3) consists of two subcolumns. The first subcolumn explains theresponse to the interest rate announcement while the second subcolumn controls forthe impact of our communication indicators. As can be seen from the highly signifi-cant coefficient estimate in Table 4 column (1), an unexpected increase of the interestrate leads to an immediate appreciation of the EUR against the USD. Since our modelis estimated for the filtered returns, the coefficient estimate has to be multiplied bys13.50 in order to obtain a measure for the effect on the raw returns. Doing so, themodel predicts that a surprise monetary policy tightening by 50 basis points leads toan appreciation of the EUR by 0.43% in the subsequent 5 minutes. The significantcoefficients in columns (2) and (3) suggest that the positive effect is increasing withinthe first 20 minutes and then falls back after 30 minutes. Hence, a positive surpriseleads to a prolonged appreciation of the EUR. Similarly, a surprise monetary policyeasing induces a significant depreciation of the EUR within the first 20/30 minutesafter the release. Thus, the estimated signs of the exchange rate reaction are in linewith our discussion in Section 1.
Looking at the effect of interest rate surprises on the volatility, the cumulativeresponse pattern provides evidence for an initial instantaneous jump in volatility,which is then followed by a gradual decline during a period of “higher than normal”volatility. Positive surprises tend to trigger stronger volatility reactions than negativeones.
18. However, in the working paper version of this article, we have shown that the exchange ratesignificantly reacts to the Q&A session, if it is appropriately controlled for the earlier announced decisionand the specific content of the introductory statement.

1412 : MONEY, CREDIT AND BANKING
Turning to the communication indicators, we find that CIk,14.30−14.50 plays a promi-nent role. There is a highly significant and positive effect of news on increasing futureprices on the exchange rate; that is, the EUR appreciates on impact by 0.11% inresponse to a one unit increase in CIk,14.30−14.50 (increasing risks to price stability).As argued in Section 1, this result suggests that market participants use the newinformation on price developments to update their beliefs about the ECB’s futureinterest rate setting. Our finding strongly supports the predictions of Engel and West(2006) and Clarida and Waldman (2008), who argue that a positive inflation sur-prise together with a Taylor-type monetary policy rule can lead to an appreciationof the exchange rate. Besides being sufficiently credible, the central bank must beexpected to raise interest rates sufficiently aggressively in response to an inflationshock. The appreciation results from the fact that in the short-run the expectationsof higher future interest rates overcompensate the long-run PPP effect, which worksin the opposite direction. Finally, the negative estimate for CI
3k,14.35−14.50 (significant
at the 15% level) suggests that the effect can be either strengthened or weakeneddepending on the content of the preceding introductory statements. In this sense thestock variable appears to control for the expected content of the communication.19
To obtain a clearer understanding of the role played by the CIk,14.30−14.50 vari-able, we reestimate our models after dividing the sample into two subperiods usingMay 2003 as the breakpoint. At this date the ECB changed the structure of the intro-ductory statement, highlighting the importance of nonmonetary issues (see Berger,de Haan, and Sturm Forthcoming). Our results suggest that the effect of communi-cation on future price developments has changed over time.20 While in the periodJanuary 1999–April 2003 the coefficient estimate on CIk,14.30−14.50 is 0.0546 (0.0369)and, hence, significant at the 13% level, it turns out to be 0.0716 (0.0155) and, there-fore, highly significant in the period May 2003–October 2006. This outcome isperhaps due to an increase in the ECB’s credibility, which implies that market partic-ipants now expect the ECB to respond more aggressively to inflation surprises. Figure7 supplements the above findings concerning the rising importance of ECB communi-cation by a simple graphical illustration. For all announcement days, the figure showsa striking difference in the intraday volatility pattern of the EUR-USD exchangerate between the subperiods January 1999–April 2003 and May 2003–October 2006.While in January 1999–April 2003 the press release dominates the whole day, itlooses much of its importance in May 2003–October 2006. In sharp contrast, in thissecond period the press conference has become most important.
Finally, Table 4 shows that statements assessing the future exchange rate develop-ment (C Ek,14.30−14.50) have significant effects. The coefficient estimates indicate that
19. For example, in a situation where the previous statements suggested that prices are falling(CI
3
k,14.35−14.50 < 0), a positive CIk,14.30−14.50 leads to a much stronger reaction, than in a situation where a
positive CIk,14.30−14.50 is expected from the previous statements (CI3
k,14.35−14.50 > 0). Note that this findingis robust with respect to the choice of l.
20. In the subsample estimations, we exclusively focus on communication on price developments. Theparameter estimates presented are obtained using the second aggregation scheme. Similar results hold foraggregation schemes (1) and (3).

CHRISTIAN CONRAD AND MICHAEL J. LAMLA : 1413
24
68
1012
1416
1820
2224
0.02
0.04
0.06
0.08
0.10
24
68
1012
1416
1820
2224
0.01
0.02
0.03
0.04
0.05
0.06
0.07
0.08
FIG
.7.
The
Ave
rage
Abs
olut
e5-
Min
ute
EU
R-U
SDR
etur
ns(a
sD
efine
din
Figu
re2)
for
Eac
h5-
Min
ute
Inte
rval
.The
left
pane
lsho
ws
the
aver
age
abso
lute
retu
rns
for
the
55an
noun
cem
ent
days
befo
reM
ay20
03an
dth
eri
ghtp
anel
for
the
34an
noun
cem
entd
ays
from
May
2003
onw
ard.
1414 : MONEY, CREDIT AND BANKING
the ECB has the credibility to speak up the EUR. Notably, at the same time there isno significant effect on the variance.
In summary, our results are in line with Almeida, Payne, and Goodhart (1998,p. 396), who argue that “. . . the exchange rate behaves according to a model whereinternational capital flows dominate trade flows, that is, the key variable for exchangerate determination is the interest rate differential and where the monetary authoritiesset interest rates according to their expectations of future inflation.”
5. CONCLUSIONS
We analyze the effect of the ECB’s monetary policy communication after themonthly Governing Council meetings on the level and volatility of the EUR-USDexchange rate. In particular, we disentangle the effects of the interest rate decision at13.45, the introductory statement starting at 14.30, and the Q&A session followingthereafter.
First, an unexpected tightening/easing of the monetary policy leads to an imme-diate appreciation/depreciation of the EUR. Both positive and negative interest ratesurprises induce prolonged increases in the volatility of the exchange rate.
Second, the introductory statement plays an important role for expectation for-mation. In particular, the forward-looking content is closely followed by marketparticipants who try to predict the future policy path. We provide evidence that theECB’s assessment of price and exchange rate developments are most relevant for theresponse of the EUR-USD exchange rate. There is compelling evidence that state-ments that indicate increasing risks to price stability induce an appreciation of theEUR. As our price indicator leads the interest rate cycle, market participants react tothe expected rise of future market rates.21 Thus, we deliver further empirical supportfor the arguments put forward by Engel and West (2006) and Clarida and Wald-man (2008). Their models of exchange rate behavior assume that a central bank’sreaction function can be modeled as a Taylor rule and imply that announcementsof surprise inflation lead to a stronger currency. The reason for this response is thatmarkets believe that central banks will react sufficiently strong to the increasing risksto price stability by raising the real interest rate. Hence, the change in the exchangerate reflects the change in market expectations of future interest rates. Our analysisallows us to observe this change in expectations in real time: in response to the ECB’scommunication on future price developments, market expectations regarding the fu-ture course of monetary policy are adjusted, inducing exchange rate movements.Finally, our results support the view that the ECB can, at least in the short-run, movethe exchange rate in the desired direction purely by commenting on exchange ratedevelopments.
21. A version of our indicator on future price developments is now published on a monthly basisby the KOF Swiss Economic Institute as the KOF Monetary Policy Communicator and available athttp://www.kof.ethz.ch/publications/indicators/communicator.

CHRISTIAN CONRAD AND MICHAEL J. LAMLA : 1415
APPENDIX: CONTENT ANALYSIS: CODING EXAMPLES
TABLE A1
EXAMPLES FOR MEDIATENOR CODING
Sentence Information unit Tense Topic Tendency Coding
September 9, 1999—Weexpect consumer priceincreases to rise somewhatfurther from their Julylevels, mainly as aconsequence of higher oilprices.
We expect consumerprice increases torise somewhatfurther from theirJuly levels, . . .
present andfuture
consumerpriceindex
rising +1
March 6, 2003—In thecourse of this year,inflation rates should fallbelow 2% and remain inline with price stabilitythereafter.
In the course of thisyear, inflation ratesshould fall below2% . . .
present andfuture
inflationrate
falling −1
March 4, 2004—Whilegrowth has been relativelymodest so far, bothexternal and domesticfactors give reason toexpect a strengthening ofthe recovery through 2004and beyond.
. . . give reason toexpect astrengthening of therecovery through2004 and beyond.
future economicgrowth
rising +1
August 30, 2001—Recentdata on economic activityindicates that real GDPgrowth in 2001 will mostlikely be lower than wasexpected a few monthsago.
. . . that real GDPgrowth in 2001 willmost likely belower . . .
future economicgrowth
falling −1
October 7, 1999—In the lightof the medium-termorientation of theEurosystem’s monetarypolicy, the rising trend ofM3 growth calls for greatvigilance on the part ofmonetary policy.
. . . , the rising trend ofM3 growth . . .
present andfuture
monetaryaggregate
rising +1
October 19, 2000—Theconfidence of investors inthe internal stability of theEuro and the positiveoutlook for Euro areagrowth are contributing tothe attractiveness ofinvesting in the Euro areaand will support a strongerexternal value of the Euro.
. . . and will support astronger externalvalue of the Euro.
present andfuture
Euroexchangerate
rising +1
NOTE: The table presents example sentences from selected introductory statements. Each sentence is split up into information units, whichcan be categorized according to their tense and topic. For the construction of the communication indicators we only employ information unitswith tense given by present and future or future. The topic determines into which category (price developments, real economy, monetaryaggregates, exchange rate) the information unit is classified. The tendency of development determines the coding as +1/0/−1.

1416 : MONEY, CREDIT AND BANKING
LITERATURE CITED
Almeida, Alvaro, Richard Payne, and Charles Goodhart. (1998) “The Effects of Macroe-conomic News on High Frequency Exchange Rate Behaviour.” Journal of Financial andQuantitative Analysis, 33, 383–408.
Andersen, Torben G., and Tim Bollerslev. (1997) “Intraday Periodicity and Volatility Persis-tence in Financial Markets.” Journal of Empirical Finance, 4, 115–58.
Andersen, Torben G., and Tim Bollerslev. (1998) “Deutsche Mark-Dollar Volatility: Intra-day Activity Patterns, Macroeconomic Announcements, and Longer Run Dependencies.”Journal of Finance, 53, 219–65.
Andersen, Torben G., Tim Bollerslev, Francis X. Diebold, and Clara Vega. (2003) “MicroEffects of Macro Announcements: Real-Time Price Discovery in Foreign Exchange.” Amer-ican Economic Review, 93, 38–62.
Baillie, Richard T., Tim Bollerslev, and Hans Ole Mikkelsen. (1996) “Fractionally IntegratedGeneralized Autoregressive Conditional Heteroskedasticity.” Journal of Econometrics, 74,3–30.
Baillie, Richard T., Aydin A. Cecen, and Young-Wook Han. (2000) “High Frequency DeutscheMark-US Dollar Returns: FIGARCH Representations and Non-Linearities.” MultinationalFinance Journal, 4, 247–67.
Balduzzi, Pierluigi, Giuseppe Bertola, Silverio Foresi, and Leora Klapper. (1998) “InterestRate Targeting and the Dynamics of Short-Term Rates.” Journal of Money, Credit andBanking, 30, 26–50.
Beine, Michel, Gust Janssen, and Christelle Lecourt. (2009) “Should Central Bankers Talk tothe Foreign Exchange Markets?” Journal of International Money and Finance, 28, 776–803.
Berger, Helge, Jakob de Haan, and Jan-Egbert Sturm. (Forthcoming) “Does Money Matter inthe ECB Strategy? New Evidence Based on ECB Communication.” International Journalof Finance & Economics.
Blinder, Alan S., Michael Ehrmann, Marcel Fratzscher, Jakob de Haan, and David-Jan Jansen.(2008) “Central Bank Communication and Monetary Policy: A Survey of Theory andEvidence.” Journal of Economic Literature, 46, 910–45.
Clarida, Richard, and Daniel Waldman. (2008) “Is Bad News about Inflation Good Newsfor the Exchange Rate?” In Asset Prices and Monetary Policy, edited by J. Y. Campbell,pp. 371–92. Chicago: University of Chicago Press.
Conrad, Christian. (2010) “Non-Negativity Conditions for the Hyperbolic GARCH Model.”Journal of Econometrics, 157, 441–57.
Conrad, Christian, and Berthold R. Haag. (2006) “Inequality Constraints in the FractionallyIntegrated GARCH Model.” Journal of Financial Econometrics, 4, 413–49.
Dornbusch, Rudiger. (1976) “Expectations and Exchange Rate Dynamics.” Journal of PoliticalEconomy, 84, 1161–76.
Ehrmann, Michael and Marcel Fratzscher. (2005) “Exchange Rates and Fundamentals: NewEvidence from Real-Time Data.” Journal of International Money and Finance, 24, 317–41.
Ehrmann, Michael, and Marcel Fratzscher. (2007) “Communication by Central Bank Com-mittee Members: Different Strategies, Same Effectiveness?” Journal of Money, Credit andBanking, 39, 509–41.
Ehrmann, Michael, and Marcel Fratzscher. (2009) “Explaining Monetary Policy in PressConferences.” International Journal of Central Banking, 5, 41–84.

CHRISTIAN CONRAD AND MICHAEL J. LAMLA : 1417
Eichenbaum, Martin, and Charles L. Evans. (1995) “Some Empirical Evidence on the Effectsof Shocks to Monetary Policy on Exchange Rates.” Quarterly Journal of Economics, 110,975–1009.
Engel, Charles, and Kenneth D. West. (2006) “Taylor Rules and the Deutschmark-Dollar RealExchange Rate.” Journal of Money, Credit and Banking, 38, 1175–94.
Faust, Jon, John H. Rogers, Shing-Yi B. Wang, and Jonathan H. Wright. (2007) “The High-Frequency Response of Exchange Rates and Interest Rates to Macroeconomic Announce-ments.” Journal of Monetary Economics, 54, 1051–68.
Fratzscher, Marcel. (2008a) “Communication and Exchange Rate Policy.” Journal of Macroe-conomics, 30, 1651–72.
Fratzscher, Marcel. (2008b) “Oral Interventions versus Actual Interventions in FX Markets—An Event-Study Approach.” Economic Journal, 118, 1079–1106.
Han, Young Wook. (2008) “Intraday Effects of Macroeconomic Shocks on the US Dollar-EuroExchange Rates.” Japan and the World Economy, 20, 585–600.
Jansen, David-Jan and Jakob de Haan. (2007) “Were Verbal Efforts to Support the EuroEffective? A High-Frequency Analysis of ECB Statements.” European Journal of PoliticalEconomy, 23, 245–59.
Kearns, Jonathan. and Phil Manners. (2006) “The Impact of Monetary Policy on the ExchangeRate: A Study Using Intraday Data.” International Journal of Central Banking, 2, 157–83.
Lamla, Michael J., and Sarah M. Lein. (Forthcoming) “What Matters When? The Impact ofECB Communication on Financial Market Expectations.” Applied Economics.
Lepski, Oleg V., Enno Mammen, and Vladimir G. Spokoiny. (1997) “Optimal Spatial Adapta-tion to Inhomogeneous Smoothness: An Approach Based on Kernel Estimates with VariableBandwidth Selectors.” Annals of Statistics, 25, 929–47.
Veronesi, Pietro. (1999) “Stock Market Overreactions to Bad News in Good Times: A RationalExpectations Equilibrium Model.” Review of Financial Studies, 12, 975–1007.
Zettelmeyer, Jeromin. (2004) “The Impact of Monetary Policy on the Exchange Rate: Evidencefrom Three Small Open Economies.” Journal of Monetary Economics, 51, 635–52.
Related Documents