The Fundamentals of Fundamental Analysis Oak Haven Investments July 21, 2005

The Fundamentals of Fundamental Analysis Oak Haven Investments July 21, 2005.
Dec 27, 2015
Welcome message from author
This document is posted to help you gain knowledge. Please leave a comment to let me know what you think about it! Share it to your friends and learn new things together.
Transcript

The Fundamentals of Fundamental Analysis
Oak Haven Investments
July 21, 2005

Investing is buying a share of a company’s success and/or failure.
Pretend that you can buy into someone's income.
You are given the opportunity to choose one of five people to “buy into”.
What would you want to know about each person?

Person 1 – Lew (all people and situation are purely fictional)
Retired Monthly Fixed Income If you divide his yearly income by the number
of shares available you come out with $1/share
Earnings Per Share (EPS) = $1
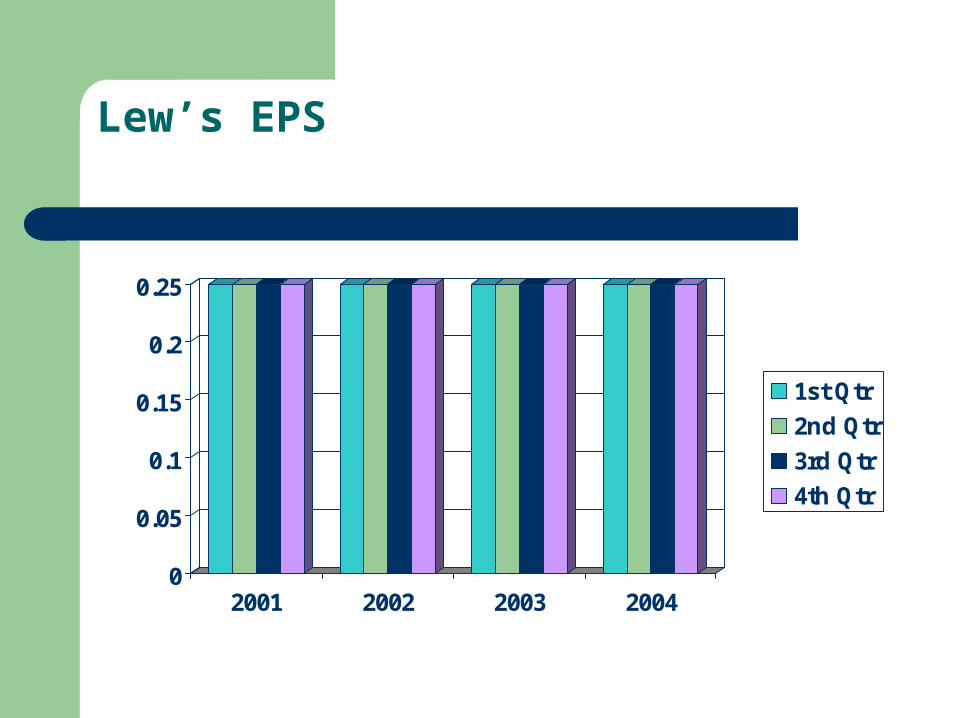
Lew’s EPS
0
0.05
0.1
0.15
0.2
0.25
2001 2002 2003 2004
1st Qtr
2nd Qtr
3rd Qtr
4th Qtr

Person 2 – Steve
Semi-retired Monthly fixed retirement payment Does tree-work to supplement fixed income Tree work comes in sporadically throughout
the year. Earning Per Share (EPS) = $1

Steve’s EPS
0
0.05
0.1
0.15
0.2
0.25
0.3
0.35
0.4
2001 2002 2003 2004
1st Qtr
2nd Qtr
3rd Qtr
4th Qtr

Person 3 – Jim
Self-employed Photographer Work is very seasonal A few steady client Income comes in spurts depending on the
season Earning Per Share (EPS) = $1

Jim’s EPS
0
0.05
0.1
0.15
0.2
0.25
0.3
0.35
0.4
2001 2002 2003 2004
1st Qtr
2nd Qtr
3rd Qtr
4th Qtr

Person 4 – Frank
Has a new idea that he may be able to sell for a fortune.
Has been building up support for his idea for about five years and feels that this is the year it will take off.
Because his idea has not sold yet, he does not have any earning, and has actually been losing money. EPS = NMF (No Meaningful Figure)

Frank’s EPS
-0.45-0.4
-0.35-0.3
-0.25-0.2
-0.15-0.1
-0.050
2001 2002 2003 2004
1st Qtr
2nd Qtr
3rd Qtr
4th Qtr

Person 5 – Joe
Entrepreneur Involved in several projects including buying
selling houses and renting commercial property
His Earning Per Share for the past year is $0.70.

Joe’s EPS
-0.15
-0.1
-0.05
0
0.05
0.1
0.15
0.2
0.25
2001 2002 2003 2004
1st Qtr
2nd Qtr
3rd Qtr
4th Qtr

How much are you willing to pay for your share?
Shares of stock are sold through an auction on the stock exchanges, much like things are bought and sold on e-Bay.
Any shares you buy require that someone else be willing to sell at your price.
Other buyers are bidding against you based on what they think a share is worth.

How much are you willing to pay for your share?
Why should you pay more for a stock than it earns per share?
Would you pay me a $1 if I agreed to pay you a $1 each year for the rest of your life.
Would you pay me more than a $1 for that steady stream of income?

PE Ratio(Price/Earnings Per Share)
How do you determine what you are willing to pay for a share of stock?
While the market determines the going price, buyers do not always agree on what the right price is.
The price that a stock is selling at divided by its EPS is its PE Ratio.

How much should you pay for a share of our fictitious people?
Lew – EPS $1 Steve – EPS $1 Jim – EPS $1 Frank – EPS NMF Joe – EPS $0.7
Remember that you are buying into their future earnings stream.
How do we determine what their futures will hold?
Past performance may be an indication of future performance.
What is the news about the person.

Evaluating Past Performance
0
0.05
0.1
0.15
0.2
0.25
2001 2002 2003 2004
Lew
1st Qtr
2nd Qtr
3rd Qtr
4th Qtr
0
0.1
0.2
0.3
0.4
2001 2002 2003 2004
Steve
1st Qtr
2nd Qtr
3rd Qtr
4th Qtr
0
0.1
0.2
0.3
0.4
2001 2002 2003 2004
Jim
1st Qtr
2nd Qtr
3rd Qtr
4th Qtr
-0.5
-0.4
-0.3
-0.2
-0.1
0
2001 2002 2003 2004
Frank
1st Qtr
2nd Qtr
3rd Qtr
4th Qtr

Evaluating Past Performance
-0.2
-0.1
0
0.1
0.2
0.3
2001 2002 2003 2004
Joe
1st Qtr
2nd Qtr
3rd Qtr
4th Qtr

Evaluating Past PerformanceLew
0
0.05
0.1
0.15
0.2
0.25
2001 2002 2003 2004
Lew
1st Qtr
2nd Qtr
3rd Qtr
4th Qtr
Steady Income Little to no change over time Very predictable

Evaluating Past PerformanceSteve
Steady Income Little to no change over time Not very predictable
0
0.1
0.2
0.3
0.4
2001 2002 2003 2004
Steve
1st Qtr
2nd Qtr
3rd Qtr
4th Qtr

Evaluating Past PerformanceJim
Steady Income Little to no change over time Each quarter is very different, but year-ago quarters
are very predictable.
0
0.1
0.2
0.3
0.4
2001 2002 2003 2004
Jim
1st Qtr
2nd Qtr
3rd Qtr
4th Qtr

Evaluating Past PerformanceFrank
No Income Lots of change, but no pattern All hope is placed on the promises of the future,
because the past doesn’t show us anything positive.
-0.5
-0.4
-0.3
-0.2
-0.1
0
2001 2002 2003 2004
Frank
1st Qtr
2nd Qtr
3rd Qtr
4th Qtr

Evaluating Past PerformanceJoe
EPS less than first three options ($0.70) Lots of change. Recent past is better than more distant past. What might EPS be next year?
-0.2
-0.1
0
0.1
0.2
0.3
2001 2002 2003 2004
Joe
1st Qtr
2nd Qtr
3rd Qtr
4th Qtr

Evaluating Future Performance
Cannot know the future Based on what is planned for the future and
your best guess on what might actually happen
Very limited information News, Rumors, Gut Feeling

Evaluating Future PerformanceScenarios
Rumor has it that Lew’s Roth IRA’s investments are about to go through the roof.
Steve has issued a statement that his book is almost complete and he has a publisher.
Steve hires Micah to do more work.
0
0.05
0.1
0.15
0.2
0.25
2001 2002 2003 2004
Lew
1st Qtr
2nd Qtr
3rd Qtr
4th Qtr
0
0.1
0.2
0.3
0.4
2001 2002 2003 2004
Steve
1st Qtr
2nd Qtr
3rd Qtr
4th Qtr

Evaluating Future PerformanceScenarios
Jim was overheard at the ball fields saying that he was tired of dealing with coaches.
Frank has just taken out a home-equity loan on his own home to pay for marketing of his product.
0
0.1
0.2
0.3
0.4
2001 2002 2003 2004
Jim
1st Qtr
2nd Qtr
3rd Qtr
4th Qtr
-0.5
-0.4
-0.3
-0.2
-0.1
0
2001 2002 2003 2004
Frank
1st Qtr
2nd Qtr
3rd Qtr
4th Qtr

Evaluating Future PerformanceScenarios
Interest rates are rising. The news has a
headline about the “real-estate bubble”.
Joe bid on a big piece of property, but did not get it.
-0.2
-0.1
0
0.1
0.2
0.3
2001 2002 2003 2004
Joe
1st Qtr
2nd Qtr
3rd Qtr
4th Qtr

Projecting Future Growth
I would be willing to pay more for a company this year if I felt that my yearly payment would go up each year.
Because of this, just comparing PE ratios may not make sense.
As a company’s earning grow, so does the value of my investment.

Projecting Future Growth
• By dividing the PE Ratio by the Growth Rate, I have a way of comparing companies with different growth prospects. (PEG Ratio)
• A PEG Ratio of between 1 and 2 is generally considered good.
• A PEG Ratio of less than 1 leaves you wondering why no one wants the stock
• A PEG Ratio of more than 2 may mean that the stock is selling for too much.
Related Documents