NREL is a national laboratory of the U.S. Department of Energy Office of Energy Efficiency & Renewable Energy Operated by the Alliance for Sustainable Energy, LLC This report is available at no cost from the National Renewable Energy Laboratory (NREL) at www.nrel.gov/publications. Contract No. DE-AC36-08GO28308 Technical Report NREL/TP-7A40-74412 May 2020 The Evolving U.S. Distribution System: Technologies, Architectures, and Regulations for Realizing a Transactive Energy Marketplace Travis Lowder and Kaifeng Xu National Renewable Energy Laboratory

Welcome message from author
This document is posted to help you gain knowledge. Please leave a comment to let me know what you think about it! Share it to your friends and learn new things together.
Transcript
NREL is a national laboratory of the U.S. Department of Energy Office of Energy Efficiency & Renewable Energy Operated by the Alliance for Sustainable Energy, LLC This report is available at no cost from the National Renewable Energy Laboratory (NREL) at www.nrel.gov/publications.
Contract No. DE-AC36-08GO28308
Technical Report NREL/TP-7A40-74412 May 2020
The Evolving U.S. Distribution System: Technologies, Architectures, and Regulations for Realizing a Transactive Energy Marketplace
Travis Lowder and Kaifeng Xu
National Renewable Energy Laboratory
NREL is a national laboratory of the U.S. Department of Energy Office of Energy Efficiency & Renewable Energy Operated by the Alliance for Sustainable Energy, LLC This report is available at no cost from the National Renewable Energy Laboratory (NREL) at www.nrel.gov/publications.
Contract No. DE-AC36-08GO28308
National Renewable Energy Laboratory 15013 Denver West Parkway Golden, CO 80401 303-275-3000 • www.nrel.gov
Technical Report NREL/TP-7A40-74412 May 2020
The Evolving U.S. Distribution System: Technologies, Architectures, and Regulations for Realizing a Transactive Energy Marketplace
Travis Lowder and Kaifeng Xu
National Renewable Energy Laboratory
Suggested Citation Lowder, Travis, and Kaifeng Xu. 2020. The Evolving U.S. Distribution System: Technologies, Architectures, and Regulations for Realizing a Transactive Energy Marketplace. Golden, CO: National Renewable Energy Laboratory. NREL/TP-7A40-74412. https://www.nrel.gov/docs/fy20osti/74412.pdf.
NOTICE
This work was authored by the National Renewable Energy Laboratory, operated by Alliance for Sustainable Energy, LLC, for the U.S. Department of Energy (DOE) under Contract No. DE-AC36-08GO28308. Funding provided by the Children's Investment Fund Foundation. The views expressed herein do not necessarily represent the views of the DOE or the U.S. Government.
This report is available at no cost from the National Renewable Energy Laboratory (NREL) at www.nrel.gov/publications.
U.S. Department of Energy (DOE) reports produced after 1991 and a growing number of pre-1991 documents are available free via www.OSTI.gov.
Cover Photos by Dennis Schroeder: (clockwise, left to right) NREL 51934, NREL 45897, NREL 42160, NREL 45891, NREL 48097, NREL 46526.
NREL prints on paper that contains recycled content.
iii This report is available at no cost from the National Renewable Energy Laboratory at www.nrel.gov/publications.
Acknowledgments The authors would like to thank our external peer reviewers for their time and contributions to improving this report, and our NREL colleagues Kristen Ardani, Dylan Cutler, Jennifer Daw, Francisco Flores-Espino, Jeffrey Logan, and Adam Warren for their reviews as well. Special thanks to Thorsten Lenck and Shuwei Zhang of Agora Energiewende for their contributions to the section on Next Kraftwerke. Lastly, we would like to express our gratitude to the NREL Communications Team for all their support in bringing this and many other publications into the public domain. This work was supported by the Children’s Investment Fund Foundation.
iv This report is available at no cost from the National Renewable Energy Laboratory at www.nrel.gov/publications.
List of Acronyms CAISO California Independent System Operator DER distributed energy resource DERMS distributed energy resource management system DR demand response DSO distribution system operator DSP distributed system platform EAM earnings adjustment mechanism ERCOT Electric Reliability Council of Texas FERC Federal Energy Regulatory Commission GWAC GridWise Architecture Council IOU investor owned utility ISO independent system operator ISO-NE New England Independent System Operator LDA local distribution area NYISO New York Independent System Operator P2P peer-to-peer PSR platform service revenues REV Reforming the Energy Vision RTO regional transmission operator TD transmission/distribution TE transactive energy TSO transmission system operator VPP virtual power plant
v This report is available at no cost from the National Renewable Energy Laboratory at www.nrel.gov/publications.
Table of Contents 1 Introduction .......................................................................................................................................................... 1
1.1 Power System Transformation at the Distribution System Level ................................................................. 1 1.2 Report Overview .......................................................................................................................................... 3
2 Foundational Concepts ........................................................................................................................................ 4 2.1 Transactive Energy ....................................................................................................................................... 4 2.2 DERs ............................................................................................................................................................ 5 2.3 The U.S. Power System and Its Operators ................................................................................................... 9
3 Past: The 20th Century Distribution Grid ........................................................................................................ 12 3.1 The Advent of the Regulated Monopoly and Deregulation ........................................................................ 12
3.1.1 Deregulation ................................................................................................................................. 13 3.2 The DER Challenge and Ratemaking Evolution ........................................................................................ 14
3.2.1 Ratemaking and DER Valuation .................................................................................................. 15 4 Present: The Inception of a 21st Century Distribution Grid ........................................................................... 17
4.1 The Distribution System Evolution Framework ......................................................................................... 17 4.2 Distribution System Planning ..................................................................................................................... 19 4.3 Storage Participation in Wholesale Markets ............................................................................................... 20 4.4 DER Aggregation and Virtual Power Plants .............................................................................................. 22
4.4.1 United States: Pacific Gas and Electric’s DERMS Demonstration Project.................................. 22 4.4.2 Germany: Next Kraftwerke’s Virtual Power Plant Business Model ............................................ 26
5 Future: Visions of the 21st Century Distribution Grid .................................................................................... 28 5.1 The Centralized Versus Decentralized Grid Architecture Model ............................................................... 28 5.2 Decentralized Distributed Markets and Market Roles ................................................................................ 31
5.2.1 Markets......................................................................................................................................... 31 5.2.2 Roles ............................................................................................................................................ 34
Conclusion: The Elusive Economic Case for TE .................................................................................................... 43 References .................................................................................................................................................................. 44
vi This report is available at no cost from the National Renewable Energy Laboratory at www.nrel.gov/publications.
List of Figures Figure 1. Centralized power system of today and the decentralized network model of tomorrow ............... 2 Figure 2. Stages of distribution system ....................................................................................................... 18 Figure 3. PG&E ask-bid-commit process ................................................................................................... 24 Figure 4. Operational market time horizons and needs............................................................................... 31 Figure 5. TE ecosystem at the wholesale and distributed levels ................................................................. 33 Figure 6. Schematic of P2P energy transaction .......................................................................................... 39
List of Tables Table 1. Smart Inverter Functions................................................................................................................. 7 Table 2. Potential DER Services and Values ................................................................................................ 9 Table 3. U.S. Power System Operators ....................................................................................................... 10 Table 4. Use Cases and Key Outcomes of PG&E's DERMS Demonstration Pilot .................................... 25 Table 5. Comparison Between Centralized and Decentralized Models of Distribution System Market
Design .................................................................................................................................... 30 Table 6. Blockchain Consensus Protocol Type .......................................................................................... 41
1 This report is available at no cost from the National Renewable Energy Laboratory at www.nrel.gov/publications.
1 Introduction 1.1 Power System Transformation at the Distribution System Level A host of well-documented trends—technological, institutional, environmental, and social—are driving power system transformation worldwide.1 At the distribution level, transformation is being driven in large part by increasing levels of distributed energy resource (DER) penetration and the associated disruptions these technologies can impart to traditional distribution system operations. The ability of end-use customers to both consume and produce energy (i.e., “prosuming”); the challenges associated with balancing a system containing multiple decentralized devices into which the utility has little visibility and over which it has no control; the growing grid-interactivity of the demand side of the system; and other factors are all redefining the electric utility business and the regulatory compact that governs it. The shape of that paradigm shift, the implications for incumbents, and the opportunities for new market entrants and technologies are not fully understood at present, nor are they playing out uniformly in all jurisdictions.
This report takes as its focus one of the several vanguards of change that could unfold on the United States power system: the development of distribution-level transactive energy marketplaces.
Across developed economies, power systems have generally been built to be load-following where supply is dictated by demand. Electricity generation on these systems must equal the level of end-use consumption downstream (which was variable but predictable) at any given time, or the entire system can fall out of phase one portion at a time, leading to brownouts or rolling blackouts. Because supply must continuously match demand, the system has been traditionally operated through periodic dispatches of generator assets and through automated closed-loop controls to balance generation with load. This approach typically accomplished reliable operation of the grid, a key regulatory requirement of power systems in many developed economies (GridWise 2015).
Reliability—along with safety and public interest—has been one of the key tenets of utility regulation since the electric power industry took on its modern form in the early 20th century (Lazar 2016). Today, there are additional considerations entering into the regulatory scope, such as sustainability, equity, and customer empowerment (GridWise 2015). And, with the worldwide push to incorporate more renewable energy into power systems comes the attendant challenge to incorporate generation assets—namely wind and solar to date—that, until recently, were not in the traditional playbook for operating the grid.
The power system of the 20th century was unidirectional and centralized with a passive consumer base. The 21st century system, with increasingly higher penetrations of variable resources on both the transmission and distribution systems, can be multidirectional and decentralized with a more active, participatory customer base. In this new iteration of the grid, generation and consumption can occur dynamically at the level of a single distribution feeder, and generation
1 See, for example, IEA (2019), Zinaman et al. (2015), and IRENA (2014).
2 This report is available at no cost from the National Renewable Energy Laboratory at www.nrel.gov/publications.
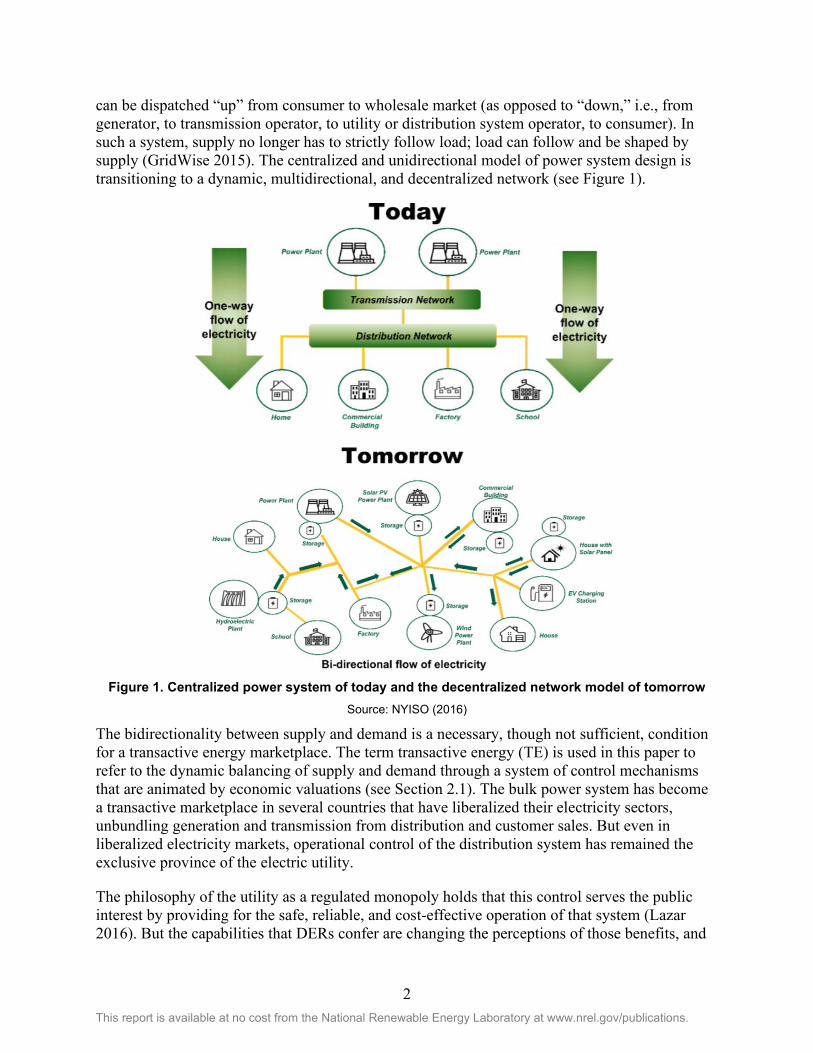
can be dispatched “up” from consumer to wholesale market (as opposed to “down,” i.e., from generator, to transmission operator, to utility or distribution system operator, to consumer). In such a system, supply no longer has to strictly follow load; load can follow and be shaped by supply (GridWise 2015). The centralized and unidirectional model of power system design is transitioning to a dynamic, multidirectional, and decentralized network (see Figure 1).
Figure 1. Centralized power system of today and the decentralized network model of tomorrow
Source: NYISO (2016)
The bidirectionality between supply and demand is a necessary, though not sufficient, condition for a transactive energy marketplace. The term transactive energy (TE) is used in this paper to refer to the dynamic balancing of supply and demand through a system of control mechanisms that are animated by economic valuations (see Section 2.1). The bulk power system has become a transactive marketplace in several countries that have liberalized their electricity sectors, unbundling generation and transmission from distribution and customer sales. But even in liberalized electricity markets, operational control of the distribution system has remained the exclusive province of the electric utility.
The philosophy of the utility as a regulated monopoly holds that this control serves the public interest by providing for the safe, reliable, and cost-effective operation of that system (Lazar 2016). But the capabilities that DERs confer are changing the perceptions of those benefits, and
3 This report is available at no cost from the National Renewable Energy Laboratory at www.nrel.gov/publications.
the resultant need for operational flexibility has created the need in turn for a new system of managing the distribution system. A distributed marketplace, in the vein of today’s wholesale markets, could provide one solution to this challenge.
1.2 Report Overview This report traces the evolution of the distribution system in the United States from the beginning of regulated monopoly designations in the early 20th century, through the rapidly modernizing grid of today, and looks forward to the potential pathways toward a TE future. It charts this evolution through the changes unfolding in three select focus areas: technology, regulation, and the utility business model.
Section 2 begins the body of the report with a discussion of key concepts to understanding the discussion to follow, including TE, DERs, and a breakdown of the electricity system operator. Section 3 of the report begins a chronological examination of the evolution of the U.S. distribution system, starting with an overview of the past century as a baseline to measure the scope of changes happening today. Section 4 discusses the present through select trends that exemplify how DERs and a reshaping the regulatory paradigm are driving fundamental changes to the utility business model and grid operations in some localities. Section 5 explores potential architectures for a transactive distribution system based on the writings of thought leaders, researchers, scholars, and industry experts.
This report is intended to provide actionable insights that enable distribution-level system transformation globally. It comprises a synthesis of the existing literature and practices that define the state of play in TE and DER integration in the United States. As such, the report does not discuss any particular topic in detail; its organizing principle is comprehensiveness, not in-depth analysis. Readers are encouraged to refer to the bibliography for resources that provide more technical material on any of the topics presented herein.
4 This report is available at no cost from the National Renewable Energy Laboratory at www.nrel.gov/publications.
2 Foundational Concepts 2.1 Transactive Energy This report will rely most heavily on the definition of TE proffered by the Gridwise Architecture Council (GWAC), a consortium that bears much of the credit for pioneering the concept. The GWAC is a technical working group of industry professionals that was assembled by the U.S. Department of Energy to conceptualize, enable, and promote interoperability2 among many different DER assets and owners on the distribution system. GWAC defines TE as: “a system of economic and control mechanisms that allows the dynamic balance of supply and demand across the entire electrical infrastructure using value as a key operational parameter” (GWAC 2018). The National Association of Regulatory Utility State Commissioners (NARUC) adds to this that TE represents a “technical architecture” that facilitates an “economic dispatch system” for DERs (Thomas 2018).
Conceptually, TE envisions an economic framework for trading DER-derived grid services that is enabled by control systems and effective communications technologies. Dynamic valuation of DERs will require more data paths, connection points, and control points than can be accommodated by the human-supervised and hierarchical supervisory, control, and data acquisition systems that are presently used to operate electric grids. TE requires advanced software asset management programs, effective communications standards and protocols, and digital transactional platforms for settling payments. Emerging technologies such as distributed energy resource management systems (DERMS) and blockchain-based protocols—which can electronically coordinate networks of DER devices and deliver real-time communications for bidding, settling, and payment—show promise in delivering the required capabilities to optimize DER output while also maintaining reliability.
The complex engineering and dynamic operation of broad-based TE systems is beyond today’s capabilities, though there are several limited pilots (see, for example, Thomas et al. 2019). Complexity notwithstanding, one of the major benefits of TE as envisioned by GWAC and others is that it could potentially allow for a more granular economic valuation of DER services than an administratively set pricing scheme such as net metering or feed-in tariffs can achieve.
At the same time, efficient operation of a TE marketplace could minimize the associated challenges of high DER penetrations, such as power quality fluctuations, and reverse power flow. It may also facilitate the incorporation of variable renewables and electric vehicle charging across the system. Today, DERs are largely located behind-the-meter—the point at which the utility’s infrastructure meets the customer’s private property—and serve customers’ on-site energy needs. As such, utilities have little control over and situational awareness of the operation of these devices. TE, as conceptualized by thought leaders, could provide an enabling
2 GWAC makes an important distinction when defining interoperability: One key attribute worth mentioning in more detail is interoperability, if only because it is often misunderstood. In general terms, interoperability provides a measurable mechanism for disparate devices, subsystems, and systems to work together. GWAC defines interoperability as the capability of two or more networks, systems, devices, applications, or components to exchange information between them and use the information so exchanged. It is not simply about systems being able to exchange information but being able to use it effectively to enable them to operate effectively together.
5 This report is available at no cost from the National Renewable Energy Laboratory at www.nrel.gov/publications.
environment where utilities can leverage devices to manage the distribution system, and where DER hosts can be rewarded for the services they provide. Customer participation is incentivized by price signals, and those price signals are produced and delivered by the interaction of supply and demand at work in the marketplace. Utilities or distribution system operators (DSOs) would optimize the distribution system, just as wholesale market operators optimize the transmission system to solicit bids from generators that communicate the true value of the service provided. This is the TE vision.
TE is one proposed solution for some of the challenges that DERs present to the distribution system. Although utilities have little visibility of and control over the operation of these devices, they do have to deal with their effects when there are high penetrations on a single feeder or on a feeder network downstream of a substation. Such effects include high amounts of energy backflow (DERs exporting excess power back into the grid) during daytime hours, when distributed solar assets are generating at their peak. This can itself create voltage violations and threaten utility equipment such as transformers. Or, at the bulk power level, if a significant portion of the distribution system is self-consuming power during the day but requires power from the grid later in the day, the resulting evening peak ramp can stress the generation infrastructure.
Other proposed solutions to address these challenges have involved changing utility rate structures3 or creating programs to incentivize self-consumption over exporting energy to the distribution system.4 The promise of TE is that it provides a mechanism to activate DERs such that they actually provide local grid services instead of merely imposing operational challenges on the utility.
It should be noted that TE requires robust cybersecurity measures to ensure the system can operate without external incursion that could compromise its goals or the safety of individual actors; however, cybersecurity is not within the scope of this report, and will therefore not be discussed beyond the mention that it is a critical component of a TE marketplace. For further reading on this issue, readers are encouraged to consult de Carvalho and Saleem (2019).
2.2 DERs This report uses NARUC’s general definition for a DER from its 2016 report Distributed Energy Resources Rate Design and Compensation:
A DER is a resource sited close to customers that can provide all or some of their immediate electric and power needs and can also be used by the system to either reduce demand (such as energy efficiency) or provide supply to satisfy the energy, capacity, or ancillary service needs of the distribution grid. The resources, if providing electricity or thermal energy, are small in scale, connected to the distribution system, and close to load. (NARUC 2016)
3 See, for example, California’s implementation of residential time-of-use rates and its shifting of peak periods to later in the evening to incentivize reduced usage during the evening demand ramp (i.e., the “duck curve”) (Ramdas et al. 2019). 4 See, for example, Hawaiian Electric’s Customer Self-Supply tariff (Hawaiian Electric 2019).
6 This report is available at no cost from the National Renewable Energy Laboratory at www.nrel.gov/publications.
While a number of technologies could be considered to belong to the DER family, this report contemplates the following list as comprising the primary subset under discussion:
• Solar photovoltaics (PV) • Battery storage • Load flexibility (e.g., demand response [DR], load modification from energy
management systems and other devices) • Energy efficiency.
Other technologies, such as combined heat and power generators, electric vehicles, microgrids (i.e., collections of DERs operating in parallel with the grid but capable of disconnecting from it), distributed wind, and so on, can also be considered DERs by definition, but are less of a consideration in this report.
Of the list of technologies above, the two at the top of the list—solar PV and storage—have achieved particular prominence in the context of the evolving distribution system. Distributed solar PV has, from 2011 – 2018, achieved a growth rate of 39.0% and is now an operational consideration on distribution feeders in several U.S. states, such as California and New York (BNEF 2019). Battery storage, particularly lithium-ion chemistries, has achieved a growth rate of 97.0% from 2013 – 2019, and is becoming an important tool for managing some of the challenges associated with solar PV (e.g., variable output, grid export) (Wood Mackenzie 2019). Batteries can render solar PV dispatchable over modest time frames, which is critical for participation in a TE marketplace.
Inverters, the devices used to switch direct current to alternating current so PV- and battery-supplied electricity can be exported to the grid, also play a critical role. While not necessarily DERs themselves, they can outfit DC-generating DERs with the many of the capabilities required to provide grid services and to participate in TE marketplaces. As a computer tied to a generation device, inverters can be used for multiple functions and can be the point of communications with a DERMS network. Table 1 provides a categorization of smart inverter functions.
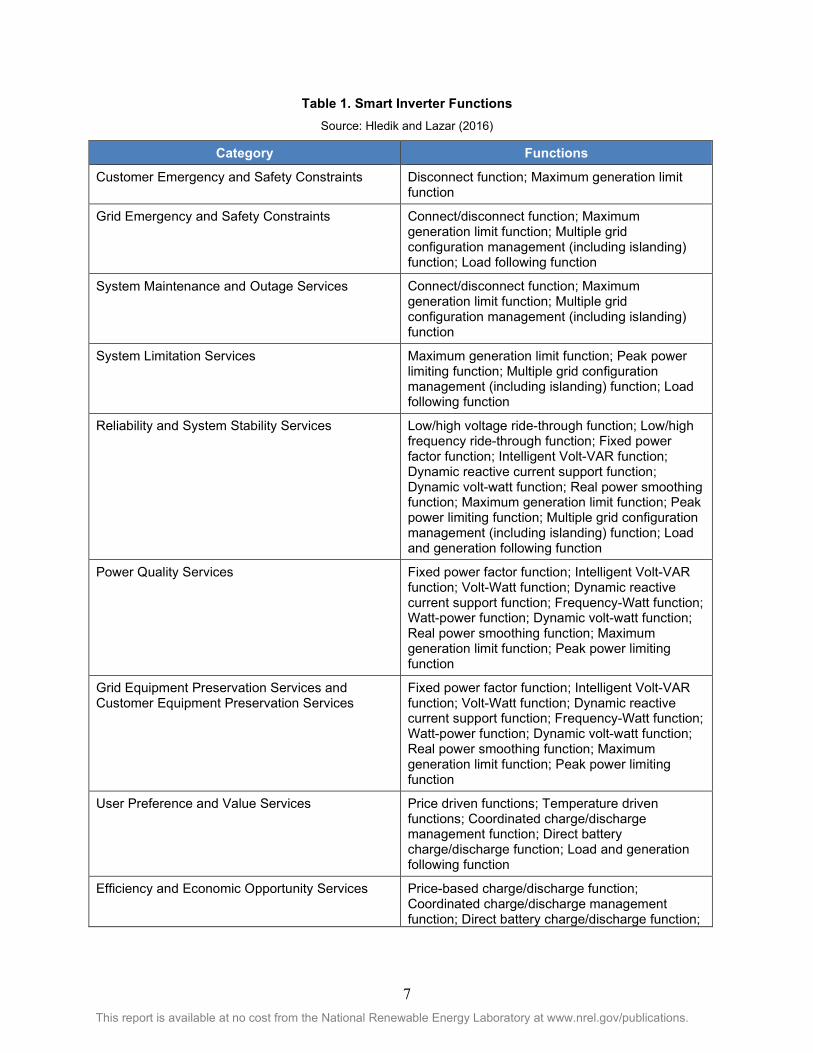
7 This report is available at no cost from the National Renewable Energy Laboratory at www.nrel.gov/publications.
Table 1. Smart Inverter Functions Source: Hledik and Lazar (2016)
Category Functions
Customer Emergency and Safety Constraints Disconnect function; Maximum generation limit function
Grid Emergency and Safety Constraints Connect/disconnect function; Maximum generation limit function; Multiple grid configuration management (including islanding) function; Load following function
System Maintenance and Outage Services Connect/disconnect function; Maximum generation limit function; Multiple grid configuration management (including islanding) function
System Limitation Services Maximum generation limit function; Peak power limiting function; Multiple grid configuration management (including islanding) function; Load following function
Reliability and System Stability Services Low/high voltage ride-through function; Low/high frequency ride-through function; Fixed power factor function; Intelligent Volt-VAR function; Dynamic reactive current support function; Dynamic volt-watt function; Real power smoothing function; Maximum generation limit function; Peak power limiting function; Multiple grid configuration management (including islanding) function; Load and generation following function
Power Quality Services Fixed power factor function; Intelligent Volt-VAR function; Volt-Watt function; Dynamic reactive current support function; Frequency-Watt function; Watt-power function; Dynamic volt-watt function; Real power smoothing function; Maximum generation limit function; Peak power limiting function
Grid Equipment Preservation Services and Customer Equipment Preservation Services
Fixed power factor function; Intelligent Volt-VAR function; Volt-Watt function; Dynamic reactive current support function; Frequency-Watt function; Watt-power function; Dynamic volt-watt function; Real power smoothing function; Maximum generation limit function; Peak power limiting function
User Preference and Value Services Price driven functions; Temperature driven functions; Coordinated charge/discharge management function; Direct battery charge/discharge function; Load and generation following function
Efficiency and Economic Opportunity Services Price-based charge/discharge function; Coordinated charge/discharge management function; Direct battery charge/discharge function;
8 This report is available at no cost from the National Renewable Energy Laboratory at www.nrel.gov/publications.
Category Functions Price driven functions; Load and generation following function
Today, DERs generally provide a limited range of services to the grid owing in large part to the technical and institutional barriers that traditional power system operation and regulation can impose. That is, because power systems were not engineered and regulations were not conceived with DERs in mind, the enhanced functionality that these technologies bring to the grid is often impeded by path-dependency. In some cases, the interim policies and regulations that were designed to incentivize DER access (e.g., net metering in the United States or feed-in tariffs in other parts of the world) have created their own path-dependent vectors. These have led to a misalignment of incentives between utilities and DER owners and hosts, which in turn has complicated the work of regulators in attempting to balance the public interest with the safe, reliable, and cost-effective operation of the distribution system.
Regulatory action to address these challenges has manifested variously throughout the United States. In some U.S. states, regulators have approved new rate classes for DER hosts that can discourage particular modes of operation through targeted time-of-use rates, demand charges, standby charges, and other economic signals. Another regulatory tactic has been to catalogue and proffer valuation strategies for the range of services that DERs can indeed provide to the grid, but that are presently not valued (e.g., “value of solar” or “value stacking pricing methodologies”).
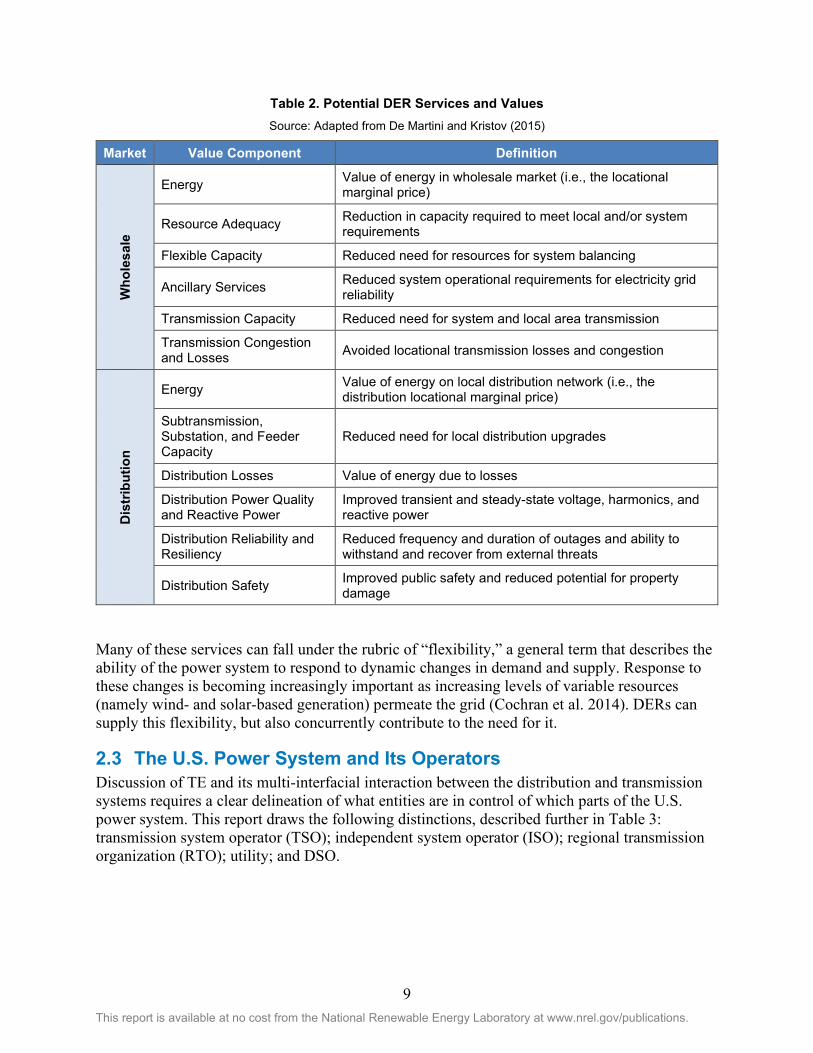
The range of potential services that DERs can provide to distribution and transmission systems is potentially broad but would require some kind of market structure or procurement policies to enable them. Table 2 provides a non-exhaustive list of such potential services.
9 This report is available at no cost from the National Renewable Energy Laboratory at www.nrel.gov/publications.
Table 2. Potential DER Services and Values Source: Adapted from De Martini and Kristov (2015)
Market Value Component Definition
Who
lesa
le
Energy Value of energy in wholesale market (i.e., the locational marginal price)
Resource Adequacy Reduction in capacity required to meet local and/or system requirements
Flexible Capacity Reduced need for resources for system balancing
Ancillary Services Reduced system operational requirements for electricity grid reliability
Transmission Capacity Reduced need for system and local area transmission
Transmission Congestion and Losses Avoided locational transmission losses and congestion
Dis
trib
utio
n
Energy Value of energy on local distribution network (i.e., the distribution locational marginal price)
Subtransmission, Substation, and Feeder Capacity
Reduced need for local distribution upgrades
Distribution Losses Value of energy due to losses
Distribution Power Quality and Reactive Power
Improved transient and steady-state voltage, harmonics, and reactive power
Distribution Reliability and Resiliency
Reduced frequency and duration of outages and ability to withstand and recover from external threats
Distribution Safety Improved public safety and reduced potential for property damage
Many of these services can fall under the rubric of “flexibility,” a general term that describes the ability of the power system to respond to dynamic changes in demand and supply. Response to these changes is becoming increasingly important as increasing levels of variable resources (namely wind- and solar-based generation) permeate the grid (Cochran et al. 2014). DERs can supply this flexibility, but also concurrently contribute to the need for it.
2.3 The U.S. Power System and Its Operators Discussion of TE and its multi-interfacial interaction between the distribution and transmission systems requires a clear delineation of what entities are in control of which parts of the U.S. power system. This report draws the following distinctions, described further in Table 3: transmission system operator (TSO); independent system operator (ISO); regional transmission organization (RTO); utility; and DSO.
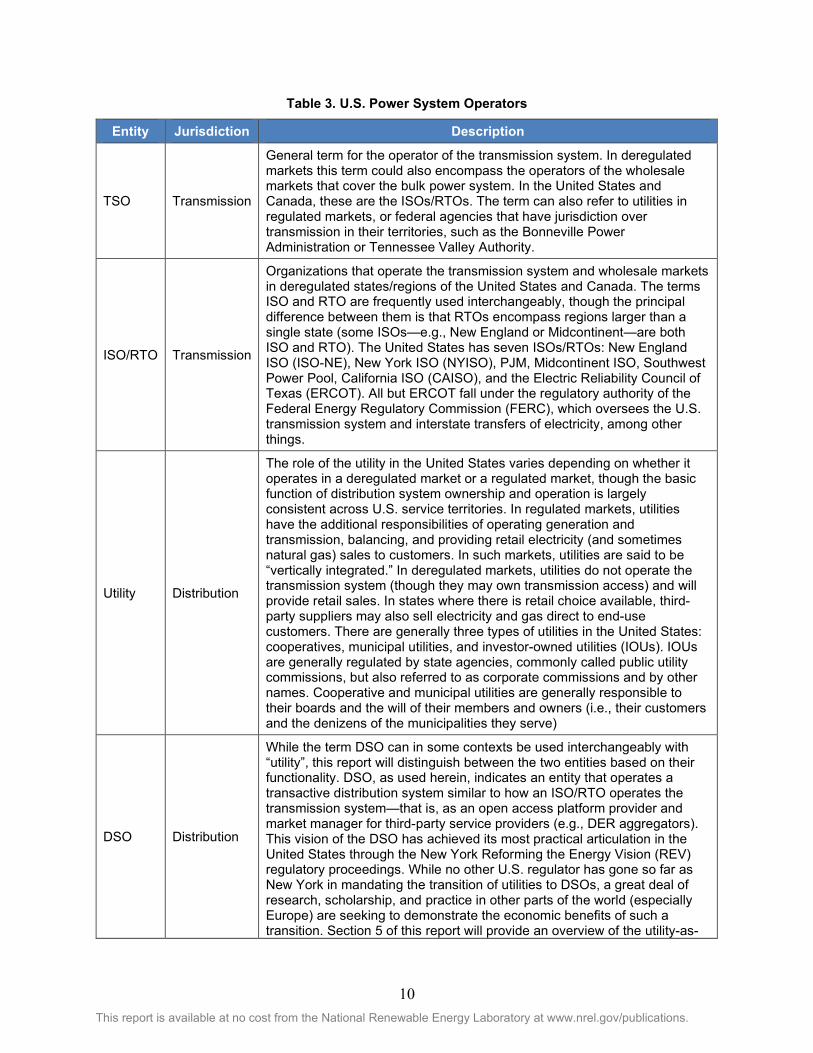
10 This report is available at no cost from the National Renewable Energy Laboratory at www.nrel.gov/publications.
Table 3. U.S. Power System Operators
Entity Jurisdiction Description
TSO Transmission
General term for the operator of the transmission system. In deregulated markets this term could also encompass the operators of the wholesale markets that cover the bulk power system. In the United States and Canada, these are the ISOs/RTOs. The term can also refer to utilities in regulated markets, or federal agencies that have jurisdiction over transmission in their territories, such as the Bonneville Power Administration or Tennessee Valley Authority.
ISO/RTO Transmission
Organizations that operate the transmission system and wholesale markets in deregulated states/regions of the United States and Canada. The terms ISO and RTO are frequently used interchangeably, though the principal difference between them is that RTOs encompass regions larger than a single state (some ISOs—e.g., New England or Midcontinent—are both ISO and RTO). The United States has seven ISOs/RTOs: New England ISO (ISO-NE), New York ISO (NYISO), PJM, Midcontinent ISO, Southwest Power Pool, California ISO (CAISO), and the Electric Reliability Council of Texas (ERCOT). All but ERCOT fall under the regulatory authority of the Federal Energy Regulatory Commission (FERC), which oversees the U.S. transmission system and interstate transfers of electricity, among other things.
Utility Distribution
The role of the utility in the United States varies depending on whether it operates in a deregulated market or a regulated market, though the basic function of distribution system ownership and operation is largely consistent across U.S. service territories. In regulated markets, utilities have the additional responsibilities of operating generation and transmission, balancing, and providing retail electricity (and sometimes natural gas) sales to customers. In such markets, utilities are said to be “vertically integrated.” In deregulated markets, utilities do not operate the transmission system (though they may own transmission access) and will provide retail sales. In states where there is retail choice available, third-party suppliers may also sell electricity and gas direct to end-use customers. There are generally three types of utilities in the United States: cooperatives, municipal utilities, and investor-owned utilities (IOUs). IOUs are generally regulated by state agencies, commonly called public utility commissions, but also referred to as corporate commissions and by other names. Cooperative and municipal utilities are generally responsible to their boards and the will of their members and owners (i.e., their customers and the denizens of the municipalities they serve)
DSO Distribution
While the term DSO can in some contexts be used interchangeably with “utility”, this report will distinguish between the two entities based on their functionality. DSO, as used herein, indicates an entity that operates a transactive distribution system similar to how an ISO/RTO operates the transmission system—that is, as an open access platform provider and market manager for third-party service providers (e.g., DER aggregators). This vision of the DSO has achieved its most practical articulation in the United States through the New York Reforming the Energy Vision (REV) regulatory proceedings. While no other U.S. regulator has gone so far as New York in mandating the transition of utilities to DSOs, a great deal of research, scholarship, and practice in other parts of the world (especially Europe) are seeking to demonstrate the economic benefits of such a transition. Section 5 of this report will provide an overview of the utility-as-
11 This report is available at no cost from the National Renewable Energy Laboratory at www.nrel.gov/publications.
Entity Jurisdiction Description DSO issue through the lens of this research and the regulatory proceedings currently underway in New York and California.
12 This report is available at no cost from the National Renewable Energy Laboratory at www.nrel.gov/publications.
3 Past: The 20th Century Distribution Grid 3.1 The Advent of the Regulated Monopoly and Deregulation The utility business model in the United States has its roots in the late 1800s when Thomas Edison, Charles Brush, and George Westinghouse—all men who held patents in electric technology—built competing enterprises offering electricity and electrical services to a variety of clients. These enterprises, and a few others that purchased or licensed technologies from the “Big Three,” purchased franchise rights with cities around the country to be the exclusive provider of electrical services within their jurisdiction. These early companies were principally in the business of selling lighting, though as the 20th century dawned, the applications for electricity expanded and the focus moved to supplying power in addition lighting to a rapidly industrializing United States (Philipson and Willis 2006).
From the late 1800s-1920, over a thousand IOUs were incorporated. Most of these companies were originally formed to provide power and lighting to a single city or town; however, a wave of mergers leading up to the 1950s saw these single-franchise5 companies combine with neighboring utilities to form large IOUs serving multiple franchises across large territorial footprints (Philipson and Willis 2003). These companies provided generation, transmission, distribution, and retail sales to an increasingly larger population of customers. Today, these multi-territory IOUs represent only about 10% of U.S. utilities by number but serve over 65% of U.S. customers (Shipley 2018).
At this stage of utility development in the United States, there was general consensus that the utility business model fit the definition of a “natural monopoly.” That is, because of the high costs of building and maintaining electrical infrastructure, economic rationale held that it was more efficient to have a single company build the networks and supply the services than it would be to expose the industry to competition. This consensus had its roots with Thomas Edison’s chief financial strategist, Samuel Insull, who envisioned electric utilities as providing “central station generation” under monopoly provision of electric service. Insull believed that monopoly status was required for utilities to reach economies of scale, and thus provide universal electric service at low cost across customer classes. His blueprint for the electric utility was a major contribution to the development of the industry over the course of the 20th century (Pechman 2016).
As monopolies, utilities could theoretically charge “monopoly prices”—prices that do not accurately reflect the cost of providing service—because they are not subjected to competition. Because of this potential for abuse of market power, and because utilities are regarded as providing essential services (i.e., their business is “affected with the public interest”) states took on the regulation of the IOUs that operate within their borders. Utility regulation provides pricing guidance in the absence of competition, ensuring that prices adequately compensate utilities for their prudent investments while also aligning with the public good (Lazar 2016).
5 Franchise agreements are contracts between a jurisdiction (e.g., city or county) and the utility which allow the utility to have right-of-way access and other benefits
13 This report is available at no cost from the National Renewable Energy Laboratory at www.nrel.gov/publications.
This, in essence, is the regulatory compact, a nonbinding agreement that stipulates the utility will provide safe, reliable, and affordable service to anyone in the service territory who requests it in exchange for regulatory approval of the rates the utility will charge customers to compensate it for “prudently incurred costs” (Shipley 2018). Regulators, because they serve the public interest, ensure rates are “just and reasonable”—that is, sufficient to cover a utility’s cost of service with a reasonable return on investment for shareholders, but no higher. Effectively, IOUs trade their ability to price their own goods and services in exchange for monopoly protections.
This regulated monopoly structure is intended to preserve the advantages that accrue to having a single company build and operate the electrical infrastructure (including generation and transmission) while at the same time protecting ratepayers from the harmful effects of market power. This arrangement persisted for much of the 20th century, until the deregulatory push of the late 1990s saw many of the IOUs around the country divested of their generation and transmission assets, and, in some cases, their exclusive rights to offer retail electric sales within their service territories.
3.1.1 Deregulation Deregulation, or “restructuring,” has its origins in the U.S. Public Utilities Regulatory Policies Act (PURPA) of 1978, through which the United States government required utilities to purchase energy from small power plants at avoided cost rates (Flores-Espino et al. 2016). This law introduced competition in the generation sector, giving rise to third-party independent power producers (IPPs) and contracts for generation services.
In 1996, after years of debates about the economic efficiencies that could be gained if electrical generation were opened up to competition, FERC issued Orders 888 and 889. These orders paved the way for ISOs/RTOs in the United States and required utilities to publish separate rates for electrical services, thereby unbundling generation from transmission (Flores-Espino et al. 2016). It also instructed owners of transmission (i.e., utilities) to create open-access tariffs, effectively allowing any power producer nondiscriminatory access to transmission infrastructure.
In 2000, FERC issued Order 2000, which enshrined the concept of the RTO in the U.S. regulatory code. RTOs (and similarly, ISOs) were envisioned as independent organizations that would provide transmission services and operate a marketplace of generators based on area-wide economic optimization to meet electricity demand, given the constraints of the transmission system and generator asset base (i.e., security constrained economic dispatch) (Flores-Espino et al. 2016). Additionally, a number of independent power producers (IPPs)—essentially third-party owners and operators of generation assets—entered the market on a merchant basis to sell their electricity and ancillary services into the ISO/RTO marketplace (otherwise known as the “wholesale market”).
Not all U.S. states opted for deregulation, and today the country is split among territories where regional ISOs/RTOs operate transmission-level marketplaces and provide balancing services, and those where utilities still maintain control of transmission and, in some cases, generation. Today, ISOs/RTOs serve over half of U.S. states and some two-thirds of electricity consumers (ISO/RTO Council 2019).
14 This report is available at no cost from the National Renewable Energy Laboratory at www.nrel.gov/publications.
3.2 The DER Challenge and Ratemaking Evolution Deregulation was the first major shakeup in the U.S. electric industry since the solidification of the utility business model in the mid-20th century.
The next shakeup came on the heels of deregulation, as customers began investing in distributed solar owing to a confluence of favorable conditions, including: profusion of net metering laws and enabling policies at the state level; tax incentives at the federal level; plummeting technology prices; and innovative business models (e.g., third-party ownership6), among other factors (Lowder et al. 2015).
In some states, solar was achieving penetrations that were starting to compound utility operation of the distribution system. Hawaii was perhaps the first utility service territory to exhibit these operational challenges. High electricity prices and the third-party ownership model were driving customer adoption of distributed solar on an isolated, island grid that had limited options (and no interconnectivity with other grids) to manage the impact. Today, the impact of distributed solar—its variability, its shifting of peak hours, its ability to capture retail rates for exports under legacy net metering laws, and so on—is being felt in other heavy-adopter states such as California.
Before the advent of DERs, the ratemaking process between the utility and its regulator was based on an approach referred to as “cost of service” (Shipley 2018). The cost of service (also called “total revenue requirement”) is the total revenue that a utility is authorized to collect through its rates allowing it to pay down “prudent” investments while also earning a “reasonable” rate of return for shareholders (i.e., the investors in the phrase “investor-owned utility”).
The authorized utility revenue includes two parts: capital expenses (cap-ex) and operating expenses (op-ex). Cap-ex refers to investments in physical assets, such as infrastructure and equipment (e.g., power plants, transmission lines, buildings, and so on). These physical assets comprise the “rate-base” of the utility. Op-ex refers to regular expenses incurred in operation of the system (e.g., labor, power or fuel purchases, maintenance, and so on). Generally, utilities can receive regulated cost-recovery through customer rates of cap-ex investments. This has led to instances of the so-called “Averch-Johnson” effect, or the capital bias in utility investments. Averch-Johnson states that utilities have incentive to invest heavily in expensive infrastructure—thereby maximizing their capital recovery—regardless of whether the costs are justified or required for service (Shipley 2018).
Third-party owned and demand-sited DERs are not in the utility’s rate-base. Moreover, DERs can impose operational costs that the utility might not otherwise incur were it to host no DERs on its system (though they can provide offsetting benefits simultaneously, as discussed). For these reasons and others, utilities can regard DERs as a source of revenue erosion and cost-
6 Third-party ownership is a form of contracting in the DER (particularly solar) space whereby a third party maintains ownership of the energy asset and charges the host a rate—typically a flat lease or a charge per $/kWh of energy generated—for the benefits derived from that asset.
15 This report is available at no cost from the National Renewable Energy Laboratory at www.nrel.gov/publications.
shifting (i.e., non-DER customers wind up paying more to maintain the distribution system than DER customers—this phenomenon is also called “cross-subsidization”) (NARUC 2016).
3.2.1 Ratemaking and DER Valuation The proliferation of DERs in certain U.S. jurisdictions during the early 2010s flouted traditional ratemaking models. Aided by administratively set export valuations (net metering), DERs were providing only one service—utility purchase offset—and, according to some utilities, were receiving more compensation and evading more costs than the value of such a service (in a system benefit context). It was during this time that utilities and their regulators began seeking more effective means to accommodate these new assets on the distribution system, both by unlocking additional value and imposing fair charges to accurately reflect the services provided and costs imposed.
In 2016, NARUC—the trade association representing utility regulators in the United States—published a document overviewing the challenge of DER regulation. The document outlines potential pathways for regulators to consider in the prevention of revenue erosion and in capturing the true cost of DERs to the distribution system. Such pathways include:
• Demand Charges: Charging customers for their highest incidence of demand over a 15–30-minute interval of time during a service period (typically a month). Historically, demand charges have a feature of commercial and industrial rates, and not residential;
• Fixed Charges and Minimum Bills: Fixed charges are those that cannot be offset by energy exports from DERs. Minimum bills are some baseline of charges that—even if a customer zeroes out their energy bill under a net metering tariff—customers will always have to pay no matter what their DERs generate. Both fixed charges and minimum bills do not contain the rate components (e.g., volumetric charges per kWh), but are instead flat fees uninfluenced by usage;
• Standby and Backup Charges: Charges associated with allowing the customer to use the distribution grid as a back-up source of power. These charges are typically applied only to net-metered customers; and
• Interconnection Fees: Fees assessed on interconnection requests for DERs designed to approximate the cost of incorporating them on the system (NARUC 2016, Bird et al. 2015).
These are all traditional levers available to utilities, and, as such, they may not be particularly suited to delivering the highest value to both utilities and DER providers alike.
Often in parallel to determining the appropriate means of charging DERs, state regulatory agencies across the United States—regardless of whether the state in question has a robust distributed solar market—have been exploring solar and DER valuation schemes. Many of these are ongoing and under constant review. In the third quarter of 2019, there were 53 actions related to DER compensation policy changes underway or under consideration in 27 states plus the District of Columbia (Proudlove 2019). Many of these proceedings are concerned with how to move beyond net metering, a policy that has been critical to the rise of distributed solar, but one that many utilities and regulators feel does not accurately value energy exports from DER devices onto the grid.
16 This report is available at no cost from the National Renewable Energy Laboratory at www.nrel.gov/publications.
“Value of solar” studies are one such means of determining what grid exports might be worth. Many states have undertaken these at the regulatory level, and some (e.g., Minnesota) have implemented them as tariffs for certain classes of DERs (e.g., Minnesota’s Value of Solar tariff for community solar or New York’s Value of Distributed Energy Resources). Typically, value of solar calculations comprise a buildup of the individual value components that solar energy provides to grid operators. These can include energy and capacity values, as well as environmental (e.g., carbon reduction value) and system benefit values such as peak reduction, congestion relief, and so on (Denholm et al. 2014).
These approaches to DER valuation can be seen as market-influenced measures that attempt to capture benefits that are priced through the machinations of supply and demand (in cases where there is no active trading for the benefit, supply and demand considerations often figure into the calculations); however, they are, on balance, still derived from the administrative actions of regulators, and as such are not true market mechanisms. The next section will discuss how the challenge of DER regulation, compensation, and coordination is being reimagined in some progressive U.S. jurisdictions, and how this process is, in some cases, driving toward a more transactive distribution system to realize dynamic valuation of DERs.
17 This report is available at no cost from the National Renewable Energy Laboratory at www.nrel.gov/publications.
4 Present: The Inception of a 21st Century Distribution Grid
After nearly 10 years of high growth in distributed solar and other DERs in some jurisdictions, the traditional wisdom of regulated monopolies and the hub-and-spoke model of electricity generation and conveyance are under effective review. Consumers are becoming prosumers, end-users of electricity that can also simultaneously produce electricity. This customer empowerment forces utilities to not only reconsider the operation of the distribution grid, but also how to invest in infrastructure and how to derive the revenue necessary to pay down and receive a return on those investments. And regulators are seeking novel solutions to balance the financial health of the utilities while at the same time allowing the public—whose interest they are charged with representing—to access the technologies that can improve economics, bolster customer choice, reduce emissions, and modernize the grid.
Some utilities (e.g., Arizona Public Service) have succeeded in applying traditional ratemaking techniques, such as demand charges and time-of-use rates to DER customers. Others are being led away by their regulators from the traditional utility business model and cost of service ratemaking paradigms. This can be seen, for example, in New York where state IOUs are undergoing a transition to “distribution system platform providers,” or operators of DER marketplaces. These changes are playing out variously across the United States, depending on factors such as the local DER market, utility service territory, regulatory framework, state laws, and others.
The specific methodologies each state is pursuing to manage an evolving distribution system are too manifold to enumerate in this report. This section will instead cover three select trends discernable among these changes that illustrate where the frontlines of transformation are occurring in the policy, regulatory, and utility business model landscapes. These trends are:
1. Distribution system planning 2. Storage participation in wholesale markets 3. DER aggregation.
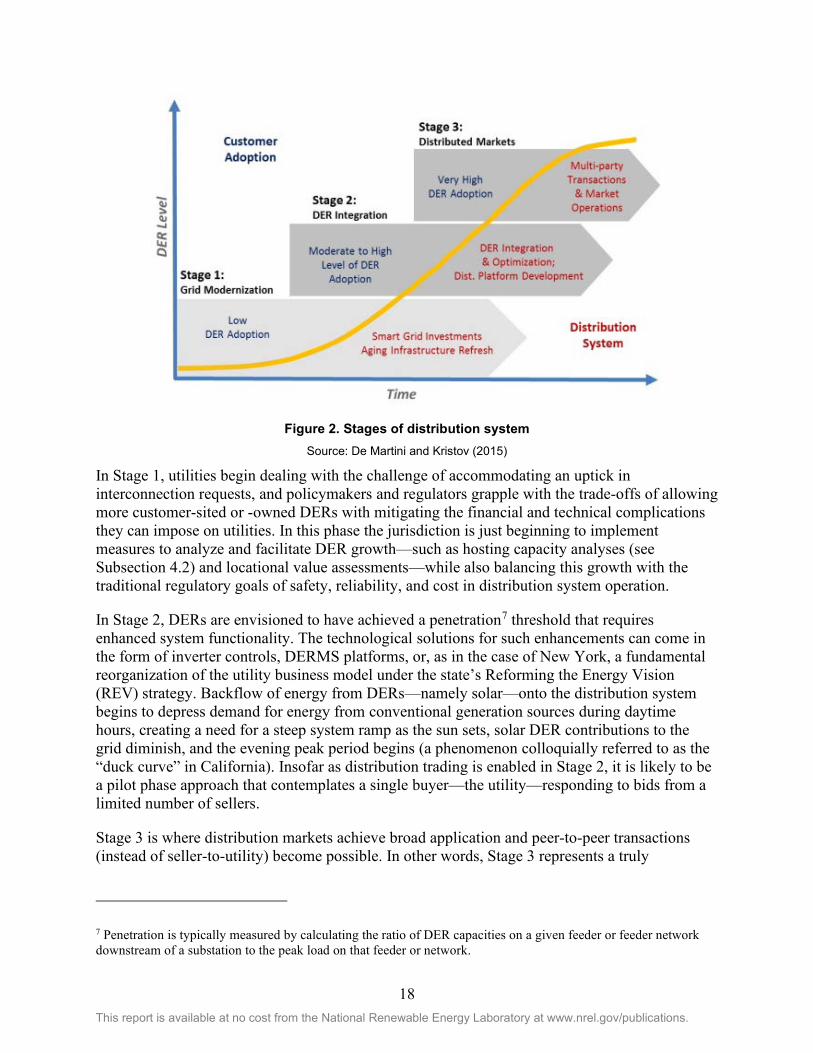
4.1 The Distribution System Evolution Framework In discussing the three trends identified above, this report will make use of a widely cited framework first developed by Paul De Martini and Lorenzo Kristov to conceptualize the transition of the distribution system from its current form to a transactive, high-DER penetration future (De Martini and Kristov 2015). This framework, visualized in Figure 2, envisions a staged process beginning with growing levels of DERs on the distribution system and a lack of technical and regulatory tools to accommodate the impacts, and culminating with a fully realized transactive distribution system.
18 This report is available at no cost from the National Renewable Energy Laboratory at www.nrel.gov/publications.
Figure 2. Stages of distribution system
Source: De Martini and Kristov (2015)
In Stage 1, utilities begin dealing with the challenge of accommodating an uptick in interconnection requests, and policymakers and regulators grapple with the trade-offs of allowing more customer-sited or -owned DERs with mitigating the financial and technical complications they can impose on utilities. In this phase the jurisdiction is just beginning to implement measures to analyze and facilitate DER growth—such as hosting capacity analyses (see Subsection 4.2) and locational value assessments—while also balancing this growth with the traditional regulatory goals of safety, reliability, and cost in distribution system operation.
In Stage 2, DERs are envisioned to have achieved a penetration7 threshold that requires enhanced system functionality. The technological solutions for such enhancements can come in the form of inverter controls, DERMS platforms, or, as in the case of New York, a fundamental reorganization of the utility business model under the state’s Reforming the Energy Vision (REV) strategy. Backflow of energy from DERs—namely solar—onto the distribution system begins to depress demand for energy from conventional generation sources during daytime hours, creating a need for a steep system ramp as the sun sets, solar DER contributions to the grid diminish, and the evening peak period begins (a phenomenon colloquially referred to as the “duck curve” in California). Insofar as distribution trading is enabled in Stage 2, it is likely to be a pilot phase approach that contemplates a single buyer—the utility—responding to bids from a limited number of sellers.
Stage 3 is where distribution markets achieve broad application and peer-to-peer transactions (instead of seller-to-utility) become possible. In other words, Stage 3 represents a truly
7 Penetration is typically measured by calculating the ratio of DER capacities on a given feeder or feeder network downstream of a substation to the peak load on that feeder or network.
19 This report is available at no cost from the National Renewable Energy Laboratory at www.nrel.gov/publications.
transactive marketplace where DER providers can trade with each other, as well as bid into wholesale and distribution markets.
Today, no U.S. state has reached Stage 3, though several pilot programs in utility service territories around the country have explored the technical (and, to the extent possible, economic) implications of the TE marketplaces envisioned in this stage. A small cohort of states could be considered to fall somewhere on the curve of Stage 2, including California, Hawaii, Massachusetts, and New York. The three trends under discussion in this section are all playing out, to varying degrees, within this cohort.
4.2 Distribution System Planning Electricity resource planning as a regulatory process dates back to the 1970s and early 1980s in the United States. It arose from the confluence of several market factors—including slackening demand, generation cost overruns, utility vertical integration, and expanding environmental regulations—that prompted regulators to open the utility decision-making process for investments and procurement to greater regulatory visibility. A decade after its inception, resource planning had become a regulatory fixture in a majority of states. Integrated resource planning (IRP)—evaluating the tradeoffs of different resources for the grid (e.g., meeting load growth with energy efficiency measures vs. investing in new generation and transmission)—was, by this time, also gaining traction (Kahrl et al. 2016).
In general, resource planning was intended to identify long-term investments that the utility (and, after restructuring, generation and transmission owners) would have to make to meet the regulatory objectives of operating a safe, reliable, and least-cost electricity system, and to do so in an open, transparent manner (Kahrl et al. 2016). Resource planning was originally conceived as applying to the bulk power sector, specifically to ensure resource adequacy of generation and system stability/reliability through transmission.
Today, however, as DERs increasingly proliferate on an evolving grid architecture, it is being applied at the distribution level in several states. Some degree of distribution resource planning (e.g., capital improvements plans) has historically been performed as part of the rate case process8 (Cooke et al. 2018); however, distribution resource planning represents something of a novelty in its current form today, that is, as a coherent practice designed to drive grid modernization, DER integration, and the resultant modifications in customer loads.
Distribution planning is one way in which nascent goals such as sustainability, customer choice, modernization, and DER integration are being actualized in the regulatory construct. As of this writing, only a handful of U.S. states have some sort of statutory or commission-directed requirement to file a distribution resource plan. These include not only high-DER penetration states such as California and Hawaii but also a number of states that are anticipating DER future growth such as Minnesota and Nevada (Cooke 2018). Several other states that do not have a distribution resource plan requirement written into their regulations are exploring the issue
8 A regulatory process used by regulated utilities to determine the amounts to charge customers for electricity as allowed by the local governing body.
20 This report is available at no cost from the National Renewable Energy Laboratory at www.nrel.gov/publications.
through open dockets, or are engaged in distribution planning activities without a formal, overarching distribution planning regulatory requirement (Cooke 2018 and Girouard 2019).
While each state that has adopted distribution resource planning has its own iteration of the statutory requirements, common components in these plans include:
• Hosting capacity analyses: Hosting capacity describes the maximum level of DER penetration under which the distribution system can continue to operate safely and reliably. The analysis comprises an evaluation of the distribution system to determine where and how many DERs can be interconnected before power quality or equipment protection issues result (assuming no upgrades). Beyond operational constraints, hosting capacity analyses may also examine how customer adoption of DERs in certain areas of the distribution system could lead to operational efficiencies. These investigations generally require detailed power flow modeling conducted at each node (De Martini and Kristov 2015, and ICF International 2016).
• Methodologies to value DER: DERs can provide locational value to the immediate sections of the distribution system that they serve (e.g., a single feeder or downstream of a single substation). As discussed in earlier sections, distributed PV has in the past been incentivized by administratively-set value assignments such as full-retail net-metering in the United States and feed-in-tariffs in other parts of the world. One key to unlocking the capabilities of DERs and side-stepping inefficiencies in top-down price assignment is to determine the economic value of their services in the locations at which they provide them—either at the sub-feeder level, the feeder-level, or substation-level (DeMartini and Kristov 2015). These values, the calculations for which distribution planning processes seek to standardize, are critical to sending the economic signals to DER buyers and sellers that will animate markets and incentivize installations at the grid injection points where they are most needed and where interconnection is least-cost.
• DER forecasts: Forecasting loads is critical for any grid operator tasked with ensuring the adequate build-out of the power system. At the distribution level and in consideration of DER growth, forecasting involves multiple scenario analyses that measure the impacts of different levels of device penetration on power quality, reliability, infrastructure upgrade needs, and locational value of DER services. This is an exercise in investigating probabilistic (i.e., stochastic) outcomes, meaning what could be possible given customer adoption of DERs across the system given a set of conditions (such as locational values). It is not deterministic, meaning the utility does not maintain control over the outcome to the extent it might in, say, an IRP setting (AEE 2018; NARUC 2016).
Other features of some distribution planning processes include requirements for utilities to undertake pilot projects to demonstrate DER technologic capabilities or market structures, and non-wires alternatives procurements to defer or eliminate costly distribution infrastructure investments (“poles and wires”).
4.3 Storage Participation in Wholesale Markets In February of 2018, FERC, the U.S. federal energy regulatory agency, issued Order 841, an amendment to its regulations under the Federal Power Act to allow electric storage to access wholesale markets’ energy, capacity, and ancillary services markets. While some wholesale markets previously allowed limited access to storage, Order 841 was the first comprehensive
21 This report is available at no cost from the National Renewable Energy Laboratory at www.nrel.gov/publications.
requirement for RTOs/ISOs to create participation models that would open all markets under FERC jurisdiction. 9
Order 841 laid out several high-level qualifications for storage resources to participate, including minimum size requirements (100 kW), ensuring that the resource can be a wholesale seller and wholesale buyer, and ensuring that the resource can provide all the capacity, energy, and/or ancillary services that it is technically capable of providing (FERC 2019a). The details of implementation and specific tariff provisions were left to the TSOs to elucidate in their compliance filing process.
All ISOs/RTOs covered by the rule filed their initial compliance plans with the Order in December of 2018. After a public comment period and a review at FERC, the regulatory agency sent operators “deficiency letters” which contained a list of outstanding issues that they did not feel were addressed in the compliance filings. The operators have responded to these deficiency letters and a current deadline of December 2019 stands for implementing the Order through modifications in each operators’ Open Access Transmission Tariff. As of this writing, not all ISO/RTO compliance filings have achieved FERC approval (St. John 2019; FERC 2019b).
It should be noted that the Notice of Proposed Rulemaking on which FERC Order 841is based (see FERC 2016) had prospectively allowed aggregations of DERs in addition to singular storage assets to participate in wholesale markets. This DER aggregation track has been separated off from the Final Order and is currently awaiting further action. FERC held a technical conference in April of 2018 to address the issue of aggregations (and the effects of DERs on the bulk power system generally). Some issues addressed at the conference included:
• The ways in which aggregations could occur in a nodal system (could markets accommodate aggregations larger than a single node?)
• The effectiveness of state approaches to DER aggregation rules, owing to differences in regional distribution systems, as opposed to “blanket” federal jurisdiction
• Potential impacts on distribution equipment (e.g., transformers) of integrating DERs into wholesale markets and the need for grid operators to have some degree of situational awareness of the distribution system. Coordination between TSOs and DSOs will be discussed further in Section 5.2.2.2.1
• The potential to allow DERs to participate both in wholesale and retail markets, or so-called “dual participation” (Hernandez and Watkins 2018).
Dual participation—the problem of scheduling DERs for both the distribution and wholesale markets—is of particular concern, as there are currently limited regulatory precedents for resolving this kind of scheduling conflict. Managing individual or aggregated DERs such that they provide the services for which they are committed to the appropriate end-use (on-site, distribution, or wholesale market) takes a level of coordination between entities beyond today’s current market practices.
9 As mentioned, the only ISO/RTO not under FERC jurisdiction is ERCOT, as its transmission system is not synchronously connected to the rest of the United States, and therefore does not engage in any interstate transfers of energy (https://www.ferc.gov/industries/electric/indus-act/rto/ercot.asp).
22 This report is available at no cost from the National Renewable Energy Laboratory at www.nrel.gov/publications.
As of this writing, the DER aggregation track for FERC Order 841 is still under review. CAISO presently does allow aggregations of DERs to participate in its marketplace, though to date it has not seen many offerors owing to several challenges (Gundlach and Webb 2018). Additionally, DER aggregations can also participate in wholesale markets as DR (i.e., as part of a larger package of “load-modifying” resources). This, however, is only one type of service that DERs can provide to the grid, and as such can represent an undervaluation of DERs through a constriction of the full scope of their services (Birk et al. 2017).
4.4 DER Aggregation and Virtual Power Plants FERC Order 841 has not at this time cleared a path for aggregated DERs to participate in existing U.S. marketplaces; however, several pilot projects in the United States and around the world are demonstrating that, regardless of a market structure, such aggregations are technically capable of delivering grid services that are competitive with, or in some cases, more economic, than traditional resources.
Several jurisdictions in the United States have piloted VPP and aggregation projects to determine the feasibility of rolling up individual DERs to provide grid services at the distribution and wholesale level. A 2018 NREL report identified 23 utility-led aggregation initiatives across the county (Cook et al. 2018). In Europe, some companies have staked their business models on aggregating resources into VPPs and selling services from these portfolios into the bulk power markets.
The following subsections provide two case studies—one in the United States and one in Germany—examining DER aggregation and virtual power plants (VPPs) in two different regulatory contexts.
4.4.1 United States: Pacific Gas and Electric’s DERMS Demonstration Project Pacific Gas and Electric (PG&E) is one of many U.S. utilities working to integrate increasing penetrations of DERs; however, its actions in this area are particularly salient, as its distribution system hosts more distributed PV capacity than any other system in the United States, with more than 380,000 distributed PV systems installed as of August 2018 (PG&E 2018).
Much of the DERs on PG&E’s system are customer-sited and third-party owned/operated (a function of the popularity of the third-party finance business model in the state). This presents challenges for the utility, giving them limited visibility into and control over these distributed assets. DERs in high penetrations can trigger transformer overloads, introduce voltage violations, and present other technical challenges that result from the system operator’s limitations in managing them. Moreover, without adequate visibility and control, there can be misaligned incentives between customers who wish to maximize the value of their DERs and the utility in its mandate to safely, reliably, and cost-effectively operate the distribution system.
Seeking solutions to better incorporate present and future DERs on its system, PG&E embarked on a pilot in 2015 to aggregate PV and lithium-ion battery storage systems and to coordinate them through a central DERMS platform for the dispatch of grid services. DERMS software solutions can provide utilities with the situational awareness at high data resolution and the maneuverability to efficiently integrate and utilize DERs to increase system flexibility, reliability, and hosting capacity. At its most basic level, a DERMS platform enables utilities to
23 This report is available at no cost from the National Renewable Energy Laboratory at www.nrel.gov/publications.
use DER operational data and capabilities to issue commands based on market signals and grid conditions to the DERs in the field. These commands could instruct DERs to adopt a certain operational mode, dispatch onto the grid, or perform other functions that could manage DER impacts or provide distribution- or even transmission-level services. For this pilot, PG&E selected GE’s Grid Solutions product through a competitive solicitation as the DERMS software (Ardani et al. 2018).
PG&E’s pilot, which was completed in 2018, aggregated 124 kW of PV and 66 kW of storage from 27 residential homes, 360 kW of storage from three commercial buildings, and 4 MW of storage from a grid-scale battery (Ardani et al. 2018). It was funded by the California Electric Program Investment Charge (EPIC) program, an initiative to support the development of new, emerging, and non-commercialized clean energy technologies in the state and itself funded by ratepayers.
PG&E selected three distribution feeders connected to a single substation and representing some 9,500 customers in the city of San Jose on which to trial the DERMS platform. These feeders were chosen for their high DER penetration, existing presence of grid sensors, and collocation with other PG&E EPIC pilots to derive co-benefits among projects. Aside from PG&E, the pilot solicited the participation of “aggregators,” or DER service providers, that would control the operation and dispatch of their fleet storage devices in the nodes. The two aggregators that participated in this pilot were Tesla (formerly SolarCity) and Engie (formerly Green Charge Networks) (Ardani et al. 2018).
PG&E divided the territory serviced by these three feeders into six DER aggregation “nodes”. Output from DERs in these nodes was pooled through the DERMS for the purposes of providing local services (e.g., voltage regulation, flexibility) to the distribution system.
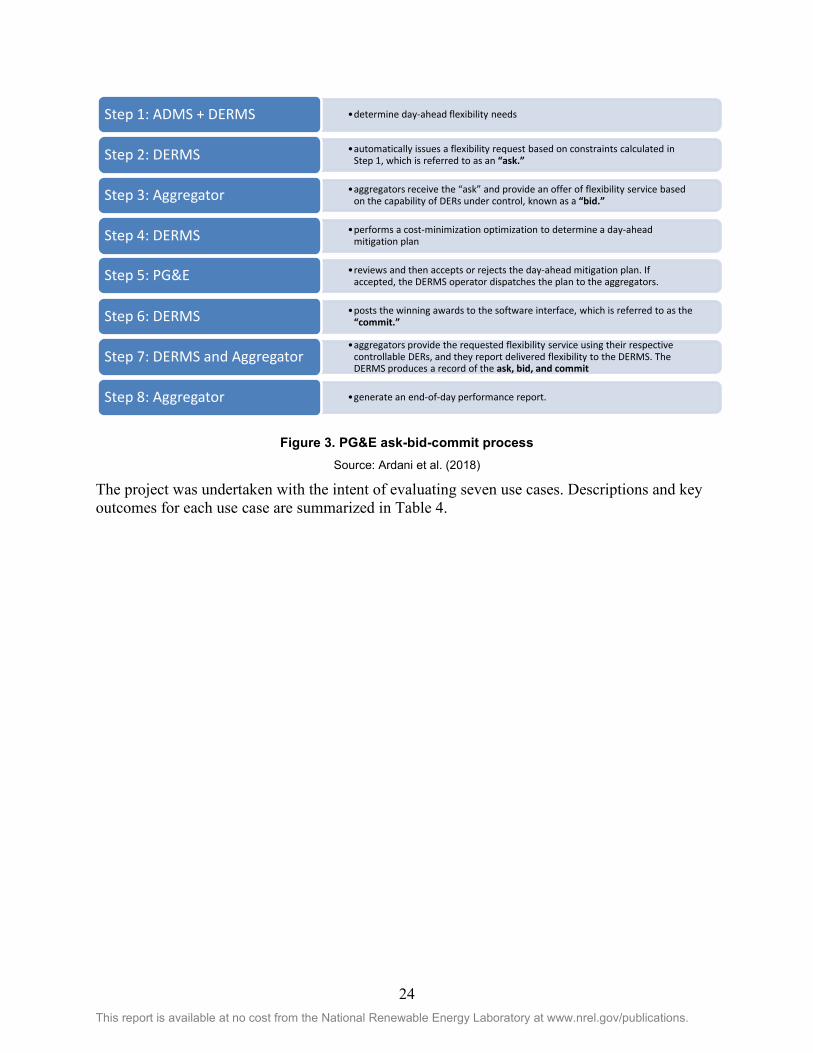
It should be noted that this pilot was not designed to test market structures or conduct an in-depth study of the economics of TE. It was primarily focused on system benefits, and those at the distribution-level particularly; however, while the pilot was not designed to determine the underlying value of DER services, it did assume a rudimentary marketplace where DERs would be dispatched according to simulated economic signals (Kuga et al. 2018). This market followed an “ask-bid-commit” flow of operations that functioned as follows: The utility determines its flexibility needs on a day-ahead basis and “asks” aggregators to respond to a request for reactive or real power from their DER portfolios; the DER providers “bid” on this ask by offering services within the capabilities of their portfolio; the DERMS platform optimizes for least cost bids and posts the winning awards to the software interface between aggregators and utilities—this is the “commit” stage. Figure 3 provides a high-level overview of the process.
24 This report is available at no cost from the National Renewable Energy Laboratory at www.nrel.gov/publications.
Figure 3. PG&E ask-bid-commit process Source: Ardani et al. (2018)
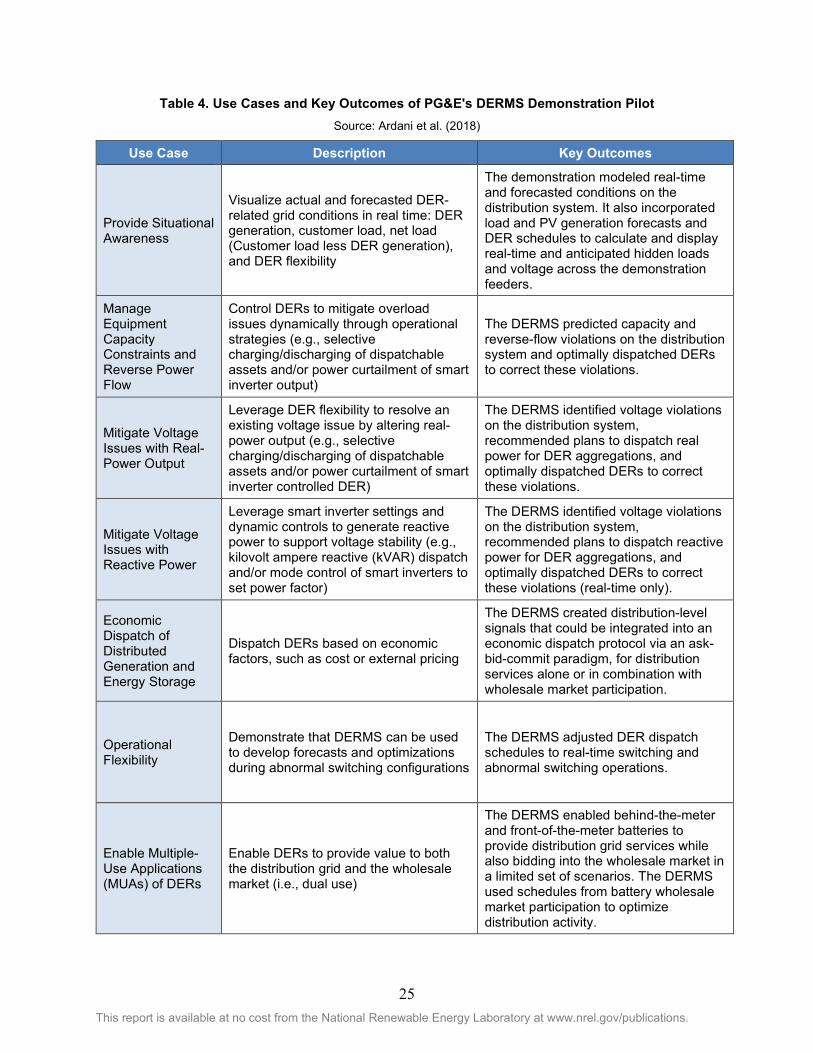
The project was undertaken with the intent of evaluating seven use cases. Descriptions and key outcomes for each use case are summarized in Table 4.
•determine day-ahead flexibility needsStep 1: ADMS + DERMS
•automatically issues a flexibility request based on constraints calculated in Step 1, which is referred to as an “ask.”Step 2: DERMS
•aggregators receive the “ask” and provide an offer of flexibility service based on the capability of DERs under control, known as a “bid.”Step 3: Aggregator
•performs a cost-minimization optimization to determine a day-ahead mitigation planStep 4: DERMS
•reviews and then accepts or rejects the day-ahead mitigation plan. If accepted, the DERMS operator dispatches the plan to the aggregators.Step 5: PG&E
•posts the winning awards to the software interface, which is referred to as the“commit.”Step 6: DERMS
•aggregators provide the requested flexibility service using their respective controllable DERs, and they report delivered flexibility to the DERMS. The DERMS produces a record of the ask, bid, and commit
Step 7: DERMS and Aggregator
•generate an end-of-day performance report.Step 8: Aggregator
25 This report is available at no cost from the National Renewable Energy Laboratory at www.nrel.gov/publications.
Table 4. Use Cases and Key Outcomes of PG&E's DERMS Demonstration Pilot Source: Ardani et al. (2018)
Use Case Description Key Outcomes
Provide Situational Awareness
Visualize actual and forecasted DER-related grid conditions in real time: DER generation, customer load, net load (Customer load less DER generation), and DER flexibility
The demonstration modeled real-time and forecasted conditions on the distribution system. It also incorporated load and PV generation forecasts and DER schedules to calculate and display real-time and anticipated hidden loads and voltage across the demonstration feeders.
Manage Equipment Capacity Constraints and Reverse Power Flow
Control DERs to mitigate overload issues dynamically through operational strategies (e.g., selective charging/discharging of dispatchable assets and/or power curtailment of smart inverter output)
The DERMS predicted capacity and reverse-flow violations on the distribution system and optimally dispatched DERs to correct these violations.
Mitigate Voltage Issues with Real-Power Output
Leverage DER flexibility to resolve an existing voltage issue by altering real-power output (e.g., selective charging/discharging of dispatchable assets and/or power curtailment of smart inverter controlled DER)
The DERMS identified voltage violations on the distribution system, recommended plans to dispatch real power for DER aggregations, and optimally dispatched DERs to correct these violations.
Mitigate Voltage Issues with Reactive Power
Leverage smart inverter settings and dynamic controls to generate reactive power to support voltage stability (e.g., kilovolt ampere reactive (kVAR) dispatch and/or mode control of smart inverters to set power factor)
The DERMS identified voltage violations on the distribution system, recommended plans to dispatch reactive power for DER aggregations, and optimally dispatched DERs to correct these violations (real-time only).
Economic Dispatch of Distributed Generation and Energy Storage
Dispatch DERs based on economic factors, such as cost or external pricing
The DERMS created distribution-level signals that could be integrated into an economic dispatch protocol via an ask-bid-commit paradigm, for distribution services alone or in combination with wholesale market participation.
Operational Flexibility
Demonstrate that DERMS can be used to develop forecasts and optimizations during abnormal switching configurations
The DERMS adjusted DER dispatch schedules to real-time switching and abnormal switching operations.
Enable Multiple-Use Applications (MUAs) of DERs
Enable DERs to provide value to both the distribution grid and the wholesale market (i.e., dual use)
The DERMS enabled behind-the-meter and front-of-the-meter batteries to provide distribution grid services while also bidding into the wholesale market in a limited set of scenarios. The DERMS used schedules from battery wholesale market participation to optimize distribution activity.
26 This report is available at no cost from the National Renewable Energy Laboratory at www.nrel.gov/publications.
In its in final report submitted to the EPIC program, PG&E further identified areas for further development and testing. These include a stated need for expanded capabilities in DERMS products, as well as continued investments in core utility capabilities such as forecasting, communications, and cybersecurity to improve the quality and accuracy of DERMS inputs. Additionally, while the pilot demonstrated that it was technically feasible for DERs to provide grid services, it also hinted that the potential for DERs to do so may be limited, especially if there are not high penetrations of devices in the aggregation areas. Moreover, further testing and demonstration may be necessary to generate confidence in the ability of aggregated DER to predictably and reliably dispatch services in a real-time setting (Kuga et al. 2018).
4.4.2 Germany: Next Kraftwerke’s Virtual Power Plant Business Model As of this writing, the share of renewable energy in Germany’s gross electricity consumption has reached about 40%. This expansion has resulted in a fundamental change in the electricity generation landscape, such that—whereas generation had primarily been the province of four large corporations10—today many small producers, often aggregated by so-called direct marketers such as Next Kraftwerke, are gaining share in the electricity market (Bendesnetzagentur and Bundeskartellamt 2019).
The aggregation business model has been enabled by two regulatory constructs: the European Union’s electricity market liberalization in 1996, and the 2000 Renewable Energy Sources Act (Gesetz für den Ausbau Erneuerbarer Energien or EEG). The former allowed for participation in the generation markets by nonregulated entities, and the latter instituted the feed-in tariff, allowing renewable energy resources receive priority interconnection to the grid and fixed compensation for exported electricity.
Next Kraftwerke was founded in 2009 with a business model focused on marketing the flexibility available in VPPs. A VPP is a portfolio of smaller, individual energy assets (generation and flexible load), over which a single entity can exercise active power control (Enbala 2018). In contrast to the established energy supply companies, Next Kraftwerke was one of the newcomers in the energy market, with a business model that emerged from the university research of its two founders. Before the company’s incorporation, the founders and current managing directors were investigating the increasing need for flexibility in the power system arising from the expansion of variable renewable energy. Because, at that time, storage facilities were comparatively expensive and only available to a limited extent, they relied on the potential of making existing power generation facilities more flexible and marketing them as control reserve. The founders saw great potential for flexibility in the emergency power generators that were available but sat idle for long periods of time, essentially waiting to capitalize on market-price spikes during peak periods. The two spied the potential to aggregate these assets and sell their capacity to provide positive control energy (Handelsblatt Energy Awards 2014).
Next Kraftwerke's business model relies on electricity from generating plants that are owned and operated by third parties. In order to be able to aggregate and market the electricity, Next Kraftwerke has developed two core technologies: The Next Box and VPP software. The Next Box is hardware that enables communication between Next Kraftwerke’s central system (the
10 Namely, E.On, RWE, EnBW, and Vattenfall.
27 This report is available at no cost from the National Renewable Energy Laboratory at www.nrel.gov/publications.
VPP software) and their network’s plants. It is installed at the customer's plant and registers the electricity generation quantities and forwards the data to the VPP platform. The VPP aggregates the data, combines it with other data, such as weather forecasts and current market data, and creates forecasts to derive an optimised dispatch schedule for each plant (Next Kraftwerke 2019a and 2019b).
As with other generation portfolios, aggregating power plants can potentially create synergies between them, such as:
• The ability to internally balance electricity volumes within the physical VPP infrastructure and hence avoid trading fees that would have otherwise been incurred from trading on the electricity market
• The ability to balance internal forecasts and generation variances, leading to higher schedule accuracy and a reduction in balancing energy risks and costs.
Aggregation also allows smaller generation units to participate in the marketplace. Minimum quantity trading requirements with lower bounds in the MWh range can effectively bar some small plants from market access; however, when bundled into a larger VPP structure, these plants can realize revenues that they would otherwise be unable to access.
At Next Kraftwerke’s inception, the core of the business model was to bundle small plants and thus market hitherto unused flexibility. The emergency power generators keep standby for large parts of the year and come online for use in the event of power failures, which rarely occur in Germany. They can be started up by the virtual power plant and, if necessary, generate additional revenue by providing reserve power. In addition, the necessary operational test runs, for which the plants must be started up regularly, can now be better harmonised with the electricity market.
Following regulatory changes in Germany in 2012, Next Kraftwerke moved into the direct marketing space. This was driven by the EEG reform which changed the remuneration scheme for renewable generators to a market premium (transitioning away from the fixed compensation of a feed-in tariff). This reform ushered in a new group of companies on the electricity market—the direct marketers—that bundled renewable electricity and sold it mainly on short-term spot markets.
Today, Next Kraftwerke’s VPP network comprises more than 8,700 plants with a total networked capacity of over 7,500 megawatts. The company currently operates in eight European countries (Next Kraftwerke 2019c).
28 This report is available at no cost from the National Renewable Energy Laboratory at www.nrel.gov/publications.
5 Future: Visions of the 21st Century Distribution Grid This section will discuss the current regulatory proceedings, proposed models and architectures, and the status of implementation of distribution system marketplaces. The following discussion assumes a context where Stage 3 on DER evolution chart (shown in Section 4.1) has been achieved. This is the stage of high DER penetration where “multiparty transactions and market operations” are facilitated in a TE-enabled environment. This stage contemplates peer-to-peer trading of and financial settlements across a range of parties (DSO, aggregators, customers/end users), as well as the optimal realization of DER services to support of grid operations.
This future is currently out of reach, owing to a lack of enabling technologies, regulatory frameworks, and other critical components; however, the trends discussed in Section 4 (among others) are providing the directional momentum that could facilitate the implementation of transactive distribution systems in several jurisdictions.
This section provides an overview of what a 21st century transactive distribution system could look like in the United States according to the formulations of thought leaders in the field of TE. It overviews the potential roles of actors in these systems, and how coordination between them could be managed to facilitate market operation while also maintaining reliability. The section also discusses peer-to-peer trading and some comments on how certain technologies (e.g., blockchain) might be employed to enact this kind of marketplace.
To avoid confusion, this Section uses the term “TSO” to refer to a generalized wholesale market and transmission system operator (as opposed to the more United States-specific ISO/RTO). Similarly, it uses the term DSO to refer to a distribution market and system operator in contradistinction to “utilities,” which in most cases today do not have the roles and responsibilities of DSOs as envisioned below).
5.1 The Centralized Versus Decentralized Grid Architecture Model Operating energy markets while maintaining whole system supply and demand is a complex and highly specialized enterprise. This is the function of the TSO in deregulated markets, but a key question in the grid architecture literature is whether the TSO would be the most suitable entity to manage DERs and operations on the distribution system. This system is much larger than the transmission system in terms of length of wires, connections, customers, and system components (Birk 2017). If the TSO takes on a market coordination, co-optimization, operations for the distribution system in addition to its current roles for the transmission system, this could introduce a level of complexity that is orders of magnitude greater than what it already manages today. Additionally, the technologies and methods used in wholesale market operations (e.g., security constrained unit commitment and economic dispatch) may not be well-suited to the number of nodes that would comprise a deep TE market. The optimization problems used for wholesale generator scheduling would become overly complex on the distribution system.
The alternative to having the TSO manage the distribution system’s portfolio of DERs and the overlaying market structure is to devolve the role to the utility or to an independent DSO. There is currently no precedent for the DSO model in the United States, and it would require that utilities reform and reorganize, or that new entities be created much as the ISOs/RTOs were organized during electricity market reform in the 1990s. Three of the foremost thought leaders in
29 This report is available at no cost from the National Renewable Energy Laboratory at www.nrel.gov/publications.
the TE space—Lorenzo Kristov, Paul De Martini, and Jeffrey Taft—frame these two alternatives as “the Grand Central Optimization”(TSO-centric) and the “Layered Decentralized Optimization” (DSO-centric) models of grid architecture (Kristov et al. 2016).
The Grand Central model envisions an electricity system where the TSO extends its role to encompass DERs in its optimization, coordination, scheduling, and dispatching of resources to conduct transmission system operations. Under this scenario, the distribution utility could in some cases call upon DERs to support their own operational needs and could even take on some coordinating/aggregative function to ensure the DER services scheduled by the TSO are available for dispatch when called upon. As such, the Central model represents an incremental extension of where the electricity system in the United States is headed today with its present DR markets and the implementation of FERC Order 841 (Kristov et al. 2016). Accordingly, this model is also called the “Minimal DSO” by Kristov et al.
In contrast, the Layered Decentralized model envisions a more radical departure from today’s electricity system. It is a vision that empowers utilities with the authority and oversight to actively manage the DERs, operate distribution-level TE markets, and leverage DERs to meet their regulatory requirements of safe, reliable, and least-cost operation. The utility in this capacity (i.e., as a DSO) would aggregate all DERs into a local distribution area (LDA) and could bid these aggregations into the wholesale markets based on economic signals from the TSO. An LDA would be composed of the distribution infrastructure, interconnected DERs, and associated customers downstream of a single transmission/distribution (TD) substation (Kristov et al. 2016). The DSO would have complete agency over the LDA, determining (likely via a DERMS-enabled distribution market platform) the best means of coordinating, scheduling, and dispatching DERs. The Decentralized model could contemplate a DSO that is incorporated under the same organization as the utility (i.e., the “poles and wires” company) or one that is a separate and independent organization. An independent DSO would provide operational services (not planning or investment) on the utility-owned physical infrastructure. In 2015, New York State decided to designate the state’s IOUs as the DSO on their own systems as the state gradually transitions to distribution markets under the REV strategy. This is, however, subject to ongoing review and performance metrics (see Section 5.3.5).
Table 5 presents key features of and differences between the Grand Central Decentralized models.
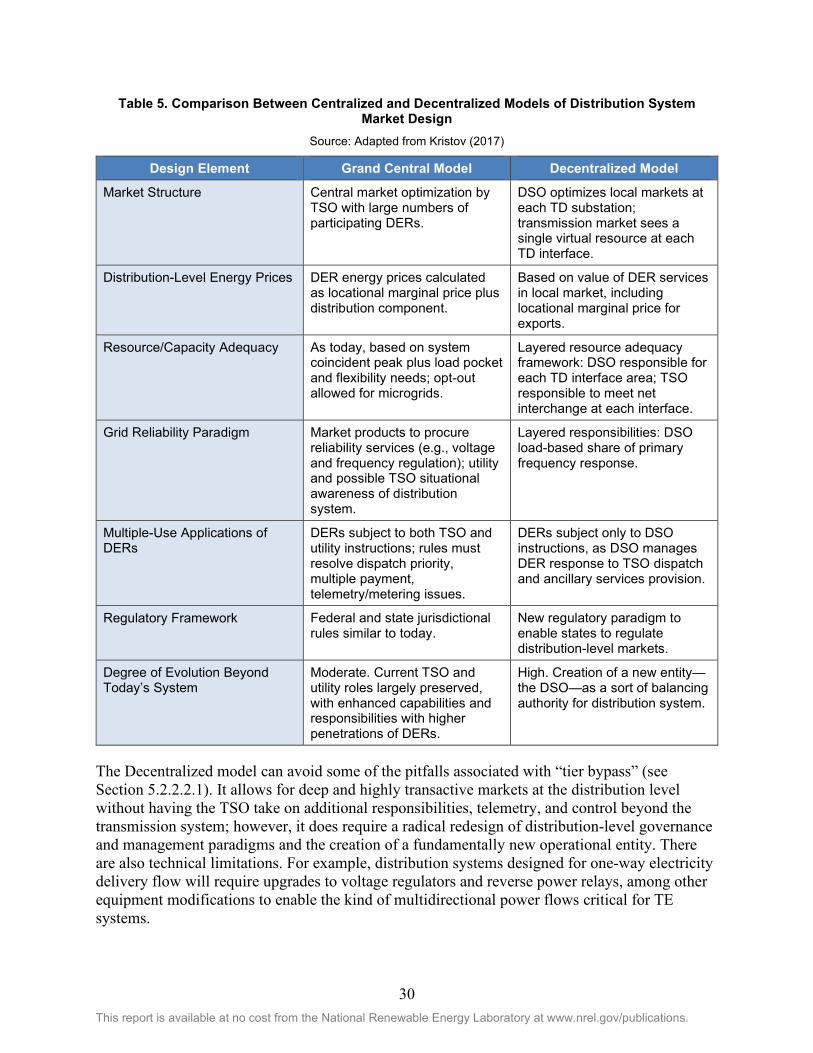
30 This report is available at no cost from the National Renewable Energy Laboratory at www.nrel.gov/publications.
Table 5. Comparison Between Centralized and Decentralized Models of Distribution System Market Design
Source: Adapted from Kristov (2017)
Design Element Grand Central Model Decentralized Model
Market Structure Central market optimization by TSO with large numbers of participating DERs.
DSO optimizes local markets at each TD substation; transmission market sees a single virtual resource at each TD interface.
Distribution-Level Energy Prices DER energy prices calculated as locational marginal price plus distribution component.
Based on value of DER services in local market, including locational marginal price for exports.
Resource/Capacity Adequacy As today, based on system coincident peak plus load pocket and flexibility needs; opt-out allowed for microgrids.
Layered resource adequacy framework: DSO responsible for each TD interface area; TSO responsible to meet net interchange at each interface.
Grid Reliability Paradigm Market products to procure reliability services (e.g., voltage and frequency regulation); utility and possible TSO situational awareness of distribution system.
Layered responsibilities: DSO load-based share of primary frequency response.
Multiple-Use Applications of DERs
DERs subject to both TSO and utility instructions; rules must resolve dispatch priority, multiple payment, telemetry/metering issues.
DERs subject only to DSO instructions, as DSO manages DER response to TSO dispatch and ancillary services provision.
Regulatory Framework Federal and state jurisdictional rules similar to today.
New regulatory paradigm to enable states to regulate distribution-level markets.
Degree of Evolution Beyond Today’s System
Moderate. Current TSO and utility roles largely preserved, with enhanced capabilities and responsibilities with higher penetrations of DERs.
High. Creation of a new entity—the DSO—as a sort of balancing authority for distribution system.
The Decentralized model can avoid some of the pitfalls associated with “tier bypass” (see Section 5.2.2.2.1). It allows for deep and highly transactive markets at the distribution level without having the TSO take on additional responsibilities, telemetry, and control beyond the transmission system; however, it does require a radical redesign of distribution-level governance and management paradigms and the creation of a fundamentally new operational entity. There are also technical limitations. For example, distribution systems designed for one-way electricity delivery flow will require upgrades to voltage regulators and reverse power relays, among other equipment modifications to enable the kind of multidirectional power flows critical for TE systems.
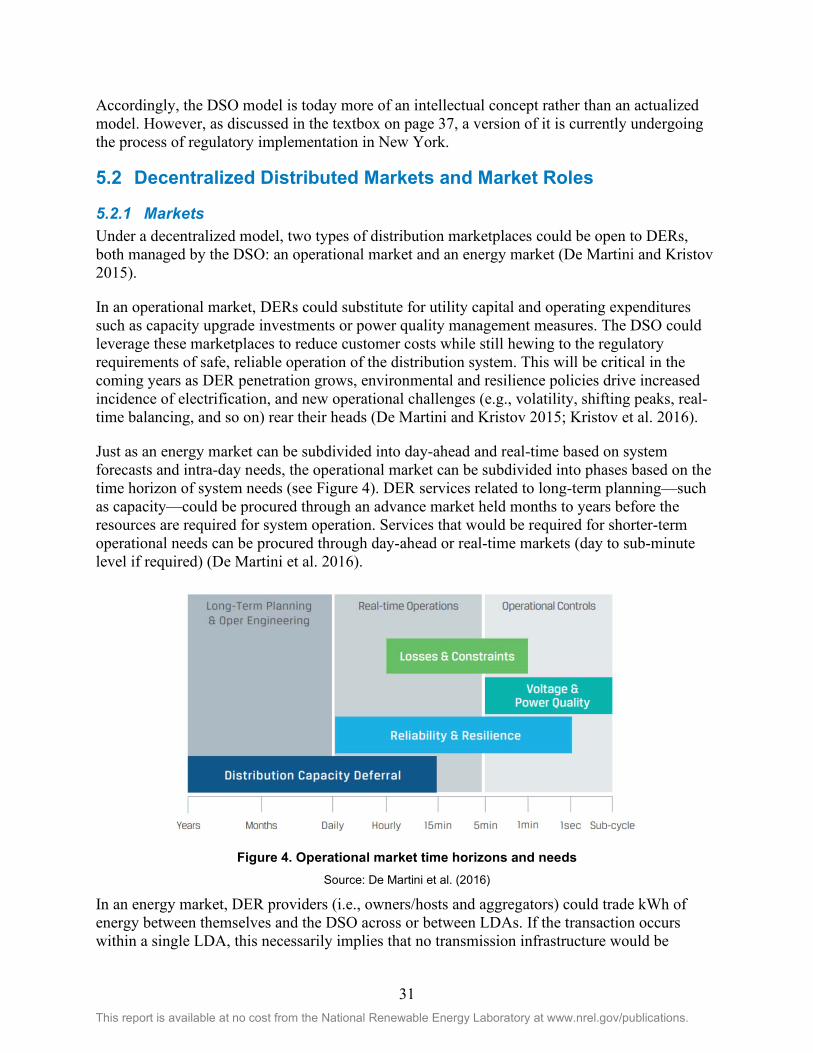
31 This report is available at no cost from the National Renewable Energy Laboratory at www.nrel.gov/publications.
Accordingly, the DSO model is today more of an intellectual concept rather than an actualized model. However, as discussed in the textbox on page 37, a version of it is currently undergoing the process of regulatory implementation in New York.
5.2 Decentralized Distributed Markets and Market Roles
5.2.1 Markets Under a decentralized model, two types of distribution marketplaces could be open to DERs, both managed by the DSO: an operational market and an energy market (De Martini and Kristov 2015).
In an operational market, DERs could substitute for utility capital and operating expenditures such as capacity upgrade investments or power quality management measures. The DSO could leverage these marketplaces to reduce customer costs while still hewing to the regulatory requirements of safe, reliable operation of the distribution system. This will be critical in the coming years as DER penetration grows, environmental and resilience policies drive increased incidence of electrification, and new operational challenges (e.g., volatility, shifting peaks, real-time balancing, and so on) rear their heads (De Martini and Kristov 2015; Kristov et al. 2016).
Just as an energy market can be subdivided into day-ahead and real-time based on system forecasts and intra-day needs, the operational market can be subdivided into phases based on the time horizon of system needs (see Figure 4). DER services related to long-term planning—such as capacity—could be procured through an advance market held months to years before the resources are required for system operation. Services that would be required for shorter-term operational needs can be procured through day-ahead or real-time markets (day to sub-minute level if required) (De Martini et al. 2016).
Figure 4. Operational market time horizons and needs
Source: De Martini et al. (2016)
In an energy market, DER providers (i.e., owners/hosts and aggregators) could trade kWh of energy between themselves and the DSO across or between LDAs. If the transaction occurs within a single LDA, this necessarily implies that no transmission infrastructure would be
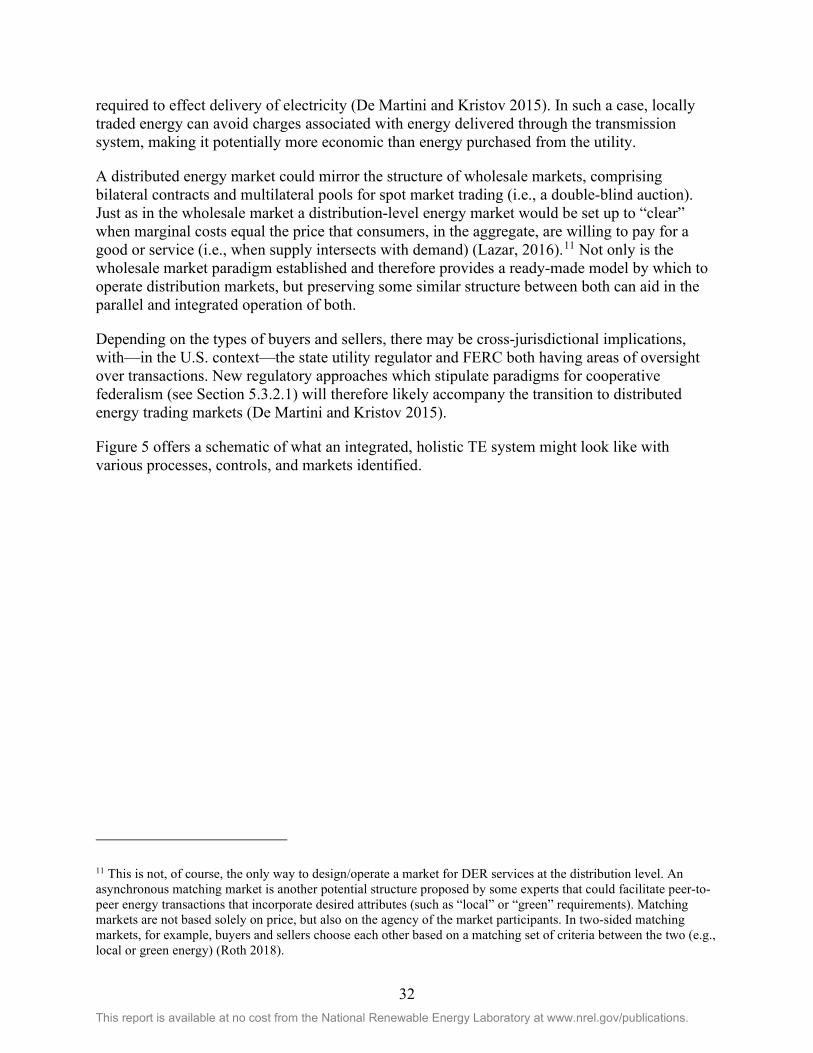
32 This report is available at no cost from the National Renewable Energy Laboratory at www.nrel.gov/publications.
required to effect delivery of electricity (De Martini and Kristov 2015). In such a case, locally traded energy can avoid charges associated with energy delivered through the transmission system, making it potentially more economic than energy purchased from the utility.
A distributed energy market could mirror the structure of wholesale markets, comprising bilateral contracts and multilateral pools for spot market trading (i.e., a double-blind auction). Just as in the wholesale market a distribution-level energy market would be set up to “clear” when marginal costs equal the price that consumers, in the aggregate, are willing to pay for a good or service (i.e., when supply intersects with demand) (Lazar, 2016).11 Not only is the wholesale market paradigm established and therefore provides a ready-made model by which to operate distribution markets, but preserving some similar structure between both can aid in the parallel and integrated operation of both.
Depending on the types of buyers and sellers, there may be cross-jurisdictional implications, with—in the U.S. context—the state utility regulator and FERC both having areas of oversight over transactions. New regulatory approaches which stipulate paradigms for cooperative federalism (see Section 5.3.2.1) will therefore likely accompany the transition to distributed energy trading markets (De Martini and Kristov 2015).
Figure 5 offers a schematic of what an integrated, holistic TE system might look like with various processes, controls, and markets identified.
11 This is not, of course, the only way to design/operate a market for DER services at the distribution level. An asynchronous matching market is another potential structure proposed by some experts that could facilitate peer-to-peer energy transactions that incorporate desired attributes (such as “local” or “green” requirements). Matching markets are not based solely on price, but also on the agency of the market participants. In two-sided matching markets, for example, buyers and sellers choose each other based on a matching set of criteria between the two (e.g., local or green energy) (Roth 2018).
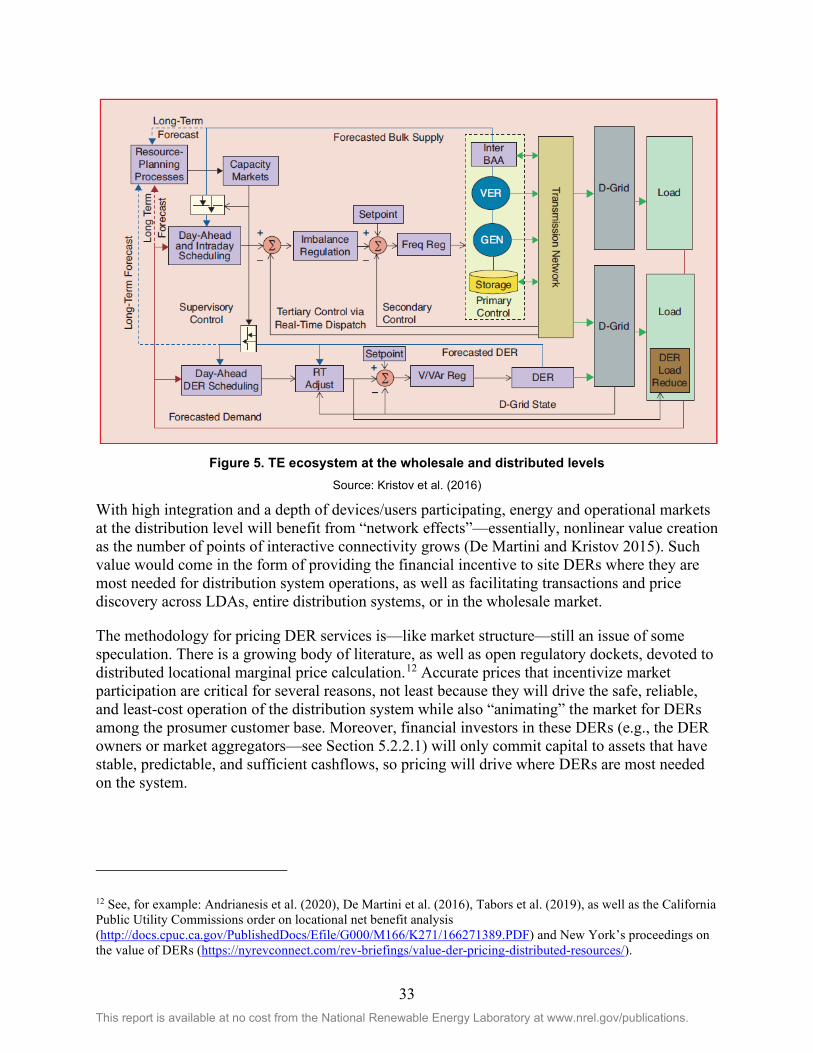
33 This report is available at no cost from the National Renewable Energy Laboratory at www.nrel.gov/publications.
Figure 5. TE ecosystem at the wholesale and distributed levels
Source: Kristov et al. (2016)
With high integration and a depth of devices/users participating, energy and operational markets at the distribution level will benefit from “network effects”—essentially, nonlinear value creation as the number of points of interactive connectivity grows (De Martini and Kristov 2015). Such value would come in the form of providing the financial incentive to site DERs where they are most needed for distribution system operations, as well as facilitating transactions and price discovery across LDAs, entire distribution systems, or in the wholesale market.
The methodology for pricing DER services is—like market structure—still an issue of some speculation. There is a growing body of literature, as well as open regulatory dockets, devoted to distributed locational marginal price calculation.12 Accurate prices that incentivize market participation are critical for several reasons, not least because they will drive the safe, reliable, and least-cost operation of the distribution system while also “animating” the market for DERs among the prosumer customer base. Moreover, financial investors in these DERs (e.g., the DER owners or market aggregators—see Section 5.2.2.1) will only commit capital to assets that have stable, predictable, and sufficient cashflows, so pricing will drive where DERs are most needed on the system.
12 See, for example: Andrianesis et al. (2020), De Martini et al. (2016), Tabors et al. (2019), as well as the California Public Utility Commissions order on locational net benefit analysis (http://docs.cpuc.ca.gov/PublishedDocs/Efile/G000/M166/K271/166271389.PDF) and New York’s proceedings on the value of DERs (https://nyrevconnect.com/rev-briefings/value-der-pricing-distributed-resources/).
34 This report is available at no cost from the National Renewable Energy Laboratory at www.nrel.gov/publications.
5.2.2 Roles
5.2.2.1 Aggregators For decentralized, transactive distribution markets based on double-blind auctions (akin to wholesale market operations) to function efficiently, buyers and sellers must be incentivized to participate in a quantity sufficient to allow for accurate price discovery and market equilibrium. Aggregators can be a critical market in realizing these outcomes.
Homeowners and businesses—as sellers of DERs—may in fact be disincentivized to participate owing to the complexity of the transactions and the resources required to understand these markets. Further, settlement and/or control of hundreds if not thousands of DER devices would quickly overwhelm the capabilities of a single utility or DSO. Aggregators address both these barriers, allowing DER hosts and distribution system operators to focus on their core capabilities.
Not only can aggregators take on the complexity and risk of bidding DERs into markets to capture prices that incentivize their participation, they can also amass portfolios of assets to achieve economies of scale for their operations (e.g., as is the case with some of the smaller plants in Next Kraftwerke’s VPP). As such, aggregators can enter DERs into the marketplace that may not have otherwise participated. Moreover, in the United States many DER assets (particularly solar and storage) are third-party owned, which means that they are already operated and controlled by entities other than the homeowner or business that hosts them. This could allow for a facilitated path to building the kinds of portfolios that aggregators would need to be competitive in a TE marketplace.
Aggregators could also serve as the first line of coordination for the multiple devices on the distribution system. These entities would do the initial work of assembling a network of devices that could represent either supply or demand (i.e., generation or load) and organizing them to provide the services at the locations requested by the DSO or market operator. To do this, aggregators would need control of the devices behind the meter, which, if the aggregator is a solar and/or storage third-party ownership company for example, it may already have. Controlling the devices behind the meter will allow the aggregators to modify the load shape of the facility at which the devices are installed, such that they can provide the specific type of flexibility service (energy, ramp up or ramp downs for power quality adjustments, and so on) asked for by the market operator. In this way, the DER aggregator business model could function much the same as the DR aggregator business model that combines the performance of multiple end-use customers and bids that composite load shape into a utility-led or wholesale DR market.
The contract structures for this business model have some precedent in the marketplace. Examples of contracts executed to date can be found in Vermont IOU Green Mountain Power’s
35 This report is available at no cost from the National Renewable Energy Laboratory at www.nrel.gov/publications.
Resilient Home Program,13 California IOU Southern California Edison’s Preferred Resources Pilot,14 or Sunrun’s VPP award in ISO-NE’s 2019 forward capacity auction.15
Contracts between the aggregator and the DSO or TSO could be modeled on those that are currently executed in DR markets and forward or bilateral contracts at the ISO level. Adjustments would need to be made to reflect the underlying resources, specific market rules/structures (e.g., whether it is for a distributed TE marketplace or the wholesale market), and other differences, but these templates exist and can be leveraged.
Aggregator participation is neither necessary nor sufficient for dynamic transactive markets. They are not required to facilitate peer-to-peer trading, or even trading between individual sellers and buyers at the distribution or wholesale level, which can to some extent be automated and driven by algorithms; however, aggregators could bring efficiencies that may be difficult to achieve in a highly transactive marketplace where expertise is at a premium.
5.2.2.2 DSO Much has been written about the potential role of the DSO in the TE literature, but as of this writing, there is little operational precedent for this kind entity. Aside from incremental regulation in New York State—which is forcing an evolution of its IOUs into DSOs—and aside from a handful of DER aggregation pilot projects around the country, there is today no TE marketplace at the distribution level in the United States. Therefore no scaled DSO business model currently exists from which to draw best practices and lessons learned.
As discussed previously in this report, the concept of the DSO—a pureplay operator of the distribution system and marketplace, as opposed to a “wires company” or load-serving entity—implies a role fundamentally distinct from that of the modern-day utility. It is a further carving-out of the utility’s standard portfolio of functions, much as electricity market liberalization in the 1990’s carved out generation and transmission from utilities’ portfolios in deregulated markets. A DSO would function much in the vein of an ISO, coordinating financial transactions, dispatch services, and balancing functions across the distribution system. It would also manage interchanges with the TSO at the TD substations, unless the TSO were to take on some extended role where it would have some degree of operational control and situational awareness into the distribution system (i.e., a Grand Central Optimization model).
The DSO model is unimplementable today given current utility capabilities and equipment. Several developments and technological evolutions would be required before a DSO could commence operations. Such measures include the installation and integration of myriad sensors
13 Green Mountain Power’s Resilient Home Program allows homeowners to lease batteries from the utility that can provide back-up power to the home in the case of an outage. The utility—Green Mountain Power—retains control over the device and can dispatch it to address grid needs. In this program, the utility effectively acts as both aggregator and DSO (though not in a TE context) (GMP 2019). 14 Southern California Edison’s Preferred Resources Pilot is a competitive solicitation (request for offers) seeking demand-side DERs—largely from DR and storage resources—to defer grid upgrades in central Orange County, California (SCE 2019). 15 In February 2019, the third-party ownership company won a 20-MW bid comprised of roughly 5,000 installations of BrightBox—the company’s solar + storage offering tailored to the state market—across NE ISO territory (Spector 2019).
36 This report is available at no cost from the National Renewable Energy Laboratory at www.nrel.gov/publications.
and telemetry equipment across feeders to ensure that the DSO maintains real-time visibility of the DERs on its system. Even in the case where aggregators manage DER portfolios, the DSO may require situational awareness at the device or AMI level to safely and reliably operate the distribution grid (Padullaparti et al. 2019). Forecasting capabilities will also need to be developed further to align day-ahead predictions with the active real-time optimization of the system. And, importantly, significant regulatory changes will be required to allow for the creation of distribution markets as well as the entities that will operate them.
New York, the only state at present to be actively engaged in implementing a DSO model (see textbox on next page), has made the preliminary determination that the IOUs themselves are the most natural entities to perform the functionalities of a DSO (NY PSC 2015). However, this does not necessarily have to be the case. An independent DSO may present some benefits over the utility-as-DSO approach, including safeguards against utility market power and the potential to foster a non-discriminatory marketplace for services such as interconnections, scheduling, planning, and other functions (DeMartini 2015). Lessons learned on the value of an independent DSO can be gleaned from the wholesale space, where independent transmission operators and open-access tariffs have more than 20 years of track record.
5.2.2.2.1 Coordination Between DSO and TSO Real-time power system operations in the United States today do not involve two-way exchanges of information or coordination between utilities and ISOs/RTOs (More Than Smart 2018). This gap in communication/coordination results from several realities of today’s electricity system, such as the fact that dispatch is currently unidirectional, and the fact that utilities are regulated by the state while most ISOs/RTOs are regulated by FERC.
In a high-DER grid where dispatches to the wholesale market are enabled, there must be active, real-time communication between the DSO and the TSO to maintain system safety and reliability while also avoiding such pitfalls as tier bypass and conflicts arising from dual participation. Tier bypass is a situation where entities that control DER operations (e.g., aggregators) coordinate with the wholesale market operator (the ISO/RTO or TSO) directly, thus bypassing the interface with the utility (More Than Smart 2018; Thomas 2018; DOE 2017a). The utility’s system of wires and equipment would be used to deliver the services offered by DER aggregators to the wholesale market, even though the utility itself would not have oversight or control in the transactions. This can both compromise the utility’s operation of the grid and imperil the utility’s equipment (with secondary consequences for surrounding infrastructure, such as fire risk).
The extent and physical grid location of the interface between TSO and DSO will be dictated by where this interface occurs on the architecture of the transactive distribution grid. In other words, if the system is skewed more toward a centralized architecture, the points of coordination could fall further downstream from the substation (i.e., into the utility service territory). In a decentralized architecture, the TD substation would be the physical point of interface. As such, the TSO would only see DERs on its system as single aggregated load shape coming off an individual distribution bus, as if all the DERs on the feeder were all located at the substation. In this way, the TD substation will function similarly to a battery, a source of load and of generation, depending on how the DERs on the distribution system are incentivized to dispatch (Kristov 2019).
37 This report is available at no cost from the National Renewable Energy Laboratory at www.nrel.gov/publications.
The Distribution Grid as Platform: Lessons From New York State
In 2014 New York State, under the governorship of Andrew Cuomo, embarked on a deep regulatory reform (Reforming the Energy Vision, or REV) to transition the state’s utilities away from the 20th century model of electric service to a 21st century “distributed system platform” (DSP). As of this writing, the New York State’s REV represents the most advanced institutional push to structurally reorganize the operation of the distribution grid. It is split into two tracks: Track One centers on the formation of the DSP—the “functional center” of REV (NY PSC 2015). Track Two is concerned with the financial mechanisms necessary to supplement or replace the cost of service ratemaking that characterizes the regulated monopoly model for utilities (Thomas 2018).
Under Track One, the DSP has been conceived of as a base of hardware and software into which various DERs can plug in and transact. The DSP provider serves a similar function to the DSO as envisioned in the decentralized model (i.e., coordinating, scheduling, and managing DER transactions). REV does not only mandate the provision of the platform and the assignment of the coordinator role, but it also seeks to catalyze market forces (“market animation” is the term employed in many of the regulatory filings) through incentivizing deep participation of DERs (NY PSC 2015).
The implementation of the DSP (and REV writ large) have been advancing incrementally since 2014 through regulatory proceedings at the New York State Department of Public Service (the state utility regulator), as well as through the actions of other agencies (e.g., NYSERDA, NYPA, and NYISO) and through several utility-led demonstration/pilot projects. The principal regulatory docket through which the DPS is advancing is Case 14-M-0101.
Currently, the market design and system integration effort to realize the DSP centers on the concept of layered decomposition. “Layering” refers to the process of allowing each tier of the power system—transmission, distribution, and customer—to optimize for their own objectives while at the same time coordinating with nodes in adjacent tiers. See DOE 2017a, DOE 2017b, Taft 2016a, and Taft 016b).
A fully operational DSP entails a departure from the utility cost of service business model. Market-wide adoption of customer-sited DER and energy efficiency can reduce utility retail sales and delay infrastructure investments, which in turn can financially impact the utility’s shareholders (Satchwell et al. 2014). One of the main goals of REV’s Track Two is to incentivize DSP providers to achieve REV objectives by removing any misalignment between their shareholders’ financial interests and the REV program (NYSERDA 2020).
The Track Two Order (NY PSC 2106) still allows DSP providers a return for infrastructure investments, but also encourages them to find innovative ways to earn revenue, including: sharing savings from low-cost alternatives to conventional solutions (e.g., non-wires alternatives); receiving incentives from meeting REV objectives (e.g., performance-based earnings adjustment mechanisms); and charging for grid services provided (platform service revenues).
38 This report is available at no cost from the National Renewable Energy Laboratory at www.nrel.gov/publications.
A decentralized architecture envisions a layered arrangement, one where the TSO and DSO are responsible for their respective layers. Each would operate and optimize its own system and marketplace, award the most economic resources at each time interval of the market, and then dispatch accordingly. Coordination would be required to ensure that the real-time operations of both systems are co-optimized and that net interchanges at each substation are delivered according to the schedules set by the respective operators. Additionally, both TSOs and DSOs would need to coordinate on planning for their respective systems, such that long-term growth scenarios of DERs at the distribution level and generators at the transmission level are included in the other’s system planning (Kristov 2017).
Lastly, it should be noted that TSO/DSO coordination will involve cooperative federalism, or the sharing of responsibility between federal and state authorities in matters where their jurisdictions overlap. Cooperative federalism can be an efficient means of policymaking where both authorities create workable solutions to shared challenges instead of either duplicating each other’s legislative actions or legislating in conflict with one another; however, in the matter of transactive energy systems that allow dispatch of DERs to the wholesale market, the degree of cooperation and the extent of jurisdiction each authority will be allowed to exercise in the other’s purview are yet to be determined. FERC Order 841 has raised this issue, though it is far from settled (Clark and Gifford 2019). The bounds between federal and state regulatory oversight will continue to be tested and established as DERs continue to proliferate and market opportunities for their services become available.
5.2.2.3 End Users, Peer-to-Peer, and Blockchain Technology An important component of a TE distribution system is the ability of end-use customers to transact their DER services with one another (i.e., peer-to-peer [P2P] trading). Theoretically, there could be benefits to keeping these services local, including those that would accrue to the customers (e.g., avoiding certain system-level costs, the ability to source from local clean energy, community engagement, and so on) and utilities (e.g., infrastructure upgrade avoidance, matching of supply and demand at a local level).
P2P is a relatively new concept and there has been limited (but growing) implementation worldwide, with all projects currently pilot level. Examples include the Brooklyn Microgrid project in New York, Power Ledger’s partnership with Kansai Electric in Japan, and ABB’s partnership with Italian utility Evolvere to pilot P2P energy trading in Switzerland.
All three of these pilots are based on blockchain platforms and smart contracts. Blockchain is a “trustless,” distributed ledger technology that enables secure transactions between parties without the oversight or coordination of a centralized entity. Blockchain was first introduced as the underlying technology to Bitcoin, a virtual currency that does not require central banks to regulate supply, monitor transactions, and ensure balance between credits and debits across the Bitcoin ecosystem. Removing central authority from the system can reduce cost, settlement time, and the risks inherent in anonymous digital transactions (Cutler et al. 2018).
Smart contracts are self-executing contracts that have embedded terms and conditions in the computer code underpinning the distributed ledger of the blockchain. These contracts are coded as conditional logic (i.e., “if, then” statements). Smart contracts can enable instantaneous, frictionless transactions between parties provided the transaction meets a certain set of
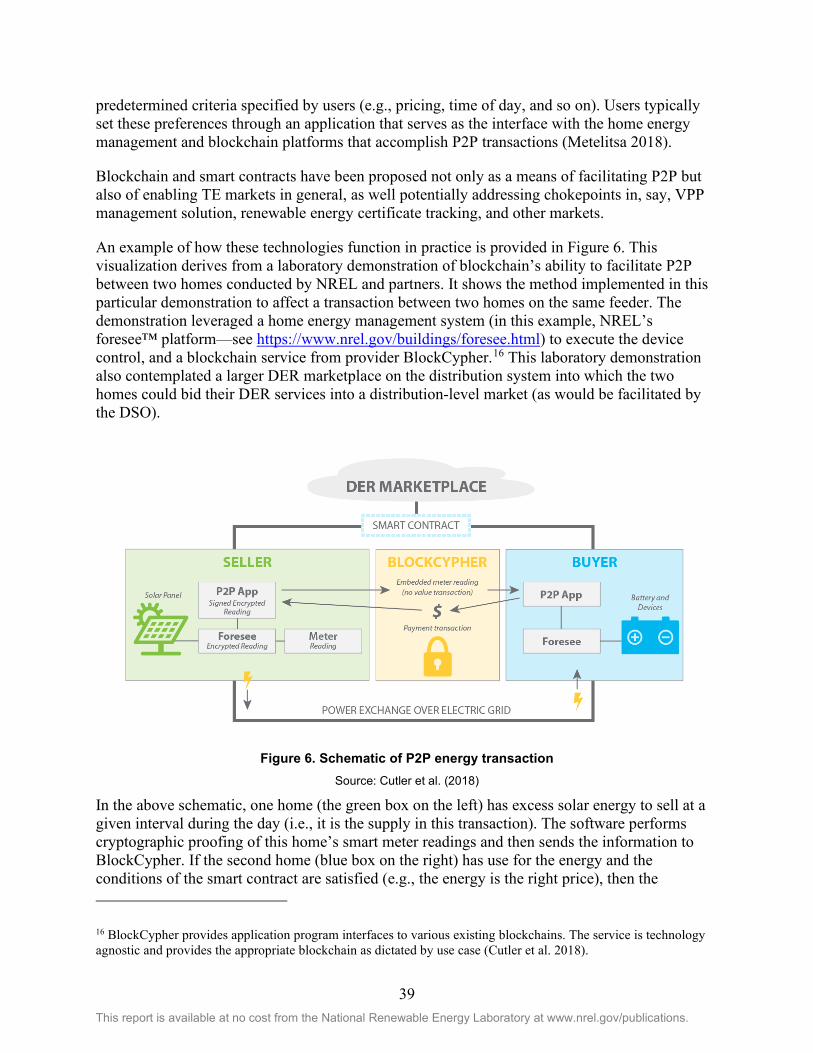
39 This report is available at no cost from the National Renewable Energy Laboratory at www.nrel.gov/publications.
predetermined criteria specified by users (e.g., pricing, time of day, and so on). Users typically set these preferences through an application that serves as the interface with the home energy management and blockchain platforms that accomplish P2P transactions (Metelitsa 2018).
Blockchain and smart contracts have been proposed not only as a means of facilitating P2P but also of enabling TE markets in general, as well potentially addressing chokepoints in, say, VPP management solution, renewable energy certificate tracking, and other markets.
An example of how these technologies function in practice is provided in Figure 6. This visualization derives from a laboratory demonstration of blockchain’s ability to facilitate P2P between two homes conducted by NREL and partners. It shows the method implemented in this particular demonstration to affect a transaction between two homes on the same feeder. The demonstration leveraged a home energy management system (in this example, NREL’s foresee™ platform—see https://www.nrel.gov/buildings/foresee.html) to execute the device control, and a blockchain service from provider BlockCypher.16 This laboratory demonstration also contemplated a larger DER marketplace on the distribution system into which the two homes could bid their DER services into a distribution-level market (as would be facilitated by the DSO).
Figure 6. Schematic of P2P energy transaction
Source: Cutler et al. (2018)
In the above schematic, one home (the green box on the left) has excess solar energy to sell at a given interval during the day (i.e., it is the supply in this transaction). The software performs cryptographic proofing of this home’s smart meter readings and then sends the information to BlockCypher. If the second home (blue box on the right) has use for the energy and the conditions of the smart contract are satisfied (e.g., the energy is the right price), then the
16 BlockCypher provides application program interfaces to various existing blockchains. The service is technology agnostic and provides the appropriate blockchain as dictated by use case (Cutler et al. 2018).
40 This report is available at no cost from the National Renewable Energy Laboratory at www.nrel.gov/publications.
transaction is verified through the consensus of the various nodes in the blockchain and a financial transaction (in tokens or cryptocurrency17) is executed. This financial transaction is accompanied by a corresponding transfer of energy from the first home to the second, which is accomplished through the foresee software (dispatch) and verified through a digital meter signature (Cutler et al. 2018).
This laboratory test validated the technical capability of P2P trading between two homes and the physical delivery (as opposed to virtual crediting) of electricity that is compensated by a financial payment. It was only conducted between two homes and did not address payments to the utility for use of its infrastructure.
There are challenges of working with an extensive network of nodes (users) because distributed consensus must be achieved to ensure transactions can be ordered and verified. Adding nodes and validator privileges can extend transaction time, such that the real-time trades required for TE systems may be out of reach. The consensus protocol, or the method to determine the order and integrity of the transactions on the blockchain platform, is a major factor in determining the time it takes to validate and settle transactions. There are several different protocols, each with their relative tradeoffs. This report calls out three in particular: proof of work, proof of stake, and proof of authority. An additional alternative is running private or permissioned chains which can avoid the complex settlement mechanisms outlined here (with the compromise of requiring credentialing for “trusted” participants or decreased security measures).
Table 6 summarizes each of the three consensus mechanisms.
17 The currency of blockchain platforms is virtual and represents some underlying value. For example, cryptocurrencies are backed by cash, though this monetary value fluctuates based on the activities in cryptocurrency markets. Bitcoin, for example, has demonstrated high value-volatility since its inception, and is much less of a static investment than, say, U.S. dollars. Tokens—generalized transaction units—can be based on any underlying asset, such as a kWh of electricity or an ownership stake in a community solar project (Metelitsa 2018).
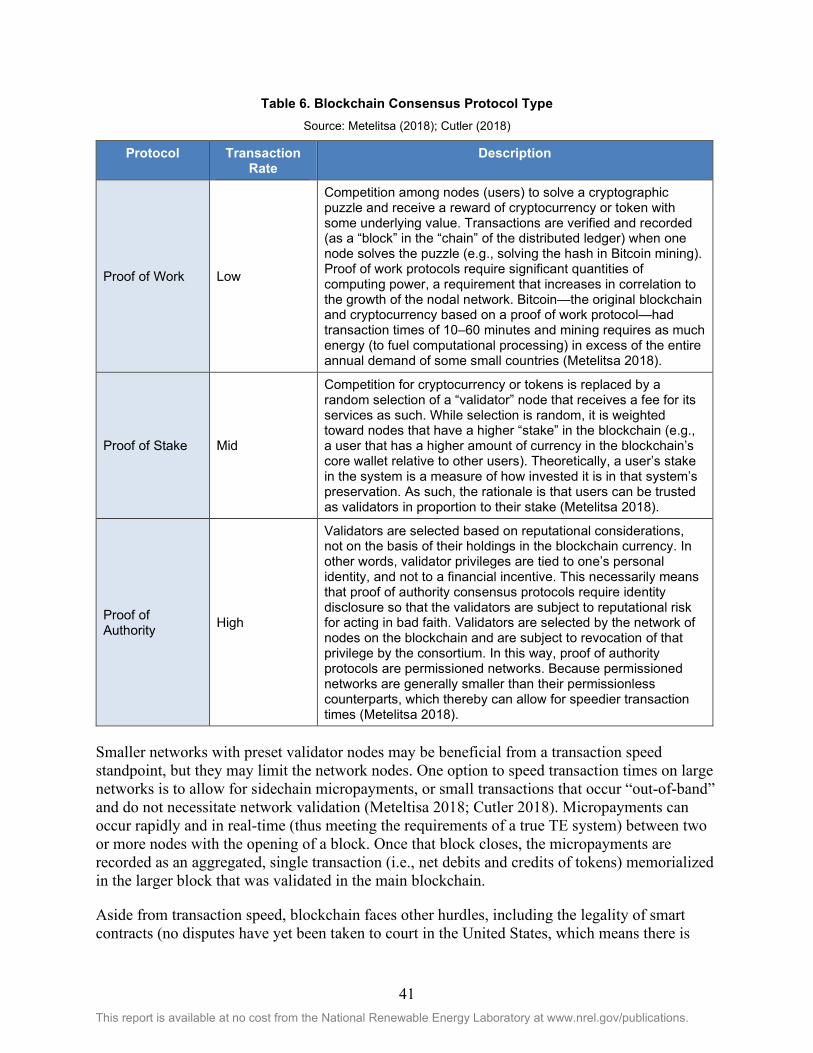
41 This report is available at no cost from the National Renewable Energy Laboratory at www.nrel.gov/publications.
Table 6. Blockchain Consensus Protocol Type Source: Metelitsa (2018); Cutler (2018)
Protocol Transaction Rate
Description
Proof of Work Low
Competition among nodes (users) to solve a cryptographic puzzle and receive a reward of cryptocurrency or token with some underlying value. Transactions are verified and recorded (as a “block” in the “chain” of the distributed ledger) when one node solves the puzzle (e.g., solving the hash in Bitcoin mining). Proof of work protocols require significant quantities of computing power, a requirement that increases in correlation to the growth of the nodal network. Bitcoin—the original blockchain and cryptocurrency based on a proof of work protocol—had transaction times of 10–60 minutes and mining requires as much energy (to fuel computational processing) in excess of the entire annual demand of some small countries (Metelitsa 2018).
Proof of Stake Mid
Competition for cryptocurrency or tokens is replaced by a random selection of a “validator” node that receives a fee for its services as such. While selection is random, it is weighted toward nodes that have a higher “stake” in the blockchain (e.g., a user that has a higher amount of currency in the blockchain’s core wallet relative to other users). Theoretically, a user’s stake in the system is a measure of how invested it is in that system’s preservation. As such, the rationale is that users can be trusted as validators in proportion to their stake (Metelitsa 2018).
Proof of Authority High
Validators are selected based on reputational considerations, not on the basis of their holdings in the blockchain currency. In other words, validator privileges are tied to one’s personal identity, and not to a financial incentive. This necessarily means that proof of authority consensus protocols require identity disclosure so that the validators are subject to reputational risk for acting in bad faith. Validators are selected by the network of nodes on the blockchain and are subject to revocation of that privilege by the consortium. In this way, proof of authority protocols are permissioned networks. Because permissioned networks are generally smaller than their permissionless counterparts, which thereby can allow for speedier transaction times (Metelitsa 2018).
Smaller networks with preset validator nodes may be beneficial from a transaction speed standpoint, but they may limit the network nodes. One option to speed transaction times on large networks is to allow for sidechain micropayments, or small transactions that occur “out-of-band” and do not necessitate network validation (Meteltisa 2018; Cutler 2018). Micropayments can occur rapidly and in real-time (thus meeting the requirements of a true TE system) between two or more nodes with the opening of a block. Once that block closes, the micropayments are recorded as an aggregated, single transaction (i.e., net debits and credits of tokens) memorialized in the larger block that was validated in the main blockchain.
Aside from transaction speed, blockchain faces other hurdles, including the legality of smart contracts (no disputes have yet been taken to court in the United States, which means there is
42 This report is available at no cost from the National Renewable Energy Laboratory at www.nrel.gov/publications.
currently no legal precedent for smart contract enforceability), cybersecurity and privacy, fraud protection, and, generally, proof of concept. Pilots between blockchain providers and utilities are becoming more common, though these are usually small-scale (Metelitsa 2018). While showing initial technical promise in facilitating P2P, as well as other applications (e.g., renewable energy credit trading, community solar asset ownership), blockchain is still in the early stages of deployment and demonstration. Interest and investment, however, remains high. As TE gains momentum as a solution for DER integration and valuation, so too may blockchain make strides as a platform of choice for executing and tracking distribution-level trades.
43 This report is available at no cost from the National Renewable Energy Laboratory at www.nrel.gov/publications.
Conclusion: The Elusive Economic Case for TE The technological composition of the distribution system, along with paradigms for its operation, management, planning, and regulation are in a state of flux. DERs have ushered in new possibilities for energy production, conveyance, and consumption while simultaneously confounding traditional business models and standard practices for pricing and selling electrical services. Jurisdictions across the United States are responding with legislative, regulatory, and/or utility-led initiatives—both large- and small-scale efforts—to manage these growing pains. But challenges persist in identifying exactly how DERs can integrate into the electricity grid and how to unlock the value these technologies can potentially provide to the stakeholders.
VPPs, transactive distribution markets, blockchain-based P2P trading, distributed inverter-based power quality management at the grid edge, and other novel approaches to unlocking DER-value have demonstrated some degree of technical feasibility. The economic case for TE, however, has been more elusive. Early signals of the economic viability of VPPs and DER aggregations can be glimpsed in examples such as Next Kraftwerke’ business model, or Sunrun’s winning VPP bid in the ISO-NE. But transactive marketplaces that draw on aggregations of DERs across an LDA for real-time balancing are likely still years away from implementation. Such marketplaces are, moreover far from proven in their ability to deliver net system benefits while simultaneously delivering beneficial economics to all participants. And, at a more fundamental level, DERs remain unproven in their ability to deliver the kind of system benefits and deferral value (i.e., as non-wires alternatives) that would justify a system to “animate” them as grid assets.
Moreover, several conditions would need to be met on any distribution grid before these transactive marketplaces could be developed. These include: high penetrations on feeders (enabling a “deep market”; technology development (e.g., refinement of DERMS applications and DER communications protocols, smart meter deployment, advances in blockchain and optimization algorithms, etc.); regulatory frameworks and market structures; and others. Until this groundwork is sufficiently laid, there is little evidence to suggest that TE could support the kind of economics that would incentivize DER-provider participation and provide utilities with a low-cost distribution system operational mode that still maintains reliability. In the United States, New York’s DSP experiment may be the first large-scale demonstration of the economic case for TE. Until the state transitions to this model, however, TE will likely continue to be incrementally applied and tested at pilot or small-scale levels. And where jurisdictions are not considering TE as a means of integrating DERs, alternative incremental steps—rate redesign, utility business model reform, procurement programs, and others—are being deployed to manage the evolution of the distribution system.
44 This report is available at no cost from the National Renewable Energy Laboratory at www.nrel.gov/publications.
References AEE (Advanced Energy Economy). 2018. Distribution System Planning: Proactively Planning for More Distributed Assets at the Grid Edge. https://info.aee.net/hubfs/Distribution%20System%20Planning%20FINAL%20-%2007-03-2018.pdf.
Andrianesis, Panagiotis, Michael Caramanis, Ralph Masiello, Richard Tabors, and Shay Bahramirad. 2020. “Locational Marginal Value of Distributed Energy Resources as Non-Wires Alternatives.” IEEE Transactions on Smart Grid 11, no. 1 (January 2020): 270-280. https://ieeexplore.ieee.org/stamp/stamp.jsp?arnumber=8731686.
Ardani, Kristen, Eric O’Shaughnessy, and Paul Schwabe. 2018. Coordinating Distributed Energy Resources for Grid Services: A Case Study of Pacific Gas and Electric. Golden, CO: National Renewable Energy Laboratory. NREL/TP-7A40-72108. https://www.nrel.gov/docs/fy19osti/72108.pdf.
Bird, Lori, Carolyn Davidson, Joyce McLaren, and John Miller. 2015. Impact of Rate Design Alternatives on Residential Solar Customer Bills: Increased Fixed Charges, Minimum Bills and Demand-Based Rates. Golden, CO: National Renewable Energy Laboratory. NREL/TP-6A20-64850. https://www.nrel.gov/docs/fy15osti/64850.pdf.
Birk, Michael, Jose Chaves-Avila, Tomas Gomez, and Richard Tabors. 2017. TSO/DSO Coordination in a Context of Distributed Energy Resource Penetration. Cambridge, MA: MIT Center for Energy and Environmental Policy Research. CEEPR WP 2017-017. http://ceepr.mit.edu/files/papers/2017-017.pdf.
Bundesnetzagentur and Bundeskartellamt. 2019. Monitoring Report: 2019. https://www.bundesnetzagentur.de/SharedDocs/Downloads/EN/BNetzA/PressSection/ReportsPublications/2019/MonitoringReport2019.pdf?__blob=publicationFile&v=1.
Clark, Tony, and Ray Gifford. 2019. “When Cooperative Federalism Becomes Compulsory: FERC Overreaches for Storage.” Utility Dive. https://www.utilitydive.com/news/when-cooperative-federalism-becomes-compulsory-ferc-overreaches-for-storag/555058/.
Cochran, Jaquelin, Mackay Miller, Owen Zinaman, Michael Milligan, Doug Arent, Bryan Palmintier, Mark O’Malley, Simon Mueller, Eamonn Lannoye, Aidan Tuohy, Ben Kujala, Morten Sommer, Hannele Holttinen, Juha Kiviluoma, et al. (2014). “Flexibility in 21st Century Power Systems.” Golden, CO: National Renewable Energy Laboratory. NREL/TP-6A20-61721. https://www.nrel.gov/docs/fy14osti/61721.pdf.
Cook, Jeffrey, Kristen Ardani, Eric O’Shaughnessy, Brittany Smith, and Robert Margolis. 2018. Expanding PV Value: Lessons Learned from Utility-led Distributed Energy Resource Aggregation in the United States. Golden, CO: National Renewable Energy Laboratory. NREL/TP-6A20-71984. https://www.nrel.gov/docs/fy19osti/71984.pdf.
45 This report is available at no cost from the National Renewable Energy Laboratory at www.nrel.gov/publications.
Cooke, A.L., J.S. Homer, and L.C. Schwartz. 2018. Distribution System Planning – State Examples by Topic. Richland, WA: Pacific Northwest National Laboratory. PNNL-27366. https://eta-publications.lbl.gov/sites/default/files/dsp_state_examples.pdf.
Cutler, Dylan, Ted Kwansik, Balamurugan Sivasathya, Samuel Booth, Bethany Sparn, and Karen Hsu. 2018. “A Demonstration of Blockchain-based Energy Transactions Between Laboratory Test Homes.” Presented at ACEEE Summer Study on Energy Efficiency in Buildings. https://www.osti.gov/biblio/1524316-demonstration-blockchain-based-energy-transactions-between-laboratory-test-homes.
De Carvalho, Ricardo, and Danish Saleem. 2019. Recommended Functionalities for Improving Cybersecurity of Distributed Energy Resources. Golden, CO: National Renewable Energy Laboratory. NREL/CP-5R00-74895. Presented at Resilience Week 2019, San Antonio, TX, November 4-7, 2019. https://www.nrel.gov/docs/fy20osti/74895.pdf.
DeMartini, Paul, Murdock, D., Chew, B., Fine, S. 2016. “Missing Links in the Evolving Distribution Markets.” ICF. https://www.icf.com/insights/energy/missing-links-evolving-distribution-markets.
DeMartini, Paul, and Lorenzo Kristov. 2015. Distribution Systems in a High Distributed Energy Resources Future: Planning, Market Design, Operation and Oversight. Berkeley, CA: Lawrence Berkeley National Laboratory. LBNL-100397. https://emp.lbl.gov/sites/all/files/lbnl-1003797.pdf.
Denholm, Paul, Robert Margolis, Bryan Palmintier, Clayton Barrows, Eduardo Ibanez, Lori Bird, and Jarett Zuboy. 2014. Methods for Analyzing the Benefits and Costs of Distributed Photovoltaic Generation to the U.S. Electric Utility System. Golden, CO: National Renewable Energy Laboratory. NREL/TP-6A20-62447. https://www.nrel.gov/docs/fy14osti/62447.pdf.
DOE (U.S. Department of Energy). 2017a. “Modern Distribution Grid: Volume I: Customer and State Policy Driven Functionality.” https://gridarchitecture.pnnl.gov/modern-grid-distribution-project.aspx.
DOE (U.S. Department of Energy). 2017b. “Modern Distribution Grid: Volume III: Decision Guide.” https://gridarchitecture.pnnl.gov/modern-grid-distribution-project.aspx
Enbala. 2018. “Virtual Power Plants: Coming Soon to a Grid Near You.” https://www.enbala.com/resource/virtual-power-plants-coming-soon-grid-near/.
FERC (The Federal Energy Regulatory Commission). 2016. “Notice of Proposed Rulemaking: Electric Storage Participation in Markets Operated by Regional Transmission Organizations and Independent System Operators.” https://www.ferc.gov/whats-new/comm-meet/2016/111716/E-1.pdf.
FERC. 2019a. “Order 841: Electric Storage Participation in Markets Operated by Regional Transmission Organizations and Independent System Operators.” https://www.ferc.gov/whats-new/comm-meet/2019/051619/E-1.pdf.
46 This report is available at no cost from the National Renewable Energy Laboratory at www.nrel.gov/publications.
FERC. 2019b. “FERC Approves First Compliance Filing on Landmark Storage Rule.” News Releases. https://www.ferc.gov/media/news-releases/2019/2019-4/10-17-19-E-1.asp#.Xelq2_lKiUk.
Flores-Espino, Francisco, Tian Tian, Ilya Chernyakhovskiy, Megan Mercer, and Mackay Miller. 2016. Competitive Electricity Market Regulation in the United States: A Primer. Golden, CO: National Renewable Energy Laboratory. NREL/TP-6A20-67106. https://www.nrel.gov/docs/fy17osti/67106.pdf.
Girouard, Coley. 2019. “The Top 10 Utility Regulation Trends of 2018.” Greentech Media. https://www.greentechmedia.com/articles/read/top-10-utility-regulation-trends-of-2018.
GMP (Green Mountain Power). 2019. “Resilient Home.” https://greenmountainpower.com/product/powerwall/.
Gundlach, Justin, and Romany Webb. 2018. Distributed Energy Resource Participation in Wholesale Markets: Lessons from the California ISO. The Energy Bar Association. http://columbiaclimatelaw.com/files/2018/05/Gundlach-and-Webb-2018-05-DER-in-Wholesale-Markets.pdf.
GWAC (GridWise Architecture Council). 2015. GridWise Transactive Energy Framework. Version 1.0. PNNL-22946. https://www.gridwiseac.org/pdfs/te_framework_report_pnnl-22946.pdf.
GWAC. 2018. Transactive Energy Systems: Research, Development and Deployment Roadmap. PNNL-26778. https://www.gridwiseac.org/pdfs/pnnl_26778_te_roadmap_dec_2018.pdf.
Hawaiian Electric. 2019. “Customer Self Supply.” Customer Renewable Programs. https://www.hawaiianelectric.com/products-and-services/customer-renewable-programs/private-rooftop-solar/customer-self-supply.
Hernandez, Kevin, and Quentin Watkins. 2018. “FERC Digs Deeper into Distributed Energy Resource Aggregation.” ScottMadden. https://www.scottmadden.com/insight/ferc-digs-deeper-into-distributed-energy-resource-aggregation/.
Hledik, Ryan, and Jim Lazar. 2016. Distribution System Pricing with Distributed Energy Resources. Berkeley, CA: Lawrence Berkeley National Laboratory. LBNL-1005180. https://emp.lbl.gov/sites/all/files/feur_4_20160518_fin-links2.pdf.
ICF International. 2016. Integrated Distribution Planning. Prepared for the Minnesota Public Utilities Commission. https://www.energy.gov/sites/prod/files/2016/09/f33/DOE%20MPUC%20Integrated%20Distribution%20Planning%208312016.pdf.
IEA (International Energy Agency). 2019. Status of Power System Transformation 2019. https://www.21stcenturypower.org/assets/pdfs/status-of-power-system-transformation-2019.pdf.
47 This report is available at no cost from the National Renewable Energy Laboratory at www.nrel.gov/publications.
IRENA (International Renewable Energy Agency). 2014. REthinking Energy. http://www.enr.fr/userfiles/files/Rethinking_FullReport_web_view.pdf.
ISO/RTO Council. 2020. “IRC History.” https://isorto.org/.
Kahrl, Fredrich, Andrew Mills, Luke Lavin, Nancy Ryan, and Arne Olsen. 2016. The Future of Electricity Resource Planning. Berkeley, CA: Lawrence Berkeley National Laboratory. LBNL-1006269. https://emp.lbl.gov/sites/all/files/lbnl-1006269.pdf.
Kristov, Lorenzo. 2017. “Modernizing Transmission-Distribution Interface Coordination for a High-DER Future.” U.S. Department of Energy Electricity Advisory Committee Meeting. https://www.energy.gov/sites/prod/files/2017/04/f34/2_T-D%20Interface%20Panel%20-%20Lorenzo%20Kristov%2C%20CAISO.pdf.
Kristov, Lorenzo. 2019. “The Bottom-Up (R)Evolution of the Electric Power System: The Pathway to the Integrated Decentralized System.” IEEE Power and Energy Magazine 17, no. 2 (March-April): 42-49. https://ieeexplore.ieee.org/document/8643617.
Kristov, Lorenzo, Paul DeMartini, and Jeffrey Taft. 2016. “A Tale of Two Visions: Designing a Decentralized Transactive Electric System.” IEEE Power and Energy Magazine 14, no. 3 (May-June): 63-69. https://ieeexplore.ieee.org/document/7452738.
Kuga, Roy, Mark Esguerra, and Alex Portilla. 2019. “Electric Program Investment Charge (EPIC): EPIC 2.02 – Distributed Energy Resource Management System.” Pacific Gas and Electric. https://www.pge.com/pge_global/common/pdfs/about-pge/environment/what-we-are-doing/electric-program-investment-charge/PGE-EPIC-2.02.pdf.
Lazar, Jim. 2016. “Electricity Regulation in the US: A Guide. Second Edition.” The Regulatory Assistance Project. https://www.raponline.org/knowledge-center/electricity-regulation-in-the-us-a-guide-2/.
Lowder, Travis, Paul Schwabe, Ella Zhou, and Douglas Arent. 2015. Historical and Current U.S. Strategies for Boosting Distributed Generation. Golden, CO: National Renewable Energy Laboratory. NREL/TP-6A20-64843. https://www.nrel.gov/docs/fy16osti/64843.pdf.
Metelitsa, C. 2018. “Blockchain for Energy 2018: Companies and Applications for Distributed Ledger Technologies on the Grid.” Wood Mackenzie.https://www.woodmac.com/reports/power-markets-blockchain-for-energy-2018-companies-and-applications-for-distributed-ledger-technologies-on-the-grid-58115325.
More Than Smart. 2017. “Coordination of Transmission and Distribution Operations in a High Distributed Energy Resource Electric Grid.” https://www.caiso.com/Documents/MoreThanSmartReport-CoordinatingTransmission_DistributionGridOperations.pdf
National Association of Regulatory Utility Commissioners (NARUC). 2016. “Distributed Energy Resources Rate Design and Compensation.” NARUC. https://pubs.naruc.org/pub/19FDF48B-AA57-5160-DBA1-BE2E9C2F7EA0
48 This report is available at no cost from the National Renewable Energy Laboratory at www.nrel.gov/publications.
National Grid. 2016. Implementation Plan for Distributed System Platform REV Demonstration Project. http://documents.dps.ny.gov/public/Common/ViewDoc.aspx?DocRefId=%7B4091DFAD-3661-47C1-9BEB-A936E1134B89%7D.
National Grid. 2019. “Distributed System Platform REV Demonstration Project: Q3 2019 Report.” http://documents.dps.ny.gov/public/Common/ViewDoc.aspx?DocRefId={AC42B5B4-E8E2-4887-91A2-7CDD73A9C204}.
Next Kraftwerke. 2019a. “Virtual Power Plant.” Technology. https://www.next-kraftwerke.com/vpp/virtual-power-plant.
Next Kraftwerke. 2019b. “Next Box & Software Interfaces.” Technology. https://www.next-kraftwerke.com/vpp/next-box.
Next Kraftwerke. 2019c. “Our Company.” Technology. https://www.next-kraftwerke.com/company.
NY PSC (New York Public Service Commission). 2015. Order Adopting Regulatory Policy Framework and Implementation Plan. http://documents.dps.ny.gov/public/Common/ViewDoc.aspx?DocRefId=%7BD6EC8F0B-6141-4A82-A857-B79CF0A71BF0%7D.
NY PSC. 2016. Order Adopting a Ratemaking and Utility Revenue Model Policy Framework. http://documents.dps.ny.gov/public/Common/ViewDoc.aspx?DocRefId=%7bD6EC8F0B-6141-4A82-A857-B79CF0A71BF0%7d.
NYISO (New York Independent System Operator). 2017. Distributed Energy Resources Roadmap for New York’s Wholesale Electricity Markets. https://www.nyiso.com/documents/20142/1391862/Distributed_Energy_Resources_Roadmap.pdf/ec0b3b64-4de2-73e0-ffef-49a4b8b1b3ca.
Padullaparti, Harsha, Santosh Veda, Surya Dhulipala, Murali Baggu, Tom Bialek, and Martha Symko-Davies. 2019. Considerations for AMI-Based Operations for Distribution Feeders. Golden, CO: National Renewable Energy Laboratory. NREL/CP-5D00-72773. Presented at the 2019 IEEE Power & Energy Society General Meeting, Atlanta, GA, August 4-8, 2019. https://www.nrel.gov/docs/fy19osti/72773.pdf.
Pechman, Carl. 2016. Modernizing the Electric Distribution Utility to Support the Clean Energy Economy. United States Department of Energy (DOE). https://www.energy.gov/sites/prod/files/2017/01/f34/Modernizing%20the%20Electric%20Distribution%20Utility%20to%20Support%20the%20Clean%20Energy%20Economy_0.pdf
PG&E (Pacific Gas and Electric). 2018. “Exploring Clean Energy Solutions.” https://www.pge.com/en_US/about-pge/environment/what-we-are-doing/clean-energy-solutions/clean-energy-solutions.page?WT.mc_id=Vanity_cleanenergy.
49 This report is available at no cost from the National Renewable Energy Laboratory at www.nrel.gov/publications.
Philipson, L., and H. L. Willis. 2006. Understanding Electric Utilities and De-Regulation. Second Edition. Taylor & Francis Group.
Proudlove, A., Lips, B., Sarkisian, D. 2019. “50 States of Solar.” NC Clean Energy Technology Center. https://nccleantech.ncsu.edu/wp-content/uploads/2019/04/Q1_19_SolarExecSummary_Final2.pdf
Ramdas, Ashwin, Kevin McCabe, Paritosh Das, and Benjamin Sigrin. 2019. California Time-of-Use Transition: Effects on Distributed Wind and Solar Economic Potential. Golden, CO: National Renewable Energy Laboratory. NREL/TP-6A20-73147. https://www.nrel.gov/docs/fy19osti/73147.pdf.
Roth, Alvin. 2018. “Marketplaces, Markets, and Market Design.” American Economic Review 108, no. 7: 1609-1658. http://cramton.umd.edu/market-design/roth-marketplaces-markets-and-market-design.pdf.
Satchwell, Andrew, Andrew Mills, Galen Barbose, Ryan Wiser, Peter Cappers, and Naim Darghouth. 2014. Financial Impacts of Net-Metered PV on Utilities and Ratepayers: A Scoping Study of Two Prototypical U.S. Utilities. Berkeley, CA: Lawrence Berkeley National Laboratory. LBNL-6913E. http://eta-publications.lbl.gov/sites/default/files/lbnl-6913e.pdf.
SCE (Southern California Edison). 2019. “Our Preferred Resources Pilot.” Meeting Demand. https://www.sce.com/about-us/reliability/meeting-demand/our-preferred-resources-pilot.
Shipley, Jessica. 2018. “Traditional Economic Regulation of Electric Utilities.” Regulatory Assistance Project. https://www.raponline.org/knowledge-center/traditional-economic-regulation-electric-utilities-3/.
Spector, Julian. 2019. “Sunrun Wins Big in New England Capacity Auction with Home Solar and Batteries.” Greentech Media. https://www.greentechmedia.com/articles/read/sunrun-wins-new-england-capacity-auction-with-home-solar-and-batteries.
St. John, J. “The Latest Skrimishes Around FERC Order 841.” Greentech Media. https://www.greentechmedia.com/squared/dispatches-from-the-grid-edge/the-latest-action-on-ferc-order-841?checkout#checkout.
Tabors, Richard, Panagiotis Andrianesis, Michael Caramis, and Ralph Masiello. 2019. “The Value of Distributed Energy Resources to the Grid: Introduction to the Concepts of Marginal Cost of Capacity and Locational Marginal Value.” Proceedings of the 52nd Hawaii International Conference on System Sciences. https://scholarspace.manoa.hawaii.edu/bitstream/10125/59782/0342.pdf.
Taft, Jeffrey. 2106a. Architectural Basis for Highly Distributed Transactive Power Grids: Frameworks, Networks, and Grid Codes. Richland, WA: Pacific Northwest National Laboratory. https://gridarchitecture.pnnl.gov/media/advanced/Architectural%20Basis%20for%20Highly%20Distributed%20Transactive%20Power%20Grids_final.pdf
50 This report is available at no cost from the National Renewable Energy Laboratory at www.nrel.gov/publications.
Taft, Jeffrey. 2106b. Grid Architecture 2. Richland, WA: Pacific Northwest National Laboratory. https://gridarchitecture.pnnl.gov/media/white-papers/GridArchitecture2final.pdf
Thomas, Sharon. 2018. “Evolution of the Distribution System & the Potential for Distribution-level Markets: A Primer for State Utility Regulators.” NARUC. https://www.naruc.org/default/assets/File/201801%20Evolution%20of%20the%20Distribution%20System.pdf.
Thomas, Sharon, Surampudy, Medha, and Mark Knight. 2019. Transactive Energy: Real-World Applications for the Modern Grid. Smart Electric Power Alliance (SEPA). https://sepapower.org/resource/transactive-energy-real-world-applications-for-the-grid/
Zinaman, Owen, Mackay Miller, Ali Adil, Douglas Arent, Sonia Aggarwal, Minnesh Bipath, Carl Linvill, Ari David, Matt Futch, Richard Kauffman, Eric Martinot, Morgan Bazilian, and Reji Kumar Pillai. 2015. Power Systems of the Future: A 21st Century Power Partnership Thought Leadership Report. Golden, CO: National Renewable Energy Laboratory. NREL/TP-6A20-62611. https://www.nrel.gov/docs/fy15osti/62611.pdf.
Related Documents