The Effects of Negative Political Advertising on Young College-Educated Voters The Honors Program Senior Capstone Project Student’s Name: Sean Donahue Faculty Sponsor: Prof. John Dietrich April 2011

Welcome message from author
This document is posted to help you gain knowledge. Please leave a comment to let me know what you think about it! Share it to your friends and learn new things together.
Transcript
The Effects of Negative Political Advertising on Young College-Educated Voters
The Honors Program Senior Capstone Project
Student’s Name: Sean Donahue Faculty Sponsor: Prof. John Dietrich
April 2011
Table of Contents Abstract ..................................................................................................................................... 1 Introduction ............................................................................................................................... 2 Past research .............................................................................................................................. 5 Rationale and hypotheses ........................................................................................................ 16 Methodology ........................................................................................................................... 18 Results ..................................................................................................................................... 19 Discussion ............................................................................................................................... 25 Appendices .............................................................................................................................. 29
Appendix A – (Pre-Video Survey) ...................................................................................... 30 Appendix B – (Post-Video Survey) .................................................................................... 32 Appendix C – (Newscast) ................................................................................................... 33
References ............................................................................................................................... 34
The Effects of Negative Political Advertising on Voters in College Senior Capstone Project for Sean Donahue
- 1 -
ABSTRACT This study examines the effectiveness of negative and positive political advertisements among
voters in college. The study builds on past research exploring negative political advertising
and demobilization and mobilization theories. Additionally, potential backlash against
sponsoring candidates of negative policy-based attack ads is looked at as is whether those
who regularly follow politics are affected differently by ads than those who do not. Fifty-three
college students participated in an experiment in which they rated two candidates based on
any prior knowledge and political party, assessing favorability and the likelihood of voting for
each candidate. Students then watched a ten minute newscast with either a positive or
negative ad sponsored by the same candidate embedded during the commercial break. They
were asked again to assess their favorability and likelihood of voting for each candidate. No
results were found in support of either mobilization or demobilization theories. Results did
not show backlash after viewing the negative ad. The positive ad, however, proved more
effective in increasing both the sponsoring candidate’s favorability and participants’ reported
likelihood of voting for him. Additionally, these findings do not support past research
claiming differences in effects between those who regularly follow politics and those who do
not.

The Effects of Negative Political Advertising on Voters in College Senior Capstone Project for Sean Donahue
- 2 -
INTRODUCTION Negative campaigning has been a feature of American politics for centuries. As far back as
1828, when President John Quincy Adams’ supporters distributed flyers accusing his
opponent Andrew Jackson of executing 13 militiamen without cause 15 years earlier,
attacking the opposition has become a popular strategy. While going negative as a campaign
strategy is a frequently debated tactic among academics and the media, politicians still see it
as an effective way of gaining an edge over an opponent, and over the last ten years the use of
negative advertising has continued to increase as a percentage of the total ads run (An Uptick
in Negativity, 2010). The 2010 elections featured some of the most negative campaigning in
history.
The January 2010 Supreme Court Case Citizens United vs. Federal Election Commission
further opened the door for corporations, unions and other outside organizations to spend
unlimited money on advertising during campaigns, and during the 2010 elections around 89%
of ads run by outside groups were negative (AP, 2010). Politicians did not let outside groups
handle all the attacking as they contributed some of the most vicious attack ads of the election
themselves. Overall, approximately two out of every three ads run during the campaign were
negative (An Uptick in Negativity, 2010). Outside groups can mask their contributors and true
sponsors of the ads and thereby face minimal backlash, but politicians can be held
accountable by voters when they run the ads and thus need to be more selective about what to
run.
The effects of negative advertising have often been studied, but little consensus exists among
researchers on two key issues. Researchers have disagreed as to whether an ad’s negative
impact on an opposing candidate outweighs the backlash to the sponsoring candidates.
Additionally, there is no clear agreement as to whether negative ads have a demobilizing or
stimulating effect on voter turnout. Much of the problem with measuring impact is because
negative advertising can be run for different reasons. Some politicians use it to get their base
motivated to vote or contribute, others use it to turn independents away from their opponents,
and some use it to discourage voters from turning out at all. Not always knowing the
motivations behind an ad makes it especially difficult to judge its effectiveness. Many studies
The Effects of Negative Political Advertising on Voters in College Senior Capstone Project for Sean Donahue
- 3 -
come to inconclusive results or found their results cannot be generalized to all people. Some
studies have looked at effects on different demographic groups and found more conclusive
results.
One demographic group of current interest to politicians is young voters, a group that has
voted largely in favor of Democrats over the past decade. In recent elections the youth vote -
voters aged 18 to 29 – has been key, with midterm election youth turnout hovering between
20-26 percent of eligible voters, down significantly from 30 years ago when it peaked at 32
percent (Youth Turnout About 20%, Comparable to Recent Midterm Years, 2010). In 2010,
youth turnout, at 20 percent was one of the lowest yet. Youth voters as a percentage of all
who voted also dropped significantly in the last two years, having made up a reported 18
percent of voters in 2008 and only nine percent in 2010 (Exit Poll: Lower Turnout Among
Youth and Black Voters, 2010). The downward trend does not have to continue. The 2006
midterms saw a four percent increase in young voter turnout as a percent of the total youth
population over the prior midterms, and the 2008 Presidential election saw the largest young
voter turnout since 1992 with at least a two percent increase over 2004, the only age group to
show such an increase (Kawashima-Ginsberg & Kirby, 2009). Additionally, these studies
have shown young citizens with some college experience are around twice as likely to vote as
those that have never attended collge. Since college enrollment is at its highest ever rate at
over 70 percent of high school graduates, this is another indication that youth turnout can be
increased (Rampell, 2010).These signs suggest that if candidates can find an effective method
to engage young voters they can make a significant difference in an election.
With negative advertising a constantly increasingly used technique, and youth voter turnout
becoming a key to winning or losing a close election, this study asks if there is a relationship
between the two. Rather than attempting to find general trends among all voters, this study
looks solely at a specific demographic: young voters with some college education.
Additionally, instead of looking at the combined effects of all ads run in a campaign, this
study will focus in on one negative ad compared to a positive ad by the same candidate, Russ
Feingold on the same theme: jobs. Feingold based many of his ads on the issue of jobs trying
to motivate supporters. His negative ad also contained a bit of contrast, including one of his

The Effects of Negative Political Advertising on Voters in College Senior Capstone Project for Sean Donahue
- 4 -
own views, acting to differentiate his opponent from himself and mobilize voters with a clear
choice. This study focuses on candidate sponsored negative ads, where viewers are clear
about the sponsorship and the ad can potentially lead to backlash against the sponsoring
candidate. The study looks at how an ad affects the favorability rating of both candidates and
self-reported likelihood of future turnout from potential voters.
The Effects of Negative Political Advertising on Voters in College Senior Capstone Project for Sean Donahue
- 5 -
PAST RESEARCH The effects of negative political advertising have long been studied not only in the United
States, but across the globe. Effects have been found to differ depending on the type of ad and
the region or people targeted. Some studies have found no generalizations can be made on the
effects of negative advertising, while among those that have come to conclusions there is little
agreement. This review of past research will look at studies covering four topics related to
negative advertising: their effects on mobilization, their effects on both candidates’
favorability ratings, their effects on cynicism, and their perceived effects by campaign
managers.
Many studies have looked at two dominant political advertising theories: the demobilization
and stimulation hypotheses. While the demobilization hypothesis claims negative advertising
decreases turnout, the stimulation hypothesis argues the opposite. One frequently cited study
looking at that issue was conducted during the 1990 California gubernatorial race, 1992
California Senate races, and 1993 Los Angeles mayoral race (Ansolabehere S., Iyengar,
Simon, & Valentino, Dec. 1994). The researchers created advertisements that were identical
in all aspects but tone (the basic content was the same, but one ad spoke positively about a
candidate and the other attacked the opposition on the same issues) and were impossible to
distinguish from ads candidates would typically run. These ads were created for all three
elections which featured distinct circumstances ranging from the typical two party races to the
non-partisan mayoral race. These were then embedded in a 15 minute newscast. Three groups
existed in each study: one in which the newscasts viewed contained a negative political ad,
one that contained a positive ad, and a third that contained a product ad in place of any
political ad. Participants, who were paid and recruited with newspaper and employee
newsletter ads, flyers, and phone calls to people on voter registration lists, were given a basic
pre-test to determine background information such as media viewing habits and political
interest. After viewing the 15 minute newscast complete with the ad, the participants were
given a lengthy posttest survey about beliefs on campaign issues, voting intentions, and level
of involvement in the campaign. The researchers then grouped voters into categories of
likelihood of voting, basing their judgment on self-reported likelihood to vote and whether the
participants were actually registered and eligible to vote. Their study found that among those

The Effects of Negative Political Advertising on Voters in College Senior Capstone Project for Sean Donahue
- 6 -
who saw a positive ad, 64 percent were likely to vote, among those who saw a product ad, 61
percent were likely to vote, and among those who saw a negative ad 58 percent were likely to
vote. The 6 percent gap was statistically significant. They also found in their research that
turnout in the 1992 senate elections was significantly reduced in states that had a relatively
negative campaign. Their results lend support to the authors’ belief in the demobilization
theory.
A study conducted during the 1996 Presidential election used a different method to analyze
the effects of negative advertising and found results that questioned the demobilization theory
(Goldstein & Freedman, August 2002). The researchers did not trust the evidence supporting
the demobilization theory, and instead believed they could support the stimulation theory.
Using information from the Campaign Media Analysis group, they were able to determine
how frequently specific ads where run and when and where they were run. They coded every
ad as negative or positive. Negative ads were further coded as contrast spots (those containing
some positive statements about the sponsor) or pure negative ads. They then looked at local
and national television viewing habits to create a television viewing scale. From that they
created a measure of ad exposure which was multiplied by the total number and type of ads
aired by or on behalf of each candidate in each market to create a measure for each
respondent. This was then compared to American National Election Studies survey data of
self reported turnout. They also analyzed individual measures of exposure to negative or
contrast ads based on respondents’ TV viewing habits. They found both negative and contrast
ads appeared to mobilize the electorate, while positive advertising had no significant effect on
turnout all other variables being equal. Additionally, while looking at specific groups, the
research discovered no evidence of any kind to support the demobilization theory for citizens
who are less politically engaged, and found no significant difference in effects from those
who were more politically engaged. While this study used sound statistical measures, its
results may be different than those of studies conducted on midterm elections. Candidates in
Presidential elections often have much greater exposure beyond just advertising, and as such
negative ads may not have the same effect on candidates for Congress.

The Effects of Negative Political Advertising on Voters in College Senior Capstone Project for Sean Donahue
- 7 -
A study published in 1999 also questioned the demobilization theory (Wattenberg & Brians,
Dec. 1999). Using the American National Election Studies survey data, the researchers found
that in 1992, 18 percent of respondents remarked there was too much negative advertisement.
However, despite the assumption that this group would be expected to be demobilized, this
group’s reported turnout was six percentage points higher than those who did not have this
viewpoint. In 1996, only five percent thought there was too much negative advertisement and
their turnout was one percent below the rest of the sample. Those who recalled either positive
or negative ads were more likely to vote, and there was no significant difference between
groups. Demographic groups that often do not vote - those without a high school diploma,
pure independents, independent leaners, and young people – also saw double digit increases in
voter turnout among those who recalled an ad, positive or negative, over those who did not.
Additionally, those with low political efficacy, the belief that one actually can have influence
on an election, a group often theorized by academics to be demobilized by negative ads, were
actually more likely to vote if they recalled an ad, regardless of whether it was positive or
negative, than if they were unable to recall one. Turnout among voters who had not voted in
the previous election also saw an increase among those who recalled either kind of
advertising. Interestingly, one of the few groups to go against this trend was college
graduates, who saw a slight decrease among those who recalled negative ads most strongly.
The study also found political efficacy was higher among those who recalled negative ads in
1992 and no significant difference existed in 1996. Even when the data are controlled to rule
out factors such as following politics in newspapers or TV, there were no data to support
demobilization theories. There were some questions about the methods used in this study,
however, and these issues were addressed in the following article in the same journal.
That article once again defended the demobilization theory with a different analysis of the
same NES data (Ansolabehere, Iyengar, & Simon, Dec. 1999). The researchers disagree that
recall is an adequate substitute for measuring exposure, and argue that recall itself may be
caused by turnout. Having found in their own experiments that just thirty minutes after
watching a campaign ad only half the viewers actually could recall having seen one, the three
researchers argued that using recall was an unacceptable method of measuring who actually
viewed ads. The researchers then did their own analysis of the data. Instead of recall, they

The Effects of Negative Political Advertising on Voters in College Senior Capstone Project for Sean Donahue
- 8 -
used Combined Gross Ratings Points of the presidential ad buys in each state to calculate the
likelihood that a randomly selected individual is exposed to political ads in general, and
negative ads in particular. Since negative advertising generally increases as Election Day
draws nearer, that was also factored into their equation. They made four groups based on
whether participants were in a high ad buy state or low ad buy state and when they were
interviewed, since those interviewed closer to the election were likely to have seen more ads.
Their analysis found that exposure to negative advertising actually lowers reported intention
to vote, while exposure to positive advertising showed no significant effects. They also found
greater turnout in races featuring mostly positive ads over races featuring a mix or mostly
negative ads. Based on their findings and their review of experimental, survey and aggregate
data, the researchers found strong support for the demobilization theory.
A 2004 study conducted by Joshua D. Clinton of Princeton University and John S. Lapinski
of Yale University also looked at the demobilization and stimulation hypotheses. They also
explored whether independents are affected differently than partisans. Over 10,400,
respondents were placed in five different groups and presented with either a single positive or
a single negative ad from Democratic Presidential candidate Al Gore, a positive and negative
ad from Gore, or a Gore negative and Republican Presidential candidate George W. Bush
positive or negative ad. Participants were then surveyed. No statistically significant evidence
was found to reject the null hypothesis that the probability of voting is unrelated to exposure
to negative advertising. However, when testing against the stimulation hypothesis, the
researchers found a slight increase in self-reported future voter turnout among those who had
seen either a positive or a negative ad over those who had seen no ad. Nonetheless, they found
no significant difference in self-reported turnout between those who had seen a positive ad
and those who had seen a negative ad.
The researchers also found that ads were more likely to get voters to turnout if they were
about an issue that had direct effects on the viewer. Contrary to a frequently held belief by
academics, they found independents were not affected by the negative advertisements
differently than were Republicans and Democrats. Additionally, challenging another
commonly held belief, respondents who paid a great deal of attention to campaigns were

The Effects of Negative Political Advertising on Voters in College Senior Capstone Project for Sean Donahue
- 9 -
actually found to be less likely to vote after being exposed negative advertisements, though
this was not the case for other voters. Again, however, since this study looked at a Presidential
election, results may differ from a midterm election in which candidate exposure by means
other than advertising is often lessened.
Studies looking at the demobilization theory and stimulation theory have shown mixed
results. Even studies looking at the same data through different means of analysis have come
to different conclusions. Self-reported recall of ad viewership, as used in the 1999 Wattenberg
and Brians study, is clearly a poor measure of actual viewership. Not only does the evidence
in Ansolabehere’s research disprove recall as an adequate measure of viewership, but also it
seems likely that those who take an interest in the election are more likely to recall ads and
vote than those who do not. The two studies providing the most solid evidence against
demobilization, Clinton and Lipinski (2004) and Goldstein and Freedman (2002), were
conducted on Presidential elections and thus may have come up with different results based
on voters seeing the ads already having more knowledge of the candidates. Those based on
congressional elections and other less publicized contests generally supported demobilization
theory whether the study was based on NES survey data, actual results compared to the tone
of the campaign or their own controlled experiment.
Other studies looked at how candidate favorability was affected by negative ads. Rather than
conducting an experiment, a 1984 study by Sharyne Merritt of California Polytechnic
University uses a survey in a California district during an election. Merritt interviewed 314
people about the California State Assembly race between Democrat Tom Hayden and
Republican Bill Hawkins. Hawkins advertised largely with negative billboards attacking
Hayden’s positions, and not a single respondent had a positive response when asked how they
felt about the billboards. Fifty-one percent who recalled Hawkins’ billboards expressed
negative feelings towards him, while only 36 percent expressed negative feelings towards
Hayden, the ads’ target. Hayden’s campaign spent much of its money on TV advertising, with
some of it directed towards ads discrediting Hawkins and his billboards. Of those who
recalled Hayden’s negative spot, 13 percent expressed negative views of Hawkins in
response, but just as many also responded with negative views of Hayden. Merritt argued
The Effects of Negative Political Advertising on Voters in College Senior Capstone Project for Sean Donahue
- 10 -
both these results led credence to her hypothesis that negative advertising produces negative
responses to both the target and the sponsor. Of additional interest, Merritt also found that
most Republicans could not correctly identify the sponsors of Hawkins’ billboards, often
believing they were views Hayden was actively promoting, while a majority of Democrats
and independents were able to identify Hawkins as the sponsor. Unsurprisingly, Republicans
were likely to respond with anger towards Hayden, while Democrats were more likely to
respond with anger towards Hawkins, and independents were evenly split. Similarly, only
Democrats responded negatively towards Hawkins after viewing Hayden’s ads about his
billboards. These findings and others contributed support to her second hypothesis that
partisanship mediates media effects.
A study conducted during the 1993 Canadian federal election looked at the effects of an attack
ad on attitudes towards the two candidates (Haddock & Zanna, June 1997). During the
election, the Progressive Conservative party ran two ads focusing on the facial paralysis of
opposition candidate Jean Chretien. The two researchers ran an experiment with 110
volunteer subjects, having them complete measures of attitudes, affective responses, and
cognitive responses concerning Conservative leader Kim Campbell and liberal leader Jean
Chretien. One group answered the questions before viewing the advertisements and another
filled out the survey after viewing them. Those who filled out the survey after were found
more likely to list positive feelings and attributes towards Chretien and negative feelings
about Campbell than those who filled out the survey before viewing the ads, showing a
potential for negative ads to have a backlash against the candidate or party that runs them.
A psychological study in 1996 looked at campaigns as pairs rather than individually (Houston
& Doan, 1996). Instead of focusing on how a single candidate’s negative ads affected views
and turnout, this research compared elections in which both candidates focused on their own
positives with elections in which both candidates focused on attacking the opposition.
Participants who volunteered for the study read basic information on two Senate candidates
consisting of positive and negative characteristics pre-tested to be approximately equivalent.
Positions on five issues, were reported with one taking the liberal viewpoint and the other the
conservative. Participants were classified as liberal or conservative based on self-report.

The Effects of Negative Political Advertising on Voters in College Senior Capstone Project for Sean Donahue
- 11 -
Participants were then randomly placed in four groups, either exposed to positive campaign
ads from both candidates, negative ads from both candidates, a positive ad from the liberal
candidate and a negative ad from the conservative, or a negative ad from the liberal candidate
and a positive ad from the conservative. Post-test results showed that a positive-positive
campaign produced higher rating for both candidates as well as greater self-reported
likelihood of voting than a negative-negative campaign. Interestingly enough, the research
also found that the assessments of a shared ideology candidate (e.g. a liberal participant rating
a liberal politician) was downgraded for running a negative campaign only when their
opposition was also running a negative campaign, while assessments of opposing ideology
candidate running a positive campaign were only upgraded when the shared ideology
candidate was also using a positive campaign.
Another study looking at potential backlash was conducted by University of Minnesota
Professor Patrick C. Meirick in 2005. Using an experiment with 107 volunteers from
communication classes, Meirick split the students into four groups, showing a Democrat or
Republican negative ad sponsored by a corresponding candidate or a corresponding political
party. The ads were embedded in a 15 minute game show and were real ads that had similar
themes. Participants were then given a post-test evaluating their views of the candidates.
Meirick’s experiment yielded surprising results. Meirick found that attacking candidates were
evaluated more favorably when participants saw candidate-sponsored attacks rather than
party-funded attacks. This was unexpected since candidate-sponsored attack ads must be
approved by the candidate and can directly be attributed to them, while party-sponsored attack
ads are not always approved by the candidate. The experiment also found that those with
greater political knowledge were better able to identify who sponsored an ad. While these
findings provide interesting results, taking subjects only from communication classes may
lead to more media literate participants who view ads differently which could skew results.
Past studies show clearly that negative ads can have a backlash effect. Whether that backlash
is worse than the negative effects on the opposition appears to vary greatly depending on the
type of campaign being run by both candidates and the ad’s sponsor (politician vs. party
sponsored). Beyond that, some results, such as Meirick’s, have led to counter-intuitive
The Effects of Negative Political Advertising on Voters in College Senior Capstone Project for Sean Donahue
- 12 -
conclusions. While people may better relate personally to ads attacking a candidate’s
character, it seems that the specific content of the ad would also likely play a role on whether
the backlash is worse than from an ad attacking policy. That party sponsored ads lead to more
negative backlash against a candidate than candidate sponsored ads could also be a result of
the content itself, since that could not be fully controlled in the experiment using real ads
(Meirick, Summer 2005). Some of these studies also have inherently skewed groups of
participants that could lead to differing results.
Another topic of interest was whether negative ads were educative (helped to increase voters
knowledge about the candidates) or if they caused cynicism (made voters distrust the political
process), often with a focus on the issue of whether or not political sophisticates are affected
differently. Adding questions to the belief that negative advertisements cause cynicism are the
findings of research conducted in 1999 (Lau, Sigelman, Heldman, & Babbitt, Dec. 1999).
This meta-analysis of 52 different studies came to three conclusions. First, it found no
statistically significant evidence to suggest negative ads are liked less than positive ads. Its
second finding was that there is no evidence to support the contention that negative ads are
more effective than positive ads. Finally, it found little evidence to support the claim that the
increasing use of negative ads is hurting electoral participation.
Another study looking at negative ads’ potential effects on cynicism was done in 2002
(Pinkleton, Nam-Hyun, & Austin, Spring 2002). This experiment had 246 participants
randomly assigned to one of two groups: a treatment or a control group. Those in the
treatment group received fictional statements about candidates for a state senate seat in
Georgia. Participants read each candidate’s bio and then completed a series of pretest scales.
They were then given three different advertisements: a positive ad, a contrast ad, and a
negative ad in print form. The control group simply read an essay about Georgia. The more
negative the advertisement was the more negativism participants reported towards political
campaigns. Additionally, participants also found the positive ads more useful towards their
knowledge than either the negative or contrast ads. However, there was no difference in
reported apathy towards politics after viewing any of the three advertisements, and the study
puts in doubt whether negative ads lead to cynicism.

The Effects of Negative Political Advertising on Voters in College Senior Capstone Project for Sean Donahue
- 13 -
Providing evidence that political sophisticates are influenced differently was a 2005 study
done by Daniel Stevens of Hartwick College. Stevens created an experiment with four
conditions: control, one negative ad, and repetition of negative ads towards a Democrat or
negative ads towards a Republican. Ads were embedded in a 15 minute news broadcast. Each
group contained over 40 subjects who were recruited from introductory political science
classes. All subjects were measured on their level of political sophistication based on factual
knowledge about the government. Stevens’ results showed that low political sophisticates
exhibit few information gains or even less information about the candidates after a single
exposure to a negative ad than those who did not see any political advertising. High
sophisticates showed slight information gains under the same condition. Their ability to place
candidates relative to each other on specific issues increased, while low sophisticates’ ability
to do the same decreased. These results show that if negative ads are educative, it is not the
case for all individuals. Even with repeated exposure to the same ad, the low sophisticates did
not seem to gain information. Additionally, the study showed high sophisticates, while
increasing the numbering of likes and dislikes of candidate characteristics and policy views
after one ad, actually showed less likes and dislikes after seeing the same ad multiple times.
His study also found that exposure to multiple negative ads or the same negative ad multiple
times prompted more thoughts about the messages of the advertising, with most being
negative, and more resentment, regardless of political sophistication. This study, however,
should be questioned for its external validity since students from a political science class are
likely to have a higher average level of political sophistication than the general public.
A 2008 study looked at character-based negative ads’ effects on cynicism and self-efficacy,
the belief an individual can have an effect on politics, differed from policy based negative ads
(Dardis, Shen, & Edwards, Winter 2008). The experiment had 129 undergraduate student
participants from a large university and used a completely crossed 2 (political ad type: issue
versus character) × 3 (message exposures: one, three, or five ads) between-subjects design.
Post-tests found that viewers of policy based attack ads reported higher political cynicism
than those who were exposed to character based attack ads. Viewers of character based ads
were found to have higher levels of perceived self-efficacy. Unlike past research that
generalized negative ads, this study showed a distinction between the effects of policy and

The Effects of Negative Political Advertising on Voters in College Senior Capstone Project for Sean Donahue
- 14 -
character based attack ads and actually found ads attacking character produced more positive
gains in self-efficacy and decrease in cynicism.
The studies explored here show little evidence to support the claim that negative political ads
cause cynicism. However, some of these studies do show a distinction among high and low
political sophisticates as high political sophisticates are able to gain some knowledge from
low exposure to negative ads, while that may not be the case for low political sophisticates.
A study conducted by four researchers at the University of Maryland focused on the 1998
congressional election took a different approach opting to get data from campaign managers
instead of voters (Abbe, Herrnson, Magleby, & Patterson, Feb 2000). The study found that
campaigns run by professionals as opposed to those run by people with little political
experience were more likely to go negative as were those campaigns in close elections or
facing incumbents. They also found that outside organizations running negative ads in a race
encouraged the candidates themselves to go negative. Consultants often believe going on the
attack is the most effective strategy to neutralize attacks from opponents and outside groups.
They found, however, that despite experienced campaign managers’ beliefs, negative
advertising is not statistically related to the percent of votes that candidates receive. Even
focusing on competitive challengers and open-seat races, negative ads did not improve
electoral performance. They did find a few specific cases in which negative ads helped
candidates; however, they also found some in which a misleading negative ad hurt the
candidate running it more than helping him or her. Overall the study found candidates waging
negative campaigns do not receive significantly more votes than those who run positive
campaigns. They found a positive correlation between the amount of money candidates spend
on campaign communication and voter share.
While several methods have been used to examine and question the effectiveness of negative
ads, it is clear experienced campaign managers believe they have their use and are an
important part of an overall campaign strategy. Studies such as Houston and Doan’s 1996
psychological study lend some credence that negative advertising may be an effective counter
to an opponent’s negative ads. However, the belief among campaign managers that spending

The Effects of Negative Political Advertising on Voters in College Senior Capstone Project for Sean Donahue
- 15 -
money on negative ads increases their share of the vote appears to be nothing more than a
myth.
Past research leads to very few clear conclusions; however, effects often appear more
concrete when studying specific demographic groups. Additionally, those who are more
politically informed appear to take more information out of negative ads than those who are
less politically informed. Negative ads also seem to have a relatively demobilizing effect in
non-Presidential elections. Not many studies have made the distinction among character- and
policy-based attack ads, but one found-policy based attack ads led to more backlash and
cynicism than character-based attack ads (Dardis, Shen, & Edwards, Winter 2008). These
effects and more will be explored among a relatively unstudied and growing demographic
group: young voters with some college education.

The Effects of Negative Political Advertising on Voters in College Senior Capstone Project for Sean Donahue
- 16 -
RATIONALE AND HYPOTHESES In an attempt to avoid the methodological and sampling errors of past research, this
experiment drew participants from a medium-sized university to get a sample of young
potential voters with some college education. Past studies that have attempted to use
nationwide survey data have run into problems justifying recall or other similar methods as
actual measures of exposure. While experiments have their own potential flaws in external
validity, they generally have reached more concrete conclusions. Additionally, researchers
who have attempted to study all potential voters have struggled to reach solid conclusions and
have found differences between demographic groups. Instead of focusing on all American
voters, this study will look at a group of rising political power in the United States, young
voters with some college education. This study also differentiates participants based on time
spent following politics. This will help differentiate people who actively follow politics,
including those who take American politics classes, from those who do not. Time spent
following politics will be used instead of political sophistication scales since political
sophistication scales measure knowledge of the government, but not necessarily who is in
tune with current politics and candidates. This study will examine if there is a difference in
the effects of negative ads between those who spend at least 30 minutes a week following
American politics (a small enough time to include those taking American political classes)
and those who do not. This study will focus on policy-based attack ads since they are more
easily comparable in theme to positive ads and are received less critically in the media.
Additionally, the focus will be on candidate-sponsored ads since the backlash for these can be
directly and accurately assessed on the candidate.
Past studies have shown political sophisticates gain more knowledge from negative ads than
do non-sophisticates and also increase their numbering of likes and dislikes of candidate
characteristics and policy views after viewing a negative ad. As such, those who actively
follow politics also would seem likely to increase their feelings, one way or another, about a
candidate after viewing a negative ad. Therefore,
H1: Among those who spend at least half an hour a week following politics, watching negative policy based political advertising will strengthen any opinion they already

The Effects of Negative Political Advertising on Voters in College Senior Capstone Project for Sean Donahue
- 17 -
have about the likelihood of voting for a particular candidate, regardless of who the ad is about.
Since those with low political sophistication have shown no gain or even have less accurate
knowledge about a candidate after viewing a negative ad, it seems likely that those who do
not actively follow politics would gain uncertainty about any preexisting leaning toward a
candidate after viewing a negative ad. Backlash will cause them to be uncertain about picking
either candidate. Therefore,
H2: Among those who spend less than half an hour a week following politics, watching negative policy based political advertising will weaken any opinion they already have about the likelihood of voting for a particular candidate, regardless of who the ad is about.
A few studies have shown that negative ads led to increased negative views of both
candidates. Therefore,
H3: Among all voters, favorability ratings will decrease for both candidates after participants view the negative policy based political ad.
Additionally, studies have shown negative ads can have a negative backlash on the sponsoring
candidate, often greater than their effect on the targeted candidate. Positive ads rarely have the
same backlash effect. Therefore,
H4: Among all voters, increase in favorability ratings of the sponsoring candidate will be greater among those who view the positive political ad than those who view the negative policy based ad.

The Effects of Negative Political Advertising on Voters in College Senior Capstone Project for Sean Donahue
- 18 -
METHODOLOGY This study used an experiment with a pre-test post-test equivalent group design. Fifty-three
students were recruited through campus-wide e-mails and with the help of professors. The
participants were introduced to the study and told to imagine that they are in the midst of a
midterm election year and the race in their state for Senate is between Democrat Russ
Feingold and Republican Ron Johnson. Every participant was given a pre-test that assessed
their likelihood of voting, likelihood of voting for each candidate, and their favorability rating
of each candidate all on 7 option Likert-type scales. They were also asked for party affiliation
and to assess their political leanings on a 7 option Likert-type scale ranging from conservative
to liberal. They were asked if they spend at least 30 minutes a week following politics and
what their primary source of current political information is.
Participants who volunteered for the experiment were then randomly assigned to two groups.
Both groups watched a 10 minute clip of a local Wisconsin television broadcast. In one group,
the news clip had Russ Feingold’s commercial “Homegrown” in which he talks about what he
has done and will do to bring jobs to the state embedded in a commercial break. The other
group viewed the same news clip, but with Feingold’s commercial “Creative Destruction” in
which he talks about opponent Ron Johnson supporting bills that he claims cost the state jobs.
The participants of those two groups were then given a post-test. The post-test again assessed
their likelihood of voting, their likelihood of voting for each candidate, and their favorability
rating of each candidate.
Results were inputted into SPSS software for analysis. Each group’s pre-test ratings were
compared to post-test ratings to look for a statistically significant difference in likelihood of
voting and voting for a particular candidate from both before and after the treatment. Within
each group, results were divided between those who spend more than 30 minutes a week
viewing politics and those who do not to see if there is a statistically significant difference in
their likelihood to vote assessments. Analyses also were run to see if there was a statistical
difference in the changes between the group that saw the negative ad and the group that saw
the positive ad.

The Effects of Negative Political Advertising on Voters in College Senior Capstone Project for Sean Donahue
- 19 -
RESULTS Hypothesis 1 predicted that among those who spend at least half an hour a week following
politics, watching negative policy based political advertising would strengthen any opinion
they already held about the likelihood of voting for a particular candidate, regardless of who
the ad is about. Unfortunately, only 12 respondents fit this category and significant data was
not able to be obtained. However, among those who did fit the qualifiers for this case, eight of
12 indicated no difference in their likelihood of voting for Feingold after watching the
negative ad, while seven of 12 indicated no difference in their likelihood of voting for
Johnson after their viewing of the commercial. Additionally, while some participants moved
from may or may not vote for each candidate towards leaning towards voting for a particular
candidate and others saw participants go from leaning one way to back to neutral, no
participants actually indicated a strengthening in any previously reported likelihood of voting
for either candidate.
Hypothesis 2 predicted that among those who spend less than half an hour a week following
politics, watching negative policy based political advertising will weaken any opinion they
already held about the likelihood of voting for a particular candidate, regardless of who the ad
is about. Similarly to hypothesis one, only 16 cases fit the qualifiers for this hypothesis.
Likewise, eight of 16 indicated no change in their likelihood of voting for Feingold, while 11
of 16 indicated no change in their likelihood of voting for Johnson. Three participants
indicated a weakening in the likelihood of voting for Feingold and three indicated a
weakening in the likelihood of voting for Johnson. Additionally, only one participant
indicated an overall decrease in likelihood of voting in the election, while six indicated an
increase and nine remained the same. Overall likelihood of voting did not change significantly
when reported likelihood of voting in the election was asked before (M = 4.00, SD = 1.211)
and after (M = 4.31, SD = 1.448) watching the video.
Hypothesis 3 predicted that among all voters, favorability ratings will decrease among both
candidates after participants view the negative policy based political ad. This time 28 cases fit
the required conditions. Feingold’s average favorability before viewing the negative ad (M =
3.96, SD = 1.071) was not statistically significantly different from his favorability after
The Effects of Negative Political Advertising on Voters in College Senior Capstone Project for Sean Donahue
- 20 -
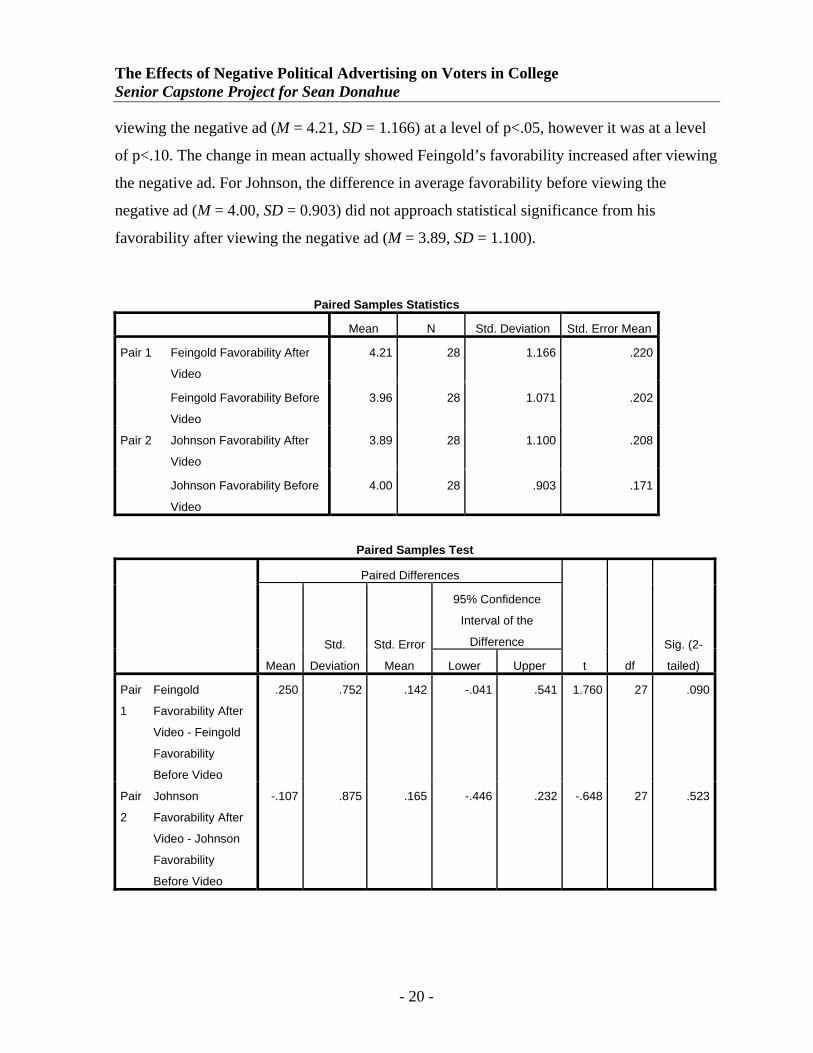
viewing the negative ad (M = 4.21, SD = 1.166) at a level of p<.05, however it was at a level
of p<.10. The change in mean actually showed Feingold’s favorability increased after viewing
the negative ad. For Johnson, the difference in average favorability before viewing the
negative ad (M = 4.00, SD = 0.903) did not approach statistical significance from his
favorability after viewing the negative ad (M = 3.89, SD = 1.100).
Paired Samples Statistics
Mean N Std. Deviation Std. Error Mean
Pair 1 Feingold Favorability After
Video
4.21 28 1.166 .220
Feingold Favorability Before
Video
3.96 28 1.071 .202
Pair 2 Johnson Favorability After
Video
3.89 28 1.100 .208
Johnson Favorability Before
Video
4.00 28 .903 .171
Paired Samples Test
Paired Differences
t df
Sig. (2-
tailed) Mean
Std.
Deviation
Std. Error
Mean
95% Confidence
Interval of the
Difference
Lower Upper
Pair
1
Feingold
Favorability After
Video - Feingold
Favorability
Before Video
.250 .752 .142 -.041 .541 1.760 27 .090
Pair
2
Johnson
Favorability After
Video - Johnson
Favorability
Before Video
-.107 .875 .165 -.446 .232 -.648 27 .523

The Effects of Negative Political Advertising on Voters in College Senior Capstone Project for Sean Donahue
- 21 -
Hypothesis 4 predicted that among all voters, increase in favorability ratings of the sponsoring
candidate will be greater among those who view the positive political ad (N = 25) than among
those who view the negative policy based ad (N = 28). While the difference in the increase of
favorability ratings for Feingold, the sponsoring candidate of each ad, between those who
watched the positive ad (M = 0.64, SD = 1.036) and those who watched the negative ad (M =
0.25, SD = 0.752) was not significant, some other evidence supporting this hypothesis was
found. While the means prior to watching the positive (M = 4.24, SD = 0.879) and negative
(M = 3.96, SD = 1.071) ads did not show a statistically significant difference, the means after
for the two randomly assigned groups showed a statistically significant [p <.05] higher
favorability among those who viewed the positive ad (M = 4.88, SD = 1.092) than those who
viewed the negative ad (M = 4.21, SD = 1.166).
Group Statistics
Ad Watched N Mean Std. Deviation Std. Error Mean
Feingold Favorability Before
Video
Positive 25 4.24 .879 .176
Negative 28 3.96 1.071 .202
Feingold Favorability After
Video
Positive 25 4.88 1.092 .218
Negative 28 4.21 1.166 .220
Independent Samples Test
t-test for Equality of Means
t df
Sig.
(2-
tailed)
Mean
Differe
nce
Std.
Error
Differe
nce
95% Confidence
Interval of the
Difference
Lower Upper
Feingold
Favorability
Before Video
Equal
variances
assumed
1.01
7
51 .314 .276 .271 -.269 .820
Equal
variances not
assumed
1.02
8
50.6
70
.309 .276 .268 -.263 .814

The Effects of Negative Political Advertising on Voters in College Senior Capstone Project for Sean Donahue
- 22 -
Feingold
Favorability
After Video
Equal
variances
assumed
2.13
7
51 .037 .666 .311 .040 1.291
Equal
variances not
assumed
2.14
5
50.8
71
.037 .666 .310 .043 1.289
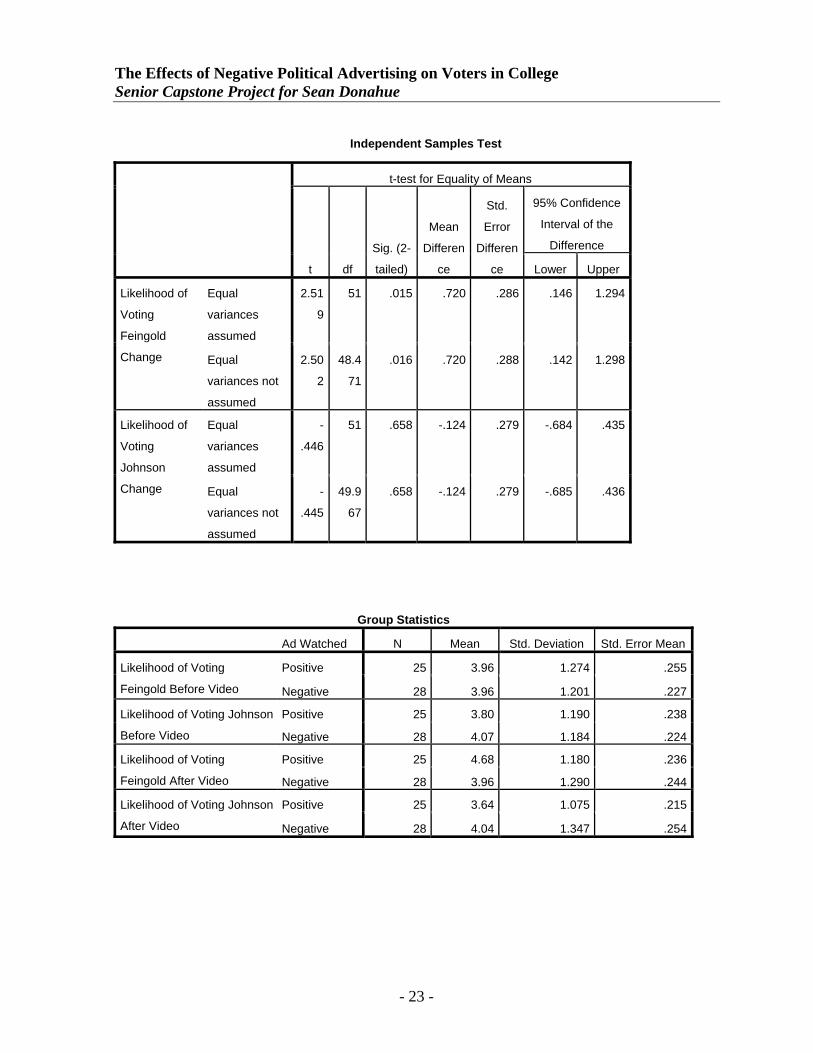
Though not directly related to the hypothesis, even stronger statistics were found over
likelihood of voting. The average change in likelihood of voting for Feingold after watching
the positive ad (M = 0.72, SD = 1.100) was significantly higher [p <.05] than the average
change in likelihood of voting for Feingold after watching the negative ad (M = 0.00, SD =
0.981). Additionally while there was no significant difference in likelihood of voting for
Feingold before watching the positive video (M = 3.96, SD = 1.274) and negative video (M =
3.96, SD = 1.201), there was a statistically significant [p <.05] higher likelihood of voting for
Feingold after watching the positive video (M = 4.68, SD = 1.180) than after watching the
negative video (M = 3.96, SD = 1.290). There was no significant change in the favorability or
likelihood of voting for Johnson after watching either ad, nor was there a significant
difference in the favorability or likelihood of voting for Johnson between the positive and
negative ad groups after viewing the ad.
Group Statistics
Ad Watched N Mean Std. Deviation Std. Error Mean
Likelihood of Voting
Feingold Change
Positive 25 .72 1.100 .220
Negative 28 .00 .981 .185
Likelihood of Voting Johnson
Change
Positive 25 -.16 1.028 .206
Negative 28 -.04 .999 .189
The Effects of Negative Political Advertising on Voters in College Senior Capstone Project for Sean Donahue
- 23 -
Independent Samples Test
t-test for Equality of Means
t df
Sig. (2-
tailed)
Mean
Differen
ce
Std.
Error
Differen
ce
95% Confidence
Interval of the
Difference
Lower Upper
Likelihood of
Voting
Feingold
Change
Equal
variances
assumed
2.51
9
51 .015 .720 .286 .146 1.294
Equal
variances not
assumed
2.50
2
48.4
71
.016 .720 .288 .142 1.298
Likelihood of
Voting
Johnson
Change
Equal
variances
assumed
-
.446
51 .658 -.124 .279 -.684 .435
Equal
variances not
assumed
-
.445
49.9
67
.658 -.124 .279 -.685 .436
Group Statistics
Ad Watched N Mean Std. Deviation Std. Error Mean
Likelihood of Voting
Feingold Before Video
Positive 25 3.96 1.274 .255
Negative 28 3.96 1.201 .227
Likelihood of Voting Johnson
Before Video
Positive 25 3.80 1.190 .238
Negative 28 4.07 1.184 .224
Likelihood of Voting
Feingold After Video
Positive 25 4.68 1.180 .236
Negative 28 3.96 1.290 .244
Likelihood of Voting Johnson
After Video
Positive 25 3.64 1.075 .215
Negative 28 4.04 1.347 .254

The Effects of Negative Political Advertising on Voters in College Senior Capstone Project for Sean Donahue
- 24 -
Independent Samples Test
t-test for Equality of Means
t df
Sig. (2-
tailed)
Mean
Differen
ce
Std.
Error
Differen
ce
95% Confidence
Interval of the
Difference
Lower Upper
Likelihood of
Voting
Feingold
Before Video
Equal
variances
assumed
-
.013
51 .990 -.004 .340 -.687 .679
Equal
variances not
assumed
-
.013
49.4
99
.990 -.004 .341 -.690 .681
Likelihood of
Voting
Johnson
Before Video
Equal
variances
assumed
-
.831
51 .410 -.271 .327 -.927 .384
Equal
variances not
assumed
-
.831
50.2
67
.410 -.271 .327 -.928 .385
Likelihood of
Voting
Feingold After
Video
Equal
variances
assumed
2.09
8
51 .041 .716 .341 .031 1.401
Equal
variances not
assumed
2.10
9
50.9
65
.040 .716 .339 .034 1.397
Likelihood of
Voting
Johnson After
Video
Equal
variances
assumed
-
1.17
2
51 .246 -.396 .337 -1.073 .282
Equal
variances not
assumed
-
1.18
8
50.4
12
.241 -.396 .333 -1.065 .273

The Effects of Negative Political Advertising on Voters in College Senior Capstone Project for Sean Donahue
- 25 -
DISCUSSION Through an experiment using pre-test post-test equivalent group design, four hypotheses were
tested examining the relative effectiveness of negative and positive political advertisements.
Unfortunately a lack of turnout to the six scheduled experiment sessions hurt chances of
finding significant results for several of the four hypotheses. The first hypothesis predicted
that those who spend at least half an hour a week following politics would find any opinion
they had about voting for a particular candidate strengthened by watching a negative ad.
While the limited number of participants didn’t permit finding significant results, not a single
case would have supported the hypothesis. While one cannot refute past findings based on this
limited data, the data shows no support that past studies indicating the politically informed
will strengthen their opinions or increase their likelihood of voting for a political candidate
after watching a negative ad applies to young college educated voters (Stevens, Sept. 2005).
This is clearly an area where more research to show whether negative ads do in fact have an
effect on strengthening the beliefs of and mobilizing voters, especially young college
educated voters, could be of interest.
The second hypothesis predicted that those who spend less than half an hour a week following
politics would find their likelihood of voting for a particular candidate weakened after
watching the negative ad, regardless of who the ad was about. Again, the small number of
participants limited findings in this category. The data collected showed no significant
changes in the before and after evaluations of those who did not spend at least half an hour a
week following politics and watched the negative ad. Additionally, the data showed no
decrease in overall likelihood of voting after watching the video. The sample size was not
significantly large enough to draw conclusions, but it suggests that more research into
whether the demobilization theory, even among those who don’t spend much time following
politics and especially among young college educated voters, could provide more useful
results.
The third hypothesis predicted that among all voters, favorability ratings would decrease
among both candidates after participants viewed the negative policy based political ad. With
28 participants fitting into this category, this hypothesis had a better basis for drawing

The Effects of Negative Political Advertising on Voters in College Senior Capstone Project for Sean Donahue
- 26 -
conclusions. Johnson’s favorability rating did not show a significant difference after
participants viewed the negative ad. Though the change in Feingold’s favorability rating was
not significant at the p < .05 level, it was at the p < .10. Feingold’s favorability rating actually
showed an increase among participants after they had watched the negative ad. This study
brings into question research that has shown policy based attack ads are most likely to lead to
backlash for the sponsoring candidate (Meirick, Summer 2005). Among young college
educated voters, these results suggest there is no reason to believe a negative ad attacking an
opponent’s views on policy will lead to backlash for the sponsoring candidate. Certainly this
may vary based on the particular ad, but suggestions that a negative ad sponsored by a
candidate guarantees backlash appear unfounded, at least among this demographic. These
results again question demobilization theories as participants’ results did not show general
disgust towards the candidates after viewing the ad. Again, whether these conclusions apply
only to college age students or the general population would require more research. Attack
ads have earned a bad reputation among the media for their supposed negative effects on
public discourse and voter turnout, but these results offer a different conclusion. Looking at
what characteristics, if any, in negative ads do cause backlash and hurt voter turnout would be
an interesting topic to study in the future.
The final hypothesis predicted that among all voters, increase in favorability ratings of the
sponsoring candidate will be greater among those who view the positive political ad than
those who view the negative. This hypothesis was meant to test whether a positive or a
negative ad would prove a more effective method for a candidate looking to gain support from
the college-educated, young voter demographic. This hypothesis provided the most fruitful
results. Feingold’s favorability ratings proved significantly higher after viewers watched the
positive ad than after viewers watched the negative ad. The likelihood of voting for Feingold
was also significantly higher after watching the positive ad than the negative ad, as was the
change in the likelihood of voting from after watching the positive ad compared to watching
the negative ad.
Perhaps just as important, there was no significant change in Johnson’s favorability rating
after watching either ad. If the negative ad attacking Johnson on policy issues was designed to

The Effects of Negative Political Advertising on Voters in College Senior Capstone Project for Sean Donahue
- 27 -
bring down his favorability and turn voters away from him, it was not very effective. In fact
there was no significant change in the likelihood of voting for Johnson after viewing either ad.
Feingold’s negative ad failed to sway voters away from Johnson, while his positive ad proved
more productive in solidifying votes for himself among the demographic of college aged
voters.
While a larger group of participants could have provided better results in supporting or
refuting all four hypotheses, these results do provide some potential insight into what ads are
better at effectively targeting college age voters. The positive and negative ads essentially
discuss the same issue: the positive ad explains how Feingold was against unfair trade
agreements that cost Wisconsin jobs; the negative explains how Johnson was in favor of those
same agreements. However, the negative ad Feingold ran did not have a significant effect
either on the favorability or the likelihood of voting for either candidate. The ad may not have
hurt Feingold as some past studies may have suggested. In fact, research on the negative ad
failed to support any effect on mobilizing or demobilizing viewers to vote. However, the
positive ad provided a significant boost to viewers’ likelihood of voting for Feingold, while
also increasing his favorability rating to a level higher than the negative ad did. All these
findings suggest spending money on a positive ad may be the more effective way to get the
support of young college educated voters.
The limitations of this study and its conclusions must be noted. The study’s participants were
all college students, and thus its findings may not apply to all young voters, but rather just
college voters. Additionally, the study was conducted at a university in New England and may
be representative of students in that area, but not all students throughout the country. Future
research conducted countrywide that focuses on both college students and those who do not
attend college that fall into the young voter demographic (age 18-29) could provide more
helpful data to politicians looking to spend their money more effectively to attract that
important voting bloc.
This study also suffers from the same limitations of any lab based study on negative political
ads: no ad is ever shown in isolation. While the study attempted to mimic reality as much as
possible by placing the ad in a newscast, viewers very rarely will see one ad by itself. During

The Effects of Negative Political Advertising on Voters in College Senior Capstone Project for Sean Donahue
- 28 -
campaigns both candidates run ads, often back-to-back, and ads often address one another.
Candidates will often have several different ads running during the same period as well.
Newscasts will also feature reports about the campaigns and even sometimes stories about the
ads, neither of which was featured in the newscasts participants in this study watched.
Additionally, people will often discuss candidates and their ads with friends, families and
peers before voting. All of these factors would likely impact each individual ad’s
effectiveness.
While it is hard to draw too many conclusions from the results of this study, the results
suggesting a positive ad is more effective than a negative one among young voters should
help direct future research on a larger scale to see if positive campaigning is in fact more
productive for politicians looking to gain the youth vote. Finally, the first two hypotheses
warrant further research on a larger scale to truly prove if theories suggesting political
advertising affect those who take the time to stay knowledgeable on current politics
differently than those who do not.
The Effects of Negative Political Advertising on Voters in College Senior Capstone Project for Sean Donahue
- 29 -
APPENDICES

The Effects of Negative Political Advertising on Voters in College Senior Capstone Project for Sean Donahue
- 30 -
Appendix A – (Pre-Video Survey) Are you eligible (18 years old or older and a U.S. citizen) to vote in the United States? (Circle one) Yes No Do you spend at least 30 minutes a week following American politics (watching political news, reading political articles, attending American politics classes, watching the Daily Show/Colbert Report, etc.)? Yes No What is your top source for political news? _________________________________________________ What political party do you most associate with? (Circle one) Democrats Republicans A Third Party None/Independent How would you rate your political beliefs on a scale of 1 (conservative) to 7 (liberal)? (Circle one) Conservative Moderate Liberal 1 2 3 4 5 6 7 Now assume there is an upcoming election for a U.S. Senate seat in your state between Democrat Russ Feingold and Republican Ron Johnson. Based on party affiliation and any prior knowledge, how would you rate your opinion of Democrat Russ Feingold on a scale of 1 (extremely negative) to 7 (extremely positive)? (Circle one) Extremely Negative Neutral Extremely Positive 1 2 3 4 5 6 7 Based on party affiliation and any prior knowledge, how would you rate your opinion of Republican Ron Johnson on a scale of 1 (extremely negative) to 7 (extremely positive)? (Circle one) Extremely Negative Neutral Extremely Positive 1 2 3 4 5 6 7 If there was an upcoming election for a U.S. Senate seat between these two candidates in your state, how likely would you be to vote on a scale of 1 (definitely wouldn’t vote) to 7 (definitely would vote)? (Circle one) Definitely wouldn’t vote May or may not Vote Definitely would vote 1 2 3 4 5 6 7

The Effects of Negative Political Advertising on Voters in College Senior Capstone Project for Sean Donahue
- 31 -
How likely would you be to vote for Democrat Russ Feingold on a scale of 1 (Definitely wouldn’t vote for Feingold) to 7 (Definitely would vote for Feingold)? (Circle one) Definitely wouldn’t vote Unsure Definitely would vote 1 2 3 4 5 6 7 How likely would you be to vote for Republican Ron Johnson on a scale of 1 (Definitely wouldn’t vote for Johnson) to 7 (Definitely would vote for Johnson)? (Circle one) Definitely wouldn’t vote Unsure Definitely would vote 1 2 3 4 5 6 7

The Effects of Negative Political Advertising on Voters in College Senior Capstone Project for Sean Donahue
- 32 -
Appendix B – (Post-Video Survey) Based on party affiliation and any knowledge about the candidate, how would you rate your opinion of Democrat Russ Feingold on a scale of 1 (extremely negative) to 7 (extremely positive)? (Circle one) Extremely Negative Neutral Extremely Positive 1 2 3 4 5 6 7 Based on party affiliation and any knowledge about the candidate, how would you rate your opinion of Republican Ron Johnson on a scale of 1 (extremely negative) to 7 (extremely positive)? (Circle one) Extremely Negative Neutral Extremely Positive 1 2 3 4 5 6 7 If there was an upcoming election for a U.S. Senate seat between these two candidates in your state, how likely would you be to vote on a scale of 1 (definitely wouldn’t vote) to 7 (definitely would vote)? (Circle one) Definitely wouldn’t Vote May or may not Vote Definitely would vote 1 2 3 4 5 6 7 How likely would you be to vote for Democrat Russ Feingold on a scale of 1 (Definitely wouldn’t vote for Feingold) to 7 (Definitely would vote for Feingold)? (Circle one) Definitely wouldn’t Vote Unsure Definitely would vote 1 2 3 4 5 6 7 How likely would you be to vote for Republican Ron Johnson on a scale of 1 (Definitely wouldn’t vote for Johnson) to 7 (Definitely would vote for Johnson)? (Circle one) Definitely wouldn’t Vote Unsure Definitely would vote 1 2 3 4 5 6 7

The Effects of Negative Political Advertising on Voters in College Senior Capstone Project for Sean Donahue
- 33 -
Appendix C – (Newscast) VIDEO STARTS
0:00 – 1:50 – NEWS OPEN AND TOP STORY –POLICE STAKEOUT TO FIND
SHOOTER
1:51 - 4:14 – NEWSTORY: SEMI CRASH
4:15 – 4:41 – NEWSTORY: WOMEN ATTACKS HUSBAND
4:42 – 5:03 - NEWSTORY: SKI LODGE FIRE
5:04 – 5:12 – ADVERTISEMENT: STATION’S WEBSITE
5:13 – 5:28 – ADVERTISEMENT: LOCAL YMCA
5:29 – 5:59 - ADVERTISEMENT: FEINGOLD’S “HOMEGROWN” (POSITIVE) OR
CREATIVE DESTRUCTION (NEGATIVE)
6:00 – 6:14 – ADVERTISEMENT: UNIVERSITY OF WISCONSIN – PARKSIDE
6:15 – 8:14 - NEWSTORY: SNOWBULANCE
8:14 – 10:04 - NEWSTORY: BEARS FAN PRIEST
10:04 – 10:12 - ADVERTISEMENT: STATION’S WEBSITE
VIDEO ENDS

The Effects of Negative Political Advertising on Voters in College Senior Capstone Project for Sean Donahue
- 34 -
REFERENCES Abbe, O. G., Herrnson, P. S., Magleby, D. B., & Patterson, K. D. (Feb 2000). Going negative
does not always mean getting ahead in elections. Campaigns & Elections , 77.
An Uptick in Negativity. (2010, November 1). Retrieved November 15, 2010, from Wesleyan Media Project: http://election-ad.research.wesleyan.edu/files/2010/11/WesMediaProject_ToneRelease_110110.pdf
Ansolabehere, S. D., Iyengar, S., & Simon, A. (Dec. 1999). Replicating Experiments Using Aggregate and Survey Data: The Case of Negative Advertising and Turnout. The American Political Science Review , 901-909.
Ansolabehere, S., Iyengar, S., Simon, A., & Valentino, N. (Dec. 1994). Does Attack Advertising Demobilize the Electorate? The American Political Science Review , 829-838.
AP. (2010, October 12). Political Ads: It's Getting Really Nasty Out There. Retrieved October 19, 2010, from NPR: http://www.npr.org/templates/story/story.php?storyId=130516051
Clinton, J. D., & Lapinski, J. S. (2004). "Targeted" Advertising and Voter Turnout: An Experimental Study of the 2000 Presidential Election. Journal of Politics , 69-96.
Dardis, F. E., Shen, F., & Edwards, H. H. (Winter 2008). Effects of Negative Political Advertising on Individuals' Cynicism and Self-Efficacy: The Impact of Ad Type and Message Exposures. Mass Communication and Society , 24-42.
Exit Poll: Lower Turnout Among Youth and Black Voters. (2010, November 2). Retrieved November 22, 2010, from CBS News: http://www.cbsnews.com/8301-503544_162-20021551-503544.html
Goldstein, K., & Freedman, P. (August 2002). Campaign Advertising and Voter Turnout: New Evidence for a Stimulation Effect. Journal of Politics , 721-740.
Haddock, G., & Zanna, M. P. (June 1997). Impact of Negative Advertising on Evaluations of Political Candidates: The 1993 Canadian Federal Election. Basic & Appllied Social Psychology , 205-223.
Houston, D. A., & Doan, K. (1996). Comparison of Paired Choice Alterna. Applied Cognitive Psychology , 125-135.
Kawashima-Ginsberg, K., & Kirby, E. H. (2009, August 17). The Youth Vote in 2008. Retrieved December 4, 2010, from CIRCLE: The Center for Information and Research on Civic Learning and Engagement:
The Effects of Negative Political Advertising on Voters in College Senior Capstone Project for Sean Donahue
- 35 -
http://www.civicyouth.org/PopUps/FactSheets/FS_youth_Voting_2008_updated_6.22.pdf
Kolodny, R., Thurber, J. A., & Dulio, D. A. (Aug 2000). Producing Negative Ads: Consultant Survey. Campaigns & Elections , 56.
Lau, R. R., Sigelman, L., Heldman, C., & Babbitt, P. (Dec. 1999). The Effects of Negative Political Advertisements: A Meta-Analytic Assessment. The American Political Science Review , 851-875.
Meirick, P. C. (Summer 2005). Political Knowledge and Sponsorship in Backlash from Party- and Candidate-sponsored Attacks. Communication Reports , 40-75.
Merritt, S. (1984). Negative Political Advertising: Some Empirical Findings. Journal of Advertising , 27-39.
Pinkleton, B. E., Nam-Hyun, U., & Austin, E. W. (Spring 2002). An Exploration of the Effects on Negative Political Advertising on Political Decision Making. Journal of Advertising , 13-25.
Rampell, C. (2010, April 10). College Enrollment Rate at Record High. Retrieved December 5, 2010, from New York Times: http://economix.blogs.nytimes.com/2010/04/28/college-enrollment-rate-at-record-high/
Stevens, D. (September 2005). Separate and Unequal Effects: Information, Political Sophistication and Negative Advertising in American Elections. Political Research Quarterly , 413-425.
Wattenberg, M. P., & Brians, C. L. (Dec. 1999). Negative Campaign Advertising: Demobilizer or Mobilizer? The American Political Science Review , 891-899.
Youth Turnout About 20%, Comparable to Recent Midterm Years. (2010, November 3). Retrieved November 22, 2010, from The Center for Information & Research on Civic Learning and Engagement: http://www.civicyouth.org/youth-turnout-about-20-comparable-to-recent-midterm-years/
Related Documents