Does deceptive advertising reduce political participation? Theory and evidence Daniel Houser, Sandra Ludwig and Thomas Stratmann Aug. 2009 Discussion Paper Interdisciplinary Center for Economic Science 4400 University Drive, MSN 1B2, Fairfax, VA 22030 Tel: +1-703-993-4850 Fax: +1-703-993-4851 ICES Website: www.ices-gmu.org ICES RePEc Archive Online at: http://edirc.repec.org/data/icgmuus.html

Welcome message from author
This document is posted to help you gain knowledge. Please leave a comment to let me know what you think about it! Share it to your friends and learn new things together.
Transcript

Does deceptive advertising reduce political
participation? Theory and evidence
Daniel Houser, Sandra Ludwig and Thomas Stratmann
Aug. 2009
Discussion Paper
Interdisciplinary Center for Economic Science
4400 University Drive, MSN 1B2, Fairfax, VA 22030
Tel: +1-703-993-4850 Fax: +1-703-993-4851
ICES Website: www.ices-gmu.org
ICES RePEc Archive Online at: http://edirc.repec.org/data/icgmuus.html

Does deceptive advertising reduce political participation?
Theory and evidence
Daniel Houser∗ Sandra Ludwig† Thomas Stratmann
‡
August, 2009
Abstract
We examine the effect of deceptive advertising on voting decisions in elections. We model two-
candidate elections in which 1) voters are uncertain about candidates' attributes; and 2)
candidates can inform voters of their attributes by sending advertisements. We compare political
campaigns with truthful advertising to campaigns in which there is a small chance of deceptive
advertising. Our theoretical model predicts that informed voters should act on the information
contained in the advertisement. Thus, even in deceptive campaigns, informed voters should
either vote for the candidate from whom they received an advertisement or abstain from voting;
they should never vote for the opposing candidate. We test our model in laboratory elections,
and, as predicted, find higher participation among informed voters in elections that allow only
for truthful advertisement than in elections that permit deceptive advertising. Contrary to our
theoretical predictions, we find substantial differences in voting behavior between truthful and
deceptive campaigns. When faced with a small probability of deception, informed voters in
deceptive campaigns vote for the candidate who did not send an advertisement, thereby making
sub-optimal voting choices. Even when there is only a small chance that an advertisement is
deceptive, voters are more likely to elect the candidate who generates less welfare.
* George Mason University, [email protected]
† LMU Munich, [email protected]
‡ George Mason University, [email protected]
1
I. Introduction
For voters, possessing accurate information about candidates’ positions is a crucial element in
deciding how to cast their ballot. Truthful and correct information about candidate positions1
underpins much of the theoretical literature on voting. The voting literature, beginning with
Downs (1957), has assumed that candidates truthfully represent their positions. More recent
significant contributions allow for voter uncertainty about candidate positions, but continue to
assume truthful representation of candidate positions. These include works by Matsusaka (1995)
and Feddersen and Pesendorfer (1996), who show that more information about candidate
positions increases voter turnout.2 Yet political advertising is not always truthful, and may
contain falsehoods and deception. To our knowledge, there is a dearth of scholarly theoretical
work studying the effect of false information on abstention and voting decisions. Furthermore,
no work has tested theoretical implications in the laboratory. Our paper takes a step toward
filling these gaps by providing a theoretical framework in which to study and perform laboratory
tests on false candidate advertising.3,4
In naturally occurring elections, candidates often provide false information. This
phenomenon is so prevalent that it has launched multiple websites aimed at pointing out false or
deceptive statements in candidate speeches and campaign advertisements. One example is
1 Candidates may differ with respect to their policy positions or with respect to valence criteria such as their qualities
or attributes. In this paper we will use the positions, attributes, and qualities interchangeably. 2 Empirical studies by Gentzkow (2005) and Lassen (2005) show that turnout is positively affected when voters have
more sources of information, such as newspapers. Also, Coupe and Noury (2004), Palfrey and Poole (1987), and
Wattenberg et al. (2000) found a positive correlation between turnout and information levels. 3 Closest to our theoretical model is work by Feddersen and Pesendorfer (1999). In their model, the introduction of
noisy information increased turnout of uninformed voters and decreased turnout of informed voters. 4 There is a large theoretical and empirical literature on the effect of campaign advertising. Empirical works includes
Levitt (1993), who analyzed the effect of campaign spending for repeat challengers, Ansolabehere and and Iyengar
(1996), who conducted a field experiment on this topic, and Gerber (1998), who found that campaign spending
positively affected election outcomes for the U.S. Senate. Theoretical work examining strategic advertising with
truthful information includes Coate (2004a, b) and Schultz (2007). Potters et al. (1997) and Prat (2002) examined
the consequences of indirect informative advertising, where voters are influenced by the amount of money that has
been spent on advertising. For a recent overview of this literature see Stratmann (2005).

2
factcheck.org, which operated during the 2008 presidential race to point out falsehoods in the
campaigns of Senators Clinton, McCain and Obama.5 A well-known false statement during the
2008 Democratic primary occurred when Senator Clinton, apparently trying to bolster her
foreign policy credentials, incorrectly claimed that she witnessed an attack during her visit to
Bosnia in 1996. While factcheck.org provides a list of false statements and deceptions to voters
during the campaign, sometimes the validity of a statement (e.g., whether a candidate intends to
keep a promise) can only be assessed after the election has been decided. A famous example is
George Bush Sr.'s ―Read my Lips: No new taxes‖ (eventually broken) promise made during his
nomination acceptance speech at the 1988 Republican National Convention. Our theoretical
model and experiments capture this latter type of false information, which is revealed as false
only after the election.
Recent empirical studies examining the effect of information on voter behavior either
assume truthful advertising (Houser et al., 2008) or assume that voters receive signals that either
provide them with perfect information or are fully uninformative (Battaglini et al. 2008, 2008).6
Corizzini et al. (2009) performed related work examining non-binding candidate promises. They
found that promises are positively correlated with candidates’ actions and that voters take such
promises into account in their vote choice rather than writing them off as cheap talk.
In this paper, we analyze differences in the way voters behave when they know political
advertising is truthful versus the way they behave when they know there is a chance that the
advertising is false (or deceptive). To our knowledge, no existing empirical study informs the
effect of false advertising on voting behavior.
5 http://www.factcheck.org/elections-2008/hillarys_adventures_abroad.html and
http://www.factcheck.org/specialreports/our_disinformed_electorate.html, accessed January 2009. 6 These studies build on the swing voter's curse literature, e.g. Feddersen and Pesendorfer 1996.

3
In both our theoretical and empirical work, we compare voter behavior between truthful
and deceptive advertising environments when voting is voluntary and costless. We study
(informed) voters exposed to advertisements as well as (uninformed) voters without such
exposure. For both groups, we examine: 1) how voter turnout and voter decisions differ under
both truthful and deceptive advertising environments; 2) whether deceptive advertising
influences which candidate is elected; and 3) whether the candidate who generates the highest
welfare for voters wins the election. Finally, we compare welfare between deceptive and truthful
advertising environments.
Our laboratory investigation compares voting decisions in an environment where
advertising is always truthful to an environment in which false advertising occurs, but accounts
for only a relatively small fraction of the overall level of advertising (most advertisements are
true). Our theory implies several equilibria. All equilibria predict that voters should either vote
for the candidate who sent them the potentially deceptive advertisement or abstain. No
equilibrium predicts that a rational voter should vote for the candidate from whom she did not
receive an advertisement. In our experimental tests of our theory the main finding is that
informed voters in deceptive campaigns are much more likely to abstain and act suboptimally
relative to campaigns that include only true information. That is, they vote for the opposition
candidate from whom they did not receive an advertisement. This practice has a strong
detrimental effect on electoral efficiency— introducing a small amount of false information leads
to an economically and statistically significantly greater likelihood of electing a sub-optimal
candidate. This large reduction in efficiency stands in sharp contrast to our theoretical prediction.
4
II. Model
We consider two-candidate elections, with one candidate belonging to the Circle party (●) and
the other one to the Triangle party (▲). Candidates have fixed ideologies that reflect their
parties’ positions. Candidates, in addition to their party affiliation, are also characterized by their
types or qualities, which are either ―high‖ (H) or ―low‖ (L).7
The population consists of N (potential) voters. Voting is voluntary and costless. All
voters are swing voters, with half leaning toward the Circle party, and the other half leaning
toward the Triangle party. With respect to candidate quality, all voters’ preferences are
homogenous. They all prefer a high-quality candidate to a low-quality candidate, irrespective of
the candidate’s party affiliation. As shown in Table 1, voters’ payoffs are xH or xL if their own-
party high- or low-quality candidate is elected, respectively, and those same respective amounts,
less ε, if the other party’s high- or low-quality candidate is elected, where xH − xL > ε > 0.8 A
voter can cast her ballot for her own party’s candidate, the other party’s candidate, or abstain.
At the beginning of each campaign, voters are unaware of the true quality of a specific
candidate. They do know, however, that each election will have exactly one high-quality
candidate and one low-quality candidate, and that each party is equally likely to have the low-
quality candidate. We consider a first-past-the-post voting system where ties are broken
randomly. Voters are rational, in the sense that they are motivated by the possibility that their
ballot will be pivotal. A pivotal vote occurs if, absent that ballot, either candidate leads by
exactly one vote or the election is tied.
7 One interpretation of the candidates’ pattern is that all voters prefer a moderate (high-quality) candidate of either
party to an extreme (low-quality) one. Alternatively, we can think of any other valence criterion that all voters favor. 8 This assumption ensures that voters prefer a high-quality candidate from the other party to a low-quality candidate
from their own party.
5
II.1 Truthful Campaigns
Consider first the case in which advertising is only truthful. Candidates engage in campaign
advertising to signal that they are of high quality. Advertising is truthful (―truthful campaign‖),
meaning that candidates cannot lie about their quality. Hence, only high-quality candidates can
send advertisements. Candidates always advertise but voters do not necessarily receive the
advertisement: each voter receives an advertisement with probability p. If a voter receives an
advertisement, the advertisement truthfully reveals which candidate is of high quality; therefore,
it also reveals that the other candidate is of low quality (as types are perfectly negatively
correlated). Figure 1 shows the timing of the game. First, candidates send advertisements. Then
voters either receive or do not receive advertisements. Next, voters cast their ballots. Finally, the
winner is announced and payoffs realized.
Since advertising is exogenous, the voting game that we analyze is static. We consider
symmetric pure strategy Bayesian Nash equilibria of the game. Voters form beliefs about the true
state conditional on any ad they receive and also condition their ballots on the same ads. The
symmetry assumption rules out an equilibrium in which all voters vote for either the Circle or the
Triangle candidate. This is ruled out because such voting behavior implies that some voters vote
for the candidate from their own party and some vote for the candidate from the other party.
II.1.1 Informed Voters’ Behavior
If a voter receives an advertisement, she knows perfectly which candidate is high-quality and
which is low-quality. Table 1 describes our assumed structure of voter preferences. Given this
structure, informed voters have a dominant strategy to vote for the high-quality candidate.

6
Hence, if a voter receives an ad from her own (other) candidate she always votes for her own
(other) candidate.
II.1.2 Uninformed Voters’ Behavior
If a voter does not receive an advertisement, she cannot update her beliefs and thus believes it is
equally likely that 1) the Triangle candidate is of high quality, while the Circle candidate is of
low quality; or 2) the Triangle candidate is of low quality, while the Circle candidate is of high
quality. Given that informed voters always vote for the high-quality candidate, two symmetric
pure strategy equilibria exist. We derive these equilibria in Appendix II.
In the first equilibrium, all uninformed voters abstain (―Abstention equilibrium‖). This
equilibrium exists if2
2 ( )( 1)H L
px x N
; that is, when the probability of receiving an
advertisement is sufficiently high. Intuitively, the reason is that an uninformed voter who
believes other uninformed voters will abstain also recognizes that their uninformed vote may
cancel out an informed vote. Since all informed voters vote for the high-quality candidate, the
uninformed voter finds it optimal to abstain so long as the probability of an informed vote is
sufficiently large. This is similar to the swing voters curse result in Feddersen and Pesendorfer
(1996).
In the second equilibrium, uninformed voters vote for their own party’s candidate (―All
vote equilibrium‖). This equilibrium exists if2
H L
px x
; that is, the probability of receiving
an advertisement is sufficiently low. Intuitively, when the probability of receiving an
advertisement is small and when all uninformed voters vote for their own Circle (Triangle) party,
then an uninformed vote is more likely to cancel out an uninformed vote for the Triangle (Circle)

7
party than an informed vote. In this case, an uninformed voter’s utility is higher if she votes for
her own party’s candidate rather than abstaining.
Because the threshold for the probability of receiving an advertisement is lower for the
first equilibrium than for the second, there exists a range of p in which both equilibria exist (see
Figure 2.) The parameterization for our experiment ( 22, 7.5, =4.5, 0.5, 0.2H LN x x p )
is such that both equilibria exist. In our experiment, the likelihood of receiving an advertisement,
p, takes the value of 0.2, while the range p where both equilibria exist goes from 0.0187 up to
0.286 (Figure 2).
II.1.3 Efficiency of Electoral Outcome – Truthful Campaigns
We now compare the level of efficiency that is reached in equilibrium assuming truthful
advertising relative to the first best, i.e., the situation where the high-quality candidate always
wins. This occurs when the state of the world is common knowledge among voters. We assign an
efficiency value of 1 to an election in which the high-quality candidate wins and a value of 0
when the low-quality candidate wins. When there is a tie, the winning candidate is chosen at
random; thus, we assign an efficiency value of 0.5.
First, we compute the expected efficiency reached in the Abstention equilibrium.
According to our model, informed voters always vote for the high-quality candidate. If at least
one voter is informed and all uninformed voters abstain, then the high-quality candidate wins the
election. The probability that at least one voter is informed is 1 − (1 − p)N
. If no voter receives an
ad, the outcome is a tie. Therefore the expected efficiency in the Abstention equilibrium is 1-
0.5(1 − p)N
. For our parameter values, N=22 and p=0.2, expected efficiency equals 0.996.

8
Next we compute the expected efficiency of the All vote equilibrium, in which
uninformed voters cast their ballot for their own party’s candidate. This implies that in each state
of the world at least half of all voters vote for the high-quality candidate. To see this, suppose the
Circle candidate is of high quality, and thus only the Circle candidate can send ads. In this case,
all voters leaning toward the Circle party will vote for the Circle candidate, irrespective of
whether they receive an ad. Voters leaning toward the Triangle party will vote for the Triangle
candidate unless they receive an ad from the high-quality Circle candidate. Since half of the
voters lean towards the Circle and Triangle parties, at least half of them will vote for the high-
quality candidate. Hence, either the high-quality candidate wins or a tie results. A tie results if
exactly none of the Triangle voters receives an advertisement, which occurs with probability (1 −
p)N/2
. The same logic applies when the Triangle candidate is of high quality. Expected efficiency
is in the All vote equilibrium; thus, 1-0.5(1 − p)N/2
.
Note that expected efficiency is lower when uninformed voters vote their own party’s
candidate than when they abstain. The reason is that the informed voter from the high-quality
candidate’s party has a lower probability of causing the pivotal vote. For the parameter values
N=22 and p=0.2 implemented in our experiment, the expected efficiency in the All vote
equilibrium is 0.957.
II.2 Deceptive Campaigns
In deceptive campaigns, advertising need not be truthful. Both high-quality and low-quality
candidates advertise, and each candidate claims to be high-quality. Hence, we define advertising
as deceptive when a low-quality candidate advertises that she is of high quality. Consequently,
advertisements from high-quality candidates are truthful while advertisements from low-quality

9
candidates are false. Like the truthful campaigns described in the previous section, we assume
that candidates always advertise and that each voter receives an advertisement from the high-
quality candidate with probability p. In addition she now receives an advertisement from the
low-quality candidate with probability q.9 We consider only cases where 0 < q < p < 0.5.
Given this design, each voter can receive either zero, one, or two advertisements. Further,
voters who receive two ads and voters who receive zero ads both believe that the two states of
the world (whether their own candidate or the other party’s candidate is of high quality) are
equally likely. This implies that voters who receive two ads are effectively uninformed.
In our model, the probability of receiving an advertisement with correct information is
the same in both the deceptive and the true campaigns. The deceptive campaigns differ from the
true campaigns in that false information is added to the environment. In particular, the total ad
frequency in true campaigns is ―p,‖ while it is ―p+q‖ in deceptive campaigns.10
Both types of
campaigns also differ in another important way—voters who receive exactly one advertisement
in the true campaigns know the truth about candidate qualities, while voters who receive exactly
one ad in the deceptive campaigns are uncertain about the true underlying state. For example, a
rational Bayesian in a true campaign who receives an ad indicating that a particular candidate is
high-quality knows with probability 1 that this is the case, and that the other candidate is low-
quality. In a deceptive campaign the same information leads a rational Bayesian to conclude that
the candidate is high-quality with probability [(1-q)/q]/[(1/q+1/p-2)], where again we consider
only the case where 0 < q < p < 0.5.
9 This implies that a voter who receives an advertisement does not know for sure whether the information is correct
or false before the election is decided. 10
A small difference between truthful and deceptive campaigns will be that in truthful campaigns less voters will be
informed since only the high-quality candidate sends ads: 20% of voters are informed and 80% uninformed in
truthful campaigns, while in deceptive campaigns 23% are informed and 77% uninformed (76% receive zero ads,
1% two ads).
10
Following the same approach that we took for truthful campaigns, we consider symmetric
pure strategy Bayesian Nash equilibria of the voting game. In Appendix II we show that in
equilibrium both voters who receive zero advertisements and voters who receive two
advertisements use the same strategy. Hence, when we refer to uninformed voters in the
discussion below, we refer to voters who receive zero or two ads.
We have several predictions based on the equilibrium played, and others that hold
regardless of the equilibrium played. The latter predictions hold independent of the parameters of
the game as long as xH>xL>ε>0 and p>q>0. The equilibria we discuss below, however, may not
exist for parameters other than those used in the experiment.
We start with the results that hold regardless of the equilibrium played. In Appendix II,
we show that in equilibrium:
(1) It is never the case that informed voters who receive an ad from the own (other)
candidate vote for the other (own) candidate;11
(2) It is never the case that informed voters who receive an ad from the own (other)
candidate abstain and that uninformed voters vote for the own (other) candidate;
(3) It is never the case that all informed and uninformed voters abstain.
Rephrasing these results, we predict that when an informed voter receives a potentially
false advertisement from her own party’s candidate, she will not vote for the other candidate.
Similarly, when the voter receives a potentially deceptive advertisement form the opposing
candidate, she will not choose to vote for her own candidate. In both cases, the theory predicts
that if the voter casts a ballot, she will vote for the candidate from whom she received the
potentially deceptive advertisement. This is because the voter knows that the advertisement is
11
To rule out the case that all voters vote for their own candidate, we must assume that ε is sufficiently small
compared to H Lx x and the informativeness of an ad, which is, however, satisfied for our parameterization.

11
more likely to be true than deceptive. The only case in which it is logical for some informed
voters to abstain is when uninformed voters vote.
We prove the existence of three equilibria in deceptive campaigns (see Appendix II). One
of those equilibra is the Abstention equilibrium that we found for truthful campaigns. In this
equilibrium, uninformed voters abstain and informed voters vote according to the advertisement
they received.
With regard to the other two equilibria, it is necessary to distinguish between informed
voters who receive an advertisement from their own party’s candidate and those who receive an
advertisement from the other party’s candidate. In these two equilibria, one group of informed
voters votes according to the advertising received, while one group of informed voters abstains.
All uninformed voters vote.12
Specifically, an informed voter who receives an ad from her own
(other) candidate votes for her own (other) candidate. Likewise, an informed voter who receives
an ad from the other (own) candidate abstains, and an uninformed voter votes for their own
(other) candidate.
The intuition for both equilibria is similar. Consider, for example, the equilibrium in
which informed voters who receive an ad from the other candidate abstain. Why wouldn’t it pay
to vote for the other candidate? Consider the state of the world when the Circle candidate is of
low quality and a voter who is leaning toward the Triangle party receives an ad from the Circle
candidate. Since the Circle candidate is of low quality, Triangle ads are more likely. Thus, it is
more likely that Circle-type voters will abstain and less likely that the Circle candidate will win.
Consequently, voting for the Circle candidate rather than abstaining creates a relatively high
chance of changing the outcome in favor of the low-quality Circle candidate. In the other state of
the world, where the Circle candidate is of high quality, the logic is similar. Voters are more
12
These two equilibria exist given the parameters that we use in our experiments.

12
likely to receive ads from the high-quality Circle candidate; thus, Triangle-type voters are more
likely to abstain and the Circle candidate is more likely to win. By voting for the Circle
candidate, the chance of changing the outcome in favor of the high-quality Circle candidate is
rather low. Since both states of the world are equally likely, it is better to abstain than to vote for
the Circle candidate.
In Appendix II, we prove that, for the parameters we use in the experiment
( 22, 7.5, =4.5, 0.5, 0.2, 0.05H LN x x p q ), the ―All vote equilibrium‖ that existed for
truthful campaigns no longer exists in deceptive campaigns. The intuition is that, since some
votes are based on false information (implying that both candidates receive votes and thus the
election is closer than under truthful advertising), the likelihood of an uninformed vote changing
the outcome to the low-quality candidate is sufficiently high to deter uninformed voting.
As mentioned in the introduction, the research closest to ours is that of Fedderson and
Pesendorfer (FP 1999), who considered the effect of a noisy signal on voter behavior when the
size of the electorate is uncertain. In contrast to our results, they found two types of voters: one
who votes for her candidate irrespective of the signal she receives, and another who votes for
candidate A as long as she does not receive information from candidate B. If the voter receives
information from candidate B, FP’s voter abstains while our voter switches to candidate B.
II.2.2 Efficiency of Electoral Outcome – Deceptive Campaigns
Again we consider the level of efficiency that is reached in equilibrium in the collective
decision process relative to the first best. Compared to the case of truthful advertising, expected
efficiency is lower in deceptive campaigns. The reason is that informed voting according to the
received ad results in votes for the low-quality candidate (since some of the ads are false). This

13
increases the probability of electing the low-quality candidate. For the parameters N=22, p=0.2
and q=0.05 used in the experiment, we simulated the probabilities for the high-quality candidate
winning the election and for a tie. 13
In the Abstention equilibrium, the high-quality candidate
wins with probability 0.91 and a tie results with probability 0.057. Thus, expected efficiency is
about 0.938. In the other two equilibria, where informed voters abstain but uninformed voters
vote, efficiency is lower (since not all information is used and uninformed voters vote). Here, the
high-quality candidate wins with probability 0.786 and a tie results with probability 0.158.
Therefore, expected efficiency is about 0.865.
III. Experiment Design
The experiment was implemented entirely on computers using software created specifically for
election experiments with campaign advertising. Subjects were seated in the laboratory at
individual computer terminals. They could not see other subjects’ decisions. Once seated,
subjects completed the computerized instructions, which included an interactive quiz. A
transcript of the instructions is given in Appendix I. After all subjects successfully completed the
instructions, they were acquainted with the software interface and the ―mouse-over‖ technology.
First, subjects were told that mouse-clicking was not necessary during the experiment but that all
decisions could be executed by moving the cursor over the appropriate area on the screen
(―mouse-over‖). Subjects were required to acknowledge the receipt of an advertisement. Due to
this technology, subjects could not hear whether other subjects received an advertisement.
Subjects practiced two interactive campaigns. In the practice rounds no money was earned. After
the practice rounds, paid rounds began.
13
We ran a Monte Carlo simulation with one million draws to obtain these probabilities.

14
The experiment included multiple rounds. Candidates and advertising were automated in
our experiment. Thus, all subjects were voters. In each round, half of the subjects were randomly
assigned to each party (the experiment was always conducted using an even number of subjects).
Political parties were represented by Triangle or Circle. A party’s (automated) candidate was
assigned a pattern, Striped or Solid, which represented a candidate’s quality or ideological
position. 14
In each round, one party’s candidate was randomly assigned as Striped and the other
one as Solid. Voters knew the party of each candidate (Triangle or Circle) but not the candidate’s
quality (Striped or Solid). We set voters’ incentives such that all voters were swing voters: they
preferred Striped to Solid candidates, but within a quality, they preferred a candidate of their
own party. Hence, a voter’s payoff depended on her own party assignment as well as the party
and shading (Striped or Solid) of the winning candidate.
Table 2 shows the payoff of a voter. Payoffs are expressed in experimental dollars, which
were converted at a known exchange rate (12 to 1) to US dollars at the end of the experiment. In
addition, each subject received a 5 US dollars show-up fee. A round proceeded as follows: At the
beginning of each round, subjects were assigned a party affiliation. Then, in a one-minute
campaign period, automated candidates sent ads to the voters. Each voter received an ad with
some probability as we describe below. After the campaign period, all subjects cast a vote for
exactly one of the candidates or abstained from voting (each choice was an active choice).
Voting was costless. The candidate receiving the majority of votes was declared the winner (ties
were broken by a computerized random draw) and the outcome was announced to voters.
Subjects were told the cumulative amount that they had earned over the course of the
experiment. Then a new round began.
14
In the instructions we only refer to a candidate’s pattern and do not use expressions like a candidate’s quality.

15
We conducted two types of campaigns: truthful campaigns (―Treatment T‖) and
deceptive campaigns (―Treatment D‖). During truthful campaigns, Striped candidates sent
advertisements to voters providing truthful information that the candidate’s quality was Striped.
During deceptive campaigns, Striped and Solid candidates sent advertisements. Advertisements
sent by Striped candidates provided truthful information about the candidate’s quality.
Advertisements from Solid candidates, however, falsely claimed that the candidate was Striped.
In total, each session included 39 or 40 campaigns and 22 potential voters. We used a
within-subjects design, where campaign advertising treatments varied by round according to a
predetermined (random) pattern.15
Campaigns were split equally (or nearly equally in 39
campaign sessions) between the deceptive and truthful conditions. Subjects were not told how
many campaigns were to be run in the experiment, nor the distribution of treatments. Before we
began a campaign, we informed subjects about whether the campaign would be truthful or
deceptive. In contrast to a between-subject design, the within-subject design allowed us to
control for unobservable subject heterogeneity.
In truthful campaigns, the probability of receiving an ad from the Striped candidate was
0.2 for each voter. In deceptive campaigns, the probability of receiving an ad was 0.2 from the
Striped candidate and 0.05 from the Solid candidate. Consequently, during any truthful
campaign, some subjects might have seen one advertisement (from the Striped candidate) while
others saw none. During any deceptive campaign, some subjects might have seen two
advertisements (one ad from each candidate, occurring with probability pq=0.01), some might
have seen one advertisement (one ad from either the Striped or the Solid candidate, occurring
with probability (1-p)(1-q)=0.76), and some might have seen none (with probability p(1-q)+q(1-
15
This predetermined pattern also included the random choice of candidates’ types which ensured they were high-
quality in half (or, in 39 campaign sessions, nearly half) of campaigns.

16
p)=0.23). Comparing the two campaign advertising treatments enables us to analyze the effect of
deceptive advertising on voter behavior, with particular attention to voter turnout, the identity of
the elected candidate, and the efficiency of electoral outcomes.
IV. Theoretical Predictions
In this section, we summarize the equilibrium predictions of our model for voter behavior and
efficiency of the electoral outcome.
IV. I. Voter Behavior
Given our parameterization in truthful campaigns, both the All vote and the Abstention
equilibrium exist. We hypothesize, in line with both equilibrium predictions, that voters in
truthful campaigns who receive an advertisement will vote for the candidate who sent the
advertisement. We predict that those voters who do not receive an advertisement will either
abstain from voting or vote for their own party’s candidate. Further, we hypothesize that
uninformed voters will be more likely to abstain. The reason is that the Abstention equilibrium
has a higher efficiency than the All vote equilibrium.
According to our theoretical analysis and parameterization for deceptive campaigns, the
Abstention equilibrium exists, but the All vote equilibrium does not. Likewise, we believe the
two equilibria described in Section II are less likely due to their lower efficiency. Thus, we
hypothesize that in deceptive campaigns, informed voters will generally vote for the candidate
who sent them an ad, while uninformed voters will mainly abstain.16
One of our central findings
for deceptive campaigns was that a voter who receives a potentially false advertisement makes a
16
Since in deceptive campaigns three equilibria exist, the turnout decision of voters might be affected by observing
whether other people decided to vote or not. Grosser and Schram (2006) experimentally analyze the effect of
observability of other people’s decisions and find that this information increases turnout.

17
suboptimal choice when she votes for the other candidate. Consequently, receiving a potentially
deceptive advertisement should not cause a voter to vote against the candidate sending the
advertisement. Otherwise, this would lead to a significant decrease in efficiency. Our
experiments shed light on whether voters, when faced with the possibility that an advertisement
is deceptive, follow this optimal strategy of not voting against the candidate who sent the
advertisement.
IV. 2. Efficiency of Electoral Outcomes
As derived in Section II, expected efficiency in truthful campaigns is between 0.957 and 0.996.
In deceptive campaigns, it is between 0.938 and 0.865 for our parameters. Thus, we hypothesize
that efficiency in deceptive campaigns is lower.
V. Results
All subjects were recruited from George Mason University’s student population via an
automated recruitment mechanism. Subjects were in the laboratory for about one hour. They
were paid privately at the end of the experiment and earned about $25 on average. In total, 44
subjects participated in 39 or 40 two-candidate campaigns and elections. Overall, we observed
1,738 voting decisions.
In this section we investigate the effect of advertising on voting behavior and the
efficiency of electoral outcomes in both truthful and deceptive campaigns. We begin by
analyzing decisions of voters who received no advertisement (―uninformed voters‖)17
, followed
17
In the following we exclude voters who received two ads, yet the results do not change if we include them (two
ads are received with empirical frequency 1.17% in the deceptive campaigns).

18
by the decisions of voters who received an advertisement (―informed voters‖). Finally, we
examine efficiency.
V.1. Uninformed Voters
In true advertising campaigns 80% of all voters were uninformed. The number of uninformed
voters (who received no advertisement) was 75% in deceptive campaigns. Naturally, these
empirical frequencies correspond closely with the theoretical values of 80% and 76%,
respectively, implied by our experiment design.
Table 3 reports that voting and abstention decisions of uninformed voters are similar
between treatments (statistical differences are reported in section V.3 below). The overall
fractions of abstentions are 25% and 24% in the true and deceptive ad treatments, respectively.
The chance of voting for one’s own party’s candidate is 64% and 60% in these two cases. The
likelihood of voting for the other party’s candidate is 11% when ads are true, and 17% when ads
might include deceptive information. Thus, in contrast to our hypothesis that uninformed voters
abstain, we find instead that a larger fraction of uninformed voters votes. In particular, voters
tend to vote for their own party’s candidate. For both campaigns, however, voting one’s own
party’s candidate is consistent with behavior in one of the less efficient equilibria.
V.2. Informed Voters
Table 4 summarizes the decisions of informed voters in campaigns with true and deceptive
advertisements. As predicted by theory, there are almost no abstentions for informed voters in
truthful campaigns. Also, roughly the same number of voters vote for their own candidate (51%)
and the other party’s candidate (48%), which makes sense in light of the fact that each candidate

19
is high-quality with probability 0.5. In campaigns with deceptive advertising, abstention rates are
substantially higher (15%), while the likelihood of voting for the other party’s candidate is only
half as large as in truthful campaigns (25% vs. 48%). Higher abstention rates of informed voters
in deceptive campaigns are consistent with our two equilibria in which informed voters abstain.
Our theory, however, also predicts that informed voters should never vote for the candidate who
did not send the ad. We address this issue in subsequent tables.
In relation to Table 3, it is worth noting that voters in truthful campaigns with truthful
information are nearly five times more likely to vote for the other party’s candidate than
uninformed voters. In contrast, one observes smaller differences between informed and
uninformed voters in deceptive campaigns: abstention rates are 15% and 24%, respectively, and
the uninformed and informed voters are about equally (59.8% and 60.3%) likely to vote for their
own party’s candidate.
Overall, informed voters’ decisions in deceptive campaigns do not follow the patterns
observed for truthful campaigns. Instead, in deceptive campaigns, once-informed voters are more
likely to abstain. Likewise, instead of voting for the candidate from whom they received the
advertisement, they vote against that candidate by voting for the opposition candidate. Not
voting for the candidate who sent the advertising is suboptimal and occurs most frequently when
the advertisement came from the other party’s candidate (see Table 4).
Table 5 describes the decisions of informed voters after receiving an advertisement from
the other party’s candidate in both treatments. We find, consistent with our theory, that an
informed voter in the truthful environment votes according to the information received. 85% of
voters who receive an advertisement from the other party’s candidate vote for that candidate. In
the deceptive treatment, however, only 42% of those voters switch when they receive the other

20
candidate’s advertisement. The remainder choose to abstain (20%) or vote for their own party
(38%). This occurs in spite of the fact that theory suggests the optimal decision is to vote for the
other party’s candidate or to abstain. According to our theoretical prediction, voting for one’s
own party after receiving a potentially deceptive advertisement from the other party’s candidate
is the ―wrong‖ choice. Thus, it appears that the presence of incorrect information leads to
suboptimal decisions.18
Table 6 presents the choices of informed voters when they receive an advertisement from
their own party’s candidate. In the truthful treatment, the overwhelming fraction (96%) of
informed voters vote for their own party, as predicted by our theory. In the deception campaign
this fraction drops to 80%. Again (as in Table 5), some voters make the suboptimal choice to
vote for the other party’s candidate.
V.3. Multinomial Analysis of Voting Decisions
Next, we test our predictions within a random effects multinomial logistic regression framework.
Our dependent variable is the voter’s choice; that is, whether to vote for the voter’s own
candidate, to vote for the candidate from the other party, or to abstain. Our independent variables
include a treatment dummy, which we code as zero for the truthful treatment and one for the
deceptive treatment (Treatment D). We also include dummy variables for receiving an
advertisement from the voter’s own party’s candidate or the other party’s candidate (Ad from
own candidate, Ad from other candidate). We omit the ―receiving no advertisements‖ category.
We account for individual heterogeneity by including individual random effects.
18
One might ask whether our results are influenced by the fact that individuals often tend to overweigh small
probabilities. However, even if subjects in our experiment suffer from such a bias, they should realize that the
chance of receiving truthful information is four times as high as receiving false information.

21
To test whether responses differ by treatment, we include an interaction between the
treatment and whether the voter received an advertisement from either the own party’s candidate
or the other party’s candidate. We implement this full set of interactions (Treatment D*Ad from
own candidate, Treatment D*Ad from other candidate) when the observed outcome is ―voting
for the other party,‖ but our data do not allow us to construct this full set of interactions when the
observed outcome is ―abstain.‖ The reason is that ―Ad from other candidate‖ and ―Treatment
D*Ad from other candidate‖ are perfectly collinear. This perfect collinearity is explained by the
fact that when advertising is truthful, we do not observe subjects abstaining when they receive an
advertisement from the other candidate. Therefore, for the abstention category, we create a
―Treatment D*Seen ad‖ variable, where ―Seen ad‖ equals one if either ―Ad from own candidate‖
or ―Ad from other candidate‖ equals one. To control for temporal effects we include the
campaign number (Campaign) among our independent variables.
We present the results of the estimation in Table 7. The first column contains no
interactions between the deception treatment and the candidate from whom subjects received an
advertisement. The second column, however, contains these interactions. In these regressions,
the coefficients are evaluated relative to the baseline outcome, which is voting for the voter’s
own party’s candidate.
The top panel of Table 7 shows the determinants of voting for the other party’s candidate.
As predicted, receiving an advertisement from the voter’s own party’s candidate reduces the
probability that the recipient will vote for the other party’s candidate. Further, receiving an
advertisement from the other party’s candidate increases the likelihood that the voter will vote
for the other party’s candidate. We also find that in deceptive campaigns, uninformed voters are

22
more likely to vote for the other party’s candidate when we include the interactions in column 2.
This is consistent with one of our additional equilibria for deceptive campaigns.
The coefficient on the interactions between the deception treatment variable and the
variables indicating who sent the advertisement once again indicate that the presence of false
information leads voters to make suboptimal choices. In particular, our theory predicts that the
point estimates on these interactions should all be zero, but they are not. For example, the
coefficient of the interaction ―Treatment D*Ad from other candidate‖ is negative and statistically
significant, indicating that subjects in the deception treatment who receive an advertisement are
less likely to make the optimal choice to vote for the other party’s candidate. Similarly, the
estimation results indicate that, relative to the truthful treatment, the probability of voting for
one’s own party’s candidate is lower when receiving a possibly deceptive advertisement from
that candidate.
The bottom panel of Table 7 details the estimates for the decision to abstain. Here, the
point estimates for having seen an advertisement from the voter’s own party’s candidate are
negative and statistically significant, indicating that when voters receive an advertisement, they
are less likely to abstain. However, the point estimate on having seen an ad from the other
party’s candidate is positive (in column 1), indicating that seeing an advertisement from the other
party’s candidate makes the voter more likely to abstain. This result, however, is due to the
specification that does not allow for differences in responses between the two treatments. We see
in Table 7, column 2 – which allows for differences in responses between the two treatments -
that the point estimate on having seen an advertisement from the other party’s candidate is
negative and statistically significant. This indicates a lower chance of abstention when seeing an
advertisement. Thus, information reduces abstention. This reduction is larger when voters

23
receive an advertisement from their own party’s candidate than when they receive one from the
other party’s candidate.
The interaction effect between the deception treatment and having seen an advertisement
is positive and statistically significant (Table 7, column 2). This is consistent with one of our
predictions. The positive coefficient on the interaction shows that deception makes informed
voters more likely to abstain. This result shows that even a small probability of deception lowers
the probability that those voters who have information will vote in elections. If voters with
truthful information decide to abstain due to the fact that they do not trust the information, this
will increase the likelihood that the low payoff candidate will be elected, and result in a
reduction in welfare. Finally, we find no evidence supporting temporal effects in the decision to
vote for the other party’s candidate, though there is some support for weakly positive effects in
the decision to abstain.
V.4. Efficiency of Electoral Outcomes
To assess the effect of information on efficiency of electoral outcomes, we begin by
investigating the effect of information between treatments. Table 8 shows that informed voters
cast their ballot for the high-quality candidate when advertising is truthful, but fail to do so when
advertising is deceptive. A reason, as discussed with Table 4, is that informed voters in the
deception treatment appear to abstain rather than vote for the high-quality candidate. In
particular, we find that 91% of informed voters vote for the high-quality candidate in the true
advertising environment, and only 59% of informed voters vote for the high-quality candidate in
the deception treatment. This is despite the greater than 4:1 odds that the information is accurate,
and that the theoretically optimal decision is to vote for the candidate who sent the

24
advertisement. Comparing both treatments, we also find that in the deception treatment, when
information is received, there is a four-fold increase in the likelihood of an informed voter
casting a ballot for a low-quality candidate (Table 8).
These observations suggest deceptive advertising affects electoral outcome efficiency. As
discussed above, out theoretical model predicts that efficiency under true advertising is about
0.95 to 0.99, while predicted efficiency is slightly lower, 0.87 to 0.94, when ads are deceptive.
To measure efficiency empirically, we assign an efficiency value of 1 to an election where the
Striped candidate wins, a value of 0.5 if there is a tie, and zero if the Solid candidate wins. So
measured, mean efficiencies are 0.89 for Treatment T and 0.49 for Treatment D, and this
difference is statistically significant (t-test, p = 0.00, two-tailed).19
Thus, campaigns with decep-
tive advertising are much more likely than truthful campaigns to result in the election of a low-
quality candidate. In particular, there would be an average efficiency of 0.5 (as we observe for
Treatment D) if voters cast their votes randomly.
VI. Conclusion
It is widely accepted that candidates do not always tell the truth during electoral campaigns. This
raises the question of how deception influences voter behavior, turnout, and the overall
efficiency of elections. In this paper, we address this question using laboratory experiments in
which campaign advertising is exogenous and is either truthful or possibly deceptive. In line with
previous studies that assume that advertising is truthful, we find that informative advertising
leads to a higher turnout of informed voters. Yet voters make suboptimal choices when an
advertisement has even a small chance of being deceptive. For example, we find that voters are
reluctant to vote for the other party’s candidate when they know they received a potentially
19
When we exclude ties, results do not change (t-test, p = 0.00, two-tailed).
25
deceptive advertisement from that candidate. Further, voters who do not receive an
advertisement, but know that advertisements might be deceptive, are more likely to vote for the
opposing party’s candidate than when advertising is truthful.
These changes in behavior influence an election’s outcome. The low pay-off candidate is
more likely to be elected when deception is possible; consequently, the efficiency of the election
outcome is lower in deceptive campaigns. Both 1) the decrease in efficiency; and 2) voters’
reactions to a small probability of deception are much larger than predicted by our model that
assumes rational behavior. Observed efficiency in deceptive campaigns is no higher than when
voters cast their votes randomly.
An important open question is why relatively large changes in behavior occur in
environments with small amounts of false information. It would be profitable to explore this with
future theoretical research in economics and psychology. Our study of deception is a small step
along a rich path for inquiry in theoretical, experimental and field research.

26
References
Ansolabehere, Stephen and Shanto Iyengar. 1996, ―Going Negative: How Political
Advertisements Shrink and Polarize the Electorate,‖ The Free Press, New York.
Battaglini, Marco, Rebecca B. Morton, and Thomas R. Palfrey, 2008. Information Aggregation
and Strategic Abstention in Large Laboratory Elections, American Economic Review: Papers
and Proceedings. 98(2), 194–200.
Battaglini, Marco, Rebecca B. Morton, and Thomas R. Palfrey, 2009. The Swing Voters Curse in
the Laboratory, Forthcoming. Review of Economic Studies.
Coate, Stephen. 2004 a. "Pareto-Improving Campaign Finance Policy," American Economic
Review, v94(3,Jun), 628-655.
Coate, Stephen. 2004 b. ―Political competition with campaign contributions and informative
advertising,‖ Journal of European Economic Association, 2 (5), 772–804.
Corazzini, Luca , Sebastian Kube, Michel André Maréchal,and Antonio Nicoló ―Elections and
Deceptions: Theory and Experimental Evidence‖ Working Paper, University of Zurich. 2009.
Coupe, Thomas and Abdul Noury. 2004. Choosing not to choose: on the link between
information and abstention, Economics Letters 84, 261–65.
Downs, Anthony. 1957. An Economic Theory of Democracy. New York: Harper.
Feddersen, Timothy and Pesendorfer Wolfgang, 1999. Abstention in Elections with Asymmetric
Information and Diverse Preferences, American Political Science Review 93(2), 381–98.
Feddersen, Timothy and Pesendorfer Wolfgang, 1996. The Swing Voters Curse, American
Economic Review 86(3), 404–24.
Gentzkow, Matthew, 2006. Television and Voter Turnout, Quarterly Journal of Economics 121,
931–72.
Gerber, Alan. 1998. ―Estimating the effect of campaign spending on Senate using instrumental
variables,‖ American Political Science Review 92(2), 401-411.
Grosser, Jens and Arthur Schram (2006): "Neighborhood Information Exchange and Voter
Participation: An Experimental Study", American Political Science Review, 100, 235-248.
Houser, Daniel, Rebecca B. Morton and Thomas Stratmann. Turned Off or Turned Out?
Campaign Information, Advertising and Voting. Working paper, George Mason University.
Lassen, David, 2005. The Effect of Information on Voter Turnout: Evidence from a Natural
Experiment, American Journal of Political Science, 49(1), 103-18.

27
Levitt, Steven D. 1993. ―Using repeat challengers to estimate the effect of campaign spending on
election outcomes in the US House,‖ Journal of Political Economy, 102, 777-798.
Matsusaka, John, 1995. Explaining Voter Turnout Patterns: An Information Theory, Public
Choice 84, 91–117.
Palfrey Thomas and Keith Poole, 1987. The Relationship between Information, Ideology, and
Voting Behavior, American Journal of Political Science 31(3), 511–30.
Potters, J., Sloof, R. and van Winden, F. 1997. ―Campaign expenditures, contributions and direct
endorsements: the strategic use of information and money to influence voter behaviour,‖
European Journal of Political Economy 46, 487-506.
Prat, Andrea. 2002. ―Campaign advertising and voter welfare,‖ Review of Economic Studies 69,
997-1017.
Schultz, C. 2007. „Strategic Campaigns and redistributive potitics,― Economic Journal 117, 936-
963.
Stratmann, Thomas. (2005): "Some Talk: Money in Politics. A (Partial) Review of the
Literature", Public Choice, Vol. 124, pp. 135-156.
Wattenberg, Martin, Ian McAllister, and Anthony Salvanto. 2000. How Voting is Like an SAT
Test: An Analysis of American Voter Rolloff, American Politics Quarterly, 28(2), 234-50.

28
Appendix I – Instructions
Welcome to today’s experiment! You will be taking part in a decision making study. We are
interested in your decisions that you make on your own. That means, now that the experiment
has started, no talking, please. Please turn off all electronic devices. If you have any questions at
any time during the experiment, or have any trouble with the computer, please raise your hand,
and we will come to you to answer your question.
As you proceed through these instructions, there will be a quiz question at the bottom of certain
pages. You must answer the question correctly before going to the next page.
When you are finished reading a screen, click the <Next> button to continue.
Overview
You are a voter in a series of election campaigns. At the beginning of each campaign you are
randomly assigned to a party: either the Circle party or the Triangle party. At the end of each
campaign you vote for either the Circle party candidate or the Triangle party candidate. The
amount of money you earn in each campaign depends on whether the elected candidate is Striped
or Solid. You earn more money if the elected candidate is Striped, regardless of the candidates
party affiliation.
Whether a party’s candidate is Striped is random and can be different in each campaign.
Candidates send advertisements saying that they are Striped.
These advertisements are true if they are made by a Striped candidate. The advertisement is false
if it is made by a Solid candidate.
In each campaign you will make a voting decision.
We next describe the specifics of the experiment.
Parties
You will be a voter assigned randomly to a political party. The two parties are the Circle Party
and the Triangle Party. Each party will be represented by one candidate. There are an even
number of voters, so in each campaign half the voters will be Circle party and half will be
Triangle party.
You will be randomly reassigned to a party at the beginning of each of the campaigns. Party
assignment will not affect your ability to earn payoffs during the experiment.
29
Question: If you are a Circle voter in campaign 1, how many times is it possible for you to be
assigned to the Circle party in subsequent campaigns? A: None B: No limit C: 1 D: 2
Combinations of Striped and Solid Candidates
Whether a candidate is Striped or Solid is randomly determined at the beginning of each
campaign. The two possible Striped and Solid candidate combinations are listed below. Both
combinations are equally likely in any campaign.
(1) Circle candidate is Striped
Triangle candidate is Solid
(2) Circle candidate is Solid
Triangle candidate is Striped
Candidate Advertisements
In some campaigns only Striped candidates advertise. In others Striped and Solid candidates
advertise.
If candidates can send ads, they always advertise. You might not see a candidate’s
advertisement.
Striped candidates will advertise that they are striped. Solid candidate will also send
advertisements, falsely claiming they are Striped.
In each campaign, your chance of seeing a Striped candidate’s ad is 1 in 5. In campaigns in
which Solid candidates can send ads (which claims that he or she is Striped) your chance of
seeing a Solid candidate’s ad is 1 in 20.
When you receive an ad, you will see a pop-up window alerting you that you have received an
ad. Also, in the bottom panel of your screen, the shading of the candidate’s symbol will change
to Striped.
When Solid candidates advertise, a question mark will appear in the candidate’s symbol as the
candidate can actually be Solid or Striped.
Voting
To make your voting decision, you will use the voting screen.

30
In each campaign you have the option to either vote or not to vote (that is, to abstain).
When you move your mouse over one of the buttons, a message box will appear asking you to
confirm your choice. You will not be able to change your decision once it has been confirmed.
Ties will be broken randomly.
After everyone has voted, the election results will be shown to all participants. You will see the
results along with your personal earnings for the campaign.
Abstentions
―Abstain‖ means simply that you wish to cast a vote for neither candidate.
Choosing to vote or to abstain may affect the outcome of the election.
Your earnings depend on which candidate wins the election, and your earnings will be the same
whether you voted for Circle, Triangle, or you chose to Abstain.
How You Earn Money
Your earnings are determined by the election outcome. Potential earnings listed below are in
experimental dollars, E$, which will be converted to US dollars at a rate of E$12 = $1. The
election outcome affects your earnings in one of four ways:
* The candidate in your party wins and that candidate is Striped: You earn E$7.50.
* The other party’s candidate wins and that candidate is Striped: You earn E$7.00.
* Your party’s candidate wins and that candidate is Solid: You earn E$4.50.
* The other party’s candidate wins and that candidate is Solid: You earn E$4.00.
Your earnings are always higher when the Striped candidate wins.
Example Question: You are a Circle voter. A Striped Triangle candidate won the election. How
much did you earn this round? A: E$7.50 B: E$7.00 C: E$4.00 D: E$4.50
There will be multiple campaigns in this experiment. Your party affiliation will be randomly
reassigned in each campaign.
31
Before each campaign begins, a screen will tell you your party affiliation for that campaign. It
will also tell you whether only Striped or also Solid candidates send ads.
At the conclusion of the final campaign, a summary screen will display your total earnings
including your show-up bonus.
Please sit quietly after the experiment has concluded and wait to be called to receive your
earnings.
Click the <Finished> button to begin the experiment.
32
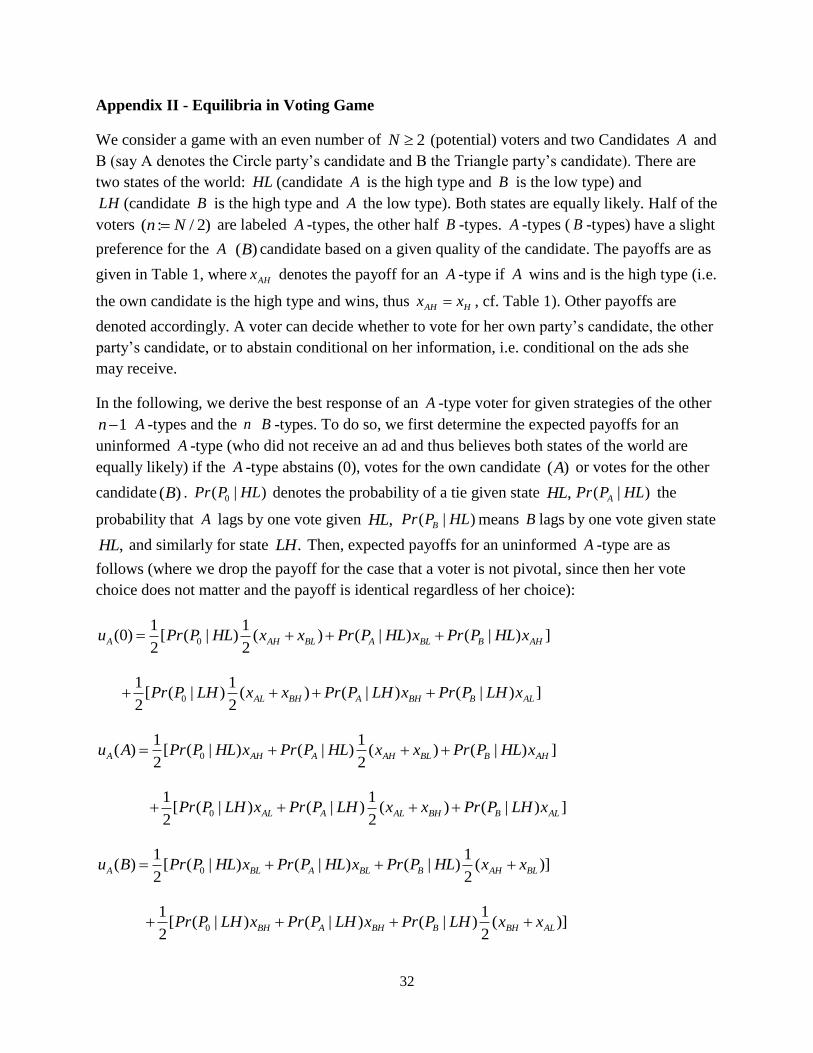
Appendix II - Equilibria in Voting Game
We consider a game with an even number of 2N (potential) voters and two Candidates A and
B (say A denotes the Circle party’s candidate and B the Triangle party’s candidate). There are
two states of the world: HL (candidate A is the high type and B is the low type) and
LH (candidate B is the high type and A the low type). Both states are equally likely. Half of the
voters ( : / 2)n N are labeled A -types, the other half B -types. A -types ( B -types) have a slight
preference for the A ( )B candidate based on a given quality of the candidate. The payoffs are as
given in Table 1, where AHx denotes the payoff for an A -type if A wins and is the high type (i.e.
the own candidate is the high type and wins, thus AH Hx x , cf. Table 1). Other payoffs are
denoted accordingly. A voter can decide whether to vote for her own party’s candidate, the other
party’s candidate, or to abstain conditional on her information, i.e. conditional on the ads she
may receive.
In the following, we derive the best response of an A -type voter for given strategies of the other
1n A -types and the n B -types. To do so, we first determine the expected payoffs for an
uninformed A -type (who did not receive an ad and thus believes both states of the world are
equally likely) if the A -type abstains (0), votes for the own candidate ( )A or votes for the other
candidate ( )B . 0( | )Pr P HL denotes the probability of a tie given state ,HL ( | )APr P HL the
probability that A lags by one vote given ,HL ( | )BPr P HL means B lags by one vote given state
,HL and similarly for state .LH Then, expected payoffs for an uninformed A -type are as
follows (where we drop the payoff for the case that a voter is not pivotal, since then her vote
choice does not matter and the payoff is identical regardless of her choice):
0
1 1(0) [ ( | ) ( ) ( | ) ( | ) ]
2 2A AH BL A BL B AHu Pr P HL x x Pr P HL x Pr P HL x
0
1 1[ ( | ) ( ) ( | ) ( | ) ]
2 2AL BH A BH B ALPr P LH x x Pr P LH x Pr P LH x
0
1 1( ) [ ( | ) ( | ) ( ) ( | ) ]
2 2A AH A AH BL B AHu A Pr P HL x Pr P HL x x Pr P HL x
0
1 1[ ( | ) ( | ) ( ) ( | ) ]
2 2AL A AL BH B ALPr P LH x Pr P LH x x Pr P LH x
0
1 1( ) [ ( | ) ( | ) ( | ) ( )]
2 2A BL A BL B AH BLu B Pr P HL x Pr P HL x Pr P HL x x
0
1 1[ ( | ) ( | ) ( | ) ( )]
2 2BH A BH B BH ALPr P LH x Pr P LH x Pr P LH x x
33
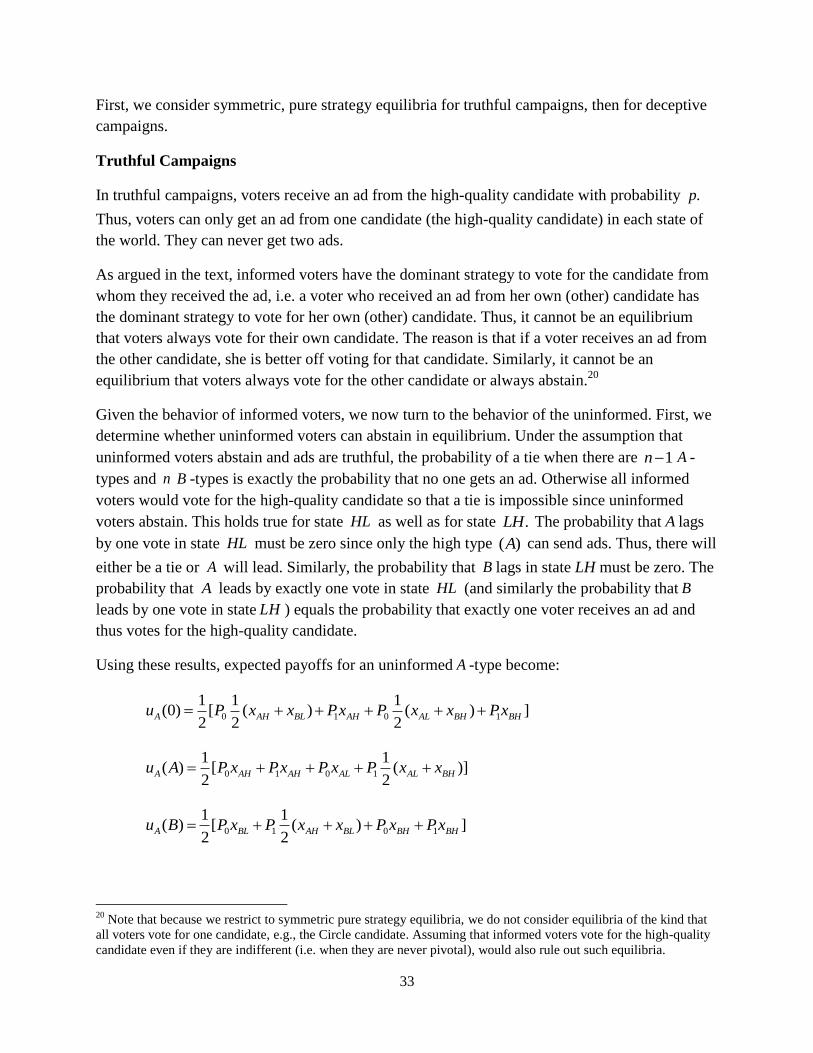
First, we consider symmetric, pure strategy equilibria for truthful campaigns, then for deceptive
campaigns.
Truthful Campaigns
In truthful campaigns, voters receive an ad from the high-quality candidate with probability .p
Thus, voters can only get an ad from one candidate (the high-quality candidate) in each state of
the world. They can never get two ads.
As argued in the text, informed voters have the dominant strategy to vote for the candidate from
whom they received the ad, i.e. a voter who received an ad from her own (other) candidate has
the dominant strategy to vote for her own (other) candidate. Thus, it cannot be an equilibrium
that voters always vote for their own candidate. The reason is that if a voter receives an ad from
the other candidate, she is better off voting for that candidate. Similarly, it cannot be an
equilibrium that voters always vote for the other candidate or always abstain.20
Given the behavior of informed voters, we now turn to the behavior of the uninformed. First, we
determine whether uninformed voters can abstain in equilibrium. Under the assumption that
uninformed voters abstain and ads are truthful, the probability of a tie when there are 1n A -
types and n B -types is exactly the probability that no one gets an ad. Otherwise all informed
voters would vote for the high-quality candidate so that a tie is impossible since uninformed
voters abstain. This holds true for state HL as well as for state .LH The probability that A lags
by one vote in state HL must be zero since only the high type ( )A can send ads. Thus, there will
either be a tie or A will lead. Similarly, the probability that B lags in state LH must be zero. The
probability that A leads by exactly one vote in state HL (and similarly the probability that B
leads by one vote in state LH ) equals the probability that exactly one voter receives an ad and
thus votes for the high-quality candidate.
Using these results, expected payoffs for an uninformed A -type become:
0 1 0 1
1 1 1(0) [ ( ) ( ) ]
2 2 2A AH BL AH AL BH BHu P x x Px P x x Px
0 1 0 1
1 1( ) [ ( )]
2 2A AH AH AL AL BHu A P x Px P x P x x
0 1 0 1
1 1( ) [ ( ) ]
2 2A BL AH BL BH BHu B P x P x x P x Px
20
Note that because we restrict to symmetric pure strategy equilibria, we do not consider equilibria of the kind that
all voters vote for one candidate, e.g., the Circle candidate. Assuming that informed voters vote for the high-quality
candidate even if they are indifferent (i.e. when they are never pivotal), would also rule out such equilibria.

34
where 2 1
0 0 0: ( | ) ( | ) (1 ) nP Pr P HL Pr P LH p and
2 2
1 : ( | ) ( | ) (2 1) (1 ) .n
B AP Pr P HL Pr P LH n p p
Is it a best response for an uninformed A-type voter to abstain? The payoff difference between
abstaining and voting for candidate A is
0 1
1(0) ( ) [ ( ) ( )]
4A A BH AH BL AL BH ALu u A P x x x x P x x .
Plugging in P0 and P1 as derived above the difference becomes
2 21(0) ( ) (1 ) [(1 )( ) (2 1) ( )]
4
n
A A BH AH BL AL BH ALu u A p p x x x x n p x x .
For our payoff parameters this difference becomes
2 21(0) ( ) (1 ) [(1 )( 2 ) (2 1) ( )].
4
n
A A H Lu u A p p n p x x
As 0 and 1H Lx x n , this difference is positive if 2
.2 ( )(2 1)H L
px x n
Thus,
the uninformed voter abstains rather than votes for her own candidate if p is sufficiently large.21
She also does not want to vote for the other candidate but rather abstains:
0 1 0
1(0) ( ) [( )( ) ( )] 0
4A A AH BL AL BHu u B P P x x P x x (since AH BL BH ALx x x x ).
As argued earlier, informed voters perfectly know the state of the world; thus, their best response
is always to vote for the high-quality candidate. Hence, we have established the following result.
Result 1: There exists an equilibrium, in which the uninformed voters abstain and the informed
ones vote for the candidate who sent the ad (i.e. the high-quality candidate) if
2.
2 ( )(2 1)H L
px x n
Next, we ask whether uninformed voters can vote for their own candidate in equilibrium. Given
that uninformed voters vote for their own candidate, then no one abstains (as the informed voters
vote for the high-quality candidate). Hence, when all 2 1n voters vote – all but our A -type
voter – the probability of a tie is zero: 2 1n is an uneven number and no one abstains. The
21
Note that the threshold is positive and smaller than 1 as 0H Lx x .

35
probability that A lags by one vote in state HL need no longer be zero since uninformed voters
vote for their own candidate. Since candidate A receives at least n-1 votes (as all A-types vote for
him in state HL irrespective of whether they receive an ad or not), this probability equals the
probability that either no voter receives an ad or only A -types receive ads, i.e. the probability
that no B -type receives an ad. Then B gets exactly one vote more than A as there are n B -types
and 1n A -types. As soon as one B -type would receive an ad – independent of whether the A -
types are informed or not – A would get more ads than B because the minimum number of votes
for A is 1.n Thus, ( | ) (1 ) .n
APr P HL p The probability that B lags by one in state
,LH however, is still zero, i.e. ( | ) 0,BPr P LH as only B can send ads: B receives a minimum of
n votes from the B -types whether these are informed or not, and if an A -type receives an ad,
she also votes for .B The probability that B lags by one vote in state HL equals the probability
that exactly one B -type receives an ad. There are at least 1n votes for .A If exactly one B -
type becomes informed and thus votes for A instead of ,B B lags by one vote as A gets n votes
and B 1.n Thus, 1( | ) (1 ) .n
BPr P HL np p The probability that A lags by one vote in state
LH equals the probability that no A -type receives an ad. Since B now receives at least n votes
from the B -types, only if no A -type switches, B leads by exactly one vote, i.e. 1( | ) (1 ) .n
APr P LH p
The payoff difference between abstaining and voting for candidate A for the uninformed A-type
is
0 0
1(0) ( ) [( )( ( | ) ( | )) ( )( ( | ) Pr( | )].
4A A BL AH A BH AL Au u A x x Pr P HL Pr P HL x x Pr P LH P LH
Plugging in the derived Pivot probabilities and the payoff parameters, this difference becomes
1 11 1(0) ( ) (1 ) [( )(1 ) ( )] (1 ) [( ) 2 ].
4 4
n n
A A BL AH BH AL H Lu u A p x x p x x p x x p
Thus, an uninformed A -type votes for the own candidate if 2
as 0.H L
H L
p x xx x
22
Moreover, it is also better for her to vote for her own candidate than for the other one as
0
1 1( ) ( ) [( )( ( | ) ( ( | ) ( | )))
2 2A A AH BL A Bu A u B x x Pr P HL Pr P HL Pr P HL
0
1( )( ( | ) (Pr( | ) Pr( | )))]
2AL BH A Bx x Pr P LH P LH P LH
22
Note that the threshold is positive and smaller than 1 as 0H Lx x .
36
11(1 ) [(1 )( ) ( )] 0
4
n
AH BL AL BHp p np x x x x
since 1n and AH BL BH ALx x x x .
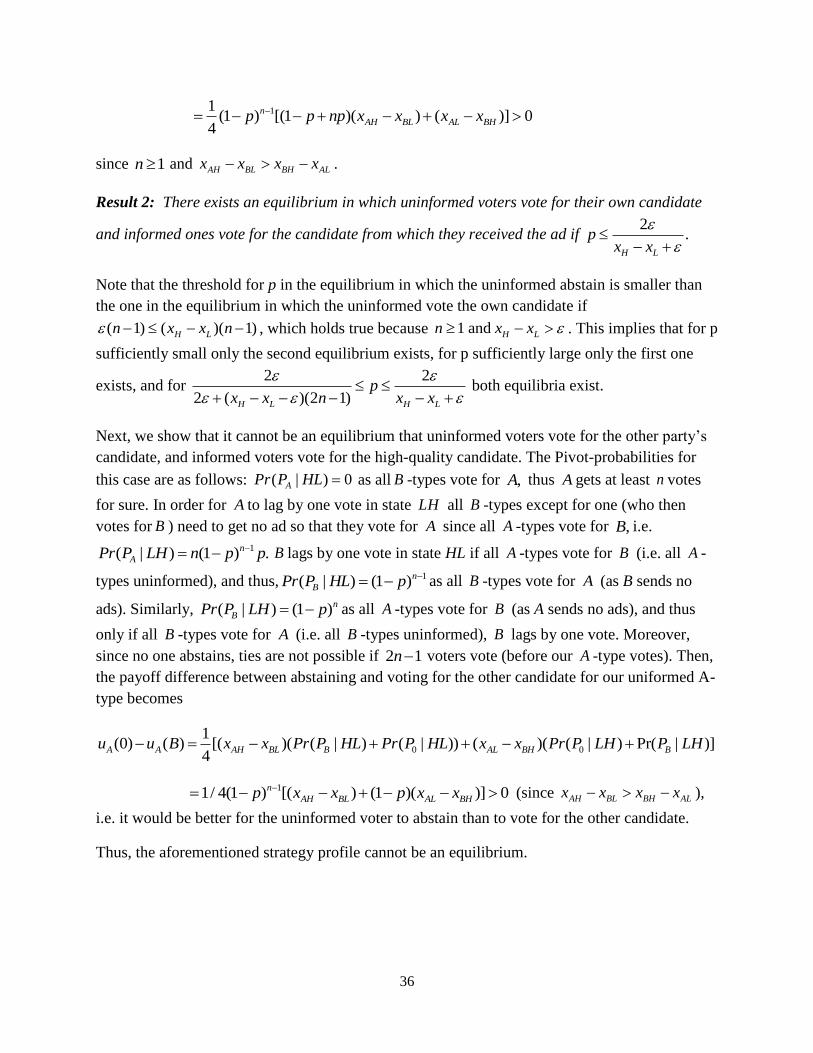
Result 2: There exists an equilibrium in which uninformed voters vote for their own candidate
and informed ones vote for the candidate from which they received the ad if 2
.H L
px x
Note that the threshold for p in the equilibrium in which the uninformed abstain is smaller than
the one in the equilibrium in which the uninformed vote the own candidate if
( 1) ( )( 1)H Ln x x n , which holds true because 1 and H Ln x x . This implies that for p
sufficiently small only the second equilibrium exists, for p sufficiently large only the first one
exists, and for 2 2
2 ( )(2 1)H L H L
px x n x x
both equilibria exist.
Next, we show that it cannot be an equilibrium that uninformed voters vote for the other party’s
candidate, and informed voters vote for the high-quality candidate. The Pivot-probabilities for
this case are as follows: ( | ) 0APr P HL as all B -types vote for ,A thus A gets at least n votes
for sure. In order for A to lag by one vote in state LH all B -types except for one (who then
votes for B ) need to get no ad so that they vote for A since all A -types vote for ,B i.e.
1( | ) (1 ) .n
APr P LH n p p B lags by one vote in state HL if all A -types vote for B (i.e. all A -
types uninformed), and thus, 1( | ) (1 )n
BPr P HL p as all B -types vote for A (as B sends no
ads). Similarly, ( | ) (1 )n
BPr P LH p as all A -types vote for B (as A sends no ads), and thus
only if all B -types vote for A (i.e. all B -types uninformed), B lags by one vote. Moreover,
since no one abstains, ties are not possible if 2 1n voters vote (before our A -type votes). Then,
the payoff difference between abstaining and voting for the other candidate for our uniformed A-
type becomes
0 0
1(0) ( ) [( )( ( | ) ( | )) ( )( ( | ) Pr( | )]
4A A AH BL B AL BH Bu u B x x Pr P HL Pr P HL x x Pr P LH P LH
11/ 4(1 ) [( ) (1 )( )] 0n
AH BL AL BHp x x p x x (since AH BL BH ALx x x x ),
i.e. it would be better for the uninformed voter to abstain than to vote for the other candidate.
Thus, the aforementioned strategy profile cannot be an equilibrium.

37
Deceptive Campaigns
In deceptive campaigns the low-quality candidate also sends ads. Hence, voters can receive zero,
one, or two ads now. a voter receives an ad from the high-quality candidate with probability p,
and from the low-quality candidate with probability q . We assume that .p q If a voter receives
no ad at all, she only knows that each state realizes with 1/2. If she receives an ad from her own
candidate, she knows that the ad is true with probability
(1 )
.(1 ) (1 )
p qt
p q q p
Note that t > 1/2 as p > q .
For an A -type, this means she expects that she is in state HL with probability t and in LH with
1 .t Similarly, if an A -type only receives an ad from the other candidate, she expects that she is
in state HL with probability 1 t and in LH with t . If a voter receives an ad from both
candidates, she knows that each ad is true with probability 1/2 and thus that both states are
equally likely. Note that this implies that voters who receive none and voters who receive two
ads are both ―uninformed.‖ Therefore, their expected payoff is identical and thus their behavior
in equilibrium is identical. If we refer to ―uninformed‖ voters in the following, we refer to those
voters who receive zero or two ads, and by ―informed‖ voters we denote those voters who
receive exactly one ad. Note that expected payoffs for an uninformed A -type if the A -type
abstains (0), votes for own candidate ( A ) or votes for other candidate ( B ) are as before for
truthful campaigns (yet, the Pivot-probabilities change). The payoff differences between the
different actions the uninformed A -type can choose are as follows:
0 0
1(0) ( ) [( )( ( | ) ( | )) ( )( ( | ) Pr( | )],
4A A BL AH A BH AL Au u A x x Pr P HL Pr P HL x x Pr P LH P LH
0 0
1(0) ( ) [( )( ( | ) ( | )) ( )( ( | ) Pr( | )],
4A A AH BL B AL BH Bu u B x x Pr P HL Pr P HL x x Pr P LH P LH
0
1 1( ) ( ) [( )( ( | ) ( ( | ) ( | )))
2 2A A AH BL A Bu A u B x x Pr P HL Pr P HL Pr P HL
0
1( )( ( | ) (Pr( | ) Pr( | )))].
2AL BH A Bx x Pr P LH P LH P LH
We obtain the expected payoffs for an informed A -type who receives an ad from A or B,
respectively, if she votes for A, B or abstains, by substituting t and 1 t for the probabilities of
1/2 for the states of the world in the expected payoff formulas for an uninformed A -type that we
derived for truthful campaigns where we denote the expected payoff on an A -type who received
an ad from A by (. | : )Au ad A and similarly by (. | : )Au ad B if she received an ad from B . The

38
payoff differences when choosing different actions given the A-type received an ad from A or B
become:
(0 | : ) ( | : )A Au ad A u A ad A0
1[ ( )( ( | ) ( | ))
2BL AH At x x Pr P HL Pr P HL
0(1 )( )( ( | ) ( | )],BH AL At x x Pr P LH Pr P LH
( | : ) ( | : )A Au B ad A u A ad A 0[ ( )( ( | ) 1/ 2( ( | ) ( | )))BL AH A Bt x x Pr P HL Pr P HL Pr P HL
0(1 )( )( ( | ) 1/ 2( ( | ) ( | ))]BH AL A Bt x x Pr P LH Pr P LH Pr P LH ,
( | : ) (0 | : )A Au B ad A u ad A0
1[ ( )( ( | ) ( | ))
2BL AH Bt x x Pr P HL Pr P HL
0(1 )( )( ( | ) ( | ))]BH AL Bt x x Pr P LH Pr P LH ,
(0 | : ) ( | : )A Au ad B u B ad B0
1[(1 )( )( ( | ) ( | ))
2AH BL Bt x x Pr P HL Pr P HL
0( )( ( | ) Pr( | )]AL BH Bt x x Pr P LH P LH ,
0( | : ) ( | : ) [(1 )( )( ( | ) 1/ 2( ( | ) ( | )))A A AH BL A Bu A ad B u B ad B t x x Pr P HL Pr P HL Pr P HL
0( )( ( | ) 1/ 2(Pr( | ) Pr( | ))]AL BH A Bt x x Pr P LH P LH P LH ,
0
1( | : ) (0 | : ) [(1 )( )( ( | ) ( | ))
2A A AH BL Au A ad B u ad B t x x Pr P HL Pr P HL
0( )( ( | ) Pr( | ))]AL BH At x x Pr P LH P LH .
First, we show in Steps 1-3 that in equilibrium voters who received an ad from their own
candidate cannot vote for the other candidate. To show this, we again consider the best response
of an A -type for given strategies of the other 1n A -types and the n B -types.
Step 1: We show that it cannot be that informed voters who received an ad from the own
candidate vote for the other candidate and those who received an ad from the other candidate
vote for their own candidate – irrespective of the behavior of the uninformed. Suppose to the
contrary these strategies were best responses, then in particular
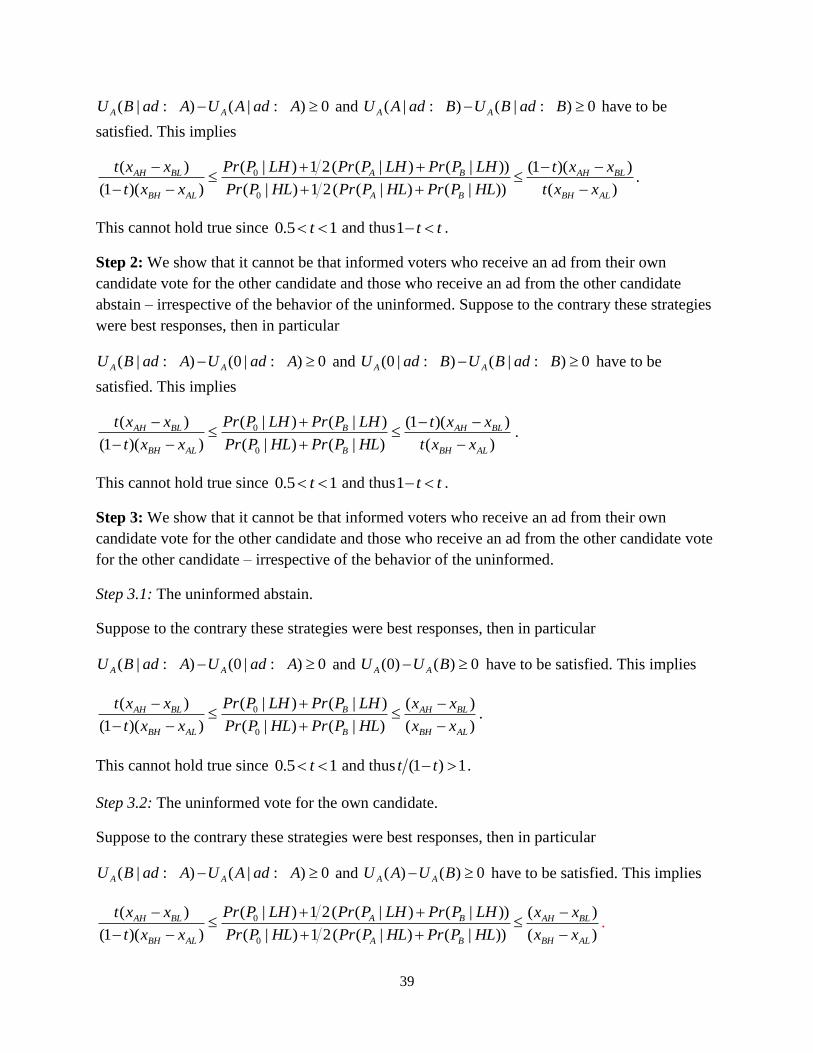
39
( | : ) ( | : ) 0A AU B ad A U A ad A and ( | : ) ( | : ) 0A AU A ad B U B ad B have to be
satisfied. This implies
0
0
( | ) 1 2( ( | ) ( | ))( ) (1 )( )
(1 )( ) ( | ) 1 2( ( | ) ( | )) ( )
A BAH BL AH BL
BH AL A B BH AL
Pr P LH Pr P LH Pr P LHt x x t x x
t x x Pr P HL Pr P HL Pr P HL t x x
.
This cannot hold true since 0.5 1t and thus1 t t .
Step 2: We show that it cannot be that informed voters who receive an ad from their own
candidate vote for the other candidate and those who receive an ad from the other candidate
abstain – irrespective of the behavior of the uninformed. Suppose to the contrary these strategies
were best responses, then in particular
( | : ) (0 | : ) 0A AU B ad A U ad A and (0 | : ) ( | : ) 0A AU ad B U B ad B have to be
satisfied. This implies
0
0
( | ) ( | )( ) (1 )( )
(1 )( ) ( | ) ( | ) ( )
BAH BL AH BL
BH AL B BH AL
Pr P LH Pr P LHt x x t x x
t x x Pr P HL Pr P HL t x x
.
This cannot hold true since 0.5 1t and thus1 t t .
Step 3: We show that it cannot be that informed voters who receive an ad from their own
candidate vote for the other candidate and those who receive an ad from the other candidate vote
for the other candidate – irrespective of the behavior of the uninformed.
Step 3.1: The uninformed abstain.
Suppose to the contrary these strategies were best responses, then in particular
( | : ) (0 | : ) 0A AU B ad A U ad A and (0) ( ) 0A AU U B have to be satisfied. This implies
0
0
( | ) ( | )( ) ( )
(1 )( ) ( | ) ( | ) ( )
BAH BL AH BL
BH AL B BH AL
Pr P LH Pr P LHt x x x x
t x x Pr P HL Pr P HL x x
.
This cannot hold true since 0.5 1t and thus (1 ) 1t t .
Step 3.2: The uninformed vote for the own candidate.
Suppose to the contrary these strategies were best responses, then in particular
( | : ) ( | : ) 0A AU B ad A U A ad A and ( ) ( ) 0A AU A U B have to be satisfied. This implies
0
0
( | ) 1 2( ( | ) ( | ))( ) ( )
(1 )( ) ( | ) 1 2( ( | ) ( | )) ( )
A BAH BL AH BL
BH AL A B BH AL
Pr P LH Pr P LH Pr P LHt x x x x
t x x Pr P HL Pr P HL Pr P HL x x
.
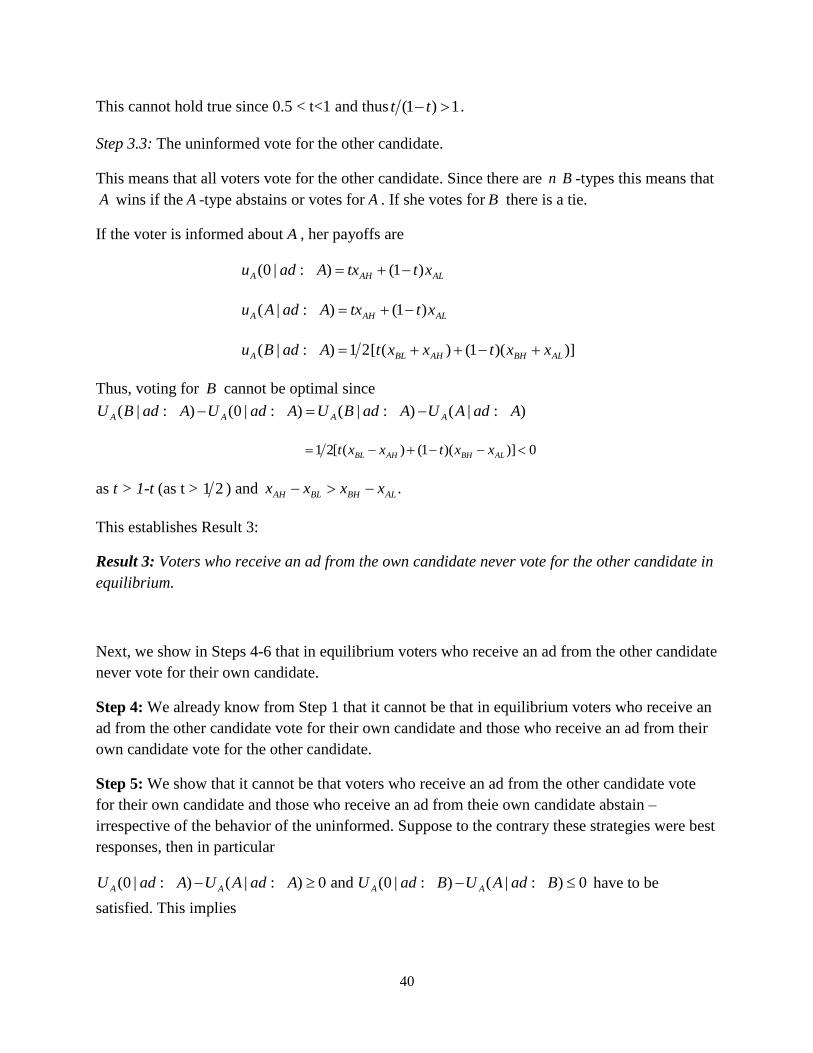
40
This cannot hold true since 0.5 < t<1 and thus (1 ) 1t t .
Step 3.3: The uninformed vote for the other candidate.
This means that all voters vote for the other candidate. Since there are n B -types this means that
A wins if the A -type abstains or votes for A . If she votes for B there is a tie.
If the voter is informed about A , her payoffs are
(0 | : ) (1 )A AH ALu ad A tx t x
( | : ) (1 )A AH ALu A ad A tx t x
( | : ) 1 2[ ( ) (1 )( )]A BL AH BH ALu B ad A t x x t x x
Thus, voting for B cannot be optimal since
( | : ) (0 | : ) ( | : ) ( | : )A A A AU B ad A U ad A U B ad A U A ad A
1 2[ ( ) (1 )( )] 0BL AH BH ALt x x t x x
as t > 1-t (as t > 1 2 ) and .AH BL BH ALx x x x
This establishes Result 3:
Result 3: Voters who receive an ad from the own candidate never vote for the other candidate in
equilibrium.
Next, we show in Steps 4-6 that in equilibrium voters who receive an ad from the other candidate
never vote for their own candidate.
Step 4: We already know from Step 1 that it cannot be that in equilibrium voters who receive an
ad from the other candidate vote for their own candidate and those who receive an ad from their
own candidate vote for the other candidate.
Step 5: We show that it cannot be that voters who receive an ad from the other candidate vote
for their own candidate and those who receive an ad from theie own candidate abstain –
irrespective of the behavior of the uninformed. Suppose to the contrary these strategies were best
responses, then in particular
(0 | : ) ( | : ) 0 and (0 | : ) ( | : ) 0A A A AU ad A U A ad A U ad B U A ad B have to be
satisfied. This implies

41
0
0
( | ) ( | )( ) ( )
(1 )( ) ( | ) ( | ) ( )
AAH BL AH BL
BH AL A BH AL
Pr P LH Pr P LHt x x x x
t x x Pr P HL Pr P HL x x
.
This cannot hold true since 0.5 1t and thus (1 ) 1t t .
Step 6: We show that it cannot be that voters who receive an ad from the other candidate and
those who receive an ad from the own candidate vote for the own candidate – irrespective of the
behavior of the uninformed.
Step 6.1: The uninformed abstain.
Suppose these strategies were best responses, then in particular
(0 | : ) ( | : ) 0A AU ad B U A ad B and (0) ( ) 0A AU U A have to be satisfied. This implies
0
0
( | ) ( | )( ) ( )
(1 )( ) ( | ) ( | ) ( )
ABH AL BH AL
AH BL A AH BL
Pr P HL Pr P HLt x x x x
t x x Pr P LH Pr P LH x x
.
This cannot hold true since 0.5 1t and thus (1 ) 1t t .
Step 6.2: The uninformed vote for the other candidate.
Suppose these strategies were best responses, then in particular
( | : ) ( | : ) 0A AU A ad B U B ad B and ( ) ( ) 0A AU A U B have to be satisfied. This implies
0
0
( | ) 1 2( ( | ) ( | ))( ) (1 )( )
( ) ( | ) 1 2( ( | ) ( | )) ( )
A BAH BL AH BL
BH AL A B BH AL
Pr P LH Pr P LH Pr P LHx x t x x
x x Pr P HL Pr P HL Pr P HL t x x
.
This cannot hold true since 0.5 1t and thus (1 ) 1t t .
Step 6.3: The uninformed vote for the own candidate (i.e. all voters vote for the own candidate).
Since there are n B -types this means that B wins if the A -type abstains or votes for B . If she
votes for A there is a tie. If she is informed about B , her expected payoffs are
(0 | : ) (1 )A BL BHu ad B t x tx
1
( | : ) [(1 )( ) ( )]2
A BL AH BH ALu A ad B t x x t x x
( | : ) (1 )A BL BHu B ad B t x tx
Thus, she votes for the own candidate if

42
( | : ) (0 | : ) ( | : ) ( | : )A A A Au A ad B u ad B u A ad B u B ad B
1 2[(1 )( ) ( )] 0.AH BL AL BHt x x t x x
This holds true if ( ) ( )1
(2 1)( )( ) ( )
BH AL H LH L
AH BL H L
x x x xtt x x
t x x x x
.
This condition is not satisfied for the parameters used in our experiment.
This establishes Result 4:
Result 4: There is no equilibrium in which the voters who receive an ad from the other candidate
vote for their own candidate.
We now turn to the cases in which informed voters vote for the candidate from whom they
receive the ad. We consider the voting decision of the remaining A -type when all other 2 1n
voters (n-1 A-types and n B-types) follow the specified strategy.
Case 1: The uninformed voters abstain.
We simulated the Pivot-probabilities23
the remaining A-type faces for 11,n 0.2,p 0.05q
under the assumption that uninformed voters abstain and the informed ones vote for the
candidate who sent the ad:
0( | ) 0.061929 Pr P HL , ( | ) 0.11642BPr P HL , ( | ) 0.025067APr P HL ,
0( | ) 0.061746Pr P LH , ( | ) 0.024971BPr P LH , ( | ) 0.11643APr P LH .
Plugging in the simulated values, t, and our payoff parameters24
, the signs of the aforementioned
payoff differences become:
(0) ( ) 0A Au u A and (0) ( ) 0A Au u B ,
(0 | : ) ( | : ) 0A Au ad A u A ad A and ( | : ) ( | : ) 0,A Au B ad A u A ad A
(0 | : ) ( | : ) 0A Au ad B u B ad B and ( | : ) ( | : ) 0.A Au A ad B u B ad B
Thus, all payoff differences are in line with the specified strategy, which establishes Result 5:
23
We used Monte Carlo simulations with one million draws. 24
One can show that all conditions are satisfied if 3H Lx x .

43
Result 5: For our parameters, there exists an equilibrium in which the informed voters vote for
the candidate from whom they receive the ad and the uninformed abstain.
Case 2: The uninformed vote for their own candidate.
Again, we simulated the Pivot-probabilities for 11,n 0.2,p 0.05q now under the
assumption that the uninformed vote for the own candidate and the informed vote for the
candidate who sent the ad:
0( | ) 0Pr P HL , ( | ) 0.26122BPr P HL , ( | ) 0.15001APr P HL ,
0( | ) 0Pr P LH , ( | ) 0.055691BPr P LH , ( | ) 0.18081APr P LH .
For the simulated values (0 | : ) ( | : ) 0A Au ad B u B ad B as AH BL BH ALx x x x . Thus, the
aforementioned strategy profile cannot be an equilibrium.
Result 6: For our parameters, there exists no equilibrium in which the informed voters vote for
the candidate from whom they receive the ad and the uninformed vote for their own candidate.
Case 3: The uninformed vote for the other candidate.
Again, we simulated the Pivot-probabilities for 11,n 0.2,p 0.05q now under the
assumption that the uninformed vote for the other candidate, while the informed vote for the
candidate from whom they received the ad:
0( | ) 0Pr P HL , ( | ) 0.056133BPr P HL , ( | ) 0.18088APr P HL ,
0( | ) 0Pr P LH , ( | ) 0.14916BPr P LH , ( | ) 0.26076APr P LH .
Plugging in the simulated values and t, (0) ( ) 0A Au u B as AH BL BH ALx x x x and thus, there
exists no equilibrium in which the informed voters vote for the candidate from whom they
receive the ad and the uninformed vote for the other candidate.
In all 9 remaining symmetric pure strategy equilibrium candidates, some or all informed voters
abstain, if not all abstain, the others vote for the candidate who sent the ad.
First, we show that it cannot be that those voters who receive an ad from their own (other)
candidate abstain but the uninformed voters vote for their own (other) candidate – irrespective of
what the respective other informed voters do.
Case 1: Voters who receive an ad from their own candidate abstain and the uninformed vote for
their own candidate.

44
Suppose these strategies were best responses, then in particular
(0 | : ) ( | : ) 0A AU ad A U A ad A and (0) ( ) 0A AU U A have to be satisfied. This implies
0
0
( | ) ( | )( ) ( )
(1 )( ) ( | ) ( | ) ( )
AAH BL AH BL
BH AL A BH AL
Pr P LH Pr P LHt x x x x
t x x Pr P HL Pr P HL x x
.
This cannot hold true since 0.5 1t and thus (1 ) 1t t .
Case 2: Voters who receive an ad from the other candidate abstain and the uninformed vote for
the other candidate.
Suppose these strategies were best responses, then in particular
(0 | : ) ( | : ) 0A AU ad B U B ad B and (0) ( ) 0A AU U B have to be satisfied. This implies
0
0
( | ) ( | )( ) (1 )( )
( ) ( | ) ( | ) ( )
BAH BL AH BL
BH AL B BH AL
Pr P LH Pr P LHx x t x x
x x Pr P HL Pr P HL t x x
.
This cannot hold true since 0.5 < t<1 and thus (1 ) 1t t .
Result 7: It cannot be that in equilibrium those voters who receive an ad from their own (other)
candidate abstain but the uninformed voters vote for their own (other) candidate – irrespective
of what the respective other informed voters do.
Next, we consider whether it can be that informed voters abstain if they receive an ad from the
other candidate but vote for the own candidate if they receive his ad. For these cases, we cannot
make a general equilibrium prediction but have to use our parameterization.
Case 1: The uninformed abstain.
We simulated the Pivot-probabilities for 11,n 0.2,p 0.05q under the assumption that all
voters but our A-type follow the specified strategy:
0( | ) 0.1804Pr P HL , ( | ) 0.28193BPr P HL , ( | ) 0.055559APr P HL ,
0( | ) 0.15063Pr P LH , ( | ) 0.043367BPr P LH , ( | ) 0.26068APr P LH .
Plugging in the simulated values and t, (0 | ) ( | ) 0A Au B u B B and thus, there exists no
equilibrium in which voters abstain if they receive an ad from the other candidate or are
uninformed but vote for the own candidate if they receive his ad.
Case 2: The uninformed vote for the own candidate.

45
We simulated the Pivot-probabilities the remaining A-type faces for 11,n 0.2,p 0.05q
under the assumption that all voters but our A-type follow the specified strategy:
0( | ) 0.26068Pr P HL , ( | ) 0.26377BPr P HL , ( | ) 0.14978APr P HL ,
0( | ) 0.05587Pr P LH , ( | ) 0.009698BPr P LH , ( | ) 0.18142APr P LH .
Plugging in the simulated values, t, and our payoff parameters, the signs of the aforementioned
payoff differences become:
(0) ( ) 0A Au u A and ( ) ( ) 0A Au A u B
(0 | : ) ( | : ) 0A Au ad A u A ad A and ( | : ) ( | : ) 0,A Au B ad A u A ad A
(0 | : ) ( | : ) 0A Au ad B u B ad B and ( | : ) (0 | : ) 0A Au A ad B u ad B .
Thus, all payoff differences are in line with the specified strategy, which establishes Result 7:
Result 8: For our parameters, there exists an equilibrium in which the informed voters abstain if
they receive an ad from the other candidate and vote for the own candidate if they receive his ad
or are uninformed.
Next, we consider whether it can be that informed voters abstain if they receive an ad from their
own candidate but vote for the other candidate if they receive his ad. For these cases, again, we
cannot make a general equilibrium prediction but have to use our parameterization.
Case 1: The uninformed abstain.
We simulated the Pivot-probabilities for 11,n 0.2,p 0.05q under the assumption that all
voters but our A-type follow the specified strategy:
0( | ) 0.14964Pr P HL , ( | ) 0.26128BPr P HL , ( | ) 0.043028APr P HL ,
0( | ) 0.18095Pr P LH , ( | ) 0.055742BPr P LH , ( | ) 0.28261APr P LH .
Plugging in the simulated values and t, (0 | ) ( | ) 0A Au A u A A and thus, there exists no
equilibrium in which voters abstain if they receive an ad from their own candidate or are
uninformed but vote for the other candidate if they receive his ad.
Case 2: The uninformed vote for the other candidate.
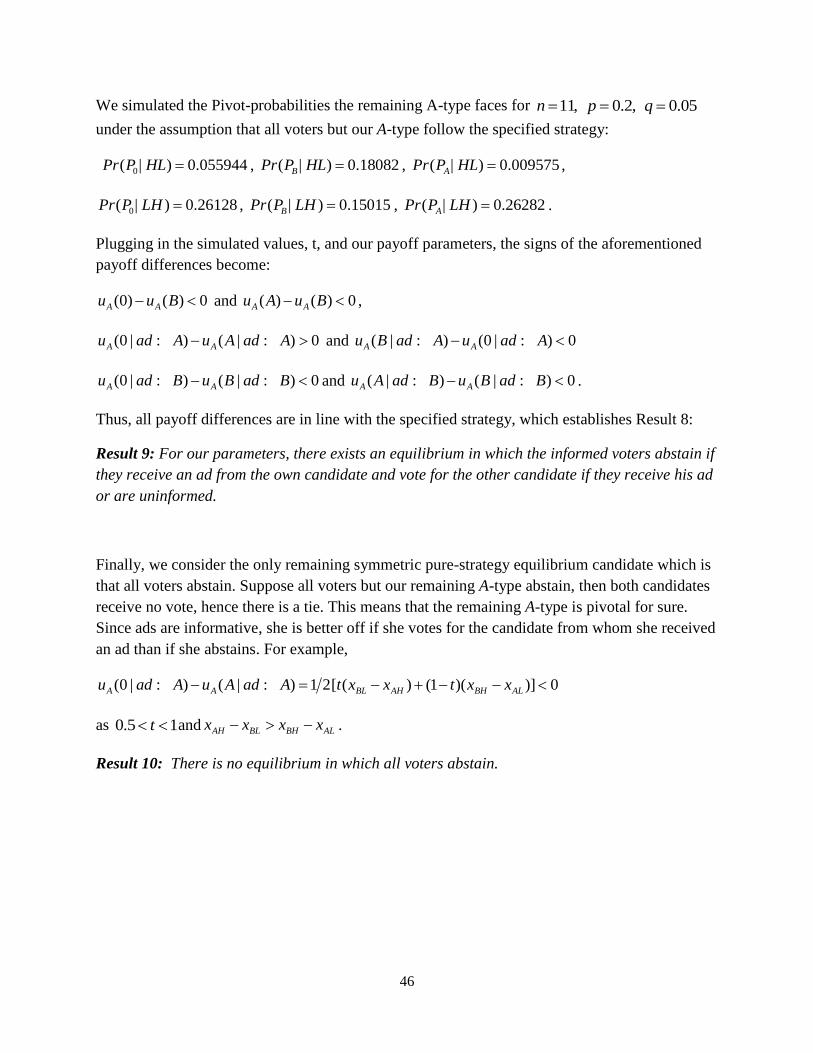
46
We simulated the Pivot-probabilities the remaining A-type faces for 11,n 0.2,p 0.05q
under the assumption that all voters but our A-type follow the specified strategy:
0( | ) 0.055944Pr P HL , ( | ) 0.18082BPr P HL , ( | ) 0.009575APr P HL ,
0( | ) 0.26128Pr P LH , ( | ) 0.15015BPr P LH , ( | ) 0.26282APr P LH .
Plugging in the simulated values, t, and our payoff parameters, the signs of the aforementioned
payoff differences become:
(0) ( ) 0A Au u B and ( ) ( ) 0A Au A u B ,
(0 | : ) ( | : ) 0A Au ad A u A ad A and ( | : ) (0 | : ) 0A Au B ad A u ad A
(0 | : ) ( | : ) 0A Au ad B u B ad B and ( | : ) ( | : ) 0A Au A ad B u B ad B .
Thus, all payoff differences are in line with the specified strategy, which establishes Result 8:
Result 9: For our parameters, there exists an equilibrium in which the informed voters abstain if
they receive an ad from the own candidate and vote for the other candidate if they receive his ad
or are uninformed.
Finally, we consider the only remaining symmetric pure-strategy equilibrium candidate which is
that all voters abstain. Suppose all voters but our remaining A-type abstain, then both candidates
receive no vote, hence there is a tie. This means that the remaining A-type is pivotal for sure.
Since ads are informative, she is better off if she votes for the candidate from whom she received
an ad than if she abstains. For example,
(0 | : ) ( | : ) 1 2[ ( ) (1 )( )] 0A A BL AH BH ALu ad A u A ad A t x x t x x
as 0.5 1t and AH BL BH ALx x x x .
Result 10: There is no equilibrium in which all voters abstain.

47
Table 1
Voters’ Payoff Structure
Elected Candidate’s Quality
Elected Candidate’s Party High Quality Low Quality
Own Party Hx Lx
Other Party Hx Lx
Table 2
Voters’ Payoffs in Experiment
Elected Candidate’s Quality
Elected Candidate’s Party High Quality Low Quality
Own Party 7.50 4.50
Other Party 7.00 4.00

48
Table 3
Decisions of Uninformed Voters (in %)
Decision/Campaign True Deceptive
Abstain 25.1 23.7
Vote Own 64.1 59.8
Vote Other 10.8 16.5
Table 4
Decisions of Informed Voters (in %)
Decision/Campaign True Deceptive
Abstain 1.14 15.2
Vote Own 51.13 60.3
Vote Other 47.73 24.5
Table 5
Decisions of Informed Voters (in %):
Advertising received from candidate of the other party
Decision/Campaign True Deceptive
Abstain 0.0 19.6
Vote Own 15.3 38.1
Vote Other 84.7 42.3
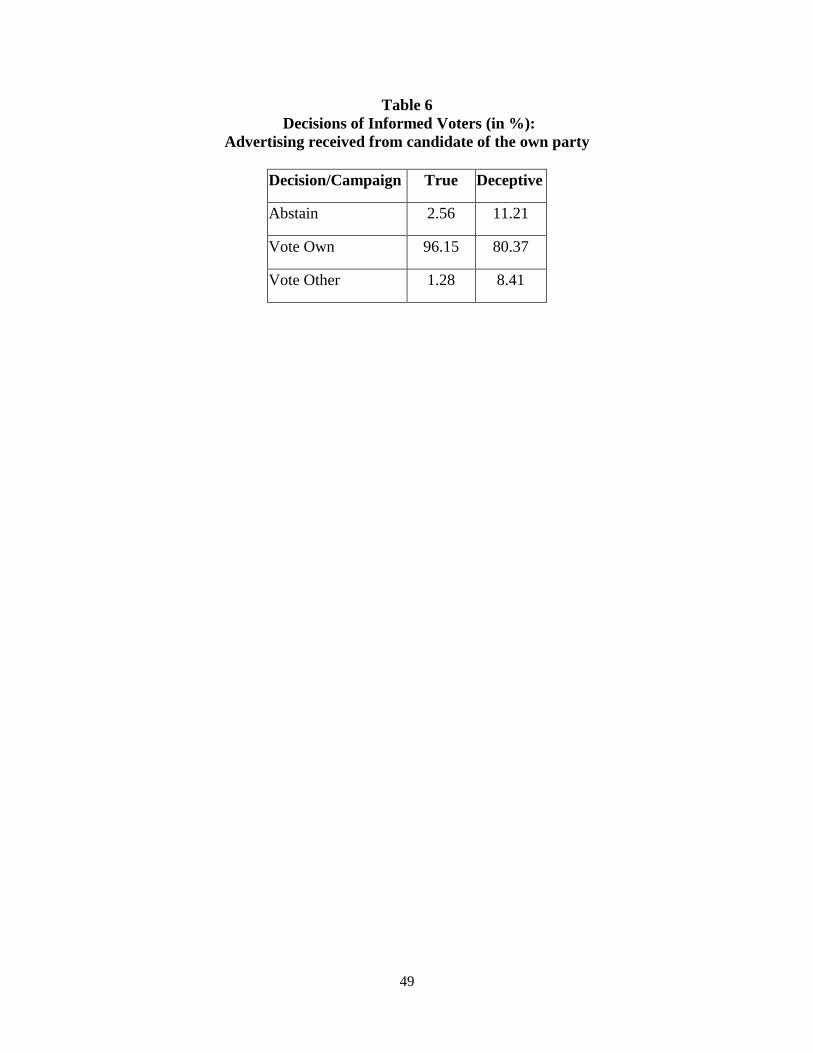
49
Table 6
Decisions of Informed Voters (in %):
Advertising received from candidate of the own party
Decision/Campaign True Deceptive
Abstain 2.56 11.21
Vote Own 96.15 80.37
Vote Other 1.28 8.41
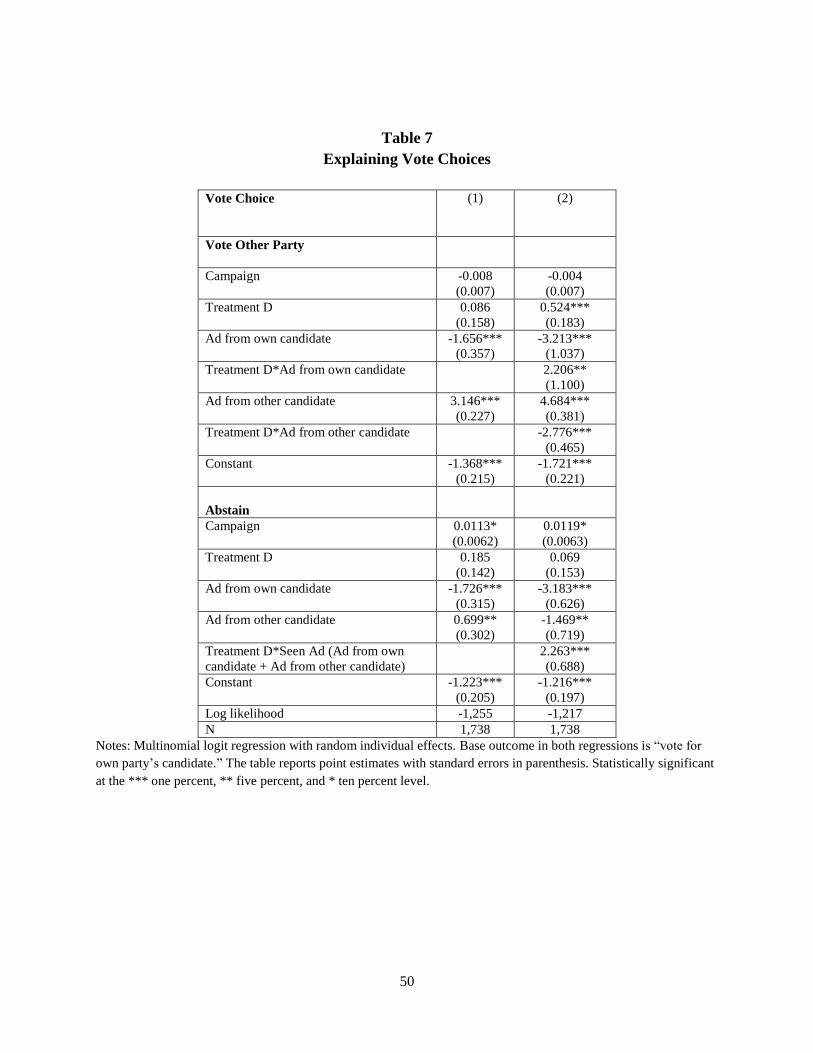
50
Table 7
Explaining Vote Choices
Vote Choice
(1) (2)
Vote Other Party
Campaign -0.008
(0.007)
-0.004
(0.007)
Treatment D 0.086
(0.158)
0.524***
(0.183)
Ad from own candidate -1.656***
(0.357)
-3.213***
(1.037)
Treatment D*Ad from own candidate 2.206**
(1.100)
Ad from other candidate 3.146***
(0.227)
4.684***
(0.381)
Treatment D*Ad from other candidate -2.776***
(0.465)
Constant -1.368***
(0.215)
-1.721***
(0.221)
Abstain
Campaign 0.0113*
(0.0062)
0.0119*
(0.0063)
Treatment D 0.185
(0.142)
0.069
(0.153)
Ad from own candidate -1.726***
(0.315)
-3.183***
(0.626)
Ad from other candidate 0.699**
(0.302)
-1.469**
(0.719)
Treatment D*Seen Ad (Ad from own
candidate + Ad from other candidate)
2.263***
(0.688)
Constant -1.223***
(0.205)
-1.216***
(0.197)
Log likelihood -1,255 -1,217
N 1,738 1,738
Notes: Multinomial logit regression with random individual effects. Base outcome in both regressions is ―vote for
own party’s candidate.‖ The table reports point estimates with standard errors in parenthesis. Statistically significant
at the *** one percent, ** five percent, and * ten percent level.

51
Table 8
Fraction of Informed Voters Voting for the High- and Low-Quality Candidate
Treatment T Treatment D
vote high quality 90.8 58.96
vote low quality 9.2 41.04

52
Figure 1
Timing
Campaign Election Outcome
Ads are sent,
voters receive
ad from high
quality candidate
with probability p (and in
deceptive campaigns
additionally from low-quality
candidate with probability q)
Voters vote own/
other party
or abstain
(simultaneously)
Winner announced,
Payoffs realize
Figure 2
Equilibria in Truthful Campaigns
Uninformed vote own party
Uninformed abstain
―All vote equilibrium‖ both equilibria ―Abstention equilibrium‖
))(1(2
2
LH xxN
LH xx
2
0 1
= 0.019
= 0.29
t
p
p
Related Documents


