The Effect of Profitability, Asset Tangibility, Corporate Tax, Non-debt Tax Shield and Inflation upon the Financial Capital Structure of the Manufacturing Companies listed on the Indonesian Stock Exchange A A Nasutionˡ*, I Siregar², Rahmansyah Panggabean 1 1 Department of Accounting, University of Sumatera Utara Email: [email protected] 2 Department of Industrial Engineering, University of Sumatera Utara ABSTRACT This study seeks to obtain empirical evidence about the effects of profitability, asset tangibility, corporate tax, non-debt tax shield, and rate of inflation upon the financial capital structure of the Manufacturing Companies listed on the Indonesia Stock Exchange. The research hypothesis is that return on assets, tangible assets, corporate tax, non-debt tax shield, and rate of inflationmay have significant influence, whether as a group or individually, upon a company’s financial capital structure. The population for this study are the manufacturing companies in the consumption goods sector that are listed on the Indonesia Stock Exchange from 2014 to 2016. 36 of these Manufacturing Companies make up the research sample. The methods of statistical data analysis we used in this study are descriptive statistics and tests of classical assumption as well as multiple linear regression. The results of data processing for individual variables show that profitability and Non-debt tax shield have a negative influence upon the Financial Capital Structure whereas and Tangible Assets have a positive influence upon the Financial Capital Structure. Meanwhile, neither Corporate Tax nor Inflation Rate has any significant influence upon the Financial Capital Structure of the Manufacturing Companies listed on the Indonesia Stock Exchange. At the same time, it can be shown that that profitability, Asset Tangibility, Corporate Tax, Non-Debt Tax Shield, and rate of inflation together have a significant influence upon the Financial Capital Structure of the Manufacturing Companies Listed on the Indonesia Stock Exchange. Type of paper: Empirical Keywords: Profitability, asset tangibility, corporate tax, non-debt tax shield, inflation, manufacturing companies 1. Introduction Financial capital structure is an important issue for any company since the company’s financial capital structure would have a direct effect upon its financial position. A company with a bad financial capital structure, such as one that carries a very large debt, would suffer a heavy 11th International Conference on Business and Management Research (ICBMR 2017) Copyright © 2017, the Authors. Published by Atlantis Press. This is an open access article under the CC BY-NC license (http://creativecommons.org/licenses/by-nc/4.0/). Advances in Economics, Business and Management Research, volume 36 65

Welcome message from author
This document is posted to help you gain knowledge. Please leave a comment to let me know what you think about it! Share it to your friends and learn new things together.
Transcript

The Effect of Profitability, Asset Tangibility, Corporate Tax,
Non-debt Tax Shield and Inflation upon the Financial Capital
Structure of the Manufacturing Companies listed on the
Indonesian Stock Exchange
A A Nasutionˡ*, I Siregar², Rahmansyah Panggabean1
1 Department of Accounting, University of Sumatera Utara
Email: [email protected]
2 Department of Industrial Engineering, University of Sumatera Utara
ABSTRACT
This study seeks to obtain empirical evidence about the effects of profitability, asset tangibility,
corporate tax, non-debt tax shield, and rate of inflation upon the financial capital structure
of the Manufacturing Companies listed on the Indonesia Stock Exchange. The research
hypothesis is that return on assets, tangible assets, corporate tax, non-debt tax shield, and rate of
inflationmay have significant influence, whether as a group or individually, upon a company’s
financial capital structure. The population for this study are the manufacturing companies in the
consumption goods sector that are listed on the Indonesia Stock Exchange from 2014 to 2016.
36 of these Manufacturing Companies make up the research sample. The methods of statistical
data analysis we used in this study are descriptive statistics and tests of classical assumption as
well as multiple linear regression. The results of data processing for individual variables show
that profitability and Non-debt tax shield have a negative influence upon the Financial Capital
Structure whereas and Tangible Assets have a positive influence upon the Financial Capital
Structure. Meanwhile, neither Corporate Tax nor Inflation Rate has any significant influence
upon the Financial Capital Structure of the Manufacturing Companies listed on the Indonesia
Stock Exchange. At the same time, it can be shown that that profitability, Asset Tangibility,
Corporate Tax, Non-Debt Tax Shield, and rate of inflation together have a significant influence
upon the Financial Capital Structure of the Manufacturing Companies Listed on the Indonesia
Stock Exchange.
Type of paper: Empirical
Keywords: Profitability, asset tangibility, corporate tax, non-debt tax shield, inflation,
manufacturing companies
1. Introduction
Financial capital structure is an important issue for any company since the company’s financial
capital structure would have a direct effect upon its financial position. A company with a bad
financial capital structure, such as one that carries a very large debt, would suffer a heavy
11th International Conference on Business and Management Research (ICBMR 2017)
Copyright © 2017, the Authors. Published by Atlantis Press. This is an open access article under the CC BY-NC license (http://creativecommons.org/licenses/by-nc/4.0/).
Advances in Economics, Business and Management Research, volume 36
65

Table 1. Research Gaps
Dependent Variables Independent Variables Influence Previous Researchers
Financial Capital Structure Profitability (Return On Assets) Negative Relationship Nassar S (2016)
Positive Relationship Baddar and Saeed(2013)
Asset Tangibility Negative Relationship Rajan and Zingales(1995)
Positive Relationship A.O Olankule and Emmanuel O. Oni
(2015)
Corporate Tax Negative Relationship Chen Deng (2015)
Positive Relationship Michael P Devereux, GiorgiaMaffini,
Jing Xing (2015)
Non Debt Tax Shield Negative Relationship Gill, Amarjit, NabuBiger,
ChenpingPai, and SmitaBhutani.
(2009)
Positive Relationship Ali, Khizer, Muhammad
FarhanAkhtar, AbdShamaSada (2011)
Inflation Rate Negative Relationship Shalom Hochman and OdedPalmon
(1983)
Positive Relationship Hatzinikolaou, Katsimbris, and Noulas
(2002)
financial burden. A company can achieve financial balance if it does not face any financial
disturbances, or in other words when it achieves a balance between the amount of capital
available and the amount of capital needed. There are two methods for managing a company’s
capital structure. The first method is to fulfill the need for capital with capital from an external
source, known as “spending with debt.” The second method is to fulfill the company’s capital
needs with its own internal resources, known as “spending its own capital.” Funding decisions
greatly determine the company’s ability to perform its operations and would also affect the
company’s own risk profile. The analysis of capital structure basically seeks to determine the
effect of liabilities upon a company’s stock price, which would inform the company’s decision
on whether it should incorporate a debt component into its capital structure. Many successful
entrepreneurs and big companies in the real world use debt as an effective way to grow their
business quickly; the ideal course of action seems to be taking on debt within certain limits so
that the company would still be able to repay the loan with interest even in difficult economic
situations. Any liabilities beyond this limit would increase the risks that the company must
face, including financial difficulties, failure to pay loan interest and principal, all the way to
bankruptcy.
In reality, it is quite difficult for a company to determine the best financial capital structure along
with the appropriate spending composition. It’s easier for the company to estimate a range of
leverage exposures that would be appropriate for it. Previous studies have indicated a research
gap in the independent variables that affect financial capital structure. These independent
variables are profitability, asset tangibility, corporate tax, non-debt tax shield, and inflation.
Having identified this research gap, it becomes necessary to study the effect of those variables
upon financial capital structure. The gaps in prior research related to this study are
summarized in the table 1.
The inconsistency in previous research results has motivated us to examine the
abovementioned variables for manufacturing companies listed on the Indonesia Stock
Advances in Economics, Business and Management Research, volume 36
66

Exchange from 2014 to 2016. The reason for this choice is that most of the companies listed
in Indonesia Stock Exchange are engaged in the manufacturing sector, so the possible
sample size would be larger and the results would be more representative of all companies
listed on the Stock Exchange.
The main objective of this paper is to examine the impacts or effects of Profitability, Asset
Tangibility, Corporate Tax, Non-debt Tax Shield, and Rate of Inflation upon the financial capital
structures of Manufacturing companies listed on the Indonesia Stock Exchange. We will use
data on 36 firms listed as manufacturing sector companies on the Indonesia stock exchange
(BEI) within the period 2014-2016.
2. Literature Review
2.1 Financial Capital Structure
Modern capital structure theory began in 1958, when the professors Franco Modigliani and
Merton Miller (MM) published what has been called the most influential finance article ever
written. MM’s study was based on some strong assumptions, such as no taxes, no brokerage fees,
no fees for bankruptcy, investors can borrow at the same rate as the company, all investors have
the same information as the management about the company’s future investment opportunities,
and earnings before interest and tax (EBIT) are not affected by the use of debt.
2.2 Profitability (Return on Assets)
Profitability is a firm’s performance in generating profit through the use of its assets,
whether current and fixed, in productive activities as shown in the return on assets that
allows them to self-finance from this internally generated fund. A basic measure of bank
profitability is the return on assets, the net profit after taxes per dollar of assets (Miskhin &
Eakins, 2006)
Return on Asset (ROA) = NetIncome
Total Assets
(1)
2.3 Asset Tangibility
Tangible Assets are physical assets that go through a relatively long period of use in the
operation of the business, such as land, buildings, machinery, and construction in progress that
can be offered as collateral to creditors in case of bankruptcy. The scale is used is a rational
scale. A high ratio of fixed to total assets provides creditors with a high level of security since
they’d be able to liquidate more assets in case bankruptcy. (Baker & Martin, 2011)
Tangibility FixedAssets
TotalAssets
(2)
2.4 Corporate Tax
Taxes and tax rates, especially Corporate Income Tax Article 23, have important implications
to business decisions and therefore the literature considers taxes as a determinant variable of
Advances in Economics, Business and Management Research, volume 36
67

capital structure (Datta, 2008). According to Brigham (1994), interest is a deductible expense,
and the deduction is of great value to firms subject to high corporate income tax rates under
Article 23. Companies with high taxes seek to reduce their tax burden by exploiting interest tax
shield from loan interest. The corporate tax scrutinized in this study is the amount of corporate
tax with profit before tax (EBT) as measured by a rational scale. The formula for calculating
corporate tax is:
Tax EBT EAT
TotalAssets (3)
2.5 Non-debt tax shield
Non-debt tax shield are fixed tax-deductible expenses such as depreciation, depletion,
amortization, research and development expense, investment tax credit, and others that act
as tax shield with similar benefits to interest expenses from debt financing, thus lowering the
probability that the firm would have to incur more debt. Ali et al (2011) computed it by dividing
depreciation expenses with total assets.
Non Debt Tax Shield Depreciation
TotalAssets
(4)
2.6 Inflation Rate
Inflation is a condition where there is a sharp increase in absolute prices that lasts for a long
time (Khalwaty, 2000). Along with the rise in prices, the intrinsic value of currency falls
sharply. Interest rates are conventional instruments for controlling or suppressing the growth of
inflation. High interest rates would suck up the money circulating in the economy. The policy
of raising interest rates to control inflation affects the firm’s preference for using its own debt
or capital (equity) in its capital structure. This is because high interest rates would increase the
cost of capital caused by the use of debt. The formula for calculating inflation rate is as follows:
l IHKt IHKt l
IHKt l (5)
3. Research Methodology
This study is a causal research that aims to test the hypothesis and seeks to explain the
phenomenon in the form of relationships between variables. In other words, the main purpose
of this study is to identify the causal relationship between the various variables. This type
of research belongs to a kind of quantitative historical research, whereby the study seeks to
explain the causes or effects of past events and current phenomena or predict future conditions.
3.1 Operational Definition and Variable Measurement Scales
Operational definition can be defined as an operational concept that describes the characteristics
of the object into observable elements so that the concept can be measured and operationalized
into the study. In the operational definition, any concept of the variables used in the study
should have a clear definition.
Co-published by Atlantis Press and Taylor & Francis
Advances in Economics, Business and Management Research, volume 36
68
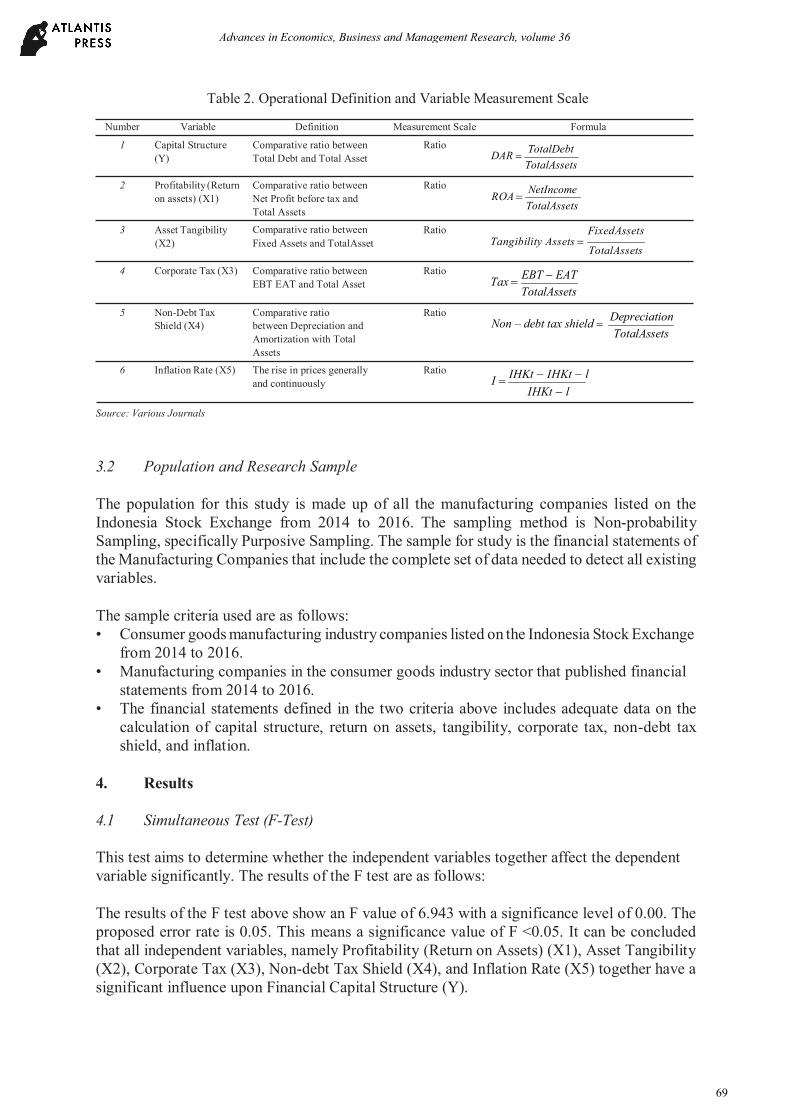
Table 2. Operational Definition and Variable Measurement Scale
Number Variable Definition Measurement Scale Formula
1 Capital Structure
(Y)
2 Profitability (Return
on assets) (X1)
3 Asset Tangibility
Comparative ratio between
Total Debt and Total Asset
Comparative ratio between
Net Profit before tax and
Total Assets
Comparative ratio between
Ratio
Ratio
Ratio
DAR
ROA
TotalDebt
TotalAssets
NetIncome
TotalAssets
FixedAssets
(X2) Fixed Assets and TotalAsset Tangibility Assets
TotalAssets
4 Corporate Tax (X3) Comparative ratio between
EBT EAT and Total Asset
Ratio Tax
EBT EAT
TotalAssets
5 Non-Debt Tax
Shield (X4)
Comparative ratio
between Depreciation and
Amortization with Total
Assets
Ratio Non – debt tax shield
Depreciation
TotalAssets
6 Inflation Rate (X5) The rise in prices generally
and continuously
Ratio I
IHKt IHKt l
IHKt l
Source: Various Journals
3.2 Population and Research Sample
The population for this study is made up of all the manufacturing companies listed on the
Indonesia Stock Exchange from 2014 to 2016. The sampling method is Non-probability
Sampling, specifically Purposive Sampling. The sample for study is the financial statements of
the Manufacturing Companies that include the complete set of data needed to detect all existing
variables.
The sample criteria used are as follows:
• Consumer goods manufacturing industry companies listed on the Indonesia Stock Exchange
from 2014 to 2016.
• Manufacturing companies in the consumer goods industry sector that published financial
statements from 2014 to 2016.
• The financial statements defined in the two criteria above includes adequate data on the
calculation of capital structure, return on assets, tangibility, corporate tax, non-debt tax
shield, and inflation.
4. Results
4.1 Simultaneous Test (F-Test)
This test aims to determine whether the independent variables together affect the dependent
variable significantly. The results of the F test are as follows:
The results of the F test above show an F value of 6.943 with a significance level of 0.00. The
proposed error rate is 0.05. This means a significance value of F <0.05. It can be concluded
that all independent variables, namely Profitability (Return on Assets) (X1), Asset Tangibility
(X2), Corporate Tax (X3), Non-debt Tax Shield (X4), and Inflation Rate (X5) together have a
significant influence upon Financial Capital Structure (Y).
Advances in Economics, Business and Management Research, volume 36
69

Table 3. Numbering of samples obtained according to the criteria
Number Company Name Code Criteria Sample Number
1 2 3
1 Akasha Wira International Tbk ADES √ √ √ 1
2 Tiga Pilar Sejahtera Food Tbk AISA √ - √
3 Tri Banyau Tirta Tbk ALTO √ √ √ 2
4 Cahaya Kalbar Tbk CEKA √ √ √ 3
5 Davomas AbadiTbk DAVO √ - -
6 Delta Djakarta Tbk DLTA √ √ √ 4
7 Darya Varia Laboratoria Tbk DVLA √ √ √ 5
8 Gudang Garam Tbk GGRM √ √ √ 6
9 Hanjaya Mandala Sampoerna Tbk HMSP √ √ √ 7
10 Indofood CBP Sukses Makmur Tbk ICBP √ √ √ 8
11 Indofarma Tbk INAF √ √ √ 9
12 Indofood Sukses Makmur Tbk INDF √ √ √ 10
13 Kimia Farma Tbk KAEF √ √ √ 11
14 Kedawung Setia Industrial Tbk KDSI √ - √
15 Kedaung Indah Can Tbk KICI √ √ √ 12
16 Kalbe FarmaTbk KLBF √ √ √ 13
17 Langgeng Makmur Industry Tbk LMPI √ √ √ 14
18 Martina Berto Tbk MBTO √ √ √ 15
19 Merck Tbk MERK √ √ √ 16
20 Multi Bintang Indonesia Tbk MLBI √ √ √ 17
21 Mustika Ratu Tbk MRAT √ √ √ 18
22 Mayora Indah Tbk MYOR √ - √ 19
23 Prashida Aneka Niaga Tbk PSDN √ - √
24 Pyridam Farma Tbk PYFA √ √ √ 20
25 Bentoel International Investama Tbk RMBA √ √ √ 21
26 Nippon Indosari Corporindo Tbk ROTI √ √ √ 22
27 Schering Plough Indonesia Tbk SCPI √ √ √ 23
28 Sekar Bumi Tbk SKBM √ √ √ 24
29 Sekar Laut Tbk SKLT √ √ √ 25
30 Taisho Pharmaceutical Indonesia Tbk SQBB √ √ √ 26
31 Siantar Top Tbk STTP √ √ √ 27
32 Mandom Indonesia Tbk TCID √ √ √ 28
33 Tempo Scan Pasific Tbk TSPC √ √ √ 29
34 Ultrajaya Milk Industry Company Tbk ULTJ √ √ √ 30
35 Unilever Indonesia Tbk UNVR √ - √
36 Wismilak Inti Makmur Tbk WIIM √ √ √ 31
Table 4. Simultaneous Test (ANOVAᵇ)
Model Sum of Squares Df Mean Square F Sig.
1 Regression 10627.736 5 2125.547 6.943 .
Residual 26635.450 87 306.155
Total 37263.186 92
Source : Result of SPSS Processing, 2017
Advances in Economics, Business and Management Research, volume 36
70
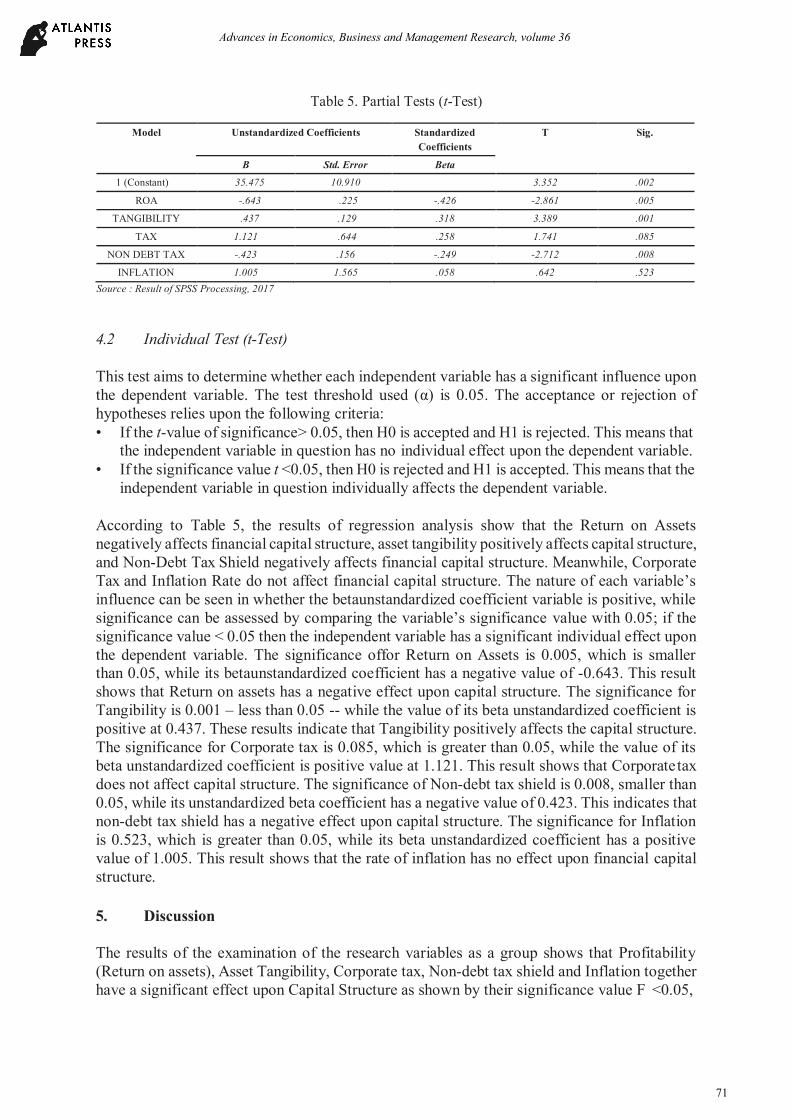
Table 5. Partial Tests (t-Test)
Model Unstandardized Coefficients Standardized
Coefficients
T Sig.
B Std. Error Beta
1 (Constant) 35.475 10.910 3.352 .002
ROA -.643 .225 -.426 -2.861 .005
TANGIBILITY .437 .129 .318 3.389 .001
TAX 1.121 .644 .258 1.741 .085
NON DEBT TAX -.423 .156 -.249 -2.712 .008
INFLATION 1.005 1.565 .058 .642 .523
Source : Result of SPSS Processing, 2017
4.2 Individual Test (t-Test)
This test aims to determine whether each independent variable has a significant influence upon
the dependent variable. The test threshold used (α) is . 5. The acceptance or rejection of
hypotheses relies upon the following criteria:
• If the t-value of significance> 0.05, then H0 is accepted and H1 is rejected. This means that
the independent variable in question has no individual effect upon the dependent variable.
• If the significance value t <0.05, then H0 is rejected and H1 is accepted. This means that the
independent variable in question individually affects the dependent variable.
According to Table 5, the results of regression analysis show that the Return on Assets
negatively affects financial capital structure, asset tangibility positively affects capital structure,
and Non-Debt Tax Shield negatively affects financial capital structure. Meanwhile, Corporate
Tax and Inflation Rate do not affect financial capital structure. The nature of each variable’s
influence can be seen in whether the betaunstandardized coefficient variable is positive, while
significance can be assessed by comparing the variable’s significance value with 0.05; if the
significance value < 0.05 then the independent variable has a significant individual effect upon
the dependent variable. The significance offor Return on Assets is 0.005, which is smaller
than 0.05, while its betaunstandardized coefficient has a negative value of -0.643. This result
shows that Return on assets has a negative effect upon capital structure. The significance for
Tangibility is 0.001 – less than 0.05 -- while the value of its beta unstandardized coefficient is
positive at 0.437. These results indicate that Tangibility positively affects the capital structure.
The significance for Corporate tax is 0.085, which is greater than 0.05, while the value of its
beta unstandardized coefficient is positive value at 1.121. This result shows that Corporate tax
does not affect capital structure. The significance of Non-debt tax shield is 0.008, smaller than
0.05, while its unstandardized beta coefficient has a negative value of 0.423. This indicates that
non-debt tax shield has a negative effect upon capital structure. The significance for Inflation
is 0.523, which is greater than 0.05, while its beta unstandardized coefficient has a positive
value of 1.005. This result shows that the rate of inflation has no effect upon financial capital
structure.
5. Discussion
The results of the examination of the research variables as a group shows that Profitability
(Return on assets), Asset Tangibility, Corporate tax, Non-debt tax shield and Inflation together
have a significant effect upon Capital Structure as shown by their significance value F <0.05,
Advances in Economics, Business and Management Research, volume 36
71

specifically F = 0.010. This result is in accord with a prior study by Boniface (2009), which
concluded that profitability, asset tangibility, growth opportunity, non-debt tax shield, corporate
tax, and inflation together have a significant effect upon capital structure.
Meanwhile, the results of individual testing for each independent variable are:
• Probability (Return on assets) negatively affects the dependent variable of capital structure.
This is shown by a significance value of t = 0.005, which is smaller than the threshold value
of 0.05. Meanwhile, the unstandardized beta coefficient has a negative value of -0.643.
This result concurs with a previous study by Nassar S (2016) but differs from the results of
research conducted by Baddar and Saed (2013). Baddar and Saed(2013) found that Return
on assets had a positive effect upon Financial Capital Structure.
• Tangibility positively affects the dependent variable of Capital Structure. Its significance
value of t = 0.001 is smaller than the threshold value of 0.05, while the beta unstandardized
coefficient has a positive value of 0.437. The results of this study are in accord with previous
research by A.O Olankule and Emmanuel O. Oni (2015). However, Rajan and Zingales(1995)
found to the contrary that Tangibility has no effect on Financial Capital Structure.
• Corporate tax does not affect the dependent variable of capital structure. The significance
value of t = 0.085 is greater than the threshold value of 0.05, while the value of the beta
unstandardized coefficient is positive at 1.121. The results of this study are in accord with
a previous study by Michael P Devereux (2015) but different from the results of research
by Chen Deng (2015). Chen Deng (2015) found in his research that Corporate Tax was
influential and insignificant to Financial Capital Structure.
• Non-debt tax shield negatively affects the dependent variable of capital structure. The
significance value of t = 0.008 is smaller than the threshold value of 0.05, while the beta
unstandardized coefficient shows a negative value of -0.423. The results of this study are
consistent with previous research by Gill, Amarjit, Nabu Biger, Chenping Pai and Smita
Bhutani(2009) but different from those of Ali, Khizer, Muhammad Farhan Akhtar, Abd
Shama Sada(2011). Ali, Khizer, Muhammad Farhan Akhtar, Abd Shama Sada(2011) found
that Non-debt Tax Shield had a positive and significant effect on Financial Capital Structure.
• Inflation does not affect the dependent variable of Capital Structure. The significance value
of 0.523 is greater than the threshold value of 0.05, while the beta unstandardized coefficient
has a positive value of 1.005. Aprevious study by Shalom Hochman and OdedPalmon(1983)
found that the rate of inflation had a negative effect on Financial Capital Structure, but
Hatzinikolaou and Katsimbiris(2002) found that Inflation positively affected Financial
Capital Structure.
6. Conclusion
This study aims to examine whether return on assets, asset tangibility, corporate tax, non-debt
tax shield, and rate of inflation have an effect upon the Capital Structure of Manufacturing
Companies listed on the Indonesia Stock Exchange. Based on the results discussed earlier, the
conclusions of this study are as follows:
• The results of this study indicate that Return on assets, Asset Tangibility, Corporate Tax,
Non-debt tax shield, and inflation together as a group significantly influence the Capital
Structure of Manufacturing Companies listed on the Indonesia Stock Exchange, with a
calculated F-value of 6.943 and a significance of 0.000.
Advances in Economics, Business and Management Research, volume 36
72

• Meanwhile, the results of for individual variables indicate that Return on assets negatively
affects capital structure, Tangibility positively affects capital structure and Non-debt tax
shield negatively affects financial capital structure, while Corporate’s tax and Inflation rate
d not affect capital structure.
According to those results, we would like to suggest the following directions for further
research:
• Follow-up studies should consider adding the variables of profitability and growth
opportunity to see whether they affect the Financial Capital Structure of Manufacturing
Companies listed on the Indonesian Stock Exchange.
• Adding another year of observationwould mean that the result obtained can be used as the
basis of management decision.
• The calculation results of the coefficient of determination shows an R-Square value equal
to 0.244. This means that 24.4% of the capital structure is influenced by return on assets,
tangibility, corporate tax, non-debt tax shield and inflation rate, while the remaining 75.6%
must be explained by factors outside this research model. The results indicate that the
regression model still needs to be improved, so follow-up studies should consider adding
several other independent variables that may affect capital structure such as firm size,
collateral, dividend policy, and corporate ownership.
References
Journal Articles
Nassar.S. (2016). The Impact of capital structure on Financial Performance of the firms :
Evidence From Borsa Istanbul. Journal of Business & Financial Affairs,5:2.
A.O.Olakunle, Emmanuel O.Oni. (2015). Assessing The Impact of Asset Tangibility On Capital
Structure : Choice For Listed Firms In Nigeria. Journal of of Applied Economics and
Business.
Rajan, Raghuram G., and Luigi Zingales. (1995). What do we know about capital structure?
Some evidence from international data. Journal of Finance, 50 (5), 1421-60.
Chen Deng (2015). Impact of Corporate Income Tax On The capital structure of Canadian
Listed Companies. A Research Project Submitted in Partial fulfillment Of the
Requirements of the Degree of Master of Finance Saint Mary’s University, Nova Scotia.
Badar. R, Saeed. A (2013) Impact of Capital Structure on Performance Empirical Evidence
from Sugar Sector of Pakistan. European Journalof Business and Management 5: 78-86.
Michael P Devereux, Giorgia Maffini, Jing Xing (2015).Corporate Tax Incentives and Capital
Structure: Empirical Evidence from UK Tax Returns. Working paper series University
Oxford.
Advances in Economics, Business and Management Research, volume 36
73

Gill, Amarjit, Nabu Biger, Chenping Pai, and Smita Bhutani.(2009). The determinant of
Capital Structure in the service industry: Evidence from United States. The open Business
Journal, no.2, pp.48-53.
Ali, Khizer, Muhammad Farhan Akhtar, Abd Shama Sadaqat, (2011). Practical Implication of
Capital Structure Thesis Theories: Empirical Evidence from the Commercial Banks of
Pakistan. European Journal of Social Sciences, volume 23, number 1, pp.165-173
Shalom Hochman and Oded Palmon. (1983). The Irrelevance of Capital Structure for the
Impact of Inflation on Investment. The Journal of Finance Vol. 38, No. 3,pp 785-794
Hatzinikolaou, D., G. M. Katsimbris, and A. G. Noulas. (2002). Inflation Uncertainty and
Capital Structure: Evidence from a Pooled Sample of the Dow-Jones Industrial Firms.
International Review of Economics and Finance, 11, pp. 45-55.
Modigliani, F., and M. H. Miller. 1958. The Cost of Capital, Corporation Finance and the
Theory of Investment. The American Economic Review, Vol. 48, No.3, pp. 261-297
Datta, D and Agarwal, B. 2008. Determinants of Capital Structure of Indian Corporate Sector
in The Period of Bull Run 2003-2007-An Econometric Study. This paper was presented
at ICBF 2009, Hyderbrand. Available on-line at www.ssrn.com
E-books
Mishkin, Frederic S and Stanley G. Eakins.(2006). Financial Market and Institutions Fifth
Edition. USA: Pearson-Addison Wesley.
Baker, H.Kent and Gerald S Martin. (2011) Capital Structure and Corporate Financing
Decision: Theory, Evidence and Practice. USA: John Wiley & Sons Ltd
Brigham, E. F., dan Houston J. F. 2006. Financial Management. Jakarta: Salemba Empat
Tajul ,Khalwaty. 2000, Inflation and solution. Jakarta :Gramedia Pustaka Utama
Advances in Economics, Business and Management Research, volume 36
74
Related Documents