The Effect of Overabundant Projection Directions on 3D Reconstruction Algorithms C. O. S. Sorzano,* R. Marabini,² N. Boisset,‡ E. Rietzel,§ R. Schro ¨der,§ G. T. Herman,² and J. M. Carazo* *Centro Nacional de Biotecnologı´a (CSIC), Universidad Auto ´noma Madrid, 28049 Madrid, Spain; ²Center for Computer Science and Applied Mathematics, Temple University, Philadelphia, Pennsylvania 19122; §Max Planck Institut fu ¨ r mediznische Forschung, Jahnstrasse 29, 69120 Heidelberg, Germany; and ‡Laboratoire de mine `ralogie cristallographie, Equipe Systemes moleculaires et biologie structurale, Universite ´ Pierre et Marie Curie Paris 6-4, Tour 16, 2eme etage, case 115, 4, Place Jussieu, 75252 Paris Cedex 05, France Received December 6, 2000, and in revised form February 9, 2001 The experimental process of collecting images from macromolecules in an electron microscope is such that it does not allow for prior specification of the angular distribution of the projection images. As a consequence, an uneven distribution of projec- tion directions may occur. Concerns have been raised recently about the behavior of 3D recon- struction algorithms for the case of unevenly dis- tributed projections. It has been illustrated on ex- perimental data that in the case of a heavily uneven distribution of projection directions some algo- rithms tend to elongate the reconstructed volumes along the overloaded direction so much as to make a quantitative biological analysis impossible. In an- swer to these concerns we have developed a strat- egy for quantitative comparison and optimization of 3D reconstruction algorithms. We apply this strategy to quantitatively analyze algebraic recon- struction techniques (ART) with blobs, simulta- neous iterative reconstruction techniques (SIRT) with voxels, and weighted backprojection (WBP). We show that the elongation artifacts that had been previously reported can be strongly reduced. With our specific choices for the free parameters of the three algorithms, WBP reconstructions tend to be inferior to those obtained with either SIRT or ART and the results obtained with ART are comparable to those with SIRT, but at a very small fraction of the computational cost of SIRT. © 2001 Academic Press Key Words: 3D reconstruction algorithms; algo- rithm optimization; algorithm comparison; collec- tion geometry. 1. INTRODUCTION In 3D reconstruction from projections the distri- bution of projection directions (expressed in the co- ordinate system fixed to the experimental object) is called the collection geometry. Knowledge of the col- lection geometry is crucial for the reconstruction process. The Projection Theorem (Herman, 1980) allows us to identify regions of the Fourier space in which there is no information regarding the Fourier transform of the object under study (missing cones, missing wedges, . . . ). A number of data collection strategies are possible in the field of 3D electron microscopy (3DEM) of biological macromolecules. If a low-resolution refer- ence volume is available, a fruitful approach is to collect untilted field micrographs from which a wide range of different views can be obtained. By direct comparison of the experimental images with the reference volume, their directions of projection can be determined and then input to a 3D reconstruction algorithm (Frank, 1996). A shortcoming of this ap- proach is that depending on the characteristics of the specimen and of its preparation for microscopy, the number of images corresponding to the different projection directions may vary quite significantly among the different directions. An experimental sit- uation of this type was first investigated by Boisset et al. (1996) and de Haas et al. (1996) in their studies of the giant hemoglobin of Lumbricus terrestris and of the human a-2 macroglobulin. Indeed, the strong differences that they observed in the performance of the different reconstruction methods, as well as the marked discrepancies between the results obtained in an unevenly distributed situation and an evenly distributed situation, have been the primary moti- vation of the present study. Similar problems were encountered in a number of cases concerning cylin- drical particles (e.g., CCT chaperonin, molluscan ho- mocyanins) oriented mostly in their circular top views within the ice layer and were overcome either by a careful interactive selection of the particles in the digitized micrographs or by taking additional tilted-specimen images. Journal of Structural Biology 133, 000 – 000 (2001) doi:10.1006/jsbi.2001.4338, available online at http://www.idealibrary.com on 1 1047-8477/01 $35.00 Copyright © 2001 by Academic Press All rights of reproduction in any form reserved.

Welcome message from author
This document is posted to help you gain knowledge. Please leave a comment to let me know what you think about it! Share it to your friends and learn new things together.
Transcript
Journal of Structural Biology 133, 000–000 (2001)doi:10.1006/jsbi.2001.4338, available online at http://www.idealibrary.com on
The Effect of Overabundant Projection Directionson 3D Reconstruction Algorithms
C. O. S. Sorzano,* R. Marabini,† N. Boisset,‡ E. Rietzel,§ R. Schroder,§ G. T. Herman,† and J. M. Carazo*
*Centro Nacional de Biotecnologıa (CSIC), Universidad Autonoma Madrid, 28049 Madrid, Spain; †Center for Computer Science andApplied Mathematics, Temple University, Philadelphia, Pennsylvania 19122; §Max Planck Institut fur mediznische Forschung,Jahnstrasse 29, 69120 Heidelberg, Germany; and ‡Laboratoire de mineralogie cristallographie, Equipe Systemes moleculaires
et biologie structurale, Universite Pierre et Marie Curie Paris 6-4, Tour 16, 2eme etage, case 115, 4,Place Jussieu, 75252 Paris Cedex 05, France
Received December 6, 2000, and in revised form February 9, 2001
The experimental process of collecting imagesfrom macromolecules in an electron microscope issuch that it does not allow for prior specification ofthe angular distribution of the projection images.As a consequence, an uneven distribution of projec-tion directions may occur. Concerns have beenraised recently about the behavior of 3D recon-struction algorithms for the case of unevenly dis-tributed projections. It has been illustrated on ex-perimental data that in the case of a heavily unevendistribution of projection directions some algo-rithms tend to elongate the reconstructed volumesalong the overloaded direction so much as to makea quantitative biological analysis impossible. In an-swer to these concerns we have developed a strat-egy for quantitative comparison and optimizationof 3D reconstruction algorithms. We apply thisstrategy to quantitatively analyze algebraic recon-struction techniques (ART) with blobs, simulta-neous iterative reconstruction techniques (SIRT)with voxels, and weighted backprojection (WBP).We show that the elongation artifacts that had beenpreviously reported can be strongly reduced. Withour specific choices for the free parameters of thethree algorithms, WBP reconstructions tend to beinferior to those obtained with either SIRT or ARTand the results obtained with ART are comparableto those with SIRT, but at a very small fraction ofthe computational cost of SIRT. © 2001 Academic Press
Key Words: 3D reconstruction algorithms; algo-rithm optimization; algorithm comparison; collec-tion geometry.
1. INTRODUCTION
In 3D reconstruction from projections the distri-bution of projection directions (expressed in the co-ordinate system fixed to the experimental object) is
called the collection geometry. Knowledge of the col-1
lection geometry is crucial for the reconstructionprocess. The Projection Theorem (Herman, 1980)allows us to identify regions of the Fourier space inwhich there is no information regarding the Fouriertransform of the object under study (missing cones,missing wedges, . . . ).
A number of data collection strategies are possiblein the field of 3D electron microscopy (3DEM) ofbiological macromolecules. If a low-resolution refer-ence volume is available, a fruitful approach is tocollect untilted field micrographs from which a widerange of different views can be obtained. By directcomparison of the experimental images with thereference volume, their directions of projection canbe determined and then input to a 3D reconstructionalgorithm (Frank, 1996). A shortcoming of this ap-proach is that depending on the characteristics ofthe specimen and of its preparation for microscopy,the number of images corresponding to the differentprojection directions may vary quite significantlyamong the different directions. An experimental sit-uation of this type was first investigated by Boissetet al. (1996) and de Haas et al. (1996) in their studiesof the giant hemoglobin of Lumbricus terrestris andof the human a-2 macroglobulin. Indeed, the strongdifferences that they observed in the performance ofthe different reconstruction methods, as well as themarked discrepancies between the results obtainedin an unevenly distributed situation and an evenlydistributed situation, have been the primary moti-vation of the present study. Similar problems wereencountered in a number of cases concerning cylin-drical particles (e.g., CCT chaperonin, molluscan ho-mocyanins) oriented mostly in their circular topviews within the ice layer and were overcome eitherby a careful interactive selection of the particles inthe digitized micrographs or by taking additional
tilted-specimen images.1047-8477/01 $35.00Copyright © 2001 by Academic Press
All rights of reproduction in any form reserved.
srdd
dppitcctttattswscrpr
pppdtstpjtcmccmntts
2 SORZANO ET AL.
In principle, nothing worse than a reconstructionwith anisotropic resolution was initially expected forthe case of the experimental situation described inthe previous paragraph. However, this is not theobservation reported by Boisset et al. (1998), whohowed qualitatively that some reconstruction algo-ithms used in the field tend to elongate the pro-uced volumes along the overabundant projectionirections while others do not.Furthermore, the oversampling of some projection
irections is becoming an important issue for single-article 3D reconstruction, as most high-resolutionrojects require the collection of large untilted-spec-men image sets at specific defocuses. This trend inhe data collection is triggered by the necessity toorrect for the contrast transfer function of the mi-roscope and requires the collection of at least 10imes as many images. However, an even distribu-ion of orientations is hard to obtain for single par-icles observed under such experimental conditionsnd all 3D reconstruction algorithms need to behoroughly tested. This issue is particularly impor-ant for low-symmetry objects such as cylindricaltructures with Cn or Dn point-group symmetries,hich are among the most common shapes found in
oluble biological macromolecular assemblies (e.g.,haperonins, proteasomes, helicases, extracellularespiratory pigments) and in membrane-associatedroteins solubilized with detergents (e.g., calciumelease channel, plant photosystem complexes, a-la-
trotoxin, and pore-forming toxins).In this work we develop a quantitative approach
to study this phenomenon extending the analysis ofBoisset et al. (1998) to algebraic reconstruction tech-niques (ART) with blobs (Marabini et al., 1998), si-multaneous iterative reconstruction techniques(SIRT) (Penczek et al., 1992), and weighted back-
rojection (WBP) (Radermacher, 1992). For this pur-ose, we define a methodology for quantitative com-arisons and apply it to the specific case of unevenlyistributed projections. This methodology (similar tohat proposed by Matej et al. (1994, 1996) but withome modifications) performs a fair comparison be-ween algorithms following a task-oriented ap-roach. Each reconstruction algorithm is first ad-usted so that its performance is optimized and thenhe results obtained by the different algorithms areompared. A random set of realizations of a para-etric family of computer-generated objects (so-
alled phantoms), projected according to the desiredollection geometry and reconstructed with opti-ized parameters, is used for the comparison. Aumber of quantitative measures of goodness areaken for each reconstruction and, finally, a statis-ical comparison of the merits of the different recon-
truction algorithms is performed.2. MATERIALS AND METHODS
In this section we develop the objective comparison strategy tobe used in this work. This approach rests on the assumptions thatthe “true” object to be reconstructed is known and that the mea-sures of quality of algorithm performance should be defined interms of the similarity of the reconstruction to the true object.These measures of quality are tailored to well-defined and prob-lem-specific tasks and are quantified through numerical observ-ers commonly referred to as Figures of Merit (FOMs). In such anapproach, the work must be based on data sets whose 3D struc-ture is known. In the present study we use geometrical phantomsand quantum mechanical simulations. Our goal is a fair compar-ison of algorithms, so our measures must be as independent aspossible from any particular phantom and/or noise realizationused during the simulations.
Typically, there are a few (maybe just one) adjustable param-eters that must be specified for a 3D reconstruction algorithm. Inour work we optimize this set of parameters for each particulartype of angular distribution. This is done by letting one of theFOMs be a training FOM and selecting the parameters of analgorithm so that this training FOM is maximized for each par-ticular family of phantoms, noise, and directions of projections.Considering that the training FOM represents just one of the setof the measures of quality in which we are interested and that thesimulations are only an approximation of the experimental real-ity, we devised a method that provides, instead of a unique set ofoptimum parameter values, a set of regions that contains them.Our evaluation process proceeds by generating a large set ofprojection simulations, performing the reconstruction with ran-domly picked parameters from their optimal regions, calculatinga battery of FOMs on the reconstructed volumes, and, finally,providing a statistical comparison over the set of reconstructionsobtained from all the algorithms under study.
2.1. Collection Geometry Representation
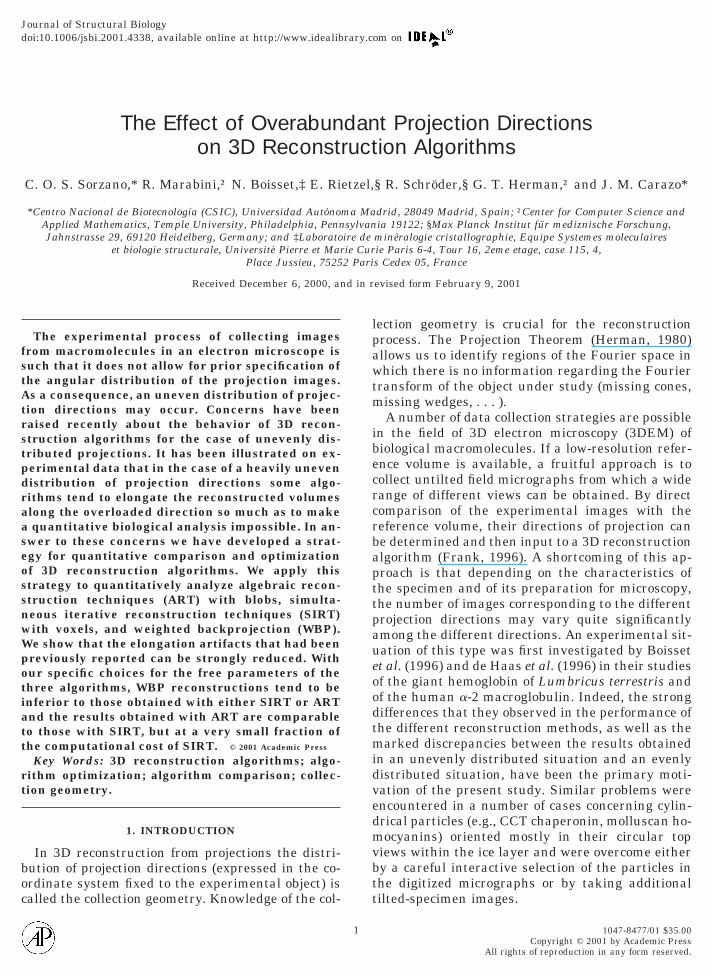
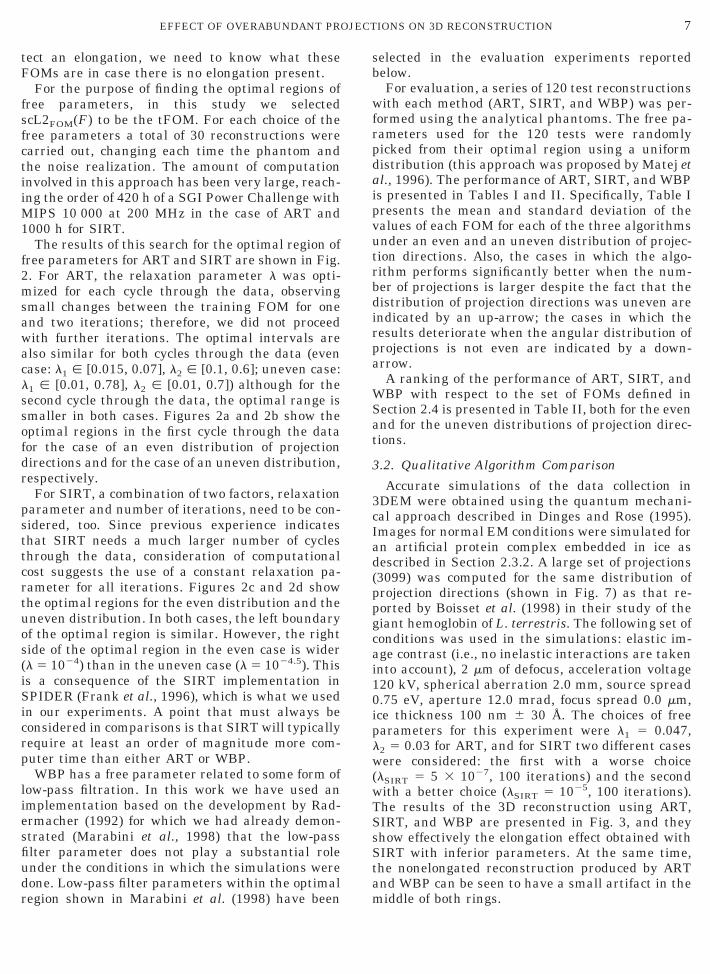
In the coordinate system attached to the particle to be recon-structed, a projection direction can be represented by a unitvector that is anchored at the origin and points into the upperhalf-space and that is parallel to the direction of electrons thatgenerated that projection. All such unit vectors lie on a hemi-sphere. A collection geometry can be illustrated by a display ofsmall triangles attached to the ends of the unit vectors represent-ing all the projection directions (called a “topology sphere” byBoisset et al. (1998)). An even distribution of projections is char-acterized by a constant distance between nearest triangles. No-tice that, except for a few exceptions, it is not possible to distrib-ute evenly a given number of unit vectors. However, a fairly good
FIG. 1. Top (a) and side (b) views of the topology spherecorresponding to an even distribution of projection directions.
approximation can be achieved as is shown in Figs. 1a and 1b.
stOwm
tF
s
trbi
oppb
2
wrsgst
3EFFECT OF OVERABUNDANT PROJECTIONS ON 3D RECONSTRUCTION
2.2. Parameter Selection
Most reconstruction algorithms require the specification of anumber of parameters. Some of these may be considered fixed, inthe sense that a given value has been found appropriate for them,based either on some prior knowledge or on general consider-ations. However, there are other parameters, referred to as freeparameters, whose selection is considered to be dependent on theparticular specifications of the problem at hand. In this work, weare considering two clearly distinguishable types of collectiongeometry: the case of an even distribution of projection directionsand the case of a highly uneven distribution. Therefore, our firstgoal is to specify the free parameters of the different reconstruc-tion algorithms that will be tested for each of these two types ofcollection geometry.
A FOM is a measure of the similarity (from some particularpoint of view) between the object to be reconstructed (a “phan-tom”) and its reconstruction from projection data. For any partic-ular ensemble of phantoms and data collection methodology, wewish to select the free parameters of an algorithm so as to max-imize the expected value of some Training Figure of Merit(tFOM). We do this training experimentally. We first explain ourapproach in the case of only one free parameter.
We randomly pick a set of phantoms and simulate the projec-tion data generation. Let m(l) be the mean and s(l) be thetandard deviation of the values of the tFOM for the reconstruc-ions of these phantoms when the free parameter has the value l.ur method approximates the interval of those values of l forhich the hypothesis that the expected value of the tFOM is
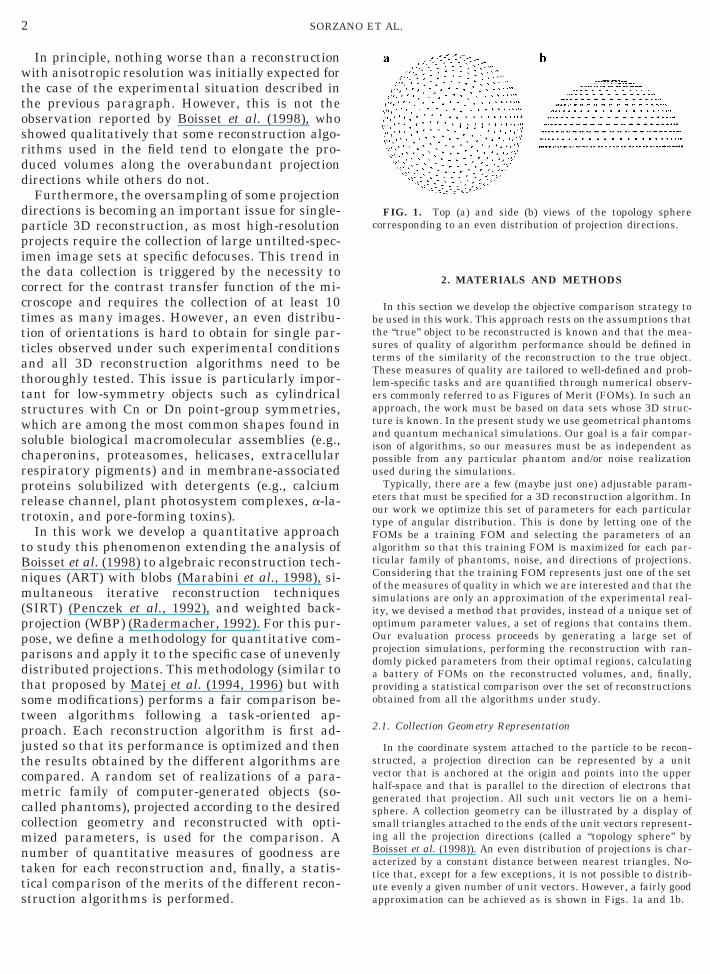
FIG. 2. tFOM versus relaxation parameter at the end of the ficase (b); the mean tFOM and its standard deviation are plotted.uneven case (d).
aximal at l cannot be rejected with 99.5% confidence based on t
he experimentally observed means and standard deviations. Inigs. 2a and 2b we show the plot of m(l), as well as the plots of
m(l) 1 s(l) and m(l) 2 s(l), together with the “optimal region”estimated by our algorithm. The algorithm is based on a Fi-bonacci search that starts with a large interval that is certain toinclude the optimal region and then narrows this interval to adesired level of accuracy. A similar approach has been suggestedby Matej et al. (1996), but without taking into consideration thetandard deviations in determining the optimal region.The extension to the case of two free parameters can be done in
wo different ways: the first consists of selecting an optimalegion that is an area in the plane, instead of an interval, definedy the two parameters (see Figs. 2c and 2d); the second, inspiredn Obi et al. (2000), selects different values of l for each iteration;
thus, the l for the first iteration is chosen randomly from theptimal region determined by Figs. 2a and 2b, while the freearameter for the second iteration is optimized following therocedure described in this section. This extension procedure cane applied for any number of iterations.
.3. Phantoms
2.3.1. Analytically generated phantoms. In this paper we dealith analytically generated phantoms of the following kind. A
elevant part (in the shape of a box) of space is identified and isubdivided into cube-shaped abutting voxels. Some continuouseometrical objects (in this paper these will be cylinders) arepecified. A density is assigned to each voxel as follows. Considerhe voxel to be subdivided into eight equal subvoxels and let n be
le through the data for ART in the even case (a) and the unevenisocurves for SIRT are represented for the even case (c) and the
rst cyctFOM
he number of centers of these subvoxels that are inside one of the
d
ro
Armecnssgdtwoi1ote
2
i
rto
sr
t
4 SORZANO ET AL.
geometrical objects. Then the density of the voxel is defined to ben/8. We use V to denote the set of all voxels, F (for foreground) to
enote those voxels whose density is 1, and B (for background) todenote those voxels whose density is 0.
The phantoms used in this article were designed following theprinciples proposed by Marabini et al. (1998). They consist of twoidentical cylinders aligned along the Z axis. The position, height,adius, and separation are random to avoid a possible dependencef the Figures of Merit used on any of these variables.2.3.2. Phantoms obtained by quantum mechanical simulation.s in previous work (Marabini et al., 1997) a phantom thatesembles a real protein complex was constructed for quantumechanical image simulations. G-actin atomic coordinates (pdb
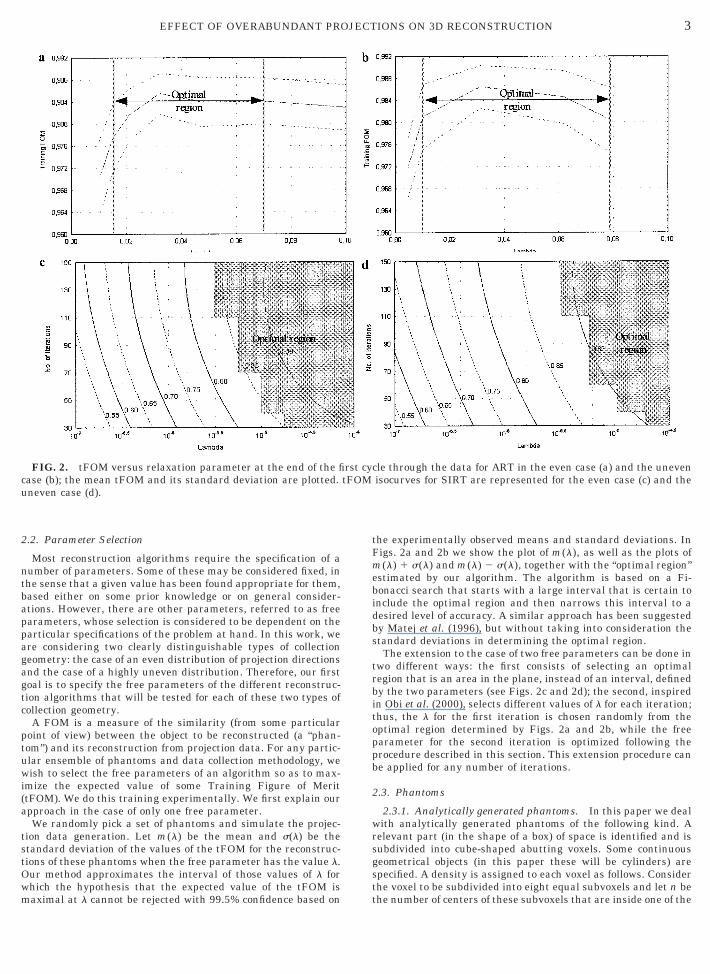
ntry 1ATN by Holmes et al., 1990) were used to obtain a smallube of a protein-like atomic distribution (carbon, oxygen, anditrogen atoms). To obtain spheres as shown in Fig. 3, eight suchmall cubes were put together to form a larger cube from which aphere is extracted. Twelve identical spheres were then put to-ether to form the phantom protein complex (Fig. 3). Such atomistribution phantoms were rotated according to the given collec-ion geometry and embedded into a distribution of oxygen atomsith a density equal to that of water. The final atom distributionsf protein phantom and oxygen atoms were chosen as input formage simulations using the program YaMS (Dinges and Rose,995). The images were simulated by calculating the propagationf an electron wave through the scattering potentials formed byhe atoms in the distribution. In our present simulations only thelastic potentials were considered.
.4. Figures of Merit
Various FOMs have been previously proposed both in medicalmaging (Matej et al., 1994) and in 3DEM (Marabini et al., 1997).
In this work we put forth a more complete set of FOMs, includingthose that evaluate elongations. Two broad families of FOMshave been developed; we refer to them as structural consistencymeasures and structural separability measures.
2.4.1. Structural consistency measures. Structural consis-tency refers to the correspondence between the voxel values in thereconstruction and in the phantom. It can be measured usingmagnitudes such as absolute errors, squared errors, differencesin the means, differences in standard deviations, and differencesin minimum and maximum values. The region over which thesedifferences are taken can be the whole volume (for global mea-sures), the background only, the foreground only, or the regionsaround the foreground.
We need to introduce some notation. We use R to denote theegion over which the FOMs are measured. Inside the regionhere are NR voxels, which are numbered from 1 to NR. The valuef the voxel number i of this region is denoted as pR,i, while the
corresponding value in the reconstruction is denoted as rR,i. Themean voxel value in the region R in the phantom is denoted bympR
and in the reconstruction mrR; spR
and srRdenote the corre-
ponding standard deviations. The maximum voxel value in theegion R in the phantom is denoted by MpR
and in the reconstruc-tion by MrR
; mpRand mrR
denote the corresponding minimalvalues. Based on these definitions the following structural con-sistency FOMs have been developed:
● Mean squared error FOM (a measure of consistency betweenvoxel values, it gives significantly more importance to large er-rors):
scL2FOM~R! 5 1 21
NROi51
NR SpR,i 2 rR,i
2 D2
.
● Mean absolute error FOM (another measure of consistencybetween phantom and reconstruction voxel values with the im-
portance of errors proportional to their size):scL1FOM~R! 5 1 21
NROi51
NR
UpR,i 2 rR,i
2 U.● Mean density value FOM (measures the correspondence be-
ween the density averages over the whole region):
scmFOM~R! 5 1 212 umpR 2 mrRu.
FIG. 3. 3D reconstructions of a realistic phantom simulatedat the atomic level using an uneven distribution of projectiondirections with 3099 projections. From top to bottom: originalphantom, reconstruction with ART, reconstruction with SIRT,reconstruction with WBP, reconstruction with SIRT using non-optimal parameters.
● Density standard deviation FOM (checks if the standard
f
e
(
h
ues in
5EFFECT OF OVERABUNDANT PROJECTIONS ON 3D RECONSTRUCTION
deviation in the phantom is well reproduced in the reconstruc-tion):
scsFOM~R! 5 1 2 uspR 2 srRu.
● Range FOM (the agreement between the voxel value rangesin the phantom and in the reconstruction):
scDFOM~R! 5 1 212 ~uMpR 2 MrRu 1 umpR 2 mrRu!.
Below we report on these FOMs for three different regions: thewhole volume V, the foreground F, and the background B. Wealso report on other structural consistency measures that havebeen designed so that errors are weighted differently dependingon where they appear.
● Blurring FOM (emphasizes accuracy near the foregroundusing a division by di, which is the Euclidean distance of thecenter of the ith voxel in the background from the voxel in theforeground that is nearest to it):
scblFOM 5 1 21
NBOi51
NB 1diSpB,i 2 rB,i
2 D2
.
● New masses appearing FOM (emphasizes accuracy far from theoreground and should thus be able to detect long elongations):
scapFOM 5 1 21
NBOi51
NB
diSpB,i 2 rB,i
2 D2
.
● Radon FOM (measures accuracy of averages in horizontal lay-rs p(k) of voxels, 1 # k # K, and is thus appropriate to detect
vertical elongations):
scrtFOM 5 1 21K O
k51
K
umpp~k! 2 mrp~k!u.
Notice that this measure is equivalent to the comparison of theRadon transforms of the phantom and the reconstruction along
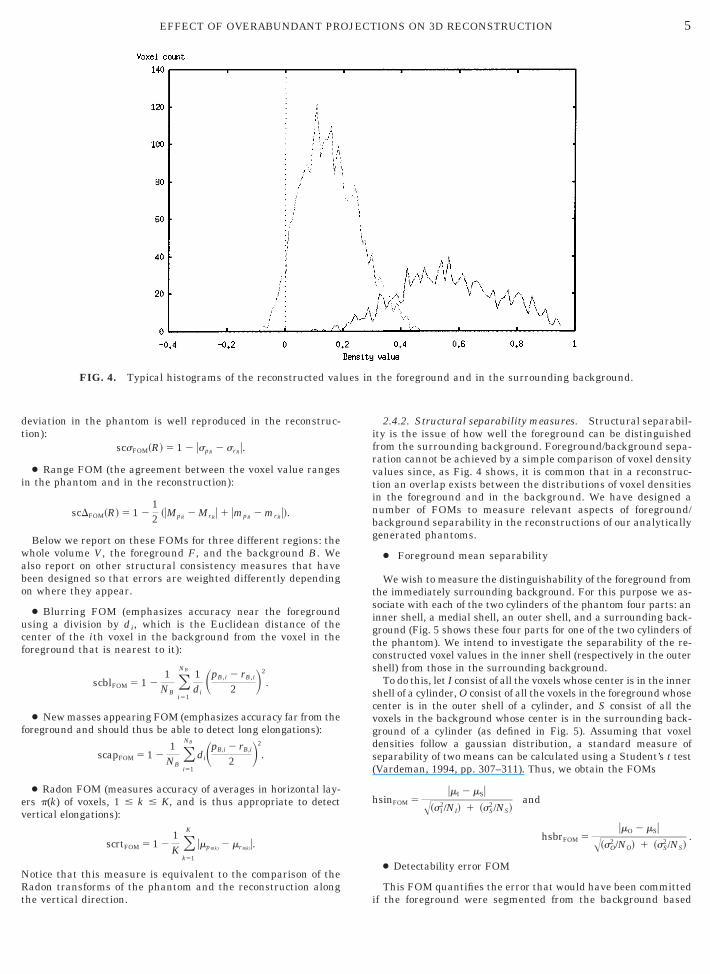
FIG. 4. Typical histograms of the reconstructed val
the vertical direction. i
2.4.2. Structural separability measures. Structural separabil-ity is the issue of how well the foreground can be distinguishedfrom the surrounding background. Foreground/background sepa-ration cannot be achieved by a simple comparison of voxel densityvalues since, as Fig. 4 shows, it is common that in a reconstruc-tion an overlap exists between the distributions of voxel densitiesin the foreground and in the background. We have designed anumber of FOMs to measure relevant aspects of foreground/background separability in the reconstructions of our analyticallygenerated phantoms.
● Foreground mean separability
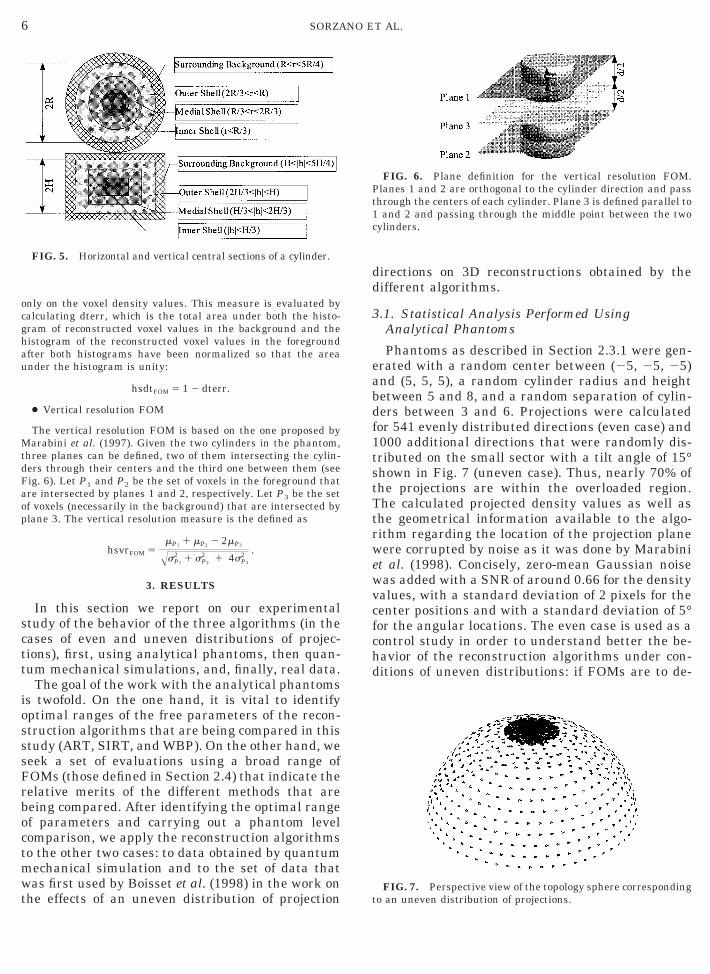
We wish to measure the distinguishability of the foreground fromthe immediately surrounding background. For this purpose we as-sociate with each of the two cylinders of the phantom four parts: aninner shell, a medial shell, an outer shell, and a surrounding back-ground (Fig. 5 shows these four parts for one of the two cylinders ofthe phantom). We intend to investigate the separability of the re-constructed voxel values in the inner shell (respectively in the outershell) from those in the surrounding background.
To do this, let I consist of all the voxels whose center is in the innershell of a cylinder, O consist of all the voxels in the foreground whosecenter is in the outer shell of a cylinder, and S consist of all thevoxels in the background whose center is in the surrounding back-ground of a cylinder (as defined in Fig. 5). Assuming that voxeldensities follow a gaussian distribution, a standard measure ofseparability of two means can be calculated using a Student’s t testVardeman, 1994, pp. 307–311). Thus, we obtain the FOMs
sinFOM 5umI 2 mSu
Î~sI2/NI! 1 ~sS
2/NS!and
hsbrFOM 5umO 2 mSu
Î~sO2 /NO! 1 ~sS
2/NS!.
● Detectability error FOM
This FOM quantifies the error that would have been committed
the foreground and in the surrounding background.
f the foreground were segmented from the background based
MtdF
t
abdf1tstTtrwewvcfchd
6 SORZANO ET AL.
only on the voxel density values. This measure is evaluated bycalculating dterr, which is the total area under both the histo-gram of reconstructed voxel values in the background and thehistogram of the reconstructed voxel values in the foregroundafter both histograms have been normalized so that the areaunder the histogram is unity:
hsdtFOM 5 1 2 dterr.
● Vertical resolution FOM
The vertical resolution FOM is based on the one proposed byarabini et al. (1997). Given the two cylinders in the phantom,
hree planes can be defined, two of them intersecting the cylin-ers through their centers and the third one between them (seeig. 6). Let P1 and P2 be the set of voxels in the foreground that
are intersected by planes 1 and 2, respectively. Let P3 be the setof voxels (necessarily in the background) that are intersected byplane 3. The vertical resolution measure is the defined as
hsvrFOM 5mP1 1 mP2 2 2mP3
ÎsP12 1 sP2
2 1 4sP32 .
3. RESULTS
In this section we report on our experimentalstudy of the behavior of the three algorithms (in thecases of even and uneven distributions of projec-tions), first, using analytical phantoms, then quan-tum mechanical simulations, and, finally, real data.
The goal of the work with the analytical phantomsis twofold. On the one hand, it is vital to identifyoptimal ranges of the free parameters of the recon-struction algorithms that are being compared in thisstudy (ART, SIRT, and WBP). On the other hand, weseek a set of evaluations using a broad range ofFOMs (those defined in Section 2.4) that indicate therelative merits of the different methods that arebeing compared. After identifying the optimal rangeof parameters and carrying out a phantom levelcomparison, we apply the reconstruction algorithmsto the other two cases: to data obtained by quantummechanical simulation and to the set of data thatwas first used by Boisset et al. (1998) in the work on
FIG. 5. Horizontal and vertical central sections of a cylinder.
he effects of an uneven distribution of projection
directions on 3D reconstructions obtained by thedifferent algorithms.
3.1. Statistical Analysis Performed UsingAnalytical Phantoms
Phantoms as described in Section 2.3.1 were gen-erated with a random center between (25, 25, 25)nd (5, 5, 5), a random cylinder radius and heightetween 5 and 8, and a random separation of cylin-ers between 3 and 6. Projections were calculatedor 541 evenly distributed directions (even case) and000 additional directions that were randomly dis-ributed on the small sector with a tilt angle of 15°hown in Fig. 7 (uneven case). Thus, nearly 70% ofhe projections are within the overloaded region.he calculated projected density values as well ashe geometrical information available to the algo-ithm regarding the location of the projection planeere corrupted by noise as it was done by Marabini
t al. (1998). Concisely, zero-mean Gaussian noiseas added with a SNR of around 0.66 for the densityalues, with a standard deviation of 2 pixels for theenter positions and with a standard deviation of 5°or the angular locations. The even case is used as aontrol study in order to understand better the be-avior of the reconstruction algorithms under con-itions of uneven distributions: if FOMs are to de-
FIG. 7. Perspective view of the topology sphere corresponding
FIG. 6. Plane definition for the vertical resolution FOM.Planes 1 and 2 are orthogonal to the cylinder direction and passthrough the centers of each cylinder. Plane 3 is defined parallel to1 and 2 and passing through the middle point between the twocylinders.
to an uneven distribution of projections.
p
7EFFECT OF OVERABUNDANT PROJECTIONS ON 3D RECONSTRUCTION
tect an elongation, we need to know what theseFOMs are in case there is no elongation present.
For the purpose of finding the optimal regions offree parameters, in this study we selectedscL2FOM(F) to be the tFOM. For each choice of thefree parameters a total of 30 reconstructions werecarried out, changing each time the phantom andthe noise realization. The amount of computationinvolved in this approach has been very large, reach-ing the order of 420 h of a SGI Power Challenge withMIPS 10 000 at 200 MHz in the case of ART and1000 h for SIRT.
The results of this search for the optimal region offree parameters for ART and SIRT are shown in Fig.2. For ART, the relaxation parameter l was opti-mized for each cycle through the data, observingsmall changes between the training FOM for oneand two iterations; therefore, we did not proceedwith further iterations. The optimal intervals arealso similar for both cycles through the data (evencase: l1 [ [0.015, 0.07], l2 [ [0.1, 0.6]; uneven case:l1 [ [0.01, 0.78], l2 [ [0.01, 0.7]) although for thesecond cycle through the data, the optimal range issmaller in both cases. Figures 2a and 2b show theoptimal regions in the first cycle through the datafor the case of an even distribution of projectiondirections and for the case of an uneven distribution,respectively.
For SIRT, a combination of two factors, relaxationparameter and number of iterations, need to be con-sidered, too. Since previous experience indicatesthat SIRT needs a much larger number of cyclesthrough the data, consideration of computationalcost suggests the use of a constant relaxation pa-rameter for all iterations. Figures 2c and 2d showthe optimal regions for the even distribution and theuneven distribution. In both cases, the left boundaryof the optimal region is similar. However, the rightside of the optimal region in the even case is wider(l 5 1024) than in the uneven case (l 5 1024.5). Thisis a consequence of the SIRT implementation inSPIDER (Frank et al., 1996), which is what we usedin our experiments. A point that must always beconsidered in comparisons is that SIRT will typicallyrequire at least an order of magnitude more com-puter time than either ART or WBP.
WBP has a free parameter related to some form oflow-pass filtration. In this work we have used animplementation based on the development by Rad-ermacher (1992) for which we had already demon-strated (Marabini et al., 1998) that the low-passfilter parameter does not play a substantial roleunder the conditions in which the simulations weredone. Low-pass filter parameters within the optimal
region shown in Marabini et al. (1998) have beenselected in the evaluation experiments reportedbelow.
For evaluation, a series of 120 test reconstructionswith each method (ART, SIRT, and WBP) was per-formed using the analytical phantoms. The free pa-rameters used for the 120 tests were randomlypicked from their optimal region using a uniformdistribution (this approach was proposed by Matej etal., 1996). The performance of ART, SIRT, and WBPis presented in Tables I and II. Specifically, Table Ipresents the mean and standard deviation of thevalues of each FOM for each of the three algorithmsunder an even and an uneven distribution of projec-tion directions. Also, the cases in which the algo-rithm performs significantly better when the num-ber of projections is larger despite the fact that thedistribution of projection directions was uneven areindicated by an up-arrow; the cases in which theresults deteriorate when the angular distribution ofprojections is not even are indicated by a down-arrow.
A ranking of the performance of ART, SIRT, andWBP with respect to the set of FOMs defined inSection 2.4 is presented in Table II, both for the evenand for the uneven distributions of projection direc-tions.
3.2. Qualitative Algorithm Comparison
Accurate simulations of the data collection in3DEM were obtained using the quantum mechani-cal approach described in Dinges and Rose (1995).Images for normal EM conditions were simulated foran artificial protein complex embedded in ice asdescribed in Section 2.3.2. A large set of projections(3099) was computed for the same distribution ofprojection directions (shown in Fig. 7) as that re-ported by Boisset et al. (1998) in their study of thegiant hemoglobin of L. terrestris. The following set ofconditions was used in the simulations: elastic im-age contrast (i.e., no inelastic interactions are takeninto account), 2 mm of defocus, acceleration voltage120 kV, spherical aberration 2.0 mm, source spread0.75 eV, aperture 12.0 mrad, focus spread 0.0 mm,ice thickness 100 nm 6 30 Å. The choices of free
arameters for this experiment were l1 5 0.047,l2 5 0.03 for ART, and for SIRT two different caseswere considered: the first with a worse choice(lSIRT 5 5 3 1027, 100 iterations) and the secondwith a better choice (lSIRT 5 1025, 100 iterations).The results of the 3D reconstruction using ART,SIRT, and WBP are presented in Fig. 3, and theyshow effectively the elongation effect obtained withSIRT with inferior parameters. At the same time,the nonelongated reconstruction produced by ARTand WBP can be seen to have a small artifact in the
middle of both rings.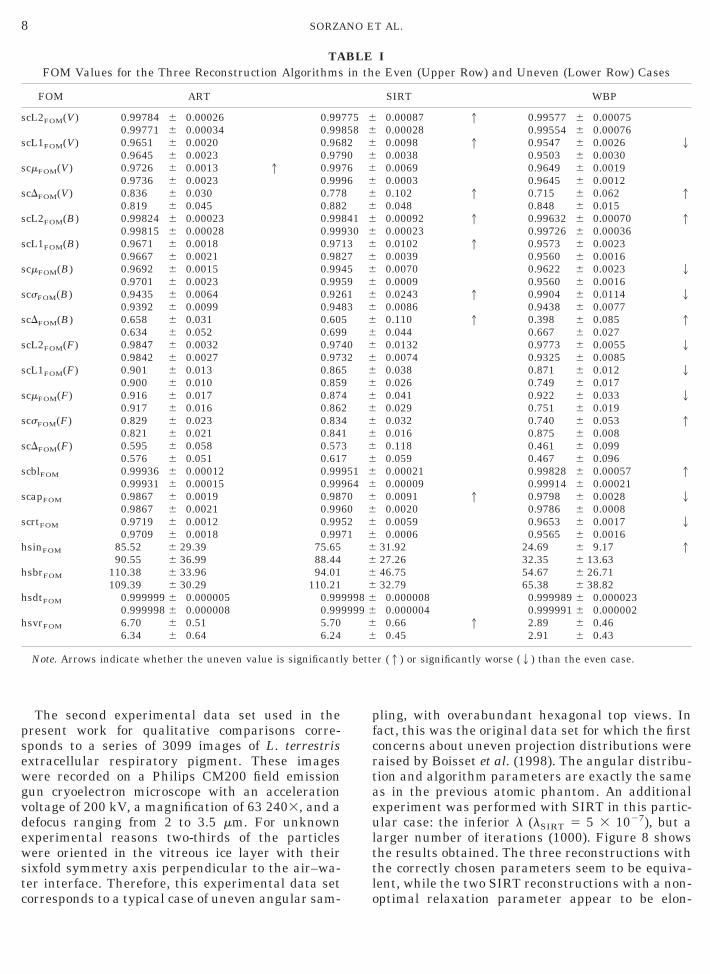
d
h
h
y bette
8 SORZANO ET AL.
The second experimental data set used in thepresent work for qualitative comparisons corre-sponds to a series of 3099 images of L. terrestrisextracellular respiratory pigment. These imageswere recorded on a Philips CM200 field emissiongun cryoelectron microscope with an accelerationvoltage of 200 kV, a magnification of 63 2403, and a
efocus ranging from 2 to 3.5 mm. For unknownexperimental reasons two-thirds of the particleswere oriented in the vitreous ice layer with theirsixfold symmetry axis perpendicular to the air–wa-ter interface. Therefore, this experimental data set
TAFOM Values for the Three Reconstruction Algorithms
FOM ART
scL2FOM(V) 0.99784 6 0.00026 0.990.99771 6 0.00034 0.99
scL1FOM(V) 0.9651 6 0.0020 0.960.9645 6 0.0023 0.97
scmFOM(V) 0.9726 6 0.0013 1 0.990.9736 6 0.0023 0.99
scDFOM(V) 0.836 6 0.030 0.770.819 6 0.045 0.88
scL2FOM(B) 0.99824 6 0.00023 0.990.99815 6 0.00028 0.99
scL1FOM(B) 0.9671 6 0.0018 0.970.9667 6 0.0021 0.98
scmFOM(B) 0.9692 6 0.0015 0.990.9701 6 0.0023 0.99
scsFOM(B) 0.9435 6 0.0064 0.920.9392 6 0.0099 0.94
scDFOM(B) 0.658 6 0.031 0.600.634 6 0.052 0.69
scL2FOM(F) 0.9847 6 0.0032 0.970.9842 6 0.0027 0.97
scL1FOM(F) 0.901 6 0.013 0.860.900 6 0.010 0.85
scmFOM(F) 0.916 6 0.017 0.870.917 6 0.016 0.86
scsFOM(F) 0.829 6 0.023 0.830.821 6 0.021 0.84
scDFOM(F) 0.595 6 0.058 0.570.576 6 0.051 0.61
scblFOM 0.99936 6 0.00012 0.990.99931 6 0.00015 0.99
scapFOM 0.9867 6 0.0019 0.980.9867 6 0.0021 0.99
scrtFOM 0.9719 6 0.0012 0.990.9709 6 0.0018 0.99
hsinFOM 85.52 6 29.39 75.6590.55 6 36.99 88.44
sbrFOM 110.38 6 33.96 94.01109.39 6 30.29 110.21
sdtFOM 0.999999 6 0.000005 0.990.999998 6 0.000008 0.99
hsvrFOM 6.70 6 0.51 5.706.34 6 0.64 6.24
Note. Arrows indicate whether the uneven value is significantl
corresponds to a typical case of uneven angular sam-
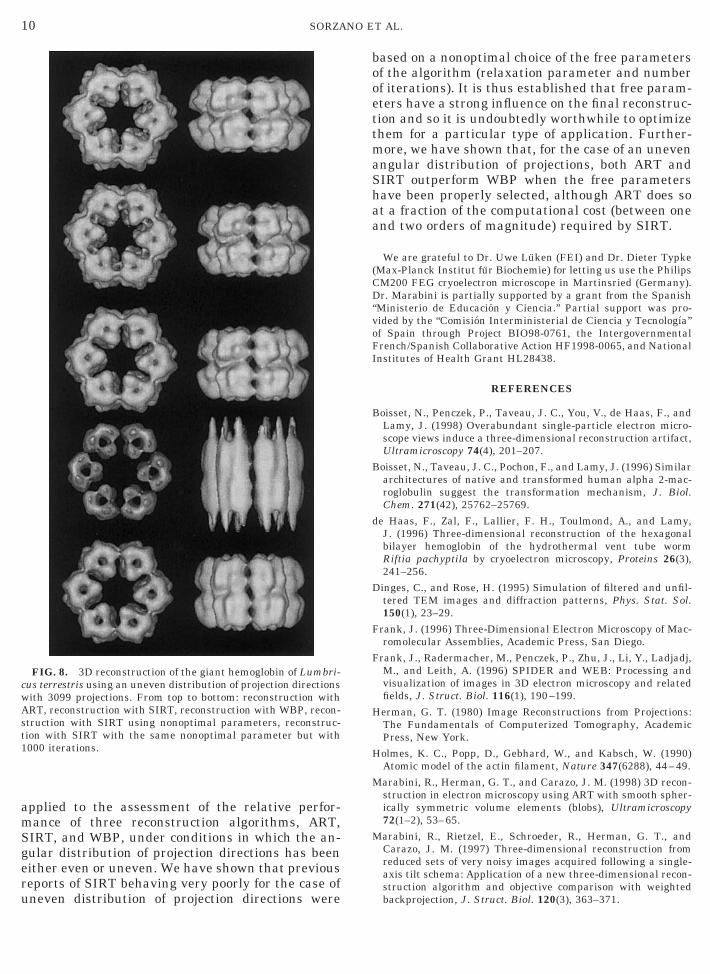
pling, with overabundant hexagonal top views. Infact, this was the original data set for which the firstconcerns about uneven projection distributions wereraised by Boisset et al. (1998). The angular distribu-tion and algorithm parameters are exactly the sameas in the previous atomic phantom. An additionalexperiment was performed with SIRT in this partic-ular case: the inferior l (lSIRT 5 5 3 1027), but alarger number of iterations (1000). Figure 8 showsthe results obtained. The three reconstructions withthe correctly chosen parameters seem to be equiva-lent, while the two SIRT reconstructions with a non-
Ie Even (Upper Row) and Uneven (Lower Row) Cases
SIRT WBP
0.00087 1 0.99577 6 0.000750.00028 0.99554 6 0.000760.0098 1 0.9547 6 0.0026 20.0038 0.9503 6 0.00300.0069 0.9649 6 0.00190.0003 0.9645 6 0.00120.102 1 0.715 6 0.062 10.048 0.848 6 0.0150.00092 1 0.99632 6 0.00070 10.00023 0.99726 6 0.000360.0102 1 0.9573 6 0.00230.0039 0.9560 6 0.00160.0070 0.9622 6 0.0023 20.0009 0.9560 6 0.00160.0243 1 0.9904 6 0.0114 20.0086 0.9438 6 0.00770.110 1 0.398 6 0.085 10.044 0.667 6 0.0270.0132 0.9773 6 0.0055 20.0074 0.9325 6 0.00850.038 0.871 6 0.012 20.026 0.749 6 0.0170.041 0.922 6 0.033 20.029 0.751 6 0.0190.032 0.740 6 0.053 10.016 0.875 6 0.0080.118 0.461 6 0.0990.059 0.467 6 0.0960.00021 0.99828 6 0.00057 10.00009 0.99914 6 0.000210.0091 1 0.9798 6 0.0028 20.0020 0.9786 6 0.00080.0059 0.9653 6 0.0017 20.0006 0.9565 6 0.0016
31.92 24.69 6 9.17 127.26 32.35 6 13.6346.75 54.67 6 26.7132.79 65.38 6 38.82
0.000008 0.999989 6 0.0000230.000004 0.999991 6 0.0000020.66 1 2.89 6 0.460.45 2.91 6 0.43
r (1) or significantly worse (2) than the even case.
BLEin th
775 6858 682 690 676 696 68 62 6841 6930 613 627 645 659 661 683 65 69 640 632 65 69 64 62 64 61 63 67 6951 6964 670 660 652 671 6
6666
9998 69999 6
66
optimal relaxation parameter appear to be elon-
v
9EFFECT OF OVERABUNDANT PROJECTIONS ON 3D RECONSTRUCTION
gated in the overloaded direction. This elongationartifact is stronger for the reconstruction done witha smaller number of iterations.
4. DISCUSSION
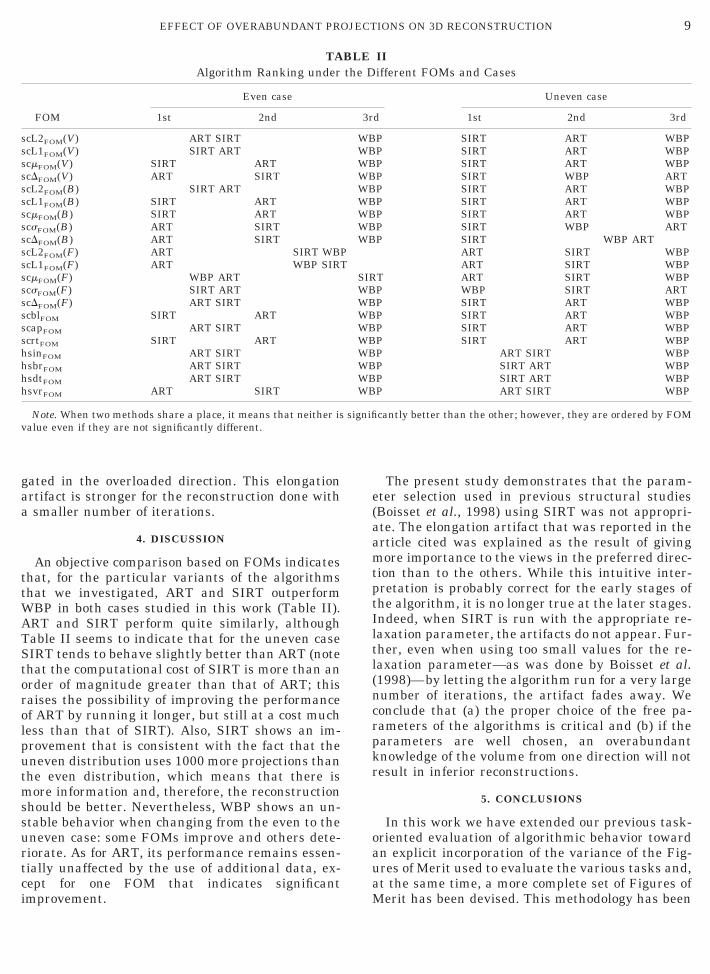
An objective comparison based on FOMs indicatesthat, for the particular variants of the algorithmsthat we investigated, ART and SIRT outperformWBP in both cases studied in this work (Table II).ART and SIRT perform quite similarly, althoughTable II seems to indicate that for the uneven caseSIRT tends to behave slightly better than ART (notethat the computational cost of SIRT is more than anorder of magnitude greater than that of ART; thisraises the possibility of improving the performanceof ART by running it longer, but still at a cost muchless than that of SIRT). Also, SIRT shows an im-provement that is consistent with the fact that theuneven distribution uses 1000 more projections thanthe even distribution, which means that there ismore information and, therefore, the reconstructionshould be better. Nevertheless, WBP shows an un-stable behavior when changing from the even to theuneven case: some FOMs improve and others dete-riorate. As for ART, its performance remains essen-tially unaffected by the use of additional data, ex-cept for one FOM that indicates significant
TAAlgorithm Ranking under
FOM
Even case
1st 2nd
scL2FOM(V) ART SIRTscL1FOM(V) SIRT ARTscmFOM(V) SIRT ARTscDFOM(V) ART SIRTscL2FOM(B) SIRT ARTscL1FOM(B) SIRT ARTscmFOM(B) SIRT ARTscsFOM(B) ART SIRTscDFOM(B) ART SIRTscL2FOM(F) ART SIRT WBPscL1FOM(F) ART WBP SIRTscmFOM(F) WBP ARTscsFOM(F) SIRT ARTscDFOM(F) ART SIRTscblFOM SIRT ARTscapFOM ART SIRTscrtFOM SIRT ARThsinFOM ART SIRThsbrFOM ART SIRThsdtFOM ART SIRThsvrFOM ART SIRT
Note. When two methods share a place, it means that neither isalue even if they are not significantly different.
improvement.
The present study demonstrates that the param-eter selection used in previous structural studies(Boisset et al., 1998) using SIRT was not appropri-ate. The elongation artifact that was reported in thearticle cited was explained as the result of givingmore importance to the views in the preferred direc-tion than to the others. While this intuitive inter-pretation is probably correct for the early stages ofthe algorithm, it is no longer true at the later stages.Indeed, when SIRT is run with the appropriate re-laxation parameter, the artifacts do not appear. Fur-ther, even when using too small values for the re-laxation parameter—as was done by Boisset et al.(1998)—by letting the algorithm run for a very largenumber of iterations, the artifact fades away. Weconclude that (a) the proper choice of the free pa-rameters of the algorithms is critical and (b) if theparameters are well chosen, an overabundantknowledge of the volume from one direction will notresult in inferior reconstructions.
5. CONCLUSIONS
In this work we have extended our previous task-oriented evaluation of algorithmic behavior towardan explicit incorporation of the variance of the Fig-ures of Merit used to evaluate the various tasks and,at the same time, a more complete set of Figures of
IIifferent FOMs and Cases
Uneven case
d 1st 2nd 3rd
P SIRT ART WBPP SIRT ART WBPP SIRT ART WBPP SIRT WBP ARTP SIRT ART WBPP SIRT ART WBPP SIRT ART WBPP SIRT WBP ARTP SIRT WBP ART
ART SIRT WBPART SIRT WBP
T ART SIRT WBPP WBP SIRT ARTP SIRT ART WBPP SIRT ART WBPP SIRT ART WBPP SIRT ART WBPP ART SIRT WBPP SIRT ART WBPP SIRT ART WBPP ART SIRT WBP
cantly better than the other; however, they are ordered by FOM
BLEthe D
3r
WBWBWBWBWBWBWBWBWB
SIRWBWBWBWBWBWBWBWBWB
signifi
Merit has been devised. This methodology has been
oFI
B
B
D
F
F
H
H
M
M
cwAst1
10 SORZANO ET AL.
applied to the assessment of the relative perfor-mance of three reconstruction algorithms, ART,SIRT, and WBP, under conditions in which the an-gular distribution of projection directions has beeneither even or uneven. We have shown that previousreports of SIRT behaving very poorly for the case of
FIG. 8. 3D reconstruction of the giant hemoglobin of Lumbri-us terrestris using an uneven distribution of projection directionsith 3099 projections. From top to bottom: reconstruction withRT, reconstruction with SIRT, reconstruction with WBP, recon-truction with SIRT using nonoptimal parameters, reconstruc-ion with SIRT with the same nonoptimal parameter but with000 iterations.
uneven distribution of projection directions were
based on a nonoptimal choice of the free parametersof the algorithm (relaxation parameter and numberof iterations). It is thus established that free param-eters have a strong influence on the final reconstruc-tion and so it is undoubtedly worthwhile to optimizethem for a particular type of application. Further-more, we have shown that, for the case of an unevenangular distribution of projections, both ART andSIRT outperform WBP when the free parametershave been properly selected, although ART does soat a fraction of the computational cost (between oneand two orders of magnitude) required by SIRT.
We are grateful to Dr. Uwe Luken (FEI) and Dr. Dieter Typke(Max-Planck Institut fur Biochemie) for letting us use the PhilipsCM200 FEG cryoelectron microscope in Martinsried (Germany).Dr. Marabini is partially supported by a grant from the Spanish“Ministerio de Educacion y Ciencia.” Partial support was pro-vided by the “Comision Interministerial de Ciencia y Tecnologıa”f Spain through Project BIO98-0761, the Intergovernmentalrench/Spanish Collaborative Action HF1998-0065, and Nationalnstitutes of Health Grant HL28438.
REFERENCES
oisset, N., Penczek, P., Taveau, J. C., You, V., de Haas, F., andLamy, J. (1998) Overabundant single-particle electron micro-scope views induce a three-dimensional reconstruction artifact,Ultramicroscopy 74(4), 201–207.oisset, N., Taveau, J. C., Pochon, F., and Lamy, J. (1996) Similararchitectures of native and transformed human alpha 2-mac-roglobulin suggest the transformation mechanism, J. Biol.Chem. 271(42), 25762–25769.
de Haas, F., Zal, F., Lallier, F. H., Toulmond, A., and Lamy,J. (1996) Three-dimensional reconstruction of the hexagonalbilayer hemoglobin of the hydrothermal vent tube wormRiftia pachyptila by cryoelectron microscopy, Proteins 26(3),241–256.inges, C., and Rose, H. (1995) Simulation of filtered and unfil-tered TEM images and diffraction patterns, Phys. Stat. Sol.150(1), 23–29.
rank, J. (1996) Three-Dimensional Electron Microscopy of Mac-romolecular Assemblies, Academic Press, San Diego.
rank, J., Radermacher, M., Penczek, P., Zhu, J., Li, Y., Ladjadj,M., and Leith, A. (1996) SPIDER and WEB: Processing andvisualization of images in 3D electron microscopy and relatedfields, J. Struct. Biol. 116(1), 190–199.
erman, G. T. (1980) Image Reconstructions from Projections:The Fundamentals of Computerized Tomography, AcademicPress, New York.
olmes, K. C., Popp, D., Gebhard, W., and Kabsch, W. (1990)Atomic model of the actin filament, Nature 347(6288), 44–49.
arabini, R., Herman, G. T., and Carazo, J. M. (1998) 3D recon-struction in electron microscopy using ART with smooth spher-ically symmetric volume elements (blobs), Ultramicroscopy72(1–2), 53–65.
arabini, R., Rietzel, E., Schroeder, R., Herman, G. T., andCarazo, J. M. (1997) Three-dimensional reconstruction fromreduced sets of very noisy images acquired following a single-axis tilt schema: Application of a new three-dimensional recon-struction algorithm and objective comparison with weighted
backprojection, J. Struct. Biol. 120(3), 363–371.
11EFFECT OF OVERABUNDANT PROJECTIONS ON 3D RECONSTRUCTION
Matej, S., Furuie, S. S., and Herman, G. T. (1996) Relevance ofstatistically significant differences between reconstruction al-gorithms, IEEE Trans. Image Proc. 5(3), 554–556.
Matej, S., Herman, G. T., Narayan, T. K., Furuie, S. S., Lewitt,R. M., and Kinahan, P. E. (1994) Evaluation of task-orientedperformance of several fully 3D PET reconstruction algorithms,Phys. Med. Biol. 39, 355–367.
Obi, T., Matej, S., Lewitt, R., and Herman, G. T. (2000) 2.5-D
simultaneous multislice reconstruction by series expansionmethods from Fourier-rebinned PET data, IEEE Trans. Med.Imaging 19(5), 474–484.
Penczek, P., Radermacher, M., and Frank, J. (1992) Three-dimen-sional reconstruction of single particles embedded in ice, Ultra-microscopy 40(1), 33–53.
Radermacher, M. (1992) Weighted back-projection methods, inFrank, J. (Ed.), Electron Tomography, Plenum, New York.
Vardeman, S. B. (1994) Statistics for Engineering Problem Solv-
ing, IEEE Press, New York.
Related Documents