Uniform distribution of projection data for improved reconstruction quality of 4D EPR imaging Rizwan Ahmad a,b , Deepti S. Vikram a , Bradley Clymer b,c , Lee C. Potter b , Yuanmu Deng a , Parthasarathy Srinivasan d , Jay L. Zweier a , and Periannan Kuppusamy a,* a Center for Biomedical EPR Spectroscopy and Imaging, Davis Heart and Lung Research Institute, Department of Internal Medicine, The Ohio State University, 420 West 12th Avenue, Room 114, Columbus, OH 43210, USA b Department of Electrical and Computer Engineering, The Ohio State University, Columbus, OH 43210, USA c Department of Biomedical Engineering, The Ohio State University, Columbus, OH 43210, USA d Mathematical Biosciences Institute, The Ohio State University, Columbus, OH 43210, USA Abstract In continuous wave (CW) electron paramagnetic resonance imaging (EPRI), high quality of reconstruction in a limited acquisition time is a high priority. It has been shown for the case of 3D EPRI, that a uniform distribution of the projection data generally enhances reconstruction quality. In this work, we have suggested two data acquisition techniques for which the gradient orientations are more evenly distributed over the 4D acquisition space as compared to the existing methods. The first sampling technique is based on equal solid angle partitioning of 4D space, while the second technique is based on Fekete points estimation in 4D to generate a more uniform distribution of data. After acquisition, filtered backprojection (FBP) is applied to carryout the reconstruction in a single stage. The single-stage reconstruction improves the spatial resolution by eliminating the necessity of data interpolation in multi-stage reconstructions. For the proposed data distributions, the simulations and experimental results indicate a higher fidelity to the true object configuration. Using the uniform distribution, we expect about 50% reduction in the acquisition time over the traditional method of equal linear angle acquisition. Keywords 4D inverse Radon transform; Fekete points; Reconstruction artifacts; EPRI; Single-stage reconstruction 1. Introduction Electron paramagnetic resonance imaging (EPRI) is a noninvasive technique that is capable of detecting and imaging free radicals [1]. Due to its ability for direct detection and characterization of both endogenous and introduced free radicals, EPRI has a distinct advantage in many biological applications [2-7]. However, the long acquisition time, especially for 4D spectral-spatial imaging, can be a bottle-neck for many in vivo biological applications. It has been shown for the 3D case [8] that uniformity of the data distribution can improve the © 2007 Elsevier Inc. All rights reserved. * Corresponding author. Fax: +1 614 292 8454. E-mail address: [email protected] (P. Kuppusamy). NIH Public Access Author Manuscript J Magn Reson. Author manuscript; available in PMC 2008 May 5. Published in final edited form as: J Magn Reson. 2007 August ; 187(2): 277–287. doi:10.1016/j.jmr.2007.05.012. NIH-PA Author Manuscript NIH-PA Author Manuscript NIH-PA Author Manuscript

Welcome message from author
This document is posted to help you gain knowledge. Please leave a comment to let me know what you think about it! Share it to your friends and learn new things together.
Transcript

Uniform distribution of projection data for improvedreconstruction quality of 4D EPR imaging
Rizwan Ahmada,b, Deepti S. Vikrama, Bradley Clymerb,c, Lee C. Potterb, Yuanmu Denga,Parthasarathy Srinivasand, Jay L. Zweiera, and Periannan Kuppusamya,*aCenter for Biomedical EPR Spectroscopy and Imaging, Davis Heart and Lung Research Institute,Department of Internal Medicine, The Ohio State University, 420 West 12th Avenue, Room 114,Columbus, OH 43210, USAbDepartment of Electrical and Computer Engineering, The Ohio State University, Columbus, OH43210, USAcDepartment of Biomedical Engineering, The Ohio State University, Columbus, OH 43210, USAdMathematical Biosciences Institute, The Ohio State University, Columbus, OH 43210, USA
AbstractIn continuous wave (CW) electron paramagnetic resonance imaging (EPRI), high quality ofreconstruction in a limited acquisition time is a high priority. It has been shown for the case of 3DEPRI, that a uniform distribution of the projection data generally enhances reconstruction quality.In this work, we have suggested two data acquisition techniques for which the gradient orientationsare more evenly distributed over the 4D acquisition space as compared to the existing methods. Thefirst sampling technique is based on equal solid angle partitioning of 4D space, while the secondtechnique is based on Fekete points estimation in 4D to generate a more uniform distribution of data.After acquisition, filtered backprojection (FBP) is applied to carryout the reconstruction in a singlestage. The single-stage reconstruction improves the spatial resolution by eliminating the necessityof data interpolation in multi-stage reconstructions. For the proposed data distributions, thesimulations and experimental results indicate a higher fidelity to the true object configuration. Usingthe uniform distribution, we expect about 50% reduction in the acquisition time over the traditionalmethod of equal linear angle acquisition.
Keywords4D inverse Radon transform; Fekete points; Reconstruction artifacts; EPRI; Single-stagereconstruction
1. IntroductionElectron paramagnetic resonance imaging (EPRI) is a noninvasive technique that is capableof detecting and imaging free radicals [1]. Due to its ability for direct detection andcharacterization of both endogenous and introduced free radicals, EPRI has a distinct advantagein many biological applications [2-7]. However, the long acquisition time, especially for 4Dspectral-spatial imaging, can be a bottle-neck for many in vivo biological applications. It hasbeen shown for the 3D case [8] that uniformity of the data distribution can improve the
© 2007 Elsevier Inc. All rights reserved.*Corresponding author. Fax: +1 614 292 8454. E-mail address: [email protected] (P. Kuppusamy).
NIH Public AccessAuthor ManuscriptJ Magn Reson. Author manuscript; available in PMC 2008 May 5.
Published in final edited form as:J Magn Reson. 2007 August ; 187(2): 277–287. doi:10.1016/j.jmr.2007.05.012.
NIH
-PA Author Manuscript
NIH
-PA Author Manuscript
NIH
-PA Author Manuscript

reconstruction quality for a given acquisition time. In this work, we investigate uniform datadistributions and their impact on 4D spectral-spatial imaging.
Most of the EPR experiments are conducted in continuous wave (CW) domain since thetechnical challenges associated with the pulsed EPR [9] limit its broad use. In CW EPRI, thedata are acquired in the form of projections [10], and filtered backprojection (FBP) [11] orFourier-based direct reconstruction techniques [12] are commonly applied to reconstruct theimage from the acquired projections. The quality of the reconstructed image depends on anumber of factors including number of acquired projections, signal-to-noise ratio (SNR), fieldhomogeneity, linewidth of the paramagnetic species under study, and the reconstructiontechnique itself. Generally, the reconstruction quality can be improved by acquiring moreprojections. This, however, is not a viable solution because projection acquisition can be atime-consuming process [13]. Hence, increasing the number of acquired projections beyond acertain limit may not be practical, especially for in vivo biological applications. Hence, it ishighly desirable to improve the reconstruction quality from a limited number of projections.
The EPRI can be performed in purely spatial domain to obtain one-, two-, or three-dimensional(1D, 2D, or 3D) images of free radical distribution in objects. It is important to mention thatpurely spatial 3D EPRI provides unambiguous distribution of free radicals under theassumption that spectral shape is space-invariant. Thus, for samples having variable linewidthsor multiple radical species, it is not possible to obtain an accurate map of the spin distributionusing purely spatial EPRI. Besides, the information obtained by purely spatial EPRI is limitedto the spin density and not the nature of the spins at each spatial volume element (voxel). Toovercome this limitation an additional dimension, the spectral dimension, is required to capturethe spectral shape function at each voxel. The imaging technique that includes a spectraldimension along with one or more spatial dimensions is termed as spectral-spatial imaging[14]. While the spatial information is captured by collecting projections along differentorientations of the gradient vector, the spectral information is encoded by varying the gradientstrength. The spectral-spatial imaging can be performed in 1, 2 or 3 spatial dimensions givingrise to 2, 3, or 4D spectral-spatial images, respectively. While the information provided by theadditional spectral dimension is immensely useful in many biological applications, it requiresadditional hardware capability, manageable experimental conditions, and additionalacquisition time. The potential application of the spectral-spatial technique has been recognizedin performing EPRI oximetry [15] that is based on the effect of oxygen-induced broadeningof the lineshape.
It is beneficial to take advantage of any symmetry or redundancy in the object configurationto reduce the number of acquired projections. A few adaptive acquisition techniques have beenpresented [8,16] where a more informative set of projections is acquired. This strategy isadvantageous only where the object configuration is highly anisotropic in a way that theinformation depicted in a small number of projections is sufficient to reasonably characterizethe object configuration. In cases where the object does not possess any exploitableconfiguration or there is not enough information available about the object configuration, anuniform sampling of the data over the object space generates consistent results. Equal solidangle (ESA)-based sampling for 3D EPRI has been presented earlier [8] which results in anestimated reduction of 30% in the acquisition time over equal linear angle (ELA)-basedsampling. A further improvement in the reconstruction has been observed [17] by obtaining amore uniform distribution of the gradient.
Although ESA-based distribution designed for 3D has been applied to 4D imaging [18], theresulting distribution has an improved uniformity only in the 3D spatial domain and the overallsampling in 4D domain is still not uniform. In addition, since the set of selected gradientorientations is identical for each applied gradient strength, there is a high redundancy in the
Ahmad et al. Page 2
J Magn Reson. Author manuscript; available in PMC 2008 May 5.
NIH
-PA Author Manuscript
NIH
-PA Author Manuscript
NIH
-PA Author Manuscript

collected data. The first technique presented here is an extension of the 3D ESA-baseddistribution [19] while the second proposed technique is an estimation of Fekete points [20]in 4D which generally results in more uniform distribution of the data. We expect about 50%reduction in the acquisition time over ELA-based distribution and about 25% reduction overthe previously proposed sampling technique where ESA approximation holds only in the 3Dspatial domain [18]. Since the reconstruction is carried out in a single stage without thenecessity of interpolation, the spatial resolution does not degrade. The computation time,however, can be longer as compared to multistage reconstruction where nD EPR image isreconstructed through (n - 1) stages of 2D backprojection operations [21]. By limiting the sizeof the reconstructed image and by breaking the reconstruction into subsets, the processing timefor 4D single-stage reconstruction can be deemed manageable.
2. TheoryIn CW EPRI, a projection is generally acquired by measuring the absorption signal as a functionof magnetic field in the presence of a static gradient. The orientation of the acquired projectionis determined by the direction of the magnetic field gradient which is a vector sum of threeindependent and mutually orthogonal field gradients in the x, y, and z directions. In 4D, Radontransform [21] of an object f(x, y, z, s) is expressed as
(1)
where ρ defines the distance of a particular line of integration from the origin, θ represents thespectral angle defined by Eq. (2), angles ϕ (90° - elevation) and η (azimuth) define the 3Dspatial domain, and p(ρ, η, ϕ, θ) represents an acquired projection along the orientation definedby hyperspherical coordinates η, ϕ, and θ. The distribution of η, ϕ,and θ determines thedistribution of projection data in 4D space.
(2)
where G is the gradient strength, ΔL and ΔB are spatial field of view (FOV) and spectralwindow, respectively.
Once a sufficient number of projections are acquired, the image can be reconstructed by theFBP method which is based on the inverse Radon transform. The FBP method requires thatthe gradient orientations for the projection data are uniformly distributed over the acquisitionspace that, for 4D EPRI, is simply S3 which is defined as
(3)
where “·” represents inner product on .
If the projections are not uniformly distributed, an appropriate weighting can be used to satisfythe requirement of the FBP
Ahmad et al. Page 3
J Magn Reson. Author manuscript; available in PMC 2008 May 5.
NIH
-PA Author Manuscript
NIH
-PA Author Manuscript
NIH
-PA Author Manuscript

(4)
where pf represents filtered projection.
(5)
where IFT stands for the inverse Fourier transform, P represents the Fourier transform (FT) ofprojection p, and v represents radial distance from the origin of Fourier domain. See AppendixA for derivation of Eqs. (4) and (5). For a limited number of projections N, Eq. (4) can beapproximated numerically by selecting a suitable distribution of sampling points.
(6)
where wi the weight associated with the ith projection, and its value depends on the data
distribution. The error of approximation depends on the number of projections (N) andthe distribution of the projections. Generally, a projection distribution which is more uniformover the sphere (hypersphere) results in smaller approximation errors because there is aconnection between better uniformity of data distribution and more accurate integration [22].
2.1. Equal linear angle sampling in 4D (ELA4)In the traditional acquisition technique, the projection angles η, ϕ, and θ are sampled at aconstant interval as shown in Fig. 1a. The reconstruction from a limited number of suchprojections is described by Eq. (7).
(7)
where M is the number of projections corresponding to θ = 90°, ϕ = 90°. An equal incrementof η, ϕ, and θ results in a nonuniform distribution of the data over S3. The acquired data becomeshighly concentrated when ϕ or θ approaches 0° or 180°. The weighting term sin2(mΔθ) sin(nΔϕ) in Eq. (7) effectively compensates for the nonuniformity of the data, but neverthelessreduces the acquisition efficiency. In addition, the sampling of data on a rigid latitude-longitudegrid can lead to more pronounced reconstruction artifacts, because in such cases streak-artifactfrom various projections, if they get aligned to an edge of the object, may get addedconstructively.
Ahmad et al. Page 4
J Magn Reson. Author manuscript; available in PMC 2008 May 5.
NIH
-PA Author Manuscript
NIH
-PA Author Manuscript
NIH
-PA Author Manuscript
2.2. Equal solid angle sampling in spatial domain (ESA3)A distribution based on ESA approximation in S2, applied to S3, is shown in Fig. 1b. In the 3Dspatial domain, the solid angle associated with gradient orientation is proportional to ΔϕΔηsinϕ, and the ESA span [19] can be approximated by keeping Δϕ constant and incrementingΔη in proportion to 1/sinϕ. This way, the number of azimuth samples for each ϕ is determinedas
(8)
Therefore, as ϕ changes, the number of points also changes accordingly, which results in amore uniform distribution of the gradient directions over S2 representing the spatial domain.Consequently, for ESA3 Eq. (7) can be modified as
(9)
Since sin(nΔϕ)/Kn ≈ 1/M, it is evident from Eq. (9) that all the projections are weightedapproximately by sin2(mΔθ) instead of sin2(mΔθ) sin(nΔϕ) as was for ELA4. This weightingreflects a distribution that avoids nonuniformity around ϕ = 0° or ϕ = 180° but still suffers fromdata congestion around θ = 0° or θ = 180°. In other words, the data from the resulting samplingpattern is crowded for lower gradient strengths and sparse for higher gradient strengths. Thereconstruction results for 4D EPRI using ESA3 based distributions has been reported recently[18].
2.3. Equal solid angle sampling in 4D (ESA4)In S3, the solid angle associated with the gradient orientation is proportional to ΔθΔϕΔηsin2θ sinϕ which can be computed from the Jacobian of the transformation (betweenhyperspherical and Cartesian coordinate systems) equations. The equal solid angle span forS3 can be approximated by keeping Δθ constant and incrementing Δϕ in proportion to 1/sinθand incrementing Δη in proportion to 1/(sin θ sinϕ). This way, the number of samples alongϕ and η are, respectively, determined as
(10)
(11)
where ϕj = j(180°/Jm). The reconstruction from 4D equal solid angle acquisition is representedas
Ahmad et al. Page 5
J Magn Reson. Author manuscript; available in PMC 2008 May 5.
NIH
-PA Author Manuscript
NIH
-PA Author Manuscript
NIH
-PA Author Manuscript

(12)
This distribution avoids concentrating data when ϕ or θ approaches 0° or 180° and henceimproves the overall uniformity of data in S3. A distribution based on ESA4 in shown in Fig.1c.
Since projections corresponding to higher gradient have lower SNR, it is a common practiceto spend more acquisition time for those projections to partially improve their SNR. If theacquisition time of a projection is made proportional to 1/cosθ, the additional percentagereduction R in the acquisition time associated with ESA4 is
(13)
where
(14)
The value of R for M = 18 (with missing angle region 85°-95°) is 23% and for M = 10 (withmissing angle of 81°-99°) is 26%. These savings are in addition to the 30% savings offered byESA3 method [18]. As a result, net savings offered by ESA4 over ELA4 for M = 18 and M =10 are 46% and 48%, respectively.
2.4. Uniform sampling based in Fekete points in 4D (UF4)The problem of uniformly distributing a large number of points over S2 has been studiedextensively [20,23-25]. Several studies have suggested methods for efficient powder averaging[26] where a discrete set of crystallite orientations are used to simulate the NMR spectra. Baket al. [27] has numerically analyzed the performances of various powder averaging methodsto compare their insensitivities to the orientation of the object from which the spectra isobserved and reported that the performance of so called REPULSION technique, which issimilar to the one presented here, is on par or superior to the other popular techniques. Moreimportantly, most of these other methods are only valid for S2 and their extension to S3 is notobvious, which is also the case for the distribution based on two successive Fibonacci numbers,whose feasibility for 3D spatial EPRI has been recently reported [17]. In recent years, sphericaldesigns [28] have received a great deal of attention because they generate optimal distributions(in terms of zero integration error) for any integrand that can be approximated by a polynomialof limited degree. For EPRI, however, a direct application of most of these methods isprohibited since they do not offer the flexibility to account for additional restrictions such asantipodal symmetry, missing angle regions, and a large number of data points to be distributed.Another popular way to generate uniform distributions is via optimization with respect to a
Ahmad et al. Page 6
J Magn Reson. Author manuscript; available in PMC 2008 May 5.
NIH
-PA Author Manuscript
NIH
-PA Author Manuscript
NIH
-PA Author Manuscript

suitable criterion such as generalized energy [29], and the bounds on the correspondingseparation radius, star discrepancy [30], and integration error have also been reported [31,32]. The main advantage of this approach for 4D spectral-spatial EPRI is its ability toaccommodate the above mentioned EPRI related constraints. The energy U for a distributionx1, x2, ...,xN is defined as
(15)
The objective to find ωN that denotes a generic subset of S2 (or S3 in our case) with N elements for which energy U is minimized. For t = 1, this represents the electrostatic
potential energy of N charged particles that repel each other according to the Coulomb’s law.Such points are called Fekete points. Extensive computations for optimal configurations andtheir corresponding extremal energies have been reported in a number of articles. Most dealwith the Coulomb case (t = 1) [33,34]. It has been observed that for a large N there are manylocal minima in the energy minimization problem. Further, these local minima have energiesvery close to the global minimum, which makes it very difficult to determine the preciseminimum.
In this work, the Fekete points over S3 were estimated using gradient descent. The basic ideacomes from electrostatics, which dictates how the charged particles over the surface of a sphere(hypersphere) can move to reach a configuration ωN with minimum potential energy (or veryclose to it) along with static stable equilibrium. The repulsive force F, which is the negativeof the potential gradient (-∇U) is calculated on each particle due to the influence of the rest. Inevery iteration, particles are moved in the direction d to reduce the net U of the system.
(16)
(17)
where is the tangential component of force acting on the ith particle due to the rest of theparticles, and β is a constant controlling the amount of displacement for the particles. Theantipodal symmetry introduced in the initialization was kept intact during the gradient descentby tying the antipodal points together and moving them in pairs. A distribution based on UF4in shown in Fig. 1d.
After accounting for the EPRI related constraints, the energy U and the standard deviation ofthe Voronoi cell size [35] are calculated for all four sampling patterns and are shown in Fig.2. The computation of Voronoi cells, also used to assign relative weight to each projectionbefore applying the FBP, over S3 is similar to a previously reported procedure for S2 [17].
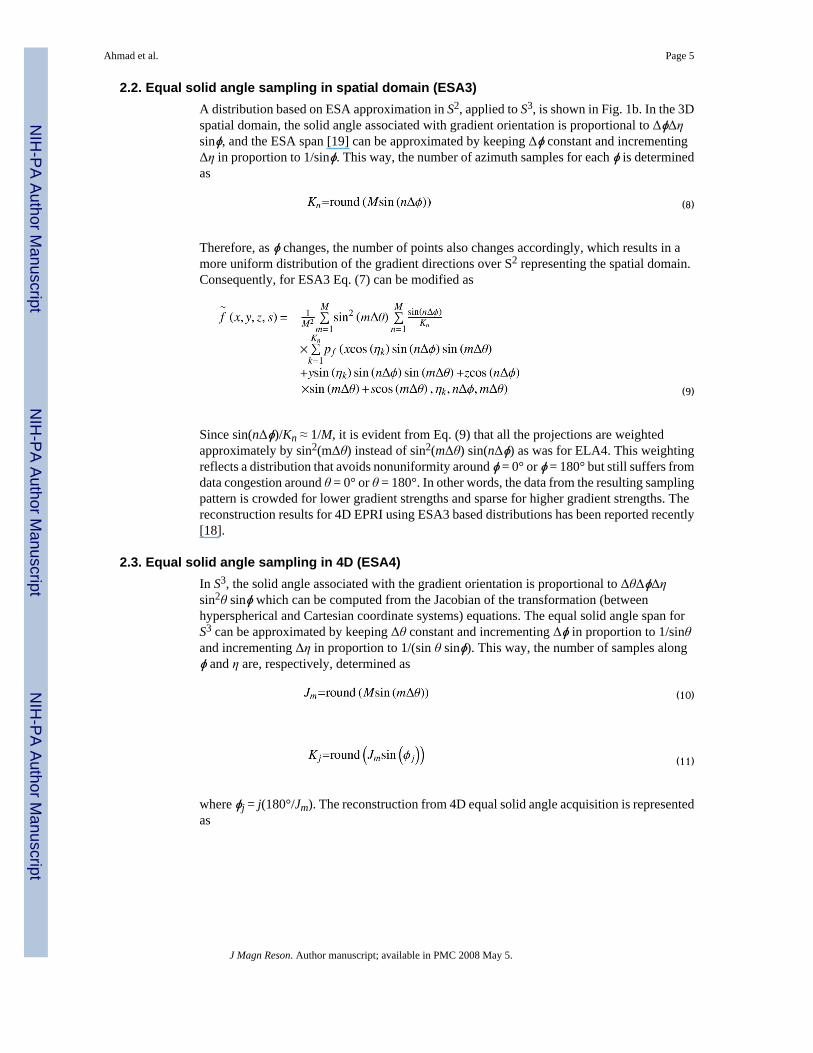
2.5. Missing angle problem and single-stage reconstructionFor spectral-spatial imaging, θ = 90° corresponds to acquiring projection data at an infinitemagnetic field gradient strength. Since hardware limitations and SNR put a restriction on themaximum applicable gradient, the projection data corresponding to higher gradients cannot beacquired. If θm is the missing angle
Ahmad et al. Page 7
J Magn Reson. Author manuscript; available in PMC 2008 May 5.
NIH
-PA Author Manuscript
NIH
-PA Author Manuscript
NIH
-PA Author Manuscript
(18)
(19)
where θG is the spectral angle associated with the maximum applicable gradient strengthGmax and θmax is the spectral angle corresponding the maximum gradient reached by a samplingmethod.
This problem is generally termed as “missing angle tomography.” Although there arealternative reconstruction techniques [36] that can handle this problem seamlessly, thecomputation cost associated with such techniques especially for 4D render them impractical.For FBP, a few techniques such as projection-reprojection [37] have been proposed to handlethis problem. Therefore, one simple solution would be to estimate the Fekete distribution overS3, remove the data points appearing in the “forbidden” region, and perform the reconstructionusing projection-reprojection. The resulting reconstruction, however, yields poor resolutionsince there are an insufficient number of high gradient projections that are vital for thereconstruction quality.
In this work, the missing angle problem is tackled by introducing a slight discrepancy in thedistribution of data along the spectral angle. For all methods except UF4, the spectral anglesampling interval Δθ is chosen such that the missing angle region around θ = 90° is avoidedaltogether. On the other hand, for UF4, where there is no fixed sampling interval, thediscrepancy is only locally introduced during the iterative process to generate Fekete points.In each iteration, points appearing in the region θmax ± θm are set equal to θmax, and pointsappearing in the region 180° - θmax ± θm are set equal to 180° - θmax. Although the introduceddiscrepancy may degrade the reconstruction quality, our experience with the simulation datashows that this technique is considerable superior to the projection-reprojection techniquebecause in this case we have a large number of projections acquired at the maximum gradientstrength. Further, for UF4 the loss of reconstruction quality due to the adjustments made in thedata distribution is far less pronounced than it is for ELA4, ESA3, or ESA4. This is becausethe adjustments for UF4 are restricted to the 90° ± 2θm region, while for ELA4, ESA3, andESA4 the effect of the adjustment made to tackle the missing angle problem trickle down theentire distribution. More importantly, for ELA4, ESA3, and ESA4, the calculated step sizeΔθ for a given number of projections may be considerably greater than 2θm. Therefore, theresulting θmax = θG - (Δθ/2 - θm) can be considerably lesser than θG, which would expand themissing angle region beyond the limits imposed by the hardware or SNR. For UF4, the equalityθmax = θG can be attained for any number of projections.
All calculations were performed using Matlab 7.0 (MathWorks, Massachusetts) on a PentiumIV computer equipped with 1 GB RAM and 3.2 GHz of clock speed. For a 64 × 64 × 64 × 64reconstruction from 1000 projections, with each projection having a size of 95 points, theapproximate computation times are: Radon transform: 18 min, inverse Radon transform: 82min, and nonlinear least-square fitting at each voxel using Matlab command lsqnonlin: 90 ms.The projection acquisition process was carried out in multiple stages using partial Radontransform [38] to reduce the computation time. For single-stage reconstruction, four matricesX, Y, Z, and S, each of size 64 × 64 × 64 × 64 were generated and plugged in the reconstruction
equation to directly calculate . The large sizes of the matrices posed a seriouslimitation on the computer memory. To avoid this problem each of the four matrices were
Ahmad et al. Page 8
J Magn Reson. Author manuscript; available in PMC 2008 May 5.
NIH
-PA Author Manuscript
NIH
-PA Author Manuscript
NIH
-PA Author Manuscript

divided into two halves The resulting 16 subsets of the reconstruction space were reconstructedone by one and then put together to generate the final image without scarifying anyreconstruction quality. Since both the FBP and curve-fitting are easy to parallelize, usingmultiple processor nodes to further speed up the reconstruction is a viable option.
3. Results3.1. Simulations
To demonstrate the performance of 4D uniform sampling, the reconstruction results from thefour acquisition techniques are compared using a digital phantom of size 64 × 64 × 64 × 64.The phantom consists of four rows and four columns of cylindrical tubes as shown in Fig. 3a.Two different intensities and linewidths are used in the phantom. The outer 12 tubes simulatea normalized intensity of 1 and a peak-to-peak linewidth of 0.27 G while the central 4 tubessimulate a normalized intensity of 0.7 and a peak-to-peak linewidth of 0.18 G. The imagingparameters, chosen to simulate EPRI experiments at L-band (1.2 GHz), were as follows: spatialFOV ΔL: sphere inscribed in 2 × 2 × 2 cm3 cube, spectral window ΔB: 2.5 G, data points perprojection: 95, maximum gradient strength: 12 G/cm (θG = 84°), scan speed: 1.85 G/s. Topartially suppress noise at high gradient strengths, acquisition time for each projection wasmade proportional to ΔB/cosθ. After partial suppression, the additive noise was assumed to bewhite Gaussian with intensity proportional to 1/cosθ. The SNR, defined as the ratio of peaksignal amplitude (for the projection with minimum peak-to-peak amplitude) and standarddeviation of the additive white noise, was 30. The total number of projections and thecorresponding acquisition time for each sampling technique is given in Table 1. Fig. 3 showsthe reconstructed images from the four sampling techniques.
3.2. EPRI experimentAn experimental phantom as shown in Fig. 4 was constructed using eighteen 100 μL capillarytubes. The capillary tubes were arranged in three columns with each column containing sixcapillaries. Two different triarylmethyl free radical (TAM) probes were used. TAM in aqueoussolution exhibits a single narrow EPR spectrum which is suitable for imaging purposes. Twelvecapillaries, constituting the 1st and 3rd columns, were filled with 2 mM Ox063 (methyl-tris[8-carboxy-2,2,6,6-tetrakis[2-hydroxy-ethyl]benzo[1,2-d;4,5-d’]bis[1,3]dithiol-4-yl]-, trisodiumsalt, MW 1427) while six capillaries in the middle column were filled with 1 mM Ox031(methyl-tris[8-carboxy-2,2,6,6-tet-rakis[(2-hydroxyethoxy)methyl]benzo[1,2-d:4,5-d’]bis[1,3]-dithiol-4-yl]-, trisodium salt, MW 1787.1) up to a height of 10 mm. For Ox063 andOx031, the respective room air peak-to-peak linewidths, measured at X-band, were 0.25 and0.18 G while the signal intensities were approximately 3:2. The overall sample dimensionswere 10.2 × 10 × 5.2 mm3.
The phantom was imaged using an L-Band (1.2 GHz) EPRI system with a reentrant resonatorwith cylindrical sample volume with a diameter of 12.6 mm and useable height of 12 mm. Thespectrometer settings were: incident microwave power: 4 mW, spectral window ΔB: 1.8 G,spatial FOV ΔL: sphere inscribed by 1.8 × 1.8 × 1.8 cm3 cube, modulation amplitude: 70 mG,maximum gradient strength: 10 G/cm (θG = 84.3°), time constant of lock-in amplifier: 20 ms.A total of four datasets (one for each sampling method) were acquired. The number ofprojections and the acquisition time for each dataset are reported in Table 1. For each projection1024 data points were collected which were later downsampled to 95 for faster reconstruction.No correction for B1 field inhomogeneities was applied. To suppress noise for high gradientprojections, the acquisition time for each projection was made proportional to ΔB/cosθ whichimplies that the scan speed across all projections was kept constant at 1.38 G/s. The measuredSNR was 12. The measured lineshapes for both Ox031 and Ox063 were reasonable
Ahmad et al. Page 9
J Magn Reson. Author manuscript; available in PMC 2008 May 5.
NIH
-PA Author Manuscript
NIH
-PA Author Manuscript
NIH
-PA Author Manuscript

approximations of a Lorentzian function with fit error <7%. Fig. 5 displays the reconstructedimages from the four acquisition techniques.
4. DiscussionThe simulation and experimental results suggest that the distribution of projection datacontributes to the reconstruction quality. The distributions which are more uniform tend tocapture more distinct information in each projection which results in high fidelity images thatpossess more information about the object. ELA4 and ESA3-based distributions repeat thesame spatial distribution of gradient directions for each spectral angle which results in enhancedredundancy in the acquired data. In addition, if any edge of the object gets aligned with thesampling pattern, the streak-artifact from the edge may get added constructively that canconsequently degrade the image quality.
Fig. 2a displays the standard deviation of the Voronoi cell size for the four distributions withUF4 exhibiting considerably lower variations in the Voronoi cell size which is also used tofind proper weighting for the acquired projections before performing the FBP. The energy Uassociated with the distributions is displayed in Fig. 2b. Among all the distributions, UF4 andELA4 possess the minimum and maximum value of U, respectively.
The simulation results are presented in Fig. 3. The quantification of the results is provided inTable 2. Since the FBP-based reconstruction from a limited number of projections generatestrong background artifacts, the voxels reflecting a spin density (obtained by integration of 4Dobject along spectral axis) less than 25% of the maximum spin density were set to zero to makefor a better 3D visualization. However, caution should be observed in applications where voxelswith weak and strong spin densities coexist in a single object because discarding the part ofsuch an object based on the intensity may result in loss of important information. To quantifythe linewidth, data at each voxel were fit with a Lorentzian function with allowable linewidthof 0.7LWmin to 1.3LWmax. Here, LWmin and LWmax are the minimum and maximum line-widths, respectively, present in the sample. The quantification of spin densities and linewidthswas done for all the voxels where spin density of the input phantom was nonzero. For bettervisualization of the parameters, input and reconstructed images were cropped 33% along theaxis of tubes.
For ELA4 and ESA3, a fixed sampling interval along θ, which is decided by the total numberof projections to be acquired, restricts us from applying the maximum permissible gradient,which translates to a lower resolution. It is this inability of ELA4 and ESA3 to utilize themaximum gradient allowed by the hardware along with the relatively lesser number of highgradient projections that has resulted in extremely poor resolution for objects with fine spatialstructures like the ones used in this work. For the simulation results shown in Fig. 3, value ofθmax and the corresponding number of projections are given in Table 1. Further, since thedistribution of the data is structured, the reconstruction is sensitive to the alignment of thesampling grid and the distribution of information content. Therefore, the reconstruction maypossess an orientational bias, and rotating the object for a given sampling may change thereconstruction quality considerably [17]. As a result, the reconstruction quality may vary withthe number of acquired projections, configuration of the object to be imaged, and the orientationof the sampling grid relative to the phantom. On the other hand, the improved uniformity ofESA4 and especially of UF4 ensures that the results are relatively insensitive to the objectcontent [27]. By our simulation experience (results not shown), we have further observed thatfor objects which lack fine structure, the difference in the reconstruction quality of uniformand non-uniform sampling patterns may not be that drastic because high gradient data may notcarry same importance for such objects. Finally, for UF4 it is possible to acquire any numberof projections, while for other three methods there are only discrete values that can be acquired.
Ahmad et al. Page 10
J Magn Reson. Author manuscript; available in PMC 2008 May 5.
NIH
-PA Author Manuscript
NIH
-PA Author Manuscript
NIH
-PA Author Manuscript

The experimental results provided in Fig. 5 and Table 2 are consistent with the simulationfindings. Since ESA4 seems to resolve all the 18 tubes, the nonzero voxels in ESA4 basedreconstruction are used to define the true spatial structure of the phantom. Hence for quantifyingthe reconstruction results of all the four sampling patterns, the spin densities and linewidthsonly at these nonzero voxels are taken into consideration.
5. ConclusionsThe uniform coverage of 4D space is important for an improved reconstruction quality. A poorapproximation of the uniform distribution, on the other hand, may result in pronounced artifactsin the reconstructed image which can degrade the reconstruction quality to an unacceptablelevel. Although data distribution based on ESA3 provides an improvement over ELA4, it isstill not uniform in the 4D acquisition space. The distributions based on ESA4 and especiallyUF4 provide a tangible improvement over ELA4 and ESA3. Besides, by breaking down thereconstruction into subsets, single-stage reconstruction can be realized without specialcomputing resources. Since computation time for the single-stage backprojection iscomparable to the acquisition time, real time reconstruction is also feasible.
AcknowledgmentsThis work was supported by NIH Grant EB005004.
Appendix A
A.1. Fourier Slice Theorem in 4DIf
(A1)
for a 4D object , the Fourier transform can be written as
(A2)
where is the inner product of the two vectors. If v represents the radial distance from the
center of and ρ defines the distance in of a particular line of integration from the originthen for a line
Ahmad et al. Page 11
J Magn Reson. Author manuscript; available in PMC 2008 May 5.
NIH
-PA Author Manuscript
NIH
-PA Author Manuscript
NIH
-PA Author Manuscript
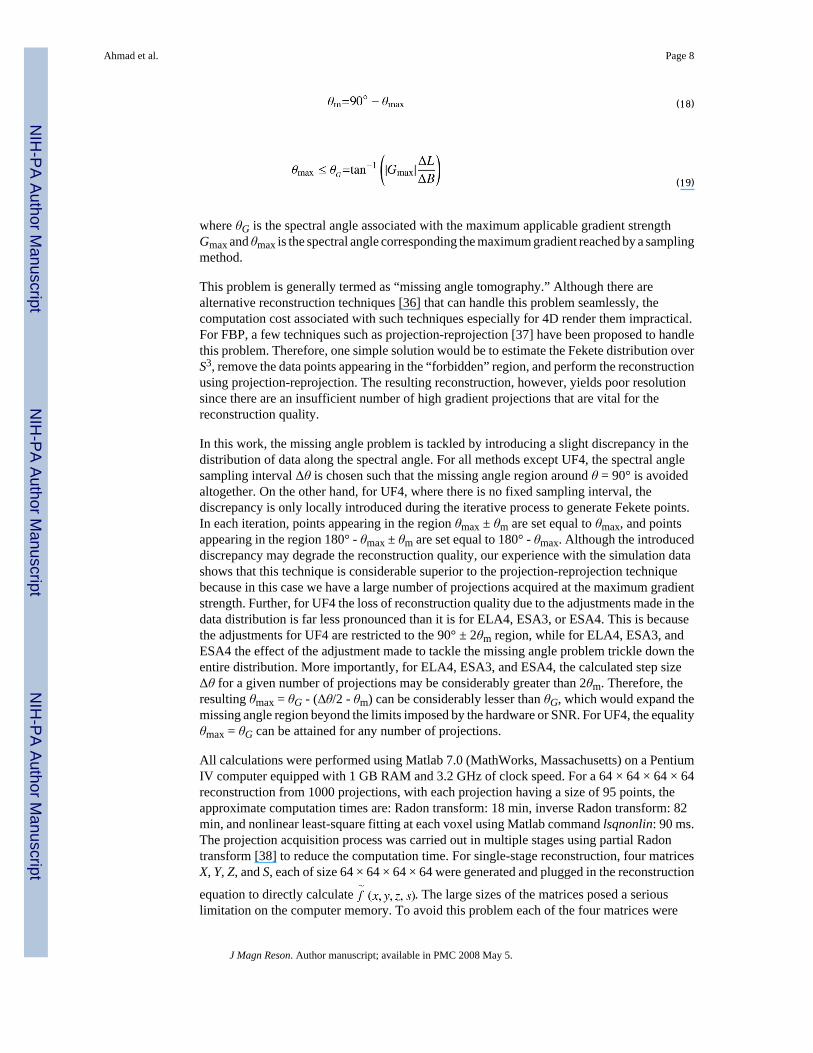
(A3)
(A4)
A.2. Filtered backprojection in 4DInverse Fourier transform in 4D
(A5)
which can be also written in hyperspherical coordinate system that can be easily computedfrom the determinant of the Jacobian matrix ∂(kx, ky, kz, ks)/∂(ν, η, ϕ, θ)
(A6)
which after some manipulation can be written as
(A7)
Therefore,
Ahmad et al. Page 12
J Magn Reson. Author manuscript; available in PMC 2008 May 5.
NIH
-PA Author Manuscript
NIH
-PA Author Manuscript
NIH
-PA Author Manuscript

(A8)
From Eqs. (A4) and (A8)
(A9)
(A10)
or equivalently,
(A11)
References[1]. Ferrari M, Quaresima V, Sotgiu A. Present status of electron paramagnetic resonance (EPR)
spectroscopy/imaging for free radical detection. Pflugers Arch 1996;431:R267–R268. [PubMed:8739367]
[2]. Fujii H, Berliner LJ. One- and two-dimensional EPR imaging studies on phantoms and plantspecimens. Magn. Reson. Med 1985;2:275–282. [PubMed: 3007920]
[3]. Fuchs J, Freisleben HJ, Groth N, Herrling T, Zimmer G, Milbradt R, Packer L. One- and two-dimensional electron paramagnetic resonance imaging in skin. Free Radic. Res. Commun1991;15:245–253. [PubMed: 1666622]
[4]. Kuppusamy P. EPR spectroscopy in biology and medicine. Antioxid. Redox Signal 2004;6:583–585.[PubMed: 15130284]
[5]. Matsumoto A, Matsumoto S, Sowers AL, Koscielniak JW, Trigg NJ, Kuppusamy P, Mitchell JB,Subramanian S, Krishna MC, Matsumoto K. Absolute oxygen tension (pO(2)) in murine fatty andmuscle tissue as determined by EPR. Magn. Reson. Med 2005;54:1530–1535. [PubMed: 16276490]
[6]. Rolett EL, Azzawi A, Liu KJ, Yongbi MN, Swartz HM, Dunn JF. Critical oxygen tension in rat braina combined (31)P-NMR and EPR oximetry study. Am. J. Physiol. Regul. Integr. Comp. Physiol2000;279:R9–R16. [PubMed: 10896858]
Ahmad et al. Page 13
J Magn Reson. Author manuscript; available in PMC 2008 May 5.
NIH
-PA Author Manuscript
NIH
-PA Author Manuscript
NIH
-PA Author Manuscript

[7]. Williams BB, al Hallaq H, Chandramouli GV, Barth ED, Rivers JN, Lewis M, Galtsev VE, KarczmarGS, Halpern HJ. Imaging spin probe distribution in the tumor of a living mouse with 250 MHzEPR: correlation with BOLD MRI. Magn. Reson. Med 2002;47:634–638. [PubMed: 11948723]
[8]. Deng Y, Kuppusamy P, Zweier JL. Progressive EPR imaging with adaptive projection acquisition.J. Magn. Reson 2005;174:177–187. [PubMed: 15862233]
[9]. Bourg J, Krishna MC, Mitchell JB, Tschudin RG, Pohida TJ, Friauf WS, Smith PD, Metcalfe J,Harrington F, Subramanian S. Radiofrequency FT EPR spectroscopy and imaging. J. Magn. Reson.B 1993;102:112–115.
[10]. Deans, SR. The Radon Transform and Some of its Applications. Wiley; New York: 1983.[11]. Shepp LA, Logan BF. The Fourier reconstruction of a head section. IEEE Trans. Nucl. Sci
1974;21:21–42.[12]. Cho, ZH.; Jones, JP.; Singh, M. Foundations of Medical Imaging. Wiley; New York: 1993.[13]. Kuppusamy P, Chzhan M, Zweier JL. Development and optimization of three-dimensional spatial
EPR imaging for biological organs and tissues. J. Magn. Reson. B 1995;106:122–130. [PubMed:7850182]
[14]. Maltempo SS, Eaton SS, Eaton GR. Spectral-spatial two-dimensional EPR imaging. J. Magn. Reson1987;72:449–455.
[15]. Kuppusamy P, Shankar RA, Zweier JL. In vivo measurement of arterial and venous oxygenationin the rat using 3D spectral-spatial electron paramagnetic resonance imaging. Phys. Med. Biol1998;43:1837–1844. [PubMed: 9703045]
[16]. Placidi G, Alecci M, Sotgiu A. Theory of adaptive acquisition method for image reconstructionfrom projections and application to EPR imaging. J. Magn. Reson 1995;108:55–57.
[17]. Ahmad R, Deng Y, Vikram DS, Clymer B, Srinivasan P, Zweier JL, Kuppusamy P. Quasi MonteCarlo-based isotropic distribution of gradient directions for improved reconstruction quality of 3DEPR imaging. J. Magn. Reson 2007;184:236–245. [PubMed: 17095271]
[18]. Ahn KH, Halpern HJ. Spatially uniform sampling in 4-D EPR spectral-spatial imaging. J. Magn.Reson. 2006
[19]. Lai CM, Lauterbur PC. A gradient control device for complete three-dimensional nuclear magneticresonance zeugmatographic imaging. J. Phys. E: Sci. Instrum 1980;13
[20]. Saff EB, Kuijlaars AB. Distributing many points on a sphere. Math. Intelligencer 1997;10:5–11.[21]. Kuppusamy P, Chzhan M, Samouilov A, Wang P, Zweier JL. Mapping the spin-density and
lineshape distribution of free radicals using 4D spectral-spatial EPR imaging. J. Magn. Reson. B1995;107:116–125. [PubMed: 7599947]
[22]. Hlawka E. Funktionen von beschränkter Variation in der Theorie der Gleichverteilung. Annali diMatematica Pura ed Applicata 1961;54:325–333.
[23]. Morris JR, Deaven DM, Ho KM. Genetic-algorithm energy minimization for point charge on asphere. Phys. Rev. B 1996;53
[24]. Katanforoush A, Shahshahani M. Distributing Points on the Sphere. I. Exp. Math 2003;12:199–209.
[25]. Hannay JH, Nye JF. Fibonacci numerical integration on a sphere. J. Phys. A: Math. Gen2004;37:11591–11601.
[26]. Alderman DW, Solum MS, Grant DM. Methods for analyzing spectroscopic line shapes. NMR solidpowder patterns. J. Chem. Phys 1986;84:3717–3725.
[27]. Bak M, Nielsen NC. REPULSION, a novel approach to efficient powder averaging in solid-stateNMR. J. Magn. Reson 1997;125:132–139. [PubMed: 9245368]
[28]. Hardin RH, Sloane NJA. New spherical 4-designs. Discrete Math 1992;106/107:255–264.[29]. Rakhmanov EA, Saff EB, Zhou YM. Minimal discrete energy on the sphere. Math. Res. Lett
1994;1:647–662.[30]. Shirley, P. Proc. Eurographics. Vol. 91. North-Holland: 1991. Discrepancy as a quality measure for
sample distributions; p. 183-193.[31]. Damelin SB, Grabner PJ. Energy functionals numerical integration and asymptotic equidistribution
on the sphere. J. Complexity 2003;19:231–246.
Ahmad et al. Page 14
J Magn Reson. Author manuscript; available in PMC 2008 May 5.
NIH
-PA Author Manuscript
NIH
-PA Author Manuscript
NIH
-PA Author Manuscript

[32]. Damelin SB, Maymeskul V. On point energies separation radius and mesh norm for s-extremalconfigurations on compact sets in Rn. J. Complexity 2005;21:845–863.
[33]. Erber T, Hockney GM. Equilibrium configurations of N equal charges on a sphere. J. Phys. A: Math.Gen 1991;24:L1369–L1377.
[34]. Glasser L, Every AG. Energies and spacings of point charges on a sphere. J. Phys. A: Math. Gen1992;25:2473–2482.
[35]. Na HS, Lee CN, Cheong O. Voronoi diagrams on the sphere. Comput. Geom.: Theory Appl2002;23:183–194.
[36]. Tseitlin M, Dhami A, Eaton SS, Eaton GR. Comparison of maximum entropy and filtered back-projection methods to reconstruct rapid-scan EPR images. J. Magn. Reson 2007;184:157–168.[PubMed: 17070083]
[37]. Stillman AE, Levin DN. Back projection reconstruction of spectroscopic NMR images fromincomplete sets of projections. J. Magn. Reson 1986;69:168–175.
[38]. Zhi-Pei L, Munson DCJ. Partial Radon transforms. IEEE Trans. Imag. Proc 1997;6:1467–1469.
Ahmad et al. Page 15
J Magn Reson. Author manuscript; available in PMC 2008 May 5.
NIH
-PA Author Manuscript
NIH
-PA Author Manuscript
NIH
-PA Author Manuscript

Fig. 1.The distribution of data points in 4D spectral-spatial domain. The dots locations on the sphererepresent the gradient orientation in the spatial domain while the color represents the spectralangle. (a) Thousand data points (along with the antipodal points) generated using equal linearangle (ELA4) acquisition. Here, Δθ = Δϕ = Δη=18°. (b) Eleven hundred fifty-two data pointsgenerated using equal solid angle in 3D (ESA3). Here, Δθ = Δϕ=15°, and Δη is varied inproportion to 1/sinϕ. (c) Six hundred sixty-four data points generated by equal solid angle in4D (ESA4). Here, Δθ = 12.8°, Δϕ is varied in proportion to 1/sinθ and Δη is 1/(sin ϕ sinθ). (d)Six hundred five data points with the uniform distribution defined by Fekete points (UF4). ForELA4 and ESA3, since the data distribution over spatial domain (defined by η and ϕ) isreplicated for all selected values of θ, the dots of different colors overlap at each spatial location.Therefore, only red dots are visible for (a) and (b). For ESA4 shown in (c), the data distributions
Ahmad et al. Page 16
J Magn Reson. Author manuscript; available in PMC 2008 May 5.
NIH
-PA Author Manuscript
NIH
-PA Author Manuscript
NIH
-PA Author Manuscript

over spatial domain for mΔθ and 180° - mΔθ are identical. Therefore, the data residing onlyin the second half of θ are visible. (For interpretation of the references in color in this figurelegend, the reader is referred to the web version of this article.)
Ahmad et al. Page 17
J Magn Reson. Author manuscript; available in PMC 2008 May 5.
NIH
-PA Author Manuscript
NIH
-PA Author Manuscript
NIH
-PA Author Manuscript

Fig. 2.(a) Standard deviation of the Voronoi cell size drawn on the surface of S3 for different numberof data points. (b) Extremal energy U for various distributions.
Ahmad et al. Page 18
J Magn Reson. Author manuscript; available in PMC 2008 May 5.
NIH
-PA Author Manuscript
NIH
-PA Author Manuscript
NIH
-PA Author Manuscript

Fig. 3.Simulation results displaying the reconstructions based on the different sampling patterns. Thefirst column represents spin density (obtained by integrating the 4D object along the spectralaxis) while the second column represents peak-to-peak linewidth at each spatial location givenin the first column. (a) A simulated phantom consisting of 16 tubes with two differentlinewidths and spin densities. The normalized spin densities for outer 12 and inner 4 tubes are1.0 and 0.7, respectively, and the linewidths for outer 12 and inner 4 tubes are 0.27 and 0.18G, respectively. (b) Reconstruction based on 1000 projections collected by ELA4. (c)Reconstruction based on 948 projections collected by ESA3. (d) Reconstruction from 664projections acquired using ESA4. (e) Reconstruction from 605 projections acquired using UF4.
Ahmad et al. Page 19
J Magn Reson. Author manuscript; available in PMC 2008 May 5.
NIH
-PA Author Manuscript
NIH
-PA Author Manuscript
NIH
-PA Author Manuscript

Fig. 4.The phantom used to obtain the experimental data. There are a total of 18 capillaries arrangedon a 6 × 3 grid. True normalized spin densities for two outer columns (1st and 3rd) and middlecolumn (2nd) are 1.0 and 0.67, respectively, and the linewidths for two outer columns (1st and3rd) and middle column (2nd) are 0.25 and 0.18 G, respectively.
Ahmad et al. Page 20
J Magn Reson. Author manuscript; available in PMC 2008 May 5.
NIH
-PA Author Manuscript
NIH
-PA Author Manuscript
NIH
-PA Author Manuscript

Fig. 5.Experimental results displaying the reconstructions based on the different sampling patterns.The first column represents spin density (obtained by integrating the 4D object along thespectral axis) while the second column represents peak-to-peak linewidth at each spatiallocation given in the first column. (a) Reconstruction based on 1728 projections collected byELA4. (b) Reconstructed based on 1512 projections collected by ESA3. (c) Reconstructionfrom 1036 projections acquired using ESA4. (d) Reconstruction from 1000 projectionsacquired using UF4.
Ahmad et al. Page 21
J Magn Reson. Author manuscript; available in PMC 2008 May 5.
NIH
-PA Author Manuscript
NIH
-PA Author Manuscript
NIH
-PA Author Manuscript

NIH
-PA Author Manuscript
NIH
-PA Author Manuscript
NIH
-PA Author Manuscript
Ahmad et al. Page 22
Table 1
Number of projections for each acquisition technique and corresponding acquisition time for the simulation andexperimental data
ELA4 ESA3 ESA4 UF4
SimulationNumber of projections 1000 948 664 605θmax 81° 82.4° 82.5° 84°Number of projections corresponding to θmax 188 158 219 162Acquisition time (min) 84 85 83 84ExperimentNumber of projections 1728 1512 1036 1000θmax 82.5° 82.5° 83.6° 84.3°Number of projections corresponding to θmax 288 252 290 259Acquisition time (min) 190 175 175 160
Here, θmax is the maximum gradient angle achieved by the sampling pattern.
J Magn Reson. Author manuscript; available in PMC 2008 May 5.

NIH
-PA Author Manuscript
NIH
-PA Author Manuscript
NIH
-PA Author Manuscript
Ahmad et al. Page 23Ta
ble
2
Qua
ntifi
catio
n of
sim
ulat
ion
and
expe
rimen
tal r
esul
ts
EL
A4
ESA
3E
SA4
UF4
Sim
ulat
ion
Mea
n in
tens
ity o
f out
er 1
2 tu
bes
0.78
9 (±
0.16
2)0.
791
(±0.
099)
1.00
0 (±
0.22
9)1.
000
(±0.
223)
Mea
n in
tens
ity o
f inn
er 4
tube
s1.
000
(±0.
220)
1.00
0 (±
0.05
0)0.
740
(±0.
130)
0.70
4 (±
0.13
2)M
ean
linew
idth
of o
uter
12
tube
s0.
126
(±0.
011)
0.11
3 (±
0.00
2)0.
229
(±0.
045)
0.28
4 (±
0.03
8)M
ean
linew
idth
of i
nner
4 tu
bes
0.11
3 (±
0.00
0)0.
112
(±0.
000)
0.15
2 (±
0.01
8)0.
201
(±0.
024)
Expe
rim
ent
Mea
n in
tens
ity o
f 1st
and
3rd
colu
mn
1.00
0 (±
0.28
4)1.
000
(±0.
202)
1.00
0 (±
0.27
9)1.
000
(±0.
261)
Mea
n in
tens
ity o
f 2nd
col
umn
0.69
4 (±
0.18
7)0.
948
(±0.
156)
0.77
4 (±
0.17
8)0.
704
(±0.
154)
Mea
n lin
ewid
th 1
st a
nd 3
rd c
olum
n0.
163
(±0.
017)
0.11
4 (±
0.00
2)0.
243
(±0.
032)
0.25
7 (±
0.03
3)M
ean
linew
idth
of 2
nd c
olum
n0.
125
(±0.
008)
0.11
3 (±
0.00
0)0.
234
(±0.
038)
0.20
7 (±
0.03
4)
For s
imul
atio
ns, t
rue
norm
aliz
ed sp
in d
ensi
ties f
or o
uter
12
and
inne
r 4 tu
bes a
re 1
.0 a
nd 0
.7, r
espe
ctiv
ely,
and
the
true
linew
idth
s for
out
er 1
2 an
d in
ner 4
tube
s are
0.2
7 an
d 0.
18 G
, res
pect
ivel
y.Fo
r exp
erim
enta
l dat
a, tr
ue n
orm
aliz
ed sp
in d
ensi
ties f
or tw
o ou
ter c
olum
ns (1
st a
nd 3
rd) a
nd m
iddl
e co
lum
n (2
nd) a
re 1
.0 a
nd 0
.67,
resp
ectiv
ely,
and
the
linew
idth
s for
two
oute
r col
umns
(1st
and
3rd)
and
mid
dle
colu
mn
(2nd
) are
0.2
5 an
d 0.
18 G
, res
pect
ivel
y.
J Magn Reson. Author manuscript; available in PMC 2008 May 5.
Related Documents