Welcome message from author
This document is posted to help you gain knowledge. Please leave a comment to let me know what you think about it! Share it to your friends and learn new things together.
Transcript
Leydig cells secrete the androgenic steroid testosterone that
is vital both for male sexual development and the main-
tenance of skeletal integrity (Jackson, 1993). Testosterone
secretion from Leydig cells in response to luteinizing
hormone is modulated through changes in the intracellular
levels of both Ca¥ and cyclic AMP (cAMP); the effect of
cAMP is also exerted ultimately through a change in cytosolic
[Ca¥] (Sullivan & Cooke, 1986). Furthermore, intracellular
Ca¥ also influences steroidogenesis although the precise
mechanism of this effect is unclear. It is believed that
mitochondrial cholesterol transport and enzymatic side chain
cleavage are both Ca¥-sensitive (Sullivan & Cooke, 1986). In
addition to intracellular [Ca¥] changes, changes in extra-
cellular [Ca¥] ([Ca¥]e) also modulate testosterone secretion.
The latter doubles when extracellular [Ca¥] is increased
from 1 to 10 mÒ (Meikle et al. 1991). Again, the mechanism
through which an elevated [Ca¥]e is transduced into
enhanced testosterone secretion is unknown. Additionally,
we are also unclear about the altered or steady-state [Ca¥]e
experienced by Leydig cells in vivo.
Journal of Physiology (1998), 513.2, pp.399—410 399
The effect of extracellularly applied divalent cations on
cytosolic Ca¥ in murine Leydig cells: evidence for
a Ca¥_sensing receptor
Olugbenga A. Adebanjo, Joseph Igietseme*, Christopher L.-H. Huang†
and Mone Zaidi
Center for Skeletal Aging and Osteoporosis, Veterans Affairs Medical Center and Medical
College of Pennsylvania-Hahnemann School of Medicine, Allegheny University of the
Health Sciences and University of Pennsylvania, Philadelphia, PA 19104, *Morehouse
School of Medicine, Department of Microbiology and Immunology, Atlanta, GA 30310, USA
and †The Physiological Laboratory, University of Cambridge, Cambridge CB2 3EG, UK
(Received 6 March 1998; accepted after revision 3 September 1998)
1. The effect of extracellularly applied divalent cations upon cytosolic Ca¥ levels ([Ca¥]) was
investigated in fura-2-loaded mouse Leydig (TM3) cells.
2. The extracellular application of Ca¥ (2·5—15 mÒ) or Ni¥ (0·5—5 mÒ) elicited concentration-
dependent elevations in cytosolic [Ca¥] that were followed by decays to baseline levels.
Extracellular Mg¥ (0·8—15 mÒ) failed to influence cytosolic [Ca¥].
3. Conditioning applications of Ca¥ (2·5—10 mÒ), Mg¥ (2·5—15 mÒ) or Ni¥ (0·5—5 mÒ) all
attenuated the cytosolic Ca¥ response to a subsequent test application of 5 mÒ [Ni¥].
4. The amplitude of Ni¥-induced cytosolic Ca¥ signals remained constant in low-Ca¥
solutions. Such findings suggest a participation of Ca¥ release from intracellular stores. In
parallel, depletion of Ca¥ stores by either ionomycin (5 ìÒ, in low-Ca¥ solutions) or
thapsigargin (4 ìÒ) abolished or attenuated Ni¥-induced Ca¥ transients.
5. Ionomycin (5 ìÒ) elevated cytosolic [Ca¥] in Ca¥-free solutions even after prior Ni¥
application, indicating the presence of Ni¥-insensitive stores.
6. Caffeine (250 and 500 ìÒ) elevated cytosolic [Ca¥] and attenuated Ni¥-induced Ca¥
release. Furthermore, TM3 cells stained intensely with a specific anti-ryanodine receptor
antiserum, Ab34
. These findings suggest that Ca¥ release is regulated by ryanodine
receptors.
7. Both membrane depolarization and hyperpolarization, brought about by changes in
extracellular [K¤] ([K¤]e) in the presence of valinomycin (5 ìÒ), altered the waveform of the
Ni¥-induced cytosolic Ca¥ signal. Hyperpolarization, in addition, diminished the response
magnitude. Such voltage-induced response modulation localizes the regulatory events to the
Leydig cell plasma membrane.
8. We propose the existence of a cell surface divalent cation (Ca¥) receptor in Leydig cells, the
activation of which triggers Ca¥ fluxes through ryanodine receptors.
7982
Keywords: Testosterone, Leydig cells, Calcium channel
Previous studies have shown that certain eukaryotic cells
‘sense’ changes in their extracellular [Ca¥], a property that
has been attributed to the existence of a variety of surface
membrane Ca¥-sensing receptors (Brown et al. 1995). These
cells include parathyroid hormone-secreting chief cells
(Brown, 1991; Brown et al. 1993), calcitonin-secreting
thyroid C cells (Garrett et al. 1995), Ca¥-absorbing gastric
mucosal and intestinal cells (Pazianas et al. 1995; Cima et al.
1997; Gama et al. 1997), Ca¥-reabsorbing renal medullary
and cortical cells (Ricardi et al. 1995), cytotrophoblasts
(Lundgren et al. 1994; Bax et al. 1994), neurones (Ruat et al.
1995; Quinn et al. 1997), bone-resorbing osteoclasts (Zaidi et
al. 1989; Malgaroli et al. 1989) and bone-forming osteoblasts
(Honda et al. 1995). Notably, the osteoclast Ca¥ receptor,
which we believe is a functional component of a surface
ryanodine receptor, responds to low-millimolar [Ca¥]
changes generated locally as a result of hydroxyapatite
dissolution (Zaidi et al. 1995). Its activation results in the
inhibition of bone resorption, possibly as part of a feedback
mechanism of osteoclast control (Moonga et al. 1990).
All Ca¥-sensing receptors are thought to trigger intra-
cellular signals in response to changed [Ca¥]e. This, in turn,
regulates cell function. Most commonly, this signal is a
cytosolic [Ca¥] change that results from both transmembrane
Ca¥ influx and intracellular Ca¥ release (Brown, 1991;
Zaidi et al. 1993a). The latter involves either ryanodine
receptors or inositol trisphosphate (IP×) receptors (Brown,
1991; Shankar et al. 1995b). In the osteoclast, however, the
plasma membrane ryanodine receptor itself gates Ca¥
influx (Zaidi et al. 1995; Adebanjo et al. 1996).
This study has used methods employed previously to
characterize Ca¥-sensing in other cells (Brown, 1991; Zaidi
et al. 1993a). Specifically, divalent cations have been used as
surrogate Ca¥ agonists allowing us to distinguish Ca¥
release from Ca¥ influx (Nemeth, 1990; Shankar et al.
1993). Our results demonstrate a plasma membrane divalent
cation (Ca¥) receptor in Leydig cells, the activation of which
triggers Ca¥ release from ryanodine receptor-gated intra-
cellular Ca¥ stores.
METHODSReagents
Fura-2, fura-2 AM and ionomycin were purchased from Molecular
Probes, Inc. (Eugene, OR, USA). Tissue culture materials, including
Hepes and heat-inactivated fetal calf serum (FCS) were purchased
from Gibco-BRL. EDTA, EGTA, Triton X_100 and trypsin were all
obtained from Sigma Chemical Co. Measurements of cytosolic [Ca¥]
were carried out in either RPMI_1640 ([Ca¥], 1·25 mÒ) (Gibco BRL)
or modified Krebs (Ca¥-free) medium. The latter comprised (mÒ):
130 NaCl, 5 KCl, 0·8 MgClµ, 5 glucose, 10 Hepes and 1·2 EGTA (pH
7·4) ([Ca¥] < 5 nÒ, by fura_2 measurements). An antibody, Ab34
,
raised to the consensus calmodulin-binding sequence of the ryano-
dine receptor was kindly provided for us by Dr F. A. Lai (National
Institute for Medical Research, London, UK). The antibody has been
shown not to differentiate between the three known ryanodine
receptor isoforms, types I, II and III. It also does not bind to any
one of the known IP× receptor isoforms (Zaidi et al. 1995).
Culture of TM3 cells
Leydig cells (TM3, ATCC-CRL_1714, American Tissue Culture
Collection, Riversville, MD, USA) derived from BALBÏc mice have
primary epithelial cell characteristics, are non-tumorigenic and
express receptors for epidermal growth factor, luteinizing hormone,
androgens, oestrogen and progesterone. The cells were grown in
Hepes-buffered RPMI_1640 supplemented with FCS (10% vÏv),
glutamine (1% wÏv), penicillin (50 kU l¢) and streptomycin
(50 mg l¢). The cells were sub-cultured at confluence by washing in
EDTA, followed by trypsin treatment (0·025% wÏv) for 2 min,
addition of RPMI_1640 before centrifugation, and resuspension in
medium. The cells were maintained in tissue culture flasks (Fisher
Scientific) at 37°C and were harvested in their logarithmic growth
phase.
Cytosolic [Ca¥] measurements
A fluorescence method employing an inverted phase-contrast
microscope (Diaphot, Nikon) was used to measure cytosolic [Ca¥]
in single TM3 cells using the Ca¥-sensitive fluorochrome, fura_2
(Shankar et al. 1993). Glass coverslips containing dispersed cells
were incubated with 10 ìÒ fura_2 AM in serum-free RPMI_1640
for 30 min at 37°C. They were then transferred to a Perspex bath
on the microscope stage and exposed to agonists by pipetting
solutions that were pre-warmed to 37°C. The temperature of the
solution was kept constant by a thermostatically controlled heating
device. Its volume was maintained at 2 ml using a vacuum
withdrawal of fluid rising beyond a constant bath level.
Fluorochrome-loaded TM3 cells were exposed alternately to
excitation wavelengths of 340 and 380 nm approximately every
second. This was achieved by using a microcomputer-driven wheel
to which band-pass interference filters had been fitted. The emitted
fluorescence was deflected to a dichroic mirror (400 nm), filtered at
510 nm, and directed to the microscope side-port fitted with a
photomultiplier tube (PM28B, Thorn EMI). The photomultiplier
tube produced single photon currents that were fed into a photon
counter (Newcastle Photometric Systems, Newcastle-upon-Tyne,
UK). Photon counts per second (c.p. s.) were recorded on an IBM
microcomputer. The ratio of emitted fluorescence intensities due to
excitation at 340 and 380 nm, F340ÏF380, was calculated and
displayed.
The fura-2 signals were calibrated using a protocol for intracellular
calibration described previously by Tsien & Pozzan (1989) and
adopted by us (Shankar et al. 1993). Briefly, fura_2-loaded cells
were bathed in a Ca¥-free, EGTA-containing solution consisting of
(mÒ): 130 NaCl, 5 KCl, 5 glucose, 0·8 MgClµ, 10 Hepes and 0·1
EGTA. Ionomycin (5 ìÒ) was first applied in order to obtain the
minimum ratio due to lowest cytosolic [Ca¥] (Rmin) and the
maximal fluorescent intensity at 380 nm (Fmax). CaClµ (1 mÒ) was
then applied together with 5 ìÒ ionomycin in order to obtain
values for the maximum ratio due to elevated cytosolic [Ca¥] (Rmax)
and the minimal fluorescent intensity at 380 nm (Fmin). Note that,
at this concentration, ionomycin has been shown to equilibrate
extracellular and intracellular Ca¥ pools in the osteoclast (Shankar
et al. 1994). The dissociation constant (Kd) for Ca¥ and fura-2 at a
temperature of 20°C, an ionic strength of 0·1 Ò, and a pH of 6·85,
is 224 nÒ (Tsien & Pozzan, 1989). The values, together with the
experimental signal, R, were substituted into the equation:
cytosolic [Ca¥] =Kd ² [(R − Rmin)Ï(Rmax − R)] ² [(FmaxÏFmin)].
The resulting cytosolic [Ca¥] levels between treatment groups were
compared by Analysis of Variance (ANOVA) with Bonferroni’s
correction for inequality.
O. A. Adebanjo, J. Igietseme, C. L.-H. Huang and M. Zaidi J. Physiol. 513.2400
Immunocytochemistry
Coverslips containing TM3 cells were fixed with glutaraldehyde
(10% vÏv) and permeabilized gently with Triton X_100 (0·1%
vÏv). They were then incubated with normal goat serum diluted in
10 mÒ phosphate-buffered saline (PBS; 1 in 10, pH 7.4) in
multiwell dishes for 15 min. Excess serum was removed and
replaced with Hanks’ Balanced Salt Solution (HBSS). The cells were
then incubated with non-immune rabbit serum (control) or Ab34
(both diluted in HBSS, 1 in 100, vÏv). After 1 h of incubation, the
coverslips were rinsed gently with HBSS, drained, and re-
incubated for a further hour with goat anti-rabbit FITC (1 in 20,
diluted in HBSS). Finally, the coverslips were washed gently and
drained. Cells were visualized on an epifluorescence microscope
(Diaphot).
RESULTS
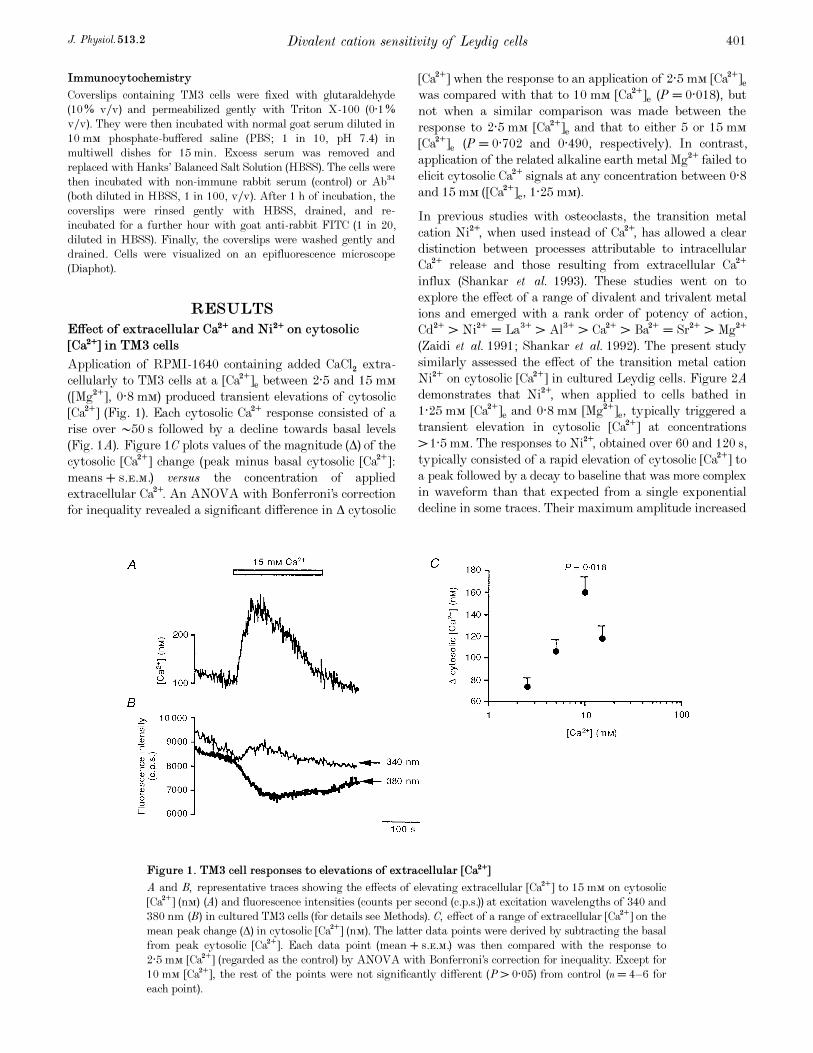
Effect of extracellular Ca¥ and Ni¥ on cytosolic[Ca¥] in TM3 cells
Application of RPMI_1640 containing added CaClµ extra-
cellularly to TM3 cells at a [Ca¥]e between 2·5 and 15 mÒ
([Mg¥], 0·8 mÒ) produced transient elevations of cytosolic
[Ca¥] (Fig. 1). Each cytosolic Ca¥ response consisted of a
rise over •50 s followed by a decline towards basal levels
(Fig. 1A). Figure 1C plots values of the magnitude (Ä) of the
cytosolic [Ca¥] change (peak minus basal cytosolic [Ca¥]:
means + s.e.m.) versus the concentration of applied
extracellular Ca¥. An ANOVA with Bonferroni’s correction
for inequality revealed a significant difference in Ä cytosolic
[Ca¥] when the response to an application of 2·5 mÒ [Ca¥]e
was compared with that to 10 mÒ [Ca¥]e (P = 0·018), but
not when a similar comparison was made between the
response to 2·5 mÒ [Ca¥]e and that to either 5 or 15 mÒ
[Ca¥]e (P = 0·702 and 0·490, respectively). In contrast,
application of the related alkaline earth metal Mg¥ failed to
elicit cytosolic Ca¥ signals at any concentration between 0·8
and 15 mÒ ([Ca¥]e, 1·25 mÒ).
In previous studies with osteoclasts, the transition metal
cation Ni¥, when used instead of Ca¥, has allowed a clear
distinction between processes attributable to intracellular
Ca¥ release and those resulting from extracellular Ca¥
influx (Shankar et al. 1993). These studies went on to
explore the effect of a range of divalent and trivalent metal
ions and emerged with a rank order of potency of action,
Cd¥ > Ni¥ = LaŤ > AlŤ > Ca¥ > Ba¥ = Sr¥ > Mg¥
(Zaidi et al. 1991; Shankar et al. 1992). The present study
similarly assessed the effect of the transition metal cation
Ni¥ on cytosolic [Ca¥] in cultured Leydig cells. Figure 2A
demonstrates that Ni¥, when applied to cells bathed in
1·25 mÒ [Ca¥]e and 0·8 mÒ [Mg¥]e, typically triggered a
transient elevation in cytosolic [Ca¥] at concentrations
>1·5 mÒ. The responses to Ni¥, obtained over 60 and 120 s,
typically consisted of a rapid elevation of cytosolic [Ca¥] to
a peak followed by a decay to baseline that was more complex
in waveform than that expected from a single exponential
decline in some traces. Their maximum amplitude increased
Divalent cation sensitivity of Leydig cellsJ. Physiol. 513.2 401
Figure 1. TM3 cell responses to elevations of extracellular [Ca¥]
A and B, representative traces showing the effects of elevating extracellular [Ca¥] to 15 mÒ on cytosolic
[Ca¥] (nÒ) (A) and fluorescence intensities (counts per second (c.p. s.)) at excitation wavelengths of 340 and
380 nm (B) in cultured TM3 cells (for details see Methods). C, effect of a range of extracellular [Ca¥] on the
mean peak change (Ä) in cytosolic [Ca¥] (nÒ). The latter data points were derived by subtracting the basal
from peak cytosolic [Ca¥]. Each data point (mean + s.e.m.) was then compared with the response to
2·5 mÒ [Ca¥] (regarded as the control) by ANOVA with Bonferroni’s correction for inequality. Except for
10 mÒ [Ca¥], the rest of the points were not significantly different (P > 0·05) from control (n = 4—6 for
each point).

with [Ni¥] up to 3 mÒ (P = 0·028), but fell at 5 mÒ [Ni¥],
nevertheless remaining significantly higher (P = 0·009)
than the corresponding response to 0·5 mÒ [Ni¥] (Fig. 2B).
The larger responses to Ni¥ as compared with Ca¥ were
consistent with the order of potency demonstrated previously
with the osteoclast system (Zaidi et al. 1991; Shankar et al.
1992).
Conditioning cation applications inactivate theresponse to 5 mÒ [Ni¥]
The effect of Ni¥ on cytosolic [Ca¥] was inactivated by
prior exposures to Ni¥, Ca¥ or Mg¥. In the first set of
experiments, further cells were exposed to a range of Ni¥
concentrations (0·5—5 mÒ) that were themselves effective in
triggering cytosolic Ca¥ transients (see above). When the
cytosolic [Ca¥] had returned to baseline, the cells were
washed with serum-free medium, and then exposed to a
second pulse of 5 mÒ [Ni¥] within 1 or 2 min. Figure 3A
and B displays traces of emitted fluorescence (F340 and F380;
photon c.p. s.) due to excitation at wavelengths of 340 and
380 nm, respectively (F340 and F380; photon c.p. s.) below the
resulting ratiometric (F340ÏF380) signals under two sets of
experimental conditions. Figure 3A shows the results from a
dye-loaded TM3 cell bathed in RPMI_1640 that was
exposed to a conditioning application of 3 mÒ Ni¥ followed
by a test application of 5 mÒ Ni¥ (horizontal open bars).
Figure 3B displays the contrasting results of adding the
5·0 mÒ Ni¥directly to free fura_2 (10 micromolar) in the
bath solution.
A comparison of these results makes it unlikely that the
traces in Fig. 3A primarily reflect a fura_2 reaction with
Ni¥ that had permeated into the cytosol rather than a
reflection of changes in cytoplasmic [Ca¥]. First, Fig. 3A
shows that the initial agonist application to the TM3 cells
produced upward deflections in the F340 trace but downward
deflections in the F380 traces. This is in contrast to the direct
reaction between fura_2 and Ni¥ that produced downward
deflections in both the F340 and the F380 signals (Fig. 3B).
The relative deflections in the F340 and F380 traces in Fig. 3A
thus do not fulfil the predictions of a direct reaction of dye
with Ni¥. Secondly, both (F340 and F380) fluorescence traces
O. A. Adebanjo, J. Igietseme, C. L.-H. Huang and M. Zaidi J. Physiol. 513.2402
Figure 2. Cytosolic [Ca¥] responses to extracellularly applied [Ni¥]
A, representative traces showing the effect of extracellularly applied [Ni¥] (0·5—5 mÒ) on cytosolic [Ca¥]
in cultured TM3 cells (for details, see Methods). B, effect of a range of extracellular [Ni¥] (0·5—5 mÒ) on
the mean peak change (Ä) in cytosolic [Ca¥] (nÒ). The latter data points were derived by subtracting the
basal from the peak cytosolic [Ca¥]. Each data point was then compared with the response to 0·5 mÒ
[Ni¥] (regarded as the control) by ANOVA with Bonferroni’s correction for inequality. P values are shown,
n = 4—6 for each point.
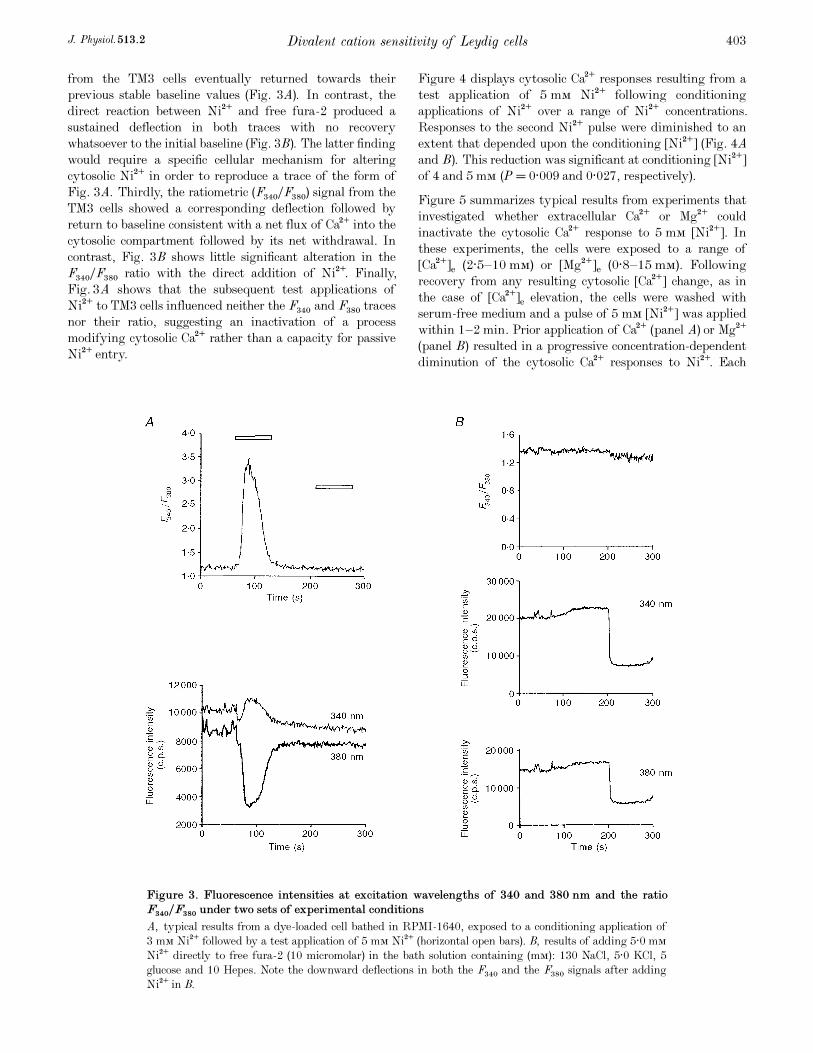
from the TM3 cells eventually returned towards their
previous stable baseline values (Fig. 3A). In contrast, the
direct reaction between Ni¥ and free fura_2 produced a
sustained deflection in both traces with no recovery
whatsoever to the initial baseline (Fig. 3B). The latter finding
would require a specific cellular mechanism for altering
cytosolic Ni¥ in order to reproduce a trace of the form of
Fig. 3A. Thirdly, the ratiometric (F340ÏF380) signal from the
TM3 cells showed a corresponding deflection followed by
return to baseline consistent with a net flux of Ca¥ into the
cytosolic compartment followed by its net withdrawal. In
contrast, Fig. 3B shows little significant alteration in the
F340ÏF380 ratio with the direct addition of Ni¥. Finally,
Fig. 3A shows that the subsequent test applications of
Ni¥ to TM3 cells influenced neither the F340 and F380 traces
nor their ratio, suggesting an inactivation of a process
modifying cytosolic Ca¥ rather than a capacity for passive
Ni¥ entry.
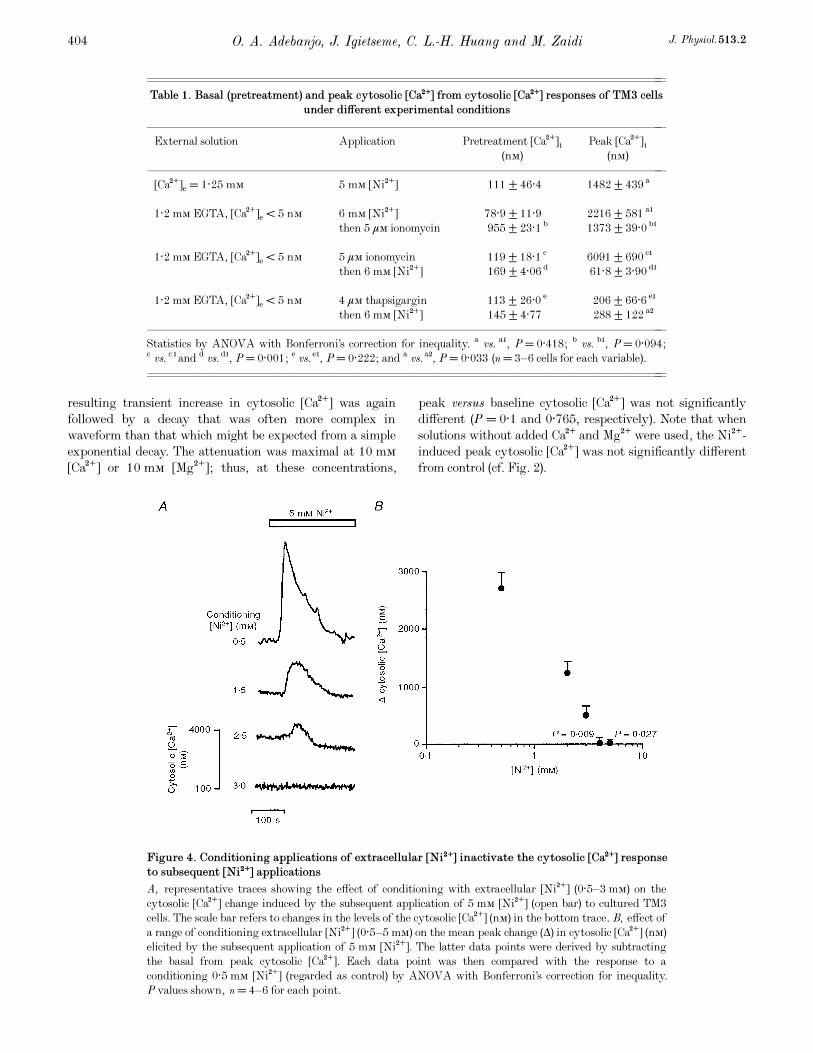
Figure 4 displays cytosolic Ca¥ responses resulting from a
test application of 5 mÒ Ni¥ following conditioning
applications of Ni¥ over a range of Ni¥ concentrations.
Responses to the second Ni¥ pulse were diminished to an
extent that depended upon the conditioning [Ni¥] (Fig. 4A
and B). This reduction was significant at conditioning [Ni¥]
of 4 and 5 mÒ (P = 0·009 and 0·027, respectively).
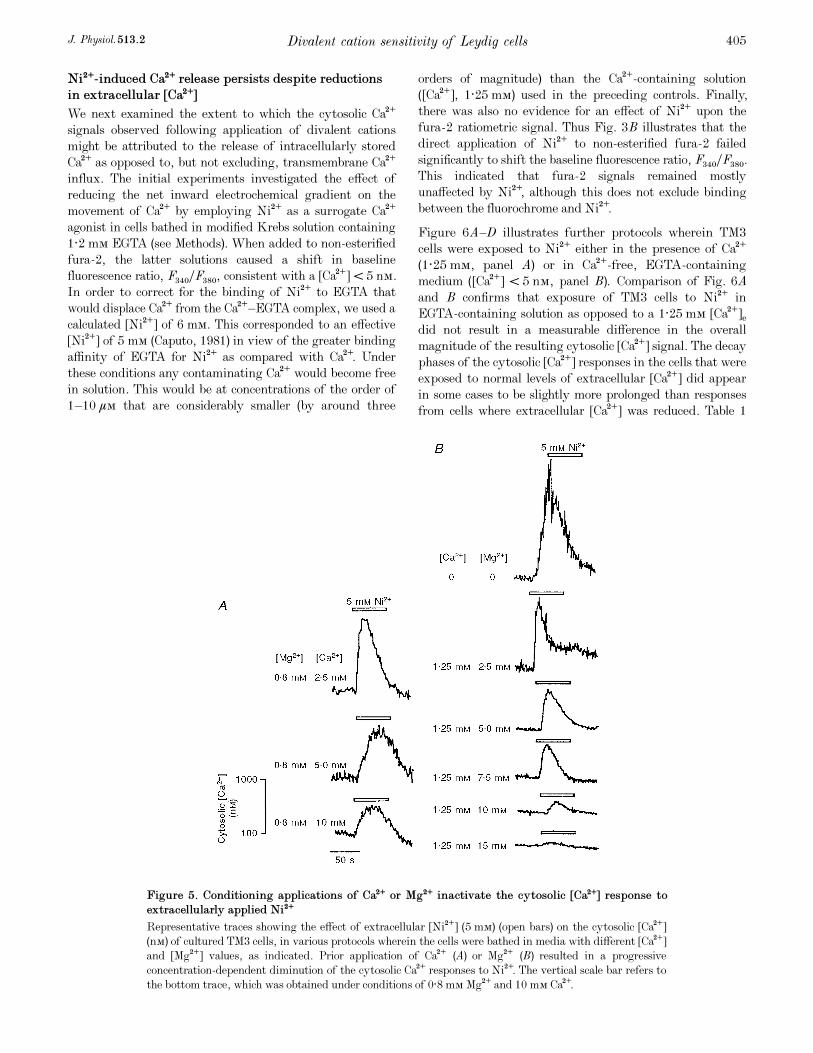
Figure 5 summarizes typical results from experiments that
investigated whether extracellular Ca¥ or Mg¥ could
inactivate the cytosolic Ca¥ response to 5 mÒ [Ni¥]. In
these experiments, the cells were exposed to a range of
[Ca¥]e (2·5—10 mÒ) or [Mg¥]e (0·8—15 mÒ). Following
recovery from any resulting cytosolic [Ca¥] change, as in
the case of [Ca¥]e elevation, the cells were washed with
serum-free medium and a pulse of 5 mÒ [Ni¥] was applied
within 1—2 min. Prior application of Ca¥ (panel A) or Mg¥
(panel B) resulted in a progressive concentration-dependent
diminution of the cytosolic Ca¥ responses to Ni¥. Each
Divalent cation sensitivity of Leydig cellsJ. Physiol. 513.2 403
Figure 3. Fluorescence intensities at excitation wavelengths of 340 and 380 nm and the ratioF340ÏF380 under two sets of experimental conditions
A, typical results from a dye-loaded cell bathed in RPMI_1640, exposed to a conditioning application of
3 mÒ Ni¥ followed by a test application of 5 mÒ Ni¥ (horizontal open bars). B, results of adding 5·0 mÒ
Ni¥ directly to free fura_2 (10 micromolar) in the bath solution containing (mÒ): 130 NaCl, 5·0 KCl, 5
glucose and 10 Hepes. Note the downward deflections in both the F×ÚÑ and the F×ÞÑ signals after adding
Ni¥ in B.
resulting transient increase in cytosolic [Ca¥] was again
followed by a decay that was often more complex in
waveform than that which might be expected from a simple
exponential decay. The attenuation was maximal at 10 mÒ
[Ca¥] or 10 mÒ [Mg¥]; thus, at these concentrations,
peak versus baseline cytosolic [Ca¥] was not significantly
different (P = 0·1 and 0·765, respectively). Note that when
solutions without added Ca¥ and Mg¥ were used, the Ni¥-
induced peak cytosolic [Ca¥] was not significantly different
from control (cf. Fig. 2).
O. A. Adebanjo, J. Igietseme, C. L.-H. Huang and M. Zaidi J. Physiol. 513.2404
Figure 4. Conditioning applications of extracellular [Ni¥] inactivate the cytosolic [Ca¥] responseto subsequent [Ni¥] applications
A, representative traces showing the effect of conditioning with extracellular [Ni¥] (0·5—3 mÒ) on the
cytosolic [Ca¥] change induced by the subsequent application of 5 mÒ [Ni¥] (open bar) to cultured TM3
cells. The scale bar refers to changes in the levels of the cytosolic [Ca¥] (nÒ) in the bottom trace. B, effect of
a range of conditioning extracellular [Ni¥] (0·5—5 mÒ) on the mean peak change (Ä) in cytosolic [Ca¥] (nÒ)
elicited by the subsequent application of 5 mÒ [Ni¥]. The latter data points were derived by subtracting
the basal from peak cytosolic [Ca¥]. Each data point was then compared with the response to a
conditioning 0·5 mÒ [Ni¥] (regarded as control) by ANOVA with Bonferroni’s correction for inequality.
P values shown, n = 4—6 for each point.
––––––––––––––––––––––––––––––––––––––––––––––––––––––––––––––––––––––––––––––––––––––––––––
Table 1. Basal (pretreatment) and peak cytosolic [Ca¥] from cytosolic [Ca¥] responses of TM3 cellsunder different experimental conditions
––––––––––––––––––––––––––––––––––––––––––––––
External solution Application Pretreatment [Ca¥]é Peak [Ca¥]é
(nÒ) (nÒ)
––––––––––––––––––––––––––––––––––––––––––––––
[Ca¥]e = 1·25 mÒ 5 mÒ [Ni¥] 111 ± 46·4 1482 ± 439a
1·2 mÒ EGTA, [Ca¥]e < 5 nÒ 6 mÒ [Ni¥] 78·9 ± 11·9 2216 ± 581a1
then 5 ìÒ ionomycin 955 ± 23·1b
1373 ± 39·0b1
1·2 mÒ EGTA, [Ca¥]e < 5 nÒ 5 ìÒ ionomycin 119 ± 18·1c
6091 ± 690c1
then 6 mÒ [Ni¥] 169 ± 4·06d
61·8 ± 3·90d1
1·2 mÒ EGTA, [Ca¥]e < 5 nÒ 4 ìÒ thapsigargin 113 ± 26·0e
206 ± 66·6e1
then 6 mÒ [Ni¥] 145 ± 4·77 288 ± 122a2
––––––––––––––––––––––––––––––––––––––––––––––
Statistics by ANOVA with Bonferroni’s correction for inequality.a
vs.a1
, P = 0·418;b
vs.b1
, P = 0·094;c
vs.c 1
andd
vs.d1
, P = 0·001;e
vs.e1
, P = 0·222; anda
vs.a2
, P = 0·033 (n = 3—6 cells for each variable).
––––––––––––––––––––––––––––––––––––––––––––––––––––––––––––––––––––––––––––––––––––––––––––
Ni¥-induced Ca¥ release persists despite reductionsin extracellular [Ca¥]
We next examined the extent to which the cytosolic Ca¥
signals observed following application of divalent cations
might be attributed to the release of intracellularly stored
Ca¥ as opposed to, but not excluding, transmembrane Ca¥
influx. The initial experiments investigated the effect of
reducing the net inward electrochemical gradient on the
movement of Ca¥ by employing Ni¥ as a surrogate Ca¥
agonist in cells bathed in modified Krebs solution containing
1·2 mÒ EGTA (see Methods). When added to non-esterified
fura-2, the latter solutions caused a shift in baseline
fluorescence ratio, F340ÏF380, consistent with a [Ca¥] < 5 nÒ.
In order to correct for the binding of Ni¥ to EGTA that
would displace Ca¥ from the Ca¥—EGTA complex, we used a
calculated [Ni¥] of 6 mÒ. This corresponded to an effective
[Ni¥] of 5 mÒ (Caputo, 1981) in view of the greater binding
affinity of EGTA for Ni¥ as compared with Ca¥. Under
these conditions any contaminating Ca¥ would become free
in solution. This would be at concentrations of the order of
1—10 ìÒ that are considerably smaller (by around three
orders of magnitude) than the Ca¥-containing solution
([Ca¥], 1·25 mÒ) used in the preceding controls. Finally,
there was also no evidence for an effect of Ni¥ upon the
fura_2 ratiometric signal. Thus Fig. 3B illustrates that the
direct application of Ni¥ to non-esterified fura_2 failed
significantly to shift the baseline fluorescence ratio, F340ÏF380.
This indicated that fura_2 signals remained mostly
unaffected by Ni¥, although this does not exclude binding
between the fluorochrome and Ni¥.
Figure 6A—D illustrates further protocols wherein TM3
cells were exposed to Ni¥ either in the presence of Ca¥
(1·25 mÒ, panel A) or in Ca¥-free, EGTA-containing
medium ([Ca¥] < 5 nÒ, panel B). Comparison of Fig. 6A
and B confirms that exposure of TM3 cells to Ni¥ in
EGTA-containing solution as opposed to a 1·25 mÒ [Ca¥]e
did not result in a measurable difference in the overall
magnitude of the resulting cytosolic [Ca¥] signal. The decay
phases of the cytosolic [Ca¥] responses in the cells that were
exposed to normal levels of extracellular [Ca¥] did appear
in some cases to be slightly more prolonged than responses
from cells where extracellular [Ca¥] was reduced. Table 1
Divalent cation sensitivity of Leydig cellsJ. Physiol. 513.2 405
Figure 5. Conditioning applications of Ca¥ or Mg¥ inactivate the cytosolic [Ca¥] response toextracellularly applied Ni¥
Representative traces showing the effect of extracellular [Ni¥] (5 mÒ) (open bars) on the cytosolic [Ca¥]
(nÒ) of cultured TM3 cells, in various protocols wherein the cells were bathed in media with different [Ca¥]
and [Mg¥] values, as indicated. Prior application of Ca¥ (A) or Mg¥ (B) resulted in a progressive
concentration-dependent diminution of the cytosolic Ca¥ responses to Ni¥. The vertical scale bar refers to
the bottom trace, which was obtained under conditions of 0·8 mÒ Mg¥ and 10 mÒ Ca¥.
shows that the Ni¥-induced peak Ä cytosolic [Ca¥] in the
two situations was not significantly different (P = 0·418).
When the cytosolic Ca¥ transient returned to baseline, the
cells bathed in Ca¥-free, EGTA-containing medium were
exposed to 5 ìÒ ionomycin to deplete any remaining intra-
cellular Ca¥ stores. There was still some rise (P = 0·094) in
cytosolic [Ca¥], suggesting that a single application of Ni¥
did not deplete all the intracellular Ca¥ stores.
Ni¥-induced Ca¥ release depends on intracellularCa¥ stores
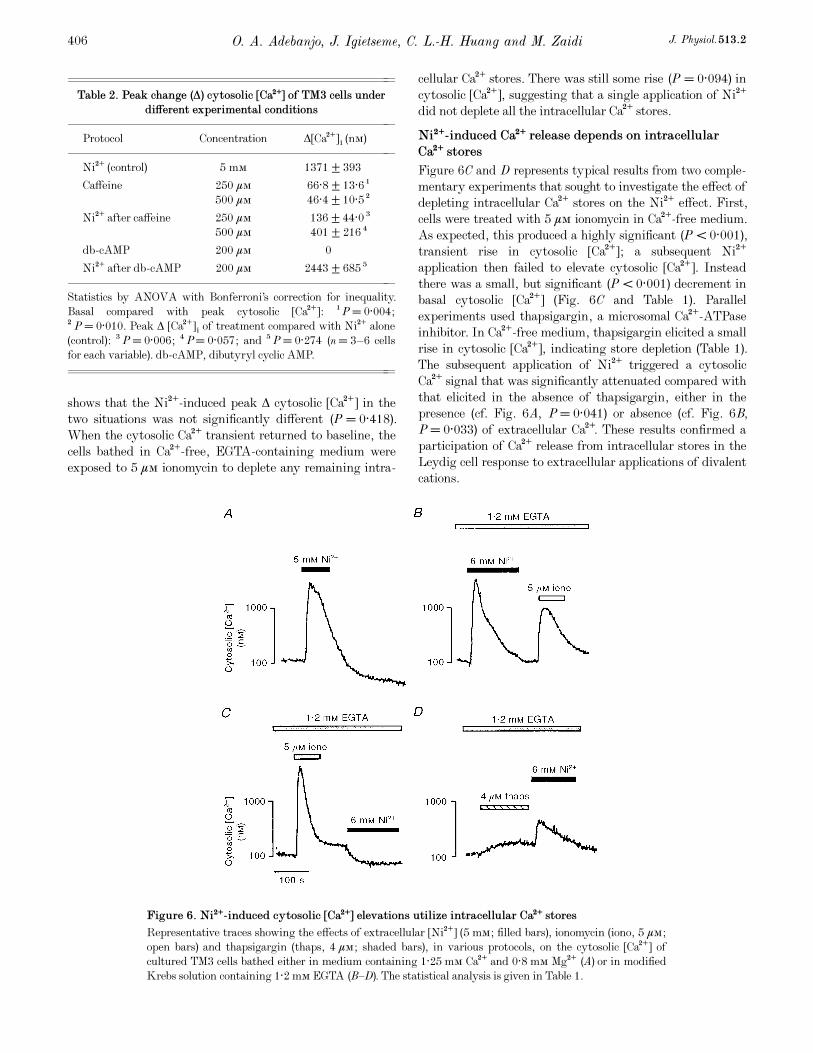
Figure 6C and D represents typical results from two comple-
mentary experiments that sought to investigate the effect of
depleting intracellular Ca¥ stores on the Ni¥ effect. First,
cells were treated with 5 ìÒ ionomycin in Ca¥-free medium.
As expected, this produced a highly significant (P < 0·001),
transient rise in cytosolic [Ca¥]; a subsequent Ni¥
application then failed to elevate cytosolic [Ca¥]. Instead
there was a small, but significant (P < 0·001) decrement in
basal cytosolic [Ca¥] (Fig. 6C and Table 1). Parallel
experiments used thapsigargin, a microsomal Ca¥-ATPase
inhibitor. In Ca¥-free medium, thapsigargin elicited a small
rise in cytosolic [Ca¥], indicating store depletion (Table 1).
The subsequent application of Ni¥ triggered a cytosolic
Ca¥ signal that was significantly attenuated compared with
that elicited in the absence of thapsigargin, either in the
presence (cf. Fig. 6A, P = 0·041) or absence (cf. Fig. 6B,
P = 0·033) of extracellular Ca¥. These results confirmed a
participation of Ca¥ release from intracellular stores in the
Leydig cell response to extracellular applications of divalent
cations.
O. A. Adebanjo, J. Igietseme, C. L.-H. Huang and M. Zaidi J. Physiol. 513.2406
Figure 6. Ni¥-induced cytosolic [Ca¥] elevations utilize intracellular Ca¥ stores
Representative traces showing the effects of extracellular [Ni¥] (5 mÒ; filled bars), ionomycin (iono, 5 ìÒ;
open bars) and thapsigargin (thaps, 4 ìÒ; shaded bars), in various protocols, on the cytosolic [Ca¥] of
cultured TM3 cells bathed either in medium containing 1·25 mÒ Ca¥ and 0·8 mÒ Mg¥ (A) or in modified
Krebs solution containing 1·2 mÒ EGTA (B—D). The statistical analysis is given in Table 1.
––––––––––––––––––––––––––––––––––––––––––––––––––––––––––
Table 2. Peak change (Ä) cytosolic [Ca¥] of TM3 cells underdifferent experimental conditions
–––––––––––––––––––––––––––––
Protocol Concentration Ä[Ca¥]é (nÒ)
–––––––––––––––––––––––––––––
Ni¥ (control) 5 mÒ 1371 ± 393
Caffeine 250 ìÒ 66·8 ± 13·61
500 ìÒ 46·4 ± 10·5 Â
Ni¥ after caffeine 250 ìÒ 136 ± 44·0 Å
500 ìÒ 401 ± 216 Æ
db-cAMP 200 ìÒ 0
Ni¥ after db-cAMP 200 ìÒ 2443 ± 685 Ç
–––––––––––––––––––––––––––––
Statistics by ANOVA with Bonferroni’s correction for inequality.
Basal compared with peak cytosolic [Ca¥]:1
P = 0·004;
ÂP = 0·010. Peak Ä [Ca¥]é of treatment compared with Ni¥ alone
(control): ÅP = 0·006; ÆP = 0·057; and ÇP = 0·274 (n = 3—6 cells
for each variable). db-cAMP, dibutyryl cyclic AMP.
––––––––––––––––––––––––––––––––––––––––––––––––––––––––––

Ni¥-induced Ca¥ release may involve ryanodinereceptor-gated Ca¥ stores
We next investigated the sensitivity of the intracellular Ca¥
stores to caffeine, a known ryanodine receptor agonist.
Caffeine itself elevated cytosolic [Ca¥] when applied at
concentrations of 250 and 500 ìÒ (P = 0·004 and 0·01,
respectively). More importantly, at both concentrations
caffeine also inhibited the cytosolic Ca¥ response to Ni¥
significantly (P = 0·006 and 0·06, respectively) (Table 2).
That ryanodine receptors were present in TM3 cells was next
confirmed immunocytochemically. Notably, permeabilized
TM3 cells stained strongly with the antiserum Ab34
. Cells
incubated with non-immune rabbit serum, instead of the
antiserum, did not stain (Fig. 7). Taken together, the data
suggest that (a) caffeine-sensitive, ryanodine receptor-gated
Ca¥ stores are present in TM3 cells, and (b) these stores
appear to be involved in Ni¥-induced cytosolic Ca¥ release.
Note that caffeine is also a phosphodiesterase inhibitor at
the concentrations tested and hence is expected to increase
cellular cAMP levels. To exclude the latter as a mechanism
of caffeine action, we tested the effect of a cell-permeant
cAMP analogue, dibutyryl cAMP, on Ni¥-induced Ca¥
release. Dibutyryl cAMP (200 ìÒ) neither elevated cytosolic
[Ca¥] nor inhibited Ni¥-induced Ca¥ release (P = 0·274)
(Table 2).
Membrane potential modulates Ni¥-induced cytosolicCa¥ transients
We finally sought to investigate the effect of changing the
cell membrane potential on Ni¥-induced Ca¥ release. This
was achieved by using 5 ìÒ valinomycin, a K¤ ionophore,
in the presence of either 5 or 100 mÒ [K¤]e. In the presence
of valinomycin, 5 mÒ [K¤]e is known to shift the membrane
potential in the negative direction, whereas 100 mÒ [K¤]e
causes membrane depolarization (Shankar et al. 1995a). The
Divalent cation sensitivity of Leydig cellsJ. Physiol. 513.2 407
Figure 7. Presence of ryanodine receptors in TM3 cells
Immunofluorescent micrographs of TM3 cells incubated with either antiserum Ab34
(a) or with non-immune
rabbit serum (b; negative control). Field of view, 375 ìm ² 255 ìm.
Figure 8. Membrane potential modulates Ni¥-induced cytosolic Ca¥ transients
Representative traces showing the effect of extracellular [Ni¥] (5 mÒ; black lines) on the cytosolic [Ca¥] of
cultured TM3 cells, in various protocols whereby the membrane potential was altered by using the K¤
ionophore, valinomycin (5 ìÒ; filled bars), in the presence of either 5 mÒ (hyperpolarized) or 100 mÒ [K¤]e
(open bar) (depolarized).
latter manoeuvre slowed the decline of the Ni¥-induced
cytosolic Ca¥ signal in the absence of any effect on peak
Ä cytosolic [Ca¥] (Fig. 8). Conversely, hyperpolarization
attenuated the magnitude of the cytosolic Ca¥ signal in
addition to slowing its decay phase (Fig. 8). These effects of
membrane voltage change are consistent with regulatory
events that are localized to the Leydig cell membrane.
DISCUSSION
The present study was prompted by the observation that
extracellular [Ca¥], when elevated from 1 to 10 mÒ, doubles
Leydig cell testosterone secretion (Meikle et al. 1991). Here
we show, for the first time, that such elevated extracellular
Ca¥ levels elicit sharp increases in cytosolic [Ca¥]. In
addition, by employing experimental strategies used to study
extracellular Ca¥ sensing in other cells (for reviews see
Brown, 1991; Zaidi et al. 1993a; Brown et al. 1995), we have
obtained new insights into transduction mechanisms that
Leydig cells use to trigger Ca¥ release in response to
changes in [Ca¥]e.
The transition metal cation, Ni¥, was used in our earlier
studies to demonstrate and to characterize a Ca¥-sensing
receptor on the osteoclast (Bax et al. 1993; Shankar et al.
1993; Zaidi et al. 1993a). Here we provide evidence that Ni¥
acts at the Leydig cell surface consistent with the existence
of a specific receptor activated by Ca¥ and Ni¥. Firstly,
Ni¥ is thought not to permeate cells; instead it blocks
plasma membrane Ca¥ channels (Caputo, 1981; Huang,
1988). Secondly, by monitoring the fluorescence separately
at each excitation wavelength, 340 and 380 nm, we did not
observe classical quenching of the fura_2 signals at any Ni¥
concentration tested. Thirdly, it is unlikely that the
observed fluorescence changes would have resulted from a
fura—Ni¥ interaction intracellularly. If so, we should have
seen a non-decaying signal as there is no known mechanism
of Ni¥ efflux from cells. Furthermore, we have confirmed
that in the same experimental system, the direct exposure
of non-esterified (free) fura_2 to Ni¥ did not appreciably
alter the ratio of the emission, F340ÏF380. Thus, it is unlikely
that the Ni¥-induced changes in the fluorescence ratio
F340ÏF380 could have resulted primarily from the binding of
permeated Ni¥ to fura_2 within the cells.
Further evidence implicates a cell surface site for Ni¥ action
more directly. Such an activation site should extend across
the cell surface membrane, and hence be exposed to the
transmembrane electric field. Thus, we find that a change in
cell membrane voltage alters the magnitude and waveform
of the Ni¥-induced Ca¥ signal (Shankar et al. 1995a). In
the presence of the K¤ ionophore valinomycin, 5 mÒ [K¤]e
was found to attenuate and prolong the Ni¥-induced
cytosolic Ca¥ signal. Likewise, 100 mÒ [K¤]e prolonged
inactivation. The receptor for Ni¥ may therefore well be an
integral protein that is either itself sensitive to the
transmembrane electric field, or whose binding with charged
ligands is voltage dependent.
In previous studies with the osteoclast, we have used Ni¥
as a substitute for Ca¥ to examine changes in cytosolic
[Ca¥] in the absence of transmembrane Ca¥ influx (Bax et
al. 1993; Shankar et al. 1993; Zaidi et al. 1993a). Here, we
demonstrate a major role for intracellular Ca¥ release in the
generation of the Ni¥-induced cytosolic Ca¥ signal. Thus, a
marked reduction of Ca¥ in the extracellular solution was
found to conserve the magnitude of the Ca¥ signal. These
results should be treated with caution, as the binding of
Ni¥ to EGTA and the consequent displacement of Ca¥ into
the solution would not reverse the cellular electrochemical
gradient of Ca¥. There is therefore the possibility that even
in EGTA-containing solutions, Ni¥ may trigger Ca¥ influx;
the latter may, in turn, contribute to the Ni¥-induced
cytosolic Ca¥ signal. However, depletion of releasable Ca¥
stores using either a Ca¥ ionophore, ionomycin (in Ca¥-free
medium) or, more specifically, a microsomal membrane Ca¥-
ATPase inhibitor, thapsigargin (in Ca¥-free medium),
abolished the Ni¥ response (Zaidi et al. 1993b; Shankar et al.
1994). These results with thapsigargin provide more direct
evidence for the release of Ca¥ from intracellular stores and
are reminiscent of hormone effects on membrane receptors
or, indeed, cation effects on cell surface Ca¥-sensing
receptors (Brown, 1991; Berridge, 1993; Zaidi et al. 1993a;
Brown et al. 1995).
The latter studies prompted us to examine whether such
Ni¥-induced Ca¥ release involved a participation of caffeine-
sensitive ryanodine receptors. Note that apart from their
classical location in microsomal membranes, ryanodine
receptors are also present on the plasma membranes of
osteoclasts (Zaidi et al. 1995). We thus tested the effect of
caffeine on basal cytosolic Ca¥ levels and on Ni¥-induced
Ca¥ release. Caffeine, applied at 250 and 500 ìÒ, itself
triggered cytosolic Ca¥ signals. At the same concentrations,
caffeine significantly inhibited Ni¥-induced cytosolic Ca¥
release. The concentrations appear somewhat lower than
those used in skeletal muscle (1—10 mÒ), but are similar to
those effective in the osteoclast (50—500 ìÒ) (Shankar et al.
1995b). In contrast, dibutyryl cAMP did not elevate cytosolic
[Ca¥] or attenuate Ni¥-induced Ca¥ release. This excludes
an effect of caffeine through its inhibition of phospho-
diesterase, and a consequent elevation in cellular cAMP. In
parallel experiments, an anti-ryanodine receptor antiserum,
Ab34
, stained Leydig cells strongly and specifically,
confirming the expression of ryanodine receptors. Taken
together, the results argue strongly for the involvement of
ryanodine receptors in Ni¥ action on Leydig cells, without
ruling out the participation of IP× receptors.
Finally, we investigated the interaction between the three
cations, Ca¥, Mg¥ and Ni¥. Mg¥ itself was found not to
elevate cytosolic [Ca¥]. This is similar to the cation’s action
on the osteoclast (Zaidi et al. 1991), but contrasts with its
potent activating action in parathyroid cells (Brown, 1991).
However, both Mg¥ and Ca¥ inhibited Ni¥-induced Ca¥
release in a concentration-dependent manner. This inhibition
is unlikely to be due to empty Ca¥ stores, as Mg¥ itself did
O. A. Adebanjo, J. Igietseme, C. L.-H. Huang and M. Zaidi J. Physiol. 513.2408
not trigger Ca¥ release from these stores. It is likely that
Mg¥ and Ca¥ compete with, or else displace Ni¥ from its
cell surface binding site. Hypothetically, this could result
from differences in the physicochemical properties of the
cations, such as their crystal ionic radii (0·099 nm for Ca¥
versus 0·069 nm for Ni¥).
In conclusion, the results provide strong evidence that a
divalent cation (Ca¥) receptor is present on the Leydig cell
surface. The receptor appears to be coupled to Ca¥ release
from ryanodine receptor-gated intracellular Ca¥ stores.
Currently, we have no structural information on this putative
entity. Its molecular characterization may nevertheless have
significant therapeutic implications. Notably, testosterone
and its analogues are being currently investigated for use in
preventing muscle and bone loss in ageing men. Furthermore,
in men with prostate cancer, testosterone levels must be
reduced. Hence it is of interest to modulate endogenous
testosterone secretion in vivo, potentially by a molecule that
could activate or inhibit the Leydig cell Ca¥-sensing receptor.
The latter strategy has been used to develop a novel
‘calcimimetic’, a potent inhibitor of parathyroid hormone
secretion for use in humans (Silverberg et al. 1997).
Adebanjo, O. A., Shankar, V. S., Pazianas, M., Simon, B., Lai,
F. A., Huang, C. L.-H. & Zaidi, M. (1996). Extracellularly applied
ruthenium red and cyclic ADP-ribose elevate cytosolic Ca¥ in
isolated rat osteoclasts. American Journal of Physiology 270,F469—475.
Bax, B. E., Shankar, V. S., Bax, C. M. R., Alam, A. S. M. T., Zara,
S. J., Pazianas, M., Huang, C. L.-H. & Zaidi, M. (1993). Functional
consequences of the interaction of Ni¥ with the osteoclast Ca¥
receptor. Experimental Physiology 78, 517—529.
Bax, C. M. R., Bax, B. E., Bain, M. & Zaidi, M. (1994). Ca¥ channels
in human term trophoblastic cells. A study using the Ca¥-sensitive
dye, fura_2. Trophoblast Research 8, 573—580.
Berridge, M. J. (1993). Inositol trisphosphate and calcium signaling.
Nature 361, 315—325.
Brown, E. M. (1991). Extracellular Ca¥ sensing, regulation of
parathyroid cell function, and role of Ca¥ and other ions as
extracellular (first) messengers. Physiological Reviews 71, 371—411.
Brown, E. M., Gamba, G., Ricardi, D., Lombardi, M., Butters, R.,
Kifor, O., Sun, A., Hediger, M. A., Lytton, J. & Hebert, S. C.
(1993). Cloning and characterization of an extracellular calcium
sensing receptor from bovine parathyroid. Nature 366, 575—580.
Brown, E. M., Pollak, M., Seidman, C. E., Seidman, J. G., Chou,
Y.-H. W., Ricardi, D. & Hebert, S. C. (1995). Calcium-ion-sensing
cell surface receptors. New England Journal of Medicine 333,234—240.
Caputo, C. (1981). Nickel substitution for calcium and the timecourse
of potassium conductances for single muscle fibres. Journal of
Muscle Research and Cell Motility 2, 167—182.
Cima, R. R., Cheng, I., Klingensmith, M. E., Chattopadhyay, N.,
Kifor, O., Hebert, S. C., Brown, E. M. & Soybel, D. (1997).
Identification and functional assay of an extracellular Ca¥ receptor
in Necturus gastric mucosa. American Journal of Physiology 273,G1051—1060.
Gama. L., Baxendale-Cox, L. M. & Breitwieser, G. E. (1997). Ca¥
sensing receptors in intestinal epithelium. American Journal of
Physiology 273, C1168—1175.
Garrett, J. E., Tamir, H., Kifor, O., Simin, R. T., Rogers, K. V.,
Mithal, A., Gagel, R. F. & Brown, E. M. (1995). Calcitonin-
secreting cells of the thyroid express an extracellular calcium
receptor gene. Endocrinology 136, 5202—5211.
Honda, Y., Fitzsimmons, R. J., Baylink, D. J. & Mohan, S. (1995).
Effects of extracellular calcium on insulin-like growth factor II in
human bone cells. Journal of Bone and Mineral Research 10,1660—1665.
Huang, C. L.-H. (1988). Intramembrane charge movements in skeletal
muscle. Physiological Reviews 68, 1197—1247.
Jackson, J. A. (1993). Osteoporosis in men. In Primer on Metabolic
Bone Diseases and Disorders of Mineral Metabolism, ed. Favus,
M. J., pp. 255—257. Lippincott Raven, Philadelphia.
Lundgren, S., Hjalm, G. & Hellman, P. (1994). A protein involved
in calcium sensing of the human parathyroid and placental
cytotrophoblast cells belongs to the LDL-receptor protein
superfamily. Experimental Cell Research 212, 344—350.
Malgaroli, A., Meldolesi, J., Zambonin-Zallone, A. & Teti, A.
(1989). Control of cytosolic free calcium in rat and chicken
osteoclasts. The role of extracellular calcium and calcitonin. Journal
of Biological Chemistry 264, 14342—14347.
Meikle, A. W., Liu, X.-A. & Stringham, J. D. (1991). Extracellular
calcium and luteinizing hormone effects on 22-hydroxycholesterol
used for testosterone production in mouse Leydig cells. Journal of
Andrology 12, 148—151.
Moonga, B. S., Moss, D. W., Patchell, A. & Zaidi, M. (1990).
Intracellular regulation of enzyme secretion from rat osteoclasts and
evidence for a functional role in bone resorption. Journal of
Physiology 429, 29—45.
Nemeth, E. F. (1990). Regulation of cytosolic calcium by extracellular
divalent cations in C-cells and parathyroid cells. Cell Calcium 11,323—327.
Pazianas, M., Adebanjo, O. A., Shankar, V. S., James, S. V.,
Colston, K. W., Maxwell, J. D. & Zaidi, M. (1995). Extracellular
Ca¥ sensing by the enterocyte. Prediction of a novel divalent cation
sensor. Biochemical and Biophysical Research Communications 210,448—453.
Quinn, S. J., Ye, C.-P., Diaz, R., Kifor, O., Bai, M., Vassilev, P. &
Brown, E. (1997). The Ca¥-sensing receptor: a target for
polyamines. American Journal of Physiology 273, C1315—1323.
Ricardi, D., Pak, J., Lee, W.-S., Gamba, G., Brown, E. M. &
Hebert, S. C. (1995). Cloning and functional expression of a rat
kidney extracellular calciumÏpolyvalent cation-sensing receptor.
Proceedings of the National Academy of Sciences of the USA 9,131—135.
Ruat, M., Molliver, M. E., Snowman, A. M. & Snyder, S. H.
(1995). Calcium sensing receptor: molecular cloning and localization
to nerve terminals. Proceedings of the National Academy of Sciences
of the USA 92, 3161—3165.
Shankar, V. S., Bax, C. M. R., Alam, A. S. M. T., Bax, B. E.,
Huang, C. L.-H. & Zaidi, M. (1992). The osteoclast Ca¥ receptor is
highly sensitive to activation by transition metal cations. Biophysical
and Biochemical Research Communications 187, 913—918.
Shankar, V. S., Bax, C. M. R., Bax, B. E., Alam, A. S. M. T.,
Simon, B., Pazianas, M., Moonga, B. S., Huang, C. L.-H. & Zaidi,
M. (1993). Activation of the Ca¥ ‘receptor’ on the osteoclast by Ni¥
elicits cytosolic Ca¥ signals: evidence for receptor activation and
inactivation, intracellular Ca¥ redistribution and divalent cation
modulation. Journal of Cellular Physiology 155, 120—129.
Divalent cation sensitivity of Leydig cellsJ. Physiol. 513.2 409
Shankar, V. S., Huang, C. L.-H., Adebanjo, O. A., Pazianas, M. &
Zaidi, M. (1994). Calcium influx and redistribution in isolated rat
osteoclasts. Experimental Physiology 79, 537—545.
Shankar, V. S., Huang, C. L.-H., Adebanjo, O. A., Simon, B. J.,
Alam, A. S. M. T., Moonga, B. S., Pazianas, M., Scott, R. H. &
Zaidi, M. (1995a). The effect of membrane potential on surface Ca¥
receptor activation in rat osteoclasts. Journal of Cellular Physiology
162, 1—8.
Shankar, V. S., Pazianas, M., Huang, C. L.-H., Simon, B.,
Adebanjo, O. & Zaidi, M. (1995b). Caffeine modulates Ca¥
receptor activation in isolated rat osteoclasts and induces intra-
cellular Ca¥ release. American Journal of Physiology 268,F447—454.
Silverberg, S. J., Bone, H. G. III, Marriott, T. B., Locker, F. G.,
Thys-Jacobs, S., Dziem, G., Kaatz, S., Sanguinetti, E. L. &
Bilezikian, J. P. (1997). Short-term inhibition of parathyroid
hormone secretion with calcium receptor agonist in patients with
primary hyperparathyroidism. New England Journal of Medicine
337, 1506—1510.
Sullivan, M. & Cooke, B. A. (1986). The role for Ca¥ in
steroidogenesis in Leydig cells. Biochemical Journal 236, 45—51.
Tsien, R. Y. & Pozzan, T. (1989). Measurement of cytosolic free Ca¥
with quin 2. Methods in Enzymology 172, 232—262.
Zaidi, M., Alam, A. S. M. T., Huang, C. L.-H., Pazianas, M., Bax,
C. M. R., Bax, B. E., Moonga, B. S., Bevis, P. J. R. & Shankar,
V. S. (1993a). Extracellular Ca¥ sensing by the osteoclast. Cell
Calcium 14, 271—277.
Zaidi, M., Datta, H. K., Patchell, A., Moonga, B. S. &
MacIntyre, I. (1989). ‘Calcium-activated’ intracellular calcium
elevation: a novel mechanism of osteoclast regulation. Biochemical
and Biophysical Research Communications 163, 1461—1465.
Zaidi, M., Kerby, J., Huang, C. L.-H., Alam, A. S. M. T., Rathod,
H., Chambers, T. J. & Moonga, B. S. (1991). Divalent cations mimic
the inhibitory effects of extracellular ionized calcium on bone
resorption by isolated rat osteoclasts: further evidence for a ‘calcium
receptor’. Journal of Cellular Physiology 149, 422—427.
Zaidi, M., Shankar, V. S., Bax, C. M. R., Bax, B. E., Bevis, P. J. R.,
Pazianas, M., Alam, A. S. M. T. & Huang, C. L.-H. (1993b).
Linkage of extracellular and intracellular control of cytosolic Ca¥ in
rat osteoclasts in the presence of thapsigargin. Journal of Bone and
Mineral Research 8, 961—967.
Zaidi, M., Shankar, V. S., Tunwell, R. E., Adebanjo, O. A.,
McKrill, J., Pazianas, M., O’Connell, D., Simon, B., Rifkin,
B. R., Venkitaraman, A., Huang, C. L.-H. & Lai, F. A. (1995). A
ryanodine receptor-like molecule expressed in the osteoclast plasma
membrane functions in extracellular Ca¥ sensing. Journal of
Clinical Investigation 96, 1582—1590.
Acknowledgements
This study was supported by grants to M.Z. from the National
Institute on Aging (NIH RO1 AG 14917_02), the Department of
Veterans Affairs (Merit Review Award) and the Amgen
Corporation, Inc., Thousand Oaks, CA, USA. C.L.-H.H.
acknowledges the support of the Leverhulme Trust (UK) and the
Biotechnology and Biological Research Council (BBSRC) of the UK.
J. I. acknowledges the support of grants AI41231 and RR03034
from the NIH.
Corresponding author
C. L.-H. Huang: The Physiological Laboratory, University of
Cambridge, Downing Street, Cambridge CB2 3EG, UK.
Email: [email protected]
Reprint requests
M. Zaidi: Centre for Osteoporosis and Skeletal Aging, Geriatrics
and Extended Care Service, Veterans Affairs Medical Center,
University andWoodland Avenues, Philadelphia, PA 19104, USA.
Email: [email protected]
O. A. Adebanjo, J. Igietseme, C. L.-H. Huang and M. Zaidi J. Physiol. 513.2410
Related Documents