July 2009 Odd Gutteberg, IET Lars Bråten, FFI Master of Science in Electronics Submission date: Supervisor: Co-supervisor: Norwegian University of Science and Technology Department of Electronics and Telecommunications The Design of a Low Cost Beacon Receiver System using Software Defined Radio Eivind Brauer Mikkelsen

Welcome message from author
This document is posted to help you gain knowledge. Please leave a comment to let me know what you think about it! Share it to your friends and learn new things together.
Transcript
July 2009Odd Gutteberg, IETLars Bråten, FFI
Master of Science in ElectronicsSubmission date:Supervisor:Co-supervisor:
Norwegian University of Science and TechnologyDepartment of Electronics and Telecommunications
The Design of a Low Cost BeaconReceiver System using SoftwareDefined Radio
Eivind Brauer Mikkelsen

Problem DescriptionAt current there is great interest in the high North due to activities related to oil, gas and fisheries.The U.S. geological survey has estimated that as much as 22 % of the worlds remaining oil and gasresources might lay in the artic. Climate changes might also lead to an increase in ship traffic dueto the melting of the polar icecap. This would in turn open new transport routs such as the North-east and North-west passage. With increasing activity the demand for reliable communicationssystems is expected to increase. New broadband services delivered via satellite now make use of millimeter wave frequencies suchas Ka-band (20/30 GHz) due to spectrum congestion. Limited works have been done to study thepropagation effects at theses frequencies in the Northern regions of Norway. In order to gain newknowledge on system performance, propagation measurements are needed for characterizationof the various propagation effects. From these measurements, new models that predictpropagation impairments can be developed.
The task is to design and build a system suitable for studying propagation effects in Northernparts Norway with focus on Ka-band frequencies. The system should also bee suitable formaritime measurements.
Assignment given: 23. January 2009Supervisor: Odd Gutteberg, IET

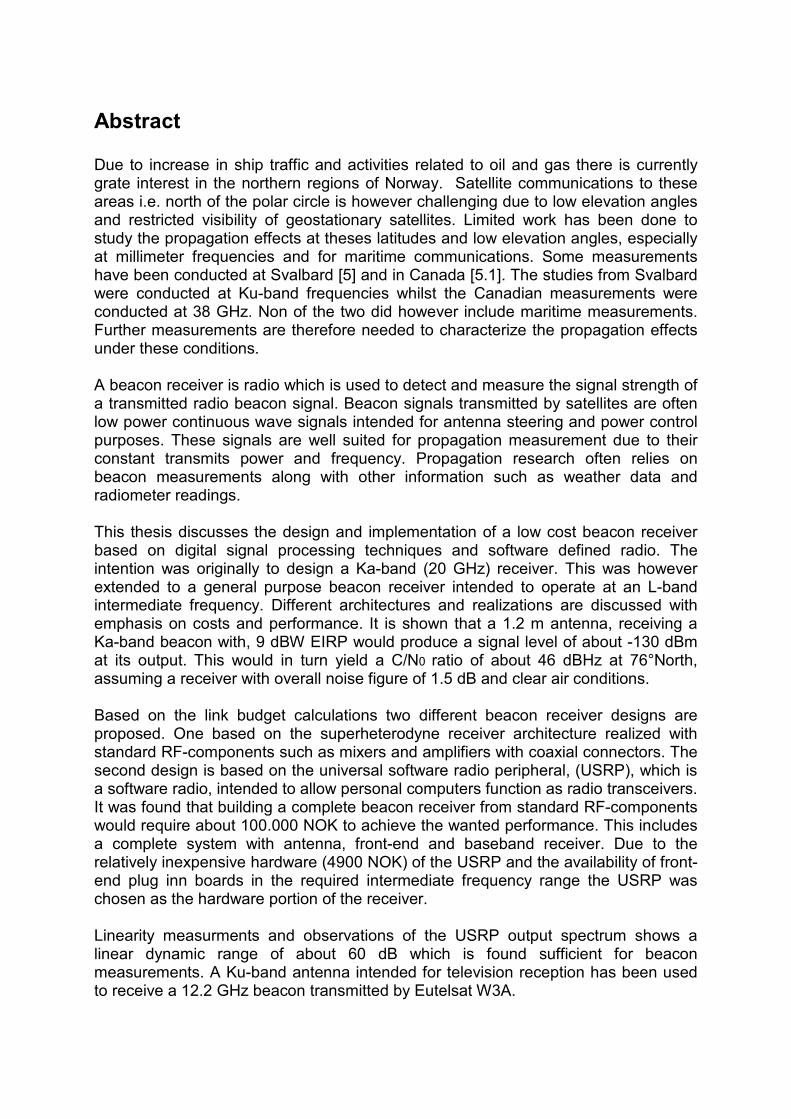
Abstract Due to increase in ship traffic and activities related to oil and gas there is currently grate interest in the northern regions of Norway. Satellite communications to these areas i.e. north of the polar circle is however challenging due to low elevation angles and restricted visibility of geostationary satellites. Limited work has been done to study the propagation effects at theses latitudes and low elevation angles, especially at millimeter frequencies and for maritime communications. Some measurements have been conducted at Svalbard [5] and in Canada [5.1]. The studies from Svalbard were conducted at Ku-band frequencies whilst the Canadian measurements were conducted at 38 GHz. Non of the two did however include maritime measurements. Further measurements are therefore needed to characterize the propagation effects under these conditions. A beacon receiver is radio which is used to detect and measure the signal strength of a transmitted radio beacon signal. Beacon signals transmitted by satellites are often low power continuous wave signals intended for antenna steering and power control purposes. These signals are well suited for propagation measurement due to their constant transmits power and frequency. Propagation research often relies on beacon measurements along with other information such as weather data and radiometer readings. This thesis discusses the design and implementation of a low cost beacon receiver based on digital signal processing techniques and software defined radio. The intention was originally to design a Ka-band (20 GHz) receiver. This was however extended to a general purpose beacon receiver intended to operate at an L-band intermediate frequency. Different architectures and realizations are discussed with emphasis on costs and performance. It is shown that a 1.2 m antenna, receiving a Ka-band beacon with, 9 dBW EIRP would produce a signal level of about -130 dBm at its output. This would in turn yield a C/N0 ratio of about 46 dBHz at 76°North, assuming a receiver with overall noise figure of 1.5 dB and clear air conditions. Based on the link budget calculations two different beacon receiver designs are proposed. One based on the superheterodyne receiver architecture realized with standard RF-components such as mixers and amplifiers with coaxial connectors. The second design is based on the universal software radio peripheral, (USRP), which is a software radio, intended to allow personal computers function as radio transceivers. It was found that building a complete beacon receiver from standard RF-components would require about 100.000 NOK to achieve the wanted performance. This includes a complete system with antenna, front-end and baseband receiver. Due to the relatively inexpensive hardware (4900 NOK) of the USRP and the availability of front-end plug inn boards in the required intermediate frequency range the USRP was chosen as the hardware portion of the receiver. Linearity measurments and observations of the USRP output spectrum shows a linear dynamic range of about 60 dB which is found sufficient for beacon measurements. A Ku-band antenna intended for television reception has been used to receive a 12.2 GHz beacon transmitted by Eutelsat W3A.
Software code was developed based on the GNU radio framework in order to use the USRP as a beacon receiver. A number of issues were discovered during this work:
• GNU radio does not contain filters for spectral averaging
• Attempts to implement additional functionality in software proved challenging due to limitations in computational speed
Both of the two issues affected the performance of the beacon receiver. Modifications and additions to the GNU radio software is therefore suggested for future work

Preface This is the master thesis for Eivind Mikkelsen, presented to the Norwegian University of Science and Technology as required to conclude the Master of Science study in Electronics and Telecommunications. This thesis has been written under the supervision of Dr. Lars Erling Bråten at the Norwegian Defense Research Establishment and Professor Odd Gutteberg at the Department of Electronics and Telecommunications, NTNU. The work has been carried out during the spring of 2009 at the University Graduate Center at Kjeller Lillestøm, Norway. The assignment came about due to a faulty beacon receiver intended for use in an earlier project. This thesis is therefore concerned with the design and implementation of a low cost beacon receiver. Originally the intent was to design and build a beacon receiver for the Eutelsat W3A 21.4 GHz beacon. The cost of implementing such a receiver was however beyond the funds available to this project. The thesis was therefore focused on developing a beacon receiver operating at an L-band intermediate frequency. In this way the receiver could cover a range of frequency bands including Ka and Ku-band.
Contents
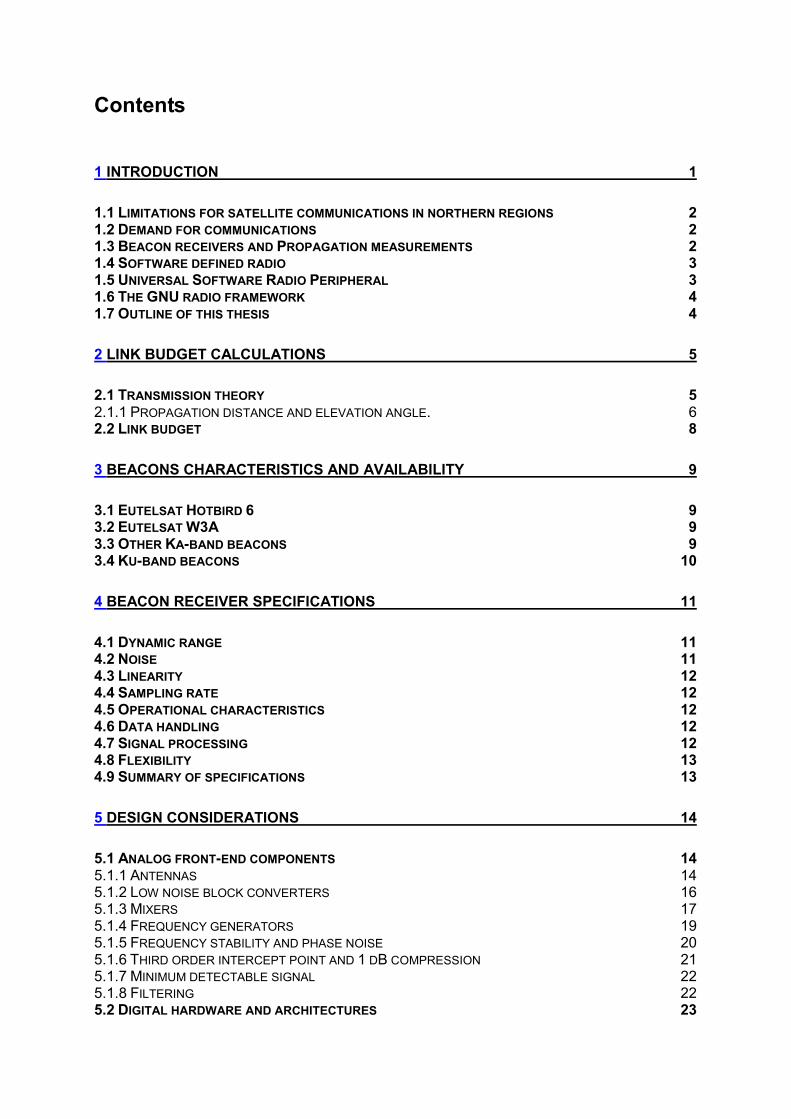
1 INTRODUCTION 1
1.1 LIMITATIONS FOR SATELLITE COMMUNICATIONS IN NORTHERN REGIONS 2 1.2 DEMAND FOR COMMUNICATIONS 2 1.3 BEACON RECEIVERS AND PROPAGATION MEASUREMENTS 2 1.4 SOFTWARE DEFINED RADIO 3 1.5 UNIVERSAL SOFTWARE RADIO PERIPHERAL 3 1.6 THE GNU RADIO FRAMEWORK 4 1.7 OUTLINE OF THIS THESIS 4
2 LINK BUDGET CALCULATIONS 5
2.1 TRANSMISSION THEORY 5 2.1.1 PROPAGATION DISTANCE AND ELEVATION ANGLE. 6 2.2 LINK BUDGET 8
3 BEACONS CHARACTERISTICS AND AVAILABILITY 9
3.1 EUTELSAT HOTBIRD 6 9 3.2 EUTELSAT W3A 9 3.3 OTHER KA-BAND BEACONS 9 3.4 KU-BAND BEACONS 10
4 BEACON RECEIVER SPECIFICATIONS 11
4.1 DYNAMIC RANGE 11 4.2 NOISE 11 4.3 LINEARITY 12 4.4 SAMPLING RATE 12 4.5 OPERATIONAL CHARACTERISTICS 12 4.6 DATA HANDLING 12 4.7 SIGNAL PROCESSING 12 4.8 FLEXIBILITY 13 4.9 SUMMARY OF SPECIFICATIONS 13
5 DESIGN CONSIDERATIONS 14
5.1 ANALOG FRONT-END COMPONENTS 14 5.1.1 ANTENNAS 14 5.1.2 LOW NOISE BLOCK CONVERTERS 16 5.1.3 MIXERS 17 5.1.4 FREQUENCY GENERATORS 19 5.1.5 FREQUENCY STABILITY AND PHASE NOISE 20 5.1.6 THIRD ORDER INTERCEPT POINT AND 1 DB COMPRESSION 21 5.1.7 MINIMUM DETECTABLE SIGNAL 22 5.1.8 FILTERING 22 5.2 DIGITAL HARDWARE AND ARCHITECTURES 23
5.2.1 ANALOG TO DIGITAL CONVERTER 23 5.2.2 QUANTIZATION NOISE AND DYNAMIC RANGE 23 5.2.3 JITTER 24 5.2.4 SAMPLING RATE 24 5.2.5 COMPUTER INTERFACE 25 5.3 RECEIVER ARCHITECTURES 26 5.3.1 DIRECT CONVERSION 26 5.3.2 SUPERHETERODYNE RECEIVER 26 5.4 OTHER DESIGN CONSIDERATIONS 27 5.4.1 LIMITATIONS DUE TO AVAILABLE EQUIPMENT 28
6 BEACON RECEIVER DESIGNS 29
6.1 FRONT-END DESIGN 29 6.2 REDUCTION OF COSTS & ALTERNATIVE HARDWARE IMPLEMENTATIONS 32 6.2.1 APPROACH 1 32 6.2.2 APPROACH 2, L-BAND RECEIVER 33
7 HARDWARE DESCRIPTION 36
7.1 UNIVERSAL SOFTWARE RADIO PERIPHERAL 36 7.1.1 ANALOG TO DIGITAL CONVERTER 37 7.1.2 PROGRAMMABLE GAIN AMPLIFIER 37 7.1.3 OSCILLATOR 37 7.1.4 FIELD PROGRAMMABLE GATEWAY ARRAY 38 7.1.5 DAUGHTERBOARDS 38 7.2 GNU RADIO FRAMEWORK 39 7.2.1 GNU RADIO COMPANION 39 7.2.2 GNU RADIO INSTALLATION 39
8 RESULTS 41
8.1 TEST SETUP 41 8.2 OBSERVATIONS 42 8.2.1 DC-OFFSET 42 8.2.2 SPECTRAL ESTIMATION 43 8.3 LINEARITY MEASUREMENTS 43 8.4 KU-BAND RECEPTION 45 8.4.1 EUTELSAT W3A BEACON 45 8.5 BEACON RECEIVER CODE 46 8.5.1 DATA PROCESSING CONSIDERATIONS 47 8.5.2 DECIMATION AND FFT SIZE 47 8.5.3 FILTERING 47 8.5.4 SIGNAL FLOW IN THE BEACON SOFTWARE 48 8.6 TESTING OF THE BEACON RECEIVER CODE 49 8.7 DISCUSSION 50 8.7.1 LIMITATIONS OF GNU RADIO 50 8.7.2 BEACON RECEIVER CODE 50
9 CONCLUSION 52
9.1 SUGGESTIONS FOR FURTHER WORK 53 9.1.1 LIMITATIONS OF GNU RADIO SOFTWARE 53 9.1.2 IMPROVEMENTS TO THE BEACON RECEIVER CODE 53 9.1.3 EXTENDED FUNCTIONALITY 53 9.1.3 MARITIME MEASUREMENTS 54
REFERENCES 55
ANNEX 1. BEACON RECEIVER BLOCK DIAGRAMS 59
APPENDIX 1 DATA SHEETS 61
APPENDIX 2. KA-BAND COVERAGE MAPS 70
APPENDIX 3. SOFTWARE CODE 71
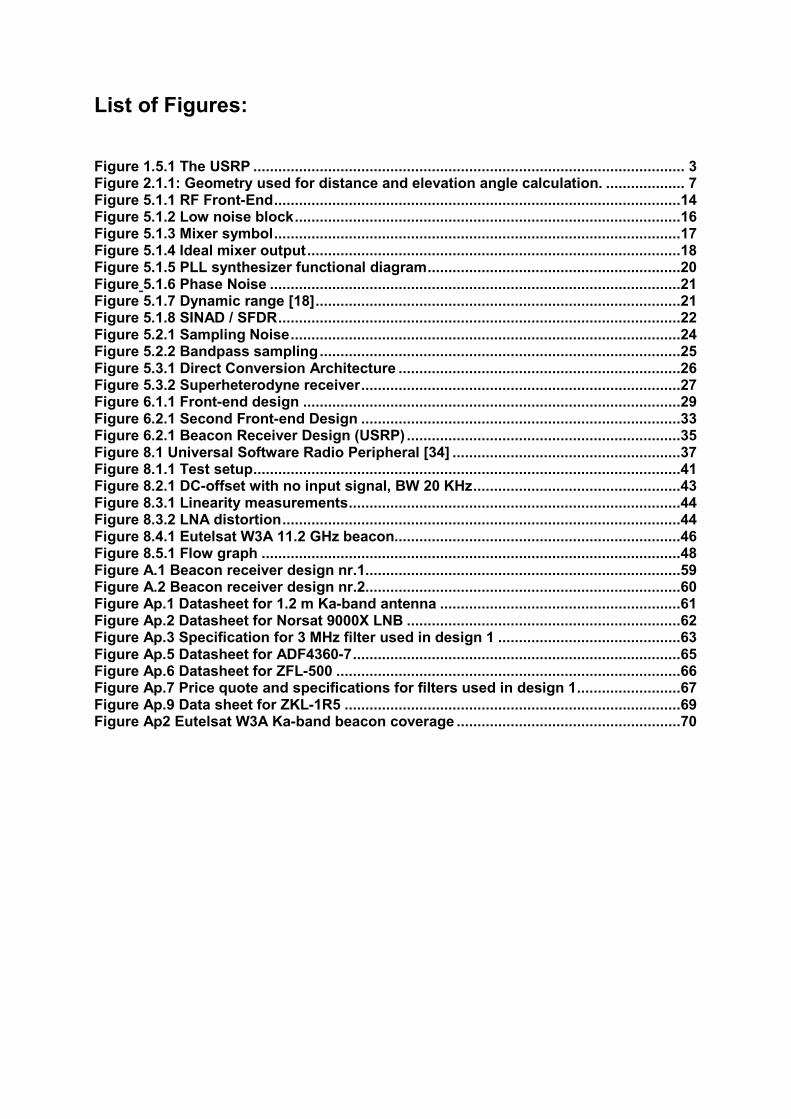
List of Figures:
Figure 1.5.1 The USRP ........................................................................................................ 3 Figure 2.1.1: Geometry used for distance and elevation angle calculation. ................... 7 Figure 5.1.1 RF Front-End..................................................................................................14 Figure 5.1.2 Low noise block.............................................................................................16 Figure 5.1.3 Mixer symbol..................................................................................................17 Figure 5.1.4 Ideal mixer output..........................................................................................18 Figure 5.1.5 PLL synthesizer functional diagram.............................................................20 Figure 5.1.6 Phase Noise ...................................................................................................21 Figure 5.1.7 Dynamic range [18]........................................................................................21 Figure 5.1.8 SINAD / SFDR.................................................................................................22 Figure 5.2.1 Sampling Noise..............................................................................................24 Figure 5.2.2 Bandpass sampling.......................................................................................25 Figure 5.3.1 Direct Conversion Architecture ....................................................................26 Figure 5.3.2 Superheterodyne receiver.............................................................................27 Figure 6.1.1 Front-end design ...........................................................................................29 Figure 6.2.1 Second Front-end Design .............................................................................33 Figure 6.2.1 Beacon Receiver Design (USRP) ..................................................................35 Figure 8.1 Universal Software Radio Peripheral [34] .......................................................37 Figure 8.1.1 Test setup.......................................................................................................41 Figure 8.2.1 DC-offset with no input signal, BW 20 KHz..................................................43 Figure 8.3.1 Linearity measurements................................................................................44 Figure 8.3.2 LNA distortion................................................................................................44 Figure 8.4.1 Eutelsat W3A 11.2 GHz beacon.....................................................................46 Figure 8.5.1 Flow graph .....................................................................................................48 Figure A.1 Beacon receiver design nr.1............................................................................59 Figure A.2 Beacon receiver design nr.2............................................................................60 Figure Ap.1 Datasheet for 1.2 m Ka-band antenna ..........................................................61 Figure Ap.2 Datasheet for Norsat 9000X LNB ..................................................................62 Figure Ap.3 Specification for 3 MHz filter used in design 1 ............................................63 Figure Ap.5 Datasheet for ADF4360-7...............................................................................65 Figure Ap.6 Datasheet for ZFL-500 ...................................................................................66 Figure Ap.7 Price quote and specifications for filters used in design 1.........................67 Figure Ap.9 Data sheet for ZKL-1R5 .................................................................................69 Figure Ap2 Eutelsat W3A Ka-band beacon coverage ......................................................70

- 1 -
Chapter 1
Introduction
Norway has an economic zone covering 819,620 square kilometers of sea surface. With the fishing zone around Jan Mayen and the protected zone around Spitsbergen the total jurisdictional district covers 1,878,953 square kilometer. This amounts to an area almost six times greater then the Norwegian mainland [1], with most of these areas lying north of the polar circle. In addition, during the course of this thesis the boarders of the Norwegian continental shelf were extended even further. The Northern regions have also been found to contain vast recourses including oil, gas and fish. U.S. geological survey has estimated that as much as 22 % of the world’s remaining petroleum recourses might lay in the Artic [2].
Figure 1.1 Political map of the Northern region [3]
The Norwegian government has announced that the High North will be Norway’s most important strategic priority area in the years ahead, and that “We will be at the forefront of international efforts to develop knowledge in and about the High North” [4].
- 2 -
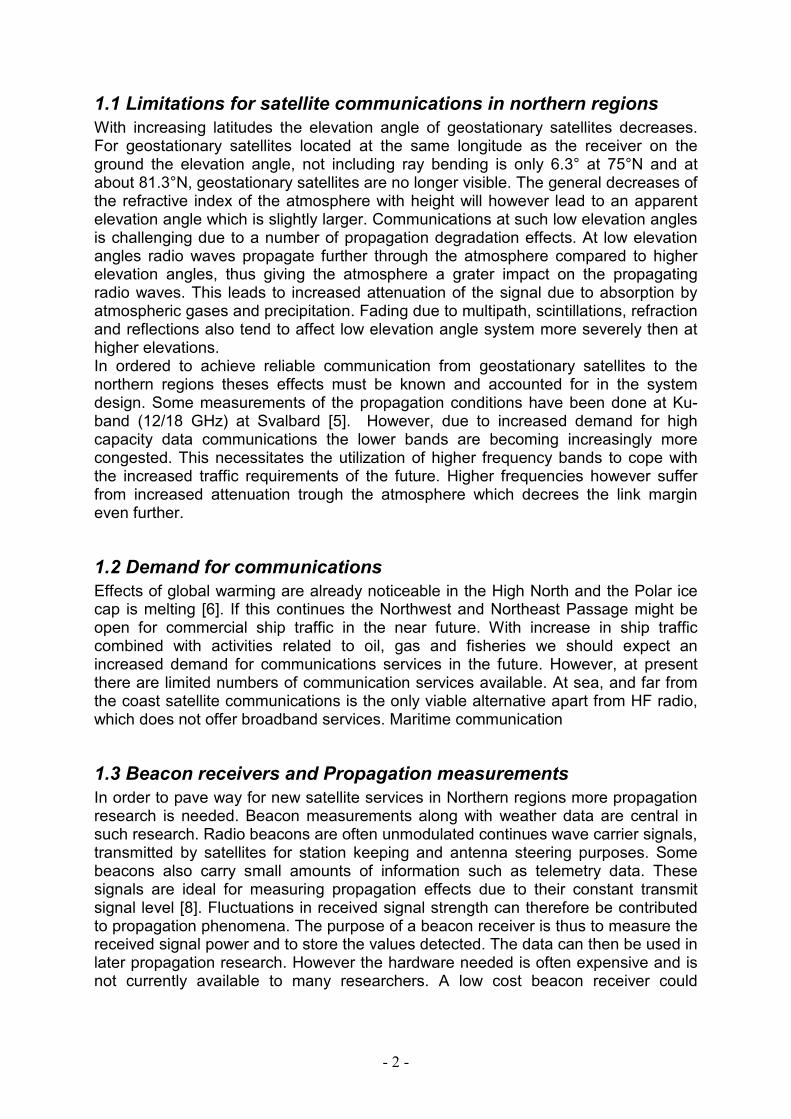
1.1 Limitations for satellite communications in northern regions
With increasing latitudes the elevation angle of geostationary satellites decreases. For geostationary satellites located at the same longitude as the receiver on the ground the elevation angle, not including ray bending is only 6.3° at 75°N and at about 81.3°N, geostationary satellites are no longer visible. The general decreases of the refractive index of the atmosphere with height will however lead to an apparent elevation angle which is slightly larger. Communications at such low elevation angles is challenging due to a number of propagation degradation effects. At low elevation angles radio waves propagate further through the atmosphere compared to higher elevation angles, thus giving the atmosphere a grater impact on the propagating radio waves. This leads to increased attenuation of the signal due to absorption by atmospheric gases and precipitation. Fading due to multipath, scintillations, refraction and reflections also tend to affect low elevation angle system more severely then at higher elevations. In ordered to achieve reliable communication from geostationary satellites to the northern regions theses effects must be known and accounted for in the system design. Some measurements of the propagation conditions have been done at Ku-band (12/18 GHz) at Svalbard [5]. However, due to increased demand for high capacity data communications the lower bands are becoming increasingly more congested. This necessitates the utilization of higher frequency bands to cope with the increased traffic requirements of the future. Higher frequencies however suffer from increased attenuation trough the atmosphere which decrees the link margin even further.
1.2 Demand for communications
Effects of global warming are already noticeable in the High North and the Polar ice cap is melting [6]. If this continues the Northwest and Northeast Passage might be open for commercial ship traffic in the near future. With increase in ship traffic combined with activities related to oil, gas and fisheries we should expect an increased demand for communications services in the future. However, at present there are limited numbers of communication services available. At sea, and far from the coast satellite communications is the only viable alternative apart from HF radio, which does not offer broadband services. Maritime communication
1.3 Beacon receivers and Propagation measurements
In order to pave way for new satellite services in Northern regions more propagation research is needed. Beacon measurements along with weather data are central in such research. Radio beacons are often unmodulated continues wave carrier signals, transmitted by satellites for station keeping and antenna steering purposes. Some beacons also carry small amounts of information such as telemetry data. These signals are ideal for measuring propagation effects due to their constant transmit signal level [8]. Fluctuations in received signal strength can therefore be contributed to propagation phenomena. The purpose of a beacon receiver is thus to measure the received signal power and to store the values detected. The data can then be used in later propagation research. However the hardware needed is often expensive and is not currently available to many researchers. A low cost beacon receiver could
- 3 -
therefore help to improve data availability for future research, without exhausting the funds available to such activities.
1.4 Software defined radio
A Software Defined Radio (SDR) is radio where selected analog components have been replaced by software [9]. By digitizing radio signals, operations traditionally performed in hardware can be performed in software. Analog components such as filters, mixers and phase locked loops are implemented using digital signal processing techniques. In turn this creates new opportunities in the design of radio receiving equipment. By replacing fairly expensive analog components with free open source software code the cost of building a beacon receiver might be reduced. Changes and modifications can also be done to the receiver without the need to replace expensive hardware components. At the center of the software radio is the analog to digital converter (ADC). Modern ADC’s can digitize wide bandwidth signals at carrier frequencies up to several hundred MHz. As an example, Analog devices [10] provide A/D converters for less than 20 dollars that can digitize signals more than 30 MHz wide at a resolution of 12 bits. This is far from the frequencies used in satellite communications so an analog front-end is needed for frequency conversion and amplification. By digitizing at a moderate intermediate frequency, flexibility can be achieved by using digital signal processing techniques.
1.5 Universal Software Radio Peripheral
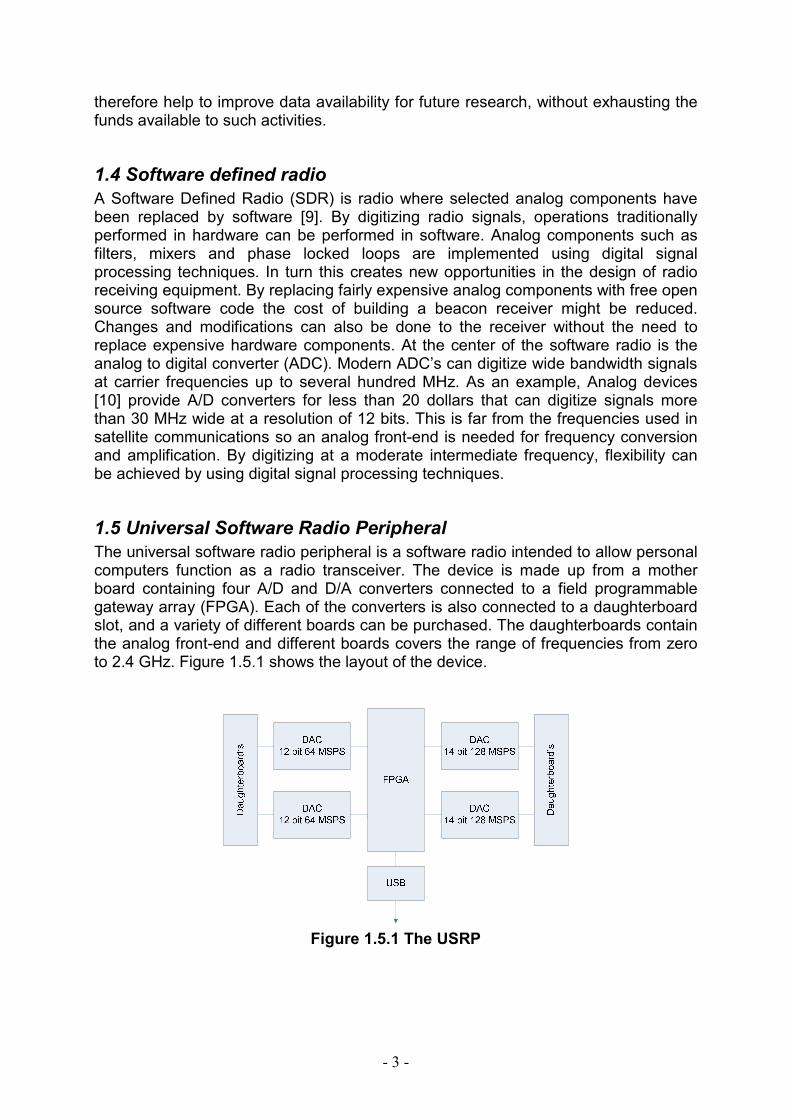
The universal software radio peripheral is a software radio intended to allow personal computers function as a radio transceiver. The device is made up from a mother board containing four A/D and D/A converters connected to a field programmable gateway array (FPGA). Each of the converters is also connected to a daughterboard slot, and a variety of different boards can be purchased. The daughterboards contain the analog front-end and different boards covers the range of frequencies from zero to 2.4 GHz. Figure 1.5.1 shows the layout of the device.
Figure 1.5.1 The USRP
- 4 -
The FPGA is used to perform basic signal processing tasks such as digital down conversion, decimation and filtering thus lightening the load of the computer processor. Some daughterboard’s can also be controlled via the motherboard to adjust mixer frequency and channel filter. An USB 2.0 connection is used to connect the USRP to a pc, giving a maximum transfer rate of 480 Mbit/s or 60 MB/s.
1.6 The GNU radio framework
The gnu radio framework is a free open source software package for the development of software radios. Software code is divided into signal processing blocks, where several blocks can be combined to create a complete software radio. The signal processing blocks are written in the programming language C++ and Python is used to tie them together. GNU radio is thus made up by a combination of the two languages. In this way existing blocks can be used to realize the intended functionality. Although primarily developed for Linux platforms the GNU radio software can be run in most operating systems. GNU radio has an online community constantly improving and developing new code. The community also offers an extensive knowledge data base along with online forums for help and support.
1.7 Outline of this thesis
In this thesis the possibility of building a low cost beacon receiver using digital signal processing techniques is evaluated. First link budgets are derived and presented with focus on the High North and low elevation angles. Topics such as satellite visibility, propagation distance and link analysis is covered. A list of available Ka-band (20 GHz) beacons along with their characteristic are then listed together with information about the respective satellites. Some Ku-band beacons are also listed. Different analog and digital RF-components are then evaluated in order to get an overview of the options available, with respect to building and implementing the receiver. The basic building blocks of the RF front-end are presented along with considerations about their function, characteristics, cost and availability. Based on the information gathered from these considerations different receiver designs are proposed. The cost of the different designs is then evaluated. The result of this evaluation leads to the decision to look for alternative methods to implement the hardware portion of the design. As a result the USRP is chosen as the hardware portion of the receiver. A description of the hardware and software related to this device is then given. The performance of the USRP is then tested with a signal generator and a Ku-band VSAT antenna. Finally a conclusion is presented along with suggestions fore further work.
- 5 -
Chapter 2
Link budget calculations
As part of the design and planning of a beacon measurement system a link-budget is needed. This Section will deal with these calculations and the methods used to construct the link-budget. The results of these calculations are then used as a basis for deciding the design and requirements of the beacon receiver. In order to estimate the performance of the communication system the losses and gains between the transmitter and receiver are estimated for clear air conditions.
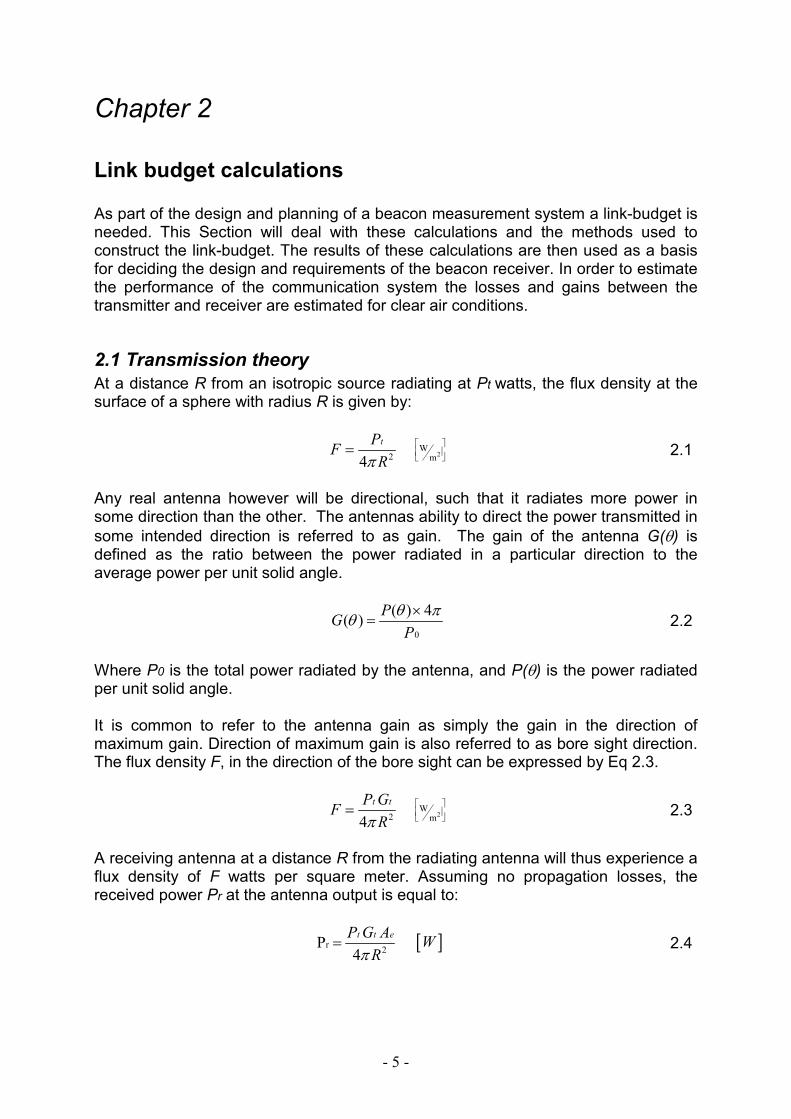
2.1 Transmission theory
At a distance R from an isotropic source radiating at Pt watts, the flux density at the surface of a sphere with radius R is given by:
24
tPF
Rπ= 2
Wm
2.1
Any real antenna however will be directional, such that it radiates more power in some direction than the other. The antennas ability to direct the power transmitted in some intended direction is referred to as gain. The gain of the antenna G(θ) is defined as the ratio between the power radiated in a particular direction to the average power per unit solid angle.
0
( ) 4( )
PG
P
θ πθ
×=
2.2
Where P0 is the total power radiated by the antenna, and P(θ) is the power radiated per unit solid angle. It is common to refer to the antenna gain as simply the gain in the direction of maximum gain. Direction of maximum gain is also referred to as bore sight direction. The flux density F, in the direction of the bore sight can be expressed by Eq 2.3.
24
t tP GF
Rπ= 2
Wm
2.3
A receiving antenna at a distance R from the radiating antenna will thus experience a flux density of F watts per square meter. Assuming no propagation losses, the received power Pr at the antenna output is equal to:
r2
P4
t t eP G A
Rπ= [ ]W 2.4
- 6 -
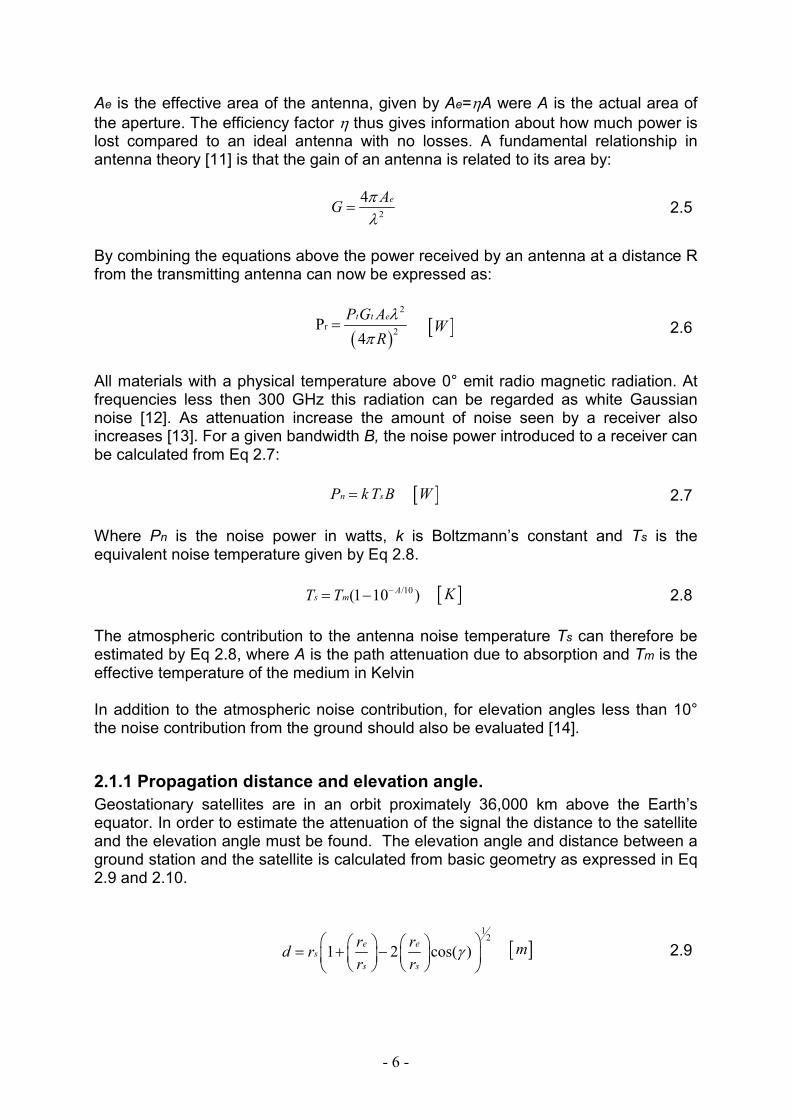
Ae is the effective area of the antenna, given by Ae=ηA were A is the actual area of
the aperture. The efficiency factor η thus gives information about how much power is lost compared to an ideal antenna with no losses. A fundamental relationship in antenna theory [11] is that the gain of an antenna is related to its area by:
2
4 eAG
πλ
=
2.5
By combining the equations above the power received by an antenna at a distance R from the transmitting antenna can now be expressed as:
( )
2
r2
P4
t t eP G A
R
λ
π= [ ]W 2.6
All materials with a physical temperature above 0° emit radio magnetic radiation. At frequencies less then 300 GHz this radiation can be regarded as white Gaussian noise [12]. As attenuation increase the amount of noise seen by a receiver also increases [13]. For a given bandwidth B, the noise power introduced to a receiver can be calculated from Eq 2.7:
n sP kT B= [ ]W 2.7
Where Pn is the noise power in watts, k is Boltzmann’s constant and Ts is the equivalent noise temperature given by Eq 2.8.
/10(1 10 )A
s mT T −= − [ ]K 2.8
The atmospheric contribution to the antenna noise temperature Ts can therefore be estimated by Eq 2.8, where A is the path attenuation due to absorption and Tm is the effective temperature of the medium in Kelvin In addition to the atmospheric noise contribution, for elevation angles less than 10° the noise contribution from the ground should also be evaluated [14].
2.1.1 Propagation distance and elevation angle.
Geostationary satellites are in an orbit proximately 36,000 km above the Earth’s equator. In order to estimate the attenuation of the signal the distance to the satellite and the elevation angle must be found. The elevation angle and distance between a ground station and the satellite is calculated from basic geometry as expressed in Eq 2.9 and 2.10.
12
1 2 cos( )e e
s
s s
r rd r
r rγ
= + −
[ ]m 2.9
- 7 -
1
cos( )
tansin( )
s
e
r
rEl
γγ
γ−
− = −
[ ]� 2.10
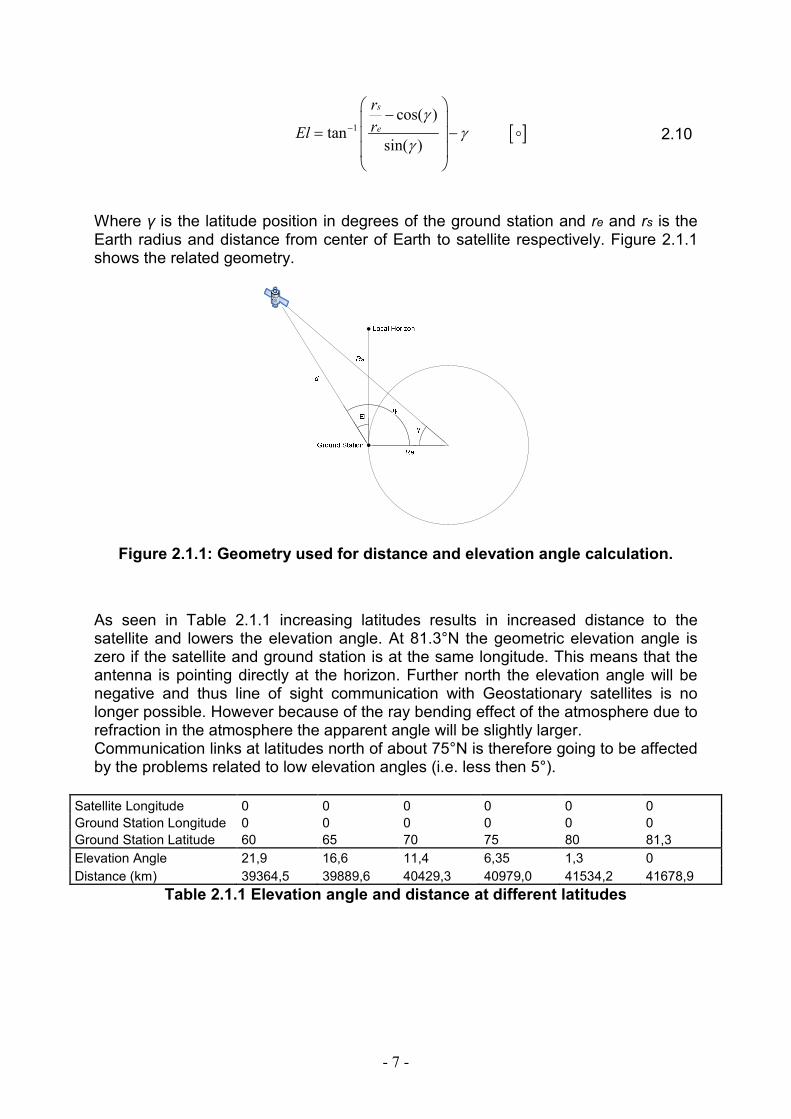
Where γ is the latitude position in degrees of the ground station and re and rs is the Earth radius and distance from center of Earth to satellite respectively. Figure 2.1.1 shows the related geometry.
Figure 2.1.1: Geometry used for distance and elevation angle calculation.
As seen in Table 2.1.1 increasing latitudes results in increased distance to the satellite and lowers the elevation angle. At 81.3°N the geometric elevation angle is zero if the satellite and ground station is at the same longitude. This means that the antenna is pointing directly at the horizon. Further north the elevation angle will be negative and thus line of sight communication with Geostationary satellites is no longer possible. However because of the ray bending effect of the atmosphere due to refraction in the atmosphere the apparent angle will be slightly larger. Communication links at latitudes north of about 75°N is therefore going to be affected by the problems related to low elevation angles (i.e. less then 5°).
Satellite Longitude 0 0 0 0 0 0
Ground Station Longitude 0 0 0 0 0 0
Ground Station Latitude 60 65 70 75 80 81,3
Elevation Angle 21,9 16,6 11,4 6,35 1,3 0
Distance (km) 39364,5 39889,6 40429,3 40979,0 41534,2 41678,9
Table 2.1.1 Elevation angle and distance at different latitudes
- 8 -
2.2 Link budget
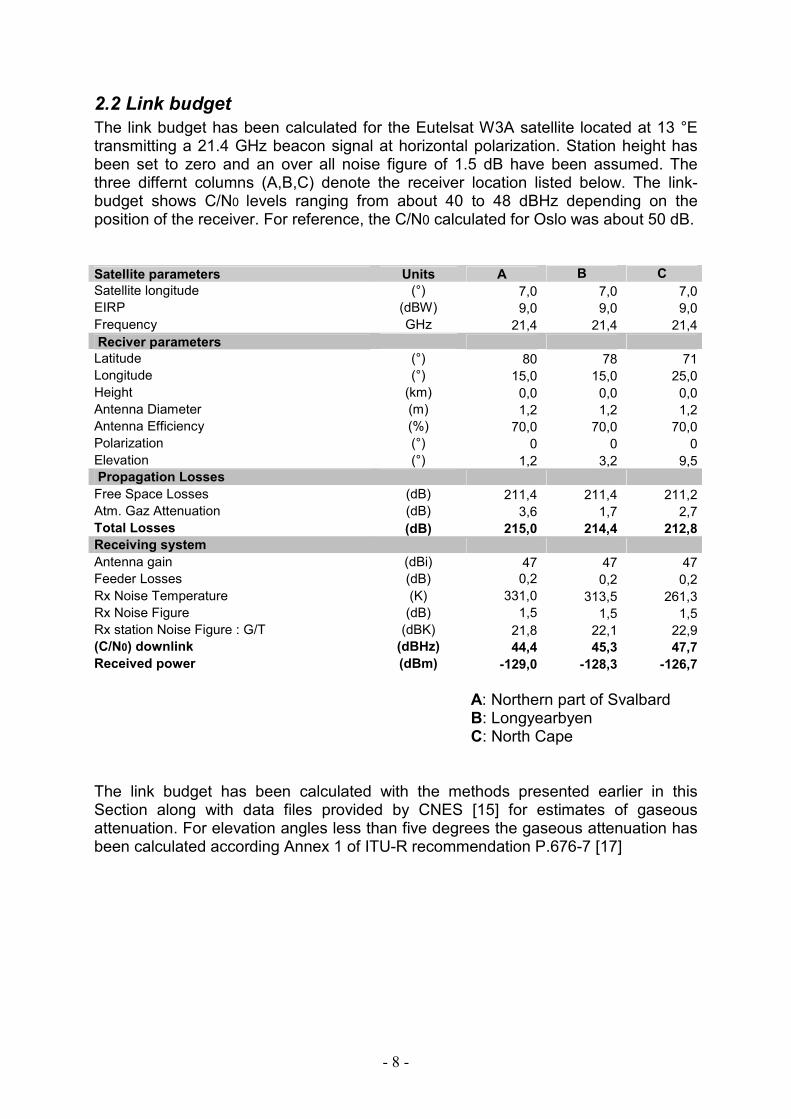
The link budget has been calculated for the Eutelsat W3A satellite located at 13 °E transmitting a 21.4 GHz beacon signal at horizontal polarization. Station height has been set to zero and an over all noise figure of 1.5 dB have been assumed. The three differnt columns (A,B,C) denote the receiver location listed below. The link-budget shows C/N0 levels ranging from about 40 to 48 dBHz depending on the position of the receiver. For reference, the C/N0 calculated for Oslo was about 50 dB.
A: Northern part of Svalbard B: Longyearbyen C: North Cape
The link budget has been calculated with the methods presented earlier in this Section along with data files provided by CNES [15] for estimates of gaseous attenuation. For elevation angles less than five degrees the gaseous attenuation has been calculated according Annex 1 of ITU-R recommendation P.676-7 [17]
Satellite parameters Units A B C
Satellite longitude (°) 7,0 7,0 7,0 EIRP (dBW) 9,0 9,0 9,0 Frequency GHz 21,4 21,4 21,4
Reciver parameters Latitude (°) 80 78 71 Longitude (°) 15,0 15,0 25,0 Height (km) 0,0 0,0 0,0 Antenna Diameter (m) 1,2 1,2 1,2 Antenna Efficiency (%) 70,0 70,0 70,0 Polarization (°) 0 0 0 Elevation (°) 1,2 3,2 9,5 Propagation Losses Free Space Losses (dB) 211,4 211,4 211,2 Atm. Gaz Attenuation (dB) 3,6 1,7 2,7 Total Losses (dB) 215,0 214,4 212,8 Receiving system Antenna gain (dBi) 47 47 47 Feeder Losses (dB) 0,2 0,2 0,2 Rx Noise Temperature (K) 331,0 313,5 261,3 Rx Noise Figure (dB) 1,5 1,5 1,5 Rx station Noise Figure : G/T (dBK) 21,8 22,1 22,9 (C/N0) downlink (dBHz) 44,4 45,3 47,7
Received power (dBm) -129,0 -128,3 -126,7
- 9 -
Chapter 3
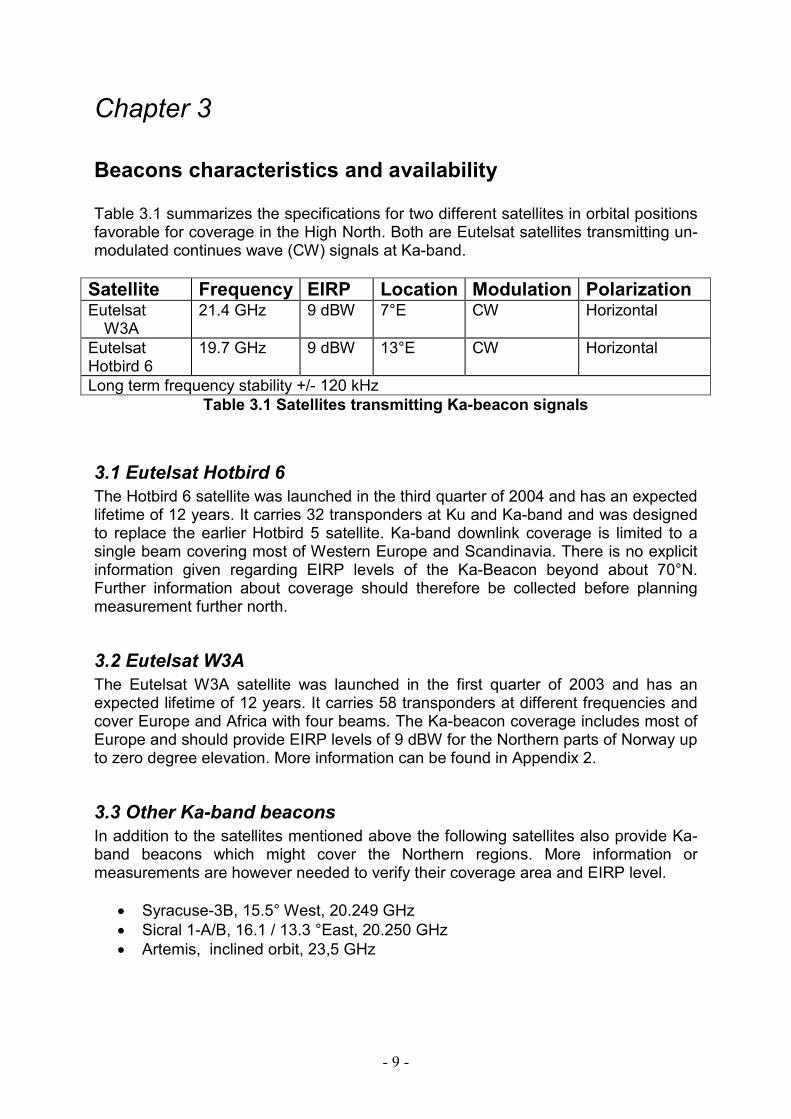
Beacons characteristics and availability Table 3.1 summarizes the specifications for two different satellites in orbital positions favorable for coverage in the High North. Both are Eutelsat satellites transmitting un-modulated continues wave (CW) signals at Ka-band.
Satellite Frequency EIRP Location Modulation Polarization Eutelsat
W3A 21.4 GHz 9 dBW 7°E CW Horizontal
Eutelsat Hotbird 6
19.7 GHz 9 dBW 13°E CW Horizontal
Long term frequency stability +/- 120 kHz Table 3.1 Satellites transmitting Ka-beacon signals
3.1 Eutelsat Hotbird 6
The Hotbird 6 satellite was launched in the third quarter of 2004 and has an expected lifetime of 12 years. It carries 32 transponders at Ku and Ka-band and was designed to replace the earlier Hotbird 5 satellite. Ka-band downlink coverage is limited to a single beam covering most of Western Europe and Scandinavia. There is no explicit information given regarding EIRP levels of the Ka-Beacon beyond about 70°N. Further information about coverage should therefore be collected before planning measurement further north.
3.2 Eutelsat W3A
The Eutelsat W3A satellite was launched in the first quarter of 2003 and has an expected lifetime of 12 years. It carries 58 transponders at different frequencies and cover Europe and Africa with four beams. The Ka-beacon coverage includes most of Europe and should provide EIRP levels of 9 dBW for the Northern parts of Norway up to zero degree elevation. More information can be found in Appendix 2.
3.3 Other Ka-band beacons
In addition to the satellites mentioned above the following satellites also provide Ka-band beacons which might cover the Northern regions. More information or measurements are however needed to verify their coverage area and EIRP level.
• Syracuse-3B, 15.5° West, 20.249 GHz • Sicral 1-A/B, 16.1 / 13.3 °East, 20.250 GHz • Artemis, inclined orbit, 23,5 GHz

- 10 -
3.4 Ku-band beacons
At Ku-band there are several satellites transmitting beacon signals which has coverage in the Northern parts of Norway. Some of these satellites are given in the list below [39].
• Thor 3/5, 1°W • Atlantic Bird 3, 5°W • Hotbird 1/3/8, 13 °E
- 11 -
Chapter 4
Beacon receiver specifications
Satellite beacons are low power signals transmitted for antenna steering, power control, telemetry and research [19]. Many beacons are also un-modulated carriers transmitted continuously at a constant EIRP level. This makes beacons well suited for propagation measurements due to their constant signal level and stable frequency. Since there normally is no data modulated onto these signals the beacon receiver needs only to measure the received signal strength or amplitude over a narrow bandwidth. Because the signal is transmitted at a constant level any variations in flux density at the ground can thus be attributed to propagation effects. The lack of modulation also means that the signal energy should be located inside a narrow bandwidth. In this Section the specifications for the receiver is derived based on information concerning available Ka-band beacons, link budgets and comparison to other beacon receivers.
4.1 Dynamic range
Signal impairments due to fading and attenuation are expected to produce considerable variations in the received signal power and carrier to noise ratio. Attenuation in excess of 30 dB should be expected fore small percentages of time in the Northern regions. Even higher values are expected at the lowest elevation angles where the signal trajectory is at grazing angle to the horizon. Different antenna sizes and receiver locations also affect the signal level presented to the receiver. In order to allow for some variations in signal level the receiver should have a dynamic range larger than the signal variations it is meant to measure. Calculations from the link budget in Section 2, indicate that a for antenna sizes in the range 1-3 m. The largest attenuation measurable will be set by the carrier to noise threshold of the receiver and not the dynamic range. A dynamic range of 50 dB should therefore be sufficient given that fades of at least 30 dB are to be measured.
4.2 Noise
In the link budget calculations it was shown that an antenna of 1.2 m diameter would provide about 47 dB gain at Ka-band (20 GHz). This will typically produce C/N0 levels at about 40 dBHz, assuming the receiver has an overall noise factor of 2 dB. Given that the receiver is to track signals during attenuation up to 30 dB a carrier to noise threshold of about 10 dBHz or better must be achieved. However the actual carrier to noise threshold that can be achieved is dependent on the techniques used in the power estimation and the overall noise factor of the receiver. An absolute requirement to the C/N threshold and noise factor might however be in conflict with the goal of constructing a low cost receiver. It might therefore be more constructive to have a 10 dB C/N threshold and 2 dB noise figure as a design goal rather than an absolute requirement.
- 12 -
4.3 Linearity
The purpose of the beacon receiver is to measure variations in signal strength due to propagation effects. Unlinearity in the receiving system should therefore be kept low. Unlinearity in the receiver it self might degrade the measured data and might be considered as noise. Components with good linearity should therefore be used in order to minimize the unlinearity of the receiver. Furthermore the design should make sure that all components function inside their linear operating area. An overall variation in linearity of less than 10 % should be achieved.
4.4 Sampling rate
In order to record rapid amplitude fluctuations in signal strength the sampling rate of the receiver i.e. the number of measurements per second needs to be sufficient to track these changes accurately. It would be preferable if the sampling rate could be changed depending on the propagation conditions and measurement period. In this way one can reduce the amount of data being recorded under periods of little activity. Thus reducing the amount of storage space needed. Based on previous beacon receiver developments [8], the receiver should be able to sample at rates of at least two samples per second to record scintillations. An adjustable sampling rate between 2 and 20 samples per second should therefore ensure that most propagation phenomena could be measured accurately.
4.5 Operational characteristics
In order to allow for long term measurements over several months, the receiver should be completely self sustaining. The system should automatically search and lock on to a beacon in the event of signal loss. Also a search for signals inside the bandwidth should be performed automatically at regular intervals to make sure the receiver is locked to the correct signal and not a spurious.
4.6 Data handling
Measurements made by the receivers must be stored digitally and in a suitable format. Simply dumping the recorded data to file will however lead to a continuously increasing file size. The recorded data should therefore be stored to file at regular time intervals. In this way individual files are at kept a reasonable size for later processing. This also provides a safety function, where only the data in the current file are lost in the event of malfunction or power loss. Recoded data should also be saved with a timestamp and information about frequency. This is necessary for comparing the recordings with other information such as weather data or other effects.
4.7 Signal processing
The receiver should only perform the signal processing absolutely necessary, where the ideal solution is to record the entire spectrum available. This is however unrealistic due to limitations in storage capacity. Some processing is therefore
- 13 -
necessary to reduce the amount of data to be stored. The receiver should therefore be capable of performing the following tasks:
• Digital down conversion • Anti aliasing Filtering • Decimation • FFT calculations
4.8 Flexibility
Preferably the receiver should also be as flexible as possible and allow for future extension in functionality and measurements of different frequencies. Such future extensions might include diversity measurements, phase coherent measurements, addition of wheatear data and so on.
4.9 Summary of specifications
• 50 dB dynamic range • C/N0 threshold of 10 dBHz • Noise figure of less than 2 dB • linearity better than +/- 10 % • Selectable sampling rates of signal strength • Automatic re acquisition • Rejection of spurious signals • Low cost
- 14 -
Chapter 5
Design considerations Several different hardware components and architectures can be used to implement a beacon receiver. The first step of the design process was therefore to get familiar with the hardware components available and their characteristics. Based on this information, different components and topologies were evaluated for the hardware implementation of the receiver. This Section is therefore concerned with the basic building blocks and topologies suitable for implementing a beacon receiver.
5.1 Analog front-end components
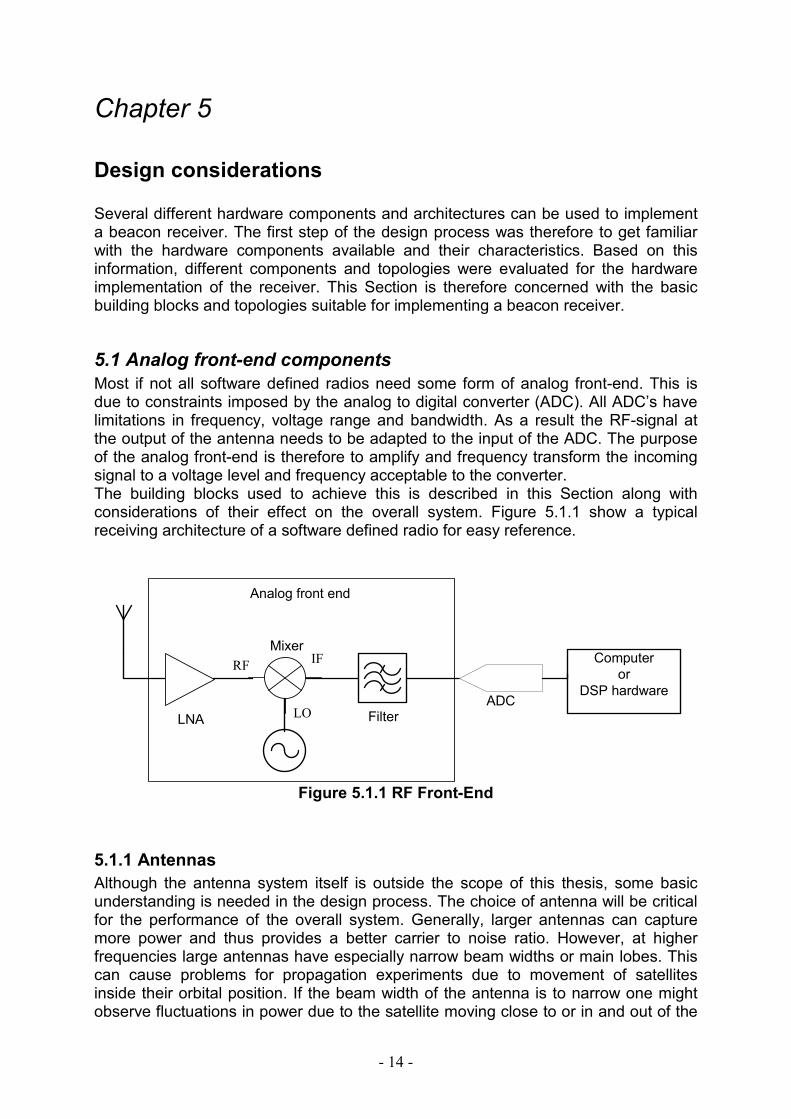
Most if not all software defined radios need some form of analog front-end. This is due to constraints imposed by the analog to digital converter (ADC). All ADC’s have limitations in frequency, voltage range and bandwidth. As a result the RF-signal at the output of the antenna needs to be adapted to the input of the ADC. The purpose of the analog front-end is therefore to amplify and frequency transform the incoming signal to a voltage level and frequency acceptable to the converter. The building blocks used to achieve this is described in this Section along with considerations of their effect on the overall system. Figure 5.1.1 show a typical receiving architecture of a software defined radio for easy reference.
IF RF
LO
LNA
ADC
Computeror
DSP hardware
Analog front end
Filter
Mixer
Figure 5.1.1 RF Front-End
5.1.1 Antennas
Although the antenna system itself is outside the scope of this thesis, some basic understanding is needed in the design process. The choice of antenna will be critical for the performance of the overall system. Generally, larger antennas can capture more power and thus provides a better carrier to noise ratio. However, at higher frequencies large antennas have especially narrow beam widths or main lobes. This can cause problems for propagation experiments due to movement of satellites inside their orbital position. If the beam width of the antenna is to narrow one might observe fluctuations in power due to the satellite moving close to or in and out of the
- 15 -
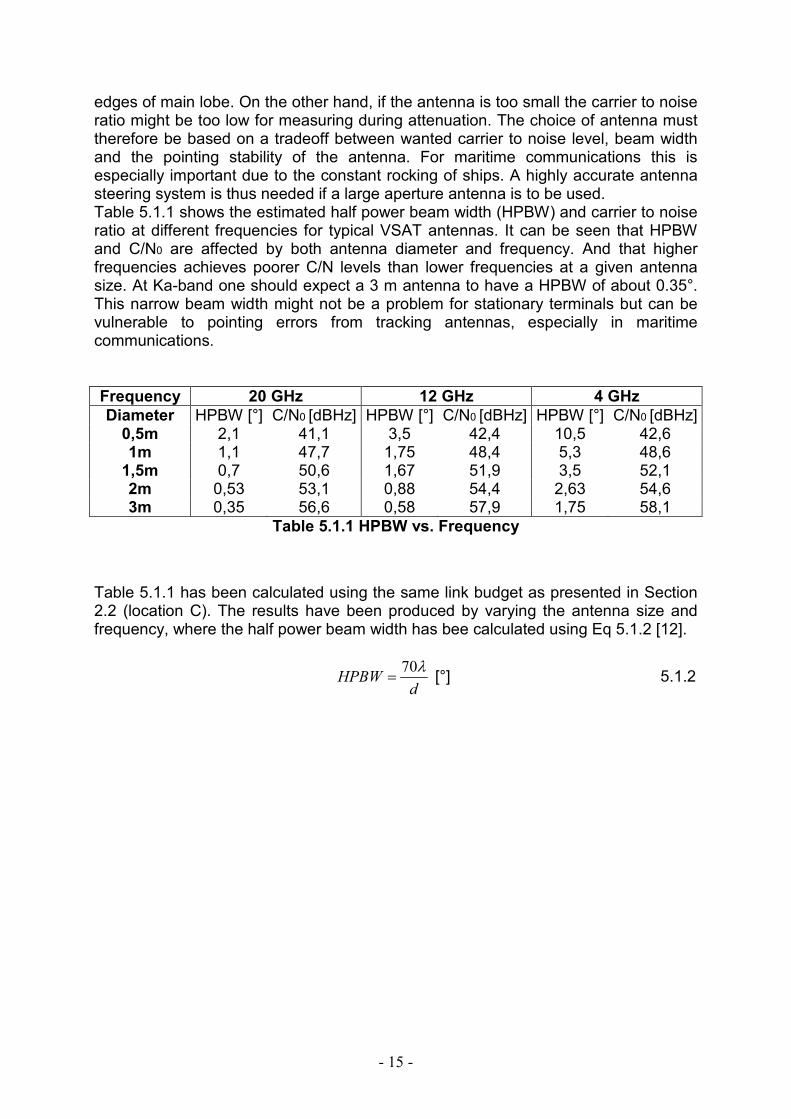
edges of main lobe. On the other hand, if the antenna is too small the carrier to noise ratio might be too low for measuring during attenuation. The choice of antenna must therefore be based on a tradeoff between wanted carrier to noise level, beam width and the pointing stability of the antenna. For maritime communications this is especially important due to the constant rocking of ships. A highly accurate antenna steering system is thus needed if a large aperture antenna is to be used. Table 5.1.1 shows the estimated half power beam width (HPBW) and carrier to noise ratio at different frequencies for typical VSAT antennas. It can be seen that HPBW and C/N0 are affected by both antenna diameter and frequency. And that higher frequencies achieves poorer C/N levels than lower frequencies at a given antenna size. At Ka-band one should expect a 3 m antenna to have a HPBW of about 0.35°. This narrow beam width might not be a problem for stationary terminals but can be vulnerable to pointing errors from tracking antennas, especially in maritime communications. Frequency 20 GHz 12 GHz 4 GHz Diameter HPBW [°] C/N0 [dBHz] HPBW [°] C/N0 [dBHz] HPBW [°] C/N0 [dBHz] 0,5m 2,1 41,1 3,5 42,4 10,5 42,6 1m 1,1 47,7 1,75 48,4 5,3 48,6 1,5m 0,7 50,6 1,67 51,9 3,5 52,1 2m 0,53 53,1 0,88 54,4 2,63 54,6 3m 0,35 56,6 0,58 57,9 1,75 58,1
Table 5.1.1 HPBW vs. Frequency
Table 5.1.1 has been calculated using the same link budget as presented in Section 2.2 (location C). The results have been produced by varying the antenna size and frequency, where the half power beam width has bee calculated using Eq 5.1.2 [12].
70
HPBWd
λ= [°] 5.1.2
- 16 -
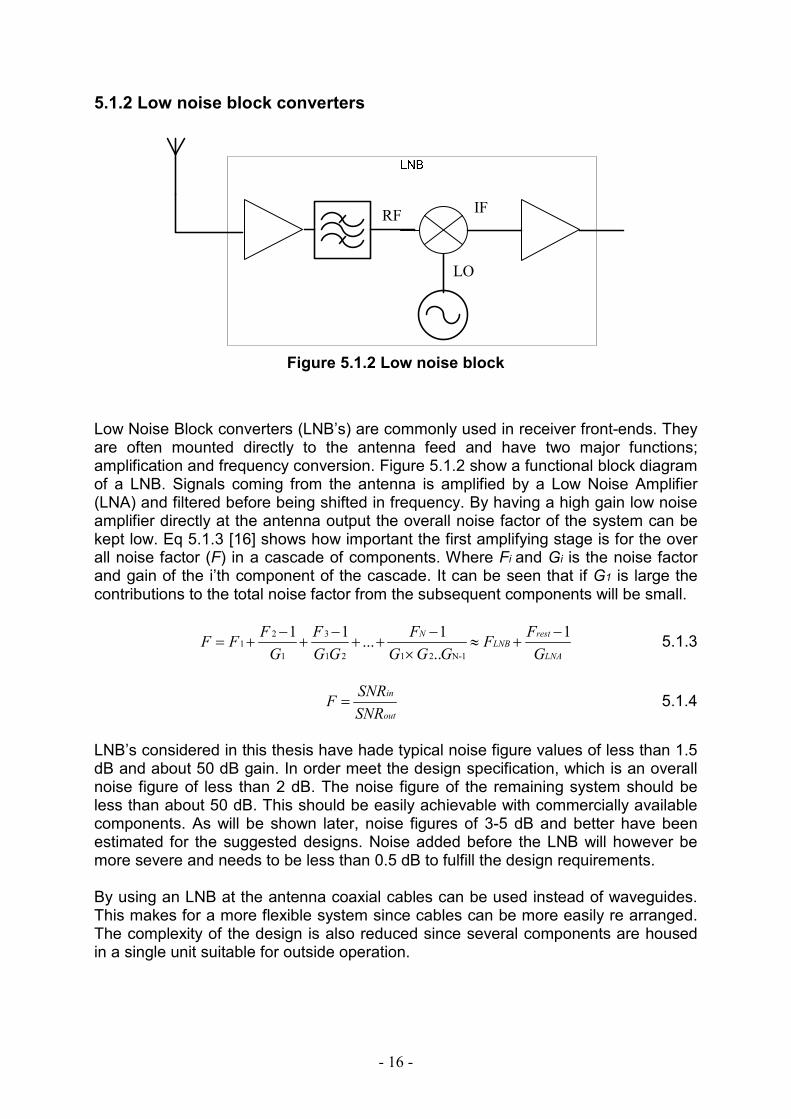
5.1.2 Low noise block converters
IF RF
LO
Figure 5.1.2 Low noise block
Low Noise Block converters (LNB’s) are commonly used in receiver front-ends. They are often mounted directly to the antenna feed and have two major functions; amplification and frequency conversion. Figure 5.1.2 show a functional block diagram of a LNB. Signals coming from the antenna is amplified by a Low Noise Amplifier (LNA) and filtered before being shifted in frequency. By having a high gain low noise amplifier directly at the antenna output the overall noise factor of the system can be kept low. Eq 5.1.3 [16] shows how important the first amplifying stage is for the over all noise factor (F) in a cascade of components. Where Fi and Gi is the noise factor and gain of the i’th component of the cascade. It can be seen that if G1 is large the contributions to the total noise factor from the subsequent components will be small.
2 31
1 1 2 1 2 N-1
1 1 1 1...
..
N restLNB
LNA
F F F FF F F
G G G G G G G
− − − −= + + + + ≈ +
× 5.1.3
in
out
SNRF
SNR= 5.1.4
LNB’s considered in this thesis have hade typical noise figure values of less than 1.5 dB and about 50 dB gain. In order meet the design specification, which is an overall noise figure of less than 2 dB. The noise figure of the remaining system should be less than about 50 dB. This should be easily achievable with commercially available components. As will be shown later, noise figures of 3-5 dB and better have been estimated for the suggested designs. Noise added before the LNB will however be more severe and needs to be less than 0.5 dB to fulfill the design requirements. By using an LNB at the antenna coaxial cables can be used instead of waveguides. This makes for a more flexible system since cables can be more easily re arranged. The complexity of the design is also reduced since several components are housed in a single unit suitable for outside operation.
- 17 -
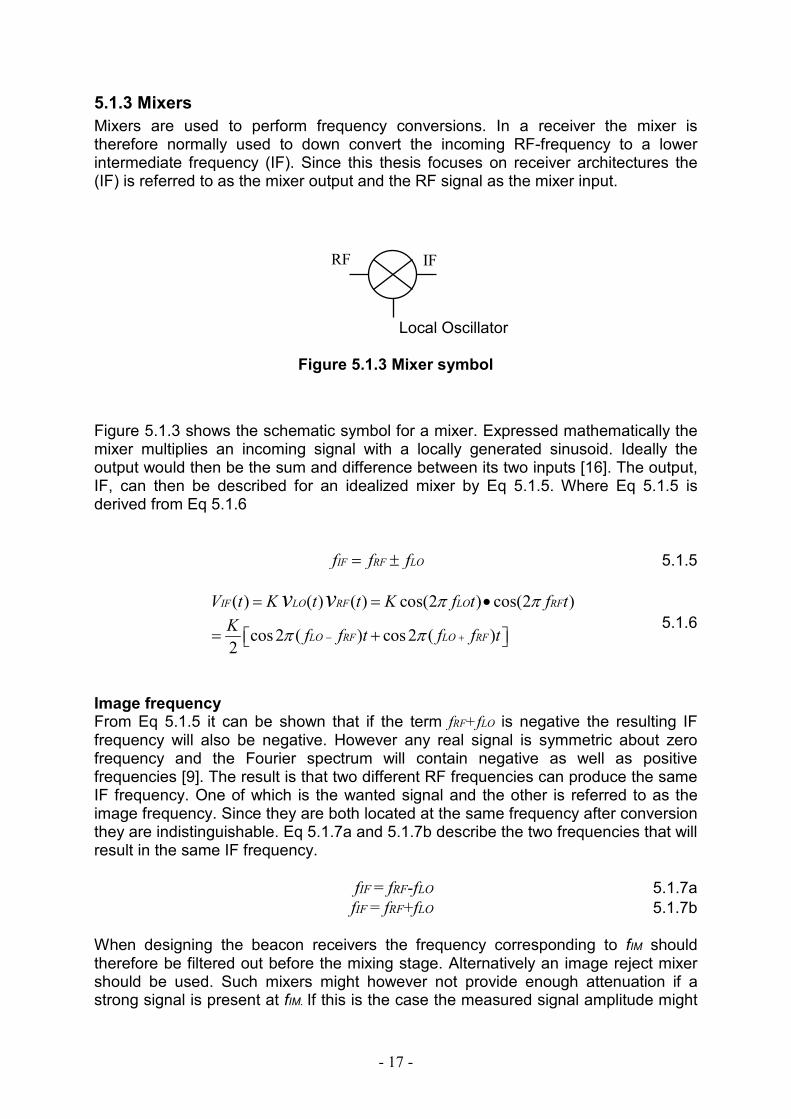
5.1.3 Mixers
Mixers are used to perform frequency conversions. In a receiver the mixer is therefore normally used to down convert the incoming RF-frequency to a lower intermediate frequency (IF). Since this thesis focuses on receiver architectures the (IF) is referred to as the mixer output and the RF signal as the mixer input.
Local Oscillator
Figure 5.1.3 Mixer symbol
Figure 5.1.3 shows the schematic symbol for a mixer. Expressed mathematically the mixer multiplies an incoming signal with a locally generated sinusoid. Ideally the output would then be the sum and difference between its two inputs [16]. The output, IF, can then be described for an idealized mixer by Eq 5.1.5. Where Eq 5.1.5 is derived from Eq 5.1.6
IF RF LOf f f= ± 5.1.5
( ) ( ) ( ) cos(2 ) cos(2 )
cos2 ( ) cos2 ( )2
IF LO RF LO RF
LO RF LO RF
V t K t t K f t f t
Kf f t f f t
v v π π
π π− +
= = •
= + 5.1.6
Image frequency From Eq 5.1.5 it can be shown that if the term fRF+fLO is negative the resulting IF frequency will also be negative. However any real signal is symmetric about zero frequency and the Fourier spectrum will contain negative as well as positive frequencies [9]. The result is that two different RF frequencies can produce the same IF frequency. One of which is the wanted signal and the other is referred to as the image frequency. Since they are both located at the same frequency after conversion they are indistinguishable. Eq 5.1.7a and 5.1.7b describe the two frequencies that will result in the same IF frequency.
fIF = fRF-fLO 5.1.7a
fIF = fRF+fLO 5.1.7b When designing the beacon receivers the frequency corresponding to fIM should therefore be filtered out before the mixing stage. Alternatively an image reject mixer should be used. Such mixers might however not provide enough attenuation if a strong signal is present at fIM. If this is the case the measured signal amplitude might
IF RF

- 18 -
be affected. Careful frequency planning is therefore needed to assure that the image frequency is kept outside the detection bandwidth or attenuated sufficiently. . Figure 5.1.4 shows the output of an ideal mixer where the doted line indicates the image frequency.
Figure 5.1.4 Ideal mixer output
Spurious responses Eq 5.1.5 is based on an ideal mixer being perfectly linear. Mixers are however unlinear devices and signal leakage between LO, RF and IF ports can occur [9]. The output of a mixer is therefore composed of a variety of harmonics and other spurious responses. Eq 5.1.8 might therefore be more descriptive of the mixer output, where m and n can take on any real positive or negative value.
IF m RF n LOf f f= − 5.1.8
Most of the harmonics produced are however small compared to the wanted signal and might end up outside the bandwidth of interest. In Table 5.1.3 a list of some of the most important response are shown. All of which can degrade system performance if they appear inside the detection bandwidth. The severity is dependent on the quality of the mixer, the power level of the signals introduced and the bandwidth of interest.
m n Signal
1 -1 Desired Signal
-1 1 Image Frequency
1 0 RF to IF leakage
0 1 LO to IF Leakage
2 -2 Second order harmonic
-2 2 Second order harmonic
Table 5.1.3 Spur Table
Careful frequency planning and filtering is needed to assure that these responses do not appear inside the bandwidth of interest or are kept below the noise floor. If this is not the case the beacon receiver might lock onto one of this spurs.
- 19 -
Isolation Leakage of power between the different ports of mixer can produce unwanted frequency components at the mixer output. This can however be alleviated by filtering and selecting mixers with good isolation between its ports. Normally the RF power level is much lower than the LO drive so that only the LO to IF and RF leakage needs to be considered. Conversion loss The conversion loss of a mixer is defined as the ratio between the available input powers to the available output power [16] as can bee seen in Eq 5.1.9. The losses are due to impendence mismatch, resistive loads and energy lost to spurious responses.
,
,
P10log( ) dB
inn RF
inn IF
LcP
= 5.1.9
The conversion loss is an important figure of merit since it is related to noise figure of the mixer [18], which in turn affects the dynamic range. A mixer with low conversion loss should therefore be used in the beacon receiver to improve dynamic range and reduce noise. LO drive Mixers are often specified to be a level N mixer where N is the recommended LO input power in dBm. Alternatively stated, the LO drive level indicate the amount of power (dBm) needed at the LO input to operate the mixer with the lowest distortion. When selecting a mixer one should therefore choose a mixer with a LO-drive matching the design requirements i.e. available LO and RF power. As a rule of thumb the LO-drive should be selected to be about 10 dB higher than the anticipated RF-level for diode mixers [20]. For FET mixers (using field effect transistors) a drive of 3 dB less than the RF-level is normally sufficient [20]. The design and choice of LO-drive should also take into consideration that the lowest level mixer also would minimize the power leakage to the system.
5.1.4 Frequency generators
The local oscillator used in the mixing stages needs to deliver a stable and spectrally pure frequency. This can be achieved by frequency synthesizers which can produce precisely controlled frequencies derived from a stable source [16]. In this thesis two different ways of implementing a frequency synthesizer has been evaluated. Those are the phase locked loop and direct digital synthesizer. Direct digital synthesizes In Direct digital synthesizes (DDS) frequencies are generated using digital techniques. The digital sine wave is then converted in to the analog domain via a digital to analog converter [16]. The advantage of this technique is that a high degree of frequency accuracy can be achieved. Since the frequency and phase is determined numerically. High frequency stability can also bee attained because there is no frequency drift due to temperature changes or ageing of the components. The drawback however is that the output frequency is limited to half the clock source frequency and that the sine wave generated suffers from distortion due to clock jitter, especially at high frequencies [9].
- 20 -
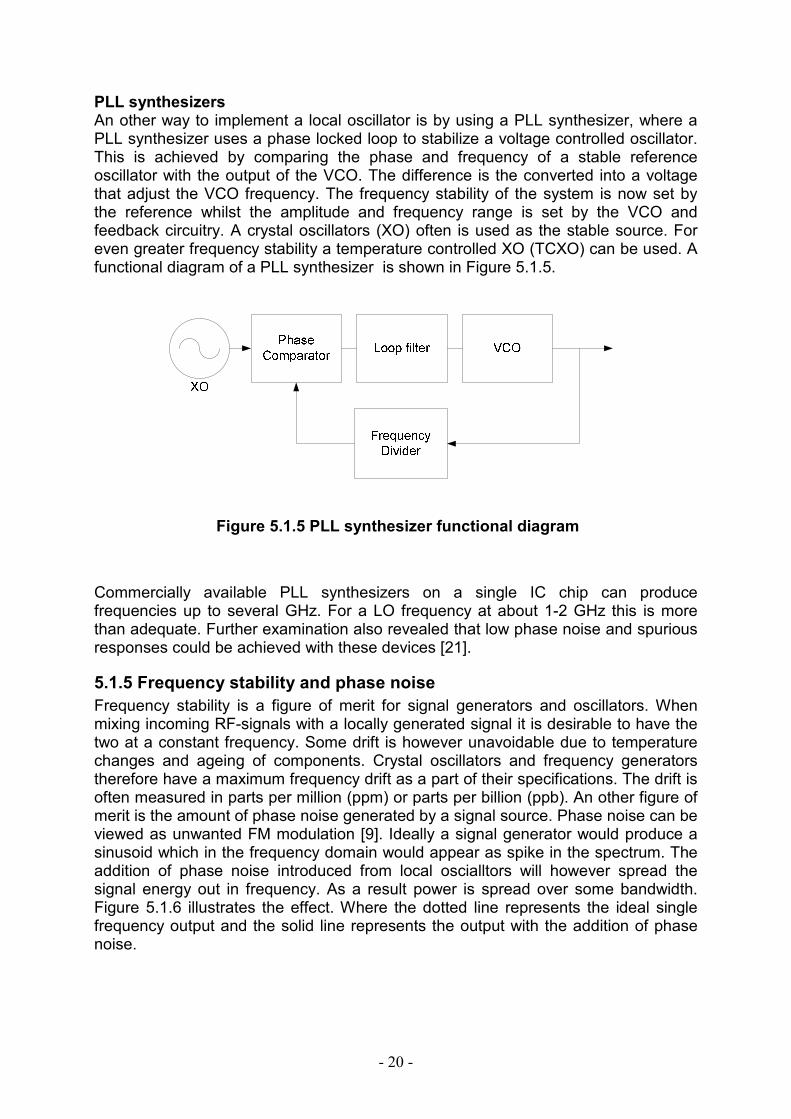
PLL synthesizers An other way to implement a local oscillator is by using a PLL synthesizer, where a PLL synthesizer uses a phase locked loop to stabilize a voltage controlled oscillator. This is achieved by comparing the phase and frequency of a stable reference oscillator with the output of the VCO. The difference is the converted into a voltage that adjust the VCO frequency. The frequency stability of the system is now set by the reference whilst the amplitude and frequency range is set by the VCO and feedback circuitry. A crystal oscillators (XO) often is used as the stable source. For even greater frequency stability a temperature controlled XO (TCXO) can be used. A functional diagram of a PLL synthesizer is shown in Figure 5.1.5.
Figure 5.1.5 PLL synthesizer functional diagram
Commercially available PLL synthesizers on a single IC chip can produce frequencies up to several GHz. For a LO frequency at about 1-2 GHz this is more than adequate. Further examination also revealed that low phase noise and spurious responses could be achieved with these devices [21].
5.1.5 Frequency stability and phase noise
Frequency stability is a figure of merit for signal generators and oscillators. When mixing incoming RF-signals with a locally generated signal it is desirable to have the two at a constant frequency. Some drift is however unavoidable due to temperature changes and ageing of components. Crystal oscillators and frequency generators therefore have a maximum frequency drift as a part of their specifications. The drift is often measured in parts per million (ppm) or parts per billion (ppb). An other figure of merit is the amount of phase noise generated by a signal source. Phase noise can be viewed as unwanted FM modulation [9]. Ideally a signal generator would produce a sinusoid which in the frequency domain would appear as spike in the spectrum. The addition of phase noise introduced from local oscialltors will however spread the signal energy out in frequency. As a result power is spread over some bandwidth. Figure 5.1.6 illustrates the effect. Where the dotted line represents the ideal single frequency output and the solid line represents the output with the addition of phase noise.
- 21 -
Figure 5.1.6 Phase Noise
In a beacon receiver, phase noise will increase the bandwidth in which the signal energy is contained, thus reducing the carrier to noise ratio. The amount of phase noise introduced should therefore be kept low.
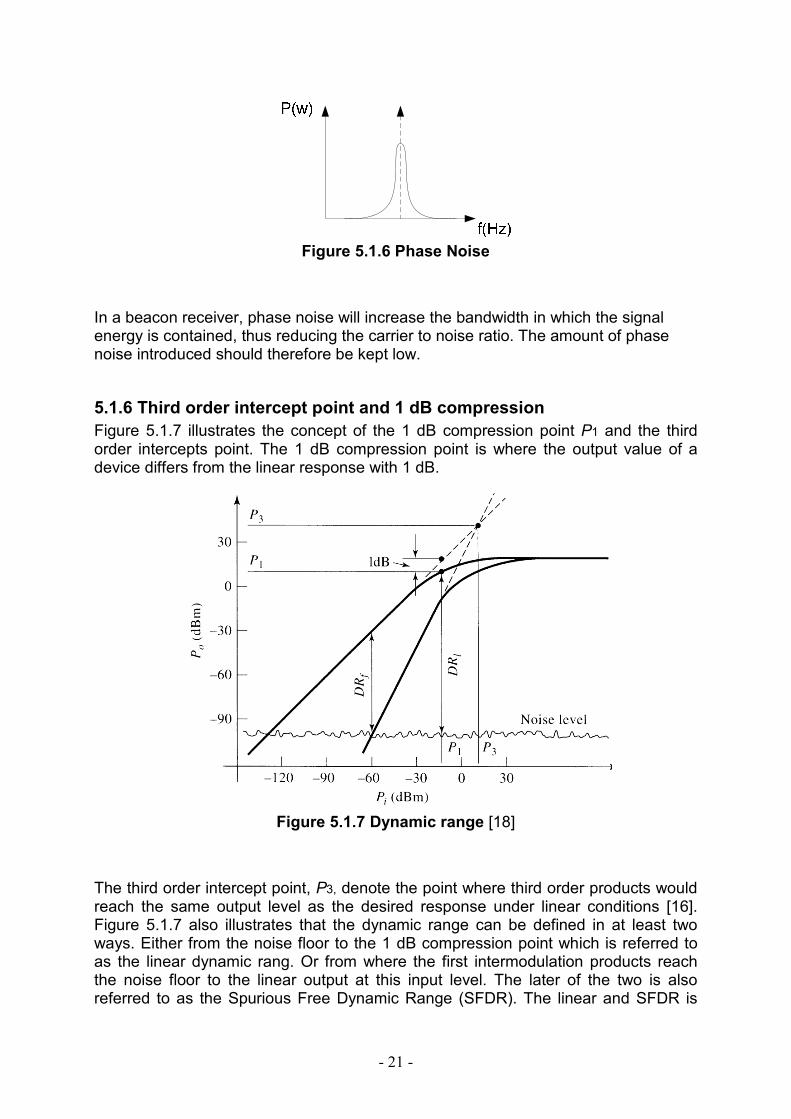
5.1.6 Third order intercept point and 1 dB compression
Figure 5.1.7 illustrates the concept of the 1 dB compression point P1 and the third order intercepts point. The 1 dB compression point is where the output value of a device differs from the linear response with 1 dB.
Figure 5.1.7 Dynamic range [18]
The third order intercept point, P3, denote the point where third order products would reach the same output level as the desired response under linear conditions [16]. Figure 5.1.7 also illustrates that the dynamic range can be defined in at least two ways. Either from the noise floor to the 1 dB compression point which is referred to as the linear dynamic rang. Or from where the first intermodulation products reach the noise floor to the linear output at this input level. The later of the two is also referred to as the Spurious Free Dynamic Range (SFDR). The linear and SFDR is

- 22 -
shown in Figure 5.1.7 as DRl and DRf respectively. Eq 5.1.10 expresses the SFDR mathematically [16], where SNRmin is the required signal to noise threshold and N0 is the noise floor (kTB).
( )3 0 min2
3fDR P N SNR= − − [dB] 5.1.10
In a beacon receiver the SFDR is especially significant. Keeping spurious and other unwanted signals below or close to the noise floor insures that the detected signal is the wanted beacon and not a locally generated spur. This would also reduce the complexity of the algorithm needed for tracking and acquisition of the signal.
Figure 5.1.8 SINAD / SFDR
5.1.7 Minimum detectable signal
The weakest signal that can be detected by a receiver is referred to as the minimum detectable signal (MDS). Eq 5.1.11 defines the MDS of a receiver [16]. Where k is Boltzmann’s constant, B is the bandwidth, TA is the antenna temperature, (F-1)T0 is the effective temperature of the receiver and (S0/NO)min is the signal to noise threshold.
[ ]min
00
0 min
( 1)i AS
S kB T F TN
= + −
5.1.11
5.1.8 Filtering
Beacon signals are often transmitted with low power close to neighboring frequency components. By filtering unwanted signals either completely or partially the power presented to receiver components can be greatly reduced. Filtering is also needed to remove spurs, avoid aliasing after digitization and removal of the image frequency. Depending on the topology of the receiver filtering can be implemented at several stages. More gain and larger dynamic range can be achieved by band pass filtering at the RF-stage. This will increase sensitivity and dynamic range since the back off (relative to the beacon power) needed to operate devices inside the linear area is reduced. Having a narrow filter at the RF stage will however limit the flexibility of the
- 23 -
reviver since a change in frequency will necessitate replacing of the filter. Alternatively a tunable filter can be used. Either way, completely isolating the wanted beacon at the RF stage will require narrow filters which are costly and often not commonly available. The solution might therefore be to filter at both RF and IF frequency. In this way a larger area of the spectrum can be preserved and channel selection can be performed at IF where the relative bandwidth is smaller. This setup allows for a more flexible design which can operate over a wide bandwidth and can be built from less costly components. This will however require a tunable local oscillator if the receiver is to function at different frequencies.
5.2 Digital hardware and architectures
5.2.1 Analog to digital converter
The purpose of the A/D converter is to digitize the incoming IF signal so that it can be processed further in software or by dedicated signal processors. The sampling rate and number of bits of the A/D converter defines the range of frequency and signal levels that can be digitized with acceptable quality. Generally higher sampling rates and more bits allow for higher frequencies and lower signal levels (i.e. greater dynamic range). However the amount of data generated must be balanced with the limitations in computational power and limitations in data transfer rates.
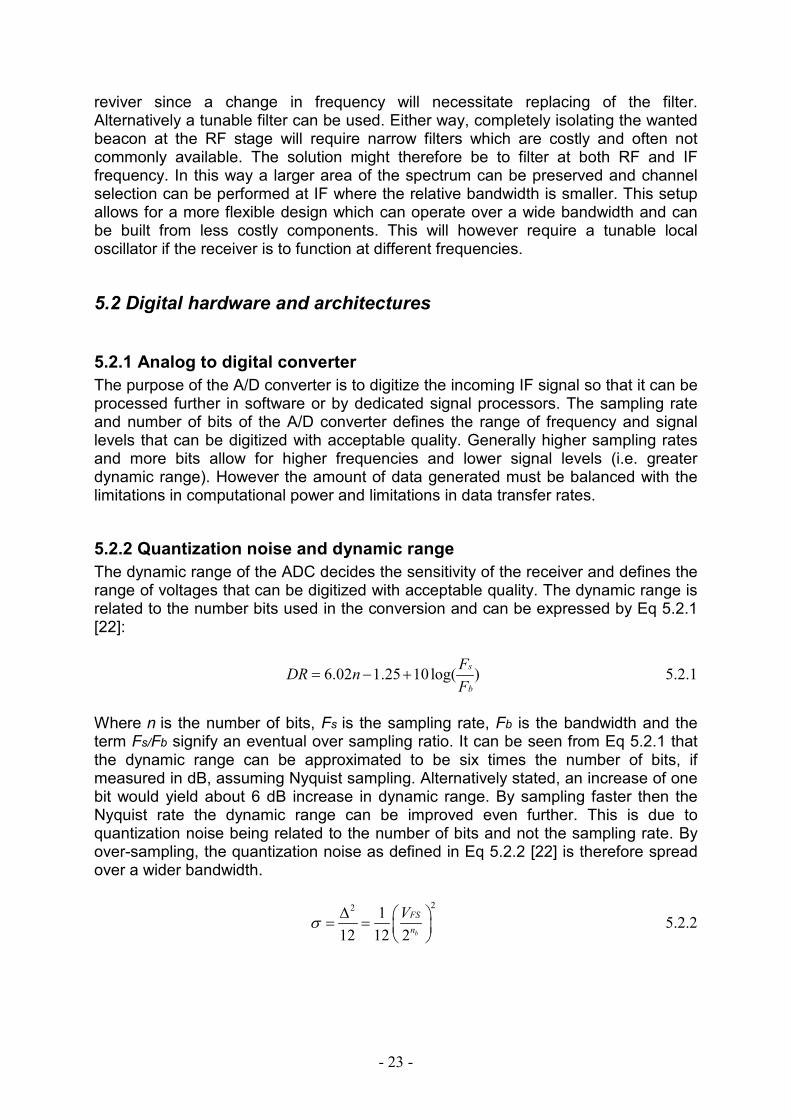
5.2.2 Quantization noise and dynamic range
The dynamic range of the ADC decides the sensitivity of the receiver and defines the range of voltages that can be digitized with acceptable quality. The dynamic range is related to the number bits used in the conversion and can be expressed by Eq 5.2.1 [22]:
6.02 1.25 10log( )s
b
FDR n
F= − + 5.2.1
Where n is the number of bits, Fs is the sampling rate, Fb is the bandwidth and the term Fs/Fb signify an eventual over sampling ratio. It can be seen from Eq 5.2.1 that the dynamic range can be approximated to be six times the number of bits, if measured in dB, assuming Nyquist sampling. Alternatively stated, an increase of one bit would yield about 6 dB increase in dynamic range. By sampling faster then the Nyquist rate the dynamic range can be improved even further. This is due to quantization noise being related to the number of bits and not the sampling rate. By over-sampling, the quantization noise as defined in Eq 5.2.2 [22] is therefore spread over a wider bandwidth.
22 1
12 12 2 b
FS
n
Vσ
∆ = =
5.2.2
- 24 -
Figure 5.2.2 illustrates how the quantization noise is spread over the digitized bandwidth. By filtering the output of the ADC the signal to quantization noise ratio inside the selected bandwidth can thus be improved.
Figure 5.2.1 Sampling Noise
From Eq 5.2.1 and 5.2.2 it is clear that an A/D converter of 9 bits is needed to achieve a dynamic range of 50 dB. However, 12 to 14 bit converters have been considered in this thesis since they are available in the same price range. The dynamic range of these converters should therefore be sufficient for measurments.
5.2.3 Jitter
The quantization noise described above is due to the mapping of continues values into discreet values. This however assumes an ideal sampling clock. Jitter in the sampling clock will however lead to uncertainties in the sampling instant and thus an error in the sampled signal [9]. The amount of noise added is dependent on the quality of the clock source used and is also more severe at higher sampling rates. A stable cock source should therefore be used to control the ADC.
5.2.4 Sampling rate
The Nyquist-Shannon theorem state that a signal with finite bandwidth can be reconstructed only if the sample rate is at least twice the bandwidth [23]. This yields two possibilities for sampling the beacon signal. Either sample at the twice the highest frequency component introduced to the ADC, known as Nyquist sampling. Or sample at twice the bandwidth of the signal, known as band pass sampling. The required sampling rate is thus determined either by the intermediate frequency where the sampling takes place or by the bandwidth of the anti-aliasing filter. Nyquist sampling can be achieved by placing a low pass filter wit cutoff frequency less than half the sampling rate in front of the ADC. This requires a lower IF frequency i.e. typically less than 50 MHz due to limitations in ADC sampling rates. Bandpass sampling evades this limitation by band-pass filtering prior to the ADC. The sampling rate needed is thus reduced to the bandwidth of the preceding filter. Since the spectrum of a digitized signal repeats itself at regular intervals this will result in a form of frequency down conversion. As long as the signal lie completely within a Nyquist band, aliasing can be avoided [9].
- 25 -
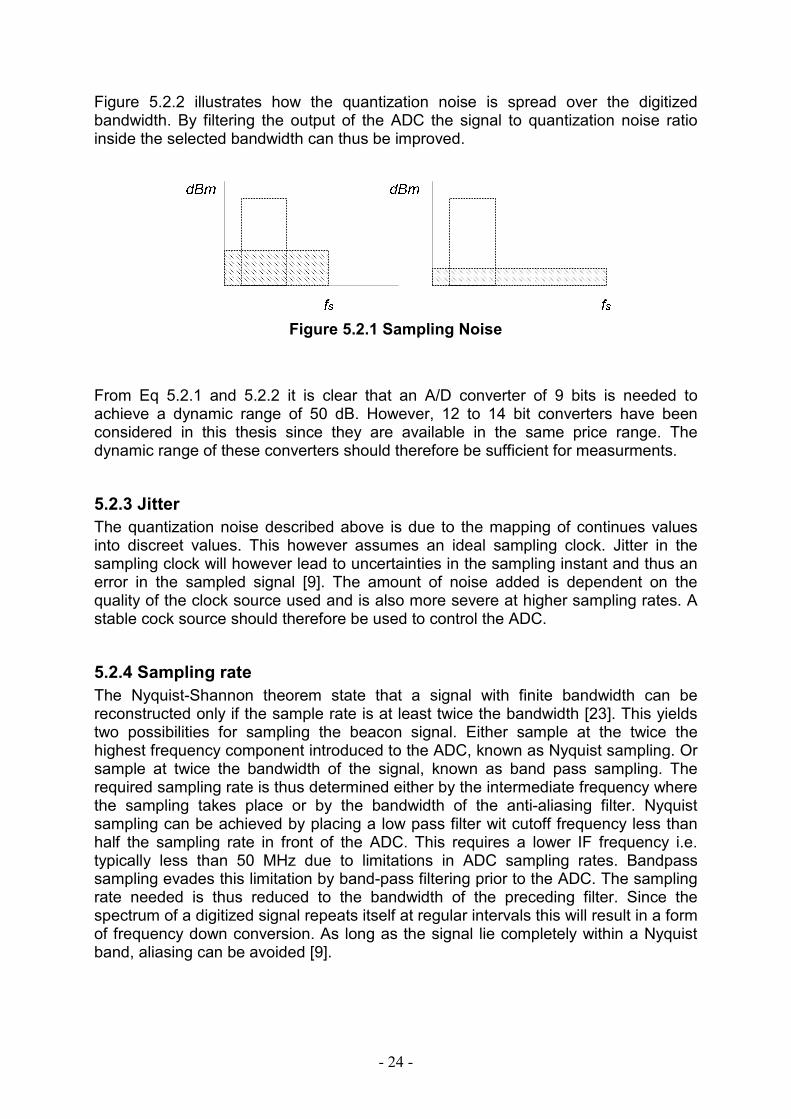
Figure 5.2.2 Bandpass sampling
Figure 5.2.2 show how frequency conversion is achieved by bandpass sampling. By sampling at twice the filter bandwidth, images of the spectrum will appear in Nyquist zones throughout the spectrum. Digital low pass filtering can then be used to select the Nyquist zone closest to baseband. In this way the highest IF frequencies that can be used are limited by the A/D converters frequency range, which again is related to input circuitry of the ADC. This does however require that all other parts of the spectra are removed so that no other frequency components will appear in any of the Nyquist zones. Selection of ADC sampling rate for the beacon receiver must thus be based on the bandwidth and frequency of the intermediate frequency to be digitized. Although both bandpass and Nyquist sampling have been considered the later approach was chouse to avoid jitter. This effectively limits the final IF frequency to less than 40 MHz due to limitations in ADC sampling rates.
5.2.5 Computer interface
An A/D converter operating at 65 MSPS with a resolution of 12 bits produce data at a rate of about 770 Mbps. This is in excesses of what a 480 Mbps USB 2.0 connections can handle. Even at 480 Mbps the amount of data needed to be processed by a computer might be too great. However the full set of data generated in the sampling process might not be needed to perform power estimates. The data rate can therefore be reduced before transferring the samples to PC. This can be achieved either by using a buffer which transfers a reduced number of samples and discards the rest or via signal processing hardware such as digital down converters and decimators.
- 26 -
5.3 Receiver architectures
At current the frequency range of commercially available and reasonable priced analog to digital converts are limited to about 100 MHz. A Radio frequency front-end is therefore unavoidable prior to digitizing satellite beacons. In this thesis two different architectures have been evaluated. Those are the direct conversion receiver and super heterodyne receiver. A brief overview of the two is presented here for the reader’s convenience.
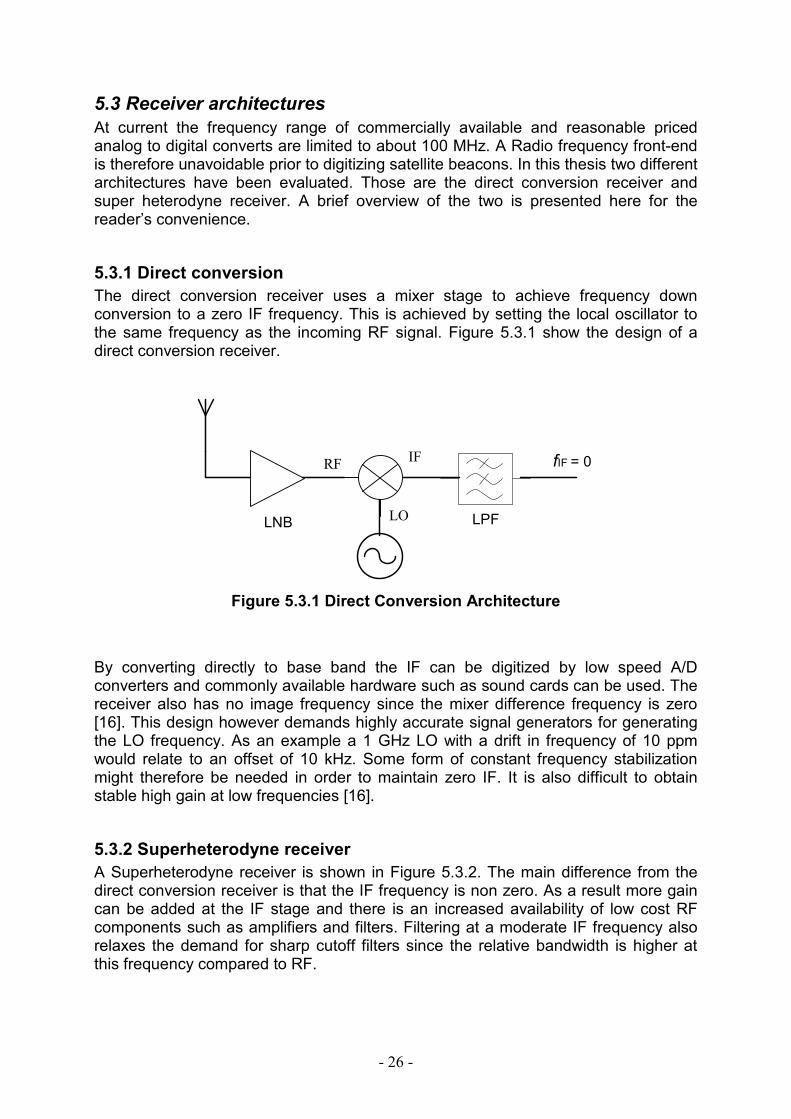
5.3.1 Direct conversion
The direct conversion receiver uses a mixer stage to achieve frequency down conversion to a zero IF frequency. This is achieved by setting the local oscillator to the same frequency as the incoming RF signal. Figure 5.3.1 show the design of a direct conversion receiver.
IF RF
LO
LNB
LPF
fIF = 0
Figure 5.3.1 Direct Conversion Architecture
By converting directly to base band the IF can be digitized by low speed A/D converters and commonly available hardware such as sound cards can be used. The receiver also has no image frequency since the mixer difference frequency is zero [16]. This design however demands highly accurate signal generators for generating the LO frequency. As an example a 1 GHz LO with a drift in frequency of 10 ppm would relate to an offset of 10 kHz. Some form of constant frequency stabilization might therefore be needed in order to maintain zero IF. It is also difficult to obtain stable high gain at low frequencies [16].
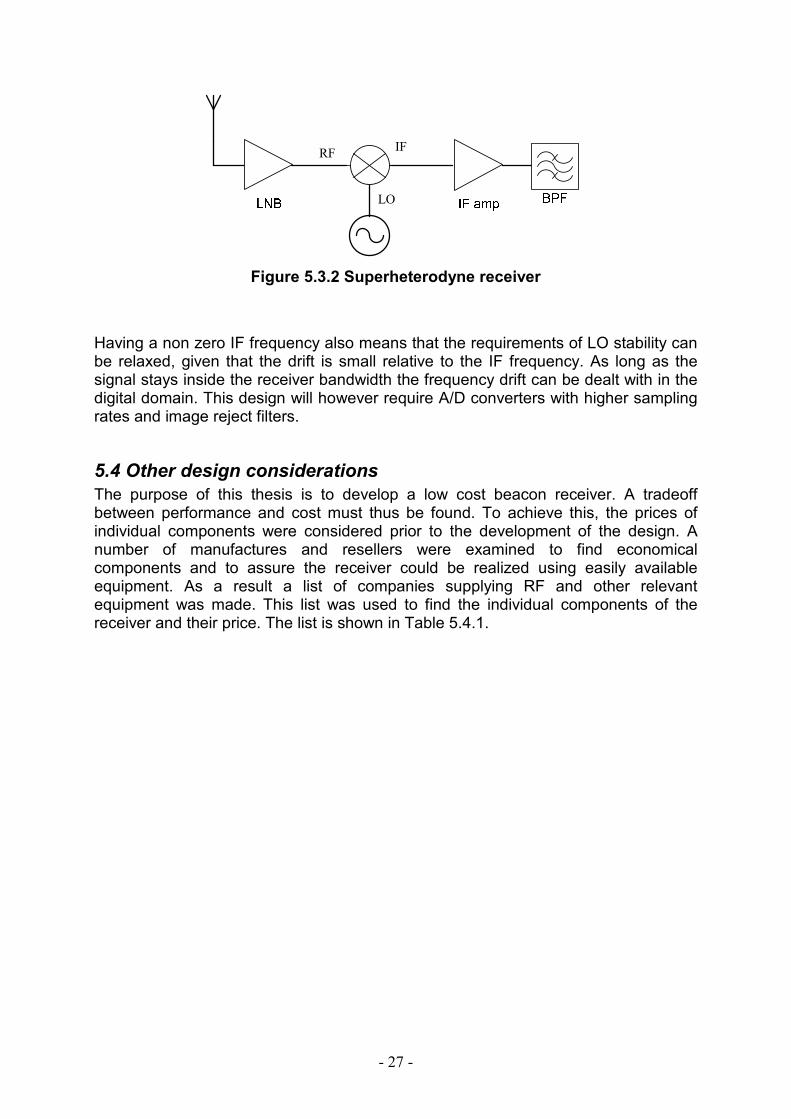
5.3.2 Superheterodyne receiver
A Superheterodyne receiver is shown in Figure 5.3.2. The main difference from the direct conversion receiver is that the IF frequency is non zero. As a result more gain can be added at the IF stage and there is an increased availability of low cost RF components such as amplifiers and filters. Filtering at a moderate IF frequency also relaxes the demand for sharp cutoff filters since the relative bandwidth is higher at this frequency compared to RF.
- 27 -
IF RF
LO
Figure 5.3.2 Superheterodyne receiver
Having a non zero IF frequency also means that the requirements of LO stability can be relaxed, given that the drift is small relative to the IF frequency. As long as the signal stays inside the receiver bandwidth the frequency drift can be dealt with in the digital domain. This design will however require A/D converters with higher sampling rates and image reject filters.
5.4 Other design considerations
The purpose of this thesis is to develop a low cost beacon receiver. A tradeoff between performance and cost must thus be found. To achieve this, the prices of individual components were considered prior to the development of the design. A number of manufactures and resellers were examined to find economical components and to assure the receiver could be realized using easily available equipment. As a result a list of companies supplying RF and other relevant equipment was made. This list was used to find the individual components of the receiver and their price. The list is shown in Table 5.4.1.

- 28 -
Company Name
Webiste Products
Analog Devices www.analog.com Mostly integrated Circuits, ADC's,
frequency synthesizers,
Minicircuits www.minicircuits.com Analog RF components, Mixers, filters,
amplifiers, Frequency synthesizers, coaxial cables, power supplies
Hittite www.hittite.com RF components both analog and digital
Farnell www.farnell.no Norwegian supplier of Integrated circuits from different
manufacturers
K&L Microwave www.klmicrowave.com Analog filters, can produce a wide range of both of-the-
shelf and tailored components
GE Satcom www.gesatcom.com Antennas and RF equipment
Komplett.no www.komplett.no Computer Hardware
Ettus Resarch www.ettus.com USRP and daughterboard
Table 5.4.1 List of Suppliers
Price quotes from additional companies were also collected for some components, especially antennas and antenna-feeds.
5.4.1 Limitations due to available equipment
The equipment available to build the receiver also needs to be considered. Lack of capability to produce circuit boards was found to be especially important. Due to this limitation integrated circuit chips and other components requiring special equipment or manufacturing techniques was avoided. This is also why components with coaxial connectors have been preferred.
- 29 -
Chapter 6
Beacon receiver designs
In this section the developed beacon receiver designs are presented along with considerations of the cost of implementation. The first designs are complete systems tailored for the Eutelsat W3A beacon. Attempts to reduce costs are then reviewed along with alternative hardware implementations.
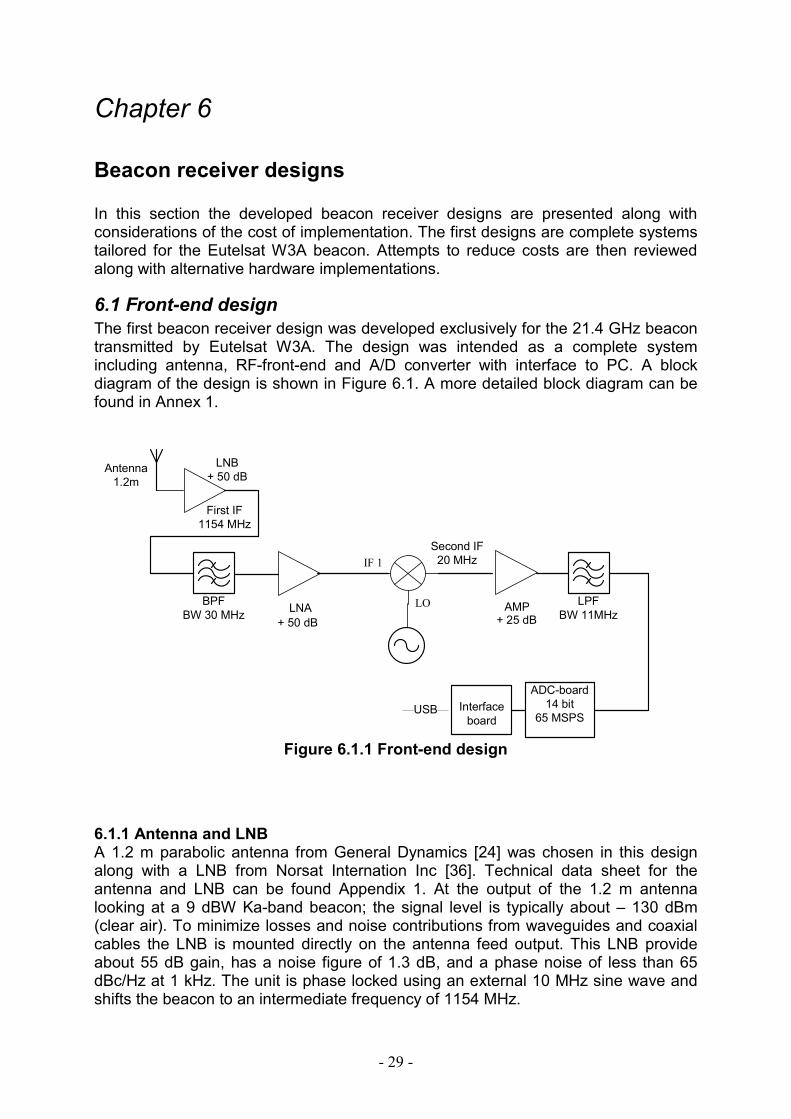
6.1 Front-end design
The first beacon receiver design was developed exclusively for the 21.4 GHz beacon transmitted by Eutelsat W3A. The design was intended as a complete system including antenna, RF-front-end and A/D converter with interface to PC. A block diagram of the design is shown in Figure 6.1. A more detailed block diagram can be found in Annex 1.
IF 1
LO
BPFBW 30 MHz
LNA
First IF1154 MHz
+ 50 dB
Second IF20 MHz
AMPLPF
BW 11MHz
LNB+ 50 dB
Antenna1.2m
ADC-board14 bit
65 MSPSInterface
boardUSB
+ 25 dB
Figure 6.1.1 Front-end design
6.1.1 Antenna and LNB A 1.2 m parabolic antenna from General Dynamics [24] was chosen in this design along with a LNB from Norsat Internation Inc [36]. Technical data sheet for the antenna and LNB can be found Appendix 1. At the output of the 1.2 m antenna looking at a 9 dBW Ka-band beacon; the signal level is typically about – 130 dBm (clear air). To minimize losses and noise contributions from waveguides and coaxial cables the LNB is mounted directly on the antenna feed output. This LNB provide about 55 dB gain, has a noise figure of 1.3 dB, and a phase noise of less than 65 dBc/Hz at 1 kHz. The unit is phase locked using an external 10 MHz sine wave and shifts the beacon to an intermediate frequency of 1154 MHz.
- 30 -
6.1.2 Filtering A band pass filter with 3 dB bandwidth of 3 MHz follows the LNB. This ensures that most of the energy from neighboring frequency components is attenuated, thus allowing fore more amplification without saturation. The use of narrow filters also allows for a lower second IF frequency. After amplification the same filter is used again to remove any harmonics from the amplification stage and attenuate neighboring frequency components further. A band pass filter with pass band between 9.5-11.5 MHz is used at the second IF to remove mixer products and avoid aliasing. The filtering in at the first IF frequency limits this receiver to the W3A beacon due to the narrow bandwidth. If other beacons are to be measured the two filters need to be replaced. 6.1.3 IF frequency The first IF frequency is determined by the LNB. In this case the beacon frequency is converted to a first IF of 1.1154 GHz. This is an L-band (800-1500 MHz) frequency which seems to be a common intermediate frequency provided by many LNB’s. The second IF can be controlled by the local oscillator. A 10.7 MHz second IF was chosen due to the availability of low cost RF components and to avoid image frequency issues. The 10.7 MHz IF is a common FM radio frequency. Filters and amplifiers are therefore commonly available at this frequency. 6.1.4. Amplification At first IF two low noise amplifiers from Minicircuits [37] are used. Both provide about 25 dB gain and have a noise figure of less than 2 dB. Low noise amplifiers are used to minimize the degradation of the signal to noise ratio and because they where found to be reasonable priced compared to other alternatives with higher noise figures. This first amplification stage brings the beacon signal power from -76 to -26 dBm. At the second IF frequency an additional amplifier from Minicircuits is used in order to utilize the full dynamic range of the ADC. 6.1.5 Local Oscillator Most off-the-shelf signal generators are expensive and quite bulky. To reduce costs and size a PLL synthesizer IC (ADF-4360) from Analog devices [38] mounted on an evaluation board is used. The ADF-4360 is a single chip PLL-synthesizer containing both VCO and a PLL. The device can generate frequencies from 300 to 1500 MHz. More information about the evaluation board and the design of the local oscillator can be found in Annex 2. The LO generates a frequency of 1143.3 MHz to achieve the 10.7 MHz IF. Design simulations performed in ADIsimPLL [25] show a phase noise of less than 80 dB at 1 kHz can be achieved. This is better than the performance of the LNB and was therefore demand adequate. 6.1.6 Digitization Digitization is performed by an A/D converter form Analog devices (AD9235 [32]) mounted on an evaluation board. The board contains all the support circuitry needed to operate the ADC. The sampling rate is 65 MSPS at 12 bits resolution. This gives a signal to noise ratio of about 70 dB and a bandwidth of more than 30 MHz. A FIFO based interface card [33] connected to the ADC board reduces the data rate and allows the sampled signal to be transferred to a computer via USB cable.
- 31 -
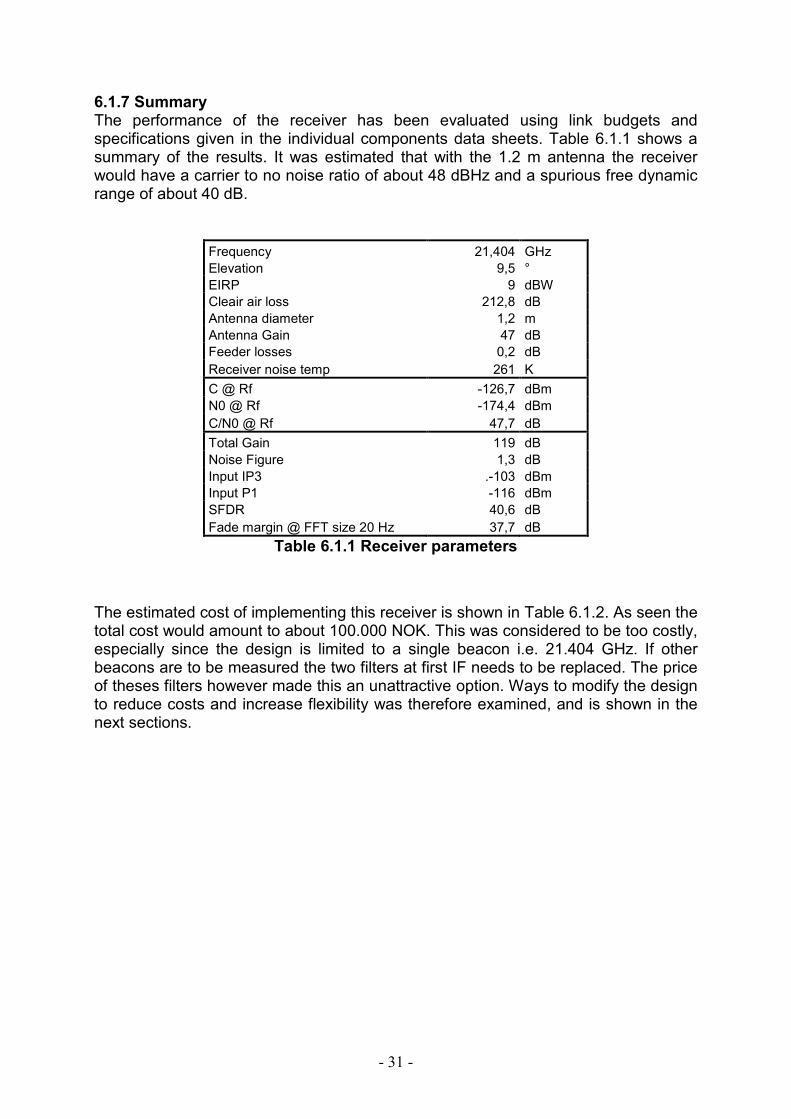
6.1.7 Summary The performance of the receiver has been evaluated using link budgets and specifications given in the individual components data sheets. Table 6.1.1 shows a summary of the results. It was estimated that with the 1.2 m antenna the receiver would have a carrier to no noise ratio of about 48 dBHz and a spurious free dynamic range of about 40 dB.
Frequency 21,404 GHz
Elevation 9,5 °
EIRP 9 dBW
Cleair air loss 212,8 dB
Antenna diameter 1,2 m
Antenna Gain 47 dB
Feeder losses 0,2 dB
Receiver noise temp 261 K
C @ Rf -126,7 dBm
N0 @ Rf -174,4 dBm
C/N0 @ Rf 47,7 dB
Total Gain 119 dB
Noise Figure 1,3 dB
Input IP3 .-103 dBm
Input P1 -116 dBm
SFDR 40,6 dB
Fade margin @ FFT size 20 Hz 37,7 dB
Table 6.1.1 Receiver parameters
The estimated cost of implementing this receiver is shown in Table 6.1.2. As seen the total cost would amount to about 100.000 NOK. This was considered to be too costly, especially since the design is limited to a single beacon i.e. 21.404 GHz. If other beacons are to be measured the two filters at first IF needs to be replaced. The price of theses filters however made this an unattractive option. Ways to modify the design to reduce costs and increase flexibility was therefore examined, and is shown in the next sections.

- 32 -
Component Manufacturer / Provider Model.nr Appendix Quantity Price
Antenna with feed General Dynamics 3120 2 1,0 775 $
LNB Norsat 900XD 2 1,0 3620 $
Filter IF1 K&L Microwave 4cp-120 2 2,0 2690 $
LNA Minicircuits ZRL-1200 2 2,0 238 $
Mixer Minicircuits ZFM-2 2 1,0 67 $
Filter IF2 Minicircuits 2 1,0 200 $
Amplifier IF2 Minicircuits 2 1,0 150 $
Frequency synthesizer Analog devices 2 1,0 460 $
OCXO Franell 2,0 155 $
ADC-Board Analog Devices 2 1,0 708 $
Misc and Coax cables Minicircuits 1000 $
PC 2000 $
Shipping and handling 1000 $
Sum Ink MVA $ 16328,75 $
Sum ink MVA (NOK) 114301,25 NOK
1 $ = 7 NOK
Table 6.1.2 Estimated costs
The estimated costs can be divided into four sections:
• Outdoor section, Antenna and LNB, 30.700 NOK • Down-conversion stage, Filters mixers and amplifiers, 31500 NOK • Baseband section, ADC and computer interface 5000 NOK • Other components such as PC, cables, TCXO and connectors 21000 NOK The estimated costs shown in NOK here and else were in this thesis have been calculated using an exchange rate of 1 $ = 7 NOK
6.2 Reduction of costs & alternative hardware implementations
The cost of implementing the receiver as described above was found to be in excess 100.000 NOK. This was found to be too costly; ways to reduce costs was therefore investigated. A variety of different designs and alternative hardware implementation approaches was evaluated. A list of some of the alternatives considered is listed below.
6.2.1 Approach 1
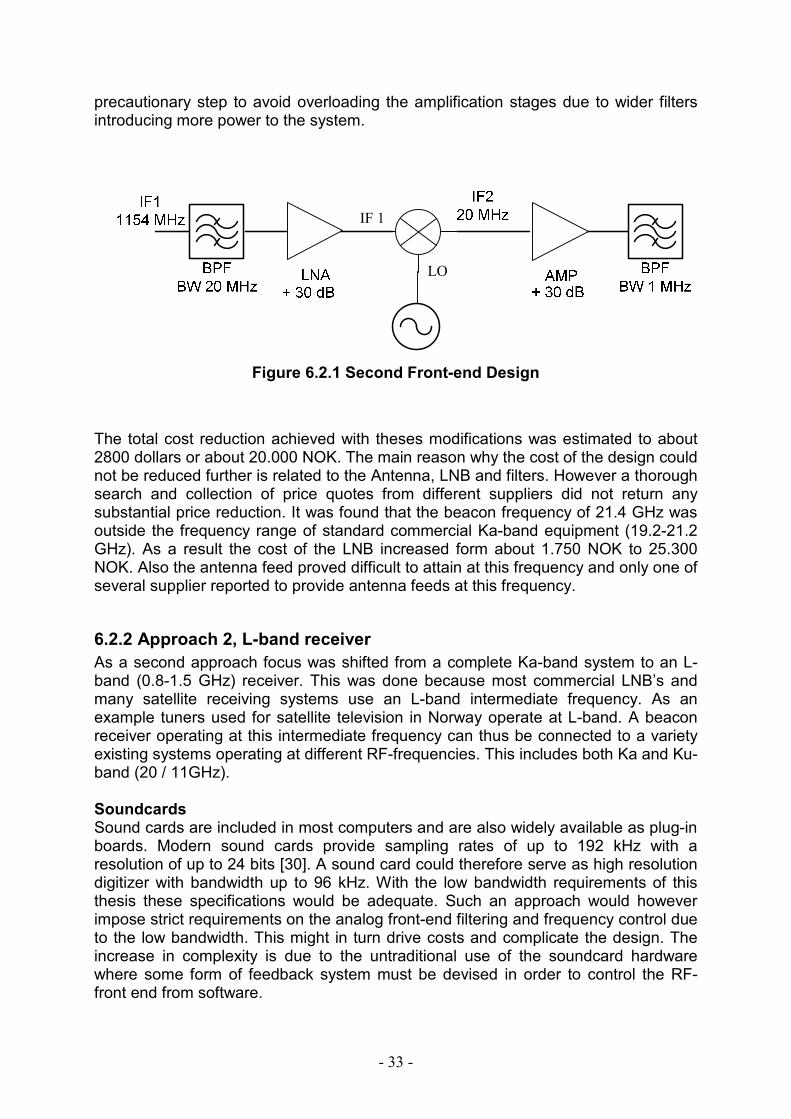
As a first approach to reduce cost the design presented in Section 6.1 was reevaluated and the number of components was reduced. This resulted in the design shown in figure 7.2.1 where antenna, LNB and digital hardware is unchanged and not shown. The primary changes are the use of wider filters which results in a higher second intermediate frequency. The amount of amplification in the first IF stage has also been reduced by removing one of the two amplifiers. This was also a
- 33 -
precautionary step to avoid overloading the amplification stages due to wider filters introducing more power to the system.
IF 1
LO
Figure 6.2.1 Second Front-end Design
The total cost reduction achieved with theses modifications was estimated to about 2800 dollars or about 20.000 NOK. The main reason why the cost of the design could not be reduced further is related to the Antenna, LNB and filters. However a thorough search and collection of price quotes from different suppliers did not return any substantial price reduction. It was found that the beacon frequency of 21.4 GHz was outside the frequency range of standard commercial Ka-band equipment (19.2-21.2 GHz). As a result the cost of the LNB increased form about 1.750 NOK to 25.300 NOK. Also the antenna feed proved difficult to attain at this frequency and only one of several supplier reported to provide antenna feeds at this frequency.
6.2.2 Approach 2, L-band receiver
As a second approach focus was shifted from a complete Ka-band system to an L-band (0.8-1.5 GHz) receiver. This was done because most commercial LNB’s and many satellite receiving systems use an L-band intermediate frequency. As an example tuners used for satellite television in Norway operate at L-band. A beacon receiver operating at this intermediate frequency can thus be connected to a variety existing systems operating at different RF-frequencies. This includes both Ka and Ku-band (20 / 11GHz).
Soundcards Sound cards are included in most computers and are also widely available as plug-in boards. Modern sound cards provide sampling rates of up to 192 kHz with a resolution of up to 24 bits [30]. A sound card could therefore serve as high resolution digitizer with bandwidth up to 96 kHz. With the low bandwidth requirements of this thesis these specifications would be adequate. Such an approach would however impose strict requirements on the analog front-end filtering and frequency control due to the low bandwidth. This might in turn drive costs and complicate the design. The increase in complexity is due to the untraditional use of the soundcard hardware where some form of feedback system must be devised in order to control the RF-front end from software.
- 34 -
Wi-Spy 2.4x Wi-spy 2.4x is a spectrum analyzer intended for locating and detecting WiFi activity and can be acquired from www.metageek.com. The device has the following specifications [26]
• Bandwidth: 2400 to 2495 MHz • Frequency Resolution: 328 KHz • Amplitude Range: -110 dBm to -6.5 dBm • Amplitude Resolution: 0.5 dBm • Sweep Time: 165 millisecond
The challenge of using this device for a beacon receiver is the operating frequency. Most satellite LNB’s output an intermediate frequency in L-band. In order to use this device at L-band a frequency conversion stage is thus needed. Universal software radio peripheral The USRP is a dedicated software defined radio developed by Ettus Research LLC [31], with the following selected specifications [27]
• ADC: 12 bits 64MS/s x 4 • DAC 14 bits 128MS/s x 4 • Bandwidth: 32 MHz • FPGA: Altera Cyclone • Interface: 32MB/s USB 2.0 • Interchangeable RF front-end insert boards
The interchangeable RF front-end insert boards made this device particularly interesting compared to other software radio alternatives. Especially a board known as DBSRX proved to cover the IF frequency range of interest in this thesis i.e. L-band (800-1500 MHz). Some of the key specifications of this board are listed below.
• Frequency range: 800 to 2400 MHz • Noise Figure: 3-5 dB • Software controllable channel filter • Bandwidth 1 to 60 MHz
By using the USRP together with DBSRX an L-band beacon receiver could be built from only two parts and at a price of about 5000 NOK1. As a result this device was selected for the hardware implementation of the beacon receiver. Although the price of the USRP is somewhat higher than that of both soundcards and WiSpy the total price tag is significantly reduced due to the 1000 NOK RF front-end board. The new design can be seen in Figure 6.2.1
1 Hardware only, MVA not included
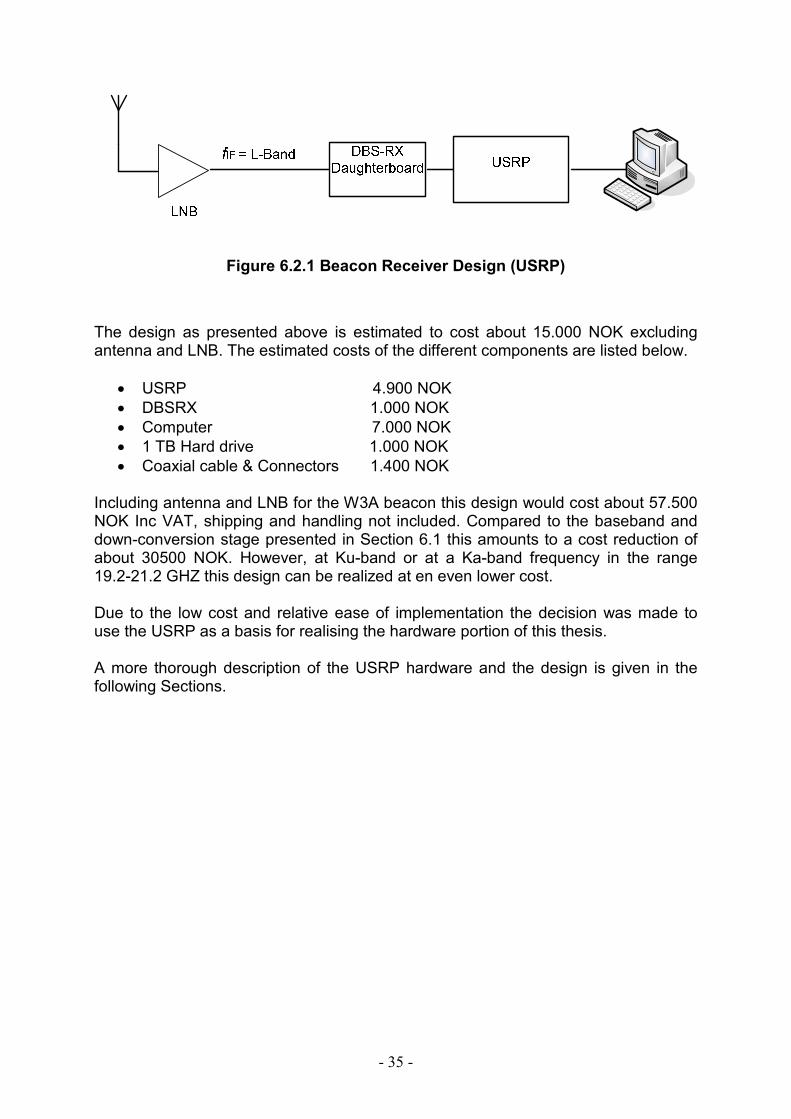
- 35 -
Figure 6.2.1 Beacon Receiver Design (USRP)
The design as presented above is estimated to cost about 15.000 NOK excluding antenna and LNB. The estimated costs of the different components are listed below.
• USRP 4.900 NOK • DBSRX 1.000 NOK • Computer 7.000 NOK • 1 TB Hard drive 1.000 NOK • Coaxial cable & Connectors 1.400 NOK
Including antenna and LNB for the W3A beacon this design would cost about 57.500 NOK Inc VAT, shipping and handling not included. Compared to the baseband and down-conversion stage presented in Section 6.1 this amounts to a cost reduction of about 30500 NOK. However, at Ku-band or at a Ka-band frequency in the range 19.2-21.2 GHZ this design can be realized at en even lower cost. Due to the low cost and relative ease of implementation the decision was made to use the USRP as a basis for realising the hardware portion of this thesis. A more thorough description of the USRP hardware and the design is given in the following Sections.
- 36 -
Chapter 7
Hardware description
In this Section the hardware of the USRP is explored along with the software used to control it.
7.1 Universal software radio peripheral
The USRP is a relatively low cost (750$) software radio developed especially for GNU radio software. The device has been used around the world in various projects ranging from simple FM receivers to more advanced functions such as MIMO systems, radars and radio astronomy. The hardware consists of a mother board containing A/D and D/A converters, an FPGA for signal processing and USB interface for connection to a host computer. There are also four slots for connecting daughterboard’s. The daughterboard’s contain the analog front-end and different boards can be purchased. Combined the daughterboard’s covers the frequency range form a few kHz up to several GHz. Figure 7.1 shows a picture of the daughterboard where the FPGA can bee seen in the center. The connections for the daughterboards can also bee seen and are labeled TX/RX A/B. The USRP is designed especially for the GNU radio framework and is available form Ettus Research (www.ettus.com). Both the hardware and software of the USRP is under constant development and the schematics and source code can be found at GNU radio website [34]. For this thesis the USRP 1 has been used, the device was borrowed form Jørn Kårstad, FFI.
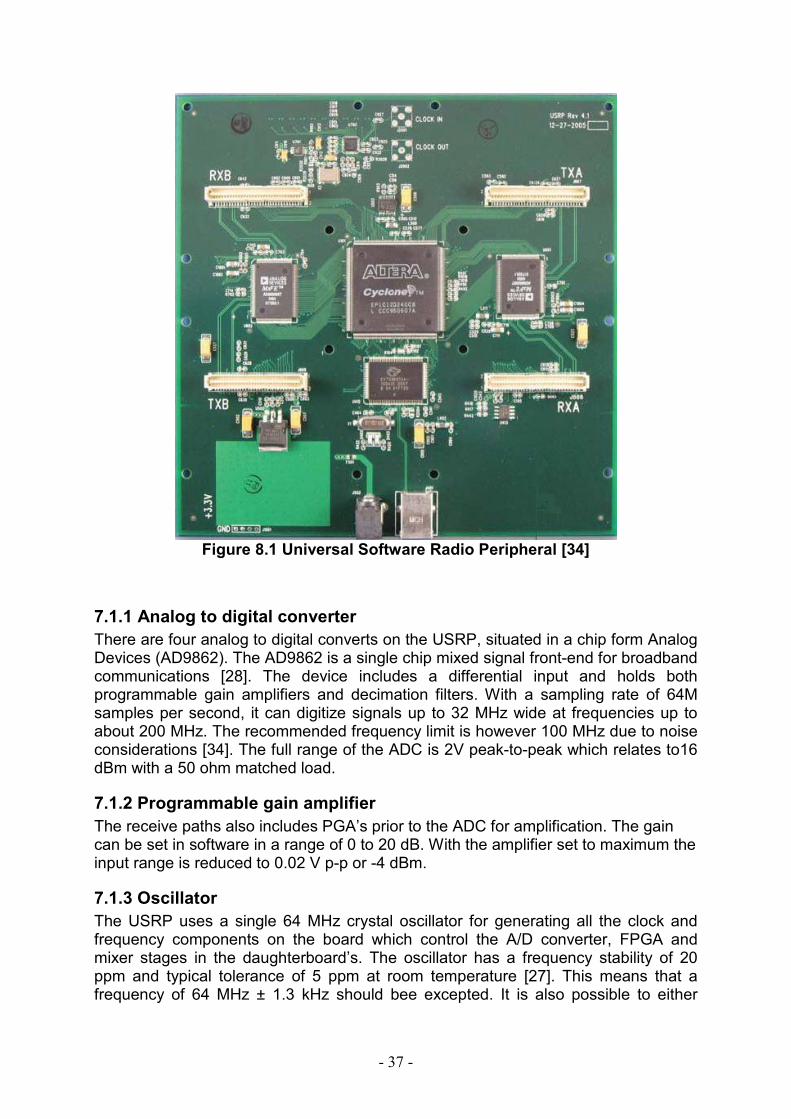
- 37 -
Figure 8.1 Universal Software Radio Peripheral [34]
7.1.1 Analog to digital converter
There are four analog to digital converts on the USRP, situated in a chip form Analog Devices (AD9862). The AD9862 is a single chip mixed signal front-end for broadband communications [28]. The device includes a differential input and holds both programmable gain amplifiers and decimation filters. With a sampling rate of 64M samples per second, it can digitize signals up to 32 MHz wide at frequencies up to about 200 MHz. The recommended frequency limit is however 100 MHz due to noise considerations [34]. The full range of the ADC is 2V peak-to-peak which relates to16 dBm with a 50 ohm matched load.
7.1.2 Programmable gain amplifier
The receive paths also includes PGA’s prior to the ADC for amplification. The gain can be set in software in a range of 0 to 20 dB. With the amplifier set to maximum the input range is reduced to 0.02 V p-p or -4 dBm.
7.1.3 Oscillator
The USRP uses a single 64 MHz crystal oscillator for generating all the clock and frequency components on the board which control the A/D converter, FPGA and mixer stages in the daughterboard’s. The oscillator has a frequency stability of 20 ppm and typical tolerance of 5 ppm at room temperature [27]. This means that a frequency of 64 MHz ± 1.3 kHz should bee excepted. It is also possible to either
- 38 -
replace the onboard oscillator or to use an external oscillator if better performance is needed.
7.1.4 Field Programmable Gateway Array
The FPGA connects all the components of the USRP together and is used to perform the onboard signal processing. The FPGA implements digital down conversion (DDC) stages, decimation and filtering. The DDC brings the desired IF frequency down to baseband. Four stages cascaded integrated comb filters then provide decimation. CIC filters are high performance filters implemented using only adds and delays [27]. The decimation stage reduces the data rate to an acceptable rate for the USB 2.0 connection so that data can be streamed to a host computer. In addition to the CIC filters the FPGA also provide optional half band filters.
7.1.5 Daughterboards
The USRP motherboard has connections for two RX and two TX daughterboard’s. A daughterboard contains an analog front-end which makes it possible to use the USRP at frequencies beyond that of the frequency limit of the ADC. A range of different boards are available to cover the RF spectrum from 30 MHz to 2.4 GHz. Only the boards of interest to this thesis will be described here. Basic RX On this board the ADC input is directly transformer coupled to an SMA connection with load impedance of 50 ohms. There are no mixer, filter or amplification stages, so only the frequency range of the ADC is available. DBSRX This board covers the frequency range from 800 MHz to 2.4 GHz and is based on the Maxim max2118 direct conversion IC [41]. It has a noise figure of 3-5 dB [27] and a software controlled channel filter. The filter bandwidth can be set to a minimum of 1 MHz or as wide as 60 MHz [27]. The DBSRX is also capable of powering an LNB i.e. it can provide DC power through centre lead of a coaxial cable. Originally 6 V can be provided by installing a jumper. Connections are also provided if other voltages are required. This will however necessitate an external power supply. The LO used in the mixer is derived from the 64 MHz XO on the motherboard. A tolerance of 5 kHz should therefore be expected at room temperature. 7.1.6 Computer interface The USRP uses a USB 2.0 interface for data transmission to and from a host computer. The USB interface can transfer data at a rate up to about 256 Mb/s or 32 MB/s. All samples are sent in 16 bit signed integer IQ format [27] i.e. 16 bit I and 16 bit Q complex data. This results in a maximum transfer rate of 8 M complex samples per second yielding a spectral bandwidth of 8 MHz. By decimating in the FPGA, the data rate can be reduced. With the maximum decimation rate of 256 the transfer rate is reduced to 64 MSPS / 256 = 250 kSPS.
- 39 -
7.2 GNU radio framework
GNU radio is a free software toolkit for signal processing and development of software radio. It is available from the GNU radio website [34]. This webpage also contains a vast amount documentation and links to support forums where one can ask for help and discuss the software code. The online community continuously improves and develops new code which is added to the current release at arbitrary intervals. The radio software contains signal processing blocks written in the programming language c++ [27]. These blocks perform different operations such as filtering, decimation and FFT. By “tying” the blocks together a complete signal processing system can be built in a fairly short time. This is achieved by programming in Python [35]. In the Python code GNU radio signal processing blocks are called and connected to other blocks. In this way one can simulate different signal processing schemes and build complete radio systems. GNU radio also contains the drivers and firmware needed to operate the USRP board. In fact USRP has been developed especially for GNU radio.
7.2.1 Gnu radio companion
The gnu radio companion is a graphical tool for developing basic software code for the GNU radio framework. In this program a set of boxes indicating different signal blocks can be put together by drag and drop. This simple user interface can be used to create basic software radio functions in a few minutes. This program therefore proved valuable to explore the functionality of both the USRP and GNU radio software.
7.2.2 GNU radio installation
GNU radio has been installed on two computers, one laptop and one desktop. The desktop is running on Fedora 11 whilst the laptop is running Ubuntu 9.04. Installation of GNU radio in Ubuntu is described below:
• Install Ubuntu 9.04. Can be acquired from www.ubuntu.com • Open the Software sources program located under the menu “System” →
“Administration” → “Software sources” • Navigate to the tab “Third-Party Software” and click “Add” and enter the
following two lines in the “ATP line” box, one at the time. deb http://gnuradio.org/ubuntu stable main
deb-src http://gnuradio.org/ubuntu stable main
• Open Terminal and enter the following statements
$ sudo apt-get update
• Go to System → Administration → Synaptic Package Manager • In the Quick search box enter gnuradio an click search • Select the package named gnuradio version 3.2 and click apply
- 40 -
GNU radio should now be installed, the package manager insures that all dependencies are met and if necessary downloads and installs missing components. To install GNU radio companion (GRC) perform the following steps.
• Open Synaptic Package Manager • Search for gnuradio companion • Select the package named gnuradio-companion and click apply
Installing GNU-radio in Fedora proved to be slightly more difficult and a solution for installing the latest version of GRC was not found. The instructions below will however install GNU radio in Fedora without GRC.
• With Fedora Installed enter the following into terminal
$ yum groupinstall "Engineering and Scientific" "Development Tools" $ yum install fftw-devel cppunit-devel wxPython-devel
libusb-devel \ guile boost-devel alsa-lib-devel numpy gsl-devel python-devel pygsl \ python-cheetah python- lxml
• To get the latest stable release enter the following into terminal $ svn co ttp://gnuradio.org/svn/gnuradio/branches/releases/3.2 gnuradio
• Now enter the following lines, one at the time
$ ./bootstrap $ ./configure $ make $ make check $ sudo make install
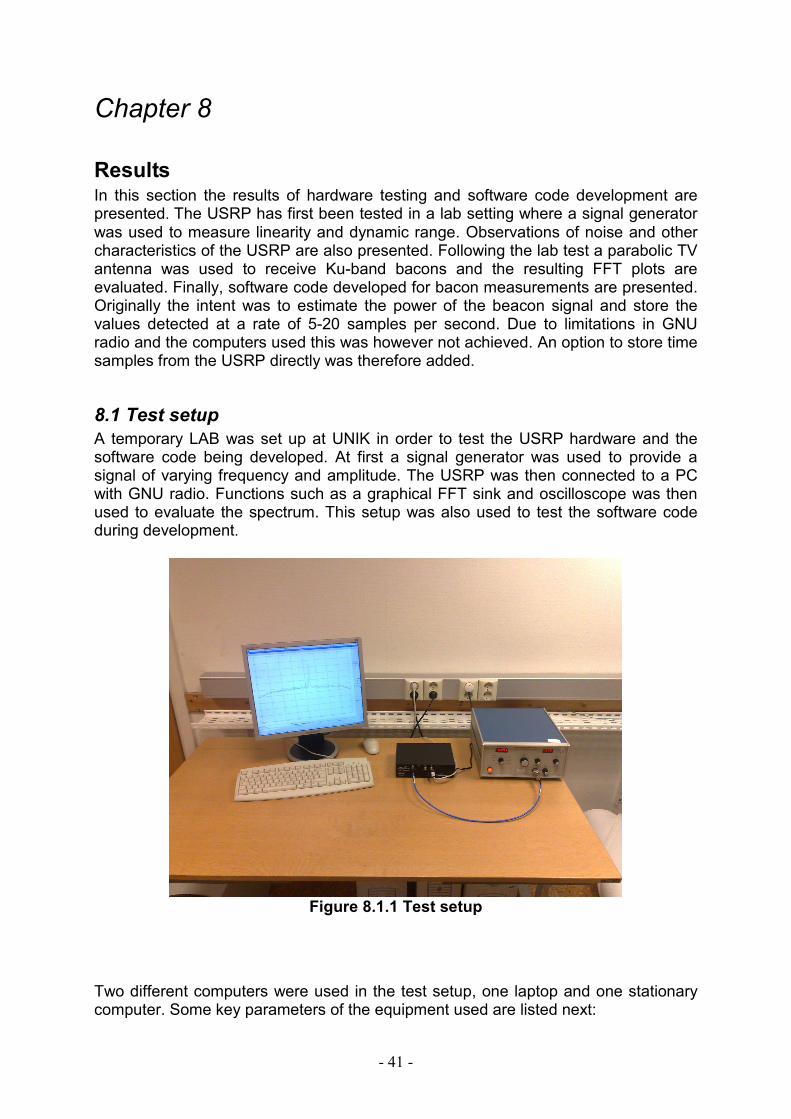
- 41 -
Chapter 8
Results In this section the results of hardware testing and software code development are presented. The USRP has first been tested in a lab setting where a signal generator was used to measure linearity and dynamic range. Observations of noise and other characteristics of the USRP are also presented. Following the lab test a parabolic TV antenna was used to receive Ku-band bacons and the resulting FFT plots are evaluated. Finally, software code developed for bacon measurements are presented. Originally the intent was to estimate the power of the beacon signal and store the values detected at a rate of 5-20 samples per second. Due to limitations in GNU radio and the computers used this was however not achieved. An option to store time samples from the USRP directly was therefore added.
8.1 Test setup
A temporary LAB was set up at UNIK in order to test the USRP hardware and the software code being developed. At first a signal generator was used to provide a signal of varying frequency and amplitude. The USRP was then connected to a PC with GNU radio. Functions such as a graphical FFT sink and oscilloscope was then used to evaluate the spectrum. This setup was also used to test the software code during development.
Figure 8.1.1 Test setup
Two different computers were used in the test setup, one laptop and one stationary computer. Some key parameters of the equipment used are listed next:
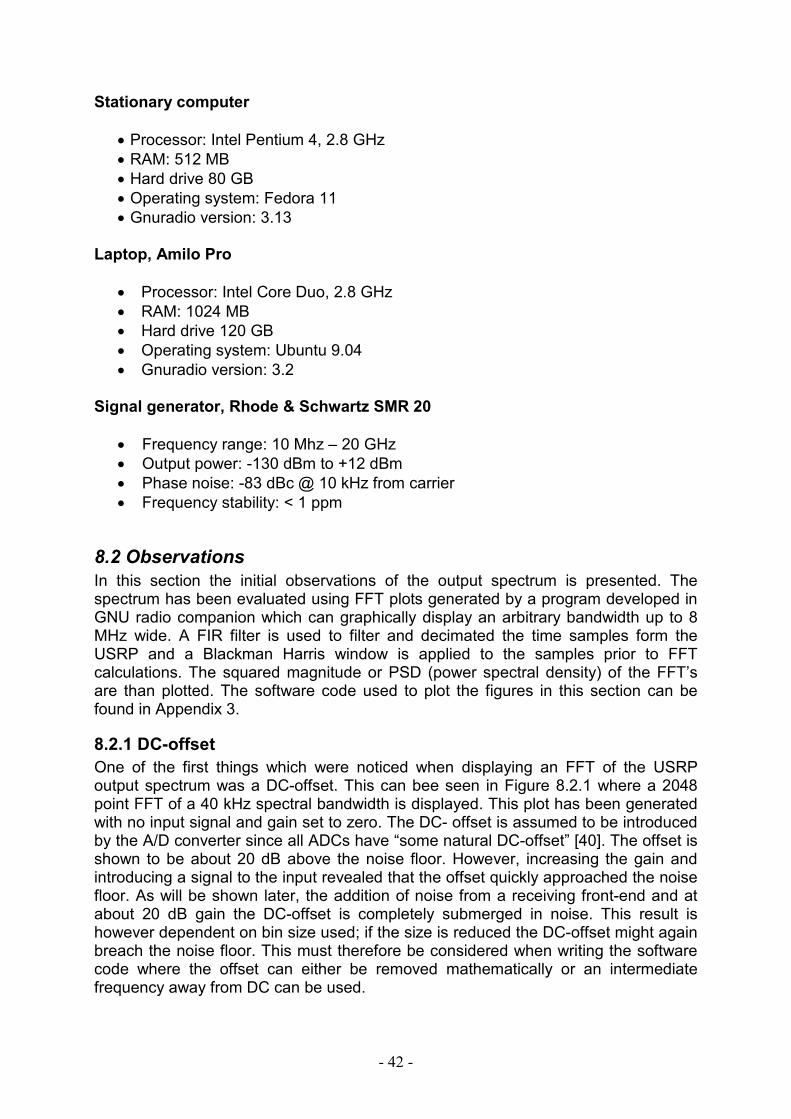
- 42 -
Stationary computer
• Processor: Intel Pentium 4, 2.8 GHz • RAM: 512 MB • Hard drive 80 GB • Operating system: Fedora 11 • Gnuradio version: 3.13
Laptop, Amilo Pro
• Processor: Intel Core Duo, 2.8 GHz • RAM: 1024 MB • Hard drive 120 GB • Operating system: Ubuntu 9.04 • Gnuradio version: 3.2
Signal generator, Rhode & Schwartz SMR 20
• Frequency range: 10 Mhz – 20 GHz • Output power: -130 dBm to +12 dBm • Phase noise: -83 dBc @ 10 kHz from carrier • Frequency stability: < 1 ppm
8.2 Observations
In this section the initial observations of the output spectrum is presented. The spectrum has been evaluated using FFT plots generated by a program developed in GNU radio companion which can graphically display an arbitrary bandwidth up to 8 MHz wide. A FIR filter is used to filter and decimated the time samples form the USRP and a Blackman Harris window is applied to the samples prior to FFT calculations. The squared magnitude or PSD (power spectral density) of the FFT’s are than plotted. The software code used to plot the figures in this section can be found in Appendix 3.
8.2.1 DC-offset
One of the first things which were noticed when displaying an FFT of the USRP output spectrum was a DC-offset. This can bee seen in Figure 8.2.1 where a 2048 point FFT of a 40 kHz spectral bandwidth is displayed. This plot has been generated with no input signal and gain set to zero. The DC- offset is assumed to be introduced by the A/D converter since all ADCs have “some natural DC-offset” [40]. The offset is shown to be about 20 dB above the noise floor. However, increasing the gain and introducing a signal to the input revealed that the offset quickly approached the noise floor. As will be shown later, the addition of noise from a receiving front-end and at about 20 dB gain the DC-offset is completely submerged in noise. This result is however dependent on bin size used; if the size is reduced the DC-offset might again breach the noise floor. This must therefore be considered when writing the software code where the offset can either be removed mathematically or an intermediate frequency away from DC can be used.
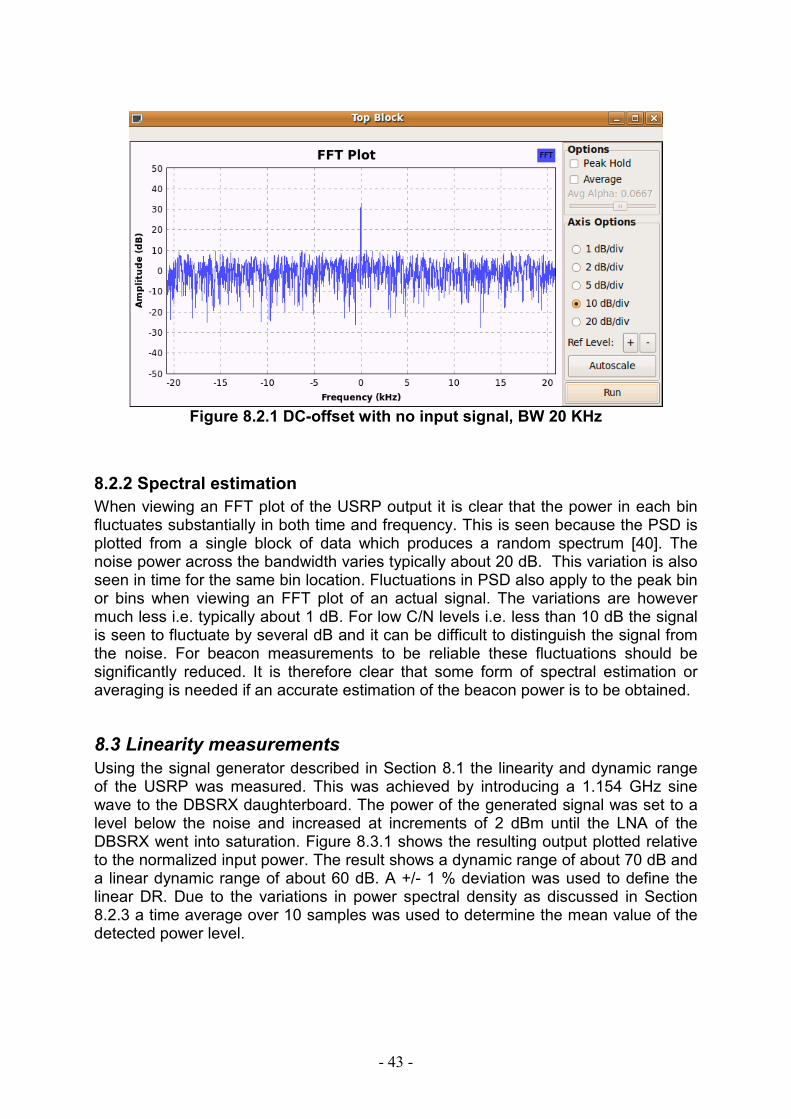
- 43 -
Figure 8.2.1 DC-offset with no input signal, BW 20 KHz
8.2.2 Spectral estimation
When viewing an FFT plot of the USRP output it is clear that the power in each bin fluctuates substantially in both time and frequency. This is seen because the PSD is plotted from a single block of data which produces a random spectrum [40]. The noise power across the bandwidth varies typically about 20 dB. This variation is also seen in time for the same bin location. Fluctuations in PSD also apply to the peak bin or bins when viewing an FFT plot of an actual signal. The variations are however much less i.e. typically about 1 dB. For low C/N levels i.e. less than 10 dB the signal is seen to fluctuate by several dB and it can be difficult to distinguish the signal from the noise. For beacon measurements to be reliable these fluctuations should be significantly reduced. It is therefore clear that some form of spectral estimation or averaging is needed if an accurate estimation of the beacon power is to be obtained.
8.3 Linearity measurements
Using the signal generator described in Section 8.1 the linearity and dynamic range of the USRP was measured. This was achieved by introducing a 1.154 GHz sine wave to the DBSRX daughterboard. The power of the generated signal was set to a level below the noise and increased at increments of 2 dBm until the LNA of the DBSRX went into saturation. Figure 8.3.1 shows the resulting output plotted relative to the normalized input power. The result shows a dynamic range of about 70 dB and a linear dynamic range of about 60 dB. A +/- 1 % deviation was used to define the linear DR. Due to the variations in power spectral density as discussed in Section 8.2.3 a time average over 10 samples was used to determine the mean value of the detected power level.
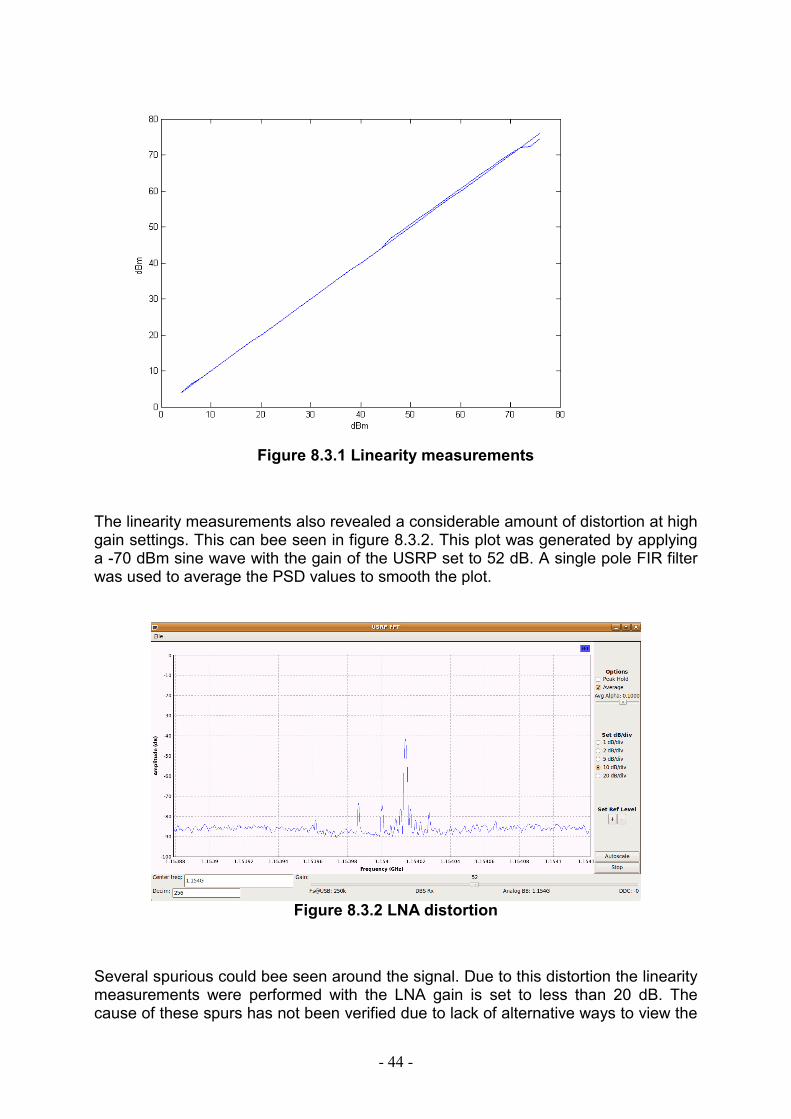
- 44 -
Figure 8.3.1 Linearity measurements
The linearity measurements also revealed a considerable amount of distortion at high gain settings. This can bee seen in figure 8.3.2. This plot was generated by applying a -70 dBm sine wave with the gain of the USRP set to 52 dB. A single pole FIR filter was used to average the PSD values to smooth the plot.
Figure 8.3.2 LNA distortion
Several spurious could bee seen around the signal. Due to this distortion the linearity measurements were performed with the LNA gain is set to less than 20 dB. The cause of these spurs has not been verified due to lack of alternative ways to view the

- 45 -
output spectrum of the signal generator. However a similar result is reported in a project where the same hardware was used [45] and distortion was found to be generated by the LNA of the USRP.
8.4 Ku-band reception
After the initial lab test the USRP was connected to a 0.45 m parabolic antenna with a Ku-band LNB. The antenna intended for television reception was acquired as a package consisting of antenna dish, LNB, wall-mount, coaxial cable and connectors. The package did not contain any documentation so all the specifications are not fully known. The flowing key specifications for the antenna have therefore been estimated:
Parabolic Antenna
• Diameter: 0.45 m • HPBW: Approximately 4.6 ° • Gain: Approximately 32 dB
LNB, Triax TQD 002 quad [44]
• Gain: 50-60 dB • Noise figure: 0.3 dB • Frequency range: 10.7 - 11.7 / 11.7 -12.75 GHz • IF frequency: 0.95 -1.95 / 1.1 – 2.15 GHz • LO frequency: 9.75 / 10.6 GHz • Polarization: Adjustable, Horizontal / Vertical • Outputs: 4 • Operating voltage: 12 / 14 V
The LNB is powered and controlled via the same coaxial cable used to transfer the signal. By applying 12 / 14 V DC to the center lead the polarization can be set to horizontal or vertical respectively. The LO frequency is changed from 9.75 GHz to 10.6 GHz by applying a 22 kHz signal. Although the USRP can be used to deliver a DC voltage the 22 kHz switching tone is not supported. A television tuner was therefore connected between the LNB and the DBSRX daughterboard. The frequency and polarization was then controlled by changing the channel selected on the TV tuner.
8.4.1 Eutelsat W3A beacon
After setting up the antenna and connections the USRP was tuned to the Eutelsat W3A Ku-band beacon of 11.2 GHz. The resulting FFT plot is shown in Figure 8.4.1. This shows the beacon in a 60 KHz bandwidth and at a resolution of 30 Hz per bin. The beacon is shown to be about 20 dB above the noise which is in reasonable agreement with the 26 dB value estimated for clear air conditions in the link budget. It should be mentioned that there is an impedance mismatch which results in additional
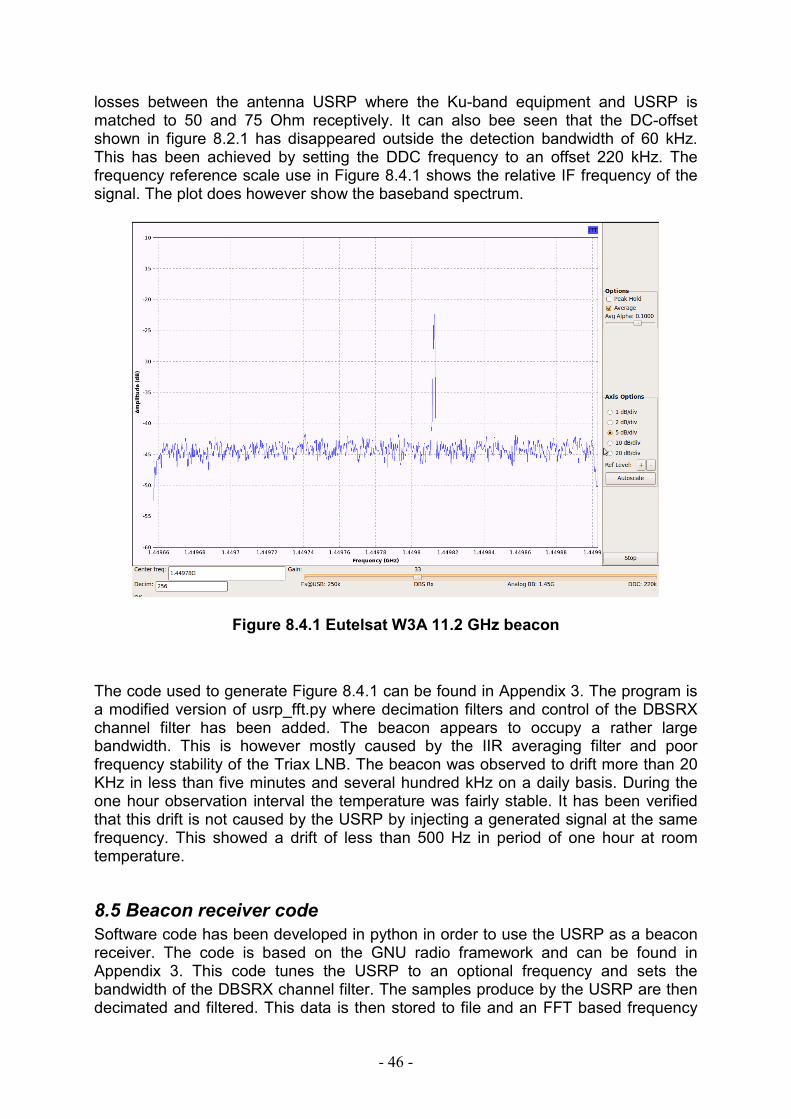
- 46 -
losses between the antenna USRP where the Ku-band equipment and USRP is matched to 50 and 75 Ohm receptively. It can also bee seen that the DC-offset shown in figure 8.2.1 has disappeared outside the detection bandwidth of 60 kHz. This has been achieved by setting the DDC frequency to an offset 220 kHz. The frequency reference scale use in Figure 8.4.1 shows the relative IF frequency of the signal. The plot does however show the baseband spectrum.
Figure 8.4.1 Eutelsat W3A 11.2 GHz beacon
The code used to generate Figure 8.4.1 can be found in Appendix 3. The program is a modified version of usrp_fft.py where decimation filters and control of the DBSRX channel filter has been added. The beacon appears to occupy a rather large bandwidth. This is however mostly caused by the IIR averaging filter and poor frequency stability of the Triax LNB. The beacon was observed to drift more than 20 KHz in less than five minutes and several hundred kHz on a daily basis. During the one hour observation interval the temperature was fairly stable. It has been verified that this drift is not caused by the USRP by injecting a generated signal at the same frequency. This showed a drift of less than 500 Hz in period of one hour at room temperature.
8.5 Beacon receiver code
Software code has been developed in python in order to use the USRP as a beacon receiver. The code is based on the GNU radio framework and can be found in Appendix 3. This code tunes the USRP to an optional frequency and sets the bandwidth of the DBSRX channel filter. The samples produce by the USRP are then decimated and filtered. This data is then stored to file and an FFT based frequency
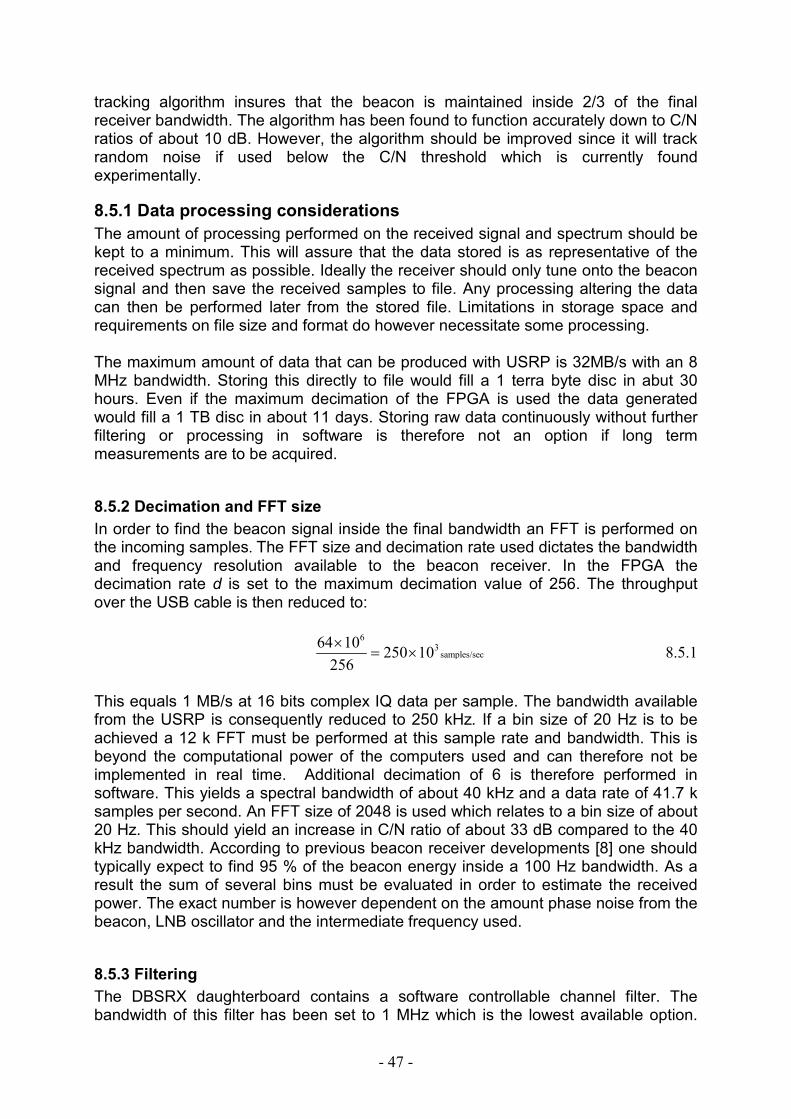
- 47 -
tracking algorithm insures that the beacon is maintained inside 2/3 of the final receiver bandwidth. The algorithm has been found to function accurately down to C/N ratios of about 10 dB. However, the algorithm should be improved since it will track random noise if used below the C/N threshold which is currently found experimentally.
8.5.1 Data processing considerations
The amount of processing performed on the received signal and spectrum should be kept to a minimum. This will assure that the data stored is as representative of the received spectrum as possible. Ideally the receiver should only tune onto the beacon signal and then save the received samples to file. Any processing altering the data can then be performed later from the stored file. Limitations in storage space and requirements on file size and format do however necessitate some processing. The maximum amount of data that can be produced with USRP is 32MB/s with an 8 MHz bandwidth. Storing this directly to file would fill a 1 terra byte disc in abut 30 hours. Even if the maximum decimation of the FPGA is used the data generated would fill a 1 TB disc in about 11 days. Storing raw data continuously without further filtering or processing in software is therefore not an option if long term measurements are to be acquired.
8.5.2 Decimation and FFT size
In order to find the beacon signal inside the final bandwidth an FFT is performed on the incoming samples. The FFT size and decimation rate used dictates the bandwidth and frequency resolution available to the beacon receiver. In the FPGA the decimation rate d is set to the maximum decimation value of 256. The throughput over the USB cable is then reduced to:
63samples/sec
64 10250 10
256
×= × 8.5.1
This equals 1 MB/s at 16 bits complex IQ data per sample. The bandwidth available from the USRP is consequently reduced to 250 kHz. If a bin size of 20 Hz is to be achieved a 12 k FFT must be performed at this sample rate and bandwidth. This is beyond the computational power of the computers used and can therefore not be implemented in real time. Additional decimation of 6 is therefore performed in software. This yields a spectral bandwidth of about 40 kHz and a data rate of 41.7 k samples per second. An FFT size of 2048 is used which relates to a bin size of about 20 Hz. This should yield an increase in C/N ratio of about 33 dB compared to the 40 kHz bandwidth. According to previous beacon receiver developments [8] one should typically expect to find 95 % of the beacon energy inside a 100 Hz bandwidth. As a result the sum of several bins must be evaluated in order to estimate the received power. The exact number is however dependent on the amount phase noise from the beacon, LNB oscillator and the intermediate frequency used.
8.5.3 Filtering
The DBSRX daughterboard contains a software controllable channel filter. The bandwidth of this filter has been set to 1 MHz which is the lowest available option.
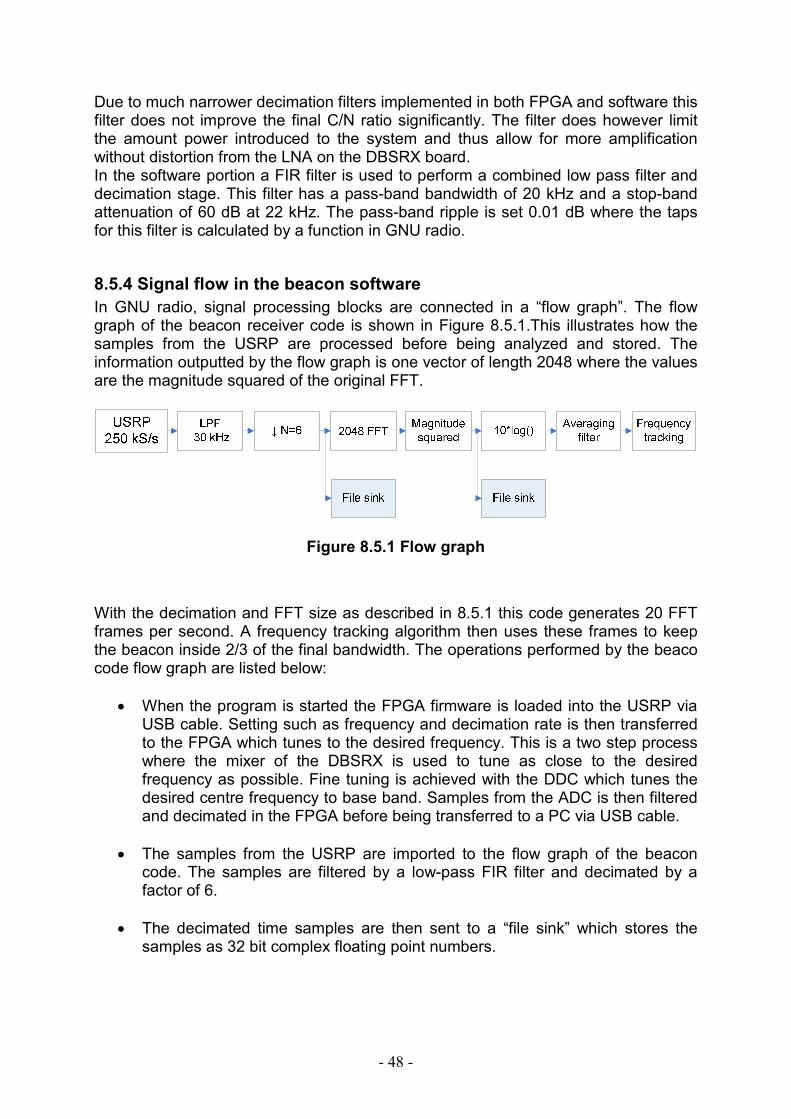
- 48 -
Due to much narrower decimation filters implemented in both FPGA and software this filter does not improve the final C/N ratio significantly. The filter does however limit the amount power introduced to the system and thus allow for more amplification without distortion from the LNA on the DBSRX board. In the software portion a FIR filter is used to perform a combined low pass filter and decimation stage. This filter has a pass-band bandwidth of 20 kHz and a stop-band attenuation of 60 dB at 22 kHz. The pass-band ripple is set 0.01 dB where the taps for this filter is calculated by a function in GNU radio.
8.5.4 Signal flow in the beacon software
In GNU radio, signal processing blocks are connected in a “flow graph”. The flow graph of the beacon receiver code is shown in Figure 8.5.1.This illustrates how the samples from the USRP are processed before being analyzed and stored. The information outputted by the flow graph is one vector of length 2048 where the values are the magnitude squared of the original FFT.
Figure 8.5.1 Flow graph
With the decimation and FFT size as described in 8.5.1 this code generates 20 FFT frames per second. A frequency tracking algorithm then uses these frames to keep the beacon inside 2/3 of the final bandwidth. The operations performed by the beaco code flow graph are listed below:
• When the program is started the FPGA firmware is loaded into the USRP via USB cable. Setting such as frequency and decimation rate is then transferred to the FPGA which tunes to the desired frequency. This is a two step process where the mixer of the DBSRX is used to tune as close to the desired frequency as possible. Fine tuning is achieved with the DDC which tunes the desired centre frequency to base band. Samples from the ADC is then filtered and decimated in the FPGA before being transferred to a PC via USB cable.
• The samples from the USRP are imported to the flow graph of the beacon
code. The samples are filtered by a low-pass FIR filter and decimated by a factor of 6.
• The decimated time samples are then sent to a “file sink” which stores the
samples as 32 bit complex floating point numbers.
- 49 -
• A Blackman-Harries widow is applied to time samples to reduce spectral leakage and a 2048 point FFT is calculated from one set of samples. This does not affect the samples stored to file
• The FFT’s are filtered by a single pole IIR filter in order to smooth the spectral
estimation.
• The PSD of the FFT is calculated by computing the squared magnitude
• Base 10 logarithms of the PSD values are calculated with correction for FFT size and windowing loss. These values are then sent to a “message sink” which allows the information in that sink to be accessed in other parts of the code i.e. peak detection algorithm.
Peak detection For each new FFT frame generated by the flow graph the largest bin is found along with the index of the bin position. The mean value of the FFT frame is then subtracted from the peak bin in order to estimate a carrier to noise ratio. If this value is above a certain threshold the corresponding frequency of the peak bin is calculated and used to track the beacon. This is achieved by re tuning the USRP if the beacon is located outside 2/3 of the receiver bandwidth or ± 13 kHz from the centre frequency.
8.6 Testing of the beacon receiver code
When evaluating the FFT frames generated by the beacon receiver code it is clear that the spectral averaging achieved with the IIR filter is insufficient. As a result the estimated beacon power varies with up to 1 dB from one sample to the next. Further averaging of spectrum is therefore needed in order to increase the detection threshold which is currently at about 10 dB C/N ratio. Below this value the frequency tracking algorithm therefore fails. In order to reduce the fluctuations in power of the measured data a time average of the FFT frame should be computed. This will however require more FFT frames per second in order to maintain resolution in time and frequency. This can be achieved with the periodogram method by calculating a new N point FFT for every N/k set of new samples, where k is a base 2 number. In this way N/k FFT’s can be applied to each sample. Zero-padding of the time series can also be used to generate more FFT frames per second, where a number of zeros is added to the time series [40]. Previous beacon receiver developments [24] have shown that video filtering can be used to perform spectral estimation. Video filters and other spectral averaging filters are however not available in the GNU radio software. The processing power of the computers used is also not sufficient to implement such operations in Python, at least not in real time. The solution might therefore be to implement an FFT algorithm in the FPGA of the USRP which uses the periodogram method to average the spectral estimate. This would reduce the load on the host computer and preserve more CPU power for the remaining tasks such as peak detection and automatic frequency control.
- 50 -
Originally the intent was to estimate the beacon level in real time and then store these estimates to file. This was however not achieved due to the imitations in spectral averaging. As a temporarily solution an option to store the decimated time samples form the USRP was added. In this way spectral estimation and averaging can be performed post measurements when the speed of calculations is less crucial. The FFT frames calculated in real time is therefore only used for frequency tracking and peak detection. The decimated time samples form the USRP is stored continually as 32 bit complex I,Q values. As a result the beacon receiver can be operated for about 70 days with a 1 terra byte hard drive. The samples are stored independently of the peak detection algorithm i.e. the receiver continues to record at the same frequency if the signal is lost. During this period frequency tracking is disabled. If the signal returns above the threshold and inside the bandwidth, frequency tracking is restored.
8.7 Discussion
8.7.1 Limitations of GNU radio
During development and testing of the beacon receiver code a number of GNU radio limitations was discovered. The signal processing blocks included in the software is not intended for measurements and this is reflected in the functionality of the individual blocks. As a result additional operations such as automatic frequency tracking and peak detection algorithms was implemented in Python. The addition of these operations in real time was on several occasions found to exceed the computational capacity of the computers used. The amount of additional computations was therefore reduced to a minimum. This imposed limitations which affected the overall performance of the beacon receiver. Most importantly, only one FFT is generated from a set of time samples. In turn this means that spectral averaging would result in decreased resolution in time and frequency. As an example a doubling of the FFT rate would relate to a 3 dB reduction in C/N ratio due to increased bin size. Variations in signal and noise due to insufficient spectral averaging do however require a higher FFT rate then what is currently achieved in the beacon receiver code. In order to avoid these problems the beacon code stores the raw samples from the USRP directly to file. In this way the computational intensive operations can be performed non real time when the speed of processing is not as critical.
8.7.2 Beacon receiver code
As discussed in Section 8.7.1 the limitations of the GNU radio software has imposed several restrictions on the software developed. Originally the code was intended to perform all calculations needed to estimate the beacon power level in real time. The detected levels were then written to file accompanied by a time-stamp and frequency position. An example of the resulting output is shown next:

- 51 -
Frequency Time-stamp Signal power
1450260539 2009-07-13 11:36:10.337044 35.6251 1450260540 2009-07-13 11:36:10.381925 34.4289 1450260560 2009-07-13 11:36:10.430570 34.7375 1450260541 2009-07-13 11:36:10.491413 34.888
The samples presented above are measurements of the W3A 12.2 GHz beacon at a carrier to noise ratio of about 25 dB. The actual value of the estimated beacon power is an arbitrary number which depends on the amount of amplification applied. The samples are however relative to the signal power so that a 3 dB attenuation of the received signal relates to a 3 dB decrease in the measured value. It can be seen that the samples varies with more than one dB from one sample to the next due insufficient averaging as previously discussed. In order to avoid some of the issues discussed in Section 8.7.1 the time samples from the USRP is stored directly to file. This function should however be improved so that time stamps and additional information such as frequency could be added to the stored samples. In total the code developed in this thesis does not perform satisfactory with respect to the specification derived in Section 4. Improvement of the developed code would therefore be an interesting topic for future work.
- 52 -
9 Conclusion In this thesis the design of a low cost beacon receiver using digital signal processing techniques have been proposed, evaluated and tested. As a basis for the design a link budget was produced with focus on Ka-band beacons covering the Northern regions of Norway. It was found that the Eutelsat W3A satellite is transmitting a continues wave 21.4 GHz radio beacon which covers area of interest i.e. Norwegian areas north of the polar circle. The beacon has an EIRP level specified to be at least 9 dBW at edge of coverage. A map of the coverage area can be found in Appendix 2. North of the Norwegian mainland this would result in a signal level of about -130 dBm at the output of a 1.2 m diameter antenna, or about 47 dB above the background noise. It was found that by using a commercially available LNB a receiver noise figure of less than 1.5 dB could be achieved. This would result in a carrier to noise ratio of about 45 dBHz. The costs of manufacturing a complete beacon receiver system for the W3A 21.4 GHz satellite beacon was found to be in excess of 100.000 NOK, where three components are affecting the overall cost of the receiver considerably. Those components are the Antenna, LNB and filters. Limitations in available fabrication equipment also lead to increased costs due the use of RF components with coaxial connections. It was also found that the Ka-band beacon selected for measurements in this thesis was unsuited for building a low cost beacon receiver. This is due to the frequency of 21.4 GHz which is about 200 MHz outside the frequency range of most commercial Ka-band equipment. This in turn made it difficult to find low cost components for the antenna and LNB. Attempts to reduce costs lead to the discovery of the universal software radio peripheral (USRP) which is a software defined radio developed for GNU radio software. By using an available plug-in board (DBSRX) containing an analog front-end the device could cover the L-band (800-1500 MHz) intermediate frequency often used in satellite receiving equipment. This allows the USRP to be used as an L-band receiver which can be connected to any front-end utilizing this intermediate frequency. The USRP was tested in a lab setting where an L-band signal of 1.45 GHz produced by a signal generator was injected into the DBSRX front-end. The spectrum was then evaluated using GNU radio software. Measurements showed that the USRP has a linear dynamic range of about 60 dB. This in excess of the 50 dB requirement of this thesis and was therefore deemed adequate for beacon measurements. Reception of the Eutelsat W3A 12.2 GHz beacon with a 0.45 m antenna also revealed that an adequate signal to noise ratio can be achieved with this device. A beacon receiver algorithm was developed and implemented in Python. The code tunes the USRP to an optional L-band IF frequency. Decimation and filtering is then carried out and a 2k FFT is performed on the incoming data. A total decimation of 1536 allows for 20 FFT’s to be generated each second with a bin size of 20 Hz in a 40 kHz bandwidth. The code has been tested on a sine wave produced by a signal generator and reception of a Ku-band beacon. The results show that additional spectral averaging is needed to reduce variations in the estimated beacon power level. This could however not be achieved with current functions in GNU radio since
- 53 -
only one FFT frame is produced per sample in real time. It is therefore suggested that a new FFT algorithm capable of producing an increased number of FFT’s per sample should be added to GNU radio. Either in the FPGA of the USRP or in a C++ signal processing block.
9.1 Suggestions for further work
9.1.1 Limitations of GNU radio software
GNU radio contains a variety of different functions and signal processing blocks. The functionality is however not intended for propagation measurements and this is reflected in the signal processing blocks on which GNU radio operates. As a result, a lot of additional programming in Python is needed in order to use the existing blocks. This is not ideal since computational intensive operations should be implemented in C++ blocks rather than Python [27]. Over runs i.e. failure to perform computations at the same rate as the incoming data has been observed frequently during this thesis. It is therefore suggested that new signal processing blocks should be created. Especially, an FFT algorithm capable of generating several frames per sample should be devised, either in C++ or in the FPGA of the USRP. This would allow for FFT’s and spectral averaging to be performed in real time.
9.1.2 Improvements to the beacon receiver code
The software code developed in this thesis should bee improved in several ways:
• Addition of time-stamps and logging of frequency to the recorded data
• Scaling of the beacon power estimate to correspond with the actual dBm value
• Improvements to the user interface
• Improvements to frequency tracking algorithm
9.1.3 Extended functionality
In propagation research the measurements of attenuation, scintillation and sea surface reflections are considered along with the climatic conditions. It is therefore suggested that weather data should be stored along with beacon measurements. This might include rain rates, wind velocity, temperature and barometric pressure.
In this thesis a beacon receiver for measurement of amplitude fluctuations have been considered. The USRP is however also capable of performing phase coherent measurements [45]. It might therefore be possible to extend the functionality of the receiver to also measure effects such as frequency selective fading and group delay.
- 54 -
9.1.4 Maritime measurements
If maritime measurements are to be collected an antenna with tracking capabilities must be integrated with the beacon receiver. The use of such antennas is however not ideal for beacon measurements since variations in signal power will be caused by the antenna. A study of the effects of maritime tracking antennas on beacon measurements should therefore be conducted.
- 55 -
References
[1] Norwegian Armed Forces, Coast guard. http://www.mil.no/sjo/kv/start/omkv/operasjonsomr_de/ Accessed 23.05.2009 [2] U.S. Geological Survey, Newsroom, “90 Billion Barrels of Oil and 1,670 Trillion Cubic Feet of Natural Gas Assessed in the Arctic” http://www.usgs.gov/newsroom/article.asp?ID=1980&from=rss_home Accessed 23.05.2009
[3] CIA world fact book, https://www.cia.gov/library/publications/the-world-factbook/ Accessed 13.05.2009 [4] Norwegian Government, ministry of foreign affairs, “The Norwegian government’s High North strategy” wwww.regjeringen.no/upload/UD/Vedlegg/strategien.pdf Accessed 13.05.2009
[5] O. Gutteberg, “Measurements of atmospheric effects on satellite links at very low elevation angle” Norwegian telecommunications administration research establishment, Telektronikk 3.1994, pp 8-13, Kjeller 1994 [5.1] Lam. W. I, “Low angle signal fading at 38 GHz in the High Artic” IEEE Trans. Antennas Propagation, Vol. AP-35, No 6, pp.1495-1499. June 1984
[6] Richter-Menge, et al. “State of the artic report”. NOAA / OAR / PMEL, Special Report, October 2006 [7] GNU radio mailing list, “USRP and DC offset” http://osdir.com/ml/gnu.radio.general/2005-04/msg00061.html Accessed 11.06.2009
[8] Kikkert C. J., Bowthorpe B. and Allen G. “Satellite Beacon Receiver Improvement Using Digital Processing Techniques”. The Fourth International Symposium on Signal Processing and its Applications (ISSPA96), pp.517-520, August 1996.
[9] Jeffery H. Reed. “Software radio, A Modern Approach to Radio Engineering”
Prentice Hall Communications Engineering and Emerging Technologies Series. ISBN: 978-0130811585. May, 2002
[10] Analog Devises. http://www.analog.com/en/index.html Accessed 13.05.2009 [11] Saunders, S. R. Aragòn-Zavala. A, “Antennas and propagation for wireless
communication system, Second edition” John Wiley & sons. ISBN: 978-0-470- 84879-1. March, 2007.
- 56 -
[12] T. Pratt, C. Bostian, and J. Allnutt, “Satellite Communications” John Wiley & Sons, 2nd edition, 2003, ISBN: 978-0471370079. October, 2002. [13] ITU-R Recommendation P.618-9 “Propagation data and prediction methods required for the design of Earth-space telecommunication systems” International Telecommunication Union, Geneva, 2007 [14] ITU-R Recommendation P372-9. “Radio Noise” International Telecommunication Union, Geneva, 2007 [15] CNES, Propagation dynamic library. http://logiciels.cnes.fr/PROPA/en/logiciel.htm Accessed 23.05.2009 [16] David M. Pozar. Microwave and RF Wireless Systems. John Wiley & Sons, 2001. ISBN 0-471-32282-2, November, 2000. [17] ITU-R Recommendation P676-7. Attenuation by atmospheric gases. International Telecommunication Union, Geneva 2007 [18] Mini-Circuits Corporation. “Understanding Mixers – Terms Defined, and Measuring Performance” www.minicircuits.com/pages/pdfs/an00009.pdf Accessed 23.05.2009 [19] Kikkert C. J., Bowthorpe B. and Ong Jin Teong, “A DSP Based Satellite Beacon Receiver and Radiometer” 1998 Asia Pacific Microwave Conference, Yokohama, Japan, pp.443-446. December 1998 [20] Mini-Circuits Corporation. “How to select a mixer”, www.minicircuits.com/pages/pdfs/mixer1-5a.pdf Accessed 23.05.2009 [21] Dosedel, M.; Urbanec, T “0-2.5 GHz Generator Based on ADF4360 Controlled by Microprocessor” Radioelektronika, 17th International Conference, pp.1-4, April 2007 [22] Giannini, Vito, Craninckx, Jan, Baschirotto, Andrea. “BASEBAND ANALOG CIRCUITS FOR SOFTWARE DEFINED RADIO” ISBN: 978-1-4020-6537-8, 2008 [23] Simon Haykin. “Communications Systems” John Wiley & Sons, fourth edition, ISBN 0-471-17869-1, 2001 [24] General Dynamics, Satcom Technologies http://www.gdsatcom.com/antennas.php. Accessed 23.05.2009 [25] ADIsimPLL Version 3.1 http://forms.analog.com/form_pages/rfcomms/adisimpll.asp Accessed 23.05.2009
- 57 -
[26] MetaGeek LLC. Wi-Spy product page. http://www.metageek.net/products/wi-spy_24x Accessed 13.06.2009 [27] Firas Abbas Hamza “The USRP under 1.5X Magnifying Lens!” http://www.scribd.com/doc/9688095/USRP-Documentation Accessed 23.05.2009 [28] Analog Devices, AD9862. http://www.analog.com/en/rfif-components/rxtx- ubsystems/ad9862/products/product.html Accessed 23.05.2009 [29] Vincent J. Arkesteijn, Eric A.M. Klumperink and Bram Nauta. “ADC Clock Jitter Requirements for Software Radio Receivers” Vehicular Technology Conference. Volume 3, pp.1983 – 1985, 26-29, Sept 2004 [30] Komplett.no www.komplett.no, Accessed 23.05.2009 [31] Ettus research LLC www.ettus.com, Accessed 23.05.2009 [32] Analog devices. “Data sheet for AD9235” http://www.analog.com/static/imported-files/eval_boards/HSC-ADC-EVALB.pdf Accessed 21.04.2009 [33] Analog devices. “High Speed ADC USB FIFO Evaluation Kit” http://www.analog.com/static/imported-files/eval_boards/HSC-ADC-EVALB.pdf Accessed 21.04.2009 [34] Gnuradio, “The gnuradio website” www.gnuradio.org, Accessed 15.06.2009 [35] Python “Python Programming Language -- Official Website” www.python.org, Accessed 21.04.2009 [36] Norsat Internation Inc www.norsat.com, Accessed 23.05.2009 [37] Mini-Circuits Corporation www.minicircuits.com/ , Accessed 23.05.2009 [38] Analog devices. http://www.analog.com, Accessed 21.04.2009 [39] Satellite signals, List of Ku-band beacon frequencies http://www.satsig.net/eut2beac.htm, Accessed 03.07.2009 [40] Connexions, “Spectrum Analysis Using the Discrete Fourier Transform “ http://cnx.org/content/m12032/latest/, Accessed 13.07.2009
- 58 -
[40.1] Connexions, “Classical Statistical Spectral Estimation “ http://cnx.org/content/m12014/latest/ [41] MAX2118 Complete DBS direct-conversion tuner ICs with monolithic VCOs. http://datasheets.maxim-ic.com/en/ds/MAX2116-MAX2118.pdf, Accessed 10.6.2009 [42] Kikkert C. J, “Dynamic range improvements of a beacon receiver using DSP
techniques” URSI Commission F Triennium Open Symposium, Cairns, Australia June 2004
[45] Yamamoto, M, “Digital beacon receiver for ionospheric TEC measurement developed with GNU Radio” Earth Planets Space, 60, pp 21-24, 2008
[44] Triax, LNB specifications. http://www.triax.dk/Antennemateriel/LNB/LNB.aspx?productId={37EB2D3B- 0808-4115-A60E-C82B1FBCAFD6}&Tab=0
[45] Antonio Jose Costa, Joao Lima, et al. “Spectrum analyzer with USRP, GNU Radio and MATLAB” January 23, 2009 http://www.av.it.pt/conftele2009/Papers/114.pdf, Acceded 27.06.09
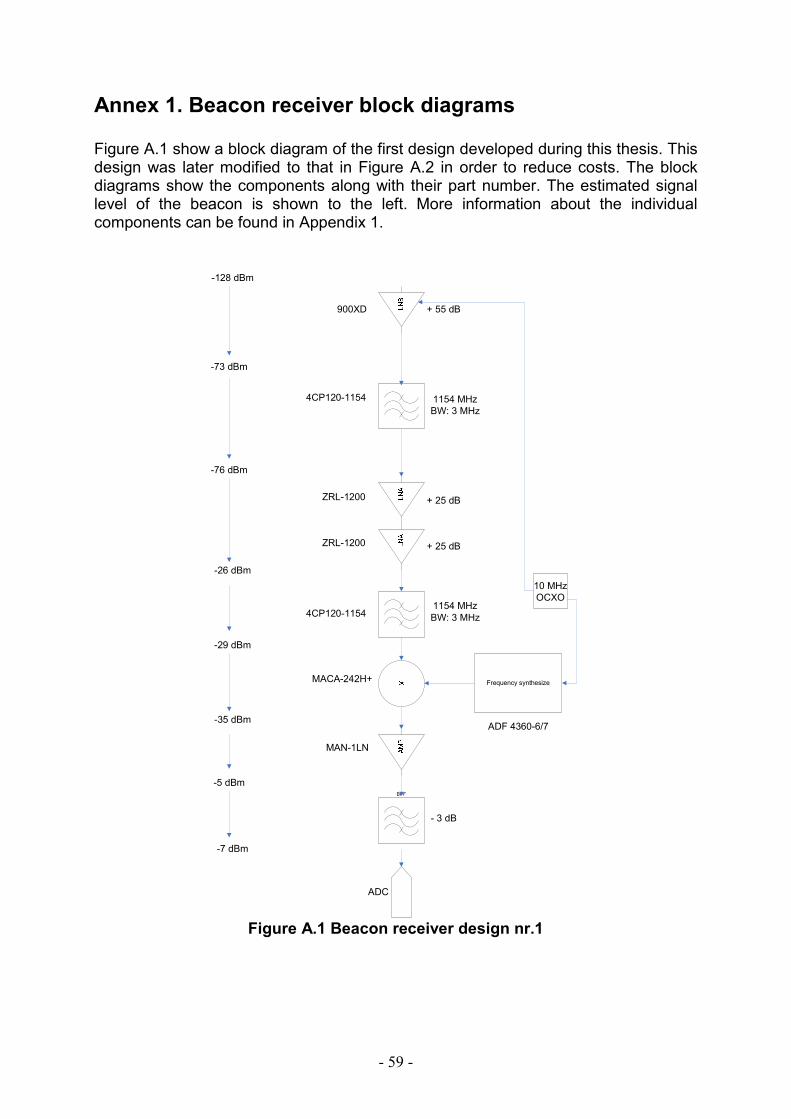
- 59 -
Annex 1. Beacon receiver block diagrams Figure A.1 show a block diagram of the first design developed during this thesis. This design was later modified to that in Figure A.2 in order to reduce costs. The block diagrams show the components along with their part number. The estimated signal level of the beacon is shown to the left. More information about the individual components can be found in Appendix 1.
BPF
ADC
1154 MHzBW: 3 MHz
4CP120-1154
ZRL-1200
ZRL-1200
+ 25 dB
+ 25 dB
+ 55 dB
- 3 dB
900XD
1154 MHzBW: 3 MHz
-128 dBm
-73 dBm
-76 dBm
-26 dBm
-29 dBm
-35 dBm
-5 dBm
-7 dBm
10 MHzOCXO
Frequency synthesizeMACA-242H+
MAN-1LN
ADF 4360-6/7
4CP120-1154
Figure A.1 Beacon receiver design nr.1
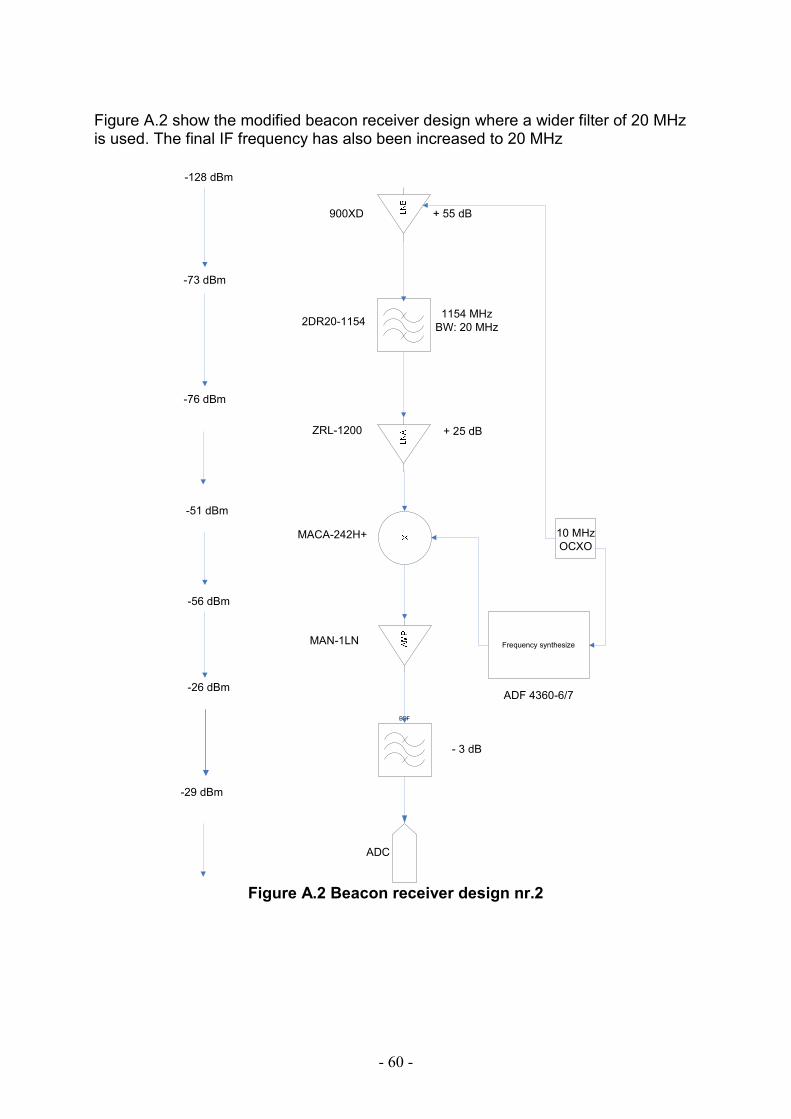
- 60 -
Figure A.2 show the modified beacon receiver design where a wider filter of 20 MHz is used. The final IF frequency has also been increased to 20 MHz
BPF
ADC
1154 MHzBW: 20 MHz
2DR20-1154
ZRL-1200 + 25 dB
+ 55 dB
- 3 dB
900XD
-128 dBm
-73 dBm
-76 dBm
-51 dBm
-56 dBm
-26 dBm
-29 dBm
10 MHzOCXO
Frequency synthesize
MACA-242H+
MAN-1LN
ADF 4360-6/7
Figure A.2 Beacon receiver design nr.2
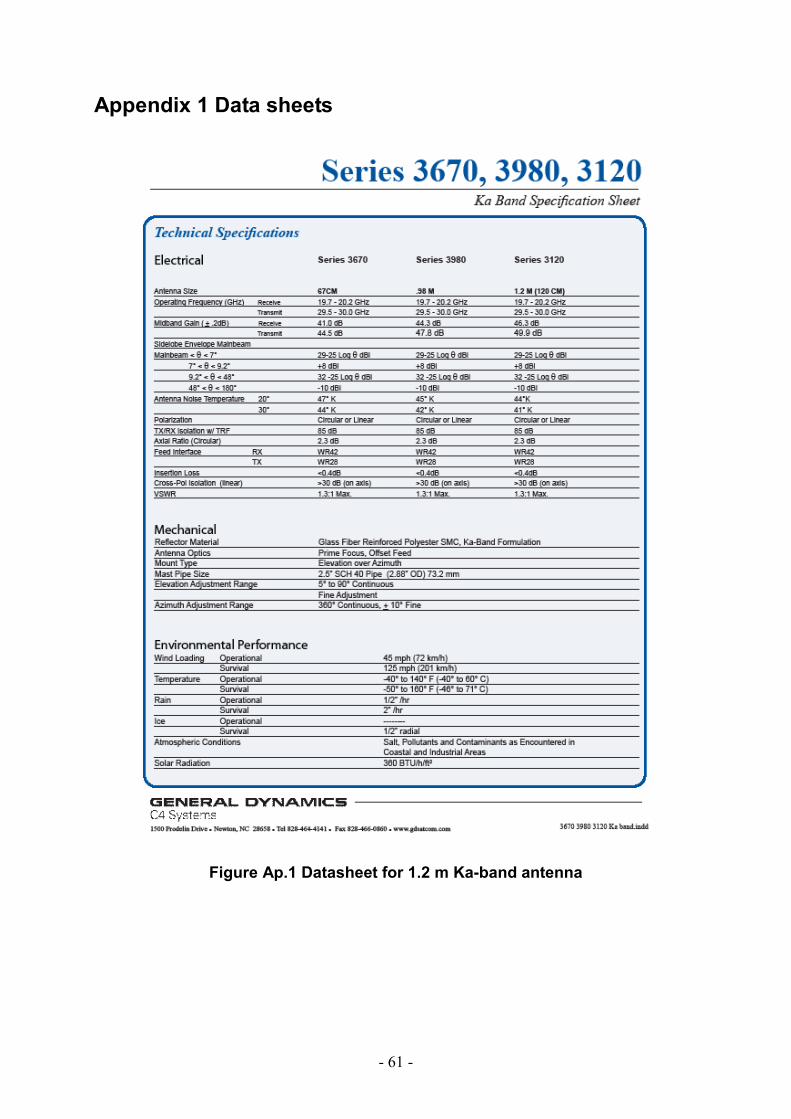
- 61 -
Appendix 1 Data sheets
Figure Ap.1 Datasheet for 1.2 m Ka-band antenna
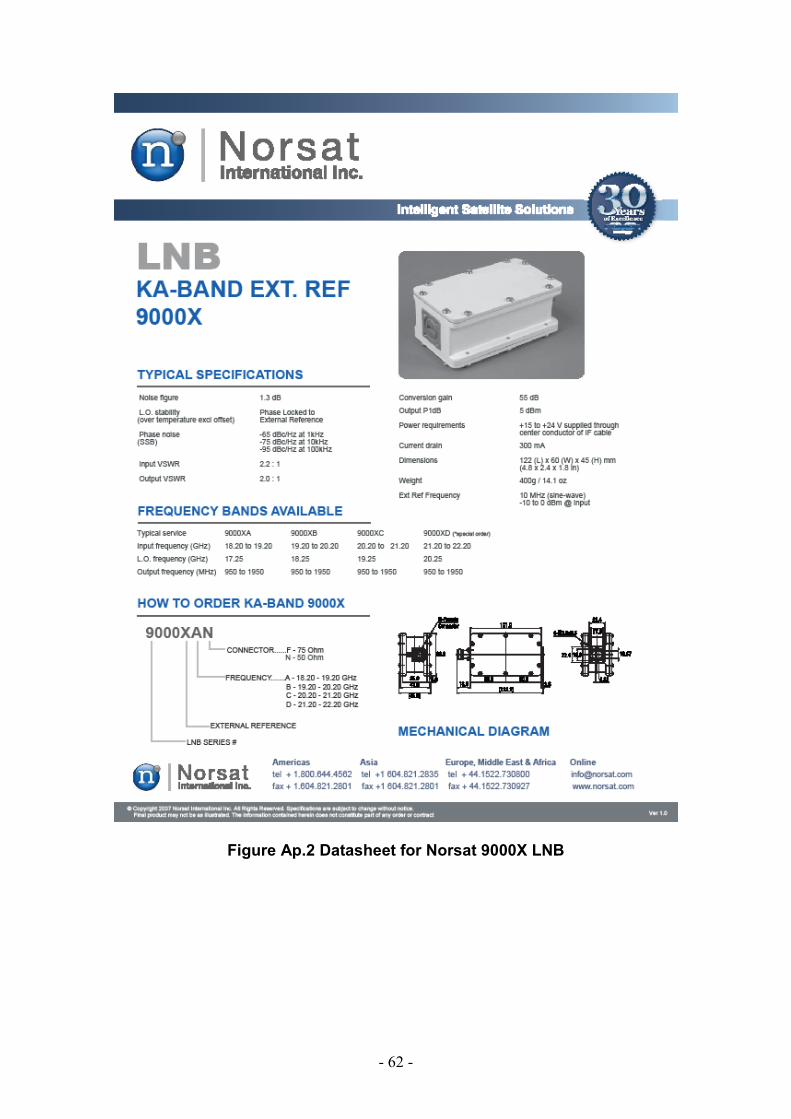
- 62 -
Figure Ap.2 Datasheet for Norsat 9000X LNB
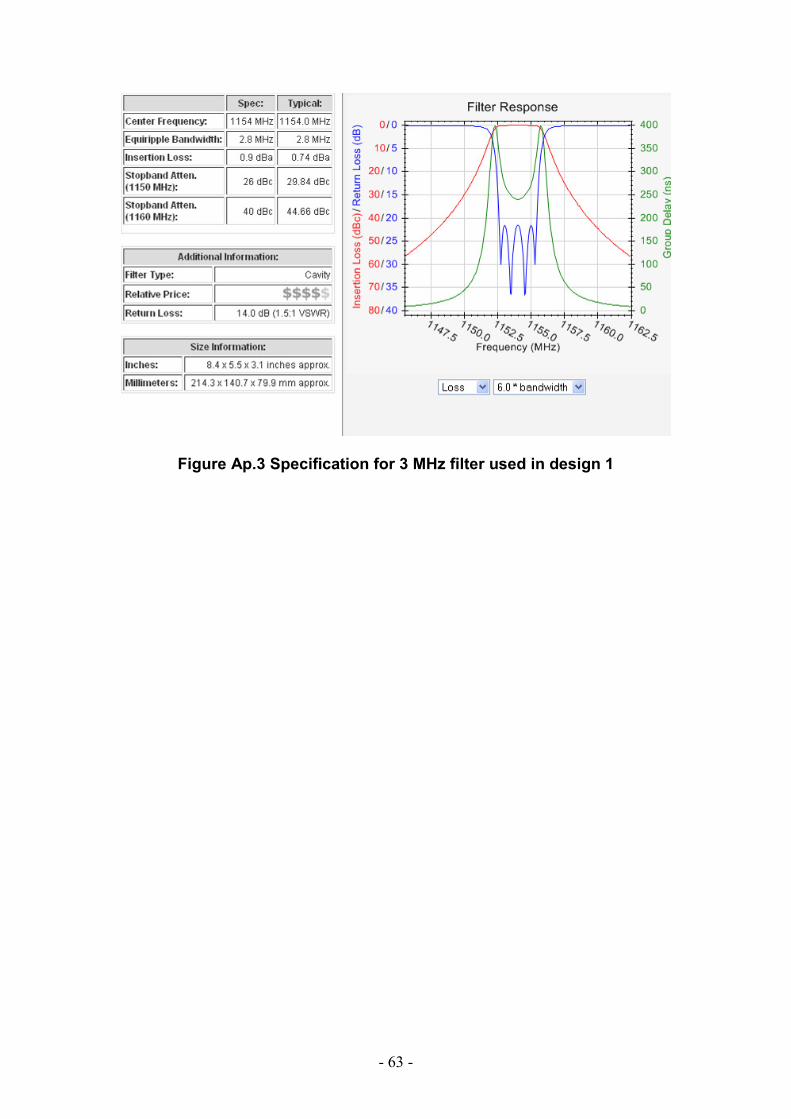
- 63 -
Figure Ap.3 Specification for 3 MHz filter used in design 1
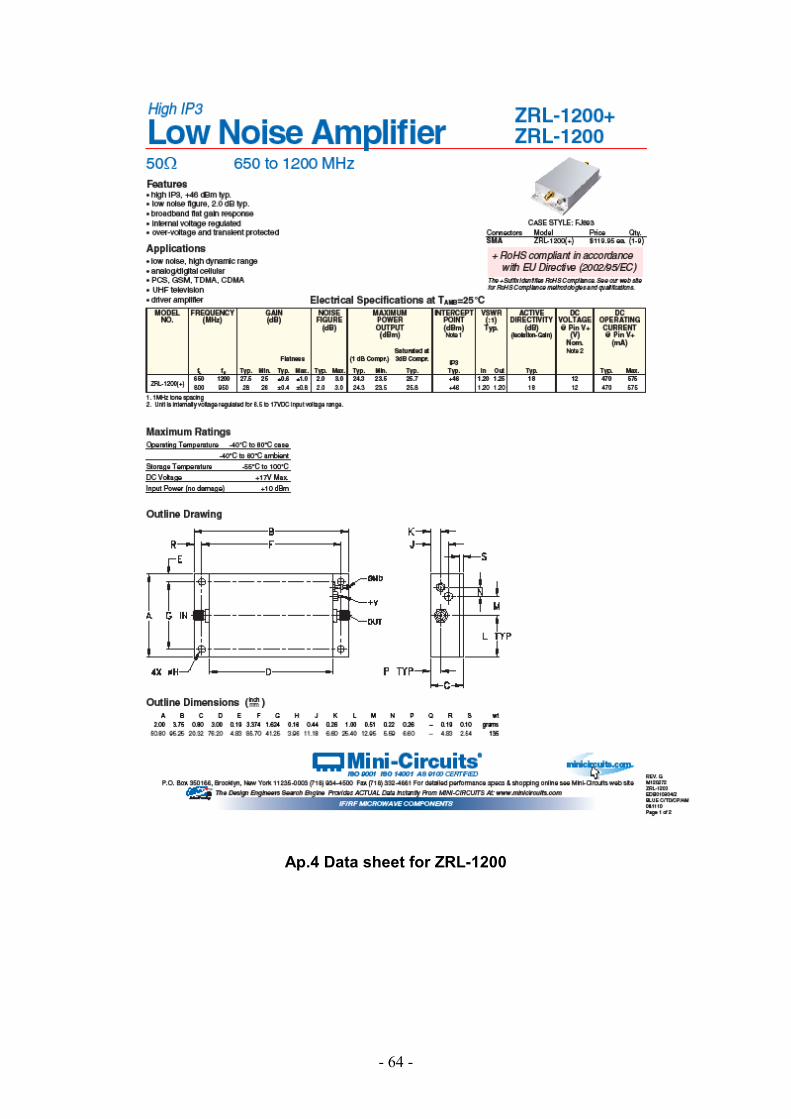
- 64 -
Ap.4 Data sheet for ZRL-1200
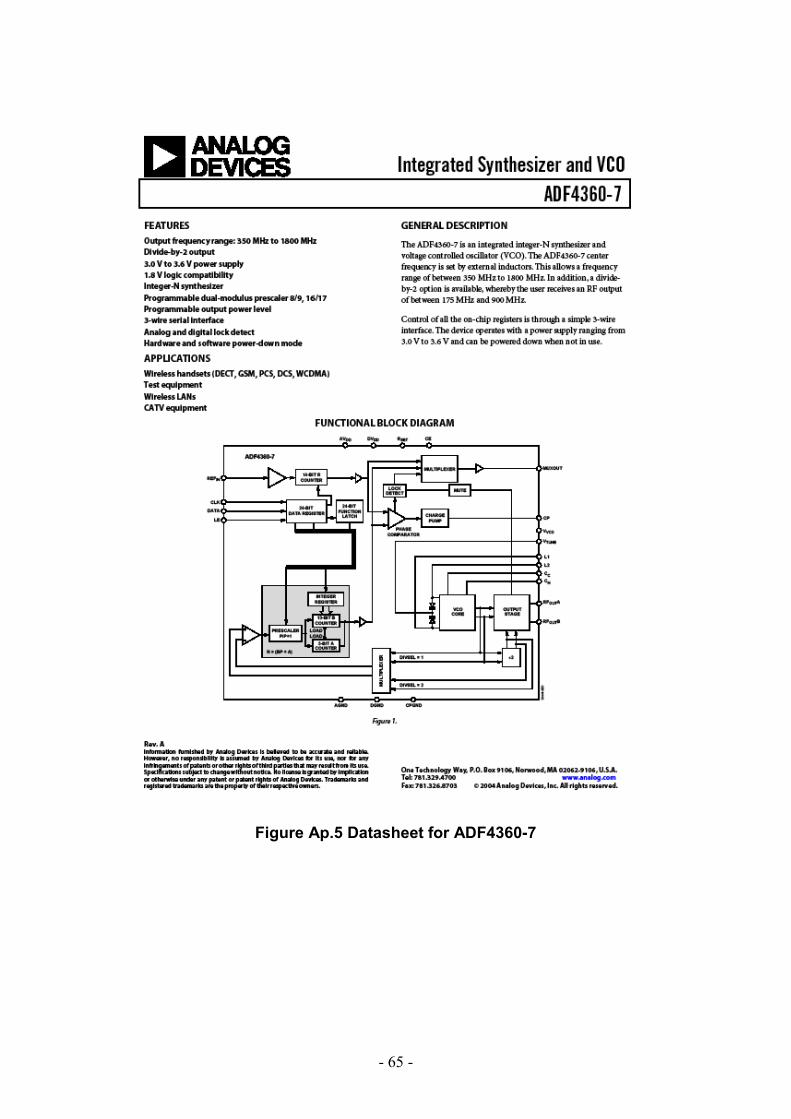
- 65 -
Figure Ap.5 Datasheet for ADF4360-7
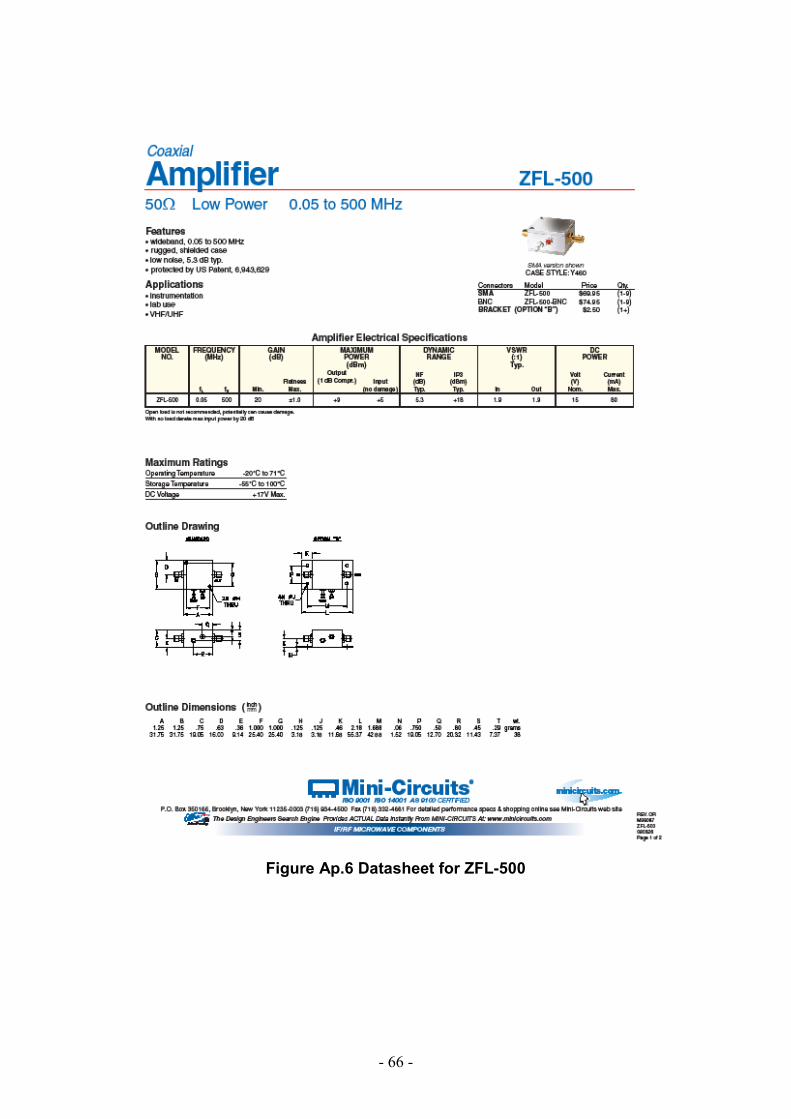
- 66 -
Figure Ap.6 Datasheet for ZFL-500

- 67 -
Figure Ap.7 Price quote and specifications for filters used in design 1
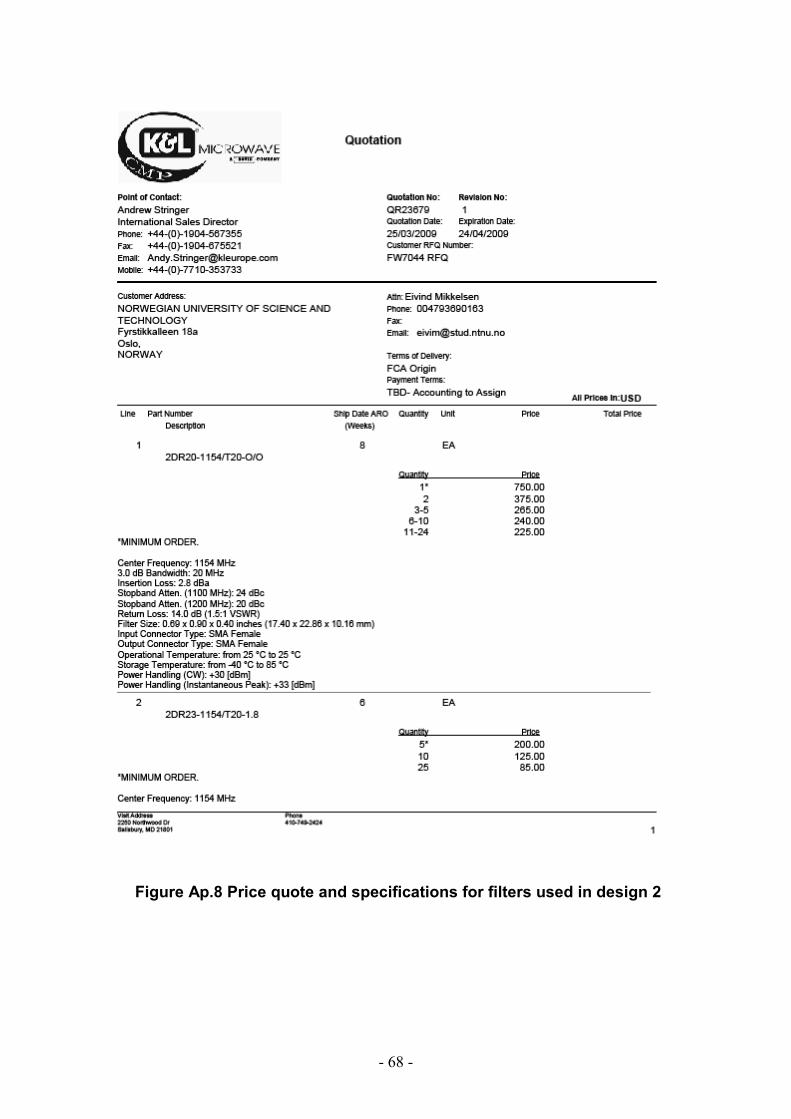
- 68 -
Figure Ap.8 Price quote and specifications for filters used in design 2
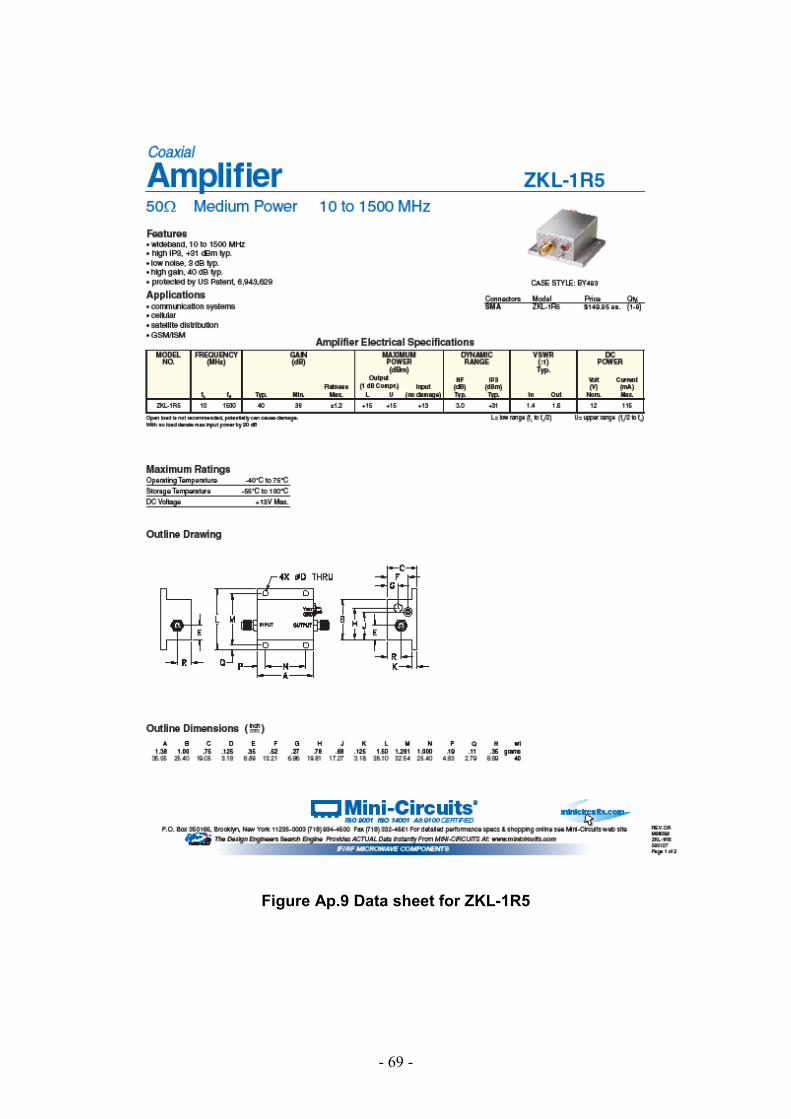
- 69 -
Figure Ap.9 Data sheet for ZKL-1R5
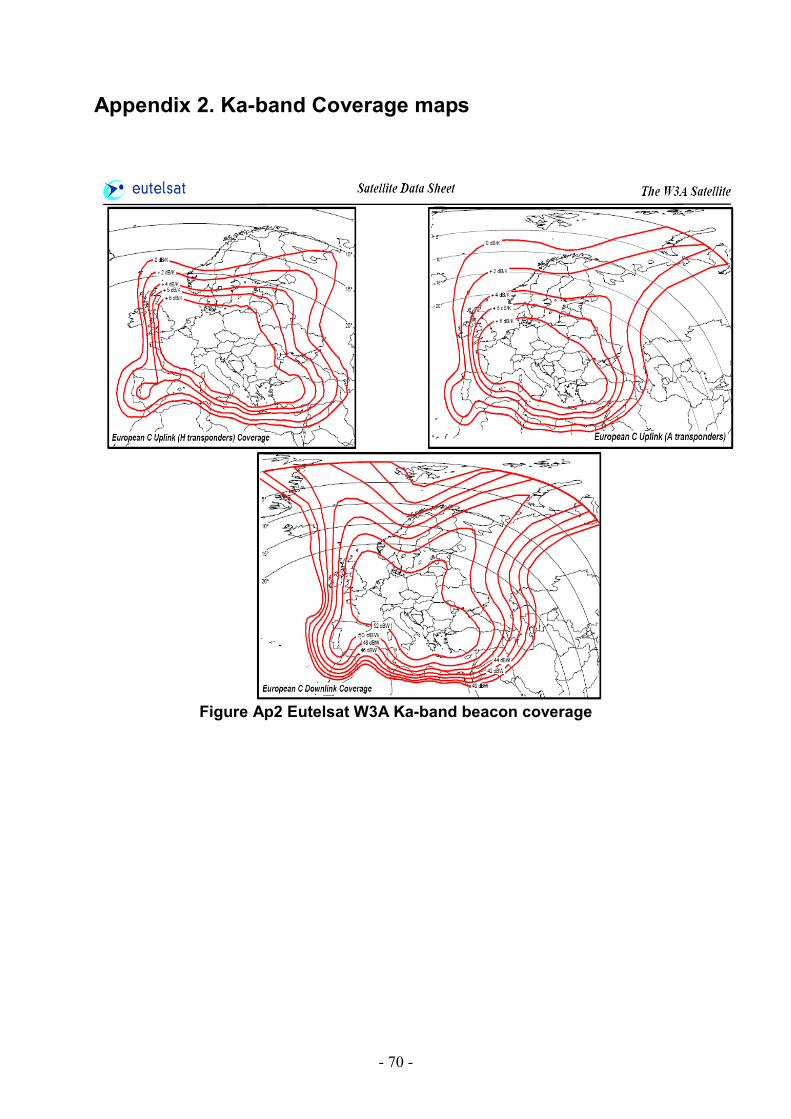
- 70 -
Appendix 2. Ka-band Coverage maps
Figure Ap2 Eutelsat W3A Ka-band beacon coverage
- 71 -
Appendix 3. Software code
Ap.2.1 FFT plotting code
#!/usr/bin/env python ################################################## # Gnuradio Python Flow Graph # Title: Top Block # Generated: Tue Jul 14 12:55:04 2009 ################################################## from gnuradio import gr from gnuradio import optfir from gnuradio.eng_option import eng_option from gnuradio.gr import firdes from gnuradio.wxgui import fftsink2 from gnuradio.wxgui import forms from grc_gnuradio import usrp as grc_usrp from grc_gnuradio import wxgui as grc_wxgui from optparse import OptionParser import wx class top_block(grc_wxgui.top_block_gui): def __init__(self): grc_wxgui.top_block_gui.__init__(self, title="Top Block") ################################################## # Variables ################################################## self.samp_rate = samp_rate = 250000 self.gain = gain = 20 ################################################## # Controls ################################################## _gain_sizer = wx.BoxSizer(wx.VERTICAL) self._gain_text_box = forms.text_box( parent=self.GetWin(), sizer=_gain_sizer, value=self.gain, callback=self.set_gain, label="gain", converter=forms.float_converter(), proportion=0, ) self._gain_slider = forms.slider( parent=self.GetWin(), sizer=_gain_sizer, value=self.gain, callback=self.set_gain, minimum=0, maximum=70, num_steps=100, style=wx.SL_HORIZONTAL, cast=float, proportion=1, ) self.Add(_gain_sizer) ################################################## # Blocks ################################################## self.gr_fir_filter_xxx_0 = gr.fir_filter_ccc(6, (optfir.low_pass(1,samp_rate,20e3,22e3,0.01,60))) self.usrp_simple_source_x_0 = grc_usrp.simple_source_c(which=0, side="A", rx_ant="RXA") self.usrp_simple_source_x_0.set_decim_rate(256) self.usrp_simple_source_x_0.set_frequency(1.45005e9, verbose=True) self.usrp_simple_source_x_0.set_gain(gain)
- 72 -
self.wxgui_fftsink2_0 = fftsink2.fft_sink_c( self.GetWin(), baseband_freq=0, y_per_div=10, y_divs=10, ref_level=50, sample_rate=samp_rate/6, fft_size=2048, fft_rate=30, average=False, avg_alpha=None, title="FFT Plot", peak_hold=False, ) self.Add(self.wxgui_fftsink2_0.win) ################################################## # Connections ################################################## self.connect((self.gr_fir_filter_xxx_0, 0), (self.wxgui_fftsink2_0, 0)) self.connect((self.usrp_simple_source_x_0, 0), (self.gr_fir_filter_xxx_0, 0)) def set_samp_rate(self, samp_rate): self.samp_rate = samp_rate self.gr_fir_filter_xxx_0.set_taps((optfir.low_pass(1,self.samp_rate,20e3,22e3,0.01,60))) self.wxgui_fftsink2_0.set_sample_rate(self.samp_rate/6) def set_gain(self, gain): self.gain = gain self._gain_slider.set_value(self.gain) self._gain_text_box.set_value(self.gain) self.usrp_simple_source_x_0.set_gain(self.gain) if __name__ == '__main__': parser = OptionParser(option_class=eng_option, usage="%prog: [options]") (options, args) = parser.parse_args() tb = top_block() tb.Run(True)
- 73 -
Ap.2.2 Beacon receiver code
#!/usr/bin/env python # # Copyright 2005,2006,2007 Free Software Foundation, Inc. # # This file is part of GNU Radio # # GNU Radio is free software; you can redistribute it and/or modify # it under the terms of the GNU General Public License as published by # the Free Software Foundation; either version 3, or (at your option) # any later version. # # GNU Radio is distributed in the hope that it will be useful, # but WITHOUT ANY WARRANTY; without even the implied warranty of # MERCHANTABILITY or FITNESS FOR A PARTICULAR PURPOSE. See the # GNU General Public License for more details. # # You should have received a copy of the GNU General Public License # along with GNU Radio; see the file COPYING. If not, write to # the Free Software Foundation, Inc., 51 Franklin Street, # Boston, MA 02110-1301, USA. # from gnuradio import gr, gru, eng_notation, optfir, window from gnuradio import audio from gnuradio import usrp from gnuradio import blks2 from gnuradio.eng_option import eng_option from gnuradio.wxgui import slider, powermate from gnuradio.wxgui import stdgui2, fftsink2, form from optparse import OptionParser from usrpm import usrp_dbid import sys import math import wx import numpy import threading import pylab import datetime def pick_subdevice(u): """ The user didn't specify a subdevice on the command line. If there's a daughterboard on A, select A. If there's a daughterboard on B, select B. Otherwise, select A. """ if u.db[0][0].dbid() >= 0: # dbid is < 0 if there's no d'board or a problem return (0, 0) if u.db[1][0].dbid() >= 0: return (1, 0) return (0, 0) class top(gr.top_block): def __init__(self): gr.top_block.__init__(self) parser = OptionParser(option_class=eng_option) parser.add_option("-R", "--rx-subdev-spec", type="subdev", default=(0,0), help="select USRP Rx side A or B (default=first one with a daughterboard)")
- 74 -
parser.add_option("-g", "--gain", type="eng_float", default=30, help="set gain in dB (default is midpoint)") parser.add_option("-F", "--fft-size", type="int", default=2048, help="specify number of FFT bins [default=%default]") parser.add_option("-d", "--decim", type="intx", default=256, help="set decimation to DECIM [default=%default]") parser.add_option("-f", "--freq", type="eng_float", default=1.20008e9, help="set frequency to FREQ", metavar="FREQ") parser.add_option("-S", "--scope", action="store_true", default=False, help="Enable scope display") parser.add_option("", "--avg-alpha", type="eng_float", default=1e-1, help="Set fftsink averaging factor, default=[%default]") (options, args) = parser.parse_args() if len(args) != 0: parser.print_help() sys.exit(1) self.options = options self.show_debug_info = True #Settings decim = options.decim self.freq = options.freq gain = options.gain # USRP is source self.u = usrp.source_c(0, decim_rate=decim) # determine the daughterboard subdevice we're using self.subdev = usrp.selected_subdev(self.u, options.rx_subdev_spec) # Set DBSRX channel filter 1MHz self.subdev.set_bw(1e6) # FFT Parameters fftsize = options.fft_size # set data rates adc_rate = self.u.adc_rate() # 64 MS/s usrp_decim = options.decim chanfilt_decim = 6 usrp_rate = self.u.adc_freq() / self.u.decim_rate() # Channel filter taps chan_filt_coeffs = optfir.low_pass (1, # gain usrp_rate, # sampling rate 18e3, # passband cutoff 20e3, # stopband cutoff 0.01, # passband ripple 60) # stopband attenuation self.chan_filt = gr.fir_filter_ccc (chanfilt_decim, chan_filt_coeffs) ss2v = gr.stream_to_vector(gr.sizeof_gr_complex, fftsize) mywin = window.blackmanharris(fftsize) fft = gr.fft_vcc(fftsize, True, mywin) power = 0 for tap in mywin: power += tap*tap c2m = gr.complex_to_mag_squared(fftsize) avg = gr.single_pole_iir_filter_ff(0.1, fftsize)
- 75 -
filesink = gr.file_sink(gr.sizeof_gr_complex, "otput.dat") log = gr.nlog10_ff(10,fftsize, -20*math.log10(fftsize) # Adjust for number of bins -10*math.log10(power/fftsize)+20) # Adjust for windowing loss # Message Settings self.qsize = 1 self.msgq0 = gr.msg_queue(self.qsize) m_sink0 = gr.message_sink(gr.sizeof_float*fftsize, self.msgq0, True) self.connect(self.u, self.chan_filt, ss2v, fft, c2m,avg, log, m_sink0) self.connect(self.chan_filt, filesink) self.set_freq(options.freq) self.set_gain(gain) def set_freq(self, target_freq): r = self.u.tune(0, self.subdev, target_freq) print "ok" return False def set_gain(self, gain): self.subdev.set_gain(gain) def shift(x,size=2048): # This fuction is no longer used due to overrun """ Shifts indexes so that the first half corresponds to FS-FS/2 and the second half to FS+FS/2. @ x: index number """ if x <= (size/2): return x+(size/2)-1 elif x > (size/2): return x-(size/2)-1 def main (): # Start Top Block tb = top() #Start Flowgraph tb.start() # Fix me, Make decimation and FFT size an option by using values from TopBlock fft_size=2048 freq = tb.freq usrp_rate = 250000 input_rate = usrp_rate / 6 cycles_per_bin = (250000/6)/fft_size
- 76 -
# Loop for reading FFT frames and AFC while(True): freq = tb.freq msg = tb.msgq0.delete_head() # get first frequency message s = msg.to_string() # raw frequency data itemsize = int(msg.arg1()) nitems = int(msg.arg2()) # Que should contain only one vecttor, if not delete the old ones if nitems > 1: start = itemsize * (nitems -1) s = s[start:start + itemsize] complex_data = numpy.fromstring(s, numpy.float32) # Fi me, removal of DC offset should be made independent of gain settings complex_data[0]=complex_data[1]-20 complex_data[1]=complex_data[1]-20 complex_data[-1]=complex_data[-1]-20 # Find peak and location of bin maxval = max(complex_data) binmax = numpy.argmax(complex_data) avgval = numpy.mean(complex_data) # mean value of FFT #maxval2=[complex_data[binmax-3], complex_data[binmax-2] , complex_data[binmax+1],complex_data[binmax] , complex_data[binmax+1] #complex_data[binmax+2],complex_data[binmax+3] , complex_data[binmax+100]] # calculates power of max bin + side bins if binmax < 2042: wavg= (complex_data[binmax-1] + complex_data[binmax] + complex_data[binmax+1])/3 else: wavg=maxval # aviod suming out of vector pk_bin = numpy.argmax(complex_data) if (maxval - (avgval-wavg) > 10): # Fix me, Treshold should be independent of gain if pk_bin > 0: left_bin = pk_bin - 1 else: left_bin = (fft_size - 1) if pk_bin < (fft_size - 2): right_bin = pk_bin + 1 else: right_bin = 0 left_val = complex_data[left_bin] right_val = complex_data[right_bin] # Calculate a weighted average bin location starting with # the fraction of a bin to offset the center. wtd_sum = (right_val - left_val) / (left_val + right_val) pk_bin += wtd_sum # Adjust for bottom wraparound if (pk_bin < 0): pk_bin += (nitems - 1) # Adjust for top wraparound if (pk_bin > (fft_size - 1)): pk_bin += (1 - fft_size) # Calculate equivalent freq of bin, accounting for spectral
- 77 -
# folding around center. if pk_bin < fft_size / 2: pk_freq = int(freq + (pk_bin * cycles_per_bin)) else: pk_freq = int(freq + ((pk_bin - (fft_size - 1))* cycles_per_bin)) #print wavg, avgval, pk_freq,freq, pk_bin # Sves the the mag squared of peak bin to fil along with beacon #frequency and time stamp s = str(maxval) ff = str(pk_freq) t = str(datetime.datetime.utcnow()) f = open('workfile', 'a') f.write(ff + '\n' + t + '\n' + s + '\n\n') # AFC if abs(pk_freq-freq) > 10000: target_freq = pk_freq+100 print "re tune", tb.freq, target_freq tb.freq=pk_freq tb.options.freq = pk_freq+100 tb.set_freq(target_freq) if __name__ == '__main__': main ()
- 78 -
Ap.2.3 Modified version of usrp_fft.py #!/usr/bin/env python # # Copyright 2004,2005,2007,2008 Free Software Foundation, Inc. # # This file is part of GNU Radio # # GNU Radio is free software; you can redistribute it and/or modify # it under the terms of the GNU General Public License as published by # the Free Software Foundation; either version 3, or (at your option) # any later version. # # GNU Radio is distributed in the hope that it will be useful, # but WITHOUT ANY WARRANTY; without even the implied warranty of # MERCHANTABILITY or FITNESS FOR A PARTICULAR PURPOSE. See the # GNU General Public License for more details. # # You should have received a copy of the GNU General Public License # along with GNU Radio; see the file COPYING. If not, write to # the Free Software Foundation, Inc., 51 Franklin Street, # Boston, MA 02110-1301, USA. # from gnuradio import gr, gru, optfir from gnuradio import usrp from gnuradio import eng_notation from gnuradio.eng_option import eng_option from gnuradio.wxgui import stdgui2, fftsink2, waterfallsink2, scopesink2, form, slider from optparse import OptionParser import wx import sys import numpy def pick_subdevice(u): """ The user didn't specify a subdevice on the command line. If there's a daughterboard on A, select A. If there's a daughterboard on B, select B. Otherwise, select A. """ if u.db[0][0].dbid() >= 0: # dbid is < 0 if there's no d'board or a problem return (0, 0) if u.db[1][0].dbid() >= 0: return (1, 0) return (0, 0) class app_top_block(stdgui2.std_top_block): def __init__(self, frame, panel, vbox, argv): stdgui2.std_top_block.__init__(self, frame, panel, vbox, argv) self.frame = frame self.panel = panel parser = OptionParser(option_class=eng_option) parser.add_option("-w", "--which", type="int", default=0, help="select which USRP (0, 1, ...) default is %default", metavar="NUM") parser.add_option("-R", "--rx-subdev-spec", type="subdev", default=None, help="select USRP Rx side A or B (default=first one with a daughterboard)") parser.add_option("-A", "--antenna", default=None, help="select Rx Antenna (only on RFX-series boards)")
- 79 -
parser.add_option("-d", "--decim", type="int", default=256, help="set fgpa decimation rate to DECIM [default=%default]") parser.add_option("-f", "--freq", type="eng_float", default=1.45031e9, help="set frequency to FREQ", metavar="FREQ") parser.add_option("-g", "--gain", type="eng_float", default=20, help="set gain in dB (default is midpoint)") parser.add_option("-W", "--waterfall", action="store_true", default=False, help="Enable waterfall display") parser.add_option("-8", "--width-8", action="store_true", default=False, help="Enable 8-bit samples across USB") parser.add_option( "--no-hb", action="store_true", default=False, help="don't use halfband filter in usrp") parser.add_option("-S", "--oscilloscope", action="store_true", default=False, help="Enable oscilloscope display") parser.add_option("", "--ref-scale", type="eng_float", default=13490.0, help="Set dBFS=0dB input value, default=[%default]") parser.add_option("", "--avg-alpha", type="eng_float", default=1e-1, help="Set fftsink averaging factor, default=[%default]") (options, args) = parser.parse_args() if len(args) != 0: parser.print_help() sys.exit(1) self.options = options self.show_debug_info = True options.freq = options.freq #- 9.75e9 # build the graph if options.no_hb or (options.decim<8): #Min decimation of this firmware is 4. #contains 4 Rx paths without halfbands and 0 tx paths. self.fpga_filename="std_4rx_0tx.rbf" self.u = usrp.source_c(which=options.which, decim_rate=options.decim, fpga_filename=self.fpga_filename) else: #Min decimation of standard firmware is 8. #standard fpga firmware "std_2rxhb_2tx.rbf" #contains 2 Rx paths with halfband filters and 2 tx paths (the default) self.u = usrp.source_c(which=options.which, decim_rate=options.decim) if options.rx_subdev_spec is None: options.rx_subdev_spec = pick_subdevice(self.u) self.u.set_mux(usrp.determine_rx_mux_value(self.u, options.rx_subdev_spec)) if options.width_8: width = 8 shift = 8 format = self.u.make_format(width, shift) print "format =", hex(format) r = self.u.set_format(format) print "set_format =", r # determine the daughterboard subdevice we're using #self.subdev = usrp.selected_subdev(self.u, options.rx_subdev_spec) self.u.set_bw(1e6) print "BW = 1MHZ" #fft_size = 16384 adc_rate = self.u.adc_rate() # 64 MS/s usrp_decim = options.decim self.u.set_decim_rate(usrp_decim) chanfilt_decim = 0 #input_rate = adc_rate / (usrp_decim + chanfilt_decim)
- 80 -
usrp_rate = self.u.adc_freq() / (self.u.decim_rate() + chanfilt_decim) input_rate = adc_rate / (usrp_decim + chanfilt_decim) if options.waterfall: self.scope = \ waterfallsink2.waterfall_sink_c (panel, fft_size=options.fft_size, sample_rate=input_rate) elif options.oscilloscope: self.scope = scopesink2.scope_sink_c(panel, sample_rate=input_rate) else: self.scope = fftsink2.fft_sink_c (panel, fft_size=options.fft_size, sample_rate=input_rate, ref_scale=options.ref_scale, ref_level=0.0, y_divs = 10, avg_alpha=options.avg_alpha) chan_filt_coeffs = optfir.low_pass (1, # gain usrp_rate, # sampling rate 25e3, # passband cutoff 30e3, # stopband cutoff 0.01, # passband ripple 60) # stopband attenuation #self.chan_filt = gr.freq_xlating_fir_filter_ccf (chanfilt_decim, chan_filt_coeffs, self.IF_freq, usrp_rate) self.chan_filt = gr.fir_filter_ccf (chanfilt_decim, chan_filt_coeffs) self.avg = gr.single_pole_iir_filter_ff(1,2) self.connect(self.u, self.avg, self.scope) self._build_gui(vbox) self._setup_events() # set initial values if options.gain is None: # if no gain was specified, use the mid-point in dB g = self.subdev.gain_range() options.gain = float(g[0]+g[1])/2 if options.freq is None: # if no freq was specified, use the mid-point r = self.subdev.freq_range() options.freq = float(r[0]+r[1])/2 self.set_gain(options.gain) if options.antenna is not None: print "Selecting antenna %s" % (options.antenna,) self.subdev.select_rx_antenna(options.antenna) if self.show_debug_info: self.myform['decim'].set_value(self.u.decim_rate()) self.myform['fs@usb'].set_value(self.u.adc_freq() / self.u.decim_rate()) self.myform['dbname'].set_value(self.subdev.name()) self.myform['baseband'].set_value(0) self.myform['ddc'].set_value(0) if not(self.set_freq(options.freq)): self._set_status_msg("Failed to set initial frequency") def _set_status_msg(self, msg): self.frame.GetStatusBar().SetStatusText(msg, 0) def _build_gui(self, vbox): def _form_set_freq(kv):
- 81 -
return self.set_freq(kv['freq']) vbox.Add(self.scope.win, 10, wx.EXPAND) # add control area at the bottom self.myform = myform = form.form() hbox = wx.BoxSizer(wx.HORIZONTAL) hbox.Add((5,0), 0, 0) myform['freq'] = form.float_field( parent=self.panel, sizer=hbox, label="Center freq", weight=1, callback=myform.check_input_and_call(_form_set_freq, self._set_status_msg)) hbox.Add((5,0), 0, 0) g = self.subdev.gain_range() myform['gain'] = form.slider_field(parent=self.panel, sizer=hbox, label="Gain", weight=3, min=int(g[0]), max=int(g[1]), callback=self.set_gain) hbox.Add((5,0), 0, 0) vbox.Add(hbox, 0, wx.EXPAND) self._build_subpanel(vbox) def _build_subpanel(self, vbox_arg): # build a secondary information panel (sometimes hidden) # FIXME figure out how to have this be a subpanel that is always # created, but has its visibility controlled by foo.Show(True/False) def _form_set_decim(kv): return self.set_decim(kv['decim']) if not(self.show_debug_info): return panel = self.panel vbox = vbox_arg myform = self.myform #panel = wx.Panel(self.panel, -1) #vbox = wx.BoxSizer(wx.VERTICAL) hbox = wx.BoxSizer(wx.HORIZONTAL) hbox.Add((5,0), 0) myform['decim'] = form.int_field( parent=panel, sizer=hbox, label="Decim", callback=myform.check_input_and_call(_form_set_decim, self._set_status_msg)) hbox.Add((5,0), 1) myform['fs@usb'] = form.static_float_field( parent=panel, sizer=hbox, label="Fs@USB") hbox.Add((5,0), 1) myform['dbname'] = form.static_text_field( parent=panel, sizer=hbox) hbox.Add((5,0), 1) myform['baseband'] = form.static_float_field( parent=panel, sizer=hbox, label="Analog BB") hbox.Add((5,0), 1) myform['ddc'] = form.static_float_field( parent=panel, sizer=hbox, label="DDC")
- 82 -
hbox.Add((5,0), 0) vbox.Add(hbox, 0, wx.EXPAND) def set_freq(self, target_freq): """ Set the center frequency we're interested in. @param target_freq: frequency in Hz @rypte: bool Tuning is a two step process. First we ask the front-end to tune as close to the desired frequency as it can. Then we use the result of that operation and our target_frequency to determine the value for the digital down converter. """ r = self.u.tune(0, self.subdev, target_freq) if r: self.myform['freq'].set_value(target_freq) # update displayed value if self.show_debug_info: self.myform['baseband'].set_value(r.baseband_freq) self.myform['ddc'].set_value(r.dxc_freq) if not self.options.waterfall and not self.options.oscilloscope: self.scope.win.set_baseband_freq(target_freq) return True return False def set_gain(self, gain): self.myform['gain'].set_value(gain) # update displayed value self.subdev.set_gain(gain) def set_decim(self, decim): ok = self.u.set_decim_rate(decim) if not ok: print "set_decim failed" input_rate = self.u.adc_freq() / self.u.decim_rate() self.scope.set_sample_rate(input_rate) if self.show_debug_info: # update displayed values self.myform['decim'].set_value(self.u.decim_rate()) self.myform['fs@usb'].set_value(self.u.adc_freq() / self.u.decim_rate()) return ok def _setup_events(self): if not self.options.waterfall and not self.options.oscilloscope: self.scope.win.Bind(wx.EVT_LEFT_DCLICK, self.evt_left_dclick) def evt_left_dclick(self, event): (ux, uy) = self.scope.win.GetXY(event) if event.CmdDown(): # Re-center on maximum power points = self.scope.win._points if self.scope.win.peak_hold: if self.scope.win.peak_vals is not None: ind = numpy.argmax(self.scope.win.peak_vals) else: ind = int(points.shape()[0]/2) else: ind = numpy.argmax(points[:,1]) (freq, pwr) = points[ind] target_freq = freq/self.scope.win._scale_factor print ind, freq, pwr self.set_freq(target_freq) else: # Re-center on clicked frequency
- 83 -
target_freq = ux/self.scope.win._scale_factor self.set_freq(target_freq) def main (): app = stdgui2.stdapp(app_top_block, "USRP FFT", nstatus=1) app.MainLoop() if __name__ == '__main__': main ()
Related Documents