COTTON (Gossypium Spp.) VALUE CHAIN ANALYSIS: THE CASE OF ARBAMINCH ZURIA DISTRICT, GAMO GOFA ZONE, ETHIOPIA MSc THESIS ABAYNEH FEYSO April 2017 HARAMAYA UNIVERSITY, HARAMAYA

Welcome message from author
This document is posted to help you gain knowledge. Please leave a comment to let me know what you think about it! Share it to your friends and learn new things together.
Transcript
COTTON (Gossypium Spp.) VALUE CHAIN ANALYSIS: THE CASE
OF ARBAMINCH ZURIA DISTRICT, GAMO GOFA ZONE,
ETHIOPIA
MSc THESIS
ABAYNEH FEYSO
April 2017
HARAMAYA UNIVERSITY, HARAMAYA

i
Cotton (Gossypium Spp.) Value Chain Analysis: The Case of
Arbaminch Zuria District, Gamo Gofa Zone, Ethiopia
A Thesis Submitted to School of Agricultural Economics and
Agribusiness, Postgraduate Program Directorate
HARAMAYA UNIVERSITY
In Partial Fulfillment of the Requirements for the Degree of MASTER
OF SCIENCE IN AGRICULTURE (AGRIBUSINESS AND VALUE
CHAIN MANAGEMENT)
Abayneh Feyso
April 2017
Haramaya University, Haramaya

ii
APPROVAL SHEET
POSTGRADUATE PROGRAM DIRECTORATE
HARAMAYA UNIVERSITY
We hereby certify that we have read and evaluated this Thesis prepared, under our
guidance, by Abayneh Feyso entitled “Cotton (Gossypium Spp.) Value Chain Analysis:
The Case of Arbaminch Zuria District, Gamo Gofa zone, Ethiopia”. We recommend
that it be submitted as fulfilling the Thesis requirement for the Degree of Master of
Science in Agriculture (Agribusiness and Value Chain Management).
Mengistu Ketema (PhD) ____________ _________
Major Advisor Signature Date
Bosena Tegegne (PhD) ____________ _______
Co-Advisor Signature Date
As a member of the Board of Examiners of the MSc. Thesis Open Defense
Examination, we certify that we have read and evaluated the Thesis prepared by
Abayneh Feyso and examined the candidate. We recommend that the Thesis be
accepted as fulfilling the Thesis requirements for the Degree of Master of Science in
Agriculture (Agribusiness and value chain management).
________________ ___________ _________
Chairperson Signature Date
____________________ ___________ _______
Internal Examiner Signature Date
_________________ ______________ _______
External Examiner Signature Date

iii
DEDICATION
This thesis is dedicated to my elder sister Zena Feyso, who had played key role in nursing
and educating me, and who was eager to see my successes, but passed away. God let her
soul rest in peace.

iv
STATEMENT OF THE AUTHOR
First, I declare that this thesis is my work and that all sources of materials used for this
thesis have been acknowledged. This thesis has been submitted in partial fulfillment of the
requirements for MSc degree at the Haramaya University and is deposited at the University
Library to be made available to borrowers under rules of the Library. I seriously declare
that this thesis is not submitted to any other institution anywhere for the award of any
academic degree, diploma, or certificate.
Brief quotations from this thesis are allowable without special permission provided that
accurate acknowledgement of source is made. Requests for permission for extended
quotation from or reproduction of this manuscript in whole or in part may be granted by
Haramaya University Post Graduate Program Directorates when in his or her judgment the
proposed use of the material is in the interests of scholarship. In all other instances,
however, permission must be obtained from the author.
Name: Abayneh Feyso Signature: ______________
Place: Haramaya University, Haramaya
Date of Submission: ____________________

v
BIOGRAPHICAL SKETCH
The author was born in Abeshige district, Guraghe zone, Southern Nations, Nationalities
and Peoples Regional State in June 1989 G.C. He attended his primary and junior
secondary school at Tadele Kulit primary school and high school and preparatory at Goro
compressive secondary school at Wolikite, capital of Guraghe zone. After completing his
preparatory school, he joined Haramaya University College of Agriculture and
Environmental Sciences under regular program in 2009 and completed his BSc. degree in
Rural Development and Agricultural Extension in 2011. He then joined Southern
Agricultural Research Institute based at Arbaminch Agricultural Research Center as a
junior socio-economic researcher in 2012 worked there until he joined Haramaya
University in September, 2015 to pursue his post graduate study in Agribusiness and Value
Chain Management.
vi
ACKNOWLEDGMENTS
My warmest gratitude goes to my major advisor Dr. Mengistu Ketema and my co-advisor
Dr. Bosena Tegegne for their inspiring guidance, encouragement, critical and constructive
comments starting from the inception of research idea to the final thesis write up.
My particular appreciation and deepest gratitude goes to my mother w/ro Aster Awano
who has devoted her life in nursing me with affection and love which played great role in
the success of my life. I would like to thank my elder brother, Ato Tadele Feyso for
couching, scheduling and financial support from lower class to first degree achievement.
My thanks also goes to my wife W/ro Abinet Dejene for advice, affection and love in my
stay in Haramaya University to attend class and for her hospitality during data collection as
well while working on my thesis. My heartfelt appreciation and great thanks go to
Arbaminch Agricultural research center employees specially; Ato Awoke Mensa, W/rt
Selamawit Markos and Ato Amaro Yalke for their great help when my computer fails to
work. Also my great thank goes to Dr. Ashebir Balcha, center manager of Arbaminch
Agricultural Research Center, for providing me with the necessary materials and
facilitation during data collection.
I feel deep sense of gratitude to my friends and classmates especially to Engida Gebre,
Gedefew Kindu and Adugnaw Anteneh for their cooperation, idea sharing and memorable
moments during the entire period of my post-graduate study. I would also like to extend
my appreciation to Arbaminch zuria district Agricultural office workers, Arbaminch town
trade and industry office workers and development agents of the study kebeles for their
support during data collection. Finally, I would like to thank all cotton chain actors
included for this study who extended their warm hospitality and generously shared their
views and made this work possible.

vii
LIST OF ABBREVIATIONS AND ACRONYMS
CSA Central Statistical Agency
EDIR Ethiopian Development Research Institute
EIA Ethiopian Investment Agency
ETB Ethiopian Birr
GDP Gross Domestic Product
GTP Growth and Transformation Plan
ICAC International Cotton Advisory Commission
IPM Integrated Pest Management
LDC Least Developed Countries
MoAN Minister of Agriculture and Natural Resource
PAN Pest Action Network
SCP Structure-Conduct-Performance
SME Small and Micro Enterprises
SNNPR Southern Nations Nationalities and Peoples Regional State
USA United States of America
VIF Variance Inflation Factor
viii
TABLE OF CONTENTS
DEDICATION iii
STATEMENT OF THE AUTHOR iv
BIOGRAPHICAL SKETCH v
ACKNOWLEDGMENTS vi
LIST OF ABBREVIATIONS AND ACRONYMS vii
LIST OF FIGURES xii
LIST OF TABLES IN THE APPENDIX xiii
ABSTRACT xiv
1. INTRODUCTION 1
1.1. Background of the Study 1
1.2. Statement of the Problem 2
1.3. Objectives of the Study 4
1.4. Scope and Limitations of the Study 4
1.5. Significance of the Study 5
1.6. Organization of the Thesis 5
2. LITERATURE REVIEW 6
2.1. Concepts and Definitions of Value Chain 6
2.2. Types of the Value Chains 7
2.3. Value Chain Analysis Framework 8
2.3.1. Value Chain Mapping 8
2.3.2. Measuring Performance 11
2.4. Upgrading 11
2.5. Methods of Evaluating Marketing System 13
2.5.1. The Structure, Conduct and Performance (SCP) Model 14
2.5.1.1. Market structure 14
2.5.1.2. Market conduct 16
2.5.1.3. Market performance 16
2.6. Empirical Studies 17
2.7. Conceptual Framework of the Study 20
3. RESEARCH METHODOLOGY 21
3.1. Description of the Study Area 21
3.2. Types of Data, Sources and Methods of Data Collection 22
ix
TABLE OF CONTENT (Contiued)
3.3. Sampling Procedures and Sample size 23
3.3.1. Producer sampling 23
3.3.2. Sampling of Processors 24
3.3.3. Sampling of Traders 24
3.4. Methods of Data Analysis 25
3.4.1. Descriptive Data Analysis 25
3.4.1.1. Value chain analysis 25
3.4.1.2. Structure Conduct and Performance (S-C-P) model 26
3.4.2. Econometric Analysis 29
3.4.2.1. Model Specification 29
3.4.2.2. Definition of variables and hypothesis 29
4. RESULTS AND DISCUSSION 33
4.1. Socio-Demographic Characteristics of Respondents 33
4.1.1. Socio-Economic Characteristics of Sampled Households 33
4.1.2. Access to Institutional Service of Sampled Households 34
4.1.3. Demographic and Socioeconomic Characteristics of Sampled Traders 35
4.1.4. Demographic and Socio-Economic Characteristics of Cottage Processors 37
4.2. Crop and Livestock Production System 38
4.2.1. Cotton Production System 39
4.2.2. Cotton Production Calendar and Profitability Analysis 40
4.2.3. Cotton Production and Storage System 42
4.3. Major Cotton Value Chain Actors and Their Functions 43
4.3.1. Support Institutions 45
4.3.2. Cotton Value Chain Map of Arbaminch Zuria District 46
4.3.3. Value Addition and Financial Analysis of Cotton Value Chain 47
4.4. Cotton Value Chain Upgrading and Governance 52
4.5. Cotton Marketing Channels and Structure-Conduct-Performance 53
4.5.1. Cotton Marketing Channel 53
4.5.2. Cotton Market Structure-Conduct-Performance 55
4.5.2.1. Cotton Market Structure 55
4.5.2.2. Cotton Market Conduct 58
4.5.2.3. Cotton market performance 59

x
TABLE OF CONTENT (Contiued)
4.6. Econometric Results 60
4.6.1. Factors Affecting Farm Household Level Cotton Supply to Market 61
4.7. Challenges and Opportunities of Actors along Cotton Value Chain 63
4.7.1. Cotton Production Opportunities 63
4.7.2. Cotton Production Challenges 64
4.7.3. Cotton Marketing Opportunities 64
4.7.4. Cotton Marketing Challenges 64
5. SUMMARY, CONCLUSION AND RECOMMENDATIONS 65
5.1. Summary and Conclusion 65
5.2. Recommendations 67
6. REFERENCES 69
7. APPENDICES 78

xi
LIST OF TABLES
Table Page
Table 1: Sample distribution of Selected Kebeles 24
Table 2: Socioeconomic characteristics of sampled household (categorical) 33
Table 3: Socioeconomic characteristics of sampled household (continuous) 34
Table 4: Institutional service of sampled households (categorical) 35
Table 5: Institutional service of sampled households (continuous) 35
Table 6: Demographic and socio economic characteristics of traders (categorical) 36
Table 7: Family size and trading experience of traders 36
Table 8: Demographic characteristics and enterprises capital 37
Table 9: Types of technology used and initial capital of processors 37
Table 10: Types of crops produced in the study kebeles. 38
Table 11: Types of livestock owned by sampled households 39
Table 12: Cotton land allocation system and cropping pattern 39
Table 13: Cotton varieties cultivated in Arbaminch zuria district 40
Table 14: Cotton farming financial analysis per hectare and per 100kg 41
Table 15: Cotton storage system, storage material and duration 42
Table 16: Cotton storage material cost and maximum amount handled 43
Table 17: Financial analysis of local collectors 48
Table 18: Financial analysis of cotton wholesaler trade per 100 kg cotton 49
Table 19: Hawassa textile company value adding activities and cost-benefit analysis. 50
Table 20: Items produced and production cost 50
Table 21: Summary value addition of farmers to textile factory 51
Table 22: Value addition summary of raw cotton to handloom 51
Table 23: Channel of cotton flow and amount sold. 53
Table 24: Amount of cotton sold to different types of traders 53
Table 25: Cotton traders’ Herfindahl-Hirschman Index (HHI) 55
Table 26: Cotton producer households’ information sources and gathering system 56
Table 27: Market entry barriers 57
Table 28: Cotton marketing conduct elements 58
Table 29: Cotton marketing margin and marketing costs and profit (birr/100kg) 59
Table 30: Factors affecting household level cotton supply to market 61

xii
LIST OF FIGURES
Figure Page
1. Elements of value chain analysis 8
2. Conceptual framework 20
3. Location of Arbaminch zuria district 22
4. Cotton value chain map of Arbaminch zuria district 47
5. Marketing channel map 54

xiii
LIST OF TABLES IN THE APPENDIX
Appendix table 1: Statistical Test Results 79
Appendix table 4: Survey Questionnaire 80

xiv
Cotton (Gossypium Spp.) Value Chain Analysis: The Case of
Arbaminch Zuria District, Gamo Gofa zone, Ethiopia
ABSTRACT
Gamo Gofa zone is the second largest cotton growing area in the country after the Amhara
Region, but cotton marketing had been a challenge for the farmers as they were getting
low prices from the local middlemen. Value chains can be seen as a vehicle by which new
forms of production, technologies, logistics and organizational relations and networks are
introduced. This study was conducted on cotton value chain analysis the case of
Arbaminch Zuria district of the zone with general objective of this study was to evaluate value
chain of cotton in Arbaminch Zuria District. Specific objectives of the study were: to identify actors
and their roles along cotton value chain, to identify cotton value addition activities and to develop
value chain map, to analyze the structure, conduct and performance of the cotton market, to
identify constraints and opportunities in cotton production and marketing and to analyze factors
affecting market supply of cotton at farm level in the study area. For this study, both primary and
secondary data were used. A total of 123 sample households were selected from three kebeles of
Arbaminch zuria district and 26 cotton traders, 9 small and micro enterprises, and one textile
company were interviewed using semi structured questionnaire. Descriptive statistics and
Econometrics models were used to analyze the data. Descriptive statistics results show that the
main cotton value chain actors in the study area are input supplier, producers, local collectors,
wholesalers, ginners, cottage level weavers, textile factories and retailers. Market concentration
ratio at district level was calculated using HHI and its value was 0.553, which shows that cotton
marketing was highly concentrated on hands of few in the study area., long existing tradition of
cotton farming and governmental and NGO support were cotton production opportunities while,
substituting cotton by other crops, lack of access to new and improved cotton varieties were cotton
production challenges of the study area. Increased market demand, proximity to and existence of
textile factories and establishment of new industry parks were cotton marketing opportunities
while, production and supplying of cotton with in similar period, bulkiness, and spoilage, were
cotton marketing challenges in the study area. Econometrics models analysis shows that size of
land allocated to cotton in hectare, use of improved seed and current year cotton price and number
of extension contact were significant and positively related whereas cotton farming experience and
distance to nearest market were found to be significant and negatively related to quantity of cotton
supply. Provision of new improved cotton varieties, regulation and implementation of cotton price
tariffs, strengthening and provision of sustainable and knowledge based extension service and
monitoring land planning of farmers were recommended to improve and strengthening cotton
value chain in the study area.
Keywords: Cotton, Value Chain, Chain Actors, Marketing, Arbaminch Zuria
1. INTRODUCTION
1.1. Background of the Study
The textile and garment industry is one of the oldest, largest and most global industries in
the world. It is the typical ‘starter’ industry for countries engaged in export-oriented
industrialization and is labor-intensive. Textile and garment industries offer a range of
opportunities including entry-level jobs for unskilled labor in developing countries. The
technological features of the textile and garment industry have made it suitable as the first
step on the ‘industrialization ladder’ in poor countries some of which have experienced a
very high output growth rate in the sector (Gereffi, 2002). According to African
Development Bank Group (2014), textile and garment sector contributed about 6.5% and
2.8% of the total value added of manufacturing in 2000/01 and 2010/11, in Ethiopia,
respectively. In terms of export earnings, the sector has contributed on average 2.3% to
Ethiopia’s total export earnings between 2000 and 2012.
The Growth and Transformation Plan (GTP) of Ethiopia considers the development of
textile industries among others and gives special attention and growing significance to
enhancing export revenues by means of substantial investments in value addition (GTP I,
2010). With regard to raw inputs, the country is endowed with a total arable land area of 2.6
million hectares for growing cotton. Moreover, Ethiopia is well endowed with water
resources (ADBG, 2014). However, study by Sutton and Kellow (2010) indicated that only
2.8%, or 73.000 hectares, is utilized for production of cotton. According to ADBG (2014),
the production cost of Ethiopian cotton is 66.3% that of Chinese cotton, 57.3% that of
American cotton, and 90.8% that of Indian cotton. Thus, there is considerable scope for
expansion of cotton planting and increased yields which would improve the domestic
supply of raw material for the textile industry at globally competitive prices. However, the
current domestic cotton production is much below the potential and it became a constraint
with respect to backward integration of the country’s textile and garment industry (EIA,
2012).
The economic value of cotton in the Ethiopian economy is significant. Firstly, it is a major
industrial input for textile firms. The textile and garment industry is one of the priority
areas in Ethiopia’s industrial policy. Secondly, cotton is a major export crop. The country
2
earned 10.6 million USD in 2009/2010 and 0.5 million USD in 2010/2011 from cotton
export (EDRI, 2015).
Cotton is grown in many regions in the country. In each region, there are wide potential
areas; in Tigray 269,130 ha, in Amhara 678,710 ha, in SNNPR 600,900 ha, in Oromia
407,420 ha, in Gambella 316,450 ha, in Benshangul 303,170ha, in Afar 200,000 ha, and in
Somali 225,000 ha. Gamo Gofa zone is the second largest cotton growing region in the
country after the Amhara Region (MoANR, 2004). But study conducted by PAN-UK
(2014) indicated that cotton marketing had been a challenge for the farmers as they were
getting low prices from the local middlemen. Having these evidences, cotton value chain
study is conducted in Gamo Gofa zone.
Given the economic and social importance of cotton to the country in general and to Gamo
Gofa zone in particular, value chain analysis may contribute to an increase in marketable
surplus by scaling-down the losses arising due to inefficient production, processing,
storage, and transportation. Because, value chains can be seen as a vehicle by which new
forms of production, technologies, logistics, labor processes and organizational relations
and networks are introduced (Trienekens, 2011). This was the basic reason why cotton
value chain study was designed in Gamo Gofa zone.
1.2. Statement of the Problem
Cotton is grown in 80 countries world‐wide, with a total of 100 countries were involved in
cotton imports and exports. It is sown on 2 to 2.5% of global arable land. Cotton is one of
the most important global crops in terms of land area, after wheat, rice, corn and soy beans
(Townsend, 2010).
Cotton is a critical crop for many African countries, and the supply of adapted and quality
seed to farmers is essential to ensure productive and remunerative cotton sectors for
farmers, traders and states (Traidcraft Policy Unit, 2011).
Ethiopia is believed to be one of the origins of cotton, and cotton cultivation is deep-rooted
in the history of the country’s agriculture. It is one of the major cash crops in the country
and is extensively grown in the lowlands under large-scale irrigation schemes and also it is
grown on small-scale farms under rain-fed agriculture. However, Ethiopia share only about
5% of total cotton produced in Africa (EIA, 2012). As to total arable and potential area for
cotton production, the country is utilizing below potential. According to Bosena et al.

3
(2011) out of the country’s total potential areas for cotton production, only about 4% is
being utilized. As a result, the amount of cotton produced in the country is low.
In Ethiopia, there are three major groups of cotton producers, namely: the smallholder
.farmers, large state farms and private commercial farms. Cotton produced by the state
farms and private commercial farms is mainly used in the modern textile manufacturing
sector and to some extent exported to foreign countries. On the other hand, cotton produced
by smallholder farmers is for the large part used by the hand loom sector (EDRI, 2014).
Generally there is adequate and growing domestic and world demand for cotton production
in the country. The major markets for Ethiopian cotton are Africa, Asia and Europe, with
Asia alone accounting for 67% of the total exports (EIA, 2012). Still the cotton sub-sector
offers a unique opportunity for Ethiopia in terms of serving as a bedrock upon which the
country can shift to high value added technological transformation following its strong
backward and forward linkages with various sectors and its provision of employment
opportunities for the large number of the rural poor. The Government of Ethiopia wishes to
take a deliberate effort and action to stimulate the growth and potential of this sub-sector in
terms of making cotton one of the major commercial crops in the country (Zerihun, 2015).
The town of Arbaminch, (505 km south of Addis Ababa) is the administrative centre for the
Gamo Gofa Zone in the Southern Nations Nationalities and Peoples Region (SNNPR) of
Ethiopia, the second largest cotton growing regions in the country after Amhara Region
(MoANR, 2004). However, most studies which have been conducted on cotton (Bosena,
2008, Bosena et al., 2011; EIA, 2012; PAN-Ethiopia, 2014) have focused only on
production and marketing aspects and were limited to a specific (Awash Valley, Humera,
Metema and Abobo) areas. Again, few researches which were conducted by individuals
and institutions (Zerihun, 2015; EDRI, 2014 & EDRI, 2015) focused only on value chain
aspect. This study was designed to analyze cotton value chain, market structure, conduct
and performance concurrently and to identify factors affecting household cotton supply to
market to generate information about its entire value chain in the study area due to absence
of adequate information on cotton value chain, market structure, conduct and performance
cotton marketing had been a challenge for the farmers as they were getting low prices from
the local middlemen (PAN-UK, 2014).
According to Mengistu (2010), without having well established coordination among the
value chain actors and convenient marketing systems, the potential increment in

4
productivity, rural incomes and foreign exchange earnings resulting from dispersed efforts
and introduction of improved production technologies alone could not be effective.
In order to narrow the aforementioned research gaps on the study area; this stud tried
to answer the following questions:
1. What are the major activities done to add value in cotton?
2. Who are the actors along cotton value chain?
3. How efficient is cotton value chain?
4. How is the benefit from trade shared among cotton value chain actors?
5. What are the factors that affect market supply of cotton in the study area?
6. What are the constraints and opportunities in cotton production and marketing?
1.3. Objectives of the Study
General objective
The general objective of the study was to evaluate value chain of cotton in the case of
Arbaminch zuria district.
The specific objectives of the study were:
1. To identify actors and their roles along cotton value chain in the study area.
2. To identify cotton value adding activities and to develop value chain map in the study
area.
3. To analyze structure, conduct and performance of cotton market in the study area.
4. To analyze factors affecting market supply of cotton at farm level in the study area
5. To identify constraints and opportunities in cotton production and marketing in the
study area.
1.4. Scope and Limitations of the Study
The study concentrated on cotton value chain analysis in Arbaminch zuria district at three
Kebeles with sample size of 123 cotton producer farm households, 26 traders, 9 small and
micro enterprises and one modern textile factory. The study focused mainly on the cotton
value chain actors that include producers, processors, local collectors, wholesalers, retailers
and support institutions.
Limitation of the study was that cotton goes through two main stages of processing:
primary processing, where seed cotton is transformed into lint and seed, where lint is

5
transformed into yarn for garment production and secondary processing, where seed is
transformed into food oil and seed cake for animal feed. However, due to data complexity
this cotton value chain analysis focused only on the primary processing. Another limitation
of the study was that the empirical analysis was done based on cross-sectional data.
However, households may change their cotton production and marketing decisions from
one year to the next depending on production and market conditions.
1.5. Significance of the Study
The study generated valuable information on cotton value chain, market structure-conduct
and performance and determinants of quantity of cotton supplied to market that might assist
development practitioners and policy makers to make relevant decisions in the development
of cotton value chain and marketing to improve the livelihood of cotton value chain actors.
Also it may serve as a reference material for further research on similar topics and other
related subjects.
1.6. Organization of the Thesis
This thesis is organized in five chapters. The first chapter has already dealt with
introduction. The second chapter contains the reviewed literature and empirical studies. The
third and fourth chapters deal with the research method, results and discussion of the
research, respectively. Finally, the fifth chapter presents summary, conclusions and
recommendations.
6
2. LITERATURE REVIEW
In this chapter concepts and definitions of value chain, theoretical and empirical reviews,
types of value chain and conceptual framework were reviewed and presented.
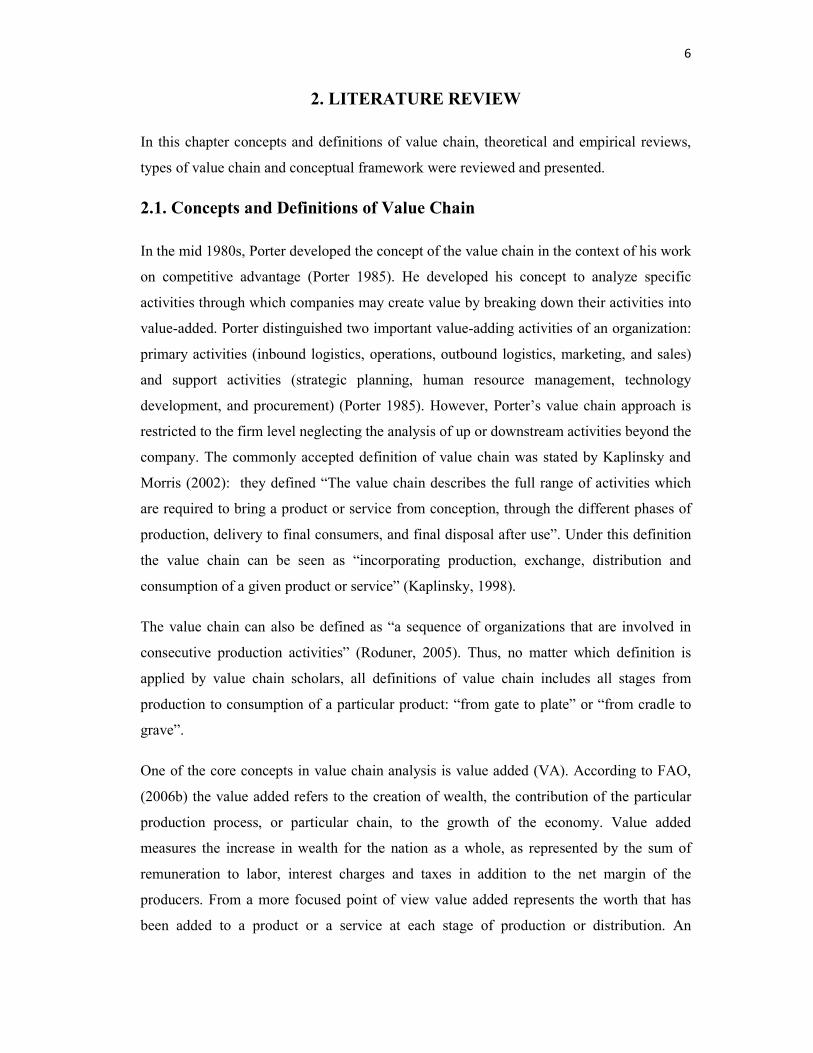
2.1. Concepts and Definitions of Value Chain
In the mid 1980s, Porter developed the concept of the value chain in the context of his work
on competitive advantage (Porter 1985). He developed his concept to analyze specific
activities through which companies may create value by breaking down their activities into
value-added. Porter distinguished two important value-adding activities of an organization:
primary activities (inbound logistics, operations, outbound logistics, marketing, and sales)
and support activities (strategic planning, human resource management, technology
development, and procurement) (Porter 1985). However, Porter’s value chain approach is
restricted to the firm level neglecting the analysis of up or downstream activities beyond the
company. The commonly accepted definition of value chain was stated by Kaplinsky and
Morris (2002): they defined “The value chain describes the full range of activities which
are required to bring a product or service from conception, through the different phases of
production, delivery to final consumers, and final disposal after use”. Under this definition
the value chain can be seen as “incorporating production, exchange, distribution and
consumption of a given product or service” (Kaplinsky, 1998).
The value chain can also be defined as “a sequence of organizations that are involved in
consecutive production activities” (Roduner, 2005). Thus, no matter which definition is
applied by value chain scholars, all definitions of value chain includes all stages from
production to consumption of a particular product: “from gate to plate” or “from cradle to
grave”.
One of the core concepts in value chain analysis is value added (VA). According to FAO,
(2006b) the value added refers to the creation of wealth, the contribution of the particular
production process, or particular chain, to the growth of the economy. Value added
measures the increase in wealth for the nation as a whole, as represented by the sum of
remuneration to labor, interest charges and taxes in addition to the net margin of the
producers. From a more focused point of view value added represents the worth that has
been added to a product or a service at each stage of production or distribution. An

7
economic agent can calculate the value added as a difference between the full value of the
output and the value of the purchased inputs (McCormick and Schmitz, 2001).
Value added is created at different stages and by different actors throughout the value
chain. Value added may be related to quality, costs, delivery times, delivery flexibility,
innovativeness, etc. The size of value added is decided by the end-customer’s willingness
to pay. Opportunities for a company to add value depend on a number of factors, such as
market characteristics (size and diversity of markets) and technological capabilities of the
actors. Moreover, market information on product and process requirements is key to being
able to produce the right value for the right market. In this respect finding value adding
opportunities is not only related to the relaxation of market access constraints in existing
markets but also to finding opportunities in new markets and in setting up new market
channels to address these markets (Trienekens, 2011).
2.2. Types of the Value Chains
Different types of the value chains can be recognized based on the number of processing
stages, spatial relationship of economic activities and the structure of involved participants
of the chains. Sturgeon (2001) has classified the value chains according to organizational
scale and to spatial scale. Based on this classification supply chain, value chain and
production network, all fall under organizational scale.
Gereffi et al. (2005) classified value chains based on the type of the value chain
governance. According to the type of governance, he classified value chain as follows:
chains ruled by markets, modular value chains, relational value chains, captive value chains
and hierarchy structured value chains. In a much broader sense of governance, the value
chains can be classified into buyer-driven chains, characterized by labor-intensive
industries and relevant to developing countries; into producer-driven chains, characterized
by capital and technology intensive industries and where producers take responsibility for
assisting the efficiency of both their suppliers and their customers. Value chain analysis is
important both conceptually and practically and can provide insight on the areas of
intervention and upgrading with the aim of value chains development (McCormick and
Schmitz, 2001). Value chains analysis is production networks in which business actors
exploit competitive resources and operate within an institutional environment. Therefore,
we conceptualize a value chain as a network of horizontally and vertically related

8
companies that jointly aim at/work towards providing products or services to a market
(Trienekens, 2011).
2.3. Value Chain Analysis Framework
The VCA framework centers around three major segments that describe each production
link in the value chain: source, make, and deliver. Each activity mapped on the value chain
diagram can be represented by a cost breakdown. Quantification of the value chain by
measuring monetary value and time is undertaken along the source-make-deliver construct
for each production activity. This measurement framework provides a consistent way to
organize and classify cost and time figures for comparison across diverse production
activities. The resulting monetary value and time measurements are then further analyzed
and transformed to derive metrics such as value added and productivity to identify
performance gaps. Firm-level performance is measured and inferred for the sector as a
whole. Establishing benchmarks for selected indicators against competitor countries, good
practice cases, and international standards can help in assessing the relative competitiveness
of the sector.
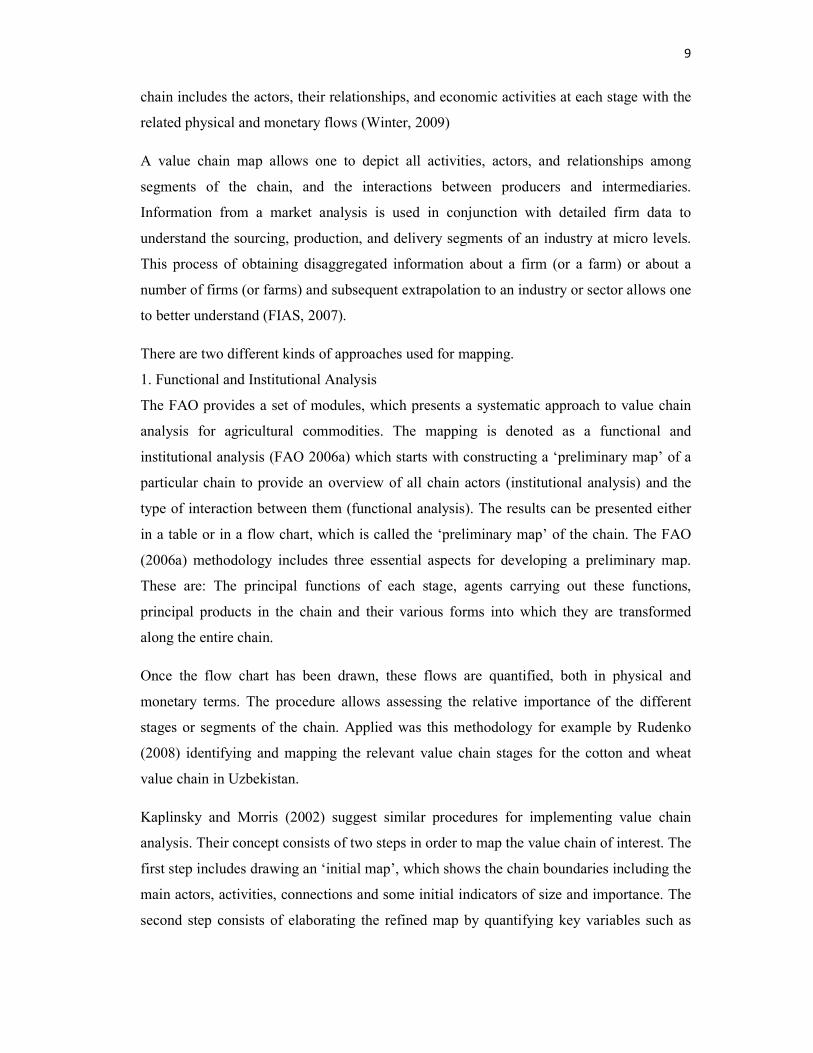
According to FIAS (2007), the value chain analysis typically includes the following key
elements or steps: choose the sector(s) to assess, analyze the market, map the value chain,
measure the performance of the chain and establish benchmarks, analyze performance gaps
(focusing on government and market failures).
Figure 1: Elements of value chain analysis
Source: FIAS, 2007
2.3.1. Value Chain Mapping
The first step of a value chain analysis is the so-called mapping. In order to do so, the
boundaries to other chains need to be defined. The main idea is initially to identify the
actors and then to ‘map’ the traced product flows within the chain including input supply,
production, processing, and marketing activities. The objective is to give an illustrative
representation of the identified chain actors and the related product flows. A mapped value
Sector Choice
Market Analysis
Value Chain Mapping
Measure Performance
Analysis of Performance Gaps
9
chain includes the actors, their relationships, and economic activities at each stage with the
related physical and monetary flows (Winter, 2009)
A value chain map allows one to depict all activities, actors, and relationships among
segments of the chain, and the interactions between producers and intermediaries.
Information from a market analysis is used in conjunction with detailed firm data to
understand the sourcing, production, and delivery segments of an industry at micro levels.
This process of obtaining disaggregated information about a firm (or a farm) or about a
number of firms (or farms) and subsequent extrapolation to an industry or sector allows one
to better understand (FIAS, 2007).
There are two different kinds of approaches used for mapping.
1. Functional and Institutional Analysis
The FAO provides a set of modules, which presents a systematic approach to value chain
analysis for agricultural commodities. The mapping is denoted as a functional and
institutional analysis (FAO 2006a) which starts with constructing a ‘preliminary map’ of a
particular chain to provide an overview of all chain actors (institutional analysis) and the
type of interaction between them (functional analysis). The results can be presented either
in a table or in a flow chart, which is called the ‘preliminary map’ of the chain. The FAO
(2006a) methodology includes three essential aspects for developing a preliminary map.
These are: The principal functions of each stage, agents carrying out these functions,
principal products in the chain and their various forms into which they are transformed
along the entire chain.
Once the flow chart has been drawn, these flows are quantified, both in physical and
monetary terms. The procedure allows assessing the relative importance of the different
stages or segments of the chain. Applied was this methodology for example by Rudenko
(2008) identifying and mapping the relevant value chain stages for the cotton and wheat
value chain in Uzbekistan.
Kaplinsky and Morris (2002) suggest similar procedures for implementing value chain
analysis. Their concept consists of two steps in order to map the value chain of interest. The
first step includes drawing an ‘initial map’, which shows the chain boundaries including the
main actors, activities, connections and some initial indicators of size and importance. The
second step consists of elaborating the refined map by quantifying key variables such as

10
value-added, and by identifying strategic and non-strategic activities. This refined map can
be understood as a framework for showing chain statistics (Schmitz, 2001).
2. Financial and Economic Value Chain Analysis
FAO provides a methodology for commodity chain analysis focusing on the product level.
The FAO methodology comprises two separate parts: (a) financial analysis, and (b)
economic analysis. Financial analysis is undertaken from the perspective of individual
agents. The aim is to determine their financial costs and benefits. In contrast, economic
analysis is undertaken from the perspective of the society or the overall economic system
(national economy, sector, or chain), considering shadow prices and opportunity costs in its
calculation. Both analyses are conducted for a defined period, usually one year. For
financial and economic commodity chain analysis, different indicators are calculated based
on the concept of value added to derive findings according to the chain performance and
impact on agents and the government. Hence, the value added for each step of the chain as
well as the overall value added of the entire chain are calculated and interpreted as the
creation of economic wealth by one or more productive activities. By definition, the
amount of total value added “measures the contribution of the commodity chain to Gross
Domestic (or National) Product” (FAO, 2006b). The calculation of the value-added (VA) is
defined as:
VA = Y – II
The value of the intermediate inputs (denoted as II) used in the productive activities has to
be subtracted from the value of the output of a product i(denoted as Y). The difference
represents the value-added from an individual agent j. Thus, to calculate the value added,
all costs and sales for the relevant stages have to be measured. In addition, the underlying
product and input prices are essential. Hence, financial and economic analyses differ in the
underlying price. While financial analysis is based on actual market prices, economic
analysis is based on shadow prices. Consequently, if there are any price distortions, the
financial analysis will reflect those.
The overall value added is the following:
agentschainchainchain VAIIYVA
It makes possible to identify which stage contributes to the highest share of the value
added, which stage to the lowest, and if there is an overall positive value added.
Afterwards, the question that arises is: how is the created wealth distributed among
fundamental agents. This is especially interesting for policy makers, who want the

11
households to get a fair share in the profit. Thus, another possibility of calculating the
value-added is the following:
ijijijijij TISWDGAVA )(
After calculating the creation and distribution of the value added among the agents, the next
step is the economic impact analysis. It includes the investigation of upstream induced
effects of productive activities because of the demand for intermediate inputs from the rest
of the national economy. In this part of the analysis, the chain is viewed as an integral part
of the national economy similar to input-output analysis Indicators are built to evaluate the
chain’s impact on growth and income in terms of chain distribution to developmental
policy objectives (FAO 2006c).
2.3.2. Measuring Performance
The performance of an industry or sector may be explained by: examining various activities
in the production chain and comparing these with national or international benchmarks;
identifying gaps in performance; and probing into the underlying policies, institutions, and
infrastructure-related inefficiencies that directly affect productivity and competitiveness.
The metrics used to measure the performance of a value chain include: Cost, time value
added and productivity. Cost and productivity are the underlying factors in determining the
competitiveness of an industry. Costs encompass monetary costs and utility costs as well as
transactions costs.
2.4. Upgrading
The practical usefulness of value chain analysis stems helps to find those segments of the
value chains which need to be improved or upgraded. The notion of upgrading, as used in
studies on competitiveness, describes a range of activities aimed at manufacturing better
products, or increasing production metrics or moving into more skilled activities (Porter,
1990; Kaplinsky, 2000).
Gereffi (1999) defines upgrading as: “a process of improving the ability of a firm or an
economy to move to more profitable and/or technologically sophisticated capital and skill-
intensive economic niches.”
According to Kaplinsky and Morris (2002), upgrading is a process of adopting innovation –
a process which recognizes relative endowments and the existence of rents. According to
12
Humphrey and Schmitz (2002), the typology of upgrading distinguishes three main
upgrading possibilities: functional; product; and process upgrading.
Kaplinsky (2002) gives four directions in which economic actors can upgrade: increasing
the efficiency of internal operations, enhancing inter-firm linkages, introducing new
products and changing the mix of activities conducted within the firm. One of the main
tasks of upgrading is focused on exploring and employing competitive advantages. A value
chain approach can help to formulate or to shape the upgrading strategies by describing and
analyzing sources for competitiveness (Schmitz, 1999).
Process upgrading: increasing the efficiency of internal processes such that these are
significantly better than those of rivals, both within individual links in the chain and
between the links in the chain (Humphrey and Schmitz, 2001).
Process upgrading focuses on the one hand on upgrading the product and on the other hand
on optimization of production and distribution processes. Product and process upgrading
are most common in developing country value chains (Trienekens, 2011).
Product upgrading: introducing new products or improving old products faster than rivals.
This involves changing new product development processes both within individual links in
the value chain and in the relationship between different chain links (Humphrey and
Schmitz, 2001).Upgrading of value added in products is always related to (potential)
demands in a market. These can be related to intrinsic (product quality, composition,
packaging, etc.) and extrinsic product attributes, which are related to typical process
characteristics (Trienekens, 2011).
Functional upgrading: increasing value added by changing the mix of activities conducted
within the firm or moving the locus of activities to different links in the value chain
(Humphrey and Schmitz, 2001).
Chain upgrading/inter-sectoral upgrading: moving to a new value chain. According to
Gereffi (1999) chain up grading is “how value adding activities have been moved from
developed to developing countries leading to new and more fine-meshed industry structures
worldwide.”
Upgrading of Value Chain-network Structure: Upgrading of the network structure
includes upgrading of horizontal as well as vertical relationships focusing on taking part in
the right market channel. Collaboration with horizontal partners may include joint

13
purchasing of production inputs, joint use of production facilities and joint marketing of
products. Moreover, in its most sophisticated form, horizontal collaboration might result in
product differentiation combining value adding activities with other sectors of the economy
(inter-sectoral upgrading) Trienekens et al. (2009).
Upgrading of vertical network (structure) relationships should focus on being part of the
right channel aiming at the right market. Developing country value chains are now
increasingly trying to differentiate their market outlets, which makes them less dependent
on their current customers (Trienekens, 2011).
Upgrading of Governance Structures: Modern market-oriented chains have the tendency
to become shorter (with fewer actors) as intermediaries between producers and downstream
parties in the chain become superfluous because of the emergence of direct trading
relationships between large producers (or producer groups) and downstream parties
(Gereffi, 2003).
2.5. Methods of Evaluating Marketing System
The development of reliable and stable market system has been an important element in
commercialization and specialization in the agricultural sector. In order to evaluate the
functioning and performance of the market, there are three different approaches namely
traditional, Structure-Conduct-Performance (SCP), and the New Empirical Industrial
Organization (NEIO) approaches that integrate SCP with value chain analysis. The SCP
approach was developed in the United State as a tool to analyze the market organization of
industrial sector and it was later applied to assess the agricultural system and this
framework was to evaluate the performance of industries in the USA (Meijer, 1994).
Efficiency factors can be evaluated by examining marketing enterprises for structure,
conduct and performance (Abbott and Mekeham, 1979). The performance of a certain
market or industry depends on the conduct of its sellers and buyers which, in turn, is
strongly influenced by the structure of the relevant markets (Scarborough and Kydd, 1992;
Margrath, 1992). Variables relevant in appraising firm’s behavior can be put into three
general categories structure, conduct, and performance related variables.

14
2.5.1. The Structure, Conduct and Performance (SCP) Model
The central hypothesis (of the SCP framework) is that observable structural characteristics
of a market determine the behavior of firms within that market, and that the behavior of
firms within a market, give structural characteristics, determines measurable market
performance Martin (2002). Environmental and internal conditions of the firm have an
influence on the actions and behavior of the firm. On the other hand, the composite of
firm’s actions is not equivalent to a complete description of overall market result. Only
some important actions and their consequences on performance of the firm are relevant
(Andargachew, 1990).
Structure -Conduct and Performance model is one of the most common and pragmatic
methods of analyzing a marketing system. It analyzes the relationship between functionally
similar firms and their market behavior as a group and, it is mainly based on the nature of
various sets of market attributes and relations between them and their performance
(Scarborough and Kydd, 1992). This analytical method is based on the theory that market
structure and market conduct determine the performance of a marketing system.
2.5.1.1. Market structure
Market structure is defined as characteristics of the organization of a market which seems
to influence strategically the nature of competition by pricing behavior within the market
(Scott, 1995). Market structure is the description of the number and nature of participants in
a market. Structural characteristics may be used as a basis for classifying markets. Markets
may be perfectly competitive, monopolistic, or oligopolistic (Cramer and Jenson, 1982).
The four salient aspects of market structures include the degree of seller concentration, the
degree of buyer concentration, the degree of product differentiation, and the condition of
entry (Scott, 1995).
Competition plays a key role in harnessing the rivalry and the profit seeking of the market
place in order that it may serve the public interest (Khols and Uhl, 1985). Determining the
presence or absence of the requirements of the model of perfect competition can be used
indirectly to assess the economic efficiency of markets. Many studies concerned with the
efficiency of agricultural markets begin in this form of analysis.
Methods of measuring of market concentration are:-
1. Market Concentration Ratio

15
Considerable attention has been focused on market concentration as a measure of
competition in marketing. Concentration refers to the proportion of industry sales made by
its largest firms. In general, the more concentrated the industry sales, the more likelihood
that the market will be imperfectly competitive (Khols and Uhl, 1985).
Concentration ratio is one of the commonly used measures of market power, which in other
words, refers to the number and relative size of distribution of buyers or sellers in a market.
Concentration ratio measures the per cent of traded volume accounted for by a given
number of participants and is designated by the formula:
1,2,3,4r .0
r
i
SiCR
CR=is concentration ratio, Si =is the percentage share of the all firms and r = is the number
of the largest firms for which the ratio is to calculated
Khols and Uhl (1985) suggest that as a rule of thumb, a four enterprise concentration ratio
of 50 percent or more is indicative of a strong oligopolistic industry; of 33-50 per cent ratio
denotes a weak oligopoly, and less than that un-concentrated industry.
Despite wide application of concentration ratio as a measure of the ratio of market
concentration, there are limitations against the index. Scarborough and Kydd (1992)
suggest that calculating and using concentration ratios as a measure of market structure is
subject to empirical, theoretical and inferential problems. In least developed countries,
where firm records are usually not available publicly, it would be difficult to determine
such ratios on anything, but the most local of scales.
Another problem associated with concentration ratio is the arbitrary selection of r (the firms
that are taken to calculate the ratio). The ratio doesn’t indicate the size distribution of r
firms. However, when the numbers of participants in an industry is large it will be difficult
to organize oligopolistic behavior. Under such local circumstances, the concentration ratio
given above can be usefully determined (Scarborough and Kydd, 1992).
2. The Gini coefficient
Gini coefficient is most easily calculated from unordered size data as the “relative mean
difference,” that is the mean of the difference between every possible pair of individuals,
divided by the mean size (Taru et al., 2010). They further stated that the Gini coefficient
ranges from zero to one. A perfect equality in concentration (low) of sellers is expected if
Gini coefficient tends towards zero, while perfect inequality in concentration (high) of
16
sellers is expected if Gini coefficient tends towards one. If Gini coefficient equals to one
then the market is imperfect and if Gini coefficient is equals to zero the market is perfect
and competitive.
2.5.1.2. Market conduct
Market conduct implies the analysis of human behavioral pattern that are not readily
identifiable, obtainable, or quantifiable (Olukosi et al., 2005). Thus, the conduct refers to
the behavior of firms or the strategies used by the firms, like their pricing, buying, selling
e.t.c. These activities may require the firms to engage into informal cooperation or
collusion. Therefore in the absence of a theoretical frame work for market analysis, there is
a tendency to treat conduct variable in a descriptive manner (Pomeroy and Trinidad, 1995).
2.5.1.3. Market performance
Performance of the market is reflection of the impact of structure and conduct on product
price, costs and the volume and quality of output (Cramers and Jensen, 1982). If the market
structure in an industry resembles monopoly rather than pure competition, then one expect
poor market performance.
As a method for analysis the SCP paradigm postulates that the relationship exists between
the three levels distinguished. Suppose a causal relations starting from the structure, which
determine the conduct, which together determine the performance (technological
progressiveness, growth orientation of marketing firms, efficiency of resource use, and
product improvement and maximum market services at the least possible cost) of
agricultural marketing system in developing countries (Meijer, 1994). Market performance
can be measured by marketing costs and margins and marketing efficiency.
1. Marketing costs and margins
A marketing margin may be defined as a difference between the price paid by consumers
and that obtained by producers or; the price of a collection of marketing services that is, the
outcome of the demand for and the supply of each service (Tomek and Robinson, 1990).
The relative share of the different market participants will be estimated using the marketing
margin analysis. The total marketing margin in the marketing system constitutes the
marketing costs plus profit earned by the different participants in the system.

17
100price Selling
price purchasingprice SellingMM
Where MM=marketing margin.
Marketing cost is measured by cost of resources used in providing marketing services.
Hence it is the current expenses incurred in the performance of the marketing functions as a
commodity moves from the importers to the ultimate consumers. It includes the costs of
transportation, marketing charges, costs of loading/offloading and storage. The marketing
inputs are the costs of providing marketing services while the outputs are the benefits or
satisfaction created or value added to the commodity as it passes through the marketing
system.
2. Marketing efficiency
Marketing efficiency is defined as the ratio between net marketing returns and marketing
costs expressed as a percentage (Osondu et al., 2014). According to Ozougwu (2002),
marketing efficiency ratio ranges from zero (0) to infinity. A ratio of 100% shows that the
market is perfectly efficient because price increment is just high enough to cover the cost of
marketing.
For cotton marketing in Arbaminch district, Marketing Efficiency (ME) was calculated by
adopting Osondu et al., (2014) and Olukosi and Isitor, (1990) procedures as follows:
100*marketing of input
marketing of output=ME
2.6. Empirical Studies
According to Dawit (2005) the flow of agricultural produce from the producer to the
consumer goes along chain of intermediaries, who, without creating value-added, but keeps
on stretching the chain. He also explained that the involvement of these superfluous
intermediaries has constrained the development of the sector and derived the farmers of
equitable returns.
Rehima (2007) adopted Tobit model to identified factors that affect market supply of
pepper at Halaba special Woreda and Silti zone of South Nations, Nationalities Peoples
Regional State. The study result shows that market distance, quantity of pepper produced,
18
frequency of contacts with extension agents and access to market information influenced
market supply of pepper. All variables were influenced market supply of pepper positively,
while distance to market influenced market supply of pepper negatively.
Bosena (2008) adopted multiple regression model to identify major factors affecting farm
level market supply of cotton at Metema district of Amhara region. The results obtained
from this analysis indicated that number of oxen owned by household, land allocated for
cotton in hectare, the productivity of cotton per hectare, and access to credit for cotton were
significant factors affecting farm level cotton market supply.
Marshal (2011) conducted Value Chain Analysis of Sugarcane research identified different
inefficiencies regarding input usage and production of sugarcane. First, education level of
producers is low. Second, small scale and subsistent farming because of small land area
possession. Third, there was water shortage because of poor coordination. Fourth, farmers
continue to use low yielding unimproved seed cane varieties. Fifth, farmers could not
afford to use fertilizers and pesticides. Sixth, there is a limited credit access. Seventh, the
extension service given is minimal. Finally, the cooperative activity is weak. Marshal
employed multiple regression model for the research to identify factors affecting
marketable sugarcane supply. This research results revealed that marketable supply is
significantly affected by yield, education, lagged price, access to credit, farm size, delay
(quality) and the number of successive harvest.
Bosena et al. (2011) used multiple regression model to identify factors affecting marketable
supply of cotton at Metema district of Amhara region. This research result revealed that
from hypnotized variables only three variables affected marketable supply of cotton at farm
level at Metema district of Amhara region. Namely productivity of cotton, land allocated to
cotton production and access to credit were affected marketable supply of cotton positively.
Zekarias et al. (2012) used multiple regression model to identify determinants of forest
coffee supply in south western Ethiopia. Result from market structure analysis revealed that
producers, assemblers and wholesalers are the major actors involved in the market chain of
coffee.
Wendmagegn (2014) adopted multiple linear regression model for study conducted on
market chain analysis of coffee in dale district of southern Ethiopia, to identify factors
affecting coffee market supply. Wendmagegn’s study revealed that eight variables namely

19
sex of the household head, education level of household head, quantity of coffee produced,
access to extension service, price of coffee in 2011/12, distance to the nearest market, non-
farm income and access to market information were found to be the significant factors
affecting the market supply of coffee at household level. He also further categorized factors
which affected coffee marketable supply in to two namely positive factor and negative
factor. Based on his study Sex of the household head, education level of the household
head, quantity of coffee produced, access to extension service, price of coffee in 2011/12,
and access to market information influenced market supply of coffee positively while
distance to the nearest market and non-farm income were found to have a significant
negative effect on coffee market supply.
Gashahun (2015) conducted research on white pea bean value chain analysis at Adami Tulu
Jido Kombolcha District of Eastern Shewa zone of Oromia region and comes up with
weakness of value chain actors. Gashahun’s white pea bean value chain analysis research
revealed with; vertical linkage between farmers with wholesalers is observed to be weak.
There is no transparency and farmers get biased price information from wholesalers
through their brokers. The linkage between farmers with primary cooperatives is also weak,
primary cooperatives are not performing based on their motto, the organizational structures
of primary cooperatives were observed to be very weak and fragile. There was no
meaningful vertical integration between exporters, wholesalers and farmers at all. Also
Gashahun had employed multiple linear regression model to analyze factors affecting yield
of white haricot bean and five variables were found to affect significantly. Namely; Age of
household head affected negatively, the rest variables livestock, household head education,
use of fertilizer and extension contact affected marketed supply affected positively.
Yimer (2015) used Linear multiple Regression model to identify factors affecting
marketable supply of fruits. The analysis result of this research revealed that five variables
were significantly affected the marketable supply of fruit at household level. Namely
quantity of fruit produce, education level of the household head, market information,
distance to the market, and extension service are variable that significantly influence the
marketable supply of fruits by household.
From these studies, one can conclude that most of the characteristics of value chain actors
as well as factors that affect the marketable supply of commodity differ from commodity to
commodity. Difference in the marketing system of these commodities, type of commodities
20
and location of the study area may result differences in factors affecting market supply of
the commodities. Hence, it is important to conducting value chain and market structure
conduct-performance consistent research to come up with chain behavior and market SCP
to analyze factors affecting market supply of cotton.
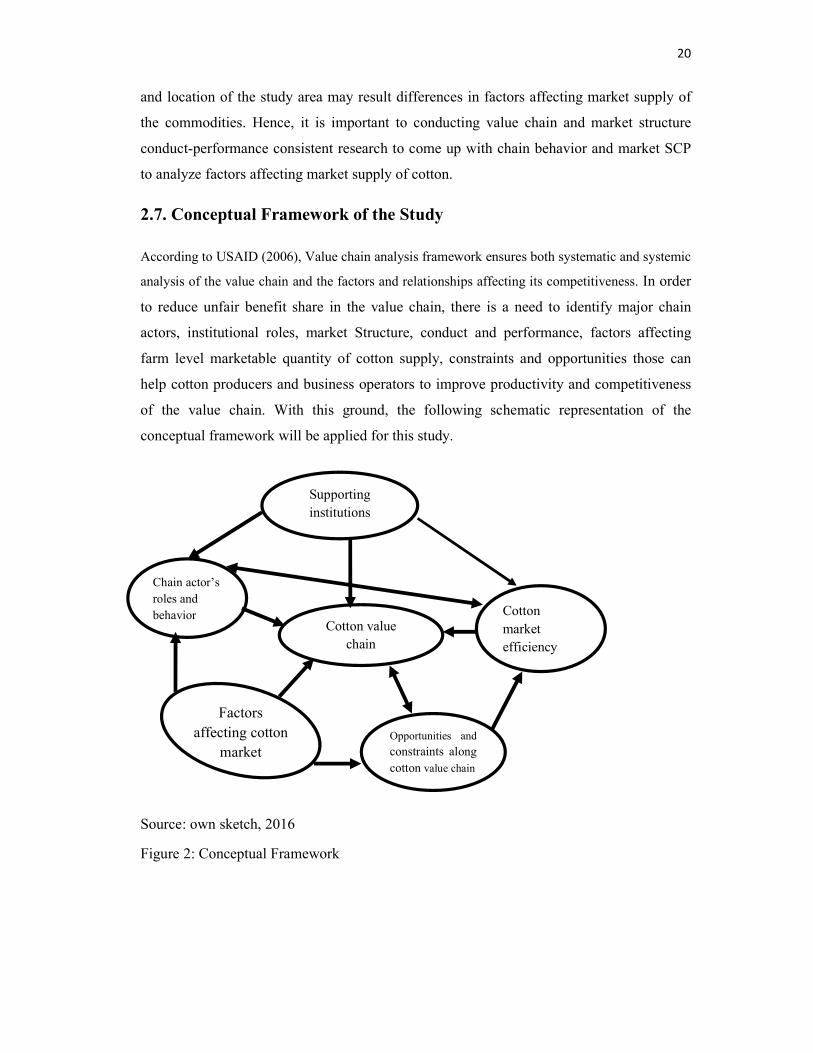
2.7. Conceptual Framework of the Study
According to USAID (2006), Value chain analysis framework ensures both systematic and systemic
analysis of the value chain and the factors and relationships affecting its competitiveness. In order
to reduce unfair benefit share in the value chain, there is a need to identify major chain
actors, institutional roles, market Structure, conduct and performance, factors affecting
farm level marketable quantity of cotton supply, constraints and opportunities those can
help cotton producers and business operators to improve productivity and competitiveness
of the value chain. With this ground, the following schematic representation of the
conceptual framework will be applied for this study.
Source: own sketch, 2016
Figure 2: Conceptual Framework
Supporting
institutions
Cotton
market
efficiency
Chain actor’s
roles and
behavior Cotton value
chain
Opportunities and
constraints along
cotton value chain
Factors
affecting cotton
market
21
3. RESEARCH METHODOLOGY
In this chapter description of study area, data types, data collection method, sampling
procedures and data analysis method are presented.
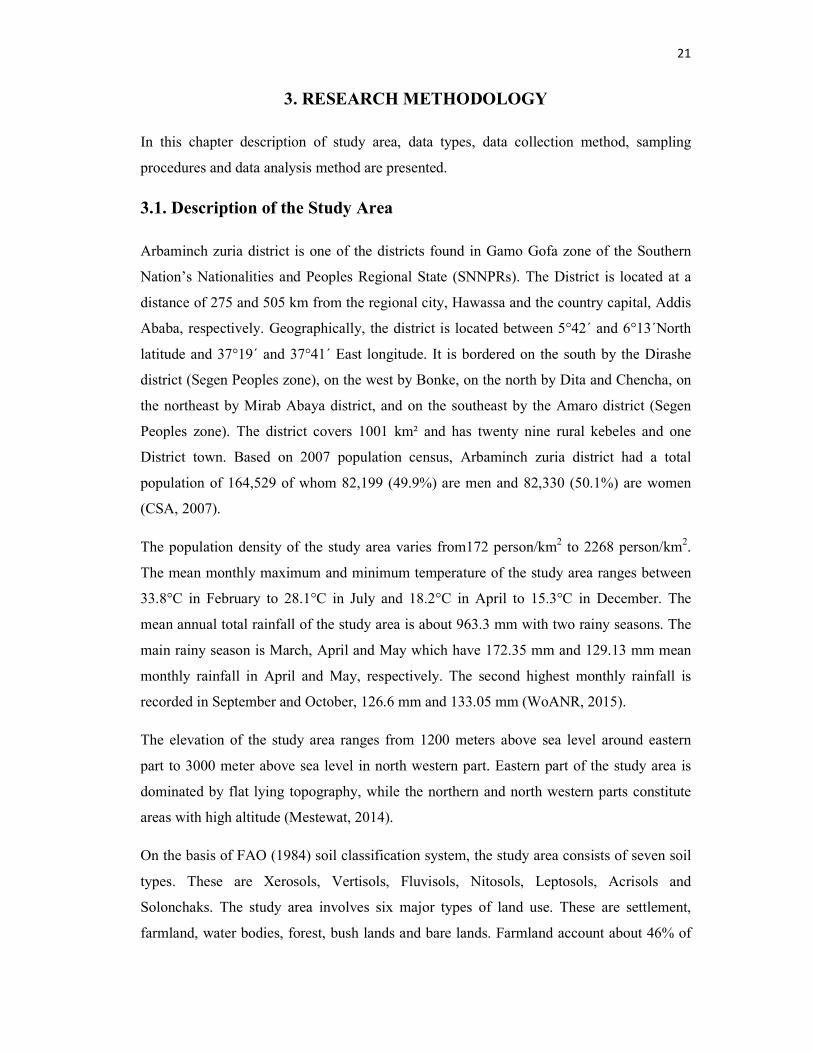
3.1. Description of the Study Area
Arbaminch zuria district is one of the districts found in Gamo Gofa zone of the Southern
Nation’s Nationalities and Peoples Regional State (SNNPRs). The District is located at a
distance of 275 and 505 km from the regional city, Hawassa and the country capital, Addis
Ababa, respectively. Geographically, the district is located between 5°42´ and 6°13´North
latitude and 37°19´ and 37°41´ East longitude. It is bordered on the south by the Dirashe
district (Segen Peoples zone), on the west by Bonke, on the north by Dita and Chencha, on
the northeast by Mirab Abaya district, and on the southeast by the Amaro district (Segen
Peoples zone). The district covers 1001 km² and has twenty nine rural kebeles and one
District town. Based on 2007 population census, Arbaminch zuria district had a total
population of 164,529 of whom 82,199 (49.9%) are men and 82,330 (50.1%) are women
(CSA, 2007).
The population density of the study area varies from172 person/km2 to 2268 person/km2.
The mean monthly maximum and minimum temperature of the study area ranges between
33.8°C in February to 28.1°C in July and 18.2°C in April to 15.3°C in December. The
mean annual total rainfall of the study area is about 963.3 mm with two rainy seasons. The
main rainy season is March, April and May which have 172.35 mm and 129.13 mm mean
monthly rainfall in April and May, respectively. The second highest monthly rainfall is
recorded in September and October, 126.6 mm and 133.05 mm (WoANR, 2015).
The elevation of the study area ranges from 1200 meters above sea level around eastern
part to 3000 meter above sea level in north western part. Eastern part of the study area is
dominated by flat lying topography, while the northern and north western parts constitute
areas with high altitude (Mestewat, 2014).
On the basis of FAO (1984) soil classification system, the study area consists of seven soil
types. These are Xerosols, Vertisols, Fluvisols, Nitosols, Leptosols, Acrisols and
Solonchaks. The study area involves six major types of land use. These are settlement,
farmland, water bodies, forest, bush lands and bare lands. Farmland account about 46% of

22
the total area, including two private large farm lands (Amibara Agricultural development
plc and Lucy Agricultural development plc.) and farmers owned farm lands. The second
dominant land use is bush land area which accounts 34.1%, settlement areas account
12.5%, dense forest of the total area found around the two lakes accounts 5.7%, water
bodies accounts 0.85%, and bare lands account 0.85% found in different parts of the
district, which is left fallow (Mestewat, 2014).
Figure 3: Location of Arbaminch zuria district
3.2. Types of Data, Sources and Methods of Data Collection
Both primary and secondary data were used. The primary data were collected using semi-
structured questionnaires. To collect primary data from cotton producer farmers, enumerato
rs who speak local language (Gamogna) very well were hired and trained for data
collection. Data were collected under strict supervision of the researcher.

23
Secondary data were collected from different sources such as from district Agricultural and
Natural Resource Development Office reports, textile industry report, Gamo Gofa zone
Agricultural and Natural Resource Development department reports, Trade and Industry
Offices, bulletins and websites. Published and unpublished documents were reviewed to
secure relevant secondary information.
Quantitative and qualitative data were collected from respective sources and were used to
achieve the proposed objectives.
3.3. Sampling Procedures and Sample size
To draw representative sample respondents from those cotton value chain actors included in
the study; the following sampling method was employed.
3.3.1. Producer sampling
Two stage sampling procedure was employed to draw representative cotton producer
farmers. In the first stage, three kebeles were selected randomly from ten cotton producer
kebeles of the study district. In the second stage, households were selected randomly from
complete list of households of selected kebeles and sample size was determined according
to formula given by Yamane (1967) at 95% confidence interval with 9% precision level (e)
= 0.09
( ))1(
2eN+1
N=n
Where n: sample size for research use, N: total number of households of the Arbaminch
zuria district and e: designates precision level and ranges from 0.05 to 0.1. For this research
e=0.09 was taken as precision level. Because according to Meryem (2013). as ‘e’ gets
approaches to 0.05 the sample size gets larger and larger, as a result it becomes difficult to
manage. Sample size for each kebele was distributed based on proportional to size of total
households.
� =26931
1 + 26931 (0.09)�= 122.89 ≈ 123
24
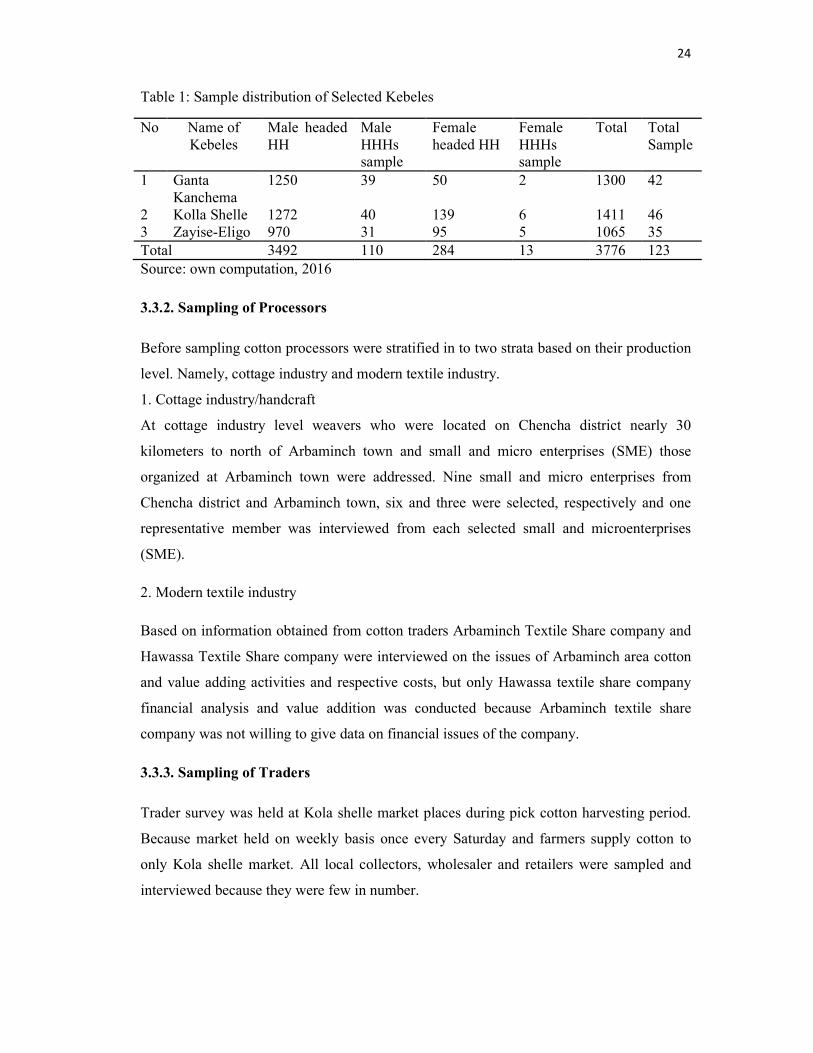
Table 1: Sample distribution of Selected Kebeles
No Name of Kebeles
Male headed HH
Male HHHs sample
Female headed HH
Female HHHs sample
Total Total Sample
1 Ganta Kanchema
1250 39 50 2 1300 42
2 Kolla Shelle 1272 40 139 6 1411 46 3 Zayise-Eligo 970 31 95 5 1065 35 Total 3492 110 284 13 3776 123 Source: own computation, 2016
3.3.2. Sampling of Processors
Before sampling cotton processors were stratified in to two strata based on their production
level. Namely, cottage industry and modern textile industry.
1. Cottage industry/handcraft
At cottage industry level weavers who were located on Chencha district nearly 30
kilometers to north of Arbaminch town and small and micro enterprises (SME) those
organized at Arbaminch town were addressed. Nine small and micro enterprises from
Chencha district and Arbaminch town, six and three were selected, respectively and one
representative member was interviewed from each selected small and microenterprises
(SME).
2. Modern textile industry
Based on information obtained from cotton traders Arbaminch Textile Share company and
Hawassa Textile Share company were interviewed on the issues of Arbaminch area cotton
and value adding activities and respective costs, but only Hawassa textile share company
financial analysis and value addition was conducted because Arbaminch textile share
company was not willing to give data on financial issues of the company.
3.3.3. Sampling of Traders
Trader survey was held at Kola shelle market places during pick cotton harvesting period.
Because market held on weekly basis once every Saturday and farmers supply cotton to
only Kola shelle market. All local collectors, wholesaler and retailers were sampled and
interviewed because they were few in number.

25
3.4. Methods of Data Analysis
Descriptive and econometric data analysis methods were used to analyze the data. Socio-
economic and demographic characteristics of value chain actors, value adding and market
structure- conduct- performance were analyzed using descriptive statistics. Econometric
model was used to analyze factors affecting quantity of cotton supplied to market.
3.4.1. Descriptive Data Analysis
This method of data analysis refers to the use of charts, ratios, percentages, means,
variances and standard deviations in the process of examining and describing socio-
economic and demographic characteristics of value chain actors, value adding activities,
chain actors’ roles and functions, marketing system and traders’ characteristics.
3.4.1.1. Value chain analysis
To come up with value chain analysis the following descriptive analysis were done:
1. Functional analysis and flow chart
Mapping the chain means giving a visual representation of the connections between actors
and tracing a product flow through an entire channel from the point of product concept to
the point of consumption(McCormick and Schmitz 2001; Kaplinsky and Morris 2002).
The starting point in value chain analysis is the so called chain mapping. To do so, the data
on all the involved agents, their activities, interactions among each other and flows of the
product through the production stages were identified and mapped.
According to FAO (2006a, b, and c), all the data sufficient for constructing the value chain
was presented in the form of a commodity flow chart. The flow chart visually highlights
interactions and flows between agents. It can also be a useful tool in achieving clarity in the
subsequent stages of analysis.
2. Financial analysis
Methods for analyzing the value chain aim basically at the analyses of the process of value
creation and income distribution (Rudenko, 2008).
According to FAO (2006b), methodology for analyzing the value chain includes financial
analysis and economic analysis. Financial analysis was used to determine the monetary

26
value added in the various segments of the chain actors. Total value added of the chain
represents all value created by all the agents of the chain.
(2) ∑VAagentsChain Added Value =
Value added: calculations carried out were in terms of the value created by individual
agents. If II is the value of intermediate inputs used and Y is the value of the output, then
the difference (Y-II) represents the value which the agent has added during the accounting
period to the value of the inputs in the process of production or processing. Value added
(VA) was defined by the equation and it was employed:
(3) II-YVA =
Value added measures the creation of wealth. At this stage, the calculation of value added
was carried out using market prices.
The financial profitability of activities in the chain was analyzed based on the agents’
activities, their economic results in the form of profits or losses.
)4( costs production Total
ProfitRR =
Where RR stands for Rate Return on the investment of cotton value chain.
3.4.1.2. Structure Conduct and Performance (S-C-P) model
1. Market structure
Market structure includes: a) the degree of buyer and seller concentration, defined by the
number of buyers and sellers in the market b) the degree of market transparency which
refers to the availability of relevant market information, its distribution among buyers and
sellers, and its adequacy in terms of price sharpening, quality comparisons and risk
reduction or uncertainty about the future. c) The condition of entry to the market referring
to the relative ease or difficulty with which seller may enter the market (Clodius and
Mueller, 1961). Market concentration can be measured by; concentration ratio, Gini-
coefficient and Hirschman Herfindahl index.
For this study only Hirschman Herfindahl index was used because unlike the four-firm
concentration ratio, the HHI reflects both the distribution of the market shares of the top
four firms and the composition of the market outside the top four firms. It also gives
27
proportionately greater weight to the market shares of the larger firms, in accord with their
relative importance in competitive interactions according to Wisdom et al. (2014).
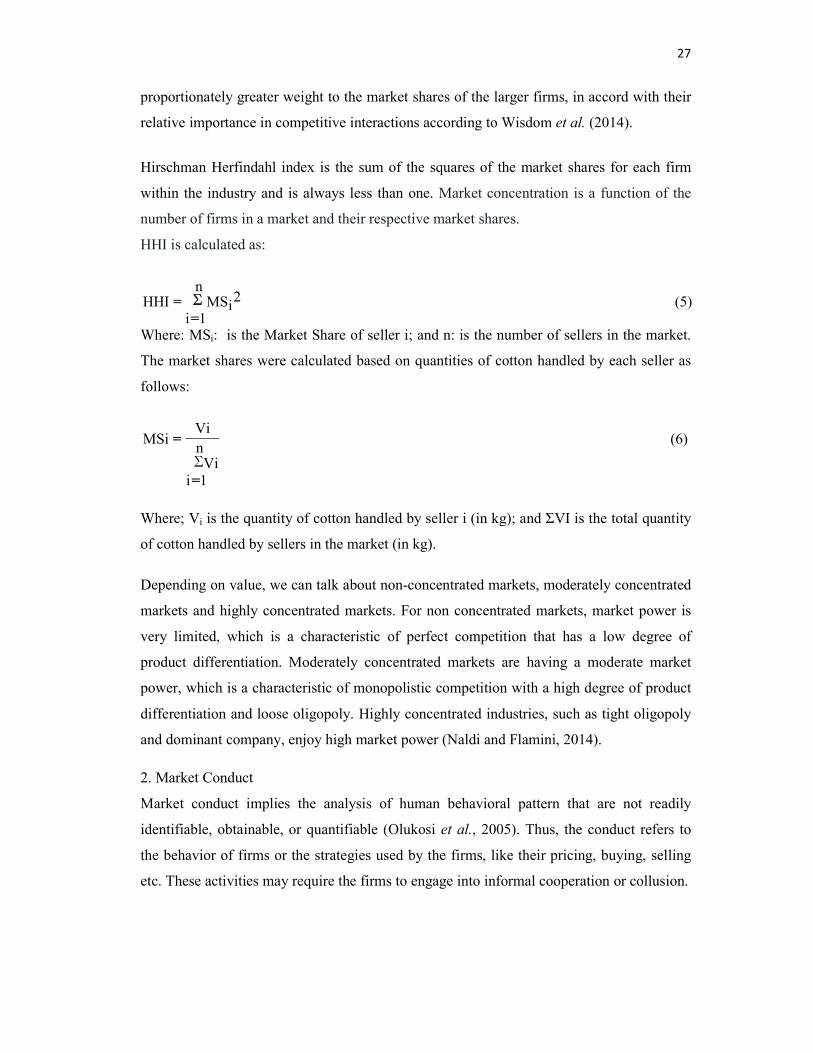
Hirschman Herfindahl index is the sum of the squares of the market shares for each firm
within the industry and is always less than one. Market concentration is a function of the
number of firms in a market and their respective market shares.
HHI is calculated as:
∑=
=n
1i(5) 2
iMS HHI
Where: MSi: is the Market Share of seller i; and n: is the number of sellers in the market.
The market shares were calculated based on quantities of cotton handled by each seller as
follows:
(6)
∑n
1iVi
ViMSi
=
=
Where; Vi is the quantity of cotton handled by seller i (in kg); and ΣVI is the total quantity
of cotton handled by sellers in the market (in kg).
Depending on value, we can talk about non-concentrated markets, moderately concentrated
markets and highly concentrated markets. For non concentrated markets, market power is
very limited, which is a characteristic of perfect competition that has a low degree of
product differentiation. Moderately concentrated markets are having a moderate market
power, which is a characteristic of monopolistic competition with a high degree of product
differentiation and loose oligopoly. Highly concentrated industries, such as tight oligopoly
and dominant company, enjoy high market power (Naldi and Flamini, 2014).
2. Market Conduct
Market conduct implies the analysis of human behavioral pattern that are not readily
identifiable, obtainable, or quantifiable (Olukosi et al., 2005). Thus, the conduct refers to
the behavior of firms or the strategies used by the firms, like their pricing, buying, selling
etc. These activities may require the firms to engage into informal cooperation or collusion.
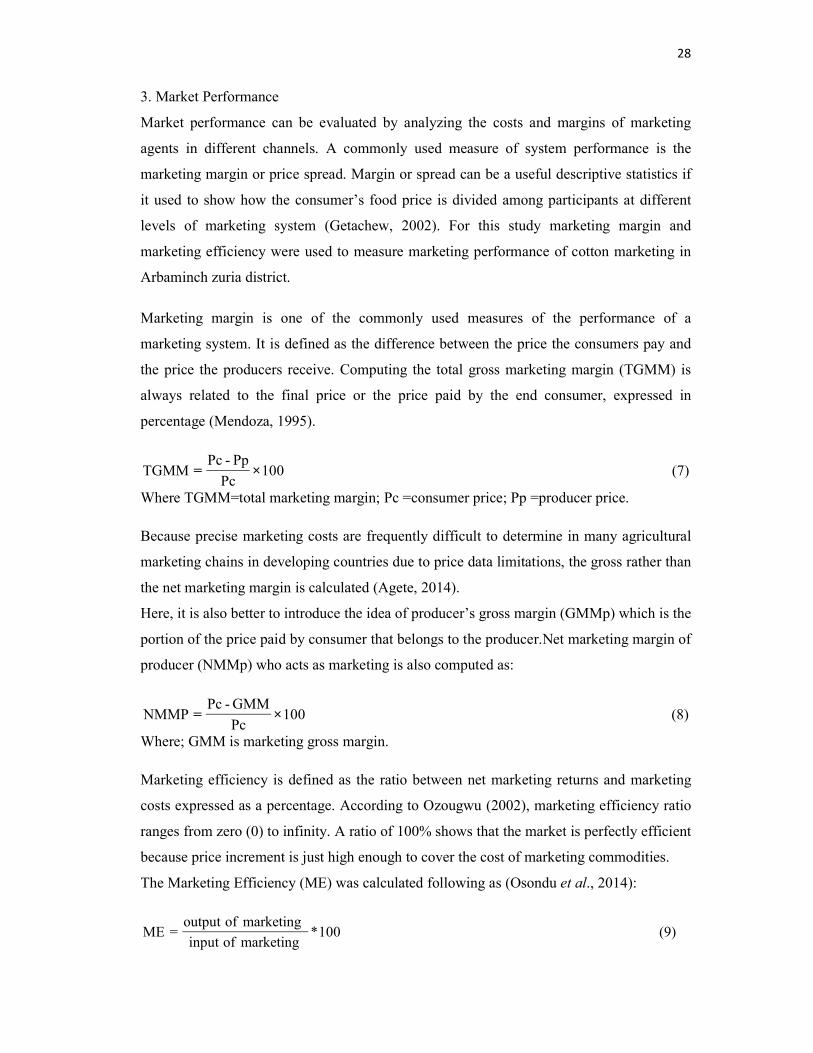
28
3. Market Performance
Market performance can be evaluated by analyzing the costs and margins of marketing
agents in different channels. A commonly used measure of system performance is the
marketing margin or price spread. Margin or spread can be a useful descriptive statistics if
it used to show how the consumer’s food price is divided among participants at different
levels of marketing system (Getachew, 2002). For this study marketing margin and
marketing efficiency were used to measure marketing performance of cotton marketing in
Arbaminch zuria district.
Marketing margin is one of the commonly used measures of the performance of a
marketing system. It is defined as the difference between the price the consumers pay and
the price the producers receive. Computing the total gross marketing margin (TGMM) is
always related to the final price or the price paid by the end consumer, expressed in
percentage (Mendoza, 1995).
(7) 100Pc
Pp- PcTGMM ×=
Where TGMM=total marketing margin; Pc =consumer price; Pp =producer price.
Because precise marketing costs are frequently difficult to determine in many agricultural
marketing chains in developing countries due to price data limitations, the gross rather than
the net marketing margin is calculated (Agete, 2014).
Here, it is also better to introduce the idea of producer’s gross margin (GMMp) which is the
portion of the price paid by consumer that belongs to the producer.Net marketing margin of
producer (NMMp) who acts as marketing is also computed as:
(8) 100Pc
GMM-PcNMMP ×=
Where; GMM is marketing gross margin.
Marketing efficiency is defined as the ratio between net marketing returns and marketing
costs expressed as a percentage. According to Ozougwu (2002), marketing efficiency ratio
ranges from zero (0) to infinity. A ratio of 100% shows that the market is perfectly efficient
because price increment is just high enough to cover the cost of marketing commodities.
The Marketing Efficiency (ME) was calculated following as (Osondu et al., 2014):
(9) 100*marketing ofinput
marketing ofoutput =ME

29
3.4.2. Econometric Analysis
3.4.2.1. Model Specification
Multiple Linear Regression Model was used to analyze factors affecting farm level cotton
supply in Arbaminch zuria district. According to Gujarati (2003) model specification of
supply function in matrix notation was:
)10( iUiXiβoβiY ++=
Where Yi = quantity cotton supplied to the market (Kg/house hold/year),βo : is constant
term, iβ : a vector of estimated coefficient of the explanatory variables, iX : a vector of
explanatory variables, iU : disturbance term.
Multiple Linear Regression Model was proposed for this study because multiple linear
regressions allow more factors to enter the analysis separately and to estimate effect of
each. (Allison,1998). Also Multiple regression is a very flexible method and suitable when
a quantitative dependent variable is in relationship to more independent or predictor
variables (Eckert, 1909). Cotton is industrial crop, so that it is expected that all sampled
cotton producers supply total cotton produced to market.
Different researchers (Ayelech, 2011; Bosena et al., 2011; and Yimer, 2015) used Multiple
Linear Regression Model to analyze factors affecting market supply of mango and avocado,
cotton, and fruits, respectively. Having aforementioned benefits, commodity nature and
empirical evidences; for this study, Multiple Linear Regression Model was used to identify
factors affecting market supply of cotton at farm level in Arbaminch zuria district.
3.4.2.2. Definition of variables and hypothesis
Dependent variable
Quantity of cotton supplied to market (ln): It was a continuous variable that represents
the market supply of cotton by individual households to the market, which was measured in
kilo gram per household per year.
Independent variables: The explanatory variables expected to influence the dependent
variable were expressed in the following manner:
Productivity of cotton Kg per hectare (QCP) (ln): It was a continuous variable representi
ng amount of cotton produced in kilogram per hectare. The variable was expected to have
positive contribution to the amount of cotton supplied to the market. Farmers who produce
30
more output per hectare were expected to supply more cotton to the market than those who
produce less. Bosena et al. (2011) found that increase in productivity of cotton increased
market supply of cotton in Metema district.
Distance to nearest market (DNM): It was a continuous variable which was measured in
kilometers which farmers waste time to sell their product to the market. Study conducted by
Yimer (2015) found that distance to market significantly and negatively affected marketed
surplus of fruits. And also study conducted by Ayelech (2011) found that, an increase in
distance to market caused marketed surplus of avocado to decline. The closer to the market
the lesser would be the transportation cost and time spent. Therefore, this variable was
expected to affect market supply of cotton negatively.
Access to market information (AMI): This was measured as a dummy variable with value
of one if the farmers have access to market information and zero otherwise. Farmers
marketing decisions were based on market price information. Studies conducted by Abay
(2007) and Yimer (2015) concluded that those farmers who had better information, supply
more vegetables and fruit to the market, respectively. Therefore, it was hypothesized that
access to market information was positively related to market supply of cotton.
Land allocated for cotton in hectare (LAC_HA): It was continuous variable. Since
cotton is an industrial crop having a direct relation with market supply, increase the area of
land covered by the crop can directly increase the marketable supply of cotton. Therefore,
this variable was assumed to have a positive relation with the dependant variable and was
measured in hectares. Bosena et al. (2011) study found that, increase in land allocated to
cotton production increase market supply of cotton in Metema District.
Education of household head (ELHH): This was a dummy variable with a value of one if
a household head was literate and zero otherwise. According to the study conducted by
Yimer (2015), found that education has improved the producing households’ ability to
acquire new idea in relation to market information and improved production which in turn
enhanced productivity and thereby increased market supply of fruits. So, this variable was
expected to have positive relation with farm level market supply of cotton.
Extension contact (NEXC): This was a continuous variable, which was measured in total
number of cotton producer’s contact with extension agents during current production year
for the purpose of exchanging information about cotton production. The more the number

31
of contacts, the higher the information and knowledge acquired by producers. Therefore, it
was hypothesized that contacts with extension agents positively affect market supply of
cotton. Study conducted by Rehima (2006) showed that contact with extension agents
positively influenced the red paper quantity supplied to market.
Lagged price of cotton ETB/quintal (LYRPCT): This was a continuous variable that
measured annual average price of cotton in the last year. It was one year lagged price of
cotton. When cotton price was high in the market in the last year, farmers would be
motivated to take their produce to the market. This variable was hypothesized to have
positive relation with market supply of cotton.
Current year price of cotton ETB/quintal (curntprice): This was a continuous variable
measured as the annual average price of cotton in the sampled markets in the study area
during the production period. The price was expected to positively affect the quantity
supplied in the market because when producers were well paid, this would motivate them to
increase their market participation and quantity of cotton sold. It was developed from the
law of supply, namely, ceteris paribus as the price of a good rises, the quantity supplied
rises. According to Agete (2014) a unit increase in the price increased the quantity of red
bean sold in Halaba special district.
Number of oxen owned (NOO): This variable was a continuous variable and measured by
taking into consideration the number of oxen owned by farming household and expected to
affects market supply of cotton positively. This was because those farmers who have their
own oxen can plough their land on time and as a result, able to produce more cotton and
supply more to market. According to Bosena et al. (2011) an increase in oxen increases
farm level market supply of cotton in Metema district.
Access to credit (ACR): This was dummy variable, which assumes a value of one if the
farmer has credit access and zero otherwise. According to Bosena et al. (2011) farm level
market supply of cotton by farmers who took credit was greater than those who did not take
credit. Therefore, it was hypothesized that access to credit would have positive influence on
farm level cotton market supply in the study area.
Experience in cotton production (ECPr): It was a continuous variable and measured in
years. A farmer with longer period of experience in production was assumed to have a
better knowledge than those have a lower experience in cotton production because through

32
time producers acquire skill about marketing and supply better than those who were less
experienced. Study conducted by Abay (2007) indicated that as farmer’s experience
increases, increases tomato supplied to market in Fogera district. Hence, experience in
cotton production was hypothesized to have positive relation with farm level market supply
of cotton.
Active working force aged 14 to 64 (NFMA14_64YR): It was continuous variable measur
ed in number of persons aged 14-64 per household. A household with more number of
working aged groups (14 to 64 years) was assumed to produce more cotton and as a result
supply more quantity of cotton to market than those households with relatively less number
of working aged groups. Hence, in this study; it was hypothesized to affect market supply
of cotton positively.
Sex of household head (SHHH): It was dummy variable and that takes a value of one if
the household head was male and zero otherwise. Studies conducted by Abay (2007) and
Yimer (2015) indicated that sex of the household head stated that both men and women
participate in vegetable and fruit production, respectively. No sign was expected a priori for
this variable.
Access to improved seed (IMPSED): This was a dummy variable and takes a value of one
if a farmer used improved seed and zero otherwise. A study conducted by Abay (2007)
Showed that improved seeds are associated with high productivity level and better capacity
to resist diseases. Therefore, use of improved seed was hypothesized to have positive effect
on farm level market supply of cotton.
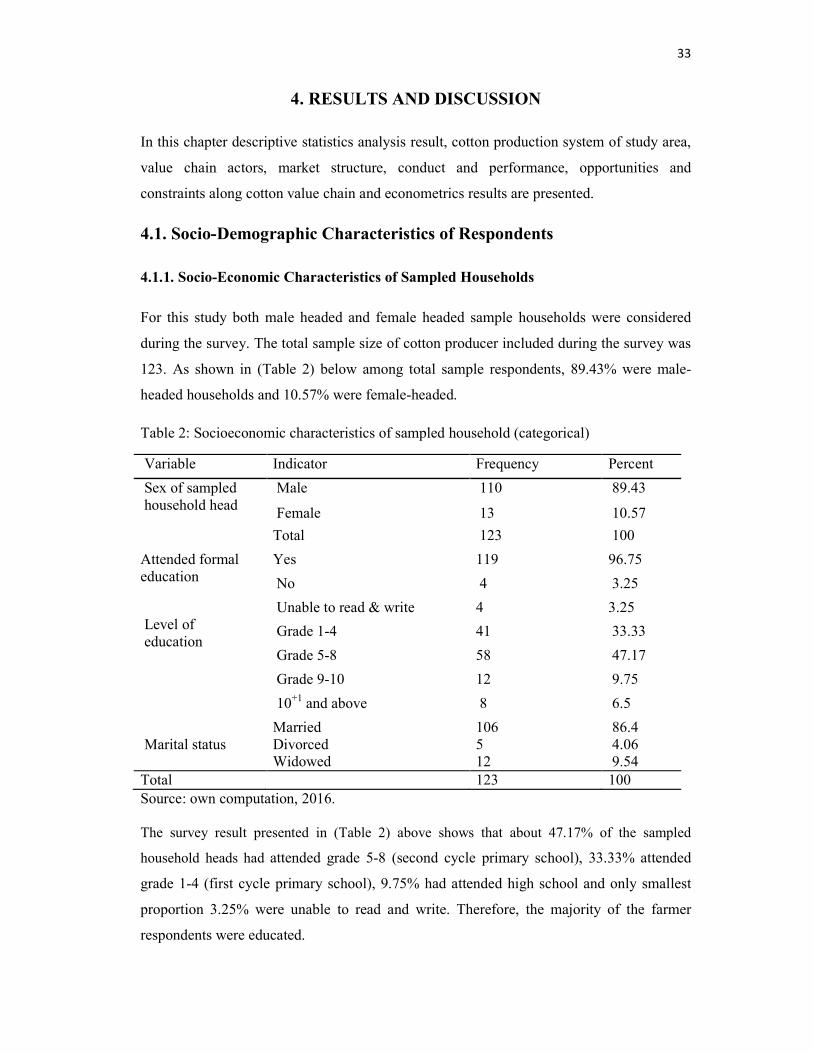
33
4. RESULTS AND DISCUSSION
In this chapter descriptive statistics analysis result, cotton production system of study area,
value chain actors, market structure, conduct and performance, opportunities and
constraints along cotton value chain and econometrics results are presented.
4.1. Socio-Demographic Characteristics of Respondents
4.1.1. Socio-Economic Characteristics of Sampled Households
For this study both male headed and female headed sample households were considered
during the survey. The total sample size of cotton producer included during the survey was
123. As shown in (Table 2) below among total sample respondents, 89.43% were male-
headed households and 10.57% were female-headed.
Table 2: Socioeconomic characteristics of sampled household (categorical)
Variable Indicator Frequency Percent
Sex of sampled household head
Male 110 89.43
Female 13 10.57
Total 123 100
Attended formal education
Yes 119 96.75
No 4 3.25
Level of education
Unable to read & write 4 3.25
Grade 1-4 41 33.33
Grade 5-8 58 47.17
Grade 9-10 12 9.75
10+1 and above 8 6.5
Marital status
Married 106 86.4 Divorced 5 4.06 Widowed 12 9.54
Total 123 100 Source: own computation, 2016. The survey result presented in (Table 2) above shows that about 47.17% of the sampled
household heads had attended grade 5-8 (second cycle primary school), 33.33% attended
grade 1-4 (first cycle primary school), 9.75% had attended high school and only smallest
proportion 3.25% were unable to read and write. Therefore, the majority of the farmer
respondents were educated.
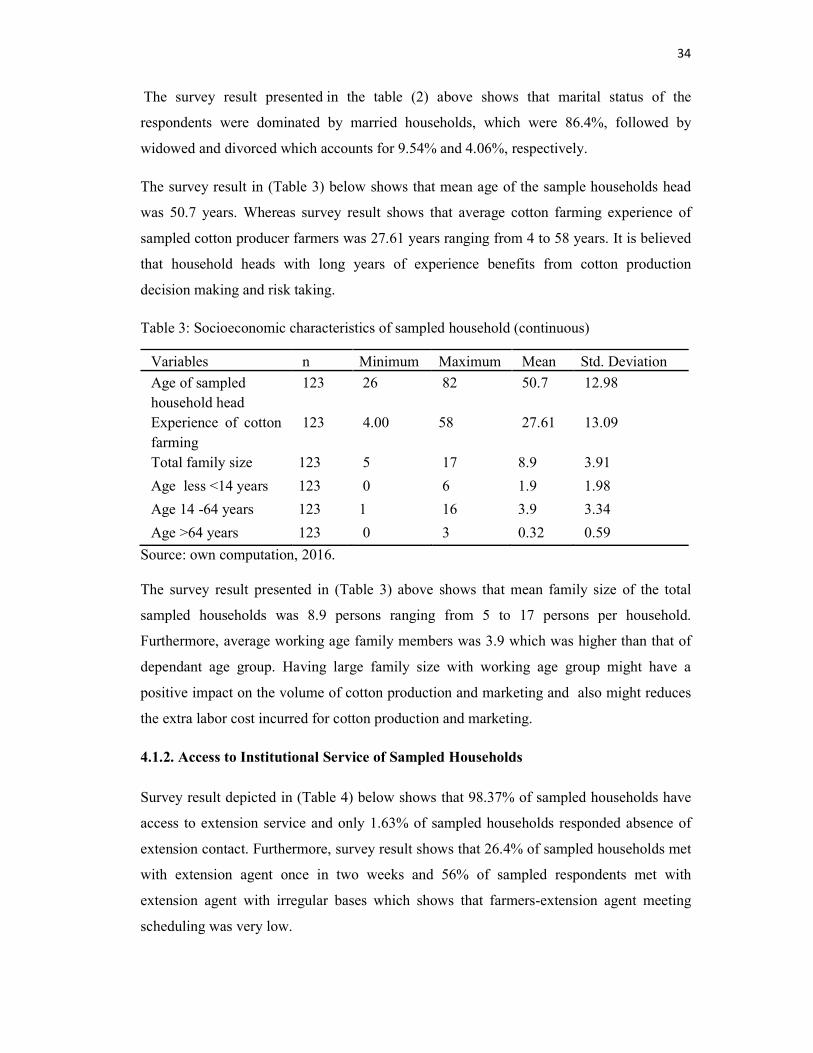
34
The survey result presented in the table (2) above shows that marital status of the
respondents were dominated by married households, which were 86.4%, followed by
widowed and divorced which accounts for 9.54% and 4.06%, respectively.
The survey result in (Table 3) below shows that mean age of the sample households head
was 50.7 years. Whereas survey result shows that average cotton farming experience of
sampled cotton producer farmers was 27.61 years ranging from 4 to 58 years. It is believed
that household heads with long years of experience benefits from cotton production
decision making and risk taking.
Table 3: Socioeconomic characteristics of sampled household (continuous)
Variables n Minimum Maximum Mean Std. Deviation
Age of sampled
household head
123 26 82 50.7 12.98
Experience of cotton
farming
123 4.00 58 27.61 13.09
Total family size 123 5 17 8.9 3.91
Age less <14 years 123 0 6 1.9 1.98
Age 14 -64 years 123 1 16 3.9 3.34
Age >64 years 123 0 3 0.32 0.59
Source: own computation, 2016.
The survey result presented in (Table 3) above shows that mean family size of the total
sampled households was 8.9 persons ranging from 5 to 17 persons per household.
Furthermore, average working age family members was 3.9 which was higher than that of
dependant age group. Having large family size with working age group might have a
positive impact on the volume of cotton production and marketing and also might reduces
the extra labor cost incurred for cotton production and marketing.
4.1.2. Access to Institutional Service of Sampled Households
Survey result depicted in (Table 4) below shows that 98.37% of sampled households have
access to extension service and only 1.63% of sampled households responded absence of
extension contact. Furthermore, survey result shows that 26.4% of sampled households met
with extension agent once in two weeks and 56% of sampled respondents met with
extension agent with irregular bases which shows that farmers-extension agent meeting
scheduling was very low.
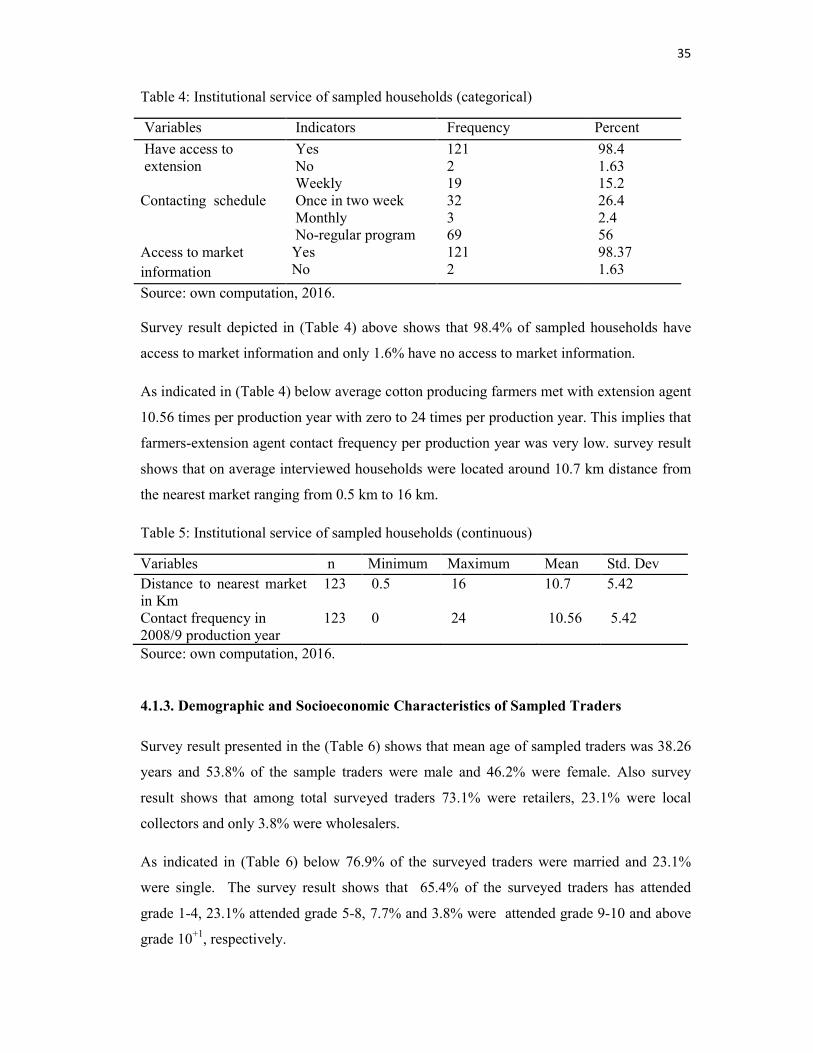
35
Table 4: Institutional service of sampled households (categorical)
Variables Indicators Frequency Percent
Have access to extension
Yes 121 98.4 No 2 1.63
Contacting schedule
Weekly 19 15.2 Once in two week 32 26.4 Monthly 3 2.4 No-regular program 69 56
Access to market
information
Yes 121 98.37 No 2 1.63
Source: own computation, 2016. Survey result depicted in (Table 4) above shows that 98.4% of sampled households have
access to market information and only 1.6% have no access to market information.
As indicated in (Table 4) below average cotton producing farmers met with extension agent
10.56 times per production year with zero to 24 times per production year. This implies that
farmers-extension agent contact frequency per production year was very low. survey result
shows that on average interviewed households were located around 10.7 km distance from
the nearest market ranging from 0.5 km to 16 km.
Table 5: Institutional service of sampled households (continuous)
Variables n Minimum Maximum Mean Std. Dev
Distance to nearest market in Km
123 0.5 16 10.7 5.42
Contact frequency in 2008/9 production year
123 0 24 10.56 5.42
Source: own computation, 2016. 4.1.3. Demographic and Socioeconomic Characteristics of Sampled Traders
Survey result presented in the (Table 6) shows that mean age of sampled traders was 38.26
years and 53.8% of the sample traders were male and 46.2% were female. Also survey
result shows that among total surveyed traders 73.1% were retailers, 23.1% were local
collectors and only 3.8% were wholesalers.
As indicated in (Table 6) below 76.9% of the surveyed traders were married and 23.1%
were single. The survey result shows that 65.4% of the surveyed traders has attended
grade 1-4, 23.1% attended grade 5-8, 7.7% and 3.8% were attended grade 9-10 and above
grade 10+1, respectively.

36
Table 6: Demographic and socio economic characteristics of sampled traders (categorical)
Variables Indicators Frequency Percent Sex of traders
Male 14 53.8 Female 12 46.2 Total 26 100
Types of trading
Wholesaler 1 3.8 Retailers 19 73.1 Local collectors 6 23.1 Total 26 100
Marital status Single 6 23.1 Married 20 76.9
Education level
Grade 1-4 17 65.4 Grade 5-8 6 23.1 Grade 9-10 2 7.7 10+1 & above 1 3.8
License conditions Yes 6 23.1 No 20 76.9 Source of initial capital Relatives 1 3.8 Own saving 25 96.2 Source: own computation, 2016.
As depicted in (Table 6) above among surveyed traders, 76.9% were not licensed and only
23.1% were licensed. With regard to source of initial capital 96.2% were started the
business with their own saving.
As presented in (Table 7) below mean cotton trading experience was 11.61 years which
shows that they were well experienced in cotton trading. Average family size of traders
was 6 persons with a range of one to eleven people per household. Also average initial
capital of sampled cotton traders was birr 1859.6 with range of 100 to 10,000 birr. Also the
survey result shows that in 2016 average working capital of sampled cotton traders was birr
7684.6 with a range of 1800 to 60,000 birr.
Table 7: Family size and trading experience of traders
Variables Indicator n Minimum Maximum Mean Std.Dev
Family size Number 26 1 11 6 2.45
Age of traders Years 26 27 55 38.26 6.86 Trading experience
Years 26 7 17 11.61 3.07
Amount of initial capital
Birr 26 100 10000 1859.6 2247.22
Amount of current working capital
Birr 26 1800 60000 7684.6 12134
Source: own computation, 2016.
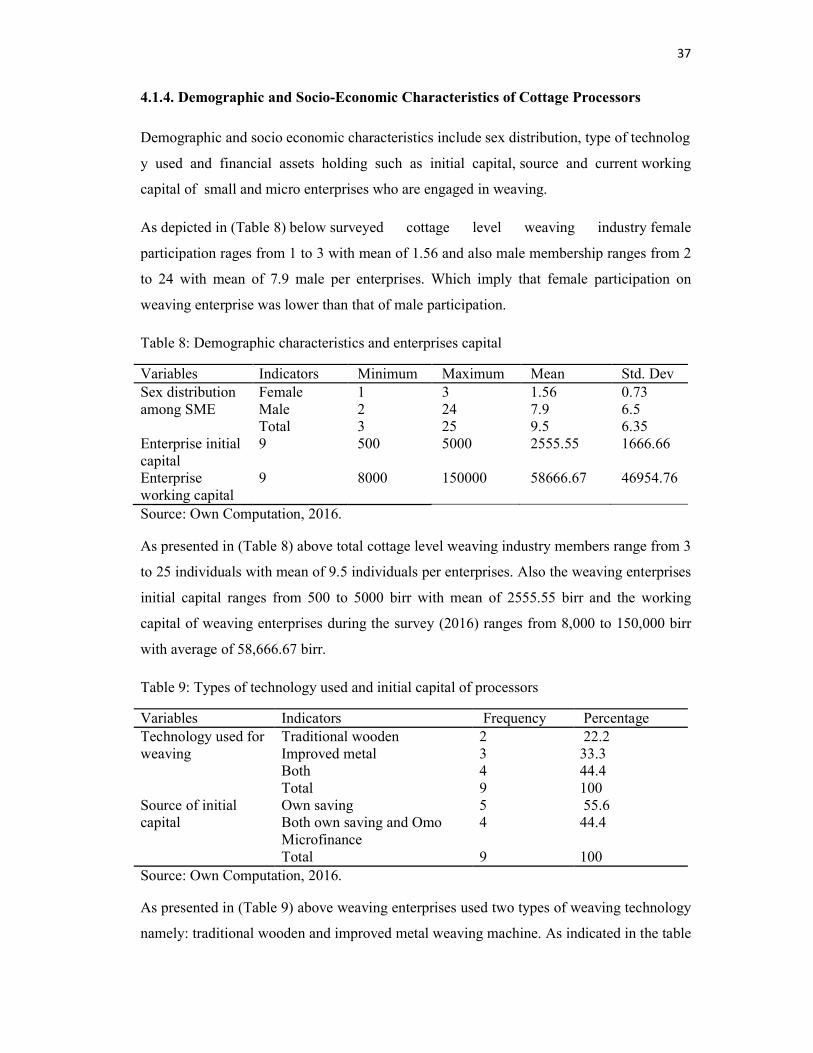
37
4.1.4. Demographic and Socio-Economic Characteristics of Cottage Processors
Demographic and socio economic characteristics include sex distribution, type of technolog
y used and financial assets holding such as initial capital, source and current working
capital of small and micro enterprises who are engaged in weaving.
As depicted in (Table 8) below surveyed cottage level weaving industry female
participation rages from 1 to 3 with mean of 1.56 and also male membership ranges from 2
to 24 with mean of 7.9 male per enterprises. Which imply that female participation on
weaving enterprise was lower than that of male participation.
Table 8: Demographic characteristics and enterprises capital
Variables Indicators Minimum Maximum Mean Std. Dev Sex distribution among SME
Female 1 3 1.56 0.73 Male 2 24 7.9 6.5 Total 3 25 9.5 6.35
Enterprise initial capital
9 500 5000 2555.55 1666.66
Enterprise working capital
9 8000 150000 58666.67 46954.76
Source: Own Computation, 2016.
As presented in (Table 8) above total cottage level weaving industry members range from 3
to 25 individuals with mean of 9.5 individuals per enterprises. Also the weaving enterprises
initial capital ranges from 500 to 5000 birr with mean of 2555.55 birr and the working
capital of weaving enterprises during the survey (2016) ranges from 8,000 to 150,000 birr
with average of 58,666.67 birr.
Table 9: Types of technology used and initial capital of processors
Variables Indicators Frequency Percentage Technology used for weaving
Traditional wooden 2 22.2 Improved metal 3 33.3 Both 4 44.4 Total 9 100
Source of initial capital
Own saving 5 55.6 Both own saving and Omo Microfinance
4 44.4
Total 9 100 Source: Own Computation, 2016.
As presented in (Table 9) above weaving enterprises used two types of weaving technology
namely: traditional wooden and improved metal weaving machine. As indicated in the table
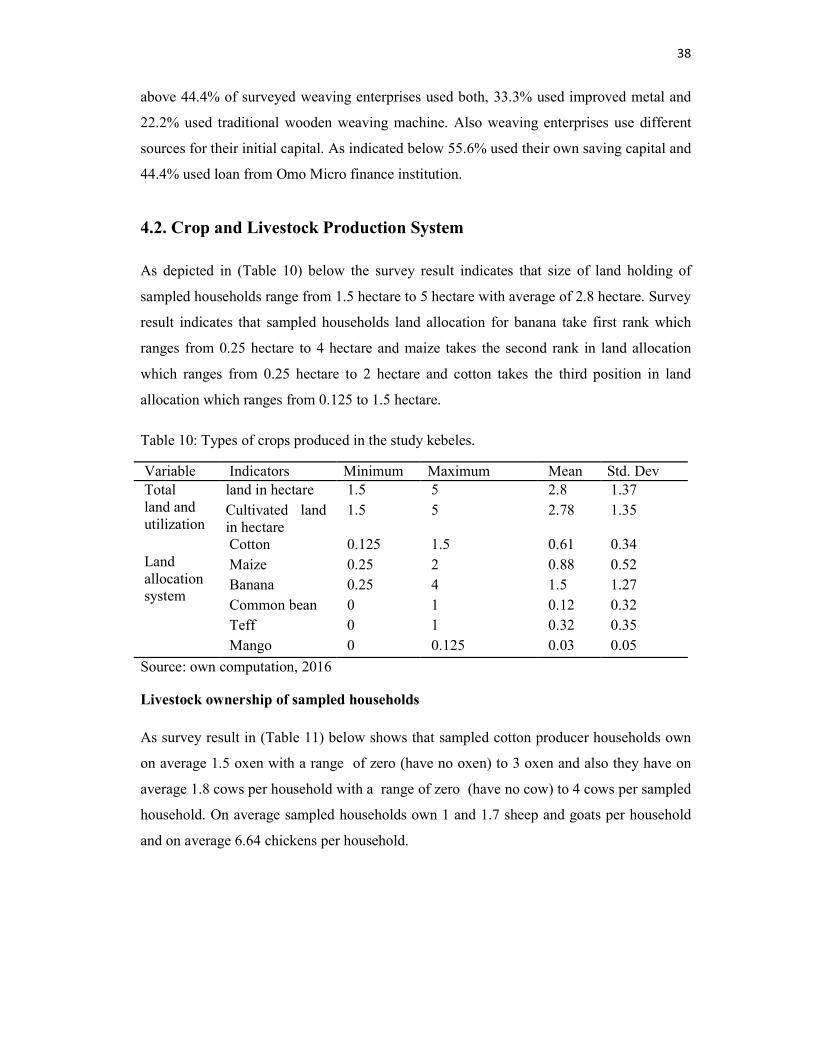
38
above 44.4% of surveyed weaving enterprises used both, 33.3% used improved metal and
22.2% used traditional wooden weaving machine. Also weaving enterprises use different
sources for their initial capital. As indicated below 55.6% used their own saving capital and
44.4% used loan from Omo Micro finance institution.
4.2. Crop and Livestock Production System
As depicted in (Table 10) below the survey result indicates that size of land holding of
sampled households range from 1.5 hectare to 5 hectare with average of 2.8 hectare. Survey
result indicates that sampled households land allocation for banana take first rank which
ranges from 0.25 hectare to 4 hectare and maize takes the second rank in land allocation
which ranges from 0.25 hectare to 2 hectare and cotton takes the third position in land
allocation which ranges from 0.125 to 1.5 hectare.
Table 10: Types of crops produced in the study kebeles.
Variable Indicators Minimum Maximum Mean Std. Dev Total land and utilization
land in hectare 1.5 5 2.8 1.37
Cultivated land in hectare
1.5 5 2.78 1.35
Land allocation system
Cotton 0.125 1.5 0.61 0.34
Maize 0.25 2 0.88 0.52
Banana 0.25 4 1.5 1.27
Common bean 0 1 0.12 0.32
Teff 0 1 0.32 0.35
Mango 0 0.125 0.03 0.05
Source: own computation, 2016
Livestock ownership of sampled households
As survey result in (Table 11) below shows that sampled cotton producer households own
on average 1.5 oxen with a range of zero (have no oxen) to 3 oxen and also they have on
average 1.8 cows per household with a range of zero (have no cow) to 4 cows per sampled
household. On average sampled households own 1 and 1.7 sheep and goats per household
and on average 6.64 chickens per household.

39
Table 11: Types of livestock owned by sampled households
Types of livestock Total livestock owned
Minimum Maximum Mean Std. Dev
Ox 776 0 3 1.5 1.02 Cow 233 0 4 1.8 1.55 Goat 213 0 8 1.7 2.67 Sheep 135 0 5 1.0 1.81
Equines 33 0 2 0.26 0.48 Chickens 830 0 18 6.64 6.046
Source: Own Computation, 2016 4.2.1. Cotton Production System
The survey result indicated in (Table 12) below shows that all (100%) sampled households
use crop rotation pattern and 87% use mono cropping cultivation system for cotton
production. Based on field observation cotton mono cropping system contributes for cotton
quality because cotton fibers traps foreign materials easily when dropped on it and
increases the level of foreign material content which result in quality deterioration, but
when cotton is cultivated alone it reduces foreign material drop on the fiber of cotton.
Table 12: Cotton land allocation system and cropping pattern
Variables Indicators Frequency Percent Use of crop rotation Yes 123 100 Land used for cotton Maize 123 100 Crops sown after cotton harvest Maize 95 77.23
Teff 28 22.77 Total 123 100
Cropping system Mono cropping 107 87 Inter cropping 16 13
Source: Own Computation, 2016.
Also 100% sampled households sow cotton in plots maize were harvested last year and
77.23% of sampled households sow maize after cotton harvest and 22.77% sow teff after
cotton was harvested.
Cotton varieties used
According to Almekinders and Louwaars (2008) seed is a basic requirement and one of the
most precious resources in crop production. In Arbaminch zuria district cotton producing
farmers use different cotton varieties. The survey result presented in (Table 13) below
shows that 81.3% sampled cotton producer households did not use improved cotton
varieties, but MoANR (2004), cotton master plan shows that Gamo Gofa zone is second
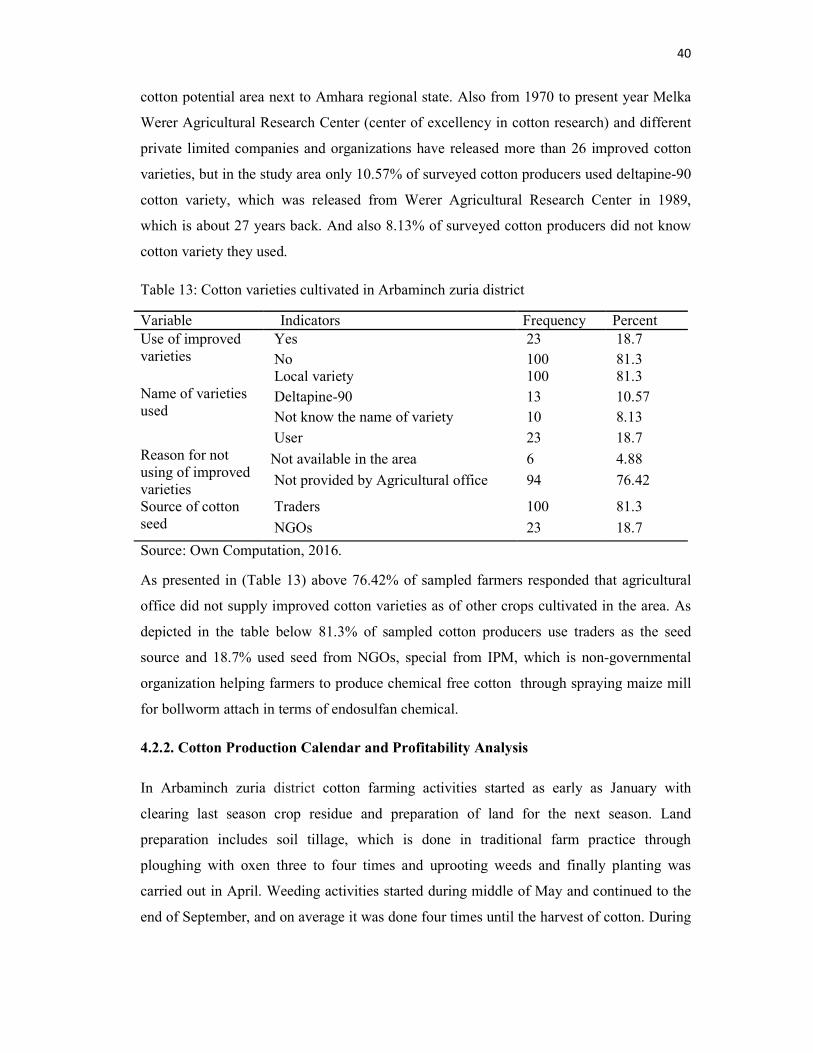
40
cotton potential area next to Amhara regional state. Also from 1970 to present year Melka
Werer Agricultural Research Center (center of excellency in cotton research) and different
private limited companies and organizations have released more than 26 improved cotton
varieties, but in the study area only 10.57% of surveyed cotton producers used deltapine-90
cotton variety, which was released from Werer Agricultural Research Center in 1989,
which is about 27 years back. And also 8.13% of surveyed cotton producers did not know
cotton variety they used.
Table 13: Cotton varieties cultivated in Arbaminch zuria district
Variable Indicators Frequency Percent Use of improved varieties
Yes 23 18.7
No 100 81.3 Name of varieties used
Local variety 100 81.3
Deltapine-90 13 10.57
Not know the name of variety 10 8.13
Reason for not using of improved varieties
User 23 18.7
Not available in the area 6 4.88
Not provided by Agricultural office 94 76.42
Source of cotton seed
Traders 100 81.3
NGOs 23 18.7
Source: Own Computation, 2016.
As presented in (Table 13) above 76.42% of sampled farmers responded that agricultural
office did not supply improved cotton varieties as of other crops cultivated in the area. As
depicted in the table below 81.3% of sampled cotton producers use traders as the seed
source and 18.7% used seed from NGOs, special from IPM, which is non-governmental
organization helping farmers to produce chemical free cotton through spraying maize mill
for bollworm attach in terms of endosulfan chemical.
4.2.2. Cotton Production Calendar and Profitability Analysis
In Arbaminch zuria district cotton farming activities started as early as January with
clearing last season crop residue and preparation of land for the next season. Land
preparation includes soil tillage, which is done in traditional farm practice through
ploughing with oxen three to four times and uprooting weeds and finally planting was
carried out in April. Weeding activities started during middle of May and continued to the
end of September, and on average it was done four times until the harvest of cotton. During

41
production monitoring of weed takes place and chemical (endosulfan) is sprayed when
bollworm and other pest incidence occur.
Harvesting activities starts from early November to half of December when bolls become
ready to harvest. Harvesting is done traditionally with handpicked in three rounds, which
were high labor demanding activities in cotton farming.
Based on the survey data, the costs of production and returns at the current prices were used
to estimate the costs and benefits of cotton production. This section aims at identifying and
quantifying different costs, which were incurred by the farmers during cotton production.
Cotton producers of Arbaminch zuria district uses five key inputs for cotton production
namely: land, seeds, chemicals, tools (oxen), and labor. Detailed of production inputs and
their costs are described in (Table 14) below.
The labor cost given in (Table 14) was estimated based on wage of labor in the village per
man day and it varies based on seasonality of farming activities. Family labor was
evaluated at the existing wage rates of hired labor at the village level. The mean
productivity of cotton was 1083.6 kg per hectare which was calculated from sampled
households’ data. Rental value of land was not taken into account because no sampled
respondents reported cultivating cotton in rented land. Average production cost per 100kg
was 637.69 birr and gross profit per 100 kg was 362.31 birr. Average cotton production
cost per hectare was 6910 birr and gross profit per hectare was 3926 birr.
Table 14: Cotton farming financial analysis per hectare and per 100kg
No. Cost items Cost in ETB Percent share
1 Labor cost 2120 56.73 2 Oxen rent 1500 21.70 3 Inputs cost 750 10.85 4 Packaging material cost 500 7.24 5 Transport cost 200 2.9 7 Land tax per hectare 40 0.58 Average cost per hectare 6910 100 6 Average yield kg per hectare 1083.6 Average cost per 100kg 637.69 Average sales price per kg(Birr) 10
Revenue per 100 Kg 1000 Revenue per hectare(Birr) 10836 Gross profit per hectare 3926 Gross profit per 100kg 362.31
Source: own computation, 2016.
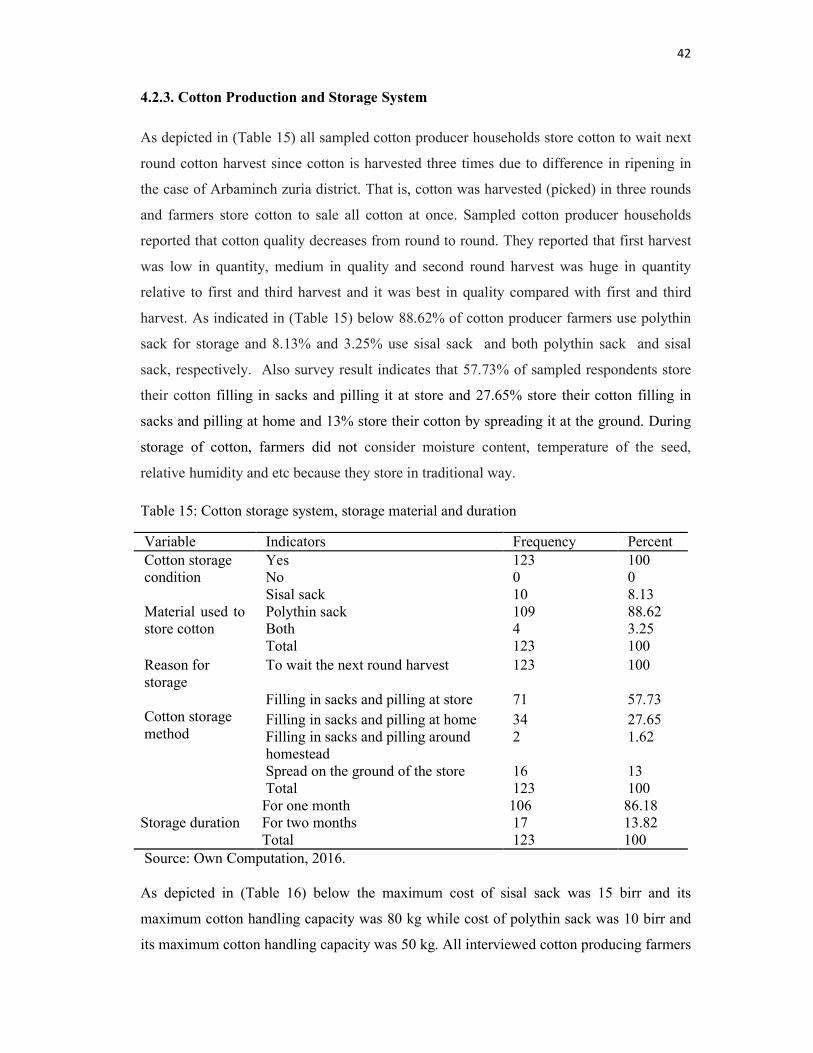
42
4.2.3. Cotton Production and Storage System
As depicted in (Table 15) all sampled cotton producer households store cotton to wait next
round cotton harvest since cotton is harvested three times due to difference in ripening in
the case of Arbaminch zuria district. That is, cotton was harvested (picked) in three rounds
and farmers store cotton to sale all cotton at once. Sampled cotton producer households
reported that cotton quality decreases from round to round. They reported that first harvest
was low in quantity, medium in quality and second round harvest was huge in quantity
relative to first and third harvest and it was best in quality compared with first and third
harvest. As indicated in (Table 15) below 88.62% of cotton producer farmers use polythin
sack for storage and 8.13% and 3.25% use sisal sack and both polythin sack and sisal
sack, respectively. Also survey result indicates that 57.73% of sampled respondents store
their cotton filling in sacks and pilling it at store and 27.65% store their cotton filling in
sacks and pilling at home and 13% store their cotton by spreading it at the ground. During
storage of cotton, farmers did not consider moisture content, temperature of the seed,
relative humidity and etc because they store in traditional way.
Table 15: Cotton storage system, storage material and duration
Variable Indicators Frequency Percent Cotton storage condition
Yes 123 100 No 0 0
Material used to store cotton
Sisal sack 10 8.13 Polythin sack 109 88.62 Both 4 3.25 Total 123 100
Reason for storage
To wait the next round harvest 123 100
Cotton storage method
Filling in sacks and pilling at store 71 57.73
Filling in sacks and pilling at home 34 27.65 Filling in sacks and pilling around homestead
2 1.62
Spread on the ground of the store 16 13 Total 123 100
Storage duration
For one month 106 86.18 For two months 17 13.82 Total 123 100
Source: Own Computation, 2016. As depicted in (Table 16) below the maximum cost of sisal sack was 15 birr and its
maximum cotton handling capacity was 80 kg while cost of polythin sack was 10 birr and
its maximum cotton handling capacity was 50 kg. All interviewed cotton producing farmers
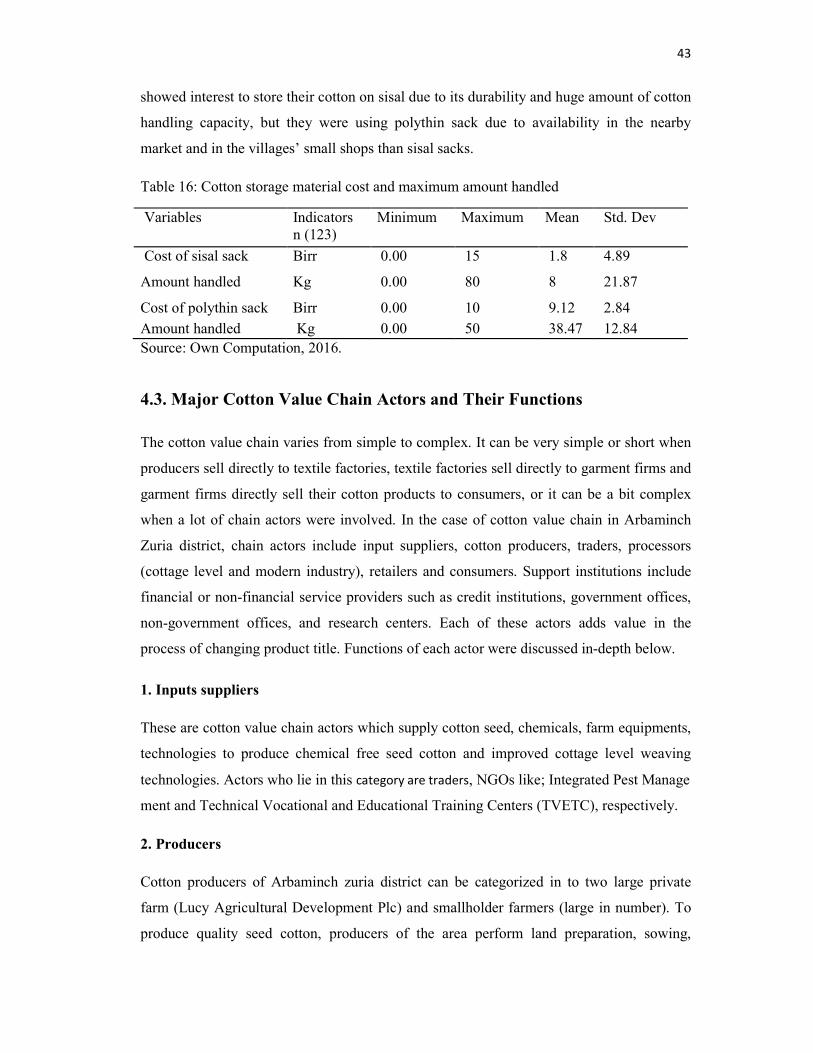
43
showed interest to store their cotton on sisal due to its durability and huge amount of cotton
handling capacity, but they were using polythin sack due to availability in the nearby
market and in the villages’ small shops than sisal sacks.
Table 16: Cotton storage material cost and maximum amount handled
Variables Indicators n (123)
Minimum Maximum Mean Std. Dev
Cost of sisal sack Birr 0.00 15 1.8 4.89
Amount handled Kg 0.00 80 8 21.87
Cost of polythin sack Birr 0.00 10 9.12 2.84
Amount handled Kg 0.00 50 38.47 12.84
Source: Own Computation, 2016.
4.3. Major Cotton Value Chain Actors and Their Functions
The cotton value chain varies from simple to complex. It can be very simple or short when
producers sell directly to textile factories, textile factories sell directly to garment firms and
garment firms directly sell their cotton products to consumers, or it can be a bit complex
when a lot of chain actors were involved. In the case of cotton value chain in Arbaminch
Zuria district, chain actors include input suppliers, cotton producers, traders, processors
(cottage level and modern industry), retailers and consumers. Support institutions include
financial or non-financial service providers such as credit institutions, government offices,
non-government offices, and research centers. Each of these actors adds value in the
process of changing product title. Functions of each actor were discussed in-depth below.
1. Inputs suppliers
These are cotton value chain actors which supply cotton seed, chemicals, farm equipments,
technologies to produce chemical free seed cotton and improved cottage level weaving
technologies. Actors who lie in this category are traders, NGOs like; Integrated Pest Manage
ment and Technical Vocational and Educational Training Centers (TVETC), respectively.
2. Producers
Cotton producers of Arbaminch zuria district can be categorized in to two large private
farm (Lucy Agricultural Development Plc) and smallholder farmers (large in number). To
produce quality seed cotton, producers of the area perform land preparation, sowing,
44
weeding, chemical spraying, harvesting, storage and transport raw cotton to storage and
finally to market.
3. Traders
In the study area traders can be classified into three based on quantity of cotton they handle.
Those are local collectors, wholesalers and retailers. Detailed functions of traders are
discussed below.
Local collectors: These are chain actors, small in number, who buys raw cotton from
smallholder farmers at local markets and sell to wholesalers at the same market place.
Wholesalers: These are cotton chain actors, very small in numbers, who buy cotton from
smallholder farmers as well as from local collectors and sell after processing or ginning raw
cotton into lint and seed. They sell lint for textile factories and seed for oil factories and
cotton producer farmers.
Retailers: In Arbaminch Zuria district, especially in cotton value chain retailers were
individuals who buy raw cotton from smallholders and sell to local level ginneries at
different markets in highland districts of Gamo Gofa zone.
4. Processors
Under this subtitle local level and modern level ginneries, weavers, and textile companies
were discussed as follows:
Ginneries: These were classified into two cottage and modern level ginneries. Cottage
level ginners buy cotton from retailers and sell ginned and spinned lint for cottage level
weavers and seed to smallholder cotton producer farmers.
Modern level ginners separate seed cotton into lint and seed through contract rental
agreement bases with wholesalers in the case of Arbaminch zuria district. They are a focal
point in the primary cotton industry. The principal function of the cotton gin is to separate
lint from seed and produce the highest monetary return for the resulting lint and seeds. For
this study two modern ginneries; Amibara General Aviation and Four –D-ginning factories
were included.
Weavers and textile companies: In the case of cotton value chain, processors are classified
in to two those are textile factories and cottage level weavers. Following the ginning phase,
45
the separated lint and seed gone through a secondary transformation process. The cotton
lint goes to textile mills for transformation into yarn, while the cottonseed goes to seed
processors for transformation into raw oil and seed cake.
Textile manufacturing refers to the transformation of cotton lint to yarn and fabrics and
ultimately to clothing. Textile manufacturing include: yarn spinners, fabric and garment
producers. For this study Arbaminch and Hawassa textile companies were addressed.
Interview with weavers and field observation showed that weavers of study area were
producing many items today like; Kemis, Netala, gabi, Algalibis (traditional bed worn),
scarf, cap, and bulliko.
5. Transport and Logistics
Both traditional means of transport like donkeys and donkey pulled carts and the modern
ones are used to transport raw cotton to producers’ house, market place, storage area and to
ginners’ house. Lorries were commonly used to transport raw cotton to ginners’ house and
the ginned products to textile factories and warehouses.
6. Consumers
Consumers in cotton value chain ranges from individual to government and non-
government institutions. Consumers of cotton product are government offices (hospitals,
educational institutions, meeting halls, training centers, health clinics and the like), non-
government organizations, hotels, cafeterias, groceries, bar and restaurants, public and
private transport agencies, tourists, individuals and communities.
4.3.1. Support Institutions
These are government and non-government institutions which enable or disable and
facilitate cotton value chain in the study area. Arbaminch plant clinic and NGOs (Integrated
Pest Management) are providing training for cotton producers to produce chemical free
cotton and Training and Vocational Education College are providing improved cottage
level weaving tools and machines. Trade and industry office organizes small and micro
enterprises (SME) on weaving. Arbaminch and Chencha towns municipality arranges
working and shopping houses for organized weaver enterprises. Infrastructure and utilities
suppliers including roads, telecommunications and health centers are the basic inputs for

46
the productivity of cotton production and further processing through providing
communication facilities and health services.
At national level price of cotton was regulated in collaboration with three Ministers office
and one Institute these are: Minster of Agriculture and Natural Resource, Ministry of
Industry, Mister of Trade and Textile Industry Development Institute. Minister of
Agriculture and Natural resource is responsible for developing policies and strategies and
supervising the performance in the development of the sector. Ministry of Industry:
develops policies and strategies for the industrialization of the country in general and textile
industry in particular. Textile Industry Development Institute supervises the performance of
both the cotton production and textile manufacturing industries. Minister of Trade responsi
ble for setting price for cotton, monitoring and supervising implementation of pricing
system.
4.3.2. Cotton Value Chain Map of Arbaminch Zuria District
Mapping a value chain helps for clear understanding of the sequence of activities and the
key actors and relationships involved in the value chain. A function of value chain mapping
is to show the relationships and integrations of the processes and activities performed along
the value chain. Major functions of cotton value chain in Arbaminch zuria district is
displayed in (Figure 4) below.

47
Figure 4: cotton value chain map of Arbaminch zuria district
Source: Own sketch from survey result, 2016.
Note: commodity flow, information flow, currency flow.
4.3.3. Value Addition and Financial Analysis of Cotton Value Chain
Value added refers to the contributions of the factors of production, such as land, labor and
capital goods to raising value of a product and corresponds to the incomes received by the
owners of these factors (Rudenko, 2008). From a more focused point of view value added
Cottage level
ginners
Value chain actors
Sel
l co
tto
n s
eed
ba
ck t
o f
arm
ers
Modern Ginning factories
Cotton
producers
Retailers
Bu
y se
ed c
otto
n
Textile Factories
Wholesalers
Local
collectors Input suppliers
Cottage level
weavers
Cotton product traders
Garment factories
Consumers
VC
ser
vic
e
prov
ider
s Arbaminch zuria Woreda agriculture and natural resource office, IPM, Arbaminch plant clinic, Arbaminch TVET, Arbaminch city and Chencha Woreda municipality, Arbaminch University, Arbaminch Agricultural research center, Arbaminch city and Chencha Woreda trade and Industry offices and Omo microfinance.
VC enablers: Minster of trade (MOT),MOANR, Ministry of Industry (MOI), Textile Industry Development Institute (TIDI), Ministry of Forestry and Environment Protection (MOFE), Ethiopian Labor Law and Standard Agency.

48
represents the worth that has been added to a product or a service at each stage of
production or distribution. An economic agent can calculate the value added as a difference
between the full value of the output and the value of the purchased inputs (McCormick and
Schmitz, 2001). Based on the aforementioned value added concept and method of value
adding calculation, each actors value adding along cotton value chain was calculated and
displayed below considering commodity and currency flow linkage and integration.
1. Input supply to raw cotton production
As observed on (Table 14) above average production cost per 100kg was 637.69 birr and
gross profit per 100kg was 362.31 birr. Average cotton production cost per hectare was
6870 birr and gross profit per hectare was 3926 birr.
2. Cotton farm production to traders
Traders of cotton value chain of Arbaminch zuria district can be classified into three.
Namely; local collectors, wholesalers and retailers.
As depicted in (Table 17) below on average local collectors add 1096 birr per 100 kg and
selling price was 1150 birr and they captures 54 birr gross profit from 100 kg of cotton.
Table 17: Financial analysis of local collectors
No. Cost items Cost per (100kg) in birr % marketing cost 1 Purchasing Price 1000 91.24 2 Marketing cost Loading and unloading
cost 17.5 1.59
Transport expense 16 1.45 Store rent 0 0 Brokerage cost 0 0 Tax 2.5 0.26 Cost of packaging material 40 3.61 Labor cost for packing 20 1.85 Total cost 1096 100 3 Selling price 1150 4 Gross profit 54 Source: Own Computation, 2016.
As depicted in (Table 18) below, wholesalers sell cotton after ginning. The case of
Arbaminch zuria district cotton value chain; ginners are processing or ginning seed cotton
based on rental agreement with wholesalers. Average ginning price per 1kg was 37.5 birr.
On average wholesalers add or cost 1575.5 birr per 100 kg cotton. After ginning
wholesalers sold lint 36 birr per kg and seed 5 birr per kg. Lint and seed percentage of
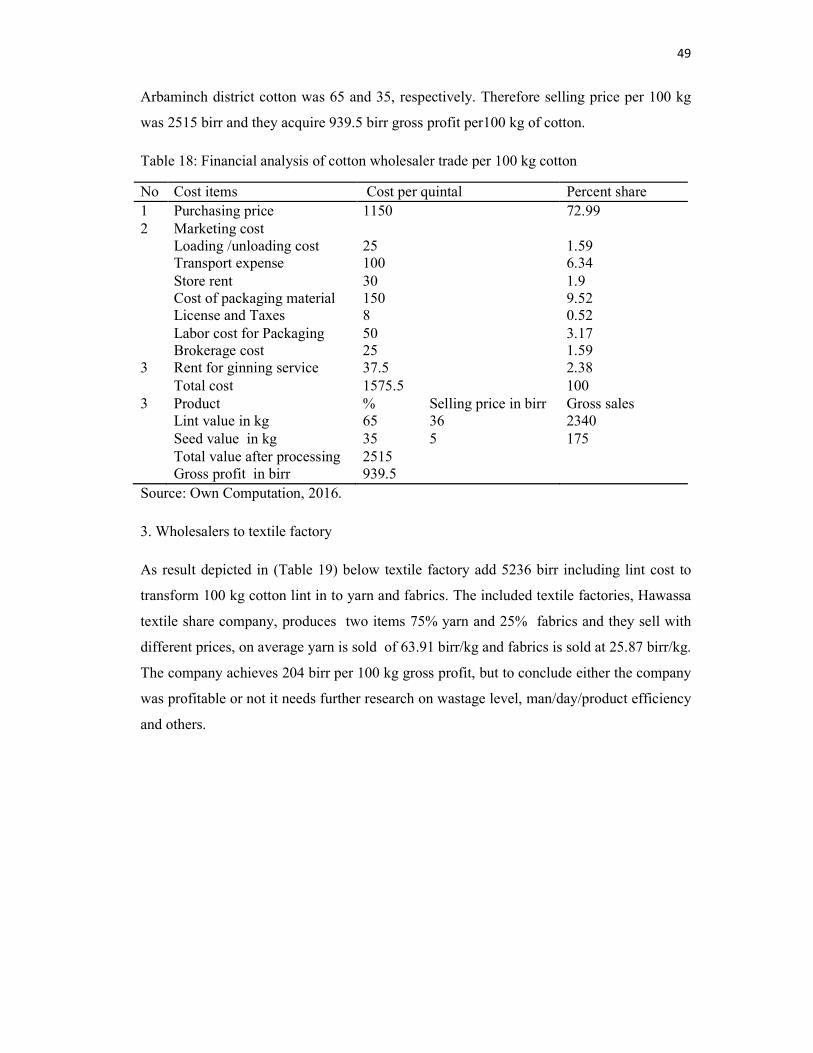
49
Arbaminch district cotton was 65 and 35, respectively. Therefore selling price per 100 kg
was 2515 birr and they acquire 939.5 birr gross profit per100 kg of cotton.
Table 18: Financial analysis of cotton wholesaler trade per 100 kg cotton
No Cost items Cost per quintal Percent share
1 Purchasing price 1150 72.99 2 Marketing cost Loading /unloading cost 25 1.59 Transport expense 100 6.34 Store rent 30 1.9 Cost of packaging material 150 9.52 License and Taxes 8 0.52 Labor cost for Packaging 50 3.17 Brokerage cost 25 1.59 3 Rent for ginning service 37.5 2.38 Total cost 1575.5 100 3 Product % Selling price in birr Gross sales Lint value in kg 65 36 2340 Seed value in kg 35 5 175 Total value after processing 2515 Gross profit in birr 939.5
Source: Own Computation, 2016.
3. Wholesalers to textile factory
As result depicted in (Table 19) below textile factory add 5236 birr including lint cost to
transform 100 kg cotton lint in to yarn and fabrics. The included textile factories, Hawassa
textile share company, produces two items 75% yarn and 25% fabrics and they sell with
different prices, on average yarn is sold of 63.91 birr/kg and fabrics is sold at 25.87 birr/kg.
The company achieves 204 birr per 100 kg gross profit, but to conclude either the company
was profitable or not it needs further research on wastage level, man/day/product efficiency
and others.

50
Table 19: Hawassa textile company value adding activities and cost-benefit analysis.
Activity Cost category Wage cost Spare part Electricity depression material Overhead
Spinning 4493641 2207494 624814 1080534 1930914 Doubling 96566 723 175004 Reeling 606632 1659 24723 17764 Knitting 260555 105581 6174 234429 157050 weaving 2437736 182480 302942 13350 111580 979324 Sub-total 7,798,564 2,592,121 936,312 1,353,036 111,580 3,260,056 Grand total 16,051,66 Purchasing price per 100kg 3600 Total output in kg (2008 E.C) 98,0827.2 Total value added birr per kg 16.36 Total value added per 100kg 1636 Items produced Yarn Fabrics Grand total Percent 75% 25% 100% Selling price(birr/kg) 63.91 25.87 selling price birr/100kg 4793.25 646.75 5440 Net profit per 100kg 204 Source: Own Computation, 2016.
4. Raw cotton to handloom
Based on the survey items produced, quantity of cotton required to produce each items and
costs associated with each items were computed in (Table 20) below.
Table 20: Items produced and production cost Items produced:
Indicators
No. producer
Percent
Production cost
Cotton used in kg
cotton price/kg
selling price
Total production cost
Gross profit
Netela Yes 8 88.9 73.9 0.5 18 119.44 82.9 36.54 No 1 11.1 Kemis Yes 6 66.7 228.9 2 18 397.78 264.9 132.9 No 3 33.3 Bulliko Ye 2 22.2 400 4 18 522.22 472 50.22 No 7 77.8 Algalibis Yes 3 33.3 170. 1 18 216.11 188 28.11 No 6 66.7 Gabi Yes 9 100 198.9 2.5 18 396.67 243.9 152.8 Scarf Yes 2 22.2 15 0.5 18 27.78 24 3.78 No 7 77.8 Dinguza Yes 9 100 78.33 1 18 136.11 96.33 39.78 Cap Yes 3 33.3 17 0.5 18 32.27 26 6.27 No 6 66.7 Total 1182.03 12 1848.38 1393.53 450.4
Source: Own Computation, 2016.

51
As results presented in (Table 20) above shows 100% surveyed weavers enterprises
produce dinguza, which traditional clothes worn by the five ethnic groups of Gamo Gofa
zone. Also 100% sampled enterprises produce gabi, 88.9% of netela, and 66.7% of
sampled enterprises produce kemis. Only 22.2% of surveyed enterprises produced bulliko is
thicker and relatively larger cloth used as a blanket in bed and it is praiseworthy gift, which
is given in different ceremonies and celebrations. On average weavers add 9850 birr per
100 kg of cotton and make 3753.33 birr gross profit per 100 kg of items they produced.
5. Summary of value addition and percentage profit share
This summary of value addition and percentage profit share describes chain actors
production cost, added values, percentage added cost, percentage of profit share and rate of
return in (Table 21) and (Table 21) below based integration of chain actors.
Table 21: Summary value addition of farmers to textile factory
Chain actors Cost per 100 kg Profits per 100 kg Unit total cost
Added cost
% added cost
Unit price
Gross profit
% Gross profit
Rate of return
Farmers 637.69 637.69 22.80 1000 362.31 22 0.568 Local collectors
10096 96 3.44 1150 54 6 0.05
Wholesalers 1575.5 425.5 15.23 2515 939.5 59 0.59 Textile factory
5236
1636
58.53
5440
204
13
0.04
Total 2795.19 100 1559.81 100
Source: Own computation, 2016.
As depicted above in the case of farmers => local collectors => wholesalers =>Textile
company chain integration farmers receive 0.568 birr return for every 1 birr investment on
cotton, local collectors receive 0.05 birr, wholesalers receive 0.59 birr, and textile company
receive 0.04 birr return for every 1 birr investment in cotton value chain activity.
Table 22: Value addition summary of raw cotton to handloom Chain actors
Cost per 100 kg Profits per 100 kg Unit cost
Add cost % add cost
Unit price Gross profit %profit Rate of return
Farmers 637.7 637.69 5.7 1000 362.31 8.11 0.56 Retailers 1350 350 3.14 1500 150 3.37 Local ginners.
1800 300 2.69 2000 200 4.48 0.11
Weavers 11650 9850 88.47 15403.16 3753.167 84.04 0.11 Total 11137.69 100 4465.477 100 0.32
Source: Own computation, 2016.

52
As depicted above in the case of farmers => retailers=> local ginners=>handloom weavers
chain integration farmers receive 0.56 birr return for every 1 birr investment on cotton,
retailers receive 0.11 birr, local ginners receive 0.11 birr, and weavers receive 0.322 birr for
every 1 birr investment in cotton value chain activity, citrus paribus.
4.4. Cotton Value Chain Upgrading and Governance
According to Kaplinsky and Morris (2002) upgrading refers to the acquisition of technologic
al capabilities and market linkages that enable firms to improve their competitiveness and
move into higher-value activities. Similarly according to Jonathan et al., (2009) upgrading
is a means of acquiring technological, institutional and market capabilities to improve their
competitiveness and move into higher-value activities. In short, upgrading is the process of
trading up. In case of cotton value chain in Arbaminch zuria district there are both process
and product upgrading is existed at different cotton chain actors. Cotton producer farmers
are acquiring knowledge from Integrated Pest Management (NGO working on cotton in
Gamo Gofa zone) how to produce organic cotton without using chemicals especially for
pest control and disseminating improved pest resistant varieties. They are acquiring
frequent training how to control cotton pests by spraying maize mill on the cotton without
spraying chemicals. Arbaminch Training, Vocational and Educational College providing
continuously training and improved weaving and spinning machines for small and
microenterprises (SME) who are employed in weaving to increasing their efficiency of
weaving processes and to improve their competitiveness with rivals on the market.
Ethiopian textile industry development institute is providing process performance and
product improvement training for textile companies to improve their competitiveness in
local and global market.
Value chain governance is authority and power relationships that determine how financial,
material, and human resources are allocated and flow within a chain (Gereffi, 1994). Cotton
is an industrial crop and its price and quality issues are determined by global standards and
markets. In Ethiopia price of cotton was regulated in collaboration with three Ministers
office and one Institute these are: Minster of Agriculture and Natural resource, Ministry of
Industry, Minster of Trade and Textile Industry Development Institute, in the case of
Arbaminch zuria district cotton value chain is governed by traders especially wholesalers
govern cotton pricing and which result with determination of local collectors quantity

53
purchase and profit level, which directly determines cotton producer farmers profitability
and decision.
4.5. Cotton Marketing Channels and Structure-Conduct-Performance
4.5.1. Cotton Marketing Channel
According to Islam (2001), marketing channel is the sequence of intermediaries through
which commodities pass from producer to consumer. This channel may be short or long
depending on kind and quality of the product marketed available, marketing services and
prevailing social and physical environment. Having such concepts in this part of the paper
marketing channels were analyzed to identify the alternative routes through which product
flows from the point of origin to final destination. The main marketing channels identified
from the point of production until the product reaches to the final consumer were three.
Their integration and commodity flow routes described below.
Table 23: Channel of cotton flow and amount sold
Variables Indicators Frequency Percent
To whom do you sold
Retailers 29 23.58 Local collectors 64 52.03 Wholesalers 30 24.39 Total 123 100
Source: Own computation, 2016.
Channel I: Farmers RetailersLocal GinnersHandloom Weaverconsumers
As indicated in the (Table 23 and (Table 24) above 23.58% of sampled households sold
cotton to retailers and retailers sold to local ginners and finally after processing (ginning)
local ginners sold to handloom weavers and after transformation of different clothes and
clothing items hand loom weavers sold to consumers. On average maximum quantities of
cotton supplied from sampled household were 200 kg and total quantity sold via this
channel from sampled house hold were 9.3%.
Table 24: Amount of cotton sold to different types of traders
Amount sold in 2016 n Minimum Maximum Sum Mean Std. Dev
Local collectors 123 300 1100 64200 513.6 236.95 Wholesalers 123 .00 1000 29250 234 222.4 Retailer 123 .00 200 9690 77.52 67.2
Source: Own computation, 2016.
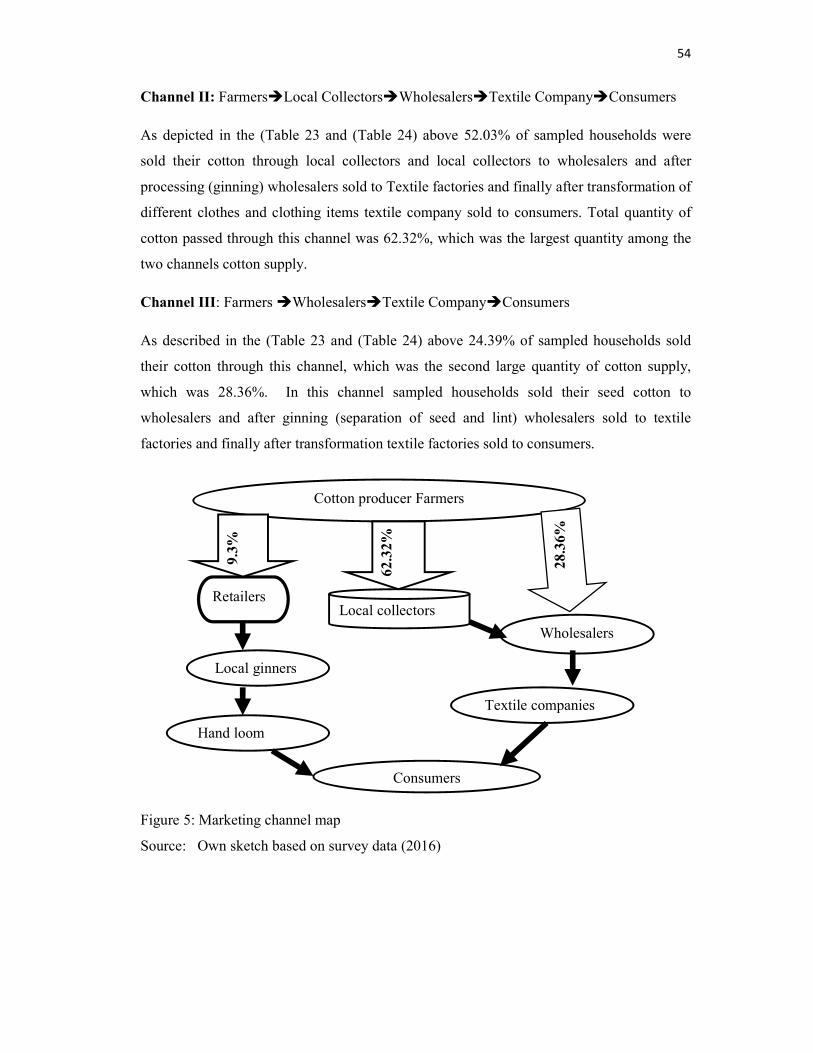
54
Channel II: FarmersLocal CollectorsWholesalersTextile CompanyConsumers
As depicted in the (Table 23 and (Table 24) above 52.03% of sampled households were
sold their cotton through local collectors and local collectors to wholesalers and after
processing (ginning) wholesalers sold to Textile factories and finally after transformation of
different clothes and clothing items textile company sold to consumers. Total quantity of
cotton passed through this channel was 62.32%, which was the largest quantity among the
two channels cotton supply.
Channel III: Farmers WholesalersTextile CompanyConsumers
As described in the (Table 23 and (Table 24) above 24.39% of sampled households sold
their cotton through this channel, which was the second large quantity of cotton supply,
which was 28.36%. In this channel sampled households sold their seed cotton to
wholesalers and after ginning (separation of seed and lint) wholesalers sold to textile
factories and finally after transformation textile factories sold to consumers.
Figure 5: Marketing channel map
Source: Own sketch based on survey data (2016)
Retailers
Consumers
Cotton producer Farmers
Wholesalers
Local ginners
Hand loom
Local collectors
Textile companies
62.3
2%
9.3%
28.
36%

55
4.5.2. Cotton Market Structure-Conduct-Performance
4.5.2.1. Cotton Market Structure
According to Harriss (1993), market structure consists of the characteristics of the
organization of a market which seems to influence strategically the nature of competition
and pricing within the market. In this study the structure of cotton marketing was
characterized using the following indicators: market concentration, the degree of
transparency (market information) and entry conditions (licensing, seasonality of business
and policy barriers).
1. Market Concentration
For this study only Herfindahl-Hirschman Index (HHI) was used because of the following
benefits, according to Wisdom et al. (2014), unlike the four-firm concentration ratio, the
HHI reflects both the distribution of the market shares of the top four firms and the
composition of the market outside the top four firms. It also gives proportionately greater
weight to the market shares of the larger firms, in accordance with their relative importance
in competitive interactions.
Table 25: Cotton traders’ Herfindahl-Hirschman Index (HHI) in Arbaminch zuria district
Number of traders
Amount purchased in kg
Total quantity purchased in kg
% share of purchased
∑n
1iVi
ViMSi
=
=
% purchased share squared
2MSi
%cumulative purchased
n
i
MSiHHI1
2
1 1355000 1355000 0.735773241 0.541362262 0.553 1 100000 100000 0.054300608 0.002948556 1 100000 100000 0.054300608 0.002948556 1 80000 80000 0.043440487 0.001887076 1 70000 70000 0.038010426 0.001444792 1 60000 60000 0.032580365 0.00106148 1 45000 45000 0.024435274 0.000597083 1 6000 6000 0.003258036 1.06148E-05 2 5000 10000 0.005430061 2.94856E-05 3 4000 12000 0.006516073 4.24592E-05 1 1000 1000 0.000543006 2.94856E-07 2 300 600 0.000325804 1.06148E-07 10 200 2000 0.001086012 1.17942E-06 26 1841600 Source: Own computation, 2016.
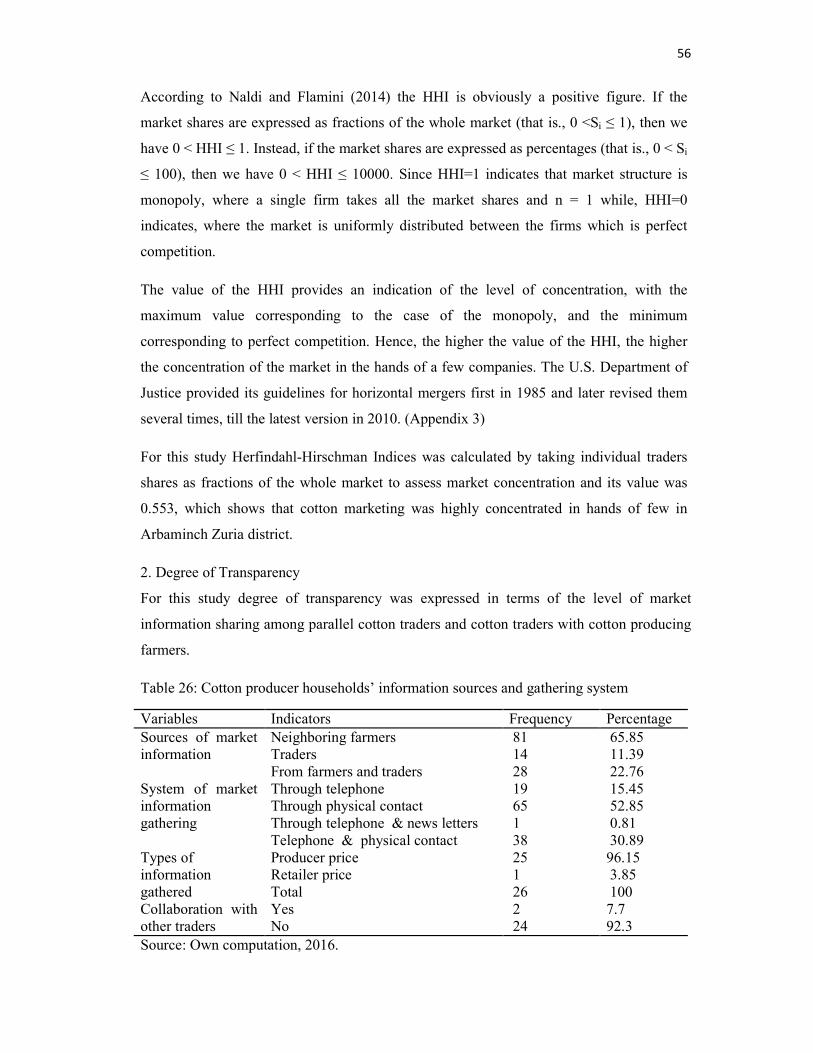
56
According to Naldi and Flamini (2014) the HHI is obviously a positive figure. If the
market shares are expressed as fractions of the whole market (that is., 0 <Si ≤ 1), then we
have 0 < HHI ≤ 1. Instead, if the market shares are expressed as percentages (that is., 0 < Si
≤ 100), then we have 0 < HHI ≤ 10000. Since HHI=1 indicates that market structure is
monopoly, where a single firm takes all the market shares and n = 1 while, HHI=0
indicates, where the market is uniformly distributed between the firms which is perfect
competition.
The value of the HHI provides an indication of the level of concentration, with the
maximum value corresponding to the case of the monopoly, and the minimum
corresponding to perfect competition. Hence, the higher the value of the HHI, the higher
the concentration of the market in the hands of a few companies. The U.S. Department of
Justice provided its guidelines for horizontal mergers first in 1985 and later revised them
several times, till the latest version in 2010. (Appendix 3)
For this study Herfindahl-Hirschman Indices was calculated by taking individual traders
shares as fractions of the whole market to assess market concentration and its value was
0.553, which shows that cotton marketing was highly concentrated in hands of few in
Arbaminch Zuria district.
2. Degree of Transparency
For this study degree of transparency was expressed in terms of the level of market
information sharing among parallel cotton traders and cotton traders with cotton producing
farmers.
Table 26: Cotton producer households’ information sources and gathering system
Variables Indicators Frequency Percentage Sources of market information
Neighboring farmers 81 65.85 Traders 14 11.39 From farmers and traders 28 22.76
System of market information gathering
Through telephone 19 15.45 Through physical contact 65 52.85 Through telephone & news letters 1 0.81 Telephone & physical contact 38 30.89
Types of information gathered
Producer price 25 96.15 Retailer price 1 3.85 Total 26 100
Collaboration with other traders
Yes 2 7.7 No 24 92.3
Source: Own computation, 2016.

57
As depicted in (Table 26) above among sampled households 65.85% obtain market
information from neighboring farmers, 22.76% obtained information from both farmers
and traders and only 11.39% obtained market information from traders. This shows that
market information (demand, supply, pricing and other information) sharing among cotton
traders and cotton producing farmers was weak. Furthermore, about 52.85% of sampled
households gather information through observing market places, which was tedious,
expensive and time consuming method. It takes farmers extra labor and consumes more
time.
As indicated in (Table 26) above 96.15% of traders share information about producer price
and only 3.85% shared about retailer price. Furthermore, 92.3% traders not collaborate each
other. This indicates that information sharing as well as collaboration among cotton traders
in Arbaminch zuria district was weak.
3. Barriers to entry conditions
Barriers to entry to existing market can be defined in a variety of ways – any factors that
increases the unit production cost of new entrants, or any impediments that imposes a cost
on new entrants but not on the incumbents. In order to find out the factors that constrain the
entry of new firms in the market, most studies have used data at industrial level as stated in
Cubero, (2010). Entry barriers for cotton marketing in Arbaminch zuria district were
licensing requirements, seasonality of cotton supply and policy issues which are discussed
in (Table 27) below.
Table 27: Market entry barriers
Variables Indicators Frequency Percentage Do you have license for cotton marketing?
Yes 6 23.1 No 20 76.9
Duration of undertaking business Year round 3 11.5 two months 23 88.5 Total 26 100
Aware of cotton marketing related government policy
Yes 1 3.8 No 25 96.2 Total 26 100
Source: Own computation, 2016.
As depicted in (Table 27) above 76.9% of sampled traders did not have cotton marketing
license. This indicates that licensing requirement did not impede new entrant for cotton
marketing. Furthermore, 88.5% of traders undertake, cotton marketing for only two
months (October to December), which was period of high cotton supply, but those small

58
quantity purchasers undertook the business throughout the year, which were only 11.5%
among surveyed cotton traders. This indicates that seasonality of cotton marketing hinders
new entrant to the business. Also 96.2% of sampled traders did not have awareness about
cotton related government policies. This indicates that having or not having awareness
about cotton marketing, government policies could not affect entry to cotton marketing in
Arbaminch zuria district negatively.
From all the above observed situations which are large HHI, information imperfection and
presence of some barriers to entry let cotton market structure to be classifies as oligopoly
market structure. Hence, cotton market in Arbaminch zuria district deviated from
competitive market norms.
4.5.2.2. Cotton Market Conduct
Market conduct refers to the patterns of behavior that traders and other market participants
adopt to affect or adjust to the markets in which they sell or buy. These include price setting
behavior, and buying and selling practices, weighing and trust among seller and buyers.
Table 28: Cotton marketing conduct elements
Variables Indicators Frequency percent Who set cotton price Traders 123 100 Do you grade your cotton No 123 100 Encounter problems in cotton marketing
Yes 26 100
If yes, what are the problems
Quality deterioration 24 92.3 Quality deterioration and supply shortage
2 7.7
Total 26 1000 Source: Own computation, 2016.
As indicated in (Table 28) above sampled cotton producing farmers reported that price for
cotton was determined by traders. However,100% sampled traders reported that they
encountered problems in cotton marketing and 92.3% of traders reported that cotton
producer farmers supply quality deteriorated cotton to the market. Field observation
indicates that there was cheat among cotton producer farmers and traders. Farmers
adulterate cotton with stones and soil and bring watered cotton to market to weigh high.
Traders also cheat farmers when they weigh cotton. Furthermore, 100% of sampled cotton
producer households reported absence of grading in cotton as a result they receive the same
price whether they brought quality cotton or not.
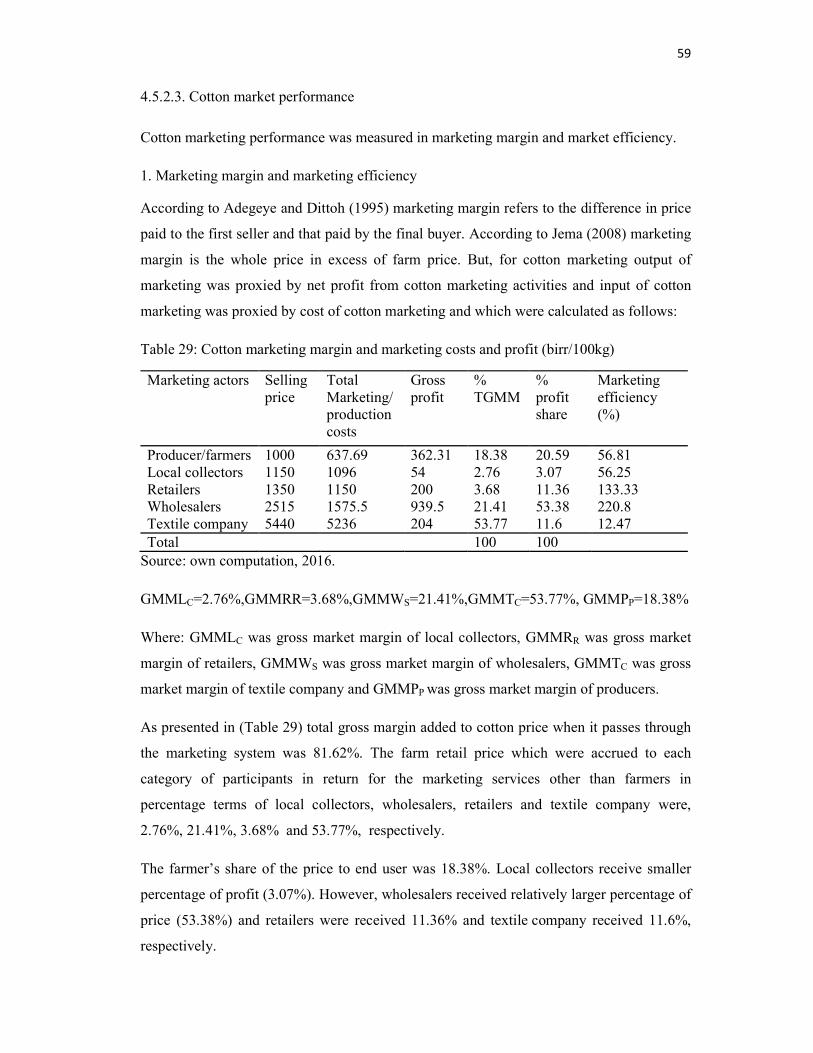
59
4.5.2.3. Cotton market performance
Cotton marketing performance was measured in marketing margin and market efficiency.
1. Marketing margin and marketing efficiency
According to Adegeye and Dittoh (1995) marketing margin refers to the difference in price
paid to the first seller and that paid by the final buyer. According to Jema (2008) marketing
margin is the whole price in excess of farm price. But, for cotton marketing output of
marketing was proxied by net profit from cotton marketing activities and input of cotton
marketing was proxied by cost of cotton marketing and which were calculated as follows:
Table 29: Cotton marketing margin and marketing costs and profit (birr/100kg)
Marketing actors Selling price
Total Marketing/production costs
Gross profit
% TGMM
% profit share
Marketing efficiency (%)
Producer/farmers 1000 637.69 362.31 18.38 20.59 56.81 Local collectors 1150 1096 54 2.76 3.07 56.25 Retailers 1350 1150 200 3.68 11.36 133.33 Wholesalers 2515 1575.5 939.5 21.41 53.38 220.8 Textile company 5440 5236 204 53.77 11.6 12.47 Total 100 100
Source: own computation, 2016.
GMMLC=2.76%,GMMRR=3.68%,GMMWS=21.41%,GMMTC=53.77%, GMMPP=18.38%
Where: GMMLC was gross market margin of local collectors, GMMRR was gross market
margin of retailers, GMMWS was gross market margin of wholesalers, GMMTC was gross
market margin of textile company and GMMPP was gross market margin of producers.
As presented in (Table 29) total gross margin added to cotton price when it passes through
the marketing system was 81.62%. The farm retail price which were accrued to each
category of participants in return for the marketing services other than farmers in
percentage terms of local collectors, wholesalers, retailers and textile company were,
2.76%, 21.41%, 3.68% and 53.77%, respectively.
The farmer’s share of the price to end user was 18.38%. Local collectors receive smaller
percentage of profit (3.07%). However, wholesalers received relatively larger percentage of
price (53.38%) and retailers were received 11.36% and textile company received 11.6%,
respectively.

60
According to Osondu et al. (2014), marketing efficiency ratio of 100% shows that the
market is perfectly efficient because price increment is just high enough to cover the cost of
marketing cotton. And also it shows a break-even point because the value addition
(marketing cost) is equal to the net profit obtained as a result of the value addition.
Marketing efficiency value below 100% is indicative of inefficiency; more is spent on
value addition compared to the margin received after value addition. According to
Scarborogh and Kydd (1992), marketing efficiency value that is greater than 100%
indicates excess profit for the marketers.
As presented in (Table 29) above wholesalers and retailers operate with marketing
efficiencies of 220.8% and 133.33% respectively. However, both the producers, local
collectors and textile company marketing were considered inefficient because their market
efficiency was below 100.
4.6. Econometric Results
Multiple linear regressions model analysis was used to identify factors affecting quantity
cotton supply to market. Before fitting multiple linear regressions, the hypothesized
explanatory variables were checked for existence of multicollinearity, hetroscedasticity and
endogeneity problem.
Test of multicollinearity: All VIF values are less than 10. This indicates absence of
serious multicollinearity problem among independent variables. If there is presence of
multicollinearity between independent variables, it is impossible to separate the effect of
each parameter estimate in the dependent variables (Appendix 1).
Test of heteroscedasticity: Since there is heteroscedasticity problem in the data set, the
parameter estimates of the coefficients of the independent variables cannot be BLUE.
Therefore, to overcome the problem, Robust OLS analysis with heteroscedasticity
consistent covariance matrix was estimated.
Test of endogeneity: When a variable is endogenous, it will be correlated with the disturba
nce term, hence violating the OLS assumptions and making our OLS estimates biased. Test
ing for endogeneity of productivity of cotton were carried out in the model using both
Hausman test and Durbin-Wu-Hausman (DWH) test and endogeneity problem were not
found in productivity variable in cotton. Hausman test result indicated that, the predicted
productivity was statistically insignificant with (p=0.1203) for cotton.

61
In the first stage of 2SLS method, regressions was run and analyzed using eleven
explanatory variables including instrumental variable and the result shows that, size of land
allocated to cotton, improved seed, extension contact and current year cotton price were
affects positively and significantly the productivity of cotton whereas cotton farming
experience affects negatively and significantly the productivity of cotton. Size of land
allocated to cotton production was used as instruments for productivity.
In second stage of 2SLS from hypothesized eleven explanatory variables six variables
productivity of cotton, cotton farming experience, distance from nearest market, use of
improved seed, frequency of extension contact and current year cotton price significantly
influence quantity of cotton supply to market. Therefore application of ordinary least
square (OLS) method of data analysis was found to be appropriate for the study (Appendix
1).
4.6.1. Factors Affecting Farm Household Level Cotton Supply to Market
Access to credit was omitted from the model because all interviewed cotton farming
households response was the same. Also access to market information was omitted from the
model because descriptive statistic result shows that absence of market information
variation among sampled cotton producer farmers was insignificant.
Dependant variable (Quantity of cotton supplied to market) was transformed to natural loga
rithmic form. The explanation on the effect of the significant explanatory variables is
discussed below.
Table 30: Factors affecting household level cotton supply to market
Quantity of cotton supplied to market (ln) Coefficient Std. Err. t-value
Sex of household head 0.012 0.833 0.014 Cotton farming experience -0.011*** 0.004 -2.75 Education level of households -0.045 0.076 -0.592 Land allocated to cotton in hectare 0.268*** 0.081 3.308 Number of ploughing aged oxen owned -0.030 0.037 -0.810 Use of improved seed 0.810*** 0.109 7.431 Active labor force engaged in cotton production 0.003 0.018 0.167 Extension contact 0.019** 0.008 2.375 Distance to nearest market -0.018** 0.008 -2.25 Lagged year price of cotton per kg 0.023 0.021 1.095 Current year cotton price 0.331*** 0.102 3.245 Productivity of cotton per hectare 0.103 0.081 1.271 Constant term (cons) -0.132 1.366 -0.096 Note: ***, **, *, significance at 1 %, 5 %, and 10 %, respectively.
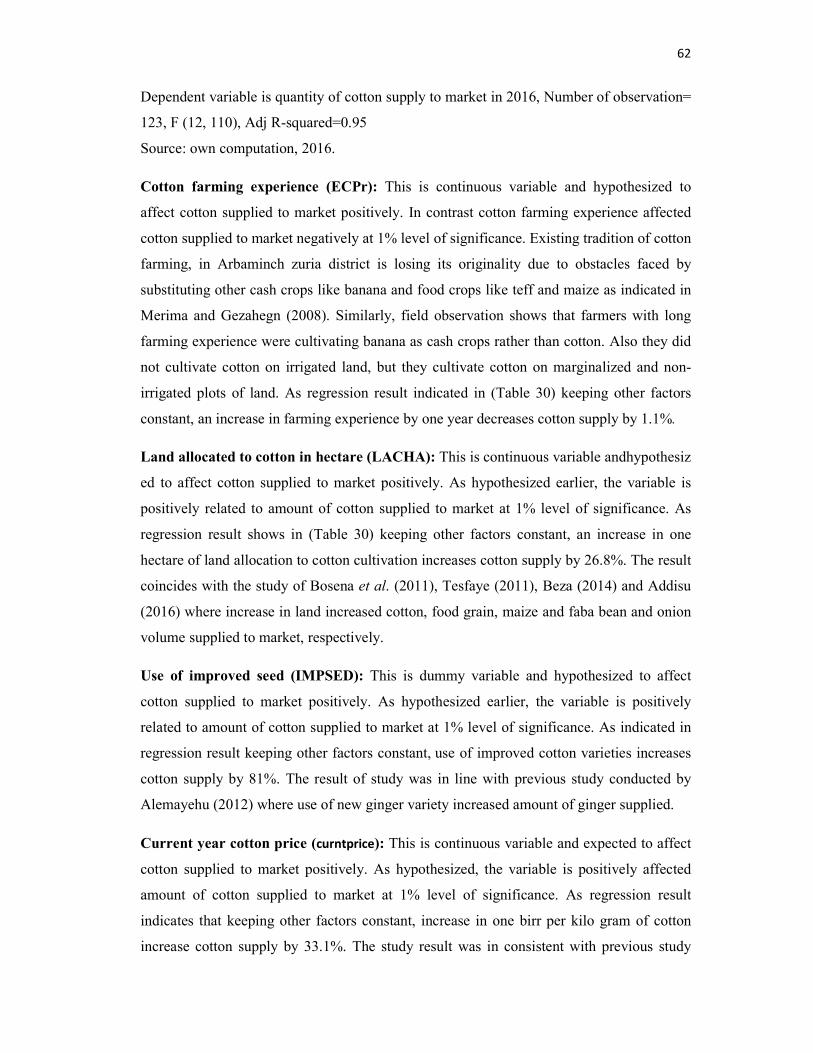
62
Dependent variable is quantity of cotton supply to market in 2016, Number of observation=
123, F (12, 110), Adj R-squared=0.95
Source: own computation, 2016.
Cotton farming experience (ECPr): This is continuous variable and hypothesized to
affect cotton supplied to market positively. In contrast cotton farming experience affected
cotton supplied to market negatively at 1% level of significance. Existing tradition of cotton
farming, in Arbaminch zuria district is losing its originality due to obstacles faced by
substituting other cash crops like banana and food crops like teff and maize as indicated in
Merima and Gezahegn (2008). Similarly, field observation shows that farmers with long
farming experience were cultivating banana as cash crops rather than cotton. Also they did
not cultivate cotton on irrigated land, but they cultivate cotton on marginalized and non-
irrigated plots of land. As regression result indicated in (Table 30) keeping other factors
constant, an increase in farming experience by one year decreases cotton supply by 1.1%.
Land allocated to cotton in hectare (LACHA): This is continuous variable andhypothesiz
ed to affect cotton supplied to market positively. As hypothesized earlier, the variable is
positively related to amount of cotton supplied to market at 1% level of significance. As
regression result shows in (Table 30) keeping other factors constant, an increase in one
hectare of land allocation to cotton cultivation increases cotton supply by 26.8%. The result
coincides with the study of Bosena et al. (2011), Tesfaye (2011), Beza (2014) and Addisu
(2016) where increase in land increased cotton, food grain, maize and faba bean and onion
volume supplied to market, respectively.
Use of improved seed (IMPSED): This is dummy variable and hypothesized to affect
cotton supplied to market positively. As hypothesized earlier, the variable is positively
related to amount of cotton supplied to market at 1% level of significance. As indicated in
regression result keeping other factors constant, use of improved cotton varieties increases
cotton supply by 81%. The result of study was in line with previous study conducted by
Alemayehu (2012) where use of new ginger variety increased amount of ginger supplied.
Current year cotton price (curntprice): This is continuous variable and expected to affect
cotton supplied to market positively. As hypothesized, the variable is positively affected
amount of cotton supplied to market at 1% level of significance. As regression result
indicates that keeping other factors constant, increase in one birr per kilo gram of cotton
increase cotton supply by 33.1%. The study result was in consistent with previous study

63
conducted by Alemnew (2010), Mebrat (2014) and Wendmagegn (2014), where increase in
one birr increased red pepper, tomato and coffee quantity supplied to market, respectively.
Extension contact (NEXC): This is continuous variable and expected to affect quantity of
cotton supply positively. As expected, number of extension contact positively affected the
amount of cotton supplied to market at 5% level of significance. As regression result
indicates keeping other factors constant, an increase in extension contact per production
year increases cotton supply by 1.9%. This result was in confirmation with the study
conducted by Ayelech (2011), Mohammed (2011), Wendmagegn (2014) and Bizualem et
al. (2015) where increase in unit of contact with extension increased mango, teff and wheat
and coffee quantity supplied to market, respectively.
Distance to nearest market (DtNM): This is continuous variable and expected to affect
quantity of cotton supply to market negatively. As hypothesized, the variable is negatively
related to amount of cotton supplied to market at 5% level of significance. Thus, regression
result shows that keeping other factors constant, an increase in one kilo meter far away
from nearest market decreases cotton supply to market by 1.8%. The result of study was in
consistent with previous study conducted by Mohammed (2012), Mebrat (2014), Wendmag
egn(2014),Yimer (2015), where increase in one kilometer, decreased coffee, tomato, and
fruit quantity supplied to market, respectively.
4.7. Challenges and Opportunities of Actors along Cotton Value Chain
4.7.1. Cotton Production Opportunities
High potential for increased cotton yields there is suitable climate and access to irrigation
water in cotton producing kebeles of Arbaminch zuria district if cotton producing farmers
produced cotton by irrigation. According to Ethiopian Agricultural Research Institute,
directory of released crop variety (2004), cotton yields high when it is cultivated in
irrigation than rain fed. There is long existing tradition of cotton farming, in the study area
according to Merima and Gezahegn (2008) once in history Arbaminch zuria district was
called the cotton belt in Ethiopia. This implies that promotion of new varieties and
agronomic practice will not take time and energy. Also there are governmental (Arbaminch
plant health clinic) and non-government organization (IPM) working with cotton producing
farmers to help them to produce organic cotton using non-chemical pesticides controlling
mechanism. Existence of basic infrastructures like all-weather road, telecommunication and

64
market access help cotton producing farmers to engage in cotton production and to create
market linkage.
4.7.2. Cotton Production Challenges
There is long existing tradition of cotton farming in Arbaminch Zuria district, but now the
area is losing its originality due to obstacles faced by substituting other cash crops like
banana and food crops like teff and maize. Because cotton harvesting requires a lot of
investment and intensive care throughout its cultivation period, there is a trend to shift from
cotton to other less time and money consuming and less risky cash crops. Also dependence
on small-scale, non-irrigated and traditional cotton production system as an industrial crop
and susceptible to many pest attach, cotton needs high care and improved production
technology. Lack of access to new and improved cotton varieties, resulted in limited
investment in the supply of new and improved varieties to enhance productivity. Only one
improved cotton variety, Deltapine-90, which was released in 1989, was known in the
Arbaminch Zuria district. These have lead farmers to access seeds from open market which
is not certified, and tested. Also there is no cotton crop failure insurance in the study area.
4.7.3. Cotton Marketing Opportunities
Cotton marketing opportunities of Arbaminch Zuria district are: increased market demand
for cotton; presence of experienced handlooms or weavers in Arbaminch town, Chencha
town and in the rural kebeles as well. Also there is increased demand of cottage industry
products by both foreigners (tourists) and local peoples. These might lead demand of cotton
high. Proximity to and existence of textile factories nearby and establishment of industrial
park at Hawassa town and access to key market and main roads connecting to Addis Ababa
are some of existing and coming cotton marketing and production opportunities of
Arbaminch Zuria district.
4.7.4. Cotton Marketing Challenges
Cotton producer farmers harvest and supply cotton within similar period, cotton become
excess during October and December as compared to demand leading to lower producer pri
ce associated with cotton bulkiness, color change, spoilage and seasonality in production.
Moreover, weight cheat was a common practice and market power was taken by the traders.
Cotton producer farmers adulterate cotton by adding water and course-soil with cotton.

65
5. SUMMARY, CONCLUSION AND RECOMMENDATIONS
5.1. Summary and Conclusion
Major functions of cotton value chain actors in Arbaminch zuria district include input
supply, raw seed cotton production, trading raw seed cotton and cotton products, processing
of raw seed cotton to transform into different products and consumption.
Value addition was undertaken when cotton goes through different chain actors. In
Arbaminch zuria district cotton producer farmers on average added or cost 637.69 birr per
100 kg raw cotton and acquire 362.31 birr per 100 kg gross profit. Local collectors cost
1096 birr per 100 kg and get gross profit of 54 birr per 100 kg. On average wholesalers cost
1575.5 birr per 100 kg and get gross profit of 939.5 birr per 100 kg of cotton. Textile
factory add 5236 birr including lint cost to transform 100 kg cotton lint in to yarn and
fabrics and get gross profit of 204 birr per 100 kg lint. Sampled cottage level weavers
produces netela, kemis, bulliko, algalibis, gabi, scarf, dinguza and cap from cotton. On
average weavers add 9850 birr per 100 kg of cotton and make gross profit of 3753.33 birr
per 100 kg of items they produced.
Cotton marketing structure-conduct and performance of Arbaminch zuria district were
identified. Structure of cotton marketing was characterized using the following indicators:
market concentration, the degree of transparency (market information) and entry conditions
(licensing, seasonality of business and policy barriers). To measure market concentration
HHI was used and its value was 0.553, which shows that cotton marketing was highly
concentrated on hands of few in Arbaminch zuria district. Among sampled households only
11.39% gather market information from traders and 22.76% gathers information from both
farmers and traders. This shows that market information (demand, supply, pricing and other
information) sharing among cotton traders and cotton producing farmers were weak.
Among total sampled traders 96.15% share information about producer price and only
3.85% shared about retailer price. Furthermore, 92.3% of traders not collaborate with each
other. This indicates that information sharing as well as collaboration among cotton traders
in Arbaminch zuria district was weak. Thus, large HHI, information imperfection and
presence of some barriers to entry let cotton market structure to be classifies as oligopoly
market structure. Hence, cotton market in Arbaminch zuria district deviated from
competitive market norms.

66
Market conduct refers to the patterns of behavior that traders and other market participants
adopt to affect or adjust to the markets in which they sell or buy. These include price
setting behavior, and buying and selling practices, weighing and trust among seller and
buyers. Cotton producing farmers reported that price for cotton was determined by traders,
however 100% sampled traders reported that they encountered problems in cotton
marketing and 92.3% of sampled traders reported that cotton producer farmers supply
quality deteriorated cotton to the market. Field observation indicated that there was cheat
among cotton producer farmers and traders. Farmers adulterate cotton with stones and soil
and bring watered cotton to market to weigh high, while traders cheat farmers when they
weigh cotton.
Cotton marketing performance was measured in marketing margin and market efficiency.
Total gross margin added to cotton price when it passes through the marketing system was
81.62%. The farmer’s share of the price to end user was 20.59%. Local collectors receive
smaller percentage of profit (3.07%). However, wholesalers received relatively larger
percentage of profit (53.38%) and retailers received 11.36% and textile company received
11.6%, respectively. Among Arbaminch zuria district cotton marketing participants’ only
wholesalers and retailers cotton marketing shows presence of excess profit, which was
220.8% and 133.33% respectively. However, smallholder cotton producer farmers, local
collectors and textile company were considered inefficient because their market efficiency
was below 100.
High potential for increased cotton yields, long existing tradition of cotton farming,
governmental and non-government organization support and existence of basic
infrastructures were seen as cotton production opportunities while substituting cotton by
other cash crops like banana and food crops like teff and maize, dependence on small-scale,
non-irrigated and traditional cotton production system, lack of access to new and improved
cotton varieties and absence of cotton crop failure insurance were seen as cotton production
related challenges of Arbaminch zuria district.
Increased market demand for cotton, proximity to and existence of textile factories nearby,
establishment of industrial park at Hawassa town and access to key market and main roads
connecting to Addis Abeba and Hawassa were seen as cotton marketing opportunities while
production of cotton at the same time and the supplying it with in similar period, bulkiness,
67
color change, spoilage, seasonality of cotton, weight cheat and quality adulteration were
seen as cotton marketing challenges of Arbaminch zuria district.
Among twelve variables included in multiple linear regression, six variables, namely;
cotton farming experience, land allocated to cotton in hectare, use of improved seed, and
current year cotton price were found to be significant at 1% significance level. Also number
of extension contact and distance to nearest market were found to be significant at 5%
significance level.
5.2. Recommendations
Based on result of this study, the following recommendations were made.
Agricultural offices, Universities and research institutions should pay attention for
provision of improved, high yielding and diseases resistant cotton varieties because shows
that majority of sampled households were not use improved cotton varieties. Good
production, productivity and sustainability of cotton production requires the presence of
good extension services, seed supply and quality inputs.
Land use plans and resource allocation system of cotton producers’ farmers need to be
monitored. Agricultural offices should create awareness among farmers to delegate
appropriate land for cotton and to produce in irrigation as of other crops.
National and regional governments may pay attention for not only for establishment of new
industry parks, but also strengthen the existing textile factories to he help them to absorb
quantities of cotton produced by cotton producer farmers.
Agriculture and natural resource offices, trade and industry offices should work for the
regulation and implementation of cotton price tariffs and production related polices. At
national level price of cotton was determined by Minster of Agriculture, Minister of
Industry, Minster of Trade and Textile Industry Development Institute, but in the case of
Arbaminch zuria District wholesalers were determining cotton price which not benefiting
all chain actors equally.
Zonal and District Agriculture and Natural Resource Offices should strengthen provision of
sustainable knowledge based extension service and improved inputs for cotton producer
farmers because investment on cotton input was not significant and increase extension
contact increases quantity of cotton supply.

68
Cotton value chain should be developed in the study area survey result shows that only
wholesalers and retailers marketing system was efficient and marketing extra benefits,
while other chain actors were not. Value development has power to alleviate cheat and
quality adulteration among chain actors and build trust within chain actors.

69
6. REFERENCES
Abay Akalu.2007. Vegetable Market Chain Analysis: The Case of Fogera Woreda. MSc
Thesis, Haramaya University, Haramaya, Ethiopia.
Abbott, J.C. and Makeham, J.P.1981. Agricultural Economics and Marketing in the
Tropics. Wing Tai Cheung Printing Co. Ltd, Rome.
Abbott, J.C., and J.P. Makeham.1979. Agricultural Economics and Marketing in Tropics.
Wingtai Cheung Cot.Ltd, Rome.
Abott, J.C.1979. Marketing Issues in Agricultural Development Planning. In: R. Moyer and
S. Hollander (eds). Markets and Marketing in Developing Economics, Richard D.
Irwin, Publishers.
Addisu Hailu. 2016. Value Chain Analysis of Vegetables: The Case of Ejere District, West
Shoa Zone, Oromia National Regional State of Ethiopia. MSc Thesis, Haramaya
University, Haramaya, Ethiopia.
Adegeye, A. and Dittoh, J. 1985. Essentials of Agricultural Economic. Impact Publisher,
Ibadan, Nigeria Ltd.
Adeniji, O, Adebayo, C. and Ajayi, O. 2012. Analysis of Marketing Margin of Yam in
selected Rural Areas of Niger State, Nigeria. Basic Research Journal of
Agricultural Science and Review.
Adugna Gessesse. 2009. Analysis of Fruit and Vegetable Market Chains in Alamata,
Southern Zone of Tigray: The Case of Onion, Tomato and Papaya. MSc Thesis,
Haramaya University, Haramaya, Ethiopia.
African Development Bank Group. 2014. Promoting Technology, Innovation, Productivity
and Linkages, Ethiopia Country Report.
Agete Jerena. 2014. Analysis of Factors Influencing Participation of Smallholder Farmers
In Red Bean Marketing In Halaba Special District, Ethiopia, MSc Thesis,
University of Nairobi, Nairobi, Kenya.
Agridev Consult. 2004. Cotton-Textile-Apparel Value Chain Report for Ethiopia. Regional
Agricultural Trade Expansion Support Program, Nairobi, Kenya.
Alemayehu Asale. 2012. Analysis of Production and Market Channel of Ginger: The Case
of Boloso Bombe and Kindo Koisha Woredas of Wolaita Zone. MSc Thesis,
Haramaya University, Haramaya, Ethiopia.

70
Alemnew Abay. 2010. Market Chain Analysis of Red Pepper: The Case of Bure Woreda,
West Gojjam Zone, Amhara National Regional State, Ethiopia. MSc Thesis,
Haramaya University, Haramaya, Ethiopia.
Almekinders, C. and Louwaars N. P. 2008. Supporting Farmers in Maintaining and
Selecting Seeds of Local Varieties. Wageningen International. Wageningen.
Ana Cubero. 2010. Barriers to Competition: The Evolution of the Debate, London
Peckering and Chatto.
Andargachew Kebede. 1990. Sheep Marketing in the Central Highlands of Ethiopia. MSc
Thesis, Haramaya University, Haramaya, Ethiopia.
AZWANRMO (Arbaminch Zuria Woreda Agriculture and Natural Resource Management
Office). 2015. Growth and Transformation Plan I performance evaluation annual
report submitted to Gamo Gofa zone Agricultural Department, Arbaminch, Ethiopia
AZWFEDO (Arbaminch Zuria Woreda Finance and Economic Development Office).
2015.Growth and Transformation Plan I evaluation annual report submitted to
Gamo Gofa zone Finance and Economic Department, Arbaminch, Ethiopia.
Ayelech Tadesse. 2011. Market Chain Analysis of Fruits for Gomma Woreda, Jimma Zone,
Oromia Regional State. MSc Thesis, Haramaya University, Haramaya, Ethiopia.
Bain, J. S.1968. Industrial Organization. 2nd Edition, John Wiley and Sons, New York.
Bammann, H. 2007. Participatory Value Chain Analysis for Improved Farmer Incomes,
Employment Opportunities and Food Security. Pacific Economic Bulletin. Volume
22 Number 3.
Berihu Assefa, Mezgebe Mihretu and Alebel Weldesilassie. 2015. Value Chain Analyses
for a Climate Resilient Production of Cotton and Sugarcane Commodities in
Ethiopia. Research Report Submitted to Ethiopian Development Research Institute
(EDRI.), Addis Ababa, Ethiopia.
Beza Erko. 2014. Maize and Faba Bean Value Chains: The Case of BakoTibe and Gobu
Seyo Districts in Central Western Ethiopia. MSc Thesis, Haramaya University,
Haramaya, Ethiopia.
Bikker JA, Haaf K. 2002. Measures of competition and concentration in the banking
industry: A review of the literature. Economic & Financial Modeling.
Bizualem Assefa, Degye Goshu and Zekarias Shumeta. 2015. Analysis of marketed
Surplus of Coffee by Smallholder Farmers in Jimma Zone, Ethiopia. Journal of
Biology, Agriculture and Healthcare. ISSN 2224-3208.

71
Bosena Tegegne. 2008. Cotton Market Chain Analysis: The Case of Metema Woreda,
North Gondar Zone, Amhara National Regional State. MSc Thesis, Haramaya
University, Haramaya, Ethiopia.
Bosena Tegegne, Fikadu Bekabil, G. Berhanu and H. Dirk. 2011. Factors Affecting Cotton
Supply at the Farm Level in Metema District of Ethiopia. Journal of Agriculture,
Biotechnology & Ecology, 4(1):41-51. ISSN: 2006-3938.
Calkins S.1983.The new merger guidelines and the Herfindahl-Hirschman Index. California
Law Review.Available:http://scholarship.law.berkeley.edu/cgi/viewcontent.cgi.
Central Statistical Agency.2010/2011.Large and Medium Scale Commercial Farms Sample
Survey, volume III, Statistical Bulletin 505. Addis Ababa, Ethiopia.
Clodius, R. L. and W. F. Muller.1961. Market Structure Analysis as an Orientation for
Research in Agricultural Economics. Journal of Farm Economics.
Compecon Limited. 2002. Measuring Market Concentration. Resource available online At
Http://En.Org/ Herfindahl- Index
Cramer, G. L. and Jensen, W.1982.Agricultural Economics and Agribusiness, 2nd Edition.
McGraw Hill Book Company, USA.
Dagmawit Giref. 2016. Maize Value Chain Analysis in South Achefer and Jabitehnan
Districts of Amhara Region, Ethiopia. MSc Thesis, Haramaya University,
Haramaya, Ethiopia.
Dawit Alemu. 2005. The status and challenges of Agricultural marketing. Paper presented
at panel discussion of EAAP, April, 2005. EARI, Addis Ababa, Ethiopia.
Demissie Mekuria. 2008. Structure, conduct and performance of marketing chains: The
case of milk marketing among pastoralists and agro-pastoralists of Eastern Ethiopia,
Global Journal of Agricultural Economics, Extension and Rural Development.
Enida Pulaj and Vasilika Kume.2013.Measuring Market Concentration of Construction
Industry. Vlora Region Evidence. European Scientific Journal. November 2013
Vol.9, Issn:1857– 7881.
Ethiopian Agricultural Research Institute. 2014. Directory of Released Crop Varieties &
Their Recommended Cultural Practices, Addis Abeba, Ethiopia.
EDRI (Ethiopian Development Research Institute). 2014. Institutional Assessment of the
Cotton and Sugarcane Commodities in Ethiopia: The climate change perspective.
Addis Ababa, Ethiopia.
EIA (Ethiopian Investment Agency). 2012. Investment Opportunity Profile for Cotton
Production and Ginning in Ethiopia. Addis Ababa, Ethiopia.
72
FAO.1984. Ethiopian Geomorphology and Soils. Assistance to Land Use Planning. Addis
Ababa, Ethiopia.
FAO. 2006a. Analytical tools Module 043 Commodity Chain Analysis. Constructing the
Commodity Chain, Functional Analysis and Flow Charts. On-line Resource
Materials for Policy Making.
FAO. 2006b. Analytical tools Module 044 Commodity Chain Analysis. Financial Analysis.
On-line Resource Materials for Policy Making.
FAO . 2006c. Analytical tools Module 045 Commodity Chain Analysis. Impact Analysis
Using Market Prices. On-line Resource Materials for Policy Making.
FAO. 2012. Ethiopia Country Programming Framework, working paper 2012-1015, Addis
Ababa, Ethiopia.
FIAS. 2007. Moving Toward Competitiveness: A Value Chain Approach. The Investment
Climate Advisory Service. Washington, D.C. April 2007.
Gashahun Kelemework. 2015. White Pea Bean (Phaseolus Vulgaris L.) Value Chain
Analysis: The Case of Adami Tulu Jido Kombolcha District, Eastern Shewa Zone,
Oromia National Regional State. MSc Thesis, Haramaya University, Haramaya,
Ethiopia.
Gebreselassie Sehilu, Ludi, E. 2008. Agricultural Commercialization in Coffee Growing
Areas of Ethiopia, Future Agriculture, University of Sussex, Brighton, UK.
Gereffi, G. 1994a. Capitalism, Development, and Global Commodity Chains, in Capitalism
and Development, edited by Leslie Sklair (1994), London: Routledge.
Gereffi, G.1994b. The Organization of Buyer-driven Global Commodity Chains: How U.S.
Retailers Shape Overseas Production Networks in Commodity Chains and Global
Capitalism.
Gereffi, G. 2002. Outsourcing and Changing Patterns of International Competition in the
Apparel Commodity Chain, Paper presented at the conference on Responding to
Globalization: Societies, Groups, and Individuals. Boulder, Colorado.
Gereffi, G., Humphrey, J. and T. Sturgeon. 2003. The Governance of Global Value Chains,
Review of International Political Economy, vol. 12 no.1.
Getachew Beshargo. 2002. Cattle Marketing in Western Shewa. MSc Thesis, Haramaya
University, Haramaya, Ethiopia.
Gichangi, A. W. 2010. Analysis of Structure, Conduct and Performance of Sweet
Potato Marketing: The Case of Nairobi and Kisumu, Kenya. MSc Thesis Egerton
University, Egerton, Kenya.
73
Growth and Transformation Plan I. 2010. Ministry of Finance and Economic Development.
Addis Ababa, Ethiopia.
Gujarati, D.N. 2003. Basic Econometrics. 4th Edition. McGraw-Hill, New York.
Hall, M., and Tideman, N. 1967. Measures of Concentration. Journal of The American
Statistical Association, 62: 162-168.
Hannaford, S. 2007. Market domination. The Impact of Industry Consolidation on
Competition, Innovation, and Consumer Choice, Praeger Publishers.
Hannan T.H. 1997. Market Share Inequality, the Number of Competitors and the HHI: An
Examination of Bank Pricing. Review of Industrial Organization.
Harriss, B. 1993. Measuring Agricultural Performance in Agricultural and Food Marketing
in Developing Countries. Trowbridge Wittshire: Redwood Book Limited.
Hudson, Julie and Spring, Christofer.1995. North African Textiles. London: British
Museum Press.
ICAC (International Cotton Advisory Committee). 2014. Review of the World cotton
Situation. Volume 67 - Number 6.
Isibor, A. C. and Ugwumba, C. O. A. 2014. Analysis of Watermelon (Citrullus lanatus)
Marketing in Nnewi Metropolis of Anambra State, Nigeria. Journal of Sciences and
Multidisciplinary Research.
Islam, M.S., Miah, T.H. and Haque, M. M. 2001. Marketing System of Marine Fish in
Bangladesh. Bangladesh Journal of Agricultural economics.
Jema Haji. 2008. Economic Efficiency and Marketing Performance of Vegetable
Production in the Eastern and Central Parts of Ethiopia. Doctorial Dissertation,
Swedish University, Uppsala.
Johann du Pisanie. 2013. Concentration Measures as an Element in Testing the Structure-
Conduct-Performance Paradigm. Economic Research Southern Africa Working
Paper 345.
Jonathan Mitchell, Christopher Coles and Jodie Keane. 2009. Upgrading along Value
Chains: Strategies for Poverty Reduction in Latin America. Briefing Paper
Kaplinsky, R. 2000. Globalisation and Unequalisation: What Can be Learnt from Global
Value Chain Analysis? Journal of Development Studies, 37( 2).
Kaplinsky, R. and Morris, M. 2002. Handbook for Value Chain Research. Available at
http://www.ids.ac.uk/ids/global/pdfs/VchNov01.pdf.

74
Kaplinsky, R.1998. Globalisation, Industrialisation and Sustainable Growth: the Pursuit of
the Nth Rent. IDS Discussion Paper 365, Institute of Development Studies, 1998
ISBN 1858642256.
Kizito A. 2008. Famine Early Warning Systems Network Market Guidance No.2.
Structure, Conduct and Performance and Food Security.
Kohl’s, R.L. and J.N. Uhl.1985. Marketing of agricultural products. 6th Edition. Macmillan
Publishing Company, New York.
Kotler, P. and Armstrong, G. 2007. Principle of Marketing 12th Edition. Vol 1, S.Chand &
Company Ltd. New Delhi.
M. Kanyenga and J.H. Mangisoni. 2007. Assessing Market Concentration in the Tobacco
Industry of Malawi.
Margrath, P. 1992. Methodologies for Studying Agricultural marketing in developing
Countries. Marketing series 2, Chart ham, UK: Natural resource Institute.
Maimouna, T. and Jing, W. 2013. Marketing Margin Analysis of Tomato in the District of
Bamako, Republic of Mali. Journal of Agricultural Economics and Development.
Marshal Negussie. 2011. Value Chain Analysis of Sugarcane: The Case of Kalu district,
South Wollo Zone of Amhara National Regional State, Ethiopia. MSc. Thesis
Haramaya University, Ethiopia.
Maurizio Naldi and Marta Flamini. 2014. The CR4 Index and the Interval Estimation of the
Herfindahl-Hirschman Index: An Empirical Comparison. <hal-01008144>
McCormick, D. and Schmitz, H. 2001. Manual for Value Chain Research on Home workers
in the Garment Industry.
Mebrat Tola. 2014. Tomato Value Chain Analysis in the Central Rift Valley: The Case of
Dugda Woreda, East Shoa Zone, Oromia National Regional State, Ethiopia. MSc
Thesis, Haramaya University, Haramaya, Ethiopia.
Meijer, P.W.M. 1994. The Function of Maize Market in Benin. Bert Broundjin, Benin.
Mendoza, G.1995. Primer on marketing channels and margins. analyzing agricultural
markets in developing countries. Lynne Rienner Publishers, Boulder, London.
Mengistu Akalu. 2010. Improving Market Access and Income of Small-Scale Beekeepers
Through Value Chain Analysis: A case Study from Gera District in South West of
Ethiopia. MSc Thesis, Copenhagen University, Copenhagen, Denmark.
Merima Abudullahi and Gezahegn Ayele. 2008. Agri-Chain Analysis of Cotton Sub-Sector
in Ethiopia. Research Report Submitted to Ethiopian Development Research
Institute Addis Abeba, Ethiopia.

75
Meryem Kuru. 2013. Analysis of Cow Milk Market Chain: The case of Sululta District,
Oromia Special Zone. MSc Thesis, Haramaya University, Haramaya, Ethiopia.
Mestewat Simeon. 2014. Geographic Information System and Remote Sensing Based
Malaria Risk Mapping Using Environmental Factors: The Case of Arbaminch Zuria
Woreda. MSc Thesis, Addis Ababa University, Addis Ababa, Ethiopia.
Meyer-Stamer, J. 2004. Regional Value Chain Initiatives: An Opportunity for the
Application of the PACA-Approach Mesopartner, working paper 06 / 2004.
MoANR (Ministry of Agriculture and Natural Resource) 2004. Market Oriented
Development Master Plan for Cotton in Ethiopia. Addis Ababa, Ethiopia.
Mohammed Hassano. 2012. Coffee Value Chain Analysis: The case of Nebso district, West
Arsi zone, Oromia Region, Ethiopia. MSc Thesis, Haramaya University, Haramaya,
Ethiopia.
Mohammed Urgessa. 2011. Market Chain Analysis of Teff and Wheat Production in
Halaba Special Woreda, Southern Ethiopia. MSc Thesis, Haramaya University,
Haramaya, Ethiopia.
Muluken Marye. 2014. Value Chain Analysis of Fruits for Debub Bench Woreda, Bench
Maji Zone, SNNPR. MA Thesis, Mekele University, Mekele, Ethiopia.
Naldi M, and Flamini M. 2014. The CR4 Index and the Interval Estimation of the
Herfindahl-Hirschman Index: An Empirical Comparison.
Ojogho, O., Erhabor, P. O., Emokaro, C. O. and Ahmadu, J. 2012. Marketing Margin and
Price Transmission Analysis for Beef in Benin Metropolis. International Journal of
Agricultural Economics and Rural Development.
Olukosi J.O., Isitor, S. U. and Ode, M. O. 2005.Introduction to Agricultural Marketing and
Prices: Principles and Applications. Living Books Series, G.U. Publications, Abuja,
Nigeria.
Osondu. K., Nwadike, F. C.,Ijioma, J. C., Udah, S.C. and Ugboaja, C .I. 2014. Marketing
Performance of Salad Vegetables: The Case of Cabbage Marketing in Abia State,
Nigeria. International Journal of Agricultural Science, Research and Technology in
Extension and Education Systems.
Pehlivanoğlu F, Tiftikçigil. 2013. A Concentration Analysis in the Turkish Iron-steel and
Metal Industry. International Journal of Economic Practices and Theories.3(3):152
-167.
PAN-UK (Pest Action Network). 2014. Cotton farmers do better with IPM in Arbaminch,
Ethiopia. Research report submitted to Alliance for Food Sovereignty in Africa.

76
Pomeroy, R.S., and A.C. Trinidad.1995. Industrial Organization and Market Analysis:
Analyzing Agricultural Markets in Developing Countries. Lynner Reinner publishe,
Boulder, London.
Porter, M. 1985. Competitive Advantage, London: Macmillan.
Porter, M. 1990. The Competitive Advantage of Nations. New York Press.
Prouty and Rosenfeld.E. 1982. Historical Dictionary of Ethiopia, London: The London:
British Museum
Rehima Mussema. 2006. Analysis of Red Pepper Marketing: The Case of Halaba and Silti
in SNNPRS of Ethiopia. MSc Thesis, Haramaya University, Haramaya, Ethiopia.
Roduner. D. 2005. Value-Chains and What is the Role of Development Agencies in Value
Chain Development in Developing Countries? Rural Development News Informatio
n magazine.
Rudenko and J.P.A. Lamers. 2006. The Comparative Advantages of the Present and Future
Payment Structure for Agricultural Producers in Uzbekistan, Central Asian Journal
of Management, Economics and Social Research. 5(2),
Rudenko. 2008. Value Chains for Rural and Regional Development: The Case of Cotton,
Wheat, Fruit and Vegetable Value Chains in the Lower Reaches of the Amu Darya
River, Uzbekistan.
Scarborough, V. and J. Kydd. 1992. Economic Analysis of Agricultural Markets. A Manual
of Marketing Series 5, Chatham, UK: Natural Resource Institute.
Schmitz, H. 1999. Local Upgrading in Global Chains. Note for IDS Workshop “Spreading
the Gains from Globalization”, September 1999.
Scott, G.J. 1995. Prices, Products and People: Analyzing Agricultural Markets in
Developing Countries. Lynne Reinner Publishers, Boulder, London.
Sturgeon, T. 2001. How Do We Define Value Chains and Production Networks? Industrial
Performance Centre, Massachusetts Institute of Technology. IDS Bulletin, 32,(3).
Tesfaye Kumbi, 2011. Household Food Insecurity in Dodata-Sire district, Arsi zone:
Coping Strategies and Policy Options. MSc Thesis Haramaya University, Ethiopia.
Tomek, W.G., and K.L., Robinson.1990. Agricultural product prices. 3rd Edition. Comel
University Press, London.
Townsend T. 2010. Report of the Executive Director to the 69th Plenary Meeting of the
International Cotton Advisory Committee Lubbock, USA September, 2010 ICAC:
Washington DC.

77
Traidcraft Policy Unit. 2011. Cottonseed Supply for Planting in Africa: A study into the
functioning of current structures for research, breeding, multiplication and
distribution and their impacts on cotton farmers.
Trienekens, J.H., B. Petersen, N. Wognum, and D. Brinkmann. 2009. European Pork
Chains; Consumer-oriented Production and Distribution. The Netherlands:
Wageningen Academic Publishers.
Trienekens. 2011. Agricultural Value Chains in Developing Countries A Framework for
Analysis, International Food and Agribusiness Management Review. 14(2), Issue 2.
U.S.Department of Justice and Federal Trade Commission.2010. Horizontal Merger
Guideline.Washington.DC.Available:https://www.ftc.gov/sites/default/files/attachm
ents/mergerreview/100819hmg.
Umar, H .Y. 2006. Economic Analysis of Gum Arabic Marketing in Nigeria. A Case Study
United Nation Industrial Development Organization programme for Country
partnership.
Wendmagegn Belete. 2014. Market Chain Analysis of Coffee in Dale District of Southern
Ethiopia. MSc Thesis, Haramaya University, Haramaya, Ethiopia.
Wisdom Madede Nzima, Joseph Dzanja, Bonnet Kamwana. 2014. Structure, Conduct and
Performance of Groundnuts Markets in Northern and Central Malawi: Case Studies
of Mzimba and Kasungu Districts, International Journal of Business and Social
Science, 5 (6).
Yamane Taro. 1967. Statistics: An Introductory Analysis, 2nd Edition, New York: Harper
and Row.
Yimer Ayalew. 2015. Factors Affecting Fruit Supply In The Market: The Case of Habru
Woreda, North Wollo, Ethiopia. European Journal of Business and Management,
ISSN 2222-1905, 7 (4) 2015.
Zekarias Shumeta, Kaba Urgessa and Zerihun Kebebew. 2012. Analysis of Market Chains
of Forest Coffee in South West Ethiopia. Academic Journal of Plant Science, 5 (2):
ISSN 28-39.
Zerihun Desalegn.2015. Ethiopian Cotton Textile Value Chain Development. Report submi
tted to 12th Southern and Eastern Africa Cotton Forum (SEACF) Symposium, June
2015. Maputo, Mozambique

78
7. APPENDICES

79
Figures in Appendix 1: Statistical Test Results
a. Variance inflation factor (VIF)test
Variable VIF 1/VIF Number of oxen Owned(NOO) 3.08 0.324563 Active labor force aged 14 to 64 years 3.03 0.330289 Extension contact (NEXC) 2.42 0.412678 Distance to nearest market (DtNM) 2.36 0.423371 Experience in cotton production(ECPr) 2.19 0.457390 Improved seed used (IMPSED) 2.07 0.482320 Sex of house hold head (SHHH) 2.00 0.500558 Education level of household head (ELHHH) 1.99 0.501535 Current year Price of cotton(curntprice) 1.92 0.520798 Land allocated for cotton (LAC_HA) 1.91 0.523730 Productivity of cotton per hectare(QCP_HA_in kg) 1.14 0.874643 Lagged Price of cotton (LYRCPR) 1.12 0.890837 Mean VIF 2.10
b. Endogeneity Test Result
Fist-stage least square regression result
Productivity of cotton per hectare in kilogram Coefficients Std. Err. t Sex of household head 1.360265 20.63365 0.07 Cotton farming experience -1.5376* .8524457 -1.80 Education level 6.809634 20.92315 0.33 Number of oxen owned 5.583511 17.53474 0.32 Use of improved seed 44.1003* 21.93721 2.01 Active labor force age14_64 7.263237 4.555712 1.59 Extension contact 10.58821** 5.672872 1.87 Distance to nearst market .3771945 3.634553 0.10 Lagged year cotton price -11.8651 11.59806 -1.02 Current year cotton price 34.65711** 19.4038 1.79 Land allocated to cotton 395.734*** 61.6528 6.42 constant 322.1523 187.8611 1.71 Number of observation=123, F(11,111)=124.73, Adj R-squared=0.917
estat endog
Ho: Variables are exogenous
Durbin (score) chi2(1)=2.62906 (p=0.1049)
Wu-Hausman F(1,110) = 2.45133 (p=0.1203)

80
Figures in Appendix 2: Herfindahl-Hirschman Index Ranges
HHI Ranges and Market Completion Level
HHI range Competition level <0.15 Unconcentrated Markets 0.15–0.25 Moderately Concentrated Markets >0.25 Highly Concentrated Markets
Source: U.S. Department of Justice and the Federal Trade Commission, 2010
Figures in Appendix 3: Survey Questionnaire
a. Questionnaire for Cotton Producer Farmers
Date of interview (day/month/year) ___/_____/2016 Enumerator name________________________signiture______________ Supervisor name______________Zone__________Woreda_______Kebele_____________
Section A: Social Economic and Demographic characteristics 1. Sex of respondent house hold head: 1. male 2. Female 2. Age of House hold head:_______________ 3. Family size:
Sex Male Age Female Total 1-14
15-64 Above 64
Total
4. Religion of respondents: 1= Ethiopian orthodox 2=Muslim 3=Catholic 4=Protestant 5=Traditional
5. Marital Status of the respondent 1. Single 2. Married 3. Divorced 4. widowed 6. Farming experience:___________.When did you start producing cotton?_________ 7. Have you educated? 1=yes 2=no 8. If your response is yes, what is your level of education? 1= 1-4 2=5-8 3= 9-10
4=10+1 and above 9. Land holding and utilization system: total land holding________,Cultivated
area______________, range land______ 10. How many hectare of land you allocated for cotton?__________________________ 11. What are common crops grown in your field? Rank them based on your land
allocation Crops Purpose** Land allocation Yield per hectare Maize Banana Teff Mango Cotton Cassava
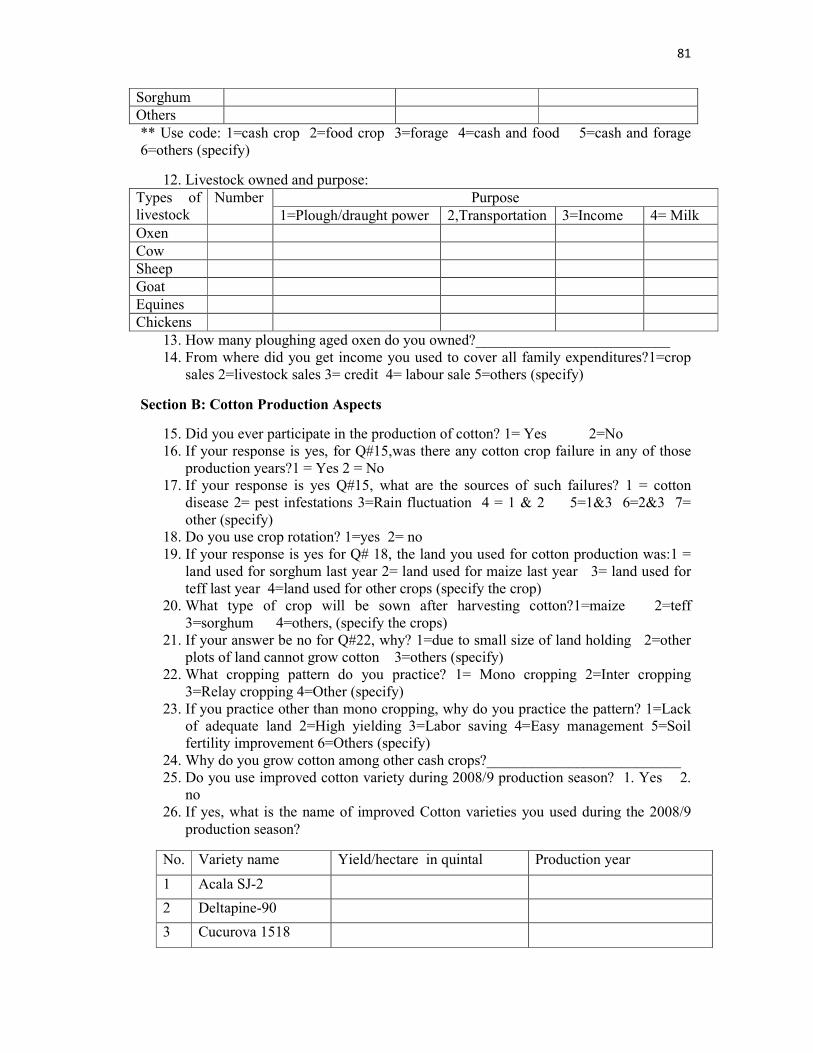
81
Sorghum Others ** Use code: 1=cash crop 2=food crop 3=forage 4=cash and food 5=cash and forage 6=others (specify)
12. Livestock owned and purpose: Types of livestock
Number Purpose 1=Plough/draught power 2,Transportation 3=Income 4= Milk
Oxen Cow Sheep Goat Equines Chickens
13. How many ploughing aged oxen do you owned?__________________________ 14. From where did you get income you used to cover all family expenditures?1=crop
sales 2=livestock sales 3= credit 4= labour sale 5=others (specify)
Section B: Cotton Production Aspects
15. Did you ever participate in the production of cotton? 1= Yes 2=No 16. If your response is yes, for Q#15,was there any cotton crop failure in any of those
production years?1 = Yes 2 = No 17. If your response is yes Q#15, what are the sources of such failures? 1 = cotton
disease 2= pest infestations 3=Rain fluctuation 4 = 1 & 2 5=1&3 6=2&3 7= other (specify)
18. Do you use crop rotation? 1=yes 2= no 19. If your response is yes for Q# 18, the land you used for cotton production was:1 =
land used for sorghum last year 2= land used for maize last year 3= land used for teff last year 4=land used for other crops (specify the crop)
20. What type of crop will be sown after harvesting cotton?1=maize 2=teff 3=sorghum 4=others, (specify the crops)
21. If your answer be no for Q#22, why? 1=due to small size of land holding 2=other plots of land cannot grow cotton 3=others (specify)
22. What cropping pattern do you practice? 1= Mono cropping 2=Inter cropping 3=Relay cropping 4=Other (specify)
23. If you practice other than mono cropping, why do you practice the pattern? 1=Lack of adequate land 2=High yielding 3=Labor saving 4=Easy management 5=Soil fertility improvement 6=Others (specify)
24. Why do you grow cotton among other cash crops?__________________________ 25. Do you use improved cotton variety during 2008/9 production season? 1. Yes 2.
no 26. If yes, what is the name of improved Cotton varieties you used during the 2008/9
production season?
No. Variety name Yield/hectare in quintal Production year
1 Acala SJ-2
2 Deltapine-90
3 Cucurova 1518
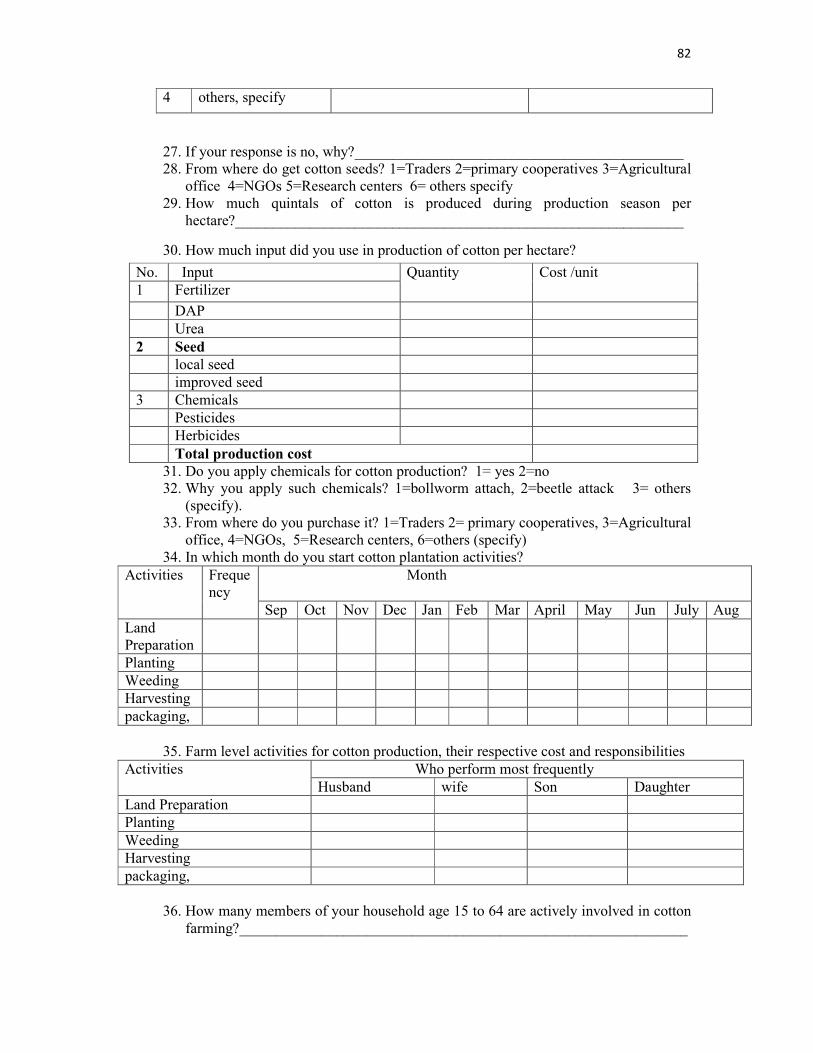
82
4 others, specify
27. If your response is no, why?____________________________________________ 28. From where do get cotton seeds? 1=Traders 2=primary cooperatives 3=Agricultural
office 4=NGOs 5=Research centers 6= others specify 29. How much quintals of cotton is produced during production season per
hectare?____________________________________________________________
30. How much input did you use in production of cotton per hectare?
No. Input
Quantity Cost /unit 1 Fertilizer
DAP Urea 2 Seed local seed improved seed 3 Chemicals Pesticides Herbicides Total production cost
31. Do you apply chemicals for cotton production? 1= yes 2=no 32. Why you apply such chemicals? 1=bollworm attach, 2=beetle attack 3= others
(specify). 33. From where do you purchase it? 1=Traders 2= primary cooperatives, 3=Agricultural
office, 4=NGOs, 5=Research centers, 6=others (specify) 34. In which month do you start cotton plantation activities?
Activities Frequency
Month
Sep Oct Nov Dec Jan Feb Mar April May Jun July Aug Land Preparation
Planting Weeding Harvesting packaging,
35. Farm level activities for cotton production, their respective cost and responsibilities
Activities Who perform most frequently Husband wife Son Daughter
Land Preparation Planting Weeding Harvesting packaging,
36. How many members of your household age 15 to 64 are actively involved in cotton
farming?____________________________________________________________

83
37. In your opinion what do you think should be done to improve cotton production? ___________________________________________________________________
Section C: Access to Services and Marketing 38. Do you have access to extension service? 1= yes 2= no 39. If your answer is yes, how many times do you meet with extension agents in 2008/9
production period to exchange information about cotton production?__________________________________________________________
40. How often does extension agent contact you? 1=weekly 2=Once in two weeks 3=Monthly 4=. No regular program
41. If your response is no, for Q#40 why?_____________________________________ 42. Do you have access to receive credit for cotton production? 1=Yes 2= no 43. If yes, who gave you the loan? 1=Microfinance Institution 2= Cooperative/
association 3= Bank 4=Other (specify) 44. How much money do you received in 2008 production period for cotton
production?__________________________________________________________ 45. If your response is no for Q#42, why?____________________________________ 46. How far did main market place from your house? ______________ in km and How
much time it takes to reach?__________________ 47. Quantity of cotton produced in 2008______________in quintal, Quantity of cotton
supplied market___________ in 2008 in quintal, quantity of cotton saved for 2009______seed.
48. Who are your major cotton buyers? 1=retailers 2=local collectors 3= wholesalers 4= Ginners 5= Other (specify)
49. When did you sale? 1= immediately after harvest 2= after one month 3=after two months 4= after three months 5=after four months 6 = after five months
50. Do you have access to market information? 1. Yes 2. no 51. If your response is yes for Q#50, who are your market information sources? 1=
Traders 2= Cooperatives 3=Friends 4= Neighbouring Farmers 5= Agricultural Extension Agents. 6= All 7= Others Specify
52. What are your market information channels? 1= telephone 2= radio and TV 3= newsletters 4=others
53. How much it is reliable for your decision making? 1= excellent 2= very good 3= good 4= poor
54. How much is the price of cotton per Kg (ETB) in 2009____________what about price of cotton per Kg in 2008 production season__________________________
55. How price for cotton be determined? 1=based on Color of lint 2= Variety 3= Grades 4=Other (specify)
56. How do you sell your cotton? 1= at farm gate 2=Sell at the ginners‘ cotton depot 3=other (specify)
57. Did you have any problem(s) in marketing of the cotton for the last one year? 1=yes2=No
58. If yes for Q#57, what are problems_______________________________________
Section D: Transportation 59. Do you have access to transportation? 1=yes 2= no 60. If your response is no for Q#59, in which season you trouble to transport? 1= rainy
season 2= dry season 3=in both season 61. If your response be yes for Q#59, what type of transportation system do use?
1=Animal pulled cart 2= Pack animal 3= Hired Vehicle 4=Animal pulled cart and pack animal 5=Animal pulled cart and vehicle 6=all
62. Do you have alternative markets to sell cotton? 1= yes 2= no

84
63. If yes, how much does it cost you to transport your cotton to the market? (specify) Market Cost Market 1 Market2 Market 3
Section E: Storage, Processing and Handling Issues 64. Do you pack and store cotton before sale? 1= No 2= Yes 65. If your response is yes for Q#64, how do you store cotton? 1= Filling in sacks and
pilling at store 2=Filling in sacks and pilling at home 3=Filling in sacks and pilling around homestead 4=Filling in sacks and pilling at farm
66. What are packaging materials you used for packing cotton? 1= Sisal sack 2= polythin sack 3=both 4=others specify
67. Why you preferred this material? 1=Strength 2=large size/ capacity to hold a huge amount of cotton 3=due to price 4=availability 5= others (specify)
68. What is the cost of those packing materials? Materials Cost per unit The amount of cotton held Sisal sack Polythin sack Others
69. Why you store? 1=to sell future in high price 2=lack of transportation facility 3= other reasons specify
70. Do you experience any losses in cotton? 1=Yes 2= No 71. How cotton storage be improved? 1=Provision of loans to buy the facilities
2=establishing markets chain for cotton 3= Others (specify) 72. What do you think problems of cotton quality loss? 1= cotton storage 2=
harvesting method 3=loss of moisture from cotton 4= dust contamination 6=all 73. Do you grade your cotton before selling? 1=yes 2= no 74. Do you get a premium price for grading? (Specify if yes)
Grade level Price per Kg
Section F: Associations 75. Is there any cotton association in this area? 1=No 2= Yes 76. If your response is yes for Q# 75, Can you specify them as: 1=Producers,
2=marketing, 3=transporters association 77. If yes, are you a member?(Indicate name) 1= No 2= Yes 78. What are the objectives of the association? 1=For easy marketing of cotton
Acquiring of inputs 2=Easy acquiring of storage facilities 3=To negotiate for better prices 4=Other (specify)
79. If not a member, why not? 1=due to lack of registration fee 2=don‘t see any benefits for joining 3= Other (specify)
b. Questionnaire for Traders
Date of interview___________________________________________________________
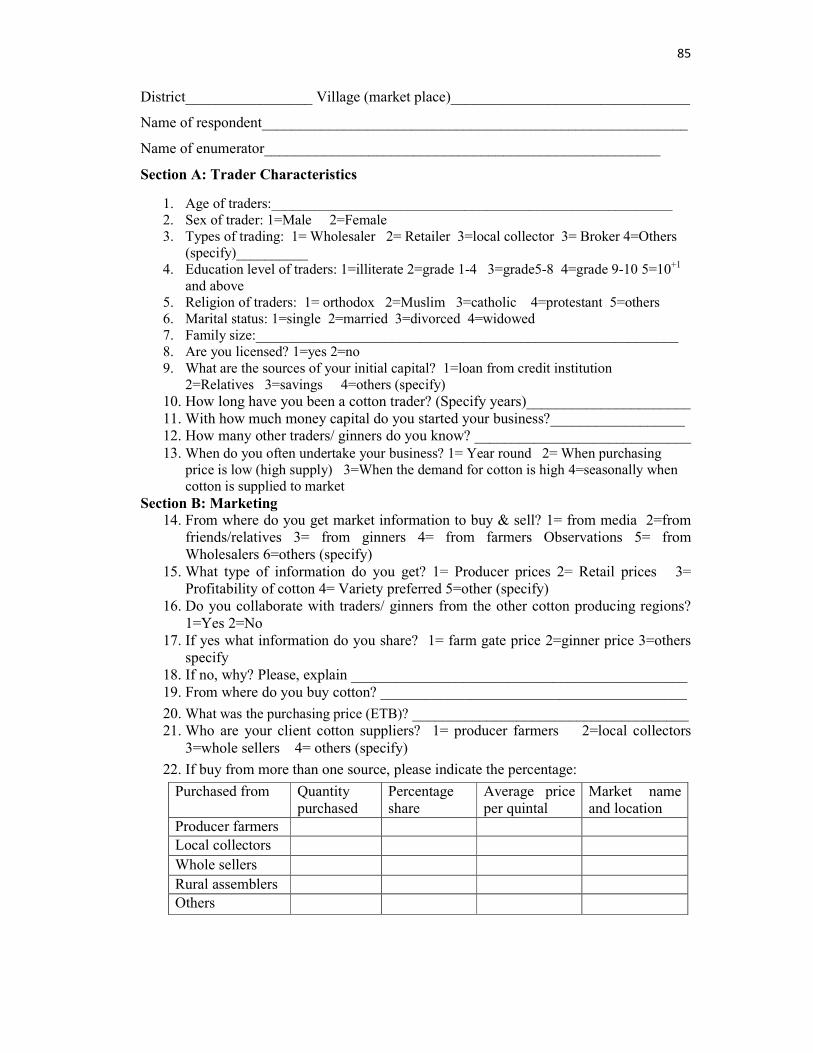
85
District_________________ Village (market place)________________________________
Name of respondent_________________________________________________________
Name of enumerator_____________________________________________________
Section A: Trader Characteristics
1. Age of traders:________________________________________________________ 2. Sex of trader: 1=Male 2=Female 3. Types of trading: 1= Wholesaler 2= Retailer 3=local collector 3= Broker 4=Others
(specify)__________ 4. Education level of traders: 1=illiterate 2=grade 1-4 3=grade5-8 4=grade 9-10 5=10+1
and above 5. Religion of traders: 1= orthodox 2=Muslim 3=catholic 4=protestant 5=others 6. Marital status: 1=single 2=married 3=divorced 4=widowed 7. Family size:___________________________________________________________ 8. Are you licensed? 1=yes 2=no 9. What are the sources of your initial capital? 1=loan from credit institution
2=Relatives 3=savings 4=others (specify) 10. How long have you been a cotton trader? (Specify years)______________________ 11. With how much money capital do you started your business?__________________ 12. How many other traders/ ginners do you know? _____________________________ 13. When do you often undertake your business? 1= Year round 2= When purchasing
price is low (high supply) 3=When the demand for cotton is high 4=seasonally when cotton is supplied to market
Section B: Marketing 14. From where do you get market information to buy & sell? 1= from media 2=from
friends/relatives 3= from ginners 4= from farmers Observations 5= from Wholesalers 6=others (specify)
15. What type of information do you get? 1= Producer prices 2= Retail prices 3= Profitability of cotton 4= Variety preferred 5=other (specify)
16. Do you collaborate with traders/ ginners from the other cotton producing regions? 1=Yes 2=No
17. If yes what information do you share? 1= farm gate price 2=ginner price 3=others specify
18. If no, why? Please, explain _____________________________________________ 19. From where do you buy cotton? _________________________________________
20. What was the purchasing price (ETB)? _____________________________________ 21. Who are your client cotton suppliers? 1= producer farmers 2=local collectors
3=whole sellers 4= others (specify)
22. If buy from more than one source, please indicate the percentage:
Purchased from Quantity purchased
Percentage share
Average price per quintal
Market name and location
Producer farmers Local collectors
Whole sellers
Rural assemblers Others
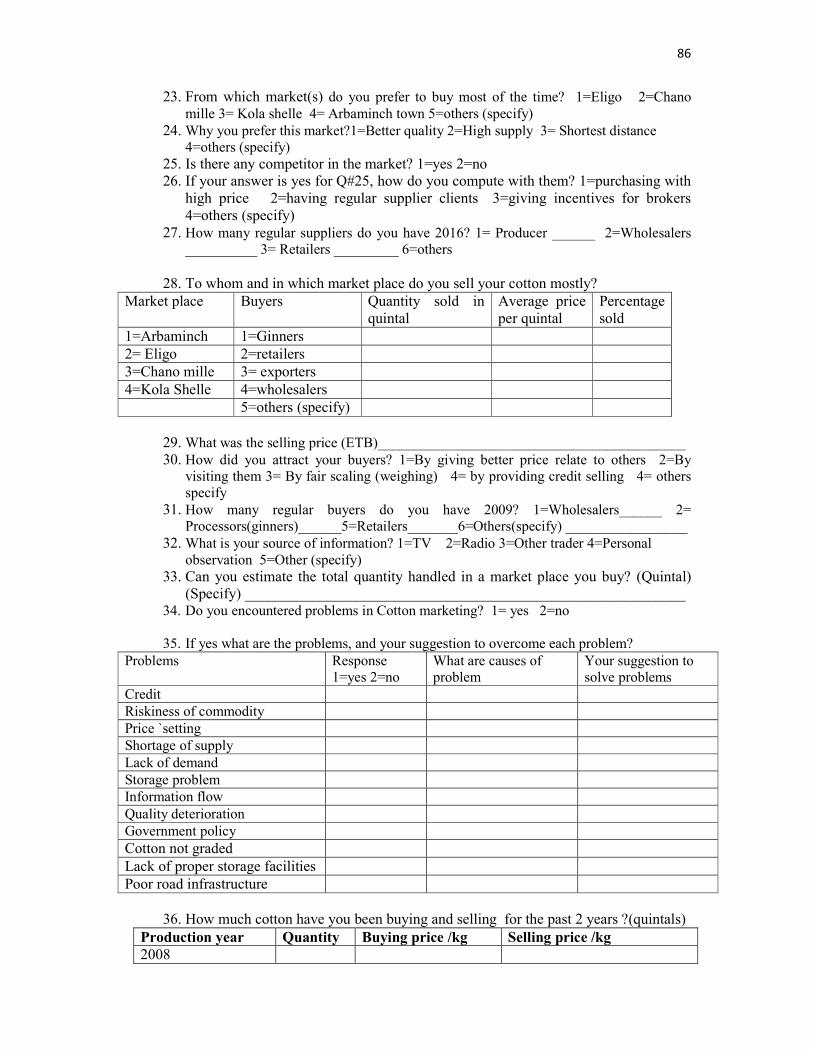
86
23. From which market(s) do you prefer to buy most of the time? 1=Eligo 2=Chano mille 3= Kola shelle 4= Arbaminch town 5=others (specify)
24. Why you prefer this market?1=Better quality 2=High supply 3= Shortest distance 4=others (specify)
25. Is there any competitor in the market? 1=yes 2=no 26. If your answer is yes for Q#25, how do you compute with them? 1=purchasing with
high price 2=having regular supplier clients 3=giving incentives for brokers 4=others (specify)
27. How many regular suppliers do you have 2016? 1= Producer ______ 2=Wholesalers __________ 3= Retailers _________ 6=others
28. To whom and in which market place do you sell your cotton mostly?
Market place Buyers Quantity sold in quintal
Average price per quintal
Percentage sold
1=Arbaminch 1=Ginners 2= Eligo 2=retailers 3=Chano mille 3= exporters 4=Kola Shelle 4=wholesalers 5=others (specify)
29. What was the selling price (ETB)___________________________________________ 30. How did you attract your buyers? 1=By giving better price relate to others 2=By
visiting them 3= By fair scaling (weighing) 4= by providing credit selling 4= others specify
31. How many regular buyers do you have 2009? 1=Wholesalers______ 2= Processors(ginners)______5=Retailers_______6=Others(specify) _________________
32. What is your source of information? 1=TV 2=Radio 3=Other trader 4=Personal observation 5=Other (specify)
33. Can you estimate the total quantity handled in a market place you buy? (Quintal) (Specify) ___________________________________________________________
34. Do you encountered problems in Cotton marketing? 1= yes 2=no
35. If yes what are the problems, and your suggestion to overcome each problem? Problems Response
1=yes 2=no What are causes of problem
Your suggestion to solve problems
Credit Riskiness of commodity Price `setting Shortage of supply Lack of demand Storage problem Information flow Quality deterioration Government policy Cotton not graded
Lack of proper storage facilities
Poor road infrastructure
36. How much cotton have you been buying and selling for the past 2 years ?(quintals)
Production year Quantity Buying price /kg Selling price /kg 2008

87
2009
37. On average how much profit do you realize per quintal? ______________________ 38. How do you determine selling price? 1=Take transport costs into consideration 2=
grade of cotton 3= Demand 4= all 5=Other (specify) 39. What costs do you incur and how much?
Product Marketing Cost Price per quintal
Marketing Cost Price per quintal
Cotton
Purchasing price per quintal
License and Taxes
Labor employed to collect and stitch/Packaging
Watching and warding
Load/ unload Storage cost
Brokerage Storage loss Transportation Personal travel expenses
Telephone cost Sorting and grading cost
40. Is your demand satisfied? 1=yes 2=no 41. If no, why? 1=Low production 2=Demand increasing 3=many traders involved 4=
Poor roads to producing areas 5=High prices charged 6= all 7= Others (specify) 42. Do you pay tax for the cotton you purchase? 1= yes 2=no 43. If your answer is yes for Q#42, on what basis do pay tax? 1=per quintal of
purchase_______birr 2=per market day_______birr 3= per quarter________birr 4=others(specify)
44. If your answer is no for Q#42, why don’t you pay tax?________________________ Section C: Storage, Handling and Transportation Issues
45. Do you store your cotton before sale? 1=Yes 2= No 46. If yes, where do you store? 1=Own store 2= Rental private store 3=Own house 4=
Others (specify) 47. Can you estimate the cost of storage?
Quantity Storage period Cost
48. On average how long do you keep the cotton before trading it after buying from the supplier?____________________________________________________________
49. If you do not store, Why not? 1= Immediate need for cash 2= Demand so high 3= Lack of proper storage facilities 4=Highly perishable and cotton quality loss 5= other (specify)
50. Do you experience any losses with the stored cotton? 1=Yes 2= No 51. If yes, what are the causes? 1= Theft 2=Poor storage structures 3= contamination
nature of cotton 5=Other (specify) 52. Do you encounter any handling costs? 1= Yes 2= No 53. What means of transport do you use in transporting cotton from and to market?
1=Own vehicle 2= Hired vehicle 3=Bicycle 4=Ox-cart 5=Public transport 6=Others (specify)
54. Estimate the distance covered (of transportation) and costs incurred? Market to another market Distance Cost

88
55. Are there enough feeder roads connecting to the main road? 1=Yes 2= no 56. What is the condition of roads in the area? 1=Very good 2=Good 3=Fair 4=Bad
Section E: Associations and Policy Issues 57. Are you a member of any credit club? 1= Yes 2=No 58. Is there an association or group for cotton traders in your area? 1= Yes 2= No 59. If yes, what are the objectives of the grouping? ____________________________ 60. Are you a member? 1= Yes 2=No 61. If yes, what are the benefits of joining? 1=Easy access to markets information 2=
Easy to have storage facilities 3= Negotiate for better prices 4=other (specify) 62. How does the association operate? ______________________________________
63. If no, why not you want to join? 1=High registration fee 2=No knowledge on dynamics of an association/group 3=Others (specify)
64. Are you aware of any government policy related to cotton marketing? 1= Yes 2=No
65. If yes, state the policy and its weakness?___________________________________ 66. In What areas would you want government intervention regarding cotton
marketing? 1=Markets 2=Research 3=Extension 4=Storage 5=Capital/credit 6=Facilitate regional trade 6=Transport and road networks 7= others (specify)
67. In your opinion, what are the opportunities that exist in cotton sub-sector? _________________________________________________________________________
68. What are the weaknesses that exist in cotton sub-sector? _________________________________________________________________________
c. Questionnaire for the Textile Companies
1. Background of company
Type of company
Establishment Year
Items Produced
Production Tons/per year Number of employee
2005 2006 2007 2008 2009
2. Does your company buy Arbaminch cotton? 1=yes 2=no 3. If your answer is yes for Q#2, how do you get Arbaminch cotton)? 1= from open
local markets from small holders 2= from local collectors 3= from wholesalers 4. Via brokers from small holders 5.from own private farm 6. From state farms 7. Via contract farming 8. Others specify
4. If your answer is no for Q#2, why? 1=high price 2=quality problem 3=others specify

89
5. If your reason be quality problem, what is it? 1=Fiber length 2=Fineness 3=High Immature/dead fiber content 4=Strength variability of fiber 5=Variability in color 6=High non-fibrous content/contaminants, 7=Elasticity problem
6. What do you think contributing factors for quality deterioration of cotton? 1=Harvesting methods 2= inappropriate handling of cotton at farm level 3= storage 4=. Transportation and transporting system 5= Ginning practices 6=others (specify)
7. How do inspect cotton quality problems? 1= Using electronic methods 2= Visual and manual inspection 3= Both 4= others (specify)
8. Which problem is more sever? 1=Fiber length 2=Fineness 3=High Immature/dead fiber content4=Strength variability of fiber 5=Variability in color6=High non-fibrous content/contaminants, 7=Elasticity problem 8= others (specify)
9. Which problem is common for Arbaminch cotton? Put in priority.________________
10. What you suggest for improvement? Please list your solution.__________________ 11. If your company produces, more than one product, what are their shares out of total
production?
No. Product Percentage shares 1 Yarn 2 Fabrics 3 Ready maid clothes (garments) 4 Others, specify
12. If presently capacities are not fully employed, what are the reasons?_______________
13. Do you think you will get enough raw inputs to meet production capacity requirements from Arbaminch? 1= Yes 2=No
14. How do your company buy raw material (cotton)? 1= contract farming 2= Randomly from markets 3= through value chain system 4=other, specify it
15. How the price of cotton is determined? 1= fixed by producers 2= fixed by your company 3= reach agreement through bargaining 4=fixed by government 5=others, specify
16. What are the parameters you used to fix price of cotton? 1=intrinsic attributes of the fiber 2=the cleanliness of lint and the degree of contamination 3=color of cotton 4= combinations
17. How many ton of cotton (lint) does your company buy from Arbaminch? Year Ton purchased Price (ETB/Kg) 2005 2006 2007 2008 2009
18. What the trend of purchase looks like? 1= Increasing 2= decreasing 3= constant 19. If it be increasing, why?______________________________________________ 20. If it be decreasing, why?_____________________________________________ 21. What is the trend of price? 1= Increasing 2= decreasing 3= constant
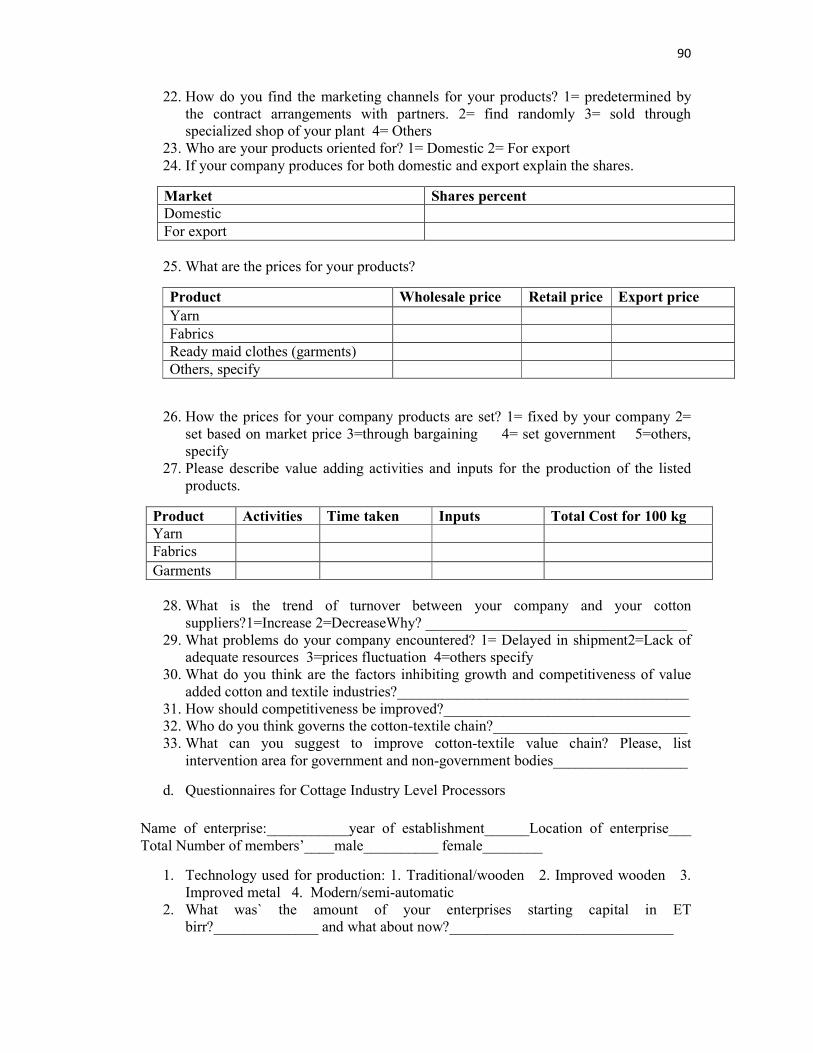
90
22. How do you find the marketing channels for your products? 1= predetermined by the contract arrangements with partners. 2= find randomly 3= sold through specialized shop of your plant 4= Others
23. Who are your products oriented for? 1= Domestic 2= For export 24. If your company produces for both domestic and export explain the shares.
Market Shares percent Domestic For export
25. What are the prices for your products?
Product Wholesale price Retail price Export price
Yarn Fabrics Ready maid clothes (garments) Others, specify
26. How the prices for your company products are set? 1= fixed by your company 2= set based on market price 3=through bargaining 4= set government 5=others, specify
27. Please describe value adding activities and inputs for the production of the listed products.
Product Activities Time taken Inputs Total Cost for 100 kg Yarn Fabrics
Garments
28. What is the trend of turnover between your company and your cotton suppliers?1=Increase 2=DecreaseWhy? ___________________________________
29. What problems do your company encountered? 1= Delayed in shipment2=Lack of adequate resources 3=prices fluctuation 4=others specify
30. What do you think are the factors inhibiting growth and competitiveness of value added cotton and textile industries?_______________________________________
31. How should competitiveness be improved?_________________________________ 32. Who do you think governs the cotton-textile chain?__________________________ 33. What can you suggest to improve cotton-textile value chain? Please, list
intervention area for government and non-government bodies__________________
d. Questionnaires for Cottage Industry Level Processors
Name of enterprise:___________year of establishment______Location of enterprise___ Total Number of members’____male__________ female________
1. Technology used for production: 1. Traditional/wooden 2. Improved wooden 3. Improved metal 4. Modern/semi-automatic
2. What was` the amount of your enterprises starting capital in ET birr?______________ and what about now?______________________________
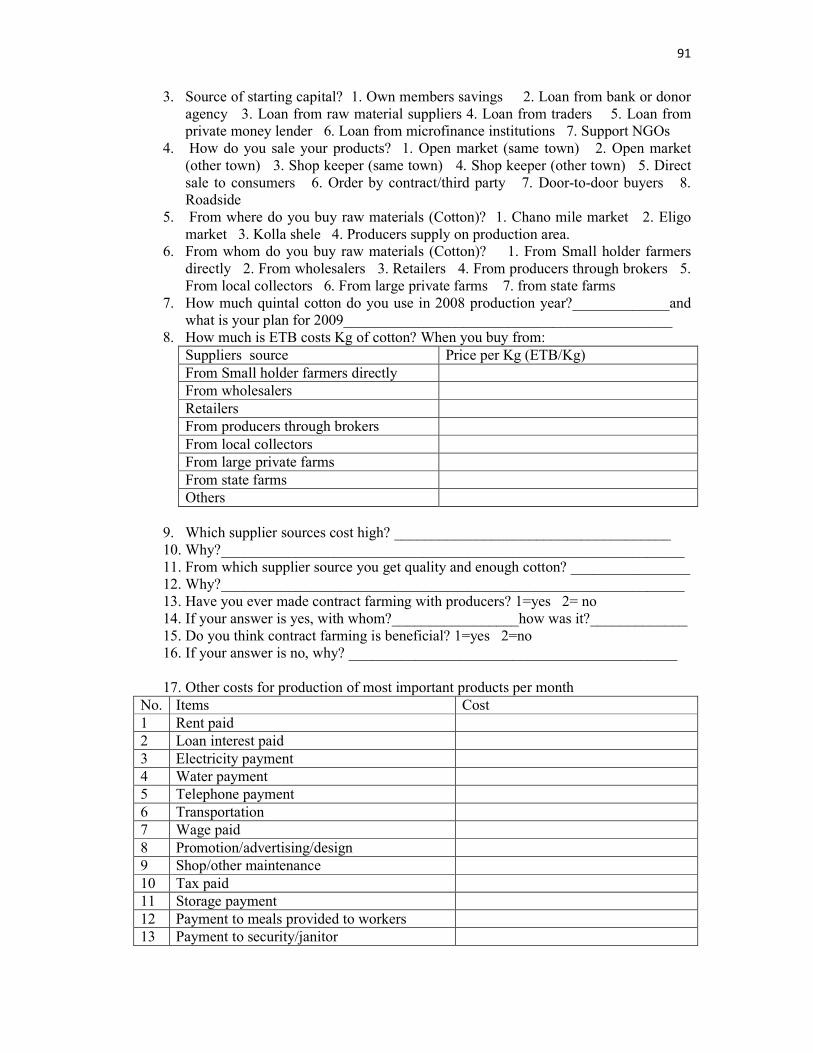
91
3. Source of starting capital? 1. Own members savings 2. Loan from bank or donor agency 3. Loan from raw material suppliers 4. Loan from traders 5. Loan from private money lender 6. Loan from microfinance institutions 7. Support NGOs
4. How do you sale your products? 1. Open market (same town) 2. Open market (other town) 3. Shop keeper (same town) 4. Shop keeper (other town) 5. Direct sale to consumers 6. Order by contract/third party 7. Door-to-door buyers 8. Roadside
5. From where do you buy raw materials (Cotton)? 1. Chano mile market 2. Eligo market 3. Kolla shele 4. Producers supply on production area.
6. From whom do you buy raw materials (Cotton)? 1. From Small holder farmers directly 2. From wholesalers 3. Retailers 4. From producers through brokers 5. From local collectors 6. From large private farms 7. from state farms
7. How much quintal cotton do you use in 2008 production year?_____________and what is your plan for 2009____________________________________________
8. How much is ETB costs Kg of cotton? When you buy from: Suppliers source Price per Kg (ETB/Kg) From Small holder farmers directly From wholesalers Retailers From producers through brokers From local collectors From large private farms From state farms Others
9. Which supplier sources cost high? _____________________________________ 10. Why?______________________________________________________________ 11. From which supplier source you get quality and enough cotton? ________________ 12. Why?______________________________________________________________ 13. Have you ever made contract farming with producers? 1=yes 2= no 14. If your answer is yes, with whom?_________________how was it?_____________ 15. Do you think contract farming is beneficial? 1=yes 2=no 16. If your answer is no, why? ____________________________________________
17. Other costs for production of most important products per month
No. Items Cost 1 Rent paid 2 Loan interest paid 3 Electricity payment 4 Water payment 5 Telephone payment 6 Transportation 7 Wage paid 8 Promotion/advertising/design 9 Shop/other maintenance 10 Tax paid 11 Storage payment 12 Payment to meals provided to workers 13 Payment to security/janitor

92
18. Have you ever faced cotton related problems in your production system? 1=yes 2=no
19. If your answer is yes, what are the problems?______________________________ 20. To produce your one product (items) how much Kg of cotton do you use?
Do you produced 1=Yes, 2=no
Amount of cotton used in Kg
Total cost for production
Selling price
Netela Gabi Kemis Kuta Denguza Buluko Scarf Cap Algalibis Others
21. Do you think your enterprise is beneficial? 1= yes 2= no 22. If your response is no,
why?_____________________________________________ 23. What strength, weakness, opportunities and threats you observed on Arba Minch
cotton? Strength Weakness Opportunities Threats
24. What you suggest to improve weakness and threats of Arbaminch cotton? Discuss:
_________________________________________________________________________
Related Documents