INTERNATIONAL JOURNAL OF CLIMATOLOGY Int. J. Climatol. (2010) Published online in Wiley InterScience (www.interscience.wiley.com) DOI: 10.1002/joc.2136 Temperature and surface lapse rate change: a study of the UK’s longest upland instrumental record Joseph Holden a * and Robert Rose b a School of Geography, University of Leeds, Leeds LS2 9JT, UK b Centre for Ecology and Hydrology, Lancaster Environment Centre, Library Avenue Bailrigg, Lancaster LA1 4AP, UK ABSTRACT: A homogenized 76-year daily-mean temperature series is presented for Moor House, an upland peatland meteorological station in northern England, which provides the longest instrumental temperature record in the UK uplands. This paper assesses trends in the temperature record over time compared to the nearby lowland temperature record at Durham. Overall warming for 1991–2006 compared with 1931–1960 and 1961–1990 was approximately the same at the upland site (0.53 ° C and 0.73 ° C for the two time periods, respectively) as at Durham (0.61 ° C and 0.71 ° C), maintaining a similar lapse rate. However, winter warming is dominant at Moor House and more pronounced and concentrated over a shorter period than at Durham; summer warming is more prominent at Durham. Therefore, seasonal lapse rates have changed and become more divergent between winter and summer half-years. Rather than changes in the dominance of particular air-masses over the study area accounting for seasonal lapse rate changes, there had been significant steepening of lapse rates over time for some air flow types. Minimum temperatures have increased more than maximum temperatures at Moor House with a consequent significant reduction in diurnal range. At Durham minimum and maximum temperatures have changed in approximate tandem so that there is no significant change in diurnal temperature range. The frequency of air frosts reduced by approximately 23% (from 129 days per year to 99) at Moor House from 1991–2006 compared to 1953–1980, and this may have major implications for the functioning of terrestrial and aquatic systems in the region. These results demonstrate that while overall annual warming in the uplands and lowlands within particular regions may be similar, even where annual lapse rates have been maintained, the seasonal distribution of that warming may be quite different even over short distances and so lowland records are not a reliable indicator of regional upland temperature change. Copyright 2010 Royal Meteorological Society KEY WORDS climate change; Moor House; lapse rate; uplands; peatland; temperature; data homogenization Received 15 January 2009; Revised 19 February 2010; Accepted 19 February 2010 1. Introduction Regional climate models predict a warming, with respect to 1961–1990, of about 3 ° C by 2100 for many areas of northern Europe (IPCC, 2007). Although there are many long-term temperature records in the UK such as at Durham (records available since 1850) these are largely confined to lowland areas. A number of authors have sug- gested that, due to changing surface-based lapse rates, upland areas may not warm in parallel with the lowlands (Pepin, 1995; Diaz and Bradley, 1997). Climate change in the UK uplands is particularly important because the soils are predominately organic and peaty (Holden et al., 2007) and these soils are significant and sensitive carbon stores (Hilbert et al., 2000; Bradley et al., 2005) which may become net sources of carbon under climate change (Worrall et al., 2004). These uplands also contain interna- tionally important ecological habitats and are source areas for water supply (Holden et al., 2007). Where instru- mental records of climate exist in the uplands there is * Correspondence to: Joseph Holden, School of Geography, University of Leeds, Leeds LS2 9JT, UK. E-mail: [email protected] therefore a need to ensure their use in understanding cli- mate change (Appenzellera et al., 2008). The aim of this paper is to compile a homogenized upland temperature series since 1931 for an internation- ally important upland research site in northern England so that warming trends may be compared with nearby long- term lowland records. This will enable us to test whether regional lowland temperature records can be used to infer local upland temperature change where the records are more scarce. In order to do this, annual, seasonal, monthly and daily mean temperature, and mean maximum and minimum temperatures will be analysed and compared between the sites. The paper assesses whether system- atic changes in the lapse rate between the sites have occurred and assesses possible synoptic controls on lapse rate changes. Moor House is a World Biosphere Reserve in the north Pennine region of northern England. The habitat is internationally important blanket peat moorland. The area is part of the largest contiguous land above 500 m in England. The site has been a focus of decades of scientific research relating to ecology, hydrology, biogeochemistry, geomorphology and climate. Indeed between 1993 and Copyright 2010 Royal Meteorological Society

Welcome message from author
This document is posted to help you gain knowledge. Please leave a comment to let me know what you think about it! Share it to your friends and learn new things together.
Transcript
INTERNATIONAL JOURNAL OF CLIMATOLOGYInt. J. Climatol. (2010)Published online in Wiley InterScience(www.interscience.wiley.com) DOI: 10.1002/joc.2136
Temperature and surface lapse rate change: a study of theUK’s longest upland instrumental record
Joseph Holdena* and Robert Roseb
a School of Geography, University of Leeds, Leeds LS2 9JT, UKb Centre for Ecology and Hydrology, Lancaster Environment Centre, Library Avenue Bailrigg, Lancaster LA1 4AP, UK
ABSTRACT: A homogenized 76-year daily-mean temperature series is presented for Moor House, an upland peatlandmeteorological station in northern England, which provides the longest instrumental temperature record in the UK uplands.This paper assesses trends in the temperature record over time compared to the nearby lowland temperature record atDurham. Overall warming for 1991–2006 compared with 1931–1960 and 1961–1990 was approximately the same at theupland site (0.53 °C and 0.73 °C for the two time periods, respectively) as at Durham (0.61 °C and 0.71 °C), maintaininga similar lapse rate. However, winter warming is dominant at Moor House and more pronounced and concentrated overa shorter period than at Durham; summer warming is more prominent at Durham. Therefore, seasonal lapse rates havechanged and become more divergent between winter and summer half-years. Rather than changes in the dominance ofparticular air-masses over the study area accounting for seasonal lapse rate changes, there had been significant steepeningof lapse rates over time for some air flow types. Minimum temperatures have increased more than maximum temperaturesat Moor House with a consequent significant reduction in diurnal range. At Durham minimum and maximum temperatureshave changed in approximate tandem so that there is no significant change in diurnal temperature range. The frequencyof air frosts reduced by approximately 23% (from 129 days per year to 99) at Moor House from 1991–2006 comparedto 1953–1980, and this may have major implications for the functioning of terrestrial and aquatic systems in the region.These results demonstrate that while overall annual warming in the uplands and lowlands within particular regions maybe similar, even where annual lapse rates have been maintained, the seasonal distribution of that warming may be quitedifferent even over short distances and so lowland records are not a reliable indicator of regional upland temperaturechange. Copyright 2010 Royal Meteorological Society
KEY WORDS climate change; Moor House; lapse rate; uplands; peatland; temperature; data homogenization
Received 15 January 2009; Revised 19 February 2010; Accepted 19 February 2010
1. Introduction
Regional climate models predict a warming, with respectto 1961–1990, of about 3 °C by 2100 for many areasof northern Europe (IPCC, 2007). Although there aremany long-term temperature records in the UK such as atDurham (records available since 1850) these are largelyconfined to lowland areas. A number of authors have sug-gested that, due to changing surface-based lapse rates,upland areas may not warm in parallel with the lowlands(Pepin, 1995; Diaz and Bradley, 1997). Climate changein the UK uplands is particularly important because thesoils are predominately organic and peaty (Holden et al.,2007) and these soils are significant and sensitive carbonstores (Hilbert et al., 2000; Bradley et al., 2005) whichmay become net sources of carbon under climate change(Worrall et al., 2004). These uplands also contain interna-tionally important ecological habitats and are source areasfor water supply (Holden et al., 2007). Where instru-mental records of climate exist in the uplands there is
* Correspondence to: Joseph Holden, School of Geography, Universityof Leeds, Leeds LS2 9JT, UK. E-mail: [email protected]
therefore a need to ensure their use in understanding cli-mate change (Appenzellera et al., 2008).
The aim of this paper is to compile a homogenizedupland temperature series since 1931 for an internation-ally important upland research site in northern England sothat warming trends may be compared with nearby long-term lowland records. This will enable us to test whetherregional lowland temperature records can be used to inferlocal upland temperature change where the records aremore scarce. In order to do this, annual, seasonal, monthlyand daily mean temperature, and mean maximum andminimum temperatures will be analysed and comparedbetween the sites. The paper assesses whether system-atic changes in the lapse rate between the sites haveoccurred and assesses possible synoptic controls on lapserate changes.
Moor House is a World Biosphere Reserve in thenorth Pennine region of northern England. The habitatis internationally important blanket peat moorland. Thearea is part of the largest contiguous land above 500 m inEngland. The site has been a focus of decades of scientificresearch relating to ecology, hydrology, biogeochemistry,geomorphology and climate. Indeed between 1993 and
Copyright 2010 Royal Meteorological Society

J. HOLDEN AND R. ROSE
2006 alone there were 161 ISI journal papers basedon work at the site, plus 21 PhD theses, at least 28MSc theses and 14 book chapters. The site is thereforeof major scientific importance. However, while mostof the papers and theses based at Moor House reportlocal climate conditions, they are not consistent in thedata they present. This is because scientists report datafrom different periods and using different techniques(Holden, 2007). For example, some report mean annualtemperatures based on an average of hourly automaticweather station data since 1991 (e.g. Worrall and Burt,2005), while others report the mean annual temperatures,or seasonal variability, based on the daily mean ofthe daily maximum and minimum observations recordedbetween 1931 and 1980 (e.g. Clark et al., 2005). Thereis therefore a need to present an analysis of climate datafrom the site in one published location that scientists canutilize in their future work.
Meteorological data were collected at Moor Housebetween January 1931 and May 1980 (Manley, 1980).The pioneering work of Gordon Manley (who alsoproduced the Central England Temperature Series datingfrom 1659; Manley, 1974) in instrumenting and analysingdata from the site is described in Manley (1980), Lamb(1981) and Holden and Adamson (2001). The site was re-instrumented with an automatic weather station in May1991 which has been running ever since. Data up tothe end of 2006 will be presented in this paper. Forthe missing period of May 1980 to May 1991 a nearbyweather station was operating at Widdybank Fell whichcan be used to help compile the complete record. Therehave been occasional short periods when data have beenlost from the Moor House datalogger at the weatherstation since 1991. However, by using weather stationswith short but overlapping records in the vicinity it hasbeen possible to compile a full daily temperature seriesfor the site from January 1931 to December 2006. Thispaper presents the compilation of such a series.
2. Homogenizing the temperature record
The Moor House meteorological station (Figure 1) liesat 556 m altitude near the sources of the rivers Teesand South Tyne in the northern Pennines (54.690N,2.375 W, decimal degrees). This upland area is coveredwith a blanket peat deposit dominated by Sphagnum,Eriophorum and Calluna vegetation. The station isnamed after a lone house (Moor House) that used toexist some 7 km distant from the nearest village. GordonManley set up the station in 1931. At that time this wasthe highest point in the British Isles where records hadbeen kept, except for Ben Nevis in Scotland where aweather station had operated from 1883 to 1898. Fourtemperature datasets are available for use from MoorHouse. Data from 1931 to 1952 are standardized to 0900daily readings. Two different techniques had been usedwithin that period (and there is a gap between 1947and 1952), but Manley (1980) performed an excellent
Figure 1. Location of the two stations used in this study. Shaded areasare those above 400 m within the North Pennines and the Lake District
of northern England.
but protracted cross-calibration to produce a continuousand consistent record. The second dataset runs from1953 to 1980 when Nature Conservancy operated thestation. This dataset differs only very slightly becausethe location of the instrumentation is around 80 m distantfrom the earlier site that was originally located closeto the house itself. Manley (1980) provided correctionfigures for the earlier data to bring them into line withNature Conservancy data and so the 1931–1980 datawere homogenized and are used in the present study. Thethird dataset comes from the UK Environmental ChangeNetwork (ECN) automatic weather station installed in1991 as part of a national set of long-term standardizedmonitoring sites (Sykes and Lane, 1996; Morecroft et al.,1997). This dataset continues up to the present day.
2.1. 1980–1991 gap
The Moor House record has missing data betweenMay 1980 and May 1991. However, a nearby weatherstation at Widdybank Fell operated from 1974 to 1995.Widdybank Fell lies 6.6 km southwest of Moor House at515 m altitude at 54.653N, 2.321 W (decimal degrees)and is situated within heather moorland. This paper usesthe full length of overlapping data available from bothMoor House and Widdybank Fell (i.e. June 1974 to April1980) to produce a calibration that can then be applied tothe May 1980 to May 1991 period. The earlier MoorHouse record then also needs to be calibrated to theECN instrumentation period (1991 onwards) to producea homogenized record [Equation (3) below]. Calibrationequations for the 1980–1991 period were developed
Copyright 2010 Royal Meteorological Society Int. J. Climatol. (2010)
UPLAND TEMPERATURE CHANGE
based on both monthly and daily means. For analysisof annual and monthly mean temperatures in this paperthe monthly calibration equations were used because theerrors were much smaller than for daily temperatures andhence the calibrations were more reliable. However, adaily mean temperature calibration was also required forthe 1980–1991 period in order to investigate synopticcontrols on changing lapse rates between Moor Houseand Durham; the daily mean calibration equation (4) wasused for daily mean temperature analysis.
The infilling equations (in degrees Celsius) for monthlymeans were determined as follows at both WiddybankFell and Moor House (taking the sum of the maximumand minimum temperature recorded for each day and thendividing by two):
MHManley = 0.9730 × Widdybank Fell
− 0.4820 (r2 = 0.9958) (1)
MHECN = 0.9276 × Widdybank Fell
− 0.1501 (r2 = 0.9901) (2)
These equations can then be applied to fill in gaps inthe monthly mean temperature record at Moor House.Equation (3) can be obtained by re-arranging Equa-tions (1) and (2) which would determine a small correc-tion factor for any differences between the Manley recordand the ECN record at Moor House:
MHManley = 1.0490 × MHECN − 0.3229 (3)
Daily means were also calculated for Moor Housefrom 1980 to 1991 in order to enable investigation ofsynoptic controls on lapse rates between Moor House andDurham (see below) over time. The equation for dailymean temperature was:
MHManley = 0.99564 × Widdybank Fell
− 0.3926 (r2 = 0.9424) (4)
Daily means were used for gap filling instead ofperforming analysis separately by daily maxima andminima. This was because the scatter was quite largefor the relationship between Moor House maxima andthe Widdybank Fell maxima (r2 = 0.84), and hence inorder to ensure the analysis was as robust as possible,we did not homogenize the maxima and minima for thegap period separately.
2.2. Gaps since 1991
There are three short periods where data are missing since1991 due to failure of the automatic datalogger on site.These are 10 February to 23 March 1993, 4 June to 27July 2004 and 18–22 October 2006 (all dates inclusive).For these periods daily mean calibration equations wereused to homogenize the record. For the first of theseperiods the correlation with the Widdybank Fell stationwas used to infill the days with missing data. For the latter
two periods the daily mean temperature data have beeninfilled using a station at Hunt Hall Farm. Hunt Hall hasoperated since 1 December 1995 and is located at 54.670north, 2.278 west (decimal degrees), at 370 m altitudesome 8 km from the Moor House station and only 3 kmfrom the Widdybank Fell station. The equation for dailymean temperature was:
MHECN = 0.9471 × Hunt Hall
− 1.05 (r2 = 0.8814) (5)
It is recognized that the Hunt Hall Farm station is some184 m lower than Moor House and so this limitation toour approach should be noted. Indeed Pepin et al. (2009)noted important differences between the Hunt Hall Farmand Widdybank Fell records particularly as the Hunt HallFarm site is more sheltered. However, the periods forwhich data from Hunt Hall Farm are required for infillingthe Moor House record are short in comparison to thewhole dataset, and so, accepting an r2 of 0.88, we haveincluded these 59 days of infilling in the homogenizedtemperature record.
2.3. Durham record
Daily temperature data are available from Durham since1850. Data from Durham are used for comparison (oftemperature changes annually and seasonally) with theupland record from Moor House. Data from Durhamare also used to investigate daily near-surface lapse rate(with Moor House) relationships with synoptic air flows.Durham is the closest lowland station with an almostcomplete record for the same time period as at MoorHouse and it is also one of the key long-term instrumentalrecords in the UK. Lack of urbanization around theDurham site has meant that external influences areminimal (Burt and Horton, 2007) unlike other importantlong-term stations such as the Radcliffe Observatory,Oxford. The Durham station is located 53 km northeastof Moor House at 54.768N, 1.585 W (decimal degrees),860 m southwest of Durham Cathedral, and south of theriver Wear (Figure 1). The site is open and well exposedat a height of 102 m above sea level. Temperature datafrom 1922 to 1933 are presented after having applieda minor correction factor as outlined by Manley (1941)accounting for some instrumental calibration. There arefive recent short periods where the automated loggerfailed at Durham: (a) 1–10 October 1999; (b) 31 October1999; (c) 26–28 October 1999; (d) 2–25 May 2004; and(e) 16 August–7 September 2005 (all dates inclusive).For all of these periods we used a calibration basedon daily mean temperature data from other stations toproduce a complete Durham record. For (a), (b) and(c) data from Wycliffe Hall station which is at 120 maltitude some 25 km southwest and which ran from 1 Jan1989 to 30 November 2000 were used and the equationfor daily mean temperature during this period was:
Durham = 0.9639 × Wycliff e Hall
+ 0.8291 (r2 = 0.9368) (6)
Copyright 2010 Royal Meteorological Society Int. J. Climatol. (2010)
J. HOLDEN AND R. ROSE
For (d) and (e) data from Ravensworth station wereused to infill the series. Ravensworth station is at 120 maltitude some 35 km southwest and ran from 1 November2002 to present. The equation which was derived fromdata from 1 November 2002 to 31 December 2006 was:
Durham = 0.9599 × Ravensworth
+ 1.0883 (r2 = 0.9240) (7)
Ravensworth and Wycliffe Hall were the closest sta-tions with complete data for the overlapping periods.
3. Results
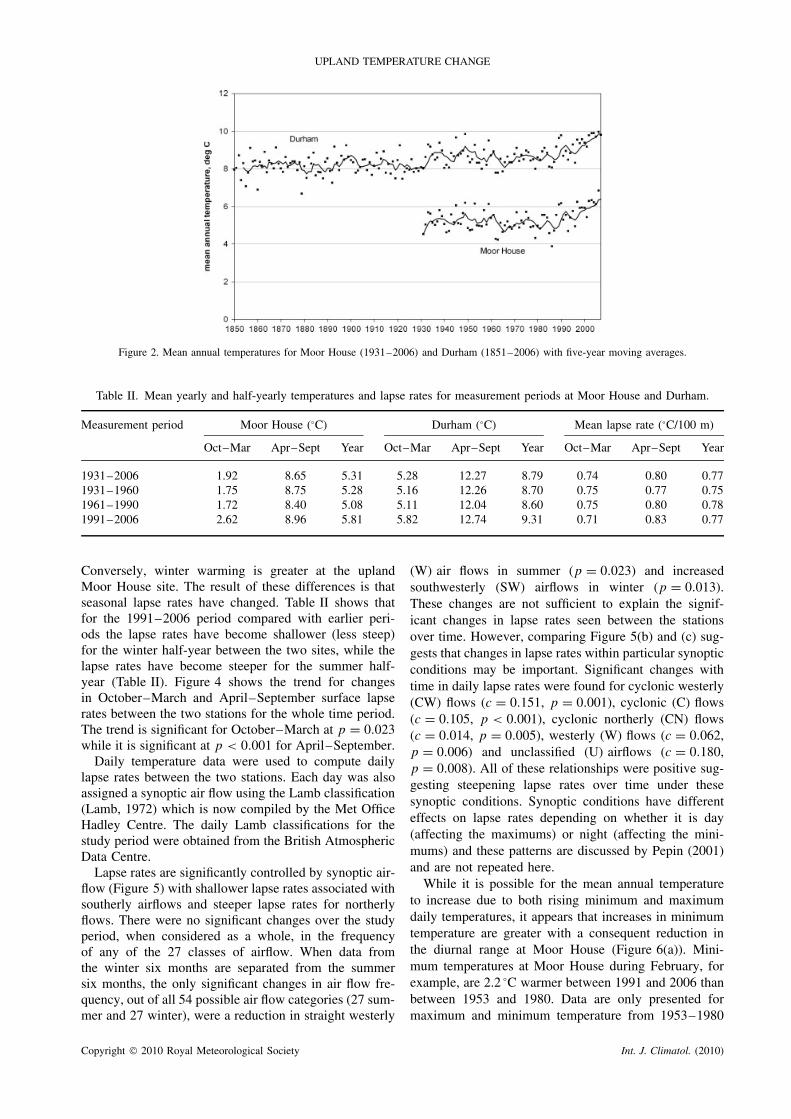
Table I provides summary of climate data based on obser-vations at Moor House. The mean annual temperatureat Moor House between 1931 and 2006 was 5.31 °C.Figure 2 shows the full time series of mean annual tem-peratures for Moor House and the lowland Durham site.The relatively cool 1961–1990 period within the con-text of the warmer 1940s and 1950s can be seen onboth records as can the recent warming since the late1980s. The mean annual warming was approximately
equal between Moor House and Durham so that the meanannual surface lapse rate has been maintained (Table II).The warming in the mean annual temperature of the1991–2006 period compared to the 1931–1960 periodwas 0.61 °C at Durham and 0.53 °C at Moor House.The equivalent comparisons with the 1961–1990 period(often used as the international standard period for com-parison; IPCC, 2007; Jenkins et al., 2007) are a warmingof 0.71 °C at Durham and 0.73 °C at Moor House.
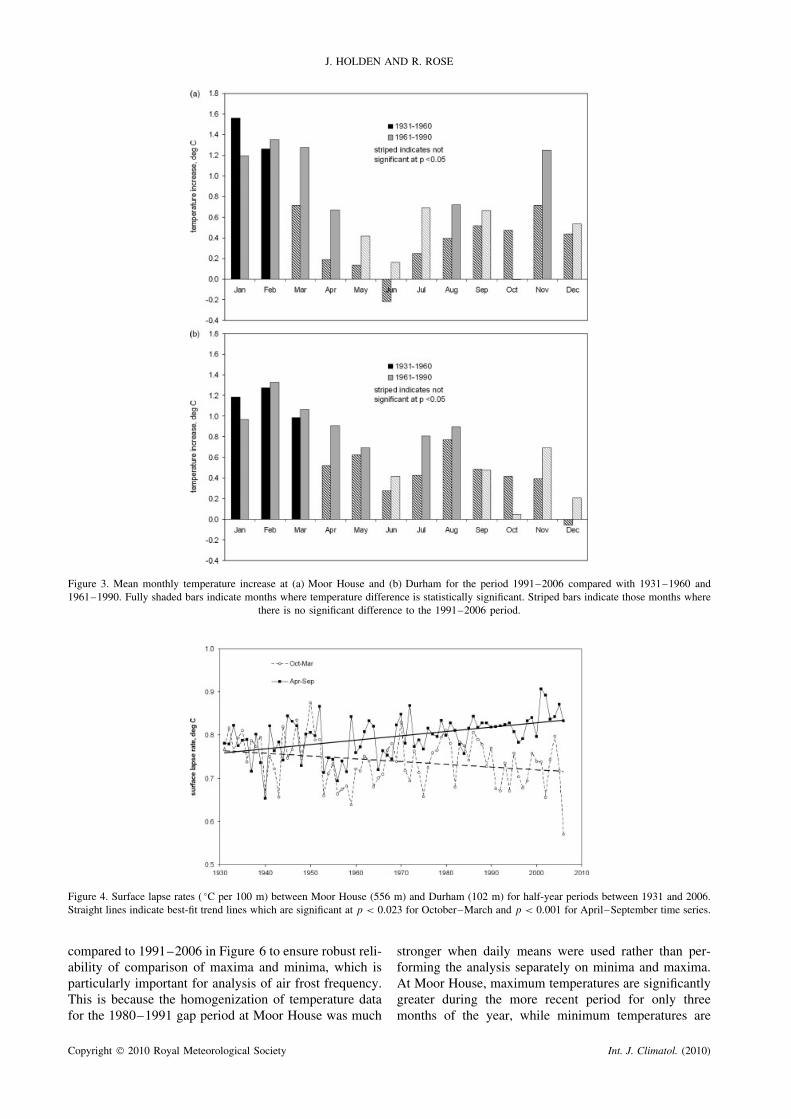
There has been a much larger warming in the wintermonths of January and February than other months ofthe year. Those months at Moor House which are sig-nificantly warmer (at p < 0.05, using a Mann–WhitneyU -test) between 1991 and 2006 compared to 1931–1960and 1961–1990 are shown in Figure 3. Similar data areshown for comparison for the lowland Durham record.At Moor House the warming is only significant (usingp < 0.05 throughout) over both the 1931–1960 and1961–1990 periods for January and February (Figure 3).At Durham, March is also included in this category.Figure 3 shows that warming between the summermonths of May–September is significant and greaterfor May, July and August at Durham compared toMoor House (where only August warming is significant).
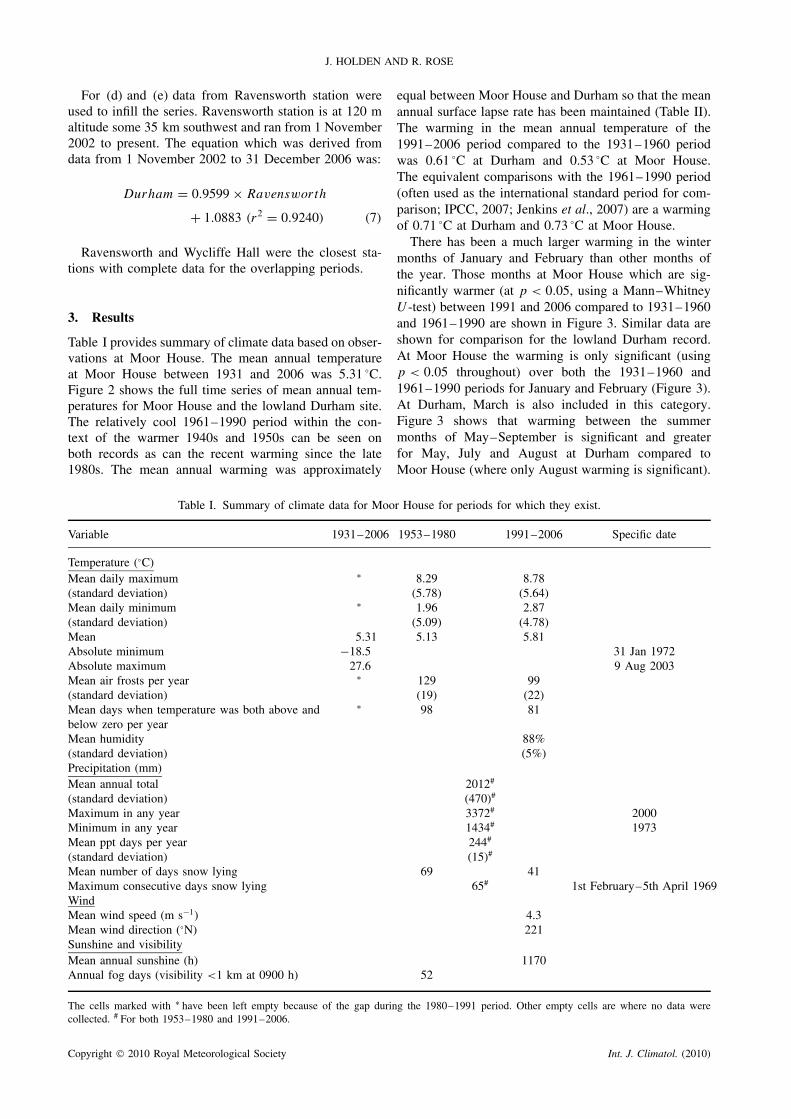
Table I. Summary of climate data for Moor House for periods for which they exist.
Variable 1931–2006 1953–1980 1991–2006 Specific date
Temperature (°C)Mean daily maximum ∗ 8.29 8.78(standard deviation) (5.78) (5.64)Mean daily minimum ∗ 1.96 2.87(standard deviation) (5.09) (4.78)Mean 5.31 5.13 5.81Absolute minimum −18.5 31 Jan 1972Absolute maximum 27.6 9 Aug 2003Mean air frosts per year ∗ 129 99(standard deviation) (19) (22)Mean days when temperature was both above andbelow zero per year
∗ 98 81
Mean humidity 88%(standard deviation) (5%)Precipitation (mm)Mean annual total 2012#
(standard deviation) (470)#
Maximum in any year 3372# 2000Minimum in any year 1434# 1973Mean ppt days per year 244#
(standard deviation) (15)#
Mean number of days snow lying 69 41Maximum consecutive days snow lying 65# 1st February–5th April 1969WindMean wind speed (m s−1) 4.3Mean wind direction (°N) 221Sunshine and visibilityMean annual sunshine (h) 1170Annual fog days (visibility <1 km at 0900 h) 52
The cells marked with ∗ have been left empty because of the gap during the 1980–1991 period. Other empty cells are where no data werecollected. # For both 1953–1980 and 1991–2006.
Copyright 2010 Royal Meteorological Society Int. J. Climatol. (2010)
UPLAND TEMPERATURE CHANGE
Figure 2. Mean annual temperatures for Moor House (1931–2006) and Durham (1851–2006) with five-year moving averages.
Table II. Mean yearly and half-yearly temperatures and lapse rates for measurement periods at Moor House and Durham.
Measurement period Moor House (°C) Durham (°C) Mean lapse rate (°C/100 m)
Oct–Mar Apr–Sept Year Oct–Mar Apr–Sept Year Oct–Mar Apr–Sept Year
1931–2006 1.92 8.65 5.31 5.28 12.27 8.79 0.74 0.80 0.771931–1960 1.75 8.75 5.28 5.16 12.26 8.70 0.75 0.77 0.751961–1990 1.72 8.40 5.08 5.11 12.04 8.60 0.75 0.80 0.781991–2006 2.62 8.96 5.81 5.82 12.74 9.31 0.71 0.83 0.77
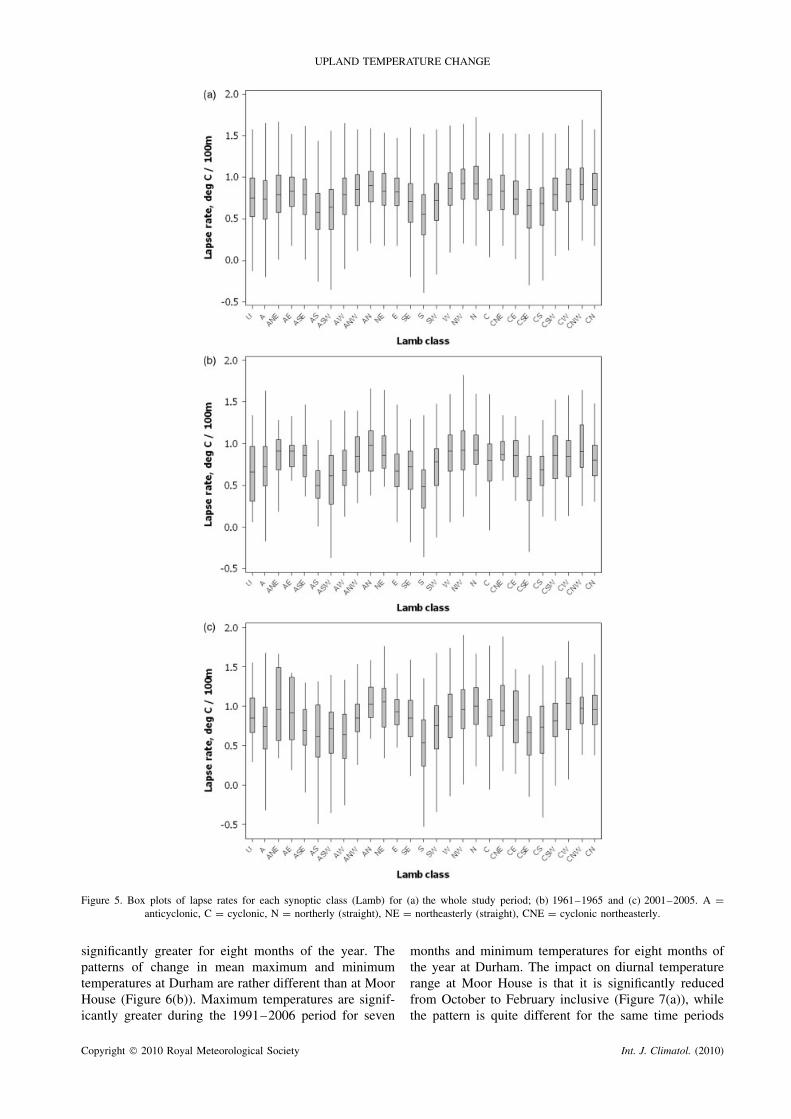
Conversely, winter warming is greater at the uplandMoor House site. The result of these differences is thatseasonal lapse rates have changed. Table II shows thatfor the 1991–2006 period compared with earlier peri-ods the lapse rates have become shallower (less steep)for the winter half-year between the two sites, while thelapse rates have become steeper for the summer half-year (Table II). Figure 4 shows the trend for changesin October–March and April–September surface lapserates between the two stations for the whole time period.The trend is significant for October–March at p = 0.023while it is significant at p < 0.001 for April–September.
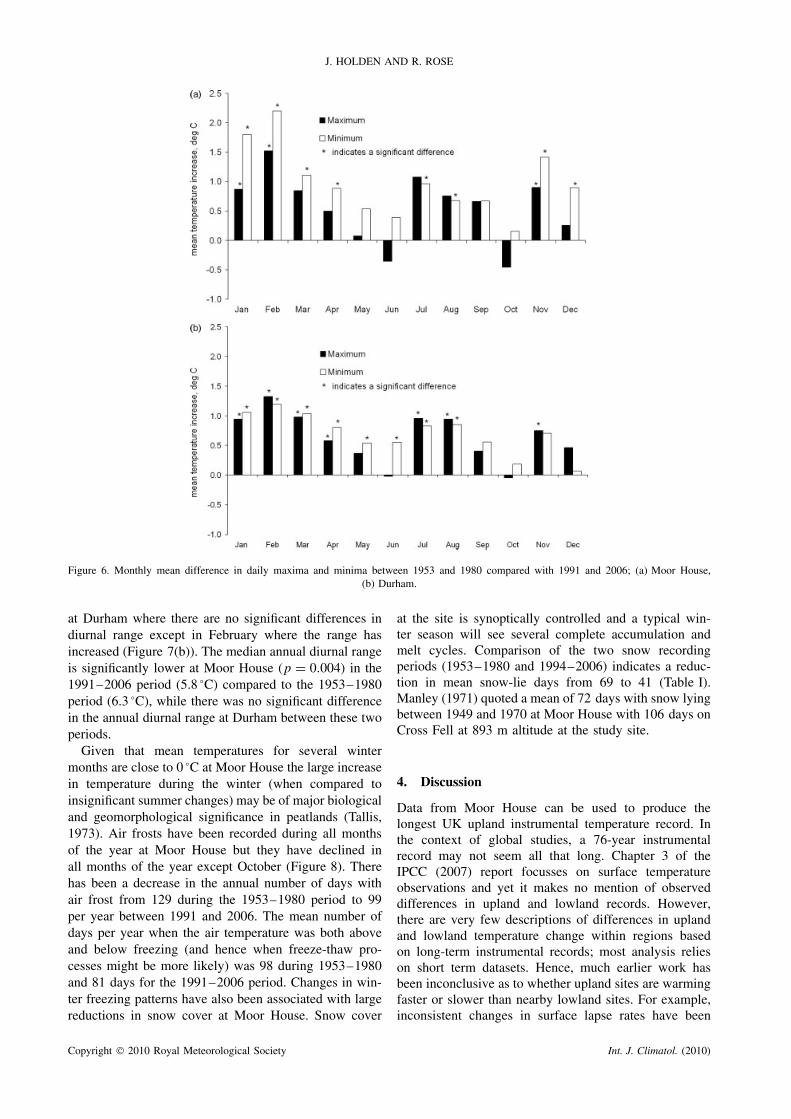
Daily temperature data were used to compute dailylapse rates between the two stations. Each day was alsoassigned a synoptic air flow using the Lamb classification(Lamb, 1972) which is now compiled by the Met OfficeHadley Centre. The daily Lamb classifications for thestudy period were obtained from the British AtmosphericData Centre.
Lapse rates are significantly controlled by synoptic air-flow (Figure 5) with shallower lapse rates associated withsoutherly airflows and steeper lapse rates for northerlyflows. There were no significant changes over the studyperiod, when considered as a whole, in the frequencyof any of the 27 classes of airflow. When data fromthe winter six months are separated from the summersix months, the only significant changes in air flow fre-quency, out of all 54 possible air flow categories (27 sum-mer and 27 winter), were a reduction in straight westerly
(W) air flows in summer (p = 0.023) and increasedsouthwesterly (SW) airflows in winter (p = 0.013).These changes are not sufficient to explain the signif-icant changes in lapse rates seen between the stationsover time. However, comparing Figure 5(b) and (c) sug-gests that changes in lapse rates within particular synopticconditions may be important. Significant changes withtime in daily lapse rates were found for cyclonic westerly(CW) flows (c = 0.151, p = 0.001), cyclonic (C) flows(c = 0.105, p < 0.001), cyclonic northerly (CN) flows(c = 0.014, p = 0.005), westerly (W) flows (c = 0.062,p = 0.006) and unclassified (U) airflows (c = 0.180,p = 0.008). All of these relationships were positive sug-gesting steepening lapse rates over time under thesesynoptic conditions. Synoptic conditions have differenteffects on lapse rates depending on whether it is day(affecting the maximums) or night (affecting the mini-mums) and these patterns are discussed by Pepin (2001)and are not repeated here.
While it is possible for the mean annual temperatureto increase due to both rising minimum and maximumdaily temperatures, it appears that increases in minimumtemperature are greater with a consequent reduction inthe diurnal range at Moor House (Figure 6(a)). Mini-mum temperatures at Moor House during February, forexample, are 2.2 °C warmer between 1991 and 2006 thanbetween 1953 and 1980. Data are only presented formaximum and minimum temperature from 1953–1980
Copyright 2010 Royal Meteorological Society Int. J. Climatol. (2010)
J. HOLDEN AND R. ROSE
Figure 3. Mean monthly temperature increase at (a) Moor House and (b) Durham for the period 1991–2006 compared with 1931–1960 and1961–1990. Fully shaded bars indicate months where temperature difference is statistically significant. Striped bars indicate those months where
there is no significant difference to the 1991–2006 period.
Figure 4. Surface lapse rates ( °C per 100 m) between Moor House (556 m) and Durham (102 m) for half-year periods between 1931 and 2006.Straight lines indicate best-fit trend lines which are significant at p < 0.023 for October–March and p < 0.001 for April–September time series.
compared to 1991–2006 in Figure 6 to ensure robust reli-ability of comparison of maxima and minima, which isparticularly important for analysis of air frost frequency.This is because the homogenization of temperature datafor the 1980–1991 gap period at Moor House was much
stronger when daily means were used rather than per-forming the analysis separately on minima and maxima.At Moor House, maximum temperatures are significantlygreater during the more recent period for only threemonths of the year, while minimum temperatures are
Copyright 2010 Royal Meteorological Society Int. J. Climatol. (2010)
UPLAND TEMPERATURE CHANGE
Figure 5. Box plots of lapse rates for each synoptic class (Lamb) for (a) the whole study period; (b) 1961–1965 and (c) 2001–2005. A =anticyclonic, C = cyclonic, N = northerly (straight), NE = northeasterly (straight), CNE = cyclonic northeasterly.
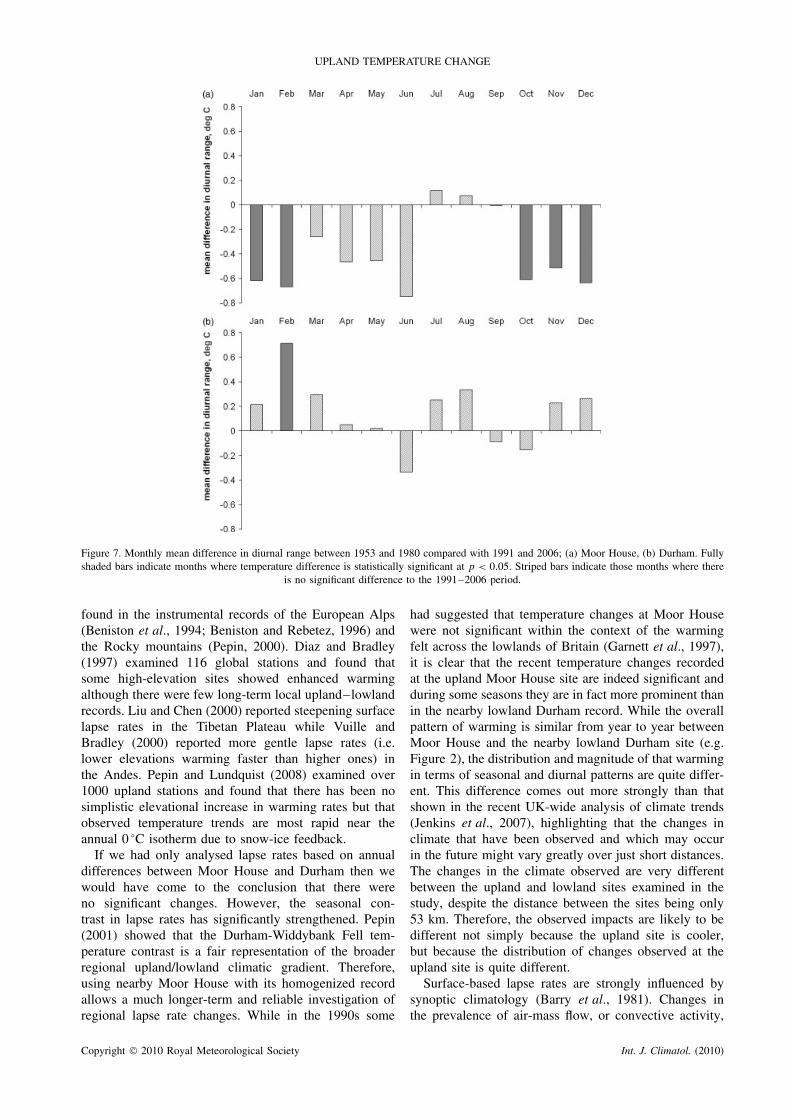
significantly greater for eight months of the year. Thepatterns of change in mean maximum and minimumtemperatures at Durham are rather different than at MoorHouse (Figure 6(b)). Maximum temperatures are signif-icantly greater during the 1991–2006 period for seven
months and minimum temperatures for eight months ofthe year at Durham. The impact on diurnal temperaturerange at Moor House is that it is significantly reducedfrom October to February inclusive (Figure 7(a)), whilethe pattern is quite different for the same time periods
Copyright 2010 Royal Meteorological Society Int. J. Climatol. (2010)
J. HOLDEN AND R. ROSE
Figure 6. Monthly mean difference in daily maxima and minima between 1953 and 1980 compared with 1991 and 2006; (a) Moor House,(b) Durham.
at Durham where there are no significant differences indiurnal range except in February where the range hasincreased (Figure 7(b)). The median annual diurnal rangeis significantly lower at Moor House (p = 0.004) in the1991–2006 period (5.8 °C) compared to the 1953–1980period (6.3 °C), while there was no significant differencein the annual diurnal range at Durham between these twoperiods.
Given that mean temperatures for several wintermonths are close to 0 °C at Moor House the large increasein temperature during the winter (when compared toinsignificant summer changes) may be of major biologicaland geomorphological significance in peatlands (Tallis,1973). Air frosts have been recorded during all monthsof the year at Moor House but they have declined inall months of the year except October (Figure 8). Therehas been a decrease in the annual number of days withair frost from 129 during the 1953–1980 period to 99per year between 1991 and 2006. The mean number ofdays per year when the air temperature was both aboveand below freezing (and hence when freeze-thaw pro-cesses might be more likely) was 98 during 1953–1980and 81 days for the 1991–2006 period. Changes in win-ter freezing patterns have also been associated with largereductions in snow cover at Moor House. Snow cover
at the site is synoptically controlled and a typical win-ter season will see several complete accumulation andmelt cycles. Comparison of the two snow recordingperiods (1953–1980 and 1994–2006) indicates a reduc-tion in mean snow-lie days from 69 to 41 (Table I).Manley (1971) quoted a mean of 72 days with snow lyingbetween 1949 and 1970 at Moor House with 106 days onCross Fell at 893 m altitude at the study site.
4. Discussion
Data from Moor House can be used to produce thelongest UK upland instrumental temperature record. Inthe context of global studies, a 76-year instrumentalrecord may not seem all that long. Chapter 3 of theIPCC (2007) report focusses on surface temperatureobservations and yet it makes no mention of observeddifferences in upland and lowland records. However,there are very few descriptions of differences in uplandand lowland temperature change within regions basedon long-term instrumental records; most analysis relieson short term datasets. Hence, much earlier work hasbeen inconclusive as to whether upland sites are warmingfaster or slower than nearby lowland sites. For example,inconsistent changes in surface lapse rates have been
Copyright 2010 Royal Meteorological Society Int. J. Climatol. (2010)
UPLAND TEMPERATURE CHANGE
Figure 7. Monthly mean difference in diurnal range between 1953 and 1980 compared with 1991 and 2006; (a) Moor House, (b) Durham. Fullyshaded bars indicate months where temperature difference is statistically significant at p < 0.05. Striped bars indicate those months where there
is no significant difference to the 1991–2006 period.
found in the instrumental records of the European Alps(Beniston et al., 1994; Beniston and Rebetez, 1996) andthe Rocky mountains (Pepin, 2000). Diaz and Bradley(1997) examined 116 global stations and found thatsome high-elevation sites showed enhanced warmingalthough there were few long-term local upland–lowlandrecords. Liu and Chen (2000) reported steepening surfacelapse rates in the Tibetan Plateau while Vuille andBradley (2000) reported more gentle lapse rates (i.e.lower elevations warming faster than higher ones) inthe Andes. Pepin and Lundquist (2008) examined over1000 upland stations and found that there has been nosimplistic elevational increase in warming rates but thatobserved temperature trends are most rapid near theannual 0 °C isotherm due to snow-ice feedback.
If we had only analysed lapse rates based on annualdifferences between Moor House and Durham then wewould have come to the conclusion that there wereno significant changes. However, the seasonal con-trast in lapse rates has significantly strengthened. Pepin(2001) showed that the Durham-Widdybank Fell tem-perature contrast is a fair representation of the broaderregional upland/lowland climatic gradient. Therefore,using nearby Moor House with its homogenized recordallows a much longer-term and reliable investigation ofregional lapse rate changes. While in the 1990s some
had suggested that temperature changes at Moor Housewere not significant within the context of the warmingfelt across the lowlands of Britain (Garnett et al., 1997),it is clear that the recent temperature changes recordedat the upland Moor House site are indeed significant andduring some seasons they are in fact more prominent thanin the nearby lowland Durham record. While the overallpattern of warming is similar from year to year betweenMoor House and the nearby lowland Durham site (e.g.Figure 2), the distribution and magnitude of that warmingin terms of seasonal and diurnal patterns are quite differ-ent. This difference comes out more strongly than thatshown in the recent UK-wide analysis of climate trends(Jenkins et al., 2007), highlighting that the changes inclimate that have been observed and which may occurin the future might vary greatly over just short distances.The changes in the climate observed are very differentbetween the upland and lowland sites examined in thestudy, despite the distance between the sites being only53 km. Therefore, the observed impacts are likely to bedifferent not simply because the upland site is cooler,but because the distribution of changes observed at theupland site is quite different.
Surface-based lapse rates are strongly influenced bysynoptic climatology (Barry et al., 1981). Changes inthe prevalence of air-mass flow, or convective activity,
Copyright 2010 Royal Meteorological Society Int. J. Climatol. (2010)

J. HOLDEN AND R. ROSE
Figure 8. Mean frequency of frost days per month at Moor House (a) and Durham (b) comparing the 1991–2006 period with 1953–1980.
over the British Isles may therefore play a role in thedifferences found in seasonal lapse rates during our study.However, out of 27 synoptic classes we only foundone significant change in the winter half-year (increasedstraight southwesterly airflows) and one in the summerhalf-year (reduction in straight westerly air flows). Thesedo not explain the significant changes in summer andwinter lapse rates that we found. Importantly, however,a significant steepening of lapse rates within a numberof synoptic air flow types (westerly, cyclonic westerly,cyclonic northerly and cyclonic) was found.
Most air-masses moving over the British Isles are west-erly from the Atlantic and so sea surface temperatures inthe North Atlantic are likely to be important, potentiallyinfluencing lapse rates within westerly or cyclonic air-masses producing a broad regional-scale signal. Polyakovet al. (2010) have found a general warming trend inthe North Atlantic since the 1920s although this wasoften accentuated by multi-decadal variability. Based ona mean daily temperature record, as westerly air-massesmove inland from a warmer than usual sea, they willmore often become cooled from beneath inland therebyresulting in an overall increased relative stability inlandand shallower daily mean lapse rates. This compares toa cooler sea which would increase instability inland andstrengthen mean daily lapse rates. The role of upwind sea
surface temperatures would explain why changes in meandaily lapse rate are seen mainly in the westerly synoptictypes.
Pepin (2001) showed that increased (warm) sea surfacetemperature anomalies to the west of the UK correlatedwith weaker lapse rates by night, and to a lesser extentduring the day, although most strongly in different partsof the North Atlantic. We did not examine daytimeand night-time daily lapse rates in our data as we onlyanalysed mean daily temperature to keep the analysisas robust as possible (due to the infill calibrations formaxima and minima for the 1980–1991 period beinga lot weaker than those for mean daily temperature).However, Pepin’s (2001) findings may well be manifestat a seasonal scale in our study as the winter half-year has longer night-time hours and we have founda significant weakening of lapse rates in our study forthe October–March half-year. Conversely, we found asignificant strengthening of lapse rates in the summerhalf-year which may be associated with daytime lapserate strengthening. This suggests that our observations,which cover a much longer time period than that used byPepin (2001), are broadly consistent with those in thatearlier study.
Pepin (2001) reported that there was a significantchange between 1968 and 1995 in the latitudinal gradient
Copyright 2010 Royal Meteorological Society Int. J. Climatol. (2010)
UPLAND TEMPERATURE CHANGE
in sea surface temperatures in the North Atlantic imme-diately to the west of the British Isles with more frequentperiods of lower temperatures in the north and highertemperatures in the south. Steepening of latitudinal seasurface temperature gradients were found to be consistentwith the trend towards steeper lapse rates by day andweaker ones at night. Whether these changes in NorthAtlantic sea surface temperature gradients are really adriver of findings manifest in our data through steeperlapse rates in summer and weaker lapse rates in winter,however, requires further investigation.
Our analysis of minima and maxima only used datafrom time periods when data were complete (i.e. nocalibrated data). This was to ensure that the analysis wasrobust since maxima and minima calibrations were foundto be the weakest between Widdybank Fell and MoorHouse while the mean daily and monthly temperatureregressions were very strong. Using the intact periodsof the record we found that minimum temperatureshave increased more than maximum temperatures atMoor House with consequent significant reduction in thediurnal range. At the same time, minimum and maximumtemperatures have changed in approximate tandem atDurham and there is therefore no significant change indiurnal temperature range at the lowland site. The winterwarming and large increase in winter daily minimumtemperatures has been very marked at Moor Housewhen comparing 1991–2006 with the earlier 1953–1980period when there is comparative maximum/minimumdata. The consequent reduction in the frequency of airfrosts represents a 23% decline which is close to theUKCIP08 (2008) 25% frost reduction prediction fornorthern England by 2065 (compared to 1961–1990).This may be significant for erosional and biologicalactivity in the upland peatlands of the UK with impactsfor plant communities and soil organisms which in turnimpact stream water quality (e.g. Cole et al., 2002).Peatlands are very sensitive to climate change, andminor changes in temperature or hydrology can havemarked impacts on their function and carbon cycling(Holden, 2005). Thus, the spatial and temporal natureof temperature change in upland peatland areas is ofconsiderable importance.
The significant reductions in frost and snow cover(Table I) observed at Moor House may provide an impor-tant mechanism that has contributed to decreased winterlapse rates. Pepin and Lundquist (2008) suggested thatthere were faster warming rates at lower temperatures,with particularly enhanced warming at temperatures nearfreezing. This feedback should not be consistent with ele-vation but theoretically should be greatest around 0 °C.They suggested that this process was related to reducedalbedo through decreases in snow and ice cover at alti-tudes around 0 °C. It is notable that mean winter tem-peratures at Moor House are close to zero (1.0 °C inDecember, 0.0 °C in January and −0.2 °C in February).So it is likely that the Moor House–Durham region fitsinto this category and this provides one additional causalmechanism for the observed decreases in winter lapse
rates (i.e. faster rates of warming at the upland site com-pared to the lowland site).
While its location is not at a particularly high altitudeby world standards, the site is itself of internationalimportance through its designation as a World BiosphereReserve. The climate data for Moor House presentedin this paper will be of use to the scientists workingat the site over the coming years. It is recommendedthat workers at the site use data presented in this paperas the standard climatological data when describing siteconditions in their manuscripts (e.g. taken from Table Ior Table II).
5. Conclusion
If this paper had assessed mean annual temperatures alonethen we would conclude that warming at the upland andlowland stations has occurred in tandem. However, ouranalysis shows that the trends in temperature vary greatlybetween the two stations on a monthly and seasonal basis.The differences between the changes observed at MoorHouse compared to Durham include: (1) winter warmingis dominant at Moor House and more pronounced thanat Durham; (2) summer warming is more prominent atDurham than Moor House; (3) minimum temperatureshave increased more than maximum temperatures atMoor House with consequent significant reduction in thediurnal range; (4) minimum and maximum temperatureshave changed in approximate tandem at Durham wherethere is no significant change in diurnal temperaturerange.
While there were no significant changes in the surfacelapse rates for the mean annual temperature, there weresignificant differences in lapse rates within the winterand summer half-years. Indeed the difference between thelapse rate in winter and that in summer has significantlyincreased. It is therefore concluded that we cannot usenearby lowland records to infer the nature of temperaturechange in the uplands and that more work is requiredto understand controls on regional lapse rates and theirchanges within different regions. Most climate modelssuggest enhanced warming at higher altitudes (e.g. Chenet al., 2003). However, our research suggests that cautionis needed and that changes in lapse rates may be seasonalsuch that the lapse rate contrasts between seasons areenhanced while in some regions no changes in theoverall annual lapse rate will be observed. Thus, if resultsfrom models are downscaled based on mean annualtemperature changes then this may mask more importantand significant seasonal lapse rate changes.
Future temperature change in upland areas will be spa-tially variable. This is because the response of local air-mass types is important. We found significant increasesin lapse rates for four (out of 27) air-mass types dur-ing our study period. Therefore, future changes in near-surface lapse rates under climate change may be differ-ent between regions due to the differential local impor-tance (and changes) of air-mass characteristics within
Copyright 2010 Royal Meteorological Society Int. J. Climatol. (2010)
J. HOLDEN AND R. ROSE
regions and the different types of air-masses that dom-inate regions. Thus, we are unlikely to observe consis-tent changes in near-surface lapse rates across the globe(Pepin and Lundquist, 2008) and patterns are likely tovary regionally. There were significant changes (steepen-ing) of lapse rates over time for a few westerly/cyclonicair flow types in our study region.
Additionally, it is suggested that decreased near-surface winter lapse rates may be related to reduced snowcover and albedo at upland sites. Theoretically, wheresnow and ice cover are common, temperature increasesshould be more enhanced closer to 0 °C. The mean wintertemperature at Moor House for December, January andFebruary is 0.2 °C. Hence, local albedo changes need tobe taken into account when assessing whether lowlandrecords can be used to infer nearby upland temperaturechange.
This paper has highlighted the importance of lapse ratestudies and the need to understand the controls on lapserates within local regions (e.g. synoptic controls and theimpact of changing synoptic controls on lapse rates, andcontrols related to changing snow cover) because uplandtemperature changes cannot be inferred from lowlandrecords alone. This has been shown to be the caseeven when the near-surface lapse rate of mean annualtemperature is static. These local controls may mean thatdownscaling of climate model results to infer near-surfacelapse rate changes need to be mediated by an improvedregional understanding of near-surface lapse rate controls.These regional and local processes also mean that we areunlikely to observe a consistent pattern of near-surfacelapse rate change across the world and re-affirm the needto monitor temperature at more high-altitude sites.
Acknowledgements
The work was funded by a Philip Leverhulme Prizeawarded to Joseph Holden. We are grateful to the Envi-ronmental Change Network and the British AtmosphericData Centre for data supplied for this project. We aregrateful to those stations that provide data to the BritishAtmospheric Data Centre for scientific use and as such weacknowledge the original sources of those data, includ-ing the University of Durham. The authors are gratefulto John Adamson (retired member of CEH Lancaster) forthe additional information supplied to aid this project.Thanks are also offered to the referees who helpedimprove the paper.
References
Appenzellera C, Begerta M, Zenklusena E, Scherrerb SC. 2008.Monitoring climate at Jungfraujoch in the high Swiss Alpine region.Science of the Total Environment 391: 262–268.
Barry RG, Kiladis G, Bradley RS. 1981. Synoptic climatology of thewestern United States in relation to climatic fluctuations during thetwentieth century. Journal of Climate 1: 97–113.
Beniston M, Rebetez M. 1996. Regional behavior of minimumtemperatures in Switzerland for the period 1979–1993. Theoreticaland Applied Climatology 53: 231–246.
Beniston M, Rebetez M, Giorgi F, Marinucci R. 1994. An analysisof regional climate change in Switzerland. Theoretical and AppliedClimatology 69: 135–159.
Bradley RI, Milne R, Bell J, Lilly A, Jordan C, Higgins A. 2005. Asoil carbon and land use database for the United Kingdom. Soil Useand Management 211: 363–369.
Burt TP, Horton BP. 2007. Inter-decadal variability in daily rainfall atDurham (UK) since the 1850s. International Journal of Climatology27: 945–956.
Chen B, Chao WC, Liu X. 2003. Enhanced climatic warming in theTibetan plateau due to doubling CO2: a model study. ClimateDynamics 20: 401–413.
Clark JM, Chapman PJ, Adamson JK, Lane SN. 2005. Influence ofdrought-induced acidification on the mobility of dissolved organiccarbon in peat soils. Global Change Biology 11: 791–809.
Cole L, Bardgett RD, Ineson P, Adamson JK. 2002. Relationshipsbetween enchytraeid worms (Oligochaeta), climate change, and therelease of dissolved organic carbon from blanket peat in northernEngland. Soil Biology & Biochemistry 34: 599–607.
Diaz HF, Bradley RS. 1997. Temperature variations during the lastcentury at high elevation sites. Climatic Change 36: 253–279.
Garnett MH, Ineson P, Adamson JK. 1997. A long-term temperaturerecord: no evidence for recent warming. Weather 52: 342–351.
Hilbert DW, Roulet N, Moore T. 2000. Modelling and analysis ofpeatlands as dynamical systems. Journal of Ecology 88: 230–242.
Holden J. 2005. Peatland hydrology and carbon cycling: why small-scale process matters. Philosophical Transactions of the RoyalSociety A 363: 2891–2913.
Holden J. 2007. A plea for more careful presentation of near-surfaceair temperature data in geomorphology. Earth Surface Processes andLandforms 32: 1433–1436.
Holden J, Adamson JK. 2001. Gordon Manley and the north Pennines.Journal of Meteorology, UK 26: 329–333.
Holden J, Shotbolt L, Bonn A, Burt TP, Chapman PJ, Dougill AJ,Fraser EDG, Hubacek K, Irvine B, Kirkby MJ, Reed MS, Prell C,Stagl S, Stringer LC, Turner A, Worrall F. 2007. Environmentalchange in moorland landscapes. Earth-Science Reviews 82: 75–100.
IPCC. 2007. Climate Change 2007: The Physical Science Basis. IPCC,Geneva.
Jenkins G, Perry M, Prior J. 2007. The Climate of the United Kingdomand Recent Trends. Hadley Centre, Met Office: Exeter.
Lamb HH. 1972. British Isles Weather Types and a Register of DailySequence of Circulation Patterns 1861–1971: Geophysical MemoirNo 116. HMSO: London; 85.
Lamb HH. 1981. The life and work of Professor Gordon Manley (1902-1980). Weather 36: 220–231.
Liu XD, Chen BD. 2000. Climatic warming in the Tibetan plateauduring recent decades. International Journal of Climatology 20:1729–1742.
Manley G. 1941. The Durham meteorological record 1847-1940.Quarterly Journal of the Royal Meteorological Society 67: 363–380.
Manley G. 1971. The mountain snows of Britian. Weather 26:192–200.
Manley G. 1974. Central England temperatures: monthly means 1659to 1973. Quarterly Journal of the Royal Meteorological Society 100:389–405.
Manley G. 1980. The northern Pennines revisited: Moor House, 1932-1978. The Meteorological Magazine 109: 281–292.
Morecroft MD, Adamson JK, Lane AMJ. 1997. The environmentalchange network: intergrating climate and ecological monitoring.Weather 52: 6–12.
Pepin NC. 1995. The use of GCM scenario output to model effects offuture climatic change on the thermal climate of marginal maritimeuplands. Geografiska Annaler Series a-Physical Geography 77A:167–185.
Pepin NC. 2000. Twentieth century change in the climate record for theFront Range, Colorado, USA. Arctic, Antarctic and Alpine Research32: 135–146.
Pepin NC. 2001. Lapse rate changes in northern England. Theoreticaland Applied Climatology 68: 1–16.
Pepin NC., Lundquist JD. 2008. Temperature trends at high elevations:Patterns across the globe. Geophysical Research Letters 35: L14701,DOI: 10.1029/2008GL034026.
Pepin NC, Adamson J, Benham D. 2009. Creation of a homogenousclimate record for Widdybank Fell in the Upper Teesdale NationalNature Reserve, northern England: 1968-2006. Theoretical andApplied Climatology 98: 47–56, DOI: 10.1007/s00704-008-0090-9.
Copyright 2010 Royal Meteorological Society Int. J. Climatol. (2010)

UPLAND TEMPERATURE CHANGE
Polyakov IV, Alexeev VA, Bhatt US, Polyakova E, Zhang XD. 2010.North Atlantic warming: patterns of long-term trend andmultidecadal variability. Climate Dynamics 34: 439–457.
Sykes JM, Lane AMJ. 1996. The United Kingdom EnvironmentalChange Network: Protocols for Standard Measurements of TerrestrialSites. Natural Environment Research Council: London; 220.
Tallis JH. 1973. Studies on Southern Pennine Peats 5. Directobservations on peat erosion and peat hydrology at Featherbed Moss,Derbyshire. Journal of Ecology 61: 1–22.
UKCIP08. 2008. UK 21st Century Climate Scenarios. Hadley Centre,Met Office: Exeter.
Vuille M, Bradley RS. 2000. Mean annual temperature trends and theirvertical structure in the tropical Andes. Geophysical Research Letters27: 3885–3888.
Worrall F, Burt T. 2005. Predicting the future DOC flux from uplandpeat catchments. Journal of Hydrology 300: 126–139.
Worrall F, Burt T, Adamson J. 2004. Can climate change explainincreases in DOC flux from upland peat catchments? Science of theTotal Environment 326: 95–112.
Copyright 2010 Royal Meteorological Society Int. J. Climatol. (2010)
Related Documents