Contents lists available at ScienceDirect Atmospheric Research journal homepage: www.elsevier.com/locate/atmosres Lapse rate characteristics in ice clouds inferred from GPS RO and CloudSat observations S. Yang a,b , X. Zou c,⁎ a Joint Center of Data Assimilation for Research and Application, Nanjing University of Information Science & Technology, Nanjing, China b State Key Laboratory of Severe Weather, Chinese Academy of Meteorological Sciences, Beijing, China c Earth System Science Interdisciplinary Center, University of Maryland, College Park, MD, USA ABSTRACT GPS Radio Occultation (RO) cloudy profiles during a seven-year period from 2007 to 2013 over the globe are firstly selected and grouped into four types of ice clouds (e.g., nimbostratus, deep convective, cirrus, altostratus) based on collocated CloudSat data. Vertical temperature profiles within ice clouds below -20 °C are then re- trieved from GPS RO refractivity observations, in which the vertical profiles of ice water content required by the forward model of refractivity are obtained from CloudSat retrievals of ice water content. Vertical distributions of relative humidity and lapse rate within clouds are finally examined in terms of their occurrences, mean values and standard deviations. It is found that ice clouds have preferred values of relative humidity and lapse rate depending on cloud types and altitudes. Most altostratus ice clouds are located between 4 and 8 km with relative humidity between 55 and 75%. The cirrus clouds have a relative humidity around 60% and are located mostly above 6 km to as high as 13 km. Difference from cirrus and altostratus ice clouds, nimbostratus ice clouds that occur mostly in polar regions are found at all altitudes below 10 km with a relative humidity decreasing linearly from about 90% near the surface to about 60% around 6 km. Within deep convective ice clouds, the relative humidity also decreases linearly from about 100% around 2.5 km to about 60% around 9 km. The lapse rate slightly increases with altitude and its value ranges between 5 and 8 °C km -1 within nimbostratus, deep con- vective and altostratus ice clouds. The lapse rate within cirrus clouds varies from 6 °C km -1 to 9 °C km -1 . Vertical variations of the lapse rate derived from GPS RO cloudy retrievals compared favorably to those derived from radiosonde profiles. Both showed that the mean lapse rate increases with altitude from about 5 °C km -1 around 3 km to about 7 °C km -1 around 7 km, and the standard deviations are much smaller than the mean lapse rate. 1. Introduction Clouds are the manifestation of physical processes occurring over a wide range of spatial and temporal scales. Local thermodynamics, large- scale meteorological forcing, boundary layer and cloud-scale circula- tions, and aerosol size and number concentrations could all influence the presence, the type, and both the macro-physical and microphysical characteristics of clouds. We may use the Arctic as an example. Arctic stratocumulus clouds are found during all seasons, peaking in frequency during late summer and autumn and of mixed phase with liquid dro- plets and ice crystals coincide within the same volume of air (e.g., Herman and Goody, 1976; Curry, 1986; Curry et al., 1996). Ad- ditionally, conditions unique to the Arctic – including low solar angles, highly reflective surfaces and a relatively cool and dry atmosphere – generally reverse the net surface radiative effect of these clouds, frequently resulting in a warming at the surface (Walsh and Chapman, 1998; Intrieri et al., 2002; Shupe and Intrieri, 2004; Sedlar et al., 2011). Using observations from late autumn, Sedlar et al. (2011) describe the important role of surface cloud radiative forcing in regulating the sur- face temperature and influencing the transition from Arctic surface melt season to autumn freeze. Curry et al. (1996) pointed out that an un- derstanding of the quasi-persistent, low-level Arctic clouds is critical for understanding the Arctic surface energy budget and lower-atmospheric thermodynamic and turbulence structure, which is as (if not more) important as the Arctic climate warming trend. Large differences of clouds between model simulations and observations were found in the polar areas (Probst et al., 2012). Therefore, simulation of cloud remains to be a great challenge for climate models. The in-situ measurements from radiosonde, aircraft dropsonde, weather balloons (e.g., radiosondes) and field campaign were used as http://dx.doi.org/10.1016/j.atmosres.2017.06.024 Received 30 April 2017; Received in revised form 4 June 2017; Accepted 22 June 2017 ⁎ Corresponding author at: Earth Science System Interdisciplinary Center, University of Maryland, College Park, MD 20740-3823, USA. E-mail address: [email protected] (X. Zou). Atmospheric Research 197 (2017) 105–112 Available online 23 June 2017 0169-8095/ © 2017 Published by Elsevier B.V. MARK

Welcome message from author
This document is posted to help you gain knowledge. Please leave a comment to let me know what you think about it! Share it to your friends and learn new things together.
Transcript

Contents lists available at ScienceDirect
Atmospheric Research
journal homepage: www.elsevier.com/locate/atmosres
Lapse rate characteristics in ice clouds inferred from GPS RO and CloudSatobservations
S. Yanga,b, X. Zouc,⁎
a Joint Center of Data Assimilation for Research and Application, Nanjing University of Information Science & Technology, Nanjing, Chinab State Key Laboratory of Severe Weather, Chinese Academy of Meteorological Sciences, Beijing, Chinac Earth System Science Interdisciplinary Center, University of Maryland, College Park, MD, USA
A B S T R A C T
GPS Radio Occultation (RO) cloudy profiles during a seven-year period from 2007 to 2013 over the globe arefirstly selected and grouped into four types of ice clouds (e.g., nimbostratus, deep convective, cirrus, altostratus)based on collocated CloudSat data. Vertical temperature profiles within ice clouds below −20 °C are then re-trieved from GPS RO refractivity observations, in which the vertical profiles of ice water content required by theforward model of refractivity are obtained from CloudSat retrievals of ice water content. Vertical distributions ofrelative humidity and lapse rate within clouds are finally examined in terms of their occurrences, mean valuesand standard deviations. It is found that ice clouds have preferred values of relative humidity and lapse ratedepending on cloud types and altitudes. Most altostratus ice clouds are located between 4 and 8 km with relativehumidity between 55 and 75%. The cirrus clouds have a relative humidity around 60% and are located mostlyabove 6 km to as high as 13 km. Difference from cirrus and altostratus ice clouds, nimbostratus ice clouds thatoccur mostly in polar regions are found at all altitudes below 10 km with a relative humidity decreasing linearlyfrom about 90% near the surface to about 60% around 6 km. Within deep convective ice clouds, the relativehumidity also decreases linearly from about 100% around 2.5 km to about 60% around 9 km. The lapse rateslightly increases with altitude and its value ranges between 5 and 8 °C km−1 within nimbostratus, deep con-vective and altostratus ice clouds. The lapse rate within cirrus clouds varies from 6 °C km−1 to 9 °C km−1.Vertical variations of the lapse rate derived from GPS RO cloudy retrievals compared favorably to those derivedfrom radiosonde profiles. Both showed that the mean lapse rate increases with altitude from about 5 °C km−1
around 3 km to about 7 °C km−1 around 7 km, and the standard deviations are much smaller than the meanlapse rate.
1. Introduction
Clouds are the manifestation of physical processes occurring over awide range of spatial and temporal scales. Local thermodynamics, large-scale meteorological forcing, boundary layer and cloud-scale circula-tions, and aerosol size and number concentrations could all influencethe presence, the type, and both the macro-physical and microphysicalcharacteristics of clouds. We may use the Arctic as an example. Arcticstratocumulus clouds are found during all seasons, peaking in frequencyduring late summer and autumn and of mixed phase with liquid dro-plets and ice crystals coincide within the same volume of air (e.g.,Herman and Goody, 1976; Curry, 1986; Curry et al., 1996). Ad-ditionally, conditions unique to the Arctic – including low solar angles,highly reflective surfaces and a relatively cool and dry atmosphere –generally reverse the net surface radiative effect of these clouds,
frequently resulting in a warming at the surface (Walsh and Chapman,1998; Intrieri et al., 2002; Shupe and Intrieri, 2004; Sedlar et al., 2011).Using observations from late autumn, Sedlar et al. (2011) describe theimportant role of surface cloud radiative forcing in regulating the sur-face temperature and influencing the transition from Arctic surface meltseason to autumn freeze. Curry et al. (1996) pointed out that an un-derstanding of the quasi-persistent, low-level Arctic clouds is critical forunderstanding the Arctic surface energy budget and lower-atmosphericthermodynamic and turbulence structure, which is as (if not more)important as the Arctic climate warming trend. Large differences ofclouds between model simulations and observations were found in thepolar areas (Probst et al., 2012). Therefore, simulation of cloud remainsto be a great challenge for climate models.
The in-situ measurements from radiosonde, aircraft dropsonde,weather balloons (e.g., radiosondes) and field campaign were used as
http://dx.doi.org/10.1016/j.atmosres.2017.06.024Received 30 April 2017; Received in revised form 4 June 2017; Accepted 22 June 2017
⁎ Corresponding author at: Earth Science System Interdisciplinary Center, University of Maryland, College Park, MD 20740-3823, USA.E-mail address: [email protected] (X. Zou).
Atmospheric Research 197 (2017) 105–112
Available online 23 June 20170169-8095/ © 2017 Published by Elsevier B.V.
MARK
the primary data sources for studying in-cloud thermodynamic struc-tures (Wang and Rossow, 1995; Wang et al., 2000; Sedlar et al., 2012)and for validating and improving climate and weather forecast models(Stephens et al., 1990; Diak et al., 1998; Bayler et al., 2000). However,these in-situ measurements are rare not only over oceans but also inhigh latitudes over land. Although nadir sounders onboard polar-or-biting operational environmental satellites (POES) provide abundantradiance measurements over the entire globe, the vertical thermo-dynamic structures within clouds are poorly resolved. On the contrary,the GPS RO limb-sounding technique provides high vertical resolutionmeasurements of atmospheric refractivity, which is a function of tem-perature, water vapor, liquid water content and ice water content(IWC). The Constellation Observing System for Meteorology, Iono-sphere and Climate/Formosa Satellite Mission #3 (COSMIC/FORMOSAT3, hereafter referred to as COSMIC for brevity) consisted ofsix low-earth-orbiting (LEO) satellites to provide thousands of GPS ROrefractivity profiles each day since April 2006 (Anthes et al., 2008; Fonget al., 2009). These COSMIC GPS RO measurements can be used toobtain vertical profiles of atmospheric temperature and water vapor inclear-sky conditions (Ware et al., 1996).
Lin et al., (2010) developed a GPS RO cloudy retrieval algorithm toobtain in-cloud thermodynamic structures from the GPS RO reflectivitymeasurements. Using a similar GPS RO cloudy retrieval algorithm,Yang and Zou (2013) investigated the characteristics of the in-cloudlapse rate, which is an important physical parameter for both numericalweather prediction (NWP) and climate models. The COSMIC data from2007 to 2010 was used in that study. Whether a GPS RO was located ina clear or cloudy condition is determined by the CloudSat Cloud Pro-filing Radar (CPR) measurements that were collocated with the GPSRO. Sufficiently large data samples were obtained for altostratus andnimbostratus clouds, which were populated in high latitudes.
This study extends the work by Yang and Zou (2013) from a four-year data period to seven years (2007–2013), from two cloud types tofour types, and from without to with a constraint on using the mostaccurate IWC retrievals from CloudSat data products when tempera-tures are below −20 °C. The larger data sample with collocatedCOSMIC GPS ROs and more accurate CloudSat IWC data allowed us tore-examine the vertical distributions of relative humidity and lapse ratefor nimbostratus, deep convective, cirrus and altostratus ice clouds thatwere classified by CloudSat. This was not possible in our previous studywith four years data when a collocation between COSMIC GPS RO andCloudSat CPR measurements is imposed.
The paper is arranged as follows: Section 2 describes GPS RO andCloudSat CPR data and the GPS RO cloudy temperature retrieval al-gorithm. Spatial distributions of COSMIC GPS ROs collocated withCloudSat pure ice clouds (e.g., cirrus, altostratus, nimbostratus anddeep convective) and the vertical distributions of CloudSat IWC mea-surements near GPS ROs are shown in Section 3. Section 4 examines thecharacteristics and differences of relative humidity and lapse rateamong four different cloud types. The lapse rates derived from the GPSRO cloudy retrievals are also compared statistically with radiosondeobservations in section 4. Summary and conclusions are provided inSection 5.
2. A brief description of data and cloudy retrieval algorithm
2.1. GPS RO data
A measurement of GPS RO refractivity at a specified altitude re-presents an integrated effect of the atmospheric refractive on a ray pathof a radio signal emitted by a GPS satellite. Since the atmospheric re-fractivity decreases exponentially with altitude, the ray bends down-ward when it passed through the atmosphere. The largest bending oc-curs at the perigee point. The bending introduces an excess of Dopplershift of the radio signal. The total bending of the ray, called bendingangle, is determined by the atmospheric refractivity and its gradient
magnitudes over a few hundred kilometers scale from the perigee (Zouet al., 1999). The farther the ray is away from the perigee point, thesmaller the impact of the atmosphere to the ray path. As a low-earth-orbiting (LEO) satellite with GPS receiver onboard circulates around theearth (i.e., rises or sets from the horizon), the excess Doppler shift of theradio signals that are continuously transmitted by GPS satellites is se-quentially measured to provide a vertical profile of the excess Dopplershift with increasing or decreasing perigee altitudes. The GPS ROmeasurements of the excess Doppler shift are then converted to verticalprofiles of the atmospheric refractivity through a data processing pro-cedure in which auxiliary information of three-dimensional positionand orbiting velocity of both GPS and LEO satellites are needed. Thelocation (e.g., latitude and longitude) of each GPS RO measurement fora single RO vertical profile changes with altitude. Sokolovskiy et al.(2009a, 2009b) and Schreiner et al. (2010) provided a detailed de-scription of the COSMIC data processing procedure. The GPS ROmeasurements of the atmospheric refractivity are used in this study toderive cloudy temperature profiles and lapse rate.
2.2. CloudSat data
The space-based active nadir pointing CPR level-2 of CloudSatproducts provides measurements of cloud top, cloud base, ice watercontent (IWC), liquid water content (LWC) and cloud type were pro-vided by CloudSat mission based on CPR measurements (Wang andSassen, 2001; CloudSat technical documentation entitled “Level 2Cloud Scenario Classification Product Process Description and InterfaceControl Document⁎”). The CloudSat CPR is a nadir-pointing instrument.An effective CPR field of view (FOV) has an elliptic shape with anacross- and along-track diameters of approximately 1.4 km and 2.5 km,respectively (Tanelli et al., 2008).
The IWC and LWC retrievals from CloudSat CPR measurementswere firstly obtained by assuming the entire radar signal was due to asingle phase of either ice or liquid (Austin, 2007). Since cloud phase(liquid or ice) cannot be determined in any given CPR resolution bin bya proper partitioning of the measured reflectivity between the liquidand ice phases, the two resultant IWC and LWC profiles were thencombined into a composite profile using an empirical scheme as fol-lows. The composite profile takes the portion of the IWC profile whentemperature is colder than −20 °C (e.g., pure ice), and the portion ofthe LWC profile when temperature is warmer than 0 °C (e.g., pure li-quid). For the portion between 0 °C and 20 °C, the ice and liquid so-lutions are simply scaled linearly with temperature to obtain a profilethat smoothly transitions from all ice at −20 °C to all liquid at 0 °C. Forthis reason, this study focuses on the upper portion of ice clouds fromthe altitude at which the temperature reaches -20 °C to cloud top (pureice clouds) within the following four cloud types classified by CloudSatCPR retrieval algorithm: altostratus (As), nimbostratus (Ns), cirrus (Ci),and deep convective (Dc) (Stephens et al., 2002). For brevity, the al-titude at which the temperature reaches −20 °C will be called the pureice cloud base, or simply cloud base from now on.
2.3. Collocation between CloudSat CPR data and GPS ROs
The GPS RO measurements are collocated with the CloudSat CPRdata globally. Collocation between COSMIC GPS RO and CloudSat CPRmeasurements is defined by a temporal difference being less than onehour and a horizontal distance between the CPR cloud location and theCOSMIC data location at the altitude of cloud being less than 100 km.Since different types of clouds have different macro- and micro-physicalproperties and are usually produced by different dynamic processes(Hartmann et al., 1992; Chen et al., 2000), the collocated GPS ROs arefurther grouped into different cloud types during the seven-year time
⁎ http://cloudsat.cira.colostate.edu/dataICDlist.php?go=list & path=/2B-CLDCLASS.
S. Yang, X. Zou Atmospheric Research 197 (2017) 105–112
106
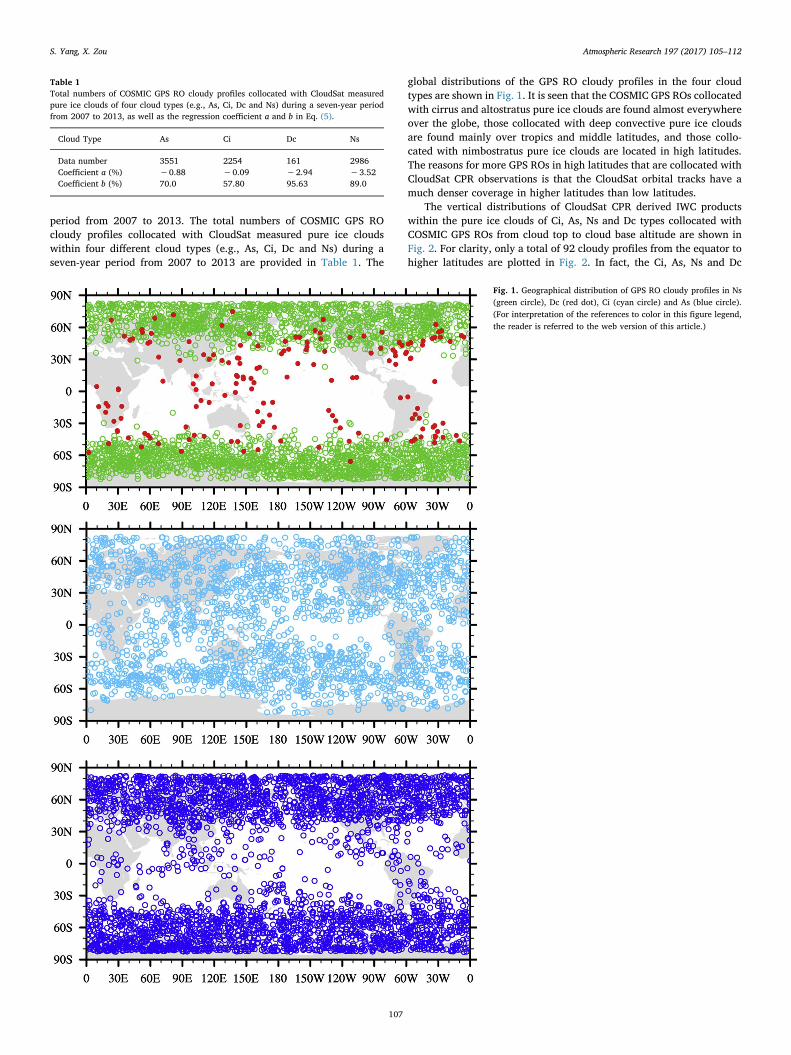
period from 2007 to 2013. The total numbers of COSMIC GPS ROcloudy profiles collocated with CloudSat measured pure ice cloudswithin four different cloud types (e.g., As, Ci, Dc and Ns) during aseven-year period from 2007 to 2013 are provided in Table 1. The
global distributions of the GPS RO cloudy profiles in the four cloudtypes are shown in Fig. 1. It is seen that the COSMIC GPS ROs collocatedwith cirrus and altostratus pure ice clouds are found almost everywhereover the globe, those collocated with deep convective pure ice cloudsare found mainly over tropics and middle latitudes, and those collo-cated with nimbostratus pure ice clouds are located in high latitudes.The reasons for more GPS ROs in high latitudes that are collocated withCloudSat CPR observations is that the CloudSat orbital tracks have amuch denser coverage in higher latitudes than low latitudes.
The vertical distributions of CloudSat CPR derived IWC productswithin the pure ice clouds of Ci, As, Ns and Dc types collocated withCOSMIC GPS ROs from cloud top to cloud base altitude are shown inFig. 2. For clarity, only a total of 92 cloudy profiles from the equator tohigher latitudes are plotted in Fig. 2. In fact, the Ci, As, Ns and Dc
Table 1Total numbers of COSMIC GPS RO cloudy profiles collocated with CloudSat measuredpure ice clouds of four cloud types (e.g., As, Ci, Dc and Ns) during a seven-year periodfrom 2007 to 2013, as well as the regression coefficient a and b in Eq. (5).
Cloud Type As Ci Dc Ns
Data number 3551 2254 161 2986Coefficient a (%) −0.88 −0.09 −2.94 −3.52Coefficient b (%) 70.0 57.80 95.63 89.0
Fig. 1. Geographical distribution of GPS RO cloudy profiles in Ns(green circle), Dc (red dot), Ci (cyan circle) and As (blue circle).(For interpretation of the references to color in this figure legend,the reader is referred to the web version of this article.)
S. Yang, X. Zou Atmospheric Research 197 (2017) 105–112
107

clouds are mostly ice clouds, and very little measurements of LWC arefound from CloudSat CPR measurements for these four cloud types(figure omitted). The cloud top varies greatly for all four types of iceclouds. The pure ice cloud base altitudes at which temperature is−20 °C vary greatly and randomly for Ci and As clouds, remain nearconstant around 8 km for As clouds, and increase with decreasing la-titudes for Dc clouds. As expected, the Dc clouds have larger cloud
depth in the tropics than middle latitudes. The IWC is low for Ci andlarge for Dc clouds. The values of IWC greater than 0.6 g m−3) areobserved in most Dc clouds, but occasionally in As and Ns cloud. The
Ns
Ci
As
Dc
Fig. 2. Vertical distributions of IWC (unit: g m−3) within the pure ice clouds of Ci, As, Nsand Dc types from the cloud top to cloud base for a total of 92 cloudy profiles from theequator to higher latitudes in both hemispheres.
Fig. 3. Vertical distributions of RH within pure ice clouds. The total number of GPS ROcloudy data points at height and RH intervals of 0.4 km and 1%, respectively, is indicatedin color shading.
Fig. 4. Vertical distributions of the lapse rate in pure ice clouds. The total number of GPSRO cloudy data points within each of the 0.2 °C/km lapse rate and 0.4 km altitude in-tervals is indicated in color shading.
S. Yang, X. Zou Atmospheric Research 197 (2017) 105–112
108
IWC is the smallest in Ci clouds, mostly below 0.05 g m−3 and alwaysbelow 0.1 g m−3.
3. A brief description of GPS RO cloudy retrieval algorithm
The GPS observed atmospheric refractivity (Nobs) is a function ofpressure (P), temperature (T), water vapor pressure (Pw), liquid watercontent (LWC) and ice water content (IWC). In clear-sky conditions,refractivity can be calculated by the following equation:
= + ×−N P
TPT
77.6 3.73 10clear sky w52 (1)
where T, P and Pw are the atmospheric temperature (unit: K), pressure(unit: hPa) and water vapor pressure (unit: hPa), respectively. In thepresence of pure ice clouds along a GPS RO ray near the perigee point,the equation for the calculation of refractivity is as follows:
= + × +N PT
PT
q77.6 3.73 10 0.69clear cloudy wi
, 52 (2)
where qi are the IWC (unit: g m−3). Based on Eq. (2), it is seen that the
contributions from the dry atmosphere (i.e., the first term on the right-hand-side of Eq. (2)), water vapor (the second term), and cloud ice (thethird term) to the atmospheric refractivity is additive.
Assuming the atmosphere is saturated within ice clouds, Eq. (2) canbe written as:
= + × +N PT
e TT
q77.6 3.73 10 ( ) 0.69sice cloud s
i5
2 (3)
where es(T) is the saturation water vapor at temperature T. In reality,the atmosphere does not need to be 100% saturated before cloud for-mation. In addition, a GPS RO observation represents a weightedaverage of the atmospheric refraction along a ray path of a radio signalreceived by a LEO satellite receiver. Therefore, clouds may occupy onlya portion of the ray path within a few hundred kilometers distance fromthe perigee point on both sides of the ray. Based on these considera-tions, an observed GPS refractivity can be expressed as a weightedaverage of a clear-sky refractivity (Nclear sky) and a cloudy refractivity(Ns
ice cloud):
= − +N a N aN(1 )model clear skysice cloud (4)
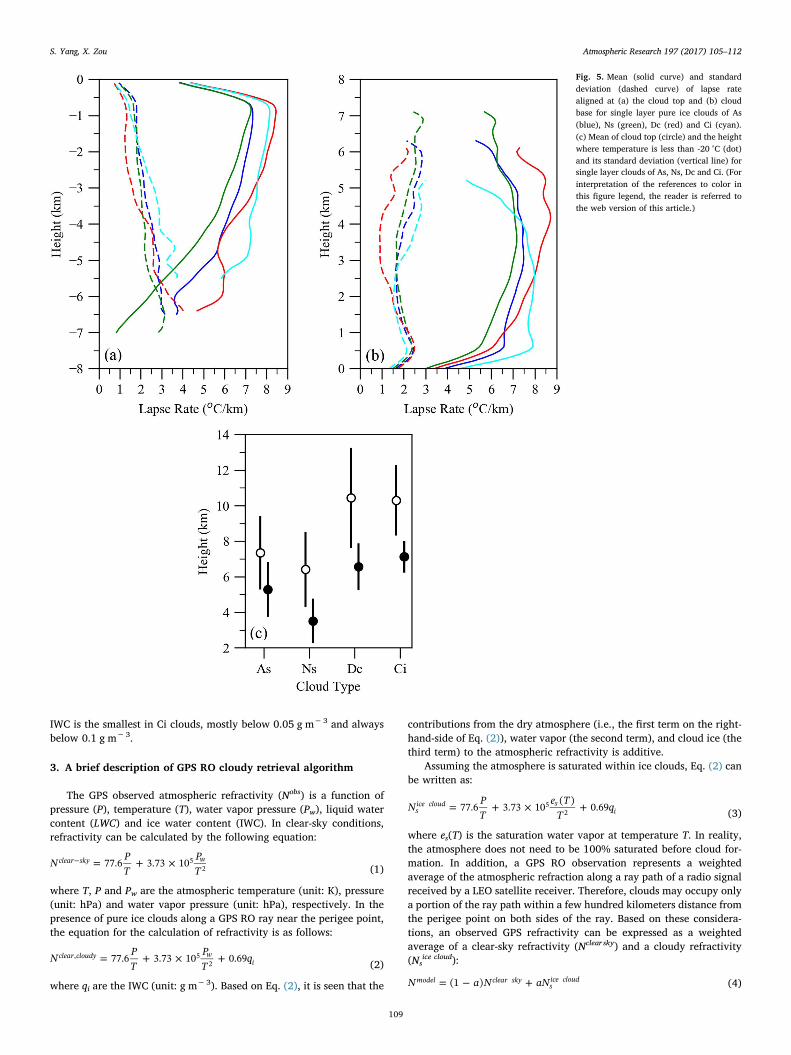
Fig. 5. Mean (solid curve) and standarddeviation (dashed curve) of lapse ratealigned at (a) the cloud top and (b) cloudbase for single layer pure ice clouds of As(blue), Ns (green), Dc (red) and Ci (cyan).(c) Mean of cloud top (circle) and the heightwhere temperature is less than -20 °C (dot)and its standard deviation (vertical line) forsingle layer clouds of As, Ns, Dc and Ci. (Forinterpretation of the references to color inthis figure legend, the reader is referred tothe web version of this article.)
S. Yang, X. Zou Atmospheric Research 197 (2017) 105–112
109
where α is an empirical parameter that is empirically determined as afunction of altitude.
= +a b az (5)
where z represents altitude (unit: km). The parameter α in Eq. (4) is afunction of height and represents a mean relative humidity (RH) alongthe GPS RO ray path (e.g., ~200 km). It is calculated based on ECMWFanalysis. The coefficients (e.g., a and b) in Eq. (5) are obtained by alinear regression to the RH for four different types of clouds. The valuesof a and b are given in Table 1. If α= 1, Nmodel=Ns
cloudy.Based on Eqs. (1)–(4), the modeled atmospheric refractivity in pure
ice clouds is a function of temperature, pressure and IWC, i.e.,Nmodel=Nmodel(T,P,qi)). Taking the IWC (qi) measurements fromCloudSat CPR, the vertical profile of temperature can be derived for anygiven in-cloud profile of GPS RO refractivity. The cloudy retrieval startsfrom the cloud top (ztop) and goes downward level-by-level from cloudtop to cloud base (zbase). Both ztop and zbase are determined by CloudSat
CPR measurements, and the cloud-top temperature (T0) and pressure(p0) are defined as the RO wet temperature and pressure at the cloudtop (ztop). With known temperature and pressure at a specific verticallevel (Tm and Pm at the mth level), the hydrostatic equation is used toderive the pressure at the (m+ 1)th level, which is 0.1 km lower thanthe mth level, assuming saturation of cloudy air. Once the pressure atthe (m+ 1)th level is obtained, the in-cloud temperature for a collo-cated cloudy RO is obtained by finding the minimum of the followingcost function:
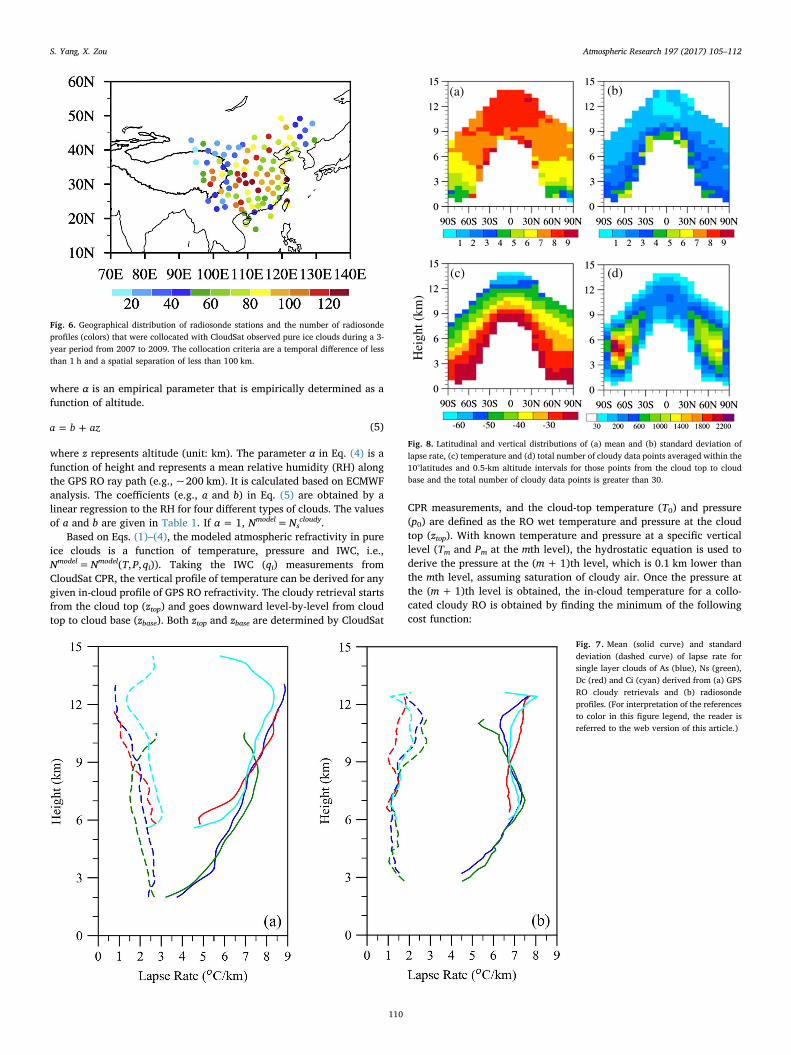
Fig. 6. Geographical distribution of radiosonde stations and the number of radiosondeprofiles (colors) that were collocated with CloudSat observed pure ice clouds during a 3-year period from 2007 to 2009. The collocation criteria are a temporal difference of lessthan 1 h and a spatial separation of less than 100 km.
Fig. 7. Mean (solid curve) and standarddeviation (dashed curve) of lapse rate forsingle layer clouds of As (blue), Ns (green),Dc (red) and Ci (cyan) derived from (a) GPSRO cloudy retrievals and (b) radiosondeprofiles. (For interpretation of the referencesto color in this figure legend, the reader isreferred to the web version of this article.)
(a) (b)
(c)
Hei
ght (
km)
(d)
Fig. 8. Latitudinal and vertical distributions of (a) mean and (b) standard deviation oflapse rate, (c) temperature and (d) total number of cloudy data points averaged within the10°latitudes and 0.5-km altitude intervals for those points from the cloud top to cloudbase and the total number of cloudy data points is greater than 30.
S. Yang, X. Zou Atmospheric Research 197 (2017) 105–112
110

= −+ + +J T N T N( ) ( ( )m
modelm m
obs1 1 1 (6a)
=+ +J T J T( ) min ( )m
cloudT
m1 1 (6b)
The value of Tm+1cloud is determined as the temperature within the
temperature range [Tm+1cloud−10°C, Tm+1
cloud+10°C] to make theEq. (6b) valid at a temperature interval of 0.1 °C interval. It was shownin Yang and Zou (2013) that J(T) assumes an asymmetric parabolicfunction shape with larger gradients on the colder temperature side,meaning the minimum of J(T) exists. A more detailed description of thederivation can be found in Yang and Zou (2013).
4. Characteristics of IWC, relative humidity and lapse rate in pureice clouds
Variations of RH within pure ice are shown in Fig. 3. The totalnumbers of GPS RO cloudy data points calculated at the 0.3-km heightand 1% RH intervals are indicated in color shading. The RH in Ns andDc clouds decreases linearly with altitudes. Specifically, the RH de-creases from about 80% near 2 km to around 50% at about 8 km in Nsclouds. The RH in Dc clouds is higher than that of Ns at the same al-titude. The RH does not vary greatly with altitude. The maximumnumbers of As and Ci clouds are located around 6 km and 8 km, re-spectively.
The lapse rates within four different pure ice clouds are shown inFig. 4. In general, the lapse rate in clouds increases with altitude,varying from about 5 °C km−1 around 3 km to 9 °C km−1 at and above9 km. The lapse rate is the smallest in the Ns ice clouds and the largestin the Ci clouds. The largest number of GPS RO cloudy data points has alapse rate around 7 °C km−1 within As, Ns and Dc ice clouds, and8 °C km−1 in Ci clouds.
We may also align all the pure ice cloudy profiles to their cloud topand cloud base altitudes. Fig. 5 gives the mean lapse rate and standarddeviation for single layer clouds aligned at the cloud top altitudes ofeach type of clouds (Fig. 5a) and the cloud base altitudes where tem-perature reaches −20 °C. Among four different types of ice clouds, thelapse rate is the smallest for the Ns ice clouds, and the largest for the Ciclouds. If aligned at the cloud top, the lapse rate below the cloud topdecreases with the decreasing altitudes. If aligned at the cloud basealtitude, the mean lapse rate remains nearly constant 0.5 km above the−20 °C altitude. The standard deviations of cloud base for Ci and Asare as high as 1.85 km and 1.52 km, respectively, while that for Ns andDc is less than 1 km. Among these four ice cloud types, Ns has thelowest altitude, As has the second lowest, and Ci has the highest alti-tudes of the pure ice cloud base (Fig. 5c). The pure ice cloud base al-titudes do not as much as the cloud top altitudes, especially for Dcclouds.
The lapse rates derived from COSMIC GPS RO measurements can becompared with those derived from radiosonde data. Fig. 6a provides thegeographical distribution of radiosonde stations over China and thenumber of radiosonde profiles that were collocated CloudSat observedpure ice clouds data during a 3-year period from 2007 to 2009. Thecollocation criteria are a temporal difference of less than 1 h and aspatial separation of less than 100 km. The mean and standard devia-tion of lapse rate for single layer clouds of As, Ns, Dc and Ci derivedfrom GPS RO cloudy retrievals (Fig. 7a) and radiosonde profiles(Fig. 7b). Considering the differences between radiosonde data and GPSretrievals especially in terms of the geographical locations, the meanand standard deviation of lapse rate derived from GPS RO cloudy re-trievals (Fig. 7a) are comparable to those derived from the radiosondeobservations (Fig. 7b). Both show that the mean lapse rate increaseswith altitude from about 5 °C km−1 around 3 km to about 7 °C km−1
around 7 km, and the standard deviations are much smaller than themean lapse rate. However, the mean lapse rate derived from GPS ROscontinues to increase with altitude above 7 km while that from radio-sonde data remains nearly constant above 7 km. The standard
deviations of the GPS RO derived lapse rates are smaller in the upperlevels than the low levels but the opposite is true for the radiosondedata.
Fig. 8 presents the latitudinal and vertical variations of the mean(Fig. 8a) and standard deviation (Fig. 8b) of lapse rate, temperature(Fig. 8c) and the total number of cloudy data points (Fig. 8d) calculatedat the 10° latitudes and 0.5-km altitude intervals. The total number ofcloudy data points below 30 is not shown. It is clearly seen that thelapse rate, temperature and pure ice cloud population have strong la-titudinal dependences. The lapse rate increases with height but with adifferent vertical gradient than the temperature variation with height.In other words, the lapse rate decreases with height faster at lower thanhigher altitudes, while the temperature increases with height slower atlower than higher altitudes, especially in low latitudes. Under theconstraint of collocations between GPS ROs and CloudSat CPR data, thelargest number of cloudy profiles is located between 40S and 80S, andthe second largest number of cloudy profiles is found between 40 N and80 N. The largest population of clouds in the tropics is found around11 km.
5. Summary and conclusions
Using a satellite limb-sounding technique, GPS RO offers an in-novative approach for monitoring global atmospheric temperature andmoisture distribution with high accuracy and high vertical resolutionfor studying the lapse rate within clouds. In this study we firstly useCloudsat CPR data to determine the presence of pure ice clouds at thelocations of the COSMIC RO observations. We secondly derive verticalprofiles of global temperature in four different cloud types fromCOSMIC GPS RO refractivity profiles using a similar cloudy retrievalalgorithm as Yang and Zou (2013). Specifically, by introducing a cloudtype dependent relative humidity parameter α we derived a set of in-cloud temperature profiles from a weighted sum of clear-sky and cloudyrefractivity values. Finally, vertical and latitudinal variations of lapserates are derived, discussed and compare with radiosonde data.
Future work includes exploring the potential benefits of having highvertical resolution cloud temperature profiles provided by GPS ROtechniques for improved simulation and application of nadir-soundingobservations of radiance measurements from microwave instrumentson board polar-orbiting operational environmental satellites.Microwave cloudy radiances measure both the emission and scattering,which are determined by cloud temperature and cloud droplet sizedistribution. The vertical profiles of temperature and lapse rate withinclouds are derivable from GPS RO refractivity measurements.Combining these two types of measurements would provide sufficientobservational information for hydrometeor parameters such as dropletsizes and/or LWC and IWC from cloudy radiance observations. Suchstudy would offer insights on how to maximizing the impacts of satellitedata assimilation on climate models when combining a diverse set ofobservations together for validation.
Acknowledgement
This research was supported jointly by the projects of NationalNatural Science Foundation of China (Grants Numbers: 91337218 and41375013), Special Fund for Meteorological Research in the PublicInterest of China (Project Number: GYHY201406008) and JiangsuQinglan Project. All data involved in this study can be obtained byemailing to [email protected].
References
Anthes, R.A., Bernhardt, P.A., Chen, Y., Cucurull, L., Dymond, K.F., Ector, D., Healy, S.B.,Ho, S.-P., Hunt, D.C., Kuo, Y.-H., Liu, H., Manning, K., McCormick, C., Meehan, T.K.,Randel, W.J., Rocken, C., Schreiner, W.S., Sokolovskiy, S.V., Syndergaard, S.,Thompson, D.C., Trenberth, K.E., Wee, T.-K., Yen, N.L., Zeng, Z., 2008. The COSMIC/
S. Yang, X. Zou Atmospheric Research 197 (2017) 105–112
111
FORMOSAT-3 mission: early results. Bull. Am. Meteorol. Soc. 89, 313–333.Austin, R.T., 2007. Level 2B radar-only cloud water content (2B-CWC-RO) process de-
scription document. CloudSat Project Technical Documentation, A NASA EarthSystem Science Pathfinder Mission. 1–24pp.
Bayler, G.M., Aune, R.M., Raymond, W.H., 2000. NWP cloud initialization using GOESsounder data and improved modeling of nonprecipitating clouds. Mon. Weather Rev.128, 3911–3920.
Chen, T., Rossow, W.B., Zhang, Y.C., 2000. Radiative effects of cloud-type variations. J.Clim. 13, 264–286.
Curry, J.A., 1986. Interactions among turbulence, radiation, and microphysics in Arcticstratus clouds. J. Atmos. Sci. 43, 90–106.
Curry, J.A., Rossow, W.B., Randall, D., Schramm, J.L, 1996. Overview of Arctic cloud andradiation conditions. J. Clim. 9, 1731–1764.
Diak, G.R., Anderson, M.C., Bland, W.L., Norman, J.M., Mecikalski, J.M., Aune, R.M.,1998. Agricultural management decision aids driven by real-time satellite data. Bull.Am. Meteorol. Soc. 79, 1345–1355.
Fong, C.-J., Yen, N.L., Chu, C.-H., Yang, S.-K., Shiau, W.-T., Huang, C.-Y., Chi, S., Chen, S.-S., Liou, Y.-A., Kuo, Y.-H., 2009. FORMOSAT-3/COSMIC spacecraft constellationsystem, mission results, and prospect for follow-on mission. Terr. Atmos. Ocean. Sci.20 (1), 1–19. http://dx.doi.org/10.3319/TAO.2008.01.03.01(F3C).
Hartmann, D.L., Ockert-Bell, M.E., Michelsen, M.L., 1992. The effect of cloud type on theearth's energy balance: global analysis. J. Clim. 5, 1281–1304.
Herman, G., Goody, R., 1976. Formation and persistence of summertime arctic stratusclouds. J. Atmos. Sci. 33, 1537–1553.
Intrieri, J.M., Fairall, C.F., Shupe, M.D., Persson, O.G.P., Andreas, E.L., Guest, P., Moritz,R.M., 2002. An annual cycle of Arctic surface cloud forcing at SHEBA. J. Geophys.Res. 107, 8039. http://dx.doi.org/10.1029/2000JC000439.
Probst, P., Rizzi, R., Tosi, E.A., et al., 2012. Total cloud cover from satellite observationsand climate models. Atmos. Res. 107, 161–170. http://dx.doi.org/10.1016/j.atmosres.2012.01.005.
Sedlar, J., Tjernström, M., Mauritsen, T., Shupe, M.D., Brooks, I.M., Persson, P.O.G.,Birch, C.E., Leck, C., Sirevaag, A., Nicolaus, M., 2011. A transitioning Arctic surfaceenergy budget: the impacts of solar zenith angle, surface albedo and cloud radiativeforcing. Clim. Dyn. 37, 1643–1660. http://dx.doi.org/10.1007/s00382-010-0937-5.
Sedlar, J., Shupe, M.D., Tjernström, M., 2012. On the relationship between thermo-dynamic structure, cloud top, and climate significance in the Arctic. J. Clim. 25,2374–2393.
Schreiner, W., Rocken, C., Sokolovskiy, S., Hunt, D., 2010. Quality assessment ofCOSMIC/FORMOSAT-3 GPS radio occultation data derived from single- and double-difference atmospheric excess phase processing. GPS Solutions 14 (1), 13–22. http://
dx.doi.org/10.1007/s10291-009-0132-5.Shupe, M.D., Intrieri, J.M., 2004. Cloud radiative forcing of the Arctic surface: the in-
fluence of cloud properties, surface albedo, and solar zenith angle. J. Clim. 17,616–628.
Sokolovskiy, S., Rocken, C., Schreiner, W., Hunt, D., Johnson, J., 2009a. Postprocessing ofL1 GPS radio occultation signals recorded in open-loop mode. Radio Sci. 44, RS2002.http://dx.doi.org/10.1029/2008RS003907.
Sokolovskiy, S., Schreiner, W., Rocken, C., Hunt, D., 2009b. Optimal noise filtering for theionospheric correction of GPS radio occultation signals. J. Atmos. Ocean. Technol. 26(7), 1398–1403. http://dx.doi.org/10.1175/2009JTECHA1192.1.
Stephens, G.L., Tsay, S.C., Stackhouse, J.P.W., Flatau, P., 1990. The relevance of themicrophysical and radiative properties of cirrus clouds to climate and climaticfeedback. J. Atmos. Sci. 47, 1742–1753.
Stephens, G.L., Vane, D.G., Boain, R.J., Mace, G.G., Sassen, K., Wang, Z., Illingworth, A.J.,O'Connor, E.J., Rossow, W.B., Durden, S.L., Miller, S.D., Austin, R.T., Benedetti, A.,Mitrescu, C., CloudSat Science Team, 2002. The CloudSat mission and the A-train: anew dimension of space-based observations of clouds and precipitation. Bull. Am.Meteorol. Soc. 83, 1771–1790.
Tanelli, S., Durden, S.L., Im, E., Pak, K.S., Reinke, D.G., Partain, P., Haynes, J.M.,Marchand, R.T., 2008. CloudSat's cloud profiling radar after two years in orbit:performance, calibration, and processing. IEEE Trans. Geosci. Remote Sens. 46,3560–3573.
Walsh, J.E., Chapman, W.L., 1998. Arctic cloud–radiation–temperature associations inobservational data and atmospheric reanalyses. J. Clim. 11, 3030–3044.
Wang, J., Rossow, W.B., 1995. Determination of cloud vertical structure from upper-airobservations. J. Appl. Meteor. 34, 2243–2258.
Wang, Z., Sassen, K., 2001. Cloud type and macrophysical property retrieval using mul-tiple remote sensors. J. Appl. Meteorol. 40, 1665–1682.
Wang, J.H., Rossow, W.B., Zhang, Y.C., 2000. Cloud vertical structure and its variationsfrom a 20-yr global rawinsonde dataset. J. Clim. 13, 3041–3056.
Ware, R., Rocken, C., Exner, M., Feng, D., Herman, B., Gorbunov, M., Hardy, K., Kuo, Y.,Meehan, T., Melbourne, W., 1996. GPS sounding of the atmosphere from low Earthorbit: preliminary results. B. Am. Meteorol. Soc. 77, 19–40.
Yang, S., Zou, X., 2013. Temperature profiles and lapse rate climatology in altostratus andnimbostratus clouds derived from GPS RO data. J. Clim. 26 (16), 6000–6014.
Zou, X., Vandenberghe, F., Wang, B., Gorbunov, M.E., Kuo, Y.-H., Sokolovskiy, S., Chang,J.C., Sela, J.G., Anthes, R., 1999. A ray-tracing operator and its adjoint for the use ofGPS/MET refraction angle measurements. J. Geophys. Res. 104 (D18),22,301–22,318.
S. Yang, X. Zou Atmospheric Research 197 (2017) 105–112
112
Related Documents