www.morganmarkets.com North America Equity Research 05 December 2012 Telecom Services & Towers Spectrum Overview & Valuation Matrix - Carrier by Carrier Spectrum Value Across the Wireless Industry Telecom Services / Cable & Satellite Philip Cusick, CFA AC (1-212) 622-1444 [email protected] Eric Pan, CFA (1-212) 622-5623 [email protected] Richard Choe (1-212) 622-6708 [email protected] Derya Erdemli, CFA (1-212) 622-8529 [email protected] J.P. Morgan Securities LLC See page 30 for analyst certification and important disclosures. J.P. Morgan does and seeks to do business with companies covered in its research reports. As a result, investors should be aware that the firm may have a conflict of interest that could affect the objectivity of this report. Investors should consider this report as only a single factor in making their investment decision. Spectrum is the lifeblood of wireless companies. It is a finite resource that is difficult to obtain and held onto tightly once won. We look at the spectrum holdings of 11 companies and provide a valuation framework based upon the most recent large scale auctions, the 700 MHz (2008) and AWS (2006). In our view, spectrum valuation is more art than science with valuations swinging widely due to supply and demand and not around a stable, precise value, so think about this as a base-case valuation methodology. Additionally, in this report we show each carrier's spectrum by geography including a graphical representation that demonstrates channel width. Framework for spectrum valuations. Our valuation framework for spectrum valuations is based upon the 700 MHz auction in 2008 and AWS auction in 2006. We assign a 30% premium to cellular spectrum over 700 MHz auction values due to its more attractive band quality. We add a 30% premium for top 100 markets vs. a 10% premium for the remaining markets. We estimate AWS auction values have increased from the 2006 auction with a 40% increase for top 100 markets and a flat valuation for non-top 100 markets. In less commonly used bands we estimate a 30% discount to current AWS prices for MMDS spectrum (DISH) and 50% for 2.5 GHz (CLWR). AT&T and Verizon have the largest and most valuable spectrum holdings. We estimate AT&T’s 90 MHz of mobile spectrum (excluding WCS) is worth about $31b at average $/MHz-pop prices of $1.30. Verizon’s 99 MHz of nationwide spectrum is worth almost $36b driven by a substantial 700 MHz spectrum position. As of 3Q12, AT&T valued its spectrum at $52b on its balance sheet and Verizon $78b, well above our valuations. Sprint and T-Mobile spectrum positions valued at $15b and $13b respectively. We calculate Sprint’s spectrum value at $15b with its 50 MHz of total spectrum of which 14 MHz is cellular and 36 MHz of PCS spectrum. T-Mobile USA's 58 MHz of PCS/AWS spectrum is worth $13b at an average of $0.77 MHz/pop. Sprint values its spectrum as of 3Q12 at $21b and T-Mobile USA at $14b. MetroPCS spectrum valued at $2.4b and Leap at $2.0b. Our analysis of MetroPCS and Leap spectrum for its PCS and AWS holdings focused on licenses and prices paid on a per market basis. We value MetroPCS spectrum at $2.4b and Leap at $2.0b. The carrying value of each company’s spectrum is $2.6b for MetroPCS and $1.8b for Leap. US Cellular has $1.5b in spectrum value and nTelos ~$109m. We value US Cellular’s spectrum at $1.5b and nTelos’s spectrum at $109m. USM's spectrum carrying value is $1.5b and $132m for NTLS. We provide spectrum valuations for Clearwire and DISH Network as well as potential future auctions. In the report below, we estimate values for the spectrum holdings for the potential alternative carriers. We estimate that, if sold, Dish’s spectrum position could be worth $7.1 billion at $0.52/MHz-pop and Clearwire’s $11.9 billion at $0.28/MHz-pop.

Welcome message from author
This document is posted to help you gain knowledge. Please leave a comment to let me know what you think about it! Share it to your friends and learn new things together.
Transcript

www.morganmarkets.com
North America Equity Research05 December 2012
Telecom Services & TowersSpectrum Overview & Valuation Matrix - Carrier by Carrier Spectrum Value Across the Wireless Industry
Telecom Services / Cable & Satellite
Philip Cusick, CFA AC
(1-212) 622-1444
Eric Pan, CFA
(1-212) 622-5623
Richard Choe
(1-212) 622-6708
Derya Erdemli, CFA
(1-212) 622-8529
J.P. Morgan Securities LLC
See page 30 for analyst certification and important disclosures.J.P. Morgan does and seeks to do business with companies covered in its research reports. As a result, investors should be aware that the firm may have a conflict of interest that could affect the objectivity of this report. Investors should consider this report as only a single factor in making their investment decision.
Spectrum is the lifeblood of wireless companies. It is a finite resource that is difficult to obtain and held onto tightly once won. We look at the spectrum holdings of 11companies and provide a valuation framework based upon the most recent large scale auctions, the 700 MHz (2008) and AWS (2006). In our view, spectrum valuation is more art than science with valuations swinging widely due to supply and demand and not around a stable, precise value, so think about this as a base-case valuation methodology. Additionally, in this report we show each carrier's spectrum by geography including a graphical representation that demonstrates channel width.
Framework for spectrum valuations. Our valuation framework for spectrum valuations is based upon the 700 MHz auction in 2008 and AWS auction in 2006. We assign a 30% premium to cellular spectrum over 700 MHz auction values due to its more attractive band quality. We add a 30% premium for top 100 markets vs. a 10% premium for the remaining markets. We estimate AWS auction values have increased from the 2006 auction with a 40% increase for top 100 markets and a flat valuation for non-top 100 markets. In less commonly used bands we estimate a 30% discount to current AWS prices for MMDS spectrum (DISH) and 50% for 2.5 GHz (CLWR).
AT&T and Verizon have the largest and most valuable spectrum holdings. We estimate AT&T’s 90 MHz of mobile spectrum (excluding WCS) is worth about $31b at average $/MHz-pop prices of $1.30. Verizon’s 99 MHz of nationwide spectrum is worth almost $36b driven by a substantial 700 MHz spectrum position. As of 3Q12, AT&T valued its spectrum at $52b on its balance sheet and Verizon $78b, well above our valuations.
Sprint and T-Mobile spectrum positions valued at $15b and $13b respectively.We calculate Sprint’s spectrum value at $15b with its 50 MHz of total spectrum of which 14 MHz is cellular and 36 MHz of PCS spectrum. T-Mobile USA's 58 MHz of PCS/AWS spectrum is worth $13b at an average of $0.77 MHz/pop. Sprint values its spectrum as of 3Q12 at $21b and T-Mobile USA at $14b.
MetroPCS spectrum valued at $2.4b and Leap at $2.0b. Our analysis of MetroPCS and Leap spectrum for its PCS and AWS holdings focused on licenses and prices paid on a per market basis. We value MetroPCS spectrum at $2.4b and Leap at $2.0b. The carrying value of each company’s spectrum is $2.6b for MetroPCS and $1.8b for Leap.
US Cellular has $1.5b in spectrum value and nTelos ~$109m. We value US Cellular’s spectrum at $1.5b and nTelos’s spectrum at $109m. USM's spectrum carrying value is $1.5b and $132m for NTLS.
We provide spectrum valuations for Clearwire and DISH Network as well as potential future auctions. In the report below, we estimate values for the spectrum holdings for the potential alternative carriers. We estimate that, if sold, Dish’s spectrum position could be worth $7.1 billion at $0.52/MHz-pop and Clearwire’s $11.9 billion at $0.28/MHz-pop.

2
North America Equity Research05 December 2012
Philip Cusick, CFA(1-212) [email protected]
Wireless Spectrum Overview
Spectrum is the lifeblood of wireless companies. It is a finite resource that is difficult to obtain and held onto tightly once it is won. We look at the spectrum holdings of 11companies and provide a valuation framework based upon the most recent large scale auctions, the 700 MHz (2008) and AWS (2006) auctions. In our view, spectrumvaluations are floor valuations, which can swing widely given technology, usage, carrier interest and capital availability. The overall value of AT&T’s and Verizon’s wireless businesses are substantially greater than spectrum value due to subscribers and networks, despite both having the largest and most highly valued spectrum positions. In our view, spectrum valuation is more art than science with valuations swinging widely due to supply and demand and not around a stable, precise value.
In the US there currently is roughly 200 MHz of spectrum allocated to the 2G and 3G technologies, while the 4G allocation is roughly 300 MHz depending on how one counts it.
Figure 1: Wireless Spectrum Summary
Source: Company reports and J.P. Morgan estimates.
In general, the lower the frequency the farther a signal will travel and be useful (propagate) at a given power. Thus, lower frequencies like 700 MHz and 800 MHzbands are better for covering large distances and penetrating buildings than the PCS or AWS bands. More debatable is the value of high-frequency spectrum when trying to cover an urban area that needs high cell-site density anyway. How well Clearwire’s 4G network loads and its economies over time will be interesting to watch against Verizon’s lower-frequency 700 MHz build.
Common Band Name Frequency Bandwidth 2G/3G/4G CommentsCellular 800/850 MHz 64 MHz 2G/3G 50 MHz given to industry in the 80's. 14MHz owned by Sprint through Nextel spectrum swap
PCS 1900 MHz 130 MHz 2G/3G/4G 120 MHz auctioned in mid-90's. Includes 10 MHz of G-Block spectrum owned by Sprint not in useAWS 1.7/2.1 GHz 90 MHz 3G/4G 2006 Auction. T-Mobile and VZ own ~30 MHz for 4G. T owns ~20 MHz for 4G.700 700 MHz 52 MHz 4G 2008 Auction. Mostly owned by AT&T, Verizon, DISH Network
2.5 2.5/2.6 GHz 150 MHz 4G Owned by Clearwire, allocated to 4GMMDS/AWS-4 2.0/2.2 GHz 40 MHz 4G Owned by DISH Network, allocated to 4G
2G/3G total ~200 MHz4G total ~300 MHz

3
North America Equity Research05 December 2012
Philip Cusick, CFA(1-212) [email protected]
Figure 2: Illustration of Signal Propagation at 800 MHz and 1900 MHz
Source: J.P. Morgan.
Spectrum Positions
We have broken down the spectrum position for the major carriers into six major categories. Since all spectrum is not created equal, the specific band and depth in each band are key in evaluating a carriers spectrum position and its potential value. Generally, the lower the band the better propagation and higher value, and spectrum depth enables larger channels and greater capacity. For the national companies we use an average of spectrum holdings for the top 100 markets. For the unlimited and regional players we only averaged the spectrum using markets where each carrier had spectrum and not across the entire top 100.
Figure 3: Average Spectrum Holdings of Major Carriers in Top 100 Markets
* Does not include sale of USM Midwest markets to Sprint
** Dish has 6 MHz of 700 MHz spectrum across 217m pops
*** Congress estimates 84 MHz could be auctioned nationwide
Cellular PCS AWS 700 MHz
MMDS
/AWS-4 WCS 2.5 GHz
Total
(weighted
avg)
AT&T 24 34 5 27 89 Verizon 25 19 30 31 105 T-Mobile - 27 35 - 62
Sprint* 14 36 - - 50 MetroPCS - 8 12 1 21 Leap - 6 14 1 20 US Cellular* 4 9 8 3 23 NTELOS - 22 4 - 25
Clearwire - - - - - 150 150 Spectrum in bands in use today 54 130 90 52 - - 150 476
LightSquared - - - - 20 - 20 DISH Network** - - - 6 40 - 44
Broadcast*** - - - 84 - - 84 Federal**** - 10 - - - 10 Spectrum with visibility to use 54 140 90 136 60 20 150 650

4
North America Equity Research05 December 2012
Philip Cusick, CFA(1-212) [email protected]
**** 10 MHz H-block
Source: J.P. Morgan estimates, FCC data.
Figure 4: Average Spectrum Holdings of Major Carriers Nationwide
* Does not include sale of USM Midwest markets to Sprint
** Dish has 6 MHz of 700 MHz spectrum across 217m pops
*** Congress estimates 84 MHz could be auctioned nationwide
**** 10 MHz H-block
Source: J.P. Morgan estimates, FCC data.
Verizon at 105 MHz in top 100 markets has the largest spectrum position, for now
Verizon not only has the most spectrum (with the exception of Clearwire), but the most in lower bands. The company has 56 MHz of cellular/700 MHz spectrum with 25 MHz on average in cellular and 31 MHz in 700 MHz. Verizon has about 49 MHz of PCS/AWS spectrum with 19 MHz in PCS and 30 MHz in AWS for the top 100 markets.
Verizon’s 2G/3G CDMA is built on the company's 800 MHz and PCS spectrum frequencies, which are each nearly nationwide. Its 4G network however is being deployed on its nationwide 700 MHz C-Block spectrum as well as its nationwide AWS spectrum. By deploying on contiguous nationwide blocks Verizon should over time have a simpler and possibly less expensive network operation. The company paid nearly $4 billion in 2012 for 20 MHz of nationwide AWS spectrum, and $4.7billion in 2008 for the 22 MHz 700 C-Block.
Additionally, as part of the AWS acquisition in 2012 Verizon offered to sell its 700 MHz A and B-Block spectrum licenses, which it paid $4.6 billion for in 2008. The company has said that it doesn’t need the spectrum, and will sell it for the right price. We estimate that the spectrum is still worth the $4.6 billion that Verizon paid - $2.6 billion for 148m pops in the 12 MHz A-block and $2.05 billion for 46m pops in the 12 MHz B-Block licenses. AT&T owns the rest of the B-Block nationwide and is the most likely buyer, while the A-Block is spread across a number of carriers. Verizon
Avg. Spectrum Holding (MHz)
Cellular PCS AWS 700 MHz
MMDS
/AWS-4 WCS 2.5 GHz
Total
(weighted
avg)
AT&T 22 34 4 23 90 Verizon 25 17 28 29 99 T-Mobile 0 26 33 - 58 Sprint* 14 36 - - 50 MetroPCS - 7 11 1 19
Leap - 6 13 1 19 US Cellular* 7 7 7 5 25 NTELOS - 23 3 - 26 Clearwire - - - - - 135 135 Spectrum in bands in use today 54 130 90 52 - - 150 476
LightSquared - - - - 20 - 20 DISH Network* - - - 6 40 - 44 Broadcast** - - - 84 - - 84 Federal*** - 10 - - - - 10 Spectrum with visibility to use 54 140 90 136 60 20 150 650

5
North America Equity Research05 December 2012
Philip Cusick, CFA(1-212) [email protected]
has already agreed to sell some smaller markets to new entrants, and has said that we will get more information on the sale in January 2013.
AT&T has ~89 MHz in top 100 markets, and is likely to gain WCS, 700
AT&T has an average of ~89 MHz total including a combined 51 MHz in low frequency cellular/700 MHz bands – ~24 MHz of cellular and 27 MHz on average in 700 MHz for the top 100 markets. Note that including a number of smaller deals that it has pending AT&T estimates it has 94 MHz in the top 100 markets and 90 MHz nationwide.
While its 700 MHz spectrum holdings aren’t as clean as Verizon’s, AT&T does have 700 spectrum in essentially every market and 30 MHz of spectrum in many of the top 100 markets. By buying the remainder of Verizon’s B-band spectrum and potentially some of the A-band AT&T could make its deployment of LTE far easier. AT&T has spent a total of $9.1b for 700 MHz spectrum with $6.6b in the 2008 auction and an additional $2.5b for the Aloha spectrum. AT&T bought an additional 12 MHz of 70m pops and 6 MHz of 230m pops of 700 MHz spectrum from Qualcomm in 2011for $1.925b. All in, we estimate AT&T paid about $1.65 MHz/pop for its 700 MHz spectrum.
Additionally AT&T has PCS spectrum essentially nationwide – an average of 34MHz across the country. Its AWS spectrum position though was weakened after paying a break-up fee to T-Mobile USA and the company has 10 to 20 MHz in only 10 of the top 50 markets - mostly areas where it is weak in the 700 band. AT&T has noted it expects to use AWS for LTE services, but if it bought more 700 band spectrum from Verizon we would not be surprised to see AWS de-emphasized over time.
Interestingly though, AT&T is in the process of closing on acquisitions which will allow it to control the majority of the WCS spectrum band, a 30 MHz block in the 2.3 GHz range. This nearly nationwide 10x10 block of spectrum could be a big asset to AT&T's LTE rollout over time. AT&T currently has ~40% of the WCS spectrum nationwide and is buying another ~50% of the block from companies including NextWave, Comcast, and Horizon. We believe that the only remaining significant holder of WCS spectrum is Sprint which owns ~10% of the band, predominately in the southern US. See below for more information on WCS.
Sprint has ~50 MHz of spectrum in the 800 and PCS bands
Sprint has 14 MHz of cellular spectrum from Nextel and 36 MHz in the PCS band on average in both top 100 and all markets for 50 MHz total. Rather than being capacity constrained though given its smaller spectrum allocation than AT&T or Verizon, half of that spectrum is nearly empty today.
Sprint historically has offered CDMA service using the PCS band and Nextel service in the 800 MHz band. As Nextel goes away though Sprint has been rolling out CDMA voice service in the 800 band and over time we expect to see 800 MHz data as well as LTE voice/data in this band as well. Additionally Sprint has a clean 10MHz slice of spectrum that it is currently using for LTE in the PCS G-Block. Over time we expect Sprint to use more PCS for data as voice moves to 800 MHz.

6
North America Equity Research05 December 2012
Philip Cusick, CFA(1-212) [email protected]
T-Mobile has 58 MHz of spectrum nationwide and MetroPCS 19 MHz in its markets
T-Mobile USA has 26 MHz of PCS spectrum and 33 MHz of AWS for a total of 58MHz. The company has contracted to merge with MetroPCS, and when combined with Metro’s PCS and AWS spectrum the resulting company will have on average 77MHz of spectrum in areas where they both operate today.
In its top 20 markets with coverage MetroPCS has on average 21 MHz of spectrum, with 10 MHz dedicated to LTE in essentially every market. In the individual bands and markets, MetroPCS has on average 15 MHz in PCS across 53m pops, 13 MHz in AWS across 85m pops and 12 MHz in 700MHz across 7m pops in the top 100 markets.
T-Mobile is in the process of adjusting its network to balance traffic load and match AT&T’s 3G/4G band plan. The company is moving its 3G/HSPA network to the PCS band (similar to AT&T), clearing its AWS spectrum for 4G/LTE technology. Thus far T-Mobile has 15 markets with HSPA+ in the 1900 band, and expects to be essentially nationwide by mid-2013. Further, the company expects to start launching LTE into its markets in the second half of 2013 and be completely rolled out with LTE by the end of that year.
Leap is balancing CDMA and LTE in ~20 MHz of spectrum
In its top 20 markets with coverage Leap Wireless has on average 20 MHz of spectrum. Its spectrum holdings are split between 12 MHz across 53m pops in the PCS band and 14 MHz across 91m pops in the AWS band. Leap has said that it is using only a minority of its spectrum today for 2G/3G services, and has at least 3x3channels ready for LTE in most/all of its markets. The company today offers LTE service in 11 markets that covers ~21 million pops and expects to roll out LTE to about 2/3 of covered pops in the next year or two.
US Cellular has 25 MHz of cellular spectrum in most markets as well as PCS remaining in key areas, but is in the process of selling its non-core PCS markets to Sprint
US Cellular has a 25 MHz cellular license in eight of the top 100 markets. Additionally, it has 19 MHz of PCS across 30m pops, 15 MHz of AWS across 15m pops, and 12 MHz of 700 MHz across 6m pops.
US Cellular recently inked an agreement with Sprint to sell its Chicago, St. Louis, Central Illinois, and parts of the Indiana/Michigan/Ohio markets where it does not have cellular licenses for $480m. The deal includes the customer base (585k) and most of the PCS licenses in these markets but does not include the network infrastructure. We estimate the value of the PCS licenses to be ~$285m of the transaction value, or $1.23/MHz-Pop.
Clearwire has the largest spectrum position, but 2.5 GHz has propagation and ownership issues
Clearwire has the largest holdings of any carrier with 42 billion MHz-pops in the 2.5 GHz band, including 150 MHz in the top 100 markets. While much of the spectrum is leased and licenses cannot be transferred, we believe that Clearwire’s leases are sufficiently long term that they can be treated as owned for this analysis. Clearwire is ~51% owned by Sprint.

7
North America Equity Research05 December 2012
Philip Cusick, CFA(1-212) [email protected]
150 MHz is a tremendous amount of spectrum, and we believe in the long term could have substantial value. While the propagation is not impressive compared to 800 MHz or even PCS band spectrum, we believe that the band is fine to be used for outdoor hotspot spectrum, or indoor in DAS or small cell implementations to create a lot of capacity in a small environment. This spectrum band is a standard global band for TD-LTE service, which is becoming prevalent in Japan and China as well as other places.
8
North America Equity Research05 December 2012
Philip Cusick, CFA(1-212) [email protected]
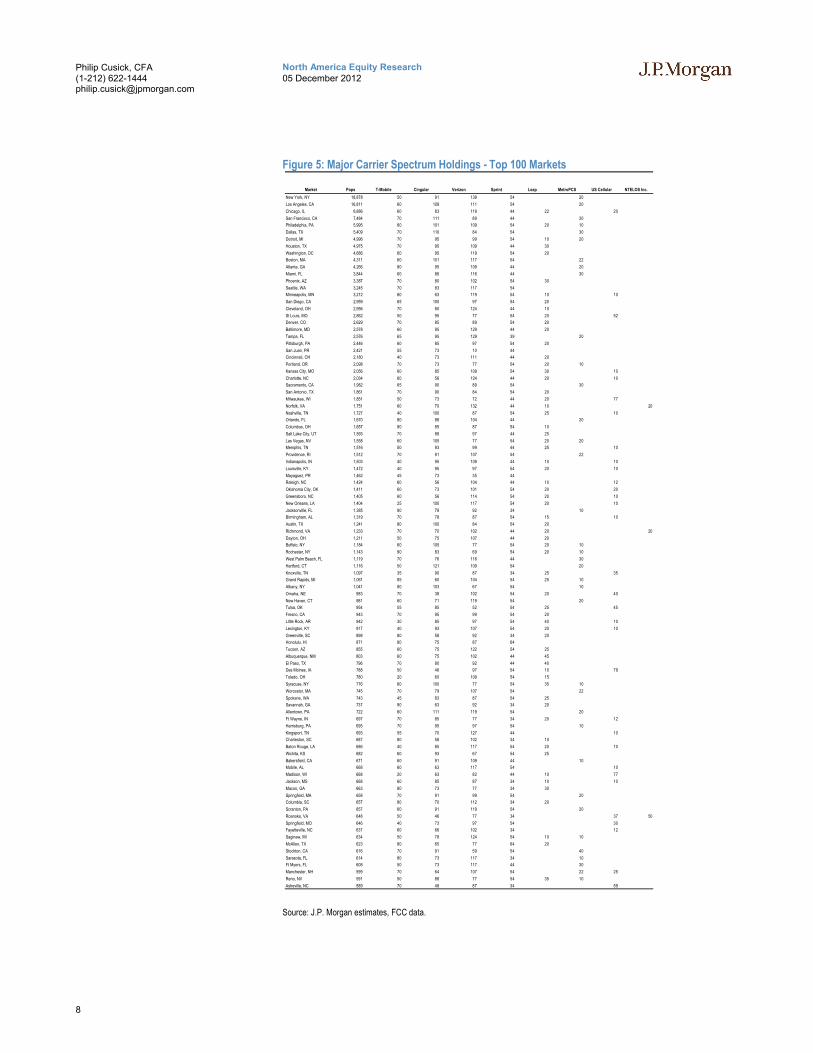
Figure 5: Major Carrier Spectrum Holdings - Top 100 Markets
Source: J.P. Morgan estimates, FCC data.
Market Pops T-Mobile Cingular Verizon Sprint Leap MetroPCS US Cellular NTELOS Inc.
New York, NY 18,878 50 91 139 54 20
Los Angeles, CA 16,811 60 109 111 54 20
Chicago, IL 8,886 60 83 119 44 22 20
San Francisco, CA 7,484 70 111 89 44 30
Philadelphia, PA 5,995 60 101 109 54 20 10
Dallas, TX 5,409 70 110 84 54 30
Detroit, MI 4,996 70 95 99 54 10 20
Houston, TX 4,975 70 95 109 44 30
Washington, DC 4,686 60 95 119 54 20
Boston, MA 4,311 60 101 117 54 22
Atlanta, GA 4,266 80 95 109 44 20
Miami, FL 3,844 60 86 116 44 30
Phoenix, AZ 3,387 70 80 102 54 30
Seattle, WA 3,245 70 83 117 54
Minneapolis, MN 3,212 80 63 119 54 10 10
San Diego, CA 2,959 65 100 97 54 20
Cleveland, OH 2,956 70 80 124 44 10
St Louis, MO 2,862 50 95 77 54 20 52
Denver, CO 2,629 70 85 89 54 20
Baltimore, MD 2,578 60 95 129 44 20
Tampa, FL 2,576 65 95 129 39 20
Pittsburgh, PA 2,446 60 85 97 54 20
San Juan, PR 2,421 55 73 10 44
Cincinnati, OH 2,180 40 73 111 44 20
Portland, OR 2,098 70 73 77 54 20 10
Kansas City, MO 2,056 60 85 109 54 30 10
Charlotte, NC 2,034 60 56 124 44 20 10
Sacramento, CA 1,982 65 90 89 54 30
San Antonio, TX 1,861 70 90 84 54 20
Milwaukee, WI 1,851 50 73 72 44 20 77
Norfolk, VA 1,751 60 70 132 44 10 20
Nashville, TN 1,727 40 100 87 54 25 10
Orlando, FL 1,670 80 88 104 44 20
Columbus, OH 1,657 80 85 87 54 10
Salt Lake City, UT 1,593 70 88 97 44 25
Las Vegas, NV 1,558 60 105 77 54 20 20
Memphis, TN 1,516 50 93 99 44 25 10
Providence, RI 1,512 70 91 107 54 22
Indianapolis, IN 1,503 40 95 109 44 10 10
Louisville, KY 1,472 40 95 97 54 20 10
Mayaguez, PR 1,462 45 73 35 44
Raleigh, NC 1,424 60 56 104 44 10 12
Oklahoma City, OK 1,411 60 73 101 54 20 20
Greensboro, NC 1,405 60 56 114 54 20 10
New Orleans, LA 1,404 25 100 117 54 20 10
Jacksonville, FL 1,385 90 78 92 34 10
Birmingham, AL 1,319 70 78 87 54 15 10
Austin, TX 1,241 80 100 84 54 20
Richmond, VA 1,233 70 70 102 44 20 20
Dayton, OH 1,211 50 75 107 44 20
Buffalo, NY 1,184 60 105 77 54 20 10
Rochester, NY 1,143 90 83 69 54 20 10
West Palm Beach, FL 1,119 70 76 116 44 30
Hartford, CT 1,116 50 121 109 54 20
Knoxville, TN 1,097 35 90 87 34 25 35
Grand Rapids, MI 1,061 85 60 104 54 25 10
Albany, NY 1,041 80 103 67 54 10
Omaha, NE 983 70 38 102 54 20 40
New Haven, CT 981 60 71 119 54 20
Tulsa, OK 954 55 85 52 54 25 45
Fresno, CA 943 70 95 99 54 20
Little Rock, AR 942 30 85 97 54 40 10
Lexington, KY 917 40 93 107 54 20 10
Greenville, SC 898 80 58 92 34 20
Honolulu, HI 871 80 75 87 64
Tucson, AZ 855 60 75 122 54 25
Albuquerque, NM 803 60 75 102 44 45
El Paso, TX 796 70 80 92 44 40
Des Moines, IA 788 50 46 97 54 10 79
Toledo, OH 780 20 60 109 54 15
Syracuse, NY 776 60 100 77 54 35 10
Worcester, MA 745 70 79 107 54 22
Spokane, WA 743 45 83 87 54 25
Savannah, GA 737 90 63 92 34 20
Allentown, PA 722 60 111 119 54 20
Ft Wayne, IN 697 70 85 77 34 20 12
Harrisburg, PA 695 70 95 97 54 10
Kingsport, TN 693 55 70 127 44 10
Charleston, SC 687 80 58 102 34 10
Baton Rouge, LA 686 40 85 117 54 20 10
Wichita, KS 682 60 93 67 54 25
Bakersfield, CA 671 60 91 109 44 10
Mobile, AL 668 60 63 117 54 10
Madison, WI 668 20 63 82 44 10 77
Jackson, MS 668 60 85 87 34 10 10
Macon, GA 663 80 73 77 34 30
Springfield, MA 658 70 91 99 54 20
Columbia, SC 657 80 70 112 34 20
Scranton, PA 657 60 91 119 54 20
Roanoke, VA 648 50 46 77 34 37 50
Springfield, MO 646 40 73 97 54 30
Fayetteville, NC 637 60 66 102 34 12
Saginaw, MI 634 50 78 124 54 10 10
McAllen, TX 623 80 65 77 64 20
Stockton, CA 616 70 91 59 54 40
Sarasota, FL 614 80 73 117 34 10
Ft Myers, FL 608 50 73 117 44 30
Manchester, NH 599 70 64 107 54 22 25
Reno, NV 591 50 88 77 54 35 10
Asheville, NC 589 70 48 87 34 59

9
North America Equity Research05 December 2012
Philip Cusick, CFA(1-212) [email protected]
Spectrum Valuation Framework
Our valuation framework for spectrum is based upon the 700 MHz auction (for low-band spectrum) in 2008 and AWS auction (for higher-band spectrum) in 2006. One important point is that rather than averaging the sale prices of each auction and applying it to current carrier spectrum holdings, we use market by market sale prices and then add a standard premium to more accurately estimate current value. Thus the average per-pop for Leap’s PCS spectrum could be significantly different than the average for Metro’s due to their current markets.
For low frequency spectrum we estimate that 700 MHz spectrum today is worth about what it sold for in 2008, with a few exceptions where licenses in some markets sold at egregious prices. We assign a 10-30% premium to cellular spectrum over 700 MHz auction values due to the fact that it is already in wide use and is a standard handset band. Finally we put a discount on E-band spectrum owned by AT&T and Dish due to its unpaired nature.
In high band we estimate AWS and PCS spectrum values are up 26% from the 2006 AWS auction average with a 40% increase for top 100 markets and a flat valuation for non-top 100 markets. We estimate a 30% discount in value to AWS spectrum for Dish’s AWS-4 spectrum (formerly MMDS), a 40% discount for WCS spectrum (non-standard but paired), and a 50% discount for 2.5 GHz spectrum (unpaired, and a lot of supply).
Figure 6: Spectrum Valuation Based Upon 700 MHz and AWS Auctions
Source: J.P. Morgan estimates, FCC.
National Carriers Spectrum Valuations
AT&T and Verizon have the largest and most valuable spectrum holdings
We estimate AT&T’s 90 MHz of spectrum is worth about $31b at average $/MHz-pop prices of $1.91 for cellular $1.59 for 700 MHz and $0.77 for PCS. Verizon’s 99MHz of nationwide spectrum is worth almost $36b driven by substantial cellular and 700 MHz spectrum positions. We calculate an average $/MHz-pop valuation of $1.30 for AT&T and $1.29 for Verizon.
As of 3Q12, AT&T valued its spectrum at $52b on its balance sheet and Verizon $78b, well above our valuations. Note that much of the carrying value of this spectrum was allocated from acquisitions like Alltel and AT&T Wireless. Since we
Discount/Premium from original auction weighted average price Avg. $/MHz-Pop
Top 100 Rest Top 100 Rest All700MHz 0% 0% vs. 700MHz auction average 700MHz $1.70 $0.73 $1.32700MHz E-Block -40% -45% vs. 700MHz auction average 700MHz E-Block $1.02 $0.40 $0.77700MHz Broadcast -40% -40% vs. 700MHz auction average 700MHz Broadcast $1.02 $0.44 $0.79Cellular 30% 10% vs. 700MHz auction average Cellular $2.20 $0.80 $1.62AWS 40% 0% vs. AWS auction AWS $0.88 $0.40 $0.68PCS 40% 0% vs. AWS auction PCS $0.88 $0.40 $0.68PCS H-Block -10% -10% vs. PCS today PCS H-Block $0.80 $0.36 $0.62MMDS-Dish -30% -30% vs. AWS today MMDS-Dish $0.62 $0.28 $0.48MMDS-Lightsquared -75% -75% vs. AWS today MMDS-Lightsquared $0.22 $0.10 $0.17WCS -40% -40% vs. AWS today WCS $0.53 $0.24 $0.412.5GHz -50% -75% vs. AWS today 2.5GHz $0.44 $0.10 $0.28

10
North America Equity Research05 December 2012
Philip Cusick, CFA(1-212) [email protected]
do not expect AT&T or Verizon to ever sell their spectrum the valuation disparity is not very important.
Note that while we don’t include AT&T’s ownership of 40% of the nationwide WCS spectrum today the value is essentially a rounding error on AT&T’s total spectrum value. After AT&T’s deals close and it owns 90% of that band we estimate it to be worth ~$2.5 billion.
Sprint and T-Mobile spectrum positions valued at $15b and $13b respectively
We calculate Sprint’s spectrum value at $15b with its 50 MHz of total spectrum of which 14 MHz is cellular and 36 MHz of PCS spectrum. We calculate an average $/MHz-Pop valuation of $1.07 for Sprint. T-Mobile USA's 58 MHz of spectrum is $13b due to the average value of PCS/AWS spectrum at $0.77 MHz/pop. Sprint values its spectrum as of 3Q12 at $21b, substantially higher than our valuations, and T-Mobile USA at $14b.
Much of T-Mobile USA's spectrum (the PCS) came in the acquisition of Voicestream by DT, which marked the peak of the wireless industry valuation in the last decade. Similarly, Sprint allocated $14 billion in value to Nextel’s spectrum when it bought that company in 2005, which we believe is significantly overstated.
Figure 7: National Carrier Spectrum Valuations
Source: J.P. Morgan estimates, FCC, Company data.
Unlimited and Regional Carriers
MetroPCS spectrum valued at $2.4b and Leap at $2.0b on a bottoms-up basis
Our bottom up analysis of MetroPCS and Leap PCS and AWS holdings focused on licenses and prices paid on a per market basis. We value MetroPCS spectrum at $2.4b and Leap at $2.0b. The carrying value of each company’s spectrum is $2.6b for MetroPCS and $1.8b for Leap, slightly lower than our valuations. We calculate an average $/MHz/pop valuation of $0.66 for Leap and $0.99 for MetroPCS.
As we think about spectrum value of Leap and MetroPCS in the context of share value, the spectrum value of each company comes close to the net debt of Leap at $2.6 billion and $2.5 billion for MetroPCS, thus is significant as a backer of the debt but not much support to equity value.
US Cellular has $1.5b in spectrum value and nTelos ~$109m
We value US Cellular’s spectrum holdings at $1.5b before the Sprint sale, after which we estimate the remainder will be worth ~$1.3 billion. USM's spectrum carrying value is $1.5b and $132m for NTLS. Of all the numbers in this note the value for US Cellular’s cellular spectrum we believe is the most uncertain. Given USM’s strong cellular position and high roaming revenue that spectrum could be worth substantially more to a potential acquirer than we estimate above based on 700
Spectrum Value ($ in '000s)
Cellular PCS AWS 700 MHz
MMDS
/AWS-4 WCS 2.5 GHz Total
Avg. $/ MHz-
Pop
3Q12 Wireless Balance
Sheet Carrying Value
AT&T 12,087,949 7,353,818 875,196 10,205,999 30,522,963 $1.30 52,082,000$ Verizon 12,571,894 4,298,520 6,556,202 12,349,771 35,776,386 $1.29 77,591,000$
T-Mobile 3,898 5,477,683 7,236,960 - 12,718,542 $0.77 14,360,000$
Sprint* 7,128,752 7,806,293 - - 14,935,045 $1.07 20,631,000$

11
North America Equity Research05 December 2012
Philip Cusick, CFA(1-212) [email protected]
MHz. We would say, however, that as Verizon and AT&T build out 700 MHz networks with LTE their need for roaming in USM markets could decline and the spectrum move back to a more normal value.
Similar to Leap and MetroPCS above, the spectrum value of US Cellular comparesfavorably to its net debt. US Cellular has net debt of only $320 million today so the spectrum should be worth an implied $14/share over and above debt.
We value nTelos’s spectrum holdings at $109m vs. the $132 million carrying value. nTelos also has some WCS spectrum, but we don't consider it in the valuation.
Figure 8: Regional and Unlimited Carrier Spectrum Valuations
Source: J.P. Morgan estimates, FCC, Company data.
Alternative Carriers and Spectrum Bands
Below we estimate spectrum valuations for Clearwire, DISH Network, and AT&T’s WCS band, as well as look at Lightsquared.
Clearwire still looking to fulfill its potential
Clearwire has said that it has 42 billion MHz-pops, as well as an average of 150 MHz of spectrum across the top 100 markets in the US. While so far the spectrum has failed to live up to its potential, the 2.5 GHz band is quickly becoming a global standard for TD-LTE technology. New Sprint investor Softbank is a big proponent of TD-LTE in this band in Japan, and we believe over time could see the same potential for the service in the US. Additionally, the TD-LTE ecosystem is growing and in 2013 we expect standard chipsets from Qualcomm to come with TD-LTE enabled in this band, though most carriers around the world will not choose the band plans necessary to activate it.
As with any spectrum, value is a question of supply and demand, and thus far Clearwire has far more supply than there has been demand. Assuming that Clearwire burns all of its cash the company currently trades at $0.23/MHz-Pop including $1.8billion in NPV of lease expense. We estimate that over time Clearwire’s 2.5 GHz spectrum could be valued at more like $11.9b, or about $0.28/MHz-pop – the equivalent of $4 per share - vs. the balance sheet wireless license value of $4.3b as of 3Q12.
Dish – S-Band Should be Authorized Soon for Terrestrial
Dish has 6 MHz of 700 MHz E-Block spectrum across 217 million pops. Additionally, Dish Network has acquired 40 MHz of spectrum from bankrupt MMDS carriers Terrestar and DBSD, and has applied to the FCC for a license transfer and then waiver to allow this spectrum to be used for terrestrial-only applications as well as satellite/terrestrial hybrid. Dish Network has discussed using this for LTE-Advanced service which could launch in 2014 or 2015.
Spectrum Value ($ in '000s)
Cellular PCS AWS 700 MHz
MMDS
/AWS-4 WCS 2.5 GHz Total
Avg. $/ MHz-
Pop
3Q12 Wireless Balance
Sheet Carrying ValueMetroPCS - 653,882 1,503,630 206,043 2,363,555 $0.99 2,562,000$ Leap - 445,113 1,306,703 217,828 1,969,644 $0.66 1,788,363$ US Cellular* 569,312 427,238 222,294 326,723 1,545,566 $0.79 1,531,873$ NTELOS - 101,138 7,884 - 109,022 $0.50 132,326$

12
North America Equity Research05 December 2012
Philip Cusick, CFA(1-212) [email protected]
Dish has offered to restrict power on 5 MHz of its upload spectrum to create a guard band for the PCS H-block if the FCC otherwise approves Dish’s spectrum for terrestrial use. This deal or something like it is in-line with our recent thinking. While long term technology changes may make power reduction a minor issue, near-term it restricts Dish to a symmetrical 15x15 LTE network vs. the planned 20x20, and creates some delay at 3GPP. Assuming a structure similar to Dish’s proposal we expect approval by the end of 2012.
We estimate DISH Network’s 6 MHz of 700 MHz spectrum to be worth $872million or $0.71/MHz-Pop. While this is less than some have estimated, we believe it is important to look at what markets Dish has (and doesn't have), and the company is missing the biggest markets on the east and west coasts. We believe AT&T (which owns those large markets) is the only likely buyer for the spectrum, limiting its value but still a premium vs the $712 million that Dish paid for it.
Next we estimate that Dish’s 40 MHz of MMDS spectrum to have a $6.2b value, much higher than the total purchase price of $2.8b but below what we estimated its worth to be a year ago. The 5 MHz restriction is not likely to reduce the long-term usability of the spectrum, but near-term it makes it somewhat less attractive to a buyer. We calculate a $/MHz-Pop value of $0.50 for DISH's MMDS/AWS-4 spectrum based on a 30% discount to our value for standard AWS today.
WCS band is being cleaned up by AT&T
Historically the WCS band, a 30 MHz block (15x15 paired) in the 2.3 GHz rangewas intended to be for wireless broadband services, but it never went anywhere due to potential interference issues with the adjacent Satellite Digital Audio Radio Service (SDARS) band. The bands C and D blocks are adjacent to the spectrum used by Sirius and XM for satellite radio, and could never be used for mobile services in order to protect that weak satellite signal. The fact that ownership was across a variety of companies that each wanted to protect their interest kept a deal from coming for far too long.
Now however, AT&T is in the process of closing on acquisitions which will allow it to control the majority of the WCS spectrum band. AT&T currently has ~40% of the WCS spectrum nationwide and is buying another ~50% of the block from companies including NextWave, Comcast, and Horizon. We believe that the only remaining significant holder of WCS spectrum is Sprint, which owns ~10% of the band, predominately in the southern US. With AT&T’s control, the company has been able to strike a deal with Sirius to use the C and D bands as guard bands with point to point applications only, freeing it to use the A and B bands as a 10x10 MHz pair. The FCC has blessed this pact, and we expect AT&T to close on its acquisitions very soon.
Assuming that the WCS band deal closes we estimate that the 20 MHz of spectrum is worth $2.5 billion or $0.41/MHz-pop, a 40% discount to our estimate of AWS band value today. To get the spectrum in use AT&T will need to get it into the 3GPP process and we do not expect this to be a global standard any time soon.

13
North America Equity Research05 December 2012
Philip Cusick, CFA(1-212) [email protected]
Figure 9: WCS Band Map
Source: FCC
L-Band Satellite Spectrum Looks Delayed Indefinitely
Two years ago it looked like Lightsquared was on track to be the next wireless carrier, with 59 MHz of spectrum and a waiver from the FCC to begin its buildout. At this point, however, the FCC has essentially halted all of Lightsquared’s momentum, and the 20 MHz of spectrum that Lightsquared owns that was intended for downlink are too close to GPS to use in the foreseeable future. At this point the company’s hopes rest on it convincing the FCC to swap 10 MHz that it has which is entangled with GPS for the 1675-1680 MHz block which could otherwise be auctioned. However, we believe that the FCC looks at the 10 MHz to be swapped as essentially worthless, and is reluctant to approve the swap.
At this point for Lightsquared we estimate a ~$0.18 MHz/pop valuation for its 20 MHz of spectrum essentially on optionality, a 75% discount to AWS spectrum for a spectrum valuation of $1.1b. We do not put a value on Lightsquared’s other spectrum which may be even more impaired at this point.
Figure 10: Alternative Carrier Spectrum Valuations
Source: J.P. Morgan estimates, Company data.
Spectrum Auctions Will Come Eventually
The national broadband plan was delivered to Congress in March 2010. It recommended finding 500 MHz of new spectrum for broadband services – 300 MHz in the next five years and another 200 MHz in the five years after that. Thus far we believe the FCC would count the 40 MHz of MMDS spectrum that it is turning into terrestrial for Dish against the goal, as well as hoping that ~80 MHz of broadcast spectrum can be turned into wireless. We are somewhat skeptical on the broadcast
SDARS SDARSTerrestrial Terrestrial
SDARS Repeaters SDARS SDARS Repeaters SDARS (Sirius) (Sirius) (Sirius) (XM) (XM) (XM)
2320
2324.54
2327.96
2332.5
2336.225
2341.285
2345
2350
2355
2360
b
2305
2310
2315
Wireless Communications Service (WCS)
a b c
WCS WCS
d a
Spectrum Value ($ in '000s)
Cellular PCS AWS 700 MHz
MMDS
/AWS-4 WCS 2.5 GHz Total
Avg. $/ MHz-
Pop
3Q12 Wireless Balance
Sheet Carrying ValueClearwire 11,885,232 11,885,232 $0.28 4,263,367$ LightSquared 1,115,505 1,115,505 $0.18 NADISH Network 872,378 6,246,826 7,119,205 $0.52 NA

14
North America Equity Research05 December 2012
Philip Cusick, CFA(1-212) [email protected]
spectrum process, and think that finding 300 MHz by 2015 will be a real challenge for the FCC.
AWS bands seem like soonest available source.
The seemingly easiest source could be additional AWS spectrum. AWS-2 is two 5 MHz pairs (H-block is 1915-1920/1995-2000 and J-block is 2020-2025/2175-2180) that are close to Sprint’s PCS spectrum and weren’t auctioned in the 2006 AWS-1 auction. AWS-3 is an unpaired 20 MHz that could be paired with lower-band military spectrum to make it more attractive. The FCC is working to protect the H-block by forcing Dish to reduce power in the 5 MHz adjacent to it. We believe the H-block could be sold as early as 2013 and that Sprint or Dish is likely to buy it for about $2 billion based on an assumed average of $0.68/MHz/pop.
Lower 700 MHz band could be a disappointment
One source of very good spectrum could be to repurpose more spectrum from the TV broadcasters in the 700 MHz band. Channels 52-69 were the sources for the 2008 700 MHz auction (6 MHz per channel), and channels 31-51 could yield another 120 MHz.
In February of 2012 Congress passed the “Middle Class Tax Relief and Job Creation Act” which includes authorization for the FCC to conduct incentive auctions including that of broadcast spectrum. Ideally, local broadcasters in cities will turn their spectrum in to the FCC in exchange for part of the proceeds from the auction. However, many of the big broadcasters have pushed back against this, and we believe that the Congressional Budget Office's estimate that an average of 84 MHz of spectrum will be turned in is very optimistic. Were that 84 MHz of spectrum be auctioned we estimate a value of as high as $20 billion or $0.79/MHz/pop - far less than the $1.32 average in the 700 MHz auction in 2008 due to lower demand from carriers and potential new entrants.
Microwave?
Additional commercial microwave could also be sourced, pushing the microwave broadcasters further up the bands. This, however, is not seen as very attractive spectrum by the carriers but could become more so if it was paired with something in a lower band.
Government bands.
Finally, there is a lot of spectrum that currently is being used (or at least allocated to) the Federal government. Congress has instructed the FCC to auction the 1675-1710 MHz spectrum by 2015, and there is far more that is not allocated but is being tested for shared use between industry and government. However, entities like the FBI, the Department of Defense, and others are likely to lobby heavily against sharing or being moved from their current bands and it would take congressional action to move most of this into the FCC’s domain.

15
North America Equity Research05 December 2012
Philip Cusick, CFA(1-212) [email protected]
Figure 11: PCS, AWS Band Plan
Source: FCC
Spectrum Spending History
Spectrum expense is mostly behind us
Since 2005 the US wireless carriers spent roughly $42 billion in major sales of spectrum in the PCS, AWS, and 700 MHz bands. Spectrum spending is almost always a contra to valuation in our models. While there has been speculation about more spectrum coming to market, we estimate it could be 2013 or later before substantial blocks of spectrum come to market.
Table 1: Major Wireless Spectrum License Spending by Carrier, 2005-Present$ millions
Source: Company reports and FCC.
Table 2: History of Spectrum Prices in Major Transactions, 2001-2010
Source: Company reports and FCC.
AWS-1
d e f d b e f c a d b e f c d e f
1710
1755
1850
1910
1920
1930
1990
2000
2020
2025
2110
2155
2175
2180
2200
1695-1710: 1755-1850: 2025-2110 MHz:
Federal Government Federal Government BAS, Government Satellite
Proposed to Auction Exclusive Spectrum
UPCS = Unlicensed Personal Communications Services (wireless microphones, etc)
XM has 2332.50-2345.00 Sirius has 2320-2332.50
b
↑↑
Proposed PCS H-Block Block Proposed AWS-2 Block
PCS, AWS, MSS SPECTRUM Band Plan
UP
CS
DISHATC /
AWS-4
(uplink) a b cAWS-3
(not paired yet)
PC
S G
-Blo
ck
PCS PCSAWS-1
↑
a
DISHATC /
AWS-4
(downlink)
PC
S G
-Blo
ck ac
Company Auction 58 AWS 700 MHz Aloha (700) QCOM (700) SpectrumCo Cox Total
AT&T 184 1400 6637 2500 1925 12646Verizon Wireless 697 2809 9363 3600 315 16784
T-Mobile USA 252 4182 4434Spectrum Co LLC (Cable co's)** 2378 2378
Sprint 194 194Echostar 712 712
Qualcomm* 558 558MetroPCS 1391 313 1704
Leap Wireless 235 1076 1311
Cox Wireless 305 305US Cellular 152 170 300 622
Cellular South 192 192CenturyLink 149 149
1714 13406 18529 2500 1925 3600 315 41989* Later sold to AT&T
** Later sold to Verizon
Date Frequency Amount ($m) $/MHz-Pop
Verizon/Cox 2012 AWS 315 0.61$ Verizon/SpectrumCo. 2012 AWS 3600 0.69$ AT&T/Qualcomm sale 2010 700 MHz 1925 0.86$ Auction 73 (700 MHz) 2008 700 MHz 14827 1.29$ AT&T/Aloha 2007 700 MHz 2500 1.06$ Acution 66 (AWS) 2006 1.7/2.1 GHz 13879 0.54$ Auction 58 (PCS) 2005 1900 MHz 2250 1.06$ Auction 35 (PCS, cancelled) 2001 1900 MHz 16300 2.11$

16
North America Equity Research05 December 2012
Philip Cusick, CFA(1-212) [email protected]
Table 3: MHz POP Prices by License Type Comparison for Auction 73, 66, 58 and 35
Source: FCC and J.P. Morgan estimates.
700 MHz auction Recap: Incumbents Dominated Auction 73
The 700 MHz auction was completed in the spring of 2008, and carriers collectively spent $19b or ~$1.30/MHz-Pop. We believe this was the auction that cemented
AUCTION 73 DATA
MHz/pop price by license type Total $/MHz/Pop 1.29$
Price $/MHz/Pop MHz/pop Bid
CMA-B Band 2.68 3,416,968,344 $9,143,993,000
BEA - A, E Band 1.02 5,132,740,758 $5,228,066,000
REA - C Band 0.76 6,277,460,816 $4,747,769,000
Total 1.29 14,827,169,918 $19,119,828,000
AUCTION 66 DATA Total $/MHz/Pop $0.54
MHz/pop price by size of spectrum licenses
0-99k 100k-249k 250-499k 500-999k 1-2.9m 3-60m$0.12 $0.12 $0.13 $0.18 $0.36 $0.67
MHz/pop price by license type
Price $/MHz/Pop MH/pop Bid
CMA 0.40 5,712,408,900 $2,268,029,200
BEA 0.46 8,568,613,350 $3,938,533,000
REA 0.67 11,424,817,800 $7,672,548,000
Total 0.54 25,705,840,050 $13,879,110,200
AUCTION 58 DATA Total $/MHz/pop $1.06
Category A B C D E F
Min pops 0 100,000 250,000 500,000 1,000,000 3,000,000
Max pops 99,999 249,999 499,999 999,999 2,999,999 20,000,000
Auction 58 Markets 45 52 34 35 67 9
Averge pops (mm) 0.064 0.171 0.357 0.659 1.768 5.118
No bid markets 14 5 3 3 0 0
Avg. $ Bid 0.19 0.51 0.95 2.88 20.35 82.08
Avg. $/MHz/Pop $0.37 $0.31 $0.26 $0.41 $1.07 $1.26
AUCTION 35 DATA
Auction 35 Total $/MHz/pop $2.11
Avg. $/MHz/Pop $0.90 $1.20 $1.35 $2.20 $3.57 $6.19
% of Auct. 35 Price 41% 26% 19% 19% 30% 20%
Auction 35
Min pops Max Pops Category $/MHz/Pop
0 99,999 A $0.90
100,000 249,999 B $1.20
250,000 499,999 C $1.35
500,000 999,999 D $2.20
1,000,000 2,999,999 E $3.57
3,000,000 20,000,000 F $6.19

17
North America Equity Research05 December 2012
Philip Cusick, CFA(1-212) [email protected]
AT&T and Verizon as the leaders of the US wireless industry for the next decade at least.
Verizon and AT&T were the two largest winners, composing nearly $16b or 82% of the total auction proceeds. Verizon spent $9.3b, winning not only the nationwide C-block, but also 195mm pops in the A and B-block. AT&T spent $6.6b, winning 175mm pops of B-block. T’s strategy seems to have been to fill in around its existing assets rather than using the auction to acquire a national footprint. T also bought 196mm pops from Aloha Partners, contiguous to the B-Block, in October for $2.5b.
The biggest new entrant was Echostar, buying 217mm pops in the E-block for $712mm. Despite significant hype at the time, we believe Google bid the minimum it could.
MetroPCS spent $313mm on 8mm pops, most of it on another 12 MHz in Boston. This was the high-end of what we expected Metro to spend, but not over. Leap stayed out. US Cellular spent $305mm on A and B-block licenses, mostly in the Midwest or small markets.
Table 4: Auction 73: Top 20 Bidders
Source: FCC and J.P. Morgan estimates.
Bidding Entity Name Bidder Bid Subtotal Pops Subtotal MHz-Pops Subtotal $/MHz/Pop
Cellco Partnership d/b/a Verizon Wireles Verizon Wireless 9,363,160,000 475,029,030 8,508,298,100 1.10$ AT&T Mobility Spectrum, LLC AT&T 6,636,658,000 175,826,532 2,109,918,384 3.15$ Frontier Wireless LLC Echostar 711,871,000 217,246,979 1,303,481,874 0.55$ QUALCOMM Incorporated QUALCOMM Incorporated 558,142,000 68,495,648 413,394,882 1.35$ MetroPCS 700 MHz, LLC MetroPCS 313,267,000 7,954,554 95,454,648 3.28$ Cox Wireless, Inc. Cox Wireless, Inc. 304,633,000 20,666,971 248,003,652 1.23$ King Street Wireless, L.P. US Cellular 300,478,500 40,570,096 486,841,152 0.62$ Cellular South Licenses, Inc. Cellular South 191,533,000 14,997,052 179,964,624 1.06$ CenturyTel Broadband Wireless LLC CenturyTel 148,964,000 17,651,509 211,818,108 0.70$ Vulcan Spectrum LLC Vulcan (Paul Allen) 112,793,000 7,019,028 84,228,336 1.34$ Continuum 700 LLC Continuum 700 LLC 66,134,250 11,976,880 143,722,560 0.46$ Cavalier Wireless, LLC Cavalier Wireless, LLC 46,352,250 26,808,514 321,702,168 0.14$ Puerto Rico Telephone Company, Inc. Puerto Rico Telephone Company, Inc. 31,402,000 6,093,357 73,120,284 0.43$ Triad 700, LLC Triad 700, LLC 17,020,500 11,754,402 186,494,364 0.09$ Horry Telephone Cooperative, Inc. Horry Telephone Cooperative, Inc. 8,469,000 878,267 10,539,204 0.80$ Central Texas Telephone Investments, LP Central Texas Telephone Investments, LP 6,347,000 1,253,210 15,038,520 0.42$ I-700, LLC I-700, LLC 5,960,000 1,985,504 23,826,048 0.25$ Iowa Telecommunications Services, Inc. Iowa Telecommunications Services, Inc. 5,894,000 286,530 3,438,360 1.71$ Redwood Wireless Corp. Redwood Wireless Corp. 5,883,750 828,466 9,941,592 0.59$ Miller, David Miller, David 5,859,000 3,311,017 39,732,204 0.15$ Total 18,840,821,250 1,110,633,546 14,468,959,064 1.30$
18
North America Equity Research05 December 2012
Philip Cusick, CFA(1-212) [email protected]
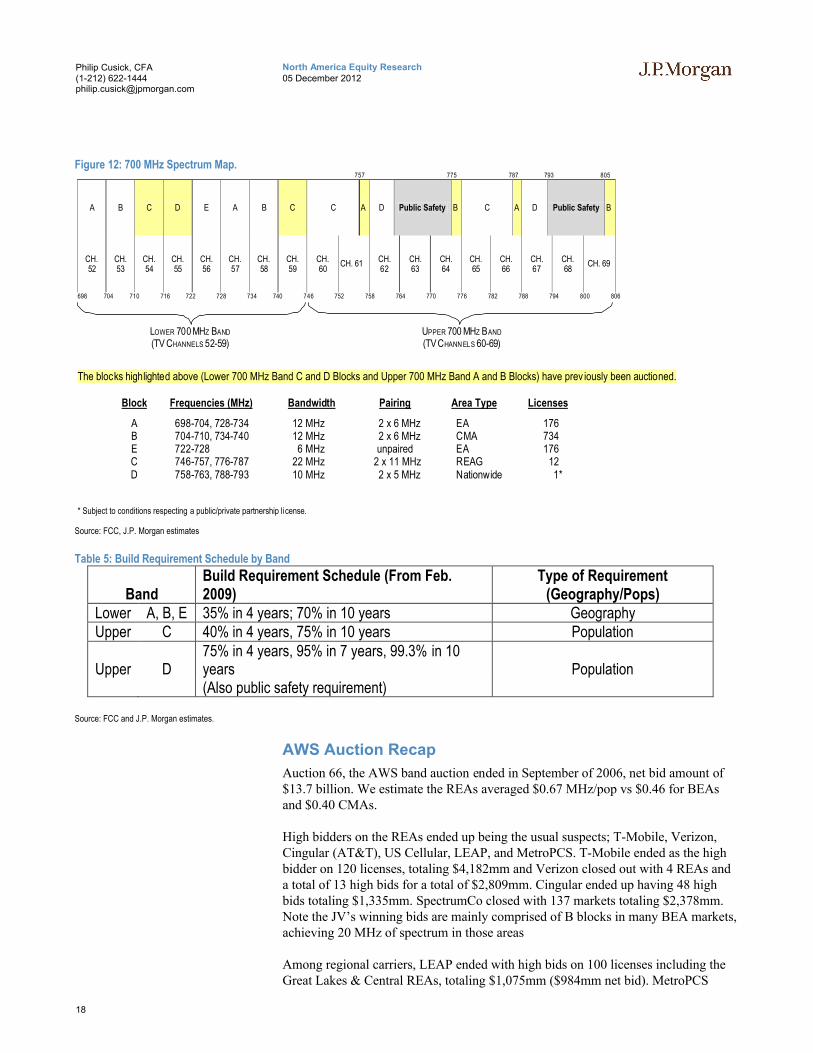
Figure 12: 700 MHz Spectrum Map.
Source: FCC, J.P. Morgan estimates
Table 5: Build Requirement Schedule by Band
BandBuild Requirement Schedule (From Feb. 2009)
Type of Requirement (Geography/Pops)
Lower A, B, E 35% in 4 years; 70% in 10 years GeographyUpper C 40% in 4 years, 75% in 10 years Population
Upper D75% in 4 years, 95% in 7 years, 99.3% in 10 years Population(Also public safety requirement)
Source: FCC and J.P. Morgan estimates.
AWS Auction Recap
Auction 66, the AWS band auction ended in September of 2006, net bid amount of$13.7 billion. We estimate the REAs averaged $0.67 MHz/pop vs $0.46 for BEAs and $0.40 CMAs.
High bidders on the REAs ended up being the usual suspects; T-Mobile, Verizon, Cingular (AT&T), US Cellular, LEAP, and MetroPCS. T-Mobile ended as the high bidder on 120 licenses, totaling $4,182mm and Verizon closed out with 4 REAs and a total of 13 high bids for a total of $2,809mm. Cingular ended up having 48 high bids totaling $1,335mm. SpectrumCo closed with 137 markets totaling $2,378mm. Note the JV’s winning bids are mainly comprised of B blocks in many BEA markets, achieving 20 MHz of spectrum in those areas
Among regional carriers, LEAP ended with high bids on 100 licenses including the Great Lakes & Central REAs, totaling $1,075mm ($984mm net bid). MetroPCS
757 775 787 793 805
A B C D E A B C C A D Public Safety B C A D Public Safety B
CH. 52
CH. 53
CH. 54
CH. 55
CH. 56
CH. 57
CH. 58
CH. 59
CH. 60
CH. 61 CH. 62
CH. 63
CH. 64
CH. 65
CH. 66
CH. 67
CH. 68
CH. 69
698 704 710 716 722 728 734 740 746 752 758 764 770 776 782 788 794 800 806
LOWER 700 MHZ BAND UPPER 700 MHZ BAND
(TV CHANNELS 52-59) (TV CHANN ELS 60-69)
The blocks highlighted above (Lower 700 MHz Band C and D Blocks and Upper 700 MHz Band A and B Blocks) have prev iously been auctioned.
Block Frequencies (MHz) Bandwidth Pairing Area Type Licenses
A 698-704, 728-734 12 MHz 2 x 6 MHz EA 176B 704-710, 734-740 12 MHz 2 x 6 MHz CMA 734E 722-728 6 MHz unpaired EA 176C 746-757, 776-787 22 MHz 2 x 11 MHz REAG 12D 758-763, 788-793 10 MHz 2 x 5 MHz Nationwide 1*
* Subject to conditions respecting a public/private partnership li cense.

19
North America Equity Research05 December 2012
Philip Cusick, CFA(1-212) [email protected]
ended with high bids on 8 licenses, totaling $1,391mm. USM had 17 high bids, totaling $170mm ($127mm net bid) and Dobson (now owned by AT&T) had 85 high bids, totaling $66mm.
Figure 13: Auction 66 Bidding Entities and Significant Investors
Source: FCC and J.P. Morgan estimates.
Figure 14: Auction 66 (AWS) License Descriptions
Source: FCC and J.P. Morgan estimates.
Upfront Maximum Footprint Est. POPsRank Bidder Name Significant Investors Payment Eligibility, MM Eligibility Eligibility, MM
($MM) (Bidding Units) (10MHz) (10MHz)
1 Wireless DBS LLC Echostar/DirecTV 972.5 648.4 5.00 1,4802 SpectrumCo LLC Comcast/Bresnan/Time Warner Cable/Cox/Bright House/Sprint 637.7 637.7 4.92 1,4563 T-Mobile License LLC T-Mobile 583.5 583.5 4.50 1,332
4 Cingular AWS, LLC Cingular (AT&T) 500.0 333.3 2.57 7615 Cellco Partnership d/b/a Verizon Wireless Verizon Wireless 383.3 255.6 1.97 5836 Cricket Licensee (Reauction), Inc. Leap Wireless / Cricket Communications 255.0 255.0 1.97 5827 MetroPCS AWS, LLC MetroPCS 200.0 200.0 1.54 4578 Dolan Family Holdings, LLC Charles Dolan (Cablevision) 150.0 150.0 1.16 342
9 AWS Wireless Inc. NextWave 142.8 142.8 1.10 32610 Barat Wireless, L.P. US Cellular 80.0 80.0 0.62 18311 CenturyTel Broadband Wireless LLC CenturyTel 59.1 59.1 0.46 13512 Atlantic Wireless, L.P. Atlantic Wireless Mgmt Co. / Fortress Investment Group 52.0 52.0 0.40 119
13 Denali Spectrum License, LLC Leap Wireless / Cricket Communications 50.0 50.0 0.39 11414 Triad AWS, Inc. Triad AWS / M.C Venture Partners (Cavalier Telco, Cleveland Un'ltd, Coral Wireless) 40.0 40.0 0.31 9115 Antares Holdings, LLC John Dolan (Northcoast Communications) 21.0 21.0 0.16 4816 Cavalier Wireless, LLC Wirt A Terger III 18.8 18.8 0.14 4317 American Cellular Corporation American Cellular / Dobson Cellular 17.0 17.0 0.13 39
18 Daredevil Communications LLC Shawn Capistrano / Gregory Smith 8.9 8.9 0.07 2019 Cellular South Licenses, Inc. Cellular South / Telapex 7.0 7.0 0.05 1620 Cincinnati Bell Wireless LLC Cincinnati Bell 7.0 7.0 0.05 1621 Carolina West Wireless, Inc. Skyline Telephone / Surry Telephone / Wilkes Telephone 6.0 6.0 0.05 1422 Red Rock Spectrum Holdings, LLC George Evans 6.0 6.0 0.05 14
23 Centennial Michiana License Company LLC Centennial, Welsh Carson, Blackstone 5.0 5.0 0.04 1124 Shenandoah Mobile Company Shenandoah Telecommunications Co 4.7 4.7 0.04 1125 Public Service Wireless Services, Inc. Public Service Communications 4.5 4.5 0.03 1026 Cable One, Inc. The Washington Post Co. / Berkshire Hathaway Inc. 3.5 3.5 0.03 8
27 Command Connect, LLC William and Lena Henning (Command Connect, LLC / Cameron Comm, LLC) 3.3 3.3 0.03 828 Iowa Telecommunications Services, Inc. - 3.1 3.1 0.02 729 PCS Partners, L.P. PCSGP, Inc. / David Behenna 3.0 3.0 0.02 730 Plateau Telecommunications, Inc. E.N.M.R. Telephone Cooperative 3.0 3.0 0.02 731 Central Texas Telephone Investments, LP Central Texas Telepone Management Co. 2.6 2.6 0.02 6
32 LL License Holdings II, LLC Long Lines Wireless 2.5 2.5 0.02 633 Hawaiian Telcom Communications, Inc. Hawaiian Telcom Holco, Inc / Carlyle Partners / TC Group 2.2 2.2 0.02 534 AGRI-VALLEY COMMUNICATIONS, INC. Agri-Valley Communciations / Pigeon Telephone Co. 2.0 2.0 0.02 535 Iowa Intelegra Consortium, LLC Schaller Telephone Co. / Niagra Telephone Co. / Hawkeye Telephone Co. 2.0 2.0 0.02 536 MTPCS License Co., LLC AAA Entertainment Licensing / Alta Communications 2.0 2.0 0.02 5
37 NSIGHTTEL WIRELESS, LLC Brown County CLEC 1.8 1.8 0.01 438 Lynch AWS Corporation Brighton Communications / Lynch Telephone Corp 1.5 1.5 0.01 339 Telephone Electronics Coporation Joseph Fail (Bay Springs Communications) / Walter Frank (Signature Telecom) 1.3 1.3 0.01 3
BlockFrequency Bands
(MHz)Total
BandwidthGeographic Area Type
No. of Licenses Nationwide
A 1710-1720 / 2110-2120 20 MHz CMA 734
B 1720-1730 / 2120-2130 20 MHz EA 176
C 1730-1735 / 2130-2135 10 MHz EA 176
D 1735-1740 / 2135-2140 10 MHz REAG 12
E 1740-1745 / 2140-2145 10 MHz REAG 12
F 1745-1755 / 2145-2155 20 MHz REAG 12

20
North America Equity Research05 December 2012
Philip Cusick, CFA(1-212) [email protected]
Figure 15: Aggregate Spectrum Map - Top 100 Markets
Source: FCC and J.P. Morgan estimates.
Frequency (MHz) 698-704 704-710 710-716 716-722 722-728 824-835 835-845 1710-1715 1715-1720 1720-1725 1725-1730 1730-1735 1735-1740 1740-1745 1745-1755 1850-1857.5 1857.5-1865 1865-1870 1870-1877.5 1877.5-1885 1885-1890 1890-1895 1895-1902.5 1902.5-1910 1895-1900 1900-1905 1905-1910 1910-1915 2000-2020
Market 700-A 700-B 700-C 700-D 700-E Cellular-A Cellular-B AWS-A1 AWS-A2 AWS-B1 AWS-B2 AWS-C AWS-D AWS-E AWS-F PCS-A1 PCS-A2 PCS-D PCS-B1 PCS-B2 PCS-E PCS-F PCS-C2 PCS-C1 PCS-C3 PCS-C4 PCS-C5 PCS-G AWS-4
1 New York, NY VZ T VZ T T T VZ VZ VZ VZ VZ PCS PCS TMO TMO TMO T TMO S S T VZ VZ VZ VZ S DISH
2 Los Angeles, CA VZ VZ VZ T T T VZ T T VZ VZ TMO PCS TMO TMO S S T T TMO VZ TMO VZ T PCS S DISH
3 Chicago, IL LEAP VZ VZ T DISH T VZ VZ TMO VZ VZ TMO LEAP TMO VZ T T S USM VZ S T TMO TMO S DISH
4 San Francisco, CA VZ T VZ T T T VZ TMO TMO TMO TMO PCS T VZ S T T T TMO TMO TMO PCS PCS VZ S DISH
5 Philadelphia, PA VZ T VZ T T T VZ TMO TMO TMO VZ LEAP PCS LEAP VZ T T T S S VZ VZ TMO TMO S DISH
6 Dallas, TX VZ T VZ T DISH T T TMO TMO VZ VZ T PCS PCS TMO VZ VZ PCS S S T T TMO TMO S DISH
7 Detroit, MI VZ T VZ T DISH VZ T TMO TMO TMO TMO PCS LEAP VZ VZ T T VZ S S PCS T TMO TMO S DISH
8 Houston, TX VZ T VZ T DISH T VZ LEAP LEAP VZ VZ VZ TMO TMO TMO TMO TMO S T VZ S T VZ LEAP T S DISH
9 Washington, DC VZ T VZ T DISH T VZ LEAP LEAP VZ VZ TMO TMO VZ TMO S S VZ T T TMO TMO VZ VZ T S DISH
10 Boston, MA PCS T VZ T T T VZ VZ VZ VZ VZ TMO PCS TMO TMO T T TMO S S TMO VZ VZ VZ T S DISH
11 Atlanta, GA VZ T VZ T DISH VZ T VZ VZ VZ VZ TMO TMO TMO TMO T S S TMO TMO VZ T PCS PCS T S DISH
12 Miami, FL VZ VZ VZ T DISH T T VZ VZ VZ VZ T TMO TMO TMO S T T VZ VZ TMO TMO PCS PCS S DISH
13 Phoenix, AZ T VZ T DISH VZ VZ TMO TMO VZ VZ LEAP T LEAP TMO T TMO VZ S S TMO TMO LEAP T T S DISH
14 Seattle, WA T VZ T DISH T VZ VZ VZ VZ VZ TMO VZ TMO TMO T VZ T S T TMO TMO VZ TMO S S DISH
15 Minneapolis, MN VZ T VZ T DISH T VZ VZ VZ VZ VZ TMO LEAP TMO TMO S S VZ TMO TMO T VZ T TMO USM S DISH
16 San Diego, CA T VZ T DISH T VZ TMO TMO TMO TMO LEAP VZ T VZ S S T T TMO VZ T T LEAP VZ S DISH
17 Cleveland, OH VZ T VZ T DISH VZ VZ TMO TMO TMO TMO LEAP TMO VZ T T S T S TMO VZ TMO VZ S DISH
18 St Louis, MO USM T VZ T DISH VZ T LEAP LEAP USM USM TMO TMO USM VZ T USM T S S T VZ TMO TMO S DISH
19 Denver, CO VZ T VZ T DISH T VZ TMO TMO VZ VZ T LEAP TMO S S T TMO LEAP VZ TMO T S DISH
20 Baltimore, MD VZ T VZ T DISH T VZ LEAP LEAP VZ VZ TMO TMO TMO VZ S TMO VZ T T TMO TMO VZ VZ T S DISH
21 Tampa, FL VZ T VZ T DISH T VZ VZ VZ VZ VZ PCS TMO TMO TMO TMO S S VZ VZ T T PCS T T S DISH
22 Pittsburgh, PA T VZ T DISH T VZ TMO TMO VZ VZ LEAP TMO VZ S S T TMO TMO LEAP T VZ T S DISH
23 San Juan, PR T DISH T T TMO TMO T S S VZ TMO TMO S DISH
24 Cincinnati, OH VZ VZ VZ T DISH VZ T T T LEAP TMO VZ T S TMO VZ TMO VZ LEAP S S DISH
25 Portland, OR T VZ T DISH T VZ LEAP LEAP VZ VZ TMO PCS TMO TMO TMO TMO T S S T VZ T S DISH
26 Kansas City, MO VZ T VZ T DISH VZ T LEAP LEAP VZ VZ TMO TMO USM VZ S S VZ TMO TMO T T TMO T LEAP S DISH
27 Charlotte, NC VZ VZ T DISH VZ VZ T T VZ VZ LEAP TMO TMO TMO TMO S S T T LEAP USM VZ VZ S DISH
28 Sacramento, CA VZ T VZ T DISH T VZ TMO TMO TMO VZ PCS TMO VZ S S T T TMO TMO PCS PCS T S DISH
29 San Antonio, TX VZ T VZ T DISH T T VZ VZ TMO TMO LEAP TMO S S TMO VZ VZ T TMO TMO LEAP S DISH
30 Milwaukee, WI USM T VZ T DISH USM T USM USM TMO TMO LEAP LEAP TMO VZ S TMO USM VZ VZ TMO USM T T S DISH
31 Norfolk, VA T VZ T DISH VZ VZ VZ VZ VZ VZ LEAP TMO TMO TMO T T S NTLS VZ TMO TMO VZ T S S DISH
32 Nashville, TN T VZ T DISH VZ T VZ VZ LEAP TMO USM VZ S S TMO T T TMO TMO T LEAP S DISH
33 Orlando, FL VZ T VZ T DISH T T VZ VZ VZ VZ PCS TMO TMO TMO TMO TMO S VZ VZ T T TMO PCS S S DISH
34 Columbus, OH T VZ T DISH VZ T TMO TMO TMO TMO LEAP TMO VZ T T S TMO TMO S VZ VZ S S DISH
35 Salt Lake City, UT T VZ T DISH T VZ VZ VZ VZ VZ LEAP TMO TMO TMO TMO TMO T S T VZ T T LEAP S DISH
36 Las Vegas, NV T VZ T DISH T VZ LEAP LEAP VZ VZ PCS PCS TMO TMO S S T T TMO VZ T T TMO T S DISH
37 Memphis, TN VZ VZ T DISH VZ T T T VZ TMO LEAP TMO USM VZ TMO TMO S T S VZ T LEAP S DISH
38 Providence, RI PCS T VZ T T T VZ VZ VZ VZ VZ TMO PCS TMO TMO T T TMO S S VZ TMO VZ TMO S DISH
39 Indianapolis, IN VZ T VZ T DISH T VZ VZ VZ LEAP TMO VZ S TMO T T T TMO VZ TMO USM S DISH
40 Louisville, KY T VZ T DISH VZ T VZ VZ LEAP TMO USM VZ T T TMO S S TMO T TMO LEAP VZ S DISH
41 Mayaguez, PR T DISH T VZ T TMO T S S VZ TMO TMO S DISH
42 Raleigh, NC USM VZ VZ T DISH VZ VZ T T VZ VZ LEAP TMO TMO TMO TMO S S T T S DISH
43 Oklahoma City, OK VZ VZ VZ T DISH VZ T T T VZ VZ LEAP TMO LEAP TMO TMO TMO S S USM VZ T USM S DISH
44 Greensboro, NC VZ VZ T DISH VZ VZ T T VZ VZ LEAP TMO TMO TMO TMO S S T T LEAP USM S VZ S DISH
45 New Orleans, LA T VZ T DISH VZ T LEAP LEAP VZ VZ TMO USM VZ S S T VZ VZ T T T TMO S DISH
46 Jacksonville, FL T VZ T DISH T T VZ VZ VZ VZ TMO TMO TMO TMO TMO TMO S VZ VZ T TMO PCS S DISH
47 Birmingham, AL T VZ T DISH VZ T TMO TMO VZ VZ TMO USM VZ S S T TMO TMO T TMO LEAP T S DISH
48 Austin, TX VZ T VZ T DISH T T TMO TMO VZ VZ TMO LEAP TMO VZ VZ TMO S T T TMO TMO LEAP S S DISH
49 Richmond, VA T VZ T DISH VZ VZ LEAP LEAP VZ VZ TMO TMO TMO TMO T T S NTLS VZ TMO TMO T S S DISH
50 Dayton, OH T VZ T DISH VZ T VZ VZ TMO LEAP TMO VZ T S TMO VZ TMO LEAP VZ T S S DISH
51 Buffalo, NY T VZ T DISH T VZ VZ VZ T T LEAP PCS TMO TMO S S VZ T T LEAP TMO TMO S DISH
52 Rochester, NY VZ VZ T DISH T VZ T T TMO TMO LEAP PCS TMO TMO S S TMO LEAP T LEAP VZ TMO TMO S DISH
53 West Palm Beach, FL VZ VZ VZ T DISH T T VZ VZ VZ VZ TMO TMO TMO TMO S T T VZ VZ TMO TMO PCS PCS S DISH
54 Hartford, CT VZ T VZ T T VZ T VZ VZ VZ VZ PCS PCS TMO TMO TMO T T S T S VZ T T S DISH
55 Knoxville, TN T VZ T DISH VZ USM VZ VZ LEAP TMO USM VZ T VZ S T T TMO T TMO LEAP S DISH
56 Grand Rapids, MI VZ T VZ T DISH VZ VZ TMO TMO TMO TMO PCS LEAP TMO VZ T T S S TMO TMO TMO LEAP S DISH
57 Albany, NY T VZ T DISH T VZ T T TMO TMO PCS TMO TMO TMO T T S S T T TMO VZ VZ S DISH
58 Omaha, NE T VZ T DISH VZ VZ USM USM VZ VZ TMO TMO LEAP TMO T USM VZ S S USM LEAP TMO TMO S DISH
59 New Haven, CT VZ T VZ T T VZ T VZ VZ VZ VZ PCS PCS TMO TMO TMO T S S VZ VZ TMO S DISH
60 Tulsa, OK T VZ T DISH T USM USM USM VZ VZ TMO LEAP TMO T T TMO S S VZ LEAP TMO S DISH
61 Fresno, CA VZ T VZ T DISH T VZ TMO TMO VZ VZ VZ TMO TMO S S T T TMO T TMO VZ LEAP LEAP S DISH
62 Little Rock, AR T VZ T DISH T VZ LEAP LEAP VZ VZ TMO USM VZ T TMO TMO S S T LEAP LEAP VZ S DISH
63 Lexington, KY T VZ T DISH VZ T T T VZ VZ LEAP TMO USM VZ T T TMO S S TMO VZ TMO LEAP VZ S DISH
64 Greenville, SC T VZ T DISH VZ VZ LEAP LEAP TMO TMO TMO TMO T S T T VZ VZ TMO TMO S DISH
65 Honolulu, HI T VZ T DISH T VZ VZ VZ VZ VZ TMO TMO TMO TMO TMO TMO T S S S T S DISH
66 Tucson, AZ T VZ T DISH VZ VZ VZ VZ VZ VZ TMO TMO LEAP TMO T T VZ S S TMO TMO LEAP T S DISH
67 Albuquerque, NM T VZ T DISH VZ VZ LEAP LEAP VZ VZ TMO LEAP TMO TMO TMO S T S VZ T LEAP T S DISH
68 El Paso, TX T VZ T DISH VZ VZ LEAP LEAP VZ VZ TMO LEAP TMO TMO TMO S T T S TMO LEAP T T S DISH
69 Des Moines, IA USM USM VZ T DISH USM VZ USM USM VZ VZ VZ LEAP TMO VZ TMO TMO USM S S T TMO T T S DISH
70 Toledo, OH VZ T VZ T DISH VZ VZ T T TMO S S VZ TMO VZ LEAP S DISH
71 Syracuse, NY T VZ T DISH T VZ LEAP LEAP VZ VZ TMO PCS TMO TMO TMO T T S S T VZ LEAP T S DISH
72 Worcester, MA PCS T VZ T T T VZ VZ VZ VZ VZ TMO PCS TMO TMO T T TMO S S TMO VZ VZ TMO S DISH
73 Spokane, WA T VZ T DISH T VZ VZ VZ LEAP T TMO TMO T VZ VZ S S T LEAP TMO S DISH
74 Savannah, GA T VZ T DISH VZ VZ LEAP LEAP VZ VZ TMO TMO TMO T TMO S TMO TMO T TMO T S DISH
75 Allentown, PA VZ T VZ T T T VZ VZ VZ VZ VZ PCS PCS TMO TMO TMO T T S T T VZ T VZ TMO S DISH
76 Ft Wayne, IN USM T VZ T DISH T VZ TMO TMO LEAP TMO VZ T T S VZ LEAP TMO TMO TMO S DISH
77 Harrisburg, PA T VZ T DISH T VZ VZ VZ VZ VZ PCS TMO TMO T VZ TMO S S T T TMO TMO S DISH
78 Kingsport, TN T VZ T DISH VZ VZ VZ VZ TMO USM VZ TMO T S T T S TMO TMO VZ S DISH
79 Charleston, SC T VZ T DISH VZ VZ VZ VZ LEAP TMO TMO TMO TMO T S T T VZ TMO TMO S DISH
80 Baton Rouge, LA T VZ T DISH VZ T LEAP LEAP VZ VZ TMO USM VZ S S T VZ VZ T T TMO TMO S DISH
81 Wichita, KS T VZ T DISH VZ T T T VZ VZ TMO TMO LEAP TMO T T TMO S S TMO LEAP S DISH
82 Bakersfield, CA VZ T VZ T T T VZ VZ VZ VZ VZ TMO PCS TMO TMO S TMO T T TMO VZ S DISH
83 Mobile, AL T VZ T DISH T VZ TMO TMO VZ VZ TMO USM VZ S S VZ VZ T T TMO TMO S DISH
84 Madison, WI USM T VZ T DISH USM T USM USM USM USM TMO LEAP TMO VZ S T T VZ VZ VZ S DISH
85 Jackson, MS T VZ T DISH VZ T TMO TMO VZ VZ TMO USM VZ TMO TMO S T T LEAP S DISH
86 Macon, GA T VZ T DISH VZ T VZ VZ TMO TMO TMO T T S TMO TMO VZ TMO LEAP LEAP S DISH
87 Springfield, MA VZ T VZ T T VZ T VZ VZ PCS PCS TMO TMO T T TMO S S VZ VZ TMO TMO S DISH
88 Columbia, SC T VZ T DISH VZ VZ LEAP LEAP VZ VZ TMO TMO TMO TMO T S T T VZ VZ TMO TMO S DISH
89 Scranton, PA VZ T VZ T T T VZ VZ VZ VZ VZ PCS PCS TMO TMO TMO T T S S T VZ VZ TMO S DISH
90 Roanoke, VA USM VZ T DISH USM VZ VZ VZ TMO TMO TMO T T NTLS NTLS S TMO VZ T S DISH
91 Springfield, MO T VZ T DISH T VZ VZ VZ TMO TMO USM VZ T USM T S S TMO T TMO VZ S DISH
92 Fayetteville, NC USM VZ T DISH VZ VZ VZ VZ T T TMO TMO TMO TMO T S T T VZ S DISH
93 Saginaw, MI VZ T VZ T DISH VZ VZ T T TMO TMO PCS LEAP TMO VZ T VZ S S TMO T T TMO VZ S DISH
94 McAllen, TX T VZ T DISH VZ T TMO TMO LEAP TMO LEAP TMO S S TMO VZ VZ T TMO TMO S S DISH
95 Stockton, CA VZ T VZ T T T VZ TMO TMO PCS TMO TMO S S T T TMO TMO PCS PCS S DISH
96 Sarasota, FL T VZ T DISH T VZ VZ VZ VZ VZ TMO TMO TMO TMO TMO S VZ VZ T TMO PCS T T S DISH
97 Ft Myers, FL T VZ T DISH T VZ VZ VZ VZ VZ TMO TMO TMO S TMO T VZ VZ T T PCS PCS S DISH
98 Manchester, NH PCS T VZ T T USM VZ VZ VZ VZ VZ TMO PCS TMO TMO T T TMO S S TMO VZ T TMO VZ S DISH
99 Reno, NV T VZ T DISH T VZ LEAP LEAP VZ VZ PCS TMO TMO S S T T TMO VZ TMO T LEAP S DISH
100 Asheville, NC USM USM VZ T DISH VZ USM VZ VZ TMO TMO TMO TMO TMO S T T VZ USM VZ S DISH
21
North America Equity Research05 December 2012
Philip Cusick, CFA(1-212) [email protected]
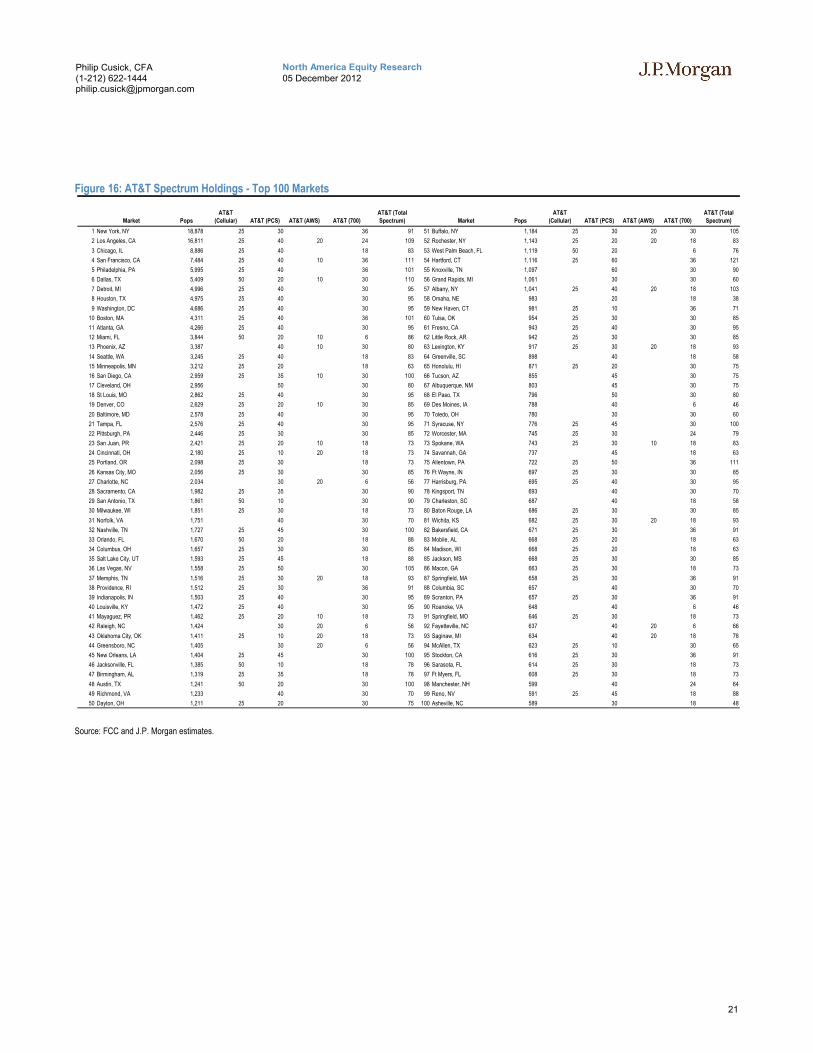
Figure 16: AT&T Spectrum Holdings - Top 100 Markets
Source: FCC and J.P. Morgan estimates.
Market Pops
AT&T
(Cellular) AT&T (PCS) AT&T (AWS) AT&T (700)
AT&T (Total
Spectrum) Market Pops
AT&T
(Cellular) AT&T (PCS) AT&T (AWS) AT&T (700)
AT&T (Total
Spectrum)
1 New York, NY 18,878 25 30 36 91 51 Buffalo, NY 1,184 25 30 20 30 105
2 Los Angeles, CA 16,811 25 40 20 24 109 52 Rochester, NY 1,143 25 20 20 18 83
3 Chicago, IL 8,886 25 40 18 83 53 West Palm Beach, FL 1,119 50 20 6 76
4 San Francisco, CA 7,484 25 40 10 36 111 54 Hartford, CT 1,116 25 60 36 121
5 Philadelphia, PA 5,995 25 40 36 101 55 Knoxville, TN 1,097 60 30 90
6 Dallas, TX 5,409 50 20 10 30 110 56 Grand Rapids, MI 1,061 30 30 60
7 Detroit, MI 4,996 25 40 30 95 57 Albany, NY 1,041 25 40 20 18 103
8 Houston, TX 4,975 25 40 30 95 58 Omaha, NE 983 20 18 38
9 Washington, DC 4,686 25 40 30 95 59 New Haven, CT 981 25 10 36 71
10 Boston, MA 4,311 25 40 36 101 60 Tulsa, OK 954 25 30 30 85
11 Atlanta, GA 4,266 25 40 30 95 61 Fresno, CA 943 25 40 30 95
12 Miami, FL 3,844 50 20 10 6 86 62 Little Rock, AR 942 25 30 30 85
13 Phoenix, AZ 3,387 40 10 30 80 63 Lexington, KY 917 25 30 20 18 93
14 Seattle, WA 3,245 25 40 18 83 64 Greenville, SC 898 40 18 58
15 Minneapolis, MN 3,212 25 20 18 63 65 Honolulu, HI 871 25 20 30 75
16 San Diego, CA 2,959 25 35 10 30 100 66 Tucson, AZ 855 45 30 75
17 Cleveland, OH 2,956 50 30 80 67 Albuquerque, NM 803 45 30 75
18 St Louis, MO 2,862 25 40 30 95 68 El Paso, TX 796 50 30 80
19 Denver, CO 2,629 25 20 10 30 85 69 Des Moines, IA 788 40 6 46
20 Baltimore, MD 2,578 25 40 30 95 70 Toledo, OH 780 30 30 60
21 Tampa, FL 2,576 25 40 30 95 71 Syracuse, NY 776 25 45 30 100
22 Pittsburgh, PA 2,446 25 30 30 85 72 Worcester, MA 745 25 30 24 79
23 San Juan, PR 2,421 25 20 10 18 73 73 Spokane, WA 743 25 30 10 18 83
24 Cincinnati, OH 2,180 25 10 20 18 73 74 Savannah, GA 737 45 18 63
25 Portland, OR 2,098 25 30 18 73 75 Allentown, PA 722 25 50 36 111
26 Kansas City, MO 2,056 25 30 30 85 76 Ft Wayne, IN 697 25 30 30 85
27 Charlotte, NC 2,034 30 20 6 56 77 Harrisburg, PA 695 25 40 30 95
28 Sacramento, CA 1,982 25 35 30 90 78 Kingsport, TN 693 40 30 70
29 San Antonio, TX 1,861 50 10 30 90 79 Charleston, SC 687 40 18 58
30 Milwaukee, WI 1,851 25 30 18 73 80 Baton Rouge, LA 686 25 30 30 85
31 Norfolk, VA 1,751 40 30 70 81 Wichita, KS 682 25 30 20 18 93
32 Nashville, TN 1,727 25 45 30 100 82 Bakersfield, CA 671 25 30 36 91
33 Orlando, FL 1,670 50 20 18 88 83 Mobile, AL 668 25 20 18 63
34 Columbus, OH 1,657 25 30 30 85 84 Madison, WI 668 25 20 18 63
35 Salt Lake City, UT 1,593 25 45 18 88 85 Jackson, MS 668 25 30 30 85
36 Las Vegas, NV 1,558 25 50 30 105 86 Macon, GA 663 25 30 18 73
37 Memphis, TN 1,516 25 30 20 18 93 87 Springfield, MA 658 25 30 36 91
38 Providence, RI 1,512 25 30 36 91 88 Columbia, SC 657 40 30 70
39 Indianapolis, IN 1,503 25 40 30 95 89 Scranton, PA 657 25 30 36 91
40 Louisville, KY 1,472 25 40 30 95 90 Roanoke, VA 648 40 6 46
41 Mayaguez, PR 1,462 25 20 10 18 73 91 Springfield, MO 646 25 30 18 73
42 Raleigh, NC 1,424 30 20 6 56 92 Fayetteville, NC 637 40 20 6 66
43 Oklahoma City, OK 1,411 25 10 20 18 73 93 Saginaw, MI 634 40 20 18 78
44 Greensboro, NC 1,405 30 20 6 56 94 McAllen, TX 623 25 10 30 65
45 New Orleans, LA 1,404 25 45 30 100 95 Stockton, CA 616 25 30 36 91
46 Jacksonville, FL 1,385 50 10 18 78 96 Sarasota, FL 614 25 30 18 73
47 Birmingham, AL 1,319 25 35 18 78 97 Ft Myers, FL 608 25 30 18 73
48 Austin, TX 1,241 50 20 30 100 98 Manchester, NH 599 40 24 64
49 Richmond, VA 1,233 40 30 70 99 Reno, NV 591 25 45 18 88
50 Dayton, OH 1,211 25 20 30 75 100 Asheville, NC 589 30 18 48

22
North America Equity Research05 December 2012
Philip Cusick, CFA(1-212) [email protected]
Figure 17: Verizon Spectrum Holdings - Top 100 Markets
Source: FCC and J.P. Morgan estimates.
Market Pops
Verizon
(Cellular) Verizon (PCS) Verizon (AWS) Verizon (700)
Verizon (Total
Spectrum) Market Pops
Verizon
(Cellular) Verizon (PCS) Verizon (AWS) Verizon (700)
Verizon (Total
Spectrum)
1 New York, NY 18,878 25 40 40 34 139 51 Buffalo, NY 1,184 25 10 20 22 77
2 Los Angeles, CA 16,811 25 20 20 46 111 52 Rochester, NY 1,143 25 10 34 69
3 Chicago, IL 8,886 25 10 50 34 119 53 West Palm Beach, FL 1,119 30 40 46 116
4 San Francisco, CA 7,484 25 10 20 34 89 54 Hartford, CT 1,116 25 10 40 34 109
5 Philadelphia, PA 5,995 25 20 30 34 109 55 Knoxville, TN 1,097 25 40 22 87
6 Dallas, TX 5,409 30 20 34 84 56 Grand Rapids, MI 1,061 50 20 34 104
7 Detroit, MI 4,996 25 10 30 34 99 57 Albany, NY 1,041 25 20 22 67
8 Houston, TX 4,975 25 20 30 34 109 58 Omaha, NE 983 50 10 20 22 102
9 Washington, DC 4,686 25 30 30 34 119 59 New Haven, CT 981 25 20 40 34 119
10 Boston, MA 4,311 25 30 40 22 117 60 Tulsa, OK 954 10 20 22 52
11 Atlanta, GA 4,266 25 10 40 34 109 61 Fresno, CA 943 25 10 30 34 99
12 Miami, FL 3,844 30 40 46 116 62 Little Rock, AR 942 25 10 40 22 97
13 Phoenix, AZ 3,387 50 10 20 22 102 63 Lexington, KY 917 25 20 40 22 107
14 Seattle, WA 3,245 25 20 50 22 117 64 Greenville, SC 898 50 20 22 92
15 Minneapolis, MN 3,212 25 20 40 34 119 65 Honolulu, HI 871 25 40 22 87
16 San Diego, CA 2,959 25 20 30 22 97 66 Tucson, AZ 855 50 10 40 22 122
17 Cleveland, OH 2,956 50 20 20 34 124 67 Albuquerque, NM 803 50 10 20 22 102
18 St Louis, MO 2,862 25 10 20 22 77 68 El Paso, TX 796 50 20 22 92
19 Denver, CO 2,629 25 10 20 34 89 69 Des Moines, IA 788 25 50 22 97
20 Baltimore, MD 2,578 25 30 40 34 129 70 Toledo, OH 780 50 25 34 109
21 Tampa, FL 2,576 25 30 40 34 129 71 Syracuse, NY 776 25 10 20 22 77
22 Pittsburgh, PA 2,446 25 10 40 22 97 72 Worcester, MA 745 25 20 40 22 107
23 San Juan, PR 2,421 10 10 73 Spokane, WA 743 25 20 20 22 87
24 Cincinnati, OH 2,180 25 20 20 46 111 74 Savannah, GA 737 50 20 22 92
25 Portland, OR 2,098 25 10 20 22 77 75 Allentown, PA 722 25 20 40 34 119
26 Kansas City, MO 2,056 25 10 40 34 109 76 Ft Wayne, IN 697 25 10 20 22 77
27 Charlotte, NC 2,034 50 20 20 34 124 77 Harrisburg, PA 695 25 10 40 22 97
28 Sacramento, CA 1,982 25 30 34 89 78 Kingsport, TN 693 50 15 40 22 127
29 San Antonio, TX 1,861 30 20 34 84 79 Charleston, SC 687 50 10 20 22 102
30 Milwaukee, WI 1,851 30 20 22 72 80 Baton Rouge, LA 686 25 30 40 22 117
31 Norfolk, VA 1,751 50 20 40 22 132 81 Wichita, KS 682 25 20 22 67
32 Nashville, TN 1,727 25 40 22 87 82 Bakersfield, CA 671 25 10 40 34 109
33 Orlando, FL 1,670 30 40 34 104 83 Mobile, AL 668 25 30 40 22 117
34 Columbus, OH 1,657 25 20 20 22 87 84 Madison, WI 668 40 20 22 82
35 Salt Lake City, UT 1,593 25 10 40 22 97 85 Jackson, MS 668 25 40 22 87
36 Las Vegas, NV 1,558 25 10 20 22 77 86 Macon, GA 663 25 10 20 22 77
37 Memphis, TN 1,516 25 10 30 34 99 87 Springfield, MA 658 25 20 20 34 99
38 Providence, RI 1,512 25 20 40 22 107 88 Columbia, SC 657 50 20 20 22 112
39 Indianapolis, IN 1,503 25 10 40 34 109 89 Scranton, PA 657 25 20 40 34 119
40 Louisville, KY 1,472 25 10 40 22 97 90 Roanoke, VA 648 25 10 20 22 77
41 Mayaguez, PR 1,462 25 10 35 91 Springfield, MO 646 25 10 40 22 97
42 Raleigh, NC 1,424 50 20 34 104 92 Fayetteville, NC 637 50 10 20 22 102
43 Oklahoma City, OK 1,411 25 10 20 46 101 93 Saginaw, MI 634 50 20 20 34 124
44 Greensboro, NC 1,405 50 10 20 34 114 94 McAllen, TX 623 25 30 22 77
45 New Orleans, LA 1,404 25 30 40 22 117 95 Stockton, CA 616 25 34 59
46 Jacksonville, FL 1,385 30 40 22 92 96 Sarasota, FL 614 25 30 40 22 117
47 Birmingham, AL 1,319 25 40 22 87 97 Ft Myers, FL 608 25 30 40 22 117
48 Austin, TX 1,241 30 20 34 84 98 Manchester, NH 599 25 20 40 22 107
49 Richmond, VA 1,233 50 10 20 22 102 99 Reno, NV 591 25 10 20 22 77
50 Dayton, OH 1,211 25 20 40 22 107 100 Asheville, NC 589 25 20 20 22 87

23
North America Equity Research05 December 2012
Philip Cusick, CFA(1-212) [email protected]
Figure 18: Sprint Spectrum Holdings - Top 100 Markets
Source: FCC and J.P. Morgan estimates.
Market Pops
Sprint
(Cellular) Sprint (PCS) Sprint (AWS) Sprint (700)
Sprint (Total
Spectrum) Market Pops
Sprint
(Cellular) Sprint (PCS) Sprint (AWS) Sprint (700)
Sprint (Total
Spectrum)
1 New York, NY 18,878 14 40 54 51 Buffalo, NY 1,184 14 40 54
2 Los Angeles, CA 16,811 14 40 54 52 Rochester, NY 1,143 14 40 54
3 Chicago, IL 8,886 14 30 44 53 West Palm Beach, FL 1,119 14 30 44
4 San Francisco, CA 7,484 14 30 44 54 Hartford, CT 1,116 14 40 54
5 Philadelphia, PA 5,995 14 40 54 55 Knoxville, TN 1,097 14 20 34
6 Dallas, TX 5,409 14 40 54 56 Grand Rapids, MI 1,061 14 40 54
7 Detroit, MI 4,996 14 40 54 57 Albany, NY 1,041 14 40 54
8 Houston, TX 4,975 14 30 44 58 Omaha, NE 983 14 40 54
9 Washington, DC 4,686 14 40 54 59 New Haven, CT 981 14 40 54
10 Boston, MA 4,311 14 40 54 60 Tulsa, OK 954 14 40 54
11 Atlanta, GA 4,266 14 30 44 61 Fresno, CA 943 14 40 54
12 Miami, FL 3,844 14 30 44 62 Little Rock, AR 942 14 40 54
13 Phoenix, AZ 3,387 14 40 54 63 Lexington, KY 917 14 40 54
14 Seattle, WA 3,245 14 40 54 64 Greenville, SC 898 14 20 34
15 Minneapolis, MN 3,212 14 40 54 65 Honolulu, HI 871 14 50 64
16 San Diego, CA 2,959 14 40 54 66 Tucson, AZ 855 14 40 54
17 Cleveland, OH 2,956 14 30 44 67 Albuquerque, NM 803 14 30 44
18 St Louis, MO 2,862 14 40 54 68 El Paso, TX 796 14 30 44
19 Denver, CO 2,629 14 40 54 69 Des Moines, IA 788 14 40 54
20 Baltimore, MD 2,578 14 30 44 70 Toledo, OH 780 14 40 54
21 Tampa, FL 2,576 14 25 39 71 Syracuse, NY 776 14 40 54
22 Pittsburgh, PA 2,446 14 40 54 72 Worcester, MA 745 14 40 54
23 San Juan, PR 2,421 14 30 44 73 Spokane, WA 743 14 40 54
24 Cincinnati, OH 2,180 14 30 44 74 Savannah, GA 737 14 20 34
25 Portland, OR 2,098 14 40 54 75 Allentown, PA 722 14 40 54
26 Kansas City, MO 2,056 14 40 54 76 Ft Wayne, IN 697 14 20 34
27 Charlotte, NC 2,034 14 30 44 77 Harrisburg, PA 695 14 40 54
28 Sacramento, CA 1,982 14 40 54 78 Kingsport, TN 693 14 30 44
29 San Antonio, TX 1,861 14 40 54 79 Charleston, SC 687 14 20 34
30 Milwaukee, WI 1,851 14 30 44 80 Baton Rouge, LA 686 14 40 54
31 Norfolk, VA 1,751 14 30 44 81 Wichita, KS 682 14 40 54
32 Nashville, TN 1,727 14 40 54 82 Bakersfield, CA 671 14 30 44
33 Orlando, FL 1,670 14 30 44 83 Mobile, AL 668 14 40 54
34 Columbus, OH 1,657 14 40 54 84 Madison, WI 668 14 30 44
35 Salt Lake City, UT 1,593 14 30 44 85 Jackson, MS 668 14 20 34
36 Las Vegas, NV 1,558 14 40 54 86 Macon, GA 663 14 20 34
37 Memphis, TN 1,516 14 30 44 87 Springfield, MA 658 14 40 54
38 Providence, RI 1,512 14 40 54 88 Columbia, SC 657 14 20 34
39 Indianapolis, IN 1,503 14 30 44 89 Scranton, PA 657 14 40 54
40 Louisville, KY 1,472 14 40 54 90 Roanoke, VA 648 14 20 34
41 Mayaguez, PR 1,462 14 30 44 91 Springfield, MO 646 14 40 54
42 Raleigh, NC 1,424 14 30 44 92 Fayetteville, NC 637 14 20 34
43 Oklahoma City, OK 1,411 14 40 54 93 Saginaw, MI 634 14 40 54
44 Greensboro, NC 1,405 14 40 54 94 McAllen, TX 623 14 50 64
45 New Orleans, LA 1,404 14 40 54 95 Stockton, CA 616 14 40 54
46 Jacksonville, FL 1,385 14 20 34 96 Sarasota, FL 614 14 20 34
47 Birmingham, AL 1,319 14 40 54 97 Ft Myers, FL 608 14 30 44
48 Austin, TX 1,241 14 40 54 98 Manchester, NH 599 14 40 54
49 Richmond, VA 1,233 14 30 44 99 Reno, NV 591 14 40 54
50 Dayton, OH 1,211 14 30 44 100 Asheville, NC 589 14 20 34

24
North America Equity Research05 December 2012
Philip Cusick, CFA(1-212) [email protected]
Figure 19: T-Mobile USA Spectrum Holdings - Top 100 Markets
Source: FCC and J.P. Morgan estimates.
Market Pops
T-Mobile
(Cellular) T-Mobile (PCS)
T-Mobile
(AWS) T-Mobile (700)
T-Mobile (Total
Spectrum) Market Pops
T-Mobile
(Cellular) T-Mobile (PCS)
T-Mobile
(AWS) T-Mobile (700)
T-Mobile (Total
Spectrum)
1 New York, NY 18,878 20 30 50 51 Buffalo, NY 1,184 30 30 60
2 Los Angeles, CA 16,811 20 40 60 52 Rochester, NY 1,143 40 50 90
3 Chicago, IL 8,886 30 30 60 53 West Palm Beach, FL 1,119 20 50 70
4 San Francisco, CA 7,484 30 40 70 54 Hartford, CT 1,116 20 30 50
5 Philadelphia, PA 5,995 30 30 60 55 Knoxville, TN 1,097 25 10 35
6 Dallas, TX 5,409 30 40 70 56 Grand Rapids, MI 1,061 35 50 85
7 Detroit, MI 4,996 30 40 70 57 Albany, NY 1,041 30 50 80
8 Houston, TX 4,975 30 40 70 58 Omaha, NE 983 30 40 70
9 Washington, DC 4,686 20 40 60 59 New Haven, CT 981 30 30 60
10 Boston, MA 4,311 20 40 60 60 Tulsa, OK 954 25 30 55
11 Atlanta, GA 4,266 30 50 80 61 Fresno, CA 943 20 50 70
12 Miami, FL 3,844 20 40 60 62 Little Rock, AR 942 20 10 30
13 Phoenix, AZ 3,387 30 40 70 63 Lexington, KY 917 30 10 40
14 Seattle, WA 3,245 30 40 70 64 Greenville, SC 898 40 40 80
15 Minneapolis, MN 3,212 40 40 80 65 Honolulu, HI 871 30 50 80
16 San Diego, CA 2,959 25 40 65 66 Tucson, AZ 855 20 40 60
17 Cleveland, OH 2,956 20 50 70 67 Albuquerque, NM 803 30 30 60
18 St Louis, MO 2,862 30 20 50 68 El Paso, TX 796 40 30 70
19 Denver, CO 2,629 30 40 70 69 Des Moines, IA 788 40 10 50
20 Baltimore, MD 2,578 30 30 60 70 Toledo, OH 780 20 20
21 Tampa, FL 2,576 25 40 65 71 Syracuse, NY 776 20 40 60
22 Pittsburgh, PA 2,446 30 30 60 72 Worcester, MA 745 30 40 70
23 San Juan, PR 2,421 25 30 55 73 Spokane, WA 743 15 30 45
24 Cincinnati, OH 2,180 30 10 40 74 Savannah, GA 737 50 40 90
25 Portland, OR 2,098 30 40 70 75 Allentown, PA 722 30 30 60
26 Kansas City, MO 2,056 40 20 60 76 Ft Wayne, IN 697 40 30 70
27 Charlotte, NC 2,034 20 40 60 77 Harrisburg, PA 695 40 30 70
28 Sacramento, CA 1,982 25 40 65 78 Kingsport, TN 693 45 10 55
29 San Antonio, TX 1,861 30 40 70 79 Charleston, SC 687 40 40 80
30 Milwaukee, WI 1,851 20 30 50 80 Baton Rouge, LA 686 30 10 40
31 Norfolk, VA 1,751 20 40 60 81 Wichita, KS 682 20 40 60
32 Nashville, TN 1,727 30 10 40 82 Bakersfield, CA 671 20 40 60
33 Orlando, FL 1,670 40 40 80 83 Mobile, AL 668 30 30 60
34 Columbus, OH 1,657 30 50 80 84 Madison, WI 668 20 20
35 Salt Lake City, UT 1,593 30 40 70 85 Jackson, MS 668 30 30 60
36 Las Vegas, NV 1,558 30 30 60 86 Macon, GA 663 40 40 80
37 Memphis, TN 1,516 30 20 50 87 Springfield, MA 658 40 30 70
38 Providence, RI 1,512 30 40 70 88 Columbia, SC 657 40 40 80
39 Indianapolis, IN 1,503 30 10 40 89 Scranton, PA 657 30 30 60
40 Louisville, KY 1,472 30 10 40 90 Roanoke, VA 648 10 40 50
41 Mayaguez, PR 1,462 25 20 45 91 Springfield, MO 646 20 20 40
42 Raleigh, NC 1,424 20 40 60 92 Fayetteville, NC 637 20 40 60
43 Oklahoma City, OK 1,411 30 30 60 93 Saginaw, MI 634 20 30 50
44 Greensboro, NC 1,405 20 40 60 94 McAllen, TX 623 30 50 80
45 New Orleans, LA 1,404 15 10 25 95 Stockton, CA 616 20 50 70
46 Jacksonville, FL 1,385 40 50 90 96 Sarasota, FL 614 40 40 80
47 Birmingham, AL 1,319 40 30 70 97 Ft Myers, FL 608 10 40 50
48 Austin, TX 1,241 30 50 80 98 Manchester, NH 599 30 40 70
49 Richmond, VA 1,233 20 50 70 99 Reno, NV 591 20 30 50
50 Dayton, OH 1,211 30 20 50 100 Asheville, NC 589 30 40 70

25
North America Equity Research05 December 2012
Philip Cusick, CFA(1-212) [email protected]
Figure 20: MetroPCS Spectrum Holdings - Top 100 Markets
Source: FCC and J.P. Morgan estimates.
Market Pops
MetroPCS
(Cellular) MetroPCS (PCS) MetroPCS (AWS) MetroPCS (700)
MetroPCS (Total
Spectrum) Market Pops
MetroPCS
(Cellular)
MetroPCS
(PCS)
MetroPCS
(AWS)
MetroPCS
(700)
MetroPCS (Total
Spectrum)
1 New York, NY 18,878 20 20 51 Buffalo, NY 1,184 10 10
2 Los Angeles, CA 16,811 10 10 20 52 Rochester, NY 1,143 10 10
3 Chicago, IL 8,886 0 53 West Palm Beach, FL 1,119 30 30
4 San Francisco, CA 7,484 20 10 30 54 Hartford, CT 1,116 20 20
5 Philadelphia, PA 5,995 10 10 55 Knoxville, TN 1,097 0
6 Dallas, TX 5,409 10 20 30 56 Grand Rapids, MI 1,061 10 10
7 Detroit, MI 4,996 10 10 20 57 Albany, NY 1,041 10 10
8 Houston, TX 4,975 0 58 Omaha, NE 983 0
9 Washington, DC 4,686 0 59 New Haven, CT 981 20 20
10 Boston, MA 4,311 10 12 22 60 Tulsa, OK 954 0
11 Atlanta, GA 4,266 20 20 61 Fresno, CA 943 0
12 Miami, FL 3,844 30 30 62 Little Rock, AR 942 0
13 Phoenix, AZ 3,387 0 63 Lexington, KY 917 0
14 Seattle, WA 3,245 0 64 Greenville, SC 898 0
15 Minneapolis, MN 3,212 0 65 Honolulu, HI 871 0
16 San Diego, CA 2,959 0 66 Tucson, AZ 855 0
17 Cleveland, OH 2,956 0 67 Albuquerque, NM 803 0
18 St Louis, MO 2,862 0 68 El Paso, TX 796 0
19 Denver, CO 2,629 0 69 Des Moines, IA 788 0
20 Baltimore, MD 2,578 0 70 Toledo, OH 780 0
21 Tampa, FL 2,576 10 10 20 71 Syracuse, NY 776 10 10
22 Pittsburgh, PA 2,446 0 72 Worcester, MA 745 10 12 22
23 San Juan, PR 2,421 0 73 Spokane, WA 743 0
24 Cincinnati, OH 2,180 0 74 Savannah, GA 737 0
25 Portland, OR 2,098 10 10 75 Allentown, PA 722 20 20
26 Kansas City, MO 2,056 0 76 Ft Wayne, IN 697 0
27 Charlotte, NC 2,034 0 77 Harrisburg, PA 695 10 10
28 Sacramento, CA 1,982 20 10 30 78 Kingsport, TN 693 0
29 San Antonio, TX 1,861 0 79 Charleston, SC 687 0
30 Milwaukee, WI 1,851 0 80 Baton Rouge, LA 686 0
31 Norfolk, VA 1,751 0 81 Wichita, KS 682 0
32 Nashville, TN 1,727 0 82 Bakersfield, CA 671 10 10
33 Orlando, FL 1,670 10 10 20 83 Mobile, AL 668 0
34 Columbus, OH 1,657 0 84 Madison, WI 668 0
35 Salt Lake City, UT 1,593 0 85 Jackson, MS 668 0
36 Las Vegas, NV 1,558 20 20 86 Macon, GA 663 0
37 Memphis, TN 1,516 0 87 Springfield, MA 658 20 20
38 Providence, RI 1,512 10 12 22 88 Columbia, SC 657 0
39 Indianapolis, IN 1,503 0 89 Scranton, PA 657 20 20
40 Louisville, KY 1,472 0 90 Roanoke, VA 648 0
41 Mayaguez, PR 1,462 0 91 Springfield, MO 646 0
42 Raleigh, NC 1,424 0 92 Fayetteville, NC 637 0
43 Oklahoma City, OK 1,411 0 93 Saginaw, MI 634 10 10
44 Greensboro, NC 1,405 0 94 McAllen, TX 623 0
45 New Orleans, LA 1,404 0 95 Stockton, CA 616 30 10 40
46 Jacksonville, FL 1,385 10 10 96 Sarasota, FL 614 10 10
47 Birmingham, AL 1,319 0 97 Ft Myers, FL 608 30 30
48 Austin, TX 1,241 0 98 Manchester, NH 599 10 12 22
49 Richmond, VA 1,233 0 99 Reno, NV 591 10 10
50 Dayton, OH 1,211 0 100 Asheville, NC 589 0

26
North America Equity Research05 December 2012
Philip Cusick, CFA(1-212) [email protected]
Figure 21: Leap Wireless Spectrum Holdings - Top 100 Markets
Source: FCC and J.P. Morgan estimates.
Market Pops Leap (Cellular) Leap (PCS) Leap (AWS) Leap (700)
Leap (Total
Spectrum) Market Pops Leap (Cellular) Leap (PCS) Leap (AWS) Leap (700)
Leap (Total
Spectrum)
1 New York, NY 18,878 0 51 Buffalo, NY 1,184 10 10 20
2 Los Angeles, CA 16,811 0 52 Rochester, NY 1,143 10 10 20
3 Chicago, IL 8,886 10 12 22 53 West Palm Beach, FL 1,119 0
4 San Francisco, CA 7,484 0 54 Hartford, CT 1,116 0
5 Philadelphia, PA 5,995 20 20 55 Knoxville, TN 1,097 15 10 25
6 Dallas, TX 5,409 0 56 Grand Rapids, MI 1,061 15 10 25
7 Detroit, MI 4,996 10 10 57 Albany, NY 1,041 0
8 Houston, TX 4,975 10 20 30 58 Omaha, NE 983 10 10 20
9 Washington, DC 4,686 20 20 59 New Haven, CT 981 0
10 Boston, MA 4,311 0 60 Tulsa, OK 954 15 10 25
11 Atlanta, GA 4,266 0 61 Fresno, CA 943 20 20
12 Miami, FL 3,844 0 62 Little Rock, AR 942 20 20 40
13 Phoenix, AZ 3,387 10 20 30 63 Lexington, KY 917 10 10 20
14 Seattle, WA 3,245 0 64 Greenville, SC 898 20 20
15 Minneapolis, MN 3,212 10 10 65 Honolulu, HI 871 0
16 San Diego, CA 2,959 10 10 20 66 Tucson, AZ 855 15 10 25
17 Cleveland, OH 2,956 10 10 67 Albuquerque, NM 803 15 30 45
18 St Louis, MO 2,862 20 20 68 El Paso, TX 796 10 30 40
19 Denver, CO 2,629 10 10 20 69 Des Moines, IA 788 10 10
20 Baltimore, MD 2,578 20 20 70 Toledo, OH 780 15 15
21 Tampa, FL 2,576 0 71 Syracuse, NY 776 15 20 35
22 Pittsburgh, PA 2,446 10 10 20 72 Worcester, MA 745 0
23 San Juan, PR 2,421 0 73 Spokane, WA 743 15 10 25
24 Cincinnati, OH 2,180 10 10 20 74 Savannah, GA 737 20 20
25 Portland, OR 2,098 20 20 75 Allentown, PA 722 0
26 Kansas City, MO 2,056 10 20 30 76 Ft Wayne, IN 697 10 10 20
27 Charlotte, NC 2,034 10 10 20 77 Harrisburg, PA 695 0
28 Sacramento, CA 1,982 0 78 Kingsport, TN 693 0
29 San Antonio, TX 1,861 10 10 20 79 Charleston, SC 687 10 10
30 Milwaukee, WI 1,851 20 20 80 Baton Rouge, LA 686 20 20
31 Norfolk, VA 1,751 10 10 81 Wichita, KS 682 15 10 25
32 Nashville, TN 1,727 15 10 25 82 Bakersfield, CA 671 0
33 Orlando, FL 1,670 0 83 Mobile, AL 668 0
34 Columbus, OH 1,657 10 10 84 Madison, WI 668 10 10
35 Salt Lake City, UT 1,593 15 10 25 85 Jackson, MS 668 10 10
36 Las Vegas, NV 1,558 20 20 86 Macon, GA 663 30 30
37 Memphis, TN 1,516 15 10 25 87 Springfield, MA 658 0
38 Providence, RI 1,512 0 88 Columbia, SC 657 20 20
39 Indianapolis, IN 1,503 10 10 89 Scranton, PA 657 0
40 Louisville, KY 1,472 10 10 20 90 Roanoke, VA 648 0
41 Mayaguez, PR 1,462 0 91 Springfield, MO 646 0
42 Raleigh, NC 1,424 10 10 92 Fayetteville, NC 637 0
43 Oklahoma City, OK 1,411 20 20 93 Saginaw, MI 634 10 10
44 Greensboro, NC 1,405 10 10 20 94 McAllen, TX 623 20 20
45 New Orleans, LA 1,404 20 20 95 Stockton, CA 616 0
46 Jacksonville, FL 1,385 0 96 Sarasota, FL 614 0
47 Birmingham, AL 1,319 15 15 97 Ft Myers, FL 608 0
48 Austin, TX 1,241 10 10 20 98 Manchester, NH 599 0
49 Richmond, VA 1,233 20 20 99 Reno, NV 591 15 20 35
50 Dayton, OH 1,211 10 10 20 100 Asheville, NC 589 0

27
North America Equity Research05 December 2012
Philip Cusick, CFA(1-212) [email protected]
Figure 22: US Cellular Spectrum Holdings - Top 100 Markets
Source: FCC and J.P. Morgan estimates.
Market Pops
US Cellular
(Cellular) US Cellular (PCS)
US Cellular
(AWS) US Cellular (700)
US Cellular (Total
Spectrum) Market Pops
US Cellular
(Cellular) US Cellular (PCS)
US Cellular
(AWS) US Cellular (700)
US Cellular
(Total Spectrum)
1 New York, NY 18,878 0 51 Buffalo, NY 1,184 0
2 Los Angeles, CA 16,811 0 52 Rochester, NY 1,143 0
3 Chicago, IL 8,886 20 20 53 West Palm Beach, FL 1,119 0
4 San Francisco, CA 7,484 0 54 Hartford, CT 1,116 0
5 Philadelphia, PA 5,995 0 55 Knoxville, TN 1,097 25 10 35
6 Dallas, TX 5,409 0 56 Grand Rapids, MI 1,061 0
7 Detroit, MI 4,996 0 57 Albany, NY 1,041 0
8 Houston, TX 4,975 0 58 Omaha, NE 983 20 20 40
9 Washington, DC 4,686 0 59 New Haven, CT 981 0
10 Boston, MA 4,311 0 60 Tulsa, OK 954 25 20 45
11 Atlanta, GA 4,266 0 61 Fresno, CA 943 0
12 Miami, FL 3,844 0 62 Little Rock, AR 942 10 10
13 Phoenix, AZ 3,387 0 63 Lexington, KY 917 10 10
14 Seattle, WA 3,245 0 64 Greenville, SC 898 0
15 Minneapolis, MN 3,212 10 10 65 Honolulu, HI 871 0
16 San Diego, CA 2,959 0 66 Tucson, AZ 855 0
17 Cleveland, OH 2,956 0 67 Albuquerque, NM 803 0
18 St Louis, MO 2,862 10 30 12 52 68 El Paso, TX 796 0
19 Denver, CO 2,629 0 69 Des Moines, IA 788 25 10 20 24 79
20 Baltimore, MD 2,578 0 70 Toledo, OH 780 0
21 Tampa, FL 2,576 0 71 Syracuse, NY 776 0
22 Pittsburgh, PA 2,446 0 72 Worcester, MA 745 0
23 San Juan, PR 2,421 0 73 Spokane, WA 743 0
24 Cincinnati, OH 2,180 0 74 Savannah, GA 737 0
25 Portland, OR 2,098 0 75 Allentown, PA 722 0
26 Kansas City, MO 2,056 10 10 76 Ft Wayne, IN 697 12 12
27 Charlotte, NC 2,034 10 10 77 Harrisburg, PA 695 0
28 Sacramento, CA 1,982 0 78 Kingsport, TN 693 10 10
29 San Antonio, TX 1,861 0 79 Charleston, SC 687 0
30 Milwaukee, WI 1,851 25 20 20 12 77 80 Baton Rouge, LA 686 10 10
31 Norfolk, VA 1,751 0 81 Wichita, KS 682 0
32 Nashville, TN 1,727 10 10 82 Bakersfield, CA 671 0
33 Orlando, FL 1,670 0 83 Mobile, AL 668 10 10
34 Columbus, OH 1,657 0 84 Madison, WI 668 25 40 12 77
35 Salt Lake City, UT 1,593 0 85 Jackson, MS 668 10 10
36 Las Vegas, NV 1,558 0 86 Macon, GA 663 0
37 Memphis, TN 1,516 10 10 87 Springfield, MA 658 0
38 Providence, RI 1,512 0 88 Columbia, SC 657 0
39 Indianapolis, IN 1,503 10 10 89 Scranton, PA 657 0
40 Louisville, KY 1,472 10 10 90 Roanoke, VA 648 25 12 37
41 Mayaguez, PR 1,462 0 91 Springfield, MO 646 20 10 30
42 Raleigh, NC 1,424 12 12 92 Fayetteville, NC 637 12 12
43 Oklahoma City, OK 1,411 20 20 93 Saginaw, MI 634 0
44 Greensboro, NC 1,405 10 10 94 McAllen, TX 623 0
45 New Orleans, LA 1,404 10 10 95 Stockton, CA 616 0
46 Jacksonville, FL 1,385 0 96 Sarasota, FL 614 0
47 Birmingham, AL 1,319 10 10 97 Ft Myers, FL 608 0
48 Austin, TX 1,241 0 98 Manchester, NH 599 25 25
49 Richmond, VA 1,233 0 99 Reno, NV 591 0
50 Dayton, OH 1,211 0 100 Asheville, NC 589 25 10 24 59

28
North America Equity Research05 December 2012
Philip Cusick, CFA(1-212) [email protected]
Figure 23: nTelos Spectrum Holdings - Top 100 Markets
Source: FCC and J.P. Morgan estimates.
Market PopsNTELOS (Cellular) NTELOS (PCS) NTELOS (AWS) NTELOS (700)
NTELOS (Total Spectrum) Market Pops
NTELOS (Cellular) NTELOS (PCS)
NTELOS (AWS) NTELOS (700)
NTELOS (Total Spectrum)
1 New York, NY 18,878 0 51 Buffalo, NY 1,184 0
2 Los Angeles, CA 16,811 0 52 Rochester, NY 1,143 0
3 Chicago, IL 8,886 0 53 West Palm Beach, FL 1,119 0
4 San Francisco, CA 7,484 0 54 Hartford, CT 1,116 0
5 Philadelphia, PA 5,995 0 55 Knoxville, TN 1,097 0
6 Dallas, TX 5,409 0 56 Grand Rapids, MI 1,061 0
7 Detroit, MI 4,996 0 57 Albany, NY 1,041 0
8 Houston, TX 4,975 0 58 Omaha, NE 983 0
9 Washington, DC 4,686 0 59 New Haven, CT 981 0
10 Boston, MA 4,311 0 60 Tulsa, OK 954 0
11 Atlanta, GA 4,266 0 61 Fresno, CA 943 0
12 Miami, FL 3,844 0 62 Little Rock, AR 942 0
13 Phoenix, AZ 3,387 0 63 Lexington, KY 917 0
14 Seattle, WA 3,245 0 64 Greenville, SC 898 0
15 Minneapolis, MN 3,212 0 65 Honolulu, HI 871 0
16 San Diego, CA 2,959 0 66 Tucson, AZ 855 0
17 Cleveland, OH 2,956 0 67 Albuquerque, NM 803 0
18 St Louis, MO 2,862 0 68 El Paso, TX 796 0
19 Denver, CO 2,629 0 69 Des Moines, IA 788 0
20 Baltimore, MD 2,578 0 70 Toledo, OH 780 0
21 Tampa, FL 2,576 0 71 Syracuse, NY 776 0
22 Pittsburgh, PA 2,446 0 72 Worcester, MA 745 0
23 San Juan, PR 2,421 0 73 Spokane, WA 743 0
24 Cincinnati, OH 2,180 0 74 Savannah, GA 737 0
25 Portland, OR 2,098 0 75 Allentown, PA 722 0
26 Kansas City, MO 2,056 0 76 Ft Wayne, IN 697 0
27 Charlotte, NC 2,034 0 77 Harrisburg, PA 695 0
28 Sacramento, CA 1,982 0 78 Kingsport, TN 693 0
29 San Antonio, TX 1,861 0 79 Charleston, SC 687 0
30 Milwaukee, WI 1,851 0 80 Baton Rouge, LA 686 0
31 Norfolk, VA 1,751 20 20 81 Wichita, KS 682 0
32 Nashville, TN 1,727 0 82 Bakersfield, CA 671 0
33 Orlando, FL 1,670 0 83 Mobile, AL 668 0
34 Columbus, OH 1,657 0 84 Madison, WI 668 0
35 Salt Lake City, UT 1,593 0 85 Jackson, MS 668 0
36 Las Vegas, NV 1,558 0 86 Macon, GA 663 0
37 Memphis, TN 1,516 0 87 Springfield, MA 658 0
38 Providence, RI 1,512 0 88 Columbia, SC 657 0
39 Indianapolis, IN 1,503 0 89 Scranton, PA 657 0
40 Louisville, KY 1,472 0 90 Roanoke, VA 648 30 20 50
41 Mayaguez, PR 1,462 0 91 Springfield, MO 646 0
42 Raleigh, NC 1,424 0 92 Fayetteville, NC 637 0
43 Oklahoma City, OK 1,411 0 93 Saginaw, MI 634 0
44 Greensboro, NC 1,405 0 94 McAllen, TX 623 0
45 New Orleans, LA 1,404 0 95 Stockton, CA 616 0
46 Jacksonville, FL 1,385 0 96 Sarasota, FL 614 0
47 Birmingham, AL 1,319 0 97 Ft Myers, FL 608 0
48 Austin, TX 1,241 0 98 Manchester, NH 599 0
49 Richmond, VA 1,233 20 20 99 Reno, NV 591 0
50 Dayton, OH 1,211 0 100 Asheville, NC 589 0

29
North America Equity Research05 December 2012
Philip Cusick, CFA(1-212) [email protected]
Figure 24: DISH Spectrum Holdings - Top 100 Markets
Source: FCC and J.P. Morgan estimates.
Market Pops DISH (700) DISH (MMDS)
DISH (Total
Spectrum) Market Pops DISH (700) DISH (MMDS)
DISH (Total
Spectrum)
1 New York, NY 18,878 40 40 51 Buffalo, NY 1,184 6 40 46
2 Los Angeles, CA 16,811 40 40 52 Rochester, NY 1,143 6 40 46
3 Chicago, IL 8,886 6 40 46 53 West Palm Beach, FL 1,119 6 40 46
4 San Francisco, CA 7,484 40 40 54 Hartford, CT 1,116 40 40
5 Philadelphia, PA 5,995 40 40 55 Knoxville, TN 1,097 6 40 46
6 Dallas, TX 5,409 6 40 46 56 Grand Rapids, MI 1,061 6 40 46
7 Detroit, MI 4,996 6 40 46 57 Albany, NY 1,041 6 40 46
8 Houston, TX 4,975 6 40 46 58 Omaha, NE 983 6 40 46
9 Washington, DC 4,686 6 40 46 59 New Haven, CT 981 40 40
10 Boston, MA 4,311 40 40 60 Tulsa, OK 954 6 40 46
11 Atlanta, GA 4,266 6 40 46 61 Fresno, CA 943 6 40 46
12 Miami, FL 3,844 6 40 46 62 Little Rock, AR 942 6 40 46
13 Phoenix, AZ 3,387 6 40 46 63 Lexington, KY 917 6 40 46
14 Seattle, WA 3,245 6 40 46 64 Greenville, SC 898 6 40 46
15 Minneapolis, MN 3,212 6 40 46 65 Honolulu, HI 871 6 40 46
16 San Diego, CA 2,959 6 40 46 66 Tucson, AZ 855 6 40 46
17 Cleveland, OH 2,956 6 40 46 67 Albuquerque, NM 803 6 40 46
18 St Louis, MO 2,862 6 40 46 68 El Paso, TX 796 6 40 46
19 Denver, CO 2,629 6 40 46 69 Des Moines, IA 788 6 40 46
20 Baltimore, MD 2,578 6 40 46 70 Toledo, OH 780 6 40 46
21 Tampa, FL 2,576 6 40 46 71 Syracuse, NY 776 6 40 46
22 Pittsburgh, PA 2,446 6 40 46 72 Worcester, MA 745 40 40
23 San Juan, PR 2,421 6 40 46 73 Spokane, WA 743 6 40 46
24 Cincinnati, OH 2,180 6 40 46 74 Savannah, GA 737 6 40 46
25 Portland, OR 2,098 6 40 46 75 Allentown, PA 722 40 40
26 Kansas City, MO 2,056 6 40 46 76 Ft Wayne, IN 697 6 40 46
27 Charlotte, NC 2,034 6 40 46 77 Harrisburg, PA 695 6 40 46
28 Sacramento, CA 1,982 6 40 46 78 Kingsport, TN 693 6 40 46
29 San Antonio, TX 1,861 6 40 46 79 Charleston, SC 687 6 40 46
30 Milwaukee, WI 1,851 6 40 46 80 Baton Rouge, LA 686 6 40 46
31 Norfolk, VA 1,751 6 40 46 81 Wichita, KS 682 6 40 46
32 Nashville, TN 1,727 6 40 46 82 Bakersfield, CA 671 40 40
33 Orlando, FL 1,670 6 40 46 83 Mobile, AL 668 6 40 46
34 Columbus, OH 1,657 6 40 46 84 Madison, WI 668 6 40 46
35 Salt Lake City, UT 1,593 6 40 46 85 Jackson, MS 668 6 40 46
36 Las Vegas, NV 1,558 6 40 46 86 Macon, GA 663 6 40 46
37 Memphis, TN 1,516 6 40 46 87 Springfield, MA 658 40 40
38 Providence, RI 1,512 40 40 88 Columbia, SC 657 6 40 46
39 Indianapolis, IN 1,503 6 40 46 89 Scranton, PA 657 40 40
40 Louisville, KY 1,472 6 40 46 90 Roanoke, VA 648 6 40 46
41 Mayaguez, PR 1,462 6 40 46 91 Springfield, MO 646 6 40 46
42 Raleigh, NC 1,424 6 40 46 92 Fayetteville, NC 637 6 40 46
43 Oklahoma City, OK 1,411 6 40 46 93 Saginaw, MI 634 6 40 46
44 Greensboro, NC 1,405 6 40 46 94 McAllen, TX 623 6 40 46
45 New Orleans, LA 1,404 6 40 46 95 Stockton, CA 616 40 40
46 Jacksonville, FL 1,385 6 40 46 96 Sarasota, FL 614 6 40 46
47 Birmingham, AL 1,319 6 40 46 97 Ft Myers, FL 608 6 40 46
48 Austin, TX 1,241 6 40 46 98 Manchester, NH 599 40 40
49 Richmond, VA 1,233 6 40 46 99 Reno, NV 591 6 40 46
50 Dayton, OH 1,211 6 40 46 100 Asheville, NC 589 6 40 46

30
North America Equity Research05 December 2012
Philip Cusick, CFA(1-212) [email protected]
Analyst Certification: The research analyst(s) denoted by an “AC” on the cover of this report certifies (or, where multiple research analysts are primarily responsible for this report, the research analyst denoted by an “AC” on the cover or within the document individually certifies, with respect to each security or issuer that the research analyst covers in this research) that: (1) all of the views expressed in this report accurately reflect his or her personal views about any and all of the subject securities or issuers; and (2) no part of any of the research analyst's compensation was, is, or will be directly or indirectly related to the specific recommendations or views expressed by the research analyst(s) in this report.
Important Disclosures
Company-Specific Disclosures: Important disclosures, including price charts, are available for compendium reports and all J.P. Morgan–covered companies by visiting https://mm.jpmorgan.com/disclosures/company, calling 1-800-477-0406, or emailing [email protected] with your request.
Explanation of Equity Research Ratings, Designations and Analyst(s) Coverage Universe: J.P. Morgan uses the following rating system: Overweight [Over the next six to twelve months, we expect this stock will outperform the average total return of the stocks in the analyst’s (or the analyst’s team’s) coverage universe.] Neutral [Over the next six to twelve months, we expect this stock will perform in line with the average total return of the stocks in the analyst’s (or the analyst’s team’s) coverage universe.] Underweight [Over the next six to twelve months, we expect this stock will underperform the average total return of the stocks in the analyst’s (or the analyst’s team’s) coverage universe.] Not Rated (NR): J.P. Morgan has removed the rating and, if applicable, the price target, for this stock because of either a lack of a sufficient fundamental basis or for legal, regulatory or policy reasons. The previous rating and, if applicable, the price target, no longer should be relied upon. An NR designation is not a recommendation or a rating. In our Asia (ex-Australia) and U.K. small- and mid-cap equity research, each stock’s expected total return is compared to the expected total return of a benchmark country market index, not to those analysts’ coverage universe. If it does not appear in the Important Disclosures section of this report, the certifying analyst’s coverage universe can be found on J.P. Morgan’s research website, www.jpmorganmarkets.com.
Coverage Universe: Cusick, Philip: AT&T (T), American Tower (AMT), Cablevision (CVC), CenturyLink (CTL), Charter (CHTR), Clearwire (CLWR), Comcast (CMCSA), Crown Castle (CCI), DIRECTV (DTV), DISH Network (DISH), Frontier (FTR), Leap Wireless (LEAP), MetroPCS (PCS), NTELOS (NTLS), SBA Communications (SBAC), Sprint Nextel (S), Telephone & Data Systems (TDS), Time Warner Cable (TWC), US Cellular (USM), Verizon Communications (VZ), Windstream (WIN)
J.P. Morgan Equity Research Ratings Distribution, as of September 28, 2012
Overweight(buy)
Neutral(hold)
Underweight(sell)
J.P. Morgan Global Equity Research Coverage 44% 44% 12%IB clients* 52% 46% 34%
JPMS Equity Research Coverage 42% 48% 10%IB clients* 69% 61% 53%
*Percentage of investment banking clients in each rating category.For purposes only of FINRA/NYSE ratings distribution rules, our Overweight rating falls into a buy rating category; our Neutral rating falls into a hold rating category; and our Underweight rating falls into a sell rating category. Please note that stocks with an NR designation are not included in the table above.
Equity Valuation and Risks: For valuation methodology and risks associated with covered companies or price targets for covered companies, please see the most recent company-specific research report at http://www.jpmorganmarkets.com , contact the primary analyst or your J.P. Morgan representative, or email [email protected].
Equity Analysts' Compensation: The equity research analysts responsible for the preparation of this report receive compensation based upon various factors, including the quality and accuracy of research, client feedback, competitive factors, and overall firm revenues.
Other Disclosures
J.P. Morgan ("JPM") is the global brand name for J.P. Morgan Securities LLC ("JPMS") and its affiliates worldwide. J.P. Morgan Cazenove is a marketing name for the U.K. investment banking businesses and EMEA cash equities and equity research businesses of JPMorgan Chase & Co. and its subsidiaries.
All research reports made available to clients are simultaneously available on our client website, J.P. Morgan Markets. Not all research content is redistributed, e-mailed or made available to third-party aggregators. For all research reports available on a particular stock, please contact your sales representative.

31
North America Equity Research05 December 2012
Philip Cusick, CFA(1-212) [email protected]
Options related research: If the information contained herein regards options related research, such information is available only to persons who have received the proper option risk disclosure documents. For a copy of the Option Clearing Corporation's Characteristics and Risks of Standardized Options, please contact your J.P. Morgan Representative or visit the OCC's website at http://www.optionsclearing.com/publications/risks/riskstoc.pdf
Legal Entities Disclosures U.S.: JPMS is a member of NYSE, FINRA, SIPC and the NFA. JPMorgan Chase Bank, N.A. is a member of FDIC and is authorized and regulated in the UK by the Financial Services Authority. U.K.: J.P. Morgan Securities plc (JPMS plc) is a member of the London Stock Exchange and is authorized and regulated by the Financial Services Authority. Registered in England & Wales No. 2711006. Registered Office 25 Bank Street, London, E14 5JP. South Africa: J.P. Morgan Equities South Africa Proprietary Limited is a member of the Johannesburg Securities Exchange and is regulated by the Financial Services Board. Hong Kong: J.P. Morgan Securities (Asia Pacific) Limited (CE number AAJ321) is regulated by the Hong Kong Monetary Authority and the Securities and Futures Commission in Hong Kong. Korea: J.P. Morgan Securities (Far East) Ltd, Seoul Branch, is regulated by the Korea Financial Supervisory Service. Australia: J.P. Morgan Australia Limited (ABN 52 002 888 011/AFS Licence No: 238188) is regulated by ASIC and J.P. Morgan Securities Australia Limited (ABN 61 003 245 234/AFS Licence No: 238066) is a Market Participant with the ASX and regulated by ASIC. Taiwan: J.P.Morgan Securities (Taiwan) Limited is a participant of the Taiwan Stock Exchange (company-type) and regulated by the Taiwan Securities and Futures Bureau. India: J.P. Morgan India Private Limited, having its registered office at J.P. Morgan Tower, Off. C.S.T. Road, Kalina, Santacruz East, Mumbai -400098, is a member of the National Stock Exchange of India Limited (SEBI Registration Number - INB 230675231/INF 230675231/INE 230675231) and Bombay Stock Exchange Limited (SEBI Registration Number - INB 010675237/INF 010675237) and is regulated by Securities and Exchange Board of India. Thailand: JPMorgan Securities (Thailand) Limited is a member of the Stock Exchange of Thailand and is regulated by the Ministry of Finance and the Securities and Exchange Commission. Indonesia: PT J.P. Morgan Securities Indonesia is a member of the Indonesia Stock Exchange and is regulated by the BAPEPAM LK. Philippines: J.P. Morgan Securities Philippines Inc. is a member of the Philippine Stock Exchange and is regulated by the Securities and Exchange Commission. Brazil: Banco J.P. Morgan S.A. is regulated by the Comissao de Valores Mobiliarios (CVM) and by the Central Bank of Brazil. Mexico: J.P. Morgan Casa de Bolsa, S.A. de C.V., J.P. Morgan Grupo Financiero is a member of the Mexican Stock Exchange and authorized to act as a broker dealer by the National Banking and Securities Exchange Commission. Singapore: This material is issued and distributed in Singapore by J.P. Morgan Securities Singapore Private Limited (JPMSS) [MICA (P) 088/04/2012 and Co. Reg. No.: 199405335R] which is a member of the Singapore Exchange Securities Trading Limited and is regulated by the Monetary Authority of Singapore (MAS) and/or JPMorgan Chase Bank, N.A., Singapore branch (JPMCB Singapore) which is regulated by the MAS. Malaysia: This material is issued and distributed in Malaysia by JPMorgan Securities (Malaysia) Sdn Bhd (18146-X) which is a Participating Organization of Bursa Malaysia Berhad and a holder of Capital Markets Services License issued by the Securities Commission in Malaysia. Pakistan: J. P. Morgan Pakistan Broking (Pvt.) Ltd is a member of the Karachi Stock Exchange and regulated by the Securities and Exchange Commission of Pakistan. Saudi Arabia: J.P. Morgan Saudi Arabia Ltd. is authorized by the Capital Market Authority of the Kingdom of Saudi Arabia (CMA) to carry out dealing as an agent, arranging, advising and custody, with respect to securities business under licence number 35-07079 and its registered address is at 8th Floor, Al-Faisaliyah Tower, King Fahad Road, P.O. Box 51907, Riyadh 11553, Kingdom of Saudi Arabia. Dubai: JPMorgan Chase Bank, N.A., Dubai Branch is regulated by the Dubai Financial Services Authority (DFSA) and its registered address is Dubai International Financial Centre - Building 3, Level 7, PO Box 506551, Dubai, UAE.
Country and Region Specific Disclosures U.K. and European Economic Area (EEA): Unless specified to the contrary, issued and approved for distribution in the U.K. and the EEA by JPMS plc. Investment research issued by JPMS plc has been prepared in accordance with JPMS plc's policies for managing conflicts of interest arising as a result of publication and distribution of investment research. Many European regulators require a firm to establish, implement and maintain such a policy. This report has been issued in the U.K. only to persons of a kind described in Article 19 (5), 38, 47 and 49 of the Financial Services and Markets Act 2000 (Financial Promotion) Order 2005 (all such persons being referred to as "relevant persons"). This document must not be acted on or relied on by persons who are not relevant persons. Any investment or investment activity to which this document relates is only available to relevant persons and will be engaged in only with relevant persons. In other EEA countries, the report has been issued to persons regarded as professional investors (or equivalent) in their home jurisdiction. Australia: This material is issued and distributed by JPMSAL in Australia to "wholesale clients" only. JPMSAL does not issue or distribute this material to "retail clients". The recipient of this material must not distribute it to any third party or outside Australia without the prior written consent of JPMSAL. For the purposes of this paragraph the terms "wholesale client" and "retail client" have the meanings given to them in section 761G of the Corporations Act 2001. Germany: This material is distributed in Germany by J.P. Morgan Securities plc, Frankfurt Branch and J.P.Morgan Chase Bank, N.A., Frankfurt Branch which are regulated by the Bundesanstalt für Finanzdienstleistungsaufsicht. Hong Kong: The 1% ownership disclosure as of the previous month end satisfies the requirements under Paragraph 16.5(a) of the Hong Kong Code of Conduct for Persons Licensed by or Registered with the Securities and Futures Commission. (For research published within the first ten days of the month, the disclosure may be based on the month end data from two months prior.) J.P. Morgan Broking (Hong Kong) Limited is the liquidity provider/market maker for derivative warrants, callable bull bear contracts and stock options listed on the Stock Exchange of Hong Kong Limited. An updated list can be found on HKEx website: http://www.hkex.com.hk. Japan: There is a risk that a loss may occur due to a change in the price of the shares in the case of share trading, and that a loss may occur due to the exchange rate in the case of foreign share trading. In the case of share trading, JPMorgan Securities Japan Co., Ltd., will be receiving a brokerage fee and consumption tax (shouhizei) calculated by multiplying the executed price by the commission rate which was individually agreed between JPMorgan Securities Japan Co., Ltd., and the customer in advance. Financial Instruments Firms: JPMorgan Securities Japan Co., Ltd., Kanto Local Finance Bureau (kinsho) No. 82 Participating Association / Japan Securities Dealers Association, The Financial Futures Association of Japan, Type II Financial Instruments Firms Association and Japan Investment Advisers Association. Korea: This report may have been edited or contributed to from time to time by affiliates of J.P. Morgan Securities (Far East) Ltd, Seoul Branch. Singapore: JPMSS and/or its affiliates may have a holding in any of the securities discussed in this report; for securities where the holding is 1% or greater, the specific holding is disclosed in the Important Disclosures section above. India: For private circulation only, not for sale. Pakistan: For private circulation only, not for sale. New Zealand: This material is issued and distributed by JPMSAL in New Zealand only to persons whose principal business is the investment of money or who, in the course of and for the purposes of their business, habitually invest money. JPMSAL does not issue or distribute this material to members of "the public" as determined in accordance with section 3 of the Securities Act 1978. The recipient of this material must not distribute it to any third party or outside New Zealand without the prior written consent of JPMSAL. Canada: The information contained herein is not, and under no circumstances is to be construed as, a prospectus, an advertisement, a public offering, an offer to sell securities described herein, or solicitation of an offer to buy securities described herein, in Canada or any province or territory thereof. Any offer or sale of the securities described herein in Canada will be made only under an exemption from the requirements to file a prospectus with the relevant Canadian securities regulators and only by a dealer properly registered under applicable securities laws or, alternatively, pursuant to an exemption from the dealer registration requirement in the relevant province or territory of Canada in which such offer or sale is made. The information

32
North America Equity Research05 December 2012
Philip Cusick, CFA(1-212) [email protected]
contained herein is under no circumstances to be construed as investment advice in any province or territory of Canada and is not tailored to the needs of the recipient. To the extent that the information contained herein references securities of an issuer incorporated, formed or created under the laws of Canada or a province or territory of Canada, any trades in such securities must be conducted through a dealer registered in Canada. No securities commission or similar regulatory authority in Canada has reviewed or in any way passed judgment upon these materials, the information contained herein or the merits of the securities described herein, and any representation to the contrary is an offence. Dubai: This report has been issued to persons regarded as professional clients as defined under the DFSA rules.
General: Additional information is available upon request. Information has been obtained from sources believed to be reliable but JPMorgan Chase & Co. or its affiliates and/or subsidiaries (collectively J.P. Morgan) do not warrant its completeness or accuracy except with respect to any disclosures relative to JPMS and/or its affiliates and the analyst's involvement with the issuer that is the subject of the research. All pricing is as of the close of market for the securities discussed, unless otherwise stated. Opinions and estimates constitute our judgment as of the date of this material and are subject to change without notice. Past performance is not indicative of future results. This material is not intended as an offer or solicitation for the purchase or sale of any financial instrument. The opinions and recommendations herein do not take into account individual client circumstances, objectives, or needs and are not intended as recommendations of particular securities, financial instruments or strategies to particular clients. The recipient of this report must make its own independent decisions regarding any securities or financial instruments mentioned herein. JPMS distributes in the U.S. research published by non-U.S. affiliates and accepts responsibility for its contents. Periodic updates may be provided on companies/industries based on company specific developments or announcements, market conditions or any other publicly available information. Clients should contact analysts and execute transactions through a J.P. Morgan subsidiary or affiliate in their home jurisdiction unless governing law permits otherwise.
"Disclosures" last revised December 01, 2012.
Copyright 2012 JPMorgan Chase & Co. All rights reserved. This report or any portion hereof may not be reprinted, sold or redistributed without the written consent of J.P. Morgan. #$J&098$#*P
Related Documents


