Supply and Demand Ka-fu Wong University of Hong Kong 1

Supply and Demand Ka-fu Wong University of Hong Kong 1.
Dec 23, 2015
Welcome message from author
This document is posted to help you gain knowledge. Please leave a comment to let me know what you think about it! Share it to your friends and learn new things together.
Transcript
1
Supply and Demand
Ka-fu WongUniversity of Hong Kong
2
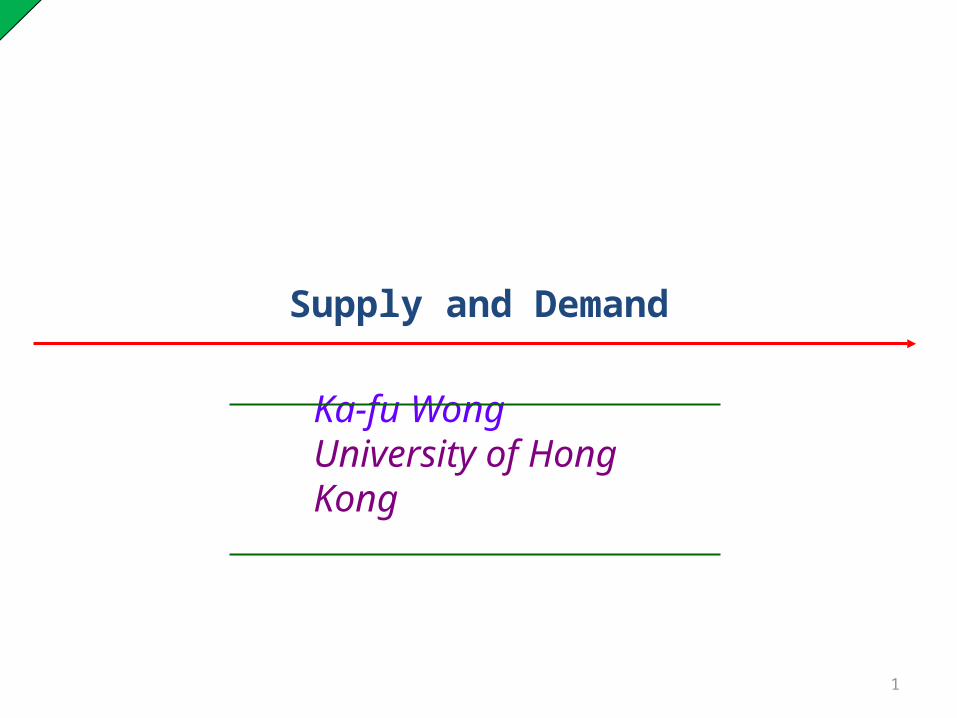
Example: Basis for exchange
• Paul is a house painter whose roof needs replacing. Ron is a roofer whose house needs painting.
• Although Paul is a painter, he also knows how to install roofing. Ron, for his part, knows how to paint houses.
• Should Paul roof his own house? Should Ron paint his own house? Time required by each to complete each type of job:
Painting Roofing
Paul
300 hrs 400 hrs
Ron 200 hrs 100 hrs
3
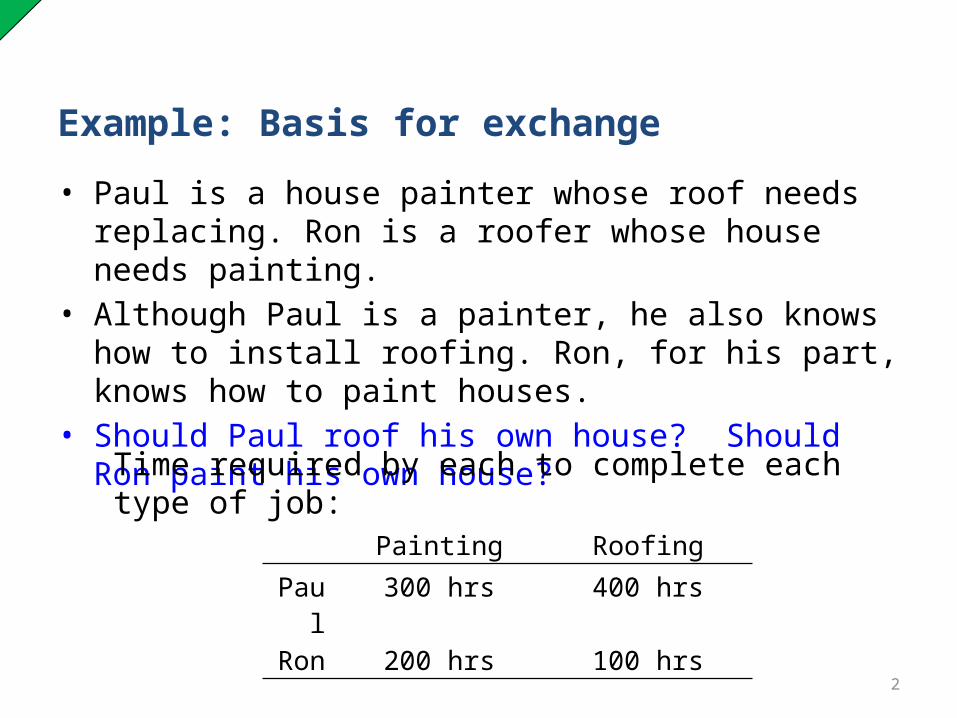
Example: Gains from exchange
o If each person performed both tasks for himself, the total time spent would be 700 hours for Paul and 300 hours for Ron.
o By contrast, when each specializes in his comparative advantage, these totals fall to 600 for Paul and 200 for Ron, a savings of 100 hours each.
Painting Roofing
Paul 300 hrs 400 hrs
Ron 200 hrs 100 hrs
4
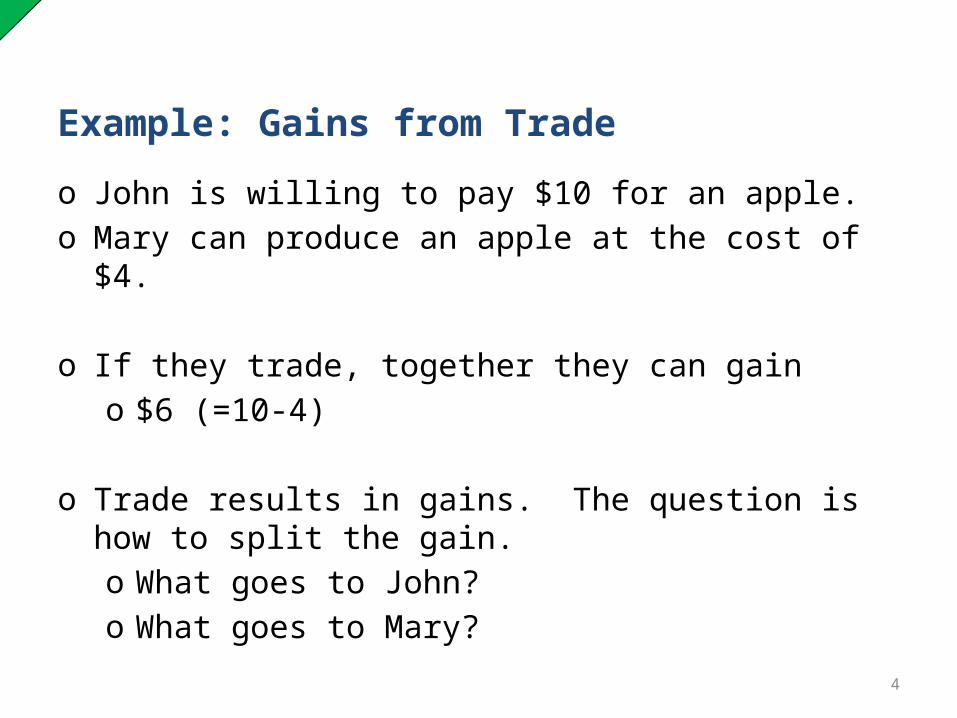
Example: Gains from Trade
o John is willing to pay $10 for an apple. o Mary can produce an apple at the cost of $4.
o If they trade, together they can gaino $6 (=10-4)
o Trade results in gains. The question is how to split the gain. o What goes to John?o What goes to Mary?
5
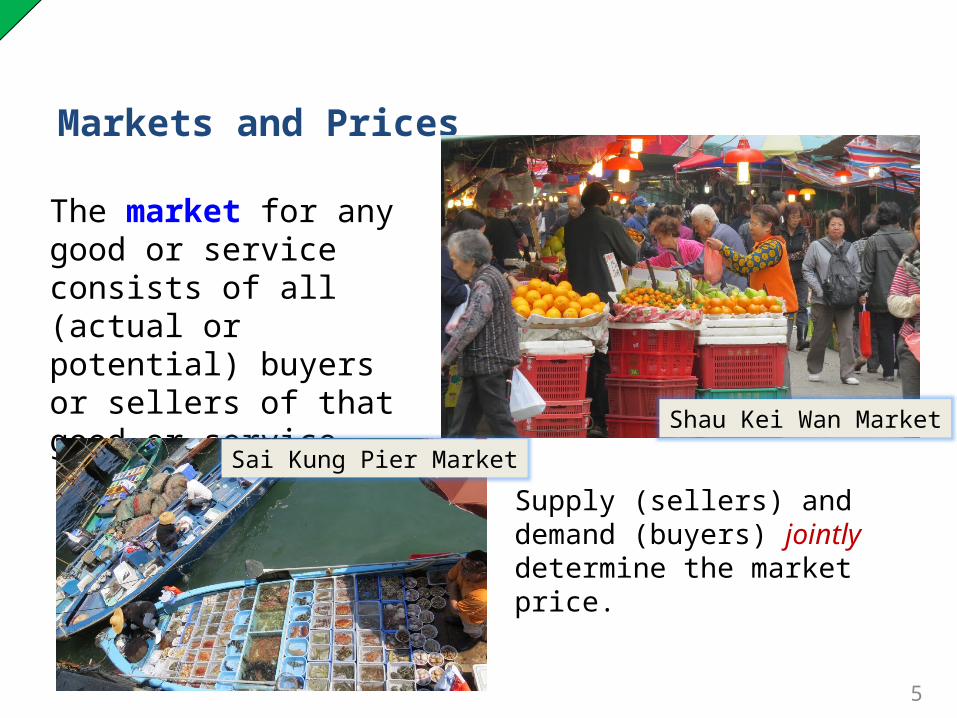
Markets and Prices
The market for any good or service consists of all (actual or potential) buyers or sellers of that good or service.
Supply (sellers) and demand (buyers) jointly determine the market price.
Shau Kei Wan Market
Sai Kung Pier Market
6
The market for lobsters
• The market for lobsters in Portland, Maine, on July 20, 2004.
7
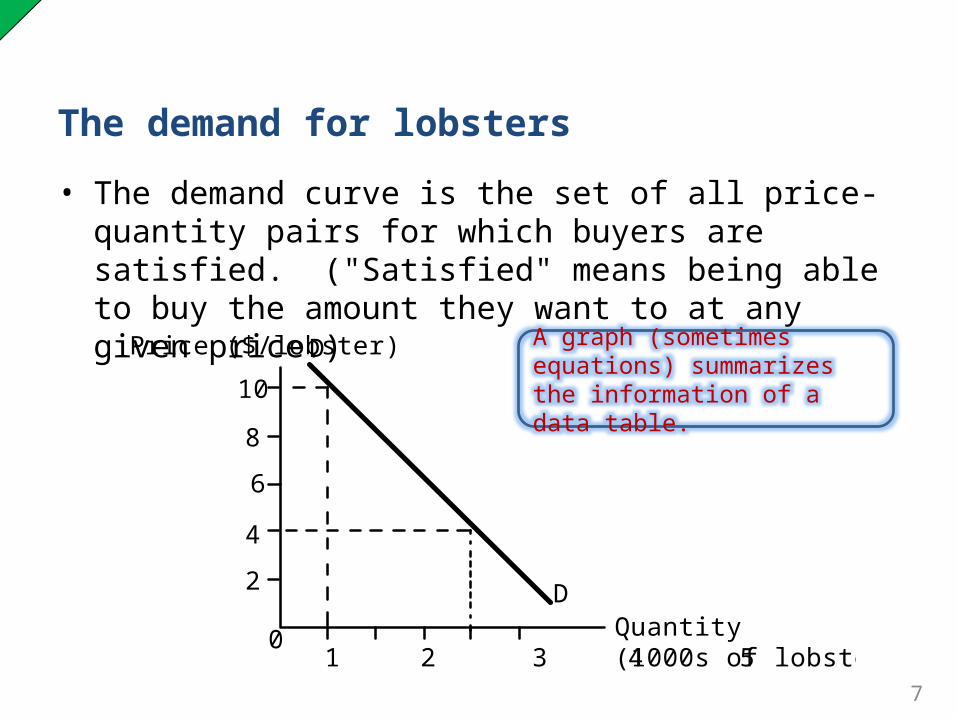
The demand for lobsters
• The demand curve is the set of all price-quantity pairs for which buyers are satisfied. ("Satisfied" means being able to buy the amount they want to at any given price.)
Price ($/lobster)
Quantity (1000s of lobsters/day)
10
8
6
4
2
01 2 3 4 5
D
D
A graph (sometimes equations) summarizes the information of a data table.
8
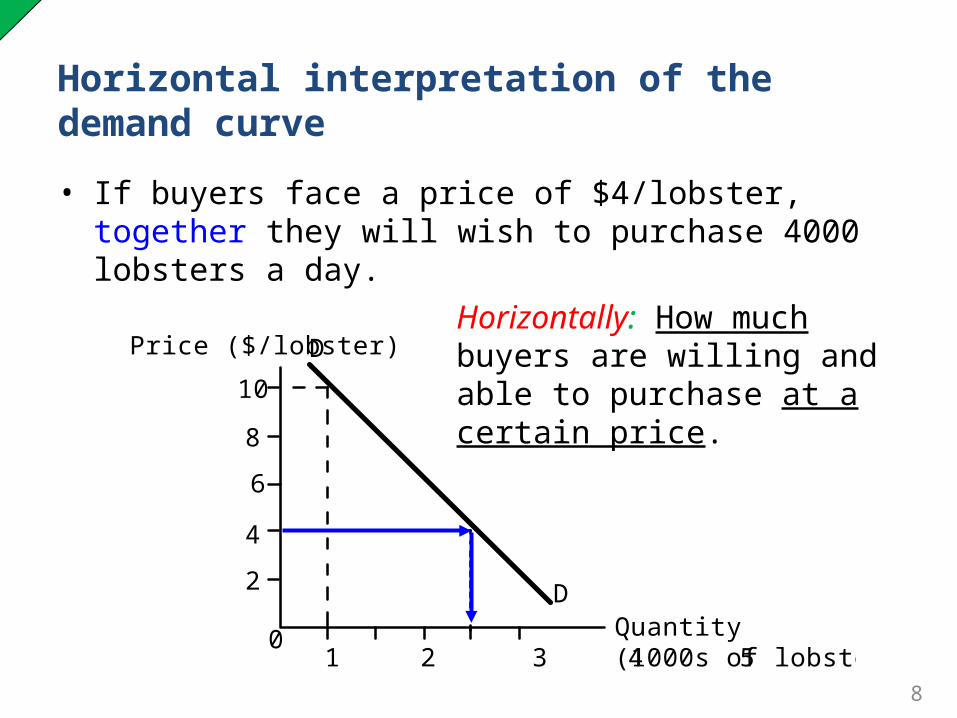
Horizontal interpretation of the demand curve
• If buyers face a price of $4/lobster, together they will wish to purchase 4000 lobsters a day.
Price ($/lobster)
Quantity (1000s of lobsters/day)
10
8
6
4
2
01 2 3 4 5
D
D
Horizontally: How much buyers are willing and able to purchase at a certain price.
9
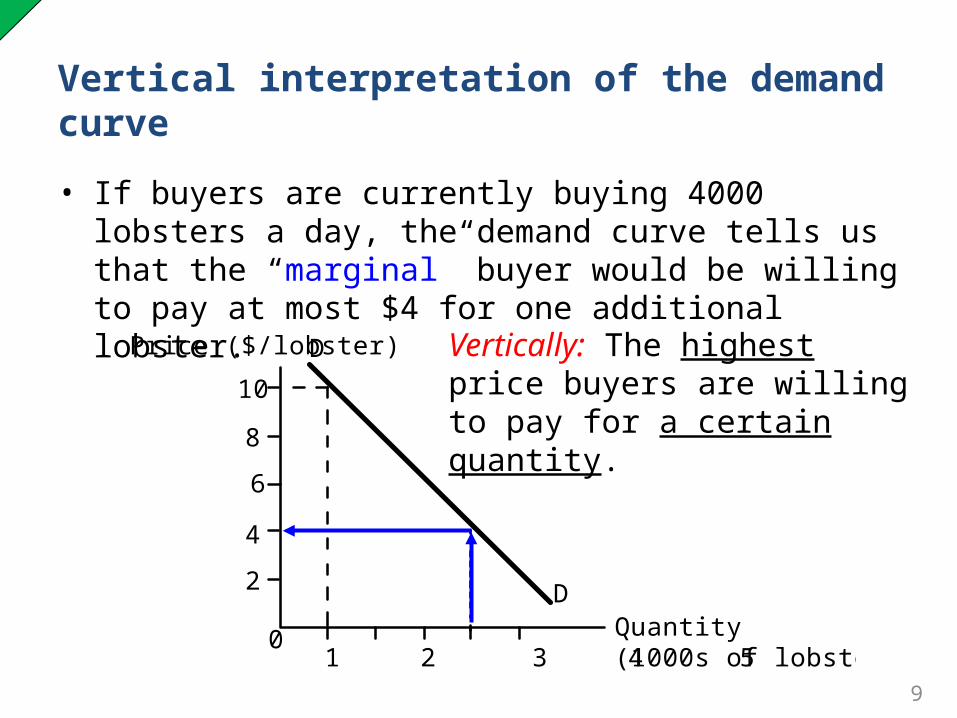
Vertical interpretation of the demand curve
• If buyers are currently buying 4000 lobsters a day, the demand curve tells us that the “marginal” buyer would be willing to pay at most $4 for one additional lobster.
Price ($/lobster)
Quantity (1000s of lobsters/day)
10
8
6
4
2
01 2 3 4 5
D
D
Vertically: The highest price buyers are willing to pay for a certain quantity.
10
Why are demand curves downward sloping
1. Buyers/ consumers have different values of the good. – When price is high, goods are only bought by those who are
willing to pay a high price. – When the price is low, goods are also bought by those who are
willing to pay a lower price.
2. For a given consumer– As the good becomes more expensive, people switch to
substitutes. (Substitution effect)• The Substitution Effect is the change in the quantity demanded of a good
that results because buyers switch to substitutes when the price of the good changes
– As the good becomes more expensive, people can’t afford to buy as much of it. (Income effect) • Income effect is the change in the quantity demanded of a good that
results because a change in the price of a good changes the buyer’s purchasing power
11
Consumer Surplus
o Consumer Surplus (economic surplus to consumer) is the consumer’s gain from exchange,o the difference between the highest price a
consumer will pay at a given quantity and the actual market price.
o Total consumer surplus is the sum of consumer surplus of all buyers.
12
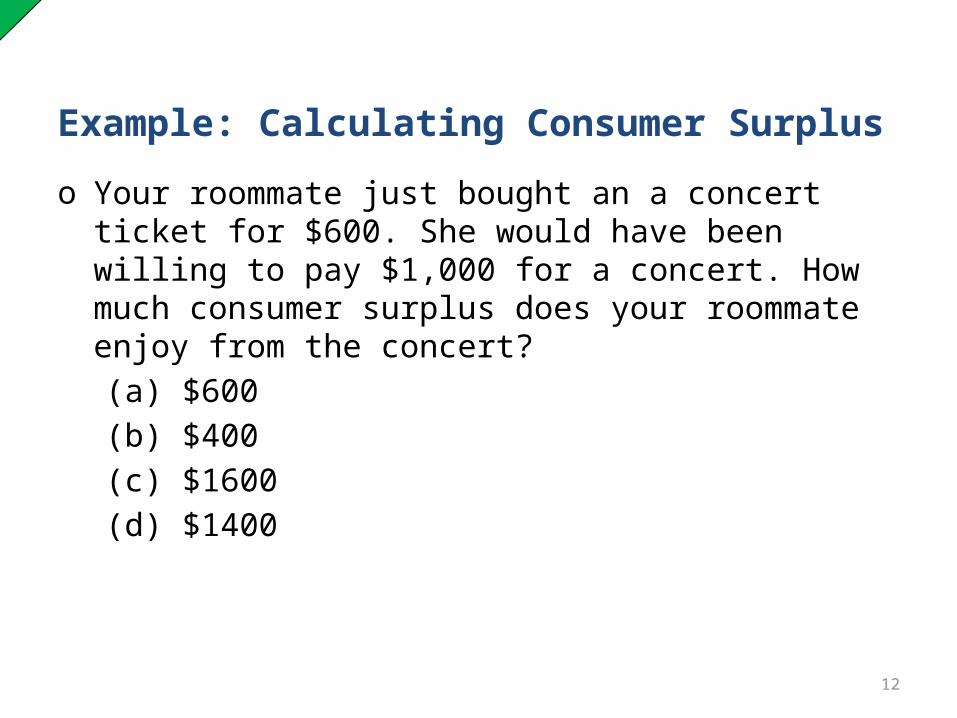
Example: Calculating Consumer Surplus
o Your roommate just bought an a concert ticket for $600. She would have been willing to pay $1,000 for a concert. How much consumer surplus does your roommate enjoy from the concert?(a) $600(b) $400(c) $1600(d) $1400
13
Example: Calculating Consumer Surplus
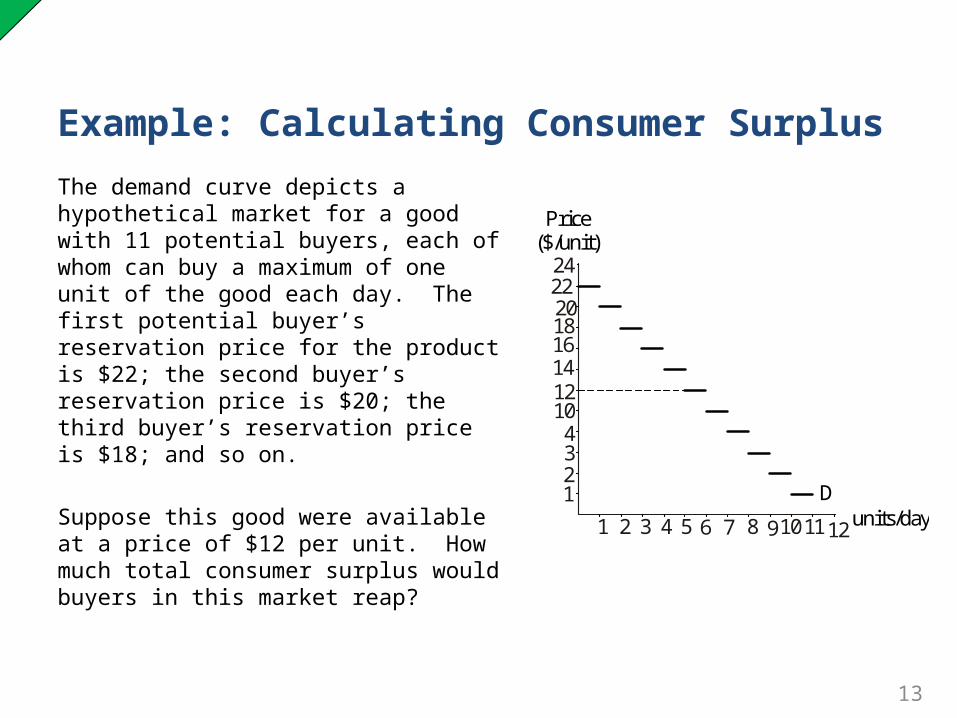
The demand curve depicts a hypothetical market for a good with 11 potential buyers, each of whom can buy a maximum of one unit of the good each day. The first potential buyer’s reservation price for the product is $22; the second buyer’s reservation price is $20; the third buyer’s reservation price is $18; and so on.
Suppose this good were available at a price of $12 per unit. How much total consumer surplus would buyers in this market reap?
24
units/day
Price($/unit)
D
222018161412104321
121110987654321
14
Example: Calculating Consumer Surplus
24
units/day
Price($/unit)
D
222018161412104321
121110987654321
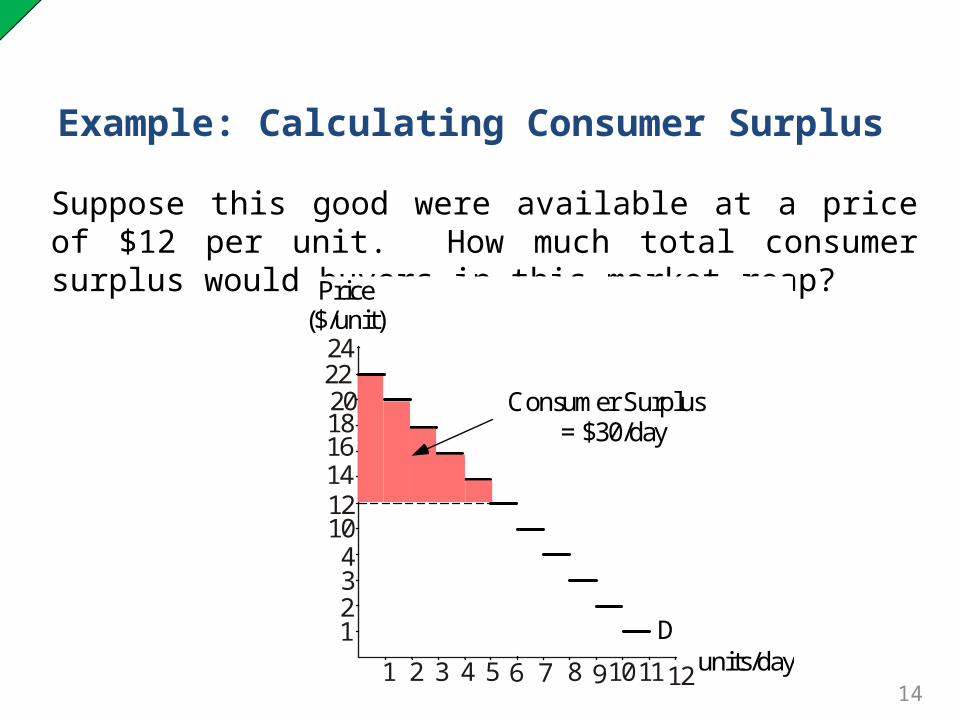
Suppose this good were available at a price of $12 per unit. How much total consumer surplus would buyers in this market reap?
24
units/day
Price($/unit)
D
222018161412104321
121110987654321
Consumer Surplus= $30/day
15
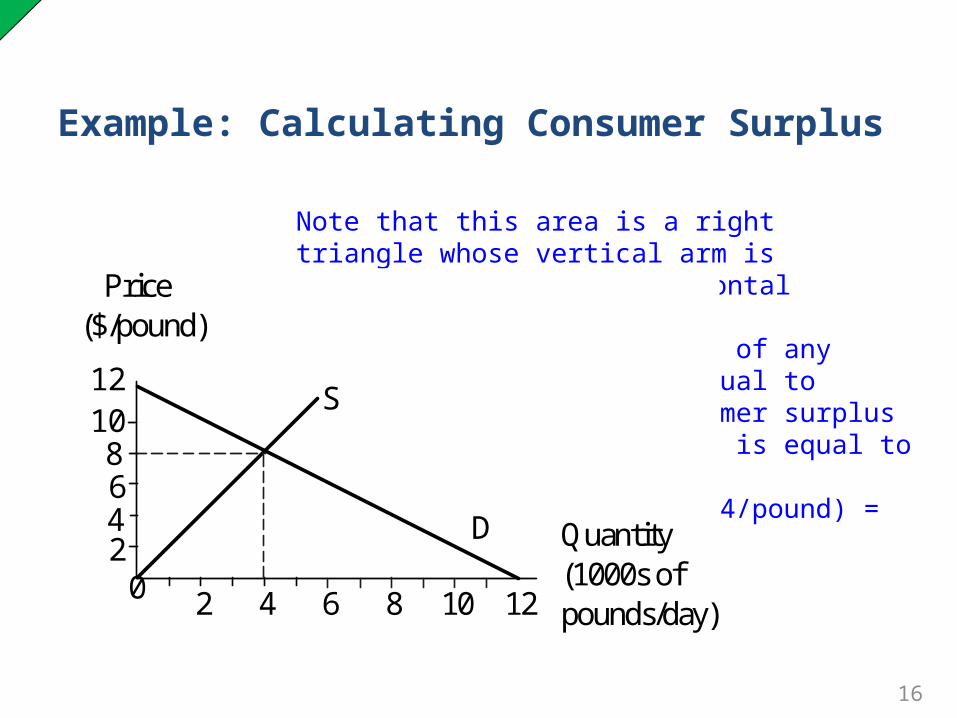
Example: Calculating Consumer Surplus
Price($/pound)
Quantity(1000s ofpounds/day)
0 2 4 6 8 10 12
D
S
2468
1012
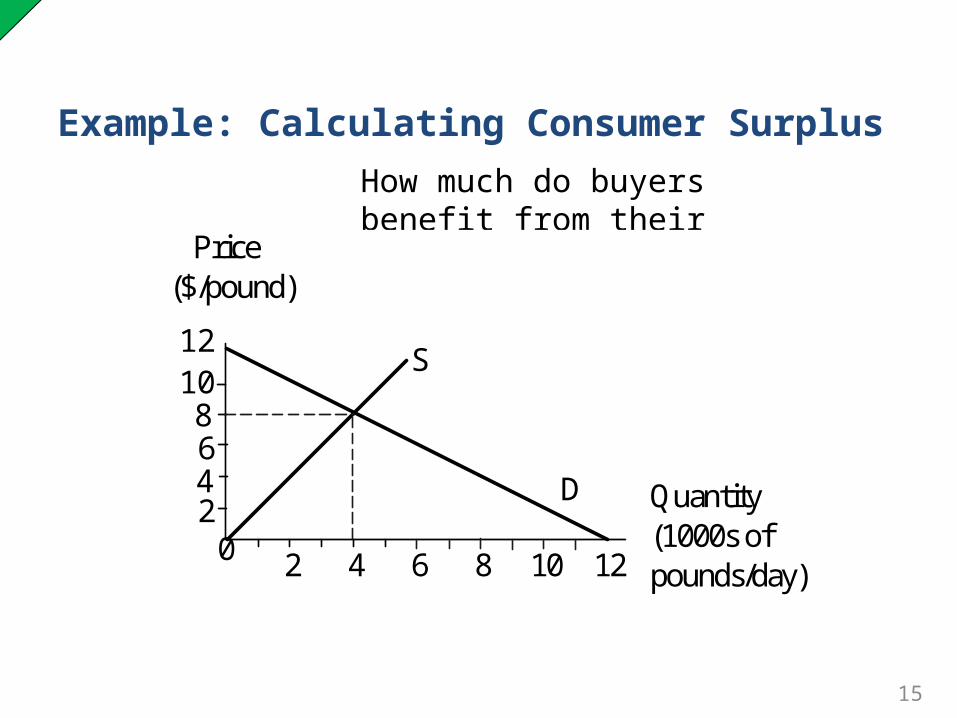
How much do buyers benefit from their participation in this market for cashews if the price is $8 per pound?
16
Example: Calculating Consumer Surplus
Price($/pound)
Quantity(1000s ofpounds/day)
0 2 4 6 8 10 12
D
S
2468
1012
Note that this area is a right triangle whose vertical arm is h=$4/pound and whose horizontal arm is b=4,000 pounds/day.
Since the area of any triangle is equal to (1/2)bh, consumer surplus in this market is equal to (1/2)x(4,000 pounds/day)x($4/pound) = $8,000/day.
17
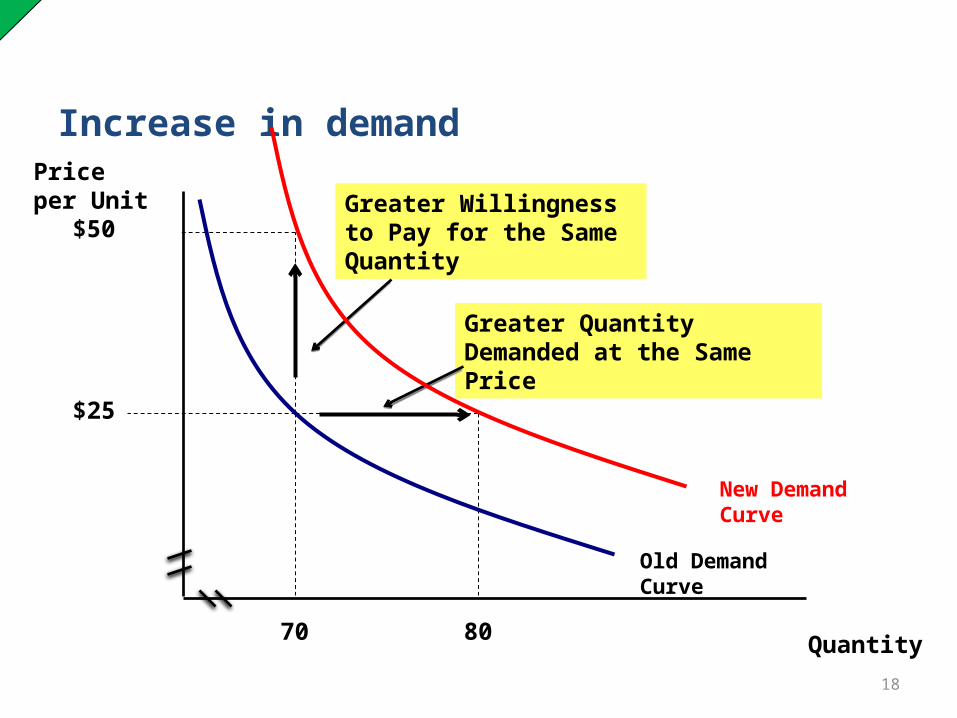
Increase in demand
o An “increase in demand” means that consumers buy more at every price level, (or consumers are willing to pay more for each quantity.)
o On the graph: the demand curve shifts outwards, up, and to the right.
18
Increase in demand
$50
80
Old Demand Curve
$25
70
Price per Unit
Quantity
New Demand Curve
Greater Quantity Demanded at the Same Price
Greater Willingness to Pay for the Same Quantity
19
Decrease in demand
o A “decrease in demand” means that consumers buy less at every price level, (or they reduce the price they’re willing to pay for a given quantity.)
o On the graph: the demand curve shifts inwards, down, and to the left.
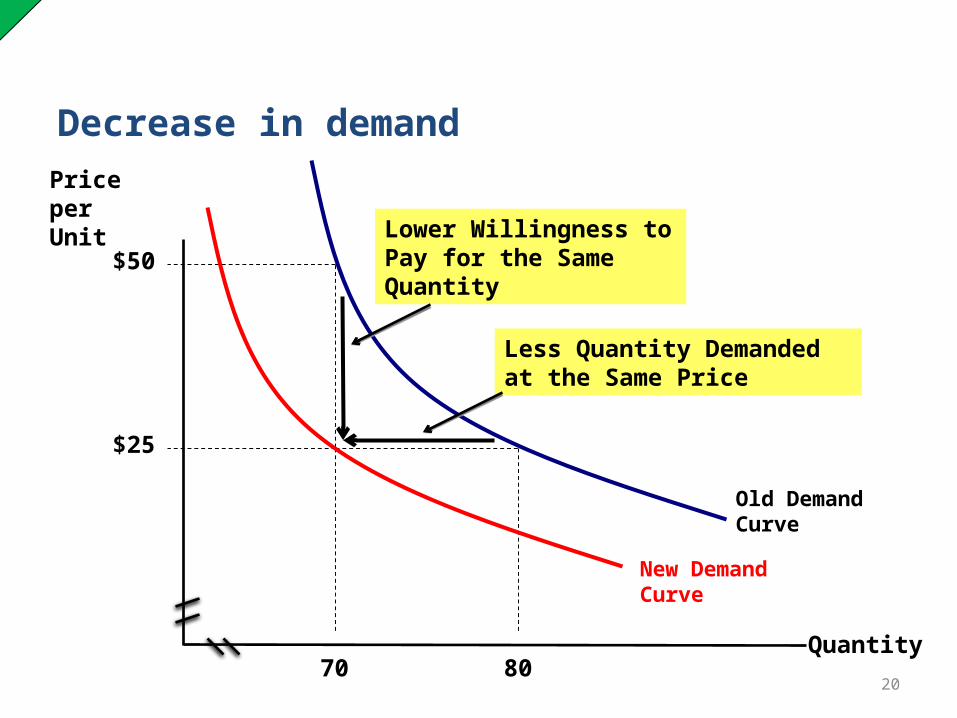
20
Decrease in demand
$50
80
Old Demand Curve
$25
70
Less Quantity Demanded at the Same Price
Lower Willingness to Pay for the Same Quantity
Price per Unit
Quantity
New Demand Curve
21
Demand Shifters
1. Income2. Population3. Price of Substitutes4. Price of Complements5. Expectations6. Tastes
22
Demand Shifters: Income
o The effect of changes in income on demand depends on the nature of the good in question.
o A Normal Good: demand increases when income increases (and vice versa).
o An Inferior Good: demand decreases when income increases (and vice versa)
23
Demand Shifters:Population
o As the population of an economy changes, the # of buyers of a particular good also changes, (thereby changing its demand.)
o What happens to the demand for diapers in Russia as birth rates drop?
24
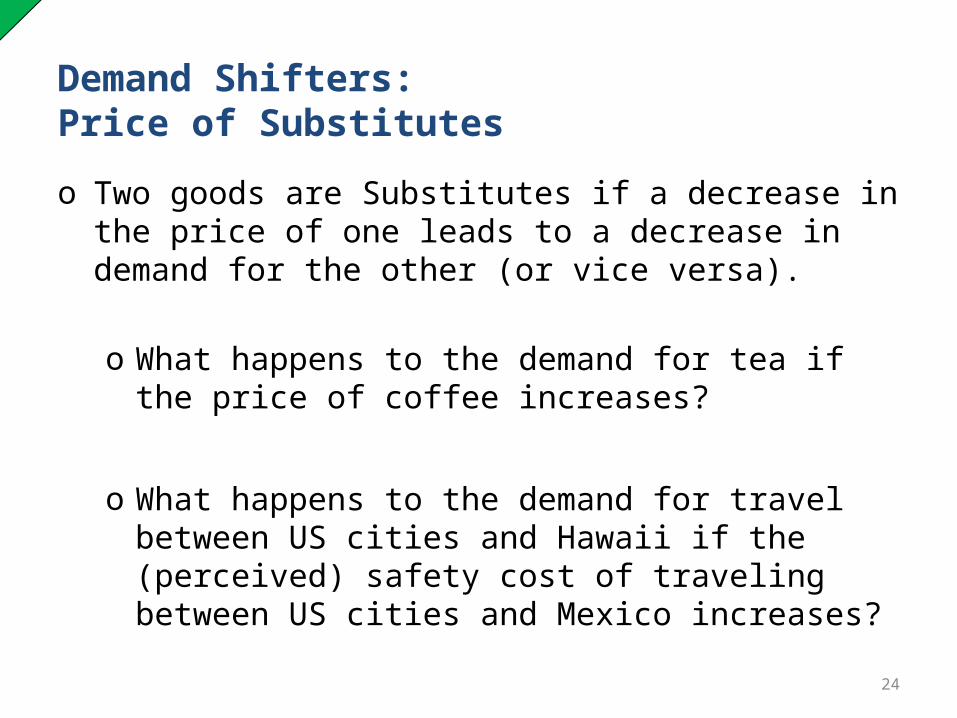
Demand Shifters: Price of Substitutes
o Two goods are Substitutes if a decrease in the price of one leads to a decrease in demand for the other (or vice versa).
o What happens to the demand for tea if the price of coffee increases?
o What happens to the demand for travel between US cities and Hawaii if the (perceived) safety cost of traveling between US cities and Mexico increases?
25
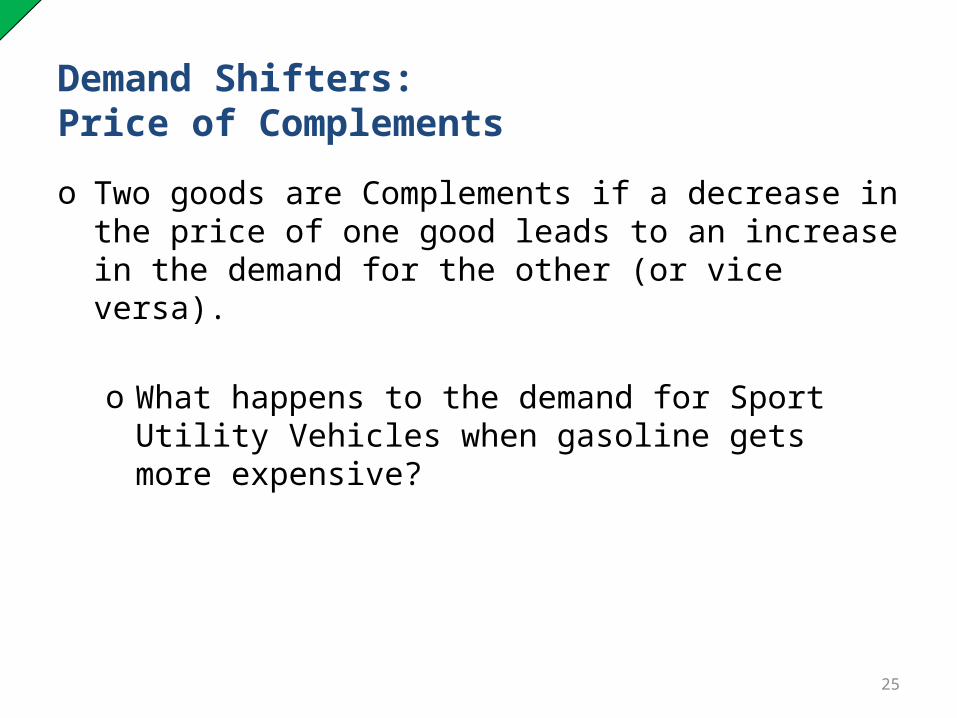
Demand Shifters: Price of Complements
o Two goods are Complements if a decrease in the price of one good leads to an increase in the demand for the other (or vice versa).
o What happens to the demand for Sport Utility Vehicles when gasoline gets more expensive?
26
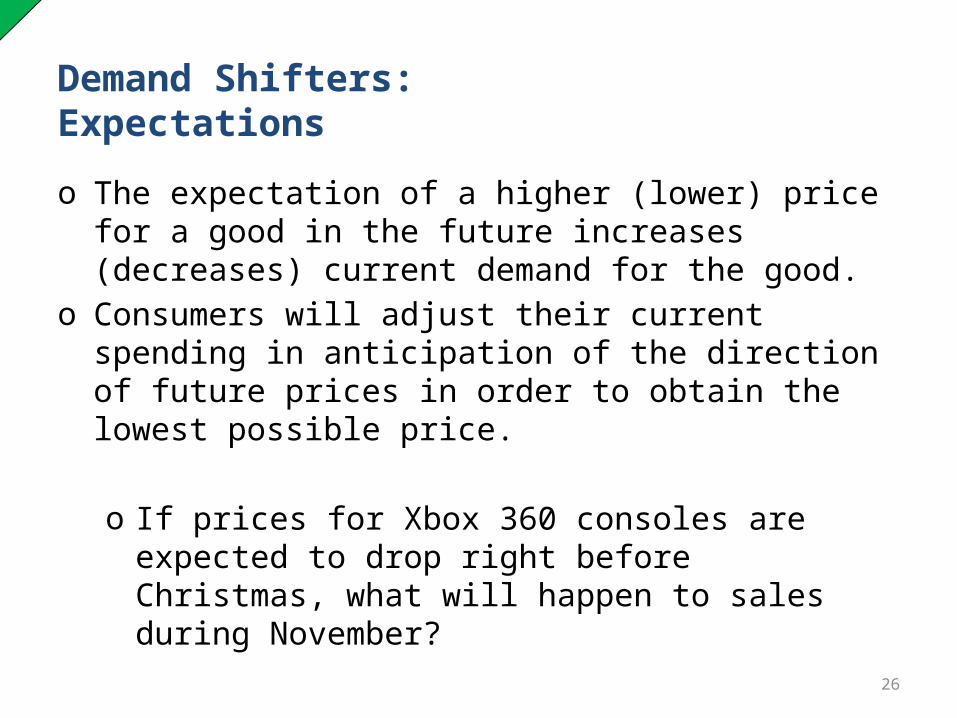
Demand Shifters: Expectations
o The expectation of a higher (lower) price for a good in the future increases (decreases) current demand for the good.
o Consumers will adjust their current spending in anticipation of the direction of future prices in order to obtain the lowest possible price.
o If prices for Xbox 360 consoles are expected to drop right before Christmas, what will happen to sales during November?
27
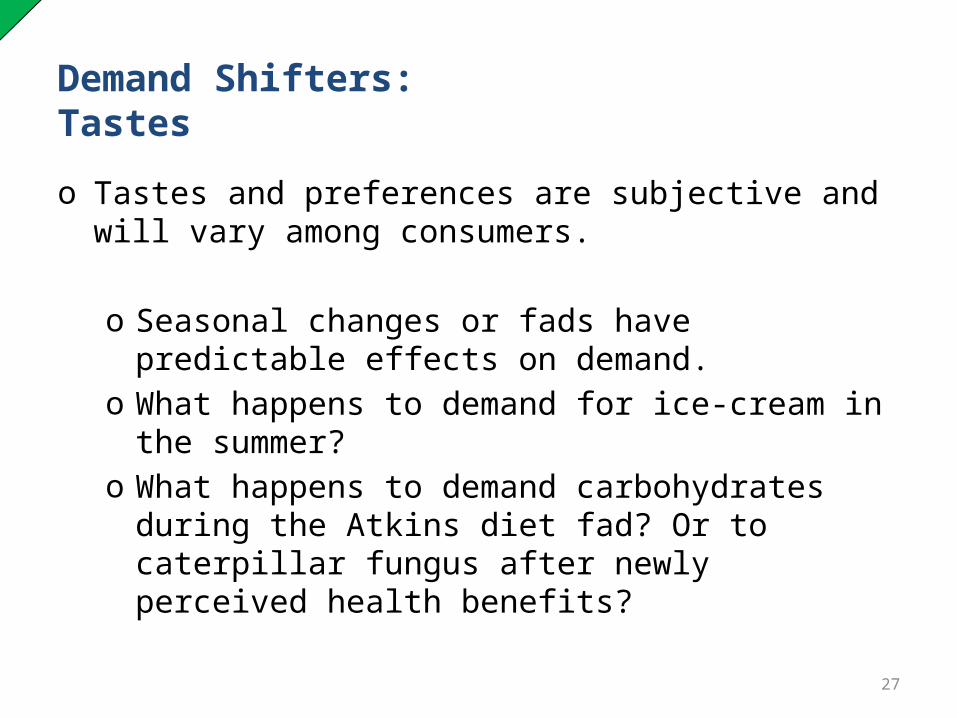
Demand Shifters: Tastes
o Tastes and preferences are subjective and will vary among consumers.
o Seasonal changes or fads have predictable effects on demand.
o What happens to demand for ice-cream in the summer?
o What happens to demand carbohydrates during the Atkins diet fad? Or to caterpillar fungus after newly perceived health benefits?
28
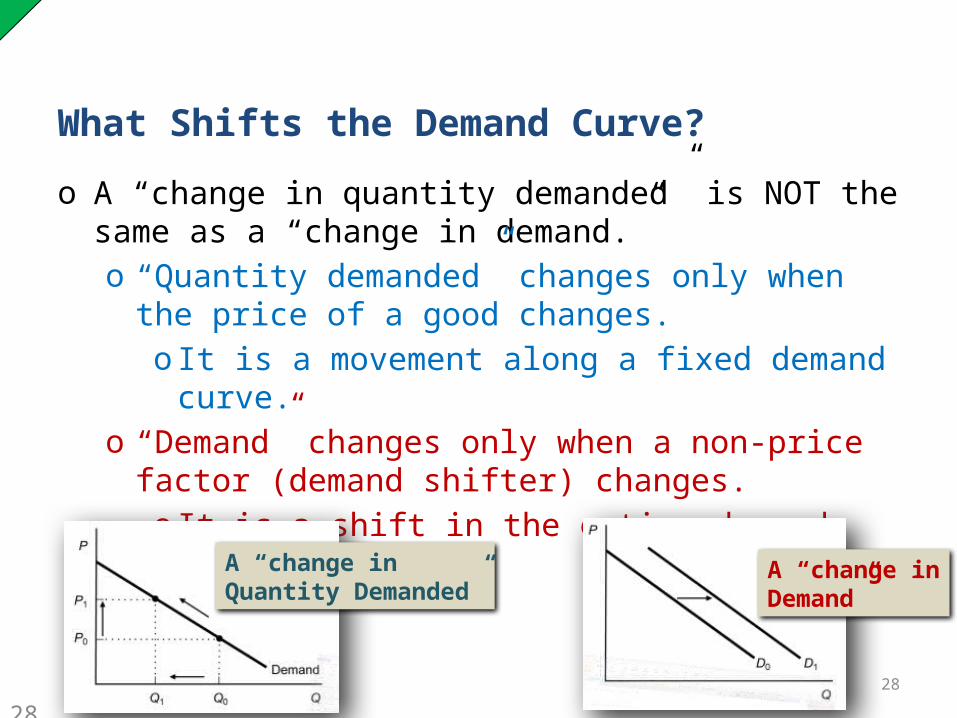
What Shifts the Demand Curve?
o A “change in quantity demanded” is NOT the same as a “change in demand.”o “Quantity demanded” changes only when the
price of a good changes.o It is a movement along a fixed demand
curve.o “Demand” changes only when a non-price
factor (demand shifter) changes.o It is a shift in the entire demand curve.
A “change in Quantity Demanded”
A “change in Demand”
28
29
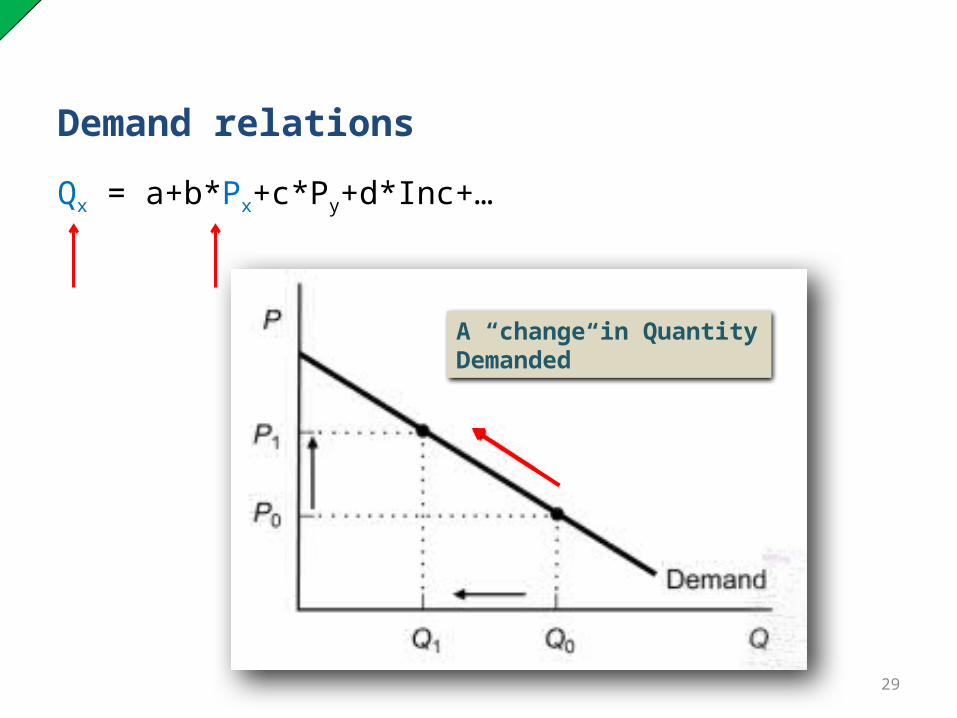
Demand relations
Qx = a+b*Px+c*Py+d*Inc+…
A “change in Quantity Demanded”
30
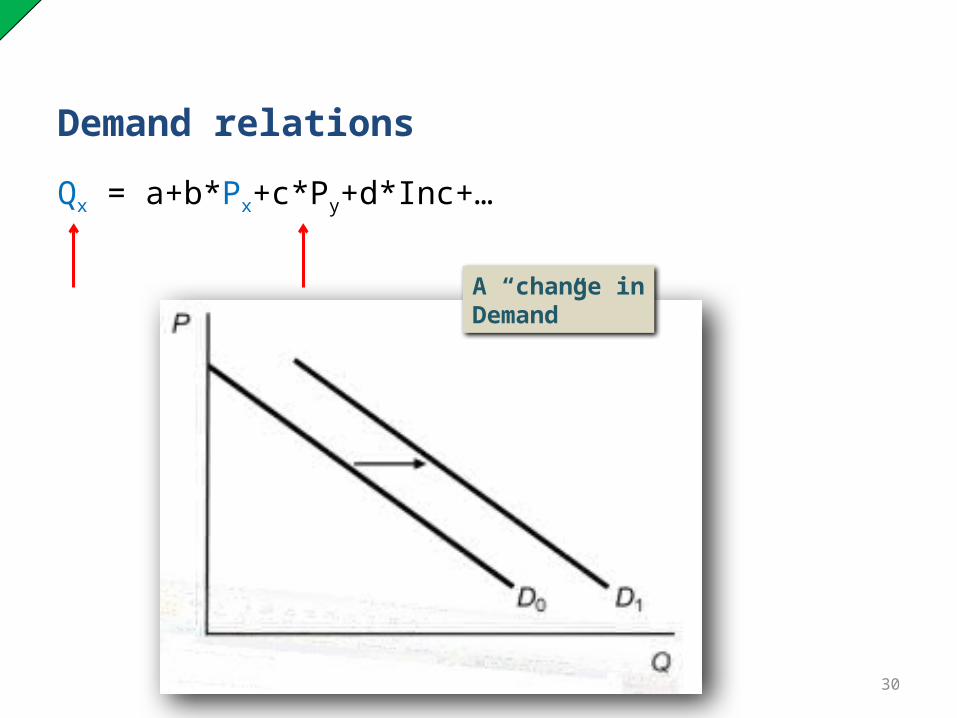
Demand relations
Qx = a+b*Px+c*Py+d*Inc+…
A “change in Demand”
31
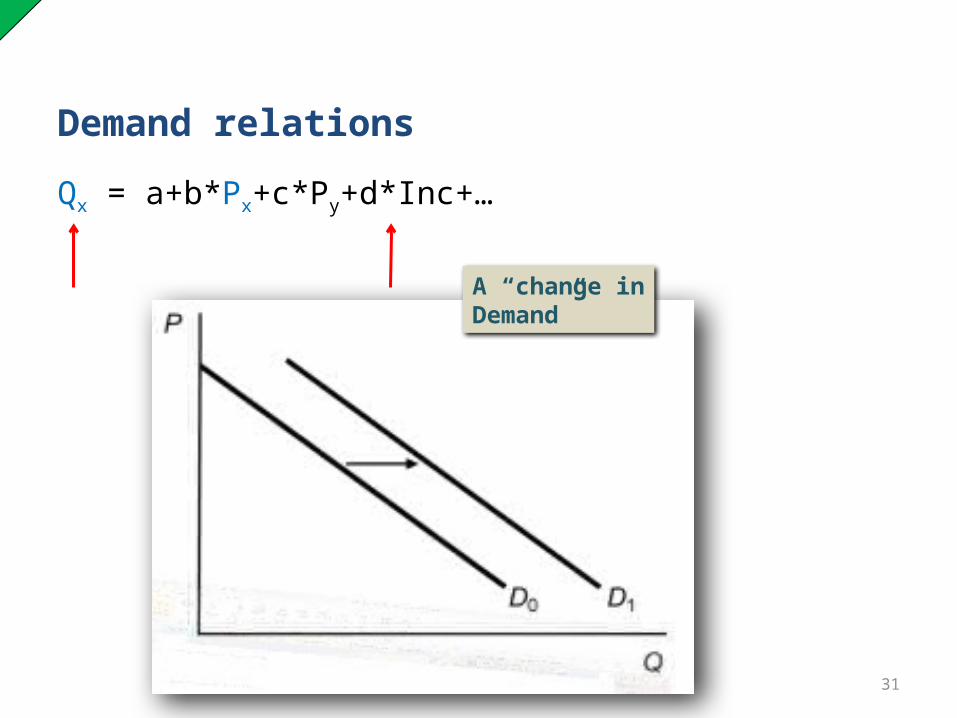
Demand relations
Qx = a+b*Px+c*Py+d*Inc+…
A “change in Demand”
32
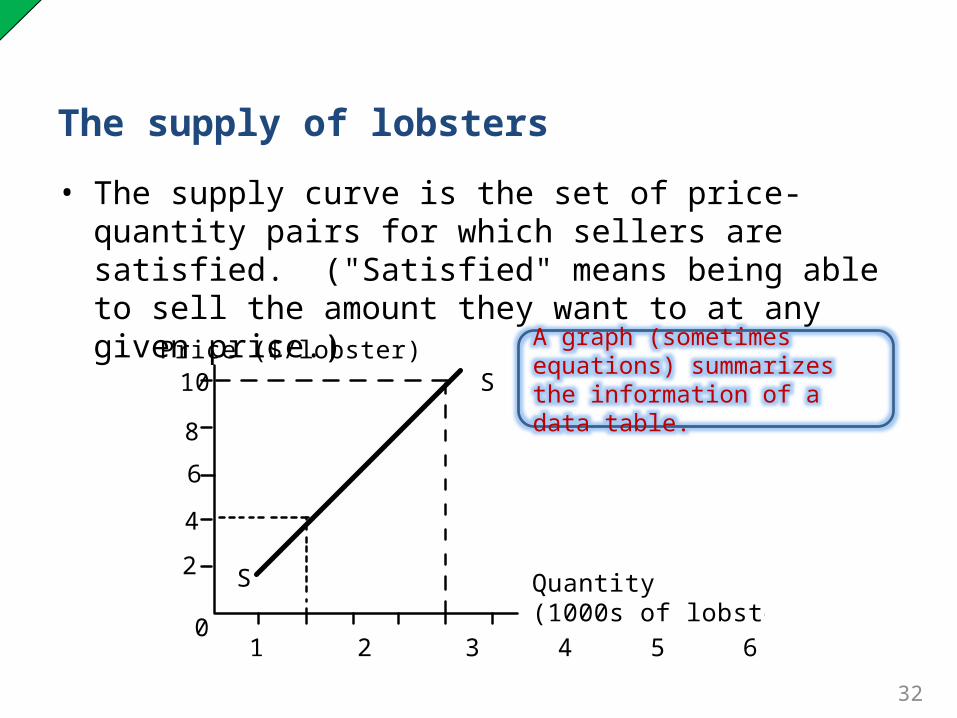
The supply of lobsters
• The supply curve is the set of price-quantity pairs for which sellers are satisfied. ("Satisfied" means being able to sell the amount they want to at any given price.)
Price ($/lobster)
Quantity (1000s of lobsters/day)
10
8
6
4
2
0
S
S
1 2 3 4 5 6
A graph (sometimes equations) summarizes the information of a data table.
33
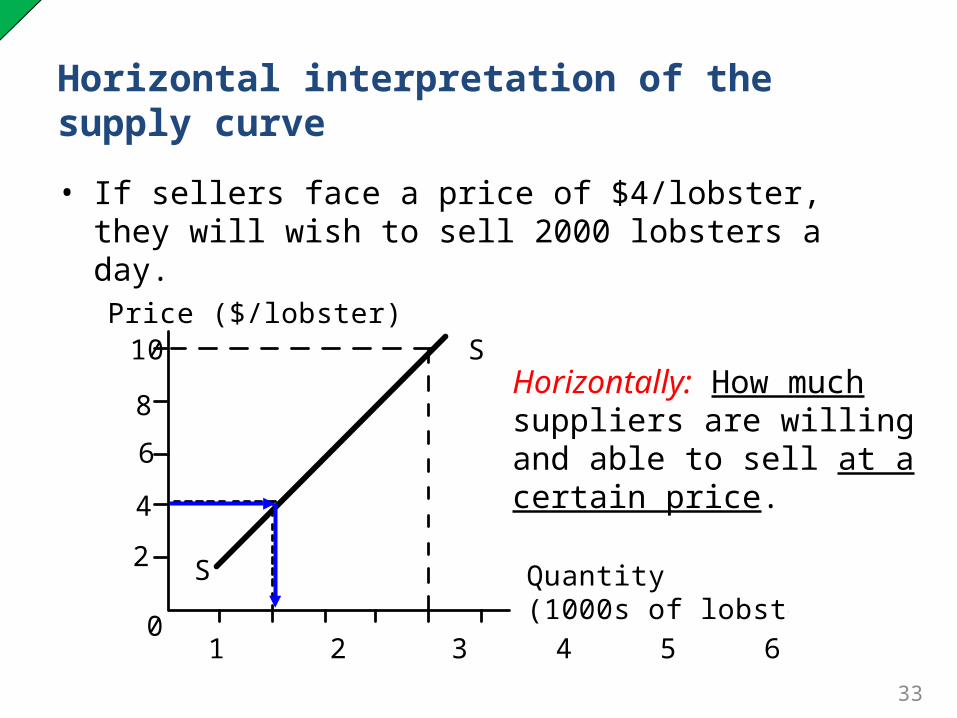
Horizontal interpretation of the supply curve
• If sellers face a price of $4/lobster, they will wish to sell 2000 lobsters a day.
Price ($/lobster)
Quantity (1000s of lobsters/day)
10
8
6
4
2
0
S
S
1 2 3 4 5 6
Horizontally: How much suppliers are willing and able to sell at a certain price.
34
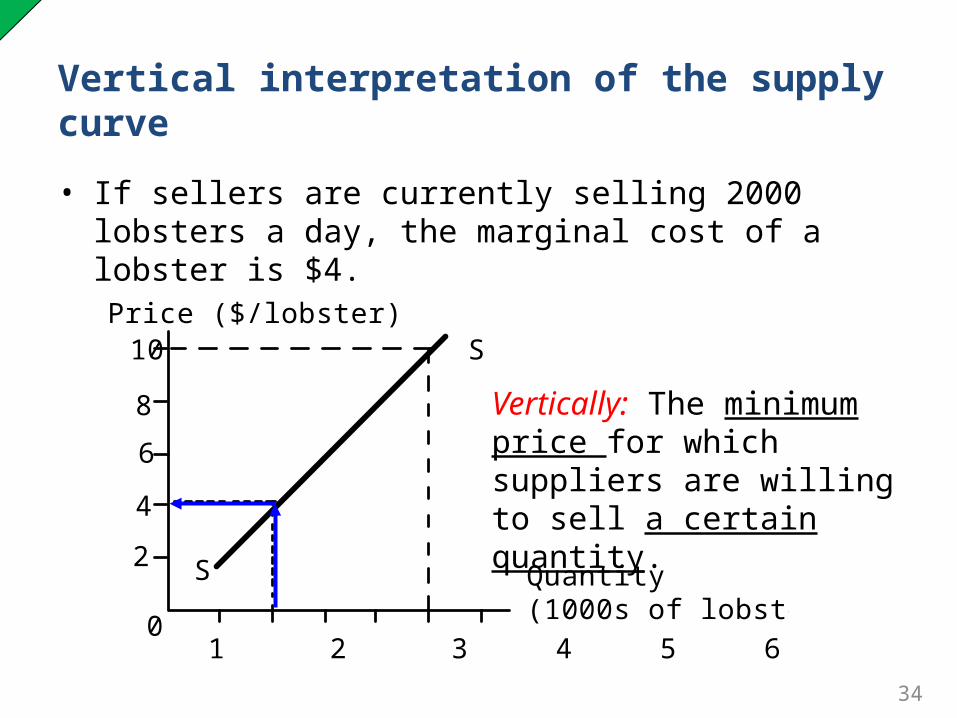
Vertical interpretation of the supply curve
• If sellers are currently selling 2000 lobsters a day, the marginal cost of a lobster is $4.
Price ($/lobster)
Quantity (1000s of lobsters/day)
10
8
6
4
2
0
S
S
1 2 3 4 5 6
Vertically: The minimum price for which suppliers are willing to sell a certain quantity.
35
Why is the supply curve upward sloping?
o The cost of producing a good is not equal across all suppliers.o At a low price, a good is produced and sold
only by the lowest cost suppliers.o At a high price, a good is also produced and
sold by higher cost suppliers.
o For the same supplier, the additional output due to the additional input decreases with output.o For the same supplier, the additional cost to
produce an additional unit of output increases.
36
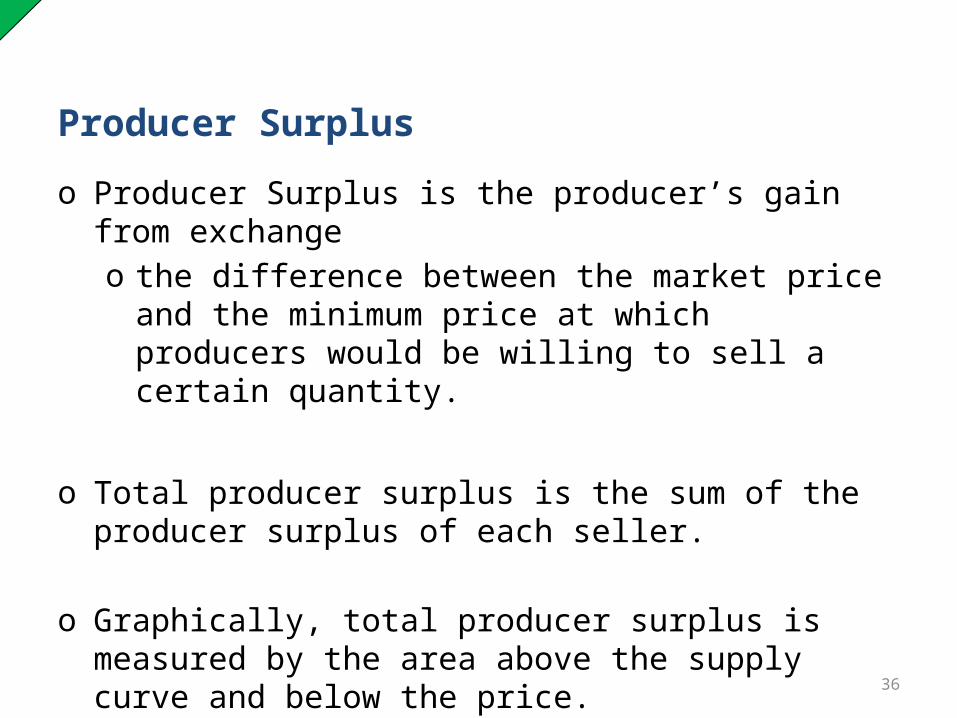
Producer Surplus
o Producer Surplus is the producer’s gain from exchange o the difference between the market price and
the minimum price at which producers would be willing to sell a certain quantity.
o Total producer surplus is the sum of the producer surplus of each seller.
o Graphically, total producer surplus is measured by the area above the supply curve and below the price.
37
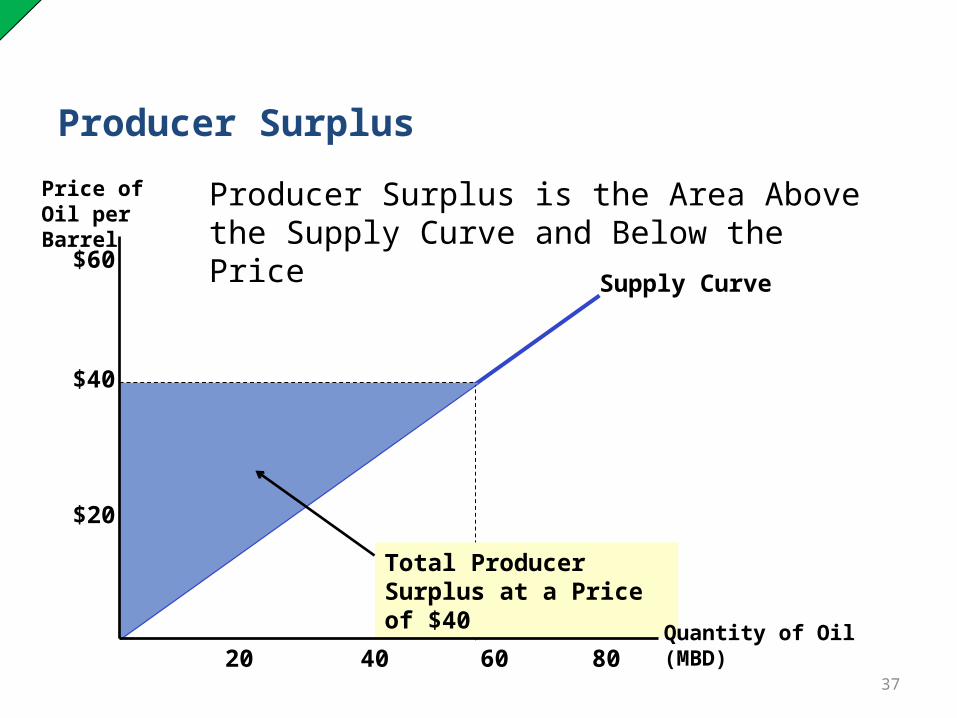
Producer Surplus
$40
$20
$60
60
40
Supply Curve
20
80
Total Producer Surplus at a Price of $40 Quantity of Oil
(MBD)
Price of Oil per Barrel
Producer Surplus is the Area Above the Supply Curve and Below the Price
38
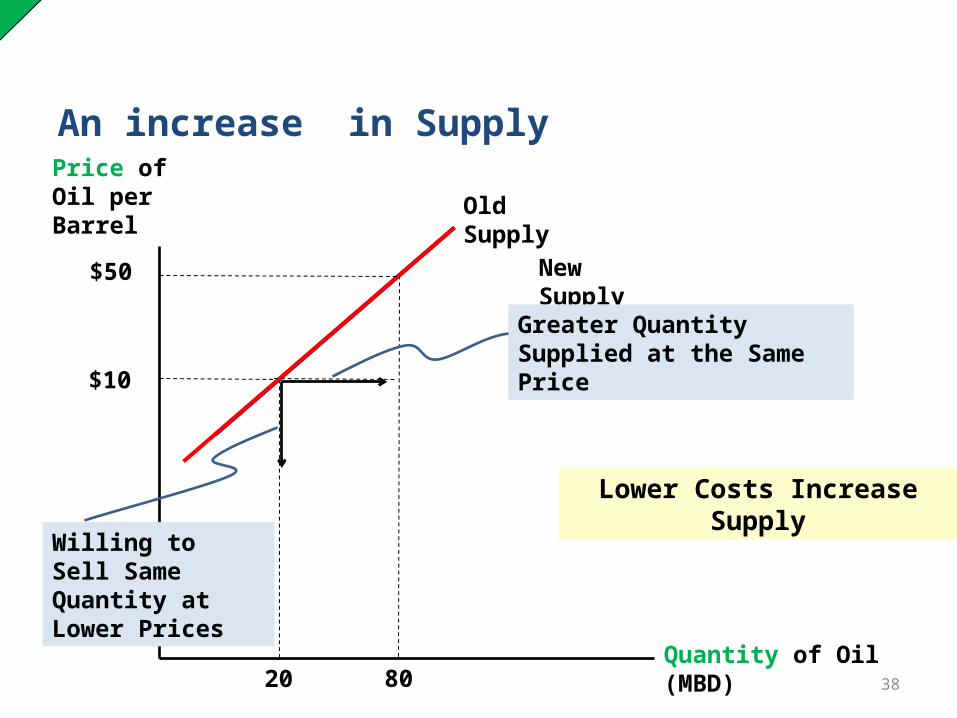
An increase in Supply
Old Supply
$50
20
Lower Costs Increase Supply
Quantity of Oil (MBD)
Price of Oil per Barrel
New Supply
$10
80
Greater Quantity Supplied at the Same Price
Willing to Sell Same Quantity at Lower Prices
39
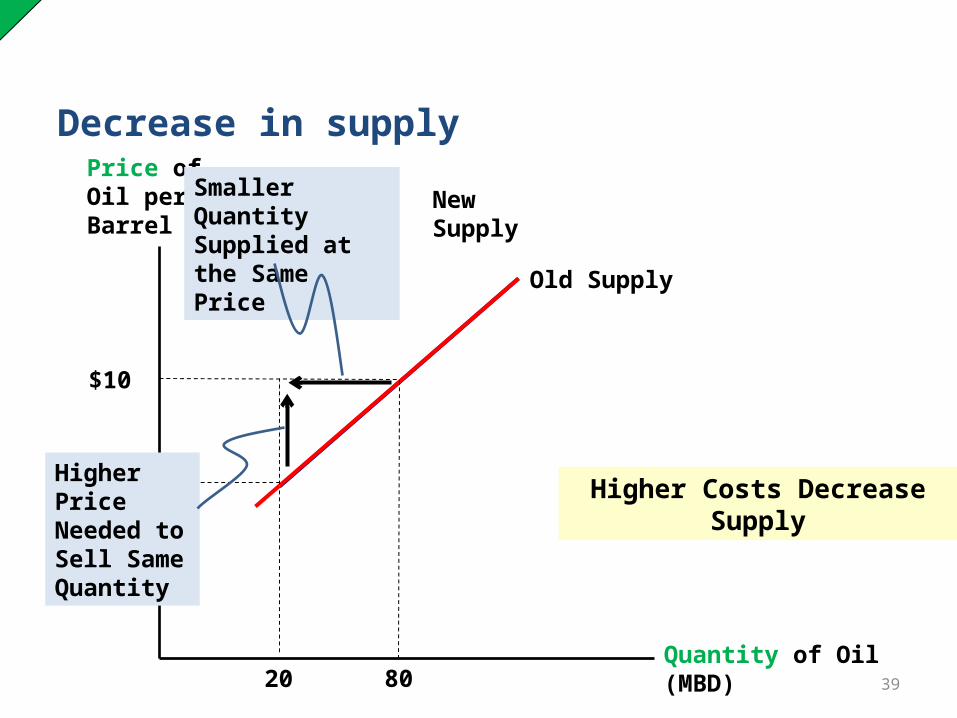
Decrease in supply
Old Supply
20
Higher Costs Decrease Supply
Quantity of Oil (MBD)
Price of Oil per Barrel
New Supply
$10
80
Smaller Quantity Supplied at the Same Price
Higher Price Needed to Sell Same Quantity
40
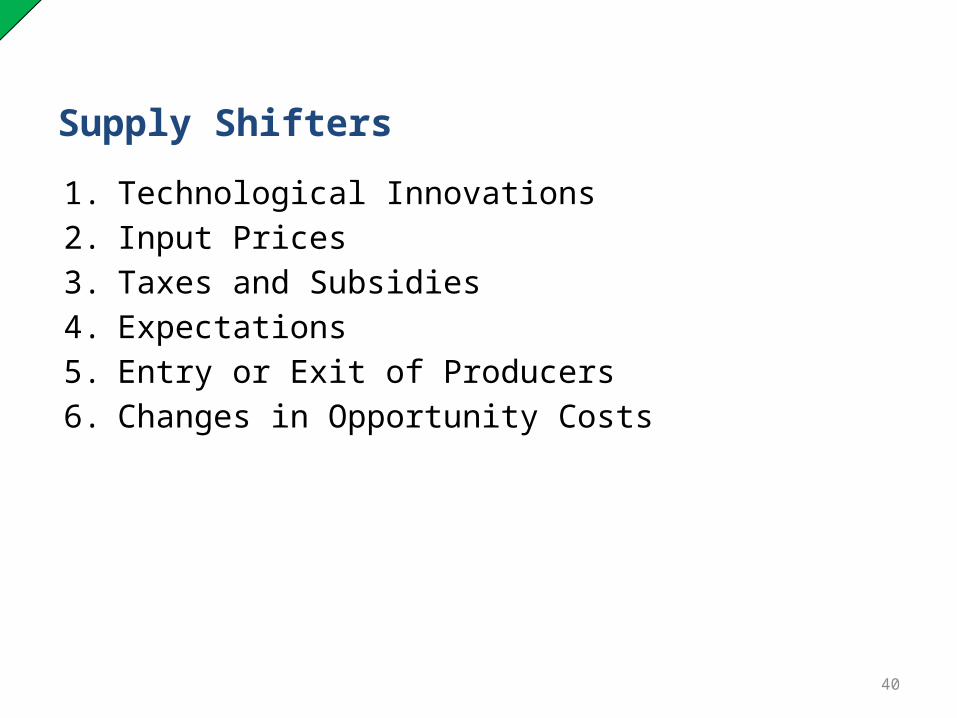
Supply Shifters
1. Technological Innovations2. Input Prices3. Taxes and Subsidies4. Expectations5. Entry or Exit of Producers6. Changes in Opportunity Costs

41
Supply Shifters:Technological Innovations
o A technological innovation makes sellers willing to offer more at a given price, or sell a quantity at a lower price.o A technological innovation lowers costs and
increases supply.
42
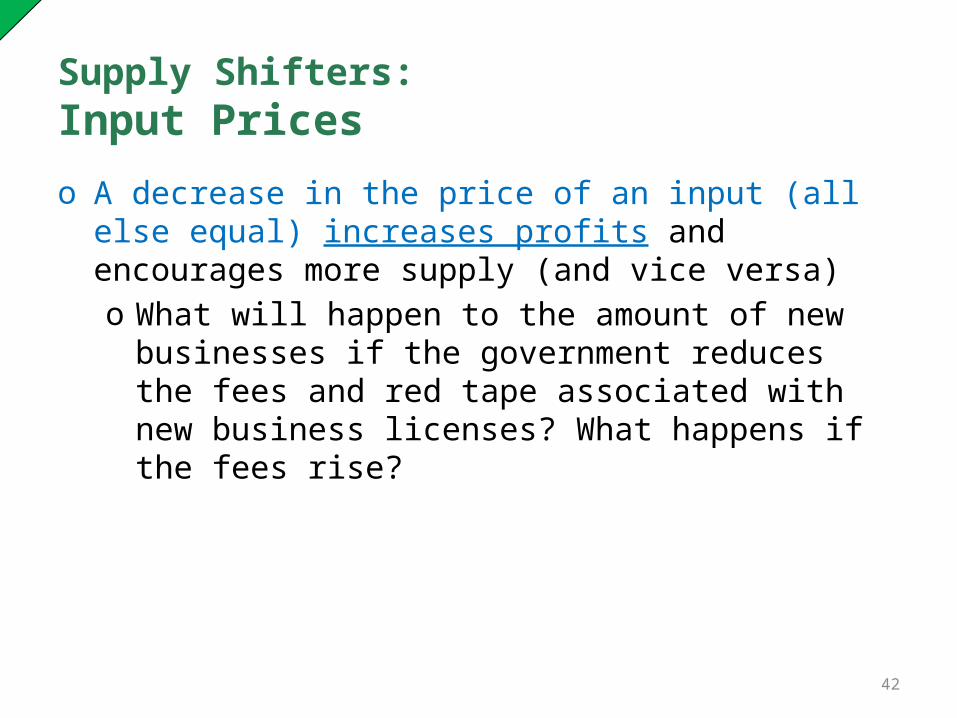
Supply Shifters:Input Prices
o A decrease in the price of an input (all else equal) increases profits and encourages more supply (and vice versa)o What will happen to the amount of new
businesses if the government reduces the fees and red tape associated with new business licenses? What happens if the fees rise?
43
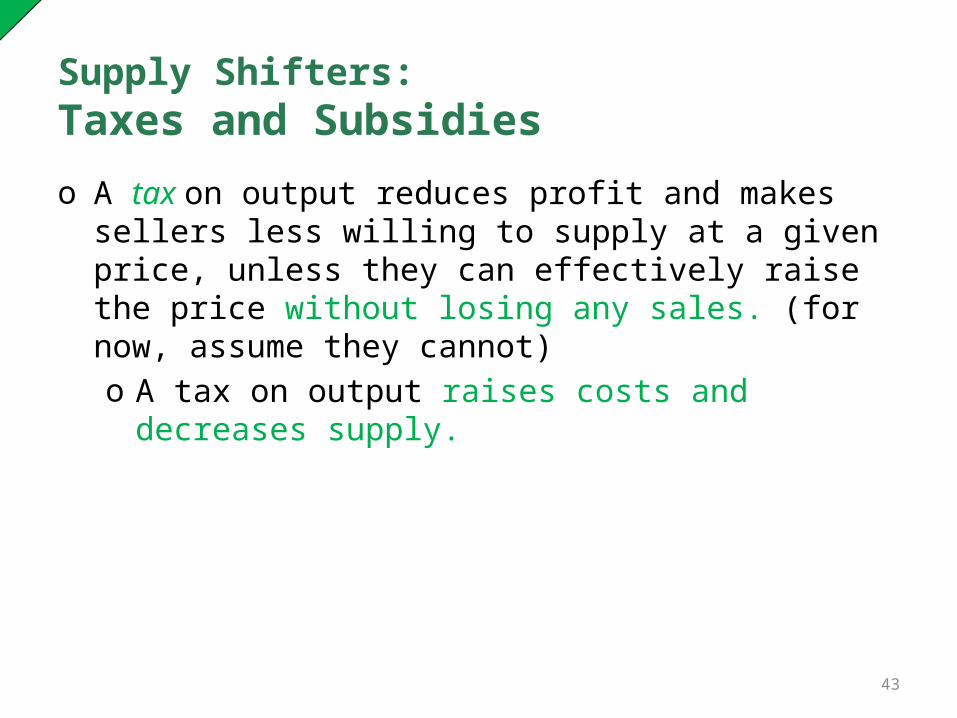
Supply Shifters: Taxes and Subsidies
o A tax on output reduces profit and makes sellers less willing to supply at a given price, unless they can effectively raise the price without losing any sales. (for now, assume they cannot)o A tax on output raises costs and decreases
supply.
44
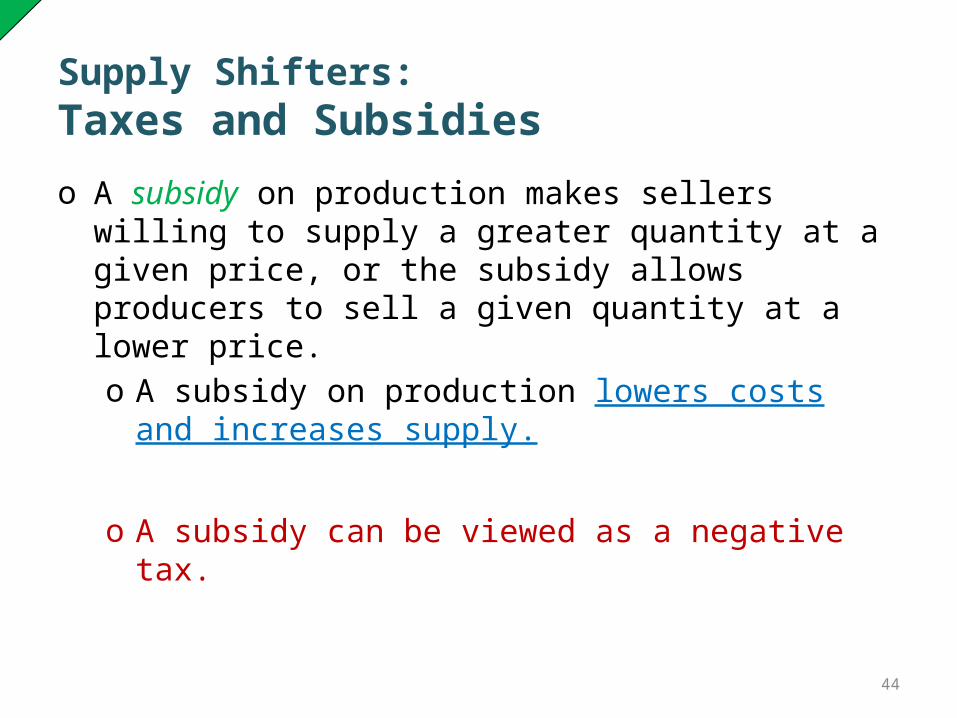
Supply Shifters: Taxes and Subsidies
o A subsidy on production makes sellers willing to supply a greater quantity at a given price, or the subsidy allows producers to sell a given quantity at a lower price.o A subsidy on production lowers costs and
increases supply.
o A subsidy can be viewed as a negative tax.
45
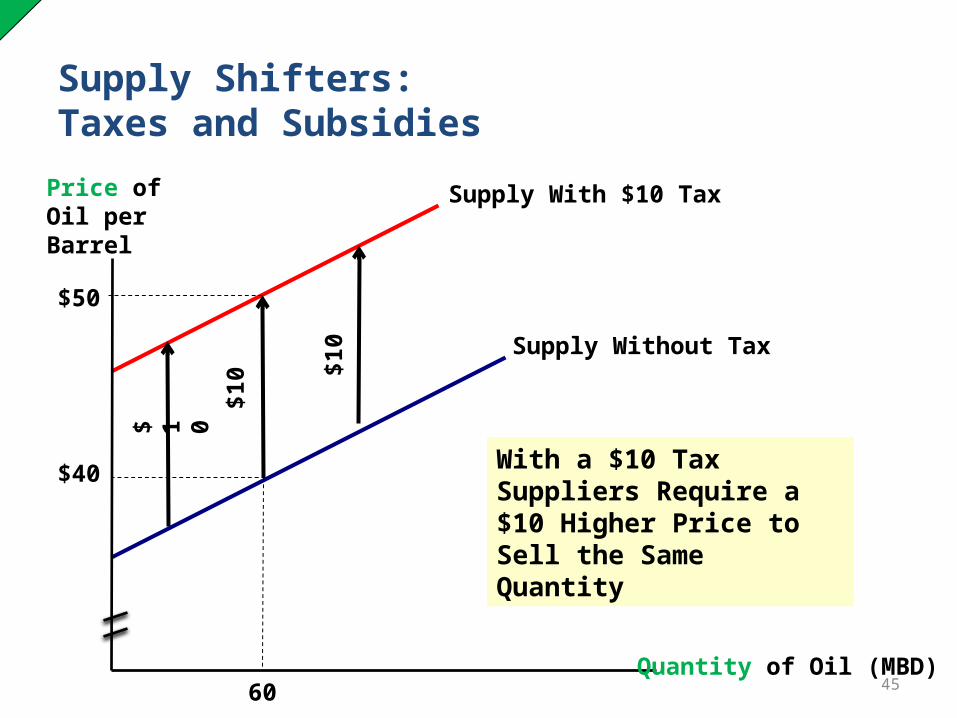
Supply Shifters:Taxes and Subsidies
$10
Supply With $10 Tax
$10
$ 1 0
$50
Supply Without Tax
$40
60
Quantity of Oil (MBD)
Price of Oil per Barrel
With a $10 Tax Suppliers Require a $10 Higher Price to Sell the Same Quantity
46
Supply Shifters: Expectations
o The expectation of a higher price for a good in the future decreases current supply of the good – if they can store the good- (and vice versa).o Sellers will adjust their current offerings in
anticipation of the direction of future prices in order to obtain the highest possible price.
47
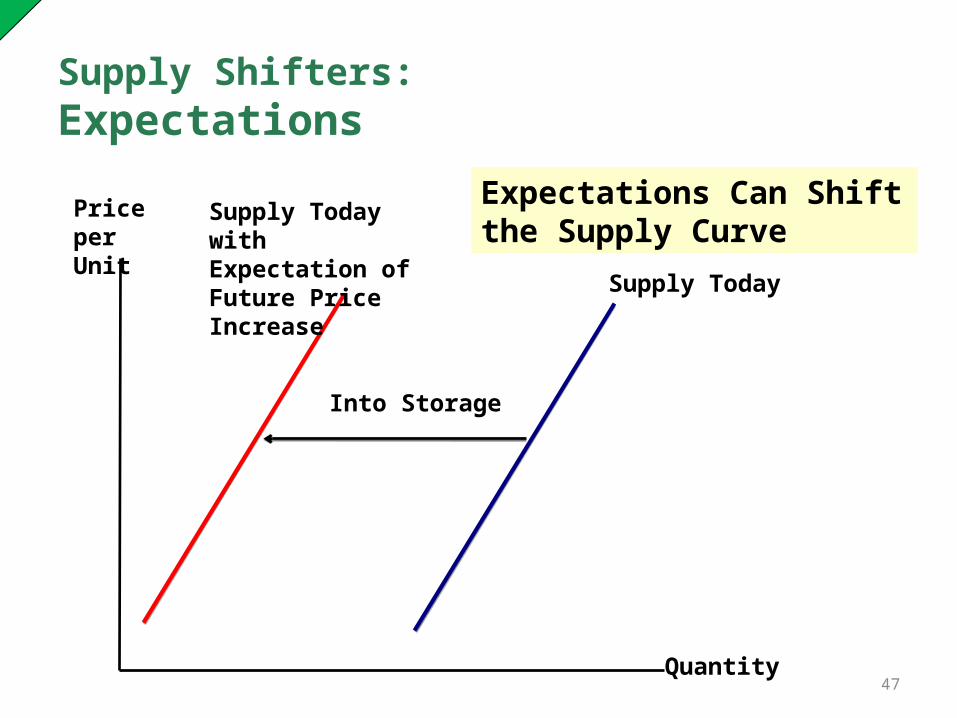
Supply Shifters: Expectations
Expectations Can Shift the Supply Curve
Quantity
Price per Unit
Supply Today
Supply Today with Expectation of Future Price Increase
Into Storage
48
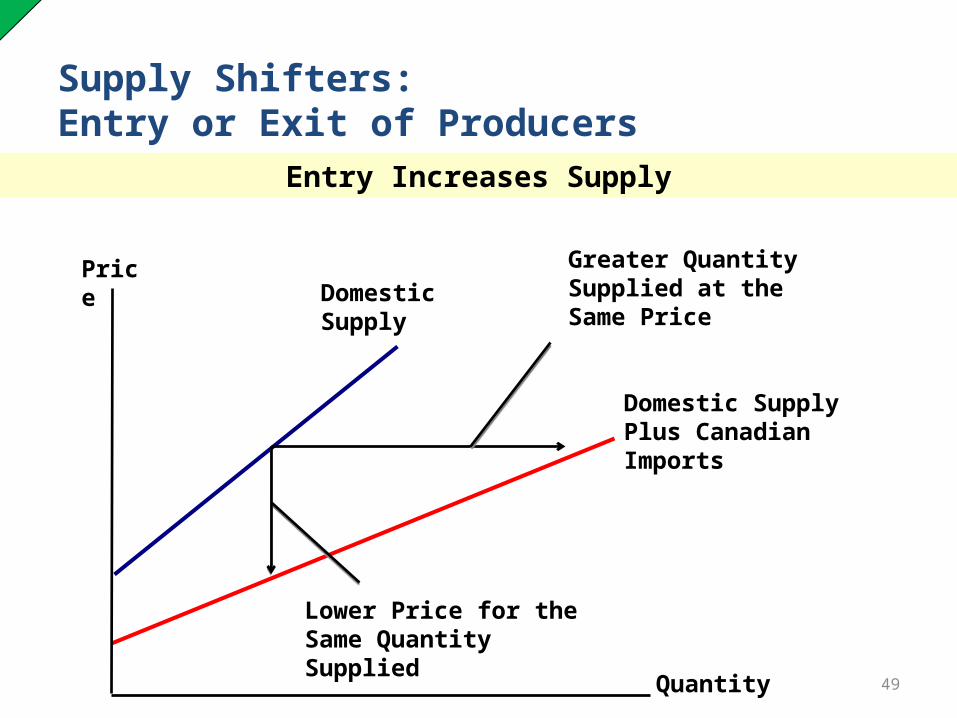
Supply Shifters: Entry or Exit of Producers
As producers enter and exit the market, the overall supply changes.
o Entry implies more sellers in the market increasing supply.
o Exit implies fewer sellers in the market decreasing supply.
o What will happen to the supply for Marijuana in California if the drug is legalized for general use?
49
Supply Shifters: Entry or Exit of Producers
Domestic Supply
Domestic Supply Plus Canadian Imports
Price
Quantity
Entry Increases Supply
Greater Quantity Supplied at the Same Price
Lower Price for the Same Quantity Supplied
50
Supply Shifters: Changes in Opportunity Costs
o Inputs used in production have opportunity costs. Sellers will choose to use those inputs where the profit is the highest o Sellers will supply less of a good if the price of
an alternate good using the same inputs rises (and vice versa).
o Sellers always chase the highest profit goods.
51
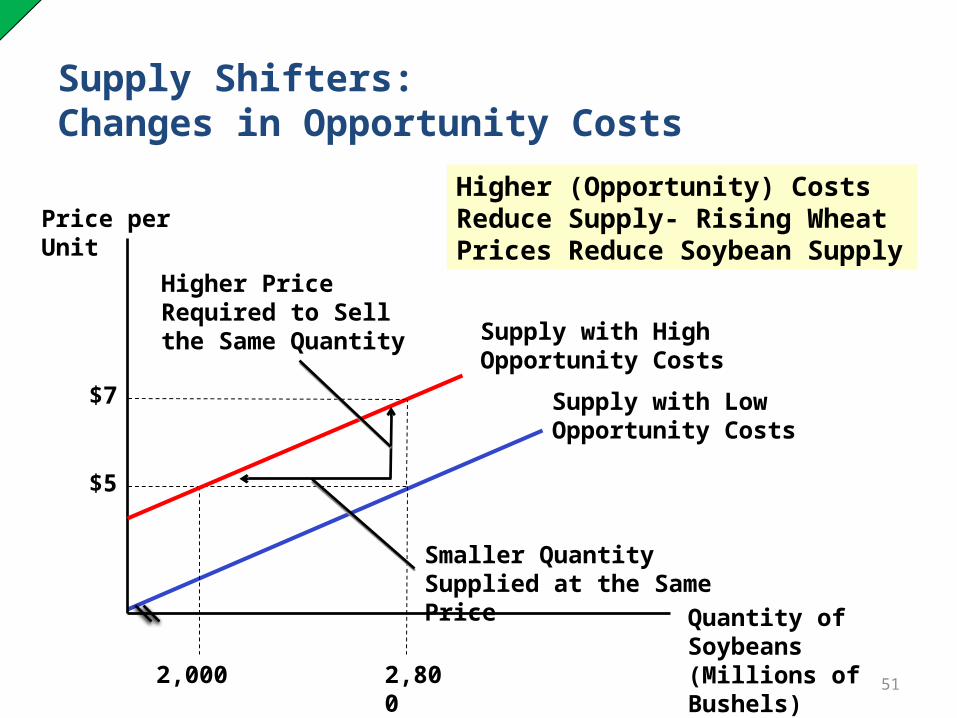
Supply Shifters: Changes in Opportunity Costs
$5
Supply with Low Opportunity Costs
2,800
Higher (Opportunity) Costs Reduce Supply- Rising Wheat Prices Reduce Soybean Supply
Quantity of Soybeans (Millions of Bushels)
Price per Unit
2,000
$7
Supply with High Opportunity Costs
Smaller Quantity Supplied at the Same Price
Higher Price Required to Sell the Same Quantity
52
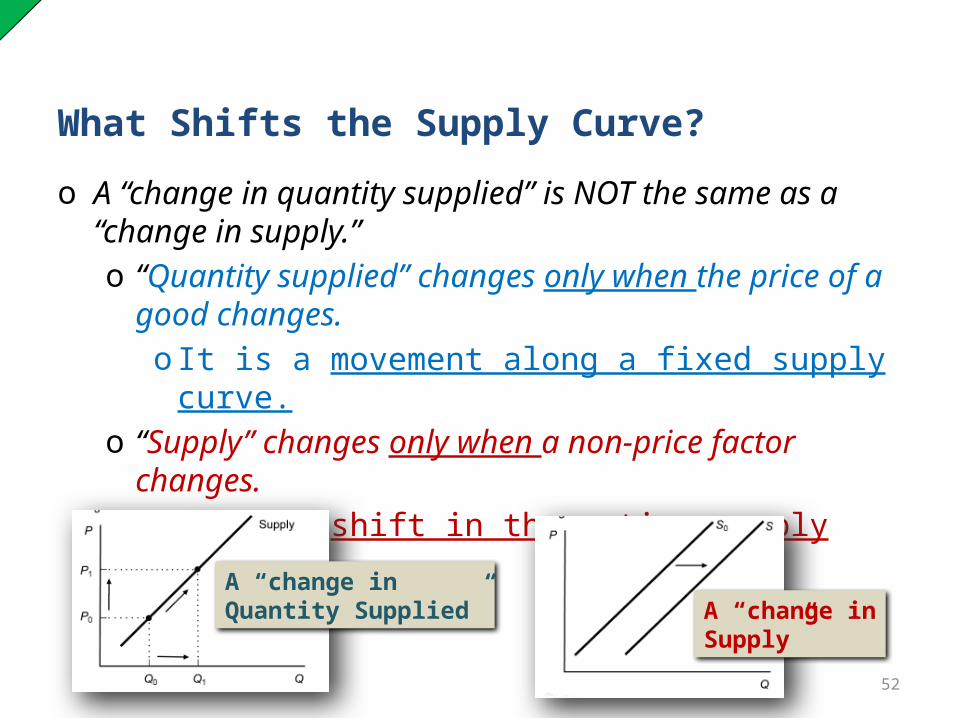
What Shifts the Supply Curve?
o A “change in quantity supplied” is NOT the same as a “change in supply.”o “Quantity supplied” changes only when the
price of a good changes.o It is a movement along a fixed supply curve.
o “Supply” changes only when a non-price factor changes.o It is a shift in the entire supply curve.
A “change in Quantity Supplied” A “change
in Supply”
Related Documents