Journal of Marine Science and Engineering Article Structural Integrity of Fixed Offshore Platforms by Incorporating Wave-in-Deck Nurul Uyun Azman 1,2 , Mohd Khairi Abu Husain 1, *, Noor Irza Mohd Zaki 1 , Ezanizam Mat Soom 3 , Nurul Azizah Mukhlas 1 and Sayyid Zainal Abidin Syed Ahmad 4 Citation: Azman, N.U.; Abu Husain, M.K.; Mohd Zaki, N.I.; Mat Soom, E.; Mukhlas, N.A.; Syed Ahmad, S.Z.A. Structural Integrity of Fixed Offshore Platforms by Incorporating Wave-in- Deck. J. Mar. Sci. Eng. 2021, 9, 1027. https://doi.org/10.3390/jmse9091027 Academic Editor: Constantine Michailides Received: 9 August 2021 Accepted: 14 September 2021 Published: 18 September 2021 Publisher’s Note: MDPI stays neutral with regard to jurisdictional claims in published maps and institutional affil- iations. Copyright: © 2021 by the authors. Licensee MDPI, Basel, Switzerland. This article is an open access article distributed under the terms and conditions of the Creative Commons Attribution (CC BY) license (https:// creativecommons.org/licenses/by/ 4.0/). 1 Department of Engineering, Razak Faculty of Technology and Informatics, University Teknologi Malaysia, Kuala Lumpur 54100, Malaysia; [email protected] (N.U.A.); [email protected] (N.I.M.Z.); [email protected] (N.A.M.) 2 Brunei Shell Petroleum, Jalan Utara, Panaga KB2933, Brunei 3 Repsol Oil and Gas Malaysia Limited, Jalan Ampang, Kuala Lumpur 54450, Malaysia; [email protected] 4 Department of Maritime Technology, Faculty of Ocean Engineering Technology and Informatics, Universiti Malaysia Terengganu, Kuala Nerus 21030, Malaysia; [email protected] * Correspondence: [email protected] Abstract: The structural integrity of offshore platforms is affected by degradation issues such as subsidence. Subsidence involves large settlement areas, and it is one of the phenomena that may be experienced by offshore platforms throughout their lives. Compaction of the reservoir is caused by pressure reduction, which results in vertical movement of soils from the reservoir to the mud line. The impact of subsidence on platforms will lead to a gradually reduced wave crest to deck air gap (insufficient air gap) and cause wave-in-deck. The wave-in-deck load can cause significant damage to deck structures, and it may cause the collapse of the entire platform. This study aims to investigate the impact of wave-in-deck load on structure response for fixed offshore structure. The conventional run of pushover analysis only considers the 100-year design crest height for the ultimate collapse. The wave height at collapse is calculated using a limit state equation for the probabilistic model that may give a different result. It is crucial to ensure that the reserve strength ratio (RSR) is not overly estimated, hence giving a false impression of the value. This study is performed to quantify the wave-in-deck load effects based on the revised RSR. As part of the analysis, the Ultimate Strength for Offshore Structures (USFOS) software and wave-in-deck calculation recommended by the International Organization for Standardization (ISO) as practised in the industry is adopted to complete the study. As expected, the new revised RSR with the inclusion of wave-in-deck load is lower and, hence, increases the probability of failure (POF) of the platform. The accuracy and effectiveness of this method will assist the industry, especially operators, for decision making and, more specifically, in outlining the action items as part of their business risk management. Keywords: subsidence; wave-in-deck; probabilistic model; reserve strength ratio; probability of failure; structural reliability assessment 1. Introduction Malaysia’s oil and gas scene started in 1910 with the discovery of an onshore oil well in Miri, Sarawak [1,2]. With the right technology and knowledge, the exploration was extended to the offshore area in Peninsular Malaysia, with Tapis oil field being the first one discovered in 1969. Currently, there were more than 300 offshore platforms in Malaysia operated by PETRONAS Peninsular Malaysia Operation (PMO), Sarawak Operation (SKO) and Sabah Operation (SBO) [3,4]. According to Ayob et al. [5], in 2014, 65% of 191 offshore platforms have exceeded their design life, and the percentage will increase to 78% in 2019. It is crucial to ensure that the structural integrity of offshore platforms in order to avoid structural failure [6–8]. Two factors may affect the structural integrity of an offshore J. Mar. Sci. Eng. 2021, 9, 1027. https://doi.org/10.3390/jmse9091027 https://www.mdpi.com/journal/jmse

Welcome message from author
This document is posted to help you gain knowledge. Please leave a comment to let me know what you think about it! Share it to your friends and learn new things together.
Transcript

Journal of
Marine Science and Engineering
Article
Structural Integrity of Fixed Offshore Platforms byIncorporating Wave-in-Deck
Nurul Uyun Azman 1,2, Mohd Khairi Abu Husain 1,*, Noor Irza Mohd Zaki 1 , Ezanizam Mat Soom 3,Nurul Azizah Mukhlas 1 and Sayyid Zainal Abidin Syed Ahmad 4
�����������������
Citation: Azman, N.U.; Abu Husain,
M.K.; Mohd Zaki, N.I.; Mat Soom, E.;
Mukhlas, N.A.; Syed Ahmad, S.Z.A.
Structural Integrity of Fixed Offshore
Platforms by Incorporating Wave-in-
Deck. J. Mar. Sci. Eng. 2021, 9, 1027.
https://doi.org/10.3390/jmse9091027
Academic Editor: Constantine
Michailides
Received: 9 August 2021
Accepted: 14 September 2021
Published: 18 September 2021
Publisher’s Note: MDPI stays neutral
with regard to jurisdictional claims in
published maps and institutional affil-
iations.
Copyright: © 2021 by the authors.
Licensee MDPI, Basel, Switzerland.
This article is an open access article
distributed under the terms and
conditions of the Creative Commons
Attribution (CC BY) license (https://
creativecommons.org/licenses/by/
4.0/).
1 Department of Engineering, Razak Faculty of Technology and Informatics, University Teknologi Malaysia,Kuala Lumpur 54100, Malaysia; [email protected] (N.U.A.); [email protected] (N.I.M.Z.);[email protected] (N.A.M.)
2 Brunei Shell Petroleum, Jalan Utara, Panaga KB2933, Brunei3 Repsol Oil and Gas Malaysia Limited, Jalan Ampang, Kuala Lumpur 54450, Malaysia;
[email protected] Department of Maritime Technology, Faculty of Ocean Engineering Technology and Informatics,
Universiti Malaysia Terengganu, Kuala Nerus 21030, Malaysia; [email protected]* Correspondence: [email protected]
Abstract: The structural integrity of offshore platforms is affected by degradation issues such assubsidence. Subsidence involves large settlement areas, and it is one of the phenomena that maybe experienced by offshore platforms throughout their lives. Compaction of the reservoir is causedby pressure reduction, which results in vertical movement of soils from the reservoir to the mudline. The impact of subsidence on platforms will lead to a gradually reduced wave crest to deckair gap (insufficient air gap) and cause wave-in-deck. The wave-in-deck load can cause significantdamage to deck structures, and it may cause the collapse of the entire platform. This study aims toinvestigate the impact of wave-in-deck load on structure response for fixed offshore structure. Theconventional run of pushover analysis only considers the 100-year design crest height for the ultimatecollapse. The wave height at collapse is calculated using a limit state equation for the probabilisticmodel that may give a different result. It is crucial to ensure that the reserve strength ratio (RSR)is not overly estimated, hence giving a false impression of the value. This study is performed toquantify the wave-in-deck load effects based on the revised RSR. As part of the analysis, the UltimateStrength for Offshore Structures (USFOS) software and wave-in-deck calculation recommended bythe International Organization for Standardization (ISO) as practised in the industry is adopted tocomplete the study. As expected, the new revised RSR with the inclusion of wave-in-deck loadis lower and, hence, increases the probability of failure (POF) of the platform. The accuracy andeffectiveness of this method will assist the industry, especially operators, for decision making and,more specifically, in outlining the action items as part of their business risk management.
Keywords: subsidence; wave-in-deck; probabilistic model; reserve strength ratio; probability offailure; structural reliability assessment
1. Introduction
Malaysia’s oil and gas scene started in 1910 with the discovery of an onshore oil wellin Miri, Sarawak [1,2]. With the right technology and knowledge, the exploration wasextended to the offshore area in Peninsular Malaysia, with Tapis oil field being the first onediscovered in 1969. Currently, there were more than 300 offshore platforms in Malaysiaoperated by PETRONAS Peninsular Malaysia Operation (PMO), Sarawak Operation (SKO)and Sabah Operation (SBO) [3,4]. According to Ayob et al. [5], in 2014, 65% of 191 offshoreplatforms have exceeded their design life, and the percentage will increase to 78% in 2019.
It is crucial to ensure that the structural integrity of offshore platforms in order toavoid structural failure [6–8]. Two factors may affect the structural integrity of an offshore
J. Mar. Sci. Eng. 2021, 9, 1027. https://doi.org/10.3390/jmse9091027 https://www.mdpi.com/journal/jmse

J. Mar. Sci. Eng. 2021, 9, 1027 2 of 18
platform. They are excessive load and insufficient strength [5]. The excessive loads comefrom the environmental loads, operational loads and accidental loads. Whereas, theinsufficient strength may cause by an error in design, fabrication, installation and operationand degradation.
Various degradation issues faced by the ageing platform such as corrosion, weldcrack, local denting, scour and subsidence [9–13]. These may affect the overall structuralintegrity of the platform as well as impede its operations as the redundancy and strengthof the platform may decrease [14–16]. Besides, the lack of precise guidelines is also asignificant issue while considering the life extension of aged facilities. The original designregulations and standards have often been used to document the safety of structuresduring the extended life. Most existing structures have a history of degradation, incidentsand accidents, which are nowhere captured while assessment is carried out with originaldesign guidelines [17,18]. There is a need to develop precise guidelines, which will takeinto account the historical condition of the structure in predicting its remaining life moreaccurately. This study considered as-is platform degradation, which is subsidence. Thedetailed methodology is presented in Section 3.
Subsidence may occur due to the depletion of the reservoir, hence causing it to becompacted [19,20]. The compaction will increase with the increase in the reservoir depletion.This eventually will lead to a surface subsidence over time. Figure 1 shows the offshorestructures with subsidence (represent by Platform 1) and without subsidence (represent byPlatform 2).
J. Mar. Sci. Eng. 2021, 9, x FOR PEER REVIEW 2 of 19
It is crucial to ensure that the structural integrity of offshore platforms in order to avoid structural failure [6–8]. Two factors may affect the structural integrity of an offshore platform. They are excessive load and insufficient strength [5]. The excessive loads come from the environmental loads, operational loads and accidental loads. Whereas, the insuf-ficient strength may cause by an error in design, fabrication, installation and operation and degradation.
Various degradation issues faced by the ageing platform such as corrosion, weld crack, local denting, scour and subsidence [9–13]. These may affect the overall structural integrity of the platform as well as impede its operations as the redundancy and strength of the platform may decrease [14–16]. Besides, the lack of precise guidelines is also a sig-nificant issue while considering the life extension of aged facilities. The original design regulations and standards have often been used to document the safety of structures dur-ing the extended life. Most existing structures have a history of degradation, incidents and accidents, which are nowhere captured while assessment is carried out with original de-sign guidelines [17,18]. There is a need to develop precise guidelines, which will take into account the historical condition of the structure in predicting its remaining life more ac-curately. This study considered as-is platform degradation, which is subsidence. The de-tailed methodology is presented in Section 3.
Subsidence may occur due to the depletion of the reservoir, hence causing it to be compacted [19,20]. The compaction will increase with the increase in the reservoir deple-tion. This eventually will lead to a surface subsidence over time. Figure 1 shows the off-shore structures with subsidence (represent by Platform 1) and without subsidence (rep-resent by Platform 2).
Figure 1. Offshore platform with and without subsidence.
The actual event of platform subsidence is illustrated in Figure 2a,b where the boat landing photo was taken in 2005 and 2016, respectively. It can be seen that the boat landing is no longer usable by 2016 as all the three stages of landing were submerged due to sub-sidence. Generally, it also means that the air gap of the platform is decreasing, and the condition may be worsened during the storm. Based on these figures, subsidence needs to be carefully assessed during the design stage of the platform in order to avoid cata-strophic incident due to the condition where the water level becomes closer to the topside
Figure 1. Offshore platform with and without subsidence.
The actual event of platform subsidence is illustrated in Figure 2a,b where the boatlanding photo was taken in 2005 and 2016, respectively. It can be seen that the boat landingis no longer usable by 2016 as all the three stages of landing were submerged due tosubsidence. Generally, it also means that the air gap of the platform is decreasing, and thecondition may be worsened during the storm. Based on these figures, subsidence needs tobe carefully assessed during the design stage of the platform in order to avoid catastrophicincident due to the condition where the water level becomes closer to the topside deckor, in other words, the loss of the air gap. Hence, there is the potential of a wave-in-deckscenario at the affected platform [21].

J. Mar. Sci. Eng. 2021, 9, 1027 3 of 18
J. Mar. Sci. Eng. 2021, 9, x FOR PEER REVIEW 3 of 19
deck or, in other words, the loss of the air gap. Hence, there is the potential of a wave-in-deck scenario at the affected platform [21].
(a) (b)
Figure 2. Evidence of platform subsidence: (a) photo in 2005; (b) photo in 2016.
Structural reliability assessment using pushover analysis is widely used to calculate the reserve strength ratio and probability failure of offshore structures. Fairly recent stud-ies had been performed by [5,22–26], which involved the structural reliability assessment. The pushover analysis had been performed by the authors to calculate the reserve strength ratio. The reserve strength ratio was then used to calculate the probability of failure. How-ever, none of the authors included the wave-in-deck load during the determination of the reserve strength ratio.
Studies performed by [22,27–31] concluded that the wave-in-deck load needed to be considered in the pushover analysis. This was due to the fact that a huge wave hitting the offshore platform led to a high wave-in-deck load that could eventually resulted in signif-icant platform damage and collapse.
The impact of waves on structures and the resulting impact load were significantly influenced by the water particle velocities, as proven from laboratory test conducted by Scharnke et al. [32]. The load estimates increased as the crest height and horizontal particle velocities increased. The loading from a wave impact event can be significant, and numer-ical prediction is quite challenging [33–35]. Wave impacts can be critical for local structural details as well as global structural integrity [32–37].
However, most of the collapse wave height was higher than the platform deck, and this led to the wave-in-deck scenario. Based on Golafshani et al. [38], the wave-in-deck load was ignored during the determination of 𝑅𝑆𝑅 in the pushover analysis. In the con-ventional pushover analysis using USFOS software, the 100-year return period environ-mental load is incremented until the platform is collapsed and generate the ultimate re-sistance of the jacket. The forces are calculated up to the true sea surface based on 100-years return period; hence, the wave height is not scaled [21]. In the current study, wave-in-deck load will be considered if the wave crest height at collapse is higher than the bot-tom steel of the structure.
To avoid overestimation, studies performed by Mat Soom et al. [39] and Ayob et al. [40] carried out the 𝑅𝑆𝑅 calculation up to the bottom of the steel structures by limiting the wave crest height. By doing so, they might overly underestimate the 𝑅𝑆𝑅 in the event that the platform had the capacity to take a higher environmental load.
According to the literature review, there are three methods for calculating the wave-in-deck load, which are the silhouette method [41–44], component method [45,46] and computational fluid dynamics method, CFD [28,47–49]. Generally, the silhouette method is a simplified method based on projected area of the wave-in-deck; hence, no detailing is required. Unlike the silhouette method, the component method needs the details of the deck model in order to calculate the wave-in-deck load. The CFD method results compare
Figure 2. Evidence of platform subsidence: (a) photo in 2005; (b) photo in 2016.
Structural reliability assessment using pushover analysis is widely used to calculatethe reserve strength ratio and probability failure of offshore structures. Fairly recent studieshad been performed by [5,22–26], which involved the structural reliability assessment. Thepushover analysis had been performed by the authors to calculate the reserve strength ratio.The reserve strength ratio was then used to calculate the probability of failure. However,none of the authors included the wave-in-deck load during the determination of the reservestrength ratio.
Studies performed by [22,27–31] concluded that the wave-in-deck load needed to beconsidered in the pushover analysis. This was due to the fact that a huge wave hittingthe offshore platform led to a high wave-in-deck load that could eventually resulted insignificant platform damage and collapse.
The impact of waves on structures and the resulting impact load were significantlyinfluenced by the water particle velocities, as proven from laboratory test conductedby Scharnke et al. [32]. The load estimates increased as the crest height and horizontalparticle velocities increased. The loading from a wave impact event can be significant, andnumerical prediction is quite challenging [33–35]. Wave impacts can be critical for localstructural details as well as global structural integrity [32–37].
However, most of the collapse wave height was higher than the platform deck, andthis led to the wave-in-deck scenario. Based on Golafshani et al. [38], the wave-in-deck loadwas ignored during the determination of RSR in the pushover analysis. In the conventionalpushover analysis using USFOS software, the 100-year return period environmental loadis incremented until the platform is collapsed and generate the ultimate resistance of thejacket. The forces are calculated up to the true sea surface based on 100-years return period;hence, the wave height is not scaled [21]. In the current study, wave-in-deck load willbe considered if the wave crest height at collapse is higher than the bottom steel of thestructure.
To avoid overestimation, studies performed by Mat Soom et al. [39] and Ayob et al. [40]carried out the RSR calculation up to the bottom of the steel structures by limiting thewave crest height. By doing so, they might overly underestimate the RSR in the event thatthe platform had the capacity to take a higher environmental load.
According to the literature review, there are three methods for calculating the wave-in-deck load, which are the silhouette method [41–44], component method [45,46] andcomputational fluid dynamics method, CFD [28,47–49]. Generally, the silhouette methodis a simplified method based on projected area of the wave-in-deck; hence, no detailing isrequired. Unlike the silhouette method, the component method needs the details of thedeck model in order to calculate the wave-in-deck load. The CFD method results comparewell with the experiment results. The silhouette method as spelled in the InternationalOrganization for Standardization, 2007, [44] is adopted in this study as it is widely usedfor the design and assessment of the fixed offshore platform. The method is a simplifiedmethod to calculate the global wave-in-deck load acting on the topside structure. It is

J. Mar. Sci. Eng. 2021, 9, 1027 4 of 18
acknowledged that the wave-in-deck load is of dynamic in nature, for example, as per studyperformed by van Raaij [50], van Raaij and Gudmenstad [51] and Iwanowski et al. [52].However, this study assumed that the wave-in-deck load acted together with the wave-on-jacket. Hence, it may give a conservative response, and this will in turn produce aconservative reserve strength ratio (RSR).
The conventional run of pushover analysis considers a 100-year crest height to calcu-late the reserve strength ratio. This study considers crest height at collapse by incorporatingwave-in-deck load and investigates the impact on structure response for fixed offshoreplatform. It is expected that the reserve strength ratio of the platform will be reduced and,hence, increase the probability of failure of the platform when the wave-in-deck load isconsidered in the pushover analysis. This method will assist the industry for decisionmaking for outlining of action items as part of their business risk management.
2. Wave-in-Deck Load and Reserve Strength Ratio
Wave-in-deck occurs when there is no deck clearance or air gap between the waterlevel and the bottom steel of topside structure when it is hit by the waves [43,44]. Toavoid wave-in-deck, all offshore platforms need to be adequately designed by providingan allowance for the air gap [31]. If the air gap is expected to reduce over time, the lowestdeck may be designed at a higher elevation or the equipment seated on the deck need to bedesigned to cater for the wave-in-deck load.
Pushover analysis, also known as ultimate strength analysis, is commonly used instructural reliability assessment to determine the reserve strength ratio (RSR) of an offshoreplatform. The platform’s ability to withstand a specific environmental load will be checked,especially for an ageing platform. The load as advised by the International Organizationfor Standardization, 2007, [44] is the 100-year environmental load.
The conventional run of pushover analysis only considers the 100-year design crestheight for the ultimate collapse. However, when the RSR is higher, the wave height willalso become higher [38]. However, no comprehensive study is carried out as to the effectsof the wave-in-deck load, which are excluded during the RSR determination [38] as shownin Figure 3a. It is crucial to ensure that the RSR is not overly estimated, hence giving a falseimpression of the value. There is a possibility that the wave crest will reach the bottomsteel of the deck structure, or even higher, and supposedly create a wave-in-deck scenarioas shown in Figure 3b.
J. Mar. Sci. Eng. 2021, 9, x FOR PEER REVIEW 4 of 19
well with the experiment results. The silhouette method as spelled in the International Organization for Standardization, 2007, [44] is adopted in this study as it is widely used for the design and assessment of the fixed offshore platform. The method is a simplified method to calculate the global wave-in-deck load acting on the topside structure. It is acknowledged that the wave-in-deck load is of dynamic in nature, for example, as per study performed by van Raaij [50], van Raaij and Gudmenstad [51] and Iwanowski et al. [52]. However, this study assumed that the wave-in-deck load acted together with the wave-on-jacket. Hence, it may give a conservative response, and this will in turn produce a conservative reserve strength ratio (RSR).
The conventional run of pushover analysis considers a 100-year crest height to calcu-late the reserve strength ratio. This study considers crest height at collapse by incorporat-ing wave-in-deck load and investigates the impact on structure response for fixed offshore platform. It is expected that the reserve strength ratio of the platform will be reduced and, hence, increase the probability of failure of the platform when the wave-in-deck load is considered in the pushover analysis. This method will assist the industry for decision making for outlining of action items as part of their business risk management.
2. Wave-in-Deck Load and Reserve Strength Ratio Wave-in-deck occurs when there is no deck clearance or air gap between the water
level and the bottom steel of topside structure when it is hit by the waves [43,44]. To avoid wave-in-deck, all offshore platforms need to be adequately designed by providing an al-lowance for the air gap [31]. If the air gap is expected to reduce over time, the lowest deck may be designed at a higher elevation or the equipment seated on the deck need to be designed to cater for the wave-in-deck load.
Pushover analysis, also known as ultimate strength analysis, is commonly used in structural reliability assessment to determine the reserve strength ratio (RSR) of an off-shore platform. The platform’s ability to withstand a specific environmental load will be checked, especially for an ageing platform. The load as advised by the International Or-ganization for Standardization, 2007, [44] is the 100-year environmental load.
The conventional run of pushover analysis only considers the 100-year design crest height for the ultimate collapse. However, when the RSR is higher, the wave height will also become higher [38]. However, no comprehensive study is carried out as to the effects of the wave-in-deck load, which are excluded during the RSR determination [38] as shown in Figure 3a. It is crucial to ensure that the RSR is not overly estimated, hence giving a false impression of the value. There is a possibility that the wave crest will reach the bot-tom steel of the deck structure, or even higher, and supposedly create a wave-in-deck scenario as shown in Figure 3b.
(a) (b)
Figure 3. Comparison of the conventional method of limiting the 100-year wave and current load with the inclusion of wave-in-deck load: (a) conventional method; (b) with inclusion of wave-in-deck load.
100-
year
wav
e an
d cu
rren
t lo
ad
100-
year
wav
e an
d cu
rren
t lo
ad
Wave-in-deck load
Figure 3. Comparison of the conventional method of limiting the 100-year wave and current load withthe inclusion of wave-in-deck load: (a) conventional method; (b) with inclusion of wave-in-deck load.
The background of the problem for the existing platform may be summarized basedon bow-tie diagram, which is widely used in risk analysis. It comprises fault trees andevent trees, which are connected to the hazardous event [53,54]. The fault trees are thecause of the event. It is divided into two, which are the hazard and the threat, while theevent trees are the consequences of the hazardous event. Figure 4 shows that the problemtriggered by one of the hazard or degradation issue is the field subsidence. It will lead

J. Mar. Sci. Eng. 2021, 9, 1027 5 of 18
to insufficient air gap and possible wave-in-deck. The control barrier that needs to beundertaken is to determine the structure response strength and RSR. The hazardous eventor the top event of the said hazard is the collapse of the platform.
J. Mar. Sci. Eng. 2021, 9, x FOR PEER REVIEW 5 of 19
The background of the problem for the existing platform may be summarized based on bow-tie diagram, which is widely used in risk analysis. It comprises fault trees and event trees, which are connected to the hazardous event [53,54]. The fault trees are the cause of the event. It is divided into two, which are the hazard and the threat, while the event trees are the consequences of the hazardous event. Figure 4 shows that the problem triggered by one of the hazard or degradation issue is the field subsidence. It will lead to insufficient air gap and possible wave-in-deck. The control barrier that needs to be under-taken is to determine the structure response strength and RSR. The hazardous event or the top event of the said hazard is the collapse of the platform.
Hazard Threat Control
Barrier
Top Event Recovery
Measure
Consequences
Figure 4. Bow-tie of existing jacket structure with field subsidence issue.
Other control barriers that may be considered are to perform site monitoring and to relocate the critical equipment in order to avoid the impact coming from the wave-in-deck. Right after the top event, the recovery measure needs to take place as soon as pos-sible, such as emergency response and the platform shutdown. The consequences of the platform collapsing are loss of life, injury to people, damage to assets and environment and damage reputation. The bow-tie is one health, safety, security and environment (HSSE) tool support for as low as reasonably practicable (ALARP) [55].
3. Methodology Reserve strength ratio (𝑅𝑆𝑅) is defined as a ratio between a platform collapse load
and a lateral environmental load, typically a 100-year return period (𝑅𝑃) load in terms of base shear or moment shear [5,25,56]. Therefore: 𝑅𝑆𝑅 = 𝐸 𝐸 (1)
where 𝑅𝑆𝑅 is the reserve strength ratio, 𝐸 is the base shear at the collapse of plat-form/ultimate capacity and 𝐸 is the base shear of 100-year return period (𝑅𝑃).
The USFOS software that has been widely adopted for pushover analysis considers the wave forces up to the true sea surface. The wave load is scaled up proportionally but not the wave height [21]. In order to quantify the effects of wave-in-deck load, the maxi-mum wave height at the collapse of the platform, ℎ is determined by using the equa-tion described by Ayob et al. [5] below: ℎ = 𝑅𝑆𝑅 ⁄ × ℎ (2)
Field Subsidence
Insufficient of Air Gap
Wave-in- Deck
Site Monitoring
Relocate Equipment
Determine Structure Re-
sponse Strength and 𝑅𝑆𝑅
Platform Collapsed
Emergency Response
Platform Shutdown
Damage to Asset
Damage to Environment
Injury to People
Loss of Life
Damage Reputation
Figure 4. Bow-tie of existing jacket structure with field subsidence issue.
Other control barriers that may be considered are to perform site monitoring and torelocate the critical equipment in order to avoid the impact coming from the wave-in-deck.Right after the top event, the recovery measure needs to take place as soon as possible,such as emergency response and the platform shutdown. The consequences of the platformcollapsing are loss of life, injury to people, damage to assets and environment and damagereputation. The bow-tie is one health, safety, security and environment (HSSE) tool supportfor as low as reasonably practicable (ALARP) [55].
3. Methodology
Reserve strength ratio (RSR) is defined as a ratio between a platform collapse loadand a lateral environmental load, typically a 100-year return period (RP) load in terms ofbase shear or moment shear [5,25,56]. Therefore:
RSR =Ecollapse
E100(1)
where RSR is the reserve strength ratio, Ecollapse is the base shear at the collapse of plat-form/ultimate capacity and E100 is the base shear of 100-year return period (RP).
The USFOS software that has been widely adopted for pushover analysis considersthe wave forces up to the true sea surface. The wave load is scaled up proportionallybut not the wave height [21]. In order to quantify the effects of wave-in-deck load, themaximum wave height at the collapse of the platform, hRSR is determined by using theequation described by Ayob et al. [5] below:
hRSR = RSR1/α × h100 (2)
where hRSR is the maximum wave height at the collapse of the platform, h100 is the 100-yearwave height, and α is the metocean constant, typically 1.7 to 2.0. In the absence of a moreexact value, α can be taken as 1.7. The hRSR is conservatively used to calculate the projectedarea of the wave-in-deck as explained in Equation (3).

J. Mar. Sci. Eng. 2021, 9, 1027 6 of 18
For this research, wave-in-deck load is determined by using the equation introducedby the International Organization for Standardization, 2007 [44]. This equation falls underthe silhouette approach. The wave-in-deck load, Etopsides:
Etopsides =12
ρwCd(αwkUw + αcbUc)2 × Aw (3)
where Etopsides is the wave-in-deck load, ρw is density of seawater, 1.025 MT/m3, Cd is theempirical drag coefficient, αwk is wave kinematic factor from met ocean data, Uw is thefluid velocity corresponding to crest height, αcb is the current blockage factors, Uc is thecurrent speed in line with the wave from met ocean data, and Aw is the projected area ofthe wave-in-deck. To avoid the overestimation of the RSR, the Aw is calculated from thebottom steel of cellar deck elevation up to the hRSR. Even though the wave-in-deck load istaken at the collapse of the platform, it may give a good indication of the RSR rather thanthe case without considering the wave-in-deck load.
Reliability-based design and assessment (RBDA) introduced by Shell has been selectedto calculate the probability of failure (POF) of the platform. The selected method adopts theconvolution method, which consists the long-term load distribution, typically the 100-year,1000-year and 10,000-year environmental loads. The equation presented in this section hasbeen extracted from a study performed by Efthymiou and van de Graff [57] and Mat Soomet al. [26]. The probability of failure can be written as follows:
POF =∫ ∞
0(1 − PE(x)).PR(x)dx (4)
where POF is the probability of failure, PE is the probability density function, and PR is theresistance probability density, Equation (4) can be rewritten as:
POF = A exp[−Rmean/E0]exp(
σR2/2E0
2)
(5)
where A and E0 is the environment constant of 0.01 × exp[2.3026/αL ] and αL/2.3026, re-spectively, with αL being the constant of linearity (i.e., 0.31–0.37), Rmean is the mean ofdistribution of structural strength, and σR is the standard deviation of the distribution ofstructural strength.
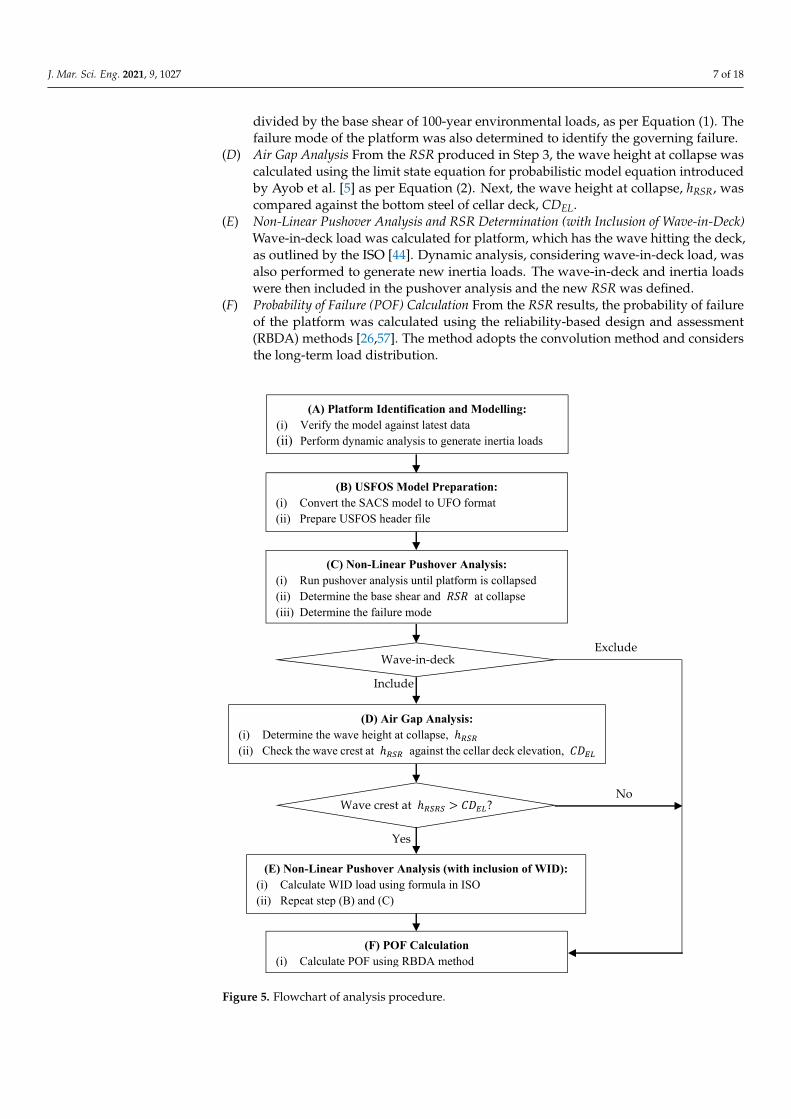
Figure 5 illustrates the overall analysis procedure (accounting for the effect of wave-in-deck load in the pushover analysis) for this study. The steps for calculating the reservestrength ratio (RSR) and probability of failure (POF) with the inclusion of wave-in-deck areas follows:
(A) Platform Identification and Modelling. Selected platform was verified against latestas-built drawings, weight control report and inspection report to ensure that theanalysis will represent the actual condition at site. Latest metocean data for 100-yearreturn period were utilized consisting of maximum wave height, h100, and associatedperiod, tass, and performed long-term distribution. Dynamic analysis was carried outto generate inertia loads. In this step, SACS software was used.
(B) USFOS Model Preparation The analysis model from step (A) was then converted to asuitable format, in this case, user-friendly (UFO) format for the subsequence pushoveranalysis [58]. The converted model, known as the “model.fem” file, was verified toensure that all items such as geometries, section properties and loading were properlyconverted. In this study, Struman software was used for the conversion. After that,the header file was prepared. The header, known as the “header.fem” file, consists ofsets of commands for the software to execute pushover analysis.
(C) Non-Linear Pushover Analysis and RSR Determination Two input files are required toperform the pushover analysis, which are model file and header file. The pushoveranalysis was performed by incrementing the 100-year environmental loads until theplatform collapses. The RSR was determined based on the base shear at collapse load
J. Mar. Sci. Eng. 2021, 9, 1027 7 of 18
divided by the base shear of 100-year environmental loads, as per Equation (1). Thefailure mode of the platform was also determined to identify the governing failure.
(D) Air Gap Analysis From the RSR produced in Step 3, the wave height at collapse wascalculated using the limit state equation for probabilistic model equation introducedby Ayob et al. [5] as per Equation (2). Next, the wave height at collapse, hRSR, wascompared against the bottom steel of cellar deck, CDEL.
(E) Non-Linear Pushover Analysis and RSR Determination (with Inclusion of Wave-in-Deck)Wave-in-deck load was calculated for platform, which has the wave hitting the deck,as outlined by the ISO [44]. Dynamic analysis, considering wave-in-deck load, wasalso performed to generate new inertia loads. The wave-in-deck and inertia loadswere then included in the pushover analysis and the new RSR was defined.
(F) Probability of Failure (POF) Calculation From the RSR results, the probability of failureof the platform was calculated using the reliability-based design and assessment(RBDA) methods [26,57]. The method adopts the convolution method and considersthe long-term load distribution.
J. Mar. Sci. Eng. 2021, 9, x FOR PEER REVIEW 8 of 19
Figure 5. Flowchart of analysis procedure.
4. Test Structure Specification Five platforms have been selected for this study, namely, PD4-40, PV3-88, PK4-88,
PP8-88 and PD4-130. The platforms are located at either Sarawak Operation (SKO) or Sa-bah Operation (SBO) as shown in Table 1. The types of platforms are two drilling, a vent, a compression and a production platform.
Table 1. Test structures specification.
No. Platform
Name Field Operation No. of
Leg Installation
Year
Water Depth As-Installed
(m)
Water Depth in 2015 (m)
1 PD4-40 Sabah Operation (SKO) Drilling 4 1980 40.3 40.4 PV3-88
Sarawak Operation (SKO) Vent 3 1982
88.4 93.7
2 PK4-88 Compression 4 1999 93.8 PP8-88 Production 8 1982 93.7
3 PD4-130 Sarawak Operation (SKO) Drilling 4 2002 129.9 132.8
(A) Platform Identification and Modelling: (i) Verify the model against latest data (ii) Perform dynamic analysis to generate inertia loads
(B) USFOS Model Preparation: (i) Convert the SACS model to UFO format (ii) Prepare USFOS header file
(C) Non-Linear Pushover Analysis: (i) Run pushover analysis until platform is collapsed (ii) Determine the base shear and 𝑅𝑆𝑅 at collapse (iii) Determine the failure mode
Wave-in-deck Exclude
(D) Air Gap Analysis: (i) Determine the wave height at collapse, ℎ (ii) Check the wave crest at ℎ against the cellar deck elevation, 𝐶𝐷
Wave crest at ℎ > 𝐶𝐷 ?
Yes
No
(E) Non-Linear Pushover Analysis (with inclusion of WID): (i) Calculate WID load using formula in ISO (ii) Repeat step (B) and (C)
(F) POF Calculation (i) Calculate POF using RBDA method
Include
Figure 5. Flowchart of analysis procedure.

J. Mar. Sci. Eng. 2021, 9, 1027 8 of 18
4. Test Structure Specification
Five platforms have been selected for this study, namely, PD4-40, PV3-88, PK4-88,PP8-88 and PD4-130. The platforms are located at either Sarawak Operation (SKO) orSabah Operation (SBO) as shown in Table 1. The types of platforms are two drilling, a vent,a compression and a production platform.
Table 1. Test structures specification.
No. PlatformName Field Operation No. of
LegInstallation
YearWater Depth
As-Installed (m)Water Depthin 2015 (m)
1 PD4-40 Sabah Operation(SKO) Drilling 4 1980 40.3 40.4
PV3-88Sarawak Operation
(SKO)
Vent 3 198288.4
93.72 PK4-88 Compression 4 1999 93.8
PP8-88 Production 8 1982 93.7
3 PD4-130 Sarawak Operation(SKO) Drilling 4 2002 129.9 132.8
The platforms have been selected based on three criteria. The first criterion is thesimilarity in terms of water depth during installation. The selected platforms are 3-legged,4-legged and 8-legged. The second criterion is the difference in terms of water depth, whichare from 40.3 m to 129.9 m with respect to mean sea level (MSL) at the time of installation.Those platforms that have the same number of legs are 4-legged platforms. PlatformPD4-130 is located at the deepest water depth of 129.9 m, whereas platform PD4-40 islocated at the shallowest water depth of 40.3 m at the time of installation. The remainingthree platforms are located at the water depth of 88.4 m at the time of installation.
The third criterion is based on the subsidence. Three out of five of the selectedplatforms are subsiding more than 5 m over time. The platforms are PV3-88, PK4-88 andPP8-88, which are located at the same field. The other two (2) platforms are PD4-130subsided by 2.864 m and PD4-40 subsided by 0.103 m in 2015. Hence, the air gap of theplatforms is also decreasing. These criteria are selected in order to see the impact of thepushover analysis with the inclusion of the wave-in-deck load. It is crucial to include thesubsidence in the analysis as the wave-in-deck is highly likely to occur at the platform.Detailed specification of the platforms is shown in Table 2.
Table 2. Detailed specifications of the platforms.
Features
Platform Description
PD4-40 PV3-88 PK4-88 PP8-88 PD4-130Design Safety Category Unmanned Unmanned Manned Manned Unmanned
Brace Type K-brace K-braceCombination of
X-brace andK-brace
K-brace X-brace
Number of Legs 4 (46.5ӯ) 3 (46.5ӯ) 4 (60ӯ) 8 (60ӯ) 4 (80ӯ)
Number of Pile4
(42”Ø)—ThroughLeg
3(42”Ø)—Through
Leg
4(54”Ø)—Through
Leg
8(54”Ø)—Through
Leg
8 (84”Ø)—SkirtPile
Number of Risers 4 (1 × 8”Ø and3 × 6”Ø) 2 (18”Ø) None 2 (1 × 30”Ø and
1 × 18”Ø)3 (2 × 24”Ø and
1 × 20”Ø)
Number of Caisson 1 (24ӯ) None 2 (30ӯ) 1 (24ӯ) 1 (30ӯ)
Boat Landing 1 1 None 2 2
Conductor 6 (2 × 36”Ø and4 × 26”Ø) None None None 12 (26”Ø)
Bridge Link None None 2 3 None

J. Mar. Sci. Eng. 2021, 9, 1027 9 of 18
Table 2. Cont.
Features
Platform Description
PD4-40 PV3-88 PK4-88 PP8-88 PD4-130
Deck Configuration2-Level Deck:Wireline Deck
and Cellar Deck
1-Level Deck:Cellar Deck
2-Level Deck with2-Modules:
Module SupportFrame Deck and
Cellar Deck
2-Level Deck:Upper Deck and
Cellar Deck
3-Level Deck:Helideck, MainDeck and Cellar
Deck
Material
CarbonSteel—Mild
Strength(248 MPa)
CarbonSteel—Mild
Strength(248 MPa)
CarbonSteel—High
Strength(345–355 MPa)
CarbonSteel—Mild
Strength(248 MPa)
CarbonSteel—High
Strength(340–355 MPa)
5. Results5.1. Platform Subsidence
Latest platform subsidence was calculated based on an air gap survey conducted in2015 (courtesy of Shell). The global positioning system (GPS) survey was used to obtainthe latest elevation of the platform, with respect to the mean sea level (MSL). The surveycampaign was split into two parts, which were platform levelling and platform lateralmovement. Two (2) sets of global navigation satellite system (GNSS) receivers and levellingequipment were used, and the survey data received in the field were processed usingthe Trimble Business Centre (TBC) software. The latest elevation acquired on site wascompared to as-built level during platform installation. Figure 6 shows the comparison ofcellar deck level in 2015, the as-built level at the time of installation and the total subsidenceof each platform.
J. Mar. Sci. Eng. 2021, 9, x FOR PEER REVIEW 10 of 19
compared to as-built level during platform installation. Figure 6 shows the comparison of cellar deck level in 2015, the as-built level at the time of installation and the total subsid-ence of each platform.
Figure 6. Platform subsidence.
From Figure 6, platform PD4-40 had the least subsidence, which may be due to min-imum reservoir depletion with the total subsidence of 0.103 m followed by platform PD4-130, which has a total subsidence of 2.864 m. It was also observed that platforms PV3-88, PK4-88 and PP8-88 have subsidence close to one another, with the maximum subsidence of 5.444 m. This was due to the location of the platforms, which were in the same field; hence, there was a possibility that the platforms were sharing the same reservoir. When the reservoir was depleted over time, it would have caused compaction and led to sub-sidence of the area.
5.2. Wave Height Air gap analysis was performed to determine whether there was a wave-in-deck is-
sue on the platforms based on the 𝑅𝑆𝑅 generated from pushover analysis. The limit state equation for a probabilistic model was used to calculate the maximum wave height at collapse, ℎ . From the ℎ , the wave crest height at collapse was calculated and com-pared with the bottom steel of the structure. Figure 7 shows the wave crest height at col-lapse and the bottom steel height of the platform.
0.002.004.006.008.00
10.0012.0014.0016.0018.0020.00
PD4-40 PV3-88 PK4-88 PP8-88 PD4-130
Cella
r Dec
k Le
vel (
m)
Platform Name
As-Built Cellar Deck Level (m) Cellar Deck Level in 2015 (m)
Subs
iden
ce =
5.3
08 m
Subs
iden
ce =
5.4
44 m
Subs
iden
ce =
0.1
03 m
Subs
iden
ce=
5.31
2m
Subs
iden
ce=
2.86
4m
Figure 6. Platform subsidence.
From Figure 6, platform PD4-40 had the least subsidence, which may be due tominimum reservoir depletion with the total subsidence of 0.103 m followed by platformPD4-130, which has a total subsidence of 2.864 m. It was also observed that platformsPV3-88, PK4-88 and PP8-88 have subsidence close to one another, with the maximumsubsidence of 5.444 m. This was due to the location of the platforms, which were in thesame field; hence, there was a possibility that the platforms were sharing the same reservoir.When the reservoir was depleted over time, it would have caused compaction and led tosubsidence of the area.

J. Mar. Sci. Eng. 2021, 9, 1027 10 of 18
5.2. Wave Height
Air gap analysis was performed to determine whether there was a wave-in-deckissue on the platforms based on the RSR generated from pushover analysis. The limitstate equation for a probabilistic model was used to calculate the maximum wave heightat collapse, hRSR. From the hRSR, the wave crest height at collapse was calculated andcompared with the bottom steel of the structure. Figure 7 shows the wave crest height atcollapse and the bottom steel height of the platform.
J. Mar. Sci. Eng. 2021, 9, x FOR PEER REVIEW 11 of 19
Figure 7. Comparison of bottom steel height and wave crest height at collapse.
Based on Figure 7, two of the platforms, namely, PK4-88 and PP8-88, as shaded, had wave-in-deck issues due to the wave crest heights at collapse being higher than the bottom steel of the decks. The wave crest heights at platforms PK4-88 and PP8-88 were found to be higher by 6.064 m and 3.720 m, respectively, from the bottom steel of the structures. So, the wave-in-deck loads should be included in the pushover analysis for these two plat-forms.
The other three platforms, namely, PD4-40, PV3-88 and PD4-130, which had wave crest heights lower than the bottom of steel and no wave-in-deck load, were included in the pushover analysis. The wave crest heights for platforms PD4-40, PV3-88 and PD4-130 were found to be lower by 3.211 m, 3.910 m and 5.530 m, respectively, from the bottom steel of the structures.
Sections 5.3–5.5 focuses on the platforms that had wave-in-deck issues; hence, only the results of platforms PK4-88 and PP8-88 as shaded in Figure 7 were compared. The results were inclusive of reserve strength ratio and probability of failure of the platform.
5.3. Wave-in-Deck Load Wave-in-deck load for platforms PK4-88 and PP8-88 were calculated using Equation
(3). As explained in Section 5.2, the wave crest height at collapse, ℎ , of both platforms was higher than the bottom of steel (BOS) of the structures. Hence, the wave-in-deck load was added in the subsequent pushover analysis. It assumed that the platforms were mod-erately equipped. The waves had been calculated using Stoke’s 5th wave theory. The cur-rent speeds were extracted from the metocean data. The detailed calculations are pre-sented in Table 3.
48.23
100.94109.85 107.77
141.11
0.00
20.00
40.00
60.00
80.00
100.00
120.00
140.00
160.00
PD4-40 PV3-88 PK4-88 PP8-88 PD4-130
Heig
ht w
ith re
spec
t to
mud
line
(m)
Platform Name
Wave Crest Height, Hcrest (m) Bottom of Steel Height (m)
Figure 7. Comparison of bottom steel height and wave crest height at collapse.
Based on Figure 7, two of the platforms, namely, PK4-88 and PP8-88, as shaded, hadwave-in-deck issues due to the wave crest heights at collapse being higher than the bottomsteel of the decks. The wave crest heights at platforms PK4-88 and PP8-88 were found to behigher by 6.064 m and 3.720 m, respectively, from the bottom steel of the structures. So, thewave-in-deck loads should be included in the pushover analysis for these two platforms.
The other three platforms, namely, PD4-40, PV3-88 and PD4-130, which had wavecrest heights lower than the bottom of steel and no wave-in-deck load, were included inthe pushover analysis. The wave crest heights for platforms PD4-40, PV3-88 and PD4-130were found to be lower by 3.211 m, 3.910 m and 5.530 m, respectively, from the bottomsteel of the structures.
Sections 5.3–5.5 focuses on the platforms that had wave-in-deck issues; hence, onlythe results of platforms PK4-88 and PP8-88 as shaded in Figure 7 were compared. Theresults were inclusive of reserve strength ratio and probability of failure of the platform.
5.3. Wave-in-Deck Load
Wave-in-deck load for platforms PK4-88 and PP8-88 were calculated using Equation (3).As explained in Section 5.2, the wave crest height at collapse, hRSR, of both platforms washigher than the bottom of steel (BOS) of the structures. Hence, the wave-in-deck load wasadded in the subsequent pushover analysis. It assumed that the platforms were moderatelyequipped. The waves had been calculated using Stoke’s 5th wave theory. The currentspeeds were extracted from the metocean data. The detailed calculations are presented inTable 3.

J. Mar. Sci. Eng. 2021, 9, 1027 11 of 18
Table 3. Wave-in-deck load calculation.
Item PK4-88 PP8-88
Deck width perpendicular to the wave (m) 32.000 55.860Distance between BOS and hRSR (m) 6.064 3.720
Density of seawater, ρw (MT/m3) 1.025 1.025Drag coefficient, Cd 2.000 2.000
Wave kinematic factor, αwk 1.000 1.000Fluid velocity corresponding to crest height, Uw (m/s) 10.225 9.238
Current blockage factors, αcb 1.000 1.000Current speed in line with the wave, Uc (m/s) 0.900 0.900
Projected area of the wave-in-deck, Aw (m2) 194.048 207.799Wave-in-deck load (MT) 2522.918 2231.533
5.4. Reserve Strength Ratio
Based on air gap analysis results, which were tabulated in the previous section, thepushover analysis for the platforms, which had the wave crest height higher than thebottom of steel, was rerun to include the wave-in-deck load. They were platforms PK4-88 and PP8-88. The reserve strength ratio versus global displacement are presented inFigures 8 and 9 for PK4-88 and PP8-88, respectively.
J. Mar. Sci. Eng. 2021, 9, x FOR PEER REVIEW 12 of 19
Table 3. Wave-in-deck load calculation.
Item PK4-88 PP8-88 Deck width perpendicular to the wave (m) 32.000 55.860
Distance between BOS and ℎ (m) 6.064 3.720 Density of seawater, 𝜌 (MT/m3) 1.025 1.025
Drag coefficient, 𝐶 2.000 2.000 Wave kinematic factor, 𝛼 1.000 1.000
Fluid velocity corresponding to crest height, 𝑈 (m/s) 10.225 9.238 Current blockage factors, 𝛼 1.000 1.000
Current speed in line with the wave, 𝑈 (m/s) 0.900 0.900 Projected area of the wave-in-deck, 𝐴 (m2) 194.048 207.799
Wave-in-deck load (MT) 2522.918 2231.533
5.4. Reserve Strength Ratio Based on air gap analysis results, which were tabulated in the previous section, the
pushover analysis for the platforms, which had the wave crest height higher than the bot-tom of steel, was rerun to include the wave-in-deck load. They were platforms PK4-88 and PP8-88. The reserve strength ratio versus global displacement are presented in Figure 8 and Figure 9 for PK4-88 and PP8-88, respectively.
(a) (b)
Figure 8. Global load versus global displacement for PK4-88: (a) PK4-88: without wave-in-deck load; (b) PK4-88: with wave-in-deck load.
(a) (b)
Figure 9. Global load versus global displacement for PP8-88: (a) PP8-88: without wave-in-deck load; (b) PP8-88: with wave-in-deck load.
0
1
2
3
4
5
0 0.5 1 1.5 2
Rese
rve
Stre
ngth
Rat
io
Global Displacement (m)
4.74
0
0.2
0.4
0.6
0.8
1
1.2
0 0.2 0.4 0.6 0.8
Rese
rve
Stre
ngth
Rat
io
Global Displacement (m)
0.57 × 6.58
00.5
11.5
22.5
33.5
44.5
0 0.5 1 1.5 2
Rese
rve
Stre
ngth
Rat
io
Global Displacement (m)
4.13
0
0.2
0.4
0.6
0.8
1
1.2
0 0.1 0.2 0.3
Rese
rve
Stre
ngth
Rat
io
Global Displacement (m)
0.41 × 3.85
Figure 8. Global load versus global displacement for PK4-88: (a) PK4-88: without wave-in-deck load; (b) PK4-88: withwave-in-deck load.
J. Mar. Sci. Eng. 2021, 9, x FOR PEER REVIEW 12 of 19
Table 3. Wave-in-deck load calculation.
Item PK4-88 PP8-88 Deck width perpendicular to the wave (m) 32.000 55.860
Distance between BOS and ℎ (m) 6.064 3.720 Density of seawater, 𝜌 (MT/m3) 1.025 1.025
Drag coefficient, 𝐶 2.000 2.000 Wave kinematic factor, 𝛼 1.000 1.000
Fluid velocity corresponding to crest height, 𝑈 (m/s) 10.225 9.238 Current blockage factors, 𝛼 1.000 1.000
Current speed in line with the wave, 𝑈 (m/s) 0.900 0.900 Projected area of the wave-in-deck, 𝐴 (m2) 194.048 207.799
Wave-in-deck load (MT) 2522.918 2231.533
5.4. Reserve Strength Ratio Based on air gap analysis results, which were tabulated in the previous section, the
pushover analysis for the platforms, which had the wave crest height higher than the bot-tom of steel, was rerun to include the wave-in-deck load. They were platforms PK4-88 and PP8-88. The reserve strength ratio versus global displacement are presented in Figure 8 and Figure 9 for PK4-88 and PP8-88, respectively.
(a) (b)
Figure 8. Global load versus global displacement for PK4-88: (a) PK4-88: without wave-in-deck load; (b) PK4-88: with wave-in-deck load.
(a) (b)
Figure 9. Global load versus global displacement for PP8-88: (a) PP8-88: without wave-in-deck load; (b) PP8-88: with wave-in-deck load.
0
1
2
3
4
5
0 0.5 1 1.5 2
Rese
rve
Stre
ngth
Rat
io
Global Displacement (m)
4.74
0
0.2
0.4
0.6
0.8
1
1.2
0 0.2 0.4 0.6 0.8
Rese
rve
Stre
ngth
Rat
io
Global Displacement (m)
0.57 × 6.58
00.5
11.5
22.5
33.5
44.5
0 0.5 1 1.5 2
Rese
rve
Stre
ngth
Rat
io
Global Displacement (m)
4.13
0
0.2
0.4
0.6
0.8
1
1.2
0 0.1 0.2 0.3
Rese
rve
Stre
ngth
Rat
io
Global Displacement (m)
0.41 × 3.85
Figure 9. Global load versus global displacement for PP8-88: (a) PP8-88: without wave-in-deck load; (b) PP8-88: withwave-in-deck load.

J. Mar. Sci. Eng. 2021, 9, 1027 12 of 18
For platform PK4-88, as shown in Figure 8a, the RSR without considering wave-in-deck load is 4.74. In order to calculate the RSR for the case with the inclusion ofwave-in-deck load, the RSR from Figure 8b needs to be multiplied by the ratio of the baseshear at collapse of the platform (e.g., which includes the wave-in-deck load) and baseshear of the 100-year return period. In this case, the ratio of the said base shear is 6.58,and this will bring the RSR with the inclusion of wave-in-deck load as 3.75. For platformPP8-88, as shown in Figure 9a, the RSR without considering wave-in-deck load is 4.13. Theratio of the base shear at collapse of the platform (e.g., which includes the wave-in-deckload) and base shear of the 100-year return period is 3.85. This will bring the RSR with theinclusion of wave-in-deck load to 1.58 after multiplying the ratio of the base shear with0.41 as shown in Figure 9b. The reserve strength ratio with and without the wave-in-deckloads are tabulated in Figure 10.
J. Mar. Sci. Eng. 2021, 9, x FOR PEER REVIEW 13 of 19
For platform PK4-88, as shown in Figure 8a, the RSR without considering wave-in-deck load is 4.74. In order to calculate the RSR for the case with the inclusion of wave-in-deck load, the RSR from Figure 8b needs to be multiplied by the ratio of the base shear at collapse of the platform (e.g., which includes the wave-in-deck load) and base shear of the 100-year return period. In this case, the ratio of the said base shear is 6.58, and this will bring the RSR with the inclusion of wave-in-deck load as 3.75. For platform PP8-88, as shown in Figure 9a, the RSR without considering wave-in-deck load is 4.13. The ratio of the base shear at collapse of the platform (e.g., which includes the wave-in-deck load) and base shear of the 100-year return period is 3.85. This will bring the RSR with the inclusion of wave-in-deck load to 1.58 after multiplying the ratio of the base shear with 0.41 as shown in Figure 9b. The reserve strength ratio with and without the wave-in-deck loads are tabulated in Figure 10.
Figure 10. Comparison of reserve strength ratio with and without inclusion of wave-in-deck load.
From Figure 10, it is observed that the reserve strength ratio with the inclusion of wave-in-deck load is lower if compared to the one without wave-in-deck load. For plat-form PK4-88, the RSR with and without wave-in-deck load are 3.75 and 4.74, respectively; whereas, for platform PP8-88, the RSR with and without wave-in-deck load are 1.58 and 4.13, respectively. In terms of percentage, the differences of the reserve strength ratio with and without wave-in-deck loads are 20.8% and 61.7% for platforms PK4-88 and PP8-88, respectively. It also found that the RSR with the inclusion of wave-in-deck load for plat-form PP8-88 did not meet the minimum required RSR of 2.14 as per the calculation adopted by Shell.
It was also found that platform PK4-88 had a higher RSR if compared to platform PP8-88. That is why the wave crest height at collapse for platform PK4-88 is higher than platform PP8-88. It is also observed that the wave-in-deck load significantly reduced the RSR of platform PP8-88. Even though the wave crest height at collapse for platform PP8-88 was lower if compared to platform PK4-88, the wave-in-deck load for platform PP8-88 was found to be higher. This was because platform PP8-88 had a higher projected wave-in-deck area as the platform was more prominent than platform PK4-88. Based on the bow-tie presented in Section 1, platform PP8-88 may collapse in the event of wave-in-deck and, hence, may lead to loss of life, injury to people, damage to asset and environment and damage reputation.
0.00
0.50
1.00
1.50
2.00
2.50
3.00
3.50
4.00
4.50
5.00
PK4-88 PP8-88
Rese
rve
Stre
ngth
Rat
io, R
SR
Platform NameReserve Strength Ratio - No Wave-in-Deck LoadReserve Strength Ratio - With Wave-in-Deck LoadMinimum Required Reserve Strength Ratio (Shell)
20.8%
61.7%
Figure 10. Comparison of reserve strength ratio with and without inclusion of wave-in-deck load.
From Figure 10, it is observed that the reserve strength ratio with the inclusion of wave-in-deck load is lower if compared to the one without wave-in-deck load. For platformPK4-88, the RSR with and without wave-in-deck load are 3.75 and 4.74, respectively;whereas, for platform PP8-88, the RSR with and without wave-in-deck load are 1.58 and4.13, respectively. In terms of percentage, the differences of the reserve strength ratio withand without wave-in-deck loads are 20.8% and 61.7% for platforms PK4-88 and PP8-88,respectively. It also found that the RSR with the inclusion of wave-in-deck load for platformPP8-88 did not meet the minimum required RSR of 2.14 as per the calculation adoptedby Shell.
It was also found that platform PK4-88 had a higher RSR if compared to platformPP8-88. That is why the wave crest height at collapse for platform PK4-88 is higher thanplatform PP8-88. It is also observed that the wave-in-deck load significantly reduced theRSR of platform PP8-88. Even though the wave crest height at collapse for platform PP8-88was lower if compared to platform PK4-88, the wave-in-deck load for platform PP8-88 wasfound to be higher. This was because platform PP8-88 had a higher projected wave-in-deckarea as the platform was more prominent than platform PK4-88. Based on the bow-tiepresented in Section 1, platform PP8-88 may collapse in the event of wave-in-deck and,
J. Mar. Sci. Eng. 2021, 9, 1027 13 of 18
hence, may lead to loss of life, injury to people, damage to asset and environment anddamage reputation.
5.5. Probability of Failure
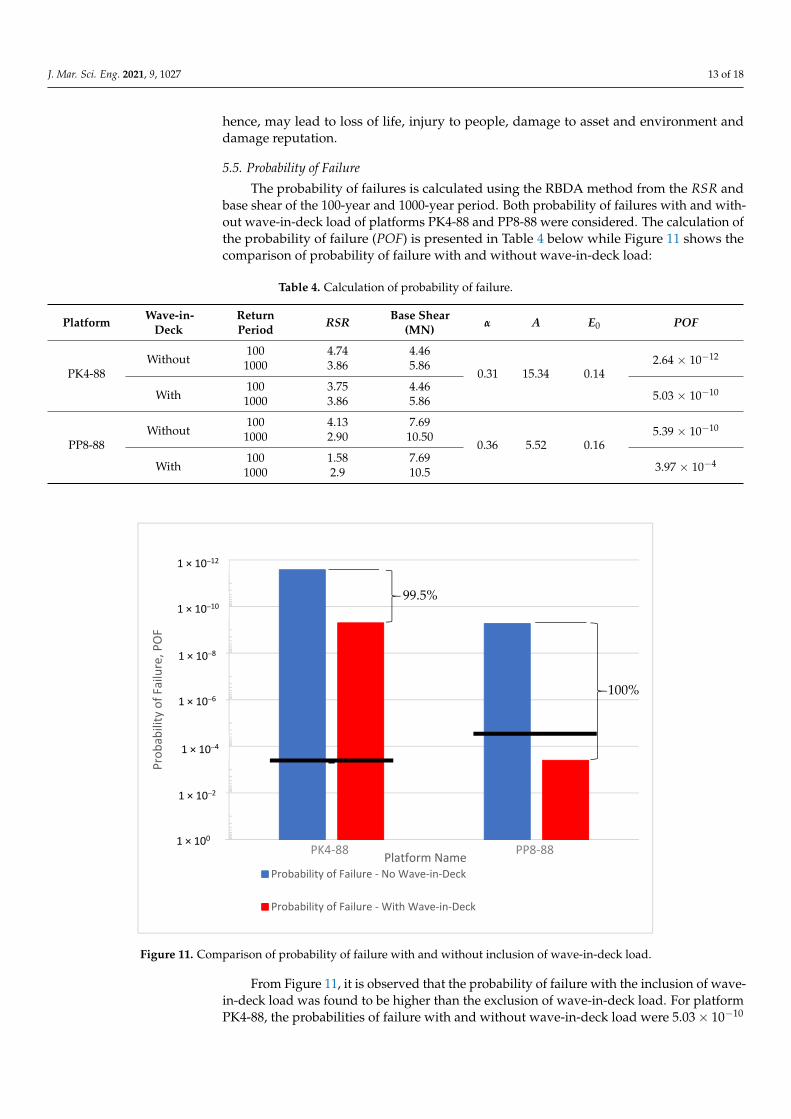
The probability of failures is calculated using the RBDA method from the RSR andbase shear of the 100-year and 1000-year period. Both probability of failures with and with-out wave-in-deck load of platforms PK4-88 and PP8-88 were considered. The calculation ofthe probability of failure (POF) is presented in Table 4 below while Figure 11 shows thecomparison of probability of failure with and without wave-in-deck load:
Table 4. Calculation of probability of failure.
Platform Wave-in-Deck
ReturnPeriod RSR Base Shear
(MN) α A E0 POF
PK4-88Without
100 4.74 4.46
0.31 15.34 0.142.64 × 10−12
1000 3.86 5.86
With100 3.75 4.46
5.03 × 10−101000 3.86 5.86
PP8-88Without
100 4.13 7.69
0.36 5.52 0.165.39 × 10−10
1000 2.90 10.50
With100 1.58 7.69
3.97 × 10−41000 2.9 10.5
J. Mar. Sci. Eng. 2021, 9, x FOR PEER REVIEW 14 of 19
5.5. Probability of Failure The probability of failures is calculated using the RBDA method from the 𝑅𝑆𝑅 and
base shear of the 100-year and 1000-year period. Both probability of failures with and without wave-in-deck load of platforms PK4-88 and PP8-88 were considered. The calcu-lation of the probability of failure (POF) is presented in Table 4 below while Figure 11 shows the comparison of probability of failure with and without wave-in-deck load:
Table 4. Calculation of probability of failure.
Platform Wave-in-Deck
Return Period RSR
Base Shear (MN)
𝜶 𝑨 𝑬𝟎 POF
PK4-88 Without
100 4.74 4.46
0.31 15.34 0.14 2.64 × 10⁻¹²
1000 3.86 5.86
With 100 3.75 4.46
5.03 × 10⁻¹⁰ 1000 3.86 5.86
PP8-88 Without
100 4.13 7.69
0.36 5.52 0.16 5.39 × 10⁻¹⁰
1000 2.90 10.50
With 100 1.58 7.69
3.97 × 10⁻⁴ 1000 2.9 10.5
Figure 11. Comparison of probability of failure with and without inclusion of wave-in-deck load.
From Figure 11, it is observed that the probability of failure with the inclusion of wave-in-deck load was found to be higher than the exclusion of wave-in-deck load. For platform PK4-88, the probabilities of failure with and without wave-in-deck load were 5.03 × 10 and 2.64 × 10 , respectively. For platform PP8-88, the probabilities of fail-ure with and without wave-in-deck load were 3.97 × 10 and 5.39 × 10 , respec-tively. In terms of percentage, the differences in the probabilities of failure with and with-
1.00E-12
1.00E-10
1.00E-08
1.00E-06
1.00E-04
1.00E-02
1.00E+00
Prob
abili
ty o
f Fai
lure
, POF
Platform NameProbability of Failure - No Wave-in-Deck
Probability of Failure - With Wave-in-Deck
PK4-88 PP8-88
99.5%
100%
1 × 10⁻¹²
1 × 10⁻¹⁰
1 × 10⁻⁸
1 × 10⁻⁶
1 × 10⁻⁴
1 × 10⁻²
1 × 100
Figure 11. Comparison of probability of failure with and without inclusion of wave-in-deck load.
From Figure 11, it is observed that the probability of failure with the inclusion of wave-in-deck load was found to be higher than the exclusion of wave-in-deck load. For platformPK4-88, the probabilities of failure with and without wave-in-deck load were 5.03 × 10⁻¹⁰

J. Mar. Sci. Eng. 2021, 9, 1027 14 of 18
and 2.64 × 10⁻¹², respectively. For platform PP8-88, the probabilities of failure with andwithout wave-in-deck load were 3.97 × 10⁻⁴ and 5.39 × 10⁻¹⁰, respectively. In terms ofpercentage, the differences in the probabilities of failure with and without wave-in-deckload are 99.5% and 100.0% for platforms PK4-88 and PP8-88, respectively. It means that thechances of the platform failing or collapsing were bigger when the wave-in-deck load wasconsidered in the pushover analysis.
If compared to the requirement of the International Organization for Standardization,2007 [44], the probability of failure with and without wave-in-deck load for platformPK4-88 was higher than the minimum required probability of failure of 5.00 × 10⁻⁴, whichwas set by the L2 installation requirement. For platform PP8-88, the probability of failurewithout wave-in-deck load was higher than the minimum required probability of failure of3.00 × 10−5, which was set by the L1 installation requirement. However, with the inclusionof wave-in-deck, the platform PP8-88 did not meet the minimum requirement.
It was also observed that the probability of failure with the inclusion of wave-in-deckload for platform PP8-88 was significantly reduced if compared to platform PK4-88. Thiswas because the wave-in-deck load for platform PP8-88 was higher if compared to platformPK4-88. It also means that the chances of the platform failing were higher if the platform ishit by the wave-in-deck load.
For platform PP8-88, it is recommended that further assessment is to be made tominimize the impact of wave-in-deck. The current study adopted the wave-in-deck loadcalculation based on the silhouette method as recommended by the ISO [44]. It is suggestedthat the component method [45,46] or computational fluid dynamic method [28,47–49] areto be utilized to calculate the wave-in-deck load in order to reduce the conservatism of thesilhouette method. The risk of platform damage may be reduced via modification such aslocalized protection or relocation of exposed sensitive equipment or via procedures suchas production shut-in and temporary evacuation during storm season [59,60]. Anothermethod that was successfully performed was by jacking-up the platform in order toincrease the air gap of platform [61]. This is crucial so that the effect of wave-in-deckcan be minimized to avoid major damage or failure to offshore platforms as reported byBotelho et al. [62], Puskar et al. [63] and Forristall [64].
6. Conclusions
Pushover analysis has been widely used to calculate the RSR of the platforms. It hasalso been used in structural reliability assessment to calculate the probability of failure ofoffshore platforms. Even though the wave-in-deck load may lead to a disastrous effect, ithas been excluded in the RSR determination. Some studies had limited the RSR up to thebottom steel of platforms only [38,39]. Generally, there are two methods of calculating thewave-in-deck load, which are the silhouette method and component method. In this study,the silhouette method introduced by the International Organization for Standardization,2007, [44] was adopted to calculate the wave-in-deck load.
No comprehensive study has been made on the effects of the wave-in-deck load as theconventional pushover analysis does not take the wave-in-deck load into account whencalculating the RSR. This is because the forces are calculated up to the wave crest height ofthe 100-year environmental load only. It is noted that high RSR has a high wave crest atcollapse; hence, the wave crest may be higher than the wave crest height of the 100-yearenvironmental load and bottom steel of structures that supposedly create a wave-in-deck.Thus, the wave-in-deck load cannot be ignored because it will lead to an overestimation ofthe RSR value.
Five fixed offshore platforms with water depth ranging from 40.3 m to 129.9 m havebeen selected for this study. The platforms are platforms PD4-40, PV3-88, PK4-88, PP8-88and PD4-130. Three of the platforms, which are platforms PV3-88, PK4-88 and PP8-88, aresubsiding more than 5 m. Three out of five platforms have past their initial design life of30 years, which are platforms PP8-88, PV3-88 and PD4-40.
J. Mar. Sci. Eng. 2021, 9, 1027 15 of 18
A procedure to consider the wave-in-deck load in determining the RSR from thepushover analysis has been introduced in this research. Air gap analysis is performedbased on the RSR value from the conventional pushover analysis. It is crucial to determinewhether the wave crest at collapse of the platform is higher than the bottom steel of thestructure or lower than that. If the wave crest at collapse of the platform is higher thanthe bottom steel of the structure, another run of pushover analysis needs to be performed.Based on the results, two of the platforms, which are platforms PK4-88 and PP8-88, havewave crest heights higher than the bottom steel of the structures. This time, the wave-in-deck loads need to be considered in the analysis of those two platforms. The silhouettemethod, as explained by the International Organization for Standardization, 2007, [44] isadopted in this research to calculate the wave-in-deck load.
From this research, it was found that the RSR with the inclusion of the wave-in-deckload is lower than without the wave-in-deck load with a maximum difference of 61.7%.Based on the reliability-based design and assessment (RBDA), the probability of failure(POF) is higher with the inclusion of the wave-in-deck load with a maximum differenceof 100.0%. Higher POF means that the chances of the platform to fail or collapse aremore significant with the addition of the wave-in-deck load. It can be concluded that it iscrucial to include the wave-in-deck load in the RSR determination in order to avoid theoverestimation of the value.
The results given in this research may be further investigated based on the followingrecommendations:
1. The metocean constant, α used in this research may be further studied depending onthe location of the offshore platform. Currently, α is conservatively taken as equal to1.7, as suggested by Ayob et al. [5], for Malaysia waters of fixed offshore platform.
2. Current study focuses on horizontal wave-in-deck only. It is recommended thatinvestigation on the impact of vertical wave-in-deck load should also be carried out.
3. Current study does not consider the dynamic effect of the structure when exposed tothe wave-in-deck load as the analysis is performed under static non-linear pushover.
Author Contributions: N.U.A. compiled the literature, proposed the methodology, performed theanalysis and wrote the paper. M.K.A.H., N.I.M.Z., E.M.S., N.A.M. and S.Z.A.S.A. supervised,reviewed and provided input for the literature and verified the findings. All authors have read andagreed to the published version of the manuscript.
Funding: The paper is financially supported by the Ministry of Higher Education under FRGS (Regis-tration Proposal No: FRGS/1/2018/TK01/UTM/02/15; FRGS/1/2019/TK01/UTM/02/17) and Uni-versiti Teknologi Malaysia (Registration Proposal No: Q.K130000.2456.09G36; Q.K130000.2456.09G41),which is gratefully acknowledged.
Institutional Review Board Statement: Not applicable.
Informed Consent Statement: Not applicable.
Data Availability Statement: Not applicable.
Acknowledgments: The authors would like to acknowledge the support of the academic and in-dustrial establishments they represent. This research has been undertaken by the leading authorwhile working for TechnipFMC Miri Office, Miri, Sarawak, Malaysia and would like to express hergratitude to the co-author from Sarawak Shell Berhad for the data and advice support.
Conflicts of Interest: The authors declare no conflict of interest.
References1. Seong, C.K.; Hong, T.Y. A Review of Offshore Oilfields Development in Malaysia. In Proceedings of the SPE Oil and Gas India
Conference, Kuala Lumpur, Malaysia, 20–22 March 1995.2. Sorkhabi, R. Miri 1910: The Centenary of oil Discovery in Sarawak. Geoexpro 2010, 7, 44–49.3. Zawawi, N.A.W.A.; Liew, M.S.; Na, K.L. Decommissioning of offshore platform: A sustainable framework. In 2012 IEEE
Colloquium on Humanities, Science and Engineering (CHUSER); IEEE: Piscataway, NJ, USA, 2012; pp. 26–31.

J. Mar. Sci. Eng. 2021, 9, 1027 16 of 18
4. PETRONAS. PETRONAS Activity Outlook 2021–2023. In Annual Report; PETRONAS, 2020. Available online: https://www.petronas.com/sites/default/files/PAO/PETRONAS-Activity-Outlook-2021-2023.pdf (accessed on 13 September 2021).
5. Ayob, M.S.; Kajuputra, A.E.; Wong, B.S. Global Ultimate Strength Assessment for Existing Offshore Jacket Structures. InProceedings of the Off-shore Technology Conference Asia, Kuala Lumpur, Malaysia, 25–28 March 2014.
6. Fazeres-Ferradosa, T.; Rosa-Santos, P.; Taveira-Pinto, F.; Vanem, E.; Carvalho, H.; Correia, J.A.F.D.O. Editorial: Advanced researchon offshore structures and foundation design: Part 1. Proc. Inst. Civ. Eng. Marit. Eng. 2019, 172, 118–123. [CrossRef]
7. Fazeres-Ferradosa, T.; Rosa-Santos, P.; Taveira-Pinto, F.; Pavlou, D.; Gao, F.-P.; Carvalho, H.; Oliveira-Pinto, S. Preface: AdvancedResearch on Offshore Structures and Foundation Design: Part 2. Proc. Inst. Civ. Eng. Marit. Eng. 2020, 173, 96–99. [CrossRef]
8. Zaki, N.M.; Abu Husain, M.; Najafian, G. Extreme structural response values from various methods of simulating wave kinematics.Ships Offshore Struct. 2014, 11, 1–16. [CrossRef]
9. Lopez-Ortega, A.; Bayon, R.; Arana, J.L. Evaluation of Protective Coatings for Offshore Applications. Corrosion and Tribocor-rosionBehaviour in Synthetic Seawater. Surf. Coat. Technol. 2018, 349, 1083–1097.
10. Kang, B.J.; Kim, J.H.; Kim, Y. Engineering Criticality Analysis on an Offshore Structure using the First and Second-OrderReli-ability Method. Int. J. Nav. Archit. Ocean. Eng. 2016, 8, 577–588. [CrossRef]
11. Yu, Z.; Amdahl, J. A review of structural responses and design of offshore tubular structures subjected to ship impacts. OceanEng. 2018, 154, 177–203. [CrossRef]
12. Fazeres-Ferradosa, T.; Chambel, J.; Taveira-Pinto, F.; Rosa-Santos, P.; Taveira-Pinto, F.; Giannini, G.; Haerens, P. Scour Protectionsfor Offshore Foundations of Marine Energy Harvesting Technologies: A Review. J. Mar. Sci. Eng. 2021, 9, 297. [CrossRef]
13. Ng, S.M.; Khan, R.; Isnadi, B.; Lee, L.A.; Saminal, S.N. A Holistic Approach to Life Extension of Fixed Offshore Platforms inMalaysian Waters. In Proceedings of the International Petroleum Technology Conference, Beijing, China, 26–28 March 2019.
14. Hokstad, P.; Håbrekke, S.; Johnsen, R.; Sangesland, S. Ageing and Extension for Offshore Facilities in General and for SpecificSystems. In SINTEF Technology and Society; SINTEF Technology and Society: Trondheim, Norway, 2010.
15. Abu Husain, M.; Zaki, N.M.; Mallahzadeh, H.; Najafian, G. Short-term probability distribution of the extreme values of offshorestructural response by an efficient time simulation technique. Ships Offshore Struct. 2014, 11, 1–14. [CrossRef]
16. Mukhlas, N.A.; Zaki, N.I.M.; Abu Husain, M.K.; Najafian, G. Efficient derivation of extreme offshore structural response exposedto random wave loads. Ships Offshore Struct. 2018, 13, 719–733. [CrossRef]
17. Ersdal, G.; Ho¨rnlund, E. Assessment of Offshore Structures for Life Extension. In Proceedings of the 27th International Conferenceon Offshore Mechanics and Arctic Engineering, Estoril, Portugal, 15–20 June 2008; pp. 277–284.
18. Zaki, N.M.; Abu Husain, M.; Najafian, G. Extreme structural responses by nonlinear system identification for fixed offshoreplatforms. Ships Offshore Struct. 2018, 13, 251–263. [CrossRef]
19. Zaman, M.M.; Abdulraheem, A.; Roegiers, J. Reservoir Compaction and Surface Subsidence in the North Sea Ekofisk Field. InSubsidence Due to Fluid Withdrawal. Development in Petroleum Science; Chilingarian, G.V., Donaldson, E.C., Yen, T.F., Eds.; ElsevierScience B.V.: Amsterdam, The Netherlands, 1995; Volume 41, pp. 373–423.
20. Nagel, N. Compaction and subsidence issues within the petroleum industry: From wilmington to ekofisk and beyond. Phys.Chem. Earth Part A Solid Earth Geod. 2001, 26, 3–14. [CrossRef]
21. Amdahl, J.; Holmas, T. ISUM for Offshore Frame Structures. Ocean. Eng. 2016, 7. [CrossRef]22. Hansen, K.; Gudmestad, O.T. Reassessment of Jacket Type of Platforms Subject to Wave-in-Deck Forces: Current Practice and
Future Development. In Proceedings of the Eleventh (2001) International Offshore and Polar Engineering Conference, Stavanger,Norway, 17–22 June 2001.
23. Kurian, V.J.; Voon, M.C.; Wahab, M.M.A.; Liew, M.S. System Reliability Assessment of Existing Jacket Platform in Malay-sianWaters. Res. J. Appl. Sci. Eng. Technol. 2014, 8, 2305–2314. [CrossRef]
24. Elsayed, T.; El-Shaib, M.; Gbr, K. Reliability of fixed offshore jacket platform against earthquake collapse. Ships Offshore Struct.2016, 11, 167–181. [CrossRef]
25. Singh, D.; Panneerselvam, N.; Kumar, D. Reliability Analysis of Strength of Offshore Jackets in Indian Western Offshore. InProceedings of the SPE Oil and Gas India Conference and Exhibition, Mumbai, India, 24–26 November 2015.
26. Mat Soom, E.; Abu Husain, M.K.; Mohd Zaki, N.I.; Azman, N.U.; Najafian, G. Reliability-Based Design and Assessment forLifetime Extension of Ageing Offshore Structures. In Proceedings of the 35th International Conference on Ocean, Offshore andArctic Engineering, Busan, Korea, 19–24 June 2016; p. V003T002A044.
27. Libot, M.A. Wave-in-Deck Loading. In Proceedings of the 1st Civil and Environmental Engineering Student Conference, ImperialCollege, London, UK, 25–26 June 2012.
28. Lubeena, R.; Gupta, V. Hydrodynamic Wave Loading on Offshore Structures. In Proceedings of the All Days; Society of PetroleumEngineers (SPE), Houston, TX, USA, 6–9 May 2013.
29. Fayazi, A.; Aghakouchak, A. Reliability Based Assessment of Existing Fixed Offshore Platforms Located in the Persian Gulf. Int.J. Marit. Technol. 2015, 4, 37–50.
30. Øistein, H.; Johannessen, T.B.; Birknes-Berg, J. Airgap and Wave in Deck Impact Statistics. Ocean. Eng. 2016, 7. [CrossRef]31. Ma, L. The Effective Modelling of Wave-In-Deck Loads. Ph.D. Thesis, Department of Civil and Environmental Engineering,
Imperial College London, London, UK, 2018.32. Scharnke, J.; Lindeboom, R.; Duz, B. Wave-in-deck Impact Loads in Relation with Wave Kinematics. In Proceedings of the ASME
2017 36th International Conference on Ocean, Offshore and Arctic Engineering, Trondheim, Norway, 25–30 June 2017.
J. Mar. Sci. Eng. 2021, 9, 1027 17 of 18
33. Wang, Y.; Mallahzadeh, H.; Abu Husain, M.K.; Mohd Zaki, N.I.; Najafian, G. Probabilistic Modelling of Extreme OffshoreStructural Response Due to Random Wave Loading. In Proceedings of the 32nd International Conference on Ocean, Offshore andArctic Engineering, Nantes, France, 9–14 June 2013; p. V02BT02A007.
34. Abu Husain, M.; Zaki, N.M.; Najafian, G. Derivation of the Probability Distribution of Extreme Values of Offshore StructuralResponse by Efficient Time Simulation Method. Open Civ. Eng. J. 2013, 7, 261–272. [CrossRef]
35. Abu Husain, M.; Zaki, N.M.; Najafian, G. Prediction of offshore structural response extreme values by three different approachesof efficient time simulation technique. Ships Offshore Struct. 2016, 12, 1–12. [CrossRef]
36. Abdussamie, N.; Drobyshevski, Y.; Ojeda, R.; Thomas, G.; Amin, W. Experimental investigation of wave-in-deck impact eventson a TLP model. Ocean Eng. 2017, 142, 541–562. [CrossRef]
37. Vanem, E.; Fazeres-Ferradosa, T.; Rosa-Santos, P.; Taveira-Pinto, F. Statistical description and modelling of extreme ocean waveconditions. Proc. Inst. Civ. Eng. Marit. Eng. 2019, 172, 124–132. [CrossRef]
38. Golafshani, A.A.; Hossein, E.; Vahid, B.; Tore, H. Assessment of Offshore Platforms under Extreme Waves by ProbabilisticIncremental Wave Analysis. J. Constr. Steel Res. 2011, 67, 759–769. [CrossRef]
39. Mat Soom, E.; Abu Husain, M.K.; Mohd Zaki, N.I.; Mohd Nor, M.N.K.; Ayob, M.S.; Najafian, G. Global Ultimate StrengthAssessment (GUSA) for Lifetime Extension of Ageing Offshore Structures. In Proceedings of the Twenty-Fifth InternationalOcean and Polar Engineering Conference, Kona, HI, USA, 21–26 June 2015.
40. Ayob, M.S.; Mukherjee, K.; Kajuputra, A.E.; Wong, B.S.; Salleh, F.M. Requalification of Offshore Jacket Structures in Ma-laysianWaters. In Proceedings of the Offshore Technology Conference Asia, Kuala Lumpur, Malaysia, 25–28 March 2014.
41. Tromans, P.S.; van de Graaf, J.W. A Substantiate Risk Assessment of a Jacket Structure. In Proceedings of the Offshore TechnologyConference, Houston, TX, USA, 4–7 May 1992.
42. Dalane, J.I.; Haver, S. Requalification of an Unmanned Jacket Structure Using Reliability Methods. In Proceedings of the OffshoreTechnology Conference, Houston, TX, USA, 1–4 May 1995.
43. American Petroleum Institute. Recommended Practice for Planning, Designing, and Constructing Fixed Offshore Platforms—WorkingStress Design; American Petroleum Institute: Washington, DC, USA, 2010.
44. International Organization for Standardization. Petroleum and Natural Gas Industries—Fixed Steel Offshore Structures; HIS: Geneva,Switzerland, 2007.
45. Kaplan, P.; Murray, J.; Yu, W.C. Theoretical Analysis of Wave Impact Forces on Platform Deck Structures. In Proceedings of the14th International Conference on Offshore Mechanics and Artic Engineering, Copenhagen, Denmark, 18–22 June 1995.
46. Finnigan, T.D.; Petrauskas, C. Wave-in-Deck Forces. In Proceedings of the Seventh International Offshore and Polar EngineeringConference, Honolulu, HI, USA, 25–30 May 1997.
47. Iwanowski, B.; Grigorian, H.; Scherf, I. Subsidence of the Ekofisk Platforms: Wave in Deck Impact Study. Various Wave Mod-elsand Computational Method. In Proceedings of the 21st International Conference on Offshore Mechanics and Artic Engineering,Oslo, Norway, 23–28 June 2002.
48. Abdussamie, N.; Thomas, G.; Amin, W.; Ojeda, R. Wave-in-Deck Forces on Fixed Horizontal Decks of Offshore Platforms. InProceedings of the ASME 33rd International Conference on Ocean, Offshore and Arctic Engineering, San Francisco, CA, USA,8–13 June 2014.
49. Chen, Y.; Wu, Y.; Bahuguni, A.; Gullman-Strand, J.; Zhang, Y.; Stewart, G.; Lv, X. Advances in Computational Hydrodynam-icsApplied to Wave-in-Deck. In Proceedings of the Offshore Technology Conference Asia, Kuala Lumpur, Malaysia, 22–25 March2016.
50. Van Raaij, K. Dynamic Behaviour of Jackets Exposed to Wave-in-Deck Forces. Ph.D. Thesis, University of Stavanger, Stavanger,Norway, 2005.
51. Van Raaij, K.; Gudmestad, O.T. Wave-in-deck loading on fixed steel jacket decks. Mar. Struct. 2007, 20, 164–184. [CrossRef]52. Iwanowski, B.; Vestbostad, T.; Lefranc, M. Wave-in-Deck Load on a Jacket Platform, CFD Calculations Compared with Experi-
ments. In Proceedings of the 33rd International Conference on Offshore Mechanics and Artic Engineering, San Francisco, CA,USA, 8–13 June 2014.
53. Lu, L.; Liang, W.; Zhang, L.; Zhang, H.; Lu, Z.; Shan, J. A comprehensive risk evaluation method for natural gas pipelines bycombining a risk matrix with a bow-tie model. J. Nat. Gas Sci. Eng. 2015, 25, 124–133. [CrossRef]
54. Vileiniskis, M.; Remenyte-Prescott, R. Quantitative risk prognostics framework based on Petri Net and Bow-Tie models. Reliab.Eng. Syst. Saf. 2017, 165, 62–73. [CrossRef]
55. Valeur, J.R. Integrated HSE ALARP Assessment—Reducing HSE Risk and Impacts in Same Processes. In Proceedings of the SPEMiddle East Health, Safety, Environment & Sustainable Development Conference and Exhibition, Doha, Qatar, 22–24 September2014.
56. Wan Abdul Majid, W.M.; Haji Hashim, A.R.; Embong, M. Determination of Structural Reserve Strength Ratio (RSR) of an ExistingOffshore Structure. In Proceedings of the Eigth (1998) International Offshore and Polar Engineering Conference, Motreal, QC,Canada, 24–29 May 1998.
57. Efthymiou, M.; van de Graaf, J.W. Reliability and (Re)Assessment of Fixed Steel Structures. In Proceedings of the ASME 201130th International Conference on Ocean, Offshore and Arctic Engineering, Rotterdam, The Netherlands, 19–24 June 2011.
58. SINTEF Group. USFOS Getting Started. In Marintek, Structural Engineering; SINTEF Group: Trondheim, Norway, 2001.

J. Mar. Sci. Eng. 2021, 9, 1027 18 of 18
59. Gebara, J.M.; Dolan, D.; Pawsey, S.; Jeanjean, P.; Dahl-Stamnes, K. Assessment of Offshore Platforms Under Subsidence—Part I:Approach. J. Offshore Mech. Arct. Eng. 2000, 122, 260–266. [CrossRef]
60. Jha, A.K.; Kiciman, O.K.; Gebara, J.M.; Stahl, B.; Dahl-Stamnes, K.H. Assessment of Offshore Platforms Under Subsidence—PartII: Analysis and Results. J. Offshore Mech. Arct. Eng. 2000, 122, 267–273. [CrossRef]
61. Smith, A.G.; Smith, T.E.; Monshaugen, T. Ekofisk Subsidence: Conceptual and Design Considerations Along the Road to Jack-ing.In Proceedings of the Offshore Technology Conference, Houston, TX, USA, 2–5 May 1988.
62. Botelho, D.L.R.; Ullmann, R.R.; Chancellor, D.P.; Versowsky, P.E. A Survey of The Structural Damage Caused by HurricaneAndrew on Some of The Platforms Located in The South Timbalier Area. In Proceedings of the Offshore Technology Conference,Houston, TX, USA, 2–5 May 1994.
63. Puskar, F.; Spong, R.; Ku, A.; Gilbert, R.; Choi, Y. Assessment of fixed offshore platform performance in Hurricane Ivan. InProceedings of the Offshore Technology Conference, Houston, TX, USA, 1–4 May 2006.
64. Forristall George, Z. Wave Crest Heights and Deck Damage in Hurricanes Ivan, Katrina, and Rita. In Proceedings of the OffshoreTechnology Conference, Houston, TX, USA, 30 April–3 May 2007.
Related Documents