Spectral imaging of the retina DJ Mordant 1 , I Al-Abboud 2 , G Muyo 2 , A Gorman 2 , A Sallam 1 , P Ritchie 3 , AR Harvey 2 and AI McNaught 1,4 Abstract Introduction The work described here involved the use of a modified fundus camera to obtain sequential hyperspectral images of the retina in 14 normal volunteers and in 1 illustrative patient with a retinal vascular occlusion. Methods The paper describes analysis techniques, which allow oximetry within retinal vessels; these results are presented as retinal oximetry maps. Results Using spectral images, with wavelengths between 556 and 650 nm, the mean oxygen saturation (OS) value in temporal retinal arterioles in normal volunteers was 104.3 ( ± 16.7), and in normal temporal retinal venules was 34.8 (±17.8). These values are comparable to those quoted in the literature, although, the venular saturations are slightly lower than those values found by other authors; explanations are offered for these differences. Discussion The described imaging and analysis techniques produce a clinically useful map of retinal oximetric values. The results from normal volunteers and from one illustrative patient are presented. Further developments, including the recent development of a ‘snapshot’ spectral camera, promises enhanced non-invasive retinal vessel oximetry mapping. Eye (2011) 25, 309–320; doi:10.1038/eye.2010.222 Keywords: spectral; hyperspectral; oximetry; retinal oximetry; retinal artery occlusion Introduction Spectroscopy is a well-established tool used in the analysis of a material through identification of the spectral signatures of its constituents. Spectral imaging extends the usefulness of spectroscopy by combining spectroscopy with imaging, thereby providing both spectral and spatial information. Spectral imaging requires sensitive detectors and powerful computers to enable fast processing of images. Its use has expanded from remote sensing for both civilian and military purposes, to laboratory-based applications for biological imaging, such as cellular spectral imaging and oximetry. Spectral imaging systems record a stack of monochromatic images onto a two-dimensional detector array, such as a charge-coupled device (CCD); multiple images are collected over multiple wavelengths forming a ‘spectral data cube’. Spectral imaging systems incorporate a range of strategies to enable collection of the multiple monochromatic images. There has been widespread application of spectral imaging systems in applications ranging from cytogenetics and 1–4 pathology 5 to oncology. 6,7 The use of spectral imaging to perform blood oximetry, exploiting the different spectral characteristics of oxygenated (HbO 2 ) vs deoxygenated haemoglobin (Hb) has been described in a variety of clinical applications, such as assessing tissue perfusion, 8–10 microvascular disease in diabetes, 11 and sickle cell anaemia. 12 Principles of blood oximetry The development of the photoelectric cell enabled the quantification of light absorption, which contributed to the development of the spectrophotometer. As a result, the spectrophotometric study of the extinction coefficients (a measurement of how much light is absorbed by a substance at a given wavelength) of reduced Hb and oxyhaemoglobin was made possible; these measurements are central to the technique of oximetry. The first studies of the spectra of undiluted haemolysed and whole blood were undertaken by Drabkin 13,14 , who demonstrated the applicability of the Lambert–Beer law in determining the OS of blood. The Lambert–Beer law, in transmission blood oximetry, assumes that for any given wavelength of light, its absorption is dependent on the extinction Received: 5 November 2010 Accepted in revised form: 22 November 2010 1 Ophthalmology Department, Gloucestershire Eye Unit, Cheltenham General Hospital, Gloucestershire Hospitals NHS Foundation Trust, Cheltenham, UK 2 School of Engineering and Physical Sciences, Heriot–Watt University, Edinburgh, UK 3 Anaesthetics Department, Gloucestershire Hospitals NHS Foundation Trust, Cheltenham, UK 4 Cranfield University, Bedfordshire, UK Correspondence: AI McNaught, Ophthalmology Department, Gloucestershire Eye Unit, Cheltenham General Hospital, Gloucestershire Hospitals NHS Foundation Trust Sandford Road, Cheltenham, Gloucestershire, GL53 7AN, UK. Tel: þ 01 24 227 2527; Fax: þ 01 24 225 3816. E-mail: andy.mcnaught@ btopenworld.com Eye (2011) 25, 309–320 & 2011 Macmillan Publishers Limited All rights reserved 0950-222X/11 www.nature.com/eye CAMBRIDGE OPHTHALMOLOGICAL SYMPOSIUM

Welcome message from author
This document is posted to help you gain knowledge. Please leave a comment to let me know what you think about it! Share it to your friends and learn new things together.
Transcript
Spectral imaging ofthe retina
DJ Mordant1, I Al-Abboud2, G Muyo2,
A Gorman2, A Sallam1, P Ritchie3, AR Harvey2
and AI McNaught1,4
Abstract
Introduction The work described here
involved the use of a modified fundus
camera to obtain sequential hyperspectral
images of the retina in 14 normal volunteers
and in 1 illustrative patient with a retinal
vascular occlusion.
Methods The paper describes analysis
techniques, which allow oximetry within
retinal vessels; these results are presented
as retinal oximetry maps.
Results Using spectral images, with
wavelengths between 556 and 650 nm, the
mean oxygen saturation (OS) value in
temporal retinal arterioles in normal
volunteers was 104.3 (±16.7), and in normal
temporal retinal venules was 34.8 (±17.8).
These values are comparable to those quoted
in the literature, although, the venular
saturations are slightly lower than those
values found by other authors; explanations
are offered for these differences.
Discussion The described imaging and
analysis techniques produce a clinically useful
map of retinal oximetric values. The results
from normal volunteers and from one
illustrative patient are presented. Further
developments, including the recent
development of a ‘snapshot’ spectral camera,
promises enhanced non-invasive retinal
vessel oximetry mapping.
Eye (2011) 25, 309–320; doi:10.1038/eye.2010.222
Keywords: spectral; hyperspectral; oximetry;
retinal oximetry; retinal artery occlusion
Introduction
Spectroscopy is a well-established tool used in
the analysis of a material through identification
of the spectral signatures of its constituents.
Spectral imaging extends the usefulness of
spectroscopy by combining spectroscopy with
imaging, thereby providing both spectral and
spatial information. Spectral imaging requires
sensitive detectors and powerful computers to
enable fast processing of images. Its use has
expanded from remote sensing for both civilian
and military purposes, to laboratory-based
applications for biological imaging, such
as cellular spectral imaging and oximetry.
Spectral imaging systems record a stack of
monochromatic images onto a two-dimensional
detector array, such as a charge-coupled device
(CCD); multiple images are collected over
multiple wavelengths forming a ‘spectral data
cube’. Spectral imaging systems incorporate a
range of strategies to enable collection of the
multiple monochromatic images. There has
been widespread application of spectral
imaging systems in applications ranging from
cytogenetics and1–4 pathology5 to oncology.6,7
The use of spectral imaging to perform blood
oximetry, exploiting the different spectral
characteristics of oxygenated (HbO2) vs
deoxygenated haemoglobin (Hb) has been
described in a variety of clinical applications,
such as assessing tissue perfusion,8–10
microvascular disease in diabetes,11 and
sickle cell anaemia.12
Principles of blood oximetry
The development of the photoelectric cell
enabled the quantification of light absorption,
which contributed to the development of the
spectrophotometer. As a result, the
spectrophotometric study of the extinction
coefficients (a measurement of how much
light is absorbed by a substance at a given
wavelength) of reduced Hb and
oxyhaemoglobin was made possible; these
measurements are central to the technique of
oximetry. The first studies of the spectra of
undiluted haemolysed and whole blood were
undertaken by Drabkin13,14, who demonstrated
the applicability of the Lambert–Beer law in
determining the OS of blood. The Lambert–Beer
law, in transmission blood oximetry, assumes
that for any given wavelength of light, its
absorption is dependent on the extinction
Received: 5 November 2010Accepted in revised form:22 November 2010
1Ophthalmology Department,
Gloucestershire Eye Unit,
Cheltenham GeneralHospital, Gloucestershire
Hospitals NHS Foundation
Trust, Cheltenham, UK
2School of Engineering and
Physical Sciences,Heriot–Watt University,
Edinburgh, UK
3Anaesthetics Department,
Gloucestershire Hospitals
NHS Foundation Trust,Cheltenham, UK
4Cranfield University,
Bedfordshire, UK
Correspondence:
AI McNaught, Ophthalmology
Department, GloucestershireEye Unit, Cheltenham General
Hospital, Gloucestershire
Hospitals NHS Foundation
Trust Sandford Road,Cheltenham, Gloucestershire,
GL53 7AN, UK.
Tel: þ 01 24 227 2527;Fax: þ 01 24 225 3816.
E-mail: andy.mcnaught@
btopenworld.com
Eye (2011) 25, 309–320& 2011 Macmillan Publishers Limited All rights reserved 0950-222X/11
www.nature.com/eyeC
AM
BR
IDG
EO
PH
TH
AL
MO
LO
GIC
AL
SY
MP
OS
IUM
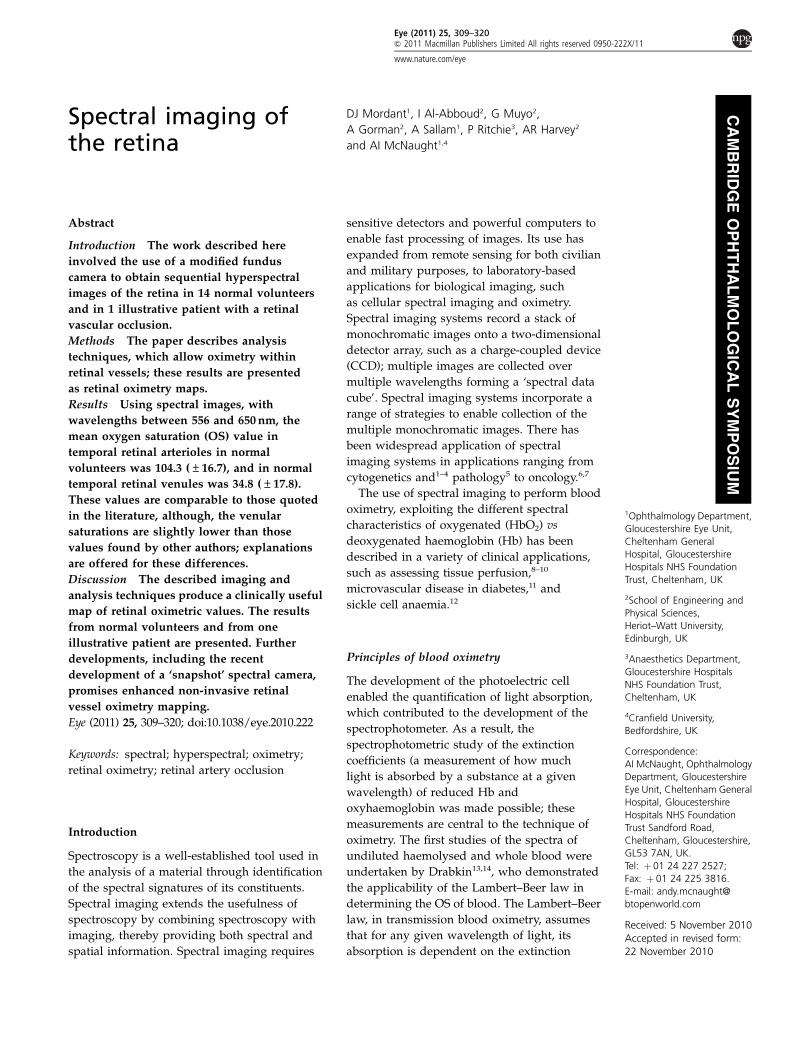
coefficient of the blood solution (e), its concentration or
haematocrit (c), and the distance (d) the light has to travel
through the solution (path length):
IT ¼ Io10�ecd;
where IT is the intensity of light transmitted through
a solution and Io is the intensity of incident light.
The optical density (OD) of a solution is a measure
of its attenuation, and is defined by:
OD ¼ � log10
IT
Io¼ ecd:
Therefore, the OD of a solution of blood is a function of
its extinction coefficient, concentration, and the path
length the light has to travel. The main absorbing
component of human blood is Hb, therefore, its
extinction coefficient is assumed to be equal to that of
Hb, although this is an approximation as it neglects
scattering by the structure of red blood cells.
Kramer and Elam15 were able to demonstrate the linear
relationship between the OS of blood and the absorption
of red and infrared wavelengths of light. This finding
was pivotal in the development of clinical oximeters.
Matthes and Gross16,17 were the first to demonstrate the
use of an isobestic wavelength and an oxygen-sensitive
wavelength in the red and infrared regions to
compensate for variables, such as the haematocrit, path
length, and light intensity. This technique of measuring
the blood OS using an isobestic and an oxygen-sensitive
wavelength is the basis of clinical dual-wavelength
oximetry used today. The integration of optical
plethsmography (analysis of the pulsatile component of
the arterial cycle) with oximetry enabled the
development of pulse oximeters, which are capable of
measuring the arterial OS by isolating the arterial signal
from the venous, bone, and tissue components.18 The
calibration of pulse oximeters is performed using data
acquired from normal subjects during induced hypoxia.
Unsurprisingly, these calibration tests were carried out at
arterial blood gas saturations of greater than 70%, the
lowest tolerable state of systemic oxygenation in humans.
At OSs below 70%, the calibration has been estimated by
linear interpolation, therefore, the accuracy below this
level is questionable.
Principles of retinal oximetry
Retinal oximetry requires an imaging system, which
captures images of the retina using multiple wavelengths
of light. Image analysis of this spectral image allows the
OD of the retinal vessels to be estimated at several
discrete wavelengths. The OD at a retinal location is
obtained by calculating the ratio of the measured
reflected light intensity adjacent to the target retinal
vessel relative to the reflected light intensity at the centre
of the retinal vessel:
ODvessel ¼ � log10
IV
IR;
where IV and IR are the intensity of light reflected
from the retinal vessel and adjacent retina, respectively.
The OD of the retinal vessels at various wavelengths
can subsequently be used to calculate the OS (Figure 1).
Various approaches have been undertaken to
non-invasively measure the OS of blood in retinal
blood vessels. Gloster19 measured changes in choroidal
reflectometry with altered oxygenation. Laing20
developed a ‘choroidal eye oximeter’ to measure
the OS of choroidal blood. Hickam et al21 described a
photographic method to estimate the OS of the retinal
veins in humans. Delori et al22 described a method
for determining the OS in retinal vessels using a
three-wavelength photoelectric oximeter; this comprised
a fundus camera integrated with three interference
filters, a photomultiplier, and a photocathode. The
accuracy of the OS calculations was reported to be most
accurate in the range of 50–100% OS, but in the range
between 0 and 50% there was a tendency towards
overestimation of the OS. Delori et al23 later applied the
three-wavelength oximetry technique in conjunction
with laser Doppler velocimetry to study the effects of
neurogenic optic atrophy with associated inner retinal
degeneration on oxygen delivery to the retina. In eyes
with optic atrophy, the mean venous OS was reported to
be significantly higher in both temporal (P¼ 0.028) and
nasal (P¼ 0.001) veins compared with the fellow eyes.
400 500 600 700 800 900 1000102
103
104
105
106
Ext
inct
ion
Coe
ff (1
/cm
M)
WAVELENGTH (NM)
Hb
HbO2
Figure 1 The molar extinction coefficients of deoxyhaemo-globin (Hb) and oxyhaemoglobin (HbO2) derivatives as afunction of wavelength.
Retinal vessel oximetryDJ Mordant et al
310
Eye
Beach et al24 developed a retinal imaging system using
two wavelengths of light to measure the OS in the retinal
vasculature of diabetic subjects without clinical evidence
of diabetic retinopathy during normoglycaemia and
hyperglycaemia. Schweitzer et al developed an imaging
ophthalmospectrometer, which consisted of a modified
fundus camera with an attached spectrograph. The
instrument illuminated the retina with a small
(40mm� 1.5 mm) slit of light. In vivo measurements of
retinal vessel OS were performed using the oximetry
algorithm in 30 eyes of 28 healthy Caucasian subjects.
The mean OS in 126 retinal arteries and 139 retinal veins
were 92.2±4.1 and 57.9±9.9%, respectively. The central
retinal venous OS was higher in patients with age-related
macular degeneration compared with the controls.25
A study on the OS in the retinal vessels of patients
with primary open-angle glaucoma (POAG) using the
imaging ophthalmospectrometer were performed by
Michelson et al. Retinal arteriolar OS in eyes with normal-
tension POAG (89.7±5.4%) was significantly lower than
the control group (P¼ 0.006). Retinal venular OSs and
arteriovenous differences in eyes with normal-tension
POAG and high-tension POAG were not significantly
different to the control eyes.26 The two-wavelength
oximetry technique described by Beach et al24 was
adopted by Stefansson and co-workers who developed a
retinal oximeter. Retinal vessel OSs of 16 normal eyes
were compared at room air and during hyperoxia
(100% OS). Significant differences in the retinal vessel
OSs were demonstrated. In the transition from normoxia
to hyperoxia, the mean retinal arteriolar OS increased
from 96±9 to 101±8% (P¼ 0.0027), and the retinal
venules increased from 55±14 to 78±15% (Po0.0001).
This experiment demonstrated that the retinal oximeter
was capable of detecting oximetric changes in the retinal
vessels during hyperoxia.27 A similar dual wavelength
retinal oximeter to that reported by Hammer et al used
the same concept of retinal oximetry described by Beach
et al. The retinal oximeter comprised of a fundus camera
(Carl Zeiss Meditec, Jena, Germany) with an attached
dual-wavelength filter, which enabled the transmission of
light at wavelengths of 548±10 and 610±10 nm (FWHM)
to be recorded onto a colour CCD. The ODRs at the two
wavelengths were used to calculate the OS. The mean
(±SD) arteriolar and venular OSs were 98±10.1 and
65±11.7%, respectively. Inhalation of 100% oxygen
increased the mean arteriolar and venular OS by 2 and
7%, respectively. The oximetry system was applied to
study the OS in diabetic patients. Venular OS increased
with the severity of diabetic retinopathy with a mean OS
(±SD) of 69±7% in subjects with mild non-proliferative
DR and 75±8% in subjects with proliferative DR.28
The application of a Fourier transform spectral
imaging system to quantify the oximetric status of
the retina with ischaemia was reported in a study of
human subjects with retinal vein occlusions.29 More
recently, the Fourier transform spectral retinal imaging
system was used to compare the OS of the retinal tissues
and blood vessels around the optic disc in normal eyes,
and eyes with open-angle glaucoma.30 Overall, 15 eyes
with low-tension glaucoma and 41 eyes with high-
tension glaucoma were compared with 20 normal eyes.
The average OS of the juxtapapillary retinal tissues
in eyes with normal-tension glaucoma (78±8%) and
high-tension glaucoma (82±10%) were reported to
be significantly lower than in normal eyes (88±8%;
P¼ 0.002 and P¼ 0.039, respectively).
Materials and methods
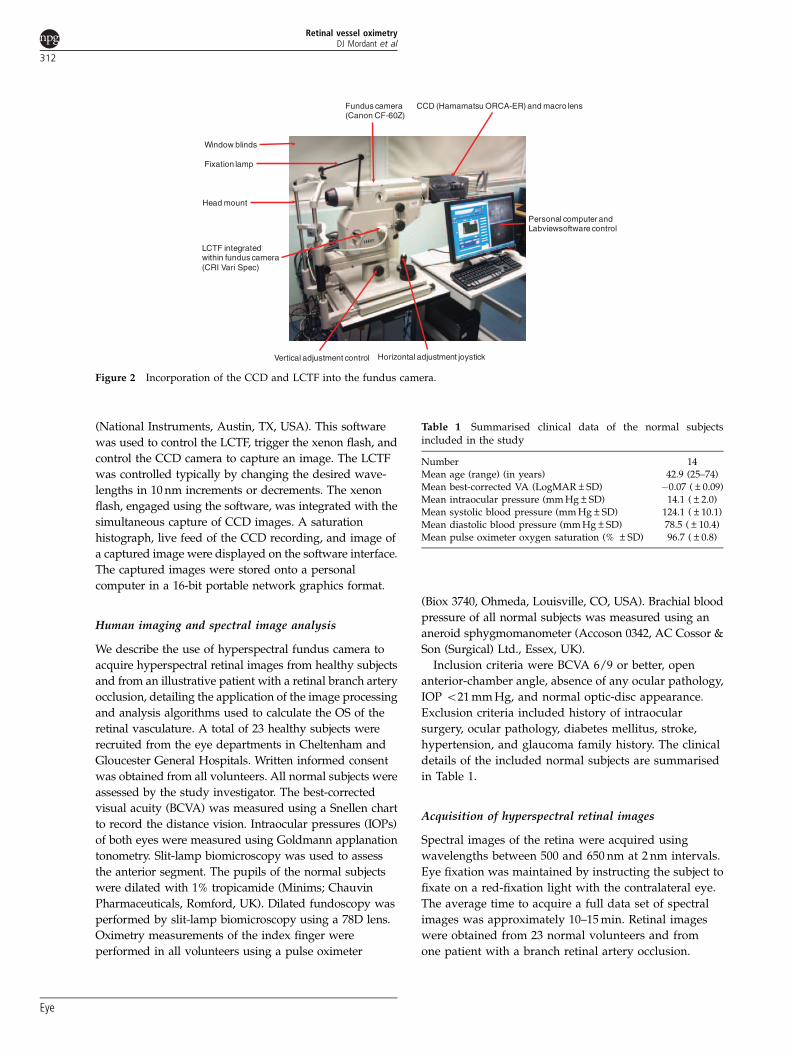
Hyperspectral fundus camera
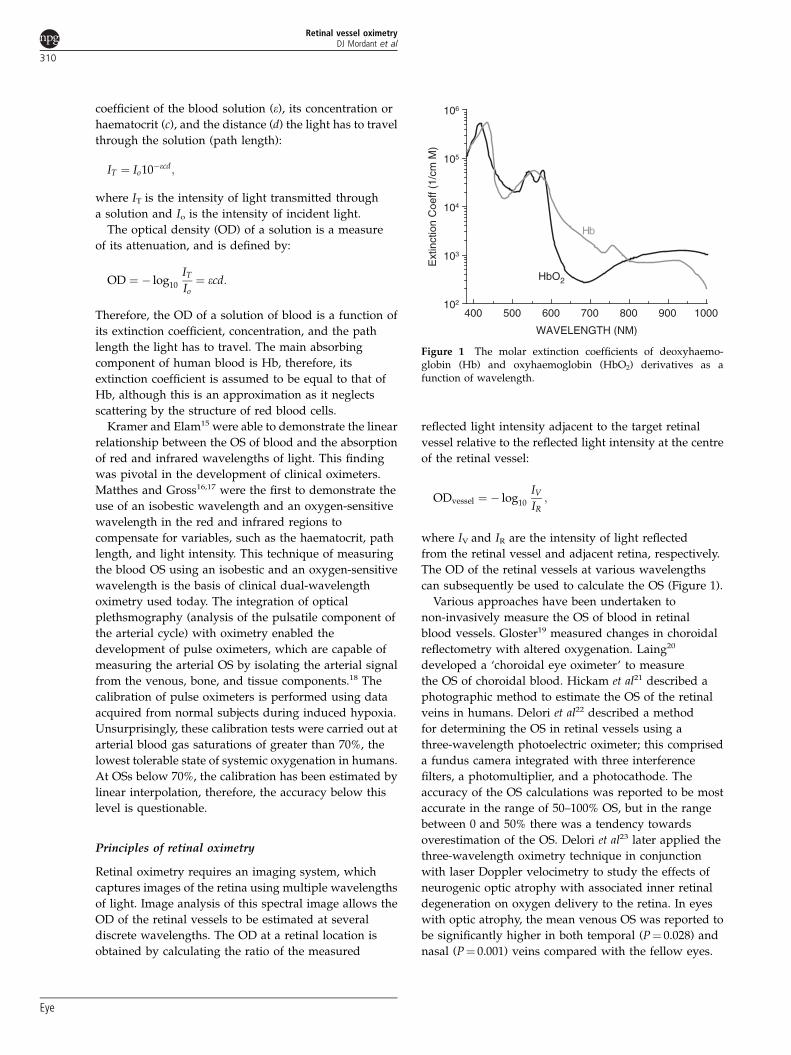
The hyperspectral imaging system was built around a
commercial mydriatic fundus camera (Canon CF-60Z,
Tokyo, Japan), with a number of modifications to allow
integration of a liquid crystal tunable filter (LCTF) into
the optical path of the camera (Figure 2). This enabled
illumination of the retina using a number of user-selected
wavelengths of visible light. The LCTF chosen to be
incorporated into the fundus camera was a CRI VariSpec
(Woburn, MA, USA). The LCTF filter is able to transmit
wavelengths between the visible and near-infrared region
(420–720 nm) with a wavelength-dependent bandwidth of
nominally 10 nm. Importantly, the LCTF is electronically
tunable, enabling fast random access of the desired
wavelength via a personal computer, contains no moving
parts, and has an operating ambient temperature range
between 10 and 401C. The LCTF was integrated in an
optimised position within the optical path of the incident
light of the fundus camera. A low-noise CCD camera
(Hamamatsu ORCA-ER, Hamamatsu Photonics KK,
Hamamatsu City, Japan) was incorporated into the
fundus camera to enable the electronic capture of retinal
images. The CCD has a high resolution of approximately
1.3 million pixels and a dynamic range of 12 bits. The
CCD is cooled to reduce dark current, noise, and thermal
drift, and has a high-quantum efficiency in the visible and
near-infrared wavelengths. A linear polariser is attached
to the front of the CCD to reduce a fixed-pattern artifact
caused by the specular reflection from the two surfaces of
the objective lens within the fundus camera. Specular
reflections from within the eye are also attenuated.
A macro lens is inserted between the CCD and the fundus
camera to maintain a field of view of approximately
401 onto the CCD detector chip with dimensions of
6.6� 8.9 mm2 (Figure 2).
The hyperspectral imaging system is controlled with
a customised software programmed using LabView
Retinal vessel oximetryDJ Mordant et al
311
Eye
(National Instruments, Austin, TX, USA). This software
was used to control the LCTF, trigger the xenon flash, and
control the CCD camera to capture an image. The LCTF
was controlled typically by changing the desired wave-
lengths in 10 nm increments or decrements. The xenon
flash, engaged using the software, was integrated with the
simultaneous capture of CCD images. A saturation
histograph, live feed of the CCD recording, and image of
a captured image were displayed on the software interface.
The captured images were stored onto a personal
computer in a 16-bit portable network graphics format.
Human imaging and spectral image analysis
We describe the use of hyperspectral fundus camera to
acquire hyperspectral retinal images from healthy subjects
and from an illustrative patient with a retinal branch artery
occlusion, detailing the application of the image processing
and analysis algorithms used to calculate the OS of the
retinal vasculature. A total of 23 healthy subjects were
recruited from the eye departments in Cheltenham and
Gloucester General Hospitals. Written informed consent
was obtained from all volunteers. All normal subjects were
assessed by the study investigator. The best-corrected
visual acuity (BCVA) was measured using a Snellen chart
to record the distance vision. Intraocular pressures (IOPs)
of both eyes were measured using Goldmann applanation
tonometry. Slit-lamp biomicroscopy was used to assess
the anterior segment. The pupils of the normal subjects
were dilated with 1% tropicamide (Minims; Chauvin
Pharmaceuticals, Romford, UK). Dilated fundoscopy was
performed by slit-lamp biomicroscopy using a 78D lens.
Oximetry measurements of the index finger were
performed in all volunteers using a pulse oximeter
(Biox 3740, Ohmeda, Louisville, CO, USA). Brachial blood
pressure of all normal subjects was measured using an
aneroid sphygmomanometer (Accoson 0342, AC Cossor &
Son (Surgical) Ltd., Essex, UK).
Inclusion criteria were BCVA 6/9 or better, open
anterior-chamber angle, absence of any ocular pathology,
IOP o21 mm Hg, and normal optic-disc appearance.
Exclusion criteria included history of intraocular
surgery, ocular pathology, diabetes mellitus, stroke,
hypertension, and glaucoma family history. The clinical
details of the included normal subjects are summarised
in Table 1.
Acquisition of hyperspectral retinal images
Spectral images of the retina were acquired using
wavelengths between 500 and 650 nm at 2 nm intervals.
Eye fixation was maintained by instructing the subject to
fixate on a red-fixation light with the contralateral eye.
The average time to acquire a full data set of spectral
images was approximately 10–15 min. Retinal images
were obtained from 23 normal volunteers and from
one patient with a branch retinal artery occlusion.
Fundus camera(Canon CF-60Z)
CCD (Hamamatsu ORCA-ER) and macro lens
Head mount
Window blinds
Fixation lamp
Vertical adjustment control Horizontal adjustment joystick
Personal computer and Labviewsoftware control
LCTF integratedwithin fundus camera(CRI Vari Spec)
Figure 2 Incorporation of the CCD and LCTF into the fundus camera.
Table 1 Summarised clinical data of the normal subjectsincluded in the study
Number 14Mean age (range) (in years) 42.9 (25–74)
Mean best-corrected VA (LogMAR±SD) �0.07 (±0.09)
Mean intraocular pressure (mm Hg±SD) 14.1 (±2.0)
Mean systolic blood pressure (mm Hg±SD) 124.1 (±10.1)
Mean diastolic blood pressure (mm Hg±SD) 78.5 (±10.4)
Mean pulse oximeter oxygen saturation (% ±SD) 96.7 (±0.8)
Retinal vessel oximetryDJ Mordant et al
312
Eye

Results I
Qualitative features of the retinal blood vessels
in spectral images of the retina
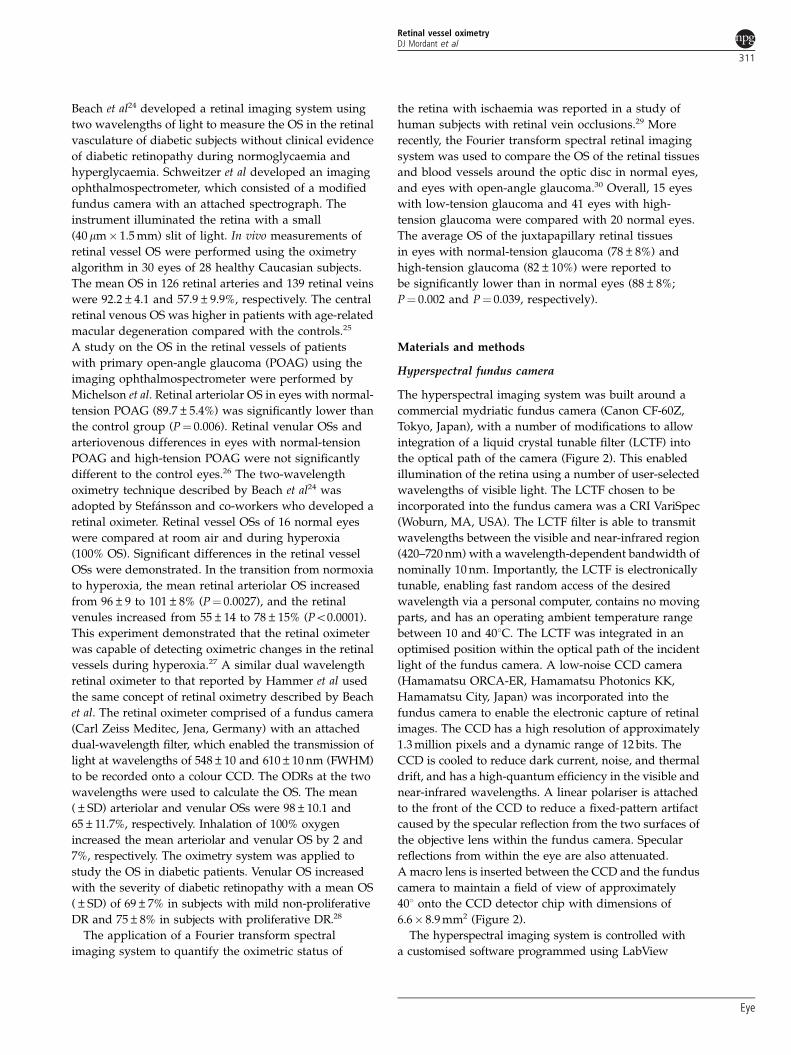
Spectral images of the retina revealed characteristic
features of the retinal blood vessels. First, the retinal
arterioles (Figure 3, red arrow heads) become less
optically dense compared with the retinal venules
(Figure 3, blue arrow heads) at wavelengths greater than
590 nm. This feature is consistent with the respective
extinction coefficients of HbO2 and deoxyhaemoglobin;
the OD of HbO2 is lower than that of deoxyhaemoglobin
between 600 and 650 nm. Second, the macular branches
of the retinal venules also appear to be less optically
dense than the first-degree retinal venules, suggesting
that the macular branches of the retinal venules appear to
have relatively higher OSs than the first-degree venular
vessels.
Results II
Processing of hyperspectral retinal images
The specific image processing algorithms that were
applied to the retinal images are described in the
following sections:
Image registration
The image registration method used a cross-correlation
technique, which measures the degree of similarity
between two images. A reference image is chosen,
usually at 580 nm, in which the OD of the arterioles
and venules are similar, and both demonstrate relatively
high contrast relative to the retinal background. All of
the other spectral retinal images are aligned to the
coordinates of the reference image. The maximum
cross-correlation within each image is searched for by
rotating and translating the images, and comparing with
the reference image. The cross-correlation techniques
require features within each image to be similar in
appearance, irrespective of the wavelength. However, the
appearance of the spectral retinal images change with
wavelength (Figure 3). Hence, a number of preprocessing
steps were implemented during the image registration
process. First, sequential spectral retinal images were
acquired such that the main features of the retinal images
(optic disc and large retinal vessels) were located in
approximately at the same position in the image field.
Second, the vascular network and the optic disc were
used as features within each image, and enhanced to
enable accurate cross-correlation between the reference
retinal image and the sequential spectral images. These
features were enhanced using customised spatial-
frequency passband and edge detection (Laplacian or
Gaussian) filters. Some image series could not be
co-registered because of poor image quality, poor focus,
and/or excessive movement between individual spectral
images in the series; these image series were discarded.
Vessel detection and tracking
The coordinates of the centreline of the retinal
vasculature were calculated by manually detecting the
620 nm 630 nm
600 nm 610 nm
580 nm 590 nm
560 nm 570 nm
Figure 3 The appearances of the arterioles and venules at nineselected wavelengths in the dark calibrated images of the retina ina normal subject. At wavelengths 4600 nm, arterioles (red arrows)are less optically dense compared with the venules (blue arrows).
Retinal vessel oximetryDJ Mordant et al
313
Eye
retinal blood vessels and applying a semi-automated
vessel-tracking routine. The vessel-tracking technique
is based on a Fast-marching algorithm, which searches
for pixels between two points, with the lowest intensities,
and finds the shortest path.31 To enable accurate
tracking of the retinal vasculature, a reference retinal
image (580 nm) was converted into an image, which
highlighted the retinal blood vessels by assigning the
lowest pixel values to the vessels in contrast with
higher pixel values to the retinal background. Two points
along the length of a given blood vessel segment
within the reference image were then manually selected,
and the vessel-tracking algorithm was applied. This
process was repeated until the majority of the retinal
vasculature was tracked. Accurate tracking for small
arterioles and venules were often the most difficult to
obtain, and therefore tracking of some of the smaller
blood vessels were omitted because of vessel-tracking
errors. The vessel-tracking algorithm enabled an
estimate of the centreline coordinates of the retinal
blood vessels.
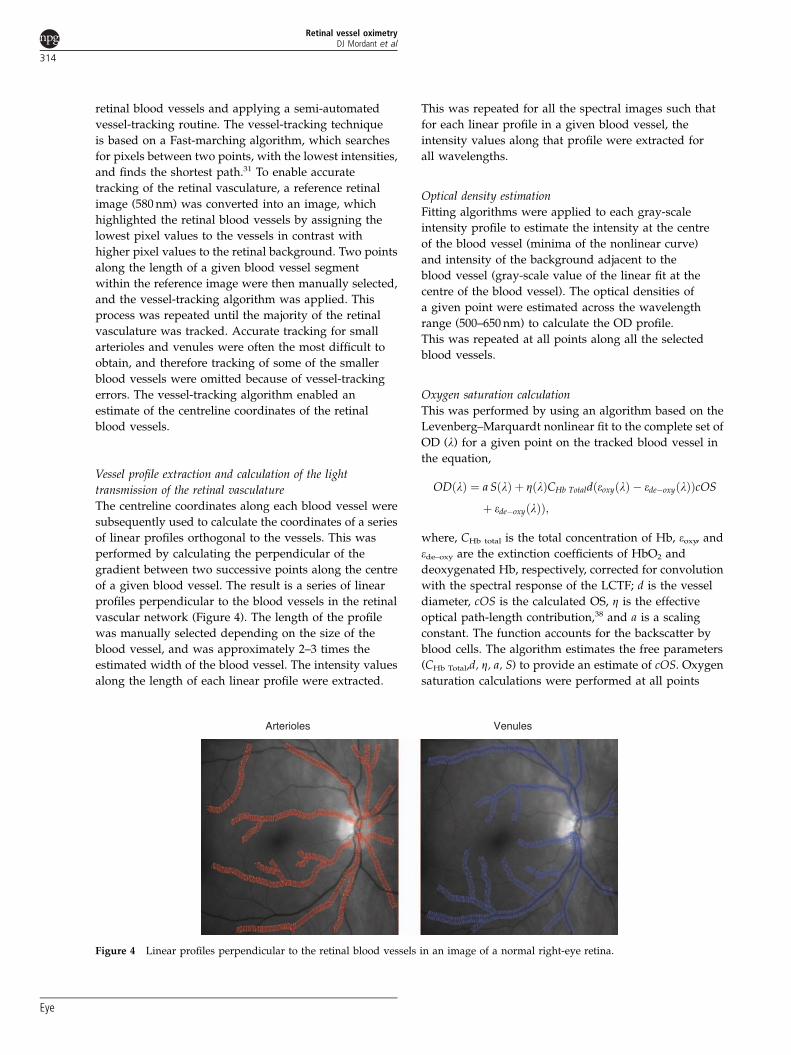
Vessel profile extraction and calculation of the light
transmission of the retinal vasculature
The centreline coordinates along each blood vessel were
subsequently used to calculate the coordinates of a series
of linear profiles orthogonal to the vessels. This was
performed by calculating the perpendicular of the
gradient between two successive points along the centre
of a given blood vessel. The result is a series of linear
profiles perpendicular to the blood vessels in the retinal
vascular network (Figure 4). The length of the profile
was manually selected depending on the size of the
blood vessel, and was approximately 2–3 times the
estimated width of the blood vessel. The intensity values
along the length of each linear profile were extracted.
This was repeated for all the spectral images such that
for each linear profile in a given blood vessel, the
intensity values along that profile were extracted for
all wavelengths.
Optical density estimation
Fitting algorithms were applied to each gray-scale
intensity profile to estimate the intensity at the centre
of the blood vessel (minima of the nonlinear curve)
and intensity of the background adjacent to the
blood vessel (gray-scale value of the linear fit at the
centre of the blood vessel). The optical densities of
a given point were estimated across the wavelength
range (500–650 nm) to calculate the OD profile.
This was repeated at all points along all the selected
blood vessels.
Oxygen saturation calculation
This was performed by using an algorithm based on the
Levenberg–Marquardt nonlinear fit to the complete set of
OD (l) for a given point on the tracked blood vessel in
the equation,
ODðlÞ ¼ a SðlÞ þ ZðlÞCHb TotaldðeoxyðlÞ � ede�oxyðlÞÞcOS
þ ede�oxyðlÞÞ;
where, CHb total is the total concentration of Hb, eoxy, and
ede–oxy are the extinction coefficients of HbO2 and
deoxygenated Hb, respectively, corrected for convolution
with the spectral response of the LCTF; d is the vessel
diameter, cOS is the calculated OS, Z is the effective
optical path-length contribution,38 and a is a scaling
constant. The function accounts for the backscatter by
blood cells. The algorithm estimates the free parameters
(CHb Total,d, Z, a, S) to provide an estimate of cOS. Oxygen
saturation calculations were performed at all points
Arterioles Venules
Figure 4 Linear profiles perpendicular to the retinal blood vessels in an image of a normal right-eye retina.
Retinal vessel oximetryDJ Mordant et al
314
Eye
along the tracked centreline of selected retinal blood
vessels. Optimal OS results were attained when the
spectral images between 556 and 640 nm were analysed.
The OS calculations and corresponding coordinates of
the centre of the tracked retinal blood vessels were used
to generate oximetric pseudocolour maps of the retinal
vasculature.
To enable further studies of the OS data, a
semi-automated program was written in Mathematica
(ver. 5.2; Wolfram Research, Inc., Champaign, IL, USA)
to enable the extraction of calculated OS values at given
points in the retinal arterioles and venules defined by
the distance from the optic-disc margin. This was
performed by determining the centre of the optic disc
and its radius (r). Four additional circles with increasing
radii (2r, 3r, 4r, 5r) about the point in the centre of the
optic disc corresponded to the regions 12 disc diameter
(dd), 1 dd, 112 dd and 2 dd from the disc margin,
respectively.
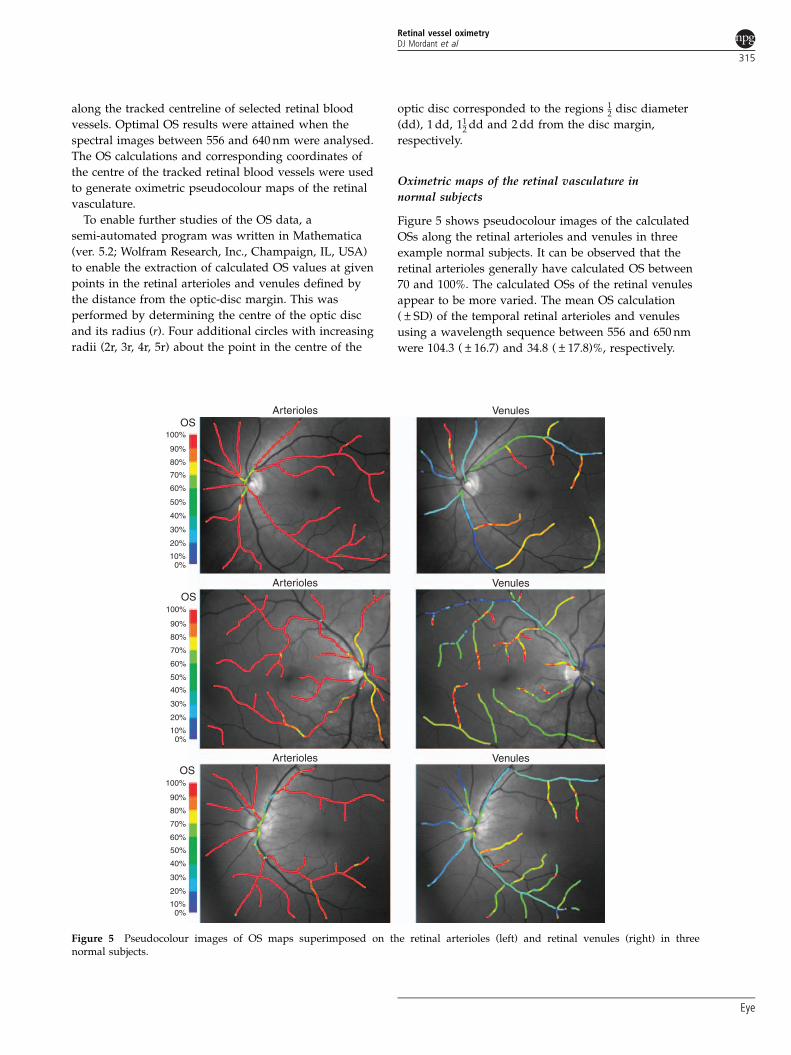
Oximetric maps of the retinal vasculature in
normal subjects
Figure 5 shows pseudocolour images of the calculated
OSs along the retinal arterioles and venules in three
example normal subjects. It can be observed that the
retinal arterioles generally have calculated OS between
70 and 100%. The calculated OSs of the retinal venules
appear to be more varied. The mean OS calculation
(±SD) of the temporal retinal arterioles and venules
using a wavelength sequence between 556 and 650 nm
were 104.3 (±16.7) and 34.8 (±17.8)%, respectively.
100%
90%
80%
70%
60%
50%
40%
30%
20%
10%0%
100%
90%
80%
70%
60%
50%
40%
30%
20%
10%0%
100%
90%
80%
70%
60%
50%
40%
30%
20%
10%0%
OS
OS
OS
Arterioles Venules
Arterioles Venules
Arterioles Venules
Figure 5 Pseudocolour images of OS maps superimposed on the retinal arterioles (left) and retinal venules (right) in threenormal subjects.
Retinal vessel oximetryDJ Mordant et al
315
Eye

The macular branches of the retinal venules generally
appear to have higher calculated OSs compared with
their respective main trunk first and second-degree
retinal venules. Figure 6 shows box- and whisker plots of
the OS of the (main trunk) temporal retinal arterioles
and venules in normal subjects, with the median,
range, and the minimum and maximum values
displayed.
These values changed very little with increasing
eccentricity from the optic-disc margin. Figure 7 shows
that the mean OS (and SEM) of the temporal retinal
arterioles and venules at different (at the disc margin,12 dd, 1 dd, 11
2 dd and 2 dd) eccentricities from the
optic-disc margin were not associated with significant
changes in the OS; temporal retinal arterioles r2¼ 0.071,
P¼ 0.66, and venules r2¼ 0.002, P¼ 0.95, respectively.
Results III
Example of retinal vascular disease: branch retinal
artery occlusion
Patient 1 was a 79-year-old man with a 25-day history of
a left-inferior branch retinal artery occlusion (Figure 8a).
The VA of the left eye was 6/18 at the time of imaging.
The pseudocolour images of the OS calculations
overlayed onto the retinal vessels (Figure 8b) indicate
lower than normal OSs of the inferotemporal retinal
arterioles, corresponding to the location of occluded
retinal arteriole.
Discussion
The human retina has a dual blood supply to meet the
high metabolic demands of the photoreceptors, ganglion
cells, and the retinal pigment epithelium. The inner
two-thirds of the retina is supplied from branches of
the central retinal vessels, and the outer one-third of the
retina is supplied by the choroid creating a watershed
zone at the outer plexiform layer. The retinal circulation
is characterised by a low blood flow rate (80 ml/min),
but the choroid, in contrast, has a high level of flow
(800 ml/min).32,33 Choroidal arterio-venous OS difference
is 3 vs (at least) 40% for the retinal circulation.34 This
higher OS differences between arterial and venous
blood in the retinal circulation offers the possibility
of gaining insights into inner retinal health by the
measurement of retinal vessel OS, and quantification
of changes in arterio-venous OS, with physiological
Temporal arteioles Temporal venules
r 2 = 0.071 r 2 = 0.002p = 0.66200
1901801701601501401301201101009080O
S (
%)
OS
(%
)
70605040302010
0
Distance from disc margin (disc diameters) Distance from disc margin (disc diameters)
0.0 0.5 1.0 1.5 2.0
100
90
80
70
60
50
40
20
10
00.0 0.5 1.0 1.5 2.0
30
p = 0.95
Figure 7 Oxygen saturation calculations of the temporal (superotemporal and inferotemporal) arterioles (left) and venules (right) atpoints defined by the distance from the optic disc: at the disc margin (0.0), 1
2 disc diameter (0.5), 1 dd (1.0), 112 dd (1.5) and 2 dd (2.0)
from the disc margin. The mean OS (central black filled circle), the SEM (vertical lines), the best-fit line (solid black horizontal line), andthe 95% confidence interval of the best-fit line (horizontal dashed lines) are shown in the plots.
200190180
160150140130120110100
9080706050403020100
Arterioles Venules
OS
(%
)
170
Figure 6 A box-and-whisker plot of the OS of the temporal(superotemporal and inferotemporal) retinal arterioles andvenules in normal subjects. The plots show the median, theinterquartile range, 95% central range, and the minimum andmaximum values.
Retinal vessel oximetryDJ Mordant et al
316
Eye

changes, for example, dark adaption and/or in response
to retinal disease.
The accurate quantification of retinal oxygen
concentration in retinal tissues, and the OS in retinal
blood vessels, therefore, remains an important but
challenging, goal. A number of different approaches have
been reported in the literature. A significant proportion
of retinal oxygenation studies have been focused on the
use of oxygen-sensitive microelectrodes in studying the
O2 tension (pO2) in the retina. Importantly, this technique
is able to measure the pO2 gradients across the choroid,
retina, and vitreous, which provide insights into the local
metabolic state of the retina. Birol et al35 studied the
distribution of foveal and perifoveal oxygen in six
anaesthetised cynomolgus macaques using O2
microelectrodes. Two characteristic pO2 minima were
identified in the fovea and perifovea at the level of the
photoreceptor inner segments and at the vitreo–retinal
interface. The invasiveness of this technique has
restricted its use mainly in animal studies.36 Studies in
human eyes have been restricted to measurements of
vitreous pO2 during intraocular surgery.37–39
The potential value of the clinical measurement, but
the invasive nature of the techniques described above,
have ensured that non-invasive retinal vessel oximetry in
humans remains an important aspiration. This report
describes the design of a retinal camera, which has
allowed successful acquisition of spectal images of the
retina, and details the image processing and analysis
techniques, which have been used to calculate the OS
of the retinal vasculature in a small group of normal
subjects and in an illustrative example of a patient with
a branch retinal arterial occlusion. We have previously
reported the validation of this spectral imaging technique
using a model eye with artificial retinal vessels filled with
human blood of known OS.40 A wavelength sequence of
556–650 nm was determined to be the most appropriate
wavelength sequence to accurately calculate the OS of
the retinal vasculature. This wavelength sequence
incorporates the important features of the extinction
coefficient curves of HbO2 (local minima and maxima)
and deoxyhaemoglobin (local maxima) to enable the
nonlinear fitting oximetry algorithm to accurately
differentiate most OD profiles of blood with varying OSs.
A total of 14 normal volunteers were successfully
imaged, and retinal oximetry values were obtained.
Examples of the pseudocolour images of OS calculations,
overlayed onto the retinal arterioles and venules in three
Arterioles
OSb
a
100%
90%
80%
70%
60%
50%
40%
30%
20%
10%0%
Venules
Figure 8 (a) Colour fundus photograph of patient 1, showing pale inferotemporal retina, corresponding to region affectedby inferotemporal retinal arteriole occlusion. (b) Pseudocolour oximetry map showing abnormally low OS within the affectedinferotemporal retinal arteriole in contrast to the normal OS levels in the unaffected superotemporal arteriole. The correspondinginferotemporal retinal venule has a normal level of OS.
Retinal vessel oximetryDJ Mordant et al
317
Eye
example normal subjects are illustrated in Figure 5.
Lower than expected OSs of the retinal arterioles can be
observed frequently at locations where the arterioles are
in close proximity to the larger venules. These errors are
mostly due to inaccuracies of the vessel profile analysis;
to analyse the light transmission of a vessel, linear
profiles orthogonal to the tracked coordinates of the
vessels are generated. The vessel profiles of tracked
arterioles adjacent to the larger venules will crossover
onto the spatial coordinates of the venules, resulting in
the accidental ‘contamination’ of the OD calculation
related to the arteriole compared with that associated
with the venule (lower OS). Careful selection of
appropriate points along the arterioles, at given distances
from the optic-disc margin, was performed to reduce this
tendency. Furthermore, OS calculations of small
segments of the vessels were obtained for the
segmentation analysis as opposed to large segments of
the vessels to reduce the influence of spurious outlying
results. Notwithstanding these precautions during
analysis, physical trans-luminal diffusion of oxygen
down its concentration gradient, from the arteriole to the
venule, cannot be excluded as a potential additional
factor. The cause of the variability of the OS in the retinal
venules is unclear, and could be attributed to a number of
factors, including variability in the illumination of the
retina images (vignetting) and retinal background
(variable pigmentation). Additionally, it could be
explained by physiological variability in the function
of the retina in the photopic conditions used to acquire
the spectral retinal images, variable consumption of
oxygen, and short-term changes in retinal blood flow.
Analysis of the first- and second-degree temporal retinal
arterioles at defined eccentricity from the optic-disc
margin revealed a mean OS of 110.8 (±11.8)%. This is
comparable to OS measurements of retinal arterioles in
healthy subjects reported by previous authors.
Correlation and linear regression analyses indicated that
the OS of the first- and second-degree temporal retinal
arterioles did not significantly change at varying
eccentricity from the optic-disc margin of up to 2 dd.
However, the mean OS of the first- and second-degree
temporal retinal venules was 27.7 (±19.1)%, which is
lower than the OS measurements of the retinal venules
reported in previous studies. A possible explanation
could be an error in the OS calculation caused by
inaccurate curve fitting by the nonlinear algorithm to the
OD profiles. However, this is unlikely as all the OD
profiles included in the analysis were carefully selected
and examined. Poor quality OD profiles were excluded
from the analysis. The constant OS measurements of the
retinal venules at different eccentricities from the optic-
disc margin indicate consistency in the OS
measurements. Previous retinal oximetry systems have
reported retinal venous OSs ranging from 45 to 65%.
Most of these systems rely on two wavelength oximetry,
which have been reported to overestimate the true OS.34
A further possible explanation could be the wavelengths
used by other workers,25 which ranged between 510 and
586 nm in 2-nm increments. At these wavelengths, the
hyperspectral retinal imaging system described in this
present study provided highly variable optical densities
of the retinal vessels, which could possibly contribute to
errors in the OS calculations.
The research work described has a number of
limitations. Data is presented from a relatively small
number of normal subjects. Data from nine normal
subjects (40%) had to be excluded from the study because
of poor image quality, resulting in poor OD calculations.
Unfortunately this was unavoidable, as the current image
acquisition process and subsequent analysis is
cumbersome and demanding for both the volunteer
and the operator. Acquisition and processing of the
images to generate oximetry maps of the retinal
vasculature of one eye took on average approximately
50 h of cumulative processing on a computer with a
2.5 GHz dual-core processor with 4 Gb of RAM. The
processing and analysis steps are semi-automated, and in
addition to this, further analysis had to be performed to
calculate the OSs of the retinal vessels at defined points
along the retinal vessels to give the mean OSs of the
temporal retinal arterioles and venules. Furthermore,
inaccuracies of the OD and OS calculations were
frequently encountered in regions of the retinal images
in which there was poor illumination of the retina,
particularly towards the periphal nasal retina:
calculated OSs beyond the physiological range (0–100%),
negative values and some calculated OSs greater than
100%. As a result, analysis of segments of the retinal
vasculature was limited to 2 dd, and analysis of the nasal
retinal vasculature was not performed. In this study,
truncation of the analysed wavelength sequence of
available optical densities before oxygen calculations
improved oximetry accuracy. The underlying cause of
variability of the optical densities at wavelengths less
than 556 nm is unclear. At these wavelengths, the retina
appears dark in the spectral images. The reduced
contrast between the retinal background and retinal
vessels could be a plausible explanation for the
variability in the OD calculations at these wavelengths.
Although reducing the wavelength sequence has
reduced the effects of this variability, the wavelengths
between 556 and 650 nm are possibly still susceptible
to variations in the retinal pigmentation. This was
noticeable in the analysis of two normal subjects
with highly pigmented retinas.
In summary, this study has described techniques to
deliver retinal vessel OS calculations in normal subjects
Retinal vessel oximetryDJ Mordant et al
318
Eye
and in a retinal patient. Retinal arteriolar OS values were
consistent with previous studies. Retinal venular OS
values were lower than some reports on normal subjects
in the literature, however, the values were comparable to
those reported by Delori et al.22,23 Retinal vessel oximetry
using the described imaging and analysis techniques,
especially using recently developed ‘snapshot’ spectral
imaging refinements41 holds promise for accurate,
practical, and non-invasive retinal oximetry
measurements.
Conflict of interest
AR Harvey owns a patent to a related spectral imaging
device, and rest of the authors declare no conflict of
interest.
Acknowledgements
This study was supported by Eye Therapy Trust;
Technology Strategy Board (CHBT/007/00028). This
paper presents independent research awarded under
New and Emerging Applications of Technology (NEAT),
part of the i4i Invention for Innovation programme
(NEAT K034) of the National Institute for Health
Research (NIHR). The views expressed in this
publication are those of the author(s) and not necessarily
those of the NHS, the NIHR, or the Department of
Health. This study was approved by the Gloucestershire
Research Ethics Committee (COREC reference:
06/Q2005/131) and all procedures were carried out in
accordance with the tenets of the Declaration of Helsinki.
References
1 Nuffer LL, Medvick PA, Foote HP, Solinsky JC.Multispectral/hyperspectral image enhancement forbiological cell analysis. Cytometry A 2006; 69(8): 897–903.
2 Timlin JA, Haaland DM, Sinclair MB, Aragon AD,Martinez MJ, Werner-Washburne M. Hyperspectralmicroarray scanning: impact on the accuracy and reliabilityof gene expression data. BMC Genomics 2005; 6(1): 72.
3 Huebschman ML, Schultz RA, Garner HR. Characteristicsand capabilities of the hyperspectral imaging microscope.IEEE Eng Med Biol Mag 2002; 21(4): 104–117.
4 Schultz RA, Nielsen T, Zavaleta JR, Ruch R, Wyatt R,Garner HR. Hyperspectral imaging: a novel approach formicroscopic analysis. Cytometry 2001; 43(4): 239–247.
5 Rooney PJ. Rapid identification of urinary tract infectionbacteria using hyperspectral whole-organism fingerprintingand artificial neural networks. Microbiology 1998; 144(5):1157–1170.
6 Martin ME, Wabuyele MB, Chen K, Kasili P, Panjehpour M,Phan M et al. Development of an advanced hyperspectralimaging (HSI) system with applications for cancerdetection. Ann Biomed Eng 2006; 34(6): 1061–1068.
7 Sorg BS, Moeller BJ, Donovan O, Cao Y, Dewhirst MW.
Hyperspectral imaging of hemoglobin saturation in
tumor microvasculature and tumor hypoxia development.
J Biomed Opt 2005; 10(4): 44004.8 Cancio LC, Batchinsky AI, Mansfield JR, Panasyuk S,
Hetz K, Martini D et al. Hyperspectral imaging: a new
approach to the diagnosis of hemorrhagic shock. J Trauma2006; 60(5): 1087–1095.
9 Zuzak KJ, Schaeberle MD, Lewis EN, Levin IW. Visible
reflectance hyperspectral imaging: characterization of a
noninvasive, in vivo system for determining tissue
perfusion. Anal Chem 2002; 74(9): 2021–2028.10 Zuzak KJ, Schaeberle MD, Gladwin MT, Cannon III RO,
Levin IW. Noninvasive determination of spatially resolved
and time-resolved tissue perfusion in humans during
nitric oxide inhibition and inhalation by use of a
visible-reflectance hyperspectral imaging technique.
Circulation 2001; 104(24): 2905–2910.11 Greenman RL, Panasyuk S, Wang X, Lyons TE, Dinh T,
Longoria L et al. Early changes in the skin microcirculation
and muscle metabolism of the diabetic foot. Lancet 2005;
366(9498): 1711–1717.12 Zuzak KJ, Gladwin MT, Cannon III RO, Levin IW. Imaging
hemoglobin oxygen saturation in sickle cell disease patients
using noninvasive visible reflectance hyperspectral
techniques: effects of nitric oxide. Am J Physiol HeartCirc Physiol 2003; 285(3): H1183–H1189.
13 Drabkin DL, Austin JH. Spectrophotometric studies. V.
Technique for analysis of undiluted blood and concentrated
hemoglobin solutions. J Biol Chem 1935; 112: 105–115.14 Drabkin DL, Schmidt CF. Observations of circulating blood
in vivo, and the direct determination of the saturation of
hemoglobin in arterial blood. J Biol Chem 1945; 157: 69–83.15 Kramer K, Elam JO, Saxton GA, Elam Jr WN. Influence of
oxygen saturation, erythrocyte concentration and optical
depth upon the red and near-infrared light transmittance of
whole blood. Am J Physiol 1951; 165: 229–246.16 Matthes K, Gross F. Untersuchungen fiber die absorption
yon rotem und ultraotem Licht durch kohlenoxydgesittigtes
und reduziertes Blut. Arch Exp Pathol Pharmacol 1939; 191:
369–380.17 Matthes K, Gross F. Fortlaufende Registrierung der
Lichtabsorption des Blutes in zwei verschiedenen
pektralbezirken. Arch Exp Pathol Pharmacol 1939; 191:
381–390.18 Aoyagi T, Kishi M, Yamaguchi K, Watanabe S. Improvement
of the earpiece oximeter. Abstracts of the 13th annual
meeting of the Japanese Society of Medical Electronics
and Biological Engineering 1974; 90–91.19 Broadfoot KD, Gloster J, Greaves DP. Photoelectric method
of investigating the amount and oxygenation of blood in
the fundus oculi. Br J Ophthalmol 1961; 45(3): 161–182.20 Laing RA, Danisch LA, Young LR. The choroidal eye
oximeter: an instrument for measuring oxygen saturation of
choroidal blood in vivo. IEEE Trans Biomed Eng 1975; 22(3):
183–195.21 Hickam JB, Frayser R, Ross JC. A study of retinal venous
blood oxygen saturation in human subjects by photographic
means. Circulation 1963; 27: 375–385.22 Delori FC. Noninvasive technique for oximetry of blood
in retinal vessels. Applied Optics 1988; 27(6): 1113–1125.23 Sebag J, Delori FC, Feke GT, Weiter JJ. Effects of optic
atrophy on retinal blood flow and oxygen saturation in
humans. Arch Ophthalmol 1989; 107(2): 222–226.
Retinal vessel oximetryDJ Mordant et al
319
Eye

24 Tiedeman JS, Kirk SE, Srinivas S, Beach JM. Retinal oxygenconsumption during hyperglycemia in patients with diabeteswithout retinopathy. Ophthalmology 1998; 105(1): 31–36.
25 Schweitzer D, Hammer M, Kraft J, Thamm E, Konigsdorffer E,Strobel J. In vivo measurement of the oxygen saturation ofretinal vessels in healthy volunteers. IEEE Trans Biomed Eng1999; 46(12): 1454–1465.
26 Michelson G, Scibor M. Intravascular oxygen saturation inretinal vessels in normal subjects and open-angle glaucomasubjects. Acta Ophthalmol Scand 2006; 84: 89–295.
27 Hardarson SH, Harris A, Karlsson RA, Halldorsson GH,Kagemann L, Rechtman E et al. Automatic retinal oximetry.Invest Ophthalmol Vis Sci 2006; 47(11): 5011–5016.
28 Hammer M, Thamm E, Schweitzer D. A simple algorithmfor in-vivo ocular fundus oximetry compensating for non-haemoglobin absorption and scattering. Phys Med Biol 2002;47(17): N233–N238.
29 Yoneya S, Saito T, Nishiyama Y, Deguchi T, Takasu M,Gil T et al. Retinal oxygen saturation levels in patients withcentral retinal vein occlusion. Ophthalmology 2002; 109(8):1521–1526.
30 Ito M, Murayama K, Deguchi T, Takasu M, Gil T, Araie Met al. Oxygen saturation levels in the juxta-papillary retinain eyes with glaucoma. Exp Eye Res 2008; 86(3): 512–518.
31 Sethian JA. Level Set Methods and Fast Marching Methods.Cambridge University Press: Cambridge, Massachusetts, 1999.
32 Shimada Y, Yoshiya I, Oka N, Hamaguri K. Effects ofmultiple scattering and peripheral circulation on arterialoxygen saturation measured with a pulse-type oximeter.Med Biol Eng Comput 1984; 22: 475–478.
33 Alm A, Bill A. Ocular and optic nerve blood flow atnormal and increased intraocular pressures in monkeys(Macaca irus): a study with radioactively labelled
microspheres including flow determinations in brain
and some other tissues. Exp Eye Res 1973; 15(1): 15–29.34 Feke GT, Tagawa H, Deupree DM, Goger DG, Sebag J,
Weiter JJ. Blood flow in the normal human retina. Invest
Ophthalmol Vis Sci 1989; 30(1): 58–65.35 Tornquist P, Alm A. Retinal and choroidal contribution to
retinal metabolism in vivo. A study in pigs. Acta Physiol
Scand 1979; 106(3): 351–357.36 Birol G, Wang S, Budzynski E, Wangsa-Wirawan ND,
Linsenmeier RA. Oxygen distribution and consumption in
the macaque retina. Am J Physiol Heart Circ Physiol 2007;
293(3): H1696–H1704.37 Sakauke H, Negi A, Honda Y. Comparative study of
vitreous oxygen tension in human and rabbit eyes. Invest
Ophthalmol Vis Sci 1989; 30: 1933–1937.38 Stefansson E, Machemer R, de Juan E, McCuen II BW.
Retinal oxygenation and laser treatment in patients
with diabetic retinopathy. Am J Ophthalmol 1992; 113:
36–38.39 Williamson TH, Grewal J, Gupta B, Mokete B, Lim M,
Fry CH. Measurement of PO2 during vitrectomy for central
retinal vein occlusion, a pilot study. Graefes Arch Clin Exp
Ophthalmol 2009; 247(8): 1019–1023.40 Mordant DJ, Al-Abboud I, Muyo G, Gorman A, Sallam A,
Rodmell S et al. Validation of human whole blood oximetry
using a hyperspectral camera with a model eye. Invest
Ophthalmol Vis Sci 2011; e-pub ahead of print 10 January
2011.41 Gorman A, Fletcher-Holmes DW, Harvey AR. Harvey,
generalisation of the Lyot filter and its application to
snapshot spectral imaging. Opt Express 2010; 18(6):
5602–5608.
Retinal vessel oximetryDJ Mordant et al
320
Eye
Related Documents