Soil Management for Sustainable Agriculture Guest Editors: Philip J. White, John W. Crawford, María Cruz Díaz A ´ lvarez, and Rosario García Moreno Applied and Environmental Soil Science

Welcome message from author
This document is posted to help you gain knowledge. Please leave a comment to let me know what you think about it! Share it to your friends and learn new things together.
Transcript

Soil Management for Sustainable Agriculture
Guest Editors: Philip J. White, John W. Crawford, María Cruz Díaz A lvarez, and Rosario García Moreno
Applied and Environmental Soil Science

Soil Management for Sustainable Agriculture
Applied and Environmental Soil Science
Soil Management for Sustainable Agriculture
Guest Editors: Philip J. White, John W. Crawford, Marıa CruzDıaz Alvarez, and Rosario Garcıa Moreno

Copyright © 2012 Hindawi Publishing Corporation. All rights reserved.
This is a special issue published in “Applied and Environmental Soil Science.” All articles are open access articles distributed under theCreative Commons Attribution License, which permits unrestricted use, distribution, and reproduction in any medium, provided theoriginal work is properly cited.

Editorial Board
Lynette K. Abbott, AustraliaJoselito M. Arocena, CanadaNanthi Bolan, AustraliaRobert L. Bradley, CanadaArtemi Cerda, SpainClaudio Cocozza, ItalyHong J. Di, New ZealandOliver Dilly, GermanyMichael A. Fullen, UK
Ryusuke Hatano, JapanWilliam R. Horwath, USAD. L. Jones, UKMatthias Kaestner, GermanyHeike Knicker, SpainTakashi Kosaki, JapanYongchao Liang, ChinaTeodoro M. Miano, ItalyAmaresh K. Nayak, India
Alessandro Piccolo, ItalyNikolla Qafoku, USAPeter Shouse, USAB. Singh, AustraliaKeith Smettem, AustraliaMarco Trevisan, ItalyAntonio Violante, ItalyPaul Voroney, CanadaJianming Xu, China
Contents
Soil Management for Sustainable Agriculture, Philip J. White, John W. Crawford,Marıa Cruz Dıaz Alvarez, and Rosario Garcıa MorenoVolume 2012, Article ID 850739, 3 pages
N, P, and K Budgets and Changes in Selected Topsoil Nutrients over 10 Years in a Long-Term Experimentwith Conventional and Organic Crop Rotations, Audun KorsaethVolume 2012, Article ID 539582, 17 pages
Impact of No-Tillage and Conventional Tillage Systems on Soil Microbial Communities, Reji P. Mathew,Yucheng Feng, Leonard Githinji, Ramble Ankumah, and Kipling S. BalkcomVolume 2012, Article ID 548620, 10 pages
Evolution of Soil Biochemical Parameters in Rainfed Crops: Effect of Organic and Mineral Fertilization,Marta M. Moreno, Carmen Moreno, Carlos Lacasta, and Ramon MecoVolume 2012, Article ID 826236, 9 pages
Nitrogen and Phosphorus Changes in Soil and Soil Water after Cultivation, Mark Watkins,Hayley Castlehouse, Murray Hannah, and David M. NashVolume 2012, Article ID 157068, 10 pages
Effect of Management Practices on Soil Microstructure and Surface Microrelief, R. Garcia Moreno,T. Burykin, M. C. Diaz Alvarez, and J. W. CrawfordVolume 2012, Article ID 608275, 9 pages
Nitrate-Nitrogen Leaching from Onion Bed under Furrow and Drip Irrigation Systems,Parmodh Sharma, Manoj K. Shukla, Theodore W. Sammis, and Pradip AdhikariVolume 2012, Article ID 650206, 17 pages
Soil Health Management under Hill Agroecosystem of North East India, R. Saha, R. S. Chaudhary,and J. SomasundaramVolume 2012, Article ID 696174, 9 pages
Soil Degradation-Induced Decline in Productivity of Sub-Saharan African Soils: The Prospects ofLooking Downwards the Lowlands with the Sawah Ecotechnology, Sunday E. Obalum,Mohammed M. Buri, John C. Nwite, Hermansah, Yoshinori Watanabe, Charles A. Igwe,and Toshiyuki WakatsukiVolume 2012, Article ID 673926, 10 pages
Lifestyle Influence on the Content of Copper, Zinc and Rubidium in Wild Mushrooms, J. A. Campos,J. A. De Toro, C. Perez de los Reyes, J. A. Amoros, and R. Garcıa-MorenoVolume 2012, Article ID 687160, 6 pages
The Effect of Rainfall Characteristics and Tillage on Sheet Erosion and Maize Grain Yield in SemiaridConditions and Granitic Sandy Soils of Zimbabwe, Adelaide MunodawafaVolume 2012, Article ID 243815, 8 pages
Organic Matter and Barium Absorption by Plant Species Grown in an Area Polluted with Scrap MetalResidue, Cleide Aparecida Abreu, Mariana Cantoni, Aline Renee Coscione, and Jorge Paz-FerreiroVolume 2012, Article ID 476821, 7 pages
Cadmium and Zinc Concentration in Grain of Durum Wheat in Relation to Phosphorus Fertilization,Crop Sequence and Tillage Management, Xiaopeng Gao and Cynthia A. GrantVolume 2012, Article ID 817107, 10 pages
Oilseed Meal Effects on the Emergence and Survival of Crop and Weed Species, Katie L. Rothlisberger,Frank M. Hons, Terry J. Gentry, and Scott A. SensemanVolume 2012, Article ID 769357, 10 pages
Promoting Cassava as an Industrial Crop in Ghana: Effects on Soil Fertility and Farming SystemSustainability, S. Adjei-Nsiah and Owuraku Sakyi-DawsonVolume 2012, Article ID 940954, 8 pages
Response of Maize (Zea mays L.) to Different Rates of Palm Bunch Ash Application in theSemi-deciduous Forest Agro-ecological Zone of Ghana, S. Adjei-NsiahVolume 2012, Article ID 870948, 5 pages
Managing the Nutrition of Plants and People, Philip J. White, Martin R. Broadley, and Peter J. GregoryVolume 2012, Article ID 104826, 13 pages
Hindawi Publishing CorporationApplied and Environmental Soil ScienceVolume 2012, Article ID 850739, 3 pagesdoi:10.1155/2012/850739
Editorial
Soil Management for Sustainable Agriculture
Philip J. White,1 John W. Crawford,2 Marıa Cruz Dıaz Alvarez,3 and Rosario Garcıa Moreno3
1 Ecological Sciences, The James Hutton Institute, Invergowrie, Dundee DD2 5DA, UK2 Faculty of Agriculture, Food and Natural Resources, The University of Sydney, Sydney, NSW 2006, Australia3 Centre for Studies and Research on Agricultural and Environmental Risk Management (CEIGRAM), Universidad Politecnica deMadrid, 28040 Madrid, Spain
Correspondence should be addressed to Philip J. White, [email protected]
Received 19 July 2012; Accepted 19 July 2012
Copyright © 2012 Philip J. White et al. This is an open access article distributed under the Creative Commons Attribution License,which permits unrestricted use, distribution, and reproduction in any medium, provided the original work is properly cited.
The soil sustains most living organisms, being the ultimatesource of their mineral nutrients. Good management of soilsensures that mineral elements do not become deficient ortoxic to plants, and that appropriate mineral elements enterthe food chain. Soil management is important, both directlyand indirectly, to crop productivity, environmental sustain-ability, and human health. Because of the projected increasein world population and the consequent necessity for theintensification of food production, the management of soilswill become increasingly important in the coming years. Toachieve future food security, the management of soils in asustainable manner will be the challenge, through propernutrient management and appropriate soil conservationpractices. Research will be required to avoid further degra-dation of soils, through erosion or contamination, and toproduce sufficient safe and nutritious food for healthy diets.
The aim of this special issue is to present currentresearch to assure food security whilst preserving naturalresources. It comprises 16 papers arising from the SoilManagement for Sustainable Agro-Food Systems Session atthe European Geosciences Union General Assembly in April2011. These range from reviews of the effects of different soilmanagement practices on the sustainability of agriculturalsystems to papers reporting the influence of specific organicand inorganic amendments on the productivity and qualityof particular crops.
The Special issue begins with an overview by P. J. White etal. of the role of plant mineral nutrition in food production,the delivery of essential mineral elements to the human diet,and the prevention of harmful mineral elements entering thefood chain. The authors describe our progress towards global
food security through the development of improved agro-nomic practices and novel crop genotypes for the sustainableintensification of agriculture. This paper is complemented byarticles by R. Saha et al., who review the consequences ofdeforestation coupled with shifting cultivation practices onsoil degradation in Northeast India, and S. E. Obalum et al.,who review the problem of soil degradation in Sub-SaharanAfrica. R. Saha et al. report massive losses of soil, soil carbon(C), nitrogen (N), phosphorus (P), potassium (K), calcium,magnesium, manganese, and zinc (Zn) following deforesta-tion in the northeastern hill region of India with shiftingcultivation practices. The consequent reduction in soil fer-tility prevents sustained agricultural production. However,they note that the adoption of appropriate agroforestrysystems can reduce soil losses, increase soil organic matter(SOM), improve soil physical properties, and preserve waterresources. In addition, techniques such as zero or minimumtillage, mulching, cultivating cover crops, and hedgerowintercropping can be used to increase SOM and sustain soilhealth. S. E. Obalum et al. report that land degradation,particularly soil erosion, also has a significant negative effecton soil quality and productivity in Sub-Saharan Africa.These authors propose the adoption of a lowland-based rice-production technology, termed the sawah ecotechnology,to meet demands for food security in this region. Theyargue that this farmer-oriented, low-cost system of managingsoil, water, and nutrient resources could not only improveagricultural productivity but also alleviate the negativeenvironmental impacts of land degradation in this region.
In many areas of the world, the loss of topsoil, eitherthrough mineral imbalance or erosion, is the single largestthreat to agricultural productivity. Soil erosions by wind and
2 Applied and Environmental Soil Science
water are the main processes by which topsoil is lost. R.Garcıa-Moreno et al. report that soils with high soil surfaceroughness (SSR), such as those produced with conservationtillage, are less susceptible to erosion, and that there is aninverse relationship between SSR and soil porosity. Theysuggest that these soil properties might be used to predict thesusceptibility of a soil to erosion by wind or water.
The influence of tillage on the physical, chemical,and microbiological properties of the soil is consideredin several papers in this Special issue, with reference tospecific agricultural systems. X. Gao and C. A. Grantreport that durum wheat (Triticum durum) grown in theCanadian prairies tends to have greater grain yield, greatergrain Zn concentrations, and lower grain cadmium (Cd)concentrations when cultivated with reduced tillage thanwith conventional tillage. The preceding crops in the rota-tion, whether spring wheat-flax, or canola-flax have littleinfluence on grain yield, grain Cd concentration, or Znconcentration, but increasing P-fertilizer application tends todecrease grain Zn concentrations. This study suggests thattillage management can have beneficial effects on both grainyield and nutritional quality. R. P. Mathew et al. comparedthe long-term effects of conventional tillage and no-tillagepractices on soil microbial communities in a silt loam soilunder continuous maize (Zea mays) production in Alabama,USA. They observed that microbial biomass was greater inthe topsoil from the untilled plots than the conventionallytilled plots, and also had greater phosphatase activity andhigher carbon and nitrogen contents. The authors concludethat conservation tillage practices can, therefore, improveboth the microbiological and physicochemical properties ofsoil. A. Munodawafa reports that grain yields of maize grownunder semiarid conditions on the infertile, sandy soils ofsouthern Zimbabwe can be predicted accurately from theamount and timing of rainfall. She observes that, for a givenamount of rainfall, similar yields were achieved using mulchripping (0.13 t ha−1 cm−1 rainfall) and conventional tillage(0.12 t ha−1 cm−1 rainfall), which were greater than thoseusing tied ridging (0.09 t ha−1 cm−1 rainfall). However, muchgreater soil erosion occurred using conventional tillage thanmulch ripping or tied ridging cultivation. She recommendsthat mulch ripping be practiced in this region, since the lossof topsoil under conventional tillage will ultimately result ina decline in productivity over time. M. Watkins et al. observethat in the well-managed dairy pastures of the GippslandRegion of south-eastern Australia, P and N are lost to theenvironment as dissolved rather than particulated forms.They report that the concentrations of P and N in soilsolutions from ryegrass (Lolium perenne) or mixed ryegrassand clover (Trifolium repens) pastures are significantly lowerin ploughed than in unploughed plots. Thus, they concludethat ploughing might reduce the amounts of P and N releasedto the environment from intensive dairy farms in this region.
Organic amendments often improve the productivityof soils and the nutritional value of crops grown thereon.In particular, crop residues can be used to increase thephytoavailability of essential mineral nutrients, reduce thephytoavailability of toxic mineral elements, improve soilphysical properties, and promote a beneficial soil biota. In
Ghana, cassava is an important staple crop, but it is alsobe used as a raw material for the production of industrialstarch and ethanol. S. Adjei-Nsiah and O. Sakyi-Dawsondemonstrate that cassava can contribute to mineral nutrientrecycling, and to the maintenance of soil fertility, when inte-grated into crop rotations. Furthermore, they argue that theproduction of cassava for industrial purposes can contributeto poverty reduction without excessive depletion of soil min-eral resources in the forest/savannah agroecological zone ofGhana. S. Adjei-Nsiah also reports that palm bunch ash, oneof the major waste products generated from processing palmfruit, can be used as an effective, local, low-cost, K-fertilizerand liming material for maize production in Ghana. C. A.Abreu et al. report that the application of sugar cane filtercake at 40–80 Mg ha−1 organic-C can reduce barium (Ba)concentrations and increase shoot dry matter of sunflower(Helianthus annuus) and castor oil (Ricinus communis)plants, but not oilseed radish (Raphanus sativus), growingon a Brazilian soil (pH 7.5) contaminated with automobilescrap. However, neither sugar cane filter nor peat applica-tions reduced soil Ba availability, which, they suggest, mightbe due to an effect of liming the soil. K. L. Rothlisberger etal. demonstrate that seed meal remaining after the extractionof oil for biodiesel production from white mustard (Sinapisalba), Indian mustard (Brassica juncea), camelina (Camelinasativa), or jatropha (Jatropha curcas) can act as a bioherbicideon johnsongrass (Sorghum halepense) and redroot pigweed(Amaranthus retroflexus), but that the efficacy and specificityof their bioherbicidal effects are related to plant speciesand affected by rate and timing of their application. M.M. Moreno et al. compared SOM, SOM mineralization,microbial biomass, and microbial activity in organic andconventional production systems for a rainfed crop rotation(durum wheat-fallow-barley-vetch) in the semiarid regionof Castilla-La Mancha, Spain. Although it is often observedthat management practices supplying more carbon to thesystem lead to the accumulation of more SOM, greater soilmicrobial biomass, and increased microbial activity, theyobserved that SOM was higher with chemical fertilization,which, they speculate, might be a consequence of either lowcompost inputs (2500 kg ha−1) to the organic rotation or thearid conditions. Soil nitrate content was also higher whenchemical fertilizers were applied, as were crop yields.
A. Korsaeth reports the N, P, and K budgets overa ten-year period of six crop rotations in a long-termexperiment in southeast Norway. He observes that theconventional arable system and the three organic systemsstudied had negative N budgets, suggesting a reductionin soil N content. By contrast, a modified arable-farmingpractice with environmentally sound management appearedto be balanced with respect to N, and conventional practicefor mixed dairy production generated an N surplus. Budgetsfor all conventional systems indicated P and K surpluses,whereas all organic systems appeared to mine the soil for Pand K. Although these calculations corresponded well withthe measured changes in topsoil P, only a common rankingof the systems for their N and K budgets and the measuredN and K in topsoil was observed. He concludes, therefore,that crop production could be mining a soil of N and K over
Applied and Environmental Soil Science 3
many years before it is detected by traditional soil analyses,and that nutrient budgeting might be used to predict mineralimbalances of agricultural practices. In a similar study, P.Sharma et al. compared irrigation efficiencies, and water andnitrate balances, for onions (Allium cepa) grown with furrowor drip irrigation in an arid area of southern New Mexicowhere water is a limited resource for crop production. Theyobserved that both the irrigation efficiency and the N-fertilizer use efficiency were slightly greater for drip systemsthan for furrow systems.
The paper of this special issue by J. A. Campos et al.reports the concentrations of 18 mineral elements in fruitingbodies from ectomycorrhizal, saprophytic, and epiphyticfungi from a mixed forest of pines and oaks on quartziteacidic soils in Ciudad Real, Spain. They report significantlyhigher copper (Cu) and rubidium (Rb) concentrations infruiting bodies from ectomycorrhizal species and signifi-cantly higher Zn concentrations in fruiting bodies fromsaprophytic species. The species Clitocybe maxima andSuillus bellini appear to “hyperaccumulate” Cu and Rb,respectively.
Acknowledgments
We thank the European Geosciences Union for supportingthe session on Soil Management for Sustainable Agro-FoodSystems at the General Assembly in April 2011, all the review-ers for their timely reports and constructive comments, andthe staff of Editorial Office of Applied and Environmental SoilScience for their assistance throughout this project.
Philip J. WhiteJohn W. Crawford
Marıa Cruz Dıaz AlvarezRosario Garcıa Moreno
Hindawi Publishing CorporationApplied and Environmental Soil ScienceVolume 2012, Article ID 539582, 17 pagesdoi:10.1155/2012/539582
Research Article
N, P, and K Budgets and Changes in Selected Topsoil Nutrientsover 10 Years in a Long-Term Experiment with Conventional andOrganic Crop Rotations
Audun Korsaeth
Arable Crops Division, Norwegian Institute for Agricultural and Environmental Research, 2849 Kapp, Norway
Correspondence should be addressed to Audun Korsaeth, [email protected]
Received 2 December 2011; Accepted 30 April 2012
Academic Editor: Philip White
Copyright © 2012 Audun Korsaeth. This is an open access article distributed under the Creative Commons Attribution License,which permits unrestricted use, distribution, and reproduction in any medium, provided the original work is properly cited.
This study presents soil system budgets of N, P and K in six contrasting cropping systems during 10 years of a long-term experimentin southeast Norway. The experiment included systems with arable cash-cropping and with mixed arable-dairy cropping (cash- andfodder crops), with organic and conventional management represented in both groups. All major nutrient inputs and outputs weremeasured or estimated. State of the art conventional cash-cropping appeared to be balanced in terms of N, whereas conventionalmixed cropping had an N surplus. By contrast, less up to date conventional arable cash-cropping and all the organic systemsshowed indications of soil organic N depletion (negative N budgets). All the organic systems showed that mining of the soil Pand K content occurs, whereas the conventional systems all had P and K surpluses. The results corresponded well with measureddifferences between systems in terms of ignition loss, P-AL, K-AL and K-HNO3 measured in 2009. This study shows that a fertilesoil may be exposed to substantial mining of N, P and K over many years before it is detectable by traditional analyses, and thatfield nutrient budgeting is a feasible, but data-demanding, approach to detect such misbalances at an early stage.
1. Introduction
In 1989, a large cropping system experiment, facilitatedfor measurements of runoff and leaching, was establishedat Apelsvoll in southeast Norway. Over the years, thisexperiment has provided data for many studies covering arange of different topics, including yields and yield quality(e.g., [1]), nutrient leaching and runoff losses (e.g., [2]),economic aspects (e.g., [3]), soil microbiology (e.g., [4]), soilphysical and chemical properties (e.g., [5]), and the relationbetween food production and N losses [6].
Some major adjustments of the experimental design weremade in 2000 [6]. In this overview, a synthesis of the resultsobtained after these changes are given for the major nutrientflows of N, P, and K, with focus on changes in topsoil nutrientpools, as affected by misbalances between nutrient inputsand outputs at field level.
Numerous long-term experiments have shown that croprotation and management affect soil fertility (e.g., [7–13]).However, considerable time is needed before identifiablechanges in soil fertility emerge [14]. Nutrient budgets havebeen used widely in a range of farming systems to assesslong-term sustainability (e.g., [15]), thus, supplementing soilmeasurements. In a discussion of uncertainties in nutrientbudgets, Oenema et al. [16] distinguished between farm gatesoil surface and soil system budgets. The latter accounts fornutrient inputs and outputs, recycling of nutrients within thesystem, nutrient loss pathways, and changes in soil nutrientpools. Soil system budgets were considered to possess thehighest uncertainty of the three budgeting approaches,since nutrient losses via leaching, runoff, volatilization, anddenitrification are classified as the most uncertain nutrientflows [17]. De Vries et al. [18], when estimating uncertaintiesin the soil system N budget of The Netherlands, reported
2 Applied and Environmental Soil Science
that leaching to ground water and leaching to surface waterhad the highest relative uncertainty (coefficient of variation).Acquiring quality data on nutrient drainage and runoff may,therefore, considerably reduce the uncertainties of the soilsystem budget approach.
The present study is aimed at comparing the effects ofmanagement (i.e., organic versus nonorganic) and type ofproduction (i.e., arable cash cropping versus mixed dairyfarming) on their long-term sustainability in terms of plantnutrition, by a combination of soil system nutrient budgetingand soil measurements. Results on drainage discharge andwater-borne nutrient losses will be presented in more detailelsewhere [19].
2. Material and Methods
2.1. Experimental Site and Treatments. In 1989, a 3.2 halarge experiment with pipe-drained plots was establishedat Apelsvoll Research Centre in central southeast Norway(60◦42′ N, 10◦51′ E, altitude 250 m). The climate of theregion is humid continental with a mean annual precipi-tation of 600 mm and a mean annual temperature of 3.6◦,and 12.0◦C in the growing season (May to September).On the experimental area, which slopes 2–8% northeast,deforestation was performed in 1935, whereafter it was usedas pasture until 1975. During the following years, up tothe establishment of the experiment in 1988, the field wascropped with a rotation including 10% root crops, 40%cereals, and 50% ley, using an average of 10 tonnes cattleslurry ha−1 yr−1 plus regular amounts of inorganic fertilizer.The first year after draining the experimental site (1989),the area was cropped with barley (Hordeum distichum L.).The major soil group of the experimental area is classified asEndostagnic Cambisol [20], with dominantly loam and siltysand textures. More detailed soil characteristics have beenpresented by Riley and Eltun [21], partly shown in Table 1.
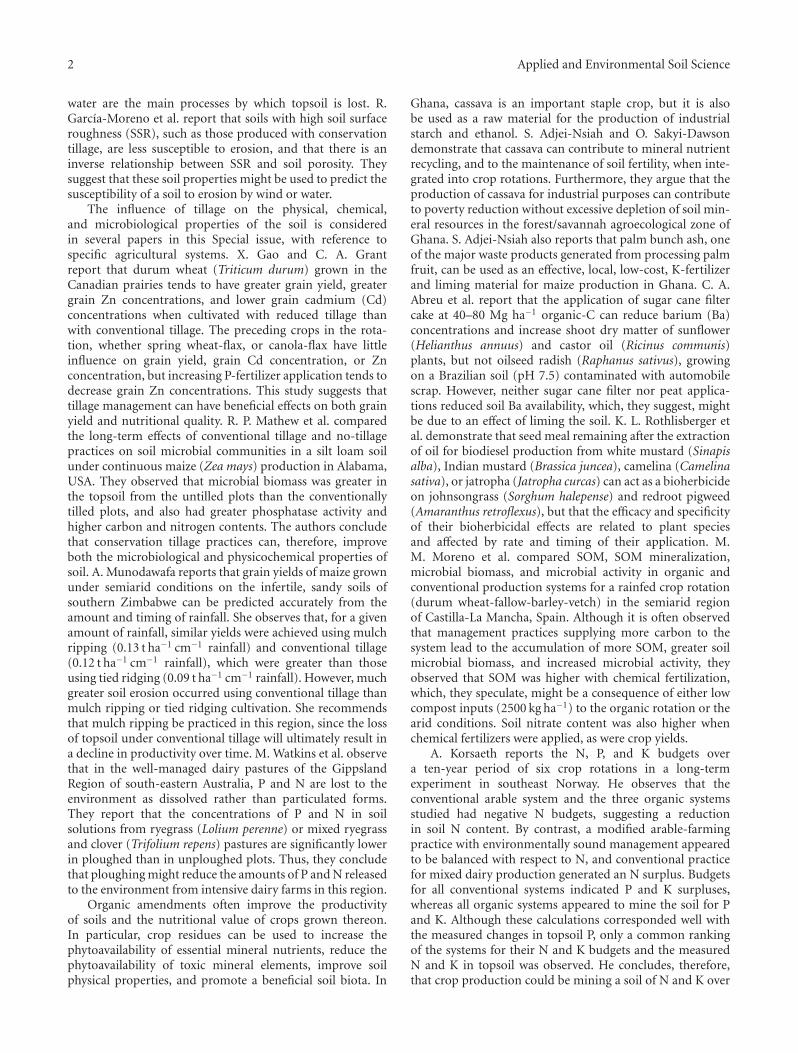
The experimental site comprises 12 blocks (30 × 60 m),separated by 7.5 m grass border zones (Figure 1). In eachblock, surface runoff is collected at the lower end and led toa sedimentation tank, and the blocks are separately drainedwith PVC pipes at a depth of 1 m with 7.5 m spacing. Surfacerunoff from the sedimentation tank and drainage water istransported in sealed plastic pipes to measuring stationsequipped for discharge measurements (tipping buckets) andvolume proportional sampling.
Using a randomised complete block design, six croppingsystems, each with 2 replicates, were established on thetwelve blocks in 1989. The first ten years (1989–1999) theexperiment comprised three arable systems (conventionaland integrated arable cropping without farmyard manureand organic cropping with some farmyard manure) andthree mixed dairy systems (conventional, integrated, andorganic production of both arable and forage crops, all withfarmyard manure). Each block comprised eight 7.5 × 30 mplots, on which all of the arable and/or fodder crops in therotation were grown each year.
Some major adjustments of the experimental design weremade in 2000. The number of rotation plots was reduced
CA1
CA1
CA2
CA2
OA
OA
CM
CM
OM1
OM1
OM2
OM2
Drain pipes Deep ditch
Station for automatic water sampling 7.5 m 30 m
60 m
7.5 mSurface runoff collector
Figure 1: Layout of the cropping system experiment at Apelsvoll.
from eight to four by merging pairs of neighbouring plots,thus, reducing rotation length from eight to four years, butstill with each crop present every year. A new organic mixeddairy system was introduced instead of the integrated mixeddairy system, and some smaller changes were made in themanagement of the other systems. The six adjusted croppingsystems are described briefly below (see Table 2 for details).
CA1. Conventional arable cropping, managed as was com-mon for the region in 1985 (tillage and fertilization as in1985, but for practical reasons, present-day inputs of seedsand chemical plant protection). The year 1985 was selected,since the North-Sea Agreement (1987) used this year as thebase for its planned 50% reduction in nutrient leaching tothe North Sea within a 10-year period. Before this date, lessattention was paid to nonpoint source losses of nutrientsattributed to farming activities, and this cropping system is,thus, used as a reference.
CA2. Conventional arable cropping, using currently avail-able knowledge in order to minimize the ratio of N lostby leaching and runoff to production. This optimisationinvolves the use of catch crops, split application of fertilizer,and reduced noninversion tillage.
OA. Organic arable cropping without cattle slurry, but with25% of the area used for green manure (grass clover ley).
CM. Conventional mixed dairy farming, optimised similarlyto CA2, but with spring ploughing, 50% of the area as grassclover ley and the use of slurry (amounts calculated fromthe theoretical number of cows sustained, see Section 2.3 fordetails).
OM1. Organic mixed dairy farming with 50% of the area asgrass clover ley and slurry use (amounts calculated as in CM).
OM2. Organic mixed dairy farming with 75% of the area asgrass clover ley and slurry use (amounts calculated as in CM).
Applied and Environmental Soil Science 3
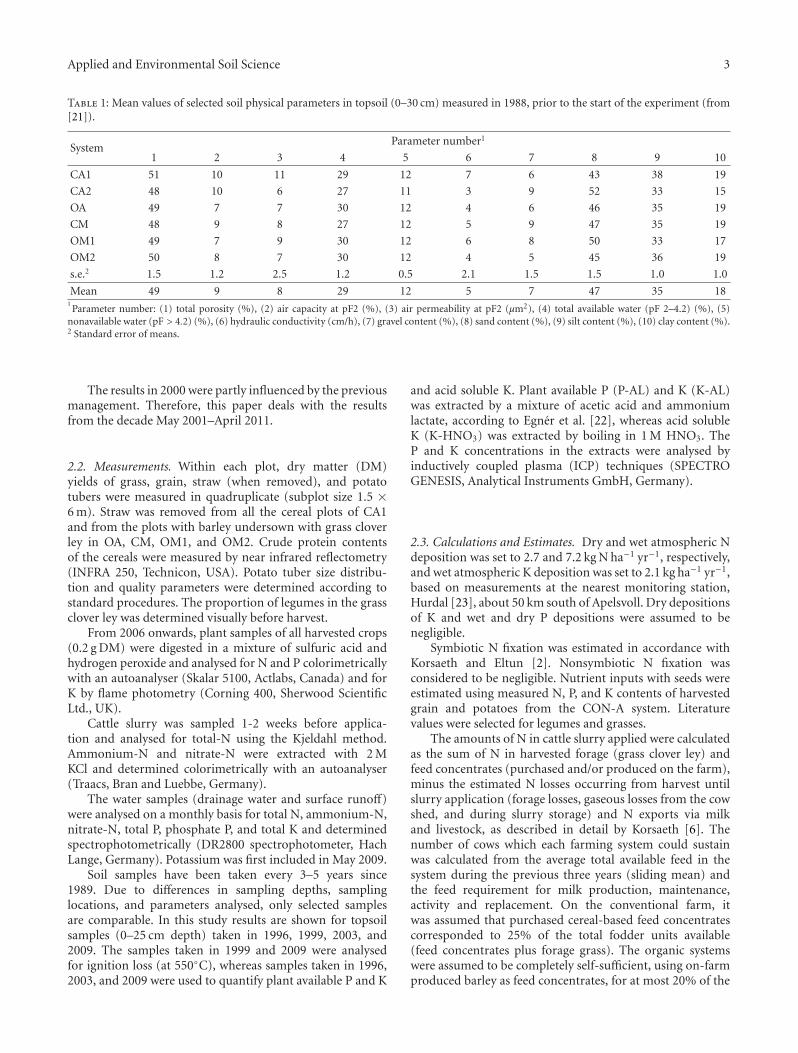
Table 1: Mean values of selected soil physical parameters in topsoil (0–30 cm) measured in 1988, prior to the start of the experiment (from[21]).
SystemParameter number1
1 2 3 4 5 6 7 8 9 10
CA1 51 10 11 29 12 7 6 43 38 19
CA2 48 10 6 27 11 3 9 52 33 15
OA 49 7 7 30 12 4 6 46 35 19
CM 48 9 8 27 12 5 9 47 35 19
OM1 49 7 9 30 12 6 8 50 33 17
OM2 50 8 7 30 12 4 5 45 36 19
s.e.2 1.5 1.2 2.5 1.2 0.5 2.1 1.5 1.5 1.0 1.0
Mean 49 9 8 29 12 5 7 47 35 181Parameter number: (1) total porosity (%), (2) air capacity at pF2 (%), (3) air permeability at pF2 (µm2), (4) total available water (pF 2–4.2) (%), (5)
nonavailable water (pF > 4.2) (%), (6) hydraulic conductivity (cm/h), (7) gravel content (%), (8) sand content (%), (9) silt content (%), (10) clay content (%).2 Standard error of means.
The results in 2000 were partly influenced by the previousmanagement. Therefore, this paper deals with the resultsfrom the decade May 2001–April 2011.
2.2. Measurements. Within each plot, dry matter (DM)yields of grass, grain, straw (when removed), and potatotubers were measured in quadruplicate (subplot size 1.5 ×6 m). Straw was removed from all the cereal plots of CA1and from the plots with barley undersown with grass cloverley in OA, CM, OM1, and OM2. Crude protein contentsof the cereals were measured by near infrared reflectometry(INFRA 250, Technicon, USA). Potato tuber size distribu-tion and quality parameters were determined according tostandard procedures. The proportion of legumes in the grassclover ley was determined visually before harvest.
From 2006 onwards, plant samples of all harvested crops(0.2 g DM) were digested in a mixture of sulfuric acid andhydrogen peroxide and analysed for N and P colorimetricallywith an autoanalyser (Skalar 5100, Actlabs, Canada) and forK by flame photometry (Corning 400, Sherwood ScientificLtd., UK).
Cattle slurry was sampled 1-2 weeks before applica-tion and analysed for total-N using the Kjeldahl method.Ammonium-N and nitrate-N were extracted with 2 MKCl and determined colorimetrically with an autoanalyser(Traacs, Bran and Luebbe, Germany).
The water samples (drainage water and surface runoff)were analysed on a monthly basis for total N, ammonium-N,nitrate-N, total P, phosphate P, and total K and determinedspectrophotometrically (DR2800 spectrophotometer, HachLange, Germany). Potassium was first included in May 2009.
Soil samples have been taken every 3–5 years since1989. Due to differences in sampling depths, samplinglocations, and parameters analysed, only selected samplesare comparable. In this study results are shown for topsoilsamples (0–25 cm depth) taken in 1996, 1999, 2003, and2009. The samples taken in 1999 and 2009 were analysedfor ignition loss (at 550◦C), whereas samples taken in 1996,2003, and 2009 were used to quantify plant available P and K
and acid soluble K. Plant available P (P-AL) and K (K-AL)was extracted by a mixture of acetic acid and ammoniumlactate, according to Egner et al. [22], whereas acid solubleK (K-HNO3) was extracted by boiling in 1 M HNO3. TheP and K concentrations in the extracts were analysed byinductively coupled plasma (ICP) techniques (SPECTROGENESIS, Analytical Instruments GmbH, Germany).
2.3. Calculations and Estimates. Dry and wet atmospheric Ndeposition was set to 2.7 and 7.2 kg N ha−1 yr−1, respectively,and wet atmospheric K deposition was set to 2.1 kg ha−1 yr−1,based on measurements at the nearest monitoring station,Hurdal [23], about 50 km south of Apelsvoll. Dry depositionsof K and wet and dry P depositions were assumed to benegligible.
Symbiotic N fixation was estimated in accordance withKorsaeth and Eltun [2]. Nonsymbiotic N fixation wasconsidered to be negligible. Nutrient inputs with seeds wereestimated using measured N, P, and K contents of harvestedgrain and potatoes from the CON-A system. Literaturevalues were selected for legumes and grasses.
The amounts of N in cattle slurry applied were calculatedas the sum of N in harvested forage (grass clover ley) andfeed concentrates (purchased and/or produced on the farm),minus the estimated N losses occurring from harvest untilslurry application (forage losses, gaseous losses from the cowshed, and during slurry storage) and N exports via milkand livestock, as described in detail by Korsaeth [6]. Thenumber of cows which each farming system could sustainwas calculated from the average total available feed in thesystem during the previous three years (sliding mean) andthe feed requirement for milk production, maintenance,activity and replacement. On the conventional farm, itwas assumed that purchased cereal-based feed concentratescorresponded to 25% of the total fodder units available(feed concentrates plus forage grass). The organic systemswere assumed to be completely self-sufficient, using on-farmproduced barley as feed concentrates, for at most 20% of the
4 Applied and Environmental Soil Science
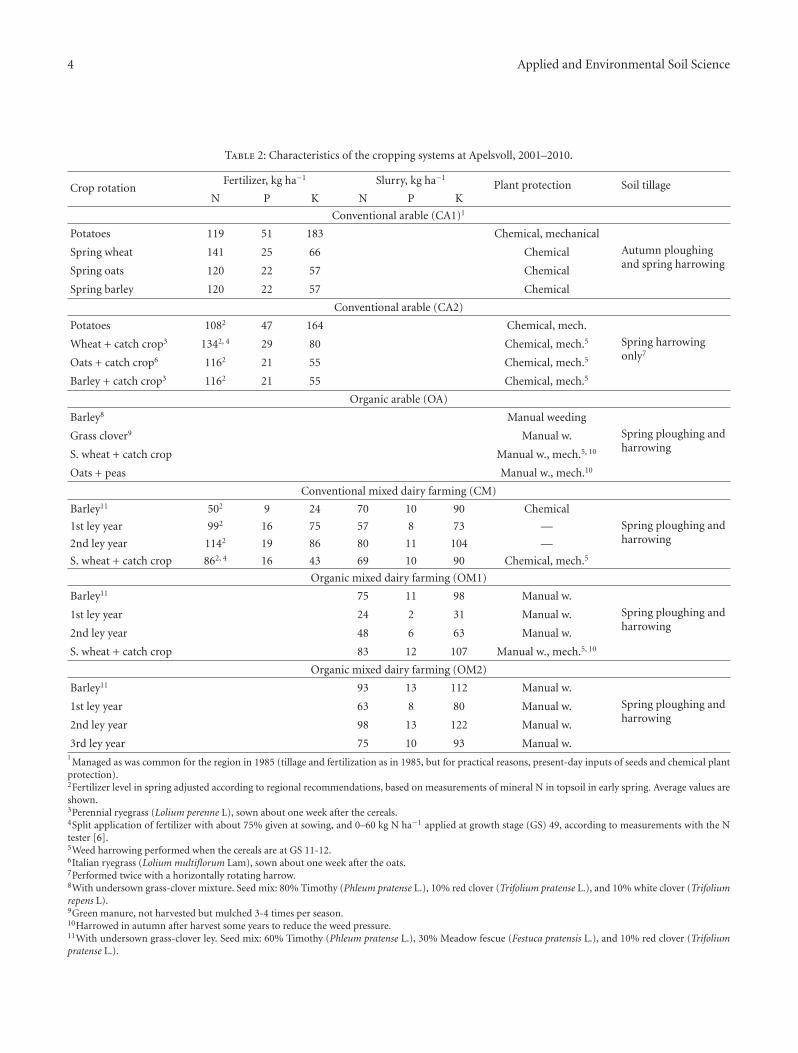
Table 2: Characteristics of the cropping systems at Apelsvoll, 2001–2010.
Crop rotationFertilizer, kg ha−1 Slurry, kg ha−1
Plant protection Soil tillageN P K N P K
Conventional arable (CA1)1
Potatoes 119 51 183 Chemical, mechanical
Autumn ploughingand spring harrowing
Spring wheat 141 25 66 Chemical
Spring oats 120 22 57 Chemical
Spring barley 120 22 57 Chemical
Conventional arable (CA2)
Potatoes 1082 47 164 Chemical, mech.
Spring harrowingonly7
Wheat + catch crop3 1342, 4 29 80 Chemical, mech.5
Oats + catch crop6 1162 21 55 Chemical, mech.5
Barley + catch crop3 1162 21 55 Chemical, mech.5
Organic arable (OA)
Barley8 Manual weeding
Spring ploughing andharrowing
Grass clover9 Manual w.
S. wheat + catch crop Manual w., mech.5, 10
Oats + peas Manual w., mech.10
Conventional mixed dairy farming (CM)
Barley11 502 9 24 70 10 90 Chemical
Spring ploughing andharrowing
1st ley year 992 16 75 57 8 73 —
2nd ley year 1142 19 86 80 11 104 —
S. wheat + catch crop 862, 4 16 43 69 10 90 Chemical, mech.5
Organic mixed dairy farming (OM1)
Barley11 75 11 98 Manual w.
Spring ploughing andharrowing
1st ley year 24 2 31 Manual w.
2nd ley year 48 6 63 Manual w.
S. wheat + catch crop 83 12 107 Manual w., mech.5, 10
Organic mixed dairy farming (OM2)
Barley11 93 13 112 Manual w.
Spring ploughing andharrowing
1st ley year 63 8 80 Manual w.
2nd ley year 98 13 122 Manual w.
3rd ley year 75 10 93 Manual w.1Managed as was common for the region in 1985 (tillage and fertilization as in 1985, but for practical reasons, present-day inputs of seeds and chemical plant
protection).2Fertilizer level in spring adjusted according to regional recommendations, based on measurements of mineral N in topsoil in early spring. Average values areshown.3Perennial ryegrass (Lolium perenne L), sown about one week after the cereals.4Split application of fertilizer with about 75% given at sowing, and 0–60 kg N ha−1 applied at growth stage (GS) 49, according to measurements with the Ntester [6].5Weed harrowing performed when the cereals are at GS 11-12.6Italian ryegrass (Lolium multiflorum Lam), sown about one week after the oats.7Performed twice with a horizontally rotating harrow.8With undersown grass-clover mixture. Seed mix: 80% Timothy (Phleum pratense L.), 10% red clover (Trifolium pratense L.), and 10% white clover (Trifoliumrepens L).9Green manure, not harvested but mulched 3-4 times per season.10Harrowed in autumn after harvest some years to reduce the weed pressure.11With undersown grass-clover ley. Seed mix: 60% Timothy (Phleum pratense L.), 30% Meadow fescue (Festuca pratensis L.), and 10% red clover (Trifoliumpratense L.).
Applied and Environmental Soil Science 5
total feed requirement. Barley not used as concentrates wasassumed to be sold.
The yearly average cereal yields of OA were reducedby 25% to correct for the area used for green manureproduction. In 2007, the mixture of oat and peas in OA wasreplaced in the rotation by faba bean (Vicia faba L.). Thesebeans were totally damaged by chocolate spot (Ascochytablight disease) and not harvested. All OA data from 2007were, thus, excluded from further analyses.
Nutrient concentrations (N, P, and K) in harvestedproducts (crops and straw) for the years 2001–2005 wereset equal to the averages (separately for each croppingsystem) for the years 2006–2010. Removal of N, P, andK was calculated as the measured dry weight of productsremoved from the field multiplied by the estimated nutrientconcentrations. Amounts of N, P and K in harvested grasswere reduced by 10% to correct for likely losses underpractical harvest.
Gaseous N-emissions (N2O-N, NOx-N, and NH3-N)were estimated from the IPCC framework [24], whichcomprises estimates for both direct and indirect emissions.Nitrogen sources included in the direct estimates usedhere were mineral N fertilizer, applied N in slurry, andN in above-ground and below-ground crop residues. NetN mineralization associated with possible loss of SOMresulting from contrasting management was not considered.The volatilization of NH3-N (and NOx-N) is in the IPCCframework [24] related to the input of mineral fertilizerand organic N additions, not including crop residues. Thisimplies that the mulched grass clover in OA would have zeroemissions of NH3-N using the IPCC-approach, which is veryunrealistic (e.g., [25]). Hence, the volatilization of NH3-Nfrom this crop was calculated by means of a separate method[6].
Nutrient runoff occurring during each agrohydrologicalyear, lasting from 1 May to 30 April, was attributed to thecropping season within that period. Calculations of N, P, andK transported via surface runoff and drainage water werebased on measured nutrient concentrations and volumes ofsurface and drainage water. Organic N was calculated asthe difference between total N and the sum of ammonium-N and nitrate-N. Potassium runoff occurring during theagrohydrological years 2001–2008 were set equal to themeasured average K runoff for the agrohydrological years2009/10 and 2010/11.
Nutrient soil system budgets were calculated separatelyfor each system by considering all major flows of N, P, and K,respectively, with the above-ground crops representing theupper boundary and the drain pipes the lower boundary.A positive soil system budget, that is, where the inputsexceeded the outputs, was taken as an indication of nutrientaccumulation, whereas a negative budget was taken as anindication of soil mining of the nutrient in question.
2.4. Statistics. Analyses of variance (ANOVA) were per-formed on yields and nutrient concentrations, using a split-plot model with cropping system as main plot and year assubplot. Grass-clover ley yields were analysed as the sum
of two cuts, whereas differences in nutrient concentrationswere analysed for each cut separately. Paired comparisons(LSD) were performed [26]. Comparisons of soil chemicalproperties measured on different occasions were conductedusing the paired Student’s t-test. In all tests, significance wasassumed at P levels < 0.05. Mean data are presented withtheir standard errors (s.e.).
3. Results
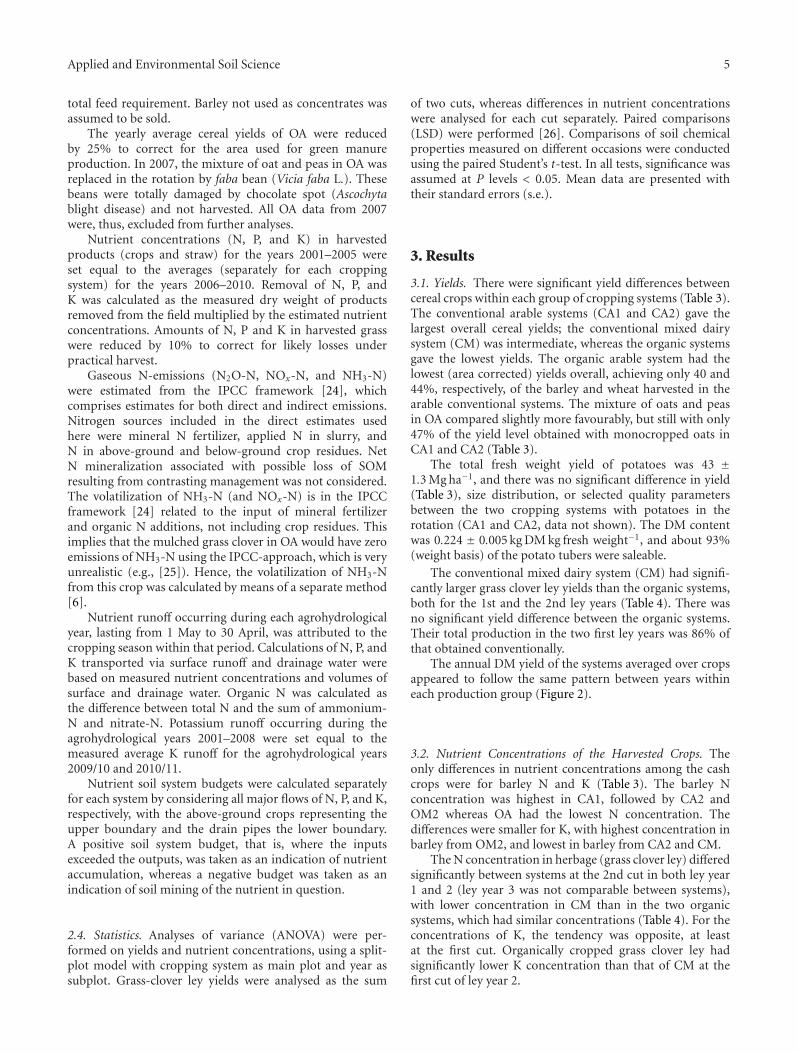
3.1. Yields. There were significant yield differences betweencereal crops within each group of cropping systems (Table 3).The conventional arable systems (CA1 and CA2) gave thelargest overall cereal yields; the conventional mixed dairysystem (CM) was intermediate, whereas the organic systemsgave the lowest yields. The organic arable system had thelowest (area corrected) yields overall, achieving only 40 and44%, respectively, of the barley and wheat harvested in thearable conventional systems. The mixture of oats and peasin OA compared slightly more favourably, but still with only47% of the yield level obtained with monocropped oats inCA1 and CA2 (Table 3).
The total fresh weight yield of potatoes was 43 ±1.3 Mg ha−1, and there was no significant difference in yield(Table 3), size distribution, or selected quality parametersbetween the two cropping systems with potatoes in therotation (CA1 and CA2, data not shown). The DM contentwas 0.224 ± 0.005 kg DM kg fresh weight−1, and about 93%(weight basis) of the potato tubers were saleable.
The conventional mixed dairy system (CM) had signifi-cantly larger grass clover ley yields than the organic systems,both for the 1st and the 2nd ley years (Table 4). There wasno significant yield difference between the organic systems.Their total production in the two first ley years was 86% ofthat obtained conventionally.
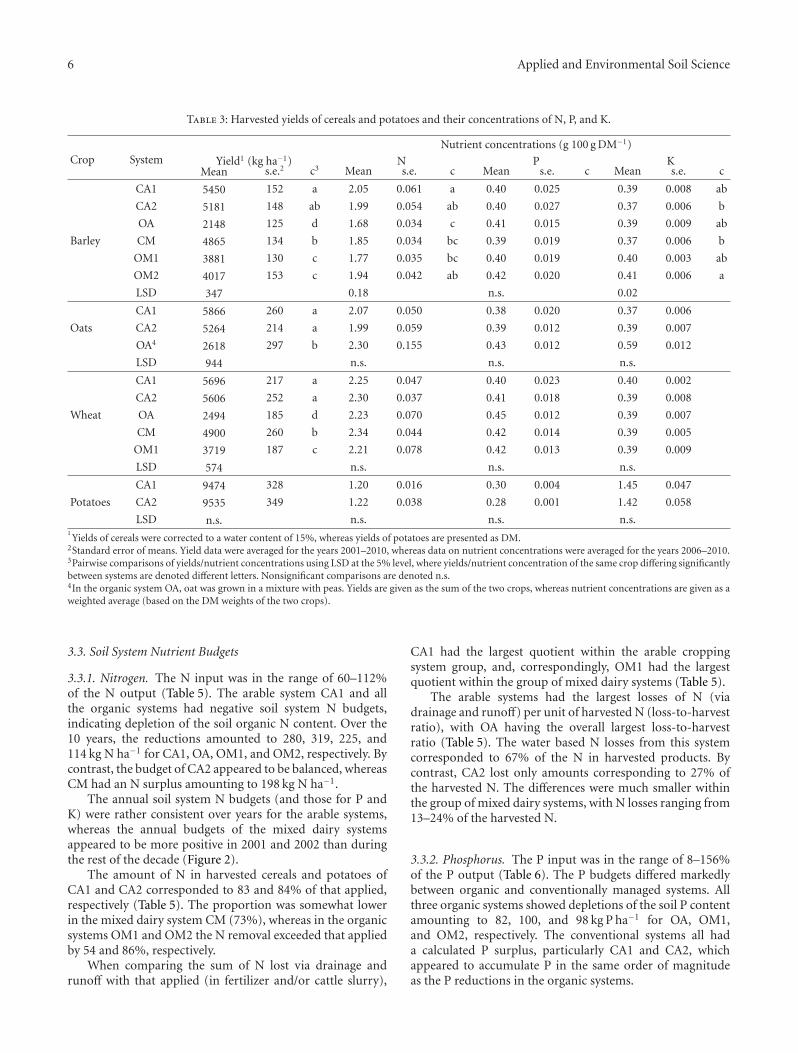
The annual DM yield of the systems averaged over cropsappeared to follow the same pattern between years withineach production group (Figure 2).
3.2. Nutrient Concentrations of the Harvested Crops. Theonly differences in nutrient concentrations among the cashcrops were for barley N and K (Table 3). The barley Nconcentration was highest in CA1, followed by CA2 andOM2 whereas OA had the lowest N concentration. Thedifferences were smaller for K, with highest concentration inbarley from OM2, and lowest in barley from CA2 and CM.
The N concentration in herbage (grass clover ley) differedsignificantly between systems at the 2nd cut in both ley year1 and 2 (ley year 3 was not comparable between systems),with lower concentration in CM than in the two organicsystems, which had similar concentrations (Table 4). For theconcentrations of K, the tendency was opposite, at leastat the first cut. Organically cropped grass clover ley hadsignificantly lower K concentration than that of CM at thefirst cut of ley year 2.
6 Applied and Environmental Soil Science
Table 3: Harvested yields of cereals and potatoes and their concentrations of N, P, and K.
Crop SystemNutrient concentrations (g 100 g DM−1)
Yield1 (kg ha−1) N P KMean s.e.2 c3 Mean s.e. c Mean s.e. c Mean s.e. c
CA1 5450 152 a 2.05 0.061 a 0.40 0.025 0.39 0.008 ab
CA2 5181 148 ab 1.99 0.054 ab 0.40 0.027 0.37 0.006 b
OA 2148 125 d 1.68 0.034 c 0.41 0.015 0.39 0.009 ab
Barley CM 4865 134 b 1.85 0.034 bc 0.39 0.019 0.37 0.006 b
OM1 3881 130 c 1.77 0.035 bc 0.40 0.019 0.40 0.003 ab
OM2 4017 153 c 1.94 0.042 ab 0.42 0.020 0.41 0.006 a
LSD 347 0.18 n.s. 0.02
CA1 5866 260 a 2.07 0.050 0.38 0.020 0.37 0.006
Oats CA2 5264 214 a 1.99 0.059 0.39 0.012 0.39 0.007
OA4 2618 297 b 2.30 0.155 0.43 0.012 0.59 0.012
LSD 944 n.s. n.s. n.s.
CA1 5696 217 a 2.25 0.047 0.40 0.023 0.40 0.002
CA2 5606 252 a 2.30 0.037 0.41 0.018 0.39 0.008
Wheat OA 2494 185 d 2.23 0.070 0.45 0.012 0.39 0.007
CM 4900 260 b 2.34 0.044 0.42 0.014 0.39 0.005
OM1 3719 187 c 2.21 0.078 0.42 0.013 0.39 0.009
LSD 574 n.s. n.s. n.s.
CA1 9474 328 1.20 0.016 0.30 0.004 1.45 0.047
Potatoes CA2 9535 349 1.22 0.038 0.28 0.001 1.42 0.058
LSD n.s. n.s. n.s. n.s.1Yields of cereals were corrected to a water content of 15%, whereas yields of potatoes are presented as DM.
2Standard error of means. Yield data were averaged for the years 2001–2010, whereas data on nutrient concentrations were averaged for the years 2006–2010.3Pairwise comparisons of yields/nutrient concentrations using LSD at the 5% level, where yields/nutrient concentration of the same crop differing significantlybetween systems are denoted different letters. Nonsignificant comparisons are denoted n.s.4In the organic system OA, oat was grown in a mixture with peas. Yields are given as the sum of the two crops, whereas nutrient concentrations are given as aweighted average (based on the DM weights of the two crops).
3.3. Soil System Nutrient Budgets
3.3.1. Nitrogen. The N input was in the range of 60–112%of the N output (Table 5). The arable system CA1 and allthe organic systems had negative soil system N budgets,indicating depletion of the soil organic N content. Over the10 years, the reductions amounted to 280, 319, 225, and114 kg N ha−1 for CA1, OA, OM1, and OM2, respectively. Bycontrast, the budget of CA2 appeared to be balanced, whereasCM had an N surplus amounting to 198 kg N ha−1.
The annual soil system N budgets (and those for P andK) were rather consistent over years for the arable systems,whereas the annual budgets of the mixed dairy systemsappeared to be more positive in 2001 and 2002 than duringthe rest of the decade (Figure 2).
The amount of N in harvested cereals and potatoes ofCA1 and CA2 corresponded to 83 and 84% of that applied,respectively (Table 5). The proportion was somewhat lowerin the mixed dairy system CM (73%), whereas in the organicsystems OM1 and OM2 the N removal exceeded that appliedby 54 and 86%, respectively.
When comparing the sum of N lost via drainage andrunoff with that applied (in fertilizer and/or cattle slurry),
CA1 had the largest quotient within the arable croppingsystem group, and, correspondingly, OM1 had the largestquotient within the group of mixed dairy systems (Table 5).
The arable systems had the largest losses of N (viadrainage and runoff) per unit of harvested N (loss-to-harvestratio), with OA having the overall largest loss-to-harvestratio (Table 5). The water based N losses from this systemcorresponded to 67% of the N in harvested products. Bycontrast, CA2 lost only amounts corresponding to 27% ofthe harvested N. The differences were much smaller withinthe group of mixed dairy systems, with N losses ranging from13–24% of the harvested N.
3.3.2. Phosphorus. The P input was in the range of 8–156%of the P output (Table 6). The P budgets differed markedlybetween organic and conventionally managed systems. Allthree organic systems showed depletions of the soil P contentamounting to 82, 100, and 98 kg P ha−1 for OA, OM1,and OM2, respectively. The conventional systems all hada calculated P surplus, particularly CA1 and CA2, whichappeared to accumulate P in the same order of magnitudeas the P reductions in the organic systems.
Applied and Environmental Soil Science 7
Table 4: Harvested ley yields, clover contentand concentrations of N, P, and K.
Year SystemCut
Nutrient concentrations (g 100 g DM−1)
Yield (kg DM ha−1) Clover1 (%) N P K
Mean s.e.2 c3 Mean s.e. c4 Mean s.e. c5 Mean s.e. c Mean s.e. c
CM 9630 335 a
Cut 1 4765 171 7 1.4 b 1.50 0.06 0.22 0.01 1.84 0.09
Cut 2 4865 243 10 2.4 B 1.48 0.09 B 0.28 0.02 1.98 0.14
OM1 8203 319 b
Cut 1 4092 218 27 2.6 a 1.55 0.09 0.22 0.01 1.69 0.06
Yr 1 Cut 2 4111 248 45 4.7 A 2.24 0.05 A 0.31 0.02 2.10 0.10
OM2 8342 278 b
Cut 1 4099 194 27 2.4 a 1.61 0.10 0.24 0.016 1.68 0.11
Cut 2 4243 228 40 5.0 A 2.16 0.16 A 0.32 0.01 2.02 0.08
LSD6 710 12 n.s. n.s. n.s.
LSD7 11 0.45 n.s. n.s.
CM 11021 304 a
Cut 1 6269 180 11 2.1 b 1.57 0.04 0.24 0.01 1.99 0.08 a
Cut 2 4752 233 11 2.1 A 1.46 0.06 B 0.27 0.02 1.82 0.09
OM1 9542 264 b
Yr 2 Cut 1 5453 188 34 2.5 a 1.64 0.11 0.22 0.01 1.65 0.06 b
Cut 2 4089 201 42 3.6 B 2.19 0.04 A 0.30 0.01 1.76 0.07
OM2 9586 312 b
Cut 1 5399 209 30 2.9 a 1.64 0.10 0.25 0.01 1.69 0.06 b
Cut 2 4187 189 36 2.5 B 2.22 0.13 A 0.30 0.01 1.84 0.05
LSD6 892 10 n.s. n.s. 0.25
LSD7 13 0.51 n.s. n.s.
OM2 8651
Yr 3 Cut 1 5499 169 19 2.3 1.52 0.05 0.24 0.01 1.60 0.08
Cut 2 3151 217 24 2.8 2.11 0.06 0.31 0.01 1.65 0.091The proportion of legumes was determined visually before harvest.
2Standard error of means. Yield data were averaged for the years 2001–2010, whereas data on nutrient concentrations were averaged for the years 2006–2010.3Pairwise comparisons of yields (sum of two cuts) using LSD at the 5% level, where yields of the same crop not differing significantly between systems aredenoted the same letter.4Pairwise comparisons of clover content separate for each cut, where clover contents of the first cut not differing significantly between systems are denotedthe same letter, whereas clover contents of the second cut not differing significantly between systems are denoted the same capital letter.5Pairwise comparisons of nutrient concentrations separate for each cut, where concentrations of the first cut not differing significantly between systems aredenoted the same letter, whereas concentrations of the second cut not differing significantly between systems are denoted the same capital letter.6LSD values at 5% level for the total yields (sum of two cuts) and that for clover content and nutrient concentrations of first cut.7LSD values at 5% level for clover content and nutrient concentrations of the second cut.
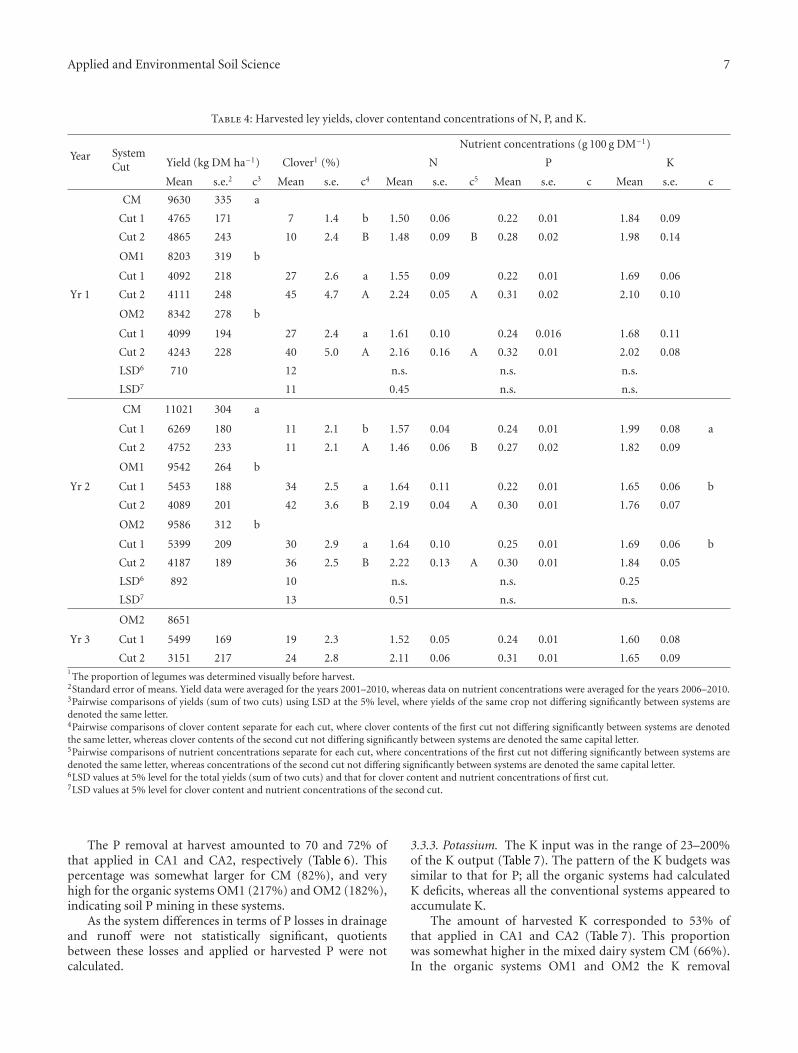
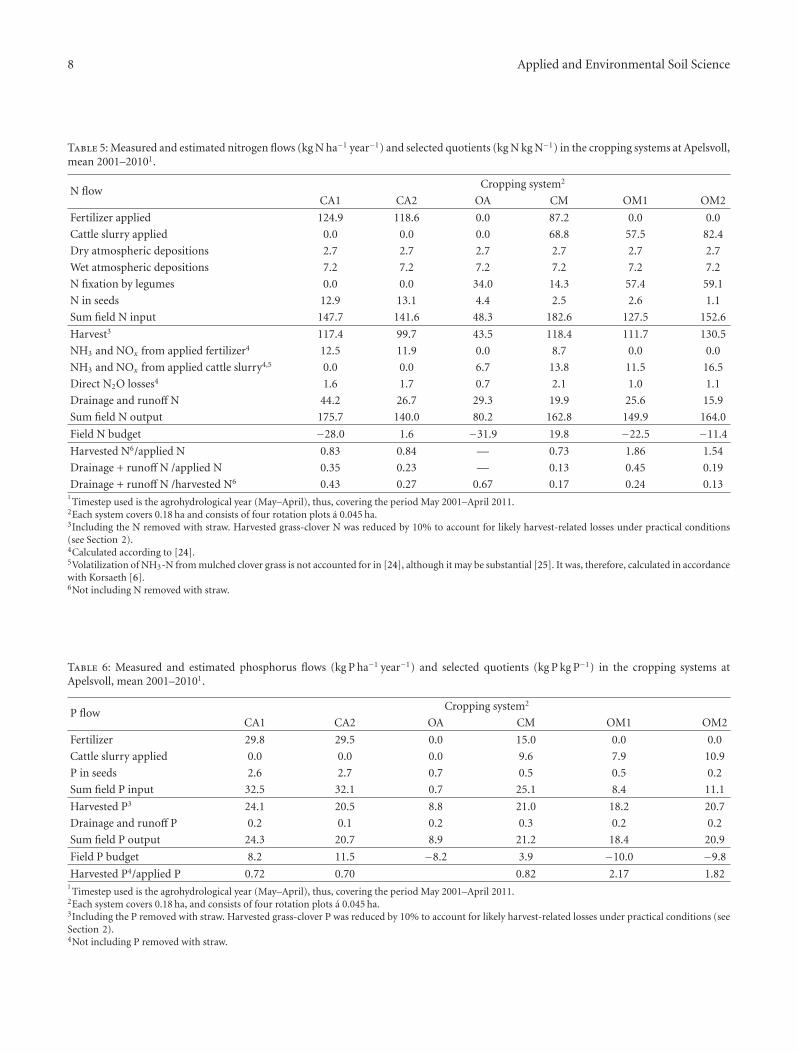
The P removal at harvest amounted to 70 and 72% ofthat applied in CA1 and CA2, respectively (Table 6). Thispercentage was somewhat larger for CM (82%), and veryhigh for the organic systems OM1 (217%) and OM2 (182%),indicating soil P mining in these systems.
As the system differences in terms of P losses in drainageand runoff were not statistically significant, quotientsbetween these losses and applied or harvested P were notcalculated.
3.3.3. Potassium. The K input was in the range of 23–200%of the K output (Table 7). The pattern of the K budgets wassimilar to that for P; all the organic systems had calculatedK deficits, whereas all the conventional systems appeared toaccumulate K.
The amount of harvested K corresponded to 53% ofthat applied in CA1 and CA2 (Table 7). This proportionwas somewhat higher in the mixed dairy system CM (66%).In the organic systems OM1 and OM2 the K removal
8 Applied and Environmental Soil Science
Table 5: Measured and estimated nitrogen flows (kg N ha−1 year−1) and selected quotients (kg N kg N−1) in the cropping systems at Apelsvoll,mean 2001–20101.
N flowCropping system2
CA1 CA2 OA CM OM1 OM2
Fertilizer applied 124.9 118.6 0.0 87.2 0.0 0.0
Cattle slurry applied 0.0 0.0 0.0 68.8 57.5 82.4
Dry atmospheric depositions 2.7 2.7 2.7 2.7 2.7 2.7
Wet atmospheric depositions 7.2 7.2 7.2 7.2 7.2 7.2
N fixation by legumes 0.0 0.0 34.0 14.3 57.4 59.1
N in seeds 12.9 13.1 4.4 2.5 2.6 1.1
Sum field N input 147.7 141.6 48.3 182.6 127.5 152.6
Harvest3 117.4 99.7 43.5 118.4 111.7 130.5
NH3 and NOx from applied fertilizer4 12.5 11.9 0.0 8.7 0.0 0.0
NH3 and NOx from applied cattle slurry4,5 0.0 0.0 6.7 13.8 11.5 16.5
Direct N2O losses4 1.6 1.7 0.7 2.1 1.0 1.1
Drainage and runoff N 44.2 26.7 29.3 19.9 25.6 15.9
Sum field N output 175.7 140.0 80.2 162.8 149.9 164.0
Field N budget −28.0 1.6 −31.9 19.8 −22.5 −11.4
Harvested N6/applied N 0.83 0.84 — 0.73 1.86 1.54
Drainage + runoff N /applied N 0.35 0.23 — 0.13 0.45 0.19
Drainage + runoff N /harvested N6 0.43 0.27 0.67 0.17 0.24 0.131Timestep used is the agrohydrological year (May–April), thus, covering the period May 2001–April 2011.
2Each system covers 0.18 ha and consists of four rotation plots a 0.045 ha.3Including the N removed with straw. Harvested grass-clover N was reduced by 10% to account for likely harvest-related losses under practical conditions(see Section 2).4Calculated according to [24].5Volatilization of NH3-N from mulched clover grass is not accounted for in [24], although it may be substantial [25]. It was, therefore, calculated in accordancewith Korsaeth [6].6Not including N removed with straw.
Table 6: Measured and estimated phosphorus flows (kg P ha−1 year−1) and selected quotients (kg P kg P−1) in the cropping systems atApelsvoll, mean 2001–20101.
P flowCropping system2
CA1 CA2 OA CM OM1 OM2
Fertilizer 29.8 29.5 0.0 15.0 0.0 0.0
Cattle slurry applied 0.0 0.0 0.0 9.6 7.9 10.9
P in seeds 2.6 2.7 0.7 0.5 0.5 0.2
Sum field P input 32.5 32.1 0.7 25.1 8.4 11.1
Harvested P3 24.1 20.5 8.8 21.0 18.2 20.7
Drainage and runoff P 0.2 0.1 0.2 0.3 0.2 0.2
Sum field P output 24.3 20.7 8.9 21.2 18.4 20.9
Field P budget 8.2 11.5 −8.2 3.9 −10.0 −9.8
Harvested P4/applied P 0.72 0.70 0.82 2.17 1.821Timestep used is the agrohydrological year (May–April), thus, covering the period May 2001–April 2011.
2Each system covers 0.18 ha, and consists of four rotation plots a 0.045 ha.3Including the P removed with straw. Harvested grass-clover P was reduced by 10% to account for likely harvest-related losses under practical conditions (seeSection 2).4Not including P removed with straw.
Applied and Environmental Soil Science 9
0
1
2
3
4
5
6
7
10
30
50
70CA1
0
1
2
3
4
5
6
7
10
30
50
70CA2
0
1
2
3
4
5
6
7
10
30
50
70
2001 2002 2003 2004 2005 2006 2007 2008 2009 2010
Agrohydrological year
2001 2002 2003 2004 2005 2006 2007 2008 2009 2010
Agrohydrological year
2001 2002 2003 2004 2005 2006 2007 2008 2009 2010
Agrohydrological year
OA
−10
−30
−50
−70
−10
−30
−50
−70
−10
−30
−50
−70
Har
vest
ed m
atte
r (M
g D
M h
a−1
)
Nu
trie
nt
fiel
d bu
dget
s (k
g h
a−1)
Har
vest
ed m
atte
r (M
g D
M h
a−1
)
Nu
trie
nt
fiel
d bu
dget
s (k
g h
a−1)
Har
vest
ed m
atte
r (M
g D
M h
a−1
)
Nu
trie
nt
fiel
d bu
dget
s (k
g h
a−1)
0123456789
1030507090
110CM
0123456789
1030507090
110OM1
0123456789
1030507090
110
2001 2002 2003 2004 2005 2006 2007 2008 2009 2010
Agrohydrological year
2001 2002 2003 2004 2005 2006 2007 2008 2009 2010
Agrohydrological year
2001 2002 2003 2004 2005 2006 2007 2008 2009 2010
Agrohydrological year
OM2
−10−30−50−70
−10−30−50−70
−10−30−50−70
Har
vest
ed m
atte
r (M
g D
M h
a−1
)
Nu
trie
nt
fiel
d bu
dget
s (k
g h
a−1)
Har
vest
ed m
atte
r (M
g D
M h
a−1
)
Nu
trie
nt
fiel
d bu
dget
s (k
g h
a−1)
Har
vest
ed m
atte
r (M
g D
M h
a−1
)
Nu
trie
nt
fiel
d bu
dget
s (k
g h
a−1)
Figure 2: Annual (agrohydrological year) harvested dry matter yields averaged over crops (lines) (right y-axis) and soil system budgets forN (black bars), P (white bars), and K (grey bars) (left y-axis) for CA1 (conventional arable: upper left subplot), CA2 (conventional arable,environmentally sound: middle left subplot), OA (organic arable: lower left subplot), CM (conventional mixed dairy: upper right subplot),OM1 (organic mixed dairy: middle right subplot), and OM2 (organic mixed dairy with 75% clover ley: lower right subplot).
at harvest was only slightly larger than the amount of Kapplied.
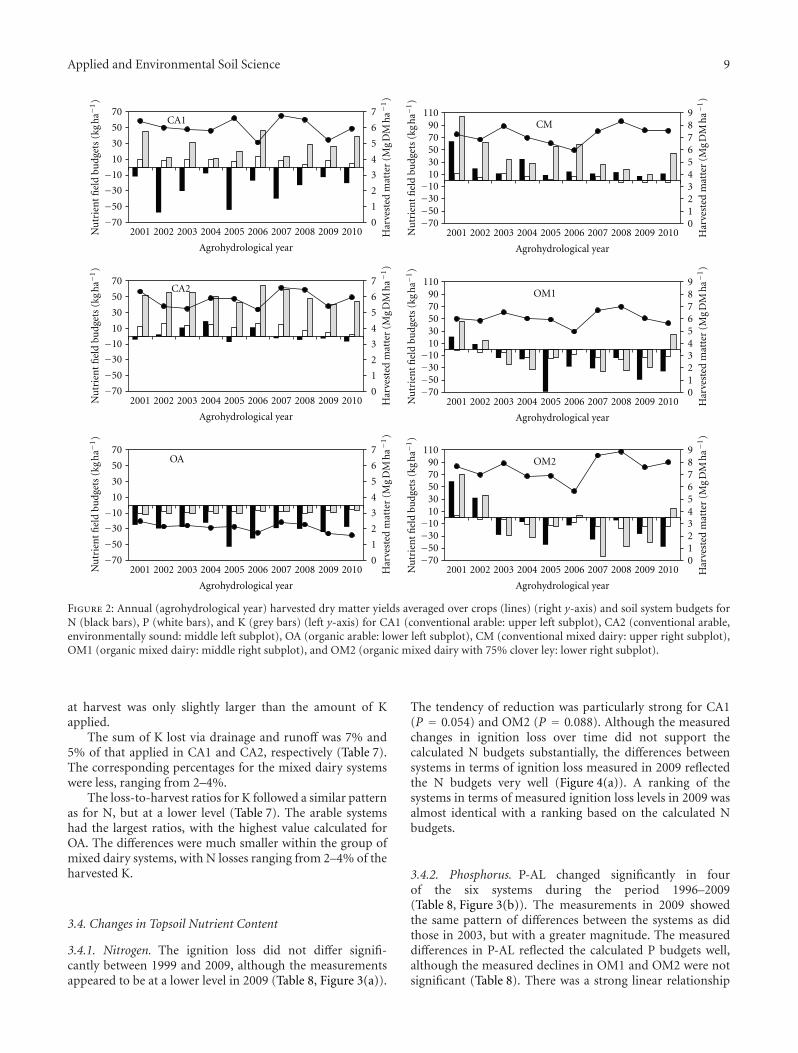
The sum of K lost via drainage and runoff was 7% and5% of that applied in CA1 and CA2, respectively (Table 7).The corresponding percentages for the mixed dairy systemswere less, ranging from 2–4%.
The loss-to-harvest ratios for K followed a similar patternas for N, but at a lower level (Table 7). The arable systemshad the largest ratios, with the highest value calculated forOA. The differences were much smaller within the group ofmixed dairy systems, with N losses ranging from 2–4% of theharvested K.
3.4. Changes in Topsoil Nutrient Content
3.4.1. Nitrogen. The ignition loss did not differ signifi-cantly between 1999 and 2009, although the measurementsappeared to be at a lower level in 2009 (Table 8, Figure 3(a)).
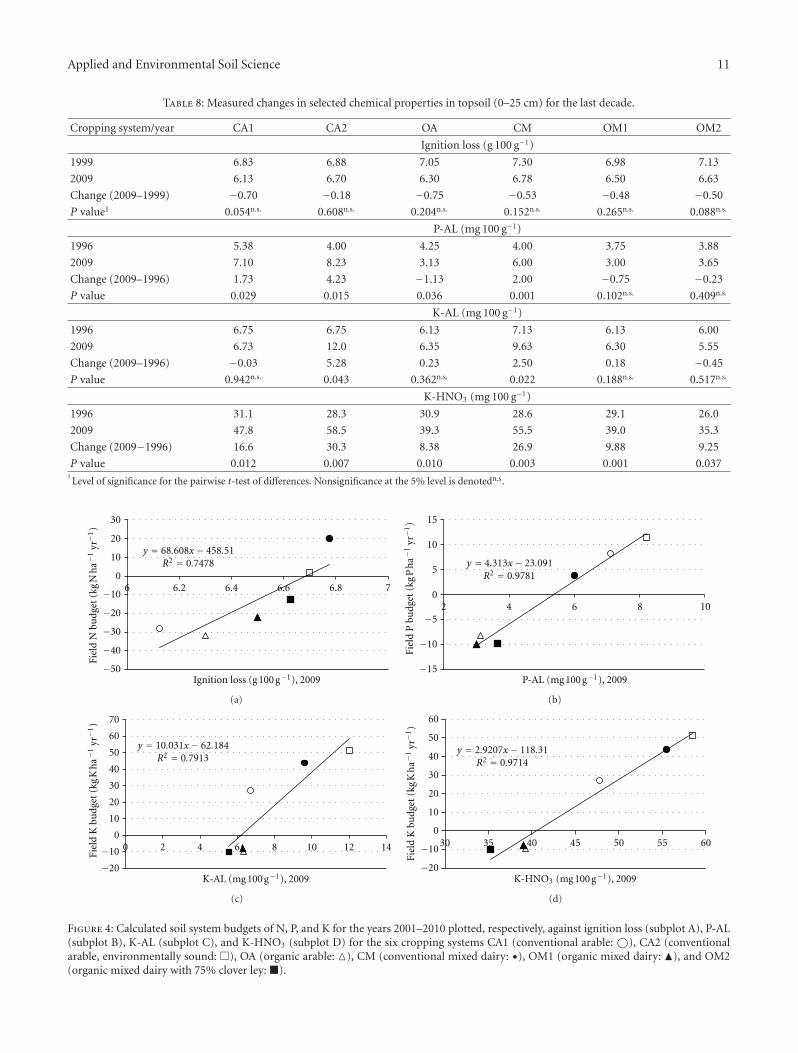
The tendency of reduction was particularly strong for CA1(P = 0.054) and OM2 (P = 0.088). Although the measuredchanges in ignition loss over time did not support thecalculated N budgets substantially, the differences betweensystems in terms of ignition loss measured in 2009 reflectedthe N budgets very well (Figure 4(a)). A ranking of thesystems in terms of measured ignition loss levels in 2009 wasalmost identical with a ranking based on the calculated Nbudgets.
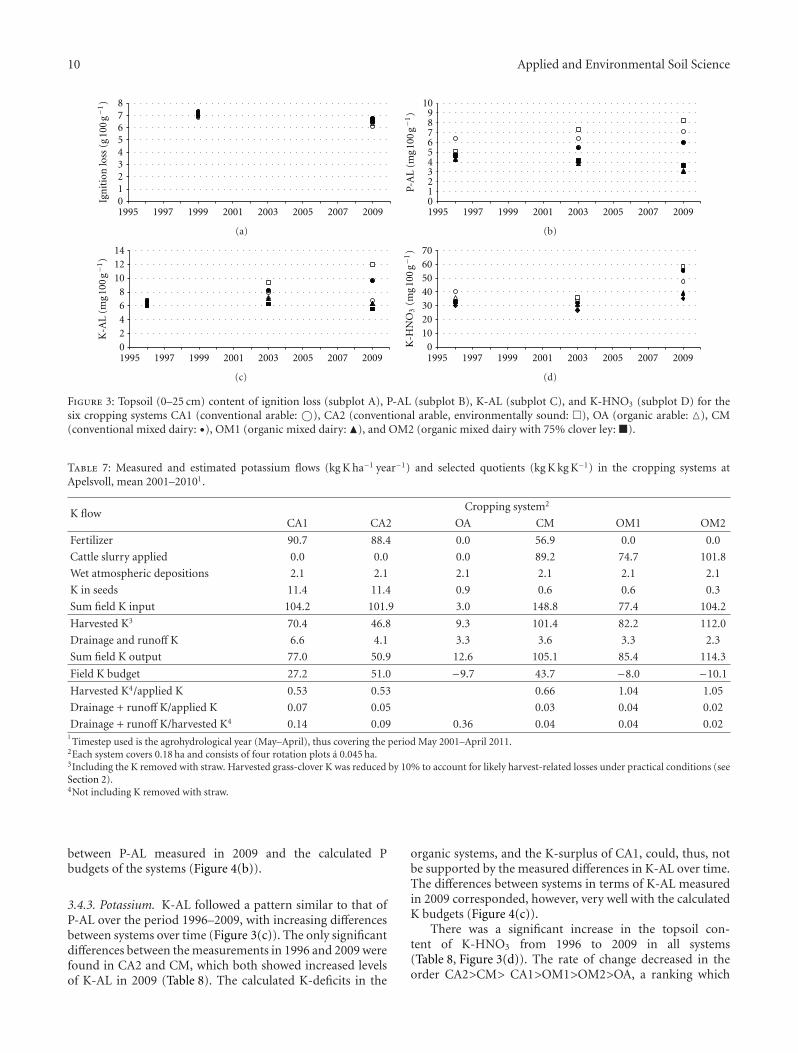
3.4.2. Phosphorus. P-AL changed significantly in fourof the six systems during the period 1996–2009(Table 8, Figure 3(b)). The measurements in 2009 showedthe same pattern of differences between the systems as didthose in 2003, but with a greater magnitude. The measureddifferences in P-AL reflected the calculated P budgets well,although the measured declines in OM1 and OM2 were notsignificant (Table 8). There was a strong linear relationship
10 Applied and Environmental Soil Science
012345678
1995 1997 1999 2001 2003 2005 2007 2009
Ign
itio
n lo
ss (
g 10
0 g−1
)
(a)
0123456789
10
P-A
L (m
g 10
0 g−1
)
1995 1997 1999 2001 2003 2005 2007 2009
(b)
02468
101214
K-A
L (m
g 10
0 g−1
)
1995 1997 1999 2001 2003 2005 2007 2009
(c)
010203040506070
K-H
NO
3(m
g 10
0 g−1
)
1995 1997 1999 2001 2003 2005 2007 2009
(d)
Figure 3: Topsoil (0–25 cm) content of ignition loss (subplot A), P-AL (subplot B), K-AL (subplot C), and K-HNO3 (subplot D) for thesix cropping systems CA1 (conventional arable: ©), CA2 (conventional arable, environmentally sound: �), OA (organic arable: �), CM(conventional mixed dairy: •), OM1 (organic mixed dairy: �), and OM2 (organic mixed dairy with 75% clover ley: �).
Table 7: Measured and estimated potassium flows (kg K ha−1 year−1) and selected quotients (kg K kg K−1) in the cropping systems atApelsvoll, mean 2001–20101.
K flowCropping system2
CA1 CA2 OA CM OM1 OM2
Fertilizer 90.7 88.4 0.0 56.9 0.0 0.0
Cattle slurry applied 0.0 0.0 0.0 89.2 74.7 101.8
Wet atmospheric depositions 2.1 2.1 2.1 2.1 2.1 2.1
K in seeds 11.4 11.4 0.9 0.6 0.6 0.3
Sum field K input 104.2 101.9 3.0 148.8 77.4 104.2
Harvested K3 70.4 46.8 9.3 101.4 82.2 112.0
Drainage and runoff K 6.6 4.1 3.3 3.6 3.3 2.3
Sum field K output 77.0 50.9 12.6 105.1 85.4 114.3
Field K budget 27.2 51.0 −9.7 43.7 −8.0 −10.1
Harvested K4/applied K 0.53 0.53 0.66 1.04 1.05
Drainage + runoff K/applied K 0.07 0.05 0.03 0.04 0.02
Drainage + runoff K/harvested K4 0.14 0.09 0.36 0.04 0.04 0.021Timestep used is the agrohydrological year (May–April), thus covering the period May 2001–April 2011.
2Each system covers 0.18 ha and consists of four rotation plots a 0.045 ha.3Including the K removed with straw. Harvested grass-clover K was reduced by 10% to account for likely harvest-related losses under practical conditions (seeSection 2).4Not including K removed with straw.
between P-AL measured in 2009 and the calculated Pbudgets of the systems (Figure 4(b)).
3.4.3. Potassium. K-AL followed a pattern similar to that ofP-AL over the period 1996–2009, with increasing differencesbetween systems over time (Figure 3(c)). The only significantdifferences between the measurements in 1996 and 2009 werefound in CA2 and CM, which both showed increased levelsof K-AL in 2009 (Table 8). The calculated K-deficits in the
organic systems, and the K-surplus of CA1, could, thus, notbe supported by the measured differences in K-AL over time.The differences between systems in terms of K-AL measuredin 2009 corresponded, however, very well with the calculatedK budgets (Figure 4(c)).
There was a significant increase in the topsoil con-tent of K-HNO3 from 1996 to 2009 in all systems(Table 8, Figure 3(d)). The rate of change decreased in theorder CA2>CM> CA1>OM1>OM2>OA, a ranking which
Applied and Environmental Soil Science 11
Table 8: Measured changes in selected chemical properties in topsoil (0–25 cm) for the last decade.
Cropping system/year CA1 CA2 OA CM OM1 OM2
Ignition loss (g 100 g−1)
1999 6.83 6.88 7.05 7.30 6.98 7.13
2009 6.13 6.70 6.30 6.78 6.50 6.63
Change (2009–1999) −0.70 −0.18 −0.75 −0.53 −0.48 −0.50
P value1 0.054n.s. 0.608n.s. 0.204n.s. 0.152n.s. 0.265n.s. 0.088n.s.
P-AL (mg 100 g−1)
1996 5.38 4.00 4.25 4.00 3.75 3.88
2009 7.10 8.23 3.13 6.00 3.00 3.65
Change (2009–1996) 1.73 4.23 −1.13 2.00 −0.75 −0.23
P value 0.029 0.015 0.036 0.001 0.102n.s. 0.409n.s.
K-AL (mg 100 g−1)
1996 6.75 6.75 6.13 7.13 6.13 6.00
2009 6.73 12.0 6.35 9.63 6.30 5.55
Change (2009–1996) −0.03 5.28 0.23 2.50 0.18 −0.45
P value 0.942n.s. 0.043 0.362n.s. 0.022 0.188n.s. 0.517n.s.
K-HNO3 (mg 100 g−1)
1996 31.1 28.3 30.9 28.6 29.1 26.0
2009 47.8 58.5 39.3 55.5 39.0 35.3
Change (2009−1996) 16.6 30.3 8.38 26.9 9.88 9.25
P value 0.012 0.007 0.010 0.003 0.001 0.0371Level of significance for the pairwise t-test of differences. Nonsignificance at the 5% level is denotedn.s.
0
10
20
30
6 6.2 6.4 6.6 6.8 7−10
−20
−30
−40
−50
y = 68.608x − 458.51R2 = 0.7478
Ignition loss (g 100 g−1), 2009
Fiel
d N
bu
dget
(kg
N h
a−1
yr−1
)
(a)
0
5
10
15
2 4 6 8 10−5
−10
−15
y = 4.313x − 23.091R2 = 0.9781
P-AL (mg 100 g−1), 2009
Fiel
d P
bu
dget
(kg
P h
a−1
yr−1
)
(b)
0
10
20
30
40
50
60
70
0 2 4 6 8 10 12 14−10
−20
y = 10.031x − 62.184R2 = 0.7913
K-AL (mg 100 g−1), 2009
Fiel
d K
bu
dget
(kg
K h
a−1
yr−1
)
(c)
0
10
20
30
40
50
60
30 35 40 45 50 55 60−10
−20
y = 2.9207x − 118.31R2 = 0.9714
K-HNO3 (mg 100 g−1), 2009
Fiel
d K
bu
dget
(kg
K h
a−1
yr−1
)
(d)
Figure 4: Calculated soil system budgets of N, P, and K for the years 2001–2010 plotted, respectively, against ignition loss (subplot A), P-AL(subplot B), K-AL (subplot C), and K-HNO3 (subplot D) for the six cropping systems CA1 (conventional arable: ©), CA2 (conventionalarable, environmentally sound: �), OA (organic arable: �), CM (conventional mixed dairy: •), OM1 (organic mixed dairy: �), and OM2(organic mixed dairy with 75% clover ley: �).
12 Applied and Environmental Soil Science
corresponded well with a ranking of the calculated Kbudgets. The relation between the soil measurements in 2009and the calculated K budgets was even stronger for K-HNO3
than it was for K-AL (Figure 4(d)).
4. Discussion
4.1. Yields. Both cereal yield levels and relative yield differ-ences between systems followed the same pattern for thewhole period 2001–2010 as for the years 2001–2004, whichwere discussed by Korsaeth [6]. Briefly, the yield differenceswere larger amongst the arable systems than amongst themixed dairy systems. The low yields in OA may be explainedby P and K deficits, as indicated by the negative P andK budgets and the significant reduction in plant availabletopsoil P, and due to the lack of chemical plant protection.More foliar diseases were generally observed on cereals in theorganic systems than in the other systems (data not shown).
The lack of significant differences in measured potatoparameters between the two cropping systems (CA1 andCA2) is partly in accordance with the findings of Riley andEkeberg [27], who compared spring and autumn ploughingat different depths (10, 20, and 30 cm) with tine harrowingonly in spring, on the same soil type at a nearby location.They found the same potato fresh weight yields in alltreatments, but the tuber dry matter concentration wassignificantly lower in potatoes grown without ploughing.
Among the mixed dairy systems, the organically growncereal yields were also lower than those grown convention-ally. However, due to much smaller differences in nutrientregime, the differences between mixed dairy systems were lessthan those between arable systems. The most likely reasonsfor inferior yields in the organic mixed dairy systems relativeto the conventional mixed dairy system were, as for the arablesystems, suboptimal nutrition and a lack of plant protection.
The yield pattern of grass clover ley was also unchangedin 2005–10 compared with the first four years of the decade[6]. The high yields of the organic leys may be explainedpartly by their N fixation, which was estimated to be muchgreater in the organic leys than in the conventional leys. Thiswas a result of the significantly higher proportions of cloverin the organic leys and less suppression of N fixation bythe use of inorganic N fertilizer. The reduced grass cloveryields in the 3rd ley year of OM2 may be due to the reducedproportion of clover compared with the first two ley years.
The long period of active nutrient uptake by grass andclover may also partly explain the relatively high organicley yields. A longer uptake period increases the utilizationof less readily available nutrients (e.g., nutrients in organicform), since the mineralization of such nutrients occursthroughout the cropping season. Smaller yield differencesbetween organic and conventional cropping for grass cloverley than for cereals have been reported previously for thisexperiment [28].
In a review of a number of Swedish field studies,Bergstrom et al. [29] reported that crop yields in organicrotations were reduced by 20 to 80%, compared withthe same crops in conventional rotations. These authorsexplained this in terms of higher N deficiency, more weed
competition, and greater infestation of crop diseases in theorganic systems.
4.2. Soil System Nutrient Budgets and Nutrient Concentrations
of Topsoil and Crops
4.2.1. Nitrogen. The large calculated deficits found for thearable systems CA1 and OA in the first part of the decade[6] were sustained. The suggested net soil N depletioncorresponded to a relative decay rate of the topsoil (0–25 cm)N content of 0.4% yr−1. This corresponds well with Rileyand Bakkegard [30], who compared soil samples taken in1991 and in 2001 from 291 arable fields located throughoutsoutheast Norway. They found that the percentage relativedecline rate of SOM was approximately one tenth of theinitial percentage of organic matter in soil over the decade.In the present study, there was a strong tendency (P = 0.054)towards reduced ignition loss for CA1 in 2009 compared with1999; but this was not the case for OA.
Comparing conventional and organic cropping systemsin a pipe-drained plot experiment in Sweden, Torstensson etal. [31] also reported an N deficit (−18 kg N ha−1 yr−1, notincluding denitrification, N in seeds and atmospheric depo-sitions) for a conventional arable rotation (CON, barley-oat-spring wheat-barley-oat-potato) comparable with CA1.They tested additionally an arable organic system withgreen manure as the only N source (OGM, oat-greenmanure-spring wheat-oat-green manure-potato), compara-ble with OA and found a positive soil system N budget(13 kg N ha−1 yr−1) in contrast to the present findings. In theexperiment of Torstensson et al. [31], the proportion of greenmanure was, however, larger than in our case (33% versus25%), which resulted in 37 kg N ha−1 yr−1 more N fixationand 20 kg N ha−1 yr−1 less harvested N, compared with OA.
The only arable system which appeared to have abalanced N budget was CA2. This may mainly be explainedby its comparative low leaching and runoff N losses, whichrepresent the main difference between CA1 and CA2 withregard to N flows. The findings indicate that reducedtillage counteracted soil N mining, which is a commonlyreported result (e.g., [32]). Another factor which may havecontributed to prevent soil N mining in CA2 is that straw wasnot removed. Straw incorporation has a well-known positiveeffect on the soil organic N content (e.g., [33]).
The conventional mixed dairy system CM had a calcu-lated N surplus over the decade, which indicates that thesystem probably increased its soil organic matter content.Conservation of or an increase in soil N has also beenreported for other rotations containing pasture or leyreceiving organic N on relatively N-rich (>2.0 g kg−1) soils[32, 33]. The opposite was found in the organic system OM1,with the same crop rotation and tillage as CM, but with acalculated N deficit of 23 kg N ha−1 yr−1, indicating that therelatively high production has been maintained at the costof the soil organic N pool. Similarly, Steinshamn et al. [34]reported an annual N deficit of 16 kg N ha−1, not includingN leaching and denitrification, at the field level in an organic
Applied and Environmental Soil Science 13
crop rotation with 50% grassland (barley, forage rape +Italian ryegrass, oats + peas, 3-year grassland).
The slightly negative N budget of OM2 (−16 kg N ha−1)shows that a high proportion of grass clover ley in therotation does not guarantee a balanced N budget. Bycomparison, Syvasalo et al. [35] reported an even larger Ndeficit (−31 kg N ha−1 yr−1, not including ammonia emis-sions, deposition, or N in seeds) in an organic grass cloverley receiving 130 kg N ha−1 in cattle slurry. An extra year ofgrass clover ley instead of wheat in the OM2 rotation resultedin the largest calculated amounts of available cattle slurry forthis system (82 kg N ha−1), but the N fixation was apparentlymuch less effective in the additional ley year than in theprevious two ley years. The estimated N fixation of the thirdley year was only 43 kg N ha−1 yr−1, compared with 82 and88 kg in the 1st and 2nd ley year, respectively.
The annual nutrient budgets of the mixed dairy systemsshowed more positive figures for 2001 and 2002 comparedwith the following eight years. This was a result of too highyield expectations when calculating the initial amount ofslurry available for these systems in 2001. The number ofcows which each farming system could sustain, and, thus,the amount of slurry available for the crops, was calculatedfrom the average total available feed in the system duringthe previous three years (sliding mean). The initializationproblem was, thus, gradually levelled out.
The calculated changes in soil N, that is, misbalanced soilsystem N budgets, were in general poorly supported by themeasured changes in topsoil ignition loss since 1999, whichwere all nonsignificant. Considering the large differences inthe measured N flows between the systems, it is very unlikelythat the SOM level of 1999 would have been sustained inall systems over the following decade. One explanation ofthe mismatch could be an over- or underestimation of theestimated gaseous N losses, which were the most uncertainN flows in the calculated budgets. If these losses were largelyoverestimated, the calculated deficits of CA1, OA, OM1,and OM2 would have been reduced, but the calculatedsurplus of OM would have increased, and vice versa. Anotherexplanation could be that some organic matter has beentransported from topsoil to subsoil. Such a translocation oforganic matter may have taken place, but it seems unlikelythat this process has diverged significantly between systemswith more or less the same crop rotation.
The relative differences between the systems in 2009matched the calculated soil system N budgets much betterthan the differences found between sampling times, indicat-ing that the 1999 data may include some random variation.The relation between ignition losses in 2009 and the Nbudgets indicated that ignition loss would equilibrate at67 g kg−1 with a balanced N budget. This corresponds to anSOM content of 47 g kg−1, calculated with a pedotransferfunction developed solely for this site (SOM = 0.81× ignitionloss (%)−0.038 × clay (%)−0.70), [21]).
The significant differences between systems in terms of Nconcentrations of the harvested crops were few and reflectedpoorly the differences in fertilization regime and soil systemN budgets. Greenwood et al. [36] developed a model linking
N concentration in plant DM to growth rate and to plantmass per unit area. They found that subcritical values ofN concentration during growth affected the growth rate.In order to define whether any of the crops in the presentstudy were N limited, measurements of N concentrationduring crop growth and not at harvest would, thus, have beenrequired.
4.2.2. Phosphorus. Conventional arable cropping appearedto give relatively large surpluses of P. In the past, moreemphasis, in Norway, was placed on adjusting N fertilizerrates to crop requirements than to adjusting P rates. In 2007–2008 there was a change in the fertilizer recommendationsfor P in Norway, with a reduction of approx. 25% forcereals and grasses and 30% for potatoes. This promptedthe fertilizer market leader in Norway (market share > 90%)to increase the N : P-ratio of their most used compoundfertilizers, from 5.3 to 7.3 for cereals and from 2.2 to 3.0 forpotatoes, thus reducing the amounts of P for a given amountof N.
The organic arable system did not receive any P, and theproduction was thus entirely dependent on P supply from thesoil. The negative soil system budget of 8 kg P ha−1 yr−1 wasthe same as that found in a stockless organic farm (red clover-winter wheat-spring beans-spring cereal) in the UK [15]. Theresults show that in stockless organic farming systems, someform of external P addition becomes unavoidable sooner orlater (depending on the size of the initial P pool and theability of the soil to deliver plant available P). Berry et al.[15] showed that a system comparable with OA was almostin balance in terms of P when it received rock phosphate.From a resource economics point of view, it is questionable;however, whether the use of untreated rock phosphate isa good strategy, considering its low plant availability [37].An alternative could be to use organic waste, such as biogasresidue from household waste, which has been shown to be avaluable and inexpensive source of plant nutrients [38].
The conventional mixed dairy system had a field surplusof almost 4 kg P ha−1 yr−1, suggesting an unnecessary use ofa limited resource. This appears to be no exception. In acomparable farming system in northern Sweden, Bengtssonet al. [39] reported a P surplus of 5 kg P ha−1 yr−1. Theproblem seems to be even worse on conventional dairy farms,that is, those with no or a very low proportion of arable crops.The P surplus on such farms is assumed to vary from 10 to72 kg ha−1 in Europe (Pfimlin et al. 2006, cited by [40]).
The organic mixed dairy systems produced at the costof their indigenous soil P pool, with a total deficit of about10 kg P ha−1 yr−1. This was not surprising, considering thatthere was no P input to these systems, except for that inseeds. Even when some feed is purchased, P deficits arecommonly reported. Berry et al. [15] reported soil surfacebudgets (i.e., maximum root depth as lower boundary) of−3 kg P ha−1 yr−1 in a mixed dairy system in the UK (leycropped in 3 out of 5 years, farm number 3). Steinshamnet al. [34] found a deficit between inputs and produce(losses not considered) in an organic dairy farming systemin Norway of 6.3 kg P ha−1 yr−1.
14 Applied and Environmental Soil Science
All the significant changes in topsoil P-AL from 1996to 2009 were in the same direction as the correspondingcalculated soil system P budgets. The budget calculationswere also supported by the very strong relation between thetopsoil level of AL-extractable P in 2009 and the calculatedsoil system budget. The results clearly show the effect of bothoverfertilization and suboptimal P fertilization on the plantavailability of P in soil.
In the present study, P losses to subsoil, that is, below rootdepth, were considered to be negligible. On a comparable soilin the long-term fertilizer trials at Møystad in S.E. Norway,Riley [41] found no effect of P treatment (no P addition, P inmineral fertilizer, or P in animal manure) below 40 cm depth.In contrast, Verloop et al. [40], studying intensive dairyfarming systems, found that some topsoil P was transportedto subsoil and that the P accumulation in the deeper layerspractically equalled the P depletion in the upper topsoil.Their experiment was, however, run on a light sandy soil,characterized by a 0.3 m anthropogenic topsoil overlaying alayer of yellow sand hardly penetrable by roots.
With an assumed balanced P budget, P-AL appearedto equilibrate at 54 mg P kg−1, a level which is normallyconsidered adequate for optimum growth. In the long-term trials at Møystad, Ekeberg and Riley [8] also founda strong relationship between topsoil P-AL and P balance(P applied via fertilizer and/or farmyard manure minusP removed by harvest) for the period 1922–1983. Theyreported that P-AL equilibrated at 25–30 mg P kg−1 when theapplication of P equalled the removal of P by crops. Thisequilibrium point rose to about 40 mg P kg−1 in the period1983–2003 (H. Riley, personal communication). Experiencesfrom an intensive dairy farm in The Netherlands, where P-equilibrium fertilization (i.e., balancing P inputs via fertilizerand manure with P in crop products) is performed, hasshown that the soil available P-status differs between croprotations.
The P content of the crops did not differ between thesystems, and the herbage concentrations of P were in therange of 0.2–0.3%, a level which is regarded as adequate [42].In comparison, Mathews et al. [43] considered 0.2–0.34% Pto be the critical concentration for cool-season grasses, thatis, a concentration level below which a 10% yield drop isexpected. It, thus, appears that the grass clover growth wasnot P limited in the organic mixed dairy systems, in spite ofthe continuous soil P depletion of these systems.
4.2.3. Potassium. The potassium soil system budgets showedthat the conventional arable systems had unnecessarily highlevels of K fertilization. As for P, the change in the compoundfertilizers (from 2009) also altered the amount of K relativeto N, with a N : K-ratio increasing from 2.1 to 2.2 for cerealfertilizer and from 0.65 to 0.67 for potato fertilizer. Althoughthis change has some importance for practical farming, it didnot influence the results presented here.
In contrast to the present findings, Torstensson et al.[31] reported a small K deficit (−3 kg K ha−1 yr−1) in a6 year conventional rotation with five years of springcereals and one year with potatoes, comparable with CA1.
Additionally, they found a large deficit (−28 kg K ha−1 yr−1)in a similar crop rotation but with ryegrass grown as acatch crop after each main crop, comparable with CA2.The contrasting findings of Torstensson et al. [31] maylargely be explained by the K leaching, which were 5–7 timeslarger in their experiment than in the present study. Theliterature appears inconclusive, however, when it comes toK-budgets for conventional arable cropping systems. Thiswas well illustrated by Heming [44], who studied a largenumber of fields in southern England, reporting K budgets(K applied in fertilizer minus K in crop) ranging from −40to +70 kg K ha−1 yr−1.
The organic arable system OA had a calculated K-deficit.Stockless organic systems without any form of K applicationare bound to result in negative K budgets, as has beencommonly reported (e.g., [15, 31, 45]). Interestingly, thecalculated deficit in OA was of the same magnitude as thecalculated deficits of the two organic mixed dairy systems(OM1 and OM2). The relatively large inputs of K in appliedslurry in the mixed dairy systems, thus, appeared to be morethan outweighed by large K export via harvested material.Reviewing a range of cropping systems in northern Europe,Oborn et al. [46] summarized that negative farm gate andsoil surface K budgets are especially common in organicfarming. This was supported by Øgaard and Hansen [47],who found negative K budgets in grassland fields on 23 outof 26 organic farms in Norway. In a study of three long-term field experiments with mixed cropping systems (six yearrotations with 2/6 or 3/6 ley) on sandy loam soils over the 18year period 1997–2004, Andrist-Rangel et al. [48] reportednegative K budgets (input minus crop offtake) for organicsystems in the range of −22 to −75 kg K ha−1 yr−1. Theyalso found, however, that a conventional mixed croppingsystem had negative field budgets during the same period,ranging from −21 to −60 K ha−1 yr−1, in contrast to theconventional mixed cropping system of the present study(CM), which had a calculated surplus of 44 kg K ha−1 yr−1.On the other hand, Bengtsson et al. [39] reported a K surplusof 39 kg K ha−1 yr−1 in a comparable conventional system innorthern Sweden.
The only significant changes in measured topsoil K-AL were the increase in CA2 and CM, in correspondencewith their large calculated field K surpluses. The relativedifferences between systems in terms of calculated K budgetswere well reflected in the relative differences between changesof K-HNO3 and there was a clear relation between K budgetsand measured levels of both K-AL and K-HNO3 in 2009.The relatively large, negative soil system K budgets for theorganic systems were, however, not reflected by the soilmeasurements. Could it be that the soil system K budgetswere largely underestimated (i.e., underestimated inputsand/or overestimated outputs)?
Errors in K mass budgets are not an uncommonphenomenon (e.g., [46]). It seems unlikely, however,that such errors alone could explain the lack of fitbetween the calculated K budgets and the soil K mea-surements. For example, the unfertilized system OA wouldneed a budget correction of about 10 kg K ha−1 yr−1,in order to achieve a balanced soil system K budget,
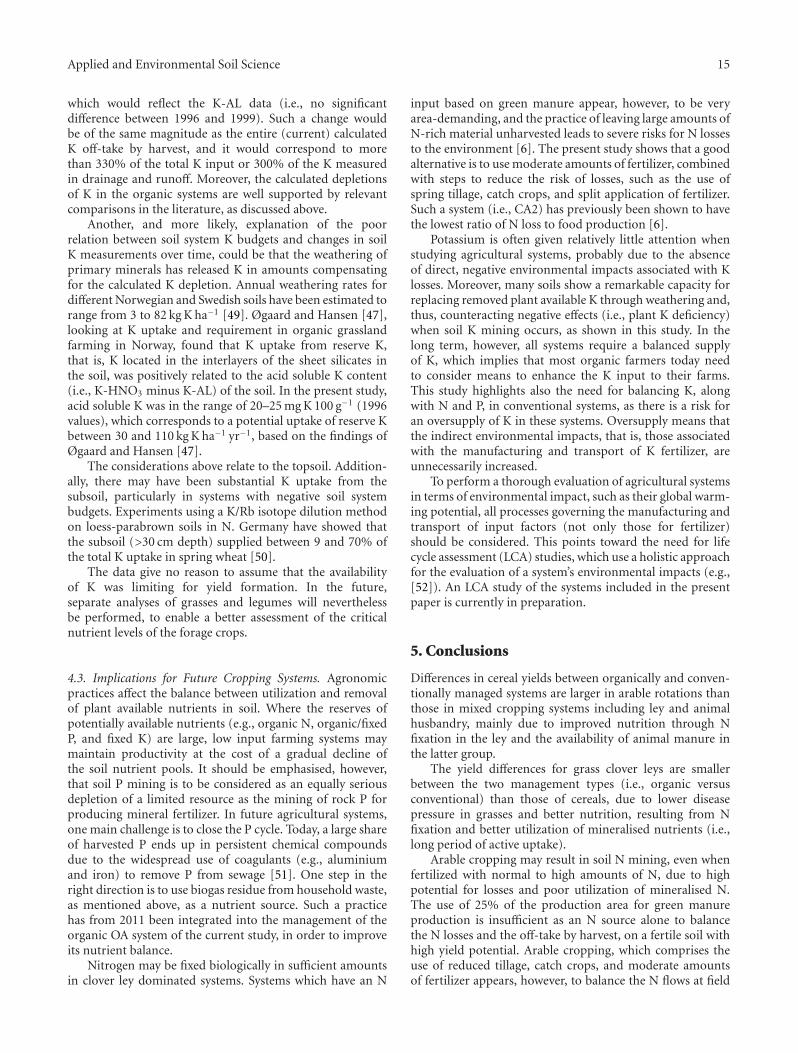
Applied and Environmental Soil Science 15
which would reflect the K-AL data (i.e., no significantdifference between 1996 and 1999). Such a change wouldbe of the same magnitude as the entire (current) calculatedK off-take by harvest, and it would correspond to morethan 330% of the total K input or 300% of the K measuredin drainage and runoff. Moreover, the calculated depletionsof K in the organic systems are well supported by relevantcomparisons in the literature, as discussed above.
Another, and more likely, explanation of the poorrelation between soil system K budgets and changes in soilK measurements over time, could be that the weathering ofprimary minerals has released K in amounts compensatingfor the calculated K depletion. Annual weathering rates fordifferent Norwegian and Swedish soils have been estimated torange from 3 to 82 kg K ha−1 [49]. Øgaard and Hansen [47],looking at K uptake and requirement in organic grasslandfarming in Norway, found that K uptake from reserve K,that is, K located in the interlayers of the sheet silicates inthe soil, was positively related to the acid soluble K content(i.e., K-HNO3 minus K-AL) of the soil. In the present study,acid soluble K was in the range of 20–25 mg K 100 g−1 (1996values), which corresponds to a potential uptake of reserve Kbetween 30 and 110 kg K ha−1 yr−1, based on the findings ofØgaard and Hansen [47].
The considerations above relate to the topsoil. Addition-ally, there may have been substantial K uptake from thesubsoil, particularly in systems with negative soil systembudgets. Experiments using a K/Rb isotope dilution methodon loess-parabrown soils in N. Germany have showed thatthe subsoil (>30 cm depth) supplied between 9 and 70% ofthe total K uptake in spring wheat [50].
The data give no reason to assume that the availabilityof K was limiting for yield formation. In the future,separate analyses of grasses and legumes will neverthelessbe performed, to enable a better assessment of the criticalnutrient levels of the forage crops.
4.3. Implications for Future Cropping Systems. Agronomicpractices affect the balance between utilization and removalof plant available nutrients in soil. Where the reserves ofpotentially available nutrients (e.g., organic N, organic/fixedP, and fixed K) are large, low input farming systems maymaintain productivity at the cost of a gradual decline ofthe soil nutrient pools. It should be emphasised, however,that soil P mining is to be considered as an equally seriousdepletion of a limited resource as the mining of rock P forproducing mineral fertilizer. In future agricultural systems,one main challenge is to close the P cycle. Today, a large shareof harvested P ends up in persistent chemical compoundsdue to the widespread use of coagulants (e.g., aluminiumand iron) to remove P from sewage [51]. One step in theright direction is to use biogas residue from household waste,as mentioned above, as a nutrient source. Such a practicehas from 2011 been integrated into the management of theorganic OA system of the current study, in order to improveits nutrient balance.
Nitrogen may be fixed biologically in sufficient amountsin clover ley dominated systems. Systems which have an N
input based on green manure appear, however, to be veryarea-demanding, and the practice of leaving large amounts ofN-rich material unharvested leads to severe risks for N lossesto the environment [6]. The present study shows that a goodalternative is to use moderate amounts of fertilizer, combinedwith steps to reduce the risk of losses, such as the use ofspring tillage, catch crops, and split application of fertilizer.Such a system (i.e., CA2) has previously been shown to havethe lowest ratio of N loss to food production [6].
Potassium is often given relatively little attention whenstudying agricultural systems, probably due to the absenceof direct, negative environmental impacts associated with Klosses. Moreover, many soils show a remarkable capacity forreplacing removed plant available K through weathering and,thus, counteracting negative effects (i.e., plant K deficiency)when soil K mining occurs, as shown in this study. In thelong term, however, all systems require a balanced supplyof K, which implies that most organic farmers today needto consider means to enhance the K input to their farms.This study highlights also the need for balancing K, alongwith N and P, in conventional systems, as there is a risk foran oversupply of K in these systems. Oversupply means thatthe indirect environmental impacts, that is, those associatedwith the manufacturing and transport of K fertilizer, areunnecessarily increased.
To perform a thorough evaluation of agricultural systemsin terms of environmental impact, such as their global warm-ing potential, all processes governing the manufacturing andtransport of input factors (not only those for fertilizer)should be considered. This points toward the need for lifecycle assessment (LCA) studies, which use a holistic approachfor the evaluation of a system’s environmental impacts (e.g.,[52]). An LCA study of the systems included in the presentpaper is currently in preparation.
5. Conclusions
Differences in cereal yields between organically and conven-tionally managed systems are larger in arable rotations thanthose in mixed cropping systems including ley and animalhusbandry, mainly due to improved nutrition through Nfixation in the ley and the availability of animal manure inthe latter group.
The yield differences for grass clover leys are smallerbetween the two management types (i.e., organic versusconventional) than those of cereals, due to lower diseasepressure in grasses and better nutrition, resulting from Nfixation and better utilization of mineralised nutrients (i.e.,long period of active uptake).
Arable cropping may result in soil N mining, even whenfertilized with normal to high amounts of N, due to highpotential for losses and poor utilization of mineralised N.The use of 25% of the production area for green manureproduction is insufficient as an N source alone to balancethe N losses and the off-take by harvest, on a fertile soil withhigh yield potential. Arable cropping, which comprises theuse of reduced tillage, catch crops, and moderate amountsof fertilizer appears, however, to balance the N flows at field
16 Applied and Environmental Soil Science
level. The use of P and K fertilizer in arable crop productionmay be used to balance the respective nutrient flows but itshould be used with care, as over supply is a great risk.
Mixed dairy systems, producing both cereals and foddercrops, risk an undersupply of both N, P, and K, if there isno import of these nutrients to the system in the form ofpurchased fodder and/or other nutrient sources. The fixationof N by the legumes in the forage crops appears to beinsufficient as the only N source. The use of mineral fertilizermay very well be used to balance the flows of N, P, and K inmixed dairy systems, but this leads to a risk of oversupply.
A relatively fertile soil may be exposed to substantialmining of N, P, and K over many years without causingdetectible nutrient deficits in plants cropped on this soil. Along-term over- or undersupply will, sooner or later, result ina significant change in the content of plant available nutrientsin the soil, but this change may be masked by the release ofnutrients from nonavailable compounds.
Field nutrient budgets appear to be a good approach tothe evaluation of whether a system is managed in a balancedway or not with regard to important nutrients such as N, P,and K, long before eventual unbalances become detectibleby traditional analyses. However, the approach requirescomprehensive datasets, which are usually unavailable underpractical conditions.
Acknowledgments
H. Riley is gratefully acknowledged for critically reading thepaper and T. Gaardløs for his skilled technical assistance.The project was funded jointly by the Norwegian Institutefor Agricultural and Environmental Research, the ResearchCouncil of Norway, and Yara International ASA.
References
[1] R. Eltun, “The Apelsvoll cropping system experiment. III.Yield and grain quality of cereals,” Norwegian Journal ofAgriculture, vol. 10, no. 1, pp. 7–22, 1996.
[2] A. Korsaeth and R. Eltun, “Nitrogen mass balances inconventional, integrated and ecological cropping systems andthe relationship between balance calculations and nitrogenrunoff in an 8-year field experiment in Norway,” Agriculture,Ecosystems and Environment, vol. 79, no. 2-3, pp. 199–214,2000.
[3] G. Lien, O. Flaten, A. Korsaeth et al., “Comparison of riskin organic, integrated and conventional cropping systems inEastern Norway,” Journal of Farm Management, vol. 12, no. 7,pp. 385–401, 2006.
[4] T. A. Breland and R. Eltun, “Soil microbial biomass and miner-alization of carbon and nitrogen in ecological, integrated andconventional forage and arable cropping systems,” Biology andFertility of Soils, vol. 30, no. 3, pp. 193–201, 1999.
[5] H. Riley, R. Pommeresche, R. Eltun, S. Hansen, and A.Korsaeth, “Soil structure, organic matter and earthwormactivity in a comparison of cropping systems with contrastingtillage, rotations, fertilizer levels and manure use,” Agriculture,Ecosystems and Environment, vol. 124, no. 3-4, pp. 275–284,2008.
[6] A. Korsaeth, “Relations between nitrogen leaching and foodproductivity in organic and conventional cropping systems ina long-term field study,” Agriculture, Ecosystems and Environ-ment, vol. 127, no. 3-4, pp. 177–188, 2008.
[7] B. T. Christensen and A. E. Johnston, “Chapter 18 Soilorganic matter and soil quality-Lessons learned from long-term experiments at Askov and Rothamsted,” Developments inSoil Science, vol. 25, no. C, pp. 399–430, 1997.
[8] E. Ekeberg and H. Riley, “The long-term fertilizer trials atMøystad, S:E: Norway,” SP Report 29, 100th AnniversaryWorkshop Askov Experimental Station, 1995.
[9] N. A. Fettell and H. S. Gill, “Long-term effects of tillage,stubble, and nitrogen management on properties of a red-brown earth,” Australian Journal of Experimental Agriculture,vol. 35, no. 7, pp. 923–928, 1995.
[10] P. R. Poulton, “The importance of long-term trials inunderstanding sustainable farming systems: the Rothamstedexperience,” Australian Journal of Experimental Agriculture,vol. 35, no. 7, pp. 825–834, 1995.
[11] W. R. Raun, G. V. Johnson, S. B. Phillips, and R. L. Westerman,“Effect of long-term N fertilization on soil organic C andtotal N in continuous wheat under conventional tillage inOklahoma,” Soil and Tillage Research, vol. 47, no. 3-4, pp. 323–330, 1998.
[12] J. Leifeld, R. Reiser, and H. R. Oberholzer, “Consequences ofconventional versus organic farming on soil carbon: resultsfrom a 27-year field experiment,” Agronomy Journal, vol. 101,no. 5, pp. 1204–1218, 2009.
[13] C. F. Drury, T. O. Oloya, D. J. McKenney, E. G. Gregorich, C.S. Tan, and C. L. vanLuyk, “Long-term effects of fertilizationand rotation on denitrification and soil carbon,” Soil ScienceSociety of America Journal, vol. 62, no. 6, pp. 1572–1579, 1998.
[14] C. M. Penfold, M. S. Miyan, T. G. Reeves, and I. T. Grierson,“Biological farming for sustainable agricultural production,”Australian Journal of Experimental Agriculture, vol. 35, no. 7,pp. 849–856, 1995.
[15] P. M. Berry, E. A. Stockdale, R. Sylvester-Bradley et al., “N, Pand K budgets for crop rotations on nine organic farms in theUK,” Soil Use and Management, vol. 19, no. 2, pp. 112–118,2003.
[16] O. Oenema, H. Kros, and W. De Vries, “Approaches anduncertainties in nutrient budgets: implications for nutrientmanagement and environmental policies,” European Journal ofAgronomy, vol. 20, no. 1-2, pp. 3–16, 2003.
[17] O. Oenema and M. Heinen, “Uncertainties in nutrient budgetdue to biases and errors,” in Nutrient Disequilibria in Agroe-cosystems: Concepts and Case Studies, E. M. A. Smaling, O.Oenema, and L. O. Fresco, Eds., pp. 75–97, CAB International,Wallingford, UK, 1999.
[18] W. De Vries, J. Kros, O. Oenema, and J. De Klein, “Uncer-tainties in the fate of nitrogen II: a quantitative assessment ofthe uncertainties in major nitrogen fluxes in the Netherlands,”Nutrient Cycling in Agroecosystems, vol. 66, no. 1, pp. 71–102,2003.
[19] A. Korsaeth, “Runoff and leaching losses of N, P, and Kin the period 2001–2011 in a long-term experiment withconventional and organic crop rotations,” In press.
[20] WRB, World Reference Base for Soil Resources, FAO, Rome,Italy, 1998.
[21] H. Riley and R. Eltun, “The Apelsvoll cropping systemexperiment. II. Soil characteristics,” Norwegian Journal ofAgricultural Sciences, vol. 8, pp. 317–333, 1994.
Applied and Environmental Soil Science 17
[22] H. Egner, H. Riehm, and W. R. Domingo, “Untersuchungenuber die chemische Bodenanalyse als Grundlage fur dieBeurteilung de Nahrstoffzustandes der Boden. II,” KungligaLantbrukshogskolans Annaler, vol. 26, pp. 199–215, 1960.
[23] W. Aas, S. Solberg, S. Manø, and K. E. Yttrei, “Overvaking avlangtransportert forurenset luft og nedbør,” Report NILU OR22/2007, Kjeller, Norway, 2007.
[24] IPCC National Greenhouse Gas Inventories Programme,“Agriculture, forestry and other land use,” in IPCC Guidelinesfor National Greenhouse Gas Inventories, H. S. Eggleston, L.Buendia, K. Miwa, T. Ngara, and K. Tanabe, Eds., vol. 4,chapter 11, pp. 1–11, IGES, Japan, 2006.
[25] L. Larsson, M. Ferm, A. Kasimir-Klemedtsson, and L.Klemedtsson, “Ammonia and nitrous oxide emissions fromgrass and alfalfa mulches,” Nutrient Cycling in Agroecosystems,vol. 51, no. 1, pp. 41–46, 1998.
[26] K. A. Gomez and A. A. Gomez, Statistical Procedures forAgricultural Research, Wiley & Sons, New York, NY, USA, 2ndedition, 1984.
[27] H. Riley and E. Ekeberg, “Effects of depth and time ofploughing on yields of spring cereals and potatoes and onsoil properties of a morainic loam soil,” Acta AgriculturaeScandinavica - Section B Soil and Plant Science, vol. 48, no. 4,pp. 193–200, 1998.
[28] R. Eltun, A. Korsaeth, and O. Nordheim, “A comparisonof environmental, soil fertility, yield, and economical effectsin six cropping systems based on an 8-year experiment inNorway,” Agriculture, Ecosystems and Environment, vol. 90, no.2, pp. 155–168, 2002.
[29] L. Bergstrom, H. Kirchmann, H. Aronsson, G. Torstensson,and L. Mattsson, “Use Efficiency and Leaching of Nutrientsin Organic and Conventional Cropping Systems in Sweden,”in Organic Crop Production—Ambitions and Limitations, H.Kirchmann and L. Bergstrom, Eds., pp. 117–141, Springer,New York, NY, USA, 2008.
[30] H. Riley and M. Bakkegard, “Declines of soil organic mattercontent under arable cropping in southeast Norway,” ActaAgriculturae Scandinavica Section B, vol. 56, no. 3, pp. 217–223, 2006.
[31] G. Torstensson, H. Aronsson, and L. Bergstrom, “Nutrient useefficiencies and leaching of organic and conventional croppingsystems in Sweden,” Agronomy Journal, vol. 98, no. 3, pp. 603–615, 2006.
[32] D. P. Heenan, W. J. McGhie, F. M. Thomson, and K. Y.Chan, “Decline in soil organic carbon and total nitrogenin relation to tillage, stubble management, and rotation,”Australian Journal of Experimental Agriculture, vol. 35, no. 7,pp. 877–884, 1995.
[33] G. Uhlen, “Long-term effects of fertilizers, manure, straw andcrop rotation on total-N and total-C in soil,” Acta AgriculturaeScandinavica, Section B, vol. 41, pp. 119–127, 1991.
[34] H. Steinshamn, E. Thuen, M. A. Bleken, U. T. Brenoe,G. Ekerholt, and C. Yri, “Utilization of nitrogen (N) andphosphorus (P) in an organic dairy farming system inNorway,” Agriculture, Ecosystems and Environment, vol. 104,no. 3, pp. 509–522, 2004.
[35] E. Syvasalo, K. Regina, E. Turtola, R. Lemola, and M. Esala,“Fluxes of nitrous oxide and methane, and nitrogen leachingfrom organically and conventionally cultivated sandy soil inwestern Finland,” Agriculture, Ecosystems and Environment,vol. 113, no. 1–4, pp. 342–348, 2006.
[36] D. J. Greenwood, F. Gastal, G. Lemaire, A. Draycott, P. Millard,and J. J. Neeteson, “Growth rate and % N of field grown crops:
theory and experiments,” Annals of Botany, vol. 67, no. 2, pp.181–190, 1991.
[37] F. E. Khasawneh and E. C. Doll, “The use of phosphate rockfor direct application to soils,” Advances in Agronomy, vol. 30,no. C, pp. 159–206, 1979.
[38] M. Odlare, M. Pell, and K. Svensson, “Changes in soil chemicaland microbiological properties during 4 years of applicationof various organic residues,” Waste Management, vol. 28, no.7, pp. 1246–1253, 2008.
[39] H. Bengtsson, I. Oborn, S. Jonsson, I. Nilsson, and A.Andersson, “Field balances of some mineral nutrients andtrace elements in organic and conventional dairy farming—acase study at Orjebyn, Sweden,” European Journal of Agronomy,vol. 20, no. 1-2, pp. 101–116, 2003.
[40] J. Verloop, J. Oenema, S. L. G. Burgers, H. F. M. Aarts, andH. van Keulen, “P-equilibrium fertilization in an intensivedairy farming system: effects on soil-P status, crop yield andP leaching,” Nutrient Cycling in Agroecosystems, vol. 87, no. 3,pp. 369–382, 2010.
[41] H. Riley, “Long-term fertilizer trials on loam soil at Møystad,south-eastern Norway: crop yields, nutrient balances andsoil chemical analyses from 1983 to 2003,” Acta AgriculturaeScandinavica Section B, vol. 57, no. 2, pp. 140–154, 2007.
[42] L. Taiz and E. Zeiger, Plant Physiology, Sinauer Associates,Sunderland, Mass, USA, 3rd edition, 2002.
[43] S. Mathews, J. P. I. Tritschler, and S. C. Miyasaka, “Phosphorusmanagement and sustainability,” in Grass for Daily Cattle, J.H. Cherney and D. J. R. Cherney, Eds., pp. 193–222, CABIInternational, Wallingford, UK, 1998.
[44] S. D. Heming, “Potassium balances for arable soils in southernEngland 1986–1999,” Soil Use and Management, vol. 20, no. 4,pp. 410–417, 2004.
[45] L. Blake, S. Mercik, M. Koerschens et al., “Potassium contentin soil, uptake in plants and the potassium balance in threeEuropean long-term field experiments,” Plant and Soil, vol.216, no. 1-2, pp. 1–14, 1999.
[46] I. Oborn, Y. Andrist-Rangel, M. Askekaard, C. A. Grant,C. A. Watson, and A. C. Edwards, “Critical aspects ofpotassium management in agricultural systems,” Soil Use andManagement, vol. 21, pp. 102–112, 2005.
[47] A. F. Øgaard and S. Hansen, “Potassium uptake and require-ment in organic grassland farming,” Nutrient Cycling inAgroecosystems, vol. 87, no. 1, pp. 137–149, 2010.
[48] Y. Andrist-Rangel, A. C. Edwards, S. Hillier, and I. Oborn,“Long-term K dynamics in organic and conventional mixedcropping systems as related to management and soil proper-ties,” Agriculture, Ecosystems and Environment, vol. 122, no. 4,pp. 413–426, 2007.
[49] J. Holmqvist, A. F. Øgaard, I. Oborn, A. C. Edwards, L.Mattsson, and H. Sverdrup, “Application of the Profile modelto estimate potassium release from mineral weathering inNorthern European agricultural soils,” European Journal ofAgronomy, vol. 20, no. 1-2, pp. 149–163, 2003.
[50] H. Kuhlmann, “Importance of the subsoil for the K nutritionof crops,” Plant and Soil, vol. 127, no. 1, pp. 129–136, 1990.
[51] L. E. De-Bashan and Y. Bashan, “Recent advances in removingphosphorus from wastewater and its future use as fertilizer(1997–2003),” Water Research, vol. 38, no. 19, pp. 4222–4246,2004.
[52] A.-G. Roer, A. Korsaeth, T. M. Henriksen, O. Michelsen, andA. H. Strømman, “The influence of system boundaries onlife cycle assessment of grain production in central southeastNorway,” Agricultural Systems, vol. 111, pp. 75–84, 2012.
Hindawi Publishing CorporationApplied and Environmental Soil ScienceVolume 2012, Article ID 548620, 10 pagesdoi:10.1155/2012/548620
Research Article
Impact of No-Tillage and Conventional Tillage Systems onSoil Microbial Communities
Reji P. Mathew,1 Yucheng Feng,1 Leonard Githinji,2
Ramble Ankumah,2 and Kipling S. Balkcom3
1 Department of Agronomy and Soils, Auburn University, Auburn, AL 36849, USA2 Department of Agricultural and Environmental Sciences, Tuskegee University, Tuskegee, AL 36088, USA3 USDA-ARS, Auburn, AL 36849, USA
Correspondence should be addressed to Yucheng Feng, [email protected]
Received 6 December 2011; Revised 4 April 2012; Accepted 5 April 2012
Academic Editor: Philip White
Copyright © 2012 Reji P. Mathew et al. This is an open access article distributed under the Creative Commons Attribution License,which permits unrestricted use, distribution, and reproduction in any medium, provided the original work is properly cited.
Soil management practices influence soil physical and chemical characteristics and bring about changes in the soil microbialcommunity structure and function. In this study, the effects of long-term conventional and no-tillage practices on microbialcommunity structure, enzyme activities, and selected physicochemical properties were determined in a continuous corn system ona Decatur silt loam soil. The long-term no-tillage treatment resulted in higher soil carbon and nitrogen contents, viable microbialbiomass, and phosphatase activities at the 0–5 cm depth than the conventional tillage treatment. Soil microbial communitystructure assessed using phospholipid fatty acid (PLFA) analysis and automated ribosomal intergenic spacer analysis (ARISA)varied by tillage practice and soil depth. The abundance of PLFAs indicative of fungi, bacteria, arbuscular mycorrhizal fungi,and actinobacteria was consistently higher in the no-till surface soil. Results of principal components analysis based on soilphysicochemical and enzyme variables were in agreement with those based on PLFA and ARISA profiles. Soil organic carbonwas positively correlated with most of the PLFA biomarkers. These results indicate that tillage practice and soil depth were twoimportant factors affecting soil microbial community structure and activity, and conservation tillage practices improve bothphysicochemical and microbiological properties of soil.
1. Introduction
Tillage systems influence physical, chemical, and biologicalproperties of soil and have a major impact on soil producti-vity and sustainability. Conventional tillage practices mayadversely affect long-term soil productivity due to erosionand loss of organic matter in soils. Sustainable soil manage-ment can be practiced through conservation tillage (includ-ing no-tillage), high crop residue return, and crop rotation[1]. Studies conducted under a wide range of climatic condi-tions, soil types, and crop rotation systems showed that soilsunder no-tillage and reduced tillage have significantly highersoil organic matter contents compared with conventionallytilled soils [2].
Conservation tillage is defined as a tillage system in whichat least 30% of crop residues are left in the field and is
an important conservation practice to reduce soil erosion[3]. The advantages of conservation tillage practices overconventional tillage include (1) reducing cultivation cost; (2)allowing crop residues to act as an insulator and reducing soiltemperature fluctuation; (3) building up soil organic matter;(4) conserving soil moisture [4, 5].
Different tillage practices cause changes in soil physicalproperties, such as bulk density [6], water holding capacity[7], pore size distribution [8], and aggregation [9]. Strat-ification of soil organic matter and differences in nutrientdistribution have also been observed in long-term conser-vation tillage systems [10, 11]. Thus, altered soil physicaland chemical conditions under conservation tillage createsignificantly different habitats for microorganisms and resultin shifts of soil microbial community structure [10–13].Conventional tillage can lead to soil microbial communities
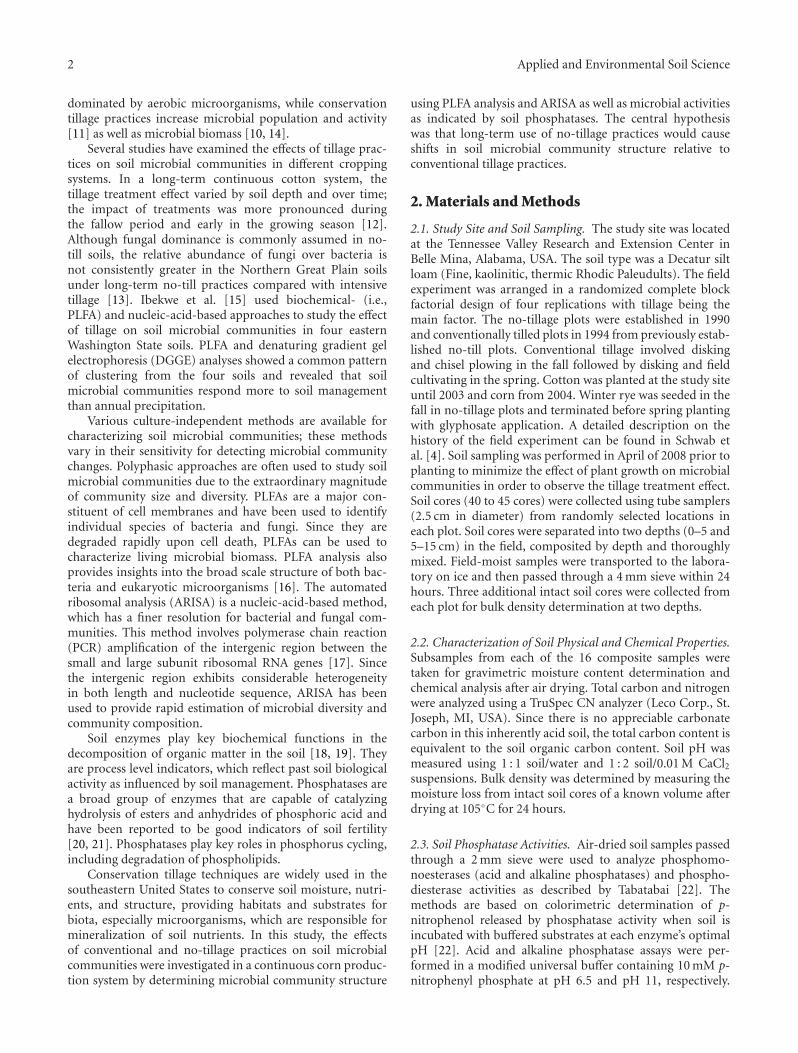
2 Applied and Environmental Soil Science
dominated by aerobic microorganisms, while conservationtillage practices increase microbial population and activity[11] as well as microbial biomass [10, 14].
Several studies have examined the effects of tillage prac-tices on soil microbial communities in different croppingsystems. In a long-term continuous cotton system, thetillage treatment effect varied by soil depth and over time;the impact of treatments was more pronounced duringthe fallow period and early in the growing season [12].Although fungal dominance is commonly assumed in no-till soils, the relative abundance of fungi over bacteria isnot consistently greater in the Northern Great Plain soilsunder long-term no-till practices compared with intensivetillage [13]. Ibekwe et al. [15] used biochemical- (i.e.,PLFA) and nucleic-acid-based approaches to study the effectof tillage on soil microbial communities in four easternWashington State soils. PLFA and denaturing gradient gelelectrophoresis (DGGE) analyses showed a common patternof clustering from the four soils and revealed that soilmicrobial communities respond more to soil managementthan annual precipitation.
Various culture-independent methods are available forcharacterizing soil microbial communities; these methodsvary in their sensitivity for detecting microbial communitychanges. Polyphasic approaches are often used to study soilmicrobial communities due to the extraordinary magnitudeof community size and diversity. PLFAs are a major con-stituent of cell membranes and have been used to identifyindividual species of bacteria and fungi. Since they aredegraded rapidly upon cell death, PLFAs can be used tocharacterize living microbial biomass. PLFA analysis alsoprovides insights into the broad scale structure of both bac-teria and eukaryotic microorganisms [16]. The automatedribosomal analysis (ARISA) is a nucleic-acid-based method,which has a finer resolution for bacterial and fungal com-munities. This method involves polymerase chain reaction(PCR) amplification of the intergenic region between thesmall and large subunit ribosomal RNA genes [17]. Sincethe intergenic region exhibits considerable heterogeneityin both length and nucleotide sequence, ARISA has beenused to provide rapid estimation of microbial diversity andcommunity composition.
Soil enzymes play key biochemical functions in thedecomposition of organic matter in the soil [18, 19]. Theyare process level indicators, which reflect past soil biologicalactivity as influenced by soil management. Phosphatases area broad group of enzymes that are capable of catalyzinghydrolysis of esters and anhydrides of phosphoric acid andhave been reported to be good indicators of soil fertility[20, 21]. Phosphatases play key roles in phosphorus cycling,including degradation of phospholipids.
Conservation tillage techniques are widely used in thesoutheastern United States to conserve soil moisture, nutri-ents, and structure, providing habitats and substrates forbiota, especially microorganisms, which are responsible formineralization of soil nutrients. In this study, the effectsof conventional and no-tillage practices on soil microbialcommunities were investigated in a continuous corn produc-tion system by determining microbial community structure
using PLFA analysis and ARISA as well as microbial activitiesas indicated by soil phosphatases. The central hypothesiswas that long-term use of no-tillage practices would causeshifts in soil microbial community structure relative toconventional tillage practices.
2. Materials and Methods
2.1. Study Site and Soil Sampling. The study site was locatedat the Tennessee Valley Research and Extension Center inBelle Mina, Alabama, USA. The soil type was a Decatur siltloam (Fine, kaolinitic, thermic Rhodic Paleudults). The fieldexperiment was arranged in a randomized complete blockfactorial design of four replications with tillage being themain factor. The no-tillage plots were established in 1990and conventionally tilled plots in 1994 from previously estab-lished no-till plots. Conventional tillage involved diskingand chisel plowing in the fall followed by disking and fieldcultivating in the spring. Cotton was planted at the study siteuntil 2003 and corn from 2004. Winter rye was seeded in thefall in no-tillage plots and terminated before spring plantingwith glyphosate application. A detailed description on thehistory of the field experiment can be found in Schwab etal. [4]. Soil sampling was performed in April of 2008 prior toplanting to minimize the effect of plant growth on microbialcommunities in order to observe the tillage treatment effect.Soil cores (40 to 45 cores) were collected using tube samplers(2.5 cm in diameter) from randomly selected locations ineach plot. Soil cores were separated into two depths (0–5 and5–15 cm) in the field, composited by depth and thoroughlymixed. Field-moist samples were transported to the labora-tory on ice and then passed through a 4 mm sieve within 24hours. Three additional intact soil cores were collected fromeach plot for bulk density determination at two depths.
2.2. Characterization of Soil Physical and Chemical Properties.Subsamples from each of the 16 composite samples weretaken for gravimetric moisture content determination andchemical analysis after air drying. Total carbon and nitrogenwere analyzed using a TruSpec CN analyzer (Leco Corp., St.Joseph, MI, USA). Since there is no appreciable carbonatecarbon in this inherently acid soil, the total carbon content isequivalent to the soil organic carbon content. Soil pH wasmeasured using 1 : 1 soil/water and 1 : 2 soil/0.01 M CaCl2suspensions. Bulk density was determined by measuring themoisture loss from intact soil cores of a known volume afterdrying at 105◦C for 24 hours.
2.3. Soil Phosphatase Activities. Air-dried soil samples passedthrough a 2 mm sieve were used to analyze phosphomo-noesterases (acid and alkaline phosphatases) and phospho-diesterase activities as described by Tabatabai [22]. Themethods are based on colorimetric determination of p-nitrophenol released by phosphatase activity when soil isincubated with buffered substrates at each enzyme’s optimalpH [22]. Acid and alkaline phosphatase assays were per-formed in a modified universal buffer containing 10 mM p-nitrophenyl phosphate at pH 6.5 and pH 11, respectively.
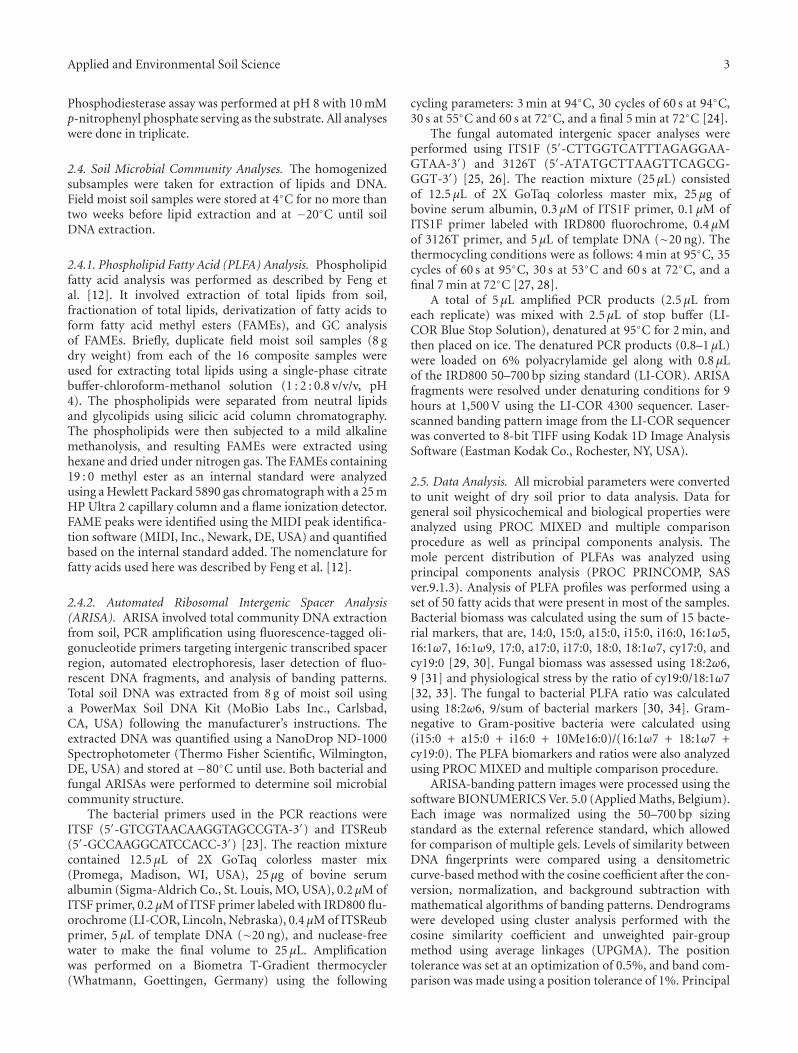
Applied and Environmental Soil Science 3
Phosphodiesterase assay was performed at pH 8 with 10 mMp-nitrophenyl phosphate serving as the substrate. All analyseswere done in triplicate.
2.4. Soil Microbial Community Analyses. The homogenizedsubsamples were taken for extraction of lipids and DNA.Field moist soil samples were stored at 4◦C for no more thantwo weeks before lipid extraction and at −20◦C until soilDNA extraction.
2.4.1. Phospholipid Fatty Acid (PLFA) Analysis. Phospholipidfatty acid analysis was performed as described by Feng etal. [12]. It involved extraction of total lipids from soil,fractionation of total lipids, derivatization of fatty acids toform fatty acid methyl esters (FAMEs), and GC analysisof FAMEs. Briefly, duplicate field moist soil samples (8 gdry weight) from each of the 16 composite samples wereused for extracting total lipids using a single-phase citratebuffer-chloroform-methanol solution (1 : 2 : 0.8 v/v/v, pH4). The phospholipids were separated from neutral lipidsand glycolipids using silicic acid column chromatography.The phospholipids were then subjected to a mild alkalinemethanolysis, and resulting FAMEs were extracted usinghexane and dried under nitrogen gas. The FAMEs containing19 : 0 methyl ester as an internal standard were analyzedusing a Hewlett Packard 5890 gas chromatograph with a 25 mHP Ultra 2 capillary column and a flame ionization detector.FAME peaks were identified using the MIDI peak identifica-tion software (MIDI, Inc., Newark, DE, USA) and quantifiedbased on the internal standard added. The nomenclature forfatty acids used here was described by Feng et al. [12].
2.4.2. Automated Ribosomal Intergenic Spacer Analysis(ARISA). ARISA involved total community DNA extractionfrom soil, PCR amplification using fluorescence-tagged oli-gonucleotide primers targeting intergenic transcribed spacerregion, automated electrophoresis, laser detection of fluo-rescent DNA fragments, and analysis of banding patterns.Total soil DNA was extracted from 8 g of moist soil usinga PowerMax Soil DNA Kit (MoBio Labs Inc., Carlsbad,CA, USA) following the manufacturer’s instructions. Theextracted DNA was quantified using a NanoDrop ND-1000Spectrophotometer (Thermo Fisher Scientific, Wilmington,DE, USA) and stored at −80◦C until use. Both bacterial andfungal ARISAs were performed to determine soil microbialcommunity structure.
The bacterial primers used in the PCR reactions wereITSF (5′-GTCGTAACAAGGTAGCCGTA-3′) and ITSReub(5′-GCCAAGGCATCCACC-3′) [23]. The reaction mixturecontained 12.5 μL of 2X GoTaq colorless master mix(Promega, Madison, WI, USA), 25 μg of bovine serumalbumin (Sigma-Aldrich Co., St. Louis, MO, USA), 0.2 μM ofITSF primer, 0.2 μM of ITSF primer labeled with IRD800 flu-orochrome (LI-COR, Lincoln, Nebraska), 0.4 μM of ITSReubprimer, 5 μL of template DNA (∼20 ng), and nuclease-freewater to make the final volume to 25 μL. Amplificationwas performed on a Biometra T-Gradient thermocycler(Whatmann, Goettingen, Germany) using the following
cycling parameters: 3 min at 94◦C, 30 cycles of 60 s at 94◦C,30 s at 55◦C and 60 s at 72◦C, and a final 5 min at 72◦C [24].
The fungal automated intergenic spacer analyses wereperformed using ITS1F (5′-CTTGGTCATTTAGAGGAA-GTAA-3′) and 3126T (5′-ATATGCTTAAGTTCAGCG-GGT-3′) [25, 26]. The reaction mixture (25 μL) consistedof 12.5 μL of 2X GoTaq colorless master mix, 25 μg ofbovine serum albumin, 0.3 μM of ITS1F primer, 0.1 μM ofITS1F primer labeled with IRD800 fluorochrome, 0.4 μMof 3126T primer, and 5 μL of template DNA (∼20 ng). Thethermocycling conditions were as follows: 4 min at 95◦C, 35cycles of 60 s at 95◦C, 30 s at 53◦C and 60 s at 72◦C, and afinal 7 min at 72◦C [27, 28].
A total of 5 μL amplified PCR products (2.5 μL fromeach replicate) was mixed with 2.5 μL of stop buffer (LI-COR Blue Stop Solution), denatured at 95◦C for 2 min, andthen placed on ice. The denatured PCR products (0.8–1 μL)were loaded on 6% polyacrylamide gel along with 0.8 μLof the IRD800 50–700 bp sizing standard (LI-COR). ARISAfragments were resolved under denaturing conditions for 9hours at 1,500 V using the LI-COR 4300 sequencer. Laser-scanned banding pattern image from the LI-COR sequencerwas converted to 8-bit TIFF using Kodak 1D Image AnalysisSoftware (Eastman Kodak Co., Rochester, NY, USA).
2.5. Data Analysis. All microbial parameters were convertedto unit weight of dry soil prior to data analysis. Data forgeneral soil physicochemical and biological properties wereanalyzed using PROC MIXED and multiple comparisonprocedure as well as principal components analysis. Themole percent distribution of PLFAs was analyzed usingprincipal components analysis (PROC PRINCOMP, SASver.9.1.3). Analysis of PLFA profiles was performed using aset of 50 fatty acids that were present in most of the samples.Bacterial biomass was calculated using the sum of 15 bacte-rial markers, that are, 14:0, 15:0, a15:0, i15:0, i16:0, 16:1ω5,16:1ω7, 16:1ω9, 17:0, a17:0, i17:0, 18:0, 18:1ω7, cy17:0, andcy19:0 [29, 30]. Fungal biomass was assessed using 18:2ω6,9 [31] and physiological stress by the ratio of cy19:0/18:1ω7[32, 33]. The fungal to bacterial PLFA ratio was calculatedusing 18:2ω6, 9/sum of bacterial markers [30, 34]. Gram-negative to Gram-positive bacteria were calculated using(i15:0 + a15:0 + i16:0 + 10Me16:0)/(16:1ω7 + 18:1ω7 +cy19:0). The PLFA biomarkers and ratios were also analyzedusing PROC MIXED and multiple comparison procedure.
ARISA-banding pattern images were processed using thesoftware BIONUMERICS Ver. 5.0 (Applied Maths, Belgium).Each image was normalized using the 50–700 bp sizingstandard as the external reference standard, which allowedfor comparison of multiple gels. Levels of similarity betweenDNA fingerprints were compared using a densitometriccurve-based method with the cosine coefficient after the con-version, normalization, and background subtraction withmathematical algorithms of banding patterns. Dendrogramswere developed using cluster analysis performed with thecosine similarity coefficient and unweighted pair-groupmethod using average linkages (UPGMA). The positiontolerance was set at an optimization of 0.5%, and band com-parison was made using a position tolerance of 1%. Principal
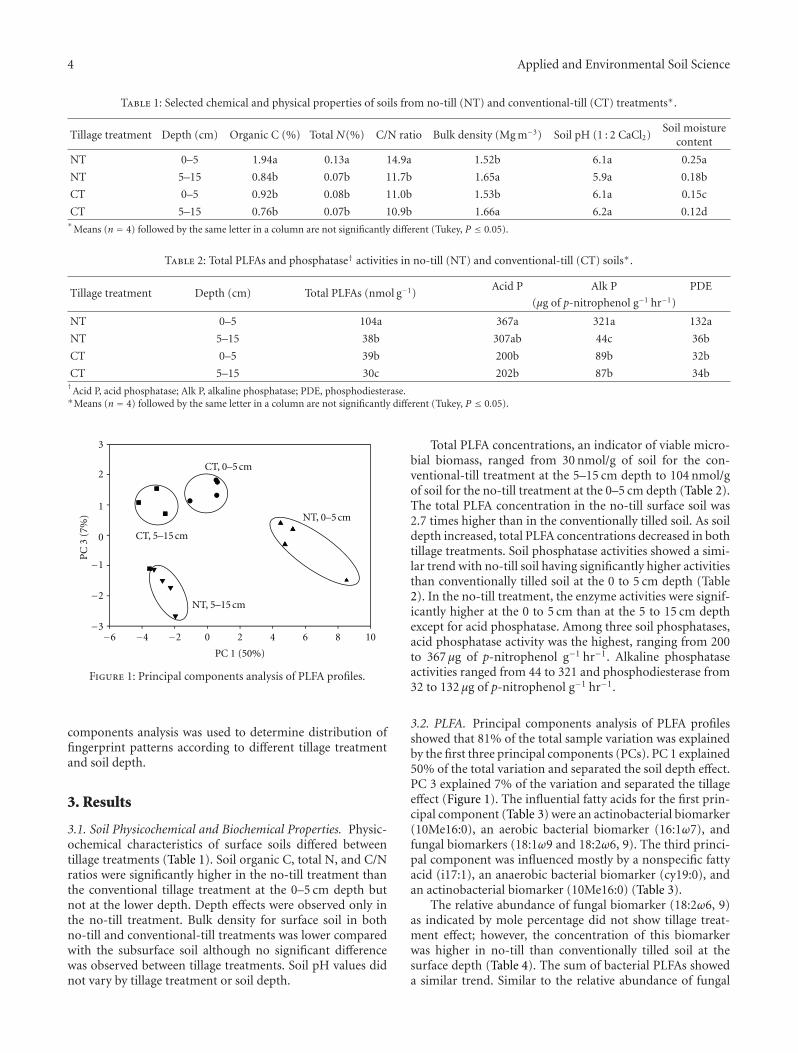
4 Applied and Environmental Soil Science
Table 1: Selected chemical and physical properties of soils from no-till (NT) and conventional-till (CT) treatments∗.
Tillage treatment Depth (cm) Organic C (%) Total N(%) C/N ratio Bulk density (Mg m−3) Soil pH (1 : 2 CaCl2)Soil moisture
content
NT 0–5 1.94a 0.13a 14.9a 1.52b 6.1a 0.25a
NT 5–15 0.84b 0.07b 11.7b 1.65a 5.9a 0.18b
CT 0–5 0.92b 0.08b 11.0b 1.53b 6.1a 0.15c
CT 5–15 0.76b 0.07b 10.9b 1.66a 6.2a 0.12d∗
Means (n = 4) followed by the same letter in a column are not significantly different (Tukey, P ≤ 0.05).
Table 2: Total PLFAs and phosphatase† activities in no-till (NT) and conventional-till (CT) soils∗.
Tillage treatment Depth (cm) Total PLFAs (nmol g−1)Acid P Alk P PDE
(μg of p-nitrophenol g−1 hr−1)
NT 0–5 104a 367a 321a 132a
NT 5–15 38b 307ab 44c 36b
CT 0–5 39b 200b 89b 32b
CT 5–15 30c 202b 87b 34b†
Acid P, acid phosphatase; Alk P, alkaline phosphatase; PDE, phosphodiesterase.∗Means (n = 4) followed by the same letter in a column are not significantly different (Tukey, P ≤ 0.05).
0 2 4 6 8 10
0
1
2
3
−4−6 −2−3
−2
−1
PC 1 (50%)
PC
3 (
7%)
NT, 5–15 cm
NT, 0–5 cm
CT, 0–5 cm
CT, 5–15 cm
Figure 1: Principal components analysis of PLFA profiles.
components analysis was used to determine distribution offingerprint patterns according to different tillage treatmentand soil depth.
3. Results
3.1. Soil Physicochemical and Biochemical Properties. Physic-ochemical characteristics of surface soils differed betweentillage treatments (Table 1). Soil organic C, total N, and C/Nratios were significantly higher in the no-till treatment thanthe conventional tillage treatment at the 0–5 cm depth butnot at the lower depth. Depth effects were observed only inthe no-till treatment. Bulk density for surface soil in bothno-till and conventional-till treatments was lower comparedwith the subsurface soil although no significant differencewas observed between tillage treatments. Soil pH values didnot vary by tillage treatment or soil depth.
Total PLFA concentrations, an indicator of viable micro-bial biomass, ranged from 30 nmol/g of soil for the con-ventional-till treatment at the 5–15 cm depth to 104 nmol/gof soil for the no-till treatment at the 0–5 cm depth (Table 2).The total PLFA concentration in the no-till surface soil was2.7 times higher than in the conventionally tilled soil. As soildepth increased, total PLFA concentrations decreased in bothtillage treatments. Soil phosphatase activities showed a simi-lar trend with no-till soil having significantly higher activitiesthan conventionally tilled soil at the 0 to 5 cm depth (Table2). In the no-till treatment, the enzyme activities were signif-icantly higher at the 0 to 5 cm than at the 5 to 15 cm depthexcept for acid phosphatase. Among three soil phosphatases,acid phosphatase activity was the highest, ranging from 200to 367 μg of p-nitrophenol g−1 hr−1. Alkaline phosphataseactivities ranged from 44 to 321 and phosphodiesterase from32 to 132 μg of p-nitrophenol g−1 hr−1.
3.2. PLFA. Principal components analysis of PLFA profilesshowed that 81% of the total sample variation was explainedby the first three principal components (PCs). PC 1 explained50% of the total variation and separated the soil depth effect.PC 3 explained 7% of the variation and separated the tillageeffect (Figure 1). The influential fatty acids for the first prin-cipal component (Table 3) were an actinobacterial biomarker(10Me16:0), an aerobic bacterial biomarker (16:1ω7), andfungal biomarkers (18:1ω9 and 18:2ω6, 9). The third princi-pal component was influenced mostly by a nonspecific fattyacid (i17:1), an anaerobic bacterial biomarker (cy19:0), andan actinobacterial biomarker (10Me16:0) (Table 3).
The relative abundance of fungal biomarker (18:2ω6, 9)as indicated by mole percentage did not show tillage treat-ment effect; however, the concentration of this biomarkerwas higher in no-till than conventionally tilled soil at thesurface depth (Table 4). The sum of bacterial PLFAs showeda similar trend. Similar to the relative abundance of fungal
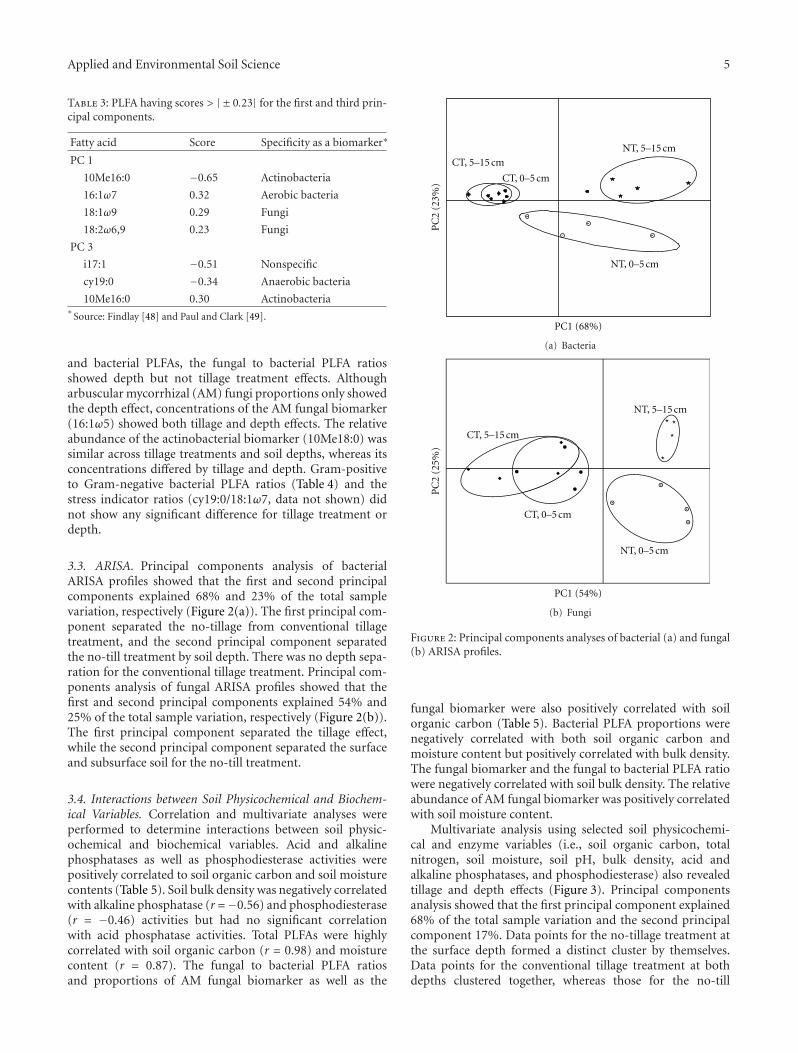
Applied and Environmental Soil Science 5
Table 3: PLFA having scores > | ± 0.23| for the first and third prin-cipal components.
Fatty acid Score Specificity as a biomarker∗
PC 1
10Me16:0 −0.65 Actinobacteria
16:1ω7 0.32 Aerobic bacteria
18:1ω9 0.29 Fungi
18:2ω6,9 0.23 Fungi
PC 3
i17:1 −0.51 Nonspecific
cy19:0 −0.34 Anaerobic bacteria
10Me16:0 0.30 Actinobacteria∗
Source: Findlay [48] and Paul and Clark [49].
and bacterial PLFAs, the fungal to bacterial PLFA ratiosshowed depth but not tillage treatment effects. Althougharbuscular mycorrhizal (AM) fungi proportions only showedthe depth effect, concentrations of the AM fungal biomarker(16:1ω5) showed both tillage and depth effects. The relativeabundance of the actinobacterial biomarker (10Me18:0) wassimilar across tillage treatments and soil depths, whereas itsconcentrations differed by tillage and depth. Gram-positiveto Gram-negative bacterial PLFA ratios (Table 4) and thestress indicator ratios (cy19:0/18:1ω7, data not shown) didnot show any significant difference for tillage treatment ordepth.
3.3. ARISA. Principal components analysis of bacterialARISA profiles showed that the first and second principalcomponents explained 68% and 23% of the total samplevariation, respectively (Figure 2(a)). The first principal com-ponent separated the no-tillage from conventional tillagetreatment, and the second principal component separatedthe no-till treatment by soil depth. There was no depth sepa-ration for the conventional tillage treatment. Principal com-ponents analysis of fungal ARISA profiles showed that thefirst and second principal components explained 54% and25% of the total sample variation, respectively (Figure 2(b)).The first principal component separated the tillage effect,while the second principal component separated the surfaceand subsurface soil for the no-till treatment.
3.4. Interactions between Soil Physicochemical and Biochem-ical Variables. Correlation and multivariate analyses wereperformed to determine interactions between soil physic-ochemical and biochemical variables. Acid and alkalinephosphatases as well as phosphodiesterase activities werepositively correlated to soil organic carbon and soil moisturecontents (Table 5). Soil bulk density was negatively correlatedwith alkaline phosphatase (r =−0.56) and phosphodiesterase(r = −0.46) activities but had no significant correlationwith acid phosphatase activities. Total PLFAs were highlycorrelated with soil organic carbon (r = 0.98) and moisturecontent (r = 0.87). The fungal to bacterial PLFA ratiosand proportions of AM fungal biomarker as well as the
NT, 5–15 cm
NT, 0–5 cm
CT, 0–5 cm
CT, 5–15 cm
PC
2 (2
3%)
PC1 (68%)
(a) Bacteria
NT, 5–15 cm
NT, 0–5 cm
CT, 0–5 cm
CT, 5–15 cmP
C2
(25%
)
PC1 (54%)
(b) Fungi
Figure 2: Principal components analyses of bacterial (a) and fungal(b) ARISA profiles.
fungal biomarker were also positively correlated with soilorganic carbon (Table 5). Bacterial PLFA proportions werenegatively correlated with both soil organic carbon andmoisture content but positively correlated with bulk density.The fungal biomarker and the fungal to bacterial PLFA ratiowere negatively correlated with soil bulk density. The relativeabundance of AM fungal biomarker was positively correlatedwith soil moisture content.
Multivariate analysis using selected soil physicochemi-cal and enzyme variables (i.e., soil organic carbon, totalnitrogen, soil moisture, soil pH, bulk density, acid andalkaline phosphatases, and phosphodiesterase) also revealedtillage and depth effects (Figure 3). Principal componentsanalysis showed that the first principal component explained68% of the total sample variation and the second principalcomponent 17%. Data points for the no-tillage treatment atthe surface depth formed a distinct cluster by themselves.Data points for the conventional tillage treatment at bothdepths clustered together, whereas those for the no-till
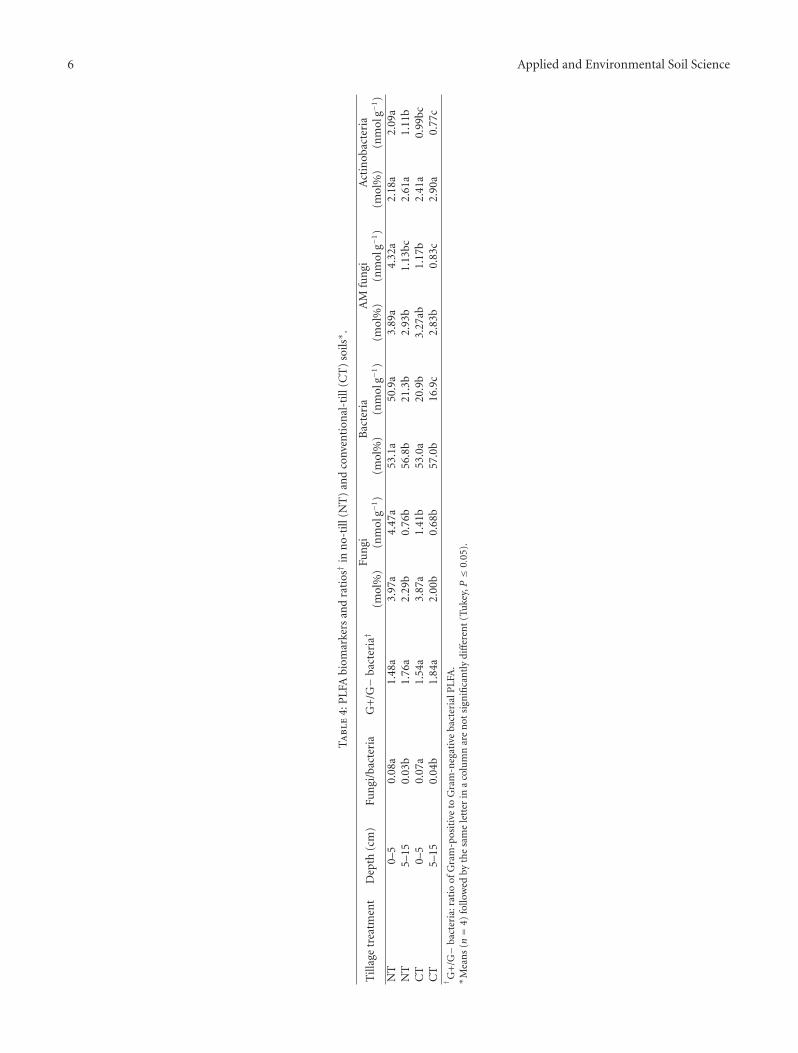
6 Applied and Environmental Soil Science
Ta
ble
4:P
LFA
biom
arke
rsan
dra
tios†
inn
o-ti
ll(N
T)
and
conv
enti
onal
-till
(CT
)so
ils∗ .
Till
age
trea
tmen
tD
epth
(cm
)Fu
ngi
/bac
teri
aG
+/G−
bact
eria†
Fun
giB
acte
ria
AM
fun
giA
ctin
obac
teri
a(m
ol%
)(n
mol
g−1)
(mol
%)
(nm
olg−
1)
(mol
%)
(nm
olg−
1)
(mol
%)
(nm
olg−
1)
NT
0–5
0.08
a1.
48a
3.97
a4.
47a
53.1
a50
.9a
3.89
a4.
32a
2.18
a2.
09a
NT
5–15
0.03
b1.
76a
2.29
b0.
76b
56.8
b21
.3b
2.93
b1.
13bc
2.61
a1.
11b
CT
0–5
0.07
a1.
54a
3.87
a1.
41b
53.0
a20
.9b
3.27
ab1.
17b
2.41
a0.
99bc
CT
5–15
0.04
b1.
84a
2.00
b0.
68b
57.0
b16
.9c
2.83
b0.
83c
2.90
a0.
77c
† G+
/G−
bact
eria
:rat
ioof
Gra
m-p
osit
ive
toG
ram
-neg
ativ
eba
cter
ialP
LFA
.∗ M
ean
s(n=
4)fo
llow
edby
the
sam
ele
tter
ina
colu
mn
are
not
sign
ifica
ntl
ydi
ffer
ent
(Tu
key,P≤
0.05
).
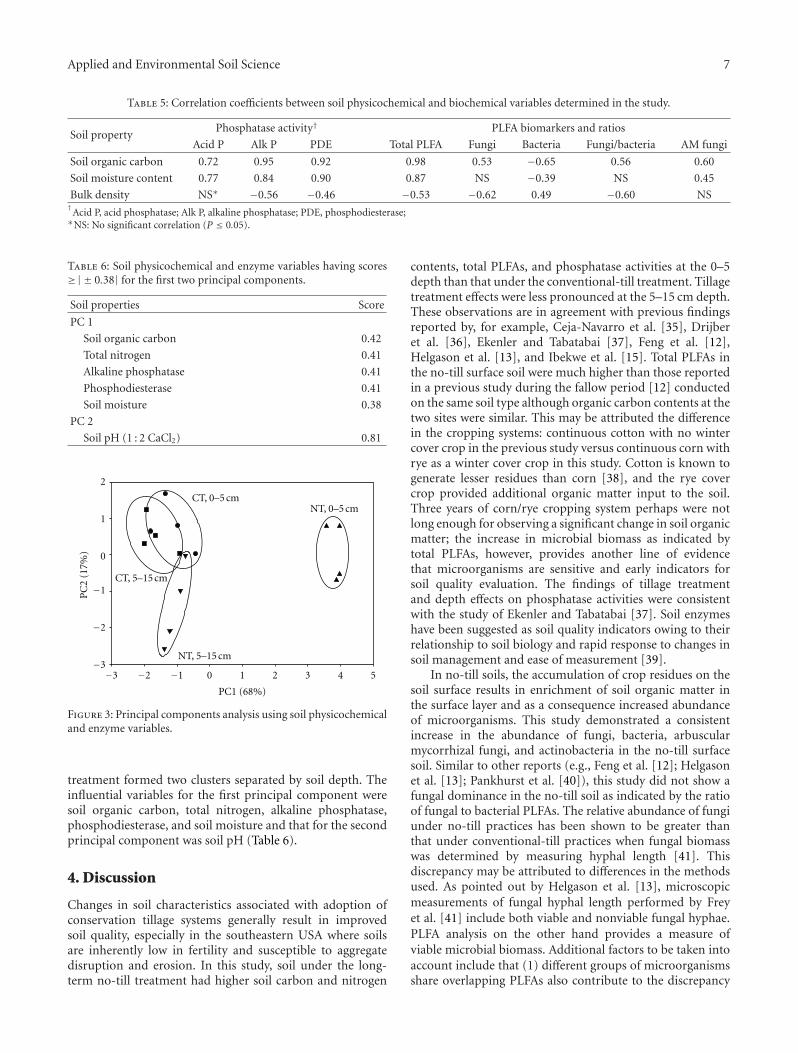
Applied and Environmental Soil Science 7
Table 5: Correlation coefficients between soil physicochemical and biochemical variables determined in the study.
Soil propertyPhosphatase activity† PLFA biomarkers and ratios
Acid P Alk P PDE Total PLFA Fungi Bacteria Fungi/bacteria AM fungi
Soil organic carbon 0.72 0.95 0.92 0.98 0.53 −0.65 0.56 0.60
Soil moisture content 0.77 0.84 0.90 0.87 NS −0.39 NS 0.45
Bulk density NS∗ −0.56 −0.46 −0.53 −0.62 0.49 −0.60 NS†
Acid P, acid phosphatase; Alk P, alkaline phosphatase; PDE, phosphodiesterase;∗NS: No significant correlation (P ≤ 0.05).
Table 6: Soil physicochemical and enzyme variables having scores≥| ± 0.38| for the first two principal components.
Soil properties Score
PC 1
Soil organic carbon 0.42
Total nitrogen 0.41
Alkaline phosphatase 0.41
Phosphodiesterase 0.41
Soil moisture 0.38
PC 2
Soil pH (1 : 2 CaCl2) 0.81
NT, 5–15 cm
NT, 0–5 cmCT, 0–5 cm
CT, 5–15 cm
PC
2 (1
7%)
PC1 (68%)
−3 −2 −1 0 1 2 3 4 5
2
1
0
−1
−2
−3
Figure 3: Principal components analysis using soil physicochemicaland enzyme variables.
treatment formed two clusters separated by soil depth. Theinfluential variables for the first principal component weresoil organic carbon, total nitrogen, alkaline phosphatase,phosphodiesterase, and soil moisture and that for the secondprincipal component was soil pH (Table 6).
4. Discussion
Changes in soil characteristics associated with adoption ofconservation tillage systems generally result in improvedsoil quality, especially in the southeastern USA where soilsare inherently low in fertility and susceptible to aggregatedisruption and erosion. In this study, soil under the long-term no-till treatment had higher soil carbon and nitrogen
contents, total PLFAs, and phosphatase activities at the 0–5depth than that under the conventional-till treatment. Tillagetreatment effects were less pronounced at the 5–15 cm depth.These observations are in agreement with previous findingsreported by, for example, Ceja-Navarro et al. [35], Drijberet al. [36], Ekenler and Tabatabai [37], Feng et al. [12],Helgason et al. [13], and Ibekwe et al. [15]. Total PLFAs inthe no-till surface soil were much higher than those reportedin a previous study during the fallow period [12] conductedon the same soil type although organic carbon contents at thetwo sites were similar. This may be attributed the differencein the cropping systems: continuous cotton with no wintercover crop in the previous study versus continuous corn withrye as a winter cover crop in this study. Cotton is known togenerate lesser residues than corn [38], and the rye covercrop provided additional organic matter input to the soil.Three years of corn/rye cropping system perhaps were notlong enough for observing a significant change in soil organicmatter; the increase in microbial biomass as indicated bytotal PLFAs, however, provides another line of evidencethat microorganisms are sensitive and early indicators forsoil quality evaluation. The findings of tillage treatmentand depth effects on phosphatase activities were consistentwith the study of Ekenler and Tabatabai [37]. Soil enzymeshave been suggested as soil quality indicators owing to theirrelationship to soil biology and rapid response to changes insoil management and ease of measurement [39].
In no-till soils, the accumulation of crop residues on thesoil surface results in enrichment of soil organic matter inthe surface layer and as a consequence increased abundanceof microorganisms. This study demonstrated a consistentincrease in the abundance of fungi, bacteria, arbuscularmycorrhizal fungi, and actinobacteria in the no-till surfacesoil. Similar to other reports (e.g., Feng et al. [12]; Helgasonet al. [13]; Pankhurst et al. [40]), this study did not show afungal dominance in the no-till soil as indicated by the ratioof fungal to bacterial PLFAs. The relative abundance of fungiunder no-till practices has been shown to be greater thanthat under conventional-till practices when fungal biomasswas determined by measuring hyphal length [41]. Thisdiscrepancy may be attributed to differences in the methodsused. As pointed out by Helgason et al. [13], microscopicmeasurements of fungal hyphal length performed by Freyet al. [41] include both viable and nonviable fungal hyphae.PLFA analysis on the other hand provides a measure ofviable microbial biomass. Additional factors to be taken intoaccount include that (1) different groups of microorganismsshare overlapping PLFAs also contribute to the discrepancy
8 Applied and Environmental Soil Science
and (2) phospholipid concentrations in fungi are lower thanthose in bacteria. Nevertheless, comparison of fungal tobacterial PLFA ratios between tillage treatments is warranted.
Polyphasic approaches are often used to study soil mic-robial communities. PLFA analysis has been shown to be thebest approach to discern a treatment effect on soil microbialcommunity and be able to differentiate treatments that arenot resolved by PCR-based methods in some cases [42]. Inthis study, both PLFA analysis and ARISA clearly demon-strated the shift in soil microbial communities associatedwith tillage practices. These findings are consistent withthose reported by Drijber et al. [36], Feng et al. [12], andPeixoto et al. [43]. The observed changes in soil microbialcommunities can be attributed to favorable physical andchemical conditions under the no-tillage system for micro-bial activities. A closer examination of principal componentsanalysis results for PLFA and ARISA profiles (Figures 1 and2) revealed that the depth effect for conventionally tilled soilwas more pronounced in PLFA analysis. This suggests thatin addition to bacteria and fungi, microfauna (e.g., protozoaand nematodes) may contribute to the discrimination of thesubtle difference between soil depths in the relatively wellmixed conventionally tilled soil since eukaryotic organismsother than fungi contribute to the soil PLFAs.
ARISA is an automated DNA fingerprinting method tar-geting the intergenic spacer regions of bacteria and fungiin PCR; it is highly reproducible and effective in detectingchanges in soil microbial community structure. Bacterialand fungal ARISA have previously been used in studiesconducted on agricultural and forest soils [44, 45]. To ourknowledge, this is the first time that ARISA was used todetermine the impact of tillage practices on soil microbialcommunities. Although it provides information on geneticcommunity structure of soil bacteria and fungi, the inter-genic spacer regions targeted by ARISA cannot be used toidentify dominant organisms. Little information is availableregarding the specific microorganisms affected by differenttillage practices. Ceja-Navarro et al. [35] conducted phylo-genetic and multivariate analyses to determine the effectsof zero tillage and conventional tillage on soil bacterialcommunities in a long-term maize-wheat rotation experi-ment. They found that bacterial communities under zerotillage and crop residue retention have the highest level ofdiversity and richness. Zero tillage has a positive effect onmembers of Rhizobiales and crop residue retention increasesfluorescent Pseudomonas spp. and Burkholderiales group. In arice-soybean rotation study, impact of conventional and no-tillage with and without cover crops on soil bacterial com-munity structure was determined using PCR-DGGE withoutidentification of bands through DNA sequencing [43].Responses of bacterial communities to cultivation, tillage,and soil depth but not to cover cropping were detected.
Results of principal components analysis based on soilphysicochemical and enzyme variables (Figure 3) were ingeneral agreement with those based on PLFA and ARISAprofiles. Soil organic carbon was the most influential factorfor PC 1, confirming its critical role in the no-till system. Soilorganic carbon was correlated with all biochemical variablesexcept for the relative abundance of bacterial biomarkers. A
negative correlation between soil organic carbon and bacte-rial PLFAs has also been observed by Zornoza et al. [46] andHelgason et al. [13]. Lauber et al. [47] quantified microbialcommunities by quantitative PCR and also reported lack ofcorrelation between soil carbon and bacterial population.They showed that soil pH and texture are better predictorsof soil bacteria.
5. Conclusions
In this study, soil under the long-term no-till treatment hadhigher soil carbon and nitrogen contents, total PLFAs, andphosphatase activities at the 0–5 cm depth than that underthe conventional tillage treatment. Differences betweentillage treatments at the 5–15 cm depth were negligiblewith the exception of alkaline phosphatase activities. Soilmicrobial communities shifted with tillage treatment and soildepth. Tillage practice and soil depth were two importantfactors affecting soil microbial communities. PLFA analysisand ARISA showed comparable results on treatment effects.PLFA profiles, however, detected differences in microbialcommunities associated with soil depth in the conventionaltillage treatment. This study demonstrated that tillage sys-tems influence soil microbial communities along with soilphysicochemical properties. Further research is needed todetermine the influence of tillage-induced changes on soilmicrobial community composition (i.e., the identity of keyorganisms) and their dynamics.
Acknowledgments
The authors would like to thank Dr. Zhanjiang (John) Liufor the use of LI-COR 4300 sequencer in the Fish MolecularGenetics and Biotechnology Laboratory at Auburn Univer-sity and Dr. Edzard Van Santen for helping with statisticalanalysis. This work was supported, in part, by grants from theAlabama Agricultural Land-Grant Alliance and the AlabamaAgricultural Experiment Station.
References
[1] P. R. Hobbs, K. Sayre, and R. Gupta, “The role of conservationagriculture in sustainable agriculture,” Philosophical Transac-tions of the Royal Society B, vol. 363, no. 1491, pp. 543–555,2008.
[2] R. Alvarez, “A review of nitrogen fertilizer and conservationtillage effects on soil organic carbon storage,” Soil Use andManagement, vol. 21, no. 1, pp. 38–52, 2005.
[3] N. D. Uri, “Factors affecting the use of conservation tillage inthe United States,” Water, Air, and Soil Pollution, vol. 116, no.3-4, pp. 621–638, 1999.
[4] E. B. Schwab, D. W. Reeves, C. H. Burmester, and R. L. Raper,“Conservation tillage systems for cotton in the TennesseeValley,” Soil Science Society of America Journal, vol. 66, no. 2,pp. 569–577, 2002.
[5] T. O. West and W. M. Post, “Soil organic carbon sequestrationrates by tillage and crop rotation: a global data analysis,” SoilScience Society of America Journal, vol. 66, no. 6, pp. 1930–1946, 2002.
Applied and Environmental Soil Science 9
[6] M. M. Wander, M. G. Bidart, and S. Aref, “Tillage impacts ondepth distribution of total and particulate organic matter inthree Illinois soils,” Soil Science Society of America Journal, vol.62, no. 6, pp. 1704–1711, 1998.
[7] M. D. Trojan and D. R. Linden, “Macroporosity and hydraulicproperties of earthworm-affected soils as influenced by tillageand residue management,” Soil Science Society of America Jour-nal, vol. 62, no. 6, pp. 1687–1692, 1998.
[8] R. H. Azooz, M. A. Arshad, and A. J. Franzluebbers, “Pore sizedistribution and hydraulic conductivity affected by tillage inNorthwestern Canada,” Soil Science Society of America Journal,vol. 60, no. 4, pp. 1197–1201, 1996.
[9] K. Y. Chan and J. A. Mead, “Surface physical properties of asandy loam soil under different tillage practices,” AustralianJournal of Soil Research, vol. 26, no. 3, pp. 549–559, 1988.
[10] E. Kandeler, D. Tscherko, and H. Spiegel, “Long-term mon-itoring of microbial biomass, N mineralisation and enzymeactivities of a chernozem under different tillage management,”Biology and Fertility of Soils, vol. 28, no. 4, pp. 343–351, 1999.
[11] T. E. Staley, “Soil microbial biomass alterations during themaize silage growing season relative to tillage method,” SoilScience Society of America Journal, vol. 63, no. 6, pp. 1845–1847, 1999.
[12] Y. Feng, A. C. Motta, D. W. Reeves, C. H. Burmester, E. VanSanten, and J. A. Osborne, “Soil microbial communities underconventional-till and no-till continuous cotton systems,” SoilBiology and Biochemistry, vol. 35, no. 12, pp. 1693–1703, 2003.
[13] B. L. Helgason, F. L. Walley, and J. J. Germida, “Fungal andbacterial abundance in long-term no-till and intensive-tillsoils of the Northern Great Plains,” Soil Science Society ofAmerica Journal, vol. 73, no. 1, pp. 120–127, 2009.
[14] E. L. Balota, A. Colozzi-Filho, D. S. Andrade, and R. P. Dick,“Microbial biomass in soils under different tillage and croprotation systems,” Biology and Fertility of Soils, vol. 38, no. 1,pp. 15–20, 2003.
[15] A. M. Ibekwe, A. C. Kennedy, P. S. Frohne, S. K. Papiernik,C. H. Yang, and D. E. Crowley, “Microbial diversity along atransect of agronomic zones,” FEMS Microbiology Ecology, vol.39, no. 3, pp. 183–191, 2002.
[16] A. Frostegard, A. Tunlid, and E. Baath, “Phospholipid fattyacid composition, biomass, and activity of microbial commu-nities from two soil types experimentally exposed to differentheavy metals,” Applied and Environmental Microbiology, vol.59, no. 11, pp. 3605–3617, 1993.
[17] M. M. Fisher and E. W. Triplett, “Automated approach forribosomal intergenic spacer analysis of microbial diversity andits application to freshwater bacterial communities,” Appliedand Environmental Microbiology, vol. 65, no. 10, pp. 4630–4636, 1999.
[18] R. G. Burns, “Extracellular enzyme-substrate interactions insoil,” in Microbes in their Natural Environment, R. W. J. H.Slater and J. W. T. Wimpenny, Eds., pp. 249–298, CambridgeUniversity Press, London, UK, 1983.
[19] R. L. Sinsabaugh, R. K. Antibus, and A. E. Linkins, “Anenzymic approach to the analysis of microbial activity duringplant litter decomposition,” Agriculture, Ecosystems and Envi-ronment, vol. 34, no. 1–4, pp. 43–54, 1991.
[20] R. P. Dick, J. A. Sandor, and N. S. Eash, “Soil enzyme activitiesafter 1500 years of terrace agriculture in the Colca Valley,Peru,” Agriculture, Ecosystems and Environment, vol. 50, no. 2,pp. 123–131, 1994.
[21] W. A. Dick and M. A. Tabatabai, “Potential uses of soil en-zymes,” in Soil Microbial Ecology: Applications in Agricultural
and Environmental Management, F. B. Metting Jr, Ed., pp. 95–127, Marcel Dekker, New York, NY, USA, 1992.
[22] M. A. Tabatabai, “Soil enzymes,” in Methods of Soil Analysis.Part 2-Chemical and Microbiological Properties, A. L. Page, R.H. Miller, and D. R. Keeney, Eds., pp. 775–883, Soil ScienceSociety of America, Madison, Wis, USA, 1994.
[23] M. Cardinale, L. Brusetti, P. Quatrini et al., “Comparison ofdifferent primer sets for use in automated ribosomal inter-genic spacer analysis of complex bacterial communities,” Ap-plied and Environmental Microbiology, vol. 70, no. 10, pp.6147–6156, 2004.
[24] L. Ranjard, F. Poly, J. Combrisson et al., “Heterogeneous celldensity and genetic structure of bacterial pools associated withvarious soil microenvironments as determined by enumer-ation and DNA fingerprinting approach (RISA),” MicrobialEcology, vol. 39, no. 4, pp. 263–272, 2000.
[25] B. Nicolardot, L. Bouziri, F. Bastian, and L. Ranjard, “A mic-rocosm experiment to evaluate the influence of location andquality of plant residues on residue decomposition and geneticstructure of soil microbial communities,” Soil Biology and Bio-chemistry, vol. 39, no. 7, pp. 1631–1644, 2007.
[26] L. Ranjard, A. Echairi, V. Nowak, D. P. H. Lejon, R. Nouaım,and R. Chaussod, “Field and microcosm experiments to eval-uate the effects of agricultural Cu treatment on the density andgenetic structure of microbial communities in two differentsoils,” FEMS Microbiology Ecology, vol. 58, no. 2, pp. 303–315,2006.
[27] N. Kennedy, J. Connolly, and N. Clipson, “Impact of lime,nitrogen and plant species on fungal community structurein grassland microcosms,” Environmental Microbiology, vol. 7,no. 6, pp. 780–788, 2005.
[28] N. Kennedy, S. Edwards, and N. Clipson, “Soil bacterial andfungal community structure across a range of unimproved andsemi-improved upland grasslands,” Microbial Ecology, vol. 50,no. 3, pp. 463–473, 2005.
[29] A. Frostegard and E. Baath, “The use of phospholipid fattyacid analysis to estimate bacterial and fungal biomass in soil,”Biology and Fertility of Soils, vol. 22, no. 1-2, pp. 59–65, 1996.
[30] T. A. Spedding, C. Hamel, G. R. Mehuys, and C. A. Mad-ramootoo, “Soil microbial dynamics in maize-growing soilunder different tillage and residue management systems,” SoilBiology and Biochemistry, vol. 36, no. 3, pp. 499–512, 2004.
[31] C. Kaiser, A. Frank, B. Wild, M. Koranda, and A. Richter,“Negligible contribution from roots to soil-borne phospho-lipid fatty acid fungal biomarkers 18:2ω6,9 and 18:1ω9,” SoilBiology and Biochemistry, vol. 42, no. 9, pp. 1650–1652, 2010.
[32] L. E. Jackson, F. J. Calderon, K. L. Steenwerth, K. M. Scow,and D. E. Rolston, “Responses of soil microbial processes andcommunity structure to tillage events and implications for soilquality,” Geoderma, vol. 114, no. 3-4, pp. 305–317, 2003.
[33] J. Moore-Kucera and R. P. Dick, “PLFA profiling of microbialcommunity structure and seasonal shifts in soils of a Douglas-fir chronosequence,” Microbial Ecology, vol. 55, no. 3, pp. 500–511, 2008.
[34] S. A. Boyle, R. R. Yarwood, P. J. Bottomley, and D. D. Myrold,“Bacterial and fungal contributions to soil nitrogen cyclingunder Douglas fir and red alder at two sites in Oregon,” SoilBiology and Biochemistry, vol. 40, no. 2, pp. 443–451, 2008.
[35] J. A. Ceja-Navarro, F. N. Rivera-Orduna, L. Patino-Zuniga etal., “Phylogenetic and multivariate analyses to determine theeffects of different tillage and residue management practiceson soil bacterial communities,” Applied and EnvironmentalMicrobiology, vol. 76, no. 11, pp. 3685–3691, 2010.
10 Applied and Environmental Soil Science
[36] R. A. Drijber, J. W. Doran, A. M. Parkhurst, and D. J. Lyon,“Changes in soil microbial community structure with tillageunder long-term wheat-fallow management,” Soil Biology andBiochemistry, vol. 32, no. 10, pp. 1419–1430, 2000.
[37] M. Ekenler and M. A. Tabatabai, “Responses of phosphatasesand arylsulfatase in soils to liming and tillage systems,” Journalof Plant Nutrition and Soil Science, vol. 166, no. 3, pp. 281–290,2003.
[38] R. Lal, “Soil carbon sequestration impacts on global climatechange and food security,” Science, vol. 304, no. 5677, pp.1623–1627, 2004.
[39] R. P. Dick, D. P. Breakwell, and R. F. Turco, “Soil enzymeactivities and biodiversity measurements as integrative micro-biological indicators,” in Methods for Assessing Soil Quality,J. W. Doran and A. J. Jones, Eds., pp. 247–271, Soil ScienceSociety of America, Madison,Wis, USA, 1996.
[40] C. E. Pankhurst, C. A. Kirkby, B. G. Hawke, and B. D. Harch,“Impact of a change in tillage and crop residue managementpractice on soil chemical and microbiological properties in acereal-producing red duplex soil in NSW, Australia,” Biologyand Fertility of Soils, vol. 35, no. 3, pp. 189–196, 2002.
[41] S. D. Frey, E. T. Elliott, and K. Paustian, “Bacterial andfungal abundance and biomass in conventional and no-tillageagroecosystems along two climatic gradients,” Soil Biology andBiochemistry, vol. 31, no. 4, pp. 573–585, 1999.
[42] P. W. Ramsey, M. C. Rillig, K. P. Feris, W. E. Holben, and J.E. Gannon, “Choice of methods for soil microbial communityanalysis: PLFA maximizes power compared to CLPP and PCR-based approaches,” Pedobiologia, vol. 50, no. 3, pp. 275–280,2006.
[43] R. S. Peixoto, H. L. C. Coutinho, B. Madari et al., “Soilaggregation and bacterial community structure as affected bytillage and cover cropping in the Brazilian Cerrados,” Soil andTillage Research, vol. 90, no. 1-2, pp. 16–28, 2006.
[44] N. C. Prevost-Boure, P. A. Maron, L. Ranjard et al., “Seasonaldynamics of the bacterial community in forest soils underdifferent quantities of leaf litter,” Applied Soil Ecology, vol. 47,no. 1, pp. 14–23, 2011.
[45] L. Ranjard, F. Poly, J. C. Lata, C. Mougel, J. Thioulouse,and S. Nazaret, “Characterization of bacterial and fungal soilcommunities by automated ribosomal intergenic spacer anal-ysis fingerprints: biological and methodological variability,”Applied and Environmental Microbiology, vol. 67, no. 10, pp.4479–4487, 2001.
[46] R. Zornoza, C. Guerrero, J. Mataix-Solera, K. M. Scow, V.Arcenegui, and J. Mataix-Beneyto, “Changes in soil microbialcommunity structure following the abandonment of agricul-tural terraces in mountainous areas of Eastern Spain,” AppliedSoil Ecology, vol. 42, no. 3, pp. 315–323, 2009.
[47] C. L. Lauber, M. S. Strickland, M. A. Bradford, and N. Fierer,“The influence of soil properties on the structure of bacterialand fungal communities across land-use types,” Soil Biologyand Biochemistry, vol. 40, no. 9, pp. 2407–2415, 2008.
[48] R. H. Findlay, “Determination of microbial communitystructure using phospholipid fatty acid profiles,” in MolecularMicrobial Ecology Manual, G. A. Kowalchuk II, Ed., pp. 983–1004, Kluwer Academic Publishers, Dordrecht, The Nether-lands, 2004.
[49] E. A. Paul and F. E. Clark, Soil Microbiology and Biochemistry,Academic Press, San Diego, Calif, USA, 1996.
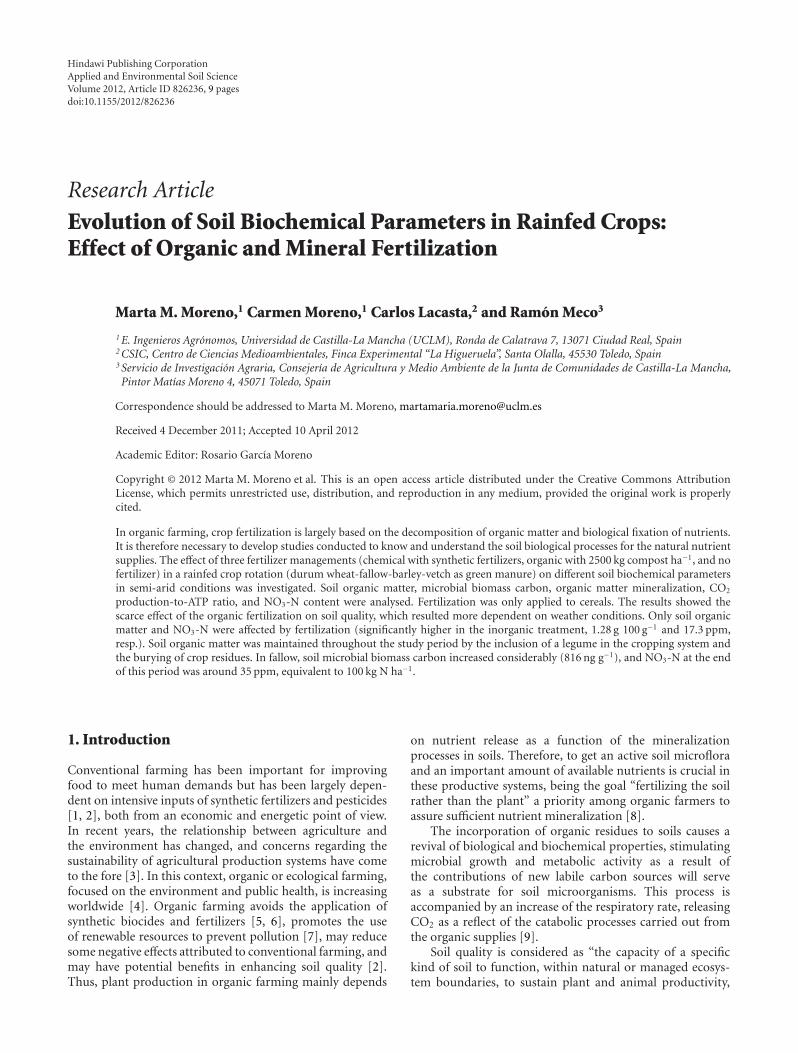
Hindawi Publishing CorporationApplied and Environmental Soil ScienceVolume 2012, Article ID 826236, 9 pagesdoi:10.1155/2012/826236
Research Article
Evolution of Soil Biochemical Parameters in Rainfed Crops:Effect of Organic and Mineral Fertilization
Marta M. Moreno,1 Carmen Moreno,1 Carlos Lacasta,2 and Ramon Meco3
1 E. Ingenieros Agronomos, Universidad de Castilla-La Mancha (UCLM), Ronda de Calatrava 7, 13071 Ciudad Real, Spain2 CSIC, Centro de Ciencias Medioambientales, Finca Experimental “La Higueruela”, Santa Olalla, 45530 Toledo, Spain3 Servicio de Investigacion Agraria, Consejerıa de Agricultura y Medio Ambiente de la Junta de Comunidades de Castilla-La Mancha,Pintor Matıas Moreno 4, 45071 Toledo, Spain
Correspondence should be addressed to Marta M. Moreno, [email protected]
Received 4 December 2011; Accepted 10 April 2012
Academic Editor: Rosario Garcıa Moreno
Copyright © 2012 Marta M. Moreno et al. This is an open access article distributed under the Creative Commons AttributionLicense, which permits unrestricted use, distribution, and reproduction in any medium, provided the original work is properlycited.
In organic farming, crop fertilization is largely based on the decomposition of organic matter and biological fixation of nutrients.It is therefore necessary to develop studies conducted to know and understand the soil biological processes for the natural nutrientsupplies. The effect of three fertilizer managements (chemical with synthetic fertilizers, organic with 2500 kg compost ha−1, and nofertilizer) in a rainfed crop rotation (durum wheat-fallow-barley-vetch as green manure) on different soil biochemical parametersin semi-arid conditions was investigated. Soil organic matter, microbial biomass carbon, organic matter mineralization, CO2
production-to-ATP ratio, and NO3-N content were analysed. Fertilization was only applied to cereals. The results showed thescarce effect of the organic fertilization on soil quality, which resulted more dependent on weather conditions. Only soil organicmatter and NO3-N were affected by fertilization (significantly higher in the inorganic treatment, 1.28 g 100 g−1 and 17.3 ppm,resp.). Soil organic matter was maintained throughout the study period by the inclusion of a legume in the cropping system andthe burying of crop residues. In fallow, soil microbial biomass carbon increased considerably (816 ng g−1), and NO3-N at the endof this period was around 35 ppm, equivalent to 100 kg N ha−1.
1. Introduction
Conventional farming has been important for improvingfood to meet human demands but has been largely depen-dent on intensive inputs of synthetic fertilizers and pesticides[1, 2], both from an economic and energetic point of view.In recent years, the relationship between agriculture andthe environment has changed, and concerns regarding thesustainability of agricultural production systems have cometo the fore [3]. In this context, organic or ecological farming,focused on the environment and public health, is increasingworldwide [4]. Organic farming avoids the application ofsynthetic biocides and fertilizers [5, 6], promotes the useof renewable resources to prevent pollution [7], may reducesome negative effects attributed to conventional farming, andmay have potential benefits in enhancing soil quality [2].Thus, plant production in organic farming mainly depends
on nutrient release as a function of the mineralizationprocesses in soils. Therefore, to get an active soil microfloraand an important amount of available nutrients is crucial inthese productive systems, being the goal “fertilizing the soilrather than the plant” a priority among organic farmers toassure sufficient nutrient mineralization [8].
The incorporation of organic residues to soils causes arevival of biological and biochemical properties, stimulatingmicrobial growth and metabolic activity as a result ofthe contributions of new labile carbon sources will serveas a substrate for soil microorganisms. This process isaccompanied by an increase of the respiratory rate, releasingCO2 as a reflect of the catabolic processes carried out fromthe organic supplies [9].
Soil quality is considered as “the capacity of a specifickind of soil to function, within natural or managed ecosys-tem boundaries, to sustain plant and animal productivity,
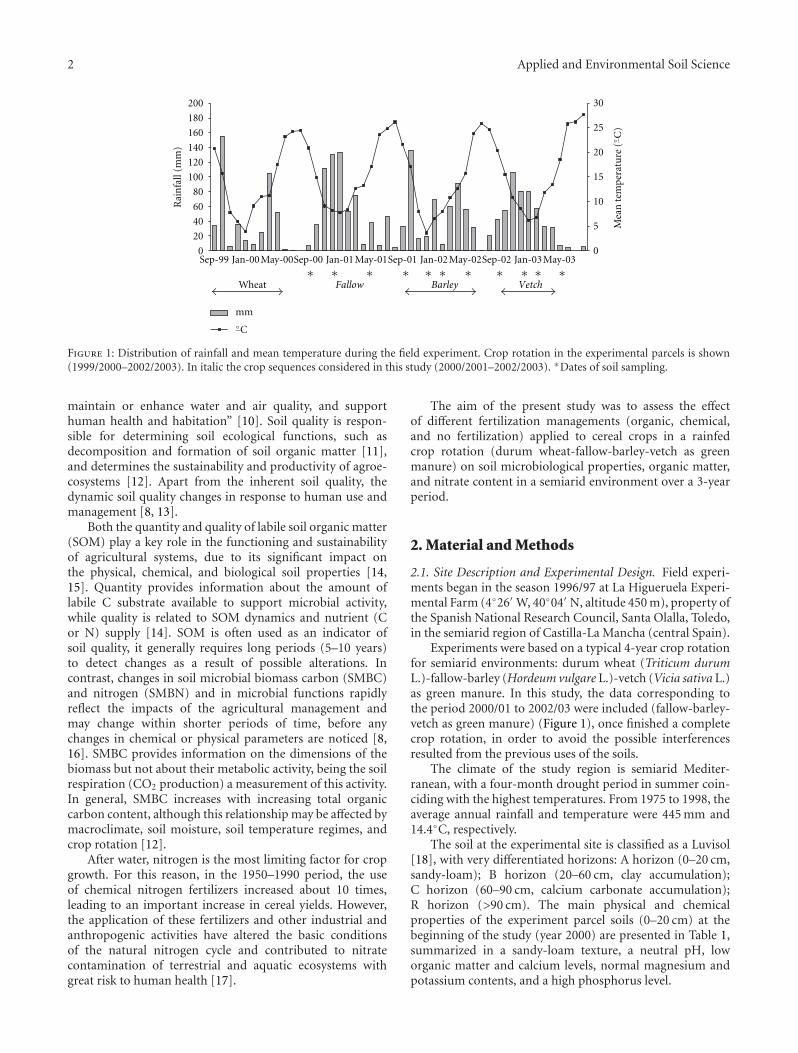
2 Applied and Environmental Soil Science
mm
Sep-99 Jan-00May-00Sep-00 Jan-01May-01Sep-01 Jan-02May-02Sep-02 Jan-03May-03
0
5
10
15
20
25
30
0
20
40
60
80
100
120
140
160
180
200
Rai
nfa
ll (m
m)
Wheat Fallow Barley Vetch
Mea
n te
mpe
ratu
re (◦ C
)
∗∗∗∗∗∗∗∗∗∗∗
◦C
Figure 1: Distribution of rainfall and mean temperature during the field experiment. Crop rotation in the experimental parcels is shown(1999/2000–2002/2003). In italic the crop sequences considered in this study (2000/2001–2002/2003). ∗Dates of soil sampling.
maintain or enhance water and air quality, and supporthuman health and habitation” [10]. Soil quality is respon-sible for determining soil ecological functions, such asdecomposition and formation of soil organic matter [11],and determines the sustainability and productivity of agroe-cosystems [12]. Apart from the inherent soil quality, thedynamic soil quality changes in response to human use andmanagement [8, 13].
Both the quantity and quality of labile soil organic matter(SOM) play a key role in the functioning and sustainabilityof agricultural systems, due to its significant impact onthe physical, chemical, and biological soil properties [14,15]. Quantity provides information about the amount oflabile C substrate available to support microbial activity,while quality is related to SOM dynamics and nutrient (Cor N) supply [14]. SOM is often used as an indicator ofsoil quality, it generally requires long periods (5–10 years)to detect changes as a result of possible alterations. Incontrast, changes in soil microbial biomass carbon (SMBC)and nitrogen (SMBN) and in microbial functions rapidlyreflect the impacts of the agricultural management andmay change within shorter periods of time, before anychanges in chemical or physical parameters are noticed [8,16]. SMBC provides information on the dimensions of thebiomass but not about their metabolic activity, being the soilrespiration (CO2 production) a measurement of this activity.In general, SMBC increases with increasing total organiccarbon content, although this relationship may be affected bymacroclimate, soil moisture, soil temperature regimes, andcrop rotation [12].
After water, nitrogen is the most limiting factor for cropgrowth. For this reason, in the 1950–1990 period, the useof chemical nitrogen fertilizers increased about 10 times,leading to an important increase in cereal yields. However,the application of these fertilizers and other industrial andanthropogenic activities have altered the basic conditionsof the natural nitrogen cycle and contributed to nitratecontamination of terrestrial and aquatic ecosystems withgreat risk to human health [17].
The aim of the present study was to assess the effectof different fertilization managements (organic, chemical,and no fertilization) applied to cereal crops in a rainfedcrop rotation (durum wheat-fallow-barley-vetch as greenmanure) on soil microbiological properties, organic matter,and nitrate content in a semiarid environment over a 3-yearperiod.
2. Material and Methods
2.1. Site Description and Experimental Design. Field experi-ments began in the season 1996/97 at La Higueruela Experi-mental Farm (4◦26′ W, 40◦04′ N, altitude 450 m), property ofthe Spanish National Research Council, Santa Olalla, Toledo,in the semiarid region of Castilla-La Mancha (central Spain).
Experiments were based on a typical 4-year crop rotationfor semiarid environments: durum wheat (Triticum durumL.)-fallow-barley (Hordeum vulgare L.)-vetch (Vicia sativa L.)as green manure. In this study, the data corresponding tothe period 2000/01 to 2002/03 were included (fallow-barley-vetch as green manure) (Figure 1), once finished a completecrop rotation, in order to avoid the possible interferencesresulted from the previous uses of the soils.
The climate of the study region is semiarid Mediter-ranean, with a four-month drought period in summer coin-ciding with the highest temperatures. From 1975 to 1998, theaverage annual rainfall and temperature were 445 mm and14.4◦C, respectively.
The soil at the experimental site is classified as a Luvisol[18], with very differentiated horizons: A horizon (0–20 cm,sandy-loam); B horizon (20–60 cm, clay accumulation);C horizon (60–90 cm, calcium carbonate accumulation);R horizon (>90 cm). The main physical and chemicalproperties of the experiment parcel soils (0–20 cm) at thebeginning of the study (year 2000) are presented in Table 1,summarized in a sandy-loam texture, a neutral pH, loworganic matter and calcium levels, normal magnesium andpotassium contents, and a high phosphorus level.
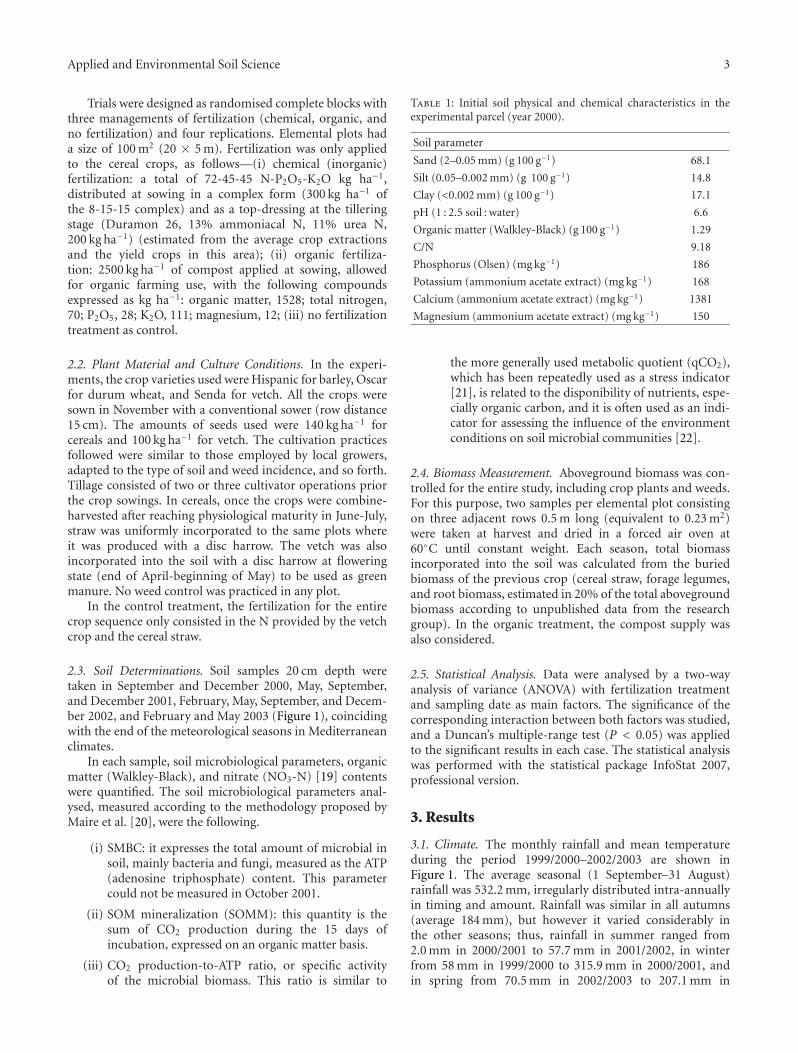
Applied and Environmental Soil Science 3
Trials were designed as randomised complete blocks withthree managements of fertilization (chemical, organic, andno fertilization) and four replications. Elemental plots hada size of 100 m2 (20 × 5 m). Fertilization was only appliedto the cereal crops, as follows—(i) chemical (inorganic)fertilization: a total of 72-45-45 N-P2O5-K2O kg ha−1,distributed at sowing in a complex form (300 kg ha−1 ofthe 8-15-15 complex) and as a top-dressing at the tilleringstage (Duramon 26, 13% ammoniacal N, 11% urea N,200 kg ha−1) (estimated from the average crop extractionsand the yield crops in this area); (ii) organic fertiliza-tion: 2500 kg ha−1 of compost applied at sowing, allowedfor organic farming use, with the following compoundsexpressed as kg ha−1: organic matter, 1528; total nitrogen,70; P2O5, 28; K2O, 111; magnesium, 12; (iii) no fertilizationtreatment as control.
2.2. Plant Material and Culture Conditions. In the experi-ments, the crop varieties used were Hispanic for barley, Oscarfor durum wheat, and Senda for vetch. All the crops weresown in November with a conventional sower (row distance15 cm). The amounts of seeds used were 140 kg ha−1 forcereals and 100 kg ha−1 for vetch. The cultivation practicesfollowed were similar to those employed by local growers,adapted to the type of soil and weed incidence, and so forth.Tillage consisted of two or three cultivator operations priorthe crop sowings. In cereals, once the crops were combine-harvested after reaching physiological maturity in June-July,straw was uniformly incorporated to the same plots whereit was produced with a disc harrow. The vetch was alsoincorporated into the soil with a disc harrow at floweringstate (end of April-beginning of May) to be used as greenmanure. No weed control was practiced in any plot.
In the control treatment, the fertilization for the entirecrop sequence only consisted in the N provided by the vetchcrop and the cereal straw.
2.3. Soil Determinations. Soil samples 20 cm depth weretaken in September and December 2000, May, September,and December 2001, February, May, September, and Decem-ber 2002, and February and May 2003 (Figure 1), coincidingwith the end of the meteorological seasons in Mediterraneanclimates.
In each sample, soil microbiological parameters, organicmatter (Walkley-Black), and nitrate (NO3-N) [19] contentswere quantified. The soil microbiological parameters anal-ysed, measured according to the methodology proposed byMaire et al. [20], were the following.
(i) SMBC: it expresses the total amount of microbial insoil, mainly bacteria and fungi, measured as the ATP(adenosine triphosphate) content. This parametercould not be measured in October 2001.
(ii) SOM mineralization (SOMM): this quantity is thesum of CO2 production during the 15 days ofincubation, expressed on an organic matter basis.
(iii) CO2 production-to-ATP ratio, or specific activityof the microbial biomass. This ratio is similar to
Table 1: Initial soil physical and chemical characteristics in theexperimental parcel (year 2000).
Soil parameter
Sand (2–0.05 mm) (g 100 g−1) 68.1
Silt (0.05–0.002 mm) (g 100 g−1) 14.8
Clay (<0.002 mm) (g 100 g−1) 17.1
pH (1 : 2.5 soil : water) 6.6
Organic matter (Walkley-Black) (g 100 g−1) 1.29
C/N 9.18
Phosphorus (Olsen) (mg kg−1) 186
Potassium (ammonium acetate extract) (mg kg−1) 168
Calcium (ammonium acetate extract) (mg kg−1) 1381
Magnesium (ammonium acetate extract) (mg kg−1) 150
the more generally used metabolic quotient (qCO2),which has been repeatedly used as a stress indicator[21], is related to the disponibility of nutrients, espe-cially organic carbon, and it is often used as an indi-cator for assessing the influence of the environmentconditions on soil microbial communities [22].
2.4. Biomass Measurement. Aboveground biomass was con-trolled for the entire study, including crop plants and weeds.For this purpose, two samples per elemental plot consistingon three adjacent rows 0.5 m long (equivalent to 0.23 m2)were taken at harvest and dried in a forced air oven at60◦C until constant weight. Each season, total biomassincorporated into the soil was calculated from the buriedbiomass of the previous crop (cereal straw, forage legumes,and root biomass, estimated in 20% of the total abovegroundbiomass according to unpublished data from the researchgroup). In the organic treatment, the compost supply wasalso considered.
2.5. Statistical Analysis. Data were analysed by a two-wayanalysis of variance (ANOVA) with fertilization treatmentand sampling date as main factors. The significance of thecorresponding interaction between both factors was studied,and a Duncan’s multiple-range test (P < 0.05) was appliedto the significant results in each case. The statistical analysiswas performed with the statistical package InfoStat 2007,professional version.
3. Results
3.1. Climate. The monthly rainfall and mean temperatureduring the period 1999/2000–2002/2003 are shown inFigure 1. The average seasonal (1 September–31 August)rainfall was 532.2 mm, irregularly distributed intra-annuallyin timing and amount. Rainfall was similar in all autumns(average 184 mm), but however it varied considerably inthe other seasons; thus, rainfall in summer ranged from2.0 mm in 2000/2001 to 57.7 mm in 2001/2002, in winterfrom 58 mm in 1999/2000 to 315.9 mm in 2000/2001, andin spring from 70.5 mm in 2002/2003 to 207.1 mm in
4 Applied and Environmental Soil Science
2001/2002. The average annual temperature was 15.2◦C(winter, 6.9◦C; spring, 13.8◦C; summer, 24.2◦C; autumn,15.2◦C).
3.2. Crop Biomass and Organic Matter Supplies. Above-ground vegetal biomass in the different crops was signifi-cantly affected by the fertilization treatment over the studyperiod (Table 2), being in all cases higher in the chemicaltreatment. In relation to the total inputs of organic matter tothe soil (Table 3), no differences among treatments werefound; however, it should be noticed that the compost dosewas also considered as an input in the organic treatment,being lower the amount of vegetal biomass incorporated intothe soil in this treatment, especially from the barley crop.
3.3. Soil Biological Parameters. The ANOVA for the soilparameters analysed is summarized in Table 4. In general, nointeractions between the fertilization treatment and the sam-pling date were significant in any case, which allowed tostudy the simple effects of each factor. Differences in all soilvariables analysed were observed among the sampling dates,mainly as result of variation in weather conditions; however,the effect of the fertilization treatment was only significanton the SOM and NO3-N variables.
The soil results obtained throughout the whole exper-iment are presented in Table 5. Averaged across samplingdates, SOM was significantly higher with chemical fertiliza-tion (1.28 g 100 g−1) than with compost or no fertilization(1.19 and 1.20 g 100 g−1, resp.). In the inorganic treatment,the highest SOM corresponded to the barley crop, whenfertilization took place.
SOMM ranged from 358 µg OM g−1 15 d−1 in the inor-ganic treatment to 337 µg OM g−1 15 d−1 in the control(Table 5), although no differences among treatments werefound. Throughout the study period, it is remark-able the high average SOMM reached in Sept 2000(721 µg OM g−1 15 d−1). During the fallow period, SOMMwas high and practically constant (Dec 2000 and May 2001).The lowest values were obtained at the end of this season(Sept 2001, 184 µg OM g−1 15 d−1).
In relation to SMBC, the highest levels were recordedin spring and autumn, and especially during the fallowperiod (Table 5). After May 2001, once the maximum SMBCwas reached, an important decreased in this parameter wasobserved and remained during the following samplings.However, SMBC increased again in September 2002, espe-cially in the organic fertilizer treatment, and in May 2003,coinciding with the end of the vetch crop.
The efficiency of soil microorganisms (CO2 to ATP ratio)was higher in the cooler months during the vetch crop (Table5, Figure 1), when the microbial biomass decreased and thesoil organic matter mineralization (measured at laboratory)presented similar values than those reached in spring andautumn.
The average soil NO3-N content was significantly higherin inorganically (17.3 ppm) than in organically (14.1 ppm)or no-fertilized soils (15.0 ppm) (Table 5). However, despitethe general results in relation to the averaged soil NO3-N
contents, statistical differences among treatments were onlyobserved in May 2002, probably as result of the low rainfallregistered in the previous winter (97.1 mm) (Figure 1),which could limit the leaching of nitrates and therefore toimprove the chemical fertilizer efficiency. NO3-N remainedin low levels during fallow and reached the maximum valuesat the end of this period in the three fertilization treatments(34.8 ppm average, equivalent to 100 kg ha−1 in the 0.20 msurface soil layer) (Table 5). In general, during the barleygrowing season, the soil NO3-N content was higher withchemical fertilization than in the other two treatments. Ineach case, soil NO3-N levels decreased as the crop cycleadvanced as consequence of plant extractions.
4. Discussion
It is well documented that the treatments which supply morecarbon to the system will generate a higher amount of soilorganic matter and therefore a higher soil microbial biomassand microbial activity [2, 12, 23–25]. However, in this studythe increase of the carbon supply did not result in an increaseof the soil parameters measured (SOM, SOMM, SMBC,and CO2 to ATP ratio), being more affected by the specificmeteorological conditions than for the type or amount of thefertilizers employed.
During the barley crop, soils did not receive externalorganic matter supplies from crop residues because this cropfollowed a fallow period, and only the organic treatmentreceived the compost as organic supply. However, thisexternal input of organic matter did not result in an increaseof SOM. It could be explained by the dry winter which char-acterized that season (2001/2002), appropriate conditions forlimiting the leaching of nitrates and getting a good efficiencyof chemical fertilizers, and therefore for obtaining a greatplant biomass production which could later be incorporatedinto the soil in the inorganic treatment, effect which was alsoobserved for vetch crop. For this reason, the total biomassaccumulated was higher in the chemical than in the otherfertilization treatments, although the total inputs of organicmatter to the soils were similar among them. Pardo et al. [26],however, did not find differences among chemical, organicand no-fertilizer treatments in cereal and vetch biomass in asimilar approach.
In relation to SOMM, the highest values were reachedin the first sampling (higher CO2 release rate) because atthat date all crop residues from the previous wheat cropwere still undecomposed (or only partially decomposed) as aresult of the scarce rainfall registered in the previous summer(2.0 mm). Consequently, when the soil sample was placedat the laboratory under the appropriate temperature andhumidity conditions for biological activity, the large amountof carbon contained in the sample produced a large CO2
release. Thus, SOMM at the laboratory was always higherat the end of summer provided that a source of organicmatter was previously added, because in these cases thesoil sample contained a certain amount of carbon whichcould be mineralised. During the fallow period, SOMMwas high and practically constant, when crop residues
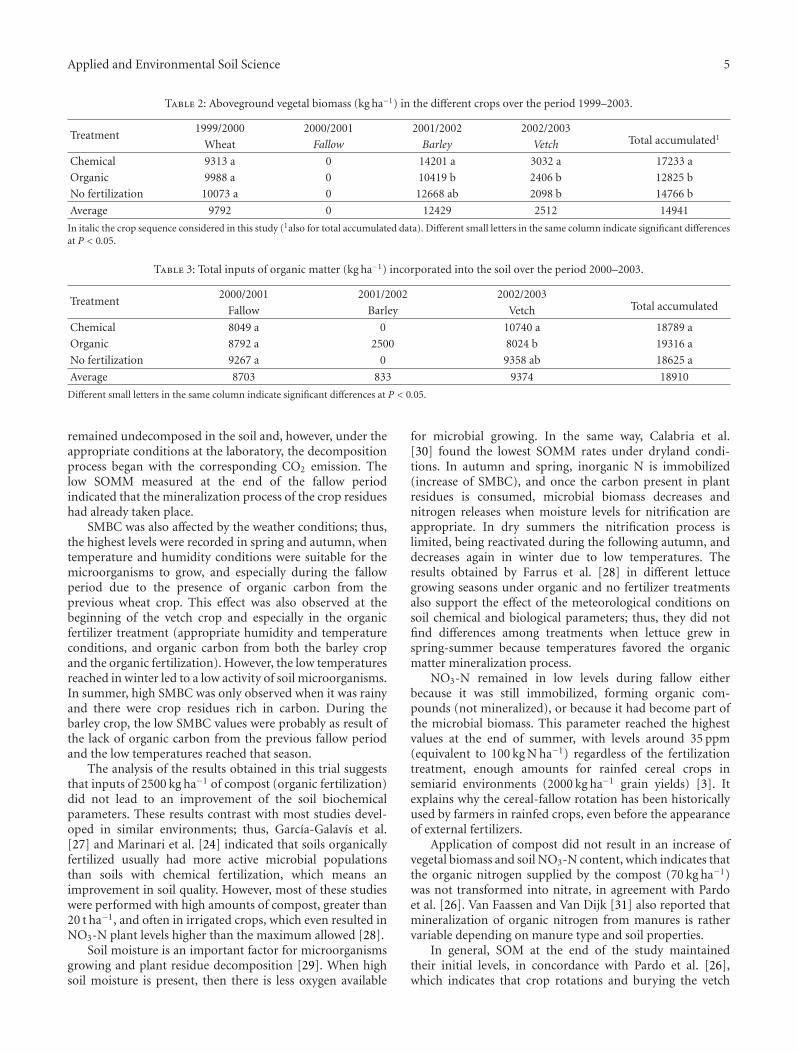
Applied and Environmental Soil Science 5
Table 2: Aboveground vegetal biomass (kg ha−1) in the different crops over the period 1999–2003.
Treatment1999/2000 2000/2001 2001/2002 2002/2003
Total accumulated1Wheat Fallow Barley Vetch
Chemical 9313 a 0 14201 a 3032 a 17233 a
Organic 9988 a 0 10419 b 2406 b 12825 b
No fertilization 10073 a 0 12668 ab 2098 b 14766 b
Average 9792 0 12429 2512 14941
In italic the crop sequence considered in this study (1also for total accumulated data). Different small letters in the same column indicate significant differencesat P < 0.05.
Table 3: Total inputs of organic matter (kg ha−1) incorporated into the soil over the period 2000–2003.
Treatment2000/2001 2001/2002 2002/2003
Total accumulatedFallow Barley Vetch
Chemical 8049 a 0 10740 a 18789 a
Organic 8792 a 2500 8024 b 19316 a
No fertilization 9267 a 0 9358 ab 18625 a
Average 8703 833 9374 18910
Different small letters in the same column indicate significant differences at P < 0.05.
remained undecomposed in the soil and, however, under theappropriate conditions at the laboratory, the decompositionprocess began with the corresponding CO2 emission. Thelow SOMM measured at the end of the fallow periodindicated that the mineralization process of the crop residueshad already taken place.
SMBC was also affected by the weather conditions; thus,the highest levels were recorded in spring and autumn, whentemperature and humidity conditions were suitable for themicroorganisms to grow, and especially during the fallowperiod due to the presence of organic carbon from theprevious wheat crop. This effect was also observed at thebeginning of the vetch crop and especially in the organicfertilizer treatment (appropriate humidity and temperatureconditions, and organic carbon from both the barley cropand the organic fertilization). However, the low temperaturesreached in winter led to a low activity of soil microorganisms.In summer, high SMBC was only observed when it was rainyand there were crop residues rich in carbon. During thebarley crop, the low SMBC values were probably as result ofthe lack of organic carbon from the previous fallow periodand the low temperatures reached that season.
The analysis of the results obtained in this trial suggeststhat inputs of 2500 kg ha−1 of compost (organic fertilization)did not lead to an improvement of the soil biochemicalparameters. These results contrast with most studies devel-oped in similar environments; thus, Garcıa-Galavıs et al.[27] and Marinari et al. [24] indicated that soils organicallyfertilized usually had more active microbial populationsthan soils with chemical fertilization, which means animprovement in soil quality. However, most of these studieswere performed with high amounts of compost, greater than20 t ha−1, and often in irrigated crops, which even resulted inNO3-N plant levels higher than the maximum allowed [28].
Soil moisture is an important factor for microorganismsgrowing and plant residue decomposition [29]. When highsoil moisture is present, then there is less oxygen available
for microbial growing. In the same way, Calabria et al.[30] found the lowest SOMM rates under dryland condi-tions. In autumn and spring, inorganic N is immobilized(increase of SMBC), and once the carbon present in plantresidues is consumed, microbial biomass decreases andnitrogen releases when moisture levels for nitrification areappropriate. In dry summers the nitrification process islimited, being reactivated during the following autumn, anddecreases again in winter due to low temperatures. Theresults obtained by Farrus et al. [28] in different lettucegrowing seasons under organic and no fertilizer treatmentsalso support the effect of the meteorological conditions onsoil chemical and biological parameters; thus, they did notfind differences among treatments when lettuce grew inspring-summer because temperatures favored the organicmatter mineralization process.
NO3-N remained in low levels during fallow eitherbecause it was still immobilized, forming organic com-pounds (not mineralized), or because it had become part ofthe microbial biomass. This parameter reached the highestvalues at the end of summer, with levels around 35 ppm(equivalent to 100 kg N ha−1) regardless of the fertilizationtreatment, enough amounts for rainfed cereal crops insemiarid environments (2000 kg ha−1 grain yields) [3]. Itexplains why the cereal-fallow rotation has been historicallyused by farmers in rainfed crops, even before the appearanceof external fertilizers.
Application of compost did not result in an increase ofvegetal biomass and soil NO3-N content, which indicates thatthe organic nitrogen supplied by the compost (70 kg ha−1)was not transformed into nitrate, in agreement with Pardoet al. [26]. Van Faassen and Van Dijk [31] also reported thatmineralization of organic nitrogen from manures is rathervariable depending on manure type and soil properties.
In general, SOM at the end of the study maintainedtheir initial levels, in concordance with Pardo et al. [26],which indicates that crop rotations and burying the vetch
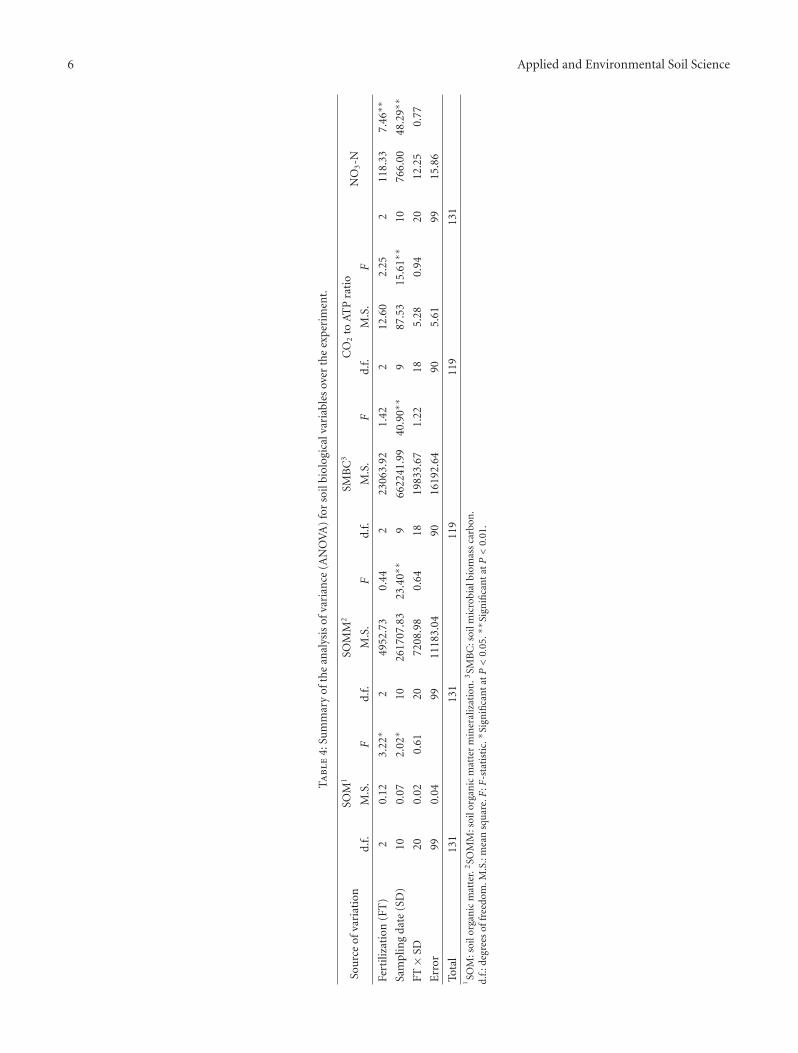
6 Applied and Environmental Soil Science
Ta
ble
4:Su
mm
ary
ofth
ean
alys
isof
vari
ance
(AN
OV
A)
for
soil
biol
ogic
alva
riab
les
over
the
expe
rim
ent.
Sou
rce
ofva
riat
ion
SOM
1SO
MM
2SM
BC
3C
O2
toA
TP
rati
oN
O3-N
d.f.
M.S
.F
d.f.
M.S
.F
d.f.
M.S
.F
d.f.
M.S
.F
Fert
iliza
tion
(FT
)2
0.12
3.22
∗2
4952
.73
0.44
223
063.
921.
422
12.6
02.
252
118.
337.
46∗∗
Sam
plin
gda
te(S
D)
100.
072.
02∗
1026
1707
.83
23.4
0∗∗
966
2241
.99
40.9
0∗∗
987
.53
15.6
1∗∗
1076
6.00
48.2
9∗∗
FT×
SD20
0.02
0.61
2072
08.9
80.
6418
1983
3.67
1.22
185.
280.
9420
12.2
50.
77
Err
or99
0.04
9911
183.
0490
1619
2.64
905.
6199
15.8
6
Tota
l13
113
111
911
913
11SO
M:s
oilo
rgan
icm
atte
r.2SO
MM
:soi
lorg
anic
mat
ter
min
eral
izat
ion
.3SM
BC
:soi
lmic
robi
albi
omas
sca
rbon
.d.
f.:d
egre
esof
free
dom
.M.S
.:m
ean
squ
are.F
:F-s
tati
stic
.∗Si
gnifi
can
tatP<
0.05
.∗∗ S
ign
ifica
nt
atP<
0.01
.
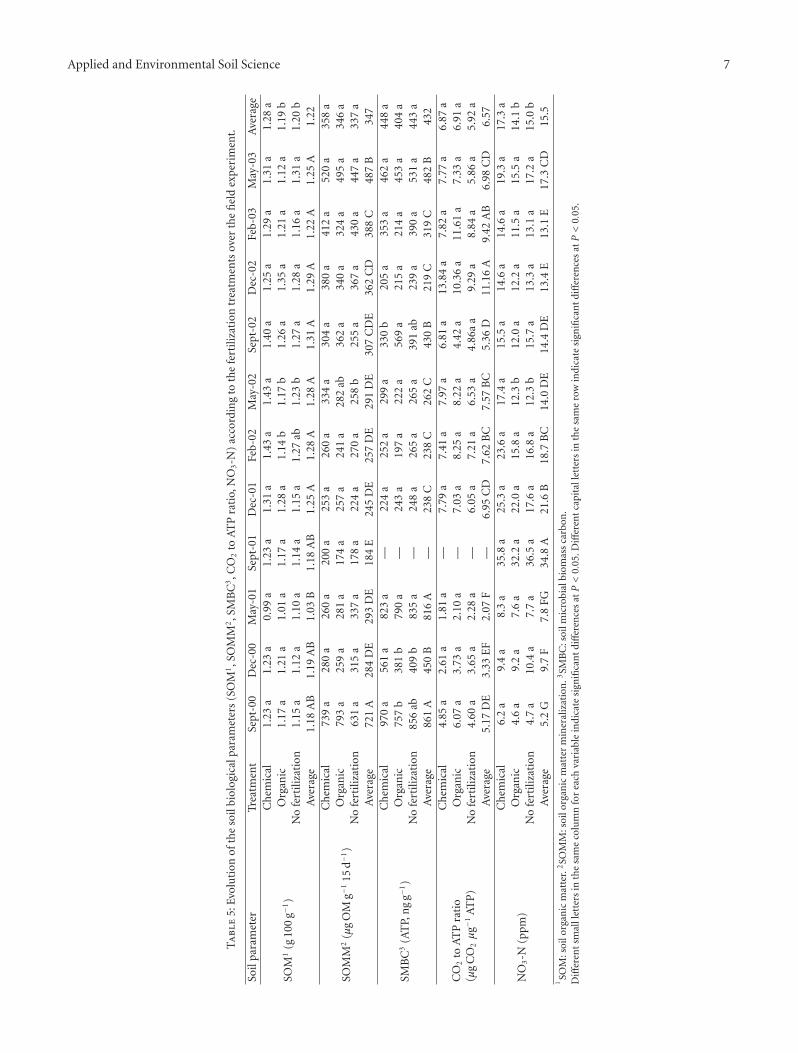
Applied and Environmental Soil Science 7
Ta
ble
5:Ev
olu
tion
ofth
eso
ilbi
olog
ical
para
met
ers
(SO
M1,S
OM
M2,S
MB
C3,C
O2
toA
TP
rati
o,N
O3-N
)ac
cord
ing
toth
efe
rtili
zati
ontr
eatm
ents
over
the
fiel
dex
peri
men
t.
Soil
para
met
erTr
eatm
ent
Sept
-00
Dec
-00
May
-01
Sept
-01
Dec
-01
Feb-
02M
ay-0
2Se
pt-0
2D
ec-0
2Fe
b-03
May
-03
Ave
rage
SOM
1(g
100
g−1)
Ch
emic
al1.
23a
1.23
a0.
99a
1.23
a1.
31a
1.43
a1.
43a
1.40
a1.
25a
1.29
a1.
31a
1.28
aO
rgan
ic1.
17a
1.21
a1.
01a
1.17
a1.
28a
1.14
b1.
17b
1.26
a1.
35a
1.21
a1.
12a
1.19
bN
ofe
rtili
zati
on1.
15a
1.12
a1.
10a
1.14
a1.
15a
1.27
ab1.
23b
1.27
a1.
28a
1.16
a1.
31a
1.20
bA
vera
ge1.
18A
B1.
19A
B1.
03B
1.18
AB
1.25
A1.
28A
1.28
A1.
31A
1.29
A1.
22A
1.25
A1.
22
SOM
M2
(µg
OM
g−1
15d−
1)
Ch
emic
al73
9a
280
a26
0a
200
a25
3a
260
a33
4a
304
a38
0a
412
a52
0a
358
aO
rgan
ic79
3a
259
a28
1a
174
a25
7a
241
a28
2ab
362
a34
0a
324
a49
5a
346
aN
ofe
rtili
zati
on63
1a
315
a33
7a
178
a22
4a
270
a25
8b
255
a36
7a
430
a44
7a
337
aA
vera
ge72
1A
284
DE
293
DE
184
E24
5D
E25
7D
E29
1D
E30
7C
DE
362
CD
388
C48
7B
347
SMB
C3
(AT
P,n
gg−
1)
Ch
emic
al97
0a
561
a82
3a
—22
4a
252
a29
9a
330
b20
5a
353
a46
2a
448
aO
rgan
ic75
7b
381
b79
0a
—24
3a
197
a22
2a
569
a21
5a
214
a45
3a
404
aN
ofe
rtili
zati
on85
6ab
409
b83
5a
—24
8a
265
a26
5a
391
ab23
9a
390
a53
1a
443
aA
vera
ge86
1A
450
B81
6A
—23
8C
238
C26
2C
430
B21
9C
319
C48
2B
432
CO
2to
AT
Pra
tio
(µg
CO
2µ
g−1
AT
P)
Ch
emic
al4.
85a
2.61
a1.
81a
—7.
79a
7.41
a7.
97a
6.81
a13
.84
a7.
82a
7.77
a6.
87a
Org
anic
6.07
a3.
73a
2.10
a—
7.03
a8.
25a
8.22
a4.
42a
10.3
6a
11.6
1a
7.33
a6.
91a
No
fert
iliza
tion
4.60
a3.
65a
2.28
a—
6.05
a7.
21a
6.53
a4.
86a
a9.
29a
8.84
a5.
86a
5.92
aA
vera
ge5.
17D
E3.
33E
F2.
07F
—6.
95C
D7.
62B
C7.
57B
C5.
36D
11.1
6A
9.42
AB
6.98
CD
6.57
NO
3-N
(ppm
)
Ch
emic
al6.
2a
9.4
a8.
3a
35.8
a25
.3a
23.6
a17
.4a
15.5
a14
.6a
14.6
a19
.3a
17.3
aO
rgan
ic4.
6a
9.2
a7.
6a
32.2
a22
.0a
15.8
a12
.3b
12.0
a12
.2a
11.5
a15
.5a
14.1
bN
ofe
rtili
zati
on4.
7a
10.4
a7.
7a
36.5
a17
.6a
16.8
a12
.3b
15.7
a13
.3a
13.1
a17
.2a
15.0
bA
vera
ge5.
2G
9.7
F7.
8FG
34.8
A21
.6B
18.7
BC
14.0
DE
14.4
DE
13.4
E13
.1E
17.3
CD
15.5
1SO
M:s
oilo
rgan
icm
atte
r.2SO
MM
:soi
lorg
anic
mat
ter
min
eral
izat
ion
.3SM
BC
:soi
lmic
robi
albi
omas
sca
rbon
.D
iffer
ent
smal
llet
ters
inth
esa
me
colu
mn
for
each
vari
able
indi
cate
sign
ifica
nt
diff
eren
ces
atP<
0.05
.Diff
eren
tca
pita
llet
ters
inth
esa
me
row
indi
cate
sign
ifica
nt
diff
eren
ces
atP<
0.05
.
8 Applied and Environmental Soil Science
and the crop residues after harvesting help to maintain thesoil fertility.
5. Conclusions
The study of different soil biochemical parameters in arainfed crop-rotation in a sandy-loam soil indicates that theimprovement of soil quality depended more on the weatherconditions than on the type of fertilizers used. Organicfertilization consisting of 2500 kg compost ha−1 did notimprove the quantity and quality of soil organic matter, beingsimilar to those observed when chemical or no fertilizer wereused. However, the inclusion of a legume in the croppingsystem and the burying of crop residues after harvestingwere enough to maintain the initial soil organic matterlevels. Including a fallow period in a crop rotation is advis-able because the soil microorganism populations increased(appropriate moisture and temperature conditions and notcompetition with crops). Additionally, at the end of fallowsoil NO3-N contents were high and enough for cereal growthin semiarid environments.
Acknowledgments
The research was supported by projects INIA SC 96-081 andRTA 01-108. The authors would like to thank Luis Martınde Eugenio and Jose Ramon Vadillo for performing the fieldoperations and helping to compile the corresponding dataover the study period.
References
[1] C. Tu, J. B. Ristaino, and S. Hu, “Soil microbial biomass andactivity in organic tomato farming systems: effects of organicinputs and straw mulching,” Soil Biology and Biochemistry, vol.38, no. 2, pp. 247–255, 2006.
[2] A. S. F. Araujo, V. B. Santos, and R. T. R. Monteiro, “Responsesof soil microbial biomass and activity for practices of organicand conventional farming systems in Piauı state, Brazil,”European Journal of Soil Biology, vol. 44, no. 2, pp. 225–230,2008.
[3] M. M. Moreno, C. Lacasta, R. Meco, and C. Moreno, “Rainfedcrop energy balance of different farming systems and croprotations in a semi-arid environment: results of a long-termtrial,” Soil and Tillage Research, vol. 114, no. 1, pp. 18–27, 2011.
[4] S. Melero, J. C. R. Porras, J. F. Herencia, and E. Madejon,“Chemical and biochemical properties in a silty loam soilunder conventional and organic management,” Soil and TillageResearch, vol. 90, no. 1-2, pp. 162–170, 2006.
[5] C. A. Helander and K. Delin, “Evaluation of farming systemsaccording to valuation indices developed within a Europeannetwork on integrated and ecological arable farming systems,”European Journal of Agronomy, vol. 21, no. 1, pp. 53–67, 2004.
[6] U. Jørgensen, T. Dalgaard, and E. S. Kristensen, “Biomassenergy in organic farming—the potential role of short rotationcoppice,” Biomass and Bioenergy, vol. 28, no. 2, pp. 237–248,2005.
[7] IFOAM Norms, International Federation of Organic Agricul-ture Movements, 2002.
[8] A. Fließbach and P. Mader, “Microbial biomass and size-density fractions differ between soils of organic and conven-tional agricultural systems,” Soil Biology and Biochemistry, vol.32, no. 6, pp. 757–768, 2000.
[9] J. C. Garcıa Gil, Efectos residuales y acumulativos producidospor la aplicacion de compost de residuos urbanos y lodosde depuradoras sobre agrosistemas mediterraneos degradados,Ph.D. thesis, Science Faculty, Autonomous University ofMadrid, Madrid, Spain, 2001.
[10] D. L. Karlen, M. J. Mausbach, J. W. Doran, R. G. Cline, R. F.Harris, and G. E. Schuman, “Soil quality: a concept, definition,and framework for evaluation,” Soil Science Society of AmericaJournal, vol. 61, no. 1, pp. 4–10, 1997.
[11] J. W. Doran, M. Sarrantonio, and M. A. Liebig, “Soil healthand sustainability,” in Advances in Agronomy, D. L. Sparks, Ed.,vol. 56, pp. 25–37, Academic Press, San Diego, Calif, USA,1996.
[12] S. Melero, E. Madejon, J. C. Ruiz, and J. F. Herencia, “Chemicaland biochemical properties of a clay soil under dryland agri-culture system as affected by organic fertilization,” EuropeanJournal of Agronomy, vol. 26, no. 3, pp. 327–334, 2007.
[13] M. R. Carter, E. G. Gregorich, D. W. Anderson, J. W. Doran, H.H. Janzen, and F. J. Pierce, “Chapter 1 Concepts of soil qualityand their significance,” Developments in Soil Science, vol. 25,pp. 1–19, 1997.
[14] E. E. Marriott and M. Wander, “Qualitative and quantitativedifferences in particulate organic matter fractions in organicand conventional farming systems,” Soil Biology and Biochem-istry, vol. 38, no. 7, pp. 1527–1536, 2006.
[15] D. Rotenberg, A. J. Wells, E. J. Chapman, A. E. Whitfield, R. M.Goodman, and L. R. Cooperband, “Soil properties associatedwith organic matter-mediated suppression of bean root rotin field soil amended with fresh and composted paper millresiduals,” Soil Biology and Biochemistry, vol. 39, no. 11, pp.2936–2948, 2007.
[16] A. P. Silva, L. C. Babujia, J. C. Franchini, R. A. Souza, and M.Hungria, “Microbial biomass under various soil- and crop-management systems in short- and long-term experiments inBrazil,” Field Crops Research, vol. 119, no. 1, pp. 20–26, 2010.
[17] M. Fernandez-Pascual, M. de Marıa, and M. R. de Felipe,“Fijacion biologica de nitrogeno: factores limitantes,” inCiencia y Medio Ambiente, F. Valladares, Ed., pp. 195–202,CSIC, Madrid, Spain, 2002.
[18] USDA, Keys to Soil Taxonomy, Tenth Edition, Soil Survey Staff,United States Department of Agriculture NRCS, 2006.
[19] J. H. Wetters and K. L. Uglum, “Direct spectrophotometricsimultaneous determination of nitrite and nitrate in theultraviolet,” Analytical Chemistry, vol. 42, no. 3, pp. 335–340,1970.
[20] N. Maire, D. Borcard, E. Laczko, and W. Matthey, “Organicmatter cycling in grassland soils of the Swiss Jura mountains:biodiversity and strategies of the living communities,” SoilBiology and Biochemistry, vol. 31, no. 9, pp. 1281–1293, 1999.
[21] D. A. Wardle and A. Ghani, “A critique of the microbialmetabolic quotient (qCO2) as a bioindicator of disturbanceand ecosystem development,” Soil Biology and Biochemistry,vol. 27, no. 12, pp. 1601–1610, 1995.
[22] T. H. Anderson and K. H. Domsch, “Application of eco-physiological quotients (qCO2 and qD) on microbial bio-masses from soils of different cropping histories,” Soil Biologyand Biochemistry, vol. 22, no. 2, pp. 251–255, 1990.
[23] E. Madejon, R. Lopez, J. M. Murillo, and F. Cabrera, “Agri-cultural use of three (sugar-beet) vinasse composts: effect
Applied and Environmental Soil Science 9
on crops and chemical properties of a Cambisol soil in theGuadalquivir river valley (SW Spain),” Agriculture, Ecosystemsand Environment, vol. 84, no. 1, pp. 55–65, 2001.
[24] S. Marinari, G. Masciandaro, B. Ceccanti, and S. Grego, “Evo-lution of soil organic matter changes using pyrolysis andmetabolic indices: a comparison between organic and mineralfertilization,” Bioresource Technology, vol. 98, no. 13, pp. 2495–2502, 2007.
[25] Q. R. Wang, Y. C. Li, and W. Klassen, “Changes of soil micro-bial biomass carbon and nitrogen with cover crops andirrigation in a tomato field,” Journal of Plant Nutrition, vol.30, no. 4, pp. 623–639, 2007.
[26] G. Pardo, J. Cavero, J. Aibar, and C. Zaragoza, “Nutrientevolution in soil and cereal yield under different fertilizationtype in dryland,” Nutrient Cycling in Agroecosystems, vol. 84,no. 3, pp. 267–279, 2009.
[27] P. A. Garcıa-Galavıs, C. Santamarıa, J. C. Ruiz, and A. Daza,“Efecto beneficioso de la agricultura ecologica sobre losmicroorganismos del suelo,” in Agroecologıa: Referente Parala Transicion de los Sistemas Agrarios, VI SEAE Congress, pp.1143–1151, Madrid, Spain, 2004.
[28] E. Farrus, M. Adrover, A. Forss, and J. Vadell, “Comparacionde tres fuentes de materia organica sobre las caracterısticasdel suelo,” in Agroecologıa: Referente Para la Transicion de losSistemas Agrarios, VI SEAE Congress, pp. 1111–1123, Madrid,Spain, 2004.
[29] Z. Huang, Z. Xu, and C. Chen, “Effect of mulching on labilesoil organic matter pools, microbial community functionaldiversity and nitrogen transformations in two hardwoodplantations of subtropical Australia,” Applied Soil Ecology, vol.40, no. 2, pp. 229–239, 2008.
[30] C. Calabria, I. Bautista, and M. Valero, “Indices biologicosde disponibilidad de nitrogeno en suelos de la ComunidadValenciana,” in Agroecologıa: Referente para la Transicion de losSistemas Agrarios, VI SEAE Congress, pp. 1017–1032, Madrid,Spain, 2004.
[31] H. G. Van Faassen and H. Van Dijk, “Manure as a source ofnitrogen and phosphorus in soils,” in Animal Manure onGrassland and Fodder Crops, Fertilizer or Waste Development inPlant and Soil Sciences, H. G. van der Meer, R. J. Unwen, T. A.van Dijk, and G. C. Ennik, Eds., pp. 27–45, Martinus NijhoffPublishers, Dordrecht, The Netherlands, 1987.
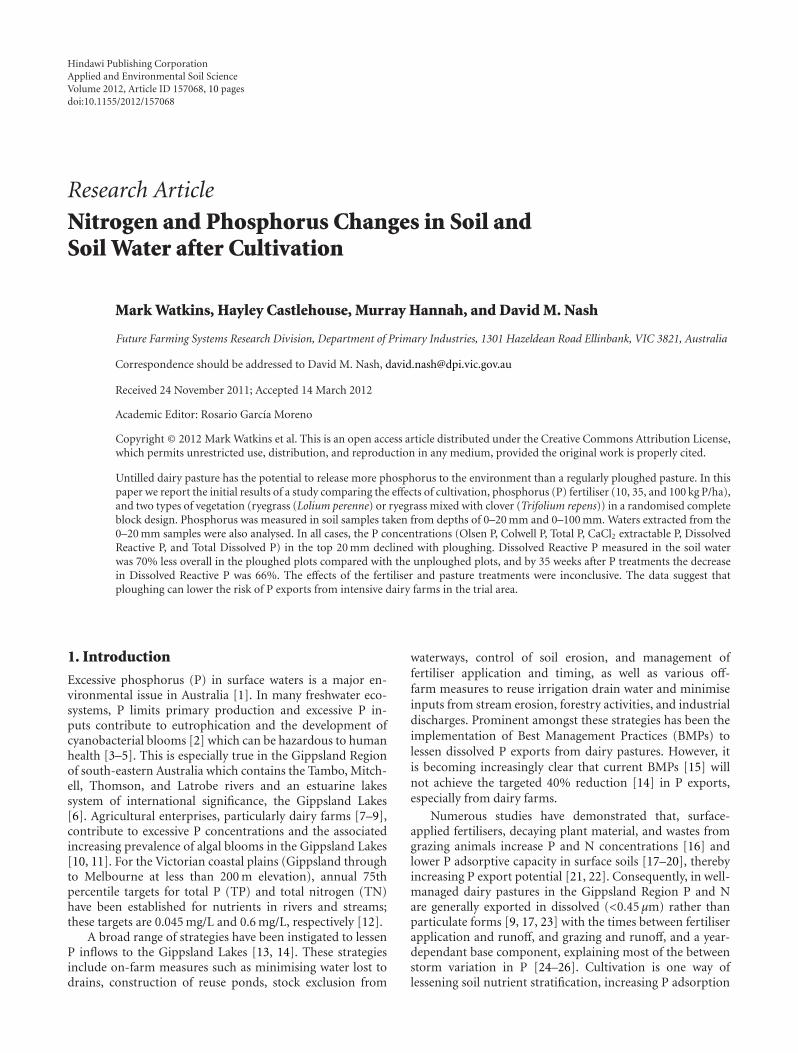
Hindawi Publishing CorporationApplied and Environmental Soil ScienceVolume 2012, Article ID 157068, 10 pagesdoi:10.1155/2012/157068
Research Article
Nitrogen and Phosphorus Changes in Soil andSoil Water after Cultivation
Mark Watkins, Hayley Castlehouse, Murray Hannah, and David M. Nash
Future Farming Systems Research Division, Department of Primary Industries, 1301 Hazeldean Road Ellinbank, VIC 3821, Australia
Correspondence should be addressed to David M. Nash, [email protected]
Received 24 November 2011; Accepted 14 March 2012
Academic Editor: Rosario Garcıa Moreno
Copyright © 2012 Mark Watkins et al. This is an open access article distributed under the Creative Commons Attribution License,which permits unrestricted use, distribution, and reproduction in any medium, provided the original work is properly cited.
Untilled dairy pasture has the potential to release more phosphorus to the environment than a regularly ploughed pasture. In thispaper we report the initial results of a study comparing the effects of cultivation, phosphorus (P) fertiliser (10, 35, and 100 kg P/ha),and two types of vegetation (ryegrass (Lolium perenne) or ryegrass mixed with clover (Trifolium repens)) in a randomised completeblock design. Phosphorus was measured in soil samples taken from depths of 0–20 mm and 0–100 mm. Waters extracted from the0–20 mm samples were also analysed. In all cases, the P concentrations (Olsen P, Colwell P, Total P, CaCl2 extractable P, DissolvedReactive P, and Total Dissolved P) in the top 20 mm declined with ploughing. Dissolved Reactive P measured in the soil waterwas 70% less overall in the ploughed plots compared with the unploughed plots, and by 35 weeks after P treatments the decreasein Dissolved Reactive P was 66%. The effects of the fertiliser and pasture treatments were inconclusive. The data suggest thatploughing can lower the risk of P exports from intensive dairy farms in the trial area.
1. Introduction
Excessive phosphorus (P) in surface waters is a major en-vironmental issue in Australia [1]. In many freshwater eco-systems, P limits primary production and excessive P in-puts contribute to eutrophication and the development ofcyanobacterial blooms [2] which can be hazardous to humanhealth [3–5]. This is especially true in the Gippsland Regionof south-eastern Australia which contains the Tambo, Mitch-ell, Thomson, and Latrobe rivers and an estuarine lakessystem of international significance, the Gippsland Lakes[6]. Agricultural enterprises, particularly dairy farms [7–9],contribute to excessive P concentrations and the associatedincreasing prevalence of algal blooms in the Gippsland Lakes[10, 11]. For the Victorian coastal plains (Gippsland throughto Melbourne at less than 200 m elevation), annual 75thpercentile targets for total P (TP) and total nitrogen (TN)have been established for nutrients in rivers and streams;these targets are 0.045 mg/L and 0.6 mg/L, respectively [12].
A broad range of strategies have been instigated to lessenP inflows to the Gippsland Lakes [13, 14]. These strategiesinclude on-farm measures such as minimising water lost todrains, construction of reuse ponds, stock exclusion from
waterways, control of soil erosion, and management offertiliser application and timing, as well as various off-farm measures to reuse irrigation drain water and minimiseinputs from stream erosion, forestry activities, and industrialdischarges. Prominent amongst these strategies has been theimplementation of Best Management Practices (BMPs) tolessen dissolved P exports from dairy pastures. However, itis becoming increasingly clear that current BMPs [15] willnot achieve the targeted 40% reduction [14] in P exports,especially from dairy farms.
Numerous studies have demonstrated that, surface-applied fertilisers, decaying plant material, and wastes fromgrazing animals increase P and N concentrations [16] andlower P adsorptive capacity in surface soils [17–20], therebyincreasing P export potential [21, 22]. Consequently, in well-managed dairy pastures in the Gippsland Region P and Nare generally exported in dissolved (<0.45 μm) rather thanparticulate forms [9, 17, 23] with the times between fertiliserapplication and runoff, and grazing and runoff, and a year-dependant base component, explaining most of the betweenstorm variation in P [24–26]. Cultivation is one way oflessening soil nutrient stratification, increasing P adsorption
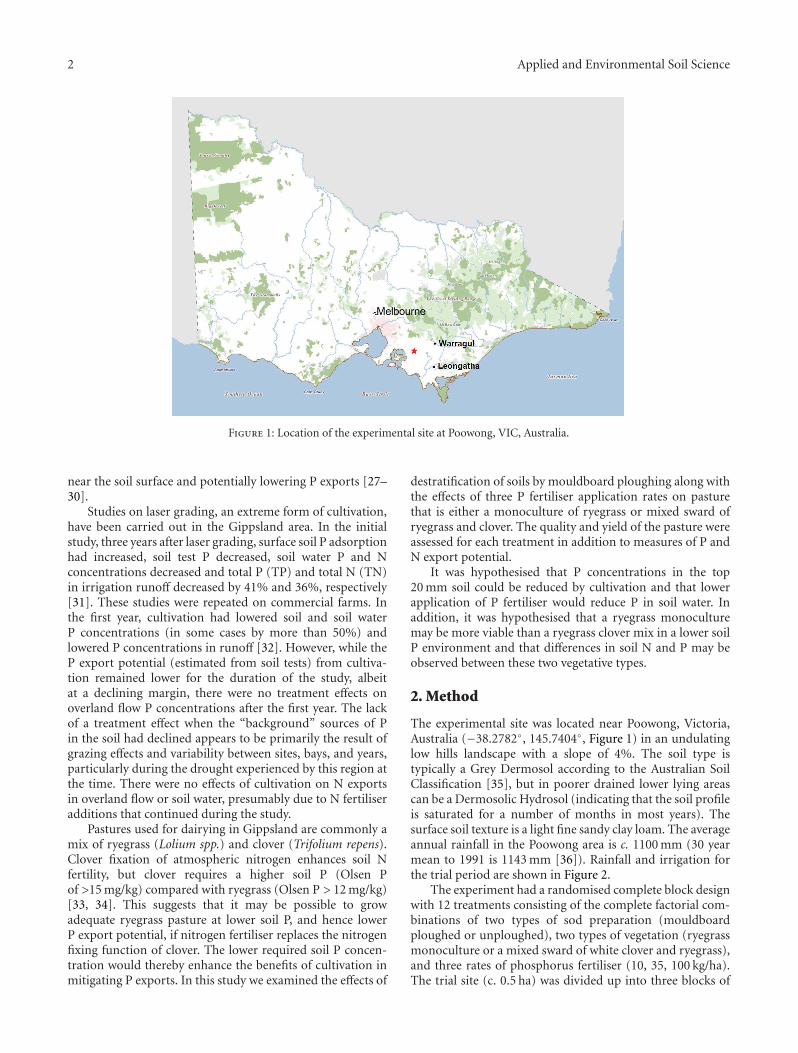
2 Applied and Environmental Soil Science
Figure 1: Location of the experimental site at Poowong, VIC, Australia.
near the soil surface and potentially lowering P exports [27–30].
Studies on laser grading, an extreme form of cultivation,have been carried out in the Gippsland area. In the initialstudy, three years after laser grading, surface soil P adsorptionhad increased, soil test P decreased, soil water P and Nconcentrations decreased and total P (TP) and total N (TN)in irrigation runoff decreased by 41% and 36%, respectively[31]. These studies were repeated on commercial farms. Inthe first year, cultivation had lowered soil and soil waterP concentrations (in some cases by more than 50%) andlowered P concentrations in runoff [32]. However, while theP export potential (estimated from soil tests) from cultiva-tion remained lower for the duration of the study, albeitat a declining margin, there were no treatment effects onoverland flow P concentrations after the first year. The lackof a treatment effect when the “background” sources of Pin the soil had declined appears to be primarily the result ofgrazing effects and variability between sites, bays, and years,particularly during the drought experienced by this region atthe time. There were no effects of cultivation on N exportsin overland flow or soil water, presumably due to N fertiliseradditions that continued during the study.
Pastures used for dairying in Gippsland are commonly amix of ryegrass (Lolium spp.) and clover (Trifolium repens).Clover fixation of atmospheric nitrogen enhances soil Nfertility, but clover requires a higher soil P (Olsen Pof >15 mg/kg) compared with ryegrass (Olsen P > 12 mg/kg)[33, 34]. This suggests that it may be possible to growadequate ryegrass pasture at lower soil P, and hence lowerP export potential, if nitrogen fertiliser replaces the nitrogenfixing function of clover. The lower required soil P concen-tration would thereby enhance the benefits of cultivation inmitigating P exports. In this study we examined the effects of
destratification of soils by mouldboard ploughing along withthe effects of three P fertiliser application rates on pasturethat is either a monoculture of ryegrass or mixed sward ofryegrass and clover. The quality and yield of the pasture wereassessed for each treatment in addition to measures of P andN export potential.
It was hypothesised that P concentrations in the top20 mm soil could be reduced by cultivation and that lowerapplication of P fertiliser would reduce P in soil water. Inaddition, it was hypothesised that a ryegrass monoculturemay be more viable than a ryegrass clover mix in a lower soilP environment and that differences in soil N and P may beobserved between these two vegetative types.
2. Method
The experimental site was located near Poowong, Victoria,Australia (−38.2782◦, 145.7404◦, Figure 1) in an undulatinglow hills landscape with a slope of 4%. The soil type istypically a Grey Dermosol according to the Australian SoilClassification [35], but in poorer drained lower lying areascan be a Dermosolic Hydrosol (indicating that the soil profileis saturated for a number of months in most years). Thesurface soil texture is a light fine sandy clay loam. The averageannual rainfall in the Poowong area is c. 1100 mm (30 yearmean to 1991 is 1143 mm [36]). Rainfall and irrigation forthe trial period are shown in Figure 2.
The experiment had a randomised complete block designwith 12 treatments consisting of the complete factorial com-binations of two types of sod preparation (mouldboardploughed or unploughed), two types of vegetation (ryegrassmonoculture or a mixed sward of white clover and ryegrass),and three rates of phosphorus fertiliser (10, 35, 100 kg/ha).The trial site (c. 0.5 ha) was divided up into three blocks of
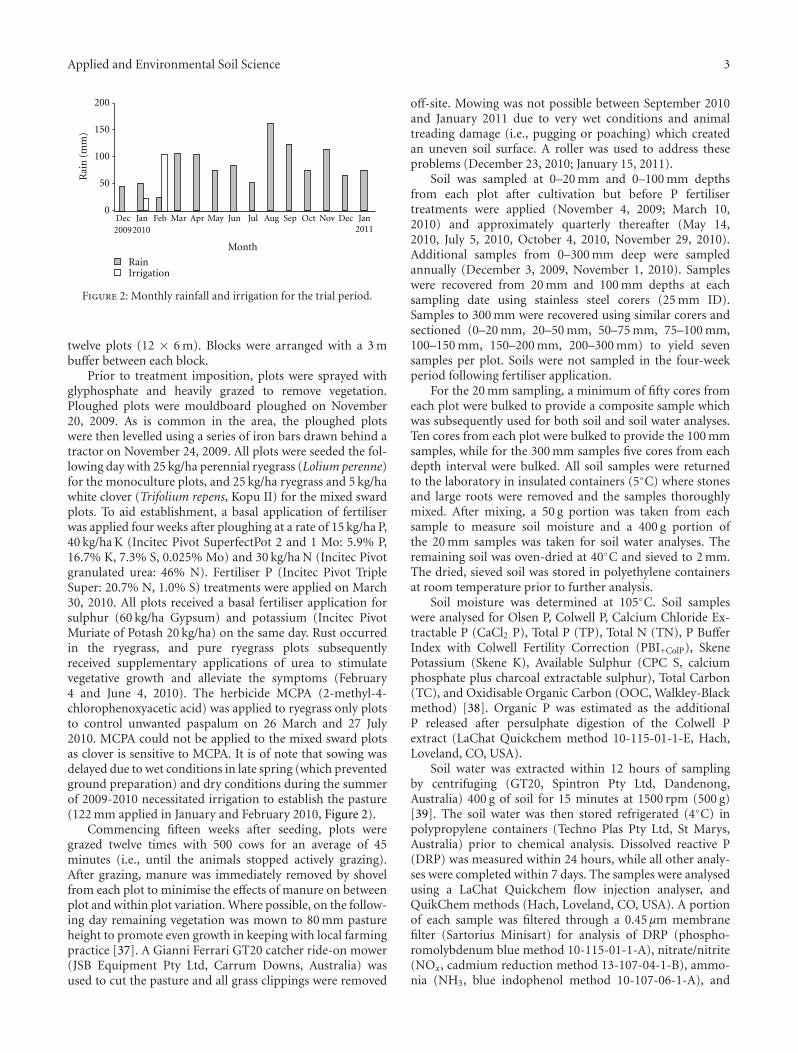
Applied and Environmental Soil Science 3
Rai
n (
mm
)
0
50
100
150
200
RainIrrigation
Month
Dec2009
Jan2010
Feb Mar Apr May Jun Jul Aug Sep Oct Nov Dec Jan2011
Figure 2: Monthly rainfall and irrigation for the trial period.
twelve plots (12 × 6 m). Blocks were arranged with a 3 mbuffer between each block.
Prior to treatment imposition, plots were sprayed withglyphosphate and heavily grazed to remove vegetation.Ploughed plots were mouldboard ploughed on November20, 2009. As is common in the area, the ploughed plotswere then levelled using a series of iron bars drawn behind atractor on November 24, 2009. All plots were seeded the fol-lowing day with 25 kg/ha perennial ryegrass (Lolium perenne)for the monoculture plots, and 25 kg/ha ryegrass and 5 kg/hawhite clover (Trifolium repens, Kopu II) for the mixed swardplots. To aid establishment, a basal application of fertiliserwas applied four weeks after ploughing at a rate of 15 kg/ha P,40 kg/ha K (Incitec Pivot SuperfectPot 2 and 1 Mo: 5.9% P,16.7% K, 7.3% S, 0.025% Mo) and 30 kg/ha N (Incitec Pivotgranulated urea: 46% N). Fertiliser P (Incitec Pivot TripleSuper: 20.7% N, 1.0% S) treatments were applied on March30, 2010. All plots received a basal fertiliser application forsulphur (60 kg/ha Gypsum) and potassium (Incitec PivotMuriate of Potash 20 kg/ha) on the same day. Rust occurredin the ryegrass, and pure ryegrass plots subsequentlyreceived supplementary applications of urea to stimulatevegetative growth and alleviate the symptoms (February4 and June 4, 2010). The herbicide MCPA (2-methyl-4-chlorophenoxyacetic acid) was applied to ryegrass only plotsto control unwanted paspalum on 26 March and 27 July2010. MCPA could not be applied to the mixed sward plotsas clover is sensitive to MCPA. It is of note that sowing wasdelayed due to wet conditions in late spring (which preventedground preparation) and dry conditions during the summerof 2009-2010 necessitated irrigation to establish the pasture(122 mm applied in January and February 2010, Figure 2).
Commencing fifteen weeks after seeding, plots weregrazed twelve times with 500 cows for an average of 45minutes (i.e., until the animals stopped actively grazing).After grazing, manure was immediately removed by shovelfrom each plot to minimise the effects of manure on betweenplot and within plot variation. Where possible, on the follow-ing day remaining vegetation was mown to 80 mm pastureheight to promote even growth in keeping with local farmingpractice [37]. A Gianni Ferrari GT20 catcher ride-on mower(JSB Equipment Pty Ltd, Carrum Downs, Australia) wasused to cut the pasture and all grass clippings were removed
off-site. Mowing was not possible between September 2010and January 2011 due to very wet conditions and animaltreading damage (i.e., pugging or poaching) which createdan uneven soil surface. A roller was used to address theseproblems (December 23, 2010; January 15, 2011).
Soil was sampled at 0–20 mm and 0–100 mm depthsfrom each plot after cultivation but before P fertilisertreatments were applied (November 4, 2009; March 10,2010) and approximately quarterly thereafter (May 14,2010, July 5, 2010, October 4, 2010, November 29, 2010).Additional samples from 0–300 mm deep were sampledannually (December 3, 2009, November 1, 2010). Sampleswere recovered from 20 mm and 100 mm depths at eachsampling date using stainless steel corers (25 mm ID).Samples to 300 mm were recovered using similar corers andsectioned (0–20 mm, 20–50 mm, 50–75 mm, 75–100 mm,100–150 mm, 150–200 mm, 200–300 mm) to yield sevensamples per plot. Soils were not sampled in the four-weekperiod following fertiliser application.
For the 20 mm sampling, a minimum of fifty cores fromeach plot were bulked to provide a composite sample whichwas subsequently used for both soil and soil water analyses.Ten cores from each plot were bulked to provide the 100 mmsamples, while for the 300 mm samples five cores from eachdepth interval were bulked. All soil samples were returnedto the laboratory in insulated containers (5◦C) where stonesand large roots were removed and the samples thoroughlymixed. After mixing, a 50 g portion was taken from eachsample to measure soil moisture and a 400 g portion ofthe 20 mm samples was taken for soil water analyses. Theremaining soil was oven-dried at 40◦C and sieved to 2 mm.The dried, sieved soil was stored in polyethylene containersat room temperature prior to further analysis.
Soil moisture was determined at 105◦C. Soil sampleswere analysed for Olsen P, Colwell P, Calcium Chloride Ex-tractable P (CaCl2 P), Total P (TP), Total N (TN), P BufferIndex with Colwell Fertility Correction (PBI+ColP), SkenePotassium (Skene K), Available Sulphur (CPC S, calciumphosphate plus charcoal extractable sulphur), Total Carbon(TC), and Oxidisable Organic Carbon (OOC, Walkley-Blackmethod) [38]. Organic P was estimated as the additionalP released after persulphate digestion of the Colwell Pextract (LaChat Quickchem method 10-115-01-1-E, Hach,Loveland, CO, USA).
Soil water was extracted within 12 hours of samplingby centrifuging (GT20, Spintron Pty Ltd, Dandenong,Australia) 400 g of soil for 15 minutes at 1500 rpm (500 g)[39]. The soil water was then stored refrigerated (4◦C) inpolypropylene containers (Techno Plas Pty Ltd, St Marys,Australia) prior to chemical analysis. Dissolved reactive P(DRP) was measured within 24 hours, while all other analy-ses were completed within 7 days. The samples were analysedusing a LaChat Quickchem flow injection analyser, andQuikChem methods (Hach, Loveland, CO, USA). A portionof each sample was filtered through a 0.45 μm membranefilter (Sartorius Minisart) for analysis of DRP (phospho-romolybdenum blue method 10-115-01-1-A), nitrate/nitrite(NOx, cadmium reduction method 13-107-04-1-B), ammo-nia (NH3, blue indophenol method 10-107-06-1-A), and
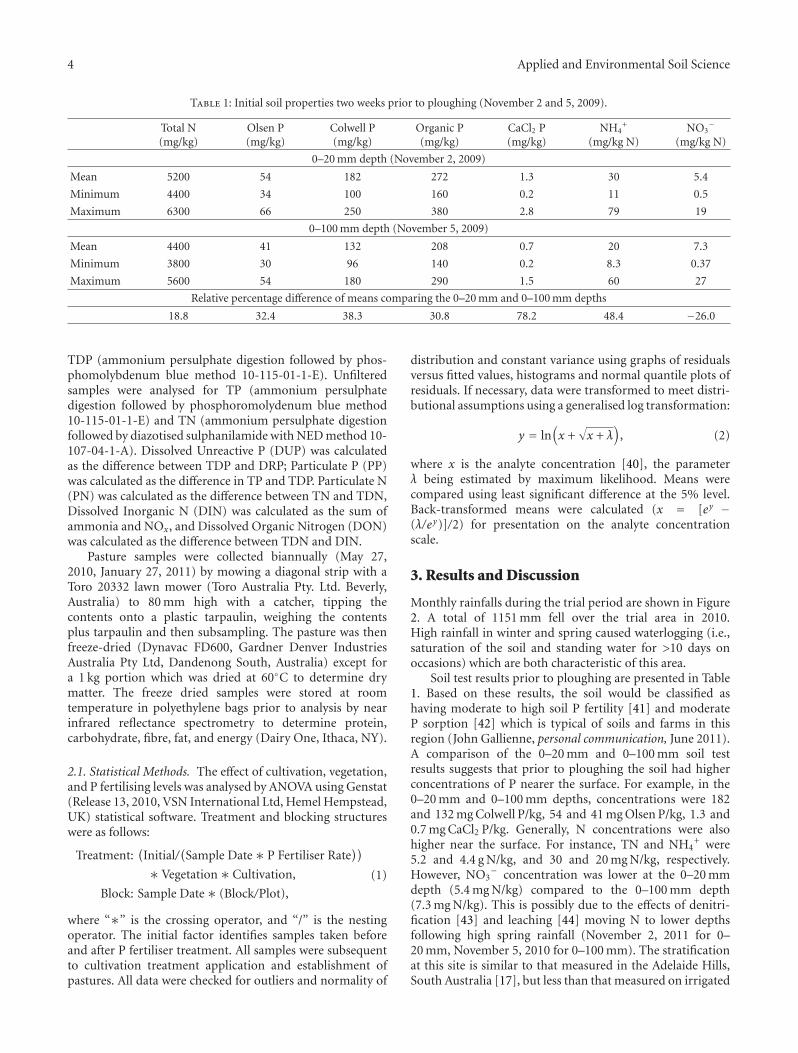
4 Applied and Environmental Soil Science
Table 1: Initial soil properties two weeks prior to ploughing (November 2 and 5, 2009).
Total N(mg/kg)
Olsen P(mg/kg)
Colwell P(mg/kg)
Organic P(mg/kg)
CaCl2 P(mg/kg)
NH4+
(mg/kg N)NO3
−
(mg/kg N)
0–20 mm depth (November 2, 2009)
Mean 5200 54 182 272 1.3 30 5.4
Minimum 4400 34 100 160 0.2 11 0.5
Maximum 6300 66 250 380 2.8 79 19
0–100 mm depth (November 5, 2009)
Mean 4400 41 132 208 0.7 20 7.3
Minimum 3800 30 96 140 0.2 8.3 0.37
Maximum 5600 54 180 290 1.5 60 27
Relative percentage difference of means comparing the 0–20 mm and 0–100 mm depths
18.8 32.4 38.3 30.8 78.2 48.4 −26.0
TDP (ammonium persulphate digestion followed by phos-phomolybdenum blue method 10-115-01-1-E). Unfilteredsamples were analysed for TP (ammonium persulphatedigestion followed by phosphoromolydenum blue method10-115-01-1-E) and TN (ammonium persulphate digestionfollowed by diazotised sulphanilamide with NED method 10-107-04-1-A). Dissolved Unreactive P (DUP) was calculatedas the difference between TDP and DRP; Particulate P (PP)was calculated as the difference in TP and TDP. Particulate N(PN) was calculated as the difference between TN and TDN,Dissolved Inorganic N (DIN) was calculated as the sum ofammonia and NOx, and Dissolved Organic Nitrogen (DON)was calculated as the difference between TDN and DIN.
Pasture samples were collected biannually (May 27,2010, January 27, 2011) by mowing a diagonal strip with aToro 20332 lawn mower (Toro Australia Pty. Ltd. Beverly,Australia) to 80 mm high with a catcher, tipping thecontents onto a plastic tarpaulin, weighing the contentsplus tarpaulin and then subsampling. The pasture was thenfreeze-dried (Dynavac FD600, Gardner Denver IndustriesAustralia Pty Ltd, Dandenong South, Australia) except fora 1 kg portion which was dried at 60◦C to determine drymatter. The freeze dried samples were stored at roomtemperature in polyethylene bags prior to analysis by nearinfrared reflectance spectrometry to determine protein,carbohydrate, fibre, fat, and energy (Dairy One, Ithaca, NY).
2.1. Statistical Methods. The effect of cultivation, vegetation,and P fertilising levels was analysed by ANOVA using Genstat(Release 13, 2010, VSN International Ltd, Hemel Hempstead,UK) statistical software. Treatment and blocking structureswere as follows:
Treatment:(Initial/
(Sample Date∗ P Fertiliser Rate
))
∗Vegetation∗ Cultivation,
Block: Sample Date∗ (Block/Plot),
(1)
where “∗” is the crossing operator, and “/” is the nestingoperator. The initial factor identifies samples taken beforeand after P fertiliser treatment. All samples were subsequentto cultivation treatment application and establishment ofpastures. All data were checked for outliers and normality of
distribution and constant variance using graphs of residualsversus fitted values, histograms and normal quantile plots ofresiduals. If necessary, data were transformed to meet distri-butional assumptions using a generalised log transformation:
y = ln(x +
√x + λ
), (2)
where x is the analyte concentration [40], the parameterλ being estimated by maximum likelihood. Means werecompared using least significant difference at the 5% level.Back-transformed means were calculated (x = [ey −(λ/ey)]/2) for presentation on the analyte concentrationscale.
3. Results and Discussion
Monthly rainfalls during the trial period are shown in Figure2. A total of 1151 mm fell over the trial area in 2010.High rainfall in winter and spring caused waterlogging (i.e.,saturation of the soil and standing water for >10 days onoccasions) which are both characteristic of this area.
Soil test results prior to ploughing are presented in Table1. Based on these results, the soil would be classified ashaving moderate to high soil P fertility [41] and moderateP sorption [42] which is typical of soils and farms in thisregion (John Gallienne, personal communication, June 2011).A comparison of the 0–20 mm and 0–100 mm soil testresults suggests that prior to ploughing the soil had higherconcentrations of P nearer the surface. For example, in the0–20 mm and 0–100 mm depths, concentrations were 182and 132 mg Colwell P/kg, 54 and 41 mg Olsen P/kg, 1.3 and0.7 mg CaCl2 P/kg. Generally, N concentrations were alsohigher near the surface. For instance, TN and NH4
+ were5.2 and 4.4 g N/kg, and 30 and 20 mg N/kg, respectively.However, NO3
− concentration was lower at the 0–20 mmdepth (5.4 mg N/kg) compared to the 0–100 mm depth(7.3 mg N/kg). This is possibly due to the effects of denitri-fication [43] and leaching [44] moving N to lower depthsfollowing high spring rainfall (November 2, 2011 for 0–20 mm, November 5, 2010 for 0–100 mm). The stratificationat this site is similar to that measured in the Adelaide Hills,South Australia [17], but less than that measured on irrigated
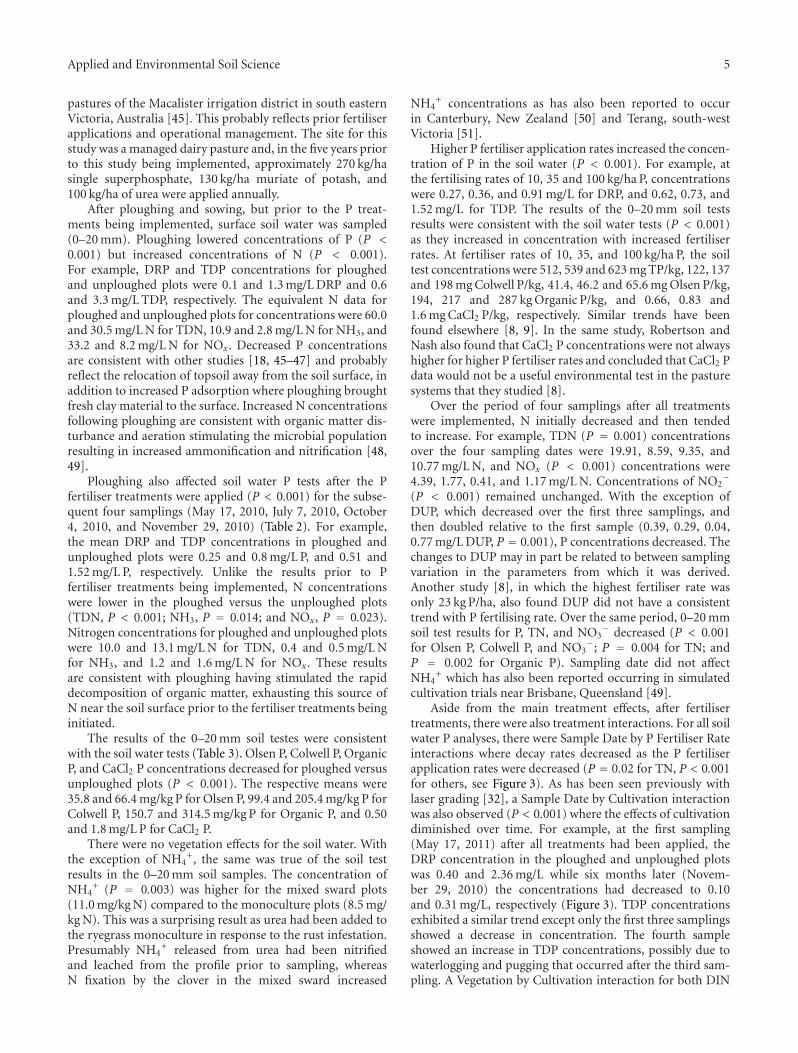
Applied and Environmental Soil Science 5
pastures of the Macalister irrigation district in south easternVictoria, Australia [45]. This probably reflects prior fertiliserapplications and operational management. The site for thisstudy was a managed dairy pasture and, in the five years priorto this study being implemented, approximately 270 kg/hasingle superphosphate, 130 kg/ha muriate of potash, and100 kg/ha of urea were applied annually.
After ploughing and sowing, but prior to the P treat-ments being implemented, surface soil water was sampled(0–20 mm). Ploughing lowered concentrations of P (P <0.001) but increased concentrations of N (P < 0.001).For example, DRP and TDP concentrations for ploughedand unploughed plots were 0.1 and 1.3 mg/L DRP and 0.6and 3.3 mg/L TDP, respectively. The equivalent N data forploughed and unploughed plots for concentrations were 60.0and 30.5 mg/L N for TDN, 10.9 and 2.8 mg/L N for NH3, and33.2 and 8.2 mg/L N for NOx. Decreased P concentrationsare consistent with other studies [18, 45–47] and probablyreflect the relocation of topsoil away from the soil surface, inaddition to increased P adsorption where ploughing broughtfresh clay material to the surface. Increased N concentrationsfollowing ploughing are consistent with organic matter dis-turbance and aeration stimulating the microbial populationresulting in increased ammonification and nitrification [48,49].
Ploughing also affected soil water P tests after the Pfertiliser treatments were applied (P < 0.001) for the subse-quent four samplings (May 17, 2010, July 7, 2010, October4, 2010, and November 29, 2010) (Table 2). For example,the mean DRP and TDP concentrations in ploughed andunploughed plots were 0.25 and 0.8 mg/L P, and 0.51 and1.52 mg/L P, respectively. Unlike the results prior to Pfertiliser treatments being implemented, N concentrationswere lower in the ploughed versus the unploughed plots(TDN, P < 0.001; NH3, P = 0.014; and NOx, P = 0.023).Nitrogen concentrations for ploughed and unploughed plotswere 10.0 and 13.1 mg/L N for TDN, 0.4 and 0.5 mg/L Nfor NH3, and 1.2 and 1.6 mg/L N for NOx. These resultsare consistent with ploughing having stimulated the rapiddecomposition of organic matter, exhausting this source ofN near the soil surface prior to the fertiliser treatments beinginitiated.
The results of the 0–20 mm soil testes were consistentwith the soil water tests (Table 3). Olsen P, Colwell P, OrganicP, and CaCl2 P concentrations decreased for ploughed versusunploughed plots (P < 0.001). The respective means were35.8 and 66.4 mg/kg P for Olsen P, 99.4 and 205.4 mg/kg P forColwell P, 150.7 and 314.5 mg/kg P for Organic P, and 0.50and 1.8 mg/L P for CaCl2 P.
There were no vegetation effects for the soil water. Withthe exception of NH4
+, the same was true of the soil testresults in the 0–20 mm soil samples. The concentration ofNH4
+ (P = 0.003) was higher for the mixed sward plots(11.0 mg/kg N) compared to the monoculture plots (8.5 mg/kg N). This was a surprising result as urea had been added tothe ryegrass monoculture in response to the rust infestation.Presumably NH4
+ released from urea had been nitrifiedand leached from the profile prior to sampling, whereasN fixation by the clover in the mixed sward increased
NH4+ concentrations as has also been reported to occur
in Canterbury, New Zealand [50] and Terang, south-westVictoria [51].
Higher P fertiliser application rates increased the concen-tration of P in the soil water (P < 0.001). For example, atthe fertilising rates of 10, 35 and 100 kg/ha P, concentrationswere 0.27, 0.36, and 0.91 mg/L for DRP, and 0.62, 0.73, and1.52 mg/L for TDP. The results of the 0–20 mm soil testsresults were consistent with the soil water tests (P < 0.001)as they increased in concentration with increased fertiliserrates. At fertiliser rates of 10, 35, and 100 kg/ha P, the soiltest concentrations were 512, 539 and 623 mg TP/kg, 122, 137and 198 mg Colwell P/kg, 41.4, 46.2 and 65.6 mg Olsen P/kg,194, 217 and 287 kg Organic P/kg, and 0.66, 0.83 and1.6 mg CaCl2 P/kg, respectively. Similar trends have beenfound elsewhere [8, 9]. In the same study, Robertson andNash also found that CaCl2 P concentrations were not alwayshigher for higher P fertiliser rates and concluded that CaCl2 Pdata would not be a useful environmental test in the pasturesystems that they studied [8].
Over the period of four samplings after all treatmentswere implemented, N initially decreased and then tendedto increase. For example, TDN (P = 0.001) concentrationsover the four sampling dates were 19.91, 8.59, 9.35, and10.77 mg/L N, and NOx (P < 0.001) concentrations were4.39, 1.77, 0.41, and 1.17 mg/L N. Concentrations of NO2
−
(P < 0.001) remained unchanged. With the exception ofDUP, which decreased over the first three samplings, andthen doubled relative to the first sample (0.39, 0.29, 0.04,0.77 mg/L DUP, P = 0.001), P concentrations decreased. Thechanges to DUP may in part be related to between samplingvariation in the parameters from which it was derived.Another study [8], in which the highest fertiliser rate wasonly 23 kg P/ha, also found DUP did not have a consistenttrend with P fertilising rate. Over the same period, 0–20 mmsoil test results for P, TN, and NO3
− decreased (P < 0.001for Olsen P, Colwell P, and NO3
−; P = 0.004 for TN; andP = 0.002 for Organic P). Sampling date did not affectNH4
+ which has also been reported occurring in simulatedcultivation trials near Brisbane, Queensland [49].
Aside from the main treatment effects, after fertilisertreatments, there were also treatment interactions. For all soilwater P analyses, there were Sample Date by P Fertiliser Rateinteractions where decay rates decreased as the P fertiliserapplication rates were decreased (P = 0.02 for TN, P < 0.001for others, see Figure 3). As has been seen previously withlaser grading [32], a Sample Date by Cultivation interactionwas also observed (P < 0.001) where the effects of cultivationdiminished over time. For example, at the first sampling(May 17, 2011) after all treatments had been applied, theDRP concentration in the ploughed and unploughed plotswas 0.40 and 2.36 mg/L while six months later (Novem-ber 29, 2010) the concentrations had decreased to 0.10and 0.31 mg/L, respectively (Figure 3). TDP concentrationsexhibited a similar trend except only the first three samplingsshowed a decrease in concentration. The fourth sampleshowed an increase in TDP concentrations, possibly due towaterlogging and pugging that occurred after the third sam-pling. A Vegetation by Cultivation interaction for both DIN
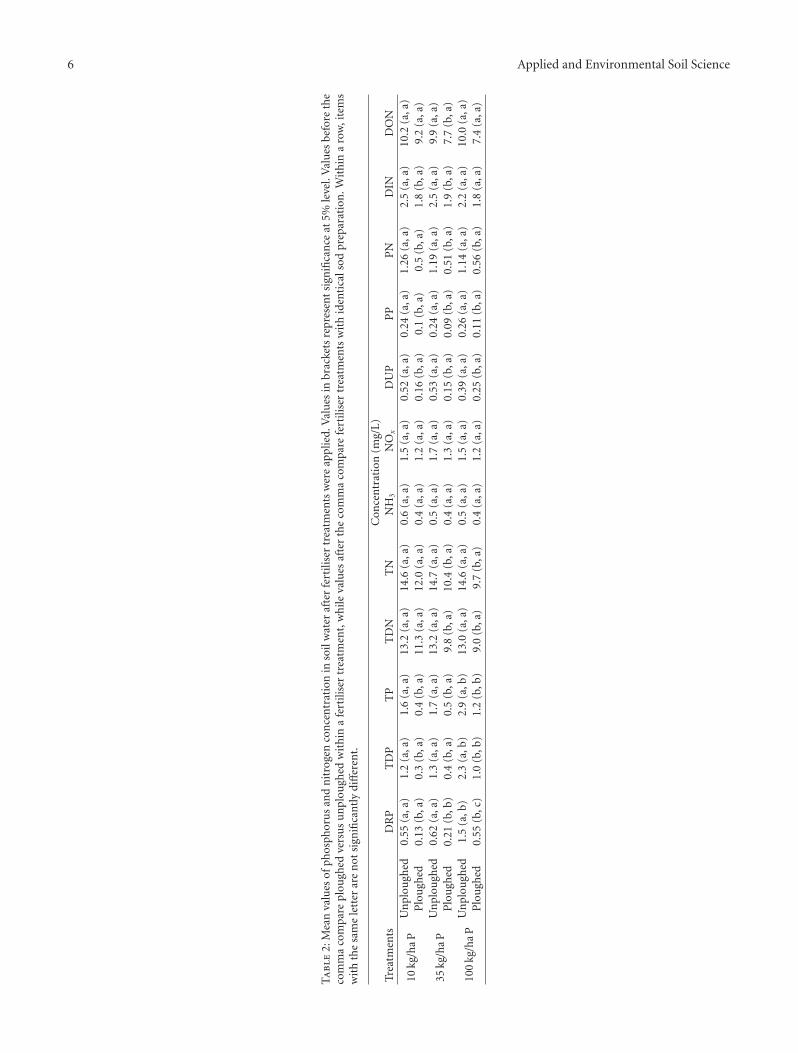
6 Applied and Environmental Soil Science
Ta
ble
2:M
ean
valu
esof
phos
phor
us
and
nit
roge
nco
nce
ntr
atio
nin
soil
wat
eraf
ter
fert
ilise
rtr
eatm
ents
wer
eap
plie
d.V
alu
esin
brac
kets
repr
esen
tsi
gnifi
can
ceat
5%le
vel.
Val
ues
befo
reth
eco
mm
aco
mpa
repl
ough
edve
rsu
su
npl
ough
edw
ith
ina
fert
ilise
rtr
eatm
ent,
wh
ileva
lues
afte
rth
eco
mm
aco
mpa
refe
rtili
ser
trea
tmen
tsw
ith
iden
tica
lsod
prep
arat
ion
.Wit
hin
aro
w,i
tem
sw
ith
the
sam
ele
tter
are
not
sign
ifica
ntl
ydi
ffer
ent.
Con
cen
trat
ion
(mg/
L)Tr
eatm
ents
DR
PT
DP
TP
TD
NT
NN
H3
NO
xD
UP
PP
PN
DIN
DO
N
10kg
/ha
PU
npl
ough
ed0.
55(a
,a)
1.2
(a,a
)1.
6(a
,a)
13.2
(a,a
)14
.6(a
,a)
0.6
(a,a
)1.
5(a
,a)
0.52
(a,a
)0.
24(a
,a)
1.26
(a,a
)2.
5(a
,a)
10.2
(a,a
)P
lou
ghed
0.13
(b,a
)0.
3(b
,a)
0.4
(b,a
)11
.3(a
,a)
12.0
(a,a
)0.
4(a
,a)
1.2
(a,a
)0.
16(b
,a)
0.1
(b,a
)0.
5(b
,a)
1.8
(b,a
)9.
2(a
,a)
35kg
/ha
PU
npl
ough
ed0.
62(a
,a)
1.3
(a,a
)1.
7(a
,a)
13.2
(a,a
)14
.7(a
,a)
0.5
(a,a
)1.
7(a
,a)
0.53
(a,a
)0.
24(a
,a)
1.19
(a,a
)2.
5(a
,a)
9.9
(a,a
)P
lou
ghed
0.21
(b,b
)0.
4(b
,a)
0.5
(b,a
)9.
8(b
,a)
10.4
(b,a
)0.
4(a
,a)
1.3
(a,a
)0.
15(b
,a)
0.09
(b,a
)0.
51(b
,a)
1.9
(b,a
)7.
7(b
,a)
100
kg/h
aP
Un
plou
ghed
1.5
(a,b
)2.
3(a
,b)
2.9
(a,b
)13
.0(a
,a)
14.6
(a,a
)0.
5(a
,a)
1.5
(a,a
)0.
39(a
,a)
0.26
(a,a
)1.
14(a
,a)
2.2
(a,a
)10
.0(a
,a)
Plo
ugh
ed0.
55(b
,c)
1.0
(b,b
)1.
2(b
,b)
9.0
(b,a
)9.
7(b
,a)
0.4
(a,a
)1.
2(a
,a)
0.25
(b,a
)0.
11(b
,a)
0.56
(b,a
)1.
8(a
,a)
7.4
(a,a
)
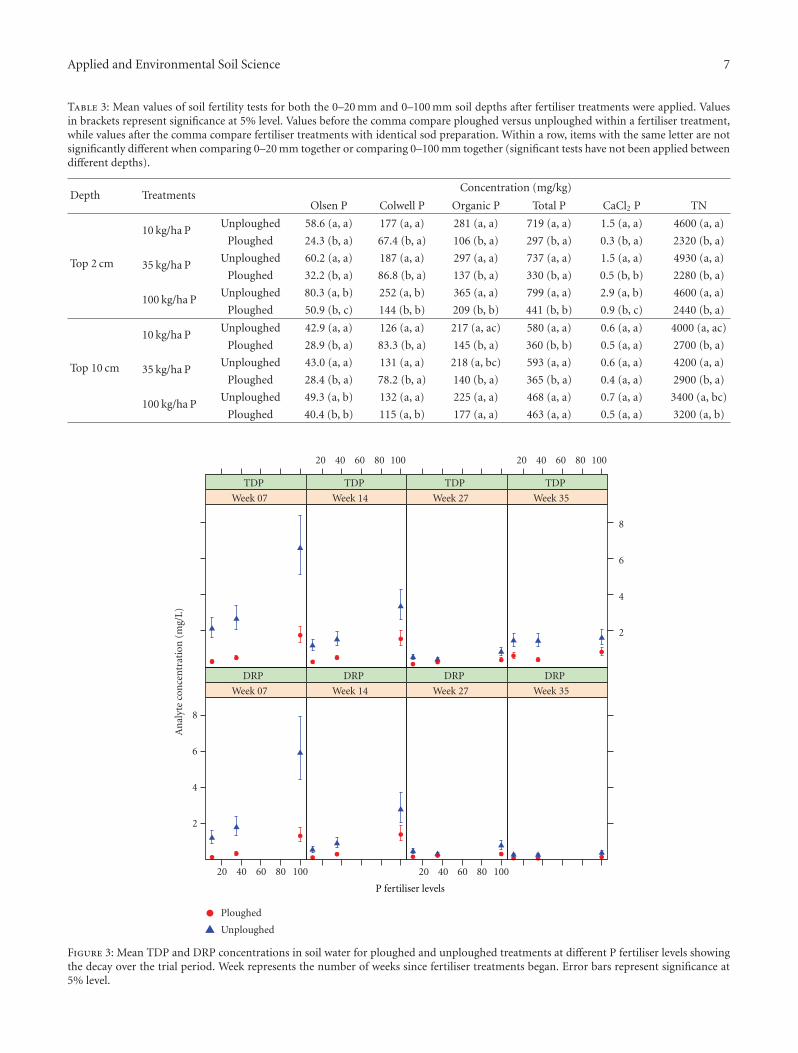
Applied and Environmental Soil Science 7
Table 3: Mean values of soil fertility tests for both the 0–20 mm and 0–100 mm soil depths after fertiliser treatments were applied. Valuesin brackets represent significance at 5% level. Values before the comma compare ploughed versus unploughed within a fertiliser treatment,while values after the comma compare fertiliser treatments with identical sod preparation. Within a row, items with the same letter are notsignificantly different when comparing 0–20 mm together or comparing 0–100 mm together (significant tests have not been applied betweendifferent depths).
Depth TreatmentsConcentration (mg/kg)
Olsen P Colwell P Organic P Total P CaCl2 P TN
Top 2 cm
10 kg/ha PUnploughed 58.6 (a, a) 177 (a, a) 281 (a, a) 719 (a, a) 1.5 (a, a) 4600 (a, a)
Ploughed 24.3 (b, a) 67.4 (b, a) 106 (b, a) 297 (b, a) 0.3 (b, a) 2320 (b, a)
35 kg/ha PUnploughed 60.2 (a, a) 187 (a, a) 297 (a, a) 737 (a, a) 1.5 (a, a) 4930 (a, a)
Ploughed 32.2 (b, a) 86.8 (b, a) 137 (b, a) 330 (b, a) 0.5 (b, b) 2280 (b, a)
100 kg/ha PUnploughed 80.3 (a, b) 252 (a, b) 365 (a, a) 799 (a, a) 2.9 (a, b) 4600 (a, a)
Ploughed 50.9 (b, c) 144 (b, b) 209 (b, b) 441 (b, b) 0.9 (b, c) 2440 (b, a)
Top 10 cm
10 kg/ha PUnploughed 42.9 (a, a) 126 (a, a) 217 (a, ac) 580 (a, a) 0.6 (a, a) 4000 (a, ac)
Ploughed 28.9 (b, a) 83.3 (b, a) 145 (b, a) 360 (b, b) 0.5 (a, a) 2700 (b, a)
35 kg/ha PUnploughed 43.0 (a, a) 131 (a, a) 218 (a, bc) 593 (a, a) 0.6 (a, a) 4200 (a, a)
Ploughed 28.4 (b, a) 78.2 (b, a) 140 (b, a) 365 (b, a) 0.4 (a, a) 2900 (b, a)
100 kg/ha PUnploughed 49.3 (a, b) 132 (a, a) 225 (a, a) 468 (a, a) 0.7 (a, a) 3400 (a, bc)
Ploughed 40.4 (b, b) 115 (a, b) 177 (a, a) 463 (a, a) 0.5 (a, a) 3200 (a, b)
An
alyt
e co
nce
ntr
atio
n (
mg/
L)
2
4
6
8
20 40 60 80 100
Week 07
DRP
Week 14
DRP
20 40 60 80 100
Week 27
DRP
Week 35
DRP
Week 07
TDP
20 40 60 80 100
Week 14
TDP
Week 27
TDP
20 40 60 80 100
2
4
6
8
Week 35
TDP
Ploughed
Unploughed
P fertiliser levels
Figure 3: Mean TDP and DRP concentrations in soil water for ploughed and unploughed treatments at different P fertiliser levels showingthe decay over the trial period. Week represents the number of weeks since fertiliser treatments began. Error bars represent significance at5% level.
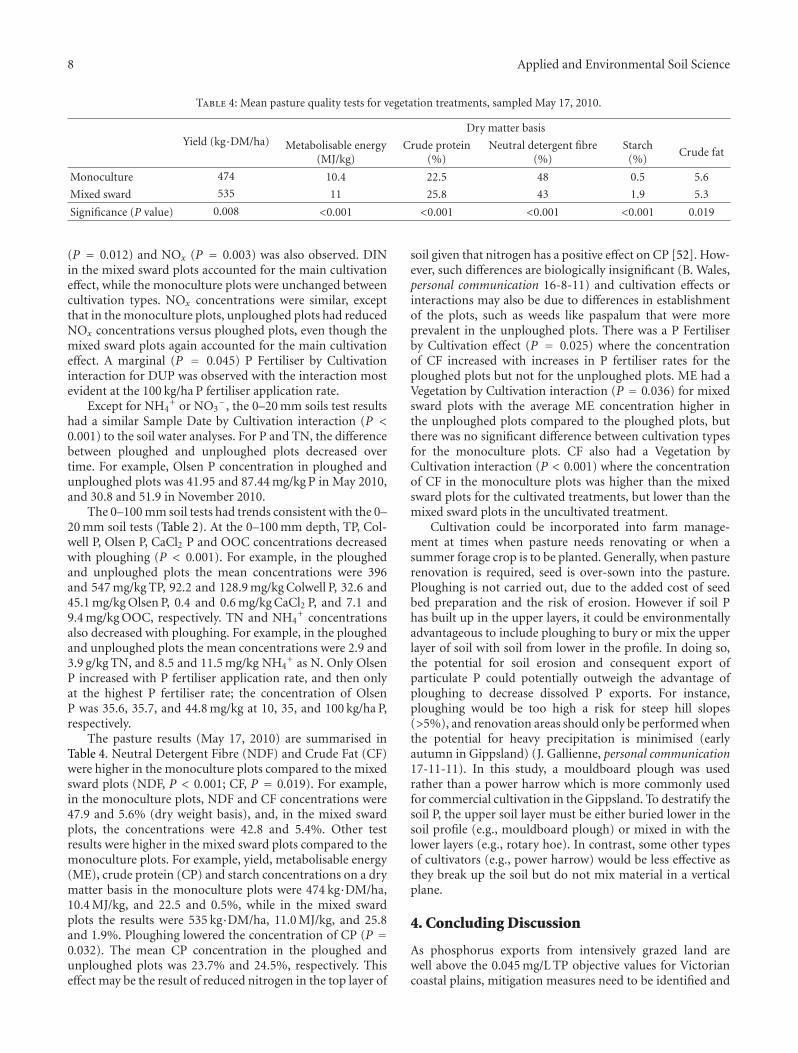
8 Applied and Environmental Soil Science
Table 4: Mean pasture quality tests for vegetation treatments, sampled May 17, 2010.
Yield (kg·DM/ha)Dry matter basis
Metabolisable energy(MJ/kg)
Crude protein(%)
Neutral detergent fibre(%)
Starch(%)
Crude fat
Monoculture 474 10.4 22.5 48 0.5 5.6
Mixed sward 535 11 25.8 43 1.9 5.3
Significance (P value) 0.008 <0.001 <0.001 <0.001 <0.001 0.019
(P = 0.012) and NOx (P = 0.003) was also observed. DINin the mixed sward plots accounted for the main cultivationeffect, while the monoculture plots were unchanged betweencultivation types. NOx concentrations were similar, exceptthat in the monoculture plots, unploughed plots had reducedNOx concentrations versus ploughed plots, even though themixed sward plots again accounted for the main cultivationeffect. A marginal (P = 0.045) P Fertiliser by Cultivationinteraction for DUP was observed with the interaction mostevident at the 100 kg/ha P fertiliser application rate.
Except for NH4+ or NO3
−, the 0–20 mm soils test resultshad a similar Sample Date by Cultivation interaction (P <0.001) to the soil water analyses. For P and TN, the differencebetween ploughed and unploughed plots decreased overtime. For example, Olsen P concentration in ploughed andunploughed plots was 41.95 and 87.44 mg/kg P in May 2010,and 30.8 and 51.9 in November 2010.
The 0–100 mm soil tests had trends consistent with the 0–20 mm soil tests (Table 2). At the 0–100 mm depth, TP, Col-well P, Olsen P, CaCl2 P and OOC concentrations decreasedwith ploughing (P < 0.001). For example, in the ploughedand unploughed plots the mean concentrations were 396and 547 mg/kg TP, 92.2 and 128.9 mg/kg Colwell P, 32.6 and45.1 mg/kg Olsen P, 0.4 and 0.6 mg/kg CaCl2 P, and 7.1 and9.4 mg/kg OOC, respectively. TN and NH4
+ concentrationsalso decreased with ploughing. For example, in the ploughedand unploughed plots the mean concentrations were 2.9 and3.9 g/kg TN, and 8.5 and 11.5 mg/kg NH4
+ as N. Only OlsenP increased with P fertiliser application rate, and then onlyat the highest P fertiliser rate; the concentration of OlsenP was 35.6, 35.7, and 44.8 mg/kg at 10, 35, and 100 kg/ha P,respectively.
The pasture results (May 17, 2010) are summarised inTable 4. Neutral Detergent Fibre (NDF) and Crude Fat (CF)were higher in the monoculture plots compared to the mixedsward plots (NDF, P < 0.001; CF, P = 0.019). For example,in the monoculture plots, NDF and CF concentrations were47.9 and 5.6% (dry weight basis), and, in the mixed swardplots, the concentrations were 42.8 and 5.4%. Other testresults were higher in the mixed sward plots compared to themonoculture plots. For example, yield, metabolisable energy(ME), crude protein (CP) and starch concentrations on a drymatter basis in the monoculture plots were 474 kg·DM/ha,10.4 MJ/kg, and 22.5 and 0.5%, while in the mixed swardplots the results were 535 kg·DM/ha, 11.0 MJ/kg, and 25.8and 1.9%. Ploughing lowered the concentration of CP (P =0.032). The mean CP concentration in the ploughed andunploughed plots was 23.7% and 24.5%, respectively. Thiseffect may be the result of reduced nitrogen in the top layer of
soil given that nitrogen has a positive effect on CP [52]. How-ever, such differences are biologically insignificant (B. Wales,personal communication 16-8-11) and cultivation effects orinteractions may also be due to differences in establishmentof the plots, such as weeds like paspalum that were moreprevalent in the unploughed plots. There was a P Fertiliserby Cultivation effect (P = 0.025) where the concentrationof CF increased with increases in P fertiliser rates for theploughed plots but not for the unploughed plots. ME had aVegetation by Cultivation interaction (P = 0.036) for mixedsward plots with the average ME concentration higher inthe unploughed plots compared to the ploughed plots, butthere was no significant difference between cultivation typesfor the monoculture plots. CF also had a Vegetation byCultivation interaction (P < 0.001) where the concentrationof CF in the monoculture plots was higher than the mixedsward plots for the cultivated treatments, but lower than themixed sward plots in the uncultivated treatment.
Cultivation could be incorporated into farm manage-ment at times when pasture needs renovating or when asummer forage crop is to be planted. Generally, when pasturerenovation is required, seed is over-sown into the pasture.Ploughing is not carried out, due to the added cost of seedbed preparation and the risk of erosion. However if soil Phas built up in the upper layers, it could be environmentallyadvantageous to include ploughing to bury or mix the upperlayer of soil with soil from lower in the profile. In doing so,the potential for soil erosion and consequent export ofparticulate P could potentially outweigh the advantage ofploughing to decrease dissolved P exports. For instance,ploughing would be too high a risk for steep hill slopes(>5%), and renovation areas should only be performed whenthe potential for heavy precipitation is minimised (earlyautumn in Gippsland) (J. Gallienne, personal communication17-11-11). In this study, a mouldboard plough was usedrather than a power harrow which is more commonly usedfor commercial cultivation in the Gippsland. To destratify thesoil P, the upper soil layer must be either buried lower in thesoil profile (e.g., mouldboard plough) or mixed in with thelower layers (e.g., rotary hoe). In contrast, some other typesof cultivators (e.g., power harrow) would be less effective asthey break up the soil but do not mix material in a verticalplane.
4. Concluding Discussion
As phosphorus exports from intensively grazed land arewell above the 0.045 mg/L TP objective values for Victoriancoastal plains, mitigation measures need to be identified and
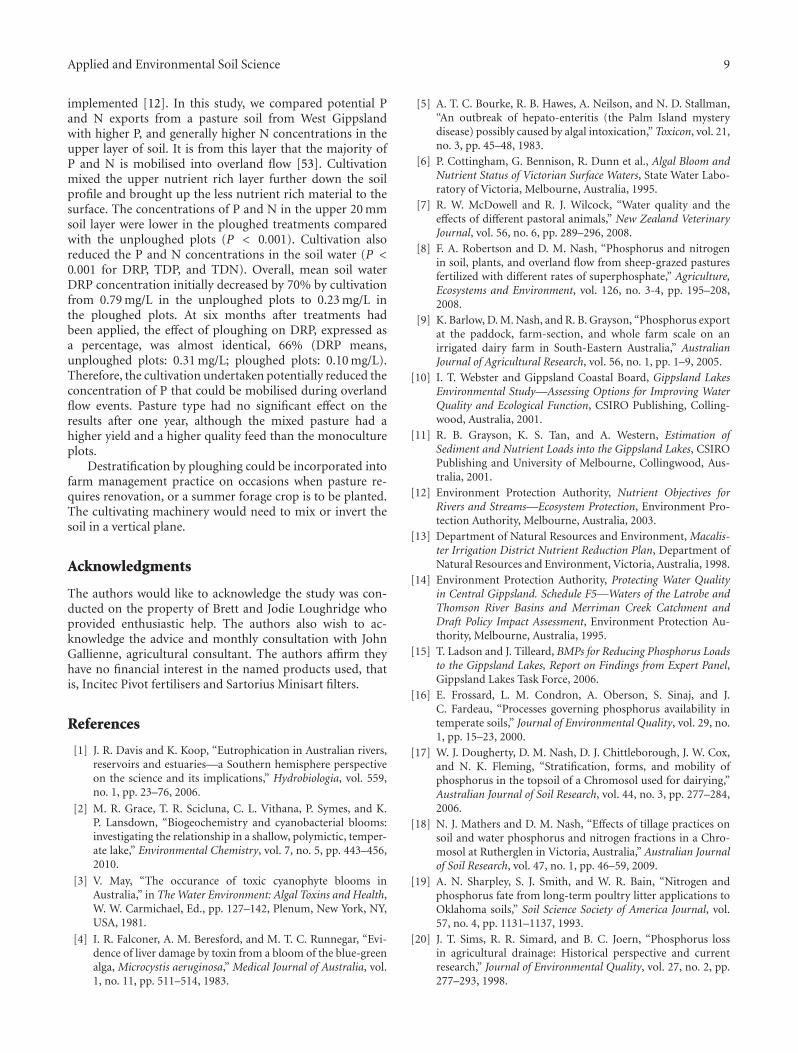
Applied and Environmental Soil Science 9
implemented [12]. In this study, we compared potential Pand N exports from a pasture soil from West Gippslandwith higher P, and generally higher N concentrations in theupper layer of soil. It is from this layer that the majority ofP and N is mobilised into overland flow [53]. Cultivationmixed the upper nutrient rich layer further down the soilprofile and brought up the less nutrient rich material to thesurface. The concentrations of P and N in the upper 20 mmsoil layer were lower in the ploughed treatments comparedwith the unploughed plots (P < 0.001). Cultivation alsoreduced the P and N concentrations in the soil water (P <0.001 for DRP, TDP, and TDN). Overall, mean soil waterDRP concentration initially decreased by 70% by cultivationfrom 0.79 mg/L in the unploughed plots to 0.23 mg/L inthe ploughed plots. At six months after treatments hadbeen applied, the effect of ploughing on DRP, expressed asa percentage, was almost identical, 66% (DRP means,unploughed plots: 0.31 mg/L; ploughed plots: 0.10 mg/L).Therefore, the cultivation undertaken potentially reduced theconcentration of P that could be mobilised during overlandflow events. Pasture type had no significant effect on theresults after one year, although the mixed pasture had ahigher yield and a higher quality feed than the monocultureplots.
Destratification by ploughing could be incorporated intofarm management practice on occasions when pasture re-quires renovation, or a summer forage crop is to be planted.The cultivating machinery would need to mix or invert thesoil in a vertical plane.
Acknowledgments
The authors would like to acknowledge the study was con-ducted on the property of Brett and Jodie Loughridge whoprovided enthusiastic help. The authors also wish to ac-knowledge the advice and monthly consultation with JohnGallienne, agricultural consultant. The authors affirm theyhave no financial interest in the named products used, thatis, Incitec Pivot fertilisers and Sartorius Minisart filters.
References
[1] J. R. Davis and K. Koop, “Eutrophication in Australian rivers,reservoirs and estuaries—a Southern hemisphere perspectiveon the science and its implications,” Hydrobiologia, vol. 559,no. 1, pp. 23–76, 2006.
[2] M. R. Grace, T. R. Scicluna, C. L. Vithana, P. Symes, and K.P. Lansdown, “Biogeochemistry and cyanobacterial blooms:investigating the relationship in a shallow, polymictic, temper-ate lake,” Environmental Chemistry, vol. 7, no. 5, pp. 443–456,2010.
[3] V. May, “The occurance of toxic cyanophyte blooms inAustralia,” in The Water Environment: Algal Toxins and Health,W. W. Carmichael, Ed., pp. 127–142, Plenum, New York, NY,USA, 1981.
[4] I. R. Falconer, A. M. Beresford, and M. T. C. Runnegar, “Evi-dence of liver damage by toxin from a bloom of the blue-greenalga, Microcystis aeruginosa,” Medical Journal of Australia, vol.1, no. 11, pp. 511–514, 1983.
[5] A. T. C. Bourke, R. B. Hawes, A. Neilson, and N. D. Stallman,“An outbreak of hepato-enteritis (the Palm Island mysterydisease) possibly caused by algal intoxication,” Toxicon, vol. 21,no. 3, pp. 45–48, 1983.
[6] P. Cottingham, G. Bennison, R. Dunn et al., Algal Bloom andNutrient Status of Victorian Surface Waters, State Water Labo-ratory of Victoria, Melbourne, Australia, 1995.
[7] R. W. McDowell and R. J. Wilcock, “Water quality and theeffects of different pastoral animals,” New Zealand VeterinaryJournal, vol. 56, no. 6, pp. 289–296, 2008.
[8] F. A. Robertson and D. M. Nash, “Phosphorus and nitrogenin soil, plants, and overland flow from sheep-grazed pasturesfertilized with different rates of superphosphate,” Agriculture,Ecosystems and Environment, vol. 126, no. 3-4, pp. 195–208,2008.
[9] K. Barlow, D. M. Nash, and R. B. Grayson, “Phosphorus exportat the paddock, farm-section, and whole farm scale on anirrigated dairy farm in South-Eastern Australia,” AustralianJournal of Agricultural Research, vol. 56, no. 1, pp. 1–9, 2005.
[10] I. T. Webster and Gippsland Coastal Board, Gippsland LakesEnvironmental Study—Assessing Options for Improving WaterQuality and Ecological Function, CSIRO Publishing, Colling-wood, Australia, 2001.
[11] R. B. Grayson, K. S. Tan, and A. Western, Estimation ofSediment and Nutrient Loads into the Gippsland Lakes, CSIROPublishing and University of Melbourne, Collingwood, Aus-tralia, 2001.
[12] Environment Protection Authority, Nutrient Objectives forRivers and Streams—Ecosystem Protection, Environment Pro-tection Authority, Melbourne, Australia, 2003.
[13] Department of Natural Resources and Environment, Macalis-ter Irrigation District Nutrient Reduction Plan, Department ofNatural Resources and Environment, Victoria, Australia, 1998.
[14] Environment Protection Authority, Protecting Water Qualityin Central Gippsland. Schedule F5—Waters of the Latrobe andThomson River Basins and Merriman Creek Catchment andDraft Policy Impact Assessment, Environment Protection Au-thority, Melbourne, Australia, 1995.
[15] T. Ladson and J. Tilleard, BMPs for Reducing Phosphorus Loadsto the Gippsland Lakes, Report on Findings from Expert Panel,Gippsland Lakes Task Force, 2006.
[16] E. Frossard, L. M. Condron, A. Oberson, S. Sinaj, and J.C. Fardeau, “Processes governing phosphorus availability intemperate soils,” Journal of Environmental Quality, vol. 29, no.1, pp. 15–23, 2000.
[17] W. J. Dougherty, D. M. Nash, D. J. Chittleborough, J. W. Cox,and N. K. Fleming, “Stratification, forms, and mobility ofphosphorus in the topsoil of a Chromosol used for dairying,”Australian Journal of Soil Research, vol. 44, no. 3, pp. 277–284,2006.
[18] N. J. Mathers and D. M. Nash, “Effects of tillage practices onsoil and water phosphorus and nitrogen fractions in a Chro-mosol at Rutherglen in Victoria, Australia,” Australian Journalof Soil Research, vol. 47, no. 1, pp. 46–59, 2009.
[19] A. N. Sharpley, S. J. Smith, and W. R. Bain, “Nitrogen andphosphorus fate from long-term poultry litter applications toOklahoma soils,” Soil Science Society of America Journal, vol.57, no. 4, pp. 1131–1137, 1993.
[20] J. T. Sims, R. R. Simard, and B. C. Joern, “Phosphorus lossin agricultural drainage: Historical perspective and currentresearch,” Journal of Environmental Quality, vol. 27, no. 2, pp.277–293, 1998.
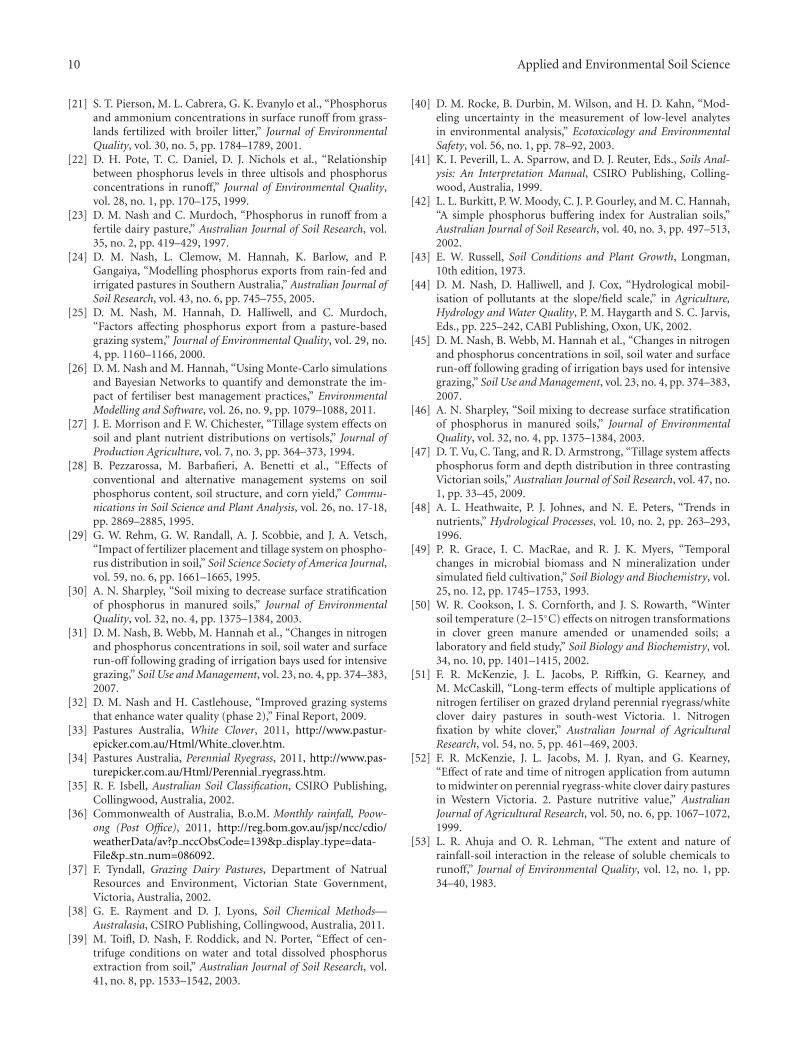
10 Applied and Environmental Soil Science
[21] S. T. Pierson, M. L. Cabrera, G. K. Evanylo et al., “Phosphorusand ammonium concentrations in surface runoff from grass-lands fertilized with broiler litter,” Journal of EnvironmentalQuality, vol. 30, no. 5, pp. 1784–1789, 2001.
[22] D. H. Pote, T. C. Daniel, D. J. Nichols et al., “Relationshipbetween phosphorus levels in three ultisols and phosphorusconcentrations in runoff,” Journal of Environmental Quality,vol. 28, no. 1, pp. 170–175, 1999.
[23] D. M. Nash and C. Murdoch, “Phosphorus in runoff from afertile dairy pasture,” Australian Journal of Soil Research, vol.35, no. 2, pp. 419–429, 1997.
[24] D. M. Nash, L. Clemow, M. Hannah, K. Barlow, and P.Gangaiya, “Modelling phosphorus exports from rain-fed andirrigated pastures in Southern Australia,” Australian Journal ofSoil Research, vol. 43, no. 6, pp. 745–755, 2005.
[25] D. M. Nash, M. Hannah, D. Halliwell, and C. Murdoch,“Factors affecting phosphorus export from a pasture-basedgrazing system,” Journal of Environmental Quality, vol. 29, no.4, pp. 1160–1166, 2000.
[26] D. M. Nash and M. Hannah, “Using Monte-Carlo simulationsand Bayesian Networks to quantify and demonstrate the im-pact of fertiliser best management practices,” EnvironmentalModelling and Software, vol. 26, no. 9, pp. 1079–1088, 2011.
[27] J. E. Morrison and F. W. Chichester, “Tillage system effects onsoil and plant nutrient distributions on vertisols,” Journal ofProduction Agriculture, vol. 7, no. 3, pp. 364–373, 1994.
[28] B. Pezzarossa, M. Barbafieri, A. Benetti et al., “Effects ofconventional and alternative management systems on soilphosphorus content, soil structure, and corn yield,” Commu-nications in Soil Science and Plant Analysis, vol. 26, no. 17-18,pp. 2869–2885, 1995.
[29] G. W. Rehm, G. W. Randall, A. J. Scobbie, and J. A. Vetsch,“Impact of fertilizer placement and tillage system on phospho-rus distribution in soil,” Soil Science Society of America Journal,vol. 59, no. 6, pp. 1661–1665, 1995.
[30] A. N. Sharpley, “Soil mixing to decrease surface stratificationof phosphorus in manured soils,” Journal of EnvironmentalQuality, vol. 32, no. 4, pp. 1375–1384, 2003.
[31] D. M. Nash, B. Webb, M. Hannah et al., “Changes in nitrogenand phosphorus concentrations in soil, soil water and surfacerun-off following grading of irrigation bays used for intensivegrazing,” Soil Use and Management, vol. 23, no. 4, pp. 374–383,2007.
[32] D. M. Nash and H. Castlehouse, “Improved grazing systemsthat enhance water quality (phase 2),” Final Report, 2009.
[33] Pastures Australia, White Clover, 2011, http://www.pastur-epicker.com.au/Html/White clover.htm.
[34] Pastures Australia, Perennial Ryegrass, 2011, http://www.pas-turepicker.com.au/Html/Perennial ryegrass.htm.
[35] R. F. Isbell, Australian Soil Classification, CSIRO Publishing,Collingwood, Australia, 2002.
[36] Commonwealth of Australia, B.o.M. Monthly rainfall, Poow-ong (Post Office), 2011, http://reg.bom.gov.au/jsp/ncc/cdio/weatherData/av?p nccObsCode=139&p display type=data-File&p stn num=086092.
[37] F. Tyndall, Grazing Dairy Pastures, Department of NatrualResources and Environment, Victorian State Government,Victoria, Australia, 2002.
[38] G. E. Rayment and D. J. Lyons, Soil Chemical Methods—Australasia, CSIRO Publishing, Collingwood, Australia, 2011.
[39] M. Toifl, D. Nash, F. Roddick, and N. Porter, “Effect of cen-trifuge conditions on water and total dissolved phosphorusextraction from soil,” Australian Journal of Soil Research, vol.41, no. 8, pp. 1533–1542, 2003.
[40] D. M. Rocke, B. Durbin, M. Wilson, and H. D. Kahn, “Mod-eling uncertainty in the measurement of low-level analytesin environmental analysis,” Ecotoxicology and EnvironmentalSafety, vol. 56, no. 1, pp. 78–92, 2003.
[41] K. I. Peverill, L. A. Sparrow, and D. J. Reuter, Eds., Soils Anal-ysis: An Interpretation Manual, CSIRO Publishing, Colling-wood, Australia, 1999.
[42] L. L. Burkitt, P. W. Moody, C. J. P. Gourley, and M. C. Hannah,“A simple phosphorus buffering index for Australian soils,”Australian Journal of Soil Research, vol. 40, no. 3, pp. 497–513,2002.
[43] E. W. Russell, Soil Conditions and Plant Growth, Longman,10th edition, 1973.
[44] D. M. Nash, D. Halliwell, and J. Cox, “Hydrological mobil-isation of pollutants at the slope/field scale,” in Agriculture,Hydrology and Water Quality, P. M. Haygarth and S. C. Jarvis,Eds., pp. 225–242, CABI Publishing, Oxon, UK, 2002.
[45] D. M. Nash, B. Webb, M. Hannah et al., “Changes in nitrogenand phosphorus concentrations in soil, soil water and surfacerun-off following grading of irrigation bays used for intensivegrazing,” Soil Use and Management, vol. 23, no. 4, pp. 374–383,2007.
[46] A. N. Sharpley, “Soil mixing to decrease surface stratificationof phosphorus in manured soils,” Journal of EnvironmentalQuality, vol. 32, no. 4, pp. 1375–1384, 2003.
[47] D. T. Vu, C. Tang, and R. D. Armstrong, “Tillage system affectsphosphorus form and depth distribution in three contrastingVictorian soils,” Australian Journal of Soil Research, vol. 47, no.1, pp. 33–45, 2009.
[48] A. L. Heathwaite, P. J. Johnes, and N. E. Peters, “Trends innutrients,” Hydrological Processes, vol. 10, no. 2, pp. 263–293,1996.
[49] P. R. Grace, I. C. MacRae, and R. J. K. Myers, “Temporalchanges in microbial biomass and N mineralization undersimulated field cultivation,” Soil Biology and Biochemistry, vol.25, no. 12, pp. 1745–1753, 1993.
[50] W. R. Cookson, I. S. Cornforth, and J. S. Rowarth, “Wintersoil temperature (2–15◦C) effects on nitrogen transformationsin clover green manure amended or unamended soils; alaboratory and field study,” Soil Biology and Biochemistry, vol.34, no. 10, pp. 1401–1415, 2002.
[51] F. R. McKenzie, J. L. Jacobs, P. Riffkin, G. Kearney, andM. McCaskill, “Long-term effects of multiple applications ofnitrogen fertiliser on grazed dryland perennial ryegrass/whiteclover dairy pastures in south-west Victoria. 1. Nitrogenfixation by white clover,” Australian Journal of AgriculturalResearch, vol. 54, no. 5, pp. 461–469, 2003.
[52] F. R. McKenzie, J. L. Jacobs, M. J. Ryan, and G. Kearney,“Effect of rate and time of nitrogen application from autumnto midwinter on perennial ryegrass-white clover dairy pasturesin Western Victoria. 2. Pasture nutritive value,” AustralianJournal of Agricultural Research, vol. 50, no. 6, pp. 1067–1072,1999.
[53] L. R. Ahuja and O. R. Lehman, “The extent and nature ofrainfall-soil interaction in the release of soluble chemicals torunoff,” Journal of Environmental Quality, vol. 12, no. 1, pp.34–40, 1983.
Hindawi Publishing CorporationApplied and Environmental Soil ScienceVolume 2012, Article ID 608275, 9 pagesdoi:10.1155/2012/608275
Research Article
Effect of Management Practices on Soil Microstructure andSurface Microrelief
R. Garcia Moreno,1 T. Burykin,2 M. C. Diaz Alvarez,1 and J. W. Crawford2
1 Centre for Studies and Research on Agricultural and Environmental Risk Management (CEIGRAM), School of AgriculturalEngineering, Polytechnic University of Madrid, Ciudad Universitaria s.n., 28040 madrid, Spain
2 Faculty of Agriculture, Food and Natural Resources, Australian Technology Park, University of Sydney,Eveleigh, Sydney, NSW 2015, Australia
Correspondence should be addressed to R. Garcia Moreno, [email protected]
Received 1 December 2011; Revised 8 March 2012; Accepted 9 March 2012
Academic Editor: Philip White
Copyright © 2012 R. Garcia Moreno et al. This is an open access article distributed under the Creative Commons AttributionLicense, which permits unrestricted use, distribution, and reproduction in any medium, provided the original work is properlycited.
Soil surface roughness (SSR) and porosity were evaluated from soils located in two farms belonging to the Plant Breeding Instituteof the University of Sidney. The sites differ in their soil management practices; the first site (PBI) was strip-tilled during early fall(May 2010), and the second site (JBP) was under power harrowed tillage at the end of July 2010. Both sites were sampled in mid-August. At each location, SSR was measured for three 1 m2 subplots using shadow analysis. To evaluate porosity and aggregation,soil samples were scanned using X-ray computed tomography with 5 µm resolution. The results show a strong negative correlationbetween SSR and porosity, 20.13% SSR and 41.38% porosity at PBI versus 42.00% SSR and 18.35% porosity at JBP. However,soil images show that when soil surface roughness is higher due to conservation and soil management practices, the processesof macroaggregation and structural porosity are enhanced. Further research must be conducted on SSR and porosity in differenttypes of soils, as they provide complementary information on the evaluation of soil erosion susceptibility.
1. Introduction
Soil surface roughness (SSR), which describes the microvari-ations in soil elevations primarily resulting from tillagepractices and textural porosity, is one of the major factorsaffecting wind and water erosion [1–4]. SSR is a directindicator of the degradation of soil microstructure, whichis mainly due to a loss of physical, chemical, and biologicalproperties [1, 2, 5]. In this case, SSR is closely related toerosion, which is the primary cause for the loss of soilstructure and organic matter, and it leads to a decrease insoil productivity and reduced fauna diversity [4, 6].
SSR promotes soil biota activity, which plays an impor-tant role in the rehabilitation of sealed soil surfaces andthe restructuring of soils, particularly after compactionevents [7]. SSR is mainly affected by management practicesand, depending on the techniques used, SSR can increasethe number and variability of microorganisms through
the improvement of soil porosity and flow water in thevadose zone [8]. The increase in microorganism activity isvery important in most biogeochemical cycles within soilsbecause it improves the physical and biological state of thesoil [4, 9, 10]. Thus, tillage influences the development ofdifferent types of microorganisms. Techniques that conservepore systems tend to enhance the activity of microorganismsand conserve the biota that are beneficial to the developmentof crops [7, 11, 12].
However, the study of soil porosity and its relation toother properties is complicated because soil is one of themost complex materials on all scales [12, 13].
By defining soil structure as the arrangement of particlesand associated pores in soils, ranging from nanometres tocentimetres, we can demonstrate the biological influenceon the stabilisation of aggregates at macro-to-micro scalesand their relationship with soil surface processes [14]. Thisassumption was proposed by Oades [14], who found that
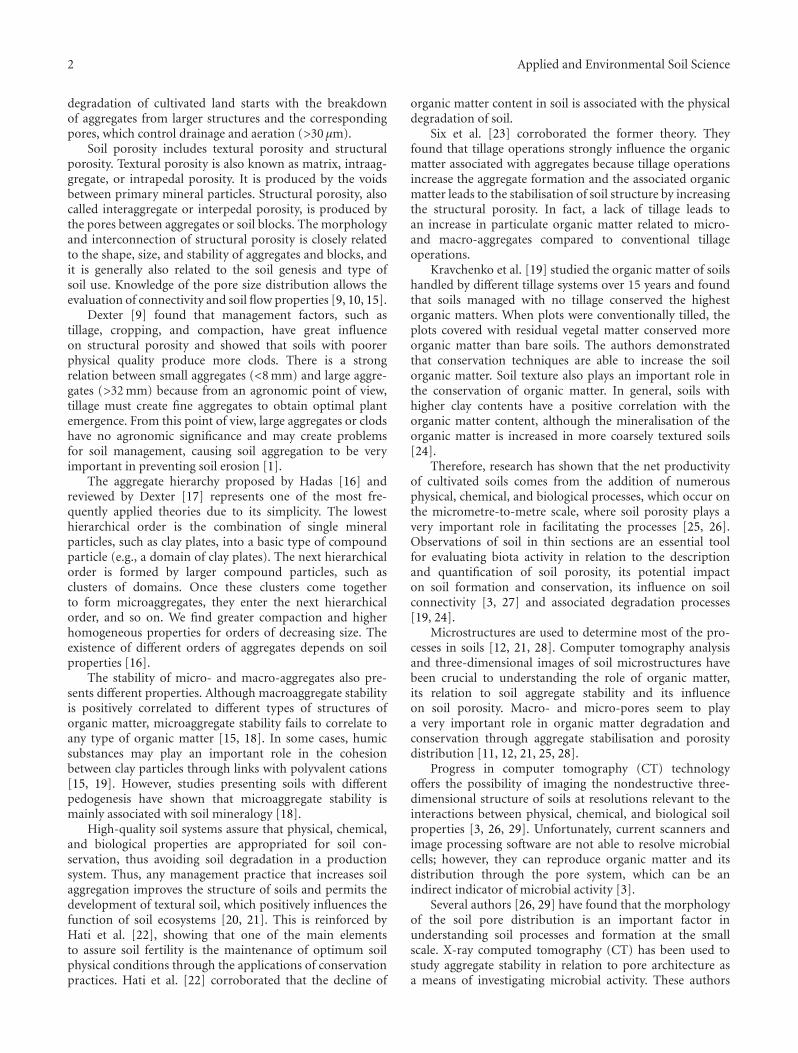
2 Applied and Environmental Soil Science
degradation of cultivated land starts with the breakdownof aggregates from larger structures and the correspondingpores, which control drainage and aeration (>30 µm).
Soil porosity includes textural porosity and structuralporosity. Textural porosity is also known as matrix, intraag-gregate, or intrapedal porosity. It is produced by the voidsbetween primary mineral particles. Structural porosity, alsocalled interaggregate or interpedal porosity, is produced bythe pores between aggregates or soil blocks. The morphologyand interconnection of structural porosity is closely relatedto the shape, size, and stability of aggregates and blocks, andit is generally also related to the soil genesis and type ofsoil use. Knowledge of the pore size distribution allows theevaluation of connectivity and soil flow properties [9, 10, 15].
Dexter [9] found that management factors, such astillage, cropping, and compaction, have great influenceon structural porosity and showed that soils with poorerphysical quality produce more clods. There is a strongrelation between small aggregates (<8 mm) and large aggre-gates (>32 mm) because from an agronomic point of view,tillage must create fine aggregates to obtain optimal plantemergence. From this point of view, large aggregates or clodshave no agronomic significance and may create problemsfor soil management, causing soil aggregation to be veryimportant in preventing soil erosion [1].
The aggregate hierarchy proposed by Hadas [16] andreviewed by Dexter [17] represents one of the most fre-quently applied theories due to its simplicity. The lowesthierarchical order is the combination of single mineralparticles, such as clay plates, into a basic type of compoundparticle (e.g., a domain of clay plates). The next hierarchicalorder is formed by larger compound particles, such asclusters of domains. Once these clusters come togetherto form microaggregates, they enter the next hierarchicalorder, and so on. We find greater compaction and higherhomogeneous properties for orders of decreasing size. Theexistence of different orders of aggregates depends on soilproperties [16].
The stability of micro- and macro-aggregates also pre-sents different properties. Although macroaggregate stabilityis positively correlated to different types of structures oforganic matter, microaggregate stability fails to correlate toany type of organic matter [15, 18]. In some cases, humicsubstances may play an important role in the cohesionbetween clay particles through links with polyvalent cations[15, 19]. However, studies presenting soils with differentpedogenesis have shown that microaggregate stability ismainly associated with soil mineralogy [18].
High-quality soil systems assure that physical, chemical,and biological properties are appropriated for soil con-servation, thus avoiding soil degradation in a productionsystem. Thus, any management practice that increases soilaggregation improves the structure of soils and permits thedevelopment of textural soil, which positively influences thefunction of soil ecosystems [20, 21]. This is reinforced byHati et al. [22], showing that one of the main elementsto assure soil fertility is the maintenance of optimum soilphysical conditions through the applications of conservationpractices. Hati et al. [22] corroborated that the decline of
organic matter content in soil is associated with the physicaldegradation of soil.
Six et al. [23] corroborated the former theory. Theyfound that tillage operations strongly influence the organicmatter associated with aggregates because tillage operationsincrease the aggregate formation and the associated organicmatter leads to the stabilisation of soil structure by increasingthe structural porosity. In fact, a lack of tillage leads toan increase in particulate organic matter related to micro-and macro-aggregates compared to conventional tillageoperations.
Kravchenko et al. [19] studied the organic matter of soilshandled by different tillage systems over 15 years and foundthat soils managed with no tillage conserved the highestorganic matters. When plots were conventionally tilled, theplots covered with residual vegetal matter conserved moreorganic matter than bare soils. The authors demonstratedthat conservation techniques are able to increase the soilorganic matter. Soil texture also plays an important role inthe conservation of organic matter. In general, soils withhigher clay contents have a positive correlation with theorganic matter content, although the mineralisation of theorganic matter is increased in more coarsely textured soils[24].
Therefore, research has shown that the net productivityof cultivated soils comes from the addition of numerousphysical, chemical, and biological processes, which occur onthe micrometre-to-metre scale, where soil porosity plays avery important role in facilitating the processes [25, 26].Observations of soil in thin sections are an essential toolfor evaluating biota activity in relation to the descriptionand quantification of soil porosity, its potential impacton soil formation and conservation, its influence on soilconnectivity [3, 27] and associated degradation processes[19, 24].
Microstructures are used to determine most of the pro-cesses in soils [12, 21, 28]. Computer tomography analysisand three-dimensional images of soil microstructures havebeen crucial to understanding the role of organic matter,its relation to soil aggregate stability and its influenceon soil porosity. Macro- and micro-pores seem to playa very important role in organic matter degradation andconservation through aggregate stabilisation and porositydistribution [11, 12, 21, 25, 28].
Progress in computer tomography (CT) technologyoffers the possibility of imaging the nondestructive three-dimensional structure of soils at resolutions relevant to theinteractions between physical, chemical, and biological soilproperties [3, 26, 29]. Unfortunately, current scanners andimage processing software are not able to resolve microbialcells; however, they can reproduce organic matter and itsdistribution through the pore system, which can be anindirect indicator of microbial activity [3].
Several authors [26, 29] have found that the morphologyof the soil pore distribution is an important factor inunderstanding soil processes and formation at the smallscale. X-ray computed tomography (CT) has been used tostudy aggregate stability in relation to pore architecture asa means of investigating microbial activity. These authors
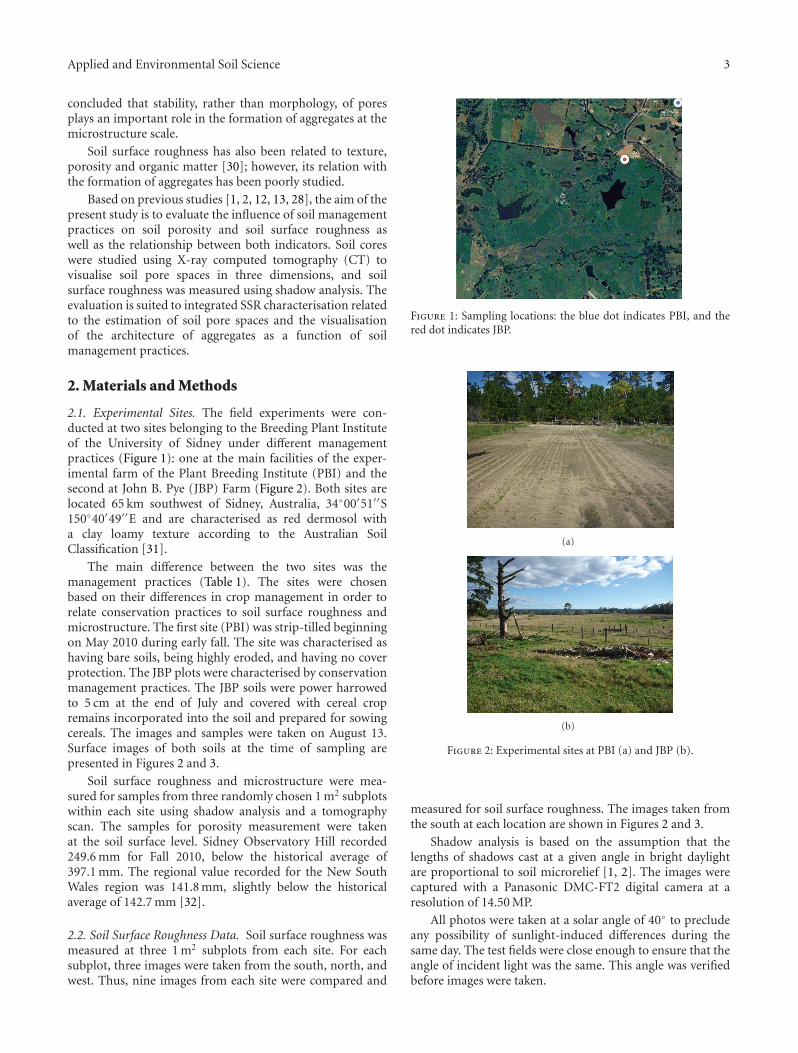
Applied and Environmental Soil Science 3
concluded that stability, rather than morphology, of poresplays an important role in the formation of aggregates at themicrostructure scale.
Soil surface roughness has also been related to texture,porosity and organic matter [30]; however, its relation withthe formation of aggregates has been poorly studied.
Based on previous studies [1, 2, 12, 13, 28], the aim of thepresent study is to evaluate the influence of soil managementpractices on soil porosity and soil surface roughness aswell as the relationship between both indicators. Soil coreswere studied using X-ray computed tomography (CT) tovisualise soil pore spaces in three dimensions, and soilsurface roughness was measured using shadow analysis. Theevaluation is suited to integrated SSR characterisation relatedto the estimation of soil pore spaces and the visualisationof the architecture of aggregates as a function of soilmanagement practices.
2. Materials and Methods
2.1. Experimental Sites. The field experiments were con-ducted at two sites belonging to the Breeding Plant Instituteof the University of Sidney under different managementpractices (Figure 1): one at the main facilities of the exper-imental farm of the Plant Breeding Institute (PBI) and thesecond at John B. Pye (JBP) Farm (Figure 2). Both sites arelocated 65 km southwest of Sidney, Australia, 34◦00′51′′S150◦40′49′′E and are characterised as red dermosol witha clay loamy texture according to the Australian SoilClassification [31].
The main difference between the two sites was themanagement practices (Table 1). The sites were chosenbased on their differences in crop management in order torelate conservation practices to soil surface roughness andmicrostructure. The first site (PBI) was strip-tilled beginningon May 2010 during early fall. The site was characterised ashaving bare soils, being highly eroded, and having no coverprotection. The JBP plots were characterised by conservationmanagement practices. The JBP soils were power harrowedto 5 cm at the end of July and covered with cereal cropremains incorporated into the soil and prepared for sowingcereals. The images and samples were taken on August 13.Surface images of both soils at the time of sampling arepresented in Figures 2 and 3.
Soil surface roughness and microstructure were mea-sured for samples from three randomly chosen 1 m2 subplotswithin each site using shadow analysis and a tomographyscan. The samples for porosity measurement were takenat the soil surface level. Sidney Observatory Hill recorded249.6 mm for Fall 2010, below the historical average of397.1 mm. The regional value recorded for the New SouthWales region was 141.8 mm, slightly below the historicalaverage of 142.7 mm [32].
2.2. Soil Surface Roughness Data. Soil surface roughness wasmeasured at three 1 m2 subplots from each site. For eachsubplot, three images were taken from the south, north, andwest. Thus, nine images from each site were compared and
Figure 1: Sampling locations: the blue dot indicates PBI, and thered dot indicates JBP.
(a)
(b)
Figure 2: Experimental sites at PBI (a) and JBP (b).
measured for soil surface roughness. The images taken fromthe south at each location are shown in Figures 2 and 3.
Shadow analysis is based on the assumption that thelengths of shadows cast at a given angle in bright daylightare proportional to soil microrelief [1, 2]. The images werecaptured with a Panasonic DMC-FT2 digital camera at aresolution of 14.50 MP.
All photos were taken at a solar angle of 40◦ to precludeany possibility of sunlight-induced differences during thesame day. The test fields were close enough to ensure that theangle of incident light was the same. This angle was verifiedbefore images were taken.
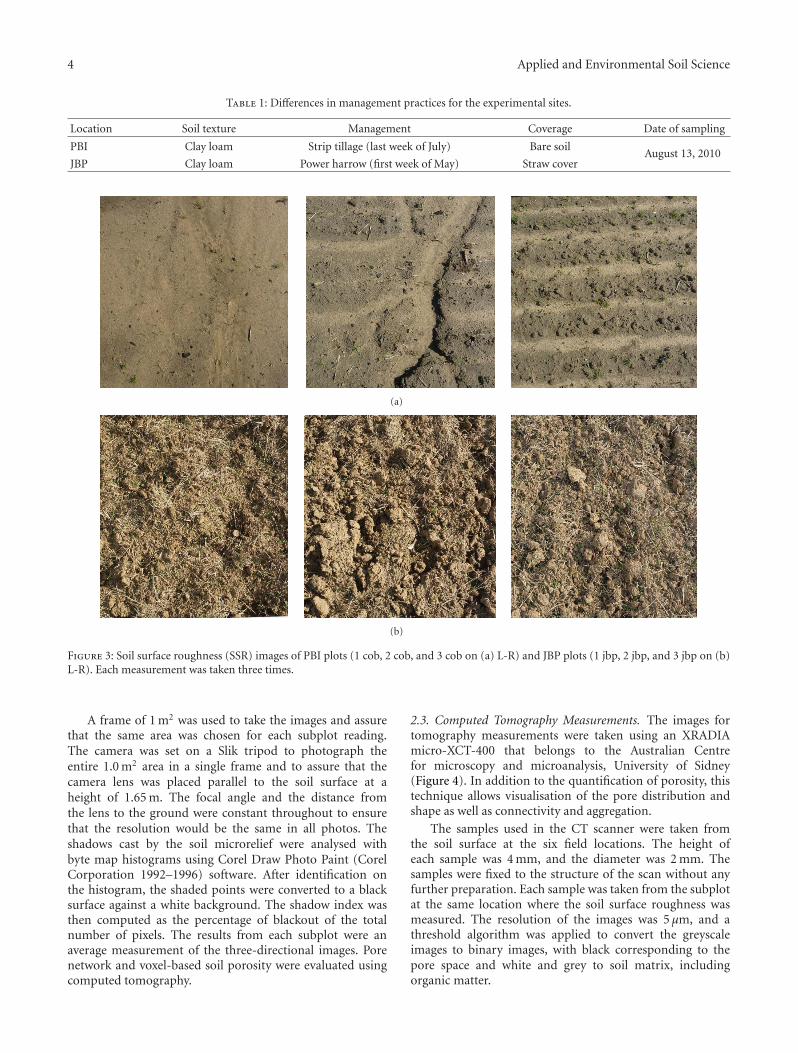
4 Applied and Environmental Soil Science
Table 1: Differences in management practices for the experimental sites.
Location Soil texture Management Coverage Date of sampling
PBI Clay loam Strip tillage (last week of July) Bare soilAugust 13, 2010
JBP Clay loam Power harrow (first week of May) Straw cover
(a)
(b)
Figure 3: Soil surface roughness (SSR) images of PBI plots (1 cob, 2 cob, and 3 cob on (a) L-R) and JBP plots (1 jbp, 2 jbp, and 3 jbp on (b)L-R). Each measurement was taken three times.
A frame of 1 m2 was used to take the images and assurethat the same area was chosen for each subplot reading.The camera was set on a Slik tripod to photograph theentire 1.0 m2 area in a single frame and to assure that thecamera lens was placed parallel to the soil surface at aheight of 1.65 m. The focal angle and the distance fromthe lens to the ground were constant throughout to ensurethat the resolution would be the same in all photos. Theshadows cast by the soil microrelief were analysed withbyte map histograms using Corel Draw Photo Paint (CorelCorporation 1992–1996) software. After identification onthe histogram, the shaded points were converted to a blacksurface against a white background. The shadow index wasthen computed as the percentage of blackout of the totalnumber of pixels. The results from each subplot were anaverage measurement of the three-directional images. Porenetwork and voxel-based soil porosity were evaluated usingcomputed tomography.
2.3. Computed Tomography Measurements. The images fortomography measurements were taken using an XRADIAmicro-XCT-400 that belongs to the Australian Centrefor microscopy and microanalysis, University of Sidney(Figure 4). In addition to the quantification of porosity, thistechnique allows visualisation of the pore distribution andshape as well as connectivity and aggregation.
The samples used in the CT scanner were taken fromthe soil surface at the six field locations. The height ofeach sample was 4 mm, and the diameter was 2 mm. Thesamples were fixed to the structure of the scan without anyfurther preparation. Each sample was taken from the subplotat the same location where the soil surface roughness wasmeasured. The resolution of the images was 5 µm, and athreshold algorithm was applied to convert the greyscaleimages to binary images, with black corresponding to thepore space and white and grey to soil matrix, includingorganic matter.
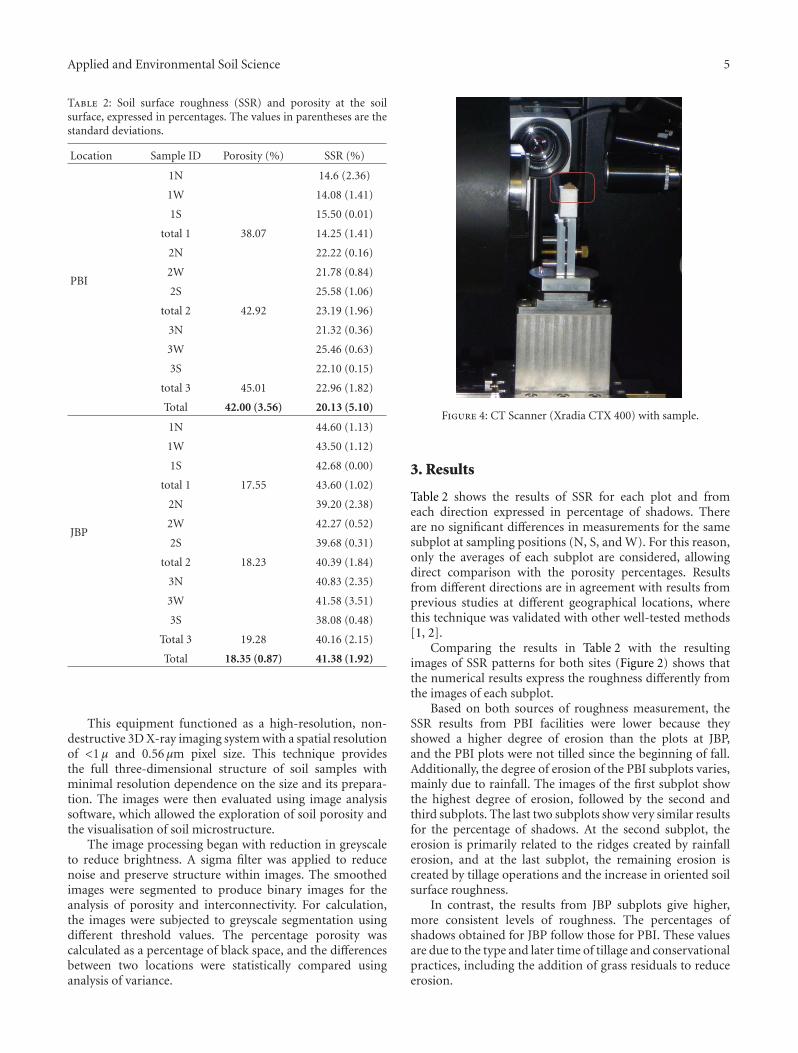
Applied and Environmental Soil Science 5
Table 2: Soil surface roughness (SSR) and porosity at the soilsurface, expressed in percentages. The values in parentheses are thestandard deviations.
Location Sample ID Porosity (%) SSR (%)
PBI
1N 14.6 (2.36)
1W 14.08 (1.41)
1S 15.50 (0.01)
total 1 38.07 14.25 (1.41)
2N 22.22 (0.16)
2W 21.78 (0.84)
2S 25.58 (1.06)
total 2 42.92 23.19 (1.96)
3N 21.32 (0.36)
3W 25.46 (0.63)
3S 22.10 (0.15)
total 3 45.01 22.96 (1.82)
Total 42.00 (3.56) 20.13 (5.10)
JBP
1N 44.60 (1.13)
1W 43.50 (1.12)
1S 42.68 (0.00)
total 1 17.55 43.60 (1.02)
2N 39.20 (2.38)
2W 42.27 (0.52)
2S 39.68 (0.31)
total 2 18.23 40.39 (1.84)
3N 40.83 (2.35)
3W 41.58 (3.51)
3S 38.08 (0.48)
Total 3 19.28 40.16 (2.15)
Total 18.35 (0.87) 41.38 (1.92)
This equipment functioned as a high-resolution, non-destructive 3D X-ray imaging system with a spatial resolutionof <1 µ and 0.56 µm pixel size. This technique providesthe full three-dimensional structure of soil samples withminimal resolution dependence on the size and its prepara-tion. The images were then evaluated using image analysissoftware, which allowed the exploration of soil porosity andthe visualisation of soil microstructure.
The image processing began with reduction in greyscaleto reduce brightness. A sigma filter was applied to reducenoise and preserve structure within images. The smoothedimages were segmented to produce binary images for theanalysis of porosity and interconnectivity. For calculation,the images were subjected to greyscale segmentation usingdifferent threshold values. The percentage porosity wascalculated as a percentage of black space, and the differencesbetween two locations were statistically compared usinganalysis of variance.
Figure 4: CT Scanner (Xradia CTX 400) with sample.
3. Results
Table 2 shows the results of SSR for each plot and fromeach direction expressed in percentage of shadows. Thereare no significant differences in measurements for the samesubplot at sampling positions (N, S, and W). For this reason,only the averages of each subplot are considered, allowingdirect comparison with the porosity percentages. Resultsfrom different directions are in agreement with results fromprevious studies at different geographical locations, wherethis technique was validated with other well-tested methods[1, 2].
Comparing the results in Table 2 with the resultingimages of SSR patterns for both sites (Figure 2) shows thatthe numerical results express the roughness differently fromthe images of each subplot.
Based on both sources of roughness measurement, theSSR results from PBI facilities were lower because theyshowed a higher degree of erosion than the plots at JBP,and the PBI plots were not tilled since the beginning of fall.Additionally, the degree of erosion of the PBI subplots varies,mainly due to rainfall. The images of the first subplot showthe highest degree of erosion, followed by the second andthird subplots. The last two subplots show very similar resultsfor the percentage of shadows. At the second subplot, theerosion is primarily related to the ridges created by rainfallerosion, and at the last subplot, the remaining erosion iscreated by tillage operations and the increase in oriented soilsurface roughness.
In contrast, the results from JBP subplots give higher,more consistent levels of roughness. The percentages ofshadows obtained for JBP follow those for PBI. These valuesare due to the type and later time of tillage and conservationalpractices, including the addition of grass residuals to reduceerosion.
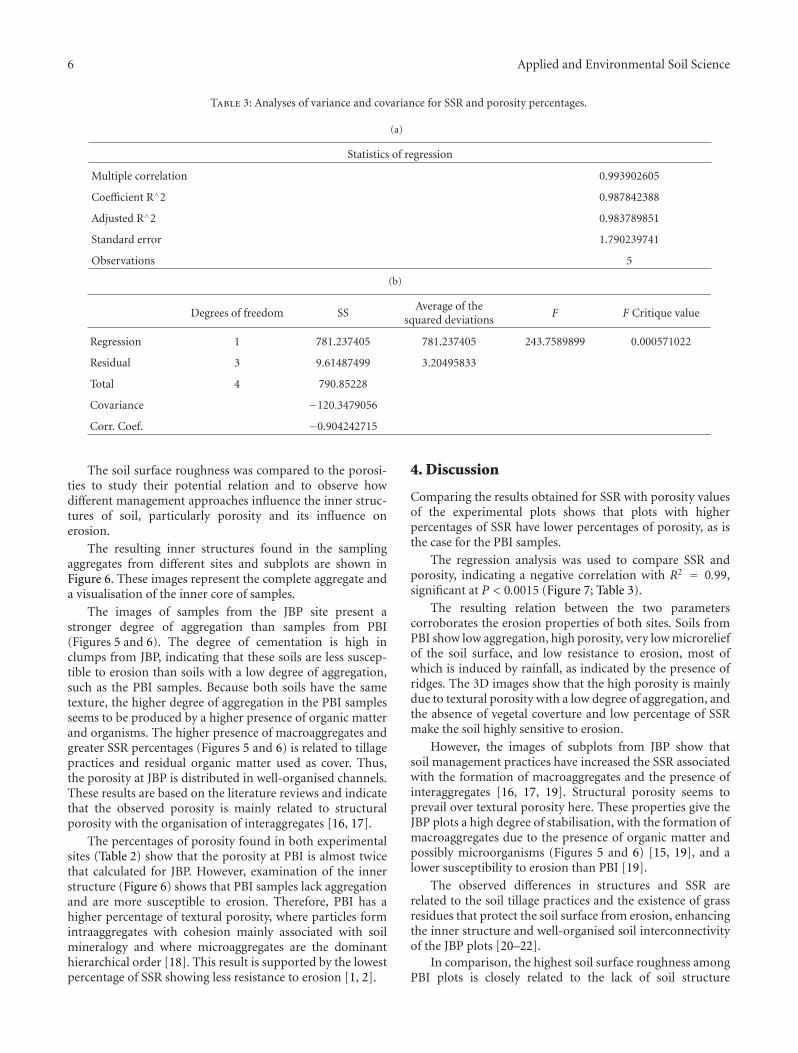
6 Applied and Environmental Soil Science
Table 3: Analyses of variance and covariance for SSR and porosity percentages.
(a)
Statistics of regression
Multiple correlation 0.993902605
Coefficient R∧2 0.987842388
Adjusted R∧2 0.983789851
Standard error 1.790239741
Observations 5
(b)
Degrees of freedom SSAverage of the
squared deviationsF F Critique value
Regression 1 781.237405 781.237405 243.7589899 0.000571022
Residual 3 9.61487499 3.20495833
Total 4 790.85228
Covariance −120.3479056
Corr. Coef. −0.904242715
The soil surface roughness was compared to the porosi-ties to study their potential relation and to observe howdifferent management approaches influence the inner struc-tures of soil, particularly porosity and its influence onerosion.
The resulting inner structures found in the samplingaggregates from different sites and subplots are shown inFigure 6. These images represent the complete aggregate anda visualisation of the inner core of samples.
The images of samples from the JBP site present astronger degree of aggregation than samples from PBI(Figures 5 and 6). The degree of cementation is high inclumps from JBP, indicating that these soils are less suscep-tible to erosion than soils with a low degree of aggregation,such as the PBI samples. Because both soils have the sametexture, the higher degree of aggregation in the PBI samplesseems to be produced by a higher presence of organic matterand organisms. The higher presence of macroaggregates andgreater SSR percentages (Figures 5 and 6) is related to tillagepractices and residual organic matter used as cover. Thus,the porosity at JBP is distributed in well-organised channels.These results are based on the literature reviews and indicatethat the observed porosity is mainly related to structuralporosity with the organisation of interaggregates [16, 17].
The percentages of porosity found in both experimentalsites (Table 2) show that the porosity at PBI is almost twicethat calculated for JBP. However, examination of the innerstructure (Figure 6) shows that PBI samples lack aggregationand are more susceptible to erosion. Therefore, PBI has ahigher percentage of textural porosity, where particles formintraaggregates with cohesion mainly associated with soilmineralogy and where microaggregates are the dominanthierarchical order [18]. This result is supported by the lowestpercentage of SSR showing less resistance to erosion [1, 2].
4. Discussion
Comparing the results obtained for SSR with porosity valuesof the experimental plots shows that plots with higherpercentages of SSR have lower percentages of porosity, as isthe case for the PBI samples.
The regression analysis was used to compare SSR andporosity, indicating a negative correlation with R2 = 0.99,significant at P < 0.0015 (Figure 7; Table 3).
The resulting relation between the two parameterscorroborates the erosion properties of both sites. Soils fromPBI show low aggregation, high porosity, very low microreliefof the soil surface, and low resistance to erosion, most ofwhich is induced by rainfall, as indicated by the presence ofridges. The 3D images show that the high porosity is mainlydue to textural porosity with a low degree of aggregation, andthe absence of vegetal coverture and low percentage of SSRmake the soil highly sensitive to erosion.
However, the images of subplots from JBP show thatsoil management practices have increased the SSR associatedwith the formation of macroaggregates and the presence ofinteraggregates [16, 17, 19]. Structural porosity seems toprevail over textural porosity here. These properties give theJBP plots a high degree of stabilisation, with the formation ofmacroaggregates due to the presence of organic matter andpossibly microorganisms (Figures 5 and 6) [15, 19], and alower susceptibility to erosion than PBI [19].
The observed differences in structures and SSR arerelated to the soil tillage practices and the existence of grassresidues that protect the soil surface from erosion, enhancingthe inner structure and well-organised soil interconnectivityof the JBP plots [20–22].
In comparison, the highest soil surface roughness amongPBI plots is closely related to the lack of soil structure
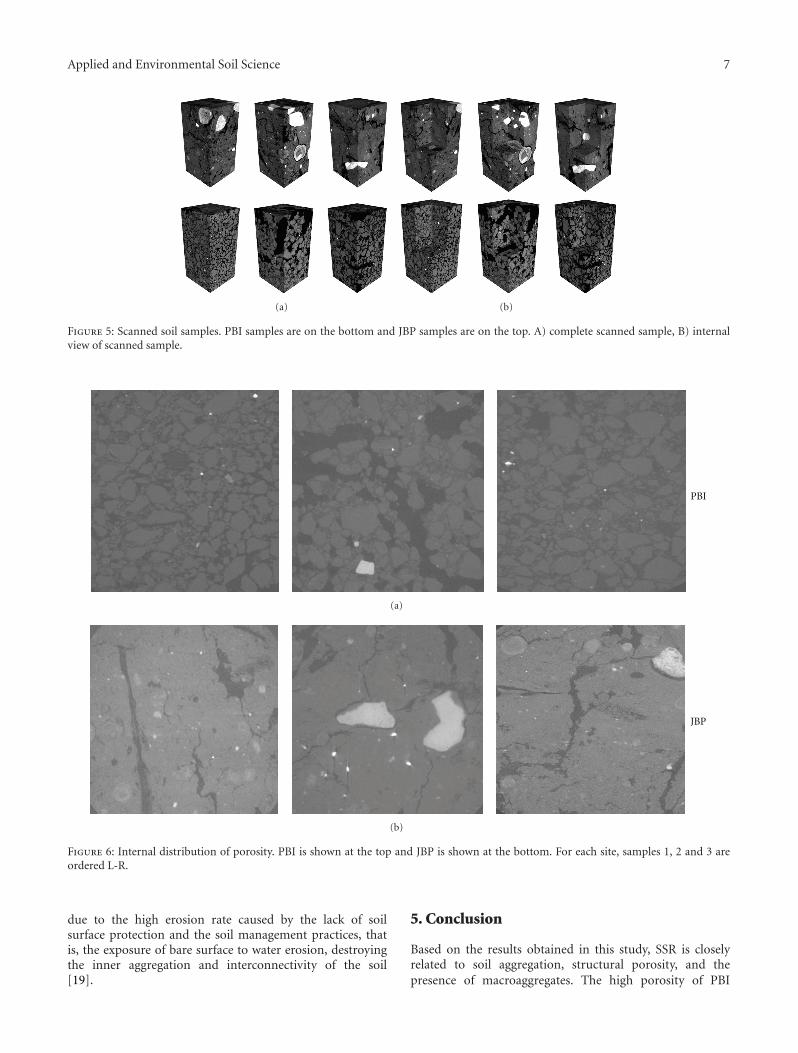
Applied and Environmental Soil Science 7
(a) (b)
Figure 5: Scanned soil samples. PBI samples are on the bottom and JBP samples are on the top. A) complete scanned sample, B) internalview of scanned sample.
PBI
(a)
JBP
(b)
Figure 6: Internal distribution of porosity. PBI is shown at the top and JBP is shown at the bottom. For each site, samples 1, 2 and 3 areordered L-R.
due to the high erosion rate caused by the lack of soilsurface protection and the soil management practices, thatis, the exposure of bare surface to water erosion, destroyingthe inner aggregation and interconnectivity of the soil[19].
5. Conclusion
Based on the results obtained in this study, SSR is closelyrelated to soil aggregation, structural porosity, and thepresence of macroaggregates. The high porosity of PBI
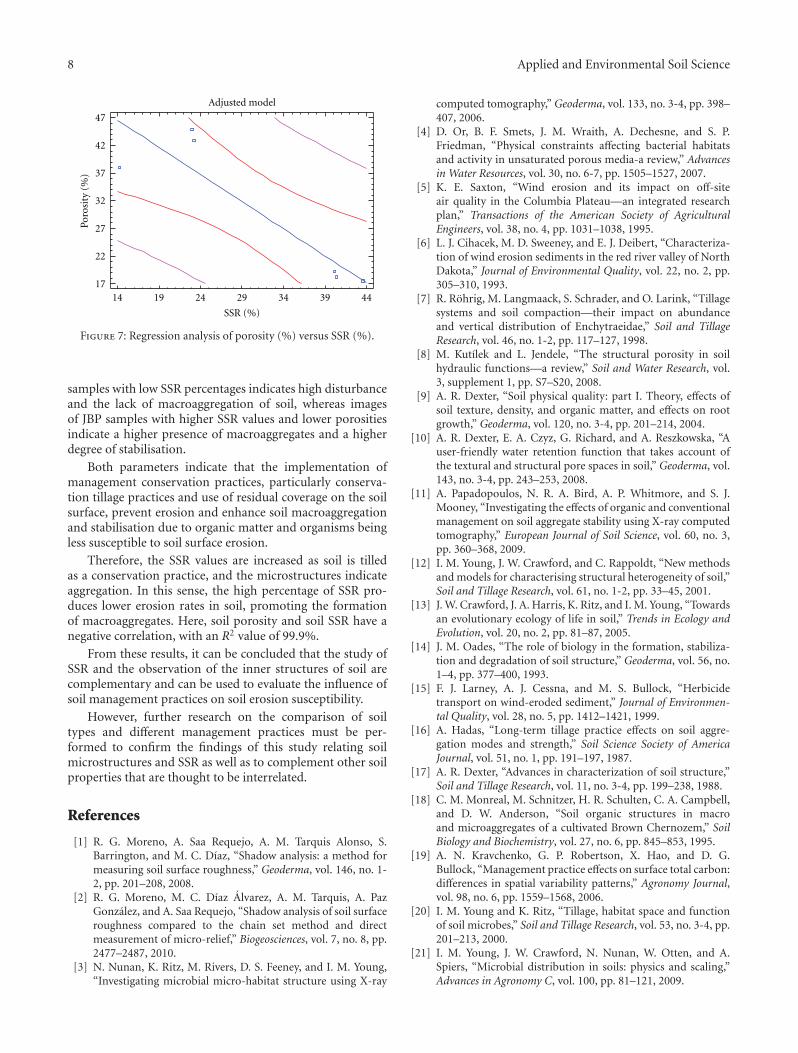
8 Applied and Environmental Soil Science
47
42
37
32
27
22
1714 19 24 29 34 39 44
Adjusted model
Poro
sity
(%
)
SSR (%)
Figure 7: Regression analysis of porosity (%) versus SSR (%).
samples with low SSR percentages indicates high disturbanceand the lack of macroaggregation of soil, whereas imagesof JBP samples with higher SSR values and lower porositiesindicate a higher presence of macroaggregates and a higherdegree of stabilisation.
Both parameters indicate that the implementation ofmanagement conservation practices, particularly conserva-tion tillage practices and use of residual coverage on the soilsurface, prevent erosion and enhance soil macroaggregationand stabilisation due to organic matter and organisms beingless susceptible to soil surface erosion.
Therefore, the SSR values are increased as soil is tilledas a conservation practice, and the microstructures indicateaggregation. In this sense, the high percentage of SSR pro-duces lower erosion rates in soil, promoting the formationof macroaggregates. Here, soil porosity and soil SSR have anegative correlation, with an R2 value of 99.9%.
From these results, it can be concluded that the study ofSSR and the observation of the inner structures of soil arecomplementary and can be used to evaluate the influence ofsoil management practices on soil erosion susceptibility.
However, further research on the comparison of soiltypes and different management practices must be per-formed to confirm the findings of this study relating soilmicrostructures and SSR as well as to complement other soilproperties that are thought to be interrelated.
References
[1] R. G. Moreno, A. Saa Requejo, A. M. Tarquis Alonso, S.Barrington, and M. C. Dıaz, “Shadow analysis: a method formeasuring soil surface roughness,” Geoderma, vol. 146, no. 1-2, pp. 201–208, 2008.
[2] R. G. Moreno, M. C. Dıaz Alvarez, A. M. Tarquis, A. PazGonzalez, and A. Saa Requejo, “Shadow analysis of soil surfaceroughness compared to the chain set method and directmeasurement of micro-relief,” Biogeosciences, vol. 7, no. 8, pp.2477–2487, 2010.
[3] N. Nunan, K. Ritz, M. Rivers, D. S. Feeney, and I. M. Young,“Investigating microbial micro-habitat structure using X-ray
computed tomography,” Geoderma, vol. 133, no. 3-4, pp. 398–407, 2006.
[4] D. Or, B. F. Smets, J. M. Wraith, A. Dechesne, and S. P.Friedman, “Physical constraints affecting bacterial habitatsand activity in unsaturated porous media-a review,” Advancesin Water Resources, vol. 30, no. 6-7, pp. 1505–1527, 2007.
[5] K. E. Saxton, “Wind erosion and its impact on off-siteair quality in the Columbia Plateau—an integrated researchplan,” Transactions of the American Society of AgriculturalEngineers, vol. 38, no. 4, pp. 1031–1038, 1995.
[6] L. J. Cihacek, M. D. Sweeney, and E. J. Deibert, “Characteriza-tion of wind erosion sediments in the red river valley of NorthDakota,” Journal of Environmental Quality, vol. 22, no. 2, pp.305–310, 1993.
[7] R. Rohrig, M. Langmaack, S. Schrader, and O. Larink, “Tillagesystems and soil compaction—their impact on abundanceand vertical distribution of Enchytraeidae,” Soil and TillageResearch, vol. 46, no. 1-2, pp. 117–127, 1998.
[8] M. Kutılek and L. Jendele, “The structural porosity in soilhydraulic functions—a review,” Soil and Water Research, vol.3, supplement 1, pp. S7–S20, 2008.
[9] A. R. Dexter, “Soil physical quality: part I. Theory, effects ofsoil texture, density, and organic matter, and effects on rootgrowth,” Geoderma, vol. 120, no. 3-4, pp. 201–214, 2004.
[10] A. R. Dexter, E. A. Czyz, G. Richard, and A. Reszkowska, “Auser-friendly water retention function that takes account ofthe textural and structural pore spaces in soil,” Geoderma, vol.143, no. 3-4, pp. 243–253, 2008.
[11] A. Papadopoulos, N. R. A. Bird, A. P. Whitmore, and S. J.Mooney, “Investigating the effects of organic and conventionalmanagement on soil aggregate stability using X-ray computedtomography,” European Journal of Soil Science, vol. 60, no. 3,pp. 360–368, 2009.
[12] I. M. Young, J. W. Crawford, and C. Rappoldt, “New methodsand models for characterising structural heterogeneity of soil,”Soil and Tillage Research, vol. 61, no. 1-2, pp. 33–45, 2001.
[13] J. W. Crawford, J. A. Harris, K. Ritz, and I. M. Young, “Towardsan evolutionary ecology of life in soil,” Trends in Ecology andEvolution, vol. 20, no. 2, pp. 81–87, 2005.
[14] J. M. Oades, “The role of biology in the formation, stabiliza-tion and degradation of soil structure,” Geoderma, vol. 56, no.1–4, pp. 377–400, 1993.
[15] F. J. Larney, A. J. Cessna, and M. S. Bullock, “Herbicidetransport on wind-eroded sediment,” Journal of Environmen-tal Quality, vol. 28, no. 5, pp. 1412–1421, 1999.
[16] A. Hadas, “Long-term tillage practice effects on soil aggre-gation modes and strength,” Soil Science Society of AmericaJournal, vol. 51, no. 1, pp. 191–197, 1987.
[17] A. R. Dexter, “Advances in characterization of soil structure,”Soil and Tillage Research, vol. 11, no. 3-4, pp. 199–238, 1988.
[18] C. M. Monreal, M. Schnitzer, H. R. Schulten, C. A. Campbell,and D. W. Anderson, “Soil organic structures in macroand microaggregates of a cultivated Brown Chernozem,” SoilBiology and Biochemistry, vol. 27, no. 6, pp. 845–853, 1995.
[19] A. N. Kravchenko, G. P. Robertson, X. Hao, and D. G.Bullock, “Management practice effects on surface total carbon:differences in spatial variability patterns,” Agronomy Journal,vol. 98, no. 6, pp. 1559–1568, 2006.
[20] I. M. Young and K. Ritz, “Tillage, habitat space and functionof soil microbes,” Soil and Tillage Research, vol. 53, no. 3-4, pp.201–213, 2000.
[21] I. M. Young, J. W. Crawford, N. Nunan, W. Otten, and A.Spiers, “Microbial distribution in soils: physics and scaling,”Advances in Agronomy C, vol. 100, pp. 81–121, 2009.
Applied and Environmental Soil Science 9
[22] K. M. Hati, A. Swarup, A. K. Dwivedi, A. K. Misra, and K.K. Bandyopadhyay, “Changes in soil physical properties andorganic carbon status at the topsoil horizon of a vertisol ofcentral India after 28 years of continuous cropping, fertiliza-tion and manuring,” Agriculture, Ecosystems and Environment,vol. 119, no. 1-2, pp. 127–134, 2007.
[23] J. Six, E. T. Elliott, and K. Paustian, “Aggregate and soil organicmatter dynamics under conventional and no-tillage systems,”Soil Science Society of America Journal, vol. 63, no. 5, pp. 1350–1358, 1999.
[24] N. G. Juma, “Interrelationships between soil structure/texture,soil biota/soil organic matter and crop production,” Geo-derma, vol. 57, no. 1-2, pp. 3–30, 1993.
[25] M. Deurer, D. Grinev, I. Young, B. E. Clothier, and K. Muller,“The impact of soil carbon management on soil macroporestructure: a comparison of two apple orchard systems in NewZealand,” European Journal of Soil Science, vol. 60, no. 6, pp.945–955, 2009.
[26] M. Feser, J. Gelb, H. Chang et al., “Sub-micron resolution CTfor failure analysis and process development,” MeasurementScience and Technology, vol. 19, no. 9, Article ID 094001, 2008.
[27] J. F. Darbyshire, S. J. Chapman, M. V. Cheshire et al., “Methodsfor the study of interrelationships between micro-organismsand soil structure,” Geoderma, vol. 56, no. 1–4, pp. 3–23, 1993.
[28] J. M. Blair, R. E. Falconer, A. C. Milne, I. M. Young, and J.W. Crawford, “Modeling three-dimensional microstructure inheterogeneous media,” Soil Science Society of America Journal,vol. 71, no. 6, pp. 1807–1812, 2007.
[29] S. de Gryze, L. Jassogne, J. Six, H. Bossuyt, M. Wevers, andR. Merckx, “Pore structure changes during decompositionof fresh residue: X-ray tomography analyses,” Geoderma, vol.134, no. 1-2, pp. 82–96, 2006.
[30] B. W. Hapke, “A theoretical photometric function for the lunarsurface,” Journal of Geophysical Research, vol. 68, pp. 4571–4586, 1963.
[31] R. F. Isbell, The Australian Soil Classification, Revised Edition,CSIRO, Canberra, Australia, 2002.
[32] Bureau of Meteorology, Australian Government, http://www.bom.gov.au/, 2010.
Hindawi Publishing CorporationApplied and Environmental Soil ScienceVolume 2012, Article ID 650206, 17 pagesdoi:10.1155/2012/650206
Research Article
Nitrate-Nitrogen Leaching from Onion Bed under Furrow andDrip Irrigation Systems
Parmodh Sharma, Manoj K. Shukla, Theodore W. Sammis, and Pradip Adhikari
Department of Plant and Environmental Sciences, New Mexico State University, MSC 3Q, P.O. Box 30003, Las Cruces,NM 88003, USA
Correspondence should be addressed to Parmodh Sharma, [email protected]
Received 4 December 2011; Accepted 24 February 2012
Academic Editor: Marıa Cruz Dıaz Alvarez
Copyright © 2012 Parmodh Sharma et al. This is an open access article distributed under the Creative Commons AttributionLicense, which permits unrestricted use, distribution, and reproduction in any medium, provided the original work is properlycited.
Water is a limited resource for crop production in arid areas of Southern New Mexico. The objectives of this study were to estimatethe amount and depth of water and nitrate-nitrogen (NO3-N) fronts, water and NO3-N balances, and irrigation efficiencies fortwo onion (Allium cepa L.) fields under furrow and drip irrigation systems. Monthly soil samples were analyzed for NO3-N andchloride concentration for two onion growing seasons starting September 2006 to August 2009. The average amount of NO3-Nin the soil water estimated by chloride tracer technique varied from 97.4 to 105.2 mg L−1 for furrow and 65.2 to 66.8 mg L−1 fordrip-irrigated fields for the 60- to 200-cm depth. The NO3-N loadings below the rooting zone ranged from 145 to 150 kg ha−1 forfurrow- and 76 to 79 kg ha−1 for drip-irrigated fields. The irrigation efficiencies varied from 78 to 80% for furrow- and 83% fordrip- and N application efficiencies (NAEs) were 35 to 36% for furrow- and 38 to 39% for drip-irrigated fields. Small N fertilizerapplications, delayed until onion bulbing starts, and water applications, preferably through drip irrigation, are recommended toreduce deep percolation and increase nitrogen and water efficiencies.
1. Introduction
Among all the elements needed for plant growth, nitrogen(N) is considered the most important fertilizer elementapplied to soils because crop requirements for N are highcompared with requirements for phosphorous (P), potas-sium (K), and other essential plant nutrients [1]. However,solubility of nitrate (NO3) sources in water can cause rapidmovement through soils, and among the various sources ofN loss in agricultural fields, leaching is considered a majorsource of NO3-N loss under normal agricultural practices[1].
Crops differ in rooting depths, rooting densities, N andwater requirements, and plant uptake efficiencies [2], andthe percolation of NO3-N to deeper soil layers dependson the cropping systems. In addition to N fertilizers andwater applied by irrigation or received through precipitation,type of irrigation system and soil physical properties alsoplay important roles in NO3-N leaching to groundwater[3, 4]. In arid regions like New Mexico, excess irrigation
is also applied to flush salts out of the rooting zone tocontrol soil salinization [5], leading to high N leaching.Nitrate loading to groundwater ranged from 165 kg ha−1
NO3-N for irrigated sweet corn (Zea mays) to 366 kg ha−1
NO3-N for irrigated potato (Solanum tuberosum) on sandysoils in Wisconsin [6]. In the Santa Maria, California,region, where crops such as potatoes, beans (Phaseolus),cauliflower (Brassica oleracea), celery (Apium graveolens),lettuce (Lactuca sativa), and broccoli (Brassica oleracea) aregrown on different soils (loam, loamy sand, and sandy loam),mean NO3-N concentrations below the crop rooting zonesranged from 60 to 204 kg ha−1 [7]. Similarly, for springbarley (Hordeum distichum L.) planted in sandy soils andfertilized with 100 kg N ha−1, leaching losses of 65 kg N ha−1
were reported [8]. Nitrate-N loading to groundwater washigher for onion than alfalfa (Medicago sativa L.) and chile(Capsicum annuum) under a furrow irrigation system of aridNew Mexico [3].
The N use efficiency of onion has been reported to rangefrom 15% [9] to 30% [10] in furrow irrigation systems. Drip
2 Applied and Environmental Soil Science
irrigation systems have been reported to reduce percolationof NO3-N below the vadose zone of bell pepper (Capsicumannuum) [11]. Drip irrigation systems have the potential tosupply water and N directly to onion roots and reduce waterand NO3-N leaching to the deeper soil layers. Drip systemsreported to apply 22% [12] to 30% [13] less water thanfurrow irrigation systems. Higher onion yields, larger bulbsizes, less NO3-N leaching, higher water use efficiency, andhigher N fertilizer use efficiency were reported under dripirrigation systems compared to furrow irrigation systems[14].
The amount of N leaching can be estimated by measuringthe concentration of chloride in irrigation water, and Nand chloride concentrations in the soil below the rootingzone of a crop [3, 15, 16]. In these studies, soil N andchloride analyses were made after the harvest of crops todetermine the growing season leaching fraction and amountof N reaching to the ground water. Most soils can supply Nby mineralization, and P and K by weathering of minerals,but cannot supply a considerable amount of chloride. Also,chloride is involved in few biological reactions other thanplant uptake and is present in most irrigation water [17].Thus, chloride is uniquely suited as a tracer element toestimate N leaching below plant rooting zones, although theassumption that chloride is a conservative tracer and is notadsorbed or released by soil may not be always valid [18, 19].There may also be errors in the chloride balance unless allsources or sinks of chloride are determined [20]. Despitethese limitations, the chloride tracer method has been usedto determine NO3-N loading to the groundwater becausethe method is fast and easy to use and is less expensivemethod than constructing a lysimeter. However, there is aneed to expand this technique by including soil nitrate-N, chloride, and irrigation measurements throughout thegrowing season. Therefore, objectives of this study wereto determine how the existing management practices ofonion in New Mexico can be improved to reduce NO3-Nleaching and improve water application and N efficiencies.The hypothesis of the study was that the transport behaviorof chloride in soils is similar to that of NO3-N, and thatchloride can be used as a tracer to determine the amount ofNO3-N reaching to the groundwater throughout the growingseason of onion in New Mexico.
2. Materials and Methods
2.1. Site Description. This study was conducted during twoonion growing seasons from 2006 to 2009 in two fields undertwo irrigation systems. In furrow-irrigated field, onion wasplanted on 2 November 2006 and harvested on 14 July 2007;this period was considered as growing season 1 whereasonion planted on 25 September 2008 and harvested on 18June 2009 was considered as growing season 2. Similarly,onion planted on 27 September 2006 and harvested on 8 June2007 was considered as growing season 1 and onion plantedon 23 February 2008 and harvested on 10 August 2008was considered as growing season 2 in drip-irrigated field.For the previous eight years, both fields were planted with
sudan grass (Sorghum sudanense) after the onion harvest ofgrowing season 1 until onion planted for growing season2. No N fertilizer was applied to the sudan grass and itwas harvested three times during the growing season in thefurrow-irrigated field, and one time in the drip-irrigatedfield where the biomass was left on the soil surface at theend of each cut and incorporated into the soil at the endof the growing season. The furrow-irrigated onion field waslocated on the Leyendecker Plant Science Research Centre(PSRC) at 32◦11′N and 106◦44′W and the drip-irrigatedonion field was located on the Fabian Garcia Research Center(FGRC) at 32◦16′N and 106◦46′W of New Mexico StateUniversity (NMSU) near Las Cruces, New Mexico. Soilsat both sites were classified as Glendale (fine-silty, mixed,calcareous, thermic typic Torrifluvents)-Harkey (coarse-silty,mixed, calcareous, thermic typic Torrifluvents) series [21].The average annual precipitation for the experimental sitesis 25.3 cm, and the average annual temperature is 17.7◦C.The groundwater table was below 2 m in depth at bothexperimental sites, and both fields were irrigated withgroundwater [22].
2.2. Seedbed Preparation. The fields at PSRC and FGRCwere prepared under conventional tillage that includeddisking, chiseling, plowing, leveling, listing, and bed shaping.Disking was done to alleviate surface soil compaction andto incorporate sudan grass stubble into the soil in both thefields. Triple superphosphate was broadcasted at a rate of200 kg P2O5 ha−1 on both onion fields before moldboardplowing. Both fields were laser leveled, bed shaped with56 cm beds and 46 cm furrows, and two rows of onionstransplanted into each bed 28 cm apart on 2 November 2006and 25 September 2008 in the field located at PSRC and on27 September 2006 and 23 February 2008 in the field locatedat FGRC. The length of row was 210 m at PSRC and 132 mat FGRC. The field at the PSRC was furrow irrigated whilethe field at the FGRC was drip-irrigated using T-tape (T-Tape: TSX-508-08-670, T-Systems, San Diego, CA) with anemitter spacing of 20 cm and a flow rate of 0.22 cm h−1 laidin the center of each bed between the two onion rows ata 10 cm depth. Onions were irrigated 19 times with totalgross water application of 95 cm, and 21 times with totalgross water application of 100 cm during growing seasons1 and 2, respectively, in the furrow-irrigated field. Onion indrip-irrigated field received a total gross water application of81 cm using 42 irrigation applications in growing season 1and 72 cm using 40 irrigation applications in growing season2. The amount of water applied during each irrigation eventwas measured with a flow meter (McCrometer, Inc., Hemet,CA) in each field. The precipitation data was obtained fromweather stations located at each experimental site. The waterapplication efficiency was calculated as the ratio of total waterstored in the onion rooting zone during irrigation (Et + Δstorage) and total water applied [23].
Urea ammonium nitrate (URAN) liquid fertilizer wasthe source of N applied in both the fields. Urea ammoniumnitrate was applied at a rate of 49.2 kg N ha−1 per irrigationin the furrow-irrigated field. During growing season 1, six
Applied and Environmental Soil Science 3
irrigations with URAN fertilizer were applied during 2007in the months of February, March, and April (total of295 kg N ha−1) and same number of fertilizer applications(total of 295 kg N ha−1) were also made during growingseason 2 in the furrow-irrigated field. In the drip-irrigatedfield, URAN was applied at an average rate of 36.5 kg N ha−1
through eight irrigations (total of 292 kg N ha−1) duringgrowing season 1 and 35.8 kg N ha−1 per irrigation througheight irrigations (total of 286 kg N ha−1) during growingseason 2 through the drip tape via injectors (H. E. Andersoncompany, Muskogee, OK). Nitrogen application efficiencywas calculated as the ratio of total N uptake and total Napplied. Nitrogen use efficiency was calculated as the ratioof total N uptake and total available N (initial soil N at a 0–50 cm depth + N fertilizer applied) [14].
2.3. Soil Sampling and Analysis. Twenty-four soil core sam-ples were collected from three locations and four depths (0–10, 10–30, 30–40, and 40–60 cm) from both fields (2 fields× 3 locations × 4 depths = 24). Cores were trimmed in thelaboratory, and soil bulk density (BD) was determined by thecore method [24]. After determining soil BD, all soil coreswere immediately placed in a water tray for 1 to 2 d at roomtemperature (24◦C) to fully saturate by capillary rise, andsaturated hydraulic conductivity (Ks) was determined by theconstant head method [25].
Bulk soil samples were collected from each field at theend of each month from six depths (0–10, 10–30, 30–40, 40–60, 60–85, and 85–110 cm) and three locations (2 fields ×3 locations × 6 depths = 36 soil samples) from September2006 to August 2009. Gravimetric soil moisture content foreach bulk soil sample was determined immediately aftersampling [26]. The gravimetric water content was multipliedby BD to calculate the volumetric soil water content (θ).The rest of each soil sample was stored in a cold room at4◦C until further analysis. Irrigation water samples collectedduring each month from both fields were analyzed forelectrical conductivity (EC), pH, nitrate, and chloride fromboth fields. Soil samples were also collected from 150- and200-cm depths during the last week of March and at thetime of harvest from both fields to examine change in theconcentration of NO3-N and chloride.
Bulk soil samples were air dried for 48 hours, ground,and passed through a 2-mm diameter sieve. Fifty-one gramsof sieved soil (<2 mm diameter) was used for particle sizeanalysis by the hydrometer method [27]. Nitrate-N wasdetermined by an automated spectrophotometric methodusing a Technicon autoanalyzer from soil-KCl extracts. Theextracts were prepared by adding 25 mL of 2.0 M KCl to2.5 g of soil, shaking the suspension for 1 hour, and filteringthrough filter paper (Whatman number 2) [28]. Chloridewas determined with a 798 MPT Titrino titrator usingsilver nitrate solution (0.1 M). Electrical conductivity (EC)and pH were measured for a solution of (1 : 2 soil : water)using an EC electrode and 72 pH meter, respectively. Soilsamples from six depths in both fields were also analyzedfor organic matter (OM), exchangeable sodium percentage(ESP), sodium adsorption ratio (SAR), phosphorous (P),
and potassium (K) at the New Mexico State University Soiland Water Testing (SWAT) Laboratory.
2.4. Onion Rooting Depth and Biomass. Onion rooting depthwas determined by excavating two pits at each field justbefore each harvest. Two plants from each pit were excavatedalong with their roots at a depth increment of 20 cm from thetop of the bed to a depth of 50 cm. The soil was gently washedin the lab and roots were separated, air dried, and weighed.
Onion samples were collected at monthly intervals fromFebruary until harvest during growing season 2 in furrow-and drip-irrigated fields for N uptake determination. Foraboveground biomass determination, the crop was manuallyharvested before each harvest from four randomly selectedplots (2.4 m × 1 m) at each field. Wet and dry plant biomassand onion yields were determined, separately, for each ploton a per-hectare basis. The plant samples were weighed fresh,then dried at 68◦C for 72 h and reweighed to determine plantmoisture content. The air-dried onion bulbs were analyzedfor NO3-N, total N and chloride at the SWAT lab of NMSU.
2.5. Crop Coefficient. The reference evapotranspiration (Eto)for grass using Penman’s equation was obtained from NMSUweather station located at each experimental field. The cropcoefficient (Kc) was calculated as follows:
Kc = B0 + B1
n∑
i=1
GDD + B2
⎛
⎝n∑
i=1
GDD
⎞
⎠
2
+ B3
⎛
⎝n∑
i=1
GDD
⎞
⎠
3
,
(1)
where i = day and n = total number of days, B0 is theintercept, and B1, B2, and B3 are regression coefficients foronion [29]. Growing-degree-days (GDD) were calculated as
GDD = (Tmax + Tmin)2
− Tb, (2)
where Tmax = daily maximum temperature (◦C); Tmin = dailyminimum temperature (◦C); Tb = base temperature (◦C).The base temperature was set at 4◦C [30]. Kc is defined asthe ratio of crop evapotranspiration (Et) and Eto ; therefore,Kc was multiplied by Eto to calculate Et.
2.6. Soil Water Content. Diurnal variations of θ in theonion beds were monitored by time domain reflectometry(TDR) sensors (Campbell Scientific, Inc., Logan, Utah). EachTDR system included one CR 10X datalogger, one SDMX50multiplexer, one TDR 100, and eight CS-640 probes poweredby a 12 V deep-cycle battery at each experimental site.A set of two probes was installed at depths of 20 and50 cm from the top of the onion bed at four locations ineach experimental field. Total of sixteen TDR sensors wereinstalled and programmed to provide half hourly readingsfor the entire growing seasons at both experimental sites.
2.7. Chloride Tracer Technique. Chloride is present in almostevery source of irrigation water and is either taken upby plants or remains in the water. Chloride is assumed
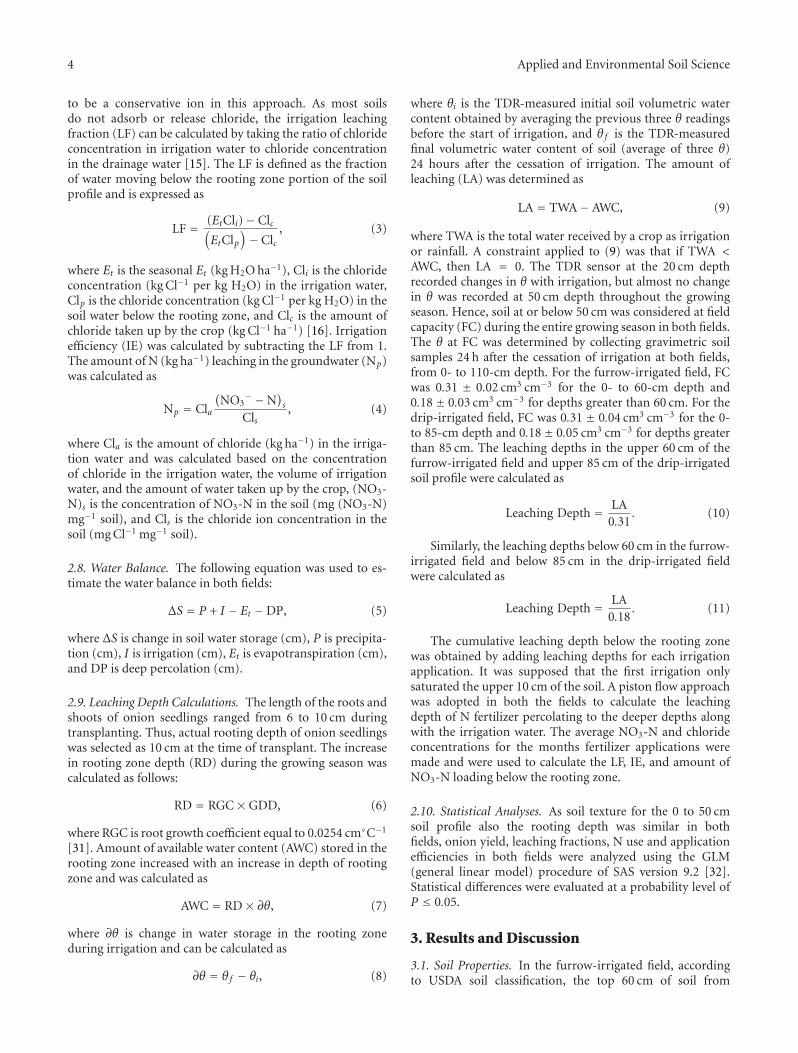
4 Applied and Environmental Soil Science
to be a conservative ion in this approach. As most soilsdo not adsorb or release chloride, the irrigation leachingfraction (LF) can be calculated by taking the ratio of chlorideconcentration in irrigation water to chloride concentrationin the drainage water [15]. The LF is defined as the fractionof water moving below the rooting zone portion of the soilprofile and is expressed as
LF = (EtCli)− Clc(EtClp
)− Clc
, (3)
where Et is the seasonal Et (kg H2O ha−1), Cli is the chlorideconcentration (kg Cl−1 per kg H2O) in the irrigation water,Clp is the chloride concentration (kg Cl−1 per kg H2O) in thesoil water below the rooting zone, and Clc is the amount ofchloride taken up by the crop (kg Cl−1 ha−1) [16]. Irrigationefficiency (IE) was calculated by subtracting the LF from 1.The amount of N (kg ha−1) leaching in the groundwater (Np)was calculated as
Np = Cla
(NO3
− −N)s
Cls, (4)
where Cla is the amount of chloride (kg ha−1) in the irriga-tion water and was calculated based on the concentrationof chloride in the irrigation water, the volume of irrigationwater, and the amount of water taken up by the crop, (NO3-N)s is the concentration of NO3-N in the soil (mg (NO3-N)mg−1 soil), and Cls is the chloride ion concentration in thesoil (mg Cl−1 mg−1 soil).
2.8. Water Balance. The following equation was used to es-timate the water balance in both fields:
ΔS = P + I − Et −DP, (5)
where ΔS is change in soil water storage (cm), P is precipita-tion (cm), I is irrigation (cm), Et is evapotranspiration (cm),and DP is deep percolation (cm).
2.9. Leaching Depth Calculations. The length of the roots andshoots of onion seedlings ranged from 6 to 10 cm duringtransplanting. Thus, actual rooting depth of onion seedlingswas selected as 10 cm at the time of transplant. The increasein rooting zone depth (RD) during the growing season wascalculated as follows:
RD = RGC×GDD, (6)
where RGC is root growth coefficient equal to 0.0254 cm◦C−1
[31]. Amount of available water content (AWC) stored in therooting zone increased with an increase in depth of rootingzone and was calculated as
AWC = RD× ∂θ, (7)
where ∂θ is change in water storage in the rooting zoneduring irrigation and can be calculated as
∂θ = θ f − θi, (8)
where θi is the TDR-measured initial soil volumetric watercontent obtained by averaging the previous three θ readingsbefore the start of irrigation, and θ f is the TDR-measuredfinal volumetric water content of soil (average of three θ)24 hours after the cessation of irrigation. The amount ofleaching (LA) was determined as
LA = TWA− AWC, (9)
where TWA is the total water received by a crop as irrigationor rainfall. A constraint applied to (9) was that if TWA <AWC, then LA = 0. The TDR sensor at the 20 cm depthrecorded changes in θ with irrigation, but almost no changein θ was recorded at 50 cm depth throughout the growingseason. Hence, soil at or below 50 cm was considered at fieldcapacity (FC) during the entire growing season in both fields.The θ at FC was determined by collecting gravimetric soilsamples 24 h after the cessation of irrigation at both fields,from 0- to 110-cm depth. For the furrow-irrigated field, FCwas 0.31 ± 0.02 cm3 cm−3 for the 0- to 60-cm depth and0.18 ± 0.03 cm3 cm−3 for depths greater than 60 cm. For thedrip-irrigated field, FC was 0.31 ± 0.04 cm3 cm−3 for the 0-to 85-cm depth and 0.18± 0.05 cm3 cm−3 for depths greaterthan 85 cm. The leaching depths in the upper 60 cm of thefurrow-irrigated field and upper 85 cm of the drip-irrigatedsoil profile were calculated as
Leaching Depth = LA0.31
. (10)
Similarly, the leaching depths below 60 cm in the furrow-irrigated field and below 85 cm in the drip-irrigated fieldwere calculated as
Leaching Depth = LA0.18
. (11)
The cumulative leaching depth below the rooting zonewas obtained by adding leaching depths for each irrigationapplication. It was supposed that the first irrigation onlysaturated the upper 10 cm of the soil. A piston flow approachwas adopted in both the fields to calculate the leachingdepth of N fertilizer percolating to the deeper depths alongwith the irrigation water. The average NO3-N and chlorideconcentrations for the months fertilizer applications weremade and were used to calculate the LF, IE, and amount ofNO3-N loading below the rooting zone.
2.10. Statistical Analyses. As soil texture for the 0 to 50 cmsoil profile also the rooting depth was similar in bothfields, onion yield, leaching fractions, N use and applicationefficiencies in both fields were analyzed using the GLM(general linear model) procedure of SAS version 9.2 [32].Statistical differences were evaluated at a probability level ofP ≤ 0.05.
3. Results and Discussion
3.1. Soil Properties. In the furrow-irrigated field, accordingto USDA soil classification, the top 60 cm of soil from
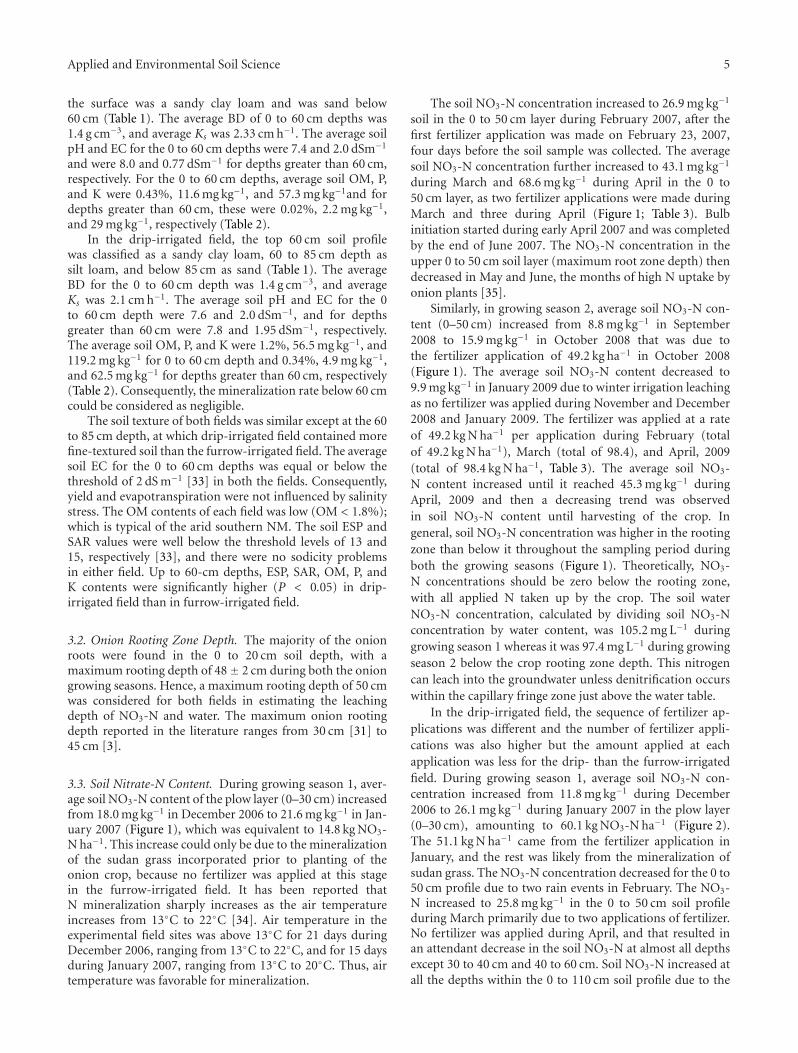
Applied and Environmental Soil Science 5
the surface was a sandy clay loam and was sand below60 cm (Table 1). The average BD of 0 to 60 cm depths was1.4 g cm−3, and average Ks was 2.33 cm h−1. The average soilpH and EC for the 0 to 60 cm depths were 7.4 and 2.0 dSm−1
and were 8.0 and 0.77 dSm−1 for depths greater than 60 cm,respectively. For the 0 to 60 cm depths, average soil OM, P,and K were 0.43%, 11.6 mg kg−1, and 57.3 mg kg−1and fordepths greater than 60 cm, these were 0.02%, 2.2 mg kg−1,and 29 mg kg−1, respectively (Table 2).
In the drip-irrigated field, the top 60 cm soil profilewas classified as a sandy clay loam, 60 to 85 cm depth assilt loam, and below 85 cm as sand (Table 1). The averageBD for the 0 to 60 cm depth was 1.4 g cm−3, and averageKs was 2.1 cm h−1. The average soil pH and EC for the 0to 60 cm depth were 7.6 and 2.0 dSm−1, and for depthsgreater than 60 cm were 7.8 and 1.95 dSm−1, respectively.The average soil OM, P, and K were 1.2%, 56.5 mg kg−1, and119.2 mg kg−1 for 0 to 60 cm depth and 0.34%, 4.9 mg kg−1,and 62.5 mg kg−1 for depths greater than 60 cm, respectively(Table 2). Consequently, the mineralization rate below 60 cmcould be considered as negligible.
The soil texture of both fields was similar except at the 60to 85 cm depth, at which drip-irrigated field contained morefine-textured soil than the furrow-irrigated field. The averagesoil EC for the 0 to 60 cm depths was equal or below thethreshold of 2 dS m−1 [33] in both the fields. Consequently,yield and evapotranspiration were not influenced by salinitystress. The OM contents of each field was low (OM < 1.8%);which is typical of the arid southern NM. The soil ESP andSAR values were well below the threshold levels of 13 and15, respectively [33], and there were no sodicity problemsin either field. Up to 60-cm depths, ESP, SAR, OM, P, andK contents were significantly higher (P < 0.05) in drip-irrigated field than in furrow-irrigated field.
3.2. Onion Rooting Zone Depth. The majority of the onionroots were found in the 0 to 20 cm soil depth, with amaximum rooting depth of 48± 2 cm during both the oniongrowing seasons. Hence, a maximum rooting depth of 50 cmwas considered for both fields in estimating the leachingdepth of NO3-N and water. The maximum onion rootingdepth reported in the literature ranges from 30 cm [31] to45 cm [3].
3.3. Soil Nitrate-N Content. During growing season 1, aver-age soil NO3-N content of the plow layer (0–30 cm) increasedfrom 18.0 mg kg−1 in December 2006 to 21.6 mg kg−1 in Jan-uary 2007 (Figure 1), which was equivalent to 14.8 kg NO3-N ha−1. This increase could only be due to the mineralizationof the sudan grass incorporated prior to planting of theonion crop, because no fertilizer was applied at this stagein the furrow-irrigated field. It has been reported thatN mineralization sharply increases as the air temperatureincreases from 13◦C to 22◦C [34]. Air temperature in theexperimental field sites was above 13◦C for 21 days duringDecember 2006, ranging from 13◦C to 22◦C, and for 15 daysduring January 2007, ranging from 13◦C to 20◦C. Thus, airtemperature was favorable for mineralization.
The soil NO3-N concentration increased to 26.9 mg kg−1
soil in the 0 to 50 cm layer during February 2007, after thefirst fertilizer application was made on February 23, 2007,four days before the soil sample was collected. The averagesoil NO3-N concentration further increased to 43.1 mg kg−1
during March and 68.6 mg kg−1 during April in the 0 to50 cm layer, as two fertilizer applications were made duringMarch and three during April (Figure 1; Table 3). Bulbinitiation started during early April 2007 and was completedby the end of June 2007. The NO3-N concentration in theupper 0 to 50 cm soil layer (maximum root zone depth) thendecreased in May and June, the months of high N uptake byonion plants [35].
Similarly, in growing season 2, average soil NO3-N con-tent (0–50 cm) increased from 8.8 mg kg−1 in September2008 to 15.9 mg kg−1 in October 2008 that was due tothe fertilizer application of 49.2 kg ha−1 in October 2008(Figure 1). The average soil NO3-N content decreased to9.9 mg kg−1 in January 2009 due to winter irrigation leachingas no fertilizer was applied during November and December2008 and January 2009. The fertilizer was applied at a rateof 49.2 kg N ha−1 per application during February (totalof 49.2 kg N ha−1), March (total of 98.4), and April, 2009(total of 98.4 kg N ha−1, Table 3). The average soil NO3-N content increased until it reached 45.3 mg kg−1 duringApril, 2009 and then a decreasing trend was observedin soil NO3-N content until harvesting of the crop. Ingeneral, soil NO3-N concentration was higher in the rootingzone than below it throughout the sampling period duringboth the growing seasons (Figure 1). Theoretically, NO3-N concentrations should be zero below the rooting zone,with all applied N taken up by the crop. The soil waterNO3-N concentration, calculated by dividing soil NO3-Nconcentration by water content, was 105.2 mg L−1 duringgrowing season 1 whereas it was 97.4 mg L−1 during growingseason 2 below the crop rooting zone depth. This nitrogencan leach into the groundwater unless denitrification occurswithin the capillary fringe zone just above the water table.
In the drip-irrigated field, the sequence of fertilizer ap-plications was different and the number of fertilizer appli-cations was also higher but the amount applied at eachapplication was less for the drip- than the furrow-irrigatedfield. During growing season 1, average soil NO3-N con-centration increased from 11.8 mg kg−1 during December2006 to 26.1 mg kg−1 during January 2007 in the plow layer(0–30 cm), amounting to 60.1 kg NO3-N ha−1 (Figure 2).The 51.1 kg N ha−1 came from the fertilizer application inJanuary, and the rest was likely from the mineralization ofsudan grass. The NO3-N concentration decreased for the 0 to50 cm profile due to two rain events in February. The NO3-N increased to 25.8 mg kg−1 in the 0 to 50 cm soil profileduring March primarily due to two applications of fertilizer.No fertilizer was applied during April, and that resulted inan attendant decrease in the soil NO3-N at almost all depthsexcept 30 to 40 cm and 40 to 60 cm. Soil NO3-N increased atall the depths within the 0 to 110 cm soil profile due to the
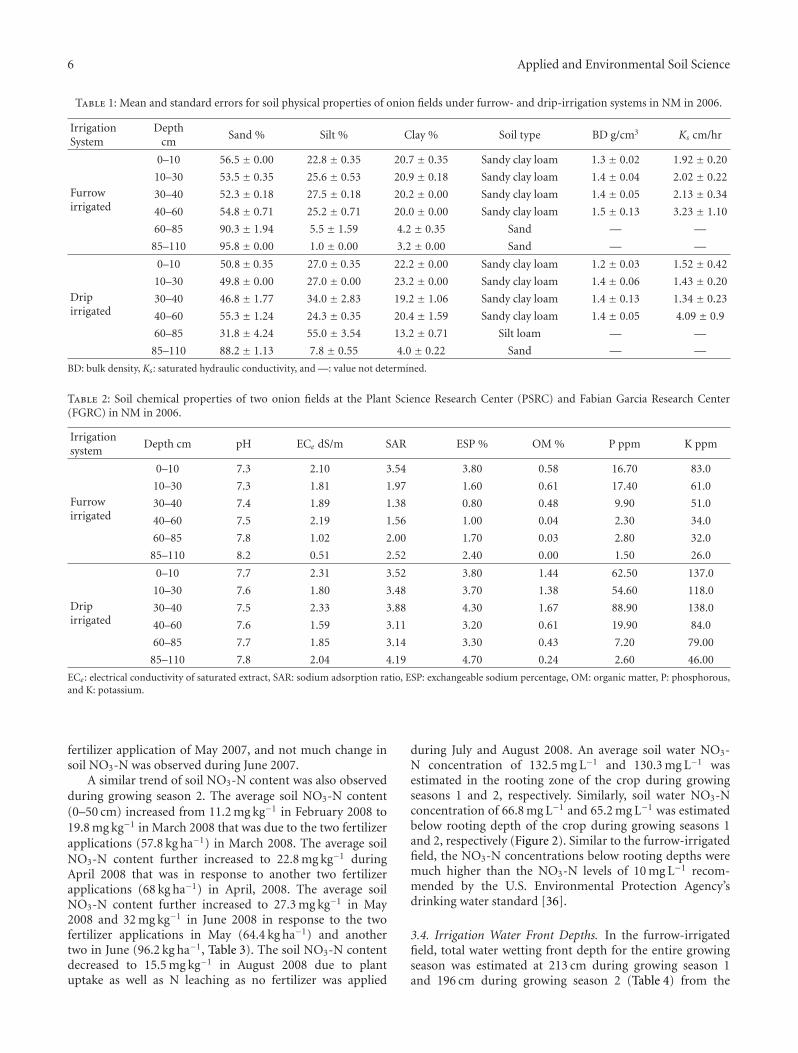
6 Applied and Environmental Soil Science
Table 1: Mean and standard errors for soil physical properties of onion fields under furrow- and drip-irrigation systems in NM in 2006.
IrrigationSystem
Depthcm
Sand % Silt % Clay % Soil type BD g/cm3 Ks cm/hr
Furrowirrigated
0–10 56.5 ± 0.00 22.8 ± 0.35 20.7 ± 0.35 Sandy clay loam 1.3 ± 0.02 1.92 ± 0.20
10–30 53.5 ± 0.35 25.6 ± 0.53 20.9 ± 0.18 Sandy clay loam 1.4 ± 0.04 2.02 ± 0.22
30–40 52.3 ± 0.18 27.5 ± 0.18 20.2 ± 0.00 Sandy clay loam 1.4 ± 0.05 2.13 ± 0.34
40–60 54.8 ± 0.71 25.2 ± 0.71 20.0 ± 0.00 Sandy clay loam 1.5 ± 0.13 3.23 ± 1.10
60–85 90.3 ± 1.94 5.5 ± 1.59 4.2 ± 0.35 Sand — —
85–110 95.8 ± 0.00 1.0 ± 0.00 3.2 ± 0.00 Sand — —
Dripirrigated
0–10 50.8± 0.35 27.0± 0.35 22.2 ± 0.00 Sandy clay loam 1.2 ± 0.03 1.52 ± 0.42
10–30 49.8 ± 0.00 27.0 ± 0.00 23.2 ± 0.00 Sandy clay loam 1.4 ± 0.06 1.43 ± 0.20
30–40 46.8 ± 1.77 34.0 ± 2.83 19.2 ± 1.06 Sandy clay loam 1.4 ± 0.13 1.34 ± 0.23
40–60 55.3 ± 1.24 24.3 ± 0.35 20.4 ± 1.59 Sandy clay loam 1.4 ± 0.05 4.09 ± 0.9
60–85 31.8 ± 4.24 55.0 ± 3.54 13.2 ± 0.71 Silt loam — —
85–110 88.2 ± 1.13 7.8 ± 0.55 4.0 ± 0.22 Sand — —
BD: bulk density, Ks: saturated hydraulic conductivity, and —: value not determined.
Table 2: Soil chemical properties of two onion fields at the Plant Science Research Center (PSRC) and Fabian Garcia Research Center(FGRC) in NM in 2006.
Irrigationsystem
Depth cm pH ECe dS/m SAR ESP % OM % P ppm K ppm
Furrowirrigated
0–10 7.3 2.10 3.54 3.80 0.58 16.70 83.0
10–30 7.3 1.81 1.97 1.60 0.61 17.40 61.0
30–40 7.4 1.89 1.38 0.80 0.48 9.90 51.0
40–60 7.5 2.19 1.56 1.00 0.04 2.30 34.0
60–85 7.8 1.02 2.00 1.70 0.03 2.80 32.0
85–110 8.2 0.51 2.52 2.40 0.00 1.50 26.0
Dripirrigated
0–10 7.7 2.31 3.52 3.80 1.44 62.50 137.0
10–30 7.6 1.80 3.48 3.70 1.38 54.60 118.0
30–40 7.5 2.33 3.88 4.30 1.67 88.90 138.0
40–60 7.6 1.59 3.11 3.20 0.61 19.90 84.0
60–85 7.7 1.85 3.14 3.30 0.43 7.20 79.00
85–110 7.8 2.04 4.19 4.70 0.24 2.60 46.00
ECe : electrical conductivity of saturated extract, SAR: sodium adsorption ratio, ESP: exchangeable sodium percentage, OM: organic matter, P: phosphorous,and K: potassium.
fertilizer application of May 2007, and not much change insoil NO3-N was observed during June 2007.
A similar trend of soil NO3-N content was also observedduring growing season 2. The average soil NO3-N content(0–50 cm) increased from 11.2 mg kg−1 in February 2008 to19.8 mg kg−1 in March 2008 that was due to the two fertilizerapplications (57.8 kg ha−1) in March 2008. The average soilNO3-N content further increased to 22.8 mg kg−1 duringApril 2008 that was in response to another two fertilizerapplications (68 kg ha−1) in April, 2008. The average soilNO3-N content further increased to 27.3 mg kg−1 in May2008 and 32 mg kg−1 in June 2008 in response to the twofertilizer applications in May (64.4 kg ha−1) and anothertwo in June (96.2 kg ha−1, Table 3). The soil NO3-N contentdecreased to 15.5 mg kg−1 in August 2008 due to plantuptake as well as N leaching as no fertilizer was applied
during July and August 2008. An average soil water NO3-N concentration of 132.5 mg L−1 and 130.3 mg L−1 wasestimated in the rooting zone of the crop during growingseasons 1 and 2, respectively. Similarly, soil water NO3-Nconcentration of 66.8 mg L−1 and 65.2 mg L−1 was estimatedbelow rooting depth of the crop during growing seasons 1and 2, respectively (Figure 2). Similar to the furrow-irrigatedfield, the NO3-N concentrations below rooting depths weremuch higher than the NO3-N levels of 10 mg L−1 recom-mended by the U.S. Environmental Protection Agency’sdrinking water standard [36].
3.4. Irrigation Water Front Depths. In the furrow-irrigatedfield, total water wetting front depth for the entire growingseason was estimated at 213 cm during growing season 1and 196 cm during growing season 2 (Table 4) from the
Applied and Environmental Soil Science 7
Table 3: Type, date, and amount of N fertilizer applied in furrow- and drip-irrigated onion fields in NM in 2006–2009.
Field Irrigation system Fertilizer type Date of applicationAmount of application
(kg N ha−1)
2/23/2007 49.2
3/16/2007 49.2
3/27/2007 49.2
4/05/2007 49.2
4/13/2007 49.2
PSRC Furrow irrigated URAN (26-0-0-6) 4/20/2007 49.2
10/10/2008 49.2
2/24/2009 49.2
3/12/2009 49.2
3/24/2009 49.2
4/14/2009 49.2
4/26/2009 49.2
11/9/2006 17.9
11/18/2006 23.9
12/16/2006 23.9
1/13/2007 51.1
2/10/2007 36.5
3/27/2007 31.8
3/30/2007 47.8
FGRC Drip irrigated URAN (26-0-0-6) 5/05/2007 59.0
3/17/2008 24.6
3/25/2008 33.2
4/14/2008 46.0
4/28/2008 22.0
5/07/2008 36.0
5/22/2008 28.4
6/18/2008 58.0
6/30/2008 38.2
PSRC: Plant Science Research Center, FGRC: Fabian Garcia Research Center;URAN: Urea ammonium nitrate.
soil surface, with average water wetting front velocity of0.89 cm day−1 during growing season 1 and 0.78 cm day−1
in growing season 2. The NO3-N front depth was esti-mated at 149 cm, with an average NO3-N front velocity of1.18 cm day−1 in growing season 1 whereas NO3-N frontdepth was 196 cm, with average NO3-N front velocity of0.82 cm day−1 in growing season 2. Although NO3-N moveswith water, the water wetting front depth was greater thanthe N front depth during both the growing seasons becausesix water applications were made beginning November 2006,before the first N fertilizer was applied during February2007 in growing season 1. Similarly, water application wasstarted on September, 2008 and first N fertilizer applicationwas made on October, 2008 in growing season 2 and pistonflow was the only mechanism considered for solute transport(Table 4).
In the drip-irrigated field, the depth of the water wettingfront was estimated at 147 cm (Tables 5(a) and 5(b)), withaverage water wetting front velocity of 0.58 cm day−1 in
growing season 1 whereas the estimated depth of waterwetting front was 105 cm (Tables 5(a) and 5(b)), withaverage water wetting front velocity of 0.67 cm day−1 ingrowing season 2. The NO3-N front depth was estimated at86 cm, with average NO3-N front velocity of 0.41 cm day−1
in growing season 1 whereas estimated depth of NO3-Nfront was 87 cm, with average NO3-N front velocity of0.63 cm day−1 in growing season 2. Similar to the furrow-irrigated field, the water wetting front was higher than theNO3-N front depth because the water application was startedearlier than N fertilizer application.
The assumption that wetting and NO3-N fronts move atthe same velocity may not be valid under field conditions.The NO3-N flow velocity can be lower than the wettingfront velocity if NO3-N adsorption was taking place duringthe transport through the soil profile. In the case of anionexclusion, the NO3-N flow velocity could be higher than thewetting front velocity, and deeper leaching of NO3-N can beobserved under such conditions [37].
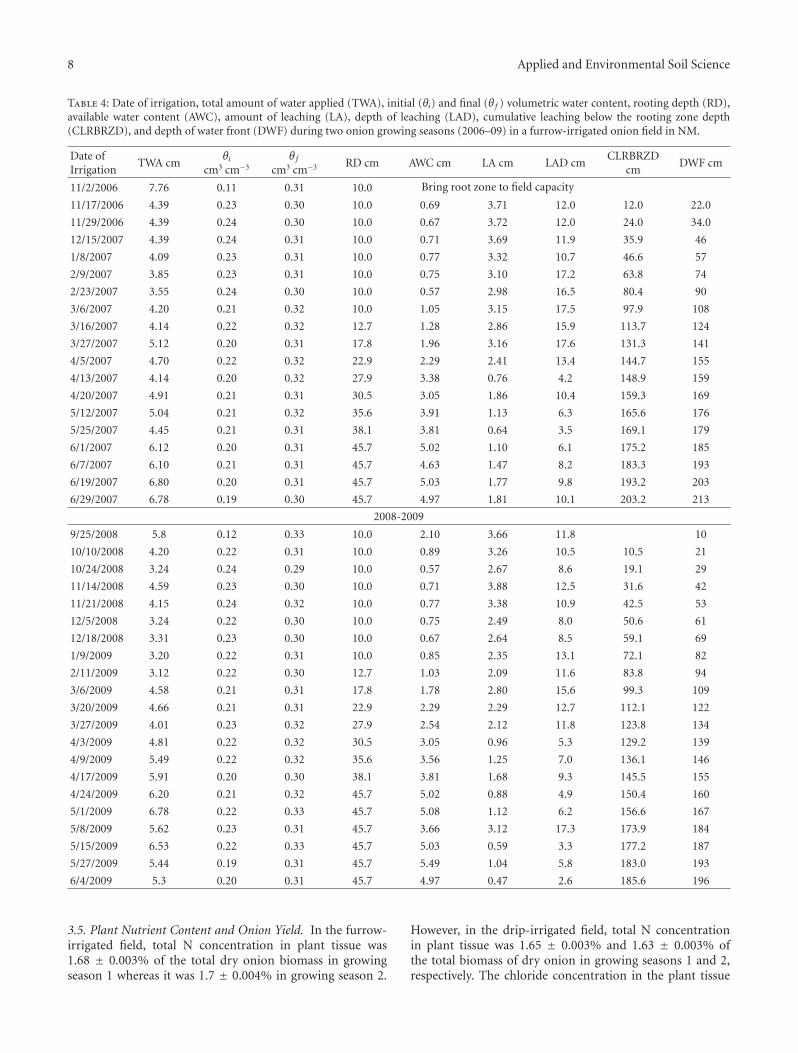
8 Applied and Environmental Soil Science
Table 4: Date of irrigation, total amount of water applied (TWA), initial (θi) and final (θ f ) volumetric water content, rooting depth (RD),available water content (AWC), amount of leaching (LA), depth of leaching (LAD), cumulative leaching below the rooting zone depth(CLRBRZD), and depth of water front (DWF) during two onion growing seasons (2006–09) in a furrow-irrigated onion field in NM.
Date ofIrrigation
TWA cmθi
cm3 cm−3θ f
cm3 cm−3 RD cm AWC cm LA cm LAD cmCLRBRZD
cmDWF cm
11/2/2006 7.76 0.11 0.31 10.0 Bring root zone to field capacity
11/17/2006 4.39 0.23 0.30 10.0 0.69 3.71 12.0 12.0 22.0
11/29/2006 4.39 0.24 0.30 10.0 0.67 3.72 12.0 24.0 34.0
12/15/2007 4.39 0.24 0.31 10.0 0.71 3.69 11.9 35.9 46
1/8/2007 4.09 0.23 0.31 10.0 0.77 3.32 10.7 46.6 57
2/9/2007 3.85 0.23 0.31 10.0 0.75 3.10 17.2 63.8 74
2/23/2007 3.55 0.24 0.30 10.0 0.57 2.98 16.5 80.4 90
3/6/2007 4.20 0.21 0.32 10.0 1.05 3.15 17.5 97.9 108
3/16/2007 4.14 0.22 0.32 12.7 1.28 2.86 15.9 113.7 124
3/27/2007 5.12 0.20 0.31 17.8 1.96 3.16 17.6 131.3 141
4/5/2007 4.70 0.22 0.32 22.9 2.29 2.41 13.4 144.7 155
4/13/2007 4.14 0.20 0.32 27.9 3.38 0.76 4.2 148.9 159
4/20/2007 4.91 0.21 0.31 30.5 3.05 1.86 10.4 159.3 169
5/12/2007 5.04 0.21 0.32 35.6 3.91 1.13 6.3 165.6 176
5/25/2007 4.45 0.21 0.31 38.1 3.81 0.64 3.5 169.1 179
6/1/2007 6.12 0.20 0.31 45.7 5.02 1.10 6.1 175.2 185
6/7/2007 6.10 0.21 0.31 45.7 4.63 1.47 8.2 183.3 193
6/19/2007 6.80 0.20 0.31 45.7 5.03 1.77 9.8 193.2 203
6/29/2007 6.78 0.19 0.30 45.7 4.97 1.81 10.1 203.2 213
2008-2009
9/25/2008 5.8 0.12 0.33 10.0 2.10 3.66 11.8 10
10/10/2008 4.20 0.22 0.31 10.0 0.89 3.26 10.5 10.5 21
10/24/2008 3.24 0.24 0.29 10.0 0.57 2.67 8.6 19.1 29
11/14/2008 4.59 0.23 0.30 10.0 0.71 3.88 12.5 31.6 42
11/21/2008 4.15 0.24 0.32 10.0 0.77 3.38 10.9 42.5 53
12/5/2008 3.24 0.22 0.30 10.0 0.75 2.49 8.0 50.6 61
12/18/2008 3.31 0.23 0.30 10.0 0.67 2.64 8.5 59.1 69
1/9/2009 3.20 0.22 0.31 10.0 0.85 2.35 13.1 72.1 82
2/11/2009 3.12 0.22 0.30 12.7 1.03 2.09 11.6 83.8 94
3/6/2009 4.58 0.21 0.31 17.8 1.78 2.80 15.6 99.3 109
3/20/2009 4.66 0.21 0.31 22.9 2.29 2.29 12.7 112.1 122
3/27/2009 4.01 0.23 0.32 27.9 2.54 2.12 11.8 123.8 134
4/3/2009 4.81 0.22 0.32 30.5 3.05 0.96 5.3 129.2 139
4/9/2009 5.49 0.22 0.32 35.6 3.56 1.25 7.0 136.1 146
4/17/2009 5.91 0.20 0.30 38.1 3.81 1.68 9.3 145.5 155
4/24/2009 6.20 0.21 0.32 45.7 5.02 0.88 4.9 150.4 160
5/1/2009 6.78 0.22 0.33 45.7 5.08 1.12 6.2 156.6 167
5/8/2009 5.62 0.23 0.31 45.7 3.66 3.12 17.3 173.9 184
5/15/2009 6.53 0.22 0.33 45.7 5.03 0.59 3.3 177.2 187
5/27/2009 5.44 0.19 0.31 45.7 5.49 1.04 5.8 183.0 193
6/4/2009 5.3 0.20 0.31 45.7 4.97 0.47 2.6 185.6 196
3.5. Plant Nutrient Content and Onion Yield. In the furrow-irrigated field, total N concentration in plant tissue was1.68 ± 0.003% of the total dry onion biomass in growingseason 1 whereas it was 1.7 ± 0.004% in growing season 2.
However, in the drip-irrigated field, total N concentrationin plant tissue was 1.65 ± 0.003% and 1.63 ± 0.003% ofthe total biomass of dry onion in growing seasons 1 and 2,respectively. The chloride concentration in the plant tissue
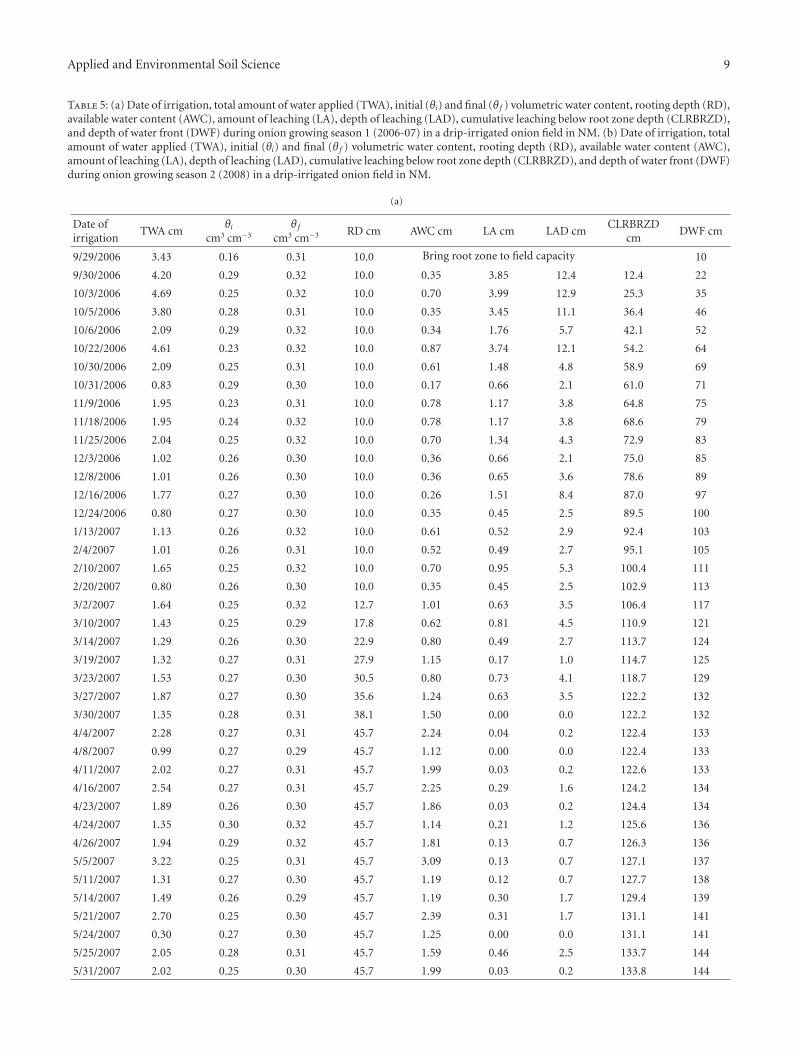
Applied and Environmental Soil Science 9
Table 5: (a) Date of irrigation, total amount of water applied (TWA), initial (θi) and final (θ f ) volumetric water content, rooting depth (RD),available water content (AWC), amount of leaching (LA), depth of leaching (LAD), cumulative leaching below root zone depth (CLRBRZD),and depth of water front (DWF) during onion growing season 1 (2006-07) in a drip-irrigated onion field in NM. (b) Date of irrigation, totalamount of water applied (TWA), initial (θi) and final (θ f ) volumetric water content, rooting depth (RD), available water content (AWC),amount of leaching (LA), depth of leaching (LAD), cumulative leaching below root zone depth (CLRBRZD), and depth of water front (DWF)during onion growing season 2 (2008) in a drip-irrigated onion field in NM.
(a)
Date ofirrigation
TWA cmθi
cm3 cm−3θ f
cm3 cm−3 RD cm AWC cm LA cm LAD cmCLRBRZD
cmDWF cm
9/29/2006 3.43 0.16 0.31 10.0 Bring root zone to field capacity 10
9/30/2006 4.20 0.29 0.32 10.0 0.35 3.85 12.4 12.4 22
10/3/2006 4.69 0.25 0.32 10.0 0.70 3.99 12.9 25.3 35
10/5/2006 3.80 0.28 0.31 10.0 0.35 3.45 11.1 36.4 46
10/6/2006 2.09 0.29 0.32 10.0 0.34 1.76 5.7 42.1 52
10/22/2006 4.61 0.23 0.32 10.0 0.87 3.74 12.1 54.2 64
10/30/2006 2.09 0.25 0.31 10.0 0.61 1.48 4.8 58.9 69
10/31/2006 0.83 0.29 0.30 10.0 0.17 0.66 2.1 61.0 71
11/9/2006 1.95 0.23 0.31 10.0 0.78 1.17 3.8 64.8 75
11/18/2006 1.95 0.24 0.32 10.0 0.78 1.17 3.8 68.6 79
11/25/2006 2.04 0.25 0.32 10.0 0.70 1.34 4.3 72.9 83
12/3/2006 1.02 0.26 0.30 10.0 0.36 0.66 2.1 75.0 85
12/8/2006 1.01 0.26 0.30 10.0 0.36 0.65 3.6 78.6 89
12/16/2006 1.77 0.27 0.30 10.0 0.26 1.51 8.4 87.0 97
12/24/2006 0.80 0.27 0.30 10.0 0.35 0.45 2.5 89.5 100
1/13/2007 1.13 0.26 0.32 10.0 0.61 0.52 2.9 92.4 103
2/4/2007 1.01 0.26 0.31 10.0 0.52 0.49 2.7 95.1 105
2/10/2007 1.65 0.25 0.32 10.0 0.70 0.95 5.3 100.4 111
2/20/2007 0.80 0.26 0.30 10.0 0.35 0.45 2.5 102.9 113
3/2/2007 1.64 0.25 0.32 12.7 1.01 0.63 3.5 106.4 117
3/10/2007 1.43 0.25 0.29 17.8 0.62 0.81 4.5 110.9 121
3/14/2007 1.29 0.26 0.30 22.9 0.80 0.49 2.7 113.7 124
3/19/2007 1.32 0.27 0.31 27.9 1.15 0.17 1.0 114.7 125
3/23/2007 1.53 0.27 0.30 30.5 0.80 0.73 4.1 118.7 129
3/27/2007 1.87 0.27 0.30 35.6 1.24 0.63 3.5 122.2 132
3/30/2007 1.35 0.28 0.31 38.1 1.50 0.00 0.0 122.2 132
4/4/2007 2.28 0.27 0.31 45.7 2.24 0.04 0.2 122.4 133
4/8/2007 0.99 0.27 0.29 45.7 1.12 0.00 0.0 122.4 133
4/11/2007 2.02 0.27 0.31 45.7 1.99 0.03 0.2 122.6 133
4/16/2007 2.54 0.27 0.31 45.7 2.25 0.29 1.6 124.2 134
4/23/2007 1.89 0.26 0.30 45.7 1.86 0.03 0.2 124.4 134
4/24/2007 1.35 0.30 0.32 45.7 1.14 0.21 1.2 125.6 136
4/26/2007 1.94 0.29 0.32 45.7 1.81 0.13 0.7 126.3 136
5/5/2007 3.22 0.25 0.31 45.7 3.09 0.13 0.7 127.1 137
5/11/2007 1.31 0.27 0.30 45.7 1.19 0.12 0.7 127.7 138
5/14/2007 1.49 0.26 0.29 45.7 1.19 0.30 1.7 129.4 139
5/21/2007 2.70 0.25 0.30 45.7 2.39 0.31 1.7 131.1 141
5/24/2007 0.30 0.27 0.30 45.7 1.25 0.00 0.0 131.1 141
5/25/2007 2.05 0.28 0.31 45.7 1.59 0.46 2.5 133.7 144
5/31/2007 2.02 0.25 0.30 45.7 1.99 0.03 0.2 133.8 144
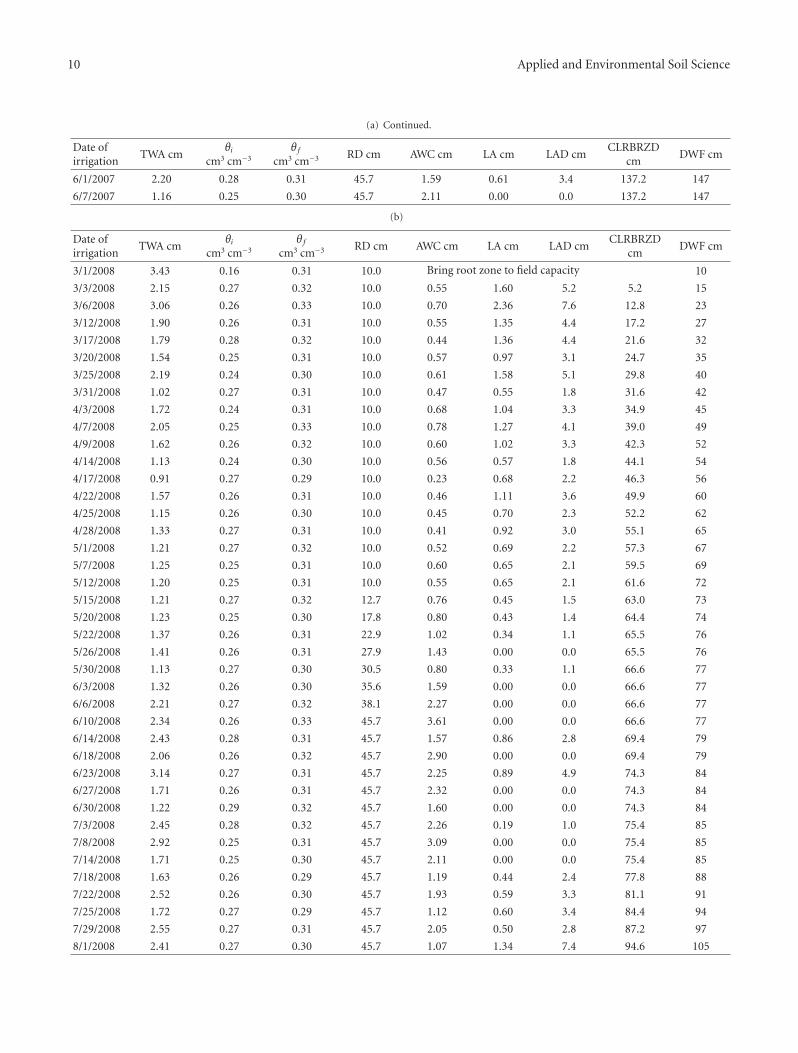
10 Applied and Environmental Soil Science
(a) Continued.
Date ofirrigation
TWA cmθi
cm3 cm−3θ f
cm3 cm−3 RD cm AWC cm LA cm LAD cmCLRBRZD
cmDWF cm
6/1/2007 2.20 0.28 0.31 45.7 1.59 0.61 3.4 137.2 147
6/7/2007 1.16 0.25 0.30 45.7 2.11 0.00 0.0 137.2 147
(b)
Date ofirrigation
TWA cmθi
cm3 cm−3θ f
cm3 cm−3 RD cm AWC cm LA cm LAD cmCLRBRZD
cmDWF cm
3/1/2008 3.43 0.16 0.31 10.0 Bring root zone to field capacity 10
3/3/2008 2.15 0.27 0.32 10.0 0.55 1.60 5.2 5.2 15
3/6/2008 3.06 0.26 0.33 10.0 0.70 2.36 7.6 12.8 23
3/12/2008 1.90 0.26 0.31 10.0 0.55 1.35 4.4 17.2 27
3/17/2008 1.79 0.28 0.32 10.0 0.44 1.36 4.4 21.6 32
3/20/2008 1.54 0.25 0.31 10.0 0.57 0.97 3.1 24.7 35
3/25/2008 2.19 0.24 0.30 10.0 0.61 1.58 5.1 29.8 40
3/31/2008 1.02 0.27 0.31 10.0 0.47 0.55 1.8 31.6 42
4/3/2008 1.72 0.24 0.31 10.0 0.68 1.04 3.3 34.9 45
4/7/2008 2.05 0.25 0.33 10.0 0.78 1.27 4.1 39.0 49
4/9/2008 1.62 0.26 0.32 10.0 0.60 1.02 3.3 42.3 52
4/14/2008 1.13 0.24 0.30 10.0 0.56 0.57 1.8 44.1 54
4/17/2008 0.91 0.27 0.29 10.0 0.23 0.68 2.2 46.3 56
4/22/2008 1.57 0.26 0.31 10.0 0.46 1.11 3.6 49.9 60
4/25/2008 1.15 0.26 0.30 10.0 0.45 0.70 2.3 52.2 62
4/28/2008 1.33 0.27 0.31 10.0 0.41 0.92 3.0 55.1 65
5/1/2008 1.21 0.27 0.32 10.0 0.52 0.69 2.2 57.3 67
5/7/2008 1.25 0.25 0.31 10.0 0.60 0.65 2.1 59.5 69
5/12/2008 1.20 0.25 0.31 10.0 0.55 0.65 2.1 61.6 72
5/15/2008 1.21 0.27 0.32 12.7 0.76 0.45 1.5 63.0 73
5/20/2008 1.23 0.25 0.30 17.8 0.80 0.43 1.4 64.4 74
5/22/2008 1.37 0.26 0.31 22.9 1.02 0.34 1.1 65.5 76
5/26/2008 1.41 0.26 0.31 27.9 1.43 0.00 0.0 65.5 76
5/30/2008 1.13 0.27 0.30 30.5 0.80 0.33 1.1 66.6 77
6/3/2008 1.32 0.26 0.30 35.6 1.59 0.00 0.0 66.6 77
6/6/2008 2.21 0.27 0.32 38.1 2.27 0.00 0.0 66.6 77
6/10/2008 2.34 0.26 0.33 45.7 3.61 0.00 0.0 66.6 77
6/14/2008 2.43 0.28 0.31 45.7 1.57 0.86 2.8 69.4 79
6/18/2008 2.06 0.26 0.32 45.7 2.90 0.00 0.0 69.4 79
6/23/2008 3.14 0.27 0.31 45.7 2.25 0.89 4.9 74.3 84
6/27/2008 1.71 0.26 0.31 45.7 2.32 0.00 0.0 74.3 84
6/30/2008 1.22 0.29 0.32 45.7 1.60 0.00 0.0 74.3 84
7/3/2008 2.45 0.28 0.32 45.7 2.26 0.19 1.0 75.4 85
7/8/2008 2.92 0.25 0.31 45.7 3.09 0.00 0.0 75.4 85
7/14/2008 1.71 0.25 0.30 45.7 2.11 0.00 0.0 75.4 85
7/18/2008 1.63 0.26 0.29 45.7 1.19 0.44 2.4 77.8 88
7/22/2008 2.52 0.26 0.30 45.7 1.93 0.59 3.3 81.1 91
7/25/2008 1.72 0.27 0.29 45.7 1.12 0.60 3.4 84.4 94
7/29/2008 2.55 0.27 0.31 45.7 2.05 0.50 2.8 87.2 97
8/1/2008 2.41 0.27 0.30 45.7 1.07 1.34 7.4 94.6 105
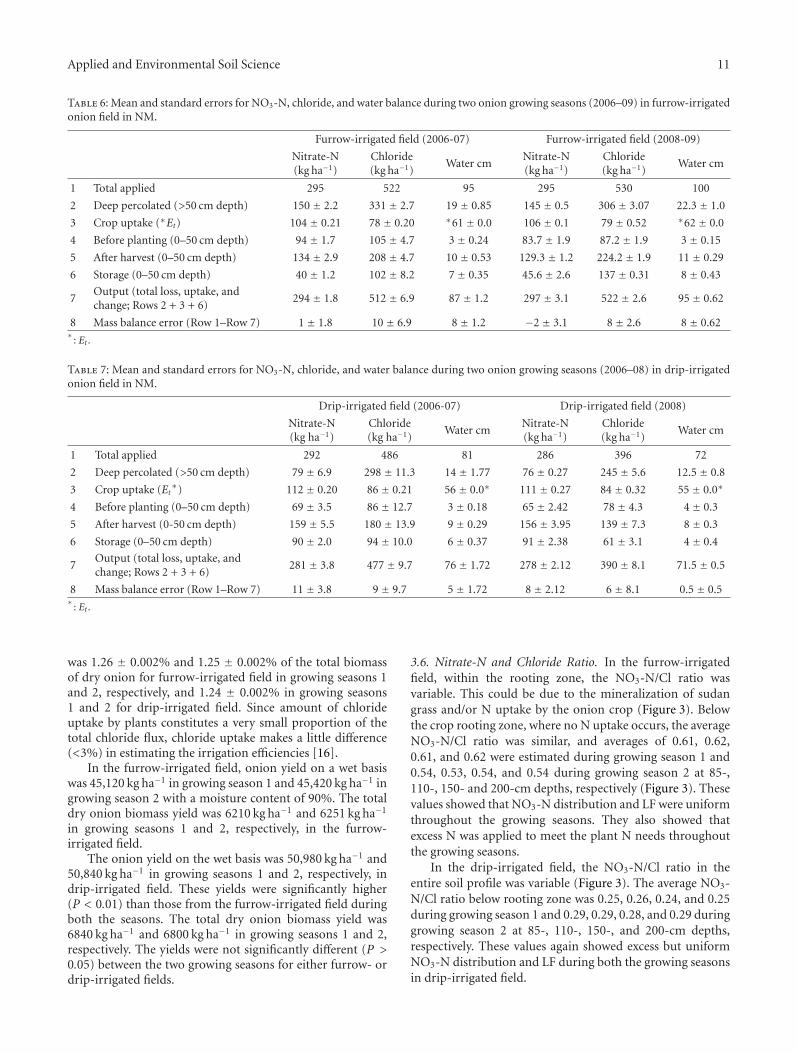
Applied and Environmental Soil Science 11
Table 6: Mean and standard errors for NO3-N, chloride, and water balance during two onion growing seasons (2006–09) in furrow-irrigatedonion field in NM.
Furrow-irrigated field (2006-07) Furrow-irrigated field (2008-09)
Nitrate-N(kg ha−1)
Chloride(kg ha−1)
Water cmNitrate-N(kg ha−1)
Chloride(kg ha−1)
Water cm
1 Total applied 295 522 95 295 530 100
2 Deep percolated (>50 cm depth) 150 ± 2.2 331 ± 2.7 19 ± 0.85 145 ± 0.5 306 ± 3.07 22.3 ± 1.0
3 Crop uptake (∗Et) 104 ± 0.21 78 ± 0.20 ∗61 ± 0.0 106 ± 0.1 79 ± 0.52 ∗62 ± 0.0
4 Before planting (0–50 cm depth) 94 ± 1.7 105 ± 4.7 3 ± 0.24 83.7 ± 1.9 87.2 ± 1.9 3 ± 0.15
5 After harvest (0–50 cm depth) 134 ± 2.9 208 ± 4.7 10 ± 0.53 129.3 ± 1.2 224.2 ± 1.9 11 ± 0.29
6 Storage (0–50 cm depth) 40 ± 1.2 102 ± 8.2 7 ± 0.35 45.6 ± 2.6 137 ± 0.31 8 ± 0.43
7Output (total loss, uptake, andchange; Rows 2 + 3 + 6)
294 ± 1.8 512 ± 6.9 87 ± 1.2 297 ± 3.1 522 ± 2.6 95 ± 0.62
8 Mass balance error (Row 1–Row 7) 1 ± 1.8 10 ± 6.9 8 ± 1.2 −2 ± 3.1 8 ± 2.6 8 ± 0.62∗
: Et .
Table 7: Mean and standard errors for NO3-N, chloride, and water balance during two onion growing seasons (2006–08) in drip-irrigatedonion field in NM.
Drip-irrigated field (2006-07) Drip-irrigated field (2008)
Nitrate-N(kg ha−1)
Chloride(kg ha−1)
Water cmNitrate-N(kg ha−1)
Chloride(kg ha−1)
Water cm
1 Total applied 292 486 81 286 396 72
2 Deep percolated (>50 cm depth) 79 ± 6.9 298 ± 11.3 14 ± 1.77 76 ± 0.27 245 ± 5.6 12.5 ± 0.8
3 Crop uptake (Et∗) 112 ± 0.20 86 ± 0.21 56 ± 0.0∗ 111 ± 0.27 84 ± 0.32 55 ± 0.0∗
4 Before planting (0–50 cm depth) 69 ± 3.5 86 ± 12.7 3 ± 0.18 65 ± 2.42 78 ± 4.3 4 ± 0.3
5 After harvest (0-50 cm depth) 159 ± 5.5 180 ± 13.9 9 ± 0.29 156 ± 3.95 139 ± 7.3 8 ± 0.3
6 Storage (0–50 cm depth) 90 ± 2.0 94 ± 10.0 6 ± 0.37 91 ± 2.38 61 ± 3.1 4 ± 0.4
7Output (total loss, uptake, andchange; Rows 2 + 3 + 6)
281 ± 3.8 477 ± 9.7 76 ± 1.72 278 ± 2.12 390 ± 8.1 71.5 ± 0.5
8 Mass balance error (Row 1–Row 7) 11 ± 3.8 9 ± 9.7 5 ± 1.72 8 ± 2.12 6 ± 8.1 0.5 ± 0.5∗
: Et .
was 1.26 ± 0.002% and 1.25 ± 0.002% of the total biomassof dry onion for furrow-irrigated field in growing seasons 1and 2, respectively, and 1.24 ± 0.002% in growing seasons1 and 2 for drip-irrigated field. Since amount of chlorideuptake by plants constitutes a very small proportion of thetotal chloride flux, chloride uptake makes a little difference(<3%) in estimating the irrigation efficiencies [16].
In the furrow-irrigated field, onion yield on a wet basiswas 45,120 kg ha−1 in growing season 1 and 45,420 kg ha−1 ingrowing season 2 with a moisture content of 90%. The totaldry onion biomass yield was 6210 kg ha−1 and 6251 kg ha−1
in growing seasons 1 and 2, respectively, in the furrow-irrigated field.
The onion yield on the wet basis was 50,980 kg ha−1 and50,840 kg ha−1 in growing seasons 1 and 2, respectively, indrip-irrigated field. These yields were significantly higher(P < 0.01) than those from the furrow-irrigated field duringboth the seasons. The total dry onion biomass yield was6840 kg ha−1 and 6800 kg ha−1 in growing seasons 1 and 2,respectively. The yields were not significantly different (P >0.05) between the two growing seasons for either furrow- ordrip-irrigated fields.
3.6. Nitrate-N and Chloride Ratio. In the furrow-irrigatedfield, within the rooting zone, the NO3-N/Cl ratio wasvariable. This could be due to the mineralization of sudangrass and/or N uptake by the onion crop (Figure 3). Belowthe crop rooting zone, where no N uptake occurs, the averageNO3-N/Cl ratio was similar, and averages of 0.61, 0.62,0.61, and 0.62 were estimated during growing season 1 and0.54, 0.53, 0.54, and 0.54 during growing season 2 at 85-,110-, 150- and 200-cm depths, respectively (Figure 3). Thesevalues showed that NO3-N distribution and LF were uniformthroughout the growing seasons. They also showed thatexcess N was applied to meet the plant N needs throughoutthe growing seasons.
In the drip-irrigated field, the NO3-N/Cl ratio in theentire soil profile was variable (Figure 3). The average NO3-N/Cl ratio below rooting zone was 0.25, 0.26, 0.24, and 0.25during growing season 1 and 0.29, 0.29, 0.28, and 0.29 duringgrowing season 2 at 85-, 110-, 150-, and 200-cm depths,respectively. These values again showed excess but uniformNO3-N distribution and LF during both the growing seasonsin drip-irrigated field.
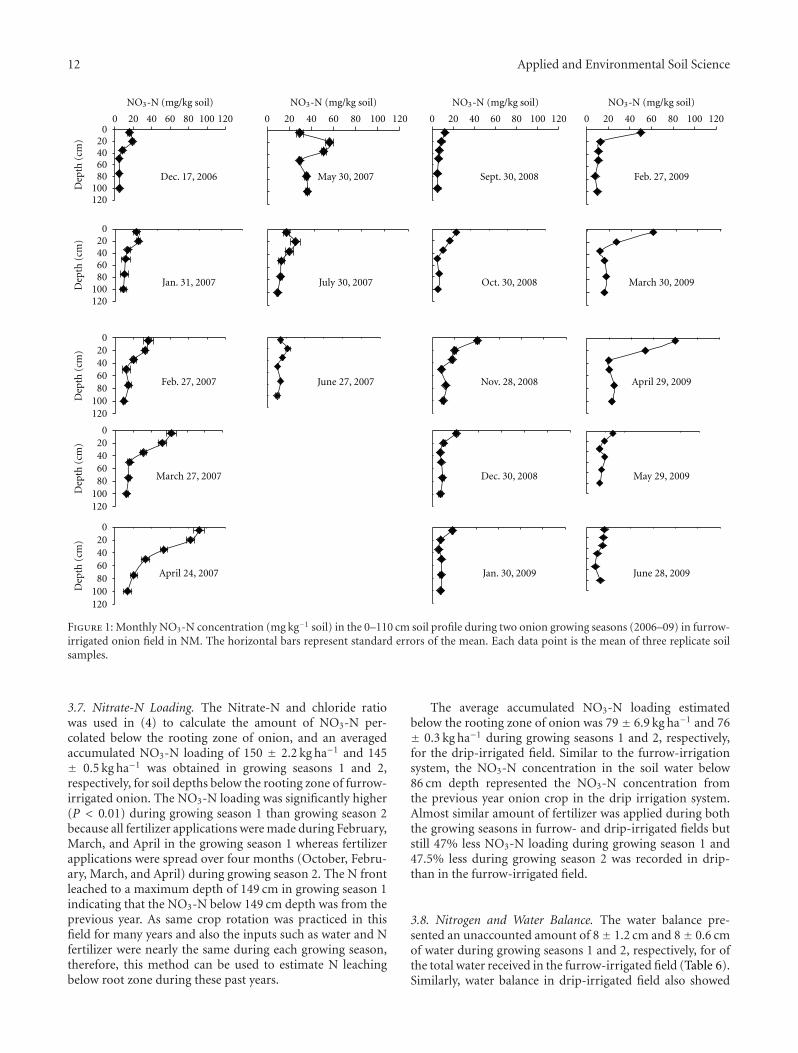
12 Applied and Environmental Soil Science
Oct. 30, 2008
Nov. 28, 2008
Dec. 30, 2008
Jan. 30, 2009
March 30, 2009
April 29, 2009
May 29, 2009
June 28, 2009
Sept. 30, 2008
NO3-N (mg/kg soil)
0 20 40 60 80 100 120
Feb. 27, 2009
NO3-N (mg/kg soil)
0 20 40 60 80 100 120
July 30, 2007
Dep
th (
cm)
Feb. 27, 2007
020406080
100120
April 24, 2007
Dep
th (
cm)
020406080
100120
June 27, 2007
March 27, 2007
Dep
th (
cm)
020406080
100120
Dep
th (
cm)
020406080
100120
Jan. 31, 2007
May 30, 2007
0 20 40 60 80 100 120
NO3-N (mg/kg soil)
Dep
th (
cm)
020406080
100Dec. 17, 2006
0 20 40 60 80 100 120
120
NO3-N (mg/kg soil)
Figure 1: Monthly NO3-N concentration (mg kg−1 soil) in the 0–110 cm soil profile during two onion growing seasons (2006–09) in furrow-irrigated onion field in NM. The horizontal bars represent standard errors of the mean. Each data point is the mean of three replicate soilsamples.
3.7. Nitrate-N Loading. The Nitrate-N and chloride ratiowas used in (4) to calculate the amount of NO3-N per-colated below the rooting zone of onion, and an averagedaccumulated NO3-N loading of 150 ± 2.2 kg ha−1 and 145± 0.5 kg ha−1 was obtained in growing seasons 1 and 2,respectively, for soil depths below the rooting zone of furrow-irrigated onion. The NO3-N loading was significantly higher(P < 0.01) during growing season 1 than growing season 2because all fertilizer applications were made during February,March, and April in the growing season 1 whereas fertilizerapplications were spread over four months (October, Febru-ary, March, and April) during growing season 2. The N frontleached to a maximum depth of 149 cm in growing season 1indicating that the NO3-N below 149 cm depth was from theprevious year. As same crop rotation was practiced in thisfield for many years and also the inputs such as water and Nfertilizer were nearly the same during each growing season,therefore, this method can be used to estimate N leachingbelow root zone during these past years.
The average accumulated NO3-N loading estimatedbelow the rooting zone of onion was 79 ± 6.9 kg ha−1 and 76± 0.3 kg ha−1 during growing seasons 1 and 2, respectively,for the drip-irrigated field. Similar to the furrow-irrigationsystem, the NO3-N concentration in the soil water below86 cm depth represented the NO3-N concentration fromthe previous year onion crop in the drip irrigation system.Almost similar amount of fertilizer was applied during boththe growing seasons in furrow- and drip-irrigated fields butstill 47% less NO3-N loading during growing season 1 and47.5% less during growing season 2 was recorded in drip-than in the furrow-irrigated field.
3.8. Nitrogen and Water Balance. The water balance pre-sented an unaccounted amount of 8± 1.2 cm and 8± 0.6 cmof water during growing seasons 1 and 2, respectively, for ofthe total water received in the furrow-irrigated field (Table 6).Similarly, water balance in drip-irrigated field also showed
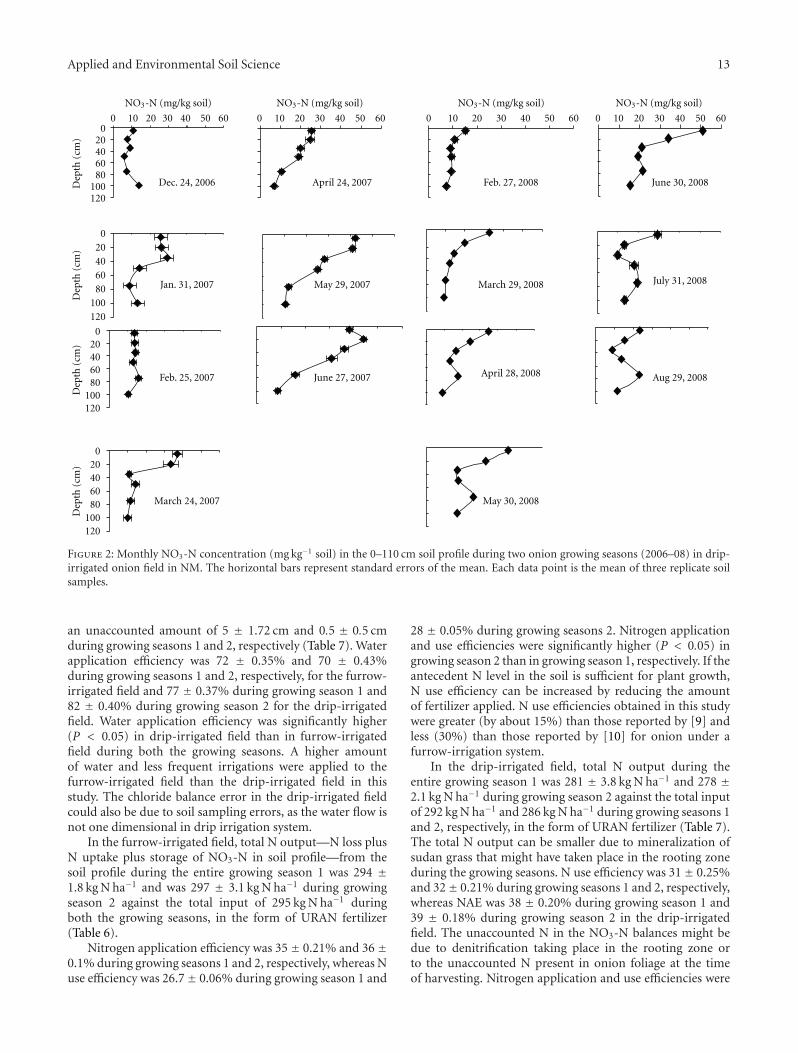
Applied and Environmental Soil Science 13
May 29, 2007
June 27, 2007
March 29, 2008
April 28, 2008
July 31, 2008
May 30, 2008
Aug 29, 2008
0 10 20 30 40 50 60
Dec. 24, 2006
NO3-N (mg/kg soil)
Dep
th (
cm)
020406080
100120
Feb. 27, 2008
NO3-N (mg/kg soil)
0 10 20 30 40 50 60
June 30, 2008
NO3-N (mg/kg soil)
0 10 20 30 40 50 60
Dep
th (
cm)
020406080
100120
Jan. 31, 2007
April 24, 2007
NO3-N (mg/kg soil)
0 10 20 30 40 50 60
Feb. 25, 2007
Dep
th (
cm)
020406080
100120
March 24, 2007
Dep
th (
cm)
020406080
100120
Figure 2: Monthly NO3-N concentration (mg kg−1 soil) in the 0–110 cm soil profile during two onion growing seasons (2006–08) in drip-irrigated onion field in NM. The horizontal bars represent standard errors of the mean. Each data point is the mean of three replicate soilsamples.
an unaccounted amount of 5 ± 1.72 cm and 0.5 ± 0.5 cmduring growing seasons 1 and 2, respectively (Table 7). Waterapplication efficiency was 72 ± 0.35% and 70 ± 0.43%during growing seasons 1 and 2, respectively, for the furrow-irrigated field and 77 ± 0.37% during growing season 1 and82 ± 0.40% during growing season 2 for the drip-irrigatedfield. Water application efficiency was significantly higher(P < 0.05) in drip-irrigated field than in furrow-irrigatedfield during both the growing seasons. A higher amountof water and less frequent irrigations were applied to thefurrow-irrigated field than the drip-irrigated field in thisstudy. The chloride balance error in the drip-irrigated fieldcould also be due to soil sampling errors, as the water flow isnot one dimensional in drip irrigation system.
In the furrow-irrigated field, total N output—N loss plusN uptake plus storage of NO3-N in soil profile—from thesoil profile during the entire growing season 1 was 294 ±1.8 kg N ha−1 and was 297 ± 3.1 kg N ha−1 during growingseason 2 against the total input of 295 kg N ha−1 duringboth the growing seasons, in the form of URAN fertilizer(Table 6).
Nitrogen application efficiency was 35± 0.21% and 36±0.1% during growing seasons 1 and 2, respectively, whereas Nuse efficiency was 26.7± 0.06% during growing season 1 and
28 ± 0.05% during growing seasons 2. Nitrogen applicationand use efficiencies were significantly higher (P < 0.05) ingrowing season 2 than in growing season 1, respectively. If theantecedent N level in the soil is sufficient for plant growth,N use efficiency can be increased by reducing the amountof fertilizer applied. N use efficiencies obtained in this studywere greater (by about 15%) than those reported by [9] andless (30%) than those reported by [10] for onion under afurrow-irrigation system.
In the drip-irrigated field, total N output during theentire growing season 1 was 281 ± 3.8 kg N ha−1 and 278 ±2.1 kg N ha−1 during growing season 2 against the total inputof 292 kg N ha−1 and 286 kg N ha−1 during growing seasons 1and 2, respectively, in the form of URAN fertilizer (Table 7).The total N output can be smaller due to mineralization ofsudan grass that might have taken place in the rooting zoneduring the growing seasons. N use efficiency was 31 ± 0.25%and 32± 0.21% during growing seasons 1 and 2, respectively,whereas NAE was 38 ± 0.20% during growing season 1 and39 ± 0.18% during growing season 2 in the drip-irrigatedfield. The unaccounted N in the NO3-N balances might bedue to denitrification taking place in the rooting zone orto the unaccounted N present in onion foliage at the timeof harvesting. Nitrogen application and use efficiencies were
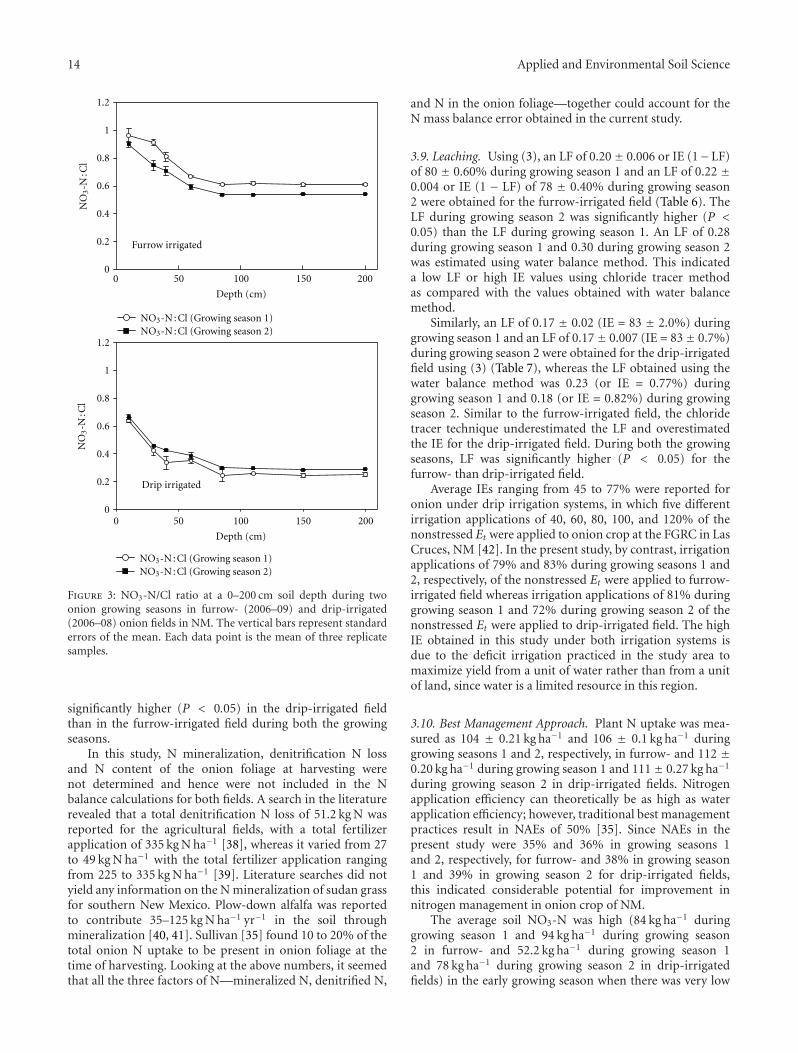
14 Applied and Environmental Soil Science
Furrow irrigated
1.2
1
0.8
0.6
0.4
0.2
0
Drip irrigated
0 50 100 150 200
Depth (cm)
0 50 100 150 200
Depth (cm)
1.2
1
0.8
0.6
0.4
0.2
0
NO3-N : Cl (Growing season 1)NO3-N : Cl (Growing season 2)
NO
3-N
: Cl
NO
3-N
: Cl
NO3-N : Cl (Growing season 1)NO3-N : Cl (Growing season 2)
Figure 3: NO3-N/Cl ratio at a 0–200 cm soil depth during twoonion growing seasons in furrow- (2006–09) and drip-irrigated(2006–08) onion fields in NM. The vertical bars represent standarderrors of the mean. Each data point is the mean of three replicatesamples.
significantly higher (P < 0.05) in the drip-irrigated fieldthan in the furrow-irrigated field during both the growingseasons.
In this study, N mineralization, denitrification N lossand N content of the onion foliage at harvesting werenot determined and hence were not included in the Nbalance calculations for both fields. A search in the literaturerevealed that a total denitrification N loss of 51.2 kg N wasreported for the agricultural fields, with a total fertilizerapplication of 335 kg N ha−1 [38], whereas it varied from 27to 49 kg N ha−1 with the total fertilizer application rangingfrom 225 to 335 kg N ha−1 [39]. Literature searches did notyield any information on the N mineralization of sudan grassfor southern New Mexico. Plow-down alfalfa was reportedto contribute 35–125 kg N ha−1 yr−1 in the soil throughmineralization [40, 41]. Sullivan [35] found 10 to 20% of thetotal onion N uptake to be present in onion foliage at thetime of harvesting. Looking at the above numbers, it seemedthat all the three factors of N—mineralized N, denitrified N,
and N in the onion foliage—together could account for theN mass balance error obtained in the current study.
3.9. Leaching. Using (3), an LF of 0.20± 0.006 or IE (1−LF)of 80 ± 0.60% during growing season 1 and an LF of 0.22 ±0.004 or IE (1 − LF) of 78 ± 0.40% during growing season2 were obtained for the furrow-irrigated field (Table 6). TheLF during growing season 2 was significantly higher (P <0.05) than the LF during growing season 1. An LF of 0.28during growing season 1 and 0.30 during growing season 2was estimated using water balance method. This indicateda low LF or high IE values using chloride tracer methodas compared with the values obtained with water balancemethod.
Similarly, an LF of 0.17 ± 0.02 (IE = 83 ± 2.0%) duringgrowing season 1 and an LF of 0.17± 0.007 (IE = 83± 0.7%)during growing season 2 were obtained for the drip-irrigatedfield using (3) (Table 7), whereas the LF obtained using thewater balance method was 0.23 (or IE = 0.77%) duringgrowing season 1 and 0.18 (or IE = 0.82%) during growingseason 2. Similar to the furrow-irrigated field, the chloridetracer technique underestimated the LF and overestimatedthe IE for the drip-irrigated field. During both the growingseasons, LF was significantly higher (P < 0.05) for thefurrow- than drip-irrigated field.
Average IEs ranging from 45 to 77% were reported foronion under drip irrigation systems, in which five differentirrigation applications of 40, 60, 80, 100, and 120% of thenonstressed Et were applied to onion crop at the FGRC in LasCruces, NM [42]. In the present study, by contrast, irrigationapplications of 79% and 83% during growing seasons 1 and2, respectively, of the nonstressed Et were applied to furrow-irrigated field whereas irrigation applications of 81% duringgrowing season 1 and 72% during growing season 2 of thenonstressed Et were applied to drip-irrigated field. The highIE obtained in this study under both irrigation systems isdue to the deficit irrigation practiced in the study area tomaximize yield from a unit of water rather than from a unitof land, since water is a limited resource in this region.
3.10. Best Management Approach. Plant N uptake was mea-sured as 104 ± 0.21 kg ha−1 and 106 ± 0.1 kg ha−1 duringgrowing seasons 1 and 2, respectively, in furrow- and 112 ±0.20 kg ha−1 during growing season 1 and 111 ± 0.27 kg ha−1
during growing season 2 in drip-irrigated fields. Nitrogenapplication efficiency can theoretically be as high as waterapplication efficiency; however, traditional best managementpractices result in NAEs of 50% [35]. Since NAEs in thepresent study were 35% and 36% in growing seasons 1and 2, respectively, for furrow- and 38% in growing season1 and 39% in growing season 2 for drip-irrigated fields,this indicated considerable potential for improvement innitrogen management in onion crop of NM.
The average soil NO3-N was high (84 kg ha−1 duringgrowing season 1 and 94 kg ha−1 during growing season2 in furrow- and 52.2 kg ha−1 during growing season 1and 78 kg ha−1 during growing season 2 in drip-irrigatedfields) in the early growing season when there was very low
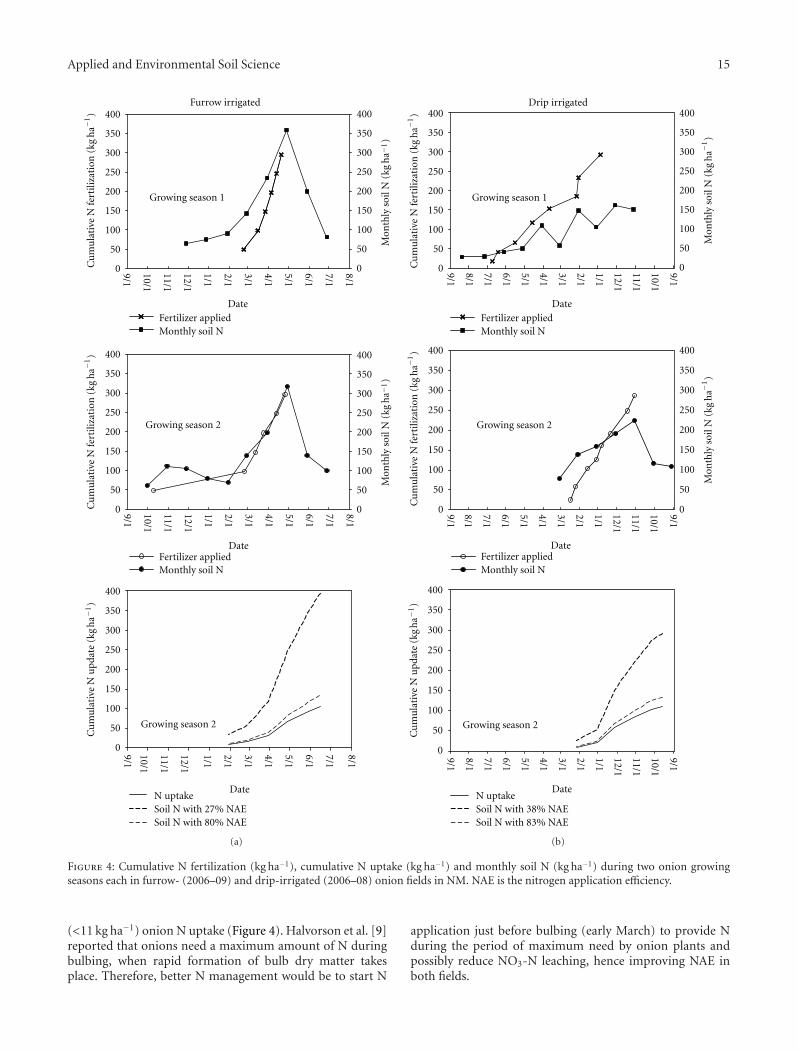
Applied and Environmental Soil Science 15
Furrow irrigated
Fertilizer appliedMonthly soil N
Growing season 1
Growing season 2
400
350
300
250
200
150
100
50
0
9/1
10/1
11/1
12/1
1/1
2/1
3/1
4/1
5/1
6/1
7/1
8/1
N uptakeSoil N with 27% NAESoil N with 80% NAE
400
350
300
250
200
150
100
50
0
400
350
300
250
200
150
100
50
0
Cu
mu
lati
ve N
fert
iliza
tion
(kg
ha−
1)
Cu
mu
lati
ve N
fert
iliza
tion
(kg
ha−
1)
Fertilizer appliedMonthly soil N
Growing season 2
400
350
300
250
200
150
100
50
0
400
350
300
250
200
150
100
50
0
Cu
mu
lati
ve N
upd
ate
(kg
ha−
1)
Mon
thly
soi
l N (
kg h
a−1)
Mon
thly
soi
l N (
kg h
a−1)
9/1
10/1
11/1
12/1
1/1
2/1
3/1
4/1
5/1
6/1
7/1
8/1
Date
9/1
10/1
11/1
12/1
1/1
2/1
3/1
4/1
5/1
6/1
7/1
8/1
Date
Date
(a)
Drip irrigated
N uptakeSoil N with 38% NAESoil N with 83% NAE
Fertilizer appliedMonthly soil N
Fertilizer appliedMonthly soil N
Growing season 2
Growing season 2
Growing season 1
Mon
thly
soi
l N (
kg h
a−1)
Mon
thly
soi
l N (
kg h
a−1)
400
350
300
250
200
150
100
50
0
400
350
300
250
200
150
100
50
0
400
350
300
250
200
150
100
50
0
400
350
300
250
200
150
100
50
0
400
350
300
250
200
150
100
50
0
Cu
mu
lati
ve N
fert
iliza
tion
(kg
ha−
1)
Cu
mu
lati
ve N
fert
iliza
tion
(kg
ha−
1)
Cu
mu
lati
ve N
upd
ate
(kg
ha−
1)
Date
9/1
10/1
11/1
12/1
1/1
2/1
3/1
4/1
5/1
6/1
7/1
8/1
9/1
Date
9/1
10/1
11/1
12/1
1/1
2/1
3/1
4/1
5/1
6/1
7/1
8/1
9/1
9/1
10/1
11/1
12/1
1/1
2/1
3/1
4/1
5/1
6/1
7/1
8/1
9/1
Date
(b)
Figure 4: Cumulative N fertilization (kg ha−1), cumulative N uptake (kg ha−1) and monthly soil N (kg ha−1) during two onion growingseasons each in furrow- (2006–09) and drip-irrigated (2006–08) onion fields in NM. NAE is the nitrogen application efficiency.
(<11 kg ha−1) onion N uptake (Figure 4). Halvorson et al. [9]reported that onions need a maximum amount of N duringbulbing, when rapid formation of bulb dry matter takesplace. Therefore, better N management would be to start N
application just before bulbing (early March) to provide Nduring the period of maximum need by onion plants andpossibly reduce NO3-N leaching, hence improving NAE inboth fields.
16 Applied and Environmental Soil Science
In the furrow-irrigated field, soil NO3-N was 235 kg ha−1
and 197 kg ha−1 during March and it increased to 359 kgha−1 and 317 kg ha−1 during April in growing seasons 1 and2, respectively, as fertilizer applications were made duringMarch and April (Figure 4). Most of the excess soil NO3-Nprobably leached with irrigation, as the soil NO3-N duringMay decreased compared to soil NO3-N during April. As thetotal onion N uptake was 104 kg ha−1 and 106 kg ha−1 duringthe entire growing seasons 1 and 2, respectively, therefore,a soil N of 150 kg ha−1 is sufficient throughout the growingseason starting from March. This soil NO3-N concentrationcan be maintained by reducing the amount of N to halfduring March and April, with a total N fertilizer applicationof 196 kg ha−1 through the entire growing season.
A single application of N before March might besufficient for onion plants in drip-irrigated field, and Napplications during December, January, and February duringgrowing season 1 could be skipped for better N management(Figure 4). Most of the N fertilizer applied before Marchprobably leached with irrigation water, as onion roots wereonly 10 to 15 cm deep until March. Curtailing excess fertilizerapplications before March would reduce the total fertilizerapplication from 292 to 190 kg ha−1 during growing season1. Similarly, by reducing the current N fertilizer appliedduring March, April, and June during the growing season2 to half would reduce the total fertilizer application from286 to 175 kg ha−1. These results also showed that regular soilsampling is important to monitoring soil NO3-N throughoutthe growing season.
The limitation of this study, in the drip-irrigated field,could be the difference in the planting dates of onion.However, this is a common practice in this area wherefarmers grow onion during fall followed by spring onion.Despite of this limitation, this study provided a detailedsketch of NO3-N leaching and discussed the improvementsthat can be made to reduce the NO3-N leaching in thefarmers’ fields of New Mexico.
4. Conclusions
Greater N concentrations were found in the onion croprooting zone than below the rooting zone depth in boththe furrow- and drip-irrigated onion in NM. The averageNO3-N loading flux below the rooting zone was 150 ±2.2 kg ha−1 and 145 ± 0.5 kg ha−1 during growing seasons 1and 2, respectively, at an average volumetric water contentof 0.19 cm3 cm−3 in furrow-irrigated field. Similarly, averageNO3-N loading flux below the rooting zone of drip-irrigated field was 79 ± 6.9 kg ha−1 and 76 ± 0.3 kg ha−1
during growing seasons 1 and 2, respectively, at an averagevolumetric water content of 0.32 cm3 cm−3. The ratio ofNO3-N and Cl decreased with increasing soil depth and wassimilar below the onion rooting zone (50–200 cm) in thefurrow- and drip-irrigated fields. A leaching fraction of 0.20± 0.006 and 0.22 ± 0.004 during growing seasons 1 and2, respectively, was obtained for the furrow-irrigated fieldand 0.17 ± 0.02 during growing season 1 and 0.17 ± 0.007during growing season 2 for the drip-irrigated field using the
chloride tracer technique. Therefore, irrigation efficiencies(1 − LF) under both systems were high: 80 ± 0.6% and 78± 0.004% during growing seasons 1 and 2, respectively, forthe furrow-irrigated field and 83 ± 2.0% during growingseason 1 and 83± 0.7% during growing season 2 for the drip-irrigated field. The chloride tracer technique underestimatedthe leaching fractions and, therefore, overestimated the IEsfor both irrigation systems compared to the water-balancemethod. Nitrogen application and use efficiencies were lowin both fields because of high levels of available N inthe root zone due to application of excess N fertilizercompared with the total amount of N taken up by the onionplants. Reducing N application rates by half and delaying Napplications until onion bulbing (early March) starts mayimprove N application and use efficiencies and potentiallyreduce the N loading in deeper soil layers. More frequentand smaller amounts of water and fertilizer applications canincrease retention and reduce the leaching depth of water andfertilizer.
Acknowledgment
The authors thank the Agricultural Experimental Station ofNew Mexico State University for funding the project.
References
[1] F. E. Allison, “The fate of nitrogen applied to soils,” Advancesin Agronomy, vol. 18, pp. 219–258, 1966.
[2] G. A. Peterson and J. F. Power, “Soil, crop, and water man-agement,” in Managing nitrogen for groundwater quality andfarm profitability, R. F. Follett, Ed., pp. 189–198, Soil ScienceSociety of America, Madison, Wis, USA, 1991.
[3] M. S. Al-Jamal, T. W. Sammis, and T. Jones, “Nitrogenand chloride concentration in deep soil cores related to fer-tilization,” Agricultural Water Management, vol. 34, no. 1, pp.1–16, 1997.
[4] P. Cepuder and M. K. Shukla, “Groundwater nitrate in Austria:a case study inTullnerfeld,” Nutrient Cycling in Agroecosystems,vol. 64, no. 3, pp. 301–315, 2002.
[5] “Diagnosis and Improvement of saline and alkali soils,”in Handbook No. 60, L. A. Richards, Ed., United StatesDepartment of Agriculture, Washington, DC, USA, 1954.
[6] W. Stites and G. J. Kraft, “Nitrate and chloride loading togroundwater from an irrigated north-central U.S. sand-plainvegetable field,” Journal of Environmental Quality, vol. 30, no.4, pp. 1176–1184, 2001.
[7] L. J. Lund, “Variations in nitrate and chloride concentrationsbelow selected agricultural fields,” Soil Science Society ofAmerica Journal, vol. 46, no. 5, pp. 1062–1066, 1982.
[8] L. Bergstrom and R. Johansson, “Leaching of nitrate frommonolith lysimeters of different types of agricultural soils,”Journal of Environmental Quality, vol. 20, no. 4, pp. 801–807,1991.
[9] A. D. Halvorson, R. F. Follett, M. E. Bartolo, and F. C.Schweissing, “Nitrogen fertilizer use efficiency of furrow-irrigated onion and corn,” Agronomy Journal, vol. 94, no. 3,pp. 442–449, 2002.
[10] T. W. Sammis, “Nutrient management of onions: a NewMexico perspective,” in Proceedings of the Western Nutrient
Applied and Environmental Soil Science 17
Management Conference, vol. 2, pp. 49–53, Salt Lake City,Utah, USA, March 1997.
[11] D. Romic, M. Romic, J. Borosic, and M. Poljak, “Mulchingdecreases nitrate leaching in bell pepper (Capsicum annuumL.) cultivation,” Agricultural Water Management, vol. 60, no.2, pp. 87–97, 2003.
[12] D. A. Bucks, L. J. Drie, and O. F. French, “Quality and fre-quency of trickle and furrow irrigation for efficient cabbageproduction,” Agronomy Journal, vol. 66, no. 1, pp. 53–56, 1974.
[13] C. D. Gustafson, “Drip irrigation-worldwide 1975, presentstatus and outlook for drip irrigation,” Survey Report ofUniversity of California, University of California, San Diego,Calif, USA, 1975.
[14] A. D. Halvorson, M. E. Bartolo, C. A. Reule, and A. Berrada,“Nitrogen effects on onion yield under drip and furrowirrigation,” Agronomy Journal, vol. 100, no. 4, pp. 1062–1069,2008.
[15] P. F. Pratt, L. J. Lund, and J. M. Rible, “An approach tomeasuring leaching of nitrate from freely drained irrigatedfields,” in Nitrogen Behavior in Field Soil, D. R. Nielsen and J.G. MacDonald, Eds., vol. 1, pp. 223–265, Academic Press, NewYork, NY, USA, 1978.
[16] Z. Samani, T. Sammis, R. Skaggs, N. Alkhatiri, and J. Deras,“Measuring on-farm irrigation efficiency with chloride tracingunder deficit irrigation,” Journal of Irrigation and DrainageEngineering, vol. 131, no. 6, pp. 555–559, 2005.
[17] D. P. Genereux, S. J. Wood, and C. M. Pringle, “Chemicaltracing of interbasin groundwater transfer in the lowlandrain-forest of Costa Rica,” Journal of Hydrology, vol. 258, no. 1–4,pp. 163–178, 2002.
[18] M. K. Shukla and P. Cepuder, “Anion exclusion during trans-port of chloride through soil columns,” Transactions of theAmerican Society of Agricultural Engineers, vol. 43, no. 6, pp.1425–1430, 2000.
[19] M. K. Shukla, T. R. Ellsworth, R. J. Hudson, and D. R. Nielsen,“Effect of water flux on solute velocity and dispersion,” SoilScience Society of America Journal, vol. 67, no. 2, pp. 449–457,2003.
[20] B. A. Stewart, “Critique of an approach to measuring leachingof nitrate from freely drained irrigated fields,” in NitrogenBehavior in Field Soil, D. R. Nielson and J. G. MacDonald, Eds.,vol. 1, pp. 267–273, Academic Press, New York, NY, USA, 1978.
[21] H. E. Bulloch and R. E. Neher, Soil Survey of Dona Ana CountyArea New Mexico, United States Department of Agriculture,Soil Conservation Service, 1980.
[22] L. H. Gile, J. W. Hawley, and R. B. Grossman, Soils and Ge-omorphology in the Basin and Range Area of Southern NewMexico—Guidebook to the Desert Project, New Mexico Bureauof Mines and Mineral Resources, New Mexico, NM, USA,1981.
[23] V. E. Hansen, O. W. Israelsen, and G. E. Stringgham, IrrigationPrinciples and Practices, John Wiley and Sons, New York, NY,USA, 1979.
[24] G. R. Blake and K. H. Hartge, “Bulk density,” in Methods of SoilAnalysis. Part 1, A. Klute, Ed., Agronomy Monograph, 9, pp.363–373, American Society of Agronomy, Soil Science Societyof America, Madision, Wis, USA, 2nd edition, 1986.
[25] A. Klute and C. Dirksen, “Hydraulic conductivity and dif-fusivity: laboratory methods,” in Methods of Soil Analysis.Part 1, A. Klute, Ed., Agronomy Monograph, 9, pp. 387–734, American Society of Agronomy, Soil Science Society ofAmerica, Madision, Wis, USA, 2nd edition, 1986.
[26] W. H. Gardner, “Water content,” in Methods of Soil Analysis.Part 1, A. Klute, Ed., Agronomy Monograph, 9, pp. 493–544, American Society of Agronomy, Soil Science Society ofAmerica, Madision, Wis, USA, 2nd edition, 1986.
[27] G. W. Gee and J. W. Bauder, “Particle size analysis,” in Methodsof Soil Analysis. Part 1, A. Klute, Ed., Agronomy Monograph,9, pp. 337–382, American Society of Agronomy, Soil ScienceSociety of America, Madision, Wis, USA, 2nd edition, 1986.
[28] D. G. Maynard and Y. P. Kalra, “Nitrate and exchangeableammonium nitrogen,” in Soil Sampling and Methods ofAnalysis, M. R. Carter, Ed., pp. 25–38, Canadian Society of SoilScience, Lewis Publishers, 1993.
[29] M. S. Al-Jamal, T. W. Sammis, S. Ball, and D. Smeal, “Yield-based, irrigated onion crop coefficients,” Applied Engineeringin Agriculture, vol. 15, no. 6, pp. 659–668, 1999.
[30] T. W. Sammis, C. L. Mapel, D. G. Lugg, R. R. Lansford, and J.T. McGuckin, “Evapotranspiration crop coefficients predictedusing growing-degree-days,” Transactions of the AmericanSociety of Agricultural Engineers, vol. 28, no. 3, pp. 773–780,1985.
[31] K. Thorup-Kristensen, “Root growth and nitrogen uptake ofcarrot, early cabbage, onion and lettuce following a range ofgreen manures,” Soil Use and Management, vol. 22, no. 1, pp.29–38, 2006.
[32] SAS Institute Incorporation, SAS 9.1 for Windows, Version9.1.3, Cary, NC, USA, 2002-2003.
[33] N. C. Brady and R. R. Weil, Elements of the Nature and Prop-erties of Soils, Person Education, Upper Saddle River, NJ, USA,2nd edition, 2004.
[34] Soil Improvement Committee and California Fertilizer Associ-ation, Western Fertilizer Handbook, The Interstate Printers andPublishers, Danville, Ill, USA, 6th edition, 1980.
[35] D. M. Sullivan, B. D. Brown, and C. C. Shock, NutrientManagement for Onions in the Pacific Northwest, PNW Exten-sion Bulletin, Washigton, DC, USA; Oregon State University,Corvallis, Ore, USA, 2001.
[36] United States Public Health Service, Drinking Water Standards,vol. 956, United States Public Health Service, 1962.
[37] J. Mikołajkow, “Laboratory methods of estimating the retar-dation factor of migrating mineral nitrogen compounds inshallow groundwater,” Geological Quarterly, vol. 47, no. 1, pp.91–96, 2003.
[38] J. C. Ryden, L. J. Lund, J. Letey, and D. D. Focht, “Directmeasurement of denitrification loss from soils: II. Develop-ment and application of field methods,” Soil Science Society ofAmerica Journal, vol. 43, pp. 110–118, 1979.
[39] N. Hofstra and A. F. Bouwman, “Denitrification in agricul-tural soils: summarizing published data and estimating globalannual rates,” Nutrient Cycling in Agroecosystems, vol. 72, no.3, pp. 267–278, 2005.
[40] T. W. Bruulsema and B. R. Christie, “Nitrogen contributionto succeeding corn from alfalfa and red clover,” AgronomyJournal, vol. 79, pp. 96–100, 1987.
[41] J. L. Gil and W. H. Fick, “Soil nitrogen mineralization inmixtures of eastern gamagrass with alfalfa and red clover,”Agronomy Journal, vol. 93, no. 4, pp. 902–910, 2001.
[42] M. S. Al-Jamal, S. Ball, and T. W. Sammis, “Comparison ofsprinkler, trickle and furrow irrigation efficiencies for onionproduction,” Agricultural Water Management, vol. 46, no. 3,pp. 253–266, 2001.
Hindawi Publishing CorporationApplied and Environmental Soil ScienceVolume 2012, Article ID 696174, 9 pagesdoi:10.1155/2012/696174
Review Article
Soil Health Management under Hill Agroecosystem ofNorth East India
R. Saha, R. S. Chaudhary, and J. Somasundaram
Indian Institute of Soil Science, Indian Council of Agricultural Research, Nabibagh, Berasia Road, Bhopal,Madhya Pradesh 462 038, India
Correspondence should be addressed to R. Saha, [email protected]
Received 2 December 2011; Revised 2 February 2012; Accepted 3 February 2012
Academic Editor: Marıa Cruz Dıaz Alvarez
Copyright © 2012 R. Saha et al. This is an open access article distributed under the Creative Commons Attribution License, whichpermits unrestricted use, distribution, and reproduction in any medium, provided the original work is properly cited.
The deterioration of soil quality/health is the combined result of soil fertility, biological degradation (decline of organic matter,biomass C, decrease in activity and diversity of soil fauna), increase in erodibility, acidity, and salinity, and exposure of compactsubsoil of poor physicochemical properties. Northeast India is characterized by high soil acidity/Al+3 toxicity, heavy soil, andcarbon loss, severe water scarcity during most parts of year though it is known as high rainfall area. The extent of soil and nutrienttransfer, causing environmental degradation in North eastern India, has been estimated to be about 601 million tones of soil, and685.8, 99.8, 511.1, 22.6, 14.0, 57.1, and 43.0 thousand tones of N, P, K, Mn, Zn, Ca, and Mg, respectively. Excessive deforestationcoupled with shifting cultivation practices have resulted in tremendous soil loss (200 t/ha/yr), poor soil physical health in thisregion. Studies on soil erodibility characteristics under various land use systems in Northeastern Hill (NEH) Region depicted thatshifting cultivation had the highest erosion ratio (12.46) and soil loss (30.2–170.2 t/ha/yr), followed by conventional agriculturesystem (10.42 and 5.10–68.20 t/ha/yr, resp.). The challenge before us is to maintain equilibrium between resources and their useto have a stable ecosystem. Agroforestry systems like agri-horti-silvi-pastoral system performed better over shifting cultivation interms of improvement in soil organic carbon; SOC (44.8%), mean weight diameter; MWD (29.4%), dispersion ratio (52.9%), soilloss (99.3%), soil erosion ratio (45.9%), and in-situ soil moisture conservation (20.6%) under the high rainfall, moderate to steepslopes, and shallow soil depth conditions. Multipurpose trees (MPTs) also played an important role on soil rejuvenation. Micheliaoblonga is reported to be a better choice as bioameliorant for these soils as continuous leaf litter and root exudates improvedsoil physical behaviour and SOC considerably. Considering the present level of resource degradation, some resource conservationtechniques like zero tillage/minimum tillage, hedge crop, mulching, cover crop need due attention for building up of organicmatter status for sustaining soil health.
1. Introduction
Soil degradation has raised some serious debate, and it is animportant issue in the modern era. It refers to the declinein soil’s inherent capacity to produce economic goods andperform ecologic functions. It is the net result of dynamic soildegradative and restorative processes regulated by naturaland anthropogenic factors. The degree of soil degradationdepends on soil’s susceptibility to degradative processes,land use, the duration of degradative land use, and themanagement. Soil and water degradation are also related tooverall environmental quality, of which water pollution andthe “greenhouse effect” are two major concerns of globalsignificance. Recent global concerns over increased atmo-spheric CO2, which can potentially alter the earth’s climate
systems, have resulted in raising interest in studying Soilorganic matter (SOM) dynamics and carbon (SOC) seques-tration capacity in various ecosystems [1]. Soils represent animportant terrestrial stock of C and approximately two tothree times as much as terrestrial vegetation and atmosphere,respectively, and the C in the SOM of agricultural land iscomposed of dominant terrestrial C stock. Soil quality is thecapacity of a soil to function within ecosystem boundariesto sustain biological productivity, maintain environmentalquality, and promote plant and animal health and thus hasa profound effect on the health and productivity of a givenecosystem and the environment related to it.
The North Eastern parts of India, comprising the states ofArunachal Pradesh, Assam, Manipur, Meghalaya, Mizoram,
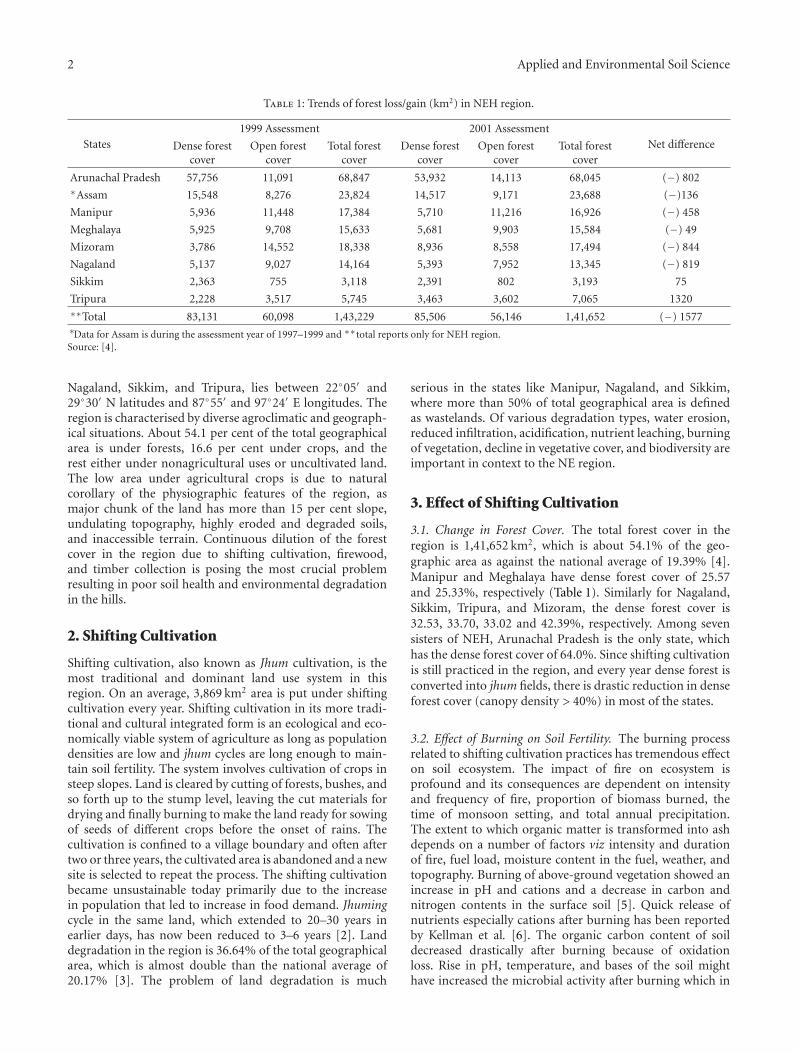
2 Applied and Environmental Soil Science
Table 1: Trends of forest loss/gain (km2) in NEH region.
States1999 Assessment 2001 Assessment
Net differenceDense forestcover
Open forestcover
Total forestcover
Dense forestcover
Open forestcover
Total forestcover
Arunachal Pradesh 57,756 11,091 68,847 53,932 14,113 68,045 (−) 802∗Assam 15,548 8,276 23,824 14,517 9,171 23,688 (−)136
Manipur 5,936 11,448 17,384 5,710 11,216 16,926 (−) 458
Meghalaya 5,925 9,708 15,633 5,681 9,903 15,584 (−) 49
Mizoram 3,786 14,552 18,338 8,936 8,558 17,494 (−) 844
Nagaland 5,137 9,027 14,164 5,393 7,952 13,345 (−) 819
Sikkim 2,363 755 3,118 2,391 802 3,193 75
Tripura 2,228 3,517 5,745 3,463 3,602 7,065 1320∗∗Total 83,131 60,098 1,43,229 85,506 56,146 1,41,652 (−) 1577∗Data for Assam is during the assessment year of 1997–1999 and ∗∗total reports only for NEH region.Source: [4].
Nagaland, Sikkim, and Tripura, lies between 22◦05′ and29◦30′ N latitudes and 87◦55′ and 97◦24′ E longitudes. Theregion is characterised by diverse agroclimatic and geograph-ical situations. About 54.1 per cent of the total geographicalarea is under forests, 16.6 per cent under crops, and therest either under nonagricultural uses or uncultivated land.The low area under agricultural crops is due to naturalcorollary of the physiographic features of the region, asmajor chunk of the land has more than 15 per cent slope,undulating topography, highly eroded and degraded soils,and inaccessible terrain. Continuous dilution of the forestcover in the region due to shifting cultivation, firewood,and timber collection is posing the most crucial problemresulting in poor soil health and environmental degradationin the hills.
2. Shifting Cultivation
Shifting cultivation, also known as Jhum cultivation, is themost traditional and dominant land use system in thisregion. On an average, 3,869 km2 area is put under shiftingcultivation every year. Shifting cultivation in its more tradi-tional and cultural integrated form is an ecological and eco-nomically viable system of agriculture as long as populationdensities are low and jhum cycles are long enough to main-tain soil fertility. The system involves cultivation of crops insteep slopes. Land is cleared by cutting of forests, bushes, andso forth up to the stump level, leaving the cut materials fordrying and finally burning to make the land ready for sowingof seeds of different crops before the onset of rains. Thecultivation is confined to a village boundary and often aftertwo or three years, the cultivated area is abandoned and a newsite is selected to repeat the process. The shifting cultivationbecame unsustainable today primarily due to the increasein population that led to increase in food demand. Jhumingcycle in the same land, which extended to 20–30 years inearlier days, has now been reduced to 3–6 years [2]. Landdegradation in the region is 36.64% of the total geographicalarea, which is almost double than the national average of20.17% [3]. The problem of land degradation is much
serious in the states like Manipur, Nagaland, and Sikkim,where more than 50% of total geographical area is definedas wastelands. Of various degradation types, water erosion,reduced infiltration, acidification, nutrient leaching, burningof vegetation, decline in vegetative cover, and biodiversity areimportant in context to the NE region.
3. Effect of Shifting Cultivation
3.1. Change in Forest Cover. The total forest cover in theregion is 1,41,652 km2, which is about 54.1% of the geo-graphic area as against the national average of 19.39% [4].Manipur and Meghalaya have dense forest cover of 25.57and 25.33%, respectively (Table 1). Similarly for Nagaland,Sikkim, Tripura, and Mizoram, the dense forest cover is32.53, 33.70, 33.02 and 42.39%, respectively. Among sevensisters of NEH, Arunachal Pradesh is the only state, whichhas the dense forest cover of 64.0%. Since shifting cultivationis still practiced in the region, and every year dense forest isconverted into jhum fields, there is drastic reduction in denseforest cover (canopy density > 40%) in most of the states.
3.2. Effect of Burning on Soil Fertility. The burning processrelated to shifting cultivation practices has tremendous effecton soil ecosystem. The impact of fire on ecosystem isprofound and its consequences are dependent on intensityand frequency of fire, proportion of biomass burned, thetime of monsoon setting, and total annual precipitation.The extent to which organic matter is transformed into ashdepends on a number of factors viz intensity and durationof fire, fuel load, moisture content in the fuel, weather, andtopography. Burning of above-ground vegetation showed anincrease in pH and cations and a decrease in carbon andnitrogen contents in the surface soil [5]. Quick release ofnutrients especially cations after burning has been reportedby Kellman et al. [6]. The organic carbon content of soildecreased drastically after burning because of oxidationloss. Rise in pH, temperature, and bases of the soil mighthave increased the microbial activity after burning which in
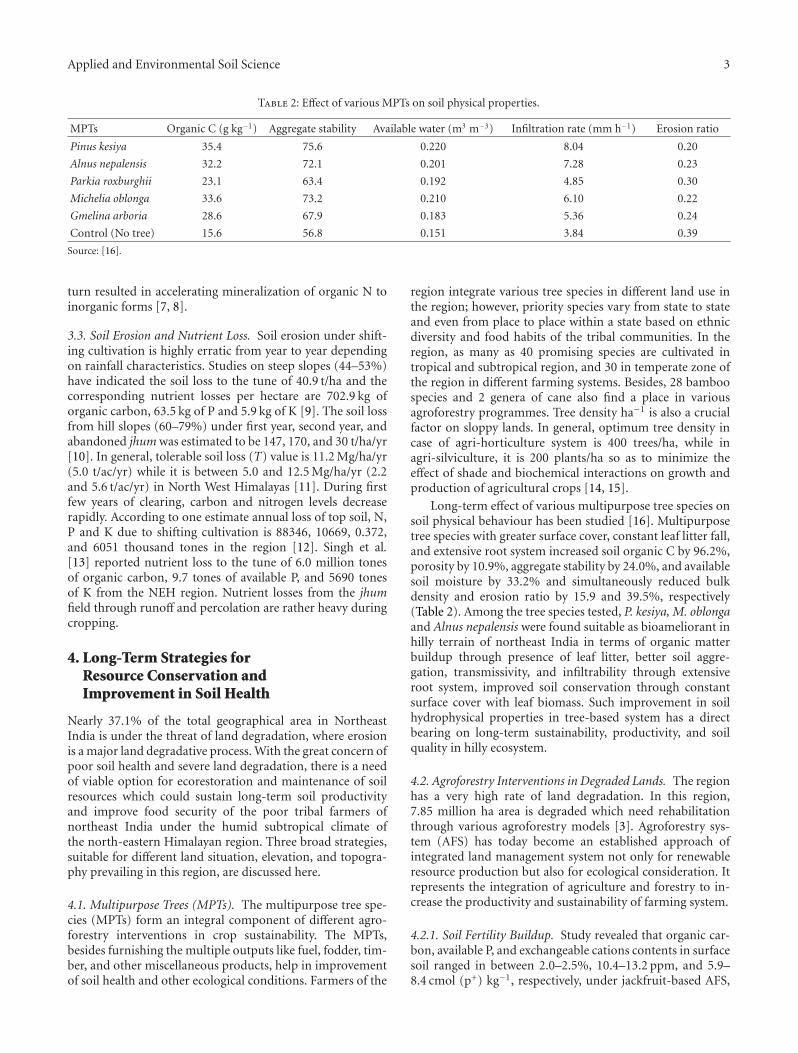
Applied and Environmental Soil Science 3
Table 2: Effect of various MPTs on soil physical properties.
MPTs Organic C (g kg−1) Aggregate stability Available water (m3 m−3) Infiltration rate (mm h−1) Erosion ratio
Pinus kesiya 35.4 75.6 0.220 8.04 0.20
Alnus nepalensis 32.2 72.1 0.201 7.28 0.23
Parkia roxburghii 23.1 63.4 0.192 4.85 0.30
Michelia oblonga 33.6 73.2 0.210 6.10 0.22
Gmelina arboria 28.6 67.9 0.183 5.36 0.24
Control (No tree) 15.6 56.8 0.151 3.84 0.39
Source: [16].
turn resulted in accelerating mineralization of organic N toinorganic forms [7, 8].
3.3. Soil Erosion and Nutrient Loss. Soil erosion under shift-ing cultivation is highly erratic from year to year dependingon rainfall characteristics. Studies on steep slopes (44–53%)have indicated the soil loss to the tune of 40.9 t/ha and thecorresponding nutrient losses per hectare are 702.9 kg oforganic carbon, 63.5 kg of P and 5.9 kg of K [9]. The soil lossfrom hill slopes (60–79%) under first year, second year, andabandoned jhum was estimated to be 147, 170, and 30 t/ha/yr[10]. In general, tolerable soil loss (T) value is 11.2 Mg/ha/yr(5.0 t/ac/yr) while it is between 5.0 and 12.5 Mg/ha/yr (2.2and 5.6 t/ac/yr) in North West Himalayas [11]. During firstfew years of clearing, carbon and nitrogen levels decreaserapidly. According to one estimate annual loss of top soil, N,P and K due to shifting cultivation is 88346, 10669, 0.372,and 6051 thousand tones in the region [12]. Singh et al.[13] reported nutrient loss to the tune of 6.0 million tonesof organic carbon, 9.7 tones of available P, and 5690 tonesof K from the NEH region. Nutrient losses from the jhumfield through runoff and percolation are rather heavy duringcropping.
4. Long-Term Strategies forResource Conservation andImprovement in Soil Health
Nearly 37.1% of the total geographical area in NortheastIndia is under the threat of land degradation, where erosionis a major land degradative process. With the great concern ofpoor soil health and severe land degradation, there is a needof viable option for ecorestoration and maintenance of soilresources which could sustain long-term soil productivityand improve food security of the poor tribal farmers ofnortheast India under the humid subtropical climate ofthe north-eastern Himalayan region. Three broad strategies,suitable for different land situation, elevation, and topogra-phy prevailing in this region, are discussed here.
4.1. Multipurpose Trees (MPTs). The multipurpose tree spe-cies (MPTs) form an integral component of different agro-forestry interventions in crop sustainability. The MPTs,besides furnishing the multiple outputs like fuel, fodder, tim-ber, and other miscellaneous products, help in improvementof soil health and other ecological conditions. Farmers of the
region integrate various tree species in different land use inthe region; however, priority species vary from state to stateand even from place to place within a state based on ethnicdiversity and food habits of the tribal communities. In theregion, as many as 40 promising species are cultivated intropical and subtropical region, and 30 in temperate zone ofthe region in different farming systems. Besides, 28 bamboospecies and 2 genera of cane also find a place in variousagroforestry programmes. Tree density ha−1 is also a crucialfactor on sloppy lands. In general, optimum tree density incase of agri-horticulture system is 400 trees/ha, while inagri-silviculture, it is 200 plants/ha so as to minimize theeffect of shade and biochemical interactions on growth andproduction of agricultural crops [14, 15].
Long-term effect of various multipurpose tree species onsoil physical behaviour has been studied [16]. Multipurposetree species with greater surface cover, constant leaf litter fall,and extensive root system increased soil organic C by 96.2%,porosity by 10.9%, aggregate stability by 24.0%, and availablesoil moisture by 33.2% and simultaneously reduced bulkdensity and erosion ratio by 15.9 and 39.5%, respectively(Table 2). Among the tree species tested, P. kesiya, M. oblongaand Alnus nepalensis were found suitable as bioameliorant inhilly terrain of northeast India in terms of organic matterbuildup through presence of leaf litter, better soil aggre-gation, transmissivity, and infiltrability through extensiveroot system, improved soil conservation through constantsurface cover with leaf biomass. Such improvement in soilhydrophysical properties in tree-based system has a directbearing on long-term sustainability, productivity, and soilquality in hilly ecosystem.
4.2. Agroforestry Interventions in Degraded Lands. The regionhas a very high rate of land degradation. In this region,7.85 million ha area is degraded which need rehabilitationthrough various agroforestry models [3]. Agroforestry sys-tem (AFS) has today become an established approach ofintegrated land management system not only for renewableresource production but also for ecological consideration. Itrepresents the integration of agriculture and forestry to in-crease the productivity and sustainability of farming system.
4.2.1. Soil Fertility Buildup. Study revealed that organic car-bon, available P, and exchangeable cations contents in surfacesoil ranged in between 2.0–2.5%, 10.4–13.2 ppm, and 5.9–8.4 cmol (p+) kg−1, respectively, under jackfruit-based AFS,
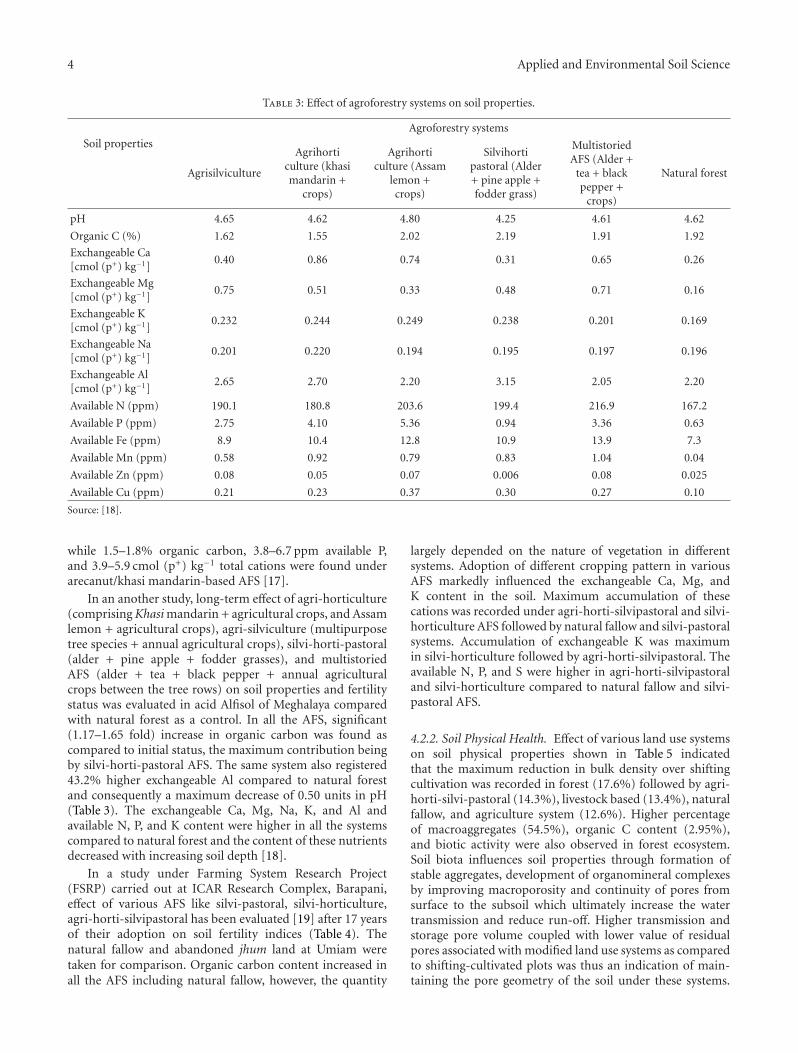
4 Applied and Environmental Soil Science
Table 3: Effect of agroforestry systems on soil properties.
Soil propertiesAgroforestry systems
Agrisilviculture
Agrihorticulture (khasimandarin +
crops)
Agrihorticulture (Assam
lemon +crops)
Silvihortipastoral (Alder+ pine apple +fodder grass)
MultistoriedAFS (Alder +
tea + blackpepper +
crops)
Natural forest
pH 4.65 4.62 4.80 4.25 4.61 4.62
Organic C (%) 1.62 1.55 2.02 2.19 1.91 1.92
Exchangeable Ca[cmol (p+) kg−1]
0.40 0.86 0.74 0.31 0.65 0.26
Exchangeable Mg[cmol (p+) kg−1]
0.75 0.51 0.33 0.48 0.71 0.16
Exchangeable K[cmol (p+) kg−1]
0.232 0.244 0.249 0.238 0.201 0.169
Exchangeable Na[cmol (p+) kg−1]
0.201 0.220 0.194 0.195 0.197 0.196
Exchangeable Al[cmol (p+) kg−1]
2.65 2.70 2.20 3.15 2.05 2.20
Available N (ppm) 190.1 180.8 203.6 199.4 216.9 167.2
Available P (ppm) 2.75 4.10 5.36 0.94 3.36 0.63
Available Fe (ppm) 8.9 10.4 12.8 10.9 13.9 7.3
Available Mn (ppm) 0.58 0.92 0.79 0.83 1.04 0.04
Available Zn (ppm) 0.08 0.05 0.07 0.006 0.08 0.025
Available Cu (ppm) 0.21 0.23 0.37 0.30 0.27 0.10
Source: [18].
while 1.5–1.8% organic carbon, 3.8–6.7 ppm available P,and 3.9–5.9 cmol (p+) kg−1 total cations were found underarecanut/khasi mandarin-based AFS [17].
In an another study, long-term effect of agri-horticulture(comprising Khasi mandarin + agricultural crops, and Assamlemon + agricultural crops), agri-silviculture (multipurposetree species + annual agricultural crops), silvi-horti-pastoral(alder + pine apple + fodder grasses), and multistoriedAFS (alder + tea + black pepper + annual agriculturalcrops between the tree rows) on soil properties and fertilitystatus was evaluated in acid Alfisol of Meghalaya comparedwith natural forest as a control. In all the AFS, significant(1.17–1.65 fold) increase in organic carbon was found ascompared to initial status, the maximum contribution beingby silvi-horti-pastoral AFS. The same system also registered43.2% higher exchangeable Al compared to natural forestand consequently a maximum decrease of 0.50 units in pH(Table 3). The exchangeable Ca, Mg, Na, K, and Al andavailable N, P, and K content were higher in all the systemscompared to natural forest and the content of these nutrientsdecreased with increasing soil depth [18].
In a study under Farming System Research Project(FSRP) carried out at ICAR Research Complex, Barapani,effect of various AFS like silvi-pastoral, silvi-horticulture,agri-horti-silvipastoral has been evaluated [19] after 17 yearsof their adoption on soil fertility indices (Table 4). Thenatural fallow and abandoned jhum land at Umiam weretaken for comparison. Organic carbon content increased inall the AFS including natural fallow, however, the quantity
largely depended on the nature of vegetation in differentsystems. Adoption of different cropping pattern in variousAFS markedly influenced the exchangeable Ca, Mg, andK content in the soil. Maximum accumulation of thesecations was recorded under agri-horti-silvipastoral and silvi-horticulture AFS followed by natural fallow and silvi-pastoralsystems. Accumulation of exchangeable K was maximumin silvi-horticulture followed by agri-horti-silvipastoral. Theavailable N, P, and S were higher in agri-horti-silvipastoraland silvi-horticulture compared to natural fallow and silvi-pastoral AFS.
4.2.2. Soil Physical Health. Effect of various land use systemson soil physical properties shown in Table 5 indicatedthat the maximum reduction in bulk density over shiftingcultivation was recorded in forest (17.6%) followed by agri-horti-silvi-pastoral (14.3%), livestock based (13.4%), naturalfallow, and agriculture system (12.6%). Higher percentageof macroaggregates (54.5%), organic C content (2.95%),and biotic activity were also observed in forest ecosystem.Soil biota influences soil properties through formation ofstable aggregates, development of organomineral complexesby improving macroporosity and continuity of pores fromsurface to the subsoil which ultimately increase the watertransmission and reduce run-off. Higher transmission andstorage pore volume coupled with lower value of residualpores associated with modified land use systems as comparedto shifting-cultivated plots was thus an indication of main-taining the pore geometry of the soil under these systems.
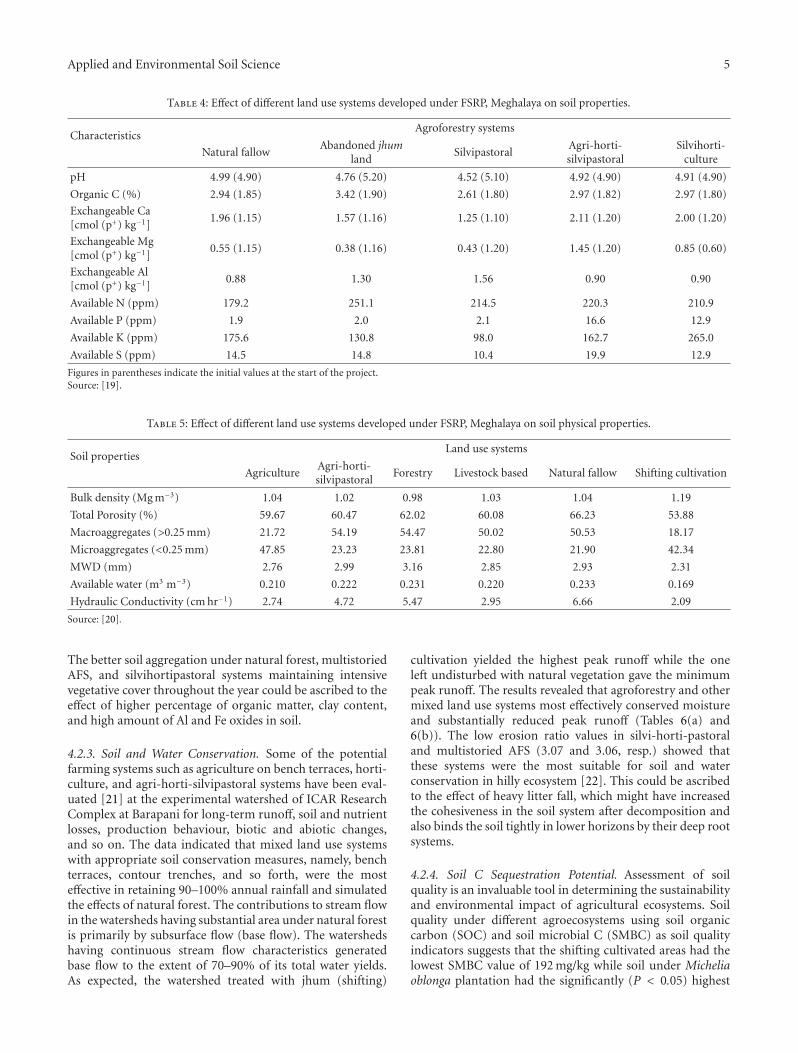
Applied and Environmental Soil Science 5
Table 4: Effect of different land use systems developed under FSRP, Meghalaya on soil properties.
CharacteristicsAgroforestry systems
Natural fallowAbandoned jhum
landSilvipastoral
Agri-horti-silvipastoral
Silvihorti-culture
pH 4.99 (4.90) 4.76 (5.20) 4.52 (5.10) 4.92 (4.90) 4.91 (4.90)
Organic C (%) 2.94 (1.85) 3.42 (1.90) 2.61 (1.80) 2.97 (1.82) 2.97 (1.80)
Exchangeable Ca[cmol (p+) kg−1]
1.96 (1.15) 1.57 (1.16) 1.25 (1.10) 2.11 (1.20) 2.00 (1.20)
Exchangeable Mg[cmol (p+) kg−1]
0.55 (1.15) 0.38 (1.16) 0.43 (1.20) 1.45 (1.20) 0.85 (0.60)
Exchangeable Al[cmol (p+) kg−1]
0.88 1.30 1.56 0.90 0.90
Available N (ppm) 179.2 251.1 214.5 220.3 210.9
Available P (ppm) 1.9 2.0 2.1 16.6 12.9
Available K (ppm) 175.6 130.8 98.0 162.7 265.0
Available S (ppm) 14.5 14.8 10.4 19.9 12.9
Figures in parentheses indicate the initial values at the start of the project.Source: [19].
Table 5: Effect of different land use systems developed under FSRP, Meghalaya on soil physical properties.
Soil propertiesLand use systems
AgricultureAgri-horti-silvipastoral
Forestry Livestock based Natural fallow Shifting cultivation
Bulk density (Mg m−3) 1.04 1.02 0.98 1.03 1.04 1.19
Total Porosity (%) 59.67 60.47 62.02 60.08 66.23 53.88
Macroaggregates (>0.25 mm) 21.72 54.19 54.47 50.02 50.53 18.17
Microaggregates (<0.25 mm) 47.85 23.23 23.81 22.80 21.90 42.34
MWD (mm) 2.76 2.99 3.16 2.85 2.93 2.31
Available water (m3 m−3) 0.210 0.222 0.231 0.220 0.233 0.169
Hydraulic Conductivity (cm hr−1) 2.74 4.72 5.47 2.95 6.66 2.09
Source: [20].
The better soil aggregation under natural forest, multistoriedAFS, and silvihortipastoral systems maintaining intensivevegetative cover throughout the year could be ascribed to theeffect of higher percentage of organic matter, clay content,and high amount of Al and Fe oxides in soil.
4.2.3. Soil and Water Conservation. Some of the potentialfarming systems such as agriculture on bench terraces, horti-culture, and agri-horti-silvipastoral systems have been eval-uated [21] at the experimental watershed of ICAR ResearchComplex at Barapani for long-term runoff, soil and nutrientlosses, production behaviour, biotic and abiotic changes,and so on. The data indicated that mixed land use systemswith appropriate soil conservation measures, namely, benchterraces, contour trenches, and so forth, were the mosteffective in retaining 90–100% annual rainfall and simulatedthe effects of natural forest. The contributions to stream flowin the watersheds having substantial area under natural forestis primarily by subsurface flow (base flow). The watershedshaving continuous stream flow characteristics generatedbase flow to the extent of 70–90% of its total water yields.As expected, the watershed treated with jhum (shifting)
cultivation yielded the highest peak runoff while the oneleft undisturbed with natural vegetation gave the minimumpeak runoff. The results revealed that agroforestry and othermixed land use systems most effectively conserved moistureand substantially reduced peak runoff (Tables 6(a) and6(b)). The low erosion ratio values in silvi-horti-pastoraland multistoried AFS (3.07 and 3.06, resp.) showed thatthese systems were the most suitable for soil and waterconservation in hilly ecosystem [22]. This could be ascribedto the effect of heavy litter fall, which might have increasedthe cohesiveness in the soil system after decomposition andalso binds the soil tightly in lower horizons by their deep rootsystems.
4.2.4. Soil C Sequestration Potential. Assessment of soilquality is an invaluable tool in determining the sustainabilityand environmental impact of agricultural ecosystems. Soilquality under different agroecosystems using soil organiccarbon (SOC) and soil microbial C (SMBC) as soil qualityindicators suggests that the shifting cultivated areas had thelowest SMBC value of 192 mg/kg while soil under Micheliaoblonga plantation had the significantly (P < 0.05) highest
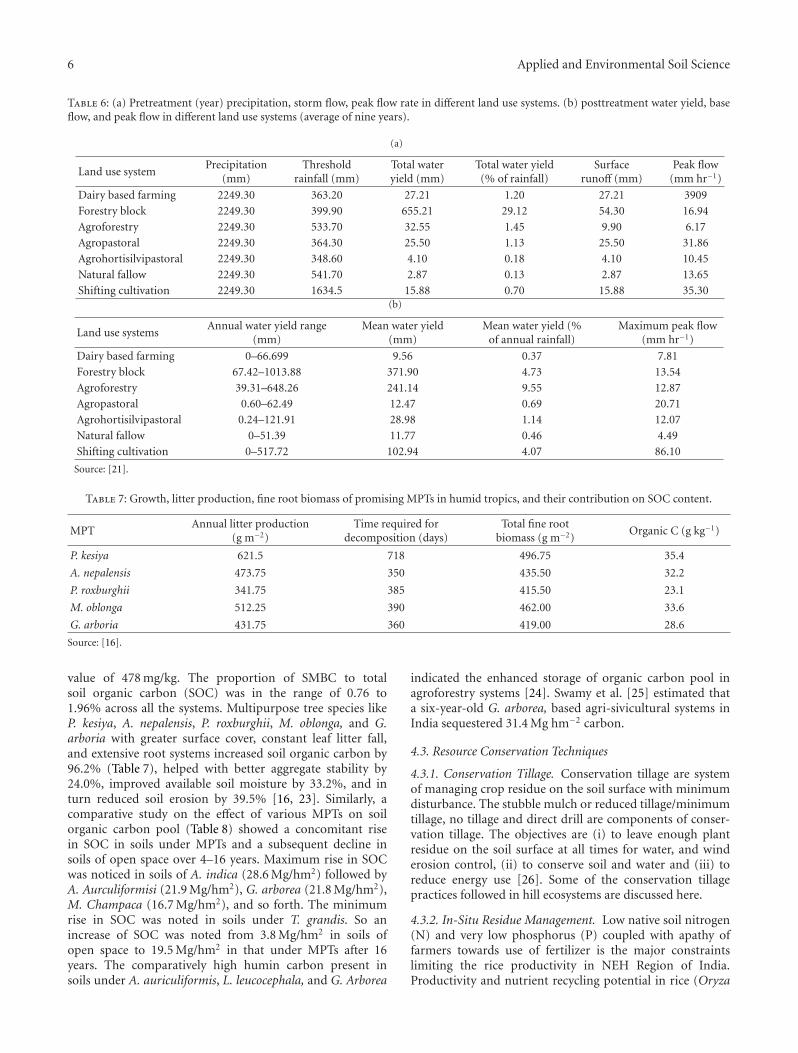
6 Applied and Environmental Soil Science
Table 6: (a) Pretreatment (year) precipitation, storm flow, peak flow rate in different land use systems. (b) posttreatment water yield, baseflow, and peak flow in different land use systems (average of nine years).
(a)
Land use systemPrecipitation
(mm)Threshold
rainfall (mm)Total wateryield (mm)
Total water yield(% of rainfall)
Surfacerunoff (mm)
Peak flow(mm hr−1)
Dairy based farming 2249.30 363.20 27.21 1.20 27.21 3909
Forestry block 2249.30 399.90 655.21 29.12 54.30 16.94
Agroforestry 2249.30 533.70 32.55 1.45 9.90 6.17
Agropastoral 2249.30 364.30 25.50 1.13 25.50 31.86
Agrohortisilvipastoral 2249.30 348.60 4.10 0.18 4.10 10.45
Natural fallow 2249.30 541.70 2.87 0.13 2.87 13.65
Shifting cultivation 2249.30 1634.5 15.88 0.70 15.88 35.30(b)
Land use systemsAnnual water yield range
(mm)Mean water yield
(mm)Mean water yield (%
of annual rainfall)Maximum peak flow
(mm hr−1)
Dairy based farming 0–66.699 9.56 0.37 7.81
Forestry block 67.42–1013.88 371.90 4.73 13.54
Agroforestry 39.31–648.26 241.14 9.55 12.87
Agropastoral 0.60–62.49 12.47 0.69 20.71
Agrohortisilvipastoral 0.24–121.91 28.98 1.14 12.07
Natural fallow 0–51.39 11.77 0.46 4.49
Shifting cultivation 0–517.72 102.94 4.07 86.10
Source: [21].
Table 7: Growth, litter production, fine root biomass of promising MPTs in humid tropics, and their contribution on SOC content.
MPTAnnual litter production
(g m−2)Time required for
decomposition (days)Total fine root
biomass (g m−2)Organic C (g kg−1)
P. kesiya 621.5 718 496.75 35.4
A. nepalensis 473.75 350 435.50 32.2
P. roxburghii 341.75 385 415.50 23.1
M. oblonga 512.25 390 462.00 33.6
G. arboria 431.75 360 419.00 28.6
Source: [16].
value of 478 mg/kg. The proportion of SMBC to totalsoil organic carbon (SOC) was in the range of 0.76 to1.96% across all the systems. Multipurpose tree species likeP. kesiya, A. nepalensis, P. roxburghii, M. oblonga, and G.arboria with greater surface cover, constant leaf litter fall,and extensive root systems increased soil organic carbon by96.2% (Table 7), helped with better aggregate stability by24.0%, improved available soil moisture by 33.2%, and inturn reduced soil erosion by 39.5% [16, 23]. Similarly, acomparative study on the effect of various MPTs on soilorganic carbon pool (Table 8) showed a concomitant risein SOC in soils under MPTs and a subsequent decline insoils of open space over 4–16 years. Maximum rise in SOCwas noticed in soils of A. indica (28.6 Mg/hm2) followed byA. Aurculiformisi (21.9 Mg/hm2), G. arborea (21.8 Mg/hm2),M. Champaca (16.7 Mg/hm2), and so forth. The minimumrise in SOC was noted in soils under T. grandis. So anincrease of SOC was noted from 3.8 Mg/hm2 in soils ofopen space to 19.5 Mg/hm2 in that under MPTs after 16years. The comparatively high humin carbon present insoils under A. auriculiformis, L. leucocephala, and G. Arborea
indicated the enhanced storage of organic carbon pool inagroforestry systems [24]. Swamy et al. [25] estimated thata six-year-old G. arborea, based agri-sivicultural systems inIndia sequestered 31.4 Mg hm−2 carbon.
4.3. Resource Conservation Techniques
4.3.1. Conservation Tillage. Conservation tillage are systemof managing crop residue on the soil surface with minimumdisturbance. The stubble mulch or reduced tillage/minimumtillage, no tillage and direct drill are components of conser-vation tillage. The objectives are (i) to leave enough plantresidue on the soil surface at all times for water, and winderosion control, (ii) to conserve soil and water and (iii) toreduce energy use [26]. Some of the conservation tillagepractices followed in hill ecosystems are discussed here.
4.3.2. In-Situ Residue Management. Low native soil nitrogen(N) and very low phosphorus (P) coupled with apathy offarmers towards use of fertilizer is the major constraintslimiting the rice productivity in NEH Region of India.Productivity and nutrient recycling potential in rice (Oryza
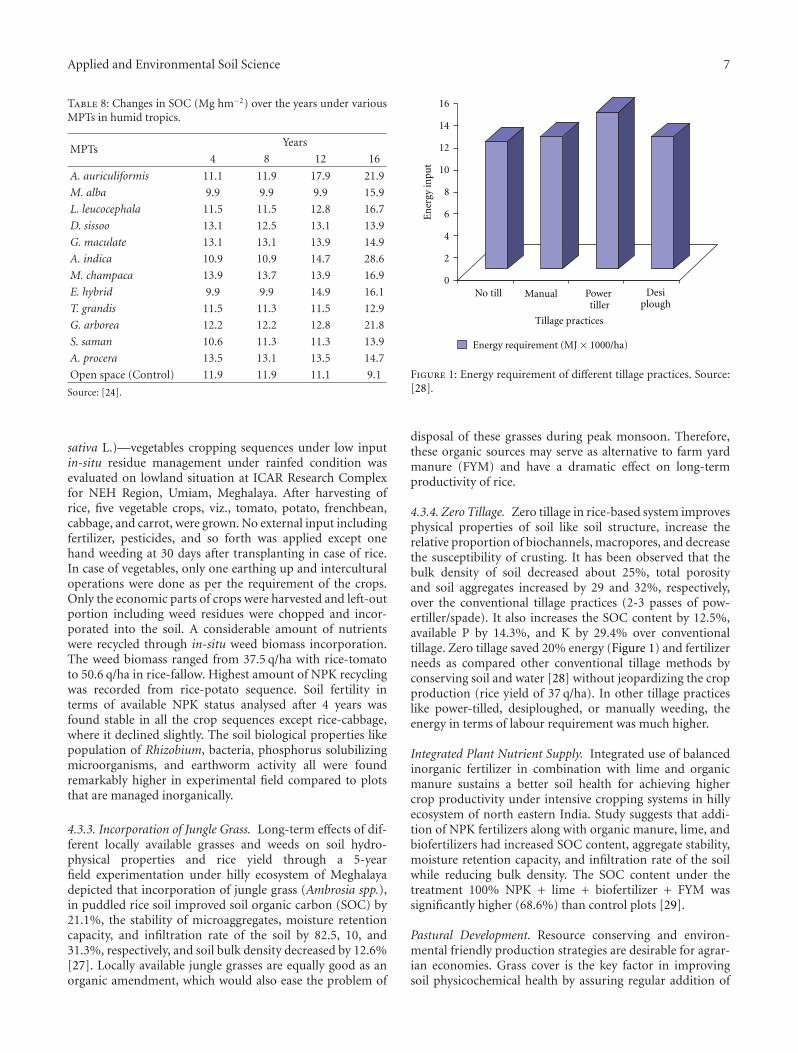
Applied and Environmental Soil Science 7
Table 8: Changes in SOC (Mg hm−2) over the years under variousMPTs in humid tropics.
MPTsYears
4 8 12 16
A. auriculiformis 11.1 11.9 17.9 21.9
M. alba 9.9 9.9 9.9 15.9
L. leucocephala 11.5 11.5 12.8 16.7
D. sissoo 13.1 12.5 13.1 13.9
G. maculate 13.1 13.1 13.9 14.9
A. indica 10.9 10.9 14.7 28.6
M. champaca 13.9 13.7 13.9 16.9
E. hybrid 9.9 9.9 14.9 16.1
T. grandis 11.5 11.3 11.5 12.9
G. arborea 12.2 12.2 12.8 21.8
S. saman 10.6 11.3 11.3 13.9
A. procera 13.5 13.1 13.5 14.7
Open space (Control) 11.9 11.9 11.1 9.1
Source: [24].
sativa L.)—vegetables cropping sequences under low inputin-situ residue management under rainfed condition wasevaluated on lowland situation at ICAR Research Complexfor NEH Region, Umiam, Meghalaya. After harvesting ofrice, five vegetable crops, viz., tomato, potato, frenchbean,cabbage, and carrot, were grown. No external input includingfertilizer, pesticides, and so forth was applied except onehand weeding at 30 days after transplanting in case of rice.In case of vegetables, only one earthing up and interculturaloperations were done as per the requirement of the crops.Only the economic parts of crops were harvested and left-outportion including weed residues were chopped and incor-porated into the soil. A considerable amount of nutrientswere recycled through in-situ weed biomass incorporation.The weed biomass ranged from 37.5 q/ha with rice-tomatoto 50.6 q/ha in rice-fallow. Highest amount of NPK recyclingwas recorded from rice-potato sequence. Soil fertility interms of available NPK status analysed after 4 years wasfound stable in all the crop sequences except rice-cabbage,where it declined slightly. The soil biological properties likepopulation of Rhizobium, bacteria, phosphorus solubilizingmicroorganisms, and earthworm activity all were foundremarkably higher in experimental field compared to plotsthat are managed inorganically.
4.3.3. Incorporation of Jungle Grass. Long-term effects of dif-ferent locally available grasses and weeds on soil hydro-physical properties and rice yield through a 5-yearfield experimentation under hilly ecosystem of Meghalayadepicted that incorporation of jungle grass (Ambrosia spp.),in puddled rice soil improved soil organic carbon (SOC) by21.1%, the stability of microaggregates, moisture retentioncapacity, and infiltration rate of the soil by 82.5, 10, and31.3%, respectively, and soil bulk density decreased by 12.6%[27]. Locally available jungle grasses are equally good as anorganic amendment, which would also ease the problem of
En
ergy
inpu
t
No till Manual
Tillage practices
16
14
12
10
8
6
4
2
0Powertiller
Desiplough
Energy requirement (MJ × 1000/ha)
Figure 1: Energy requirement of different tillage practices. Source:[28].
disposal of these grasses during peak monsoon. Therefore,these organic sources may serve as alternative to farm yardmanure (FYM) and have a dramatic effect on long-termproductivity of rice.
4.3.4. Zero Tillage. Zero tillage in rice-based system improvesphysical properties of soil like soil structure, increase therelative proportion of biochannels, macropores, and decreasethe susceptibility of crusting. It has been observed that thebulk density of soil decreased about 25%, total porosityand soil aggregates increased by 29 and 32%, respectively,over the conventional tillage practices (2-3 passes of pow-ertiller/spade). It also increases the SOC content by 12.5%,available P by 14.3%, and K by 29.4% over conventionaltillage. Zero tillage saved 20% energy (Figure 1) and fertilizerneeds as compared other conventional tillage methods byconserving soil and water [28] without jeopardizing the cropproduction (rice yield of 37 q/ha). In other tillage practiceslike power-tilled, desiploughed, or manually weeding, theenergy in terms of labour requirement was much higher.
Integrated Plant Nutrient Supply. Integrated use of balancedinorganic fertilizer in combination with lime and organicmanure sustains a better soil health for achieving highercrop productivity under intensive cropping systems in hillyecosystem of north eastern India. Study suggests that addi-tion of NPK fertilizers along with organic manure, lime, andbiofertilizers had increased SOC content, aggregate stability,moisture retention capacity, and infiltration rate of the soilwhile reducing bulk density. The SOC content under thetreatment 100% NPK + lime + biofertilizer + FYM wassignificantly higher (68.6%) than control plots [29].
Pastural Development. Resource conserving and environ-mental friendly production strategies are desirable for agrar-ian economies. Grass cover is the key factor in improvingsoil physicochemical health by assuring regular addition of
8 Applied and Environmental Soil Science
organic matter, thus reducing surface runoff and soil erosion.Some promising perennial grasses like Setaria, Congosignal,Guinea, Napier, and Broom grass were tested for theireffect on soil physicochemical properties. Study [30] revealedthat continuous 15 years grass covers significantly increasedthe SOC, the highest SOC content with Setaria (2.24%).Similarly, Soil microbial biomass carbon, soil aggregation,and infiltration rate under various grass covers were also highas compared to plots without grass covers.
Hedgerow Intercropping. As the trees have long gestationperiod, farmers may be reluctant to cultivate the treesmainly due to prevailing land tenure system in the region.However, cultivating various hedgerow species even in jhumfield could be better option for them as these species haveshort gestation period. Hedgerows alone reduced soil loss by94% and run-off by 78%. When twigs and tender stem ofhedge plants are used for mulch, it conserved 83% of thesoil and 42% of rainfall. In a study conducted at Changki,Nagaland in NEH region, the soil loss was reduced by 22%with the incorporation of hedgerow species in the jhumfields compared to traditional jhum site (38.14 t/ha/yr).Thus contour hedgerow technology provides an option forfarming on the hill slopes on a sustainable basis. Growingof nitrogen fixing hedge species on the field bunds helps infixation of atmospheric nitrogen and reduces the leachinglosses of mineral nitrogen. Their vigorous root systemmobilizes phosphorus, potassium, and other trace elements.
ICAR Research Complex for NEH Region has alsoscreened various hedgerow species for plantation, and Ca-janus cajan, Crotalaria tetragona, Desmodium rensonii, Flem-ingia macrophylla, Indigofera tinctoria, Tephrosia candida,and Gliricidia maculata have been found suitable for farmingin Eastern Himalayas. Survival percentage of these speciesranged from 60.0 to 80.0 over degraded sites. The total N,P, and K concentration in the foliage of hedgerow speciesranged from 3.23–3.86; 0.32–0.81; 1.26–1.67%, respectively.Total leaf biomass production on the dry weight basisafter one year of growth was found to be highest in C.tetragona (22.98 q/ha) followed by G. maculata (20.75 q/ha),I. tinctoria (16.99 q/ha), and T. candida (15.30 q/ha). Amongthe hedgerow species, C. tetragona enriched the soil fertilitymore efficiently as it accumulated higher amount of totalN, P, and K (79.74, 11.03, and 37.46 kg/ha) through its leafincorporation. The recycling of bases in litter of hedgerowcould potentially counteract the acidification [31]. Theincorporation of leaf biomass of T. candida improved thepH in acid soil by increasing 0.49 units from the initial levelat surface soil. Thus, the biomass produced from hedgerowsshowed a favorable influence on soil acidity.
4.4. Organic Farming. Organic farming is primarily in oper-ation in areas under shifting cultivation and traditionalland use systems in north east India. Nearly 57.1% of totalgeographical area (TGA) in India is under the threat of landdegradation mainly by water erosion. On an average, 37.1%of TGA in NE India is in degraded state. Fertilizer use inmost of the states of the region is far below the nationalaverage. The use of N, P, and K through fertilizer in the region
is only 13.37, 11.12, and 11.0% of the crop removal thusnecessasiating the organic source of nutrition in the domainof soil health management. Organic sources if pooledtogether can supply 13.07 kg N/ha, 7.18 kg phosphate/ha, and7.34 kg potash/ha in NE India. The micronutrient supplyfrom organic sources may be adequate. Substantial amountof potash can be obtained from crop residues if managedto add in soils. Biofertilizers in case of adequate supply canproduce an increase (5–30%) in yield. Vermicomposting ofrural wastes holds a great promise in mitigating nutrienthunger of soils in NE India considering supply of compostingearthworms and need based training in compost technology.Soil amelioration with the use of limestone deposit availablein north east can be brought in use. Finally, watershedbased technology with proper soil and water conservationmeasures can be an effective avenue to nurture soil health forsustainable organic food production.
5. Epilogue
Even today, Jhuming is considered as a major source of ruraleconomy in north eastern part of India and will remain asimportant one as it is associated with socioeconomic andcultural systems of the people of this region. Because of this,degradation will continue in the years to come and mayreach to the extent of out of control, if proper care is nottaken right now. Therefore, to reduce all types of degradationlevel, a comprehensive forest policy is required as a long-termstrategy in the region for sustainability and augmentation offood, fuel, fodder, and timer requirements. In this direction,agroforestry coupled with some sound resource conservationtechniques needs to be strengthened for long-term sustain-able production and environmental conservations in fragileecosystem which will contribute to improved food securityand income generation for resource poor farmers and protectthe environments.
Integrated farming system (IFS) has emerged as a wellaccepted, single window, and sound strategy for harmonizingsimultaneously jointmanagement of land, water, vegetation,livestock, and human resources, The IFS developed for hillareas could reduce the risk of soil degradation, produce thesoils productive potential, and reduce the risks of environ-mental degradation. Besides, these interventions having atree crop with a high quality of leaf litter and root bindingability reduce erodibility of rainfall/runoff and improve thephysicochemical conditions. Attempt should also be made tomanage soil health through addition of organic inputs in thisregion.
References
[1] W. H. Schlesinger, “Carbon sequestration in soils,” Science, vol.284, no. 5423, p. 2095, 1999.
[2] D. N. Borthakur, Agriculture of the North Eastern Region withSpecial Reference to Hill Agriculture, Beecee Prakashan, Guwa-hati, India, 1992.
[3] Anonymous, Wastelands Atlas of India, Ministry of Rural De-velopment, Government of India and National Remote Sens-ing Agency, Hyderabad, India, 2000.
Applied and Environmental Soil Science 9
[4] Anonymous, State of Forest Report, Forest Survey of India.Ministry of Environment and Forests, Government of India,2001.
[5] S. C. Ram and P. S. Ramakrishnan, “Hydrology and soil fer-tility of degraded grasslands at Cherrapunji in North EasternIndia,” Environment Conservation, vol. 15, pp. 29–35, 1988.
[6] M. Kellman, K. Miyanishi, and P. Hiebert, “Nutrient retentionby savanna ecosystems II. Retention after fire,” Journal of Ecol-ogy, vol. 73, no. 3, pp. 953–962, 1985.
[7] I. F. Ahlgren and C. E. Ahlgren, “Effect of prescribed burningon soil microorganisms in a Minnesota jack pine forest,” Ecol-ogy, vol. 46, no. 3, pp. 304–310, 1965.
[8] G. Griffith, “Fertility problems in Uganda,” Technical Com-munication, Commonwealth Bureau of Soil Science, vol. 46,pp. 160–164, 1949.
[9] M. Ram and B. P. Singh, “Soil fertility management in farmingsystems,” Lectures notes, off campus training on farmingsystem, Aizawl, India, 1993.
[10] A. Singh and M. D. Singh, “Effect of various stages of shiftingcultivation on soil erosion from steep hill slopes,” IndianForester, vol. 106, no. 2, pp. 115–121, 1981.
[11] D. Mandal, K. S. Dadhwal, O. P. S. Khola, and B. L. Dhyani,“Adjusted T values for conservation planning in NorthwestHimalayas of India,” Journal of Soil and Water Conservation,vol. 61, no. 6, pp. 391–397, 2006.
[12] U. C. Sharma, “Methods of selecting suitable land use systemwith reference to shifting cultivation in NEH region,” IndianJournal of Soil Conservation, vol. 26, no. 3, pp. 234–238, 1998.
[13] N. P. Singh, O. P. Singh, and N. S. Jamir, Sustainable AgricultureDevelopment Strategy for North Eastern Hill Region of India,Mittal, New Delhi, India, 1996, Edited by Shukla S. P. andSharma N.
[14] B. P. Bhatt, “Agroforestry for sustainable mountain develop-ment in N.E.H. region,” in Central Himalaya Environmentand Development: Potentials, Actions and Challenges, M. S. S.Rawat, Ed., pp. 206–223, Transmedia Publisher, Uttaranchal,India, 2003.
[15] Umashankar, “Indigenous agroforestry tree species for con-servation and rural livelihood,” in Agroforestry in North EastIndia: Opportunities and Challenges, B. P. Bhatt and K. M.Bujarbaruah, Eds., pp. 149–174, ICAR Research Complex forNEH Region, Umiam, Meghalaya, 2005.
[16] R. Saha, J. M. S. Tomar, and P. K. Ghosh, “Evaluation andselection of multipurpose tree for improving soil hydro-phys-ical behaviour under hilly eco-system of north east India,”Agroforestry Systems, vol. 69, no. 3, pp. 239–247, 2007.
[17] B. P. Singh and S. K. Dhyani, “Significance of jackfruit inrestoration of soil fertility,” Annual Report, ICAR ResearchComplex, Umiam, Meghalaya, 1995.
[18] B. Majumdar, K. Kumar, M. S. Venkatesh, Patiram, and BhattB. P., “Effect of different agroforestry systems on soil proper-ties in acid Alfisols of Meghalaya,” Journal Hill Research, vol.17, no. 1, pp. 1–5, 2004.
[19] B. Majumdar, M. S. Venkatesh, K. K. Satapathy, K. Kumar,and Patiram, “Effect of alternative farming systems to shiftingcultivation on soil fertility,” Indian Journal of AgriculturalSciences, vol. 72, no. 2, pp. 122–124, 2002.
[20] R. Saha and V. K. Mishra, “Long-term effect of various landuse systems on physical properties of silty clay loam soil of N-E hills,” Journal of the Indian Society of Soil Science, vol. 55, no.2, pp. 112–118, 2007.
[21] K. K. Satapathy, “Runoff production on hill slopes underdifferent land use systems,” in Agroforestry in North EastIndia: Opportunities and Challenges, B. P. Bhatt and K. M.
Bujarbaruah, Eds., pp. 451–459, ICAR Research Complex forNEH Region, Umiam, Meghalaya, 2005.
[22] R. Saha, V. K. Mishra, and J. M. S. Tomar, “Effect of agro-forestry systems on erodibility and hydraulic properties ofAlfisols in eastern Himalayan region,” Indian Journal of SoilConservation, vol. 33, pp. 251–253, 2005.
[23] R. Saha, P. K. Ghosh, V. K. Mishra, B. Majumdar, and J. M. S.Tomar, “Can agroforestry be a resource conservation tool tomaintain soil health in the fragile ecosystem of north-eastIndia?” Outlook on Agriculture, vol. 39, no. 3, pp. 191–196,2010.
[24] M. Datta and N. P. Singh, “Growth characteristics of mul-tipurpose tree species, crop productivity and soil propertiesin agroforestry systems under subtropical humid climate inIndia,” Journal of Forestry Research, vol. 18, no. 4, pp. 261–270,2007.
[25] S. L. Swamy, S. Puri, and A. K. Singh, “Growth, biomass, car-bon storage and nutrient distribution in Gmelina arboreaRoxb. Stands on red lateritic soils in central India,” BioresourceTechnology, vol. 90, no. 2, pp. 109–126, 2003.
[26] P. K. Ghosh, A. Das, R. Saha et al., “Conservation agriculturetowards achieving food security in North East India,” CurrentScience, vol. 99, no. 7, pp. 915–921, 2010.
[27] R. Saha and V. K. Mishra, “Effect of organic residue manage-ment on soil hydro-physical characteristics and rice yield ineastern Himalayan region, India,” Journal of Sustainable Agri-culture, vol. 33, no. 2, pp. 161–176, 2009.
[28] V. K. Mishra, R. Saha, and K. M. Bujarbaruah, “Zero tillagetechnique for transplanted rice in high rainfall eco-system,”Scientific leaflet., ICAR Research Complex for NEH Region,Umiam, Meghlaya, 2005.
[29] R. Saha, V. K. Mishra, B. Majumdar, K. Laxminarayana, and P.K. Ghosh, “Effect of integrated nutrient management on soilphysical properties and crop productivity under a Maize (Zeamays)-mustard (Brassica campestris) cropping sequence inacidic soils of Northeast India,” Communications in Soil Scienceand Plant Analysis, vol. 41, no. 18, pp. 2187–2200, 2010.
[30] P. K. Ghosh, R. Saha, J. J. Gupta et al., “Long-term effect ofpastures on soil quality in acid soil of north-east India,” Aus-tralian Journal of Soil Research, vol. 47, no. 4, pp. 372–379,2009.
[31] K. Laxminarayana, B. P. Bhatt, and R. Tulsi, “Soil fertilitybuildup through hedgerow intercropping in integrated farm-ing system: a case study,” in Agroforestry in North East India:Opportunities and Challenges, B. P. Bhatt and K. M. Bujar-baruah, Eds., pp. 495–506, ICAR Research Complex for NEHRegion, Umiam, Meghalaya, 2005.
Hindawi Publishing CorporationApplied and Environmental Soil ScienceVolume 2012, Article ID 673926, 10 pagesdoi:10.1155/2012/673926
Review Article
Soil Degradation-Induced Decline in Productivity ofSub-Saharan African Soils: The Prospects ofLooking Downwards the Lowlands with the Sawah Ecotechnology
Sunday E. Obalum,1, 2 Mohammed M. Buri,3 John C. Nwite,4 Hermansah,5
Yoshinori Watanabe,1 Charles A. Igwe,1, 2 and Toshiyuki Wakatsuki1
1 School of Agriculture, Kinki University, Nara 631-8505, Japan2 Department of Soil Science, University of Nigeria, Nsukka 410001, Nigeria3 CSIR—Soil Research Institute, Academy Post Office, Kwadaso, Kumasi, Ghana4 Department of Crop Production Technology, Federal College of Agriculture, P.M.B. 7008, Ishiagu, Nigeria5 Department of Soil Science, Faculty of Agriculture, Andalas University, Limau Manis, Padang 25163, Indonesia
Correspondence should be addressed to Sunday E. Obalum, [email protected]
Received 4 November 2011; Revised 13 January 2012; Accepted 16 January 2012
Academic Editor: Rosario Garcıa Moreno
Copyright © 2012 Sunday E. Obalum et al. This is an open access article distributed under the Creative Commons AttributionLicense, which permits unrestricted use, distribution, and reproduction in any medium, provided the original work is properlycited.
The paper provides an insight into the problem of land degradation in Sub-Saharan Africa, with emphasis on soil erosion and itseffect on soil quality and productivity, and proposes a lowland-based rice-production technology for coping with the situation.Crop yields are, in addition to the degree of past and current erosion, determined by a number of interacting variables. This,coupled with the generally weak database on erosion-induced losses in crop yield in spite of the region’s high vulnerability toerosion, makes it difficult to attain a reliable inference on the cause-effect relationship between soil loss and productivity. Availabledata suggest, however, that the region is at risk of not meeting up with the challenges of agriculture in this 21st century. Based onthe few studies reviewed, methodology appears to have an overwhelming influence on the erosion-productivity response, whereasissues bordering on physical environment and soil affect the shape of the response curve. We argue that the sawah ecotechnologyhas the potential of countering the negative agronomic and environmental impacts of land degradation in Sub-Saharan Africa.This is a farmer-oriented, low-cost system of managing soil, water, and nutrient resources for enhancing lowland rice productivityand realizing Green Revolution in the region.
1. Introduction
Ever since mankind started agriculture, soil erosion has beenthe single largest threat to soil productivity and has remainedso till date [1]. This is so because removal of the topsoilby any means has, through research and historical evidence,been severally shown to have many deleterious effects onthe productive capacity of the soil as well as on ecologicalwellbeing. Doran and Parkin [2] captioned the impact ofsoil erosion in their popular maxim that “the thin layerof soil covering the earth’s surface represents the differencebetween survival and extinction for most terrestrial life.”Although fertile topsoils could be lost when scraped by
heavy machineries [3], the key avenues of topsoil loss includewater erosion and wind erosion. Sometimes erosion can besuch gradual for so long a time as to elude detection inone’s lifetime, thus making its adverse effects hard to detect.Eswaran et al. [4] propose an annual loss of 75 billion tonsof soil on a global basis which costs the world about US $400billion per year. A review of the global agronomic impact ofsoil erosion identifies two severity groups of continents andreveals that Africa belongs to the more vulnerable group [5].
Soil erosion by water seems to be the greatest factorlimiting soil productivity and impeding agricultural enter-prise in the entire humid tropical region [6]. This is evidentin many regions of Africa [7], mainly in the humid and
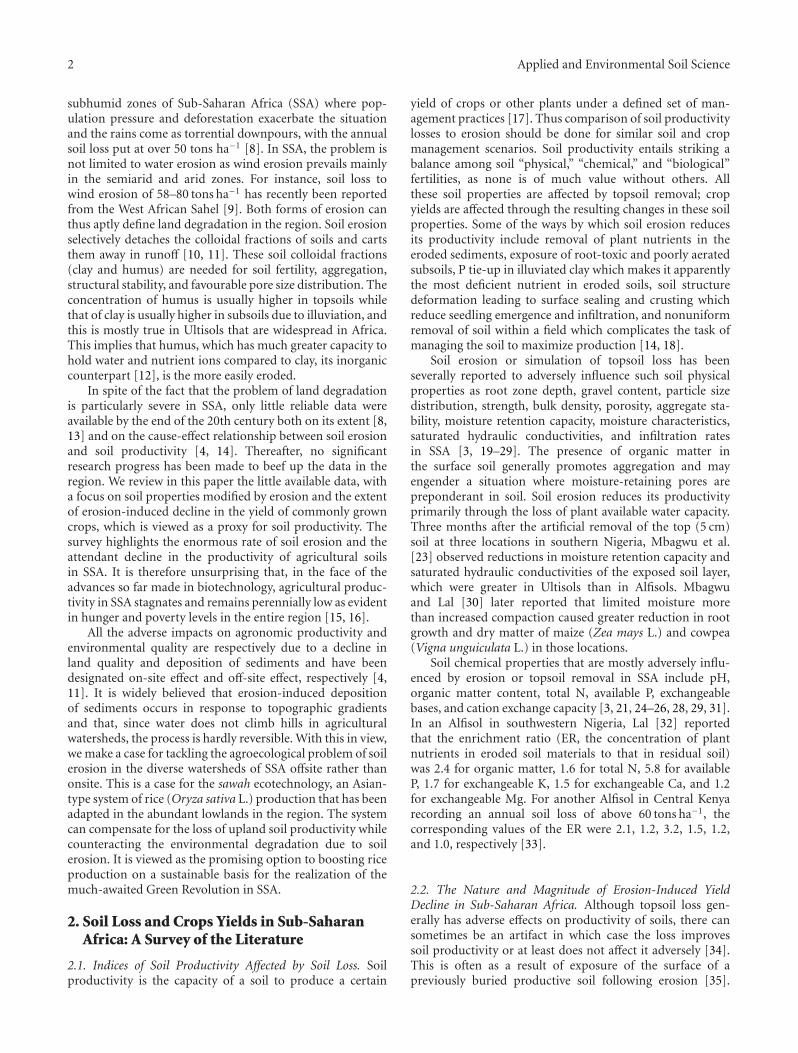
2 Applied and Environmental Soil Science
subhumid zones of Sub-Saharan Africa (SSA) where pop-ulation pressure and deforestation exacerbate the situationand the rains come as torrential downpours, with the annualsoil loss put at over 50 tons ha−1 [8]. In SSA, the problem isnot limited to water erosion as wind erosion prevails mainlyin the semiarid and arid zones. For instance, soil loss towind erosion of 58–80 tons ha−1 has recently been reportedfrom the West African Sahel [9]. Both forms of erosion canthus aptly define land degradation in the region. Soil erosionselectively detaches the colloidal fractions of soils and cartsthem away in runoff [10, 11]. These soil colloidal fractions(clay and humus) are needed for soil fertility, aggregation,structural stability, and favourable pore size distribution. Theconcentration of humus is usually higher in topsoils whilethat of clay is usually higher in subsoils due to illuviation, andthis is mostly true in Ultisols that are widespread in Africa.This implies that humus, which has much greater capacity tohold water and nutrient ions compared to clay, its inorganiccounterpart [12], is the more easily eroded.
In spite of the fact that the problem of land degradationis particularly severe in SSA, only little reliable data wereavailable by the end of the 20th century both on its extent [8,13] and on the cause-effect relationship between soil erosionand soil productivity [4, 14]. Thereafter, no significantresearch progress has been made to beef up the data in theregion. We review in this paper the little available data, witha focus on soil properties modified by erosion and the extentof erosion-induced decline in the yield of commonly growncrops, which is viewed as a proxy for soil productivity. Thesurvey highlights the enormous rate of soil erosion and theattendant decline in the productivity of agricultural soilsin SSA. It is therefore unsurprising that, in the face of theadvances so far made in biotechnology, agricultural produc-tivity in SSA stagnates and remains perennially low as evidentin hunger and poverty levels in the entire region [15, 16].
All the adverse impacts on agronomic productivity andenvironmental quality are respectively due to a decline inland quality and deposition of sediments and have beendesignated on-site effect and off-site effect, respectively [4,11]. It is widely believed that erosion-induced depositionof sediments occurs in response to topographic gradientsand that, since water does not climb hills in agriculturalwatersheds, the process is hardly reversible. With this in view,we make a case for tackling the agroecological problem of soilerosion in the diverse watersheds of SSA offsite rather thanonsite. This is a case for the sawah ecotechnology, an Asian-type system of rice (Oryza sativa L.) production that has beenadapted in the abundant lowlands in the region. The systemcan compensate for the loss of upland soil productivity whilecounteracting the environmental degradation due to soilerosion. It is viewed as the promising option to boosting riceproduction on a sustainable basis for the realization of themuch-awaited Green Revolution in SSA.
2. Soil Loss and Crops Yields in Sub-SaharanAfrica: A Survey of the Literature
2.1. Indices of Soil Productivity Affected by Soil Loss. Soilproductivity is the capacity of a soil to produce a certain
yield of crops or other plants under a defined set of man-agement practices [17]. Thus comparison of soil productivitylosses to erosion should be done for similar soil and cropmanagement scenarios. Soil productivity entails striking abalance among soil “physical,” “chemical,” and “biological”fertilities, as none is of much value without others. Allthese soil properties are affected by topsoil removal; cropyields are affected through the resulting changes in these soilproperties. Some of the ways by which soil erosion reducesits productivity include removal of plant nutrients in theeroded sediments, exposure of root-toxic and poorly aeratedsubsoils, P tie-up in illuviated clay which makes it apparentlythe most deficient nutrient in eroded soils, soil structuredeformation leading to surface sealing and crusting whichreduce seedling emergence and infiltration, and nonuniformremoval of soil within a field which complicates the task ofmanaging the soil to maximize production [14, 18].
Soil erosion or simulation of topsoil loss has beenseverally reported to adversely influence such soil physicalproperties as root zone depth, gravel content, particle sizedistribution, strength, bulk density, porosity, aggregate sta-bility, moisture retention capacity, moisture characteristics,saturated hydraulic conductivities, and infiltration ratesin SSA [3, 19–29]. The presence of organic matter inthe surface soil generally promotes aggregation and mayengender a situation where moisture-retaining pores arepreponderant in soil. Soil erosion reduces its productivityprimarily through the loss of plant available water capacity.Three months after the artificial removal of the top (5 cm)soil at three locations in southern Nigeria, Mbagwu et al.[23] observed reductions in moisture retention capacity andsaturated hydraulic conductivities of the exposed soil layer,which were greater in Ultisols than in Alfisols. Mbagwuand Lal [30] later reported that limited moisture morethan increased compaction caused greater reduction in rootgrowth and dry matter of maize (Zea mays L.) and cowpea(Vigna unguiculata L.) in those locations.
Soil chemical properties that are mostly adversely influ-enced by erosion or topsoil removal in SSA include pH,organic matter content, total N, available P, exchangeablebases, and cation exchange capacity [3, 21, 24–26, 28, 29, 31].In an Alfisol in southwestern Nigeria, Lal [32] reportedthat the enrichment ratio (ER, the concentration of plantnutrients in eroded soil materials to that in residual soil)was 2.4 for organic matter, 1.6 for total N, 5.8 for availableP, 1.7 for exchangeable K, 1.5 for exchangeable Ca, and 1.2for exchangeable Mg. For another Alfisol in Central Kenyarecording an annual soil loss of above 60 tons ha−1, thecorresponding values of the ER were 2.1, 1.2, 3.2, 1.5, 1.2,and 1.0, respectively [33].
2.2. The Nature and Magnitude of Erosion-Induced YieldDecline in Sub-Saharan Africa. Although topsoil loss gen-erally has adverse effects on productivity of soils, there cansometimes be an artifact in which case the loss improvessoil productivity or at least does not affect it adversely [34].This is often as a result of exposure of the surface of apreviously buried productive soil following erosion [35].
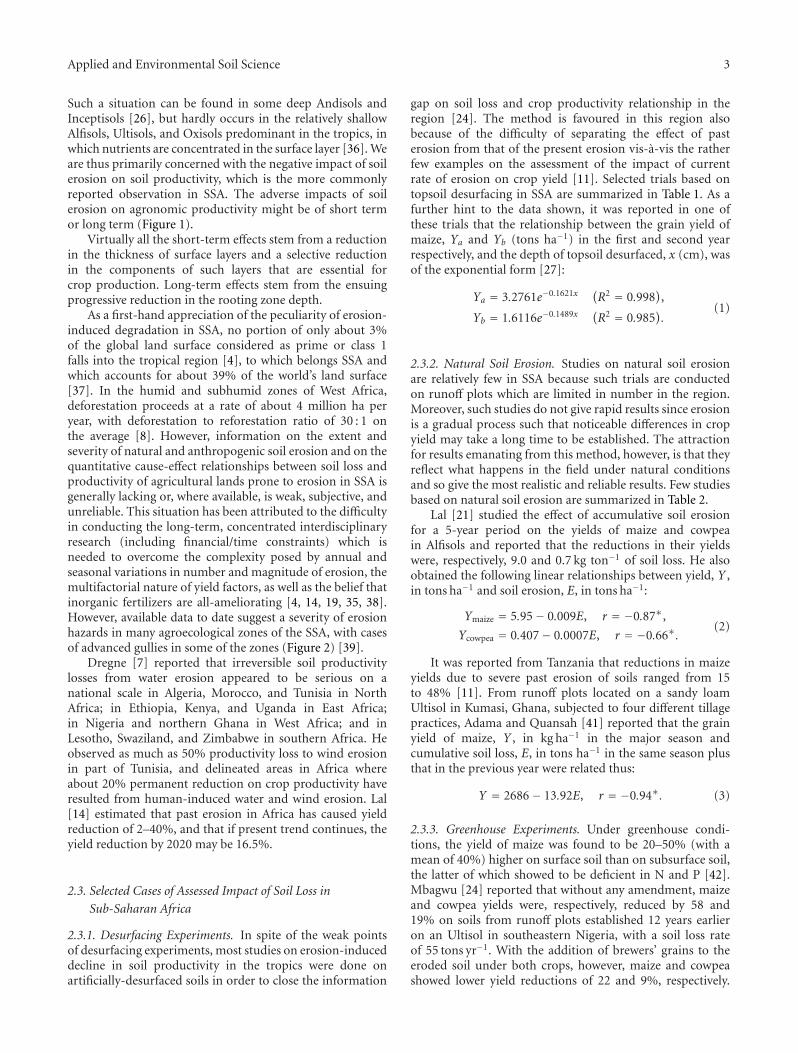
Applied and Environmental Soil Science 3
Such a situation can be found in some deep Andisols andInceptisols [26], but hardly occurs in the relatively shallowAlfisols, Ultisols, and Oxisols predominant in the tropics, inwhich nutrients are concentrated in the surface layer [36]. Weare thus primarily concerned with the negative impact of soilerosion on soil productivity, which is the more commonlyreported observation in SSA. The adverse impacts of soilerosion on agronomic productivity might be of short termor long term (Figure 1).
Virtually all the short-term effects stem from a reductionin the thickness of surface layers and a selective reductionin the components of such layers that are essential forcrop production. Long-term effects stem from the ensuingprogressive reduction in the rooting zone depth.
As a first-hand appreciation of the peculiarity of erosion-induced degradation in SSA, no portion of only about 3%of the global land surface considered as prime or class 1falls into the tropical region [4], to which belongs SSA andwhich accounts for about 39% of the world’s land surface[37]. In the humid and subhumid zones of West Africa,deforestation proceeds at a rate of about 4 million ha peryear, with deforestation to reforestation ratio of 30 : 1 onthe average [8]. However, information on the extent andseverity of natural and anthropogenic soil erosion and on thequantitative cause-effect relationships between soil loss andproductivity of agricultural lands prone to erosion in SSA isgenerally lacking or, where available, is weak, subjective, andunreliable. This situation has been attributed to the difficultyin conducting the long-term, concentrated interdisciplinaryresearch (including financial/time constraints) which isneeded to overcome the complexity posed by annual andseasonal variations in number and magnitude of erosion, themultifactorial nature of yield factors, as well as the belief thatinorganic fertilizers are all-ameliorating [4, 14, 19, 35, 38].However, available data to date suggest a severity of erosionhazards in many agroecological zones of the SSA, with casesof advanced gullies in some of the zones (Figure 2) [39].
Dregne [7] reported that irreversible soil productivitylosses from water erosion appeared to be serious on anational scale in Algeria, Morocco, and Tunisia in NorthAfrica; in Ethiopia, Kenya, and Uganda in East Africa;in Nigeria and northern Ghana in West Africa; and inLesotho, Swaziland, and Zimbabwe in southern Africa. Heobserved as much as 50% productivity loss to wind erosionin part of Tunisia, and delineated areas in Africa whereabout 20% permanent reduction on crop productivity haveresulted from human-induced water and wind erosion. Lal[14] estimated that past erosion in Africa has caused yieldreduction of 2–40%, and that if present trend continues, theyield reduction by 2020 may be 16.5%.
2.3. Selected Cases of Assessed Impact of Soil Loss in
Sub-Saharan Africa
2.3.1. Desurfacing Experiments. In spite of the weak pointsof desurfacing experiments, most studies on erosion-induceddecline in soil productivity in the tropics were done onartificially-desurfaced soils in order to close the information
gap on soil loss and crop productivity relationship in theregion [24]. The method is favoured in this region alsobecause of the difficulty of separating the effect of pasterosion from that of the present erosion vis-a-vis the ratherfew examples on the assessment of the impact of currentrate of erosion on crop yield [11]. Selected trials based ontopsoil desurfacing in SSA are summarized in Table 1. As afurther hint to the data shown, it was reported in one ofthese trials that the relationship between the grain yield ofmaize, Ya and Yb (tons ha−1) in the first and second yearrespectively, and the depth of topsoil desurfaced, x (cm), wasof the exponential form [27]:
Ya = 3.2761e−0.1621x (R2 = 0.998
),
Yb = 1.6116e−0.1489x (R2 = 0.985
).
(1)
2.3.2. Natural Soil Erosion. Studies on natural soil erosionare relatively few in SSA because such trials are conductedon runoff plots which are limited in number in the region.Moreover, such studies do not give rapid results since erosionis a gradual process such that noticeable differences in cropyield may take a long time to be established. The attractionfor results emanating from this method, however, is that theyreflect what happens in the field under natural conditionsand so give the most realistic and reliable results. Few studiesbased on natural soil erosion are summarized in Table 2.
Lal [21] studied the effect of accumulative soil erosionfor a 5-year period on the yields of maize and cowpeain Alfisols and reported that the reductions in their yieldswere, respectively, 9.0 and 0.7 kg ton−1 of soil loss. He alsoobtained the following linear relationships between yield, Y ,in tons ha−1 and soil erosion, E, in tons ha−1:
Ymaize = 5.95− 0.009E, r = −0.87∗,
Ycowpea = 0.407− 0.0007E, r = −0.66∗.(2)
It was reported from Tanzania that reductions in maizeyields due to severe past erosion of soils ranged from 15to 48% [11]. From runoff plots located on a sandy loamUltisol in Kumasi, Ghana, subjected to four different tillagepractices, Adama and Quansah [41] reported that the grainyield of maize, Y , in kg ha−1 in the major season andcumulative soil loss, E, in tons ha−1 in the same season plusthat in the previous year were related thus:
Y = 2686− 13.92E, r = −0.94∗. (3)
2.3.3. Greenhouse Experiments. Under greenhouse condi-tions, the yield of maize was found to be 20–50% (with amean of 40%) higher on surface soil than on subsurface soil,the latter of which showed to be deficient in N and P [42].Mbagwu [24] reported that without any amendment, maizeand cowpea yields were, respectively, reduced by 58 and19% on soils from runoff plots established 12 years earlieron an Ultisol in southeastern Nigeria, with a soil loss rateof 55 tons yr−1. With the addition of brewers’ grains to theeroded soil under both crops, however, maize and cowpeashowed lower yield reductions of 22 and 9%, respectively.
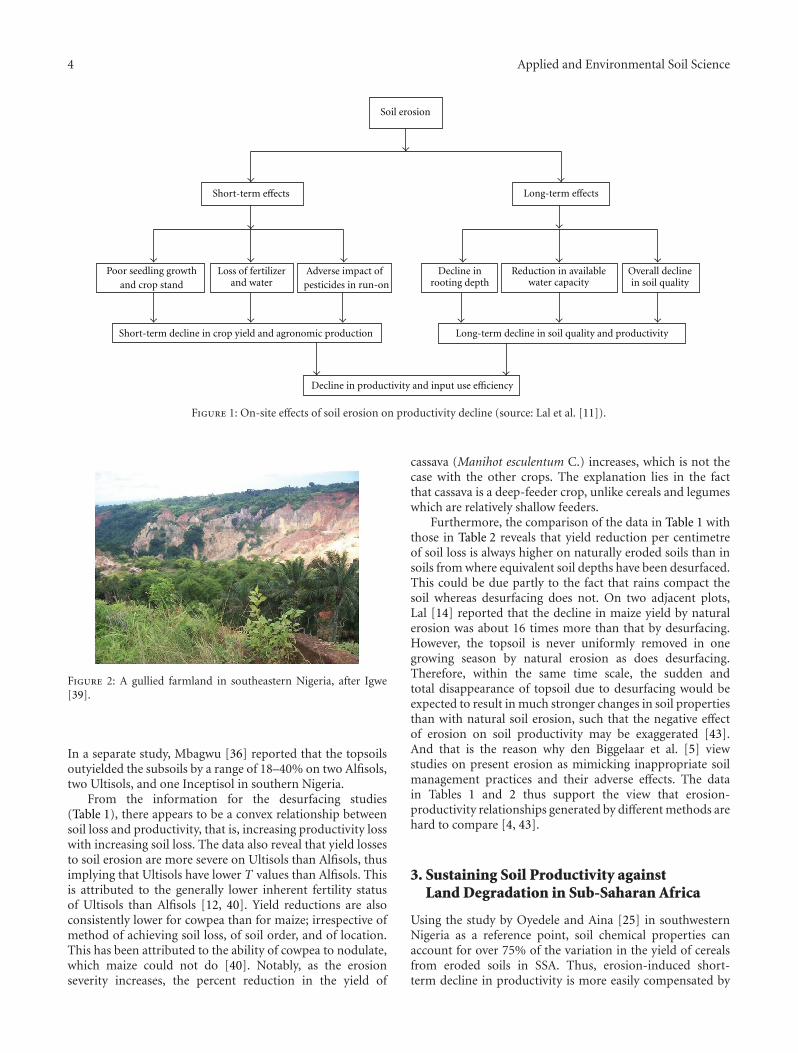
4 Applied and Environmental Soil Science
Soil erosion
Short-term effects Long-term effects
Loss of fertilizerand water
Adverse impact ofpesticides in
Decline inrooting depth
Reduction in availablewater capacity
Overall declinein soil quality
Decline in productivity and input use efficiency
Poor seedling growthand crop stand
Short-term decline in crop yield and agronomic production Long-term decline in soil quality and productivity
run-on
Figure 1: On-site effects of soil erosion on productivity decline (source: Lal et al. [11]).
Figure 2: A gullied farmland in southeastern Nigeria, after Igwe[39].
In a separate study, Mbagwu [36] reported that the topsoilsoutyielded the subsoils by a range of 18–40% on two Alfisols,two Ultisols, and one Inceptisol in southern Nigeria.
From the information for the desurfacing studies(Table 1), there appears to be a convex relationship betweensoil loss and productivity, that is, increasing productivity losswith increasing soil loss. The data also reveal that yield lossesto soil erosion are more severe on Ultisols than Alfisols, thusimplying that Ultisols have lower T values than Alfisols. Thisis attributed to the generally lower inherent fertility statusof Ultisols than Alfisols [12, 40]. Yield reductions are alsoconsistently lower for cowpea than for maize; irrespective ofmethod of achieving soil loss, of soil order, and of location.This has been attributed to the ability of cowpea to nodulate,which maize could not do [40]. Notably, as the erosionseverity increases, the percent reduction in the yield of
cassava (Manihot esculentum C.) increases, which is not thecase with the other crops. The explanation lies in the factthat cassava is a deep-feeder crop, unlike cereals and legumeswhich are relatively shallow feeders.
Furthermore, the comparison of the data in Table 1 withthose in Table 2 reveals that yield reduction per centimetreof soil loss is always higher on naturally eroded soils than insoils from where equivalent soil depths have been desurfaced.This could be due partly to the fact that rains compact thesoil whereas desurfacing does not. On two adjacent plots,Lal [14] reported that the decline in maize yield by naturalerosion was about 16 times more than that by desurfacing.However, the topsoil is never uniformly removed in onegrowing season by natural erosion as does desurfacing.Therefore, within the same time scale, the sudden andtotal disappearance of topsoil due to desurfacing would beexpected to result in much stronger changes in soil propertiesthan with natural soil erosion, such that the negative effectof erosion on soil productivity may be exaggerated [43].And that is the reason why den Biggelaar et al. [5] viewstudies on present erosion as mimicking inappropriate soilmanagement practices and their adverse effects. The datain Tables 1 and 2 thus support the view that erosion-productivity relationships generated by different methods arehard to compare [4, 43].
3. Sustaining Soil Productivity againstLand Degradation in Sub-Saharan Africa
Using the study by Oyedele and Aina [25] in southwesternNigeria as a reference point, soil chemical properties canaccount for over 75% of the variation in the yield of cerealsfrom eroded soils in SSA. Thus, erosion-induced short-term decline in productivity is more easily compensated by
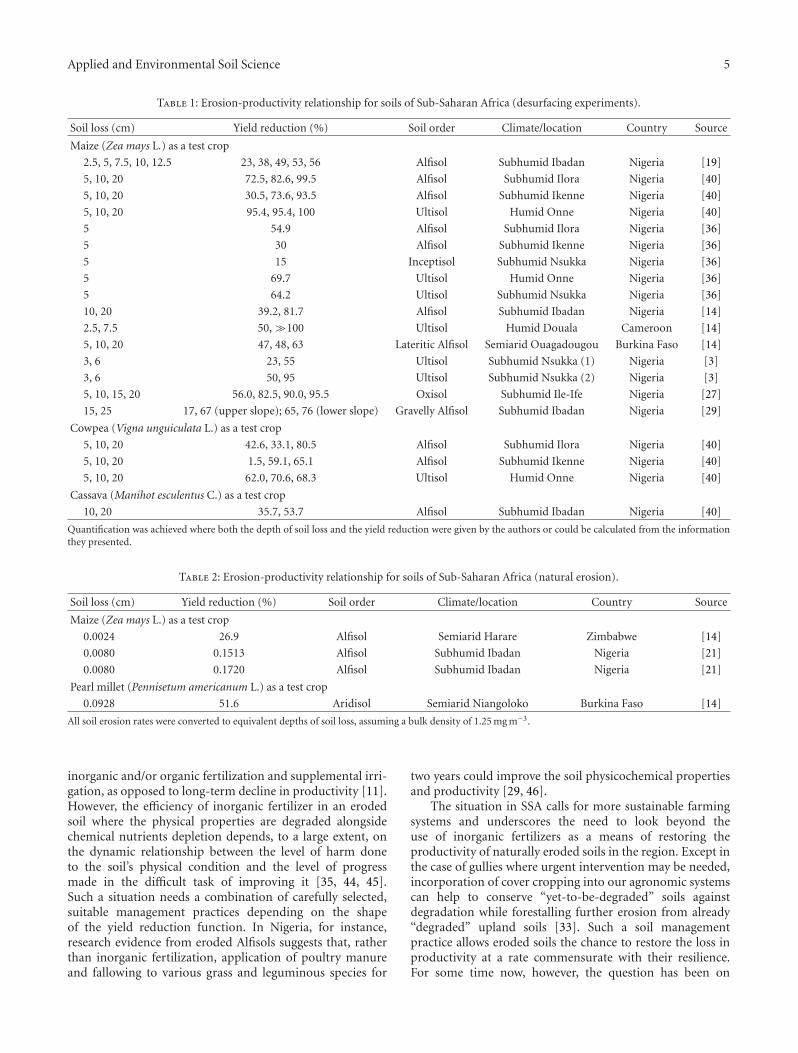
Applied and Environmental Soil Science 5
Table 1: Erosion-productivity relationship for soils of Sub-Saharan Africa (desurfacing experiments).
Soil loss (cm) Yield reduction (%) Soil order Climate/location Country Source
Maize (Zea mays L.) as a test crop
2.5, 5, 7.5, 10, 12.5 23, 38, 49, 53, 56 Alfisol Subhumid Ibadan Nigeria [19]
5, 10, 20 72.5, 82.6, 99.5 Alfisol Subhumid Ilora Nigeria [40]
5, 10, 20 30.5, 73.6, 93.5 Alfisol Subhumid Ikenne Nigeria [40]
5, 10, 20 95.4, 95.4, 100 Ultisol Humid Onne Nigeria [40]
5 54.9 Alfisol Subhumid Ilora Nigeria [36]
5 30 Alfisol Subhumid Ikenne Nigeria [36]
5 15 Inceptisol Subhumid Nsukka Nigeria [36]
5 69.7 Ultisol Humid Onne Nigeria [36]
5 64.2 Ultisol Subhumid Nsukka Nigeria [36]
10, 20 39.2, 81.7 Alfisol Subhumid Ibadan Nigeria [14]
2.5, 7.5 50,�100 Ultisol Humid Douala Cameroon [14]
5, 10, 20 47, 48, 63 Lateritic Alfisol Semiarid Ouagadougou Burkina Faso [14]
3, 6 23, 55 Ultisol Subhumid Nsukka (1) Nigeria [3]
3, 6 50, 95 Ultisol Subhumid Nsukka (2) Nigeria [3]
5, 10, 15, 20 56.0, 82.5, 90.0, 95.5 Oxisol Subhumid Ile-Ife Nigeria [27]
15, 25 17, 67 (upper slope); 65, 76 (lower slope) Gravelly Alfisol Subhumid Ibadan Nigeria [29]
Cowpea (Vigna unguiculata L.) as a test crop
5, 10, 20 42.6, 33.1, 80.5 Alfisol Subhumid Ilora Nigeria [40]
5, 10, 20 1.5, 59.1, 65.1 Alfisol Subhumid Ikenne Nigeria [40]
5, 10, 20 62.0, 70.6, 68.3 Ultisol Humid Onne Nigeria [40]
Cassava (Manihot esculentus C.) as a test crop
10, 20 35.7, 53.7 Alfisol Subhumid Ibadan Nigeria [40]
Quantification was achieved where both the depth of soil loss and the yield reduction were given by the authors or could be calculated from the informationthey presented.
Table 2: Erosion-productivity relationship for soils of Sub-Saharan Africa (natural erosion).
Soil loss (cm) Yield reduction (%) Soil order Climate/location Country Source
Maize (Zea mays L.) as a test crop
0.0024 26.9 Alfisol Semiarid Harare Zimbabwe [14]
0.0080 0.1513 Alfisol Subhumid Ibadan Nigeria [21]
0.0080 0.1720 Alfisol Subhumid Ibadan Nigeria [21]
Pearl millet (Pennisetum americanum L.) as a test crop
0.0928 51.6 Aridisol Semiarid Niangoloko Burkina Faso [14]
All soil erosion rates were converted to equivalent depths of soil loss, assuming a bulk density of 1.25 mg m−3.
inorganic and/or organic fertilization and supplemental irri-gation, as opposed to long-term decline in productivity [11].However, the efficiency of inorganic fertilizer in an erodedsoil where the physical properties are degraded alongsidechemical nutrients depletion depends, to a large extent, onthe dynamic relationship between the level of harm doneto the soil’s physical condition and the level of progressmade in the difficult task of improving it [35, 44, 45].Such a situation needs a combination of carefully selected,suitable management practices depending on the shapeof the yield reduction function. In Nigeria, for instance,research evidence from eroded Alfisols suggests that, ratherthan inorganic fertilization, application of poultry manureand fallowing to various grass and leguminous species for
two years could improve the soil physicochemical propertiesand productivity [29, 46].
The situation in SSA calls for more sustainable farmingsystems and underscores the need to look beyond theuse of inorganic fertilizers as a means of restoring theproductivity of naturally eroded soils in the region. Except inthe case of gullies where urgent intervention may be needed,incorporation of cover cropping into our agronomic systemscan help to conserve “yet-to-be-degraded” soils againstdegradation while forestalling further erosion from already“degraded” upland soils [33]. Such a soil managementpractice allows eroded soils the chance to restore the loss inproductivity at a rate commensurate with their resilience.For some time now, however, the question has been on
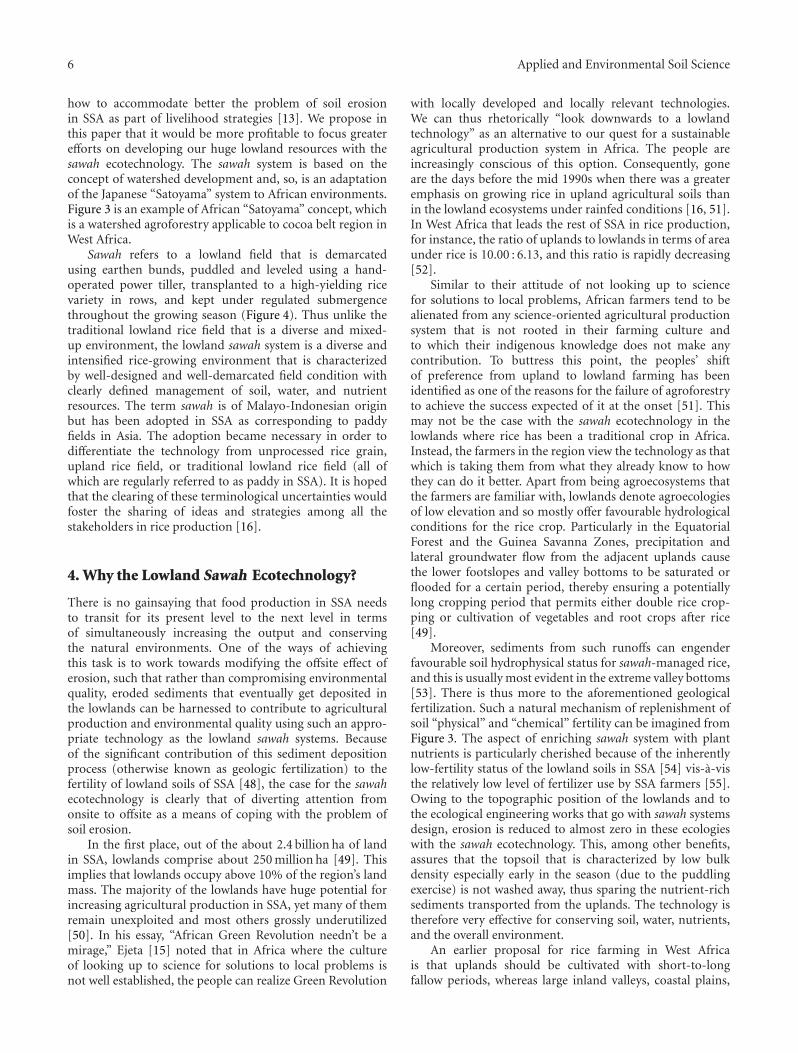
6 Applied and Environmental Soil Science
how to accommodate better the problem of soil erosionin SSA as part of livelihood strategies [13]. We propose inthis paper that it would be more profitable to focus greaterefforts on developing our huge lowland resources with thesawah ecotechnology. The sawah system is based on theconcept of watershed development and, so, is an adaptationof the Japanese “Satoyama” system to African environments.Figure 3 is an example of African “Satoyama” concept, whichis a watershed agroforestry applicable to cocoa belt region inWest Africa.
Sawah refers to a lowland field that is demarcatedusing earthen bunds, puddled and leveled using a hand-operated power tiller, transplanted to a high-yielding ricevariety in rows, and kept under regulated submergencethroughout the growing season (Figure 4). Thus unlike thetraditional lowland rice field that is a diverse and mixed-up environment, the lowland sawah system is a diverse andintensified rice-growing environment that is characterizedby well-designed and well-demarcated field condition withclearly defined management of soil, water, and nutrientresources. The term sawah is of Malayo-Indonesian originbut has been adopted in SSA as corresponding to paddyfields in Asia. The adoption became necessary in order todifferentiate the technology from unprocessed rice grain,upland rice field, or traditional lowland rice field (all ofwhich are regularly referred to as paddy in SSA). It is hopedthat the clearing of these terminological uncertainties wouldfoster the sharing of ideas and strategies among all thestakeholders in rice production [16].
4. Why the Lowland Sawah Ecotechnology?
There is no gainsaying that food production in SSA needsto transit for its present level to the next level in termsof simultaneously increasing the output and conservingthe natural environments. One of the ways of achievingthis task is to work towards modifying the offsite effect oferosion, such that rather than compromising environmentalquality, eroded sediments that eventually get deposited inthe lowlands can be harnessed to contribute to agriculturalproduction and environmental quality using such an appro-priate technology as the lowland sawah systems. Becauseof the significant contribution of this sediment depositionprocess (otherwise known as geologic fertilization) to thefertility of lowland soils of SSA [48], the case for the sawahecotechnology is clearly that of diverting attention fromonsite to offsite as a means of coping with the problem ofsoil erosion.
In the first place, out of the about 2.4 billion ha of landin SSA, lowlands comprise about 250 million ha [49]. Thisimplies that lowlands occupy above 10% of the region’s landmass. The majority of the lowlands have huge potential forincreasing agricultural production in SSA, yet many of themremain unexploited and most others grossly underutilized[50]. In his essay, “African Green Revolution needn’t be amirage,” Ejeta [15] noted that in Africa where the cultureof looking up to science for solutions to local problems isnot well established, the people can realize Green Revolution
with locally developed and locally relevant technologies.We can thus rhetorically “look downwards to a lowlandtechnology” as an alternative to our quest for a sustainableagricultural production system in Africa. The people areincreasingly conscious of this option. Consequently, goneare the days before the mid 1990s when there was a greateremphasis on growing rice in upland agricultural soils thanin the lowland ecosystems under rainfed conditions [16, 51].In West Africa that leads the rest of SSA in rice production,for instance, the ratio of uplands to lowlands in terms of areaunder rice is 10.00 : 6.13, and this ratio is rapidly decreasing[52].
Similar to their attitude of not looking up to sciencefor solutions to local problems, African farmers tend to bealienated from any science-oriented agricultural productionsystem that is not rooted in their farming culture andto which their indigenous knowledge does not make anycontribution. To buttress this point, the peoples’ shiftof preference from upland to lowland farming has beenidentified as one of the reasons for the failure of agroforestryto achieve the success expected of it at the onset [51]. Thismay not be the case with the sawah ecotechnology in thelowlands where rice has been a traditional crop in Africa.Instead, the farmers in the region view the technology as thatwhich is taking them from what they already know to howthey can do it better. Apart from being agroecosystems thatthe farmers are familiar with, lowlands denote agroecologiesof low elevation and so mostly offer favourable hydrologicalconditions for the rice crop. Particularly in the EquatorialForest and the Guinea Savanna Zones, precipitation andlateral groundwater flow from the adjacent uplands causethe lower footslopes and valley bottoms to be saturated orflooded for a certain period, thereby ensuring a potentiallylong cropping period that permits either double rice crop-ping or cultivation of vegetables and root crops after rice[49].
Moreover, sediments from such runoffs can engenderfavourable soil hydrophysical status for sawah-managed rice,and this is usually most evident in the extreme valley bottoms[53]. There is thus more to the aforementioned geologicalfertilization. Such a natural mechanism of replenishment ofsoil “physical” and “chemical” fertility can be imagined fromFigure 3. The aspect of enriching sawah system with plantnutrients is particularly cherished because of the inherentlylow-fertility status of the lowland soils in SSA [54] vis-a-visthe relatively low level of fertilizer use by SSA farmers [55].Owing to the topographic position of the lowlands and tothe ecological engineering works that go with sawah systemsdesign, erosion is reduced to almost zero in these ecologieswith the sawah ecotechnology. This, among other benefits,assures that the topsoil that is characterized by low bulkdensity especially early in the season (due to the puddlingexercise) is not washed away, thus sparing the nutrient-richsediments transported from the uplands. The technology istherefore very effective for conserving soil, water, nutrients,and the overall environment.
An earlier proposal for rice farming in West Africais that uplands should be cultivated with short-to-longfallow periods, whereas large inland valleys, coastal plains,
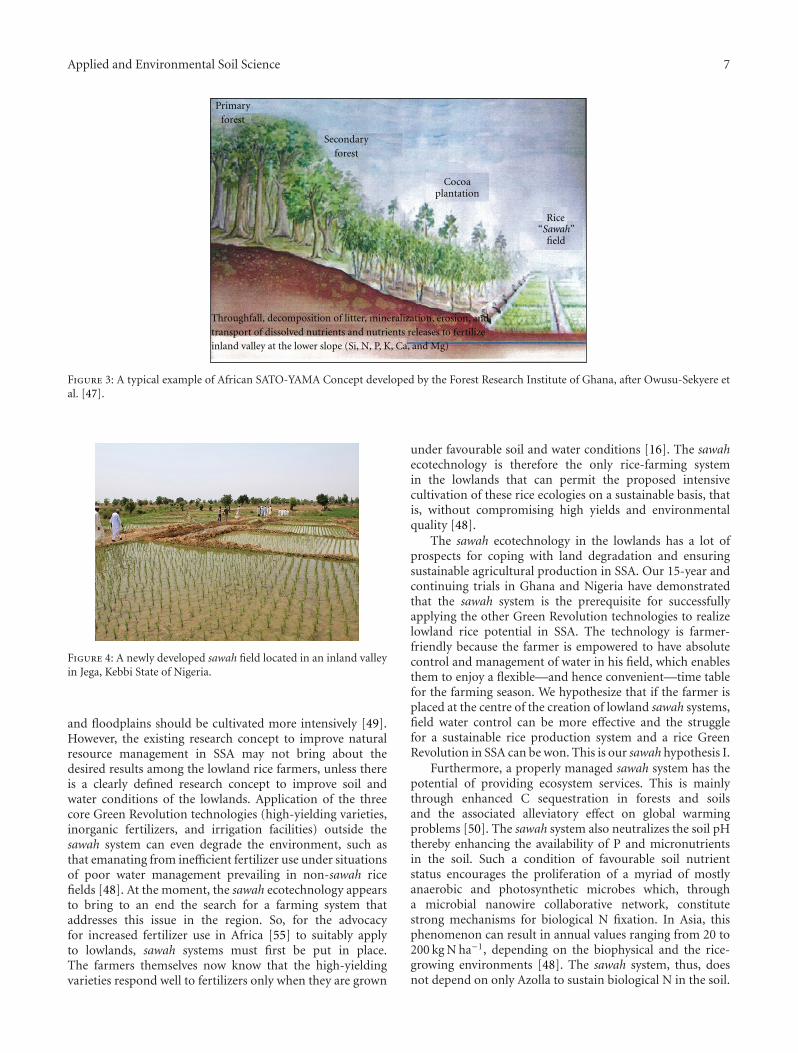
Applied and Environmental Soil Science 7
Primaryforest
o e tSecondary
f r s
olC coa
p antation
Throughfall, decomposition of litter, mineralization,transport of dissolved nutrients and nutrients releases to fertilizeinland valley at the lower slope (Si, N, P, K, Ca
field
, and Mg)
erosion, and
Rice“Sawah”
Figure 3: A typical example of African SATO-YAMA Concept developed by the Forest Research Institute of Ghana, after Owusu-Sekyere etal. [47].
Figure 4: A newly developed sawah field located in an inland valleyin Jega, Kebbi State of Nigeria.
and floodplains should be cultivated more intensively [49].However, the existing research concept to improve naturalresource management in SSA may not bring about thedesired results among the lowland rice farmers, unless thereis a clearly defined research concept to improve soil andwater conditions of the lowlands. Application of the threecore Green Revolution technologies (high-yielding varieties,inorganic fertilizers, and irrigation facilities) outside thesawah system can even degrade the environment, such asthat emanating from inefficient fertilizer use under situationsof poor water management prevailing in non-sawah ricefields [48]. At the moment, the sawah ecotechnology appearsto bring to an end the search for a farming system thataddresses this issue in the region. So, for the advocacyfor increased fertilizer use in Africa [55] to suitably applyto lowlands, sawah systems must first be put in place.The farmers themselves now know that the high-yieldingvarieties respond well to fertilizers only when they are grown
under favourable soil and water conditions [16]. The sawahecotechnology is therefore the only rice-farming systemin the lowlands that can permit the proposed intensivecultivation of these rice ecologies on a sustainable basis, thatis, without compromising high yields and environmentalquality [48].
The sawah ecotechnology in the lowlands has a lot ofprospects for coping with land degradation and ensuringsustainable agricultural production in SSA. Our 15-year andcontinuing trials in Ghana and Nigeria have demonstratedthat the sawah system is the prerequisite for successfullyapplying the other Green Revolution technologies to realizelowland rice potential in SSA. The technology is farmer-friendly because the farmer is empowered to have absolutecontrol and management of water in his field, which enablesthem to enjoy a flexible—and hence convenient—time tablefor the farming season. We hypothesize that if the farmer isplaced at the centre of the creation of lowland sawah systems,field water control can be more effective and the strugglefor a sustainable rice production system and a rice GreenRevolution in SSA can be won. This is our sawah hypothesis I.
Furthermore, a properly managed sawah system has thepotential of providing ecosystem services. This is mainlythrough enhanced C sequestration in forests and soilsand the associated alleviatory effect on global warmingproblems [50]. The sawah system also neutralizes the soil pHthereby enhancing the availability of P and micronutrientsin the soil. Such a condition of favourable soil nutrientstatus encourages the proliferation of a myriad of mostlyanaerobic and photosynthetic microbes which, througha microbial nanowire collaborative network, constitutestrong mechanisms for biological N fixation. In Asia, thisphenomenon can result in annual values ranging from 20 to200 kg N ha−1, depending on the biophysical and the rice-growing environments [48]. The sawah system, thus, doesnot depend on only Azolla to sustain biological N in the soil.
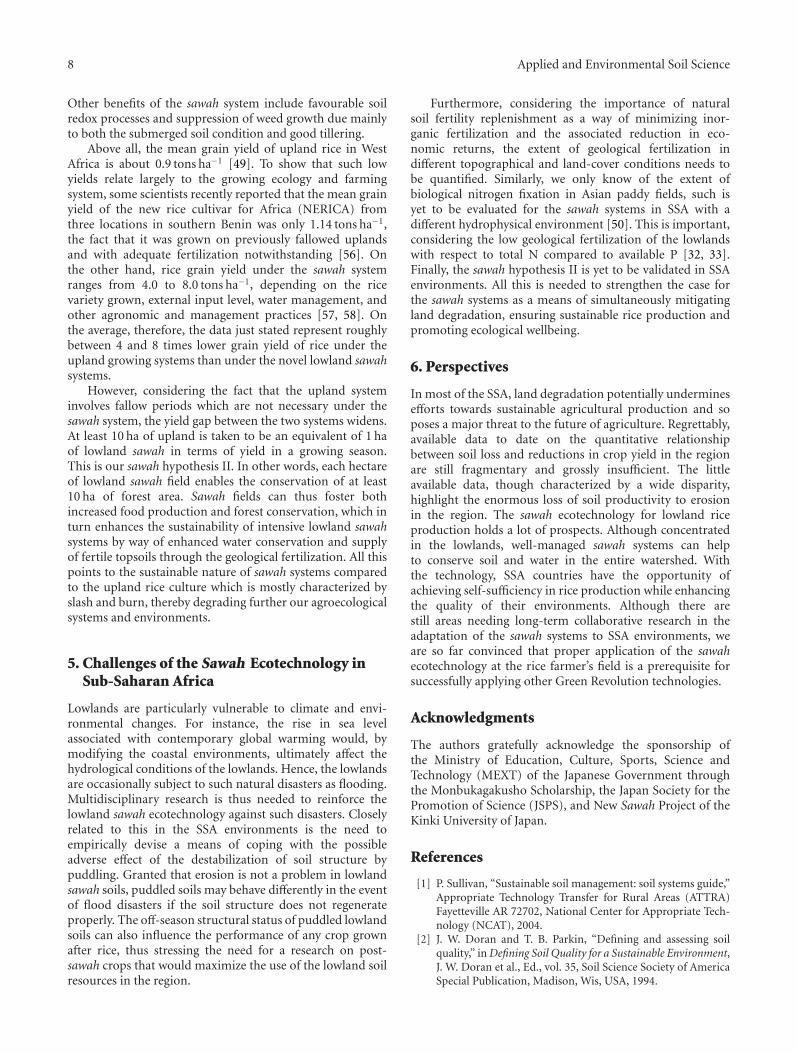
8 Applied and Environmental Soil Science
Other benefits of the sawah system include favourable soilredox processes and suppression of weed growth due mainlyto both the submerged soil condition and good tillering.
Above all, the mean grain yield of upland rice in WestAfrica is about 0.9 tons ha−1 [49]. To show that such lowyields relate largely to the growing ecology and farmingsystem, some scientists recently reported that the mean grainyield of the new rice cultivar for Africa (NERICA) fromthree locations in southern Benin was only 1.14 tons ha−1,the fact that it was grown on previously fallowed uplandsand with adequate fertilization notwithstanding [56]. Onthe other hand, rice grain yield under the sawah systemranges from 4.0 to 8.0 tons ha−1, depending on the ricevariety grown, external input level, water management, andother agronomic and management practices [57, 58]. Onthe average, therefore, the data just stated represent roughlybetween 4 and 8 times lower grain yield of rice under theupland growing systems than under the novel lowland sawahsystems.
However, considering the fact that the upland systeminvolves fallow periods which are not necessary under thesawah system, the yield gap between the two systems widens.At least 10 ha of upland is taken to be an equivalent of 1 haof lowland sawah in terms of yield in a growing season.This is our sawah hypothesis II. In other words, each hectareof lowland sawah field enables the conservation of at least10 ha of forest area. Sawah fields can thus foster bothincreased food production and forest conservation, which inturn enhances the sustainability of intensive lowland sawahsystems by way of enhanced water conservation and supplyof fertile topsoils through the geological fertilization. All thispoints to the sustainable nature of sawah systems comparedto the upland rice culture which is mostly characterized byslash and burn, thereby degrading further our agroecologicalsystems and environments.
5. Challenges of the Sawah Ecotechnology inSub-Saharan Africa
Lowlands are particularly vulnerable to climate and envi-ronmental changes. For instance, the rise in sea levelassociated with contemporary global warming would, bymodifying the coastal environments, ultimately affect thehydrological conditions of the lowlands. Hence, the lowlandsare occasionally subject to such natural disasters as flooding.Multidisciplinary research is thus needed to reinforce thelowland sawah ecotechnology against such disasters. Closelyrelated to this in the SSA environments is the need toempirically devise a means of coping with the possibleadverse effect of the destabilization of soil structure bypuddling. Granted that erosion is not a problem in lowlandsawah soils, puddled soils may behave differently in the eventof flood disasters if the soil structure does not regenerateproperly. The off-season structural status of puddled lowlandsoils can also influence the performance of any crop grownafter rice, thus stressing the need for a research on post-sawah crops that would maximize the use of the lowland soilresources in the region.
Furthermore, considering the importance of naturalsoil fertility replenishment as a way of minimizing inor-ganic fertilization and the associated reduction in eco-nomic returns, the extent of geological fertilization indifferent topographical and land-cover conditions needs tobe quantified. Similarly, we only know of the extent ofbiological nitrogen fixation in Asian paddy fields, such isyet to be evaluated for the sawah systems in SSA with adifferent hydrophysical environment [50]. This is important,considering the low geological fertilization of the lowlandswith respect to total N compared to available P [32, 33].Finally, the sawah hypothesis II is yet to be validated in SSAenvironments. All this is needed to strengthen the case forthe sawah systems as a means of simultaneously mitigatingland degradation, ensuring sustainable rice production andpromoting ecological wellbeing.
6. Perspectives
In most of the SSA, land degradation potentially underminesefforts towards sustainable agricultural production and soposes a major threat to the future of agriculture. Regrettably,available data to date on the quantitative relationshipbetween soil loss and reductions in crop yield in the regionare still fragmentary and grossly insufficient. The littleavailable data, though characterized by a wide disparity,highlight the enormous loss of soil productivity to erosionin the region. The sawah ecotechnology for lowland riceproduction holds a lot of prospects. Although concentratedin the lowlands, well-managed sawah systems can helpto conserve soil and water in the entire watershed. Withthe technology, SSA countries have the opportunity ofachieving self-sufficiency in rice production while enhancingthe quality of their environments. Although there arestill areas needing long-term collaborative research in theadaptation of the sawah systems to SSA environments, weare so far convinced that proper application of the sawahecotechnology at the rice farmer’s field is a prerequisite forsuccessfully applying other Green Revolution technologies.
Acknowledgments
The authors gratefully acknowledge the sponsorship ofthe Ministry of Education, Culture, Sports, Science andTechnology (MEXT) of the Japanese Government throughthe Monbukagakusho Scholarship, the Japan Society for thePromotion of Science (JSPS), and New Sawah Project of theKinki University of Japan.
References
[1] P. Sullivan, “Sustainable soil management: soil systems guide,”Appropriate Technology Transfer for Rural Areas (ATTRA)Fayetteville AR 72702, National Center for Appropriate Tech-nology (NCAT), 2004.
[2] J. W. Doran and T. B. Parkin, “Defining and assessing soilquality,” in Defining Soil Quality for a Sustainable Environment,J. W. Doran et al., Ed., vol. 35, Soil Science Society of AmericaSpecial Publication, Madison, Wis, USA, 1994.
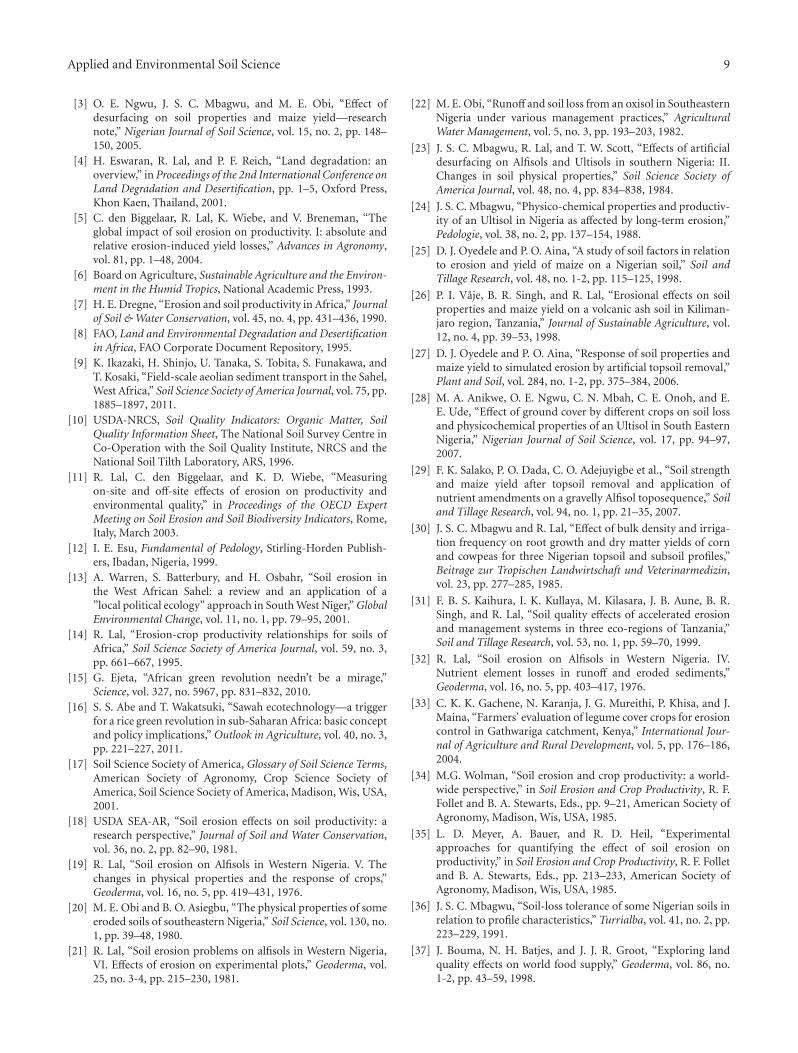
Applied and Environmental Soil Science 9
[3] O. E. Ngwu, J. S. C. Mbagwu, and M. E. Obi, “Effect ofdesurfacing on soil properties and maize yield—researchnote,” Nigerian Journal of Soil Science, vol. 15, no. 2, pp. 148–150, 2005.
[4] H. Eswaran, R. Lal, and P. F. Reich, “Land degradation: anoverview,” in Proceedings of the 2nd International Conference onLand Degradation and Desertification, pp. 1–5, Oxford Press,Khon Kaen, Thailand, 2001.
[5] C. den Biggelaar, R. Lal, K. Wiebe, and V. Breneman, “Theglobal impact of soil erosion on productivity. I: absolute andrelative erosion-induced yield losses,” Advances in Agronomy,vol. 81, pp. 1–48, 2004.
[6] Board on Agriculture, Sustainable Agriculture and the Environ-ment in the Humid Tropics, National Academic Press, 1993.
[7] H. E. Dregne, “Erosion and soil productivity in Africa,” Journalof Soil & Water Conservation, vol. 45, no. 4, pp. 431–436, 1990.
[8] FAO, Land and Environmental Degradation and Desertificationin Africa, FAO Corporate Document Repository, 1995.
[9] K. Ikazaki, H. Shinjo, U. Tanaka, S. Tobita, S. Funakawa, andT. Kosaki, “Field-scale aeolian sediment transport in the Sahel,West Africa,” Soil Science Society of America Journal, vol. 75, pp.1885–1897, 2011.
[10] USDA-NRCS, Soil Quality Indicators: Organic Matter, SoilQuality Information Sheet, The National Soil Survey Centre inCo-Operation with the Soil Quality Institute, NRCS and theNational Soil Tilth Laboratory, ARS, 1996.
[11] R. Lal, C. den Biggelaar, and K. D. Wiebe, “Measuringon-site and off-site effects of erosion on productivity andenvironmental quality,” in Proceedings of the OECD ExpertMeeting on Soil Erosion and Soil Biodiversity Indicators, Rome,Italy, March 2003.
[12] I. E. Esu, Fundamental of Pedology, Stirling-Horden Publish-ers, Ibadan, Nigeria, 1999.
[13] A. Warren, S. Batterbury, and H. Osbahr, “Soil erosion inthe West African Sahel: a review and an application of a”local political ecology” approach in South West Niger,” GlobalEnvironmental Change, vol. 11, no. 1, pp. 79–95, 2001.
[14] R. Lal, “Erosion-crop productivity relationships for soils ofAfrica,” Soil Science Society of America Journal, vol. 59, no. 3,pp. 661–667, 1995.
[15] G. Ejeta, “African green revolution needn’t be a mirage,”Science, vol. 327, no. 5967, pp. 831–832, 2010.
[16] S. S. Abe and T. Wakatsuki, “Sawah ecotechnology—a triggerfor a rice green revolution in sub-Saharan Africa: basic conceptand policy implications,” Outlook in Agriculture, vol. 40, no. 3,pp. 221–227, 2011.
[17] Soil Science Society of America, Glossary of Soil Science Terms,American Society of Agronomy, Crop Science Society ofAmerica, Soil Science Society of America, Madison, Wis, USA,2001.
[18] USDA SEA-AR, “Soil erosion effects on soil productivity: aresearch perspective,” Journal of Soil and Water Conservation,vol. 36, no. 2, pp. 82–90, 1981.
[19] R. Lal, “Soil erosion on Alfisols in Western Nigeria. V. Thechanges in physical properties and the response of crops,”Geoderma, vol. 16, no. 5, pp. 419–431, 1976.
[20] M. E. Obi and B. O. Asiegbu, “The physical properties of someeroded soils of southeastern Nigeria,” Soil Science, vol. 130, no.1, pp. 39–48, 1980.
[21] R. Lal, “Soil erosion problems on alfisols in Western Nigeria,VI. Effects of erosion on experimental plots,” Geoderma, vol.25, no. 3-4, pp. 215–230, 1981.
[22] M. E. Obi, “Runoff and soil loss from an oxisol in SoutheasternNigeria under various management practices,” AgriculturalWater Management, vol. 5, no. 3, pp. 193–203, 1982.
[23] J. S. C. Mbagwu, R. Lal, and T. W. Scott, “Effects of artificialdesurfacing on Alfisols and Ultisols in southern Nigeria: II.Changes in soil physical properties,” Soil Science Society ofAmerica Journal, vol. 48, no. 4, pp. 834–838, 1984.
[24] J. S. C. Mbagwu, “Physico-chemical properties and productiv-ity of an Ultisol in Nigeria as affected by long-term erosion,”Pedologie, vol. 38, no. 2, pp. 137–154, 1988.
[25] D. J. Oyedele and P. O. Aina, “A study of soil factors in relationto erosion and yield of maize on a Nigerian soil,” Soil andTillage Research, vol. 48, no. 1-2, pp. 115–125, 1998.
[26] P. I. Vaje, B. R. Singh, and R. Lal, “Erosional effects on soilproperties and maize yield on a volcanic ash soil in Kiliman-jaro region, Tanzania,” Journal of Sustainable Agriculture, vol.12, no. 4, pp. 39–53, 1998.
[27] D. J. Oyedele and P. O. Aina, “Response of soil properties andmaize yield to simulated erosion by artificial topsoil removal,”Plant and Soil, vol. 284, no. 1-2, pp. 375–384, 2006.
[28] M. A. Anikwe, O. E. Ngwu, C. N. Mbah, C. E. Onoh, and E.E. Ude, “Effect of ground cover by different crops on soil lossand physicochemical properties of an Ultisol in South EasternNigeria,” Nigerian Journal of Soil Science, vol. 17, pp. 94–97,2007.
[29] F. K. Salako, P. O. Dada, C. O. Adejuyigbe et al., “Soil strengthand maize yield after topsoil removal and application ofnutrient amendments on a gravelly Alfisol toposequence,” Soiland Tillage Research, vol. 94, no. 1, pp. 21–35, 2007.
[30] J. S. C. Mbagwu and R. Lal, “Effect of bulk density and irriga-tion frequency on root growth and dry matter yields of cornand cowpeas for three Nigerian topsoil and subsoil profiles,”Beitrage zur Tropischen Landwirtschaft und Veterinarmedizin,vol. 23, pp. 277–285, 1985.
[31] F. B. S. Kaihura, I. K. Kullaya, M. Kilasara, J. B. Aune, B. R.Singh, and R. Lal, “Soil quality effects of accelerated erosionand management systems in three eco-regions of Tanzania,”Soil and Tillage Research, vol. 53, no. 1, pp. 59–70, 1999.
[32] R. Lal, “Soil erosion on Alfisols in Western Nigeria. IV.Nutrient element losses in runoff and eroded sediments,”Geoderma, vol. 16, no. 5, pp. 403–417, 1976.
[33] C. K. K. Gachene, N. Karanja, J. G. Mureithi, P. Khisa, and J.Maina, “Farmers’ evaluation of legume cover crops for erosioncontrol in Gathwariga catchment, Kenya,” International Jour-nal of Agriculture and Rural Development, vol. 5, pp. 176–186,2004.
[34] M.G. Wolman, “Soil erosion and crop productivity: a world-wide perspective,” in Soil Erosion and Crop Productivity, R. F.Follet and B. A. Stewarts, Eds., pp. 9–21, American Society ofAgronomy, Madison, Wis, USA, 1985.
[35] L. D. Meyer, A. Bauer, and R. D. Heil, “Experimentalapproaches for quantifying the effect of soil erosion onproductivity,” in Soil Erosion and Crop Productivity, R. F. Folletand B. A. Stewarts, Eds., pp. 213–233, American Society ofAgronomy, Madison, Wis, USA, 1985.
[36] J. S. C. Mbagwu, “Soil-loss tolerance of some Nigerian soils inrelation to profile characteristics,” Turrialba, vol. 41, no. 2, pp.223–229, 1991.
[37] J. Bouma, N. H. Batjes, and J. J. R. Groot, “Exploring landquality effects on world food supply,” Geoderma, vol. 86, no.1-2, pp. 43–59, 1998.
10 Applied and Environmental Soil Science
[38] R. Lal, “Agronomic impact of soil degradation,” in Method-ology for Assessment of Soil Degradation, R. Lal, W. Blum, C.Valentine, and B. A. Stewart, Eds., pp. 459–473, CRC Press,Boca Raton, Fla, USA, 1997.
[39] C. A. Igwe, “Tropical soils, physical properties,” in Encyclope-dia of Agrophysics, J. Glinski, J. Horabik, and J. Lipiec, Eds., pp.934–937, Springer, 1st edition, 2011.
[40] J. S. C. Mbagwu, R. Lal, and T. W. Scott, “Effects ofdesurfacing of Alfisols and Ultisols in southern Nigeria: I.Crop performance,” Soil Science Society of America Journal, vol.48, no. 4, pp. 828–833, 1984.
[41] A. I. Adama and C. Quansah, “Cumulative soil loss underdifferent tillage practices and its effects on the growth andyield of maize in the semi-deciduous forest zone of Ghana,”in Proceedings of the African Crop Science Conference, vol. 9,pp. 343–349, 2009.
[42] P. O. Aina and E. Egolum, “The effect of cattle feedlotmanure and inorganic fertilizer on the improvement of subsoilproductivity,” Soil Science, vol. 129, no. 4, pp. 212–217, 1980.
[43] M. M. Bakker, G. Govers, and M. D. A. Rounsevell, “Thecrop productivity-erosion relationship: an analysis based onexperimental work,” Catena, vol. 57, no. 1, pp. 55–76, 2004.
[44] J. S. C. Mbagwu, “Effects of soil erosion on the productivityof agricultural lands in the humid tropics,” Beitrage zurTropischen Landwirtschaft und Veterinarmedizin, vol. 24, no.2, pp. 161–175, 1986.
[45] O. E. Ngwu, J. S. C. Mbagwu, and M. E. Obi, “Effects ofsurface soil loss in southeastern Nigeria: 1. Crop performance,”Nigerian Journal of Soil Research, vol. 6, pp. 1–8, 2005.
[46] G. F. Wilson, R. Lal, and B. N. Okigbo, “Effects of cover cropson soil structure and on yield of subsequent arable cropsgrown under strip tillage on an eroded alfisol,” Soil and TillageResearch, vol. 2, no. 3, pp. 233–250, 1982.
[47] E. Owusu-Sekyere, E. K. Nakashima, and T. Wakatsuki,“Extending cocoa agroforestry into sawah ecosystem inGhanaian inland valleys,” Ghana Journal of Agricultural Sci-ence, vol. 43, pp. 37–44, 2010.
[48] S. Hirose and T. Wakatsuki, Restoration of Inland ValleyEcosystems in West Africa, Association of Agriculture andForestry Statistics, Tokyo, Japan, 2002.
[49] P. N. Windmeijer and W. Andriesse, Eds., Inland Valleysin West Africa. An Agro-ecological Characterization of Rice-growing Environments, Institute for Land Reclamation andImprovement (ILRI), Wageningen, The Netherlands, 1993.
[50] T. Wakatsuki and T. Masunaga, “Ecological engineering forsustainable food production and the restoration of degradedwatersheds in tropics of low pH soils: focus on West Africa,”Soil Science and Plant Nutrition, vol. 51, no. 5, pp. 629–636,2005.
[51] A. L. Kaswamila and J. A. Mkavidanda, “The neglect oftraditional agro-forestry (TAF) and its effects on soil erosionand crop yield: the case of the West Usambara Mountains,” inProceedings of the International Conference on Geo-Informationfor Sustainable Land Management (SLM ’97), pp. 17–21,Enschede, The Netherlands, August 1997.
[52] West Africa Rice Development Association WARDA, AfricaRice Trends, 2007, The Africa Rice Center, Cotonou, Benin,2008.
[53] S. E. Obalum, J. C. Nwite, J. Oppong, C. A. Igwe, and T.Wakatsuki, “Variations in selected soil physical properties withlandforms and slope within an inland valley ecosystem in
Ashanti Region of Ghana,” Soil and Water Research, vol. 6, pp.73–82, 2011.
[54] S. S. Abe, M. M. Buri, R. N. Issaka, P. Kiepe, and T. Wakatsuki,“Soil fertility potential for rice production in West Africanlowlands,” Japan Agricultural Research Quarterly, vol. 44, no.4, pp. 343–355, 2010.
[55] A. Bationo, A. Hartemink, O. Lungu et al., “African soils: theirproductivity and profitability of fertilizer use,” in Proceedingsof the African Fertilizer Summit, Abuja, Nigeria, June 2006.
[56] B. Kone, G. L. Amadji, S. Aliou, S. Diatta, and C. Akakpo,“Nutrient constraint and yield potential of rice on upland soilin the south of the Dahoumey gap of West Africa,” Archives ofAgronomy and Soil Science, vol. 57, pp. 763–774, 2011.
[57] J. C. Nwite, C. A. Igwe, and T. Wakatsuki, “Evaluation of sawahrice management system in an inland valley in southeasternNigeria. I: soil chemical properties and rice yield,” Paddy andWater Environment, vol. 6, no. 3, pp. 299–307, 2008.
[58] M. M. Buri, R. N. Issaka, and T. Wakatsuki, “Determiningoptimum rates of mineral fertilizers for economic rice grainyields under the “sawah” system in Ghana,” West AfricanJournal of Applied Ecology, vol. 12, 2008.
Hindawi Publishing CorporationApplied and Environmental Soil ScienceVolume 2012, Article ID 687160, 6 pagesdoi:10.1155/2012/687160
Research Article
Lifestyle Influence on the Content of Copper,Zinc and Rubidium in Wild Mushrooms
J. A. Campos,1 J. A. De Toro,2 C. Perez de los Reyes,1 J. A. Amoros,1 and R. Garcıa-Moreno3
1 Departamento de Produccion Vegetal y Tecnologia Agraria, UCLM, Ciudad Real, Spain2 Instituto Regional de Investigacion Cientıfica Aplicada (IRICA) and Departamento de Fısica Aplicada,Universidad de Castilla-La Mancha, 13071 Ciudad Real, Spain
3 Departamento de ciencias de la Navegacion y de la Tierra, Universidade da Coruna, A Coruna, Spain
Correspondence should be addressed to J. A. Campos, [email protected]
Received 2 December 2011; Revised 3 February 2012; Accepted 6 February 2012
Academic Editor: Philip White
Copyright © 2012 J. A. Campos et al. This is an open access article distributed under the Creative Commons Attribution License,which permits unrestricted use, distribution, and reproduction in any medium, provided the original work is properly cited.
The concentration of 18 trace elements in several species of fungi (arranged in three groups: ectomycorrhizae, saprobes, andepiphytes) has been determined. The measurements were made using the methodology of X-ray fluorescence. Higher contents ofCu and Rb (with statistical support) have been found in the ectomycorrhizal species. The Zn content reached higher concentrationsin the saprophytic species. According to the normality test and the search for outliers, the species Clitocybe maxima and Suillusbellini accumulate large amounts of Cu and Rb, respectively, so that both can be named as “outliers.” The leftwards displacementof the density curves and their nonnormality are attributed to the presence of these two species, which exhibit hyperaccumulationskills for Cu and Rb, respectively. Regarding Zn absorption, no particular species were classified as outlier; therefore it can beassumed that the observed differences between the different groups of fungi are due to differences in their nutritional physiology.
1. Introduction
Fungi are vital to ecosystem health as they play crucial rolesin the geochemical cycles, element mobilization, and organicmatter decomposition. As mycorrhizas they can improveplant growth by increasing uptake of nutrients, and assaprobes they are related to the recycling of biomass mineralconstituents [1, 2]. Special mention deserves their role aswood decay agents since very little species of other groups oforganisms are capable to attack recalcitrant substances suchas cellulose or lignin. Because of the vital importance of fungito the well-being of an entire ecosystem, the interaction offungi with the organic and inorganic substrate should betraced.
Over the last few years many articles have been publishedon the subject of elemental content in sporocarps of wildfungi. Some of them were focused on the perspective of thenutritional skills, or toxicity, when consumed by humans [3–10] and others tried to settle differences between differentspecies or places [11, 12]. There are also some recent pa-pers on the subject of the weathering properties of wild
mushrooms and their relation with the mineral particlesof the soil [13–18]. Some studies have shown a correlationbetween fungal metal concentrations and point sources ofmetal pollution such as smelters or roadsides [19, 20].
The sporocarps of basidiomycetes have a collectionof morphological features, by which we can identify anddiscriminate the species, and also a short lifetime, generallyno more than 7-8 days, although the mycelium may livefor many years. Thus, the fungal sporocarps become anadvantageous material for the study of the concentrationsof the different elements in a wide range of species and,therefore, to track the specific relations with the ecologicalniche where they live. The hypothesis of our work is that thedifferences in the absorption rates between fungal species ofdifferent lifestyles are a reflection of the substrate from whichthey feed. The aim of this study is threefold: (1) to comparetrace element concentrations between different species andlifestyles; (2) to identify the elements that could be used aslifestyle indicators; (3) to identify the species with a specialbehaviour in the absorption of certain trace elements.
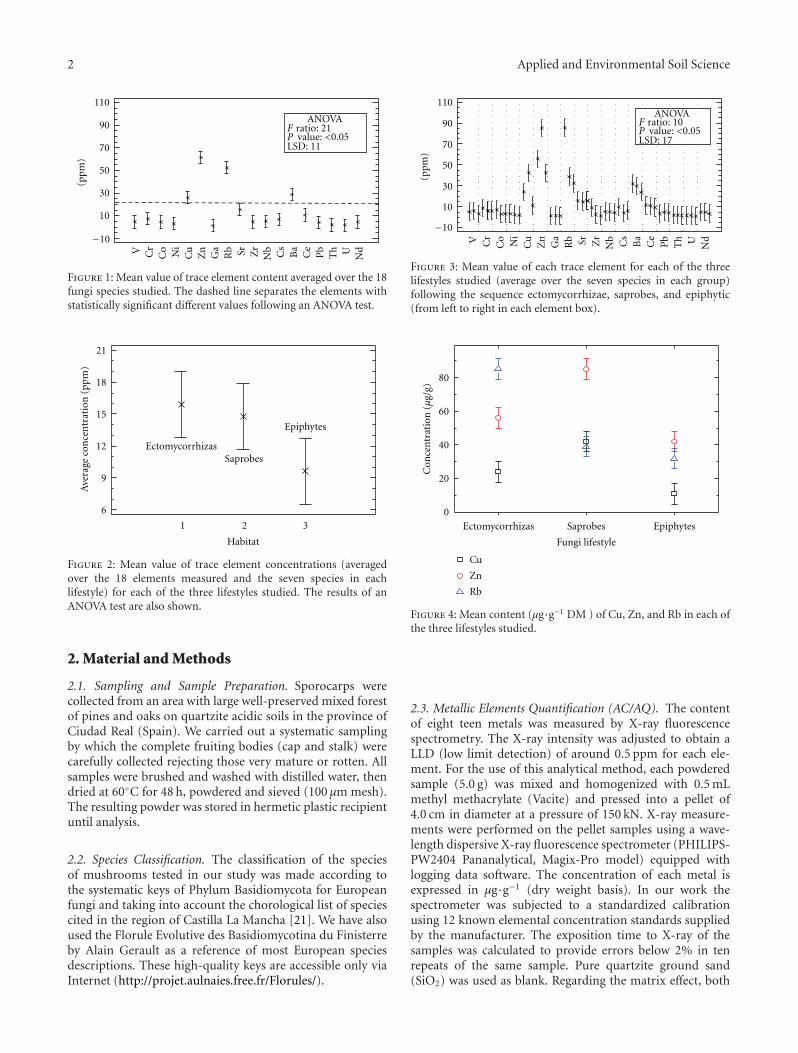
2 Applied and Environmental Soil Science
F ratio: 21P value: <0.05LSD: 11
ANOVA
(ppm
)
110
90
70
50
30
10
V Cr
Co Ni
Cu
Zn
Ga
Rb Sr Zr
Nb Cs
Ba
Ce
Pb
Th U
Nd
−10
Figure 1: Mean value of trace element content averaged over the 18fungi species studied. The dashed line separates the elements withstatistically significant different values following an ANOVA test.
1 2 3
6
9
12
15
18
21
EctomycorrhizasSaprobes
Epiphytes
Ave
rage
con
cen
trat
ion
(pp
m)
Habitat
Figure 2: Mean value of trace element concentrations (averagedover the 18 elements measured and the seven species in eachlifestyle) for each of the three lifestyles studied. The results of anANOVA test are also shown.
2. Material and Methods
2.1. Sampling and Sample Preparation. Sporocarps werecollected from an area with large well-preserved mixed forestof pines and oaks on quartzite acidic soils in the province ofCiudad Real (Spain). We carried out a systematic samplingby which the complete fruiting bodies (cap and stalk) werecarefully collected rejecting those very mature or rotten. Allsamples were brushed and washed with distilled water, thendried at 60◦C for 48 h, powdered and sieved (100 µm mesh).The resulting powder was stored in hermetic plastic recipientuntil analysis.
2.2. Species Classification. The classification of the speciesof mushrooms tested in our study was made according tothe systematic keys of Phylum Basidiomycota for Europeanfungi and taking into account the chorological list of speciescited in the region of Castilla La Mancha [21]. We have alsoused the Florule Evolutive des Basidiomycotina du Finisterreby Alain Gerault as a reference of most European speciesdescriptions. These high-quality keys are accessible only viaInternet (http://projet.aulnaies.free.fr/Florules/).
F ratio: 10P value: <0.05LSD: 17
ANOVA
(ppm
)
110
90
70
50
30
10
−10
V Cr
Co Ni
Cu
Zn
Ga
Rb Sr Zr
Nb Cs
Ba
Ce
Pb
Th U
Nd
Figure 3: Mean value of each trace element for each of the threelifestyles studied (average over the seven species in each group)following the sequence ectomycorrhizae, saprobes, and epiphytic(from left to right in each element box).
Ectomycorrhizas Saprobes Epiphytes0
20
40
60
80
Cu
Zn
Rb
Fungi lifestyle
Con
cen
trat
ion
(µ
g/g)
Figure 4: Mean content (µg·g−1 DM ) of Cu, Zn, and Rb in each ofthe three lifestyles studied.
2.3. Metallic Elements Quantification (AC/AQ). The contentof eight teen metals was measured by X-ray fluorescencespectrometry. The X-ray intensity was adjusted to obtain aLLD (low limit detection) of around 0.5 ppm for each ele-ment. For the use of this analytical method, each powderedsample (5.0 g) was mixed and homogenized with 0.5 mLmethyl methacrylate (Vacite) and pressed into a pellet of4.0 cm in diameter at a pressure of 150 kN. X-ray measure-ments were performed on the pellet samples using a wave-length dispersive X-ray fluorescence spectrometer (PHILIPS-PW2404 Pananalytical, Magix-Pro model) equipped withlogging data software. The concentration of each metal isexpressed in µg·g−1 (dry weight basis). In our work thespectrometer was subjected to a standardized calibrationusing 12 known elemental concentration standards suppliedby the manufacturer. The exposition time to X-ray of thesamples was calculated to provide errors below 2% in tenrepeats of the same sample. Pure quartzite ground sand(SiO2) was used as blank. Regarding the matrix effect, both
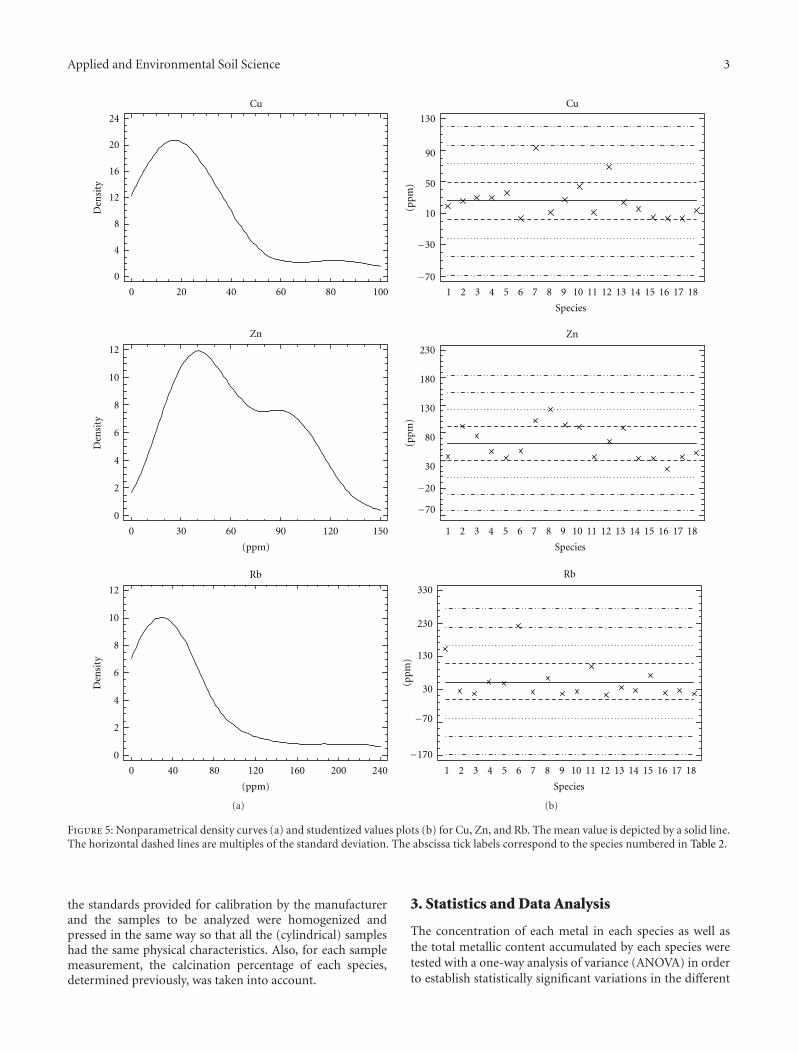
Applied and Environmental Soil Science 3
0 20 40 60 80 100
Cu
0
4
8
12
16
20
24
Den
sity
0 30 60 90 120 150
0
2
4
6
8
10
12
Zn
Den
sity
(ppm)
0 40 80 120 160 200 240
Rb
0
2
4
6
8
10
12
Den
sity
(ppm)
(a)
−70
−30
10
50
90
130
Species
1 2 3 4 5 6 7 8 9 10 11 12 13 14 15 16 17 18
(ppm
)
Cu
30
80
130
180
230
Species
1 2 3 4 5 6 7 8 9 10 11 12 13 14 15 16 17 18
(ppm
)
−70
−20
Zn
Species
1 2 3 4 5 6 7 8 9 10 11 12 13 14 15 16 17 18
30
130
230
330
(ppm
)
−170
−70
Rb
(b)
Figure 5: Nonparametrical density curves (a) and studentized values plots (b) for Cu, Zn, and Rb. The mean value is depicted by a solid line.The horizontal dashed lines are multiples of the standard deviation. The abscissa tick labels correspond to the species numbered in Table 2.
the standards provided for calibration by the manufacturerand the samples to be analyzed were homogenized andpressed in the same way so that all the (cylindrical) sampleshad the same physical characteristics. Also, for each samplemeasurement, the calcination percentage of each species,determined previously, was taken into account.
3. Statistics and Data Analysis
The concentration of each metal in each species as well asthe total metallic content accumulated by each species weretested with a one-way analysis of variance (ANOVA) in orderto establish statistically significant variations in the different
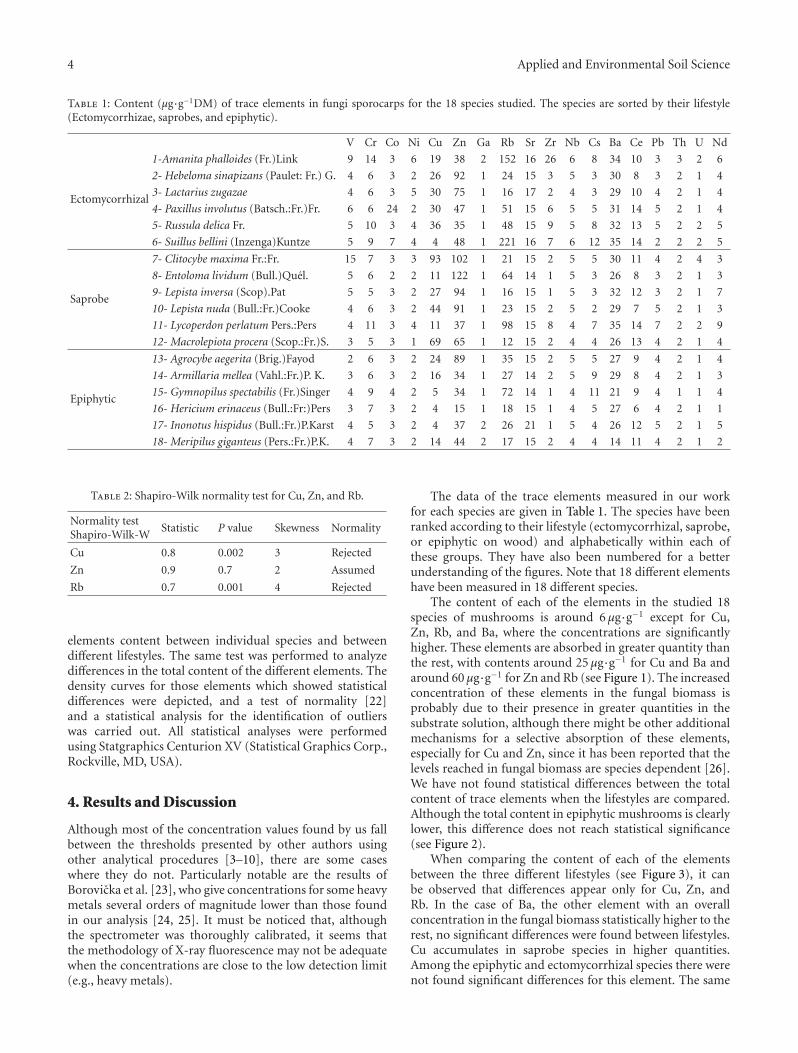
4 Applied and Environmental Soil Science
Table 1: Content (µg·g−1DM) of trace elements in fungi sporocarps for the 18 species studied. The species are sorted by their lifestyle(Ectomycorrhizae, saprobes, and epiphytic).
V Cr Co Ni Cu Zn Ga Rb Sr Zr Nb Cs Ba Ce Pb Th U Nd
Ectomycorrhizal
1-Amanita phalloides (Fr.)Link 9 14 3 6 19 38 2 152 16 26 6 8 34 10 3 3 2 6
2- Hebeloma sinapizans (Paulet: Fr.) G. 4 6 3 2 26 92 1 24 15 3 5 3 30 8 3 2 1 4
3- Lactarius zugazae 4 6 3 5 30 75 1 16 17 2 4 3 29 10 4 2 1 4
4- Paxillus involutus (Batsch.:Fr.)Fr. 6 6 24 2 30 47 1 51 15 6 5 5 31 14 5 2 1 4
5- Russula delica Fr. 5 10 3 4 36 35 1 48 15 9 5 8 32 13 5 2 2 5
6- Suillus bellini (Inzenga)Kuntze 5 9 7 4 4 48 1 221 16 7 6 12 35 14 2 2 2 5
Saprobe
7- Clitocybe maxima Fr.:Fr. 15 7 3 3 93 102 1 21 15 2 5 5 30 11 4 2 4 3
8- Entoloma lividum (Bull.)Quel. 5 6 2 2 11 122 1 64 14 1 5 3 26 8 3 2 1 3
9- Lepista inversa (Scop).Pat 5 5 3 2 27 94 1 16 15 1 5 3 32 12 3 2 1 7
10- Lepista nuda (Bull.:Fr.)Cooke 4 6 3 2 44 91 1 23 15 2 5 2 29 7 5 2 1 3
11- Lycoperdon perlatum Pers.:Pers 4 11 3 4 11 37 1 98 15 8 4 7 35 14 7 2 2 9
12- Macrolepiota procera (Scop.:Fr.)S. 3 5 3 1 69 65 1 12 15 2 4 4 26 13 4 2 1 4
Epiphytic
13- Agrocybe aegerita (Brig.)Fayod 2 6 3 2 24 89 1 35 15 2 5 5 27 9 4 2 1 4
14- Armillaria mellea (Vahl.:Fr.)P. K. 3 6 3 2 16 34 1 27 14 2 5 9 29 8 4 2 1 3
15- Gymnopilus spectabilis (Fr.)Singer 4 9 4 2 5 34 1 72 14 1 4 11 21 9 4 1 1 4
16- Hericium erinaceus (Bull.:Fr:)Pers 3 7 3 2 4 15 1 18 15 1 4 5 27 6 4 2 1 1
17- Inonotus hispidus (Bull.:Fr.)P.Karst 4 5 3 2 4 37 2 26 21 1 5 4 26 12 5 2 1 5
18- Meripilus giganteus (Pers.:Fr.)P.K. 4 7 3 2 14 44 2 17 15 2 4 4 14 11 4 2 1 2
Table 2: Shapiro-Wilk normality test for Cu, Zn, and Rb.
Normality testShapiro-Wilk-W
Statistic P value Skewness Normality
Cu 0.8 0.002 3 Rejected
Zn 0.9 0.7 2 Assumed
Rb 0.7 0.001 4 Rejected
elements content between individual species and betweendifferent lifestyles. The same test was performed to analyzedifferences in the total content of the different elements. Thedensity curves for those elements which showed statisticaldifferences were depicted, and a test of normality [22]and a statistical analysis for the identification of outlierswas carried out. All statistical analyses were performedusing Statgraphics Centurion XV (Statistical Graphics Corp.,Rockville, MD, USA).
4. Results and Discussion
Although most of the concentration values found by us fallbetween the thresholds presented by other authors usingother analytical procedures [3–10], there are some caseswhere they do not. Particularly notable are the results ofBorovicka et al. [23], who give concentrations for some heavymetals several orders of magnitude lower than those foundin our analysis [24, 25]. It must be noticed that, althoughthe spectrometer was thoroughly calibrated, it seems thatthe methodology of X-ray fluorescence may not be adequatewhen the concentrations are close to the low detection limit(e.g., heavy metals).
The data of the trace elements measured in our workfor each species are given in Table 1. The species have beenranked according to their lifestyle (ectomycorrhizal, saprobe,or epiphytic on wood) and alphabetically within each ofthese groups. They have also been numbered for a betterunderstanding of the figures. Note that 18 different elementshave been measured in 18 different species.
The content of each of the elements in the studied 18species of mushrooms is around 6 µg·g−1 except for Cu,Zn, Rb, and Ba, where the concentrations are significantlyhigher. These elements are absorbed in greater quantity thanthe rest, with contents around 25 µg·g−1 for Cu and Ba andaround 60 µg·g−1 for Zn and Rb (see Figure 1). The increasedconcentration of these elements in the fungal biomass isprobably due to their presence in greater quantities in thesubstrate solution, although there might be other additionalmechanisms for a selective absorption of these elements,especially for Cu and Zn, since it has been reported that thelevels reached in fungal biomass are species dependent [26].We have not found statistical differences between the totalcontent of trace elements when the lifestyles are compared.Although the total content in epiphytic mushrooms is clearlylower, this difference does not reach statistical significance(see Figure 2).
When comparing the content of each of the elementsbetween the three different lifestyles (see Figure 3), it canbe observed that differences appear only for Cu, Zn, andRb. In the case of Ba, the other element with an overallconcentration in the fungal biomass statistically higher to therest, no significant differences were found between lifestyles.Cu accumulates in saprobe species in higher quantities.Among the epiphytic and ectomycorrhizal species there werenot found significant differences for this element. The same
Applied and Environmental Soil Science 5
holds for Zn, although with major differences (Figures 3and 4). On the other hand, Rb is more efficiently absorbedby ectomycorrhizal species, without significant differencesbetween the saprophytic and epiphytic groups of species.
Once established that there are clear differences in theabsorption of these elements between the three groupsof species (ectomycorrhiza, saprobes, and epiphytes), it isconvenient to make a more detailed analysis trying to findout the causes of that differential absorption. To this purposewe have performed a test of normality [22] and a searchfor species with a particular behaviour in the absorption ofthese elements (statistical “outliers”). The final goal of thisanalysis is to verify whether that data lies within a normaldistribution or not, and, if not, to examine the presence ofspecies that may be considered as outliers. It is assumed thatthese species have a peculiar absorption for these elementsand, therefore, are responsible for breaking the expectednormal distribution of the data.
Figure 5 displays the nonparametric density curves forCu, Zn, and Rb. The right- hand panels show the corre-sponding tests for outliers identification with the distribu-tion of each species data (numbered according to Table 1)with respect to the mean (solid line) and standard deviationunits (dashed lines). Normality is rejected for Cu and Rb(Table 2), with a leftwards shift of the density curve in bothcases, which means that there are values high enough abovethe mean to break normality. The panels on the right-handside show a different representation of the dispersion ofthe data in the different species. In the case of Cu, thereis a datapoint with value almost three times the standarddeviation, which can therefore be considered an outlier. Thisdatapoint corresponds to Clitocybe maxima, a species locatedwithin the saprobe group. It seems that the presence of Cuin fungal biomass is more related to specific absorptive skillsof the species than to the concentration of this element inthe substrate solution, since we cannot expect a high spatialheterogeneity of the deposits of this element in a forest soil(e.g., from organic waste, excrements, etc.).
The density curve of the data shows that Zn is set tonormal, according to the Shapiro-Wilk test (Table 2); how-ever two modes are hinted, where the smaller one; centeredat 95 ppm; corresponds to the saprobe group, consistentlywith the observed significant differences in Figures 3 and 4,and thus confirming that differences between saprobe speciesand the rest of the lifestyles do exist. It can therefore beconcluded that the differences found between the saprobespecies and the other groups are based on the physiologicalcharacteristics shared by the species of this particular trophicgroup and not by the presence of outliers. Alonso et al. [26]give values between 130 and 267 µg·g−1 in saprobe speciesof genus Agaricus (A. campestris, A. Macrospores, and A.silvicola). These authors suggest that saprophytic species havemore efficient mechanisms to absorb trace elements thanectomycorrhiza ones.
In the case of Rb the test of normality (Table 2) indicatesthat the data were not normally distributed. In a moredetailed analysis (Figure 5) it can be seen that the speciesSuillus bellini accumulates this element in a much greateramount than the other species (three times the standard
deviation), shifting the density curve leftwards and breakingthe expected normality. This species can be considered as astatistical outlier with a particular absorptive behaviour. Wecan assume that the absorption of Rb is species specific andthat it is supported by a particular nutritional physiologynot shared by the whole trophic group. The special skills ofsome ectomycorrhizal species (e.g., Suillus sp.), by attackingmineral particles of soil, may underlie this result.
5. Conclusions
The concentrations of the trace elements Cu, Zn, and Rbfound in the biomass of eighteen species of mushrooms arerelated to the lifestyle (ectomycorrhiza, saprobe, or epiphyticon wood). Cu and Zn accumulate in greater amounts insaprobes species and Rb reaches higher concentrations inthe ectomycorrhiza species group. Further analysis indicatesthat the species Clitocybe maxima and Suillus bellini act ashyperaccumulators of Cu and Rb, respectively, and this iscrucial in establishing the statistical significance between thetrophic groups. Hyperaccumulating species do not appear inthe case of Zn and, therefore, we assume that the differencesfound between the three lifestyles stem from the peculiaritiesof the nutritional physiology shared by the species in eachgroup.
References
[1] V. Wiemken, “Contributions of studies with in vitro culturesystems to the understanding of the ectomycorrhizal symbio-sis,” in Mycorrhiza: Structure, Function, Molecular Biology andBiotechnology, A. Varma and B. Hock, Eds., Springer-Verlag,New York, NY, USA, 1995.
[2] P. E. Courty, M. Buee, A. G. Diedhiou et al., “The role ofectomycorrhizal communities in forest ecosystem processes:new perspectives and emerging concepts,” Soil Biology andBiochemistry, vol. 42, no. 5, pp. 679–698, 2010.
[3] D. Mendil, O. D. Uluozlu, E. Hasdemir, and A. Caglar, “Deter-mination of trace elements on some wild edible mushroomsamples from Kastamonu, Turkey,” Food Chemistry, vol. 88,no. 2, pp. 281–285, 2004.
[4] N. Dursun, M. M. Ozcan et al., “Mineral contents of 34 speciesof edible mushrooms growing wild in Turkey,” Journal of theScience of Food and Agriculture, vol. 86, no. 7, pp. 1087–1094,2006.
[5] L. Cocchi, L. Vescovi, L. E. Petrini, and O. Petrini, “Heavymetals in edible mushrooms in Italy,” Food Chemistry, vol. 98,no. 2, pp. 277–284, 2006.
[6] P. K. Ouzouni, P. G. Veltsistas, E. K. Paleologos, and K. A.Riganakos, “Determination of metal content in wild ediblemushroom species from regions of Greece,” Journal of FoodComposition and Analysis, vol. 20, no. 6, pp. 480–486, 2007.
[7] K. Chudzynski and J. Falandysz, “Multivariate analysis of ele-ments content of Larch Bolete (Suillus grevillei) mushroom,”Chemosphere, vol. 73, no. 8, pp. 1230–1239, 2008.
[8] J. J. Falandysz, T. Kunito, R. Kubota et al., “Some mineralconstituents of Parasol mushroom (Macrolepiota procera),”Journal of Environmental Science and Health, Part B, vol. 43,pp. 187–192, 2008.
[9] P. Kalac, “Chemical composition and nutritional value ofEuropean species of wild growing mushrooms: a review,” FoodChemistry, vol. 113, no. 1, pp. 9–16, 2009.
6 Applied and Environmental Soil Science
[10] P. Kalac, “Trace element contents in European species of wildgrowing edible mushrooms: a review for the period 2000–2009,” Food Chemistry, vol. 122, no. 1, pp. 2–15, 2010.
[11] G. Tyler, “Metal accumulation by wood-decaying fungi,”Chemosphere, vol. 11, no. 11, pp. 1141–1146, 1982.
[12] J. Vetter, “Mineral composition of basidiomes of Amanitaspecies,” Mycological Research, vol. 109, no. 6, pp. 746–750,2005.
[13] R. Landeweert, E. Hoffland, R. D. Finlay, T. W. Kuyper, andN. Van Breemen, “Linking plants to rocks: ectomycorrhizalfungi mobilize nutrients from minerals,” Trends in Ecology andEvolution, vol. 16, no. 5, pp. 248–254, 2001.
[14] E. Hoffland, T. W. Kuyper, H. Wallander et al., “The role offungi in weathering,” Frontiers in Ecology and the Environment,vol. 2, pp. 258–264, 2004.
[15] G. M. Gadd, Fungi in Biogeochemical Cycles, CambridgeUniversity Press, Cambridge, UK, 2006.
[16] G. M. Gadd, “Global biogeochemical cycling: fungi and theirrole in the biosphere,” in Encyclopedia of Ecology, Elsevier,Amsterdam, The Netherlands, 2007.
[17] R. Amundson, D. D. Richter, G. S. Humphreys, E. G. Jobbagy,and J. Gaillardet, “Coupling between biota and earth materialsin the critical zone,” Elements, vol. 3, no. 5, pp. 327–332, 2007.
[18] L. van Scholl, T. W. Kuyper, M. M. Smits, R. Landeweert, E.Hoffland, and N. V. Breemen, “Rock-eating mycorrhizas: theirrole in plant nutrition and biogeochemical cycles,” Plant andSoil, vol. 303, no. 1-2, pp. 35–47, 2008.
[19] J. D. McCreight and D. B. Schroeder, “Cadmium, lead andnickel content of Lycoperdon perlatum Pers. in a roadsideenvironment,” Environmental Pollution, vol. 13, no. 4, pp. 265–268, 1977.
[20] R. Bargagli and F. Baldi, “Mercury and methyl mercury inhigher fungi and their relation with the substrata in a cinnabarmining area,” Chemosphere, vol. 13, no. 9, pp. 1059–1071,1984.
[21] F. D. Calonge, G. Moreno et al., “Flora Micologica de CastillaLa Mancha. Situacion actual y conservacion de los hongos delbosque,” in Memoria Final (2004–2007), Hernandez-Crespo,Ed., Real Jardın Botanico CSIC, Madrid, Spain, 2008.
[22] S. S. Shapiro and M. B. Wilk, “An analysis of variance test fornormality (complete samples),” Biometrika, vol. 52, pp. 591–611, 1965.
[23] J. Borovicka, J. Kubrova, J. Rohovec, Z. Randa, and C. E. Dunn,“Uranium, thorium and rare earth elements in macrofungi:what are the genuine concentrations?” BioMetals, vol. 24, no.5, pp. 837–845, 2011.
[24] J. A. Campos, N. A. Tejera, and C. J. Sanchez, “Substrate role inthe accumulation of heavy metals in sporocarps of wild fungi,”BioMetals, vol. 22, no. 5, pp. 835–841, 2009.
[25] J. A. Campos, “Nutrients and trace elements content of wooddecay fungi isolated from oak (Quercus ilex),” Biological TraceElement Research, vol. 144, no. 1-3, pp. 1370–1380, 2011.
[26] J. Alonso, M. A. Garcıa, M. Perez-Lopez, and M. J. Melgar,“The concentrations and bioconcentration factors of copperand zinc in edible mushrooms,” Archives of EnvironmentalContamination and Toxicology, vol. 44, no. 2, pp. 180–188,2003.
Hindawi Publishing CorporationApplied and Environmental Soil ScienceVolume 2012, Article ID 243815, 8 pagesdoi:10.1155/2012/243815
Research Article
The Effect of Rainfall Characteristics and Tillageon Sheet Erosion and Maize Grain Yield in Semiarid Conditionsand Granitic Sandy Soils of Zimbabwe
Adelaide Munodawafa
Department of Land and Water Resources Management, Midlands State University, P.O. Box 9055, Gweru, Zimbabwe
Correspondence should be addressed to Adelaide Munodawafa, [email protected]
Received 4 November 2011; Revised 15 January 2012; Accepted 16 January 2012
Academic Editor: Marıa Cruz Dıaz Alvarez
Copyright © 2012 Adelaide Munodawafa. This is an open access article distributed under the Creative Commons AttributionLicense, which permits unrestricted use, distribution, and reproduction in any medium, provided the original work is properlycited.
In semiarid regions, rainfall is one of the primary factors affecting soil erosion and crop production under rain-fed agriculture.The study sought to quantify the effect of rainfall characteristics on sheet erosion and maize grain yield under different tillagesystems. It was carried out under semiarid conditions and infertile sandy soils of Zimbabwe. Rainfall amount and intensity wererecorded every 24 hours, while sheet erosion was measured from four tillage systems (Conventional Tillage (CT), Mulch Ripping(MR), Tied Ridging (TR) and Bare Fallow (BF)). Maize (Zea mays L.) was grown on three tillage systems (CT, MR, and TR).Rainfall amount varied significantly (P < 0.001) between seasons (164–994 mm). CT recorded the highest average soil losses(15 t/ha), while MR and TR recorded 1.3 and 1.2 t/ha, respectively. Maize grain yields increased with increasing seasonal rainfallgiving yield-responses of 0.9 t/ha (TR) to 1.3 t/ha (MR) for every 100 mm rainfall increment. Overall, treatments didnot differsignificantly (P < 0.497), except during drier seasons (P < 0.025). Regression equations showed that yields can be confidentlypredicted using rainfall amount and time, with R2 values of 0.82 to 0.94. Maize grain yields proved to be mostly dependent onrainfall amount than fertility. The productivity of the soils decreased with increased length of cultivation.
1. Introduction
Rill and gully erosion in the smallholder areas of Zimbabweis largely under control through mechanical conservationstructures such as contour ridges, grassed waterways, andstorm drains [1]. However, sheet erosion is still a major threatto soil fertility and productivity. The sheet erosion processis selective and deprives the soil of its fine particles (clayand organic matter) [2]. These particles are easily splashedout and carried in suspension, while the heavier particlesremain behind [3–5]. The soils are thus impoverished asthese nutrient reservoirs are lost together with inherent andapplied plant nutrients. The bulk density of the soils isincreased and plant available water is decreased. Accordingto Stocking and Peake [6], the changes in soil conditions, inmany cases, may be describing the effect of erosion inducedlow soil productivity.
In soil erosion research, rainfall amount and intensity(erosive power of rainfall) have been found to be thefundamental factors affecting soil erosion [7, 8]. The impactof raindrops on the soil surface results in temporary cappingof the soil and lowered infiltration rate, thus generatingrunoff [9–11]. Runoff is directly dependent on rainfallamount and intensity and soil loss, being a function ofrunoff also depends primarily on these factors. Accordingto Morgan [12], sheet erosion occurs when, during a rain-storm, soil moisture storage and/or the infiltration capacityof the soil are exceeded.
Rainfall is also the primary factor affecting crop produc-tion in rain-fed agriculture [5]. Previous studies in semiaridregions have shown that the yield parameter is mainlydependent on the amount and distribution of rainfall. Elwell[13] found a linear relationship between rainfall amountand yield on granitic sands and high rainfall conditions of
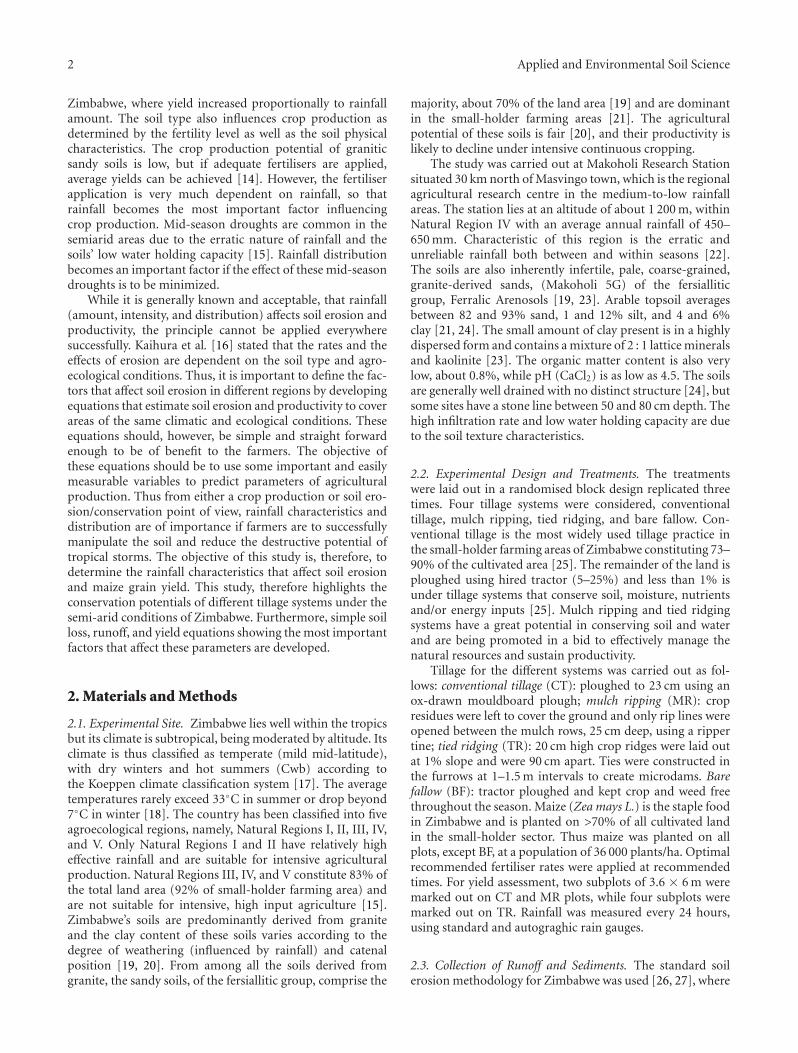
2 Applied and Environmental Soil Science
Zimbabwe, where yield increased proportionally to rainfallamount. The soil type also influences crop production asdetermined by the fertility level as well as the soil physicalcharacteristics. The crop production potential of graniticsandy soils is low, but if adequate fertilisers are applied,average yields can be achieved [14]. However, the fertiliserapplication is very much dependent on rainfall, so thatrainfall becomes the most important factor influencingcrop production. Mid-season droughts are common in thesemiarid areas due to the erratic nature of rainfall and thesoils’ low water holding capacity [15]. Rainfall distributionbecomes an important factor if the effect of these mid-seasondroughts is to be minimized.
While it is generally known and acceptable, that rainfall(amount, intensity, and distribution) affects soil erosion andproductivity, the principle cannot be applied everywheresuccessfully. Kaihura et al. [16] stated that the rates and theeffects of erosion are dependent on the soil type and agro-ecological conditions. Thus, it is important to define the fac-tors that affect soil erosion in different regions by developingequations that estimate soil erosion and productivity to coverareas of the same climatic and ecological conditions. Theseequations should, however, be simple and straight forwardenough to be of benefit to the farmers. The objective ofthese equations should be to use some important and easilymeasurable variables to predict parameters of agriculturalproduction. Thus from either a crop production or soil ero-sion/conservation point of view, rainfall characteristics anddistribution are of importance if farmers are to successfullymanipulate the soil and reduce the destructive potential oftropical storms. The objective of this study is, therefore, todetermine the rainfall characteristics that affect soil erosionand maize grain yield. This study, therefore highlights theconservation potentials of different tillage systems under thesemi-arid conditions of Zimbabwe. Furthermore, simple soilloss, runoff, and yield equations showing the most importantfactors that affect these parameters are developed.
2. Materials and Methods
2.1. Experimental Site. Zimbabwe lies well within the tropicsbut its climate is subtropical, being moderated by altitude. Itsclimate is thus classified as temperate (mild mid-latitude),with dry winters and hot summers (Cwb) according tothe Koeppen climate classification system [17]. The averagetemperatures rarely exceed 33◦C in summer or drop beyond7◦C in winter [18]. The country has been classified into fiveagroecological regions, namely, Natural Regions I, II, III, IV,and V. Only Natural Regions I and II have relatively higheffective rainfall and are suitable for intensive agriculturalproduction. Natural Regions III, IV, and V constitute 83% ofthe total land area (92% of small-holder farming area) andare not suitable for intensive, high input agriculture [15].Zimbabwe’s soils are predominantly derived from graniteand the clay content of these soils varies according to thedegree of weathering (influenced by rainfall) and catenalposition [19, 20]. From among all the soils derived fromgranite, the sandy soils, of the fersiallitic group, comprise the
majority, about 70% of the land area [19] and are dominantin the small-holder farming areas [21]. The agriculturalpotential of these soils is fair [20], and their productivity islikely to decline under intensive continuous cropping.
The study was carried out at Makoholi Research Stationsituated 30 km north of Masvingo town, which is the regionalagricultural research centre in the medium-to-low rainfallareas. The station lies at an altitude of about 1 200 m, withinNatural Region IV with an average annual rainfall of 450–650 mm. Characteristic of this region is the erratic andunreliable rainfall both between and within seasons [22].The soils are also inherently infertile, pale, coarse-grained,granite-derived sands, (Makoholi 5G) of the fersialliticgroup, Ferralic Arenosols [19, 23]. Arable topsoil averagesbetween 82 and 93% sand, 1 and 12% silt, and 4 and 6%clay [21, 24]. The small amount of clay present is in a highlydispersed form and contains a mixture of 2 : 1 lattice mineralsand kaolinite [23]. The organic matter content is also verylow, about 0.8%, while pH (CaCl2) is as low as 4.5. The soilsare generally well drained with no distinct structure [24], butsome sites have a stone line between 50 and 80 cm depth. Thehigh infiltration rate and low water holding capacity are dueto the soil texture characteristics.
2.2. Experimental Design and Treatments. The treatmentswere laid out in a randomised block design replicated threetimes. Four tillage systems were considered, conventionaltillage, mulch ripping, tied ridging, and bare fallow. Con-ventional tillage is the most widely used tillage practice inthe small-holder farming areas of Zimbabwe constituting 73–90% of the cultivated area [25]. The remainder of the land isploughed using hired tractor (5–25%) and less than 1% isunder tillage systems that conserve soil, moisture, nutrientsand/or energy inputs [25]. Mulch ripping and tied ridgingsystems have a great potential in conserving soil and waterand are being promoted in a bid to effectively manage thenatural resources and sustain productivity.
Tillage for the different systems was carried out as fol-lows: conventional tillage (CT): ploughed to 23 cm using anox-drawn mouldboard plough; mulch ripping (MR): cropresidues were left to cover the ground and only rip lines wereopened between the mulch rows, 25 cm deep, using a rippertine; tied ridging (TR): 20 cm high crop ridges were laid outat 1% slope and were 90 cm apart. Ties were constructed inthe furrows at 1–1.5 m intervals to create microdams. Barefallow (BF): tractor ploughed and kept crop and weed freethroughout the season. Maize (Zea mays L.) is the staple foodin Zimbabwe and is planted on >70% of all cultivated landin the small-holder sector. Thus maize was planted on allplots, except BF, at a population of 36 000 plants/ha. Optimalrecommended fertiliser rates were applied at recommendedtimes. For yield assessment, two subplots of 3.6 × 6 m weremarked out on CT and MR plots, while four subplots weremarked out on TR. Rainfall was measured every 24 hours,using standard and autograghic rain gauges.
2.3. Collection of Runoff and Sediments. The standard soilerosion methodology for Zimbabwe was used [26, 27], where
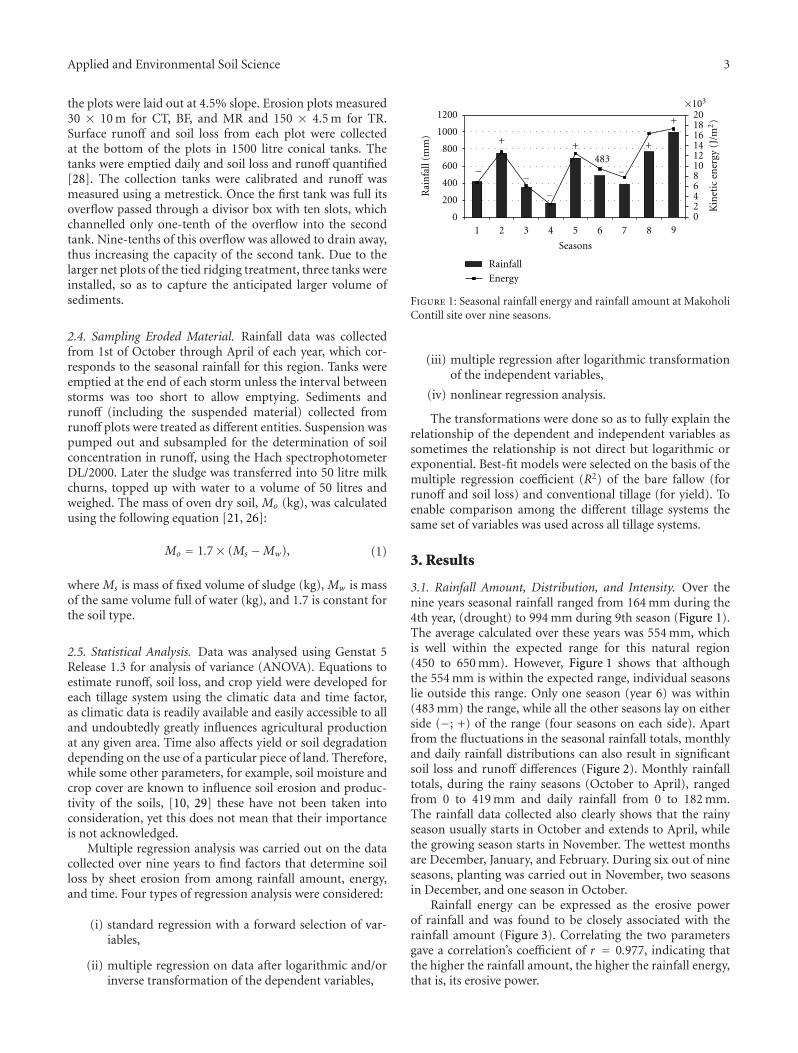
Applied and Environmental Soil Science 3
the plots were laid out at 4.5% slope. Erosion plots measured30 × 10 m for CT, BF, and MR and 150 × 4.5 m for TR.Surface runoff and soil loss from each plot were collectedat the bottom of the plots in 1500 litre conical tanks. Thetanks were emptied daily and soil loss and runoff quantified[28]. The collection tanks were calibrated and runoff wasmeasured using a metrestick. Once the first tank was full itsoverflow passed through a divisor box with ten slots, whichchannelled only one-tenth of the overflow into the secondtank. Nine-tenths of this overflow was allowed to drain away,thus increasing the capacity of the second tank. Due to thelarger net plots of the tied ridging treatment, three tanks wereinstalled, so as to capture the anticipated larger volume ofsediments.
2.4. Sampling Eroded Material. Rainfall data was collectedfrom 1st of October through April of each year, which cor-responds to the seasonal rainfall for this region. Tanks wereemptied at the end of each storm unless the interval betweenstorms was too short to allow emptying. Sediments andrunoff (including the suspended material) collected fromrunoff plots were treated as different entities. Suspension waspumped out and subsampled for the determination of soilconcentration in runoff, using the Hach spectrophotometerDL/2000. Later the sludge was transferred into 50 litre milkchurns, topped up with water to a volume of 50 litres andweighed. The mass of oven dry soil, Mo (kg), was calculatedusing the following equation [21, 26]:
Mo = 1.7× (Ms −Mw), (1)
where Ms is mass of fixed volume of sludge (kg), Mw is massof the same volume full of water (kg), and 1.7 is constant forthe soil type.
2.5. Statistical Analysis. Data was analysed using Genstat 5Release 1.3 for analysis of variance (ANOVA). Equations toestimate runoff, soil loss, and crop yield were developed foreach tillage system using the climatic data and time factor,as climatic data is readily available and easily accessible to alland undoubtedly greatly influences agricultural productionat any given area. Time also affects yield or soil degradationdepending on the use of a particular piece of land. Therefore,while some other parameters, for example, soil moisture andcrop cover are known to influence soil erosion and produc-tivity of the soils, [10, 29] these have not been taken intoconsideration, yet this does not mean that their importanceis not acknowledged.
Multiple regression analysis was carried out on the datacollected over nine years to find factors that determine soilloss by sheet erosion from among rainfall amount, energy,and time. Four types of regression analysis were considered:
(i) standard regression with a forward selection of var-iables,
(ii) multiple regression on data after logarithmic and/orinverse transformation of the dependent variables,
+
+
−
−
− −
++
483
02468101214161820
0
200
400
600
800
1000
1200
1 2 3 4 5 6 7 8 9
Rai
nfa
ll(m
m)
Seasons
Rainfall
Energy
×103
Kin
etic
en
ergy
(J/
m2)
Figure 1: Seasonal rainfall energy and rainfall amount at MakoholiContill site over nine seasons.
(iii) multiple regression after logarithmic transformationof the independent variables,
(iv) nonlinear regression analysis.
The transformations were done so as to fully explain therelationship of the dependent and independent variables assometimes the relationship is not direct but logarithmic orexponential. Best-fit models were selected on the basis of themultiple regression coefficient (R2) of the bare fallow (forrunoff and soil loss) and conventional tillage (for yield). Toenable comparison among the different tillage systems thesame set of variables was used across all tillage systems.
3. Results
3.1. Rainfall Amount, Distribution, and Intensity. Over thenine years seasonal rainfall ranged from 164 mm during the4th year, (drought) to 994 mm during 9th season (Figure 1).The average calculated over these years was 554 mm, whichis well within the expected range for this natural region(450 to 650 mm). However, Figure 1 shows that althoughthe 554 mm is within the expected range, individual seasonslie outside this range. Only one season (year 6) was within(483 mm) the range, while all the other seasons lay on eitherside (−; +) of the range (four seasons on each side). Apartfrom the fluctuations in the seasonal rainfall totals, monthlyand daily rainfall distributions can also result in significantsoil loss and runoff differences (Figure 2). Monthly rainfalltotals, during the rainy seasons (October to April), rangedfrom 0 to 419 mm and daily rainfall from 0 to 182 mm.The rainfall data collected also clearly shows that the rainyseason usually starts in October and extends to April, whilethe growing season starts in November. The wettest monthsare December, January, and February. During six out of nineseasons, planting was carried out in November, two seasonsin December, and one season in October.
Rainfall energy can be expressed as the erosive powerof rainfall and was found to be closely associated with therainfall amount (Figure 3). Correlating the two parametersgave a correlation’s coefficient of r = 0.977, indicating thatthe higher the rainfall amount, the higher the rainfall energy,that is, its erosive power.
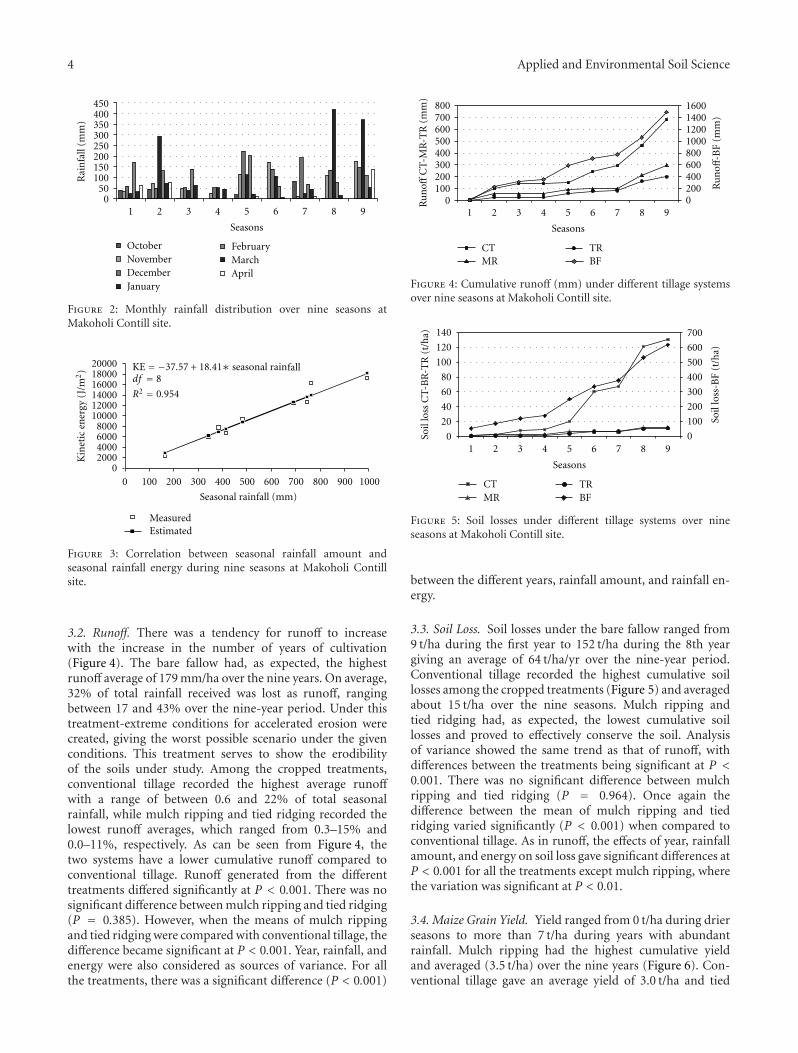
4 Applied and Environmental Soil Science
050
100150200250300350400450
1 2 3 4 5 6 7 8 9
Rai
nfa
ll(m
m)
Seasons
OctoberNovemberDecemberJanuary
FebruaryMarchApril
Figure 2: Monthly rainfall distribution over nine seasons atMakoholi Contill site.
02000400060008000
100001200014000160001800020000
Kin
etic
ener
gy(J
/m2)
0 100 200 300 400 500 600 700 800 900 1000
MeasuredEstimated
KE = −37.57 + 18.41∗ seasonal raindf = 8
R2 = 0.954
Seasonal rainfall (mm)
fall
Figure 3: Correlation between seasonal rainfall amount andseasonal rainfall energy during nine seasons at Makoholi Contillsite.
3.2. Runoff. There was a tendency for runoff to increasewith the increase in the number of years of cultivation(Figure 4). The bare fallow had, as expected, the highestrunoff average of 179 mm/ha over the nine years. On average,32% of total rainfall received was lost as runoff, rangingbetween 17 and 43% over the nine-year period. Under thistreatment-extreme conditions for accelerated erosion werecreated, giving the worst possible scenario under the givenconditions. This treatment serves to show the erodibilityof the soils under study. Among the cropped treatments,conventional tillage recorded the highest average runoffwith a range of between 0.6 and 22% of total seasonalrainfall, while mulch ripping and tied ridging recorded thelowest runoff averages, which ranged from 0.3–15% and0.0–11%, respectively. As can be seen from Figure 4, thetwo systems have a lower cumulative runoff compared toconventional tillage. Runoff generated from the differenttreatments differed significantly at P < 0.001. There was nosignificant difference between mulch ripping and tied ridging(P = 0.385). However, when the means of mulch rippingand tied ridging were compared with conventional tillage, thedifference became significant at P < 0.001. Year, rainfall, andenergy were also considered as sources of variance. For allthe treatments, there was a significant difference (P < 0.001)
02004006008001000120014001600
0100200300400500600700800
1 2 3 4 5 6 7 8 9
Ru
noff
-BF
(mm
)
Ru
noff
CT
-MR
-TR
(mm
)
Seasons
CTMR
TRBF
Figure 4: Cumulative runoff (mm) under different tillage systemsover nine seasons at Makoholi Contill site.
0
100
200
300
400
500
600
700
0
20
40
60
80
100
120
140
1 2 3 4 5 6 7 8 9
Seasons
CTMR
TRBF
Soil
loss
-BF
(t/h
a)
Soil
loss
CT
-BR
-TR
(t/
ha)
Figure 5: Soil losses under different tillage systems over nineseasons at Makoholi Contill site.
between the different years, rainfall amount, and rainfall en-ergy.
3.3. Soil Loss. Soil losses under the bare fallow ranged from9 t/ha during the first year to 152 t/ha during the 8th yeargiving an average of 64 t/ha/yr over the nine-year period.Conventional tillage recorded the highest cumulative soillosses among the cropped treatments (Figure 5) and averagedabout 15 t/ha over the nine seasons. Mulch ripping andtied ridging had, as expected, the lowest cumulative soillosses and proved to effectively conserve the soil. Analysisof variance showed the same trend as that of runoff, withdifferences between the treatments being significant at P <0.001. There was no significant difference between mulchripping and tied ridging (P = 0.964). Once again thedifference between the mean of mulch ripping and tiedridging varied significantly (P < 0.001) when compared toconventional tillage. As in runoff, the effects of year, rainfallamount, and energy on soil loss gave significant differences atP < 0.001 for all the treatments except mulch ripping, wherethe variation was significant at P < 0.01.
3.4. Maize Grain Yield. Yield ranged from 0 t/ha during drierseasons to more than 7 t/ha during years with abundantrainfall. Mulch ripping had the highest cumulative yieldand averaged (3.5 t/ha) over the nine years (Figure 6). Con-ventional tillage gave an average yield of 3.0 t/ha and tied
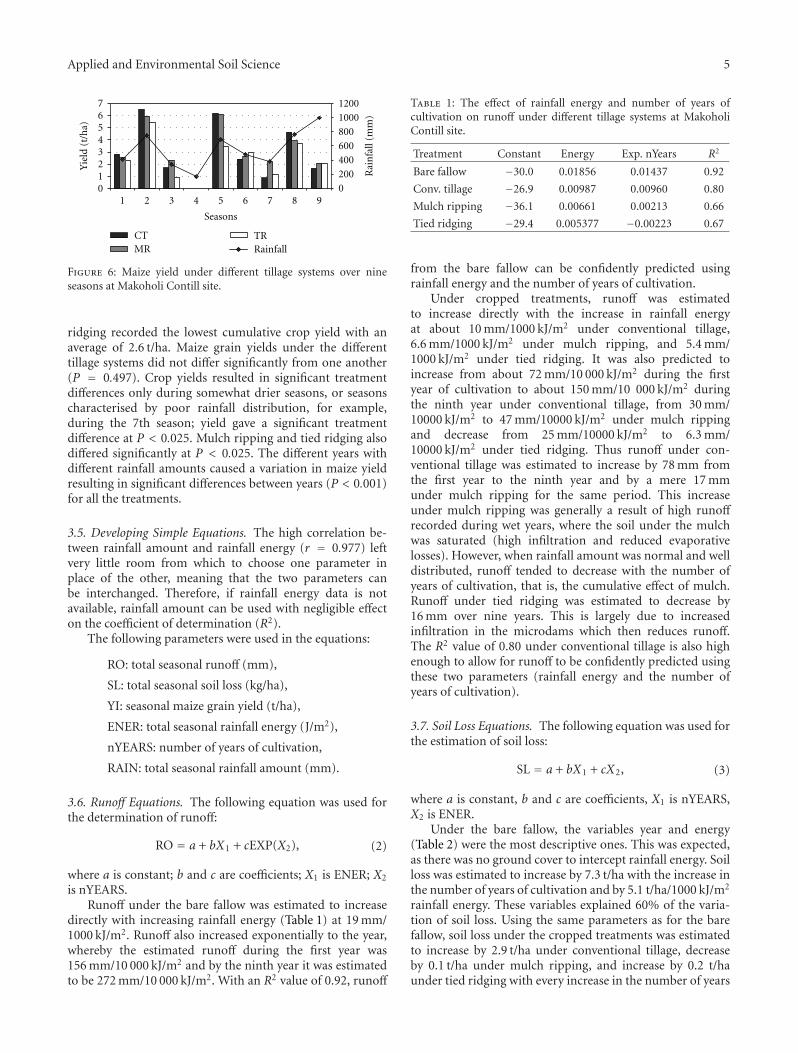
Applied and Environmental Soil Science 5
0
200
400
600
800
1000
1200
01234567
1 2 3 4 5 6 7 8 9
Rai
nfa
ll(m
m)
Seasons
CTMR
TRRainfall
Yie
ld (
t/h
a)
Figure 6: Maize yield under different tillage systems over nineseasons at Makoholi Contill site.
ridging recorded the lowest cumulative crop yield with anaverage of 2.6 t/ha. Maize grain yields under the differenttillage systems did not differ significantly from one another(P = 0.497). Crop yields resulted in significant treatmentdifferences only during somewhat drier seasons, or seasonscharacterised by poor rainfall distribution, for example,during the 7th season; yield gave a significant treatmentdifference at P < 0.025. Mulch ripping and tied ridging alsodiffered significantly at P < 0.025. The different years withdifferent rainfall amounts caused a variation in maize yieldresulting in significant differences between years (P < 0.001)for all the treatments.
3.5. Developing Simple Equations. The high correlation be-tween rainfall amount and rainfall energy (r = 0.977) leftvery little room from which to choose one parameter inplace of the other, meaning that the two parameters canbe interchanged. Therefore, if rainfall energy data is notavailable, rainfall amount can be used with negligible effecton the coefficient of determination (R2).
The following parameters were used in the equations:
RO: total seasonal runoff (mm),
SL: total seasonal soil loss (kg/ha),
YI: seasonal maize grain yield (t/ha),
ENER: total seasonal rainfall energy (J/m2),
nYEARS: number of years of cultivation,
RAIN: total seasonal rainfall amount (mm).
3.6. Runoff Equations. The following equation was used forthe determination of runoff:
RO = a + bX1 + cEXP(X2), (2)
where a is constant; b and c are coefficients; X1 is ENER; X2
is nYEARS.Runoff under the bare fallow was estimated to increase
directly with increasing rainfall energy (Table 1) at 19 mm/1000 kJ/m2. Runoff also increased exponentially to the year,whereby the estimated runoff during the first year was156 mm/10 000 kJ/m2 and by the ninth year it was estimatedto be 272 mm/10 000 kJ/m2. With an R2 value of 0.92, runoff
Table 1: The effect of rainfall energy and number of years ofcultivation on runoff under different tillage systems at MakoholiContill site.
Treatment Constant Energy Exp. nYears R2
Bare fallow −30.0 0.01856 0.01437 0.92
Conv. tillage −26.9 0.00987 0.00960 0.80
Mulch ripping −36.1 0.00661 0.00213 0.66
Tied ridging −29.4 0.005377 −0.00223 0.67
from the bare fallow can be confidently predicted usingrainfall energy and the number of years of cultivation.
Under cropped treatments, runoff was estimatedto increase directly with the increase in rainfall energyat about 10 mm/1000 kJ/m2 under conventional tillage,6.6 mm/1000 kJ/m2 under mulch ripping, and 5.4 mm/1000 kJ/m2 under tied ridging. It was also predicted toincrease from about 72 mm/10 000 kJ/m2 during the firstyear of cultivation to about 150 mm/10 000 kJ/m2 duringthe ninth year under conventional tillage, from 30 mm/10000 kJ/m2 to 47 mm/10000 kJ/m2 under mulch rippingand decrease from 25 mm/10000 kJ/m2 to 6.3 mm/10000 kJ/m2 under tied ridging. Thus runoff under con-ventional tillage was estimated to increase by 78 mm fromthe first year to the ninth year and by a mere 17 mmunder mulch ripping for the same period. This increaseunder mulch ripping was generally a result of high runoffrecorded during wet years, where the soil under the mulchwas saturated (high infiltration and reduced evaporativelosses). However, when rainfall amount was normal and welldistributed, runoff tended to decrease with the number ofyears of cultivation, that is, the cumulative effect of mulch.Runoff under tied ridging was estimated to decrease by16 mm over nine years. This is largely due to increasedinfiltration in the microdams which then reduces runoff.The R2 value of 0.80 under conventional tillage is also highenough to allow for runoff to be confidently predicted usingthese two parameters (rainfall energy and the number ofyears of cultivation).
3.7. Soil Loss Equations. The following equation was used forthe estimation of soil loss:
SL = a + bX1 + cX2, (3)
where a is constant, b and c are coefficients, X1 is nYEARS,X2 is ENER.
Under the bare fallow, the variables year and energy(Table 2) were the most descriptive ones. This was expected,as there was no ground cover to intercept rainfall energy. Soilloss was estimated to increase by 7.3 t/ha with the increase inthe number of years of cultivation and by 5.1 t/ha/1000 kJ/m2
rainfall energy. These variables explained 60% of the varia-tion of soil loss. Using the same parameters as for the barefallow, soil loss under the cropped treatments was estimatedto increase by 2.9 t/ha under conventional tillage, decreaseby 0.1 t/ha under mulch ripping, and increase by 0.2 t/haunder tied ridging with every increase in the number of years
6 Applied and Environmental Soil Science
Table 2: The effect of rainfall energy and number of years ofcultivation on soil loss under different tillage systems at MakoholiContill site.
Treatment Constant nYears Energy R2
Bare fallow −23.6 7.28 0.00505 0.60
Conv. tillage −8.78 2.92 0.000869 0.25
Mulch ripping −0.173 −0.113 0.000205 0.09
Tied ridging −0.766 0.166 0.0001129 0.27
Table 3: The effect of rainfall amount and number of yearsof cultivation on maize yield under different tillage systems atMakoholi Contill site.
Treatment Constant Exp. nYear Rainfall R2 Signif.level
Conv. tillage −2.241 −0.0009493 0.011821 0.90 P < 0.001
Mulch ripping −1.689 −0.0010092 0.011882 0.85 P < 0.001
Tied ridging −1.382 −0.0006357 0.008736 0.82 P < 0.025
of cultivation. Soil loss also tended to increase by 0.9 t/haunder conventional tillage, 0.2 t/ha under mulch ripping, and0.1 t/ha with every 1000 kJ/m2 increase in rainfall energy.
The R2 values were very low explaining only 25% ofthe variation under conventional tillage, 9% under mulchripping, and 27% under tied ridging. While for all thetreatments, increases in soil loss are given in relation to 1000J/m2; it should be noted that the average rainfall energy overthe nine years is more than ten times this value, that is, 10166 J/m2.
3.8. Yield Equations. Yield was closely related to rainfall(P < 0.001) and was related exponentially to the year, for alltreatments. The following equation was used for the deter-mination of yield:
YI = a + b EXP(X1) + cX2, (4)
where a is constant; b and c are coefficient; X1 is nYEARS; X2
is RAIN.Under conventional tillage, yields were poorly and neg-
atively correlated to year (−0.195), while better correlatedto rainfall amount (0.551). The maize grain was estimatedto increase by 1.2 t/ha for every 100 mm of rainfall received(Table 3). The highest yields were predicted under mulchripping. A low and negative r value was also found betweenyield and year (−0.241), meaning that there is a decrease inyield with time. The correlation between yield and rainfallwas lower than under conventional tillage (0.488). Cropyields were predicted to increase at 1.3 t/ha for every 100 mmof rainfall received. Yields under tied ridging were estimatedto increase at 0.9 t/ha for every 100 mm of rainfall and alsodecrease exponentially to the year.
4. Discussion
The nine years data showed the erratic and unreliable natureof rainfall, both between and within the seasons, in the semi-arid region of southern Zimbabwe. Within the nine years of
research, seasonal rainfall varied extensively from 164 mmto 994 mm. While the average rainfall amount (554 mm)still lay within the given range for this natural region (450–650 mm/yr), only one season recorded a seasonal total withinthis range and the other eight seasons recorded either higheror lower seasonal totals. The monthly and daily totals wereequally variable, with some months recording much morethan seasonal totals and some days recording more thanmonthly totals. This great variation in rainfall poses a highrisk in agricultural production, as it becomes difficult topredict rainfall for any one season with certainty [15]. Theerratic nature of rainfall also adds to the erosion problem[2]. Hudson [30] and Elwell and Stocking [31] reported thatthe rare and infrequent heavy storms cause severe erosion.The infiltration capacity of the soils, during such storms isexceeded and the high intensity causes crust formation [8],which leads to high runoff and soil losses.
The study results showed very high runoff and soil lossesunder the bare fallow and conventional tillage systems andnegligible losses under mulch ripping and tied ridging. Whenthe natural equilibrium of the soil is disturbed throughcultivation—disruption of soil aggregates and increasedaeration—the rate of organic matter mineralization isincreased [32–34]. Organic matter is important in the soilaggregation and improves water infiltration and storage[35], thus its reduction results in higher rates of soilerosion. The very high topsoil losses with conventional tillagewill eventually result in reduced plant available water andnutrients and thus productivity, as the soil depth is limiteddue to the presence of a stone line at around 50–80 cmdepth [21]. Although plant nutrients can be compensatedby additions of fertiliser or manure, in rain-fed agriculture,plant available water cannot be ameliorated. The physicalproperties, therefore, altered (e.g., water holding capacity)by soil erosion, are the most long term yield limiting factors[36]. Mulch ripping and tied ridging proved to be effective inreducing soil erosion. The mulch intercepts rainfall energy,thus increasing infiltration [37–39], while the rotting stoveradds organic matter to the soil [40, 41]. The microdamsunder tied ridging enhance water ponding thus increasingwater storage and reducing drainage [7]. The regressionequations also support the dependence of runoff primarilyon rainfall energy and the number of years of cultivation,R2 = 0.92 for bare fallow and R2 = 0.80 for conventionaltillage. The R2 values for the estimation of soil loss weregenerally lower than those found for the estimation of runoff,indicating that soil loss is also affected by other factors otherthan rainfall energy and time. Crop or ground cover andrunoff volume and velocity have to be considered as well[40]. The ground cover effect is especially important undermulch ripping, while runoff volume and velocity are alsodrastically reduced under mulch ripping and tied ridging.
Mulch ripping had the highest yield average of 3.5 t/hadue to lower evaporative losses, especially during yearswith low rainfall or poor rainfall distribution. The soilmoisture conserved ensured a better water supply to thecrop during mid-season dry spells. Although runoff wasdrastically reduced under tied ridging, the water harvestedin the microdams quickly drained away due to the very
Applied and Environmental Soil Science 7
high infiltration capacity, 40 cm/h according to Vogel [21],and low water holding capacity of these soils, which wasfound by Moyo and Hagmann [42] to be 10.3% by volume.Therefore, when rainfall events were widely spaced, thewater harvested in micro-dams did not benefit the crop,as it would have drained away. The soil surface was alsoincreased through ridging, thereby increasing evaporativelosses [42]. The variables rainfall amount and time werefound to adequately estimate yield; R2 values ranged from0.82 to 0.94 across all treatments. There was a direct linearrelationship between yield and rainfall amount and maizegrain yield increased by 0.9 (tied ridging), 1.2 (conventionaltillage), and 1.3 t/ha (mulch ripping) with every 100 mmincrement of rainfall. Yields decreased exponentially to theyear under all the treatments indicating the reduction ofproductivity as soils are opened from virgin land.
Although the sandy soils are described as inherentlyinfertile [43], the applied fertilisers seem to be adequateresulting in high yields during good rainfall seasons. Thus,rainfall, more than fertility, seems to be the most impor-tant yield-limiting factor. The study did not establish anyconclusive yield variation among the treatments, except thatunder all tillage systems, there was a yield decline withthe number of years of cultivation. Thus optimal fertiliserapplication and use of hybrid seed mask the effect of erosionon yield, as optimal crop growth can be achieved, if weatherconditions are favourable. Thus, the fertiliser application isvery much dependent on rainfall, so that rainfall becomesthe most important factor influencing crop production. Theeffect of erosion on yield is of long term, while rainfall–thussoil moisture content—is the main short-term factor thatinfluences yield.
5. Conclusions
The results of this study led to the following conclusions.
(i) Mulch ripping is the recommended tillage system forconserving soil and water and sustaining yields, whiletied ridging can also be used satisfactorily to conservesoil and water but should be combined with mulchfor better yields.
(ii) Conventional tillage practiced in the communal areashas to be replaced by conservation tillage techniquesso as to reduce soil and water losses and maintain soilproductivity.
(iii) Runoff and soil losses are a function of rainfallamount and intensity, number of years of cultivationand ground cover, that is, ploughing or minimumtillage; bare soil or soil covered with crops, weedsor mulch. The lower the intensity of tillage and thehigher the ground cover, the better.
(iv) In semiarid regions where rainfall is limiting, yieldis mostly dependent on the amount of rainfall andperiod of cultivation rather than fertility, if optimalfertilisers are used.
(v) Yield is a poor indicator of soil erosion when fertilis-ers and hybrid varieties are used as yield decline is
masked. This is likely to be the case until such a timethat yield declines even with the use of fertilisers andbetter cultivars, at which stage the damage might wellbe irreversible.
Acknowledgments
The author would like to express gratitude to GTZ forproviding the much needed funding through CONTILL(Conservation Tillage), a collaborative project between GTZand the Government of Zimbabwe (GoZ). Further acknowl-edgement goes to the GoZ, for providing the opportunityand research facilities. The author would like to thank all theCONTILL members from both Domboshawa and especiallyMakoholi site for their relentless support and input towardsthe success of this project.
References
[1] H. A. Elwell, “Sheet erosion from arable lands in Zimbabwe:prediction and control,” in Harare Symposium on Soil andWater Conservation, pp. 429–438, Harare Zimbabwe, IAE,1984.
[2] F. R. Troeh, J. A. Hobbs, and R. L. Donahue, Soil and WaterConservation for Productivity and Environmental Protection,Prentice-Hall, Englewood Cliffs, NJ, USA, 1980.
[3] J. Poesen and J. Savat, “Particle size separation during erosionby splash and runoff,” in Assessment of Erosion, M. de Boodtand D. Gabriels, Eds., pp. 427–440, Wiley, Chichester, UK,1980.
[4] R. Lal, “Monitoring soil erosion’s impact on crop productiv-ity,” Soil Erosion Research Methods, pp. 187–201, 1988.
[5] R. J. Godwin, Agricultural Engineering in Development: Tillagefor Crop Production in Areas of Low Rainfall, vol. 83, FAOAgricultural Services Bulletin, Rome, Italy, 1990.
[6] M. Stocking and L. Peake, “Soil conservation and productiv-ity,” in Proceedings of the 4th International Conference on SoilConservation, pp. 399–438, University of Venezuale, Maracay,Venezuela, November 1985.
[7] N. W. Hudson, Land Husbandry, Batsford, London, UK, 1992.[8] D. K. Cassel, C. W. Raczkowski, and H. P. Denton, “Tillage
effects on corn production and soil physical conditions,” SoilScience Society of America Journal, vol. 59, no. 5, pp. 1436–1443, 1995.
[9] G. Wrigley, Tropical Agriculture: The Development and Produc-tion, Macmillan Publishing, New York, NY, USA, 1992.
[10] Y. Le Bissonnais and M. J. Singer, “Crusting, runoff, anderosion response to soil water content and successive rainfalls,”Soil Science Society of America Bulletin, vol. 56, no. 6, pp. 1898–1903, 1992.
[11] M. H. Beare, P. F. Hendrix, and D. C. Coleman, “Water-stableaggregates and organic matter fractions in conventional- andno-tillage soils,” Soil Science Society of America Journal, vol. 58,no. 3, pp. 777–786, 1994.
[12] R. P. C. Morgan, Soil Erosion and Conservation, LongmanGroup UK Limited, Harlow, UK, 1986.
[13] H. A. Elwell, “Feasibility of modelling annual soil loss, runoffand maize yiled for the two research sites, Domboshawaand Makoholi. Projections to other natural regions in Zim-babwe. Testing of and contributions to SLEMSA,” ConsultancyReport, AGRITEX/ GTZ Conservation Tillage Project IAE,Harare, Zimbabwe, 1994.
8 Applied and Environmental Soil Science
[14] P.M. Grant, “Peasant farming on infertile sands,” RhodesianScience News, vol. 10, no. 10, pp. 252–254, 1976.
[15] S. Moyo, P. Robinson, Y. Katerere, S. Stevenson, and S.Gombo, Zimbabwe’s Environmental Dilemma. Balancing Re-source Inequities, ZERO, Harare, Zimbabwe, 1991.
[16] F. B. S. Kaihura, I. K. Kullaya, M. Kilasara, J. B. Aune, B. R.Singh, and R. Lal, “Impact of soil erosion on soil productivityand crop yield in Tanzania,” Advances in GeoEcology, vol. 31,pp. 375–381, 1998.
[17] M. Rosenberg, “Koeppen climate classification,” 2007, http://geography.about.com/od/physical geography/a/koeppen.htm.
[18] MNTR, The National Conservation Strategy, Zimbabwe’s Roadto Survival, The Government of Zimbabwe, Harare, Zim-babwe, 1987.
[19] J. G. Thompson and W. D. Purves, A Guide to the Soilsof Rhodesia, vol. 1, Department of Research and SpecialistServices, Harare, Zimbabwe, 1978.
[20] K. Nyamapfene, Soils of Zimbabwe, Nehanda Publishers, Har-are, Zimbabwe, 1991.
[21] H. Vogel, “An evaluation of five tillage systems from small-holder agriculture in Zimbabwe,” Landwirtschaft der Tropen,vol. 94, pp. 21–36, 1993.
[22] Anon, Guide to Makoholi Experiment Station, Department ofResearch and Specialist Services, Salisbury, UK, 1969.
[23] J. G. Thompson, Report on the Soils of the Makoholi ExperimentStation, Department of Research and Specialist Services,Salisbury, UK, 1967.
[24] J. G. Thompson and W. D. Purves, A Guide to the Soilsof Zimbabwe, vol. 3, Department of Research and SpecialistServices, CHarare, Zimbabwe, 1981.
[25] CONTILL, “Conservation tillage for sustainable crop produc-tion systems,” Working Document, IAE, Harare, Zimbabwe,1990.
[26] F. E. Wendelaar and A. N. Purkis, “Recording soil loss andrunoff from 300 m2 erosion research field plots,” ResearchBulletin 24, Conex, Harare, Zimbabwe, 1979.
[27] A. Moyo, Assessment of the effect of soil erosion on nutrient lossfrom granite-derived sandy soils under different tillage systemsin Zimbabwe, Ph.D. thesis, 2003.
[28] A. Munodawafa, “Assessing nutrient losses with soil erosionunder different tillage systems and their implications on waterquality,” Physics and Chemistry of the Earth, vol. 32, no. 15–18,pp. 1135–1140, 2007.
[29] K. J. Olsen, “Modelling runoff and soil loss on coarse grainedsandy soils at Domboshawa, Zimbabwe,” Contill ProjectResearch Report 12, IAE, Harare Zimbabwe, 1994.
[30] N. W. Hudson, Erosion Research. Advisory Notes, Conex,Salisbury, UK, 1958.
[31] H. A. Elwell and M. A. Stocking, “Rainfall parameters and acover model to predict runoff and soil loss from grazing trialsin the Rhodesian sandveld,” Grasslands Society for SouthernAfrica, vol. 9, pp. 157–164, 1974.
[32] D. Schroeder, Soils. Facts and Concepts, FHAG, Berne, Switzer-land, 1984.
[33] J. R. Salinas-Garcia, F. M. Hons, and J. E. Matocha, “Long-term effects of tillage and fertilization on soil organic matterdynamics,” Soil Science Society of America Journal, vol. 61, no.1, pp. 152–159, 1997.
[34] D. A. Angers, A. N’dayegamiye, and D. Cote, “Tillage-induceddifferences in organic matter of particle-size fractions andmicrobial biomass,” Soil Science Society of America Journal, vol.57, no. 2, pp. 512–516, 1993.
[35] R. H. Follett, S. C. Gupta, and P. G. Hunt, “Conservationpractices: relation to the management of plant nutrients for
crop production,” in Soil Fertility and Organic Matter asCritical Components of Production Systems, pp. 19–51, Journalof Soil Science Society of America, Special Publication 19,Madison, Wis, USA, 1987.
[36] B. Lowery and W. E. Larson, “Erosion impact on soil pro-ductivity,” Journal of Soil Science Society of America, vol. 59,no. 3, pp. 647–648, 1995.
[37] J. E. Adams, “Influence of mulches on runoff, erosion andsoil moisture depletion,” Proceedings of Soil Science Society ofAmerica, vol. 30, pp. 110–114, 1966.
[38] P. G. Braithwaite, “Conservation tillage- planting systems,”Rhodesian Farmer, vol. 10, pp. 25–32, 1976.
[39] H. A. Elwell, “An assessment of soil erosion in Zimbabwe,”Zimbabwe Science News, vol. 19, no. 3-4, pp. 27–31, 1986.
[40] W. L. Hargrove, “Crop residue management in the South-East,” in Proceedings of the National Conference on Crop ResidueManagement for Conservation, Lexington, Ky, USA, 1991.
[41] D. C. Reicosky, W. D. Kemper, G. W. Langdale, C. L. Douglas,and P. E. Rasmussen, “Soil organic matter changes resultingfrom tillage and biomass production,” Journal of Soil andWater Conservation, vol. 50, no. 3, pp. 253–261, 1995.
[42] A. Moyo and J. Hagmann, “Growth-effective rainfall inmaize production under different tillage systems in semi aridconditions and shallow granitic sands of Southern Zimbabwe,”in Proceedings of the 13th International Soil Tillage ResearchOrganisation, Aalborg, Denmark, July 1994.
[43] P. Grant, “Peasant farming on infertile sands,” in The RhodesiaScience News, vol. 10, pp. 252–254, Rhodesia Scientific Associ-ation, Harare, Zimbabwe, 10 edition, 1981.
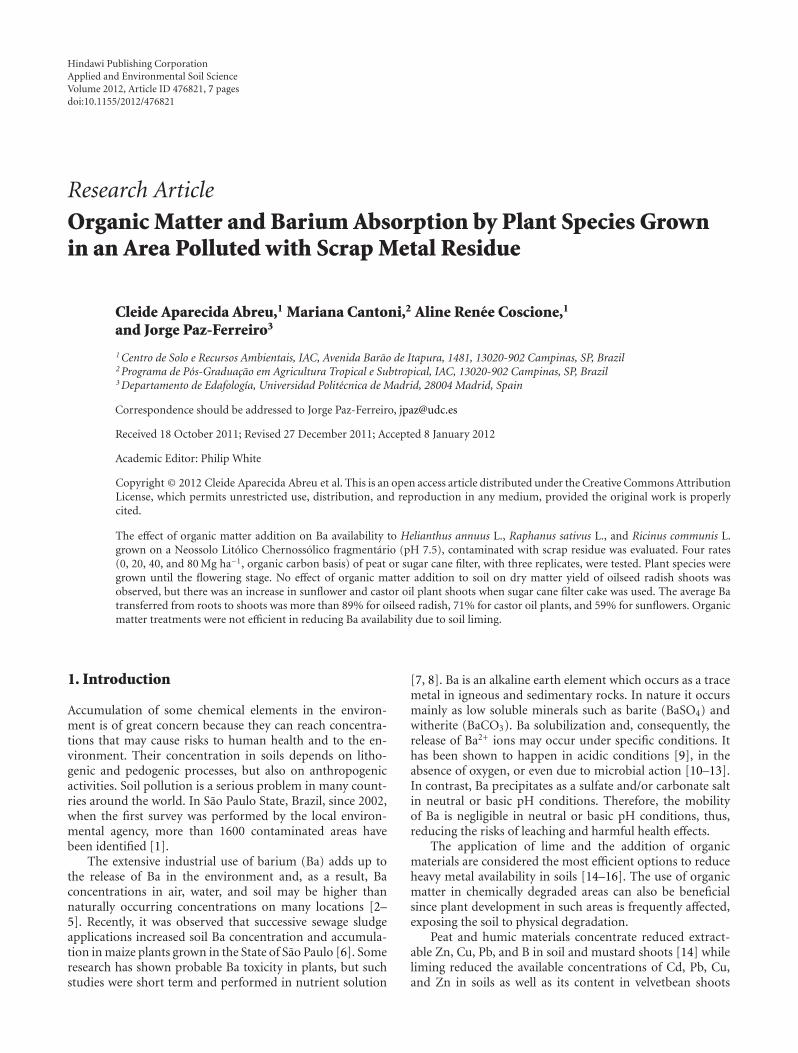
Hindawi Publishing CorporationApplied and Environmental Soil ScienceVolume 2012, Article ID 476821, 7 pagesdoi:10.1155/2012/476821
Research Article
Organic Matter and Barium Absorption by Plant Species Grownin an Area Polluted with Scrap Metal Residue
Cleide Aparecida Abreu,1 Mariana Cantoni,2 Aline Renee Coscione,1
and Jorge Paz-Ferreiro3
1 Centro de Solo e Recursos Ambientais, IAC, Avenida Barao de Itapura, 1481, 13020-902 Campinas, SP, Brazil2 Programa de Pos-Graduacao em Agricultura Tropical e Subtropical, IAC, 13020-902 Campinas, SP, Brazil3 Departamento de Edafologıa, Universidad Politecnica de Madrid, 28004 Madrid, Spain
Correspondence should be addressed to Jorge Paz-Ferreiro, [email protected]
Received 18 October 2011; Revised 27 December 2011; Accepted 8 January 2012
Academic Editor: Philip White
Copyright © 2012 Cleide Aparecida Abreu et al. This is an open access article distributed under the Creative Commons AttributionLicense, which permits unrestricted use, distribution, and reproduction in any medium, provided the original work is properlycited.
The effect of organic matter addition on Ba availability to Helianthus annuus L., Raphanus sativus L., and Ricinus communis L.grown on a Neossolo Litolico Chernossolico fragmentario (pH 7.5), contaminated with scrap residue was evaluated. Four rates(0, 20, 40, and 80 Mg ha−1, organic carbon basis) of peat or sugar cane filter, with three replicates, were tested. Plant species weregrown until the flowering stage. No effect of organic matter addition to soil on dry matter yield of oilseed radish shoots wasobserved, but there was an increase in sunflower and castor oil plant shoots when sugar cane filter cake was used. The average Batransferred from roots to shoots was more than 89% for oilseed radish, 71% for castor oil plants, and 59% for sunflowers. Organicmatter treatments were not efficient in reducing Ba availability due to soil liming.
1. Introduction
Accumulation of some chemical elements in the environ-ment is of great concern because they can reach concentra-tions that may cause risks to human health and to the en-vironment. Their concentration in soils depends on litho-genic and pedogenic processes, but also on anthropogenicactivities. Soil pollution is a serious problem in many count-ries around the world. In Sao Paulo State, Brazil, since 2002,when the first survey was performed by the local environ-mental agency, more than 1600 contaminated areas havebeen identified [1].
The extensive industrial use of barium (Ba) adds up tothe release of Ba in the environment and, as a result, Baconcentrations in air, water, and soil may be higher thannaturally occurring concentrations on many locations [2–5]. Recently, it was observed that successive sewage sludgeapplications increased soil Ba concentration and accumula-tion in maize plants grown in the State of Sao Paulo [6]. Someresearch has shown probable Ba toxicity in plants, but suchstudies were short term and performed in nutrient solution
[7, 8]. Ba is an alkaline earth element which occurs as a tracemetal in igneous and sedimentary rocks. In nature it occursmainly as low soluble minerals such as barite (BaSO4) andwitherite (BaCO3). Ba solubilization and, consequently, therelease of Ba2+ ions may occur under specific conditions. Ithas been shown to happen in acidic conditions [9], in theabsence of oxygen, or even due to microbial action [10–13].In contrast, Ba precipitates as a sulfate and/or carbonate saltin neutral or basic pH conditions. Therefore, the mobilityof Ba is negligible in neutral or basic pH conditions, thus,reducing the risks of leaching and harmful health effects.
The application of lime and the addition of organicmaterials are considered the most efficient options to reduceheavy metal availability in soils [14–16]. The use of organicmatter in chemically degraded areas can also be beneficialsince plant development in such areas is frequently affected,exposing the soil to physical degradation.
Peat and humic materials concentrate reduced extract-able Zn, Cu, Pb, and B in soil and mustard shoots [14] whileliming reduced the available concentrations of Cd, Pb, Cu,and Zn in soils as well as its content in velvetbean shoots
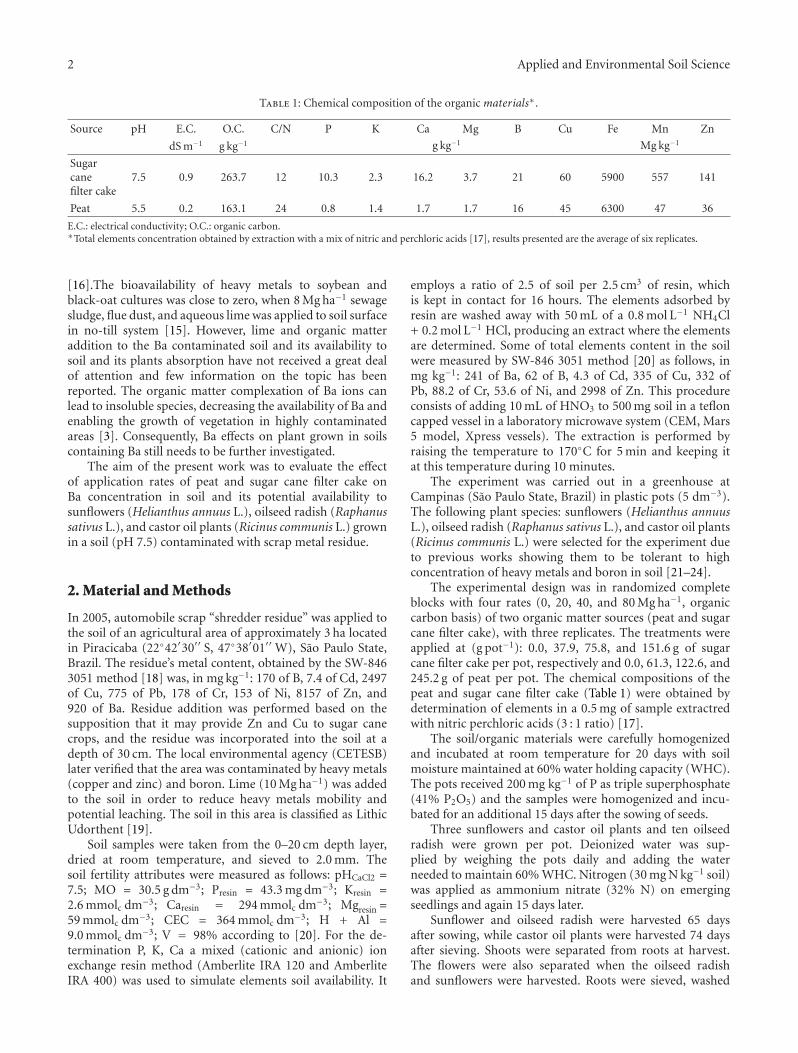
2 Applied and Environmental Soil Science
Table 1: Chemical composition of the organic materials∗.
Source pH E.C. O.C. C/N P K Ca Mg B Cu Fe Mn Zn
dS m−1 g kg−1 g kg−1 Mg kg−1
Sugarcanefilter cake
7.5 0.9 263.7 12 10.3 2.3 16.2 3.7 21 60 5900 557 141
Peat 5.5 0.2 163.1 24 0.8 1.4 1.7 1.7 16 45 6300 47 36
E.C.: electrical conductivity; O.C.: organic carbon.∗Total elements concentration obtained by extraction with a mix of nitric and perchloric acids [17], results presented are the average of six replicates.
[16].The bioavailability of heavy metals to soybean andblack-oat cultures was close to zero, when 8 Mg ha−1 sewagesludge, flue dust, and aqueous lime was applied to soil surfacein no-till system [15]. However, lime and organic matteraddition to the Ba contaminated soil and its availability tosoil and its plants absorption have not received a great dealof attention and few information on the topic has beenreported. The organic matter complexation of Ba ions canlead to insoluble species, decreasing the availability of Ba andenabling the growth of vegetation in highly contaminatedareas [3]. Consequently, Ba effects on plant grown in soilscontaining Ba still needs to be further investigated.
The aim of the present work was to evaluate the effectof application rates of peat and sugar cane filter cake onBa concentration in soil and its potential availability tosunflowers (Helianthus annuus L.), oilseed radish (Raphanussativus L.), and castor oil plants (Ricinus communis L.) grownin a soil (pH 7.5) contaminated with scrap metal residue.
2. Material and Methods
In 2005, automobile scrap “shredder residue” was applied tothe soil of an agricultural area of approximately 3 ha locatedin Piracicaba (22◦42′30′′ S, 47◦38′01′′ W), Sao Paulo State,Brazil. The residue’s metal content, obtained by the SW-8463051 method [18] was, in mg kg−1: 170 of B, 7.4 of Cd, 2497of Cu, 775 of Pb, 178 of Cr, 153 of Ni, 8157 of Zn, and920 of Ba. Residue addition was performed based on thesupposition that it may provide Zn and Cu to sugar canecrops, and the residue was incorporated into the soil at adepth of 30 cm. The local environmental agency (CETESB)later verified that the area was contaminated by heavy metals(copper and zinc) and boron. Lime (10 Mg ha−1) was addedto the soil in order to reduce heavy metals mobility andpotential leaching. The soil in this area is classified as LithicUdorthent [19].
Soil samples were taken from the 0–20 cm depth layer,dried at room temperature, and sieved to 2.0 mm. Thesoil fertility attributes were measured as follows: pHCaCl2 =7.5; MO = 30.5 g dm−3; Presin = 43.3 mg dm−3; Kresin =2.6 mmolc dm−3; Caresin = 294 mmolc dm−3; Mgresin =59 mmolc dm−3; CEC = 364 mmolc dm−3; H + Al =9.0 mmolc dm−3; V = 98% according to [20]. For the de-termination P, K, Ca a mixed (cationic and anionic) ionexchange resin method (Amberlite IRA 120 and AmberliteIRA 400) was used to simulate elements soil availability. It
employs a ratio of 2.5 of soil per 2.5 cm3 of resin, whichis kept in contact for 16 hours. The elements adsorbed byresin are washed away with 50 mL of a 0.8 mol L−1 NH4Cl+ 0.2 mol L−1 HCl, producing an extract where the elementsare determined. Some of total elements content in the soilwere measured by SW-846 3051 method [20] as follows, inmg kg−1: 241 of Ba, 62 of B, 4.3 of Cd, 335 of Cu, 332 ofPb, 88.2 of Cr, 53.6 of Ni, and 2998 of Zn. This procedureconsists of adding 10 mL of HNO3 to 500 mg soil in a tefloncapped vessel in a laboratory microwave system (CEM, Mars5 model, Xpress vessels). The extraction is performed byraising the temperature to 170◦C for 5 min and keeping itat this temperature during 10 minutes.
The experiment was carried out in a greenhouse atCampinas (Sao Paulo State, Brazil) in plastic pots (5 dm−3).The following plant species: sunflowers (Helianthus annuusL.), oilseed radish (Raphanus sativus L.), and castor oil plants(Ricinus communis L.) were selected for the experiment dueto previous works showing them to be tolerant to highconcentration of heavy metals and boron in soil [21–24].
The experimental design was in randomized completeblocks with four rates (0, 20, 40, and 80 Mg ha−1, organiccarbon basis) of two organic matter sources (peat and sugarcane filter cake), with three replicates. The treatments wereapplied at (g pot−1): 0.0, 37.9, 75.8, and 151.6 g of sugarcane filter cake per pot, respectively and 0.0, 61.3, 122.6, and245.2 g of peat per pot. The chemical compositions of thepeat and sugar cane filter cake (Table 1) were obtained bydetermination of elements in a 0.5 mg of sample extractredwith nitric perchloric acids (3 : 1 ratio) [17].
The soil/organic materials were carefully homogenizedand incubated at room temperature for 20 days with soilmoisture maintained at 60% water holding capacity (WHC).The pots received 200 mg kg−1 of P as triple superphosphate(41% P2O5) and the samples were homogenized and incu-bated for an additional 15 days after the sowing of seeds.
Three sunflowers and castor oil plants and ten oilseedradish were grown per pot. Deionized water was sup-plied by weighing the pots daily and adding the waterneeded to maintain 60% WHC. Nitrogen (30 mg N kg−1 soil)was applied as ammonium nitrate (32% N) on emergingseedlings and again 15 days later.
Sunflower and oilseed radish were harvested 65 daysafter sowing, while castor oil plants were harvested 74 daysafter sieving. Shoots were separated from roots at harvest.The flowers were also separated when the oilseed radishand sunflowers were harvested. Roots were sieved, washed
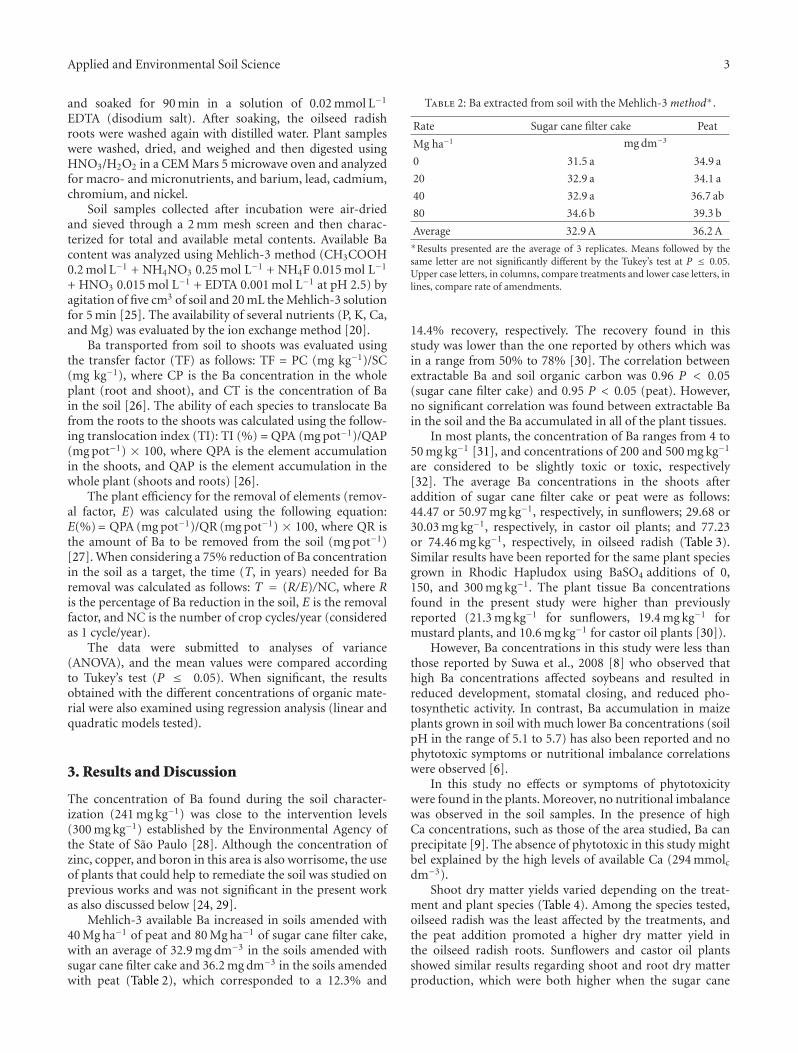
Applied and Environmental Soil Science 3
and soaked for 90 min in a solution of 0.02 mmol L−1
EDTA (disodium salt). After soaking, the oilseed radishroots were washed again with distilled water. Plant sampleswere washed, dried, and weighed and then digested usingHNO3/H2O2 in a CEM Mars 5 microwave oven and analyzedfor macro- and micronutrients, and barium, lead, cadmium,chromium, and nickel.
Soil samples collected after incubation were air-driedand sieved through a 2 mm mesh screen and then charac-terized for total and available metal contents. Available Bacontent was analyzed using Mehlich-3 method (CH3COOH0.2 mol L−1 + NH4NO3 0.25 mol L−1 + NH4F 0.015 mol L−1
+ HNO3 0.015 mol L−1 + EDTA 0.001 mol L−1 at pH 2.5) byagitation of five cm3 of soil and 20 mL the Mehlich-3 solutionfor 5 min [25]. The availability of several nutrients (P, K, Ca,and Mg) was evaluated by the ion exchange method [20].
Ba transported from soil to shoots was evaluated usingthe transfer factor (TF) as follows: TF = PC (mg kg−1)/SC(mg kg−1), where CP is the Ba concentration in the wholeplant (root and shoot), and CT is the concentration of Bain the soil [26]. The ability of each species to translocate Bafrom the roots to the shoots was calculated using the follow-ing translocation index (TI): TI (%) = QPA (mg pot−1)/QAP(mg pot−1) × 100, where QPA is the element accumulationin the shoots, and QAP is the element accumulation in thewhole plant (shoots and roots) [26].
The plant efficiency for the removal of elements (remov-al factor, E) was calculated using the following equation:E(%)= QPA (mg pot−1)/QR (mg pot−1) × 100, where QR isthe amount of Ba to be removed from the soil (mg pot−1)[27]. When considering a 75% reduction of Ba concentrationin the soil as a target, the time (T, in years) needed for Baremoval was calculated as follows: T = (R/E)/NC, where Ris the percentage of Ba reduction in the soil, E is the removalfactor, and NC is the number of crop cycles/year (consideredas 1 cycle/year).
The data were submitted to analyses of variance(ANOVA), and the mean values were compared accordingto Tukey’s test (P ≤ 0.05). When significant, the resultsobtained with the different concentrations of organic mate-rial were also examined using regression analysis (linear andquadratic models tested).
3. Results and Discussion
The concentration of Ba found during the soil character-ization (241 mg kg−1) was close to the intervention levels(300 mg kg−1) established by the Environmental Agency ofthe State of Sao Paulo [28]. Although the concentration ofzinc, copper, and boron in this area is also worrisome, the useof plants that could help to remediate the soil was studied onprevious works and was not significant in the present workas also discussed below [24, 29].
Mehlich-3 available Ba increased in soils amended with40 Mg ha−1 of peat and 80 Mg ha−1 of sugar cane filter cake,with an average of 32.9 mg dm−3 in the soils amended withsugar cane filter cake and 36.2 mg dm−3 in the soils amendedwith peat (Table 2), which corresponded to a 12.3% and
Table 2: Ba extracted from soil with the Mehlich-3 method∗.
Rate Sugar cane filter cake Peat
Mg ha−1 mg dm−3
0 31.5 a 34.9 a
20 32.9 a 34.1 a
40 32.9 a 36.7 ab
80 34.6 b 39.3 b
Average 32.9 A 36.2 A∗Results presented are the average of 3 replicates. Means followed by thesame letter are not significantly different by the Tukey’s test at P ≤ 0.05.Upper case letters, in columns, compare treatments and lower case letters, inlines, compare rate of amendments.
14.4% recovery, respectively. The recovery found in thisstudy was lower than the one reported by others which wasin a range from 50% to 78% [30]. The correlation betweenextractable Ba and soil organic carbon was 0.96 P < 0.05(sugar cane filter cake) and 0.95 P < 0.05 (peat). However,no significant correlation was found between extractable Bain the soil and the Ba accumulated in all of the plant tissues.
In most plants, the concentration of Ba ranges from 4 to50 mg kg−1 [31], and concentrations of 200 and 500 mg kg−1
are considered to be slightly toxic or toxic, respectively[32]. The average Ba concentrations in the shoots afteraddition of sugar cane filter cake or peat were as follows:44.47 or 50.97 mg kg−1, respectively, in sunflowers; 29.68 or30.03 mg kg−1, respectively, in castor oil plants; and 77.23or 74.46 mg kg−1, respectively, in oilseed radish (Table 3).Similar results have been reported for the same plant speciesgrown in Rhodic Hapludox using BaSO4 additions of 0,150, and 300 mg kg−1. The plant tissue Ba concentrationsfound in the present study were higher than previouslyreported (21.3 mg kg−1 for sunflowers, 19.4 mg kg−1 formustard plants, and 10.6 mg kg−1 for castor oil plants [30]).
However, Ba concentrations in this study were less thanthose reported by Suwa et al., 2008 [8] who observed thathigh Ba concentrations affected soybeans and resulted inreduced development, stomatal closing, and reduced pho-tosynthetic activity. In contrast, Ba accumulation in maizeplants grown in soil with much lower Ba concentrations (soilpH in the range of 5.1 to 5.7) has also been reported and nophytotoxic symptoms or nutritional imbalance correlationswere observed [6].
In this study no effects or symptoms of phytotoxicitywere found in the plants. Moreover, no nutritional imbalancewas observed in the soil samples. In the presence of highCa concentrations, such as those of the area studied, Ba canprecipitate [9]. The absence of phytotoxic in this study mightbel explained by the high levels of available Ca (294 mmolcdm−3).
Shoot dry matter yields varied depending on the treat-ment and plant species (Table 4). Among the species tested,oilseed radish was the least affected by the treatments, andthe peat addition promoted a higher dry matter yield inthe oilseed radish roots. Sunflowers and castor oil plantsshowed similar results regarding shoot and root dry matterproduction, which were both higher when the sugar cane
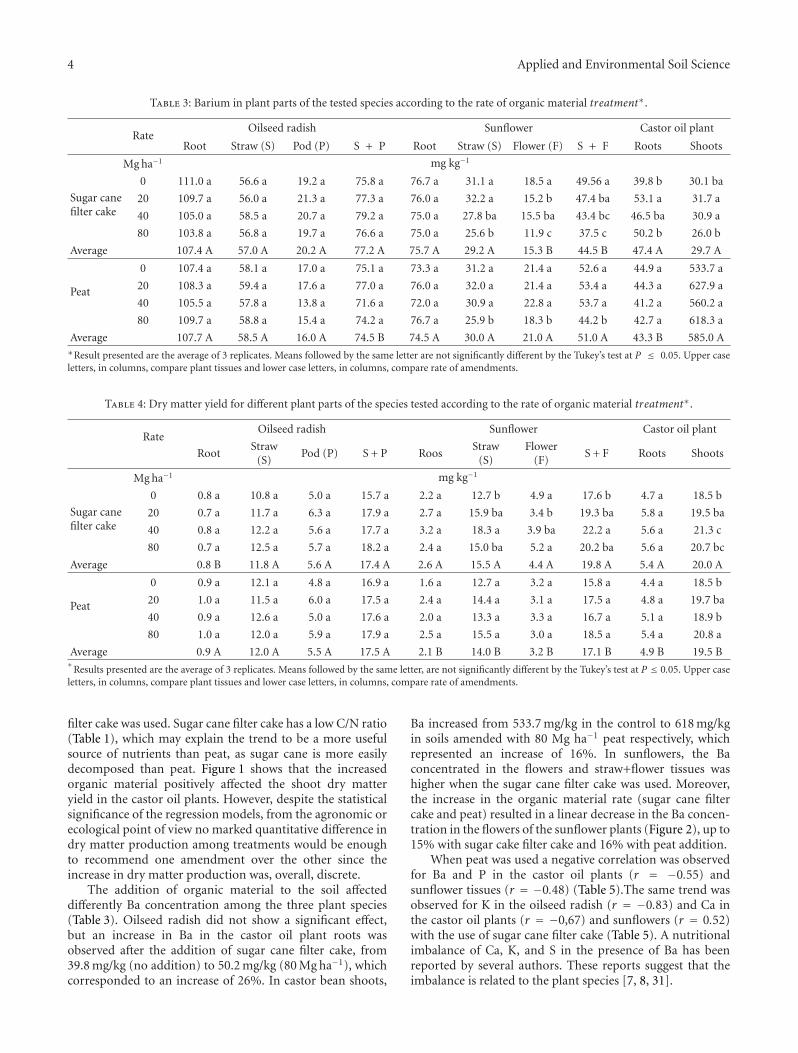
4 Applied and Environmental Soil Science
Table 3: Barium in plant parts of the tested species according to the rate of organic material treatment∗.
RateOilseed radish Sunflower Castor oil plant
Root Straw (S) Pod (P) S + P Root Straw (S) Flower (F) S + F Roots Shoots
Mg ha−1 mg kg−1
Sugar canefilter cake
0 111.0 a 56.6 a 19.2 a 75.8 a 76.7 a 31.1 a 18.5 a 49.56 a 39.8 b 30.1 ba
20 109.7 a 56.0 a 21.3 a 77.3 a 76.0 a 32.2 a 15.2 b 47.4 ba 53.1 a 31.7 a
40 105.0 a 58.5 a 20.7 a 79.2 a 75.0 a 27.8 ba 15.5 ba 43.4 bc 46.5 ba 30.9 a
80 103.8 a 56.8 a 19.7 a 76.6 a 75.0 a 25.6 b 11.9 c 37.5 c 50.2 b 26.0 b
Average 107.4 A 57.0 A 20.2 A 77.2 A 75.7 A 29.2 A 15.3 B 44.5 B 47.4 A 29.7 A
Peat
0 107.4 a 58.1 a 17.0 a 75.1 a 73.3 a 31.2 a 21.4 a 52.6 a 44.9 a 533.7 a
20 108.3 a 59.4 a 17.6 a 77.0 a 76.0 a 32.0 a 21.4 a 53.4 a 44.3 a 627.9 a
40 105.5 a 57.8 a 13.8 a 71.6 a 72.0 a 30.9 a 22.8 a 53.7 a 41.2 a 560.2 a
80 109.7 a 58.8 a 15.4 a 74.2 a 76.7 a 25.9 b 18.3 b 44.2 b 42.7 a 618.3 a
Average 107.7 A 58.5 A 16.0 A 74.5 B 74.5 A 30.0 A 21.0 A 51.0 A 43.3 B 585.0 A∗Result presented are the average of 3 replicates. Means followed by the same letter are not significantly different by the Tukey’s test at P ≤ 0.05. Upper caseletters, in columns, compare plant tissues and lower case letters, in columns, compare rate of amendments.
Table 4: Dry matter yield for different plant parts of the species tested according to the rate of organic material treatment∗.
RateOilseed radish Sunflower Castor oil plant
RootStraw
(S)Pod (P) S + P Roos
Straw(S)
Flower(F)
S + F Roots Shoots
Mg ha−1 mg kg−1
Sugar canefilter cake
0 0.8 a 10.8 a 5.0 a 15.7 a 2.2 a 12.7 b 4.9 a 17.6 b 4.7 a 18.5 b
20 0.7 a 11.7 a 6.3 a 17.9 a 2.7 a 15.9 ba 3.4 b 19.3 ba 5.8 a 19.5 ba
40 0.8 a 12.2 a 5.6 a 17.7 a 3.2 a 18.3 a 3.9 ba 22.2 a 5.6 a 21.3 c
80 0.7 a 12.5 a 5.7 a 18.2 a 2.4 a 15.0 ba 5.2 a 20.2 ba 5.6 a 20.7 bc
Average 0.8 B 11.8 A 5.6 A 17.4 A 2.6 A 15.5 A 4.4 A 19.8 A 5.4 A 20.0 A
Peat
0 0.9 a 12.1 a 4.8 a 16.9 a 1.6 a 12.7 a 3.2 a 15.8 a 4.4 a 18.5 b
20 1.0 a 11.5 a 6.0 a 17.5 a 2.4 a 14.4 a 3.1 a 17.5 a 4.8 a 19.7 ba
40 0.9 a 12.6 a 5.0 a 17.6 a 2.0 a 13.3 a 3.3 a 16.7 a 5.1 a 18.9 b
80 1.0 a 12.0 a 5.9 a 17.9 a 2.5 a 15.5 a 3.0 a 18.5 a 5.4 a 20.8 a
Average 0.9 A 12.0 A 5.5 A 17.5 A 2.1 B 14.0 B 3.2 B 17.1 B 4.9 B 19.5 B∗
Results presented are the average of 3 replicates. Means followed by the same letter, are not significantly different by the Tukey’s test at P ≤ 0.05. Upper caseletters, in columns, compare plant tissues and lower case letters, in columns, compare rate of amendments.
filter cake was used. Sugar cane filter cake has a low C/N ratio(Table 1), which may explain the trend to be a more usefulsource of nutrients than peat, as sugar cane is more easilydecomposed than peat. Figure 1 shows that the increasedorganic material positively affected the shoot dry matteryield in the castor oil plants. However, despite the statisticalsignificance of the regression models, from the agronomic orecological point of view no marked quantitative difference indry matter production among treatments would be enoughto recommend one amendment over the other since theincrease in dry matter production was, overall, discrete.
The addition of organic material to the soil affecteddifferently Ba concentration among the three plant species(Table 3). Oilseed radish did not show a significant effect,but an increase in Ba in the castor oil plant roots wasobserved after the addition of sugar cane filter cake, from39.8 mg/kg (no addition) to 50.2 mg/kg (80 Mg ha−1), whichcorresponded to an increase of 26%. In castor bean shoots,
Ba increased from 533.7 mg/kg in the control to 618 mg/kgin soils amended with 80 Mg ha−1 peat respectively, whichrepresented an increase of 16%. In sunflowers, the Baconcentrated in the flowers and straw+flower tissues washigher when the sugar cane filter cake was used. Moreover,the increase in the organic material rate (sugar cane filtercake and peat) resulted in a linear decrease in the Ba concen-tration in the flowers of the sunflower plants (Figure 2), up to15% with sugar cake filter cake and 16% with peat addition.
When peat was used a negative correlation was observedfor Ba and P in the castor oil plants (r = −0.55) andsunflower tissues (r = −0.48) (Table 5).The same trend wasobserved for K in the oilseed radish (r = −0.83) and Ca inthe castor oil plants (r = −0,67) and sunflowers (r = 0.52)with the use of sugar cane filter cake (Table 5). A nutritionalimbalance of Ca, K, and S in the presence of Ba has beenreported by several authors. These reports suggest that theimbalance is related to the plant species [7, 8, 31].
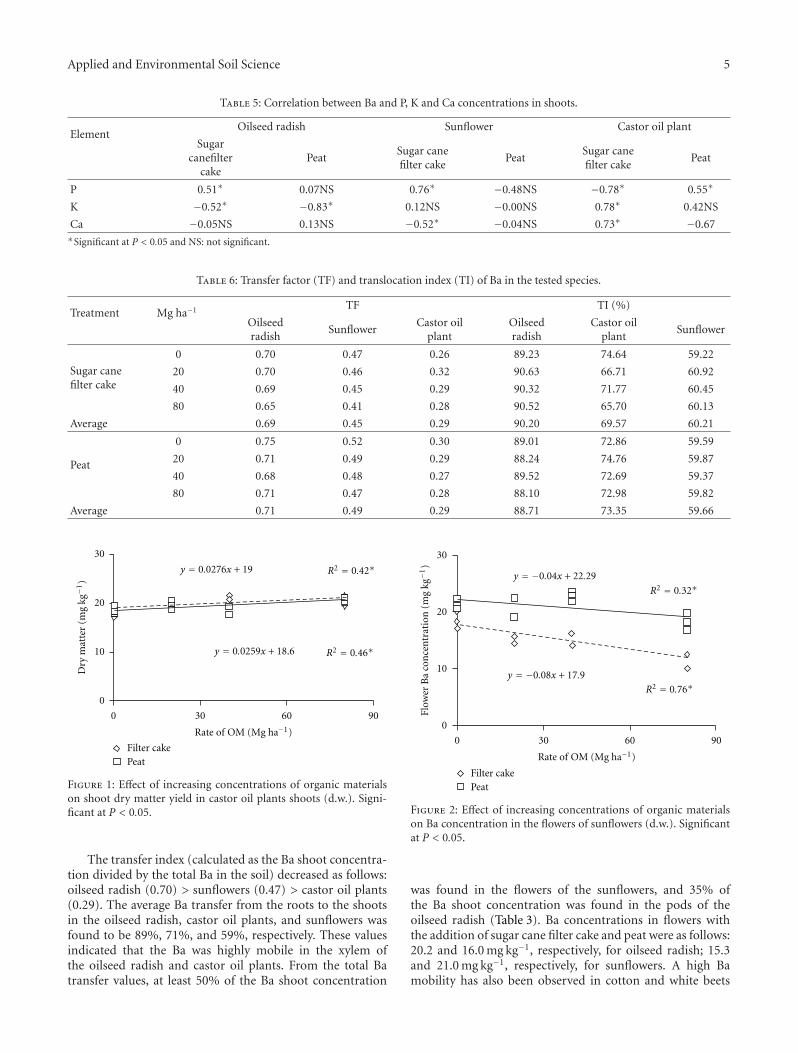
Applied and Environmental Soil Science 5
Table 5: Correlation between Ba and P, K and Ca concentrations in shoots.
ElementOilseed radish Sunflower Castor oil plant
Sugarcanefilter
cakePeat
Sugar canefilter cake
PeatSugar canefilter cake
Peat
P 0.51∗ 0.07NS 0.76∗ −0.48NS −0.78∗ 0.55∗
K −0.52∗ −0.83∗ 0.12NS −0.00NS 0.78∗ 0.42NS
Ca −0.05NS 0.13NS −0.52∗ −0.04NS 0.73∗ −0.67∗Significant at P < 0.05 and NS: not significant.
Table 6: Transfer factor (TF) and translocation index (TI) of Ba in the tested species.
Treatment Mg ha−1 TF TI (%)
Oilseedradish
SunflowerCastor oil
plantOilseedradish
Castor oilplant
Sunflower
Sugar canefilter cake
0 0.70 0.47 0.26 89.23 74.64 59.22
20 0.70 0.46 0.32 90.63 66.71 60.92
40 0.69 0.45 0.29 90.32 71.77 60.45
80 0.65 0.41 0.28 90.52 65.70 60.13
Average 0.69 0.45 0.29 90.20 69.57 60.21
Peat
0 0.75 0.52 0.30 89.01 72.86 59.59
20 0.71 0.49 0.29 88.24 74.76 59.87
40 0.68 0.48 0.27 89.52 72.69 59.37
80 0.71 0.47 0.28 88.10 72.98 59.82
Average 0.71 0.49 0.29 88.71 73.35 59.66
30
20
10
0
0 30 60 90
Dry
mat
ter
(mg
kg−1
)
Filter cakePeat
Rate of OM (Mg ha−1)
y = 0.0276x + 19 R2 = 0.42∗
y = 0.0259x + 18.6 R2 = 0.46∗
Figure 1: Effect of increasing concentrations of organic materialson shoot dry matter yield in castor oil plants shoots (d.w.). Signi-ficant at P < 0.05.
The transfer index (calculated as the Ba shoot concentra-tion divided by the total Ba in the soil) decreased as follows:oilseed radish (0.70) > sunflowers (0.47) > castor oil plants(0.29). The average Ba transfer from the roots to the shootsin the oilseed radish, castor oil plants, and sunflowers wasfound to be 89%, 71%, and 59%, respectively. These valuesindicated that the Ba was highly mobile in the xylem ofthe oilseed radish and castor oil plants. From the total Batransfer values, at least 50% of the Ba shoot concentration
Filter cakePeat
0 30 60 90
Rate of OM (Mg ha−1)
30
20
10
0
Flow
er B
a co
nce
ntr
atio
n (
mg
kg−1
)
R2 = 0.32∗
R2 = 0.76∗
y = −0.04x + 22.29
y = −0.08x + 17.9
Figure 2: Effect of increasing concentrations of organic materialson Ba concentration in the flowers of sunflowers (d.w.). Significantat P < 0.05.
was found in the flowers of the sunflowers, and 35% ofthe Ba shoot concentration was found in the pods of theoilseed radish (Table 3). Ba concentrations in flowers withthe addition of sugar cane filter cake and peat were as follows:20.2 and 16.0 mg kg−1, respectively, for oilseed radish; 15.3and 21.0 mg kg−1, respectively, for sunflowers. A high Bamobility has also been observed in cotton and white beets
6 Applied and Environmental Soil Science
during development and flowering, whereas a large amountof Ba accumulation has been reported in the leaves of corn(105.7 mg kg−1) when compared with the grains of corn(1.05 mg kg−1) [6, 33].
The obtained transfer factors (lower than 1) suggestedthat the tested species were inadequate in accumulating orextracting Ba from soil (Table 6). Similarly, low transferfactors have also been reported for castor oil plants, sun-flowers, and mustard plants [30]. Indeed, these authors [30]reported that none of the plants grown in soils containing Baranging from 132.3 to 1,130 mg kg−1 were able to accumulatemeasurable concentrations of Ba, thus, highlighting the lowtransfer of this element from soil to plants [34].
A decreasing trend for Ba transfer to oilseed radish andsunflowers was found when the sugar cane filter cake con-centration increased (Table 6). In addition to improving thephysical and chemical conditions of the soil, organic ligandsare promising in the mitigation of heavy metal contaminatedsoils. Peat and a concentrate containing humic substancesfrom coal favor mustard development in a contaminated soildue to the mitigation of Zn, Cu, Mn, Pb, and B by the organicligands [14].
4. Conclusions
Under the conditions studied the elevated soil pH reacheddue to liming overcame the organic matter addition effectand determined the barium availability and its absorptionby the plant species grown in the area polluted with scrapmetal residue. This is suggested by the absence of phytotoxiceffects on plants, the moderate Ba accumulation in shootscompared to the usual content of Ba in plants, the small effectof organic matter treatments on plants dry matter yields, andfinally the levels of Ba extracted by Mehlich-3.
Acknowledgment
The authors would like to thank Fundacao de Apoio aPesquisa do Estado de Sao Paulo (FAPESP) for the financialsupport with the 2006/60987-0 Research Grant.
References
[1] Cetesb, “Relatorio de Totalizacao de areas contaminadas erea- bilitadas-Dezembro de 2010,” 2011, http://www.cetesb.sp.gov.br/areas-contaminadas/relacoes-de-areas-contaminadas/15-publicacoes.
[2] J. A. Ippolito and K. A. Barbarick, “Biosolids affect soil bariumin a dryland wheat agroecosystem,” Journal of EnvironmentalQuality, vol. 35, no. 6, pp. 2333–2341, 2006.
[3] L. C. S. Merlino, W. Melo, F. G. Macedo et al., “Barium, cad-mium, chromium and lead in maize plants and in an oxisolafter eleven years of sewage sludge applications,” Revista Bras-ileira de Ciencia do Solo, vol. 34, pp. 2031–2039, 2010.
[4] E. Simon, M. Braun, A. Vidic, D. Bogyo, I. Fabian, and B. Toth-neresz, “Air pollution assessment ion elemental concentrationof leaves tissue and foliage dust along an urbanization gradientin Vienna,” Environmental Pollution, vol. 159, pp. 1229–1233,2011.
[5] E. Nogaj, J. Kwapulinski, and H. Misiolek, “Pharyngeal Tonsilas new biomarker of pollution on example of barium,” PolishJournal of Environmental Studies, vol. 20, pp. 161–172, 2011.
[6] T. A. R. Nogueira, W. J. deMelo, I. M. Fonseca, M. O. Marques,and Z. He, “Barium uptake by maize plants as affected bysewage sludge in a long-term field study,” Journal of HazardousMaterials, vol. 181, no. 1-3, pp. 1148–1157, 2010.
[7] M. Llugany, C. Poschenrieder, and J. Barcelo, “Assessment ofbarium toxicity in bush beans,” Archives of Environmental Con-tamination and Toxicology, vol. 39, no. 4, pp. 440–444, 2000.
[8] R. Suwa, K. Jayachandran, N. T. Nguyen, A. Boulenouar, K.Fujita, and H. Saneoka, “Barium toxicity effects in soybeanplants,” Archives of Environmental Contamination and Toxicol-ogy, vol. 55, no. 3, pp. 397–403, 2008.
[9] C. A. Menzie, B. Southworth, G. Stephenson, and N.Feisthauer, “The importance of understanding the chemicalform of a metal in the environment: the case of barium sulfate(barite),” Human and Ecological Risk Assessment, vol. 14, no. 5,pp. 974–991, 2008.
[10] F. Baldi, M. Pepi, D. Burrini, G. Kniewald, D. Scali, and E.Lanciotti, “Dissolution of barium from barite in sewage sludg-es and cultures of Desulfovibrio desulfuricans,” Applied andEnvironmental Microbiology, vol. 62, no. 7, pp. 2398–2404,1996.
[11] A. A. Carbonell, R. Pulido, R. D. DeLaune, and W. H. Patrick,“Soluble barium in barite and phosphogypsum amendedMississippi River alluvial sediment,” Journal of EnvironmentalQuality, vol. 28, no. 1, pp. 316–321, 1999.
[12] G. A. Ulrich, G. N. Breit, I. M. Cozzarelli, and J. M. Suflita,“Sources of sulfate supporting anaerobic metabolism in a con-taminated aquifer,” Environmental Science and Technology, vol.37, no. 6, pp. 1093–1099, 2003.
[13] C. M. Davidson, M. D. Gibson, E. Hamilton, B. H. Mac-Gillivray, J. Reglinski, and E. Rezabal, “The long-term envi-ronmental behaviour of strontium and barium released fromformer mine workings in the granites of the Sunart region ofScotland, UK,” Chemosphere, vol. 58, no. 6, pp. 793–798, 2005.
[14] G. C. G. Dos Santos and A. A. Rodella, “Effect of sources oforganic matter in the alleviation of the toxic effects of B, Zn,Cu, Mn and Pb to Brassica Juncea,” Revista Brasileira de Cien-cia do Solo, vol. 31, no. 4, pp. 793–804, 2007.
[15] J. C. Correa, L. T. Bull, W. D. S. Paganini, and I. A.Guerrini, “Heavy metal exchangeable in an Oxisol with surfaceapplication of flue dust, aqueous lime, sewage sludge and lime-stone,” Pesquisa Agropecuaria Brasileira, vol. 43, no. 3, pp. 411–419, 2008.
[16] E. E. C. de Melo, C. W. A. do Nascimento, A. C. Q. Santos,and A. S. da Silva, “Availability and fractionation of Cd, Pb,Cu, and Zn in soil as a function of incubation time and pH,”Ciencia e Agrotecnologia, vol. 32, no. 3, pp. 776–784, 2008.
[17] O. C. Bataglia, A. M. C. Furlani, J. P. F. Teixeira, and J. R. Gallo,Metodos de Analise Quımica de Plantas, Boletim Tecnico, 78,Instituto Agronomico, Campinas, Brazil, 1983.
[18] United States Environmental Protection Agency, “Method3051: microwave assisted acid digestion of sediments, sludges,soil and soils,” 2009, http://www.epa.gov/epaoswer/hazwaste/test/3 series.htm.
[19] Empresa Brasileira de Pesquisa Agropecuaria, Brazilian Systemof Soil Classification, vol. 306, Embrapa-Centro Nacional dePesquisa de Solos, Rio de Janeiro, Brazil, 2nd edition, 2006.
[20] B. van Raij, J. C. Andrade, H. Cantarella, and J. A. Quaggio,Analise Quımica Para Avaliacao da Fertilidade de Solos Tropi-cais, Instituto Agronomico, Campinas, Brazil, 2001.
Applied and Environmental Soil Science 7
[21] C. De Freitas Zeitouni, R. S. Berton, and C. A. De Abreu,“Phytoextraction of cadmium and zinc from an oxisol conta-minated with heavy metals,” Bragantia, vol. 66, no. 4, pp. 649–657, 2007.
[22] A. M. M. Pires, C. A. Abreu, A. R. Coscione, V. A. Silva, andN. P. Ramos, “Initial growth of sunflower in soils with highconcentrations of boron and heavy metals,” in Proceedings ofthe 17th International Sunflower Conference, vol. 2, pp. 315–318, Cordoba, Spain, 2008.
[23] G. C. G. dos Santos, A. A. Rodella, C. A. de Abreu, and A.R. Coscione, “Vegetable species for phytoextraction of boron,copper, lead, manganese and zinc from contaminated soil,”Scientia Agricola, vol. 67, no. 6, pp. 713–719, 2010.
[24] R. A. B. Jorge, C. A. de Abreu, C. A. de Andrade, and O. A. deCamargo, “Filter cake and peat as amendments of contami-nated soil with residue of scrap rich in boron,” Bragantia, vol.69, no. 2, pp. 467–476, 2010.
[25] A. Mehlich, “Mehlich 3 soil test extractant: a modificationof Mehlich 2 extractant,” Communications in Soil Science andPlant Analysis, vol. 15, no. 12, pp. 1409–1416, 1984.
[26] A. D. Abichequer and H. Bohnen, “Efficiency of phosphorusuptake, translocation and utilization in wheat varieties,” Re-vista Brasileira de Ciencia do Solo, vol. 22, pp. 21–26, 1998.
[27] S. Lubben and D. Sauerbeck, “The uptake and distribution ofheavy metals by spring wheat,” Water, Air, and Soil Pollution,vol. 57-58, pp. 239–247, 1991.
[28] Companhia de Tecnologia de Saneamento Ambiental, “Guid-ing values for soils and groundwater in the State of SaoPaulo,” 2011, http://www.cetesb.sp.gov.br/Solo/relatorios/ta-bela valores 2005.pdf.
[29] M. B. Gabos, G. Casagrande, C. A. Abreu, and J. Paz-Ferreiro, “Uso da materia organica como mitigadora de solomulticontaminado e do girassol como fitoextratora,” RevistaBrasileira de Engenharia Agrıcola e Ambiental, vol. 15, no. 12,pp. 1298–1306, 2011.
[30] A. R. Coscione and R. S. Berton, “Barium extraction potentialby mustard, sunflower and castor bean,” Scientia Agricola, vol.66, no. 1, pp. 59–63, 2009.
[31] F. M. Chaudhry, A. Wallace, and R. T. Mueller, “Bariumtoxicity in plants,” Communications in Soil Science and PlantAnalysis, vol. 8, no. 9, pp. 795–797, 1977.
[32] I. Pais and J. R. Jones, The Handbook of Trace Elements, St.Lucie Press, Boca Raton, Fla, USA, 1998.
[33] Z. En, A. Vasidov, V. V. Tsipin, T. Tillaev, and G. I. Jumani-yazova, “Study of element uptake in plants from the soil toassess environmental contamination by toxic elements,” Nu-clear Instruments and Methods in Physics Research A, vol. 505,no. 1-2, pp. 462–465, 2003.
[34] J. Pichtel, K. Kuroiwa, and H. T. Sawyerr, “Distribution ofPb, Cd and Ba in soils and plants of two contaminated sites,”Environmental Pollution, vol. 110, no. 1, pp. 171–178, 2000.
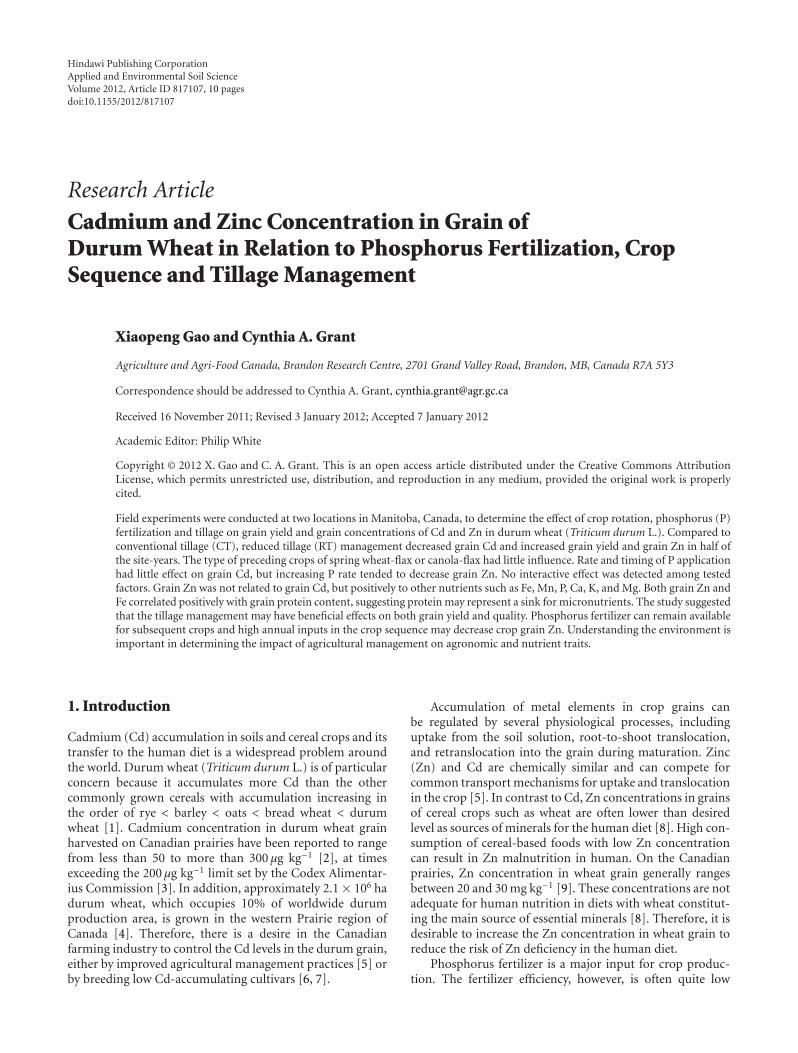
Hindawi Publishing CorporationApplied and Environmental Soil ScienceVolume 2012, Article ID 817107, 10 pagesdoi:10.1155/2012/817107
Research Article
Cadmium and Zinc Concentration in Grain ofDurum Wheat in Relation to Phosphorus Fertilization, CropSequence and Tillage Management
Xiaopeng Gao and Cynthia A. Grant
Agriculture and Agri-Food Canada, Brandon Research Centre, 2701 Grand Valley Road, Brandon, MB, Canada R7A 5Y3
Correspondence should be addressed to Cynthia A. Grant, [email protected]
Received 16 November 2011; Revised 3 January 2012; Accepted 7 January 2012
Academic Editor: Philip White
Copyright © 2012 X. Gao and C. A. Grant. This is an open access article distributed under the Creative Commons AttributionLicense, which permits unrestricted use, distribution, and reproduction in any medium, provided the original work is properlycited.
Field experiments were conducted at two locations in Manitoba, Canada, to determine the effect of crop rotation, phosphorus (P)fertilization and tillage on grain yield and grain concentrations of Cd and Zn in durum wheat (Triticum durum L.). Compared toconventional tillage (CT), reduced tillage (RT) management decreased grain Cd and increased grain yield and grain Zn in half ofthe site-years. The type of preceding crops of spring wheat-flax or canola-flax had little influence. Rate and timing of P applicationhad little effect on grain Cd, but increasing P rate tended to decrease grain Zn. No interactive effect was detected among testedfactors. Grain Zn was not related to grain Cd, but positively to other nutrients such as Fe, Mn, P, Ca, K, and Mg. Both grain Zn andFe correlated positively with grain protein content, suggesting protein may represent a sink for micronutrients. The study suggestedthat the tillage management may have beneficial effects on both grain yield and quality. Phosphorus fertilizer can remain availablefor subsequent crops and high annual inputs in the crop sequence may decrease crop grain Zn. Understanding the environment isimportant in determining the impact of agricultural management on agronomic and nutrient traits.
1. Introduction
Cadmium (Cd) accumulation in soils and cereal crops and itstransfer to the human diet is a widespread problem aroundthe world. Durum wheat (Triticum durum L.) is of particularconcern because it accumulates more Cd than the othercommonly grown cereals with accumulation increasing inthe order of rye < barley < oats < bread wheat < durumwheat [1]. Cadmium concentration in durum wheat grainharvested on Canadian prairies have been reported to rangefrom less than 50 to more than 300 µg kg−1 [2], at timesexceeding the 200 µg kg−1 limit set by the Codex Alimentar-ius Commission [3]. In addition, approximately 2.1 × 10⁶ hadurum wheat, which occupies 10% of worldwide durumproduction area, is grown in the western Prairie region ofCanada [4]. Therefore, there is a desire in the Canadianfarming industry to control the Cd levels in the durum grain,either by improved agricultural management practices [5] orby breeding low Cd-accumulating cultivars [6, 7].
Accumulation of metal elements in crop grains canbe regulated by several physiological processes, includinguptake from the soil solution, root-to-shoot translocation,and retranslocation into the grain during maturation. Zinc(Zn) and Cd are chemically similar and can compete forcommon transport mechanisms for uptake and translocationin the crop [5]. In contrast to Cd, Zn concentrations in grainsof cereal crops such as wheat are often lower than desiredlevel as sources of minerals for the human diet [8]. High con-sumption of cereal-based foods with low Zn concentrationcan result in Zn malnutrition in human. On the Canadianprairies, Zn concentration in wheat grain generally rangesbetween 20 and 30 mg kg−1 [9]. These concentrations are notadequate for human nutrition in diets with wheat constitut-ing the main source of essential minerals [8]. Therefore, it isdesirable to increase the Zn concentration in wheat grain toreduce the risk of Zn deficiency in the human diet.
Phosphorus fertilizer is a major input for crop produc-tion. The fertilizer efficiency, however, is often quite low
2 Applied and Environmental Soil Science
during the season of application because of the low mobilityand rapid immobilization of phosphate after being appliedto the soil. Application of P fertilizer can influence soil Cdavailability and Cd accumulation in crops, either by directaddition of Cd as a contaminant in P fertilizers, or by indirectimpact on soil properties, plant nutrition, and plant growth[5, 10]. For example, application of high-Cd P fertilizersled to increases in soil and plant Cd in many long-termfield studies [11–13]. Phosphorus fertilizer is also frequentlyreported to reduce Zn concentration in crops and potentialmechanisms include interactions between Zn and P in thesoil [14], less translocation of Zn from the roots to theshoots [15], metabolic disorder within plant cells [16], anddilution effect [17]. In a short-term growth chamber study[18], the immediate increase of Cd accumulation in durumwheat following phosphate application was mostly due toincreased Cd uptake and translocation by decreasing Znaccumulation in durum wheat induced by P fertilization,rather than to a direct addition effect. Similar results werealso reported in other studies [19, 20], where using reagent-grade phosphate increased Cd concentration, but decreasedZn concentration of durum wheat. Though these studiesshowed the long-term or short-term effect of P fertilizationon phytoavailability of Cd and Zn in soil-plant system,there is little information available on the effect of theresidual P from P fertilizer that was applied to precedingcrops.
On the Canadian prairies, rotation of wheat with oilseedsor pulse crops is widely adopted and has been reported toincrease grain yield and quality of subsequent crops throughreduced disease incidence, improved water use efficiency, soilphysical and chemical properties, and enhanced soil ecologi-cal environments [21–23]. Several studies have addressed theimpact of crop rotation on Cd concentration in crops. Oliveret al. [24] reported a greater Cd concentration in springwheat grown after lupin than after cereal and proposed theeffect was due to increased Cd availability by rhizosphereacidification and root release of citric acid in lupin. In a 3-year field trial in Manitoba,Canada, seed Cd concentrationin flax was lower when grown after bread wheat (Triticumaestivum L.) than after canola (Brassica napus L.), whichwas attributed to an increase in mycorrhizal colonization orto the lower Cd concentration in the decomposing wheatresidue relative to canola residue [25].
Reduced tillage practices are widely adopted by farmerson the Canadian prairies because of the benefits in con-serving soil moisture, preventing soil erosion and reducingcost of production [26]. Difference in tillage managementmay have an impact on pH and nutrient stratification in thesoil profile or residue decomposition [27], and consequentlyaffect availability of Cd and Zn. The effect of tillage manage-ment on uptake of Cd and Zn in crops has been investigatedin several field studies and the results are inconsistent. Tilleret al. [28] reported a 30% greater Cd concentration in springwheat grain under direct drilling, compared to reducedtillage. Franzluebbers and Hons [29] reported that soil undera no-tillage system contained greater amounts of extractableZn than under a conventional tillage system. In some otherfield studies, however, long-term tillage practices did not
consistently influence Cd concentration in soils and crops[25, 30, 31].
Information on the influence of agricultural manage-ment practices on crop yield and on Cd and Zn concentra-tion and accumulation in crops is important in order to selectmanagement practices that optimize both crop productivityand quality. Although many studies have evaluated theimpact of tillage system, crop sequence and fertilizer prac-tices in the short term, effects of these management practicescan persist and have impacts on subsequent crops. For ex-ample, P fertilizer not used by a crop in the year of pro-duction will remain in the soil and may exert residual effecton the following crop. Effects of tillage may increase overtime as changes in soil organic matter and nutrient stratifi-cation intensify. However, information on the persistence ofmanagement effects on the yield and quality of later crops ina cropping system are limited.
Based on field studies conducted at two locations over afour-year period, yield and concentrations of Cd and Zn offlax were shown to be influenced by tillage system, type ofpreceding crop and P application to the preceding crop [25,32], but information is lacking about whether such effectscan persist to influence subsequent crops. Therefore, toaddress this question, the field study described by Grant et al.[25, 32] was extended for an additional year to determine ifpreceding crop, P fertilization and tillage system would havea continuing effect on the yield and quality of the durumwheat grown in the third year of the cropping sequence.
2. Materials and Methods
2.1. Experimental Treatment and Cultural Practices. Fieldplot experiments were conducted at two different locationsnear Brandon, Manitoba. Both sites were classified as clayloam, Orthic Black Chernozemic soils. Initial characteristicsof the soils are provided in Table 1 [25]. Sampling and de-termination methods for soil characteristics were alsodescribed by Grant et al. [25]. One site (MZTRF) had beenunder reduced tillage (RT) management for 6 years beforethe study was initiated, while the second site (BRC North)had been under conventional tillage (CT) management untilthe establishment of the study. Neither of the soils was indus-trially contaminated and as such both are representative ofsoils commonly used for durum wheat production on theCanadian prairies.
The study was conducted over a 5 yr period from 1999–2003, with 3 yr cropping cycles being conducted at eachof two locations in 1999-2000-2001, 2000-2001-2002, and2001-2002-2003.
In the first phase of the 3 yr cycle, either spring wheat(cv. AC Barrie) or canola (cv. G3295) was seeded under CTor RT, with P fertilizer treatments of 0, 11 and 22 kg P ha−1
as monoammonium phosphate (MAP). In the second phase,each plot where wheat or canola had been grown in the pre-ceding season was divided into two subplots. Flax (cv. ACEmerson) was seeded into each subplot, with P fertilizertreatment of 0 or 11 kg P ha−1. Tillage treatment was kept thesame as the preceding season. For the first and second phases,spring wheat, canola, and flax were harvested at maturity
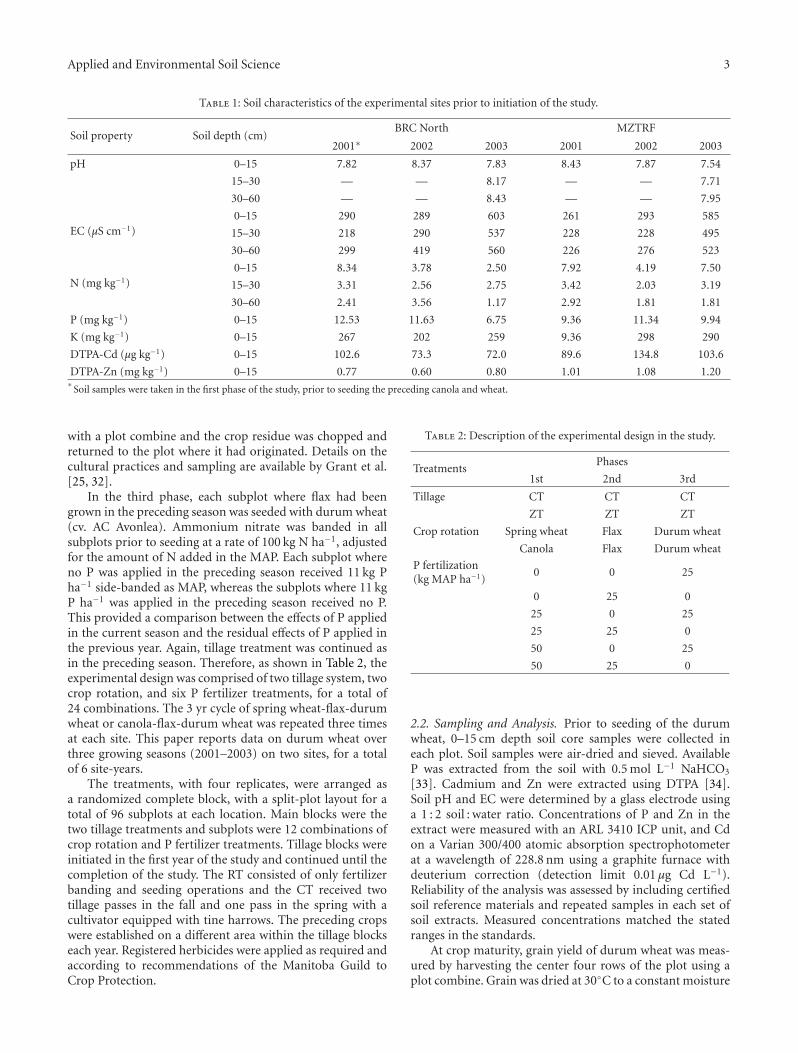
Applied and Environmental Soil Science 3
Table 1: Soil characteristics of the experimental sites prior to initiation of the study.
Soil property Soil depth (cm)BRC North MZTRF
2001∗ 2002 2003 2001 2002 2003
pH 0–15 7.82 8.37 7.83 8.43 7.87 7.54
15–30 — — 8.17 — — 7.71
30–60 — — 8.43 — — 7.95
EC (µS cm−1)0–15 290 289 603 261 293 585
15–30 218 290 537 228 228 495
30–60 299 419 560 226 276 523
N (mg kg−1)0–15 8.34 3.78 2.50 7.92 4.19 7.50
15–30 3.31 2.56 2.75 3.42 2.03 3.19
30–60 2.41 3.56 1.17 2.92 1.81 1.81
P (mg kg−1) 0–15 12.53 11.63 6.75 9.36 11.34 9.94
K (mg kg−1) 0–15 267 202 259 9.36 298 290
DTPA-Cd (µg kg−1) 0–15 102.6 73.3 72.0 89.6 134.8 103.6
DTPA-Zn (mg kg−1) 0–15 0.77 0.60 0.80 1.01 1.08 1.20∗
Soil samples were taken in the first phase of the study, prior to seeding the preceding canola and wheat.
with a plot combine and the crop residue was chopped andreturned to the plot where it had originated. Details on thecultural practices and sampling are available by Grant et al.[25, 32].
In the third phase, each subplot where flax had beengrown in the preceding season was seeded with durum wheat(cv. AC Avonlea). Ammonium nitrate was banded in allsubplots prior to seeding at a rate of 100 kg N ha−1, adjustedfor the amount of N added in the MAP. Each subplot whereno P was applied in the preceding season received 11 kg Pha−1 side-banded as MAP, whereas the subplots where 11 kgP ha−1 was applied in the preceding season received no P.This provided a comparison between the effects of P appliedin the current season and the residual effects of P applied inthe previous year. Again, tillage treatment was continued asin the preceding season. Therefore, as shown in Table 2, theexperimental design was comprised of two tillage system, twocrop rotation, and six P fertilizer treatments, for a total of24 combinations. The 3 yr cycle of spring wheat-flax-durumwheat or canola-flax-durum wheat was repeated three timesat each site. This paper reports data on durum wheat overthree growing seasons (2001–2003) on two sites, for a totalof 6 site-years.
The treatments, with four replicates, were arranged asa randomized complete block, with a split-plot layout for atotal of 96 subplots at each location. Main blocks were thetwo tillage treatments and subplots were 12 combinations ofcrop rotation and P fertilizer treatments. Tillage blocks wereinitiated in the first year of the study and continued until thecompletion of the study. The RT consisted of only fertilizerbanding and seeding operations and the CT received twotillage passes in the fall and one pass in the spring with acultivator equipped with tine harrows. The preceding cropswere established on a different area within the tillage blockseach year. Registered herbicides were applied as required andaccording to recommendations of the Manitoba Guild toCrop Protection.
Table 2: Description of the experimental design in the study.
TreatmentsPhases
1st 2nd 3rd
Tillage CT CT CT
ZT ZT ZT
Crop rotation Spring wheat Flax Durum wheat
Canola Flax Durum wheat
P fertilization(kg MAP ha−1)
0 0 25
0 25 0
25 0 25
25 25 0
50 0 25
50 25 0
2.2. Sampling and Analysis. Prior to seeding of the durumwheat, 0–15 cm depth soil core samples were collected ineach plot. Soil samples were air-dried and sieved. AvailableP was extracted from the soil with 0.5 mol L−1 NaHCO3
[33]. Cadmium and Zn were extracted using DTPA [34].Soil pH and EC were determined by a glass electrode usinga 1 : 2 soil : water ratio. Concentrations of P and Zn in theextract were measured with an ARL 3410 ICP unit, and Cdon a Varian 300/400 atomic absorption spectrophotometerat a wavelength of 228.8 nm using a graphite furnace withdeuterium correction (detection limit 0.01 µg Cd L−1).Reliability of the analysis was assessed by including certifiedsoil reference materials and repeated samples in each set ofsoil extracts. Measured concentrations matched the statedranges in the standards.
At crop maturity, grain yield of durum wheat was meas-ured by harvesting the center four rows of the plot using aplot combine. Grain was dried at 30◦C to a constant moisture
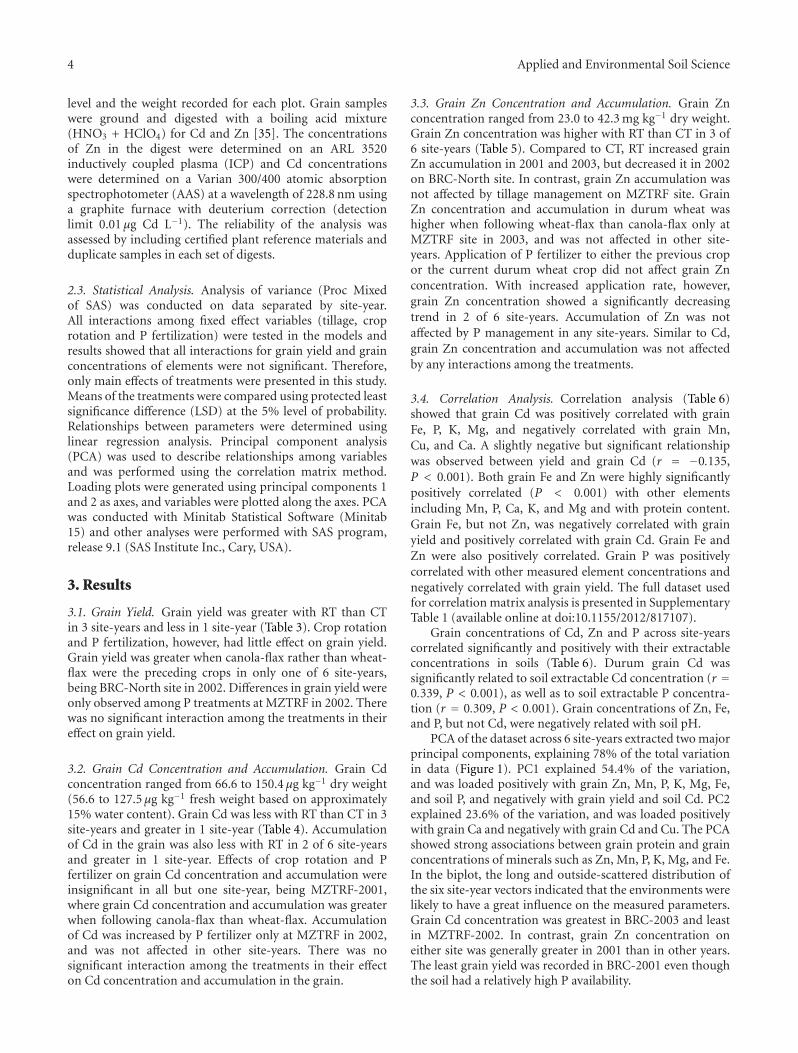
4 Applied and Environmental Soil Science
level and the weight recorded for each plot. Grain sampleswere ground and digested with a boiling acid mixture(HNO3 + HClO4) for Cd and Zn [35]. The concentrationsof Zn in the digest were determined on an ARL 3520inductively coupled plasma (ICP) and Cd concentrationswere determined on a Varian 300/400 atomic absorptionspectrophotometer (AAS) at a wavelength of 228.8 nm usinga graphite furnace with deuterium correction (detectionlimit 0.01 µg Cd L−1). The reliability of the analysis wasassessed by including certified plant reference materials andduplicate samples in each set of digests.
2.3. Statistical Analysis. Analysis of variance (Proc Mixedof SAS) was conducted on data separated by site-year.All interactions among fixed effect variables (tillage, croprotation and P fertilization) were tested in the models andresults showed that all interactions for grain yield and grainconcentrations of elements were not significant. Therefore,only main effects of treatments were presented in this study.Means of the treatments were compared using protected leastsignificance difference (LSD) at the 5% level of probability.Relationships between parameters were determined usinglinear regression analysis. Principal component analysis(PCA) was used to describe relationships among variablesand was performed using the correlation matrix method.Loading plots were generated using principal components 1and 2 as axes, and variables were plotted along the axes. PCAwas conducted with Minitab Statistical Software (Minitab15) and other analyses were performed with SAS program,release 9.1 (SAS Institute Inc., Cary, USA).
3. Results
3.1. Grain Yield. Grain yield was greater with RT than CTin 3 site-years and less in 1 site-year (Table 3). Crop rotationand P fertilization, however, had little effect on grain yield.Grain yield was greater when canola-flax rather than wheat-flax were the preceding crops in only one of 6 site-years,being BRC-North site in 2002. Differences in grain yield wereonly observed among P treatments at MZTRF in 2002. Therewas no significant interaction among the treatments in theireffect on grain yield.
3.2. Grain Cd Concentration and Accumulation. Grain Cdconcentration ranged from 66.6 to 150.4 µg kg−1 dry weight(56.6 to 127.5 µg kg−1 fresh weight based on approximately15% water content). Grain Cd was less with RT than CT in 3site-years and greater in 1 site-year (Table 4). Accumulationof Cd in the grain was also less with RT in 2 of 6 site-yearsand greater in 1 site-year. Effects of crop rotation and Pfertilizer on grain Cd concentration and accumulation wereinsignificant in all but one site-year, being MZTRF-2001,where grain Cd concentration and accumulation was greaterwhen following canola-flax than wheat-flax. Accumulationof Cd was increased by P fertilizer only at MZTRF in 2002,and was not affected in other site-years. There was nosignificant interaction among the treatments in their effecton Cd concentration and accumulation in the grain.
3.3. Grain Zn Concentration and Accumulation. Grain Znconcentration ranged from 23.0 to 42.3 mg kg−1 dry weight.Grain Zn concentration was higher with RT than CT in 3 of6 site-years (Table 5). Compared to CT, RT increased grainZn accumulation in 2001 and 2003, but decreased it in 2002on BRC-North site. In contrast, grain Zn accumulation wasnot affected by tillage management on MZTRF site. GrainZn concentration and accumulation in durum wheat washigher when following wheat-flax than canola-flax only atMZTRF site in 2003, and was not affected in other site-years. Application of P fertilizer to either the previous cropor the current durum wheat crop did not affect grain Znconcentration. With increased application rate, however,grain Zn concentration showed a significantly decreasingtrend in 2 of 6 site-years. Accumulation of Zn was notaffected by P management in any site-years. Similar to Cd,grain Zn concentration and accumulation was not affectedby any interactions among the treatments.
3.4. Correlation Analysis. Correlation analysis (Table 6)showed that grain Cd was positively correlated with grainFe, P, K, Mg, and negatively correlated with grain Mn,Cu, and Ca. A slightly negative but significant relationshipwas observed between yield and grain Cd (r = −0.135,P < 0.001). Both grain Fe and Zn were highly significantlypositively correlated (P < 0.001) with other elementsincluding Mn, P, Ca, K, and Mg and with protein content.Grain Fe, but not Zn, was negatively correlated with grainyield and positively correlated with grain Cd. Grain Fe andZn were also positively correlated. Grain P was positivelycorrelated with other measured element concentrations andnegatively correlated with grain yield. The full dataset usedfor correlation matrix analysis is presented in SupplementaryTable 1 (available online at doi:10.1155/2012/817107).
Grain concentrations of Cd, Zn and P across site-yearscorrelated significantly and positively with their extractableconcentrations in soils (Table 6). Durum grain Cd wassignificantly related to soil extractable Cd concentration (r =0.339, P < 0.001), as well as to soil extractable P concentra-tion (r = 0.309, P < 0.001). Grain concentrations of Zn, Fe,and P, but not Cd, were negatively related with soil pH.
PCA of the dataset across 6 site-years extracted two majorprincipal components, explaining 78% of the total variationin data (Figure 1). PC1 explained 54.4% of the variation,and was loaded positively with grain Zn, Mn, P, K, Mg, Fe,and soil P, and negatively with grain yield and soil Cd. PC2explained 23.6% of the variation, and was loaded positivelywith grain Ca and negatively with grain Cd and Cu. The PCAshowed strong associations between grain protein and grainconcentrations of minerals such as Zn, Mn, P, K, Mg, and Fe.In the biplot, the long and outside-scattered distribution ofthe six site-year vectors indicated that the environments werelikely to have a great influence on the measured parameters.Grain Cd concentration was greatest in BRC-2003 and leastin MZTRF-2002. In contrast, grain Zn concentration oneither site was generally greater in 2001 than in other years.The least grain yield was recorded in BRC-2001 even thoughthe soil had a relatively high P availability.
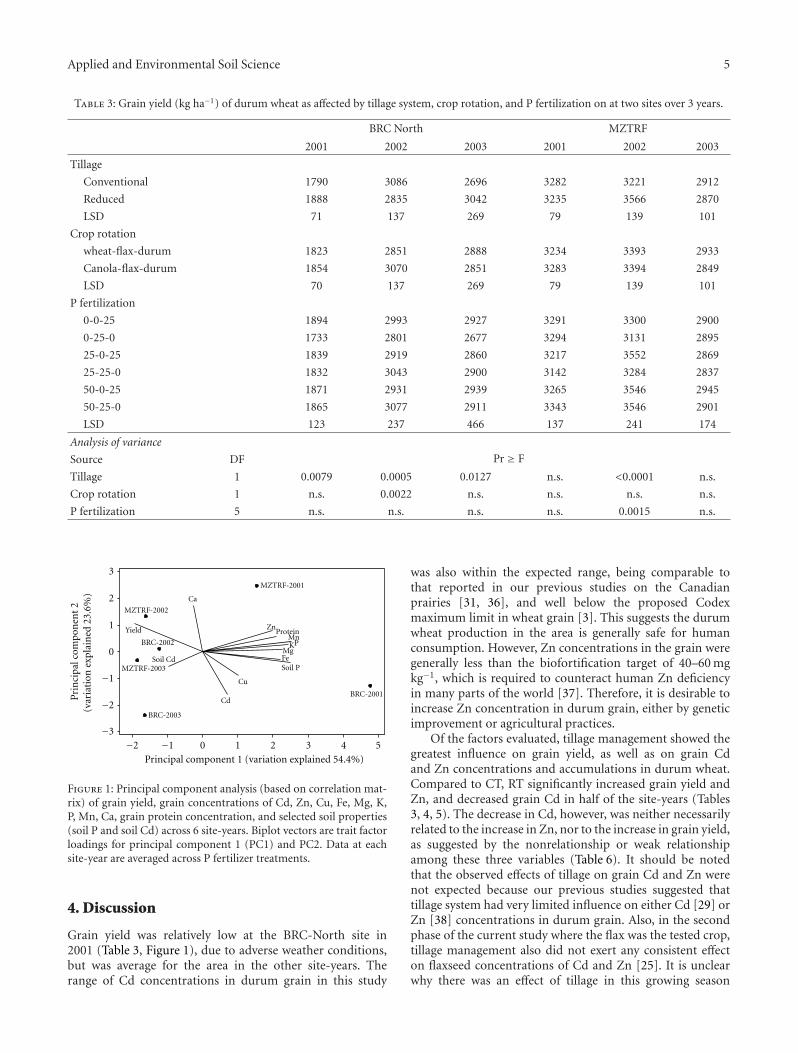
Applied and Environmental Soil Science 5
Table 3: Grain yield (kg ha−1) of durum wheat as affected by tillage system, crop rotation, and P fertilization on at two sites over 3 years.
BRC North MZTRF
2001 2002 2003 2001 2002 2003
Tillage
Conventional 1790 3086 2696 3282 3221 2912
Reduced 1888 2835 3042 3235 3566 2870
LSD 71 137 269 79 139 101
Crop rotation
wheat-flax-durum 1823 2851 2888 3234 3393 2933
Canola-flax-durum 1854 3070 2851 3283 3394 2849
LSD 70 137 269 79 139 101
P fertilization
0-0-25 1894 2993 2927 3291 3300 2900
0-25-0 1733 2801 2677 3294 3131 2895
25-0-25 1839 2919 2860 3217 3552 2869
25-25-0 1832 3043 2900 3142 3284 2837
50-0-25 1871 2931 2939 3265 3546 2945
50-25-0 1865 3077 2911 3343 3546 2901
LSD 123 237 466 137 241 174
Analysis of variance
Source DF Pr ≥ F
Tillage 1 0.0079 0.0005 0.0127 n.s. <0.0001 n.s.
Crop rotation 1 n.s. 0.0022 n.s. n.s. n.s. n.s.
P fertilization 5 n.s. n.s. n.s. n.s. 0.0015 n.s.
Soil CdSoil P
MgK
Ca
Cu
MnP
Fe
Zn
Cd
ProteinYield
Pri
nci
pal c
ompo
nen
t 2
(var
iati
on e
xpla
ined
23.
6%)
BRC-2003
MZTRF-2003
BRC-2002
MZTRF-2002
BRC-2001
MZTRF-2001
Principal component 1 (variation explained 54.4%)
3
2
1
0
−1
−2
−3−2 −1 0 1 2 3 4 5
Figure 1: Principal component analysis (based on correlation mat-rix) of grain yield, grain concentrations of Cd, Zn, Cu, Fe, Mg, K,P, Mn, Ca, grain protein concentration, and selected soil properties(soil P and soil Cd) across 6 site-years. Biplot vectors are trait factorloadings for principal component 1 (PC1) and PC2. Data at eachsite-year are averaged across P fertilizer treatments.
4. Discussion
Grain yield was relatively low at the BRC-North site in2001 (Table 3, Figure 1), due to adverse weather conditions,but was average for the area in the other site-years. Therange of Cd concentrations in durum grain in this study
was also within the expected range, being comparable tothat reported in our previous studies on the Canadianprairies [31, 36], and well below the proposed Codexmaximum limit in wheat grain [3]. This suggests the durumwheat production in the area is generally safe for humanconsumption. However, Zn concentrations in the grain weregenerally less than the biofortification target of 40–60 mgkg−1, which is required to counteract human Zn deficiencyin many parts of the world [37]. Therefore, it is desirable toincrease Zn concentration in durum grain, either by geneticimprovement or agricultural practices.
Of the factors evaluated, tillage management showed thegreatest influence on grain yield, as well as on grain Cdand Zn concentrations and accumulations in durum wheat.Compared to CT, RT significantly increased grain yield andZn, and decreased grain Cd in half of the site-years (Tables3, 4, 5). The decrease in Cd, however, was neither necessarilyrelated to the increase in Zn, nor to the increase in grain yield,as suggested by the nonrelationship or weak relationshipamong these three variables (Table 6). It should be notedthat the observed effects of tillage on grain Cd and Zn werenot expected because our previous studies suggested thattillage system had very limited influence on either Cd [29] orZn [38] concentrations in durum grain. Also, in the secondphase of the current study where the flax was the tested crop,tillage management also did not exert any consistent effecton flaxseed concentrations of Cd and Zn [25]. It is unclearwhy there was an effect of tillage in this growing season
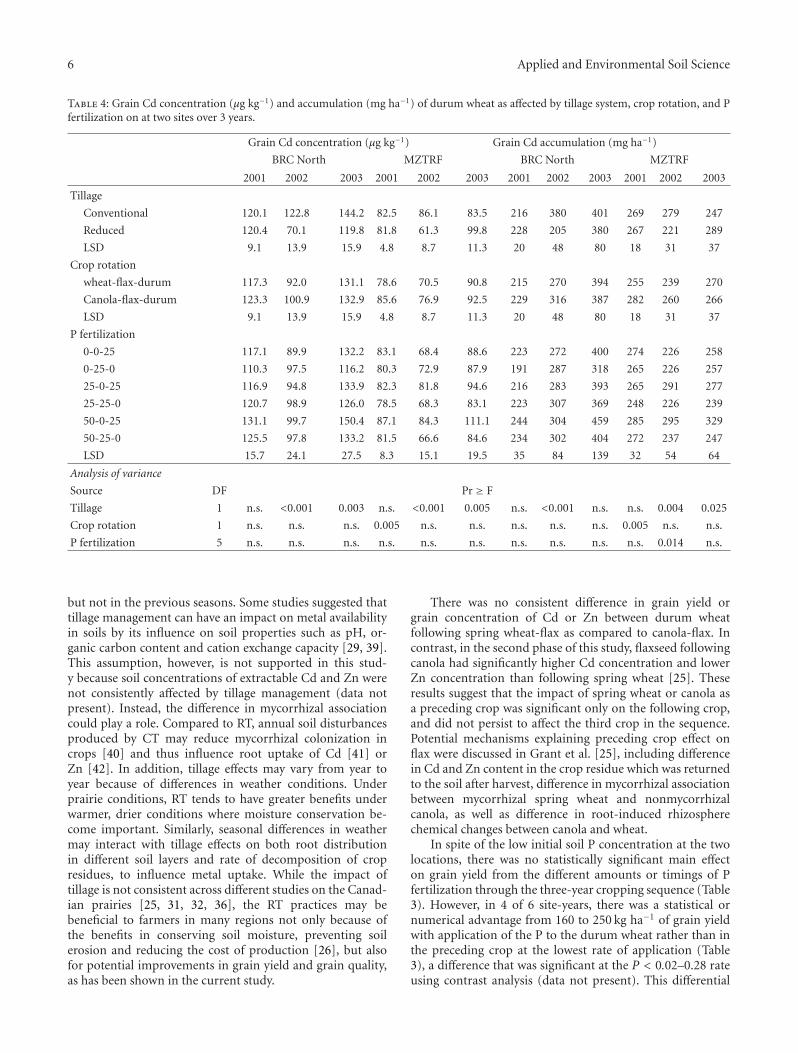
6 Applied and Environmental Soil Science
Table 4: Grain Cd concentration (µg kg−1) and accumulation (mg ha−1) of durum wheat as affected by tillage system, crop rotation, and Pfertilization on at two sites over 3 years.
Grain Cd concentration (µg kg−1) Grain Cd accumulation (mg ha−1)
BRC North MZTRF BRC North MZTRF
2001 2002 2003 2001 2002 2003 2001 2002 2003 2001 2002 2003
Tillage
Conventional 120.1 122.8 144.2 82.5 86.1 83.5 216 380 401 269 279 247
Reduced 120.4 70.1 119.8 81.8 61.3 99.8 228 205 380 267 221 289
LSD 9.1 13.9 15.9 4.8 8.7 11.3 20 48 80 18 31 37
Crop rotation
wheat-flax-durum 117.3 92.0 131.1 78.6 70.5 90.8 215 270 394 255 239 270
Canola-flax-durum 123.3 100.9 132.9 85.6 76.9 92.5 229 316 387 282 260 266
LSD 9.1 13.9 15.9 4.8 8.7 11.3 20 48 80 18 31 37
P fertilization
0-0-25 117.1 89.9 132.2 83.1 68.4 88.6 223 272 400 274 226 258
0-25-0 110.3 97.5 116.2 80.3 72.9 87.9 191 287 318 265 226 257
25-0-25 116.9 94.8 133.9 82.3 81.8 94.6 216 283 393 265 291 277
25-25-0 120.7 98.9 126.0 78.5 68.3 83.1 223 307 369 248 226 239
50-0-25 131.1 99.7 150.4 87.1 84.3 111.1 244 304 459 285 295 329
50-25-0 125.5 97.8 133.2 81.5 66.6 84.6 234 302 404 272 237 247
LSD 15.7 24.1 27.5 8.3 15.1 19.5 35 84 139 32 54 64
Analysis of variance
Source DF Pr ≥ F
Tillage 1 n.s. <0.001 0.003 n.s. <0.001 0.005 n.s. <0.001 n.s. n.s. 0.004 0.025
Crop rotation 1 n.s. n.s. n.s. 0.005 n.s. n.s. n.s. n.s. n.s. 0.005 n.s. n.s.
P fertilization 5 n.s. n.s. n.s. n.s. n.s. n.s. n.s. n.s. n.s. n.s. 0.014 n.s.
but not in the previous seasons. Some studies suggested thattillage management can have an impact on metal availabilityin soils by its influence on soil properties such as pH, or-ganic carbon content and cation exchange capacity [29, 39].This assumption, however, is not supported in this stud-y because soil concentrations of extractable Cd and Zn werenot consistently affected by tillage management (data notpresent). Instead, the difference in mycorrhizal associationcould play a role. Compared to RT, annual soil disturbancesproduced by CT may reduce mycorrhizal colonization incrops [40] and thus influence root uptake of Cd [41] orZn [42]. In addition, tillage effects may vary from year toyear because of differences in weather conditions. Underprairie conditions, RT tends to have greater benefits underwarmer, drier conditions where moisture conservation be-come important. Similarly, seasonal differences in weathermay interact with tillage effects on both root distributionin different soil layers and rate of decomposition of cropresidues, to influence metal uptake. While the impact oftillage is not consistent across different studies on the Canad-ian prairies [25, 31, 32, 36], the RT practices may bebeneficial to farmers in many regions not only because ofthe benefits in conserving soil moisture, preventing soilerosion and reducing the cost of production [26], but alsofor potential improvements in grain yield and grain quality,as has been shown in the current study.
There was no consistent difference in grain yield orgrain concentration of Cd or Zn between durum wheatfollowing spring wheat-flax as compared to canola-flax. Incontrast, in the second phase of this study, flaxseed followingcanola had significantly higher Cd concentration and lowerZn concentration than following spring wheat [25]. Theseresults suggest that the impact of spring wheat or canola asa preceding crop was significant only on the following crop,and did not persist to affect the third crop in the sequence.Potential mechanisms explaining preceding crop effect onflax were discussed in Grant et al. [25], including differencein Cd and Zn content in the crop residue which was returnedto the soil after harvest, difference in mycorrhizal associationbetween mycorrhizal spring wheat and nonmycorrhizalcanola, as well as difference in root-induced rhizospherechemical changes between canola and wheat.
In spite of the low initial soil P concentration at the twolocations, there was no statistically significant main effecton grain yield from the different amounts or timings of Pfertilization through the three-year cropping sequence (Table3). However, in 4 of 6 site-years, there was a statistical ornumerical advantage from 160 to 250 kg ha−1 of grain yieldwith application of the P to the durum wheat rather than inthe preceding crop at the lowest rate of application (Table3), a difference that was significant at the P < 0.02–0.28 rateusing contrast analysis (data not present). This differential
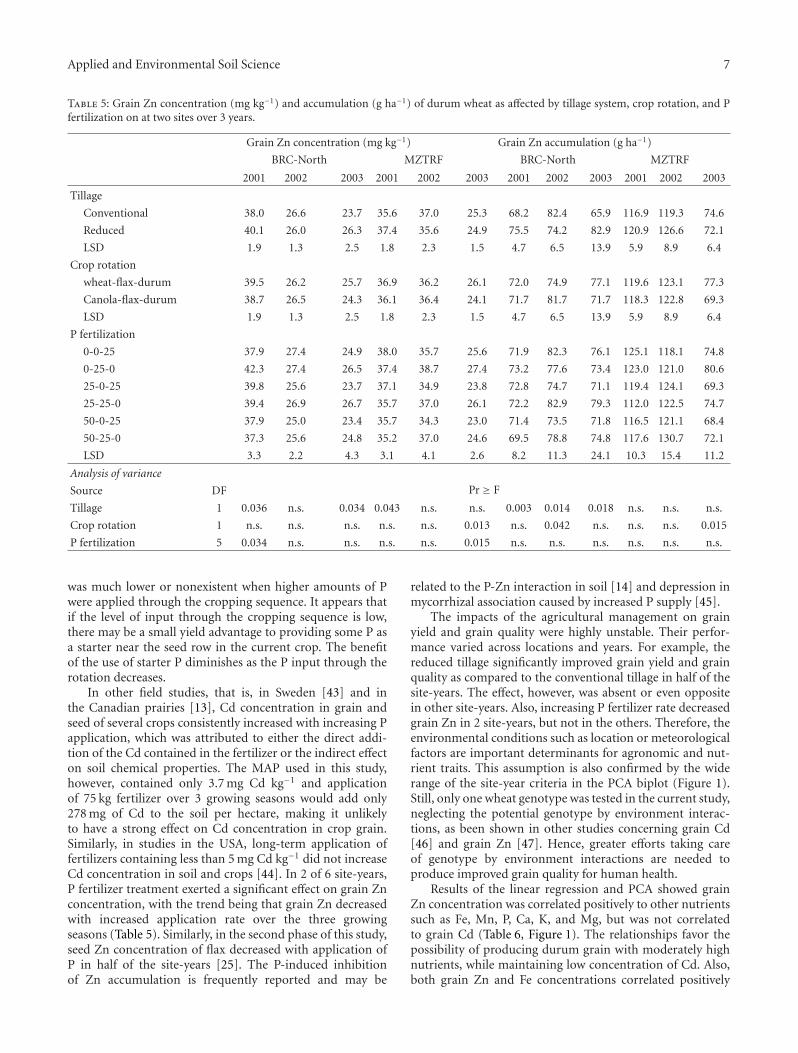
Applied and Environmental Soil Science 7
Table 5: Grain Zn concentration (mg kg−1) and accumulation (g ha−1) of durum wheat as affected by tillage system, crop rotation, and Pfertilization on at two sites over 3 years.
Grain Zn concentration (mg kg−1) Grain Zn accumulation (g ha−1)
BRC-North MZTRF BRC-North MZTRF
2001 2002 2003 2001 2002 2003 2001 2002 2003 2001 2002 2003
Tillage
Conventional 38.0 26.6 23.7 35.6 37.0 25.3 68.2 82.4 65.9 116.9 119.3 74.6
Reduced 40.1 26.0 26.3 37.4 35.6 24.9 75.5 74.2 82.9 120.9 126.6 72.1
LSD 1.9 1.3 2.5 1.8 2.3 1.5 4.7 6.5 13.9 5.9 8.9 6.4
Crop rotation
wheat-flax-durum 39.5 26.2 25.7 36.9 36.2 26.1 72.0 74.9 77.1 119.6 123.1 77.3
Canola-flax-durum 38.7 26.5 24.3 36.1 36.4 24.1 71.7 81.7 71.7 118.3 122.8 69.3
LSD 1.9 1.3 2.5 1.8 2.3 1.5 4.7 6.5 13.9 5.9 8.9 6.4
P fertilization
0-0-25 37.9 27.4 24.9 38.0 35.7 25.6 71.9 82.3 76.1 125.1 118.1 74.8
0-25-0 42.3 27.4 26.5 37.4 38.7 27.4 73.2 77.6 73.4 123.0 121.0 80.6
25-0-25 39.8 25.6 23.7 37.1 34.9 23.8 72.8 74.7 71.1 119.4 124.1 69.3
25-25-0 39.4 26.9 26.7 35.7 37.0 26.1 72.2 82.9 79.3 112.0 122.5 74.7
50-0-25 37.9 25.0 23.4 35.7 34.3 23.0 71.4 73.5 71.8 116.5 121.1 68.4
50-25-0 37.3 25.6 24.8 35.2 37.0 24.6 69.5 78.8 74.8 117.6 130.7 72.1
LSD 3.3 2.2 4.3 3.1 4.1 2.6 8.2 11.3 24.1 10.3 15.4 11.2
Analysis of variance
Source DF Pr ≥ F
Tillage 1 0.036 n.s. 0.034 0.043 n.s. n.s. 0.003 0.014 0.018 n.s. n.s. n.s.
Crop rotation 1 n.s. n.s. n.s. n.s. n.s. 0.013 n.s. 0.042 n.s. n.s. n.s. 0.015
P fertilization 5 0.034 n.s. n.s. n.s. n.s. 0.015 n.s. n.s. n.s. n.s. n.s. n.s.
was much lower or nonexistent when higher amounts of Pwere applied through the cropping sequence. It appears thatif the level of input through the cropping sequence is low,there may be a small yield advantage to providing some P asa starter near the seed row in the current crop. The benefitof the use of starter P diminishes as the P input through therotation decreases.
In other field studies, that is, in Sweden [43] and inthe Canadian prairies [13], Cd concentration in grain andseed of several crops consistently increased with increasing Papplication, which was attributed to either the direct addi-tion of the Cd contained in the fertilizer or the indirect effecton soil chemical properties. The MAP used in this study,however, contained only 3.7 mg Cd kg−1 and applicationof 75 kg fertilizer over 3 growing seasons would add only278 mg of Cd to the soil per hectare, making it unlikelyto have a strong effect on Cd concentration in crop grain.Similarly, in studies in the USA, long-term application offertilizers containing less than 5 mg Cd kg−1 did not increaseCd concentration in soil and crops [44]. In 2 of 6 site-years,P fertilizer treatment exerted a significant effect on grain Znconcentration, with the trend being that grain Zn decreasedwith increased application rate over the three growingseasons (Table 5). Similarly, in the second phase of this study,seed Zn concentration of flax decreased with application ofP in half of the site-years [25]. The P-induced inhibitionof Zn accumulation is frequently reported and may be
related to the P-Zn interaction in soil [14] and depression inmycorrhizal association caused by increased P supply [45].
The impacts of the agricultural management on grainyield and grain quality were highly unstable. Their perfor-mance varied across locations and years. For example, thereduced tillage significantly improved grain yield and grainquality as compared to the conventional tillage in half of thesite-years. The effect, however, was absent or even oppositein other site-years. Also, increasing P fertilizer rate decreasedgrain Zn in 2 site-years, but not in the others. Therefore, theenvironmental conditions such as location or meteorologicalfactors are important determinants for agronomic and nut-rient traits. This assumption is also confirmed by the widerange of the site-year criteria in the PCA biplot (Figure 1).Still, only one wheat genotype was tested in the current study,neglecting the potential genotype by environment interac-tions, as been shown in other studies concerning grain Cd[46] and grain Zn [47]. Hence, greater efforts taking careof genotype by environment interactions are needed toproduce improved grain quality for human health.
Results of the linear regression and PCA showed grainZn concentration was correlated positively to other nutrientssuch as Fe, Mn, P, Ca, K, and Mg, but was not correlatedto grain Cd (Table 6, Figure 1). The relationships favor thepossibility of producing durum grain with moderately highnutrients, while maintaining low concentration of Cd. Also,both grain Zn and Fe concentrations correlated positively
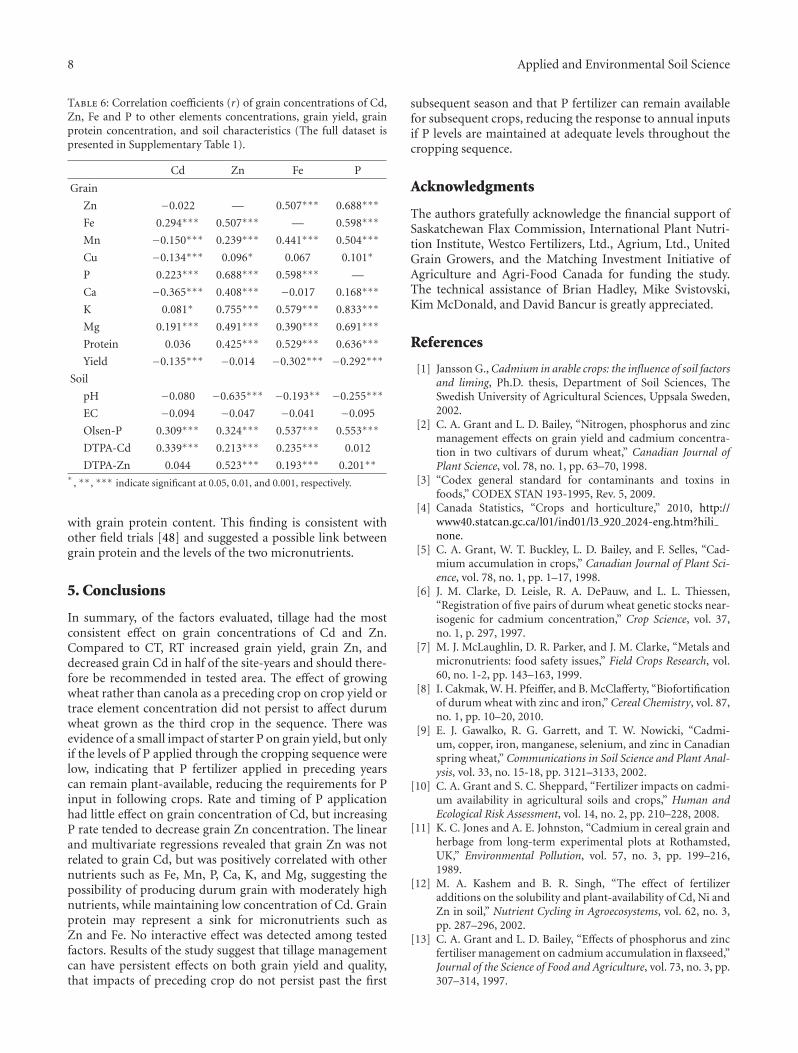
8 Applied and Environmental Soil Science
Table 6: Correlation coefficients (r) of grain concentrations of Cd,Zn, Fe and P to other elements concentrations, grain yield, grainprotein concentration, and soil characteristics (The full dataset ispresented in Supplementary Table 1).
Cd Zn Fe P
Grain
Zn −0.022 — 0.507∗∗∗ 0.688∗∗∗
Fe 0.294∗∗∗ 0.507∗∗∗ — 0.598∗∗∗
Mn −0.150∗∗∗ 0.239∗∗∗ 0.441∗∗∗ 0.504∗∗∗
Cu −0.134∗∗∗ 0.096∗ 0.067 0.101∗
P 0.223∗∗∗ 0.688∗∗∗ 0.598∗∗∗ —
Ca −0.365∗∗∗ 0.408∗∗∗ −0.017 0.168∗∗∗
K 0.081∗ 0.755∗∗∗ 0.579∗∗∗ 0.833∗∗∗
Mg 0.191∗∗∗ 0.491∗∗∗ 0.390∗∗∗ 0.691∗∗∗
Protein 0.036 0.425∗∗∗ 0.529∗∗∗ 0.636∗∗∗
Yield −0.135∗∗∗ −0.014 −0.302∗∗∗ −0.292∗∗∗
Soil
pH −0.080 −0.635∗∗∗ −0.193∗∗ −0.255∗∗∗
EC −0.094 −0.047 −0.041 −0.095
Olsen-P 0.309∗∗∗ 0.324∗∗∗ 0.537∗∗∗ 0.553∗∗∗
DTPA-Cd 0.339∗∗∗ 0.213∗∗∗ 0.235∗∗∗ 0.012
DTPA-Zn 0.044 0.523∗∗∗ 0.193∗∗∗ 0.201∗∗∗
, ∗∗, ∗∗∗ indicate significant at 0.05, 0.01, and 0.001, respectively.
with grain protein content. This finding is consistent withother field trials [48] and suggested a possible link betweengrain protein and the levels of the two micronutrients.
5. Conclusions
In summary, of the factors evaluated, tillage had the mostconsistent effect on grain concentrations of Cd and Zn.Compared to CT, RT increased grain yield, grain Zn, anddecreased grain Cd in half of the site-years and should there-fore be recommended in tested area. The effect of growingwheat rather than canola as a preceding crop on crop yield ortrace element concentration did not persist to affect durumwheat grown as the third crop in the sequence. There wasevidence of a small impact of starter P on grain yield, but onlyif the levels of P applied through the cropping sequence werelow, indicating that P fertilizer applied in preceding yearscan remain plant-available, reducing the requirements for Pinput in following crops. Rate and timing of P applicationhad little effect on grain concentration of Cd, but increasingP rate tended to decrease grain Zn concentration. The linearand multivariate regressions revealed that grain Zn was notrelated to grain Cd, but was positively correlated with othernutrients such as Fe, Mn, P, Ca, K, and Mg, suggesting thepossibility of producing durum grain with moderately highnutrients, while maintaining low concentration of Cd. Grainprotein may represent a sink for micronutrients such asZn and Fe. No interactive effect was detected among testedfactors. Results of the study suggest that tillage managementcan have persistent effects on both grain yield and quality,that impacts of preceding crop do not persist past the first
subsequent season and that P fertilizer can remain availablefor subsequent crops, reducing the response to annual inputsif P levels are maintained at adequate levels throughout thecropping sequence.
Acknowledgments
The authors gratefully acknowledge the financial support ofSaskatchewan Flax Commission, International Plant Nutri-tion Institute, Westco Fertilizers, Ltd., Agrium, Ltd., UnitedGrain Growers, and the Matching Investment Initiative ofAgriculture and Agri-Food Canada for funding the study.The technical assistance of Brian Hadley, Mike Svistovski,Kim McDonald, and David Bancur is greatly appreciated.
References
[1] Jansson G., Cadmium in arable crops: the influence of soil factorsand liming, Ph.D. thesis, Department of Soil Sciences, TheSwedish University of Agricultural Sciences, Uppsala Sweden,2002.
[2] C. A. Grant and L. D. Bailey, “Nitrogen, phosphorus and zincmanagement effects on grain yield and cadmium concentra-tion in two cultivars of durum wheat,” Canadian Journal ofPlant Science, vol. 78, no. 1, pp. 63–70, 1998.
[3] “Codex general standard for contaminants and toxins infoods,” CODEX STAN 193-1995, Rev. 5, 2009.
[4] Canada Statistics, “Crops and horticulture,” 2010, http://www40.statcan.gc.ca/l01/ind01/l3 920 2024-eng.htm?hilinone.
[5] C. A. Grant, W. T. Buckley, L. D. Bailey, and F. Selles, “Cad-mium accumulation in crops,” Canadian Journal of Plant Sci-ence, vol. 78, no. 1, pp. 1–17, 1998.
[6] J. M. Clarke, D. Leisle, R. A. DePauw, and L. L. Thiessen,“Registration of five pairs of durum wheat genetic stocks near-isogenic for cadmium concentration,” Crop Science, vol. 37,no. 1, p. 297, 1997.
[7] M. J. McLaughlin, D. R. Parker, and J. M. Clarke, “Metals andmicronutrients: food safety issues,” Field Crops Research, vol.60, no. 1-2, pp. 143–163, 1999.
[8] I. Cakmak, W. H. Pfeiffer, and B. McClafferty, “Biofortificationof durum wheat with zinc and iron,” Cereal Chemistry, vol. 87,no. 1, pp. 10–20, 2010.
[9] E. J. Gawalko, R. G. Garrett, and T. W. Nowicki, “Cadmi-um, copper, iron, manganese, selenium, and zinc in Canadianspring wheat,” Communications in Soil Science and Plant Anal-ysis, vol. 33, no. 15-18, pp. 3121–3133, 2002.
[10] C. A. Grant and S. C. Sheppard, “Fertilizer impacts on cadmi-um availability in agricultural soils and crops,” Human andEcological Risk Assessment, vol. 14, no. 2, pp. 210–228, 2008.
[11] K. C. Jones and A. E. Johnston, “Cadmium in cereal grain andherbage from long-term experimental plots at Rothamsted,UK,” Environmental Pollution, vol. 57, no. 3, pp. 199–216,1989.
[12] M. A. Kashem and B. R. Singh, “The effect of fertilizeradditions on the solubility and plant-availability of Cd, Ni andZn in soil,” Nutrient Cycling in Agroecosystems, vol. 62, no. 3,pp. 287–296, 2002.
[13] C. A. Grant and L. D. Bailey, “Effects of phosphorus and zincfertiliser management on cadmium accumulation in flaxseed,”Journal of the Science of Food and Agriculture, vol. 73, no. 3, pp.307–314, 1997.
Applied and Environmental Soil Science 9
[14] J. O. Agbenin, “Phosphate-induced zinc retention in a tropicalsemi-arid soil,” European Journal of Soil Science, vol. 49, no. 4,pp. 693–700, 1998.
[15] T. S. Verma and R. S. Minhas, “Zinc and phosphorus inter-action in a wheat-maize cropping system,” Fertilizer Research,vol. 13, no. 1, pp. 77–86, 1987.
[16] M. Haldar and L. N. Mandal, “Effect of phosphorus and zincon the growth and phosphorus, zinc, copper, iron and man-ganese nutrition of rice,” Plant and Soil, vol. 59, no. 3, pp. 415–425, 1981.
[17] S. R. Olsen, “Micronutrient interaction,” in Micronutrients inAgriculture, J. J. Mortvedt, P. M. Giordano, and W. L. Lindsay,Eds., pp. 243–264, Soil Science Society of America, Wis, USA,1972.
[18] X. Gao, D. N. Flaten, M. Tenuta, M. G. Grimmett, E. J.Gawalko, and C. A. Grant, “Soil solution dynamics and plantuptake of cadmium and zinc by durum wheat following phos-phate fertilization,” Plant and Soil, vol. 338, no. 1, pp. 423–434,2011.
[19] M. Choudhary, L. D. Bailey, and C. A. Grant, “Effect of zinc oncadmium concentration in the tissue of durum wheat,” Ca-nadian Journal of Plant Science, vol. 74, no. 3, pp. 549–552,1994.
[20] Y. Jiao, C. A. Grant, and L. D. Bailey, “Effects of phosphorusand zinc fertilizer on cadmium uptake and distribution in flaxand durum wheat,” Journal of the Science of Food and Agricul-ture, vol. 84, no. 8, pp. 777–785, 2004.
[21] P. R. Miller, Y. Gan, B. G. McConkey, and C. L. McDonald,“Pulse crops for the northern Great Plains: I. Grain productiv-ity and residual effects on soil water and nitrogen,” AgronomyJournal, vol. 95, no. 4, pp. 972–979, 2003.
[22] C. A. Campbell, R. P. Zentner, F. Selles et al., “Quantifyingshort-term effects of crop rotations on soil organic carbon insouthwestern Saskatchewan,” Canadian Journal of Soil Science,vol. 80, no. 1, pp. 193–202, 2000.
[23] C. Hamel, K. Hanson, F. Selles et al., “Seasonal and long-termresource-related variations in soil microbial communities inwheat-based rotations of the Canadian prairie,” Soil Biologyand Biochemistry, vol. 38, no. 8, pp. 2104–2116, 2006.
[24] D. P. Oliver, J. E. Schultz, K. G. Tiller, and R. H. Merry, “Theeffect of crop rotation and tillage practices on cadmium con-centration in wheat grain,” Australian Journal of AgriculturalResearch, vol. 44, no. 6, pp. 1221–1234, 1993.
[25] C. A. Grant, M. A. Monreal, R. B. Irvine, R. M. Mohr, D.L. McLaren, and M. Khakbazan, “Preceding crop and phos-phorus fertilization affect cadmium and zinc concentration offlaxseed under conventional and reduced tillage,” Plant andSoil, vol. 333, no. 1, pp. 337–350, 2010.
[26] R. P. Zentner, G. P. Lafond, D. A. Derksen, and C. A. Campbell,“Tillage method and crop diversification: effect on economicreturns and riskiness of cropping systems in a thin black cher-nozem of the Canadian prairies,” Soil and Tillage Research, vol.67, no. 1, pp. 9–21, 2002.
[27] C. A. Grant and L. D. Bailey, “The effect of tillage and KCladdition on pH, conductance, NO3-N, P, K and Cl distributionin the soil profile,” Canadian Journal of Soil Science, vol. 74, no.3, pp. 307–314, 1994.
[28] K. G. Tiller, D. P. Oliver, M. J. McLaughlin et al., “Managingcadmium contamination of agricultural land,” in Remediationof Soils Contaminated by Metals, I. K. Iskandar, Ed., pp. 225–255, Science and Technology Letters, Northwood, UK, 1997.
[29] A. J. Franzluebbers and F. M. Hons, “Soil-profile distributionof primary and secondary plant-available nutrients under con-
ventional and no tillage,” Soil and Tillage Research, vol. 39, no.3-4, pp. 229–239, 1996.
[30] L. M. Shuman and D. V. McCracken, “Tillage, lime, andpoultry litter effects on soil zinc, manganese, and copper,”Communications in Soil Science and Plant Analysis, vol. 30, no.9-10, pp. 1267–1277, 1999.
[31] X. Gao, F. Akhter, M. Tenuta, D. N. Flaten, E. J. Gawalko, andC. A. Grant, “Mycorrhizal colonization and grain Cd concen-tration of field-grown durum wheat in response to tillage,preceding crop and phosphorus fertilization,” Journal of theScience of Food and Agriculture, vol. 90, no. 5, pp. 750–758,2010.
[32] C. A. Grant, M. A. Monreal, R. B. Irvine, R. M. Mohr, D. L.Mclaren, and M. Khakbazan, “Crop response to current andprevious season applications of phosphorus as affected by cropsequence and tillage,” Canadian Journal of Plant Science, vol.89, no. 1, pp. 49–66, 2009.
[33] S. R. Olsen, C. V. Cole, F. S. Watanabe, and L. A. Dean,“Estimation of available phosphorus in soils by extraction withsodium bicarbonate,” Circular number 939, USDA, 1954.
[34] W. L. Lindsay and W. A. Norvell, “Development of a DTPA soiltest for zinc, iron, manganese, and copper,” Soil Science Societyof America Journal, vol. 42, no. 4, pp. 421–428, 1978.
[35] R. L. Westerman, Soil Testing and Plant Analysis, Soil ScienceSociety of America, Madison, Wis, USA, 1990.
[36] X. Gao, K. R. Brown, G. J. Racz, and C. A. Grant, “Concentra-tion of cadmium in durum wheat as affected by time, sourceand placement of nitrogen fertilization under reduced andconventional-tillage management,” Plant and Soil, vol. 337, no.1, pp. 341–354, 2010.
[37] R. D. Graham, R. M. Welch, D. A. Saunders et al., “Nutritioussubsistence food systems,” Advances in Agronomy, vol. 92, pp.1–74, 2007.
[38] X. Gao and C. A. Grant, “Interactive effect of N fertilizationand tillage management on Zn biofortification in durumwheat (Triticum durum),” Canadian Journal of Plant Science,vol. 91, no. 6, pp. 951–960, 2011.
[39] K. R. J. Smettem, A. D. Rovira, S. A. Wace, B. R. Wilson, andA. Simon, “Effect of tillage and crop rotation on the surfacestability and chemical properties of a red-brown earth (Alfisol)under wheat,” Soil and Tillage Research, vol. 22, no. 1-2, pp.27–40, 1992.
[40] C. G. Castillo, R. Rubio, J. L. Rouanet, and F. Borie, “Earlyeffects of tillage and crop rotation on arbuscular mycorrhizalfungal propagules in an Ultisol,” Biology and Fertility of Soils,vol. 43, no. 1, pp. 83–92, 2006.
[41] X. Gao, M. Tenuta, D. N. Flaten, and C. A. Grant, “Cadmiumconcentration in flax colonized by mycorrhizal fungi dependson soil phosphorus and cadmium concentrations,” Communi-cations in Soil Science and Plant Analysis, vol. 42, no. 15, pp.1882–1897, 2011.
[42] M. H. Ryan, J. K. McInerney, I. R. Record, and J. F. Angus,“Zinc bioavailability in wheat grain in relation to phosphorusfertiliser, crop sequence and mycorrhizal fungi,” Journal of theScience of Food and Agriculture, vol. 88, no. 7, pp. 1208–1216,2008.
[43] A. Andersson and G. Simon, “Levels of Cd and some othertrace elements in soils and crops as influenced by lime andfertilizer level,” Acta Agriculturae Scandinavica, vol. 4l, pp. 3–11, 1991.
[44] J. J. Mortvedt, “Cadmium levels in soils and plants from somelong-term soil fertility experiments in the United States ofAmerica,” Journal of Environmental Quality, vol. 16, no. 2, pp.137–142, 1987.
10 Applied and Environmental Soil Science
[45] M. A. Monreal, C. A. Grant, R. B. Irvine, R. M. Mohr, D. L.McLaren, and M. Khakbazan, “Crop management effect onarbuscular mycorrhizae and root growth of flax,” CanadianJournal of Plant Science, vol. 91, no. 2, pp. 315–324, 2011.
[46] X. Gao, R. M. Mohr, D. L. McLaren, and C. A. Grant,“Grain cadmium and zinc concentrations in wheat as affectedby genotypic variation and potassium chloride fertilization,”Field Crops Research, vol. 122, no. 2, pp. 95–103, 2011.
[47] A. K. Joshi, J. Crossa, B. Arun et al., “Genotype× environmentinteraction for zinc and iron concentration of wheat grain ineastern Gangetic plains of India,” Field Crops Research, vol.116, no. 3, pp. 268–277, 2010.
[48] F. J. Zhao, Y. H. Su, S. J. Dunham et al., “Variation in mineralmicronutrient concentrations in grain of wheat lines of diverseorigin,” Journal of Cereal Science, vol. 49, no. 2, pp. 290–295,2009.
Hindawi Publishing CorporationApplied and Environmental Soil ScienceVolume 2012, Article ID 769357, 10 pagesdoi:10.1155/2012/769357
Research Article
Oilseed Meal Effects on the Emergence and Survival ofCrop and Weed Species
Katie L. Rothlisberger, Frank M. Hons, Terry J. Gentry, and Scott A. Senseman
Department of Soil and Crop Sciences, Texas A&M University, 370 Olsen Boulevard, 2474 TAMU, College Station,TX 77843-2474, USA
Correspondence should be addressed to Katie L. Rothlisberger, [email protected]
Received 28 October 2011; Revised 20 December 2011; Accepted 23 December 2011
Academic Editor: Philip White
Copyright © 2012 Katie L. Rothlisberger et al. This is an open access article distributed under the Creative Commons AttributionLicense, which permits unrestricted use, distribution, and reproduction in any medium, provided the original work is properlycited.
Oilseed crops are being widely evaluated for potential biodiesel production. Seed meal (SM) remaining after extracting oil mayhave use as bioherbicides or organic fertilizers. Brassicaceae SM often contains glucosinolates that hydrolyze into biologically activecompounds that may inhibit various pests. Jatropha curcas SM contains curcin, a phytoxin. A 14-day greenhouse study determinedthat Sinapis alba (white mustard), Brassica juncea (Indian mustard), Camelina sativa, and Jatropha curcas applied to soil at varyingapplication rates [0, 0.5, 1.0, and 2.5% (w/w)] and incubation times (1, 7, and 14 d) prior to planting affected seed emergenceand seedling survival of cotton [Gossypium hirsutum (L.)], sorghum [Sorghum bicolor (L.) Moench], johnsongrass (Sorghumhalepense), and redroot pigweed (Amaranthus retroflexus). With each species, emergence and survival was most decreased by2.5% SM application applied at 1 and 7 d incubations. White mustard SM incubated for 1 d applied at low and high rates hadsimilar negative effects on johnsongrass seedlings. Redroot pigweed seedling survival was generally most decreased by all 2.5% SMapplications. Based on significant effects determined by ANOVA, results suggested that the type, rate, and timing of SM applicationshould be considered before land-applying SMs in cropping systems.
1. Introduction
Research involving oilseed crops for biodiesel production hasincreased due to greater needs for renewable energy sources.Biodiesel is an EPA-approved renewable fuel that can beproduced from oilseed crops. The oil extracted from seedis chemically reacted with an alcohol, such as methanol,to form chemical compounds known as fatty acid methylesters, or “biodiesel.” The oil contained in the seed is mostoften extracted mechanically using a screw press. The residueremaining after oil extraction is referred to as either a presscake or seed meal (SM). In order for biodiesel production tobe economically and environmentally sustainable, a feasibleand profitable means of byproduct or SM disposal and/orusage needs to be developed. Utilization of SM in organicagricultural production systems offers a possible solution.
Oilseeds have the potential to produce significant energyand renewable fuels and include such oilseeds as soybean[Glycine max (L.) Merr.], canola and rapeseed (Brassica
napus), Indian mustard (Brassica juncea), white mustard(Sinapis alba), physic nut or jatropha (Jatropha curcas),camelina (Camelina sativa), and castor bean (Ricinus com-munis). Brassicaceae oilseeds have been reported to contain30 to 40% oil by weight [1], while jatropha seed contains asimilar range of 30 to 37% [2]. Recent interest in jatropha isdue primarily to its purported ability to grow on marginallands. Therefore, its cultivation would be less likely todisplace food-producing crops [3], but it is limited to sub-tropical and tropical environments. Jatropha and generallyall oilseeds are rich in protein, containing a good balance ofamino acids. The SM of jatropha reportedly contains morenutrients than either chicken or cattle manure [4].
Many oilseed meals, such as from soybean, have beenused as additives in animal feed because of their highnutrient content, but certain plants within the Brassicaceaefamily cannot be used in the same manner because oftheir biocidal properties. Upon enzymatic hydration bymyrosinase, a number of allelochemicals are produced in
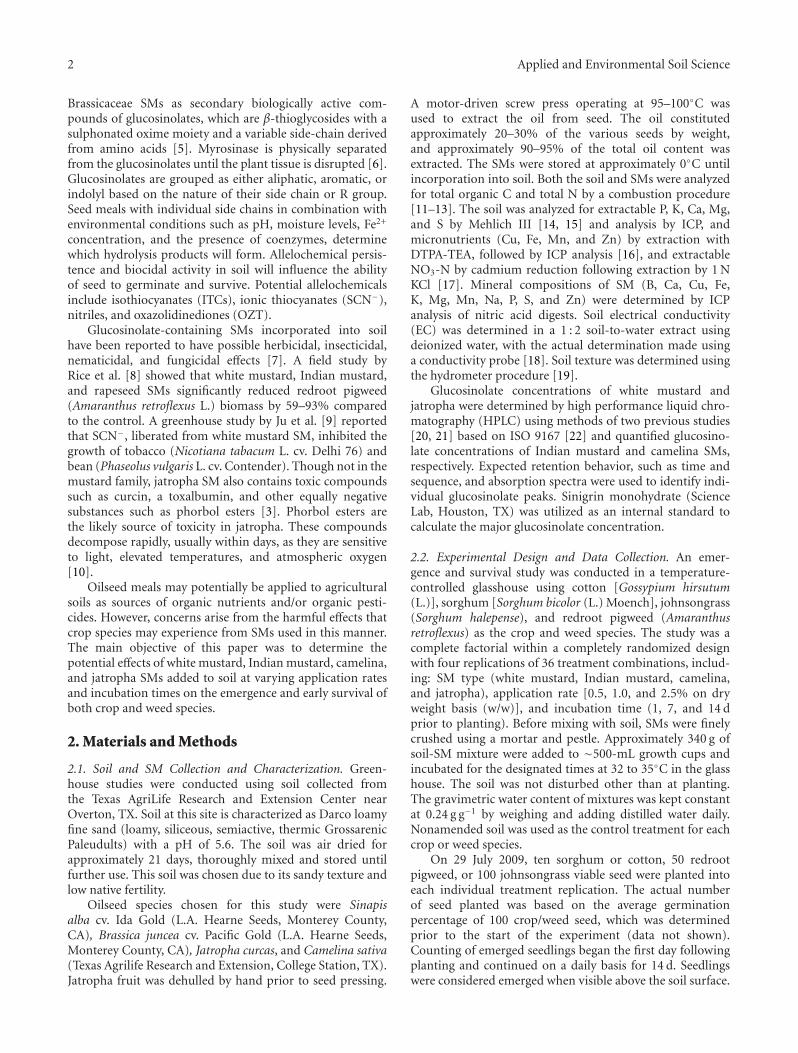
2 Applied and Environmental Soil Science
Brassicaceae SMs as secondary biologically active com-pounds of glucosinolates, which are β-thioglycosides with asulphonated oxime moiety and a variable side-chain derivedfrom amino acids [5]. Myrosinase is physically separatedfrom the glucosinolates until the plant tissue is disrupted [6].Glucosinolates are grouped as either aliphatic, aromatic, orindolyl based on the nature of their side chain or R group.Seed meals with individual side chains in combination withenvironmental conditions such as pH, moisture levels, Fe2+
concentration, and the presence of coenzymes, determinewhich hydrolysis products will form. Allelochemical persis-tence and biocidal activity in soil will influence the abilityof seed to germinate and survive. Potential allelochemicalsinclude isothiocyanates (ITCs), ionic thiocyanates (SCN−),nitriles, and oxazolidinediones (OZT).
Glucosinolate-containing SMs incorporated into soilhave been reported to have possible herbicidal, insecticidal,nematicidal, and fungicidal effects [7]. A field study byRice et al. [8] showed that white mustard, Indian mustard,and rapeseed SMs significantly reduced redroot pigweed(Amaranthus retroflexus L.) biomass by 59–93% comparedto the control. A greenhouse study by Ju et al. [9] reportedthat SCN−, liberated from white mustard SM, inhibited thegrowth of tobacco (Nicotiana tabacum L. cv. Delhi 76) andbean (Phaseolus vulgaris L. cv. Contender). Though not in themustard family, jatropha SM also contains toxic compoundssuch as curcin, a toxalbumin, and other equally negativesubstances such as phorbol esters [3]. Phorbol esters arethe likely source of toxicity in jatropha. These compoundsdecompose rapidly, usually within days, as they are sensitiveto light, elevated temperatures, and atmospheric oxygen[10].
Oilseed meals may potentially be applied to agriculturalsoils as sources of organic nutrients and/or organic pesti-cides. However, concerns arise from the harmful effects thatcrop species may experience from SMs used in this manner.The main objective of this paper was to determine thepotential effects of white mustard, Indian mustard, camelina,and jatropha SMs added to soil at varying application ratesand incubation times on the emergence and early survival ofboth crop and weed species.
2. Materials and Methods
2.1. Soil and SM Collection and Characterization. Green-house studies were conducted using soil collected fromthe Texas AgriLife Research and Extension Center nearOverton, TX. Soil at this site is characterized as Darco loamyfine sand (loamy, siliceous, semiactive, thermic GrossarenicPaleudults) with a pH of 5.6. The soil was air dried forapproximately 21 days, thoroughly mixed and stored untilfurther use. This soil was chosen due to its sandy texture andlow native fertility.
Oilseed species chosen for this study were Sinapisalba cv. Ida Gold (L.A. Hearne Seeds, Monterey County,CA), Brassica juncea cv. Pacific Gold (L.A. Hearne Seeds,Monterey County, CA), Jatropha curcas, and Camelina sativa(Texas Agrilife Research and Extension, College Station, TX).Jatropha fruit was dehulled by hand prior to seed pressing.
A motor-driven screw press operating at 95–100◦C wasused to extract the oil from seed. The oil constitutedapproximately 20–30% of the various seeds by weight,and approximately 90–95% of the total oil content wasextracted. The SMs were stored at approximately 0◦C untilincorporation into soil. Both the soil and SMs were analyzedfor total organic C and total N by a combustion procedure[11–13]. The soil was analyzed for extractable P, K, Ca, Mg,and S by Mehlich III [14, 15] and analysis by ICP, andmicronutrients (Cu, Fe, Mn, and Zn) by extraction withDTPA-TEA, followed by ICP analysis [16], and extractableNO3-N by cadmium reduction following extraction by 1 NKCl [17]. Mineral compositions of SM (B, Ca, Cu, Fe,K, Mg, Mn, Na, P, S, and Zn) were determined by ICPanalysis of nitric acid digests. Soil electrical conductivity(EC) was determined in a 1 : 2 soil-to-water extract usingdeionized water, with the actual determination made usinga conductivity probe [18]. Soil texture was determined usingthe hydrometer procedure [19].
Glucosinolate concentrations of white mustard andjatropha were determined by high performance liquid chro-matography (HPLC) using methods of two previous studies[20, 21] based on ISO 9167 [22] and quantified glucosino-late concentrations of Indian mustard and camelina SMs,respectively. Expected retention behavior, such as time andsequence, and absorption spectra were used to identify indi-vidual glucosinolate peaks. Sinigrin monohydrate (ScienceLab, Houston, TX) was utilized as an internal standard tocalculate the major glucosinolate concentration.
2.2. Experimental Design and Data Collection. An emer-gence and survival study was conducted in a temperature-controlled glasshouse using cotton [Gossypium hirsutum(L.)], sorghum [Sorghum bicolor (L.) Moench], johnsongrass(Sorghum halepense), and redroot pigweed (Amaranthusretroflexus) as the crop and weed species. The study was acomplete factorial within a completely randomized designwith four replications of 36 treatment combinations, includ-ing: SM type (white mustard, Indian mustard, camelina,and jatropha), application rate [0.5, 1.0, and 2.5% on dryweight basis (w/w)], and incubation time (1, 7, and 14 dprior to planting). Before mixing with soil, SMs were finelycrushed using a mortar and pestle. Approximately 340 g ofsoil-SM mixture were added to ∼500-mL growth cups andincubated for the designated times at 32 to 35◦C in the glasshouse. The soil was not disturbed other than at planting.The gravimetric water content of mixtures was kept constantat 0.24 g g−1 by weighing and adding distilled water daily.Nonamended soil was used as the control treatment for eachcrop or weed species.
On 29 July 2009, ten sorghum or cotton, 50 redrootpigweed, or 100 johnsongrass viable seed were planted intoeach individual treatment replication. The actual numberof seed planted was based on the average germinationpercentage of 100 crop/weed seed, which was determinedprior to the start of the experiment (data not shown).Counting of emerged seedlings began the first day followingplanting and continued on a daily basis for 14 d. Seedlingswere considered emerged when visible above the soil surface.
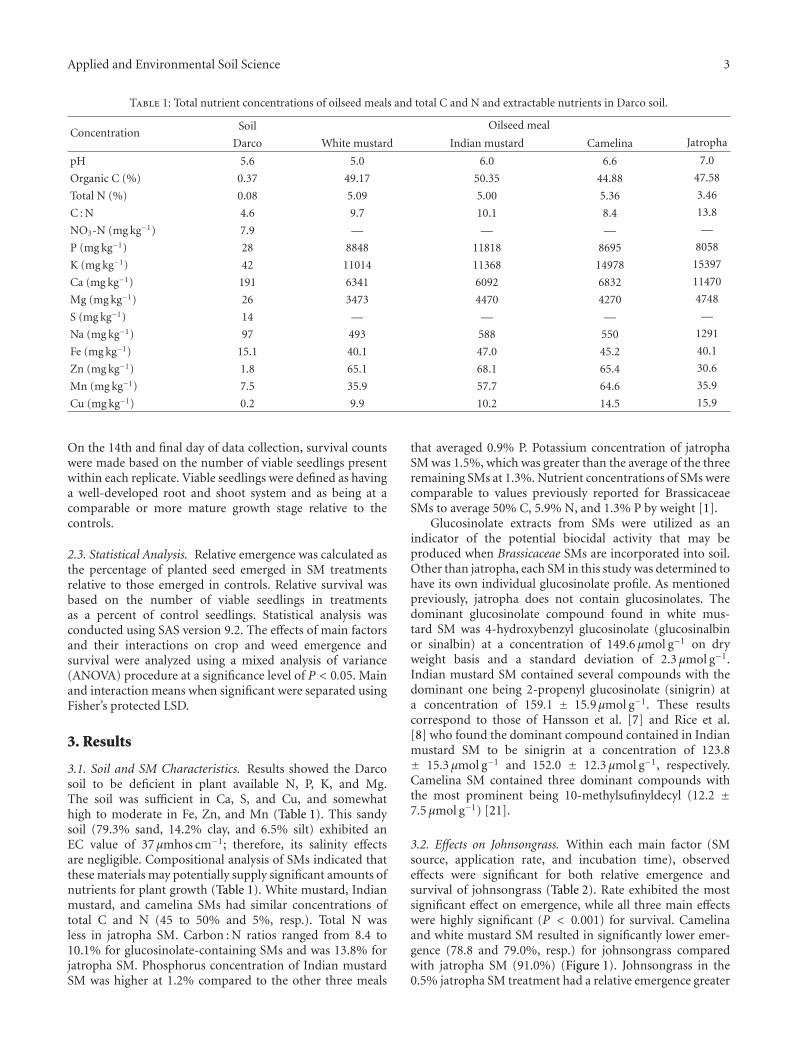
Applied and Environmental Soil Science 3
Table 1: Total nutrient concentrations of oilseed meals and total C and N and extractable nutrients in Darco soil.
ConcentrationSoil Oilseed meal
Darco White mustard Indian mustard Camelina Jatropha
pH 5.6 5.0 6.0 6.6 7.0
Organic C (%) 0.37 49.17 50.35 44.88 47.58
Total N (%) 0.08 5.09 5.00 5.36 3.46
C : N 4.6 9.7 10.1 8.4 13.8
NO3-N (mg kg−1) 7.9 — — — —
P (mg kg−1) 28 8848 11818 8695 8058
K (mg kg−1) 42 11014 11368 14978 15397
Ca (mg kg−1) 191 6341 6092 6832 11470
Mg (mg kg−1) 26 3473 4470 4270 4748
S (mg kg−1) 14 — — — —
Na (mg kg−1) 97 493 588 550 1291
Fe (mg kg−1) 15.1 40.1 47.0 45.2 40.1
Zn (mg kg−1) 1.8 65.1 68.1 65.4 30.6
Mn (mg kg−1) 7.5 35.9 57.7 64.6 35.9
Cu (mg kg−1) 0.2 9.9 10.2 14.5 15.9
On the 14th and final day of data collection, survival countswere made based on the number of viable seedlings presentwithin each replicate. Viable seedlings were defined as havinga well-developed root and shoot system and as being at acomparable or more mature growth stage relative to thecontrols.
2.3. Statistical Analysis. Relative emergence was calculated asthe percentage of planted seed emerged in SM treatmentsrelative to those emerged in controls. Relative survival wasbased on the number of viable seedlings in treatmentsas a percent of control seedlings. Statistical analysis wasconducted using SAS version 9.2. The effects of main factorsand their interactions on crop and weed emergence andsurvival were analyzed using a mixed analysis of variance(ANOVA) procedure at a significance level of P < 0.05. Mainand interaction means when significant were separated usingFisher’s protected LSD.
3. Results
3.1. Soil and SM Characteristics. Results showed the Darcosoil to be deficient in plant available N, P, K, and Mg.The soil was sufficient in Ca, S, and Cu, and somewhathigh to moderate in Fe, Zn, and Mn (Table 1). This sandysoil (79.3% sand, 14.2% clay, and 6.5% silt) exhibited anEC value of 37 μmhos cm−1; therefore, its salinity effectsare negligible. Compositional analysis of SMs indicated thatthese materials may potentially supply significant amounts ofnutrients for plant growth (Table 1). White mustard, Indianmustard, and camelina SMs had similar concentrations oftotal C and N (45 to 50% and 5%, resp.). Total N wasless in jatropha SM. Carbon : N ratios ranged from 8.4 to10.1% for glucosinolate-containing SMs and was 13.8% forjatropha SM. Phosphorus concentration of Indian mustardSM was higher at 1.2% compared to the other three meals
that averaged 0.9% P. Potassium concentration of jatrophaSM was 1.5%, which was greater than the average of the threeremaining SMs at 1.3%. Nutrient concentrations of SMs werecomparable to values previously reported for BrassicaceaeSMs to average 50% C, 5.9% N, and 1.3% P by weight [1].
Glucosinolate extracts from SMs were utilized as anindicator of the potential biocidal activity that may beproduced when Brassicaceae SMs are incorporated into soil.Other than jatropha, each SM in this study was determined tohave its own individual glucosinolate profile. As mentionedpreviously, jatropha does not contain glucosinolates. Thedominant glucosinolate compound found in white mus-tard SM was 4-hydroxybenzyl glucosinolate (glucosinalbinor sinalbin) at a concentration of 149.6 μmol g−1 on dryweight basis and a standard deviation of 2.3 μmol g−1.Indian mustard SM contained several compounds with thedominant one being 2-propenyl glucosinolate (sinigrin) ata concentration of 159.1 ± 15.9μmol g−1. These resultscorrespond to those of Hansson et al. [7] and Rice et al.[8] who found the dominant compound contained in Indianmustard SM to be sinigrin at a concentration of 123.8± 15.3 μmol g−1 and 152.0 ± 12.3 μmol g−1, respectively.Camelina SM contained three dominant compounds withthe most prominent being 10-methylsufinyldecyl (12.2 ±7.5 μmol g−1) [21].
3.2. Effects on Johnsongrass. Within each main factor (SMsource, application rate, and incubation time), observedeffects were significant for both relative emergence andsurvival of johnsongrass (Table 2). Rate exhibited the mostsignificant effect on emergence, while all three main effectswere highly significant (P < 0.001) for survival. Camelinaand white mustard SM resulted in significantly lower emer-gence (78.8 and 79.0%, resp.) for johnsongrass comparedwith jatropha SM (91.0%) (Figure 1). Johnsongrass in the0.5% jatropha SM treatment had a relative emergence greater
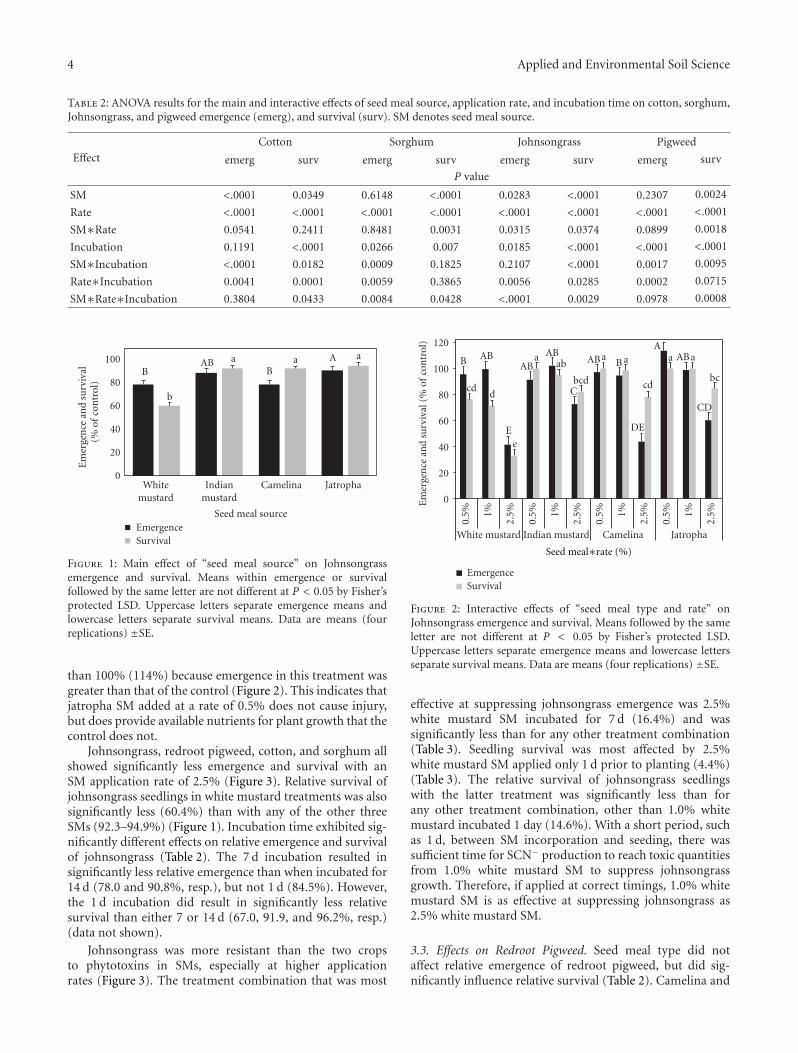
4 Applied and Environmental Soil Science
Table 2: ANOVA results for the main and interactive effects of seed meal source, application rate, and incubation time on cotton, sorghum,Johnsongrass, and pigweed emergence (emerg), and survival (surv). SM denotes seed meal source.
Effect
Cotton Sorghum Johnsongrass Pigweed
emerg surv emerg surv emerg surv emerg surv
P value
SM <.0001 0.0349 0.6148 <.0001 0.0283 <.0001 0.2307 0.0024
Rate <.0001 <.0001 <.0001 <.0001 <.0001 <.0001 <.0001 <.0001
SM∗Rate 0.0541 0.2411 0.8481 0.0031 0.0315 0.0374 0.0899 0.0018
Incubation 0.1191 <.0001 0.0266 0.007 0.0185 <.0001 <.0001 <.0001
SM∗Incubation <.0001 0.0182 0.0009 0.1825 0.2107 <.0001 0.0017 0.0095
Rate∗Incubation 0.0041 0.0001 0.0059 0.3865 0.0056 0.0285 0.0002 0.0715
SM∗Rate∗Incubation 0.3804 0.0433 0.0084 0.0428 <.0001 0.0029 0.0978 0.0008
BAB
BA
b
a a a
0
20
40
60
80
100
Whitemustard
Indianmustard
Camelina Jatropha
Em
erge
nce
an
d su
rviv
al
(%
of
con
trol
)
Seed meal sourceEmergenceSurvival
Figure 1: Main effect of “seed meal source” on Johnsongrassemergence and survival. Means within emergence or survivalfollowed by the same letter are not different at P < 0.05 by Fisher’sprotected LSD. Uppercase letters separate emergence means andlowercase letters separate survival means. Data are means (fourreplications) ±SE.
than 100% (114%) because emergence in this treatment wasgreater than that of the control (Figure 2). This indicates thatjatropha SM added at a rate of 0.5% does not cause injury,but does provide available nutrients for plant growth that thecontrol does not.
Johnsongrass, redroot pigweed, cotton, and sorghum allshowed significantly less emergence and survival with anSM application rate of 2.5% (Figure 3). Relative survival ofjohnsongrass seedlings in white mustard treatments was alsosignificantly less (60.4%) than with any of the other threeSMs (92.3–94.9%) (Figure 1). Incubation time exhibited sig-nificantly different effects on relative emergence and survivalof johnsongrass (Table 2). The 7 d incubation resulted insignificantly less relative emergence than when incubated for14 d (78.0 and 90.8%, resp.), but not 1 d (84.5%). However,the 1 d incubation did result in significantly less relativesurvival than either 7 or 14 d (67.0, 91.9, and 96.2%, resp.)(data not shown).
Johnsongrass was more resistant than the two cropsto phytotoxins in SMs, especially at higher applicationrates (Figure 3). The treatment combination that was most
B AB
E
ABAB
C
AB B
DE
AAB
CD
cdd
e
aab
bcd
a a
cd
a a
bc
0
20
40
60
80
100
120
0.5% 1%
2.5%
0.5% 1%
2.5%
0.5% 1%
2.5%
0.5% 1%
2.5%
White mustard Indian mustard Camelina Jatropha
Em
erge
nce
an
d su
rviv
al (
% o
f co
ntr
ol)
EmergenceSurvival
Seed meal∗rate (%)
Figure 2: Interactive effects of “seed meal type and rate” onJohnsongrass emergence and survival. Means followed by the sameletter are not different at P < 0.05 by Fisher’s protected LSD.Uppercase letters separate emergence means and lowercase lettersseparate survival means. Data are means (four replications) ±SE.
effective at suppressing johnsongrass emergence was 2.5%white mustard SM incubated for 7 d (16.4%) and wassignificantly less than for any other treatment combination(Table 3). Seedling survival was most affected by 2.5%white mustard SM applied only 1 d prior to planting (4.4%)(Table 3). The relative survival of johnsongrass seedlingswith the latter treatment was significantly less than forany other treatment combination, other than 1.0% whitemustard incubated 1 day (14.6%). With a short period, suchas 1 d, between SM incorporation and seeding, there wassufficient time for SCN− production to reach toxic quantitiesfrom 1.0% white mustard SM to suppress johnsongrassgrowth. Therefore, if applied at correct timings, 1.0% whitemustard SM is as effective at suppressing johnsongrass as2.5% white mustard SM.
3.3. Effects on Redroot Pigweed. Seed meal type did notaffect relative emergence of redroot pigweed, but did sig-nificantly influence relative survival (Table 2). Camelina and
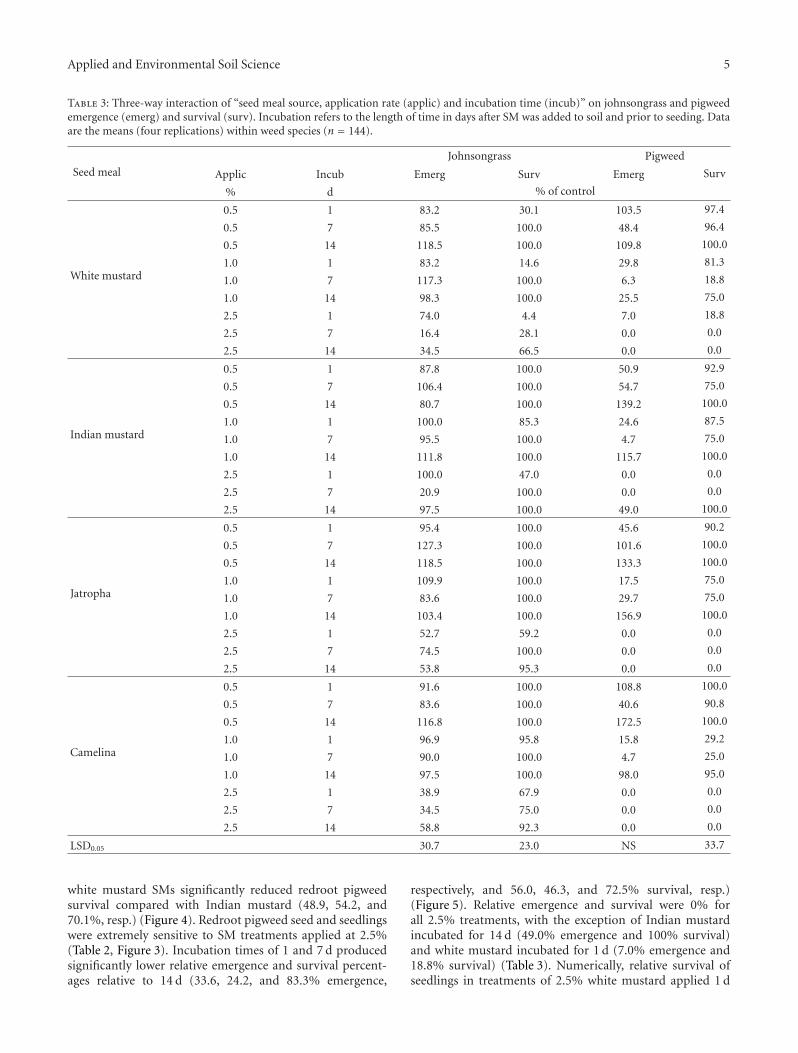
Applied and Environmental Soil Science 5
Table 3: Three-way interaction of “seed meal source, application rate (applic) and incubation time (incub)” on johnsongrass and pigweedemergence (emerg) and survival (surv). Incubation refers to the length of time in days after SM was added to soil and prior to seeding. Dataare the means (four replications) within weed species (n = 144).
Seed meal
Johnsongrass Pigweed
Applic Incub Emerg Surv Emerg Surv
% d % of control
White mustard
0.5 1 83.2 30.1 103.5 97.4
0.5 7 85.5 100.0 48.4 96.4
0.5 14 118.5 100.0 109.8 100.0
1.0 1 83.2 14.6 29.8 81.3
1.0 7 117.3 100.0 6.3 18.8
1.0 14 98.3 100.0 25.5 75.0
2.5 1 74.0 4.4 7.0 18.8
2.5 7 16.4 28.1 0.0 0.0
2.5 14 34.5 66.5 0.0 0.0
Indian mustard
0.5 1 87.8 100.0 50.9 92.9
0.5 7 106.4 100.0 54.7 75.0
0.5 14 80.7 100.0 139.2 100.0
1.0 1 100.0 85.3 24.6 87.5
1.0 7 95.5 100.0 4.7 75.0
1.0 14 111.8 100.0 115.7 100.0
2.5 1 100.0 47.0 0.0 0.0
2.5 7 20.9 100.0 0.0 0.0
2.5 14 97.5 100.0 49.0 100.0
Jatropha
0.5 1 95.4 100.0 45.6 90.2
0.5 7 127.3 100.0 101.6 100.0
0.5 14 118.5 100.0 133.3 100.0
1.0 1 109.9 100.0 17.5 75.0
1.0 7 83.6 100.0 29.7 75.0
1.0 14 103.4 100.0 156.9 100.0
2.5 1 52.7 59.2 0.0 0.0
2.5 7 74.5 100.0 0.0 0.0
2.5 14 53.8 95.3 0.0 0.0
Camelina
0.5 1 91.6 100.0 108.8 100.0
0.5 7 83.6 100.0 40.6 90.8
0.5 14 116.8 100.0 172.5 100.0
1.0 1 96.9 95.8 15.8 29.2
1.0 7 90.0 100.0 4.7 25.0
1.0 14 97.5 100.0 98.0 95.0
2.5 1 38.9 67.9 0.0 0.0
2.5 7 34.5 75.0 0.0 0.0
2.5 14 58.8 92.3 0.0 0.0
LSD0.05 30.7 23.0 NS 33.7
white mustard SMs significantly reduced redroot pigweedsurvival compared with Indian mustard (48.9, 54.2, and70.1%, resp.) (Figure 4). Redroot pigweed seed and seedlingswere extremely sensitive to SM treatments applied at 2.5%(Table 2, Figure 3). Incubation times of 1 and 7 d producedsignificantly lower relative emergence and survival percent-ages relative to 14 d (33.6, 24.2, and 83.3% emergence,
respectively, and 56.0, 46.3, and 72.5% survival, resp.)(Figure 5). Relative emergence and survival were 0% forall 2.5% treatments, with the exception of Indian mustardincubated for 14 d (49.0% emergence and 100% survival)and white mustard incubated for 1 d (7.0% emergence and18.8% survival) (Table 3). Numerically, relative survival ofseedlings in treatments of 2.5% white mustard applied 1 d
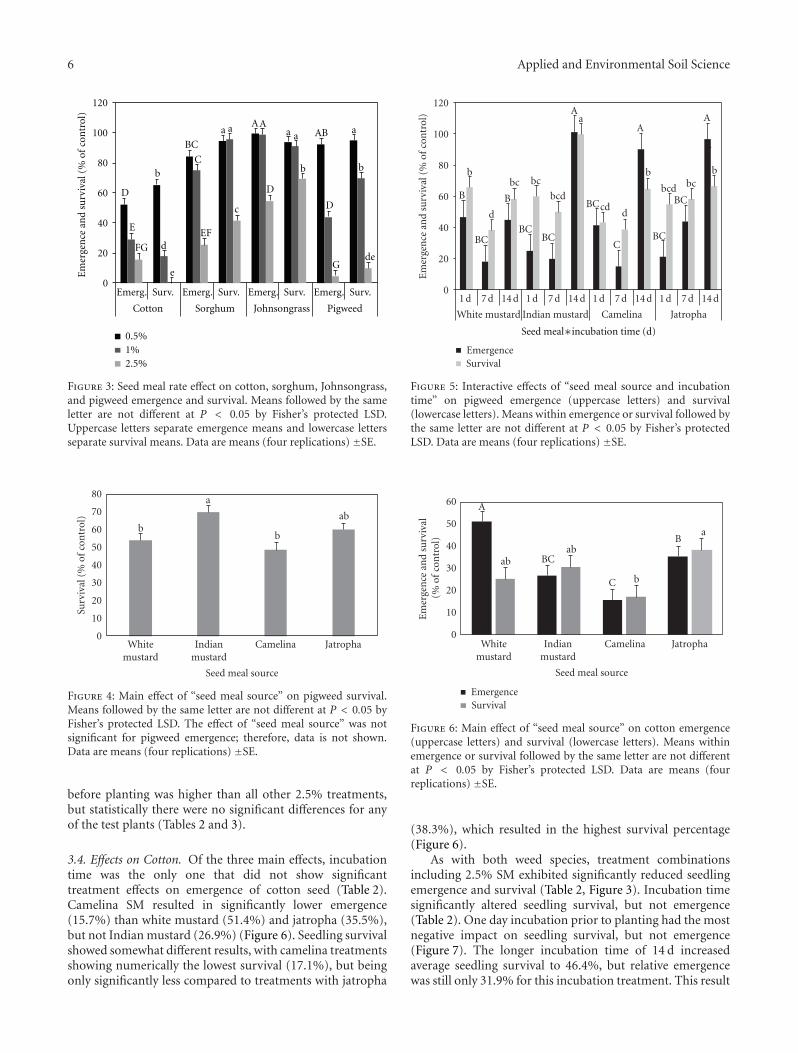
6 Applied and Environmental Soil Science
D
b
BC
aA
a AB a
E
d
C
a Aa
D
b
FG
e
EF
c
D
b
Gde
0
20
40
60
80
100
120
Emerg. Surv. Emerg. Surv. Emerg. Surv. Emerg. Surv.
Cotton Sorghum Johnsongrass Pigweed
Em
erge
nce
an
d su
rviv
al (
% o
f co
ntr
ol)
0.5%1%2.5%
Figure 3: Seed meal rate effect on cotton, sorghum, Johnsongrass,and pigweed emergence and survival. Means followed by the sameletter are not different at P < 0.05 by Fisher’s protected LSD.Uppercase letters separate emergence means and lowercase lettersseparate survival means. Data are means (four replications) ±SE.
b
a
ab
b
0
10
20
30
40
50
60
70
80
Whitemustard
Indianmustard
Camelina Jatropha
Surv
ival
(%
of
con
trol
)
Seed meal source
Figure 4: Main effect of “seed meal source” on pigweed survival.Means followed by the same letter are not different at P < 0.05 byFisher’s protected LSD. The effect of “seed meal source” was notsignificant for pigweed emergence; therefore, data is not shown.Data are means (four replications) ±SE.
before planting was higher than all other 2.5% treatments,but statistically there were no significant differences for anyof the test plants (Tables 2 and 3).
3.4. Effects on Cotton. Of the three main effects, incubationtime was the only one that did not show significanttreatment effects on emergence of cotton seed (Table 2).Camelina SM resulted in significantly lower emergence(15.7%) than white mustard (51.4%) and jatropha (35.5%),but not Indian mustard (26.9%) (Figure 6). Seedling survivalshowed somewhat different results, with camelina treatmentsshowing numerically the lowest survival (17.1%), but beingonly significantly less compared to treatments with jatropha
B
BC
B
BCBC
A
BC
C
A
BC
BC
A
b
d
bc bc
bcd
a
cdd
b
bcd bcb
0
20
40
60
80
100
120
1 d 7 d 14 d 1 d 7 d 14 d 1 d 7 d 14 d 1 d 7 d 14 d
White mustard Indian mustard Camelina Jatropha
Em
erge
nce
an
d su
rviv
al (
% o
f co
ntr
ol)
EmergenceSurvival
A
Seed meal∗incubation time (d)
Figure 5: Interactive effects of “seed meal source and incubationtime” on pigweed emergence (uppercase letters) and survival(lowercase letters). Means within emergence or survival followed bythe same letter are not different at P < 0.05 by Fisher’s protectedLSD. Data are means (four replications) ±SE.
A
BC
B
C
abab
b
a
0
10
20
30
40
50
60
Whitemustard
Indianmustard
Camelina Jatropha
Em
erge
nce
an
d su
rviv
al
(% o
f co
ntr
ol)
Seed meal source
EmergenceSurvival
Figure 6: Main effect of “seed meal source” on cotton emergence(uppercase letters) and survival (lowercase letters). Means withinemergence or survival followed by the same letter are not differentat P < 0.05 by Fisher’s protected LSD. Data are means (fourreplications) ±SE.
(38.3%), which resulted in the highest survival percentage(Figure 6).
As with both weed species, treatment combinationsincluding 2.5% SM exhibited significantly reduced seedlingemergence and survival (Table 2, Figure 3). Incubation timesignificantly altered seedling survival, but not emergence(Table 2). One day incubation prior to planting had the mostnegative impact on seedling survival, but not emergence(Figure 7). The longer incubation time of 14 d increasedaverage seedling survival to 46.4%, but relative emergencewas still only 31.9% for this incubation treatment. This result
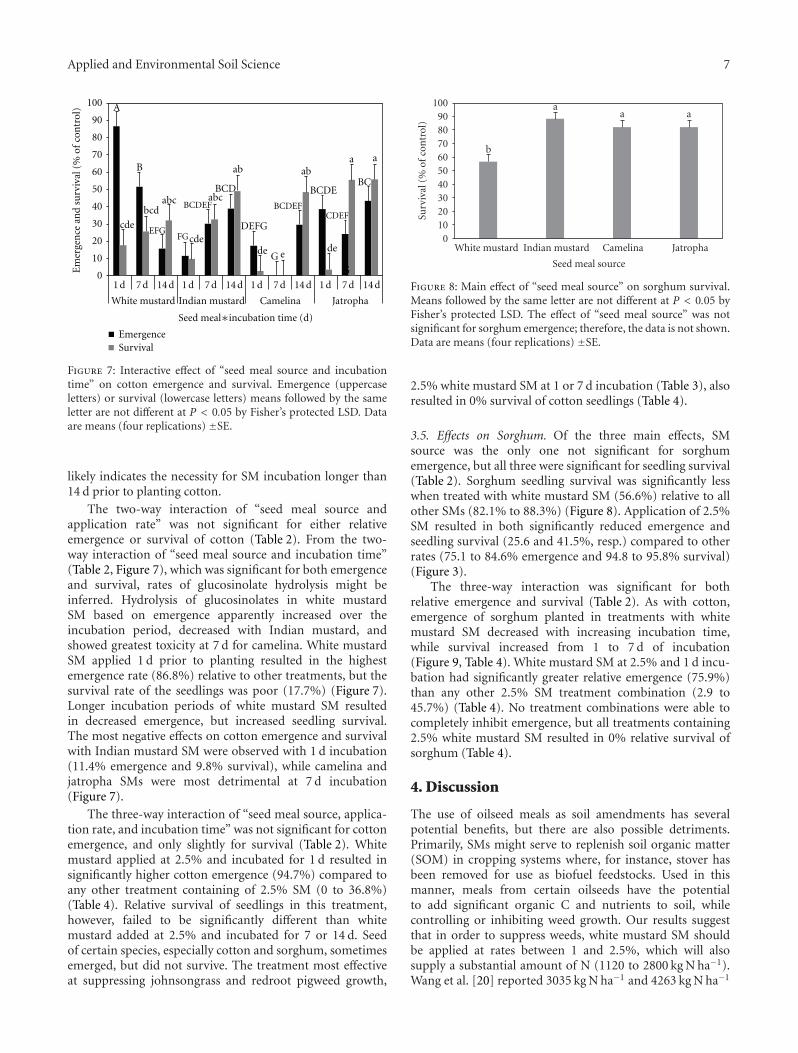
Applied and Environmental Soil Science 7
A
B
BCDEF
DEFG
G
BCDEF
BCDE
CDEF
BC
cde
bcdabc
cde
abc
ab
de e
ab
de
a a
0
10
20
30
40
50
60
70
80
90
100
1 d 7 d 14 d 1 d 7 d 14 d 1 d 7 d 14 d 1 d 7 d 14 d
White mustard Indian mustard Camelina Jatropha
Em
erge
nce
an
d su
rviv
al (
% o
f co
ntr
ol)
EmergenceSurvival
EFGFG
BCD
G
Seed meal∗incubation time (d)
Figure 7: Interactive effect of “seed meal source and incubationtime” on cotton emergence and survival. Emergence (uppercaseletters) or survival (lowercase letters) means followed by the sameletter are not different at P < 0.05 by Fisher’s protected LSD. Dataare means (four replications) ±SE.
likely indicates the necessity for SM incubation longer than14 d prior to planting cotton.
The two-way interaction of “seed meal source andapplication rate” was not significant for either relativeemergence or survival of cotton (Table 2). From the two-way interaction of “seed meal source and incubation time”(Table 2, Figure 7), which was significant for both emergenceand survival, rates of glucosinolate hydrolysis might beinferred. Hydrolysis of glucosinolates in white mustardSM based on emergence apparently increased over theincubation period, decreased with Indian mustard, andshowed greatest toxicity at 7 d for camelina. White mustardSM applied 1 d prior to planting resulted in the highestemergence rate (86.8%) relative to other treatments, but thesurvival rate of the seedlings was poor (17.7%) (Figure 7).Longer incubation periods of white mustard SM resultedin decreased emergence, but increased seedling survival.The most negative effects on cotton emergence and survivalwith Indian mustard SM were observed with 1 d incubation(11.4% emergence and 9.8% survival), while camelina andjatropha SMs were most detrimental at 7 d incubation(Figure 7).
The three-way interaction of “seed meal source, applica-tion rate, and incubation time” was not significant for cottonemergence, and only slightly for survival (Table 2). Whitemustard applied at 2.5% and incubated for 1 d resulted insignificantly higher cotton emergence (94.7%) compared toany other treatment containing of 2.5% SM (0 to 36.8%)(Table 4). Relative survival of seedlings in this treatment,however, failed to be significantly different than whitemustard added at 2.5% and incubated for 7 or 14 d. Seedof certain species, especially cotton and sorghum, sometimesemerged, but did not survive. The treatment most effectiveat suppressing johnsongrass and redroot pigweed growth,
b
aa a
0102030405060708090
100
White mustard Indian mustard Camelina Jatropha
Surv
ival
(%
of
con
trol
)
Seed meal source
Figure 8: Main effect of “seed meal source” on sorghum survival.Means followed by the same letter are not different at P < 0.05 byFisher’s protected LSD. The effect of “seed meal source” was notsignificant for sorghum emergence; therefore, the data is not shown.Data are means (four replications) ±SE.
2.5% white mustard SM at 1 or 7 d incubation (Table 3), alsoresulted in 0% survival of cotton seedlings (Table 4).
3.5. Effects on Sorghum. Of the three main effects, SMsource was the only one not significant for sorghumemergence, but all three were significant for seedling survival(Table 2). Sorghum seedling survival was significantly lesswhen treated with white mustard SM (56.6%) relative to allother SMs (82.1% to 88.3%) (Figure 8). Application of 2.5%SM resulted in both significantly reduced emergence andseedling survival (25.6 and 41.5%, resp.) compared to otherrates (75.1 to 84.6% emergence and 94.8 to 95.8% survival)(Figure 3).
The three-way interaction was significant for bothrelative emergence and survival (Table 2). As with cotton,emergence of sorghum planted in treatments with whitemustard SM decreased with increasing incubation time,while survival increased from 1 to 7 d of incubation(Figure 9, Table 4). White mustard SM at 2.5% and 1 d incu-bation had significantly greater relative emergence (75.9%)than any other 2.5% SM treatment combination (2.9 to45.7%) (Table 4). No treatment combinations were able tocompletely inhibit emergence, but all treatments containing2.5% white mustard SM resulted in 0% relative survival ofsorghum (Table 4).
4. Discussion
The use of oilseed meals as soil amendments has severalpotential benefits, but there are also possible detriments.Primarily, SMs might serve to replenish soil organic matter(SOM) in cropping systems where, for instance, stover hasbeen removed for use as biofuel feedstocks. Used in thismanner, meals from certain oilseeds have the potentialto add significant organic C and nutrients to soil, whilecontrolling or inhibiting weed growth. Our results suggestthat in order to suppress weeds, white mustard SM shouldbe applied at rates between 1 and 2.5%, which will alsosupply a substantial amount of N (1120 to 2800 kg N ha−1).Wang et al. [20] reported 3035 kg N ha−1 and 4263 kg N ha−1
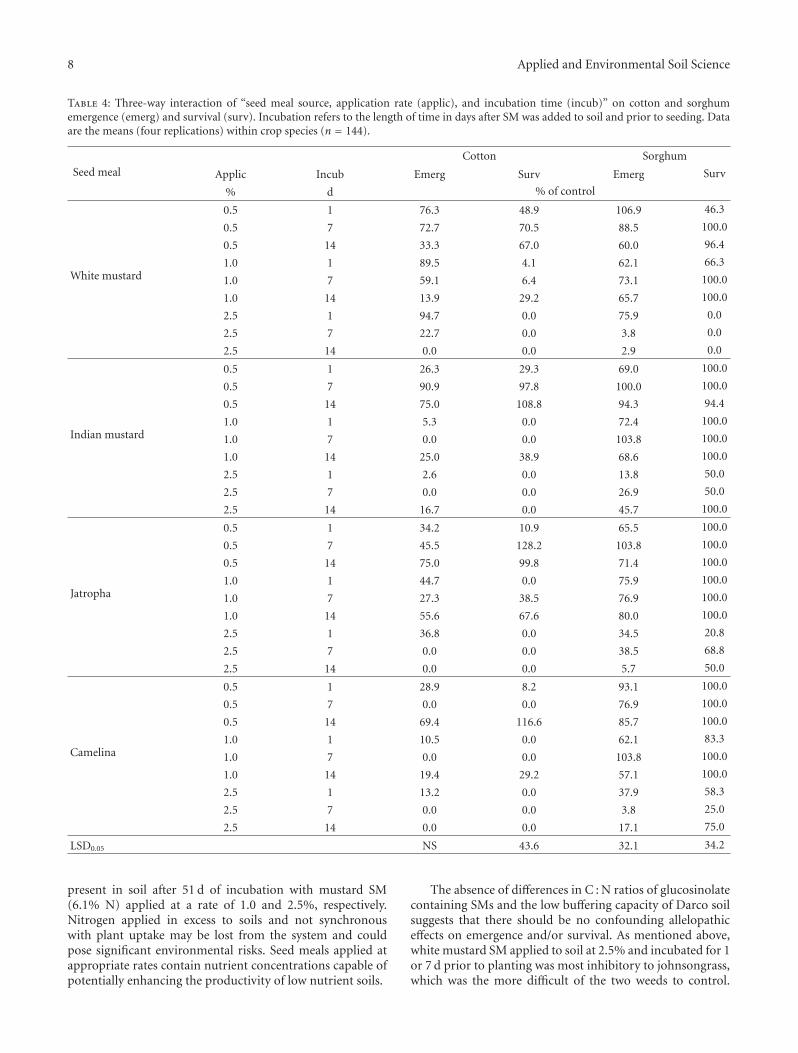
8 Applied and Environmental Soil Science
Table 4: Three-way interaction of “seed meal source, application rate (applic), and incubation time (incub)” on cotton and sorghumemergence (emerg) and survival (surv). Incubation refers to the length of time in days after SM was added to soil and prior to seeding. Dataare the means (four replications) within crop species (n = 144).
Seed meal
Cotton Sorghum
Applic Incub Emerg Surv Emerg Surv
% d % of control
White mustard
0.5 1 76.3 48.9 106.9 46.3
0.5 7 72.7 70.5 88.5 100.0
0.5 14 33.3 67.0 60.0 96.4
1.0 1 89.5 4.1 62.1 66.3
1.0 7 59.1 6.4 73.1 100.0
1.0 14 13.9 29.2 65.7 100.0
2.5 1 94.7 0.0 75.9 0.0
2.5 7 22.7 0.0 3.8 0.0
2.5 14 0.0 0.0 2.9 0.0
Indian mustard
0.5 1 26.3 29.3 69.0 100.0
0.5 7 90.9 97.8 100.0 100.0
0.5 14 75.0 108.8 94.3 94.4
1.0 1 5.3 0.0 72.4 100.0
1.0 7 0.0 0.0 103.8 100.0
1.0 14 25.0 38.9 68.6 100.0
2.5 1 2.6 0.0 13.8 50.0
2.5 7 0.0 0.0 26.9 50.0
2.5 14 16.7 0.0 45.7 100.0
Jatropha
0.5 1 34.2 10.9 65.5 100.0
0.5 7 45.5 128.2 103.8 100.0
0.5 14 75.0 99.8 71.4 100.0
1.0 1 44.7 0.0 75.9 100.0
1.0 7 27.3 38.5 76.9 100.0
1.0 14 55.6 67.6 80.0 100.0
2.5 1 36.8 0.0 34.5 20.8
2.5 7 0.0 0.0 38.5 68.8
2.5 14 0.0 0.0 5.7 50.0
Camelina
0.5 1 28.9 8.2 93.1 100.0
0.5 7 0.0 0.0 76.9 100.0
0.5 14 69.4 116.6 85.7 100.0
1.0 1 10.5 0.0 62.1 83.3
1.0 7 0.0 0.0 103.8 100.0
1.0 14 19.4 29.2 57.1 100.0
2.5 1 13.2 0.0 37.9 58.3
2.5 7 0.0 0.0 3.8 25.0
2.5 14 0.0 0.0 17.1 75.0
LSD0.05 NS 43.6 32.1 34.2
present in soil after 51 d of incubation with mustard SM(6.1% N) applied at a rate of 1.0 and 2.5%, respectively.Nitrogen applied in excess to soils and not synchronouswith plant uptake may be lost from the system and couldpose significant environmental risks. Seed meals applied atappropriate rates contain nutrient concentrations capable ofpotentially enhancing the productivity of low nutrient soils.
The absence of differences in C : N ratios of glucosinolatecontaining SMs and the low buffering capacity of Darco soilsuggests that there should be no confounding allelopathiceffects on emergence and/or survival. As mentioned above,white mustard SM applied to soil at 2.5% and incubated for 1or 7 d prior to planting was most inhibitory to johnsongrass,which was the more difficult of the two weeds to control.
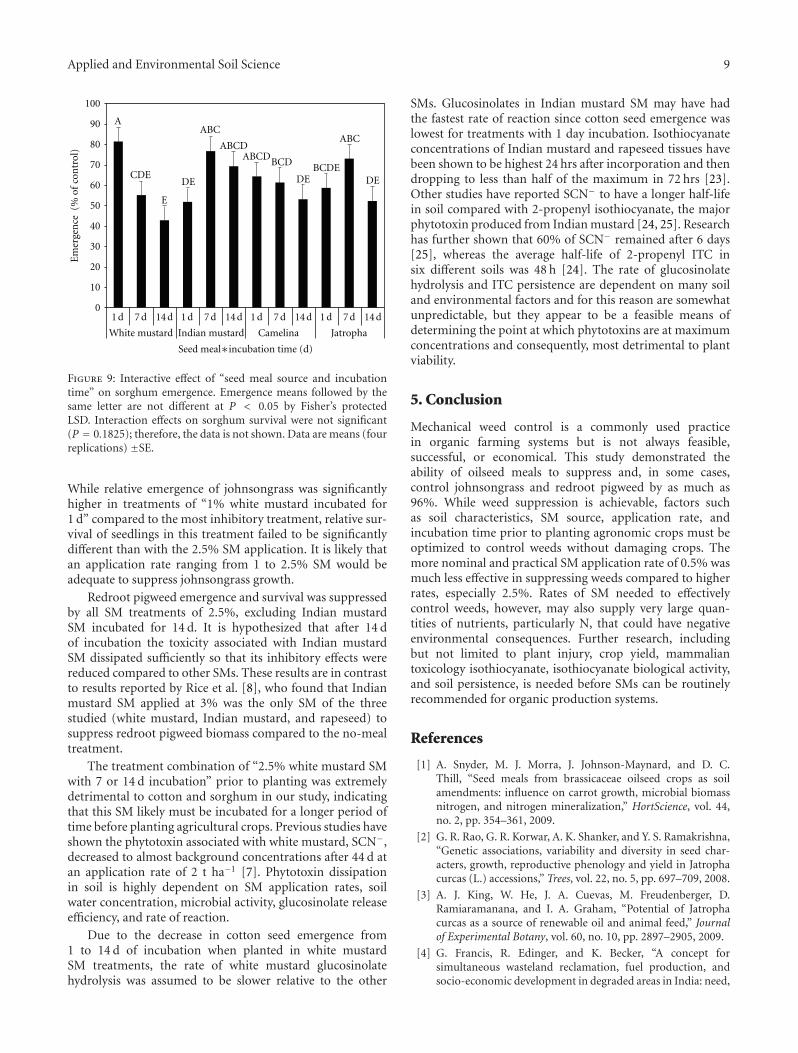
Applied and Environmental Soil Science 9
A
CDE
E
DE
ABC
ABCDABCD
BCD
DEBCDE
ABC
DE
0
10
20
30
40
50
60
70
80
90
100
1 d 7 d 14 d 1 d 7 d 14 d 1 d 7 d 14 d 1 d 7 d 14 d
White mustard Indian mustard Camelina Jatropha
Em
erge
nce
(%
of
con
trol
)
Seed meal∗incubation time (d)
Figure 9: Interactive effect of “seed meal source and incubationtime” on sorghum emergence. Emergence means followed by thesame letter are not different at P < 0.05 by Fisher’s protectedLSD. Interaction effects on sorghum survival were not significant(P = 0.1825); therefore, the data is not shown. Data are means (fourreplications) ±SE.
While relative emergence of johnsongrass was significantlyhigher in treatments of “1% white mustard incubated for1 d” compared to the most inhibitory treatment, relative sur-vival of seedlings in this treatment failed to be significantlydifferent than with the 2.5% SM application. It is likely thatan application rate ranging from 1 to 2.5% SM would beadequate to suppress johnsongrass growth.
Redroot pigweed emergence and survival was suppressedby all SM treatments of 2.5%, excluding Indian mustardSM incubated for 14 d. It is hypothesized that after 14 dof incubation the toxicity associated with Indian mustardSM dissipated sufficiently so that its inhibitory effects werereduced compared to other SMs. These results are in contrastto results reported by Rice et al. [8], who found that Indianmustard SM applied at 3% was the only SM of the threestudied (white mustard, Indian mustard, and rapeseed) tosuppress redroot pigweed biomass compared to the no-mealtreatment.
The treatment combination of “2.5% white mustard SMwith 7 or 14 d incubation” prior to planting was extremelydetrimental to cotton and sorghum in our study, indicatingthat this SM likely must be incubated for a longer period oftime before planting agricultural crops. Previous studies haveshown the phytotoxin associated with white mustard, SCN−,decreased to almost background concentrations after 44 d atan application rate of 2 t ha−1 [7]. Phytotoxin dissipationin soil is highly dependent on SM application rates, soilwater concentration, microbial activity, glucosinolate releaseefficiency, and rate of reaction.
Due to the decrease in cotton seed emergence from1 to 14 d of incubation when planted in white mustardSM treatments, the rate of white mustard glucosinolatehydrolysis was assumed to be slower relative to the other
SMs. Glucosinolates in Indian mustard SM may have hadthe fastest rate of reaction since cotton seed emergence waslowest for treatments with 1 day incubation. Isothiocyanateconcentrations of Indian mustard and rapeseed tissues havebeen shown to be highest 24 hrs after incorporation and thendropping to less than half of the maximum in 72 hrs [23].Other studies have reported SCN− to have a longer half-lifein soil compared with 2-propenyl isothiocyanate, the majorphytotoxin produced from Indian mustard [24, 25]. Researchhas further shown that 60% of SCN− remained after 6 days[25], whereas the average half-life of 2-propenyl ITC insix different soils was 48 h [24]. The rate of glucosinolatehydrolysis and ITC persistence are dependent on many soiland environmental factors and for this reason are somewhatunpredictable, but they appear to be a feasible means ofdetermining the point at which phytotoxins are at maximumconcentrations and consequently, most detrimental to plantviability.
5. Conclusion
Mechanical weed control is a commonly used practicein organic farming systems but is not always feasible,successful, or economical. This study demonstrated theability of oilseed meals to suppress and, in some cases,control johnsongrass and redroot pigweed by as much as96%. While weed suppression is achievable, factors suchas soil characteristics, SM source, application rate, andincubation time prior to planting agronomic crops must beoptimized to control weeds without damaging crops. Themore nominal and practical SM application rate of 0.5% wasmuch less effective in suppressing weeds compared to higherrates, especially 2.5%. Rates of SM needed to effectivelycontrol weeds, however, may also supply very large quan-tities of nutrients, particularly N, that could have negativeenvironmental consequences. Further research, includingbut not limited to plant injury, crop yield, mammaliantoxicology isothiocyanate, isothiocyanate biological activity,and soil persistence, is needed before SMs can be routinelyrecommended for organic production systems.
References
[1] A. Snyder, M. J. Morra, J. Johnson-Maynard, and D. C.Thill, “Seed meals from brassicaceae oilseed crops as soilamendments: influence on carrot growth, microbial biomassnitrogen, and nitrogen mineralization,” HortScience, vol. 44,no. 2, pp. 354–361, 2009.
[2] G. R. Rao, G. R. Korwar, A. K. Shanker, and Y. S. Ramakrishna,“Genetic associations, variability and diversity in seed char-acters, growth, reproductive phenology and yield in Jatrophacurcas (L.) accessions,” Trees, vol. 22, no. 5, pp. 697–709, 2008.
[3] A. J. King, W. He, J. A. Cuevas, M. Freudenberger, D.Ramiaramanana, and I. A. Graham, “Potential of Jatrophacurcas as a source of renewable oil and animal feed,” Journalof Experimental Botany, vol. 60, no. 10, pp. 2897–2905, 2009.
[4] G. Francis, R. Edinger, and K. Becker, “A concept forsimultaneous wasteland reclamation, fuel production, andsocio-economic development in degraded areas in India: need,
10 Applied and Environmental Soil Science
potential and perspectives of Jatropha plantations,” NaturalResources Forum, vol. 29, no. 1, pp. 12–24, 2005.
[5] R. F. Mithen, “Glucosinolates and their degradation products,”Advances in Botanical Research, vol. 35, pp. 213–232, 2001.
[6] A. L. Gimsing and J. A. Kirkegaard, “Glucosinolates andbiofumigation: fate of glucosinolates and their hydrolysisproducts in soil,” Phytochemistry Reviews, vol. 8, no. 1, pp.299–310, 2009.
[7] D. Hansson, M. J. Morra, V. Borek, A. J. Snyder, J. L.Johnson-Maynard, and D. C. Thill, “Ionic thiocyanate (SCN-)production, fate, and phytotoxicity in soil amended withBrassicaceae seed meals,” Journal of Agricultural and FoodChemistry, vol. 56, no. 11, pp. 3912–3917, 2008.
[8] A. R. Rice, J. L. Johnson-Maynard, D. C. Thill, and M. J.Morra, “Vegetable crop emergence and weed control followingamendment with different,” Renewable Agriculture and FoodSystems, vol. 22, no. 3, pp. 204–212, 2007.
[9] H. Y. Ju, B. B. Bible, and C. Chong, “Influence of ionicthiocyanate on growth of cabbage, bean, and tobacco,” Journalof Chemical Ecology, vol. 9, no. 8, pp. 1255–1262, 1983.
[10] R. E. E. Jongschaap, W. J. Corre, P. S. Bindraban, and W. A.Brandenburg, Claims and Facts on Jatropha Curcas L., PlantResearch International, Wageningen, The Netherlands, 2007.
[11] S. L. McGeehan and D. V. Naylor, “Automated instrumentalanalysis of carbon and nitrogen in plant and soil samples,”Communications in Soil Science & Plant Analysis, vol. 19, no.4, pp. 493–505, 1988.
[12] E. E. Schulte and B. G. Hopkins, “Estimation of soil organicmatter by weight lost-on-ignition,” in Soil Organic Matter:Analysis and Interpretation, F. R. Magdoff, M. A. Tabatabai,and E. A. Hanlon Jr., Eds., Special Publication No. 46, pp. 21–32, Soil Science Society of America, Madison, Wis, USA, 1996.
[13] D. A. Storer, “A simple high sample volume ashing procedurefor determination of soil organic matter,” Communications inSoil Science & Plant Analysis, vol. 15, no. 7, pp. 759–772, 1984.
[14] A. Mehlich, “New extractant for soil test evaluation of phos-phorus, potassium, magnesium, calcium, sodium, manganese,and zinc,” Communications in Soil Science and Plant Analysis,vol. 9, pp. 477–492, 1978.
[15] A. Mehlich, “Mehlich 3 soil test extractant: a modification ofMehlich 2 extractant,” Communications in Soil Science & PlantAnalysis, vol. 15, no. 12, pp. 1409–1416, 1984.
[16] W. L. Lindsay and W. A. Norvell, “Development of a DTPA soiltest for zinc, iron, manganese, and copper,” Soil Science Societyof America Journal, vol. 42, pp. 421–428, 1978.
[17] D. R. Keeney and D. W. Nelson, “Nitrogen—inorganic forms,”in Methods of Soil Analysis, Part 2, A. L. Page et al., Ed., pp.643–687, ASA and SSSA, Madison, Wis, USA, 1982.
[18] J. D. Rhoades, “Soluble salts,” in Methods of Soil Analysis, Part2, A. L. Page et al., Ed., pp. 167–168, ASA and SSSA, Madison,Wis, USA, 1982.
[19] P. R. Day, “Particle fractionation and particle-size analysis,” inMethods of Soil Analysis, Part 1, C. A. Black et al., Ed., pp. 545–567, ASA and SSSA, Madison, Wis, USA, 1965.
[20] A. S. Wang, P. Hu, E. B. Hollister et al., “Impact of Indianmustard (Brassica juncea) and flax (Linum usitatissimum) seedmeal applications on soil carbon, nitrogen, and microbialdynamics,” Applied and Environmental Soil Science, vol. 2012,Article ID 351609, 14 pages, 2012.
[21] P. Hu, A. S. Wang, A. S. Engledow et al., “Inhibition ofthe germination and growth of Phymatotrichopsis omnivora(Cotton root rot) by oilseed meals and isothiocyanates,”Applied Soil Ecology, vol. 49, pp. 68–75, 2011.
[22] International Organization for Standarization, Rapeseed–Determination of Glucosinolates Content–part 1: Method UsingHigh-Performance Liquid Chromatography, ISO 9167-1:1992-(E), Geneva, Switzerland, 1992.
[23] M. J. Morra and J. A. Kirkegaard, “Isothiocyanate releasefrom soil-incorporated Brassica tissues,” Soil Biology andBiochemistry, vol. 34, no. 11, pp. 1683–1690, 2002.
[24] V. Borek, M. J. Morra, P. D. Brown, and J. P. McCaffrey, “Trans-formation of the glucosinolate-derived allelochemicals allylisothiocyanate and allylnitrile in soil,” Journal of Agriculturaland Food Chemistry, vol. 43, no. 7, pp. 1935–1940, 1995.
[25] P. D. Brown and M. J. Morra, “Fate of ionic thiocyanate(SCN-) in soil,” Journal of Agricultural and Food Chemistry,vol. 41, no. 6, pp. 978–982, 1993.
Hindawi Publishing CorporationApplied and Environmental Soil ScienceVolume 2012, Article ID 940954, 8 pagesdoi:10.1155/2012/940954
Research Article
Promoting Cassava as an Industrial Crop in Ghana: Effects onSoil Fertility and Farming System Sustainability
S. Adjei-Nsiah1 and Owuraku Sakyi-Dawson2
1 Forest and Horticultural Crops Research Centre, Kade, Institute of Agricultural Research,College of Agriculture and Consumer Sciences, University of Ghana, P.O. Box 68, Legon, Ghana
2 Department of Agricultural Extension, School of Agriculture, College of Agriculture and Consumer Sciences,University of Ghana, P.O. Box 68, Legon, Ghana
Correspondence should be addressed to S. Adjei-Nsiah, y [email protected]
Received 21 November 2011; Accepted 2 January 2012
Academic Editor: Marıa Cruz Dıaz Alvarez
Copyright © 2012 S. Adjei-Nsiah and O. Sakyi-Dawson. This is an open access article distributed under the Creative CommonsAttribution License, which permits unrestricted use, distribution, and reproduction in any medium, provided the original work isproperly cited.
Cassava is an important starchy staple crop in Ghana with per capita consumption of 152.9 kg/year. Besides being a staple foodcrop, cassava can be used as raw material for the production of industrial starch and ethanol. The potential of cassava as anindustrial commercial crop has not been exploited to a large extent because of perceptions that cassava depletes soils. Recent findingfrom field studies in the forest/savannah transitional agroecological zone of Ghana indicates that when integrated in the croppingsystem as a form of rotation, cassava contributes significantly to maintenance of soil fertility, and thus large scale production ofcassava for industrial use can contribute to poverty reduction in an environmentally responsive way. This paper discusses the roleof cassava cultivation in soil fertility management and its implication for farming system sustainability and industrialization.
1. Introduction
Cassava is an important starchy staple crop in Ghana withper capita consumption of 152.9 kg/year [1]. Besides beinga staple food crop, cassava can be used as raw material forthe production of industrial starch and ethanol. In Ghana,cassava is cultivated as a monocrop or intercropped withother food crops, either as the dominant or subsidiary crop.In terms of quantity produced, cassava is the most importantroot crop in Ghana followed by yams and cocoyams, butcassava ranks second to maize in terms of area planted. Theproduction of cassava in Ghana ranged from 10,217,929 MTto 12,260,330 MT in the period 2007–2009 covering an areaof 800,531 ha to 885,800 ha [1]. Ghana currently producesabout 12,260,000 MT of cassava annually. Out of this,8,561,700 MT is available for human consumption while na-tional consumption is estimated at only 3,672,700 MT result-ing in surplus of about 4,889,000 MT which can be exploitedfor the production of industrial starch or ethanol.
Despite its importance, the potential of cassava as an in-dustrial crop has not been exploited to any appreciable extent
in Ghana, with the perception that cassava depletes soils[2, 3]. However, recent studies in the forest/savannah transi-tional agroecological zone as well as the semideciduous forestzone of Ghana have demonstrated that, when integrated inthe cropping system as a form of rotation, cassava has thepotential of maintaining soil fertility.
In most parts of Africa, cassava is planted just before theland is left to fallow [4, 5]. In the forest/savannah transitionalagroecological zone of Ghana, farmers often rotate maizewith cowpea and when they observe decline in productivity,the land is cropped to cassava for a period ranging between12 to 18 months after which the maize/cowpea rotation isresumed [6]. Farmers in Benin also use cassava as a “strategyfor regenerating soil fertility” [7], and the term used forcassava cultivation in Benin “jachere manioc” literally means“cassava fallow”. According to [8], cassava is frequentlygrown on marginal soils. This is attributed to increasingpopulation densities which often result in land pressureand successively shorter fallow periods thereby compellingfarmers to allocate more of their land to cassava production[9]. Cassava is also frequently grown on marginal soils
2 Applied and Environmental Soil Science
because of its efficiency in nutrient capture and removal[10]. In the forest/savannah transitional agroecological zoneof Ghana where cassava is widely grown and used as soilfertility regenerating crop, cassava cultivation is intertwinedwith several factors such as ethnicity, access to resources(including labour, cash, and land), gender, and wealth.
This paper discusses the role of cassava cultivation in soilfertility management and its implication for farming systemsustainability and industrialization.
2. Material and Methods
The research study on which this paper is largely basedwas part of a larger research program called “Convergenceof Sciences—inclusive technology development for a betterintegrated crop and soil management” (CoS), which wasimplemented by University of Ghana for Ghana and Univer-site d’Abomey Calavi for Republic of Benin with technicalbackstopping from Wageningen University and ResearchCentre, Netherlands.
2.1. The Study Area and Population. The study was con-ducted in the Wenchi Municipal (7◦27 and 8◦30 N, 1◦ and2◦36 W) in the forest/savanna transitional agroecologicalzone of Ghana. The relief of Wenchi is gently undulatingto flat. The soils, which are mainly Lixisols, are fragile withshallow top soils underlain with compact concretions andimpermeable iron pans [11]. Temperatures are relatively highwith a monthly mean of about 30◦C. Rainfall is bimodal andstarts in April and ends in November with a dry spell inAugust. The rainy season is followed by a long dry seasonfrom November to March. The annual rainfall is about1300 mm with about 107 rainy days. Wenchi Municipal,which has a total population of 97,058 (2000 census), isethnically diverse with about 20% of the population beingmigrants from the three northern regions of Ghana and theneighbouring Burkina Faso.
2.2. Research Approach and Methods. Wenchi was selectedafter an initial exploratory study carried out according to theideas and principles of “technography” [12], which revealedthe existence of local soil fertility management strategies,some of which seemed to contradict with dominant scientificbeliefs. Among these was the inclusion of late maturingcassava varieties in rotational sequences in the cropping sys-tems in the area as a soil fertility management strategy [13].This study was thus conducted to explore the efficacy ofthe farmers’ soil fertility management strategies and theirrelevant social context.
In order to ground the research in the needs of thefarming communities, a diagnostic study was carried outin the study area between July 2002 and July 2003 usingParticipatory Rural Appraisal tools such as drawing of acommunity territory map (to identify the differences in soilfertility patterns), a transect walk (to reveal the diversityof the landscape), and analysis of soil fertility managementstrategies and group discussions. Group discussions (10–40)were held in the village centre and/or on farmers’ fields.
In addition, two sets of individual interviews with farm-ers were conducted to collect qualitative and quantitativedata. In the first interview, which involved 40 farmers, theselection of farmers was done through stratified sampling.A list of farmers in the community was obtained from thevillage committee secretary and every tenth name from thelist was selected for individual interviewing. The secondinterview which involved 38 farmers was conducted laterto look at the farming characteristics of the various sub-communities in the village using a wealth ranking exercise.For this interview, 6–10 persons were selected from eachwealth category within each subcommunity. The individualinterviews were semistructured in nature and served bothto get more quantitative data on farm size, household com-position and the farming system, and to obtain a betterqualitative understanding of the soil fertility managementstrategies and their underlying rationale.
The diagnostic study was followed by farmer participato-ry on-farm experimentations with three (3) farmer researchgroups established soon after the diagnostic study to evaluatethe agronomic efficacy of the soil fertility managementpractices being used by the farmers. Six cropping sequences:cassava cropping; pigeonpea cropping; mucuna/maize/mu-cuna rotation; cowpea/maize/cowpea rotation; maize/maize/maize; and Imperata cylindrica fallow were evaluated onboth farmer-managed and researcher-managed plots fortheir effects on soil fertility and yield of subsequent maizetest crop. To deepen our understanding of soil fertilitymanagement, we carried out further exploration of diversityamong the farmers according to gender, ethnicity, andwealth. Farmers were selected from three communities inWenchi according to ethnicity and gender for interviewusing semistructured questionnaires. We conducted two setsof interviews. For the first interview, the native house-holds were categorised into male-headed and female-headedhouseholds. Subsequently, a stratified sample was selectedconsisting of 20 males from male-headed households, 20females from male-headed households, and 20 females fromfemale-headed households. In the case of the migrants, everyfarmer in the community was interviewed because of thesmall size of their population. As migrant women do not havetheir own farming enterprises, only males were interviewed.In the second interview, the farmers were selected through awealth ranking exercise. Fifteen farmers were selected fromeach of three wealth categories for interviewing. In additionfocus group discussions were held with chiefs, communityleaders, family heads, and opinion leaders about land tenuresystems in Wenchi.
3. Results and Discussion
3.1. Land Tenure and Cropping Systems in Wenchi. Four maintypes of holders of land were identified in Wenchi. Thesewere as follows.
(1) The chief ’s holding known as the stool land or thetraditional land. This is the land the chief holds in trustfor the stool. These lands are managed by the “Abusahenes”(literally meaning share cropping chiefs) who are responsible
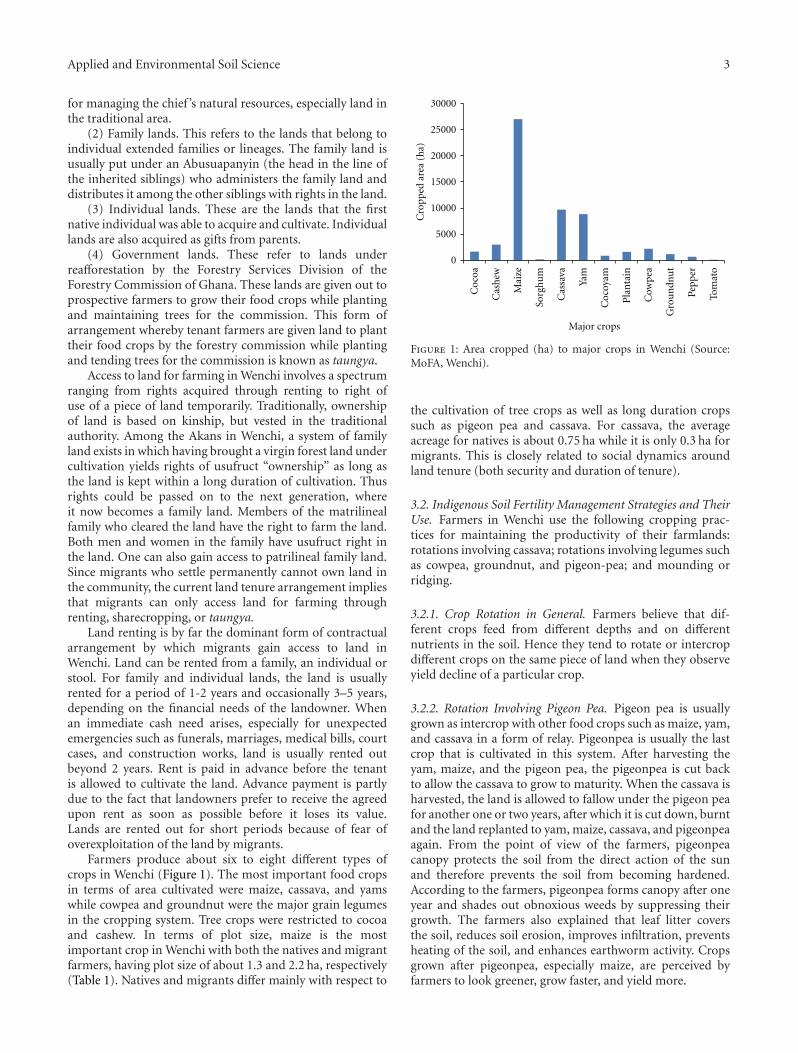
Applied and Environmental Soil Science 3
for managing the chief ’s natural resources, especially land inthe traditional area.
(2) Family lands. This refers to the lands that belong toindividual extended families or lineages. The family land isusually put under an Abusuapanyin (the head in the line ofthe inherited siblings) who administers the family land anddistributes it among the other siblings with rights in the land.
(3) Individual lands. These are the lands that the firstnative individual was able to acquire and cultivate. Individuallands are also acquired as gifts from parents.
(4) Government lands. These refer to lands underreafforestation by the Forestry Services Division of theForestry Commission of Ghana. These lands are given out toprospective farmers to grow their food crops while plantingand maintaining trees for the commission. This form ofarrangement whereby tenant farmers are given land to planttheir food crops by the forestry commission while plantingand tending trees for the commission is known as taungya.
Access to land for farming in Wenchi involves a spectrumranging from rights acquired through renting to right ofuse of a piece of land temporarily. Traditionally, ownershipof land is based on kinship, but vested in the traditionalauthority. Among the Akans in Wenchi, a system of familyland exists in which having brought a virgin forest land undercultivation yields rights of usufruct “ownership” as long asthe land is kept within a long duration of cultivation. Thusrights could be passed on to the next generation, whereit now becomes a family land. Members of the matrilinealfamily who cleared the land have the right to farm the land.Both men and women in the family have usufruct right inthe land. One can also gain access to patrilineal family land.Since migrants who settle permanently cannot own land inthe community, the current land tenure arrangement impliesthat migrants can only access land for farming throughrenting, sharecropping, or taungya.
Land renting is by far the dominant form of contractualarrangement by which migrants gain access to land inWenchi. Land can be rented from a family, an individual orstool. For family and individual lands, the land is usuallyrented for a period of 1-2 years and occasionally 3–5 years,depending on the financial needs of the landowner. Whenan immediate cash need arises, especially for unexpectedemergencies such as funerals, marriages, medical bills, courtcases, and construction works, land is usually rented outbeyond 2 years. Rent is paid in advance before the tenantis allowed to cultivate the land. Advance payment is partlydue to the fact that landowners prefer to receive the agreedupon rent as soon as possible before it loses its value.Lands are rented out for short periods because of fear ofoverexploitation of the land by migrants.
Farmers produce about six to eight different types ofcrops in Wenchi (Figure 1). The most important food cropsin terms of area cultivated were maize, cassava, and yamswhile cowpea and groundnut were the major grain legumesin the cropping system. Tree crops were restricted to cocoaand cashew. In terms of plot size, maize is the mostimportant crop in Wenchi with both the natives and migrantfarmers, having plot size of about 1.3 and 2.2 ha, respectively(Table 1). Natives and migrants differ mainly with respect to
30000
25000
20000
15000
10000
5000
0
Coc
oa
Cas
hew
Mai
ze
Sorg
hum
Cas
sava
Yam
Coc
oyam
Pla
nta
in
Cow
pea
Gro
un
dnu
t
Pepp
er
Tom
ato
Major crops
Cro
pped
are
a (h
a)
Figure 1: Area cropped (ha) to major crops in Wenchi (Source:MoFA, Wenchi).
the cultivation of tree crops as well as long duration cropssuch as pigeon pea and cassava. For cassava, the averageacreage for natives is about 0.75 ha while it is only 0.3 ha formigrants. This is closely related to social dynamics aroundland tenure (both security and duration of tenure).
3.2. Indigenous Soil Fertility Management Strategies and TheirUse. Farmers in Wenchi use the following cropping prac-tices for maintaining the productivity of their farmlands:rotations involving cassava; rotations involving legumes suchas cowpea, groundnut, and pigeon-pea; and mounding orridging.
3.2.1. Crop Rotation in General. Farmers believe that dif-ferent crops feed from different depths and on differentnutrients in the soil. Hence they tend to rotate or intercropdifferent crops on the same piece of land when they observeyield decline of a particular crop.
3.2.2. Rotation Involving Pigeon Pea. Pigeon pea is usuallygrown as intercrop with other food crops such as maize, yam,and cassava in a form of relay. Pigeonpea is usually the lastcrop that is cultivated in this system. After harvesting theyam, maize, and the pigeon pea, the pigeonpea is cut backto allow the cassava to grow to maturity. When the cassava isharvested, the land is allowed to fallow under the pigeon peafor another one or two years, after which it is cut down, burntand the land replanted to yam, maize, cassava, and pigeonpeaagain. From the point of view of the farmers, pigeonpeacanopy protects the soil from the direct action of the sunand therefore prevents the soil from becoming hardened.According to the farmers, pigeonpea forms canopy after oneyear and shades out obnoxious weeds by suppressing theirgrowth. The farmers also explained that leaf litter coversthe soil, reduces soil erosion, improves infiltration, preventsheating of the soil, and enhances earthworm activity. Cropsgrown after pigeonpea, especially maize, are perceived byfarmers to look greener, grow faster, and yield more.
4 Applied and Environmental Soil Science
Table 1: Mean acreage (ha) for selected crops in three communities in Wenchi District.
Community NRoot and tubers Cereals Legumes Tree crops
Cassava Yams Maize Sorghum Cowpea Pigeonpea Cocoa Cashew
Asuoano 37 0.76 0.68 1.70 0 0.28 0.10 0.40 0.10
Beposo 37 0.65 0.56 1.80 0 0.16 0.12 0.20 0.22
Konkomba∗ 30 0.20 0.44 1.60 0.1 0.20 0 0 0.03
Residential status
Native 58 0.75 0.60 1.3 0 0.21 0.10 0.33 0.2
Migrants 46 0.30 0.50 2.2 0.01 0.20 0 0 0.10∗
Predominantly migrant community. Source: Adjei-Nsiah (Unpublished).
3.2.3. Bush Fallows. In this case, when farmers observe adecline in fertility of their soils after cropping for three tofour successive years, they allow the land to lie fallow for 2-3years before they go back and crop the land again. Accordingto the farmers, fallowing the land for 2-3 years allows the landto regenerate its fertility. They mentioned that as the landis allowed to fallow, young trees begin to grow and shadethe soil so that the land is not exposed to the direct actionof the sun thereby keeping the soil moist all the time. Theyalso reason that during the fallow period the litter of thevegetation on the land fertilises the soil as it decomposes.
3.2.4. Rotation with Cowpea. Farmers rotate maize withcowpea, which has a growing period of about 60–70 days,because of its food value and marketability and to maintainthe fertility of their farmlands. According to the farmers,maize grown after cowpea grows faster and yields highereven if inorganic fertilizer is not applied to the maize. Theymentioned that the nodules formed on the roots contain“energy” which is released for the growth of the maize whenthey decompose. Farmers also attribute the yield increase inmaize after cowpea, to an increase in fertility of the soil as aresult of the decomposition of the cowpea foliage that is lefton the land after harvest. However, they remarked that if theland is not immediately used for cropping after harvestingthe cowpea the fertility of the land is lost since cowpea foliagedecomposes rapidly.
3.2.5. Construction of Ridges and Mounds. Farmers constructridges or mounds on less fertile plots on fallowed land. Ongrasslands, farmers either plough the land and/or constructmounds or ridges. Farmers construct mounds or ridgesor plough their land for two reasons: firstly, to controlproblematic weeds that invade the land as a result of declinein fertility, and, secondly, to improve the productivity of thesoil. As they construct the ridges or mounds, the weeds andleaves on the land mix with the soil and fertilize the soil asthey decompose. Farmers reason that the decomposed weedsand leaves when mixed with the soil improve the fertility ofthe soil and increase the yield of maize planted. According tothe farmers, the construction of the mounds and ridges alsoloosens the soil, which becomes compact after continuouscropping. This allows water to percolate into the soil whenit rains.
Table 2: Percentage of native and migrant farmers at Asuoano in2002 practising various soil fertility management strategies.
Strategy (%)Native farmers Migrant farmers
N = 22 N = 16
Cassava cropping 82 44
Bush fallow 77 19
Pigeonpea 59 6
Rotation withcowpea/groundnut
18 50
Mounding/ridging 14 100
Source: [6].
3.2.6. Rotation Involving Cassava. Farmers often crop a pieceof land for a period ranging from three to four years to maizeand cowpea and when they observe decline in the fertility ofthe soil, they crop the land to cassava for 18–24 months afterwhich they resume their maize/cowpea rotation. The farmersattribute the role of cassava in soil fertility regeneration to itsability to protect the soil from soil erosion through its canopyand its high leaf litter production, which also shades off thesoil from the direct action of the sun and thus increases theactivities of soil micro- and macroorganisms. The farmersattribute these beneficial roles of cassava to the fact that thevarieties of cassava that the farmers grow are the spreadingtypes that form a closed canopy and completely shade offthe soil within few months after planting. The use of cassavafor soil fertility regeneration is not only peculiar to Wenchi.Reference [7] also reported on the extensive use of cassava forsoil fertility regeneration in some parts of Benin.
While the natives widely apply bush fallowing, androtation involving long duration crops such as cassava andpigeonpea for maintaining the fertility of their farmlands,migrants who do not own land in the communities butdepend largely on sharecropping and land renting for gainingaccess to land for farming use short-term rotational strategiessuch as rotations involving short duration crops such ascowpea and groundnuts (Table 2).
3.3. Farmers’ Agronomic and Social Evaluation of Soil FertilityManagement Strategies. Table 3 shows the effect of croppingsequence and N rate on maize grain yield and weed biomassassociated with the maize crop 8 weeks after planting
Applied and Environmental Soil Science 5
Table 3: Effect of crop sequence and N rate on (a) maize grain and(b) weed biomass associated with the maize crop at 8 weeks afterplanting on researcher-managed plots.
Crop sequenceN rate (Kg ha−1)
MeanO 60
(a)
Speargrass fallow 1050 2848 1949
Cassava 3002 2738 2870
Pigeonpea 2422 2328 2697
Cowpea-maize-cowpea 1670 2128 1999
Mucuna-maize-Mucuna 2970 4195 3582
Maize-maize-maize 1380 2972 1754
Mean 2082 2868
SED: crop sequence (CS) = 318.4; N Rate (NR) = 115.3;CS × NR = 375.8P < F : CS = 0.001; NR = 0.001;CS × NR = 0.01
(b)
Speargrass fallow 585 790 686
Cassava 270 300 285
Pigeonpea 390 500 445
Cowpea-maize-cowpea 325 395 360
Mucuna-maize-mucuna 300 345 323
Maize-maize-maize 240 430 335
Mean 351 460
SED: Crop sequence (CS) = 65.9; N Rate (NR) = 52.4;CS ×NR = 112.1P < F : CS = 0.001; NR = 0.05;CS × NR = NS
Source: [14].
[14]. According to these data, yields of maize ranged from1.0 t ha−1 with spear grass fallow to 3.0 t ha−1 with plotspreviously under cassava when mineral fertilizer was notapplied to the maize and on the fertilized plots yields rangedfrom 2.1 t ha−1 with the continuous maize plot to 4.2 t ha−1
with plots previously under mucuna/maize rotation. Thecropping sequences did not have significant effects on soilchemical properties. Lower weed biomass was also associatedwith the maize crop grown on plots previously under cassavacropping. Weed biomass after cassava in the unfertilized plotswas roughly half that found after the speargrass fallow andfurther reduced to a third of that found after speargrassfallow when cassava was followed by maize with fertilizer.
The beneficial effects of cassava on maize grain yieldwere mainly due to the relatively high amount of recycledN returned to the soil through the leaf litter and greenleafy biomass of cassava which was ploughed back into thesoil just before the maize test crop was planted. Accordingto criteria set by [15], cassava litterfall is an importantsource of easily mineralisable N due to its high N (2.5%)and low lignin content, resulting in high decompositionrates [16]. While it is true that the major beneficial effectof cassava on subsequent maize crop was due to the highN cycling properties of cassava litter and the green leafybiomass which was returned into the soil just before themaize test crop was planted, we cannot exclude the potential
role of mycorrizal associations as suggested by the verylarge initial effect of cassava on maize dry matter yield at 3weeks after planting [14]. Beneficial effects of higher mycor-rizal inoculums at the start of the crop season have repeatedlybeen reported for maize [17]. Unfortunately, mycorrizal as-sociations were not studied. Other possible effects may in-clude reduction in weed incidence as a result of the suppres-sion of weeds by the cassava canopy. In agricultural systems,shade suppresses weeds growing on the site and interruptscontinuous reseeding of the field [18] Cassava/maize rotationresulted in the highest return on investment both when Nfertilizer was applied to the maize crop or not for the 2-yearperiod (Table 4). This was due to low input use and labourrequirement of cassava as well as the high cassava root yieldobtained in this study which was around 31 t ha−1 which wasfar above the current national average of 14 t ha−1 [1].
While both native male and female farmers prefer cas-sava/maize rotation, migrant farmers prefer rotation involv-ing cowpea (Table 5). Migrant farmers cite market andtenure insecurity as reasons for preferring cowpea/maizeto cassava/maize rotation and this is reflected in the totalfarmland allocated to cassava by migrant farmers comparedto native farmers (Table 1). Among the migrants, ethnicity,history, and context of migration as well as quality ofrelationships with the native community also played a majorrole in soil fertility management [19]. Migrants who hadstayed in Wenchi for a longer period and considered theirstay in Wenchi as permanent had managed to build long-standing relationship with the natives and had relativelysecured and long-duration access to land and tended to userotation involving cassava for maintaining soil fertility. Therewas one group of migrants who tended to look at theirstay in Wenchi as temporal which had implication for soilfertility management. This group of migrants, although didnot own land, tended to have large farms and seemed tosucceed in accumulating wealth on the basis of soil mining.Native farmers, particularly women, on the other hand prefercassava/maize rotation to cowpea/maize rotation due to theflexibility in the labour requirement and minimal use ofexternal input in the cultivation of cassava as well as the roleof cassava in food security [9, 19].
3.4. Implication of Large Scale Cassava Cultivation for SystemSustainability. In farming systems with minimal applicationof external inputs, management of organic resources playsa major role in maintaining both nutrient availability andsoil organic matter [15]. In a cereal-based farming system asthat found in the forest/savanna transitional agroecologicalzone of Ghana, where external input use is minimal, mostrecycling of N and P occurs through cassava litterfall andgreen leafy biomass of cassava incorporated into the soilafter cassava harvest [16, 20]. Cassava litterfall and greenleafy biomass of cassava are important sources of easilymineralizable N due to their high nitrogen (2.5 and 3.5%for litterfall and green leafy biomass resp.) leading to highdecomposition rates [14]. Maize roots may also benefit fromcassava association with mycorrizal [17]. Thus, rotationinvolving cassava, within smallholder agriculture, has the
6 Applied and Environmental Soil Science
Table 4: Estimated costs of production, gross revenue and returns on investment of (a) various crop sequences (b) maize grown after thesequences with N application to the maize and (c) maize grown after the sequences without N application to the maize.
Crop sequenceEconomic yield Total revenue Cost of production (US$) Total Net Return on
(kg ha−1) (US$) Land Input Labour cost revenue investment
(a) Crops in the sequence1Cassava 31,000 2545.1 41.7 41.7 635.0 718.4 1826.7 2542Pigeonpea 1,870 623.3 41.7 8.3 221.5 271.5 351.8 1303Mucuna-maize-mucuna 2,016 365.1 41.7 41.7 247.4 330.8 34.3 104Cowpea-maize-cowpea 2,536 ∗(1,230) 1079.0 41.7 106,1 475.1 622.9 456.1 735Maize-maize-maize 3,287 595.2 41.7 36.1 386.1 463.8 456.1 286Speargrass fallow 0 0 41.7 0 0 41.7 −41.7 −100
(b) Maize after crop sequence with Napplication
CS 1 2,738 495.9 13.9 104.2 190.2 308.3 187.6 61
CS 2 2,974 538.5 13.9 104.2 196.5 314.6 223.9 71
CS 3 4,194 759.4 13.9 104.2 245.9 364.0 395.4 108
CS 4 2,331 422.1 13.9 104.2 177.0 295.1 127.0 43
CS 5 2,126 385.0 13.9 104.2 175.4 293.5 91.4 31
CS 6 2,848 515.7 13.9 104.2 224.4 342.5 173.3 51
(c) Maize after crop sequence without Napplication
CS 1 3,000 543.2 13.9 13.9 175.6 203.4 339.8 167
CS 2 2,423 438.8 13.9 13.9 165.5 193.3 245.5 127
CS 3 2,961 537.7 13.9 13.9 209.7 237.5 300.2 126
CS 4 1,772 302.8 13.9 13.9 155.2 183.0 119.8 66
CS 5 1,380 249.9 13.9 13.9 153.0 180.7 69.1 38
CS 6 1,048 189.8 13.9 13.9 173.7 200.9 −11.1 −61US$ 82.1 t−1.
2US$ 333.3 t−1.3US$ 337.5 t−1 for cowpea and US$181.1 t−1 for maize.∗Yield of maize.CS 1: cassava; CS 2: pigeonpea; CS 3: Mucuna-maize-Mucuna; CS 4: cowpea-maize-cowpea; CS 5: maize-maize-maize; CS 6: speargrass fallow (source: [14]).
potential of maintaining a reasonable supply of N and P tocereal crops, particularly maize considering the minimal useof external inputs in a maize-based farming system.
Although nutrient recycling is expected to be improvedthrough incorporation of litterfall and harvested cropresidues into the soil, it is likely that promoting cassava asan industrial crop may accelerate the depletion of nutrientstocks, particularly potassium through root harvest. Thus onthe long term, K may become the most limiting nutrientespecially on soils with K values as low as 0.2 cmol K kg−1 asthose found in Wenchi [10, 14]. Increasing K input throughmineral fertilizer application is difficult as potassium fertiliz-ers are not readily available in rural markets, and smallholderfarmers hardly apply fertilizers to cassava. Long-term Kbalances are therefore needed to address this issue. However,K removal may be reduced by half if the cassava stems are notremoved from the field for planting [21].
In a place like Wenchi, where the population of thefarming community is very heterogeneous, if we want tocontribute to better conditions for farming system sustain-ability through large scale integration of cassava in thefarming system, efforts must be oriented to design a range
of social arrangements that will meet the specific needsand circumstances of different categories of people. Oneof such social arrangements is to invest in negotiation ofand experimentation with new kinds of contractual and/orland tenure arrangements, involving also supporting controland sanctioning systems. There is also the need to worktowards new institutional arrangements that may contributeto reduction of uncertainties and conflicts around landtenure. Possibility in this respect may include (a) contractualprovisions for renting that create a link between the levelof rent and the level of revenue obtained, (b) clear andagreed-upon rules as to who can contract out what landand who should be involved as witness, (c) increasedinvolvement of local authorities in validating contracts, and(d) strengthening customary institutions to manage land-related conflicts at the local level.
4. Conclusion
The study shows the importance of cassava in the predomi-nantly maize-based farming system of Wenchi, Ghana. Our
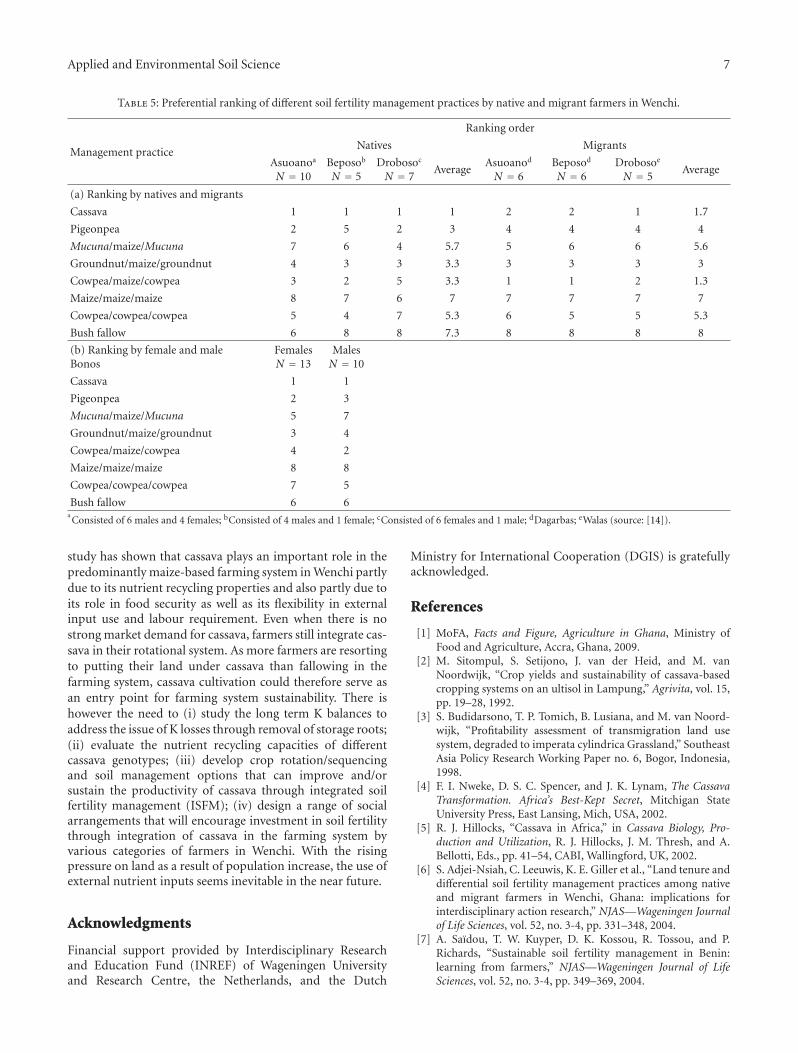
Applied and Environmental Soil Science 7
Table 5: Preferential ranking of different soil fertility management practices by native and migrant farmers in Wenchi.
Management practice
Ranking order
Natives Migrants
Asuoanoa
N = 10Beposob
N = 5Drobosoc
N = 7Average
Asuoanod
N = 6Beposod
N = 6Drobosoe
N = 5Average
(a) Ranking by natives and migrants
Cassava 1 1 1 1 2 2 1 1.7
Pigeonpea 2 5 2 3 4 4 4 4
Mucuna/maize/Mucuna 7 6 4 5.7 5 6 6 5.6
Groundnut/maize/groundnut 4 3 3 3.3 3 3 3 3
Cowpea/maize/cowpea 3 2 5 3.3 1 1 2 1.3
Maize/maize/maize 8 7 6 7 7 7 7 7
Cowpea/cowpea/cowpea 5 4 7 5.3 6 5 5 5.3
Bush fallow 6 8 8 7.3 8 8 8 8
(b) Ranking by female and maleBonos
FemalesN = 13
MalesN = 10
Cassava 1 1
Pigeonpea 2 3
Mucuna/maize/Mucuna 5 7
Groundnut/maize/groundnut 3 4
Cowpea/maize/cowpea 4 2
Maize/maize/maize 8 8
Cowpea/cowpea/cowpea 7 5
Bush fallow 6 6aConsisted of 6 males and 4 females; bConsisted of 4 males and 1 female; cConsisted of 6 females and 1 male; dDagarbas; eWalas (source: [14]).
study has shown that cassava plays an important role in thepredominantly maize-based farming system in Wenchi partlydue to its nutrient recycling properties and also partly due toits role in food security as well as its flexibility in externalinput use and labour requirement. Even when there is nostrong market demand for cassava, farmers still integrate cas-sava in their rotational system. As more farmers are resortingto putting their land under cassava than fallowing in thefarming system, cassava cultivation could therefore serve asan entry point for farming system sustainability. There ishowever the need to (i) study the long term K balances toaddress the issue of K losses through removal of storage roots;(ii) evaluate the nutrient recycling capacities of differentcassava genotypes; (iii) develop crop rotation/sequencingand soil management options that can improve and/orsustain the productivity of cassava through integrated soilfertility management (ISFM); (iv) design a range of socialarrangements that will encourage investment in soil fertilitythrough integration of cassava in the farming system byvarious categories of farmers in Wenchi. With the risingpressure on land as a result of population increase, the use ofexternal nutrient inputs seems inevitable in the near future.
Acknowledgments
Financial support provided by Interdisciplinary Researchand Education Fund (INREF) of Wageningen Universityand Research Centre, the Netherlands, and the Dutch
Ministry for International Cooperation (DGIS) is gratefullyacknowledged.
References
[1] MoFA, Facts and Figure, Agriculture in Ghana, Ministry ofFood and Agriculture, Accra, Ghana, 2009.
[2] M. Sitompul, S. Setijono, J. van der Heid, and M. vanNoordwijk, “Crop yields and sustainability of cassava-basedcropping systems on an ultisol in Lampung,” Agrivita, vol. 15,pp. 19–28, 1992.
[3] S. Budidarsono, T. P. Tomich, B. Lusiana, and M. van Noord-wijk, “Profitability assessment of transmigration land usesystem, degraded to imperata cylindrica Grassland,” SoutheastAsia Policy Research Working Paper no. 6, Bogor, Indonesia,1998.
[4] F. I. Nweke, D. S. C. Spencer, and J. K. Lynam, The CassavaTransformation. Africa’s Best-Kept Secret, Mitchigan StateUniversity Press, East Lansing, Mich, USA, 2002.
[5] R. J. Hillocks, “Cassava in Africa,” in Cassava Biology, Pro-duction and Utilization, R. J. Hillocks, J. M. Thresh, and A.Bellotti, Eds., pp. 41–54, CABI, Wallingford, UK, 2002.
[6] S. Adjei-Nsiah, C. Leeuwis, K. E. Giller et al., “Land tenure anddifferential soil fertility management practices among nativeand migrant farmers in Wenchi, Ghana: implications forinterdisciplinary action research,” NJAS—Wageningen Journalof Life Sciences, vol. 52, no. 3-4, pp. 331–348, 2004.
[7] A. Saıdou, T. W. Kuyper, D. K. Kossou, R. Tossou, and P.Richards, “Sustainable soil fertility management in Benin:learning from farmers,” NJAS—Wageningen Journal of LifeSciences, vol. 52, no. 3-4, pp. 349–369, 2004.
8 Applied and Environmental Soil Science
[8] A. G. O. Dixon, J. M. Ngeve, and E. N. Nukenine, “Genotypex environment effects on severity of cassava bacterial blightdisease caused by Xanthomonas axonopodis pv. manihotis,”European Journal of Plant Pathology, vol. 108, no. 8, pp. 763–770, 2002.
[9] S. Berry, No Condition is Permanent: The Sociological Dynamicsof Agrarian Change in Sub-Saharan Africa, The University ofWisconsin Press, Madison, Wis, USA, 1993.
[10] R. H. Howeler, “Cassava mineral nutrition and fertilization,”in Cassava Biology, Production and Utilization, R. J. Hillocks,J. M. Thresh, and A. Bellotti, Eds., pp. 115–147, CABI,Wallingford, UK, 2002.
[11] R. D. Asiamah, T. Adjei-Gyapong, E. Yeboah, J. E. Fening, E. O.Ampontua, and E. Gaisie, “Report on soil characterization andevaluation at four primary multiplication sites (Mampong,Wenchi, Asuansi and Kpeve) in Ghana,” Tech. Rep. 200, SoilResearch Institute, Kumasi, Ghana, 2000.
[12] P. Richards, TechnographicStudies, “Paper presented at theInitiation Workshop on ‘Convergence of Sciences’ Project,”February 2001, Accra, Ghana.
[13] S. K. Offei, S. K., and O. Sakyi-Dawson, Technographicstudies on cowpea as a private sector crop in Ghana, “Reportpresented at an International Workshop on the ‘Convergenceof Sciences’ project,” March 2002, Cotonou, Benin http://www.dpw.wageningen-ur.nl/forum.
[14] S. Adjei-Nsiah, T. W. Kuyper, C. Leeuwis, M. K. Abekoe, andK. E. Giller, “Evaluating sustainable and profitable croppingsequences with cassava and four legume crops: effects on soilfertility and maize yields in the forest/savannah transitionalagro-ecological zone of Ghana,” Field Crops Research, vol. 103,no. 2, pp. 87–97, 2007.
[15] C. A. Palm, K. E. Giller, P. L. Mafongoya, and M. J. Swift,“Management of organic matter in the tropics: translatingtheory into practice,” Nutrient Cycling in Agroecosystems, vol.61, no. 1-2, pp. 63–75, 2001.
[16] S. Adjei-Nsiah, Cropping systems, land tenure and socialdiversity in Wenchi, Ghana: implication for soil fertility manage-ment, Ph.D. thesis, Wageningen University, Wageningen, TheNetherlands, 2006.
[17] A. O. Osunde, A. Bala, M. S. Gwam, P. A. Tsado, N. Sanginga,and J. A. Okogun, “Residual benefits of promiscuous soybeanto maize (Zea mays L.) grown on farmers’ fields around Minnain the southern Guinea savanna zone of Nigeria,” Agriculture,Ecosystems and Environment, vol. 100, no. 2-3, pp. 209–220,2003.
[18] A. de Rouw, “The fallow period as a weed-break in shiftingcultivation (tropical wet forests),” Agriculture, Ecosystems andEnvironment, vol. 54, no. 1-2, pp. 31–43, 1995.
[19] S. Adjei-Nsiah, C. Leeuwis, O. Sakyi-Dawson, K. E. Giller, K.E., and T. W. Kuyper, “Exploring diversity among farmers fororienting inter-disciplinary action research on cropping sys-tem management in Wenchi, Ghana: the significance of timehorizons,” International Journal of Agricultural Sustainability,vol. 5, pp. 176–194, 2007.
[20] A. M. Fermont, Cassava and soil fertility in intensifying small-holder farming systems of East Africa, Ph.D. thesis, WageningenUniversity, Wageningen, The Netherlands, 2009.
[21] S. Adjei-Nsiah, “Yield and nitrogen accumulation in fivecassava varieties and their subsequent effects on soil chemicalproperties in the forest/savanna transitional agro-ecologicalzone of Ghana,” Journal of Soil Science and EnvironmentalManagement, vol. 1, pp. 15–20, 2010.
Hindawi Publishing CorporationApplied and Environmental Soil ScienceVolume 2012, Article ID 870948, 5 pagesdoi:10.1155/2012/870948
Research Article
Response of Maize (Zea mays L.) to Different Rates ofPalm Bunch Ash Application in the Semi-deciduous ForestAgro-ecological Zone of Ghana
S. Adjei-Nsiah
Forest and Horticultural Crops Research Centre, Institute of Agricultural Research, College of Agriculture and Consumer Sciences,University of Ghana, P.O. Box 68, Legon, Ghana
Correspondence should be addressed to S. Adjei-Nsiah, y [email protected]
Received 15 November 2011; Accepted 2 January 2012
Academic Editor: Rosario Garcıa Moreno
Copyright © 2012 S. Adjei-Nsiah. This is an open access article distributed under the Creative Commons Attribution License,which permits unrestricted use, distribution, and reproduction in any medium, provided the original work is properly cited.
The effects of palm bunch ash (PBA) and mineral fertilizer application on grain yield and nutrient uptake in maize and soilchemical properties were studied in both the major and minor rainy seasons in the semi-deciduous forest agro-ecological zoneof Ghana. In both the major and minor rainy seasons, the response of maize to four levels (0, 2, 4, and 6 tons per hectare) ofpalm bunch ash and 200 kg per hectare of NPK (15-15-15) application was evaluated using randomised complete block design.Results of the study showed that application of palm bunch ash significantly (P < 0.05) increased soil pH, soil phosphorus, andexchangeable cations. Maize grain yield varied significantly (P < 0.05) among the different treatments in both the major and minorrainy seasons. The highest maize grain yield of 4530 and 6120 kg ha−1 was obtained at PBA application rate of 2 tons ha−1 for themajor and minor rainy seasons, respectively.
1. Introduction
Empty fruit bunch (EFB) is one of the major waste productsgenerated from processing fresh fruit bunch (FFB) in palmfruit processing mills. About 22% of FFB processed intooil end up as EFB [1]. Currently, Ghana produces about1,900,000 metric tons of FFB annually [2] which, whenprocessed into oil, generate 418,000 MT of EFB annually.In the large industrial estates, EFB is either incinerated inthe mills as a means of getting rid of these wastes’ as wellas, providing energy for the boilers in FFB sterilization.However, the small-scale mills which process about 60% ofthe total FFB produced in the country [3] burn the EFB as ameans of disposing them, resulting in heaps of ash dottedaround small-scale mills in the major oil palm producingareas in Ghana. There is currently no large-scale use forpalm bunch ash in Ghana, although it could be used for themanufacture of local soap due to its high potassium content.The palm bunch ash (PBA) produced by burning EFB, whichconstitutes about 6.5% by weight of the EFB, contains 30–40% K2O [1] and could thus be used as source of potassium
fertilizer. Most soils in the forest part of southern Ghanawhere oil palm is cultivated are acidic due to the natureof the parent material, high rainfall regime, intensity, andassociated leaching of nutrients which requires sustainableliming. Preliminary analysis of bunch ash of different agesfrom processing mills in Kade (unpublished results) indicatesthat besides K, palm bunch ash has high pH and containsvarying amounts of other nutrients such as calcium (Ca),phosphorus (P), and magnesium (Mg). These propertiesof palm bunch ash make it suitable as a liming materialand fertilizer supplement. Studies [4–6] have shown thatapplication of wood ash significantly increased the effectivecation exchange capacity and base saturation and decreasedthe concentration of exchangeable aluminium in the soil.In southern Nigeria, [7] and [8] found palm bunch ash asan effective fertilizer and liming material for increasing soilfertility, pH, and nutrient uptake by crops such as maize andcassava.
In Ghana, mineral fertilizers are rarely used by small-holder farmers due to prohibitive cost as a result of priva-tization and removal of government subsidies [9]. In recent
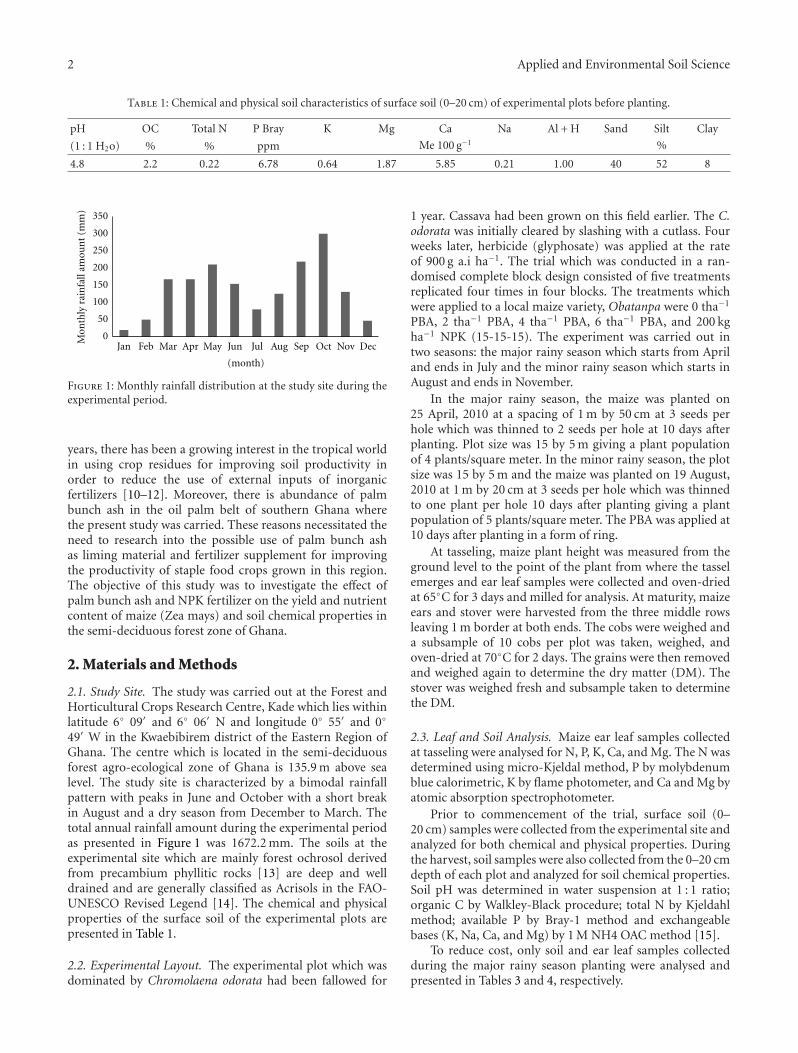
2 Applied and Environmental Soil Science
Table 1: Chemical and physical soil characteristics of surface soil (0–20 cm) of experimental plots before planting.
pH OC Total N P Bray K Mg Ca Na Al + H Sand Silt Clay
(1 : 1 H2o) % % ppm Me 100 g−1 %
4.8 2.2 0.22 6.78 0.64 1.87 5.85 0.21 1.00 40 52 8
0
50
100
150
200
250
300
350
Jan Feb Mar Apr May Jun Jul Aug Sep Oct Nov Dec
Mon
thly
rai
nfa
ll am
oun
t (m
m)
(month)
Figure 1: Monthly rainfall distribution at the study site during theexperimental period.
years, there has been a growing interest in the tropical worldin using crop residues for improving soil productivity inorder to reduce the use of external inputs of inorganicfertilizers [10–12]. Moreover, there is abundance of palmbunch ash in the oil palm belt of southern Ghana wherethe present study was carried. These reasons necessitated theneed to research into the possible use of palm bunch ashas liming material and fertilizer supplement for improvingthe productivity of staple food crops grown in this region.The objective of this study was to investigate the effect ofpalm bunch ash and NPK fertilizer on the yield and nutrientcontent of maize (Zea mays) and soil chemical properties inthe semi-deciduous forest zone of Ghana.
2. Materials and Methods
2.1. Study Site. The study was carried out at the Forest andHorticultural Crops Research Centre, Kade which lies withinlatitude 6◦ 09′ and 6◦ 06′ N and longitude 0◦ 55′ and 0◦
49′ W in the Kwaebibirem district of the Eastern Region ofGhana. The centre which is located in the semi-deciduousforest agro-ecological zone of Ghana is 135.9 m above sealevel. The study site is characterized by a bimodal rainfallpattern with peaks in June and October with a short breakin August and a dry season from December to March. Thetotal annual rainfall amount during the experimental periodas presented in Figure 1 was 1672.2 mm. The soils at theexperimental site which are mainly forest ochrosol derivedfrom precambium phyllitic rocks [13] are deep and welldrained and are generally classified as Acrisols in the FAO-UNESCO Revised Legend [14]. The chemical and physicalproperties of the surface soil of the experimental plots arepresented in Table 1.
2.2. Experimental Layout. The experimental plot which wasdominated by Chromolaena odorata had been fallowed for
1 year. Cassava had been grown on this field earlier. The C.odorata was initially cleared by slashing with a cutlass. Fourweeks later, herbicide (glyphosate) was applied at the rateof 900 g a.i ha−1. The trial which was conducted in a ran-domised complete block design consisted of five treatmentsreplicated four times in four blocks. The treatments whichwere applied to a local maize variety, Obatanpa were 0 tha−1
PBA, 2 tha−1 PBA, 4 tha−1 PBA, 6 tha−1 PBA, and 200 kgha−1 NPK (15-15-15). The experiment was carried out intwo seasons: the major rainy season which starts from Apriland ends in July and the minor rainy season which starts inAugust and ends in November.
In the major rainy season, the maize was planted on25 April, 2010 at a spacing of 1 m by 50 cm at 3 seeds perhole which was thinned to 2 seeds per hole at 10 days afterplanting. Plot size was 15 by 5 m giving a plant populationof 4 plants/square meter. In the minor rainy season, the plotsize was 15 by 5 m and the maize was planted on 19 August,2010 at 1 m by 20 cm at 3 seeds per hole which was thinnedto one plant per hole 10 days after planting giving a plantpopulation of 5 plants/square meter. The PBA was applied at10 days after planting in a form of ring.
At tasseling, maize plant height was measured from theground level to the point of the plant from where the tasselemerges and ear leaf samples were collected and oven-driedat 65◦C for 3 days and milled for analysis. At maturity, maizeears and stover were harvested from the three middle rowsleaving 1 m border at both ends. The cobs were weighed anda subsample of 10 cobs per plot was taken, weighed, andoven-dried at 70◦C for 2 days. The grains were then removedand weighed again to determine the dry matter (DM). Thestover was weighed fresh and subsample taken to determinethe DM.
2.3. Leaf and Soil Analysis. Maize ear leaf samples collectedat tasseling were analysed for N, P, K, Ca, and Mg. The N wasdetermined using micro-Kjeldal method, P by molybdenumblue calorimetric, K by flame photometer, and Ca and Mg byatomic absorption spectrophotometer.
Prior to commencement of the trial, surface soil (0–20 cm) samples were collected from the experimental site andanalyzed for both chemical and physical properties. Duringthe harvest, soil samples were also collected from the 0–20 cmdepth of each plot and analyzed for soil chemical properties.Soil pH was determined in water suspension at 1 : 1 ratio;organic C by Walkley-Black procedure; total N by Kjeldahlmethod; available P by Bray-1 method and exchangeablebases (K, Na, Ca, and Mg) by 1 M NH4 OAC method [15].
To reduce cost, only soil and ear leaf samples collectedduring the major rainy season planting were analysed andpresented in Tables 3 and 4, respectively.
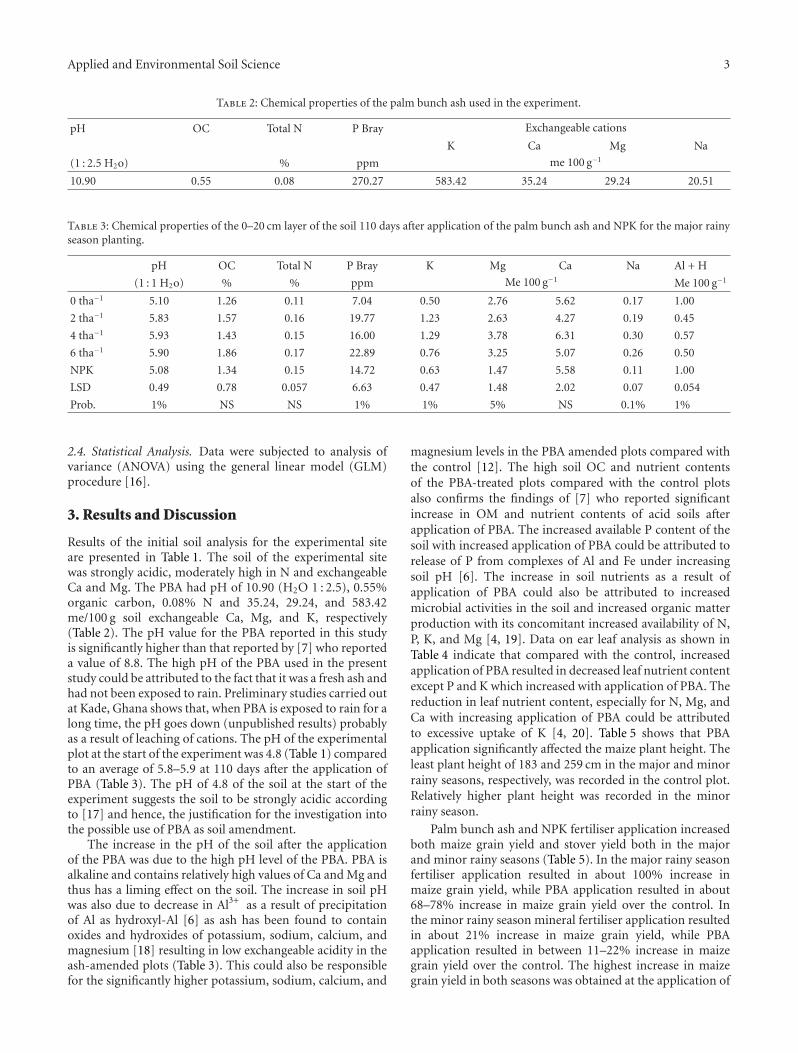
Applied and Environmental Soil Science 3
Table 2: Chemical properties of the palm bunch ash used in the experiment.
pH OC Total N P Bray Exchangeable cations
K Ca Mg Na
(1 : 2.5 H2o) % ppm me 100 g−1
10.90 0.55 0.08 270.27 583.42 35.24 29.24 20.51
Table 3: Chemical properties of the 0–20 cm layer of the soil 110 days after application of the palm bunch ash and NPK for the major rainyseason planting.
pH OC Total N P Bray K Mg Ca Na Al + H
(1 : 1 H2o) % % ppm Me 100 g−1 Me 100 g−1
0 tha−1 5.10 1.26 0.11 7.04 0.50 2.76 5.62 0.17 1.00
2 tha−1 5.83 1.57 0.16 19.77 1.23 2.63 4.27 0.19 0.45
4 tha−1 5.93 1.43 0.15 16.00 1.29 3.78 6.31 0.30 0.57
6 tha−1 5.90 1.86 0.17 22.89 0.76 3.25 5.07 0.26 0.50
NPK 5.08 1.34 0.15 14.72 0.63 1.47 5.58 0.11 1.00
LSD 0.49 0.78 0.057 6.63 0.47 1.48 2.02 0.07 0.054
Prob. 1% NS NS 1% 1% 5% NS 0.1% 1%
2.4. Statistical Analysis. Data were subjected to analysis ofvariance (ANOVA) using the general linear model (GLM)procedure [16].
3. Results and Discussion
Results of the initial soil analysis for the experimental siteare presented in Table 1. The soil of the experimental sitewas strongly acidic, moderately high in N and exchangeableCa and Mg. The PBA had pH of 10.90 (H2O 1 : 2.5), 0.55%organic carbon, 0.08% N and 35.24, 29.24, and 583.42me/100 g soil exchangeable Ca, Mg, and K, respectively(Table 2). The pH value for the PBA reported in this studyis significantly higher than that reported by [7] who reporteda value of 8.8. The high pH of the PBA used in the presentstudy could be attributed to the fact that it was a fresh ash andhad not been exposed to rain. Preliminary studies carried outat Kade, Ghana shows that, when PBA is exposed to rain for along time, the pH goes down (unpublished results) probablyas a result of leaching of cations. The pH of the experimentalplot at the start of the experiment was 4.8 (Table 1) comparedto an average of 5.8–5.9 at 110 days after the application ofPBA (Table 3). The pH of 4.8 of the soil at the start of theexperiment suggests the soil to be strongly acidic accordingto [17] and hence, the justification for the investigation intothe possible use of PBA as soil amendment.
The increase in the pH of the soil after the applicationof the PBA was due to the high pH level of the PBA. PBA isalkaline and contains relatively high values of Ca and Mg andthus has a liming effect on the soil. The increase in soil pHwas also due to decrease in Al3+ as a result of precipitationof Al as hydroxyl-Al [6] as ash has been found to containoxides and hydroxides of potassium, sodium, calcium, andmagnesium [18] resulting in low exchangeable acidity in theash-amended plots (Table 3). This could also be responsiblefor the significantly higher potassium, sodium, calcium, and
magnesium levels in the PBA amended plots compared withthe control [12]. The high soil OC and nutrient contentsof the PBA-treated plots compared with the control plotsalso confirms the findings of [7] who reported significantincrease in OM and nutrient contents of acid soils afterapplication of PBA. The increased available P content of thesoil with increased application of PBA could be attributed torelease of P from complexes of Al and Fe under increasingsoil pH [6]. The increase in soil nutrients as a result ofapplication of PBA could also be attributed to increasedmicrobial activities in the soil and increased organic matterproduction with its concomitant increased availability of N,P, K, and Mg [4, 19]. Data on ear leaf analysis as shown inTable 4 indicate that compared with the control, increasedapplication of PBA resulted in decreased leaf nutrient contentexcept P and K which increased with application of PBA. Thereduction in leaf nutrient content, especially for N, Mg, andCa with increasing application of PBA could be attributedto excessive uptake of K [4, 20]. Table 5 shows that PBAapplication significantly affected the maize plant height. Theleast plant height of 183 and 259 cm in the major and minorrainy seasons, respectively, was recorded in the control plot.Relatively higher plant height was recorded in the minorrainy season.
Palm bunch ash and NPK fertiliser application increasedboth maize grain yield and stover yield both in the majorand minor rainy seasons (Table 5). In the major rainy seasonfertiliser application resulted in about 100% increase inmaize grain yield, while PBA application resulted in about68–78% increase in maize grain yield over the control. Inthe minor rainy season mineral fertiliser application resultedin about 21% increase in maize grain yield, while PBAapplication resulted in between 11–22% increase in maizegrain yield over the control. The highest increase in maizegrain yield in both seasons was obtained at the application of
4 Applied and Environmental Soil Science
Table 4: Effect of palm bunch ash and NPK fertilizer on maize ear leaf nutrient composition for the major rainy season planting.
TreatmentN P K Mg Ca
%
0 tha−1 PBA 2.66 0.25 0.87 0.19 0.36
2 tha−1 PBA 2.61 0.33 1.00 0.16 0.26
4 tha−1 PBA 2.59 0.33 1.00 0.15 0.26
6 tha−1 PBA 2.56 0.37 0.98 0.15 0.23
NPK 2.72 0.32 0.96 0.19 0.38
LSD 0.12 0.05 0.18 0.04 0.06
Prob. NS 1% NS 5% 0.1%
NS: not significant.
Table 5: Effect of PBA and NPK fertilizer on growth and yield of maize for the major and minor rainy season plantings.
TreatmentPlant height (cm) Maiza grain yield at 12% moisture content (tha−1) Maiza stover DM (tha−1)
Major season Minor season Major season Minor season Major season Minor season
0 tha−1 PBA 183 259 2550 5030 1990 2975
2 tha−1 PBA 221 293 4530 6120 3720 4485
4 tha−1 PBA 213 291 4480 5830 3470 3825
6 tha−1 PBA 232 291 4290 5583 3700 3575
NPK 234 284 5120 6060 4430 4743
LSD 21.0 15.0 1140 763 670 1076
Prob. 0.1% 1% 1% 5% 0.1% 5%
2 tons ha−1 PBA. The increase in maize grain yield and rootyield of cassava with PBA or Wood ash has been reported byseveral workers [6, 7, 12, 19–21] who attributed it to increasein soil nutrient content and uptake of nutrients by maize aswell as higher organic matter in the ash.
4. Conclusions
The results of this study suggest that pH of acid soils can becorrected and leached nutrients replaced by recycling of palmbunch ash. Application of PBA contributes to improvementin soil chemical properties of acid soils by raising soil pH andthe level of macronutrients such as N, P, K, Ca, and Mg inthe soil. This may enhance yield of crops through improvednutrient uptake by crops. In both seasons, application of 2tha−1 gave the highest maize grain yield. Thus in oil palmgrowing areas in Ghana, where soils are acidic, palm bunchash which are found in abundance in these areas could beused as a liming material and as a fertiliser supplement toimprove the yield of staple food crops.
Acknowledgment
The author gratefully acknowledges the financial contribu-tion made towards this work by the Forest and HorticulturalCrops Research Centre, Kade of the Institute of AgriculturalResearch, University of Ghana, Legon.
References
[1] K. H. Lim and A. R. Zaharah, “Decomposition and N and Krelease by oil palm empty fruit bunches applied under maturepalms,” Journal of Oil Palm Research, vol. 12, pp. 55–62, 2000.
[2] FAO Statistical Databases, 2009, http://faostat.fao.org/site/639/default.aspx.
[3] J. Opoku and F.A. Asante, “Palm oil production in Ghana,”Final report on the status of the oil palm industry in Ghana,German Technical Co-operation (GTZ), Accra, Ghana, 2008.
[4] A. Saarsalmi, E. Malkonen, and S. Piirainen, “Effects of woodash fertilization on forest soil chemical properties,” SilvaFennica, vol. 35, no. 3, pp. 355–368, 2001.
[5] B. P. Bougnom, J. Mair, F. X. Etoa, and H. Insam, “Compostswith wood ash addition: a risk or a chance for amelioratingacid tropical soils?” Geoderma, vol. 153, no. 3-4, pp. 402–407,2009.
[6] C. N. Mbah, J. N. Nwite, C. Njoku, and I. A. Nweke, “Responseof maize (Zea mays L.) to different rates of wood-ash appli-cation in acid ultisol in Southeast Nigeria,” African Journal ofAgricultural Research, vol. 5, no. 7, pp. 580–583, 2010.
[7] M. A. Awodun, S. O. Ojeniyi, A. Adeboye, and A. S. Odedina,“Effect of oil palm bunch refuse ash on soil and plantnutrient composition and yield of maize,” Eurasian Journal ofSustainable Agriculture, vol. 1, pp. 50–54, 2007.
[8] S. O. Ojeniyi, P. O. Ezekiel, D. O. Asawalam, A. O. Awo, S. A.Odedina, and J. N. Odedina, “Root growth and NPK status ofcassava as influenced by oil palm bunch ash,” African Journalof Biotechnology, vol. 8, no. 18, pp. 4407–4412, 2009.
Applied and Environmental Soil Science 5
[9] H. Gerner, E. O. Asante, E. Owusu Benoah, and K. Marfo,Ghana Fertilizer Privatization Scheme. Private Sector Role andPublic Sector Responsibility in Meeting Needs of Farmers, IFDC-Africa, Lome, Togo, 1995.
[10] H. Khalid, Z. Zin, and T. M. Anderson, “Nutrient cycling inan oil palm plantation. The effects of residue managementpractices during replanting on dry matter and nutrient uptakeof young palms,” Journal of Oil Palm Research, vol. 12, pp. 29–37, 2000.
[11] L. S. Ayeni, O. M. Ayeni, O. P. Oso, and S. O. Ojeniyi, “Effect ofsawdust and wood ash applications in improving soil chemicalproperties and growth of cocoa (Theobroma cacao) seedlingsin the nurseries,” Medwel Agricultural Journal, vol. 3, pp. 323–326, 2008.
[12] F. O. Adekayode and M. R. Olojugba, “The utilization ofwood ash as manure to reduce the use of mineral fertilizer forimproved performance of maize (Zea mays L.) as measured inthe chlorophyll content and grain yield,” Journal of Soil Scienceand Environmental Management, vol. 1, pp. 40–45, 2010.
[13] P. M. Ahn, “Soils of the lower tano basin, South WesternGhana,” Ghana Ministry of Food and Agriculture, Soils andLanduse Survey Memoir No. 2, 1961.
[14] F.A.O., “FAO Unesco Soil Map of the world,” World SoilResources Report, vol. 60, FAO, Rome, Italy, 1998.
[15] Agronomy Society of America-Soil Science Society of Amer-ica, Methods of Soil Analysis, Part 2, Chemical and Micro-biological Properties-Agronomy Monograph No. 9, ASA-SSA,Madison, Wis, USA, 2nd edition, 1982.
[16] SAS, SAS User’s Guide: Statistics, SAS Institute, Cary, NC, USA,1996.
[17] N. C. Brady, The Nature and Properties of Soils, Macmillan,New York, NY, USA, 9th edition, 1984.
[18] A. Demeyer, J. C. Voundi Nkana, and M. G. Verloo, “Char-acteristics of wood ash and influence on soil properties andnutrient uptake: an overview,” Bioresource Technology, vol. 77,no. 3, pp. 287–295, 2001.
[19] S. O. Ojeniyi, B. C. Awanlemhen, and S. A. Adejoro, “Soil plantnutrients and maize performance as influenced by oilpalmbunch ash plus NPK fertilizer,” Journal of American Science,vol. 6, no. 12, pp. 456–460, 2010.
[20] U. S. Offor, G. I. Wilcox, and C. N. Agbagwaa, “Potentials ofpalm bunch ash on yield of Zea mays,” Journal of Agricultureand Social Research, vol. 10, no. 2, pp. 132–134, 2010.
[21] P. O. Ezekiel, S. O. Ojeniyi, D. O. Asawalam, and A. O. Awo,“Root growth, dry root yield and NPK content of cassavaas influenced by oil palm bunch ash on ultisols of southeastNigeria,” Nigerian Journal of Soil Science, vol. 19, pp. 6–10,2009.
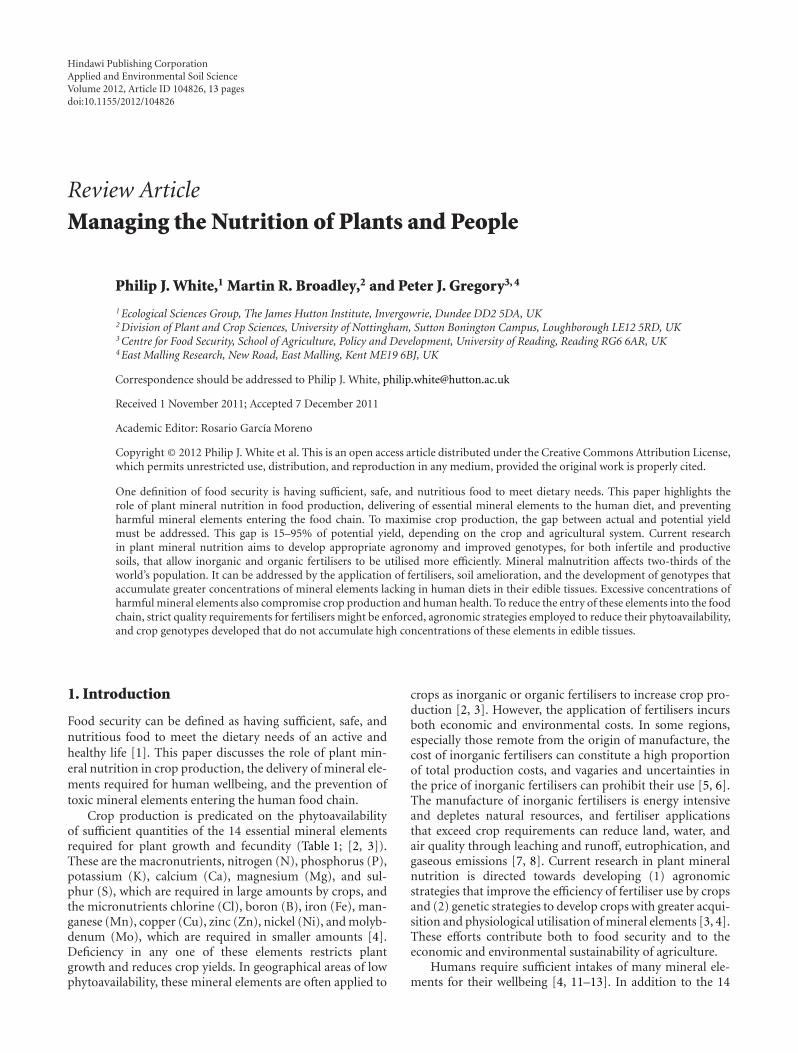
Hindawi Publishing CorporationApplied and Environmental Soil ScienceVolume 2012, Article ID 104826, 13 pagesdoi:10.1155/2012/104826
Review Article
Managing the Nutrition of Plants and People
Philip J. White,1 Martin R. Broadley,2 and Peter J. Gregory3, 4
1 Ecological Sciences Group, The James Hutton Institute, Invergowrie, Dundee DD2 5DA, UK2 Division of Plant and Crop Sciences, University of Nottingham, Sutton Bonington Campus, Loughborough LE12 5RD, UK3 Centre for Food Security, School of Agriculture, Policy and Development, University of Reading, Reading RG6 6AR, UK4 East Malling Research, New Road, East Malling, Kent ME19 6BJ, UK
Correspondence should be addressed to Philip J. White, [email protected]
Received 1 November 2011; Accepted 7 December 2011
Academic Editor: Rosario Garcıa Moreno
Copyright © 2012 Philip J. White et al. This is an open access article distributed under the Creative Commons Attribution License,which permits unrestricted use, distribution, and reproduction in any medium, provided the original work is properly cited.
One definition of food security is having sufficient, safe, and nutritious food to meet dietary needs. This paper highlights therole of plant mineral nutrition in food production, delivering of essential mineral elements to the human diet, and preventingharmful mineral elements entering the food chain. To maximise crop production, the gap between actual and potential yieldmust be addressed. This gap is 15–95% of potential yield, depending on the crop and agricultural system. Current researchin plant mineral nutrition aims to develop appropriate agronomy and improved genotypes, for both infertile and productivesoils, that allow inorganic and organic fertilisers to be utilised more efficiently. Mineral malnutrition affects two-thirds of theworld’s population. It can be addressed by the application of fertilisers, soil amelioration, and the development of genotypes thataccumulate greater concentrations of mineral elements lacking in human diets in their edible tissues. Excessive concentrations ofharmful mineral elements also compromise crop production and human health. To reduce the entry of these elements into the foodchain, strict quality requirements for fertilisers might be enforced, agronomic strategies employed to reduce their phytoavailability,and crop genotypes developed that do not accumulate high concentrations of these elements in edible tissues.
1. Introduction
Food security can be defined as having sufficient, safe, andnutritious food to meet the dietary needs of an active andhealthy life [1]. This paper discusses the role of plant min-eral nutrition in crop production, the delivery of mineral ele-ments required for human wellbeing, and the prevention oftoxic mineral elements entering the human food chain.
Crop production is predicated on the phytoavailabilityof sufficient quantities of the 14 essential mineral elementsrequired for plant growth and fecundity (Table 1; [2, 3]).These are the macronutrients, nitrogen (N), phosphorus (P),potassium (K), calcium (Ca), magnesium (Mg), and sul-phur (S), which are required in large amounts by crops, andthe micronutrients chlorine (Cl), boron (B), iron (Fe), man-ganese (Mn), copper (Cu), zinc (Zn), nickel (Ni), and molyb-denum (Mo), which are required in smaller amounts [4].Deficiency in any one of these elements restricts plantgrowth and reduces crop yields. In geographical areas of lowphytoavailability, these mineral elements are often applied to
crops as inorganic or organic fertilisers to increase crop pro-duction [2, 3]. However, the application of fertilisers incursboth economic and environmental costs. In some regions,especially those remote from the origin of manufacture, thecost of inorganic fertilisers can constitute a high proportionof total production costs, and vagaries and uncertainties inthe price of inorganic fertilisers can prohibit their use [5, 6].The manufacture of inorganic fertilisers is energy intensiveand depletes natural resources, and fertiliser applicationsthat exceed crop requirements can reduce land, water, andair quality through leaching and runoff, eutrophication, andgaseous emissions [7, 8]. Current research in plant mineralnutrition is directed towards developing (1) agronomicstrategies that improve the efficiency of fertiliser use by cropsand (2) genetic strategies to develop crops with greater acqui-sition and physiological utilisation of mineral elements [3, 4].These efforts contribute both to food security and to theeconomic and environmental sustainability of agriculture.
Humans require sufficient intakes of many mineral ele-ments for their wellbeing [4, 11–13]. In addition to the 14
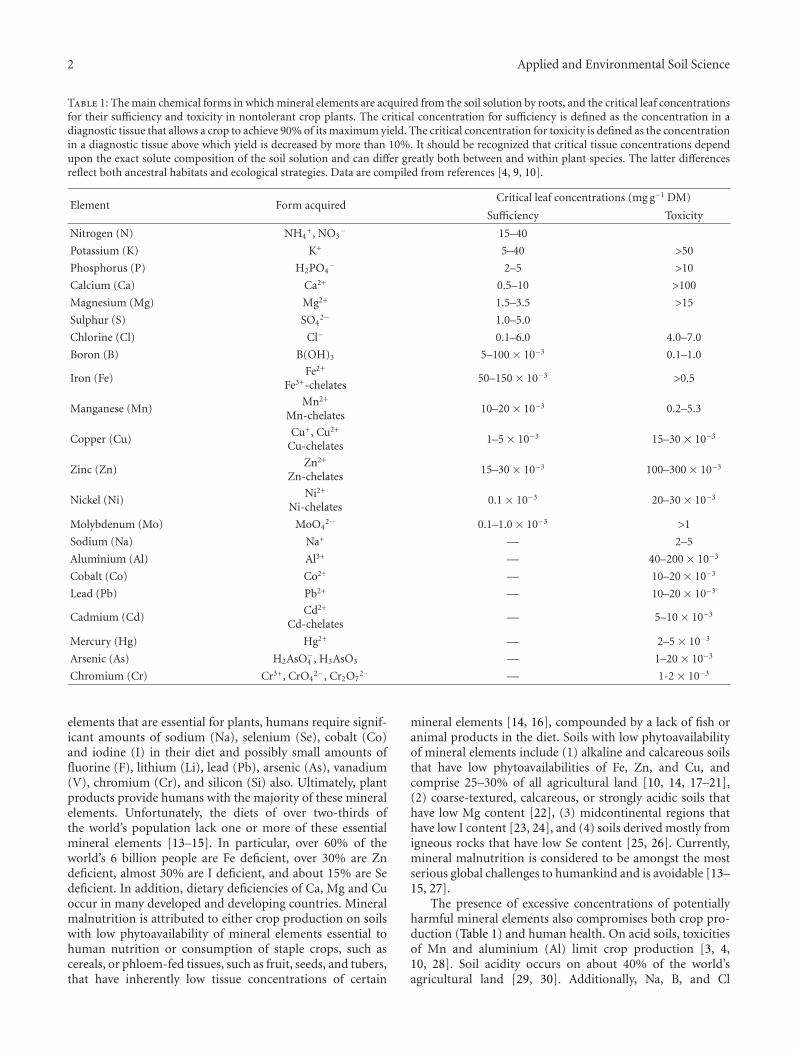
2 Applied and Environmental Soil Science
Table 1: The main chemical forms in which mineral elements are acquired from the soil solution by roots, and the critical leaf concentrationsfor their sufficiency and toxicity in nontolerant crop plants. The critical concentration for sufficiency is defined as the concentration in adiagnostic tissue that allows a crop to achieve 90% of its maximum yield. The critical concentration for toxicity is defined as the concentrationin a diagnostic tissue above which yield is decreased by more than 10%. It should be recognized that critical tissue concentrations dependupon the exact solute composition of the soil solution and can differ greatly both between and within plant species. The latter differencesreflect both ancestral habitats and ecological strategies. Data are compiled from references [4, 9, 10].
Element Form acquiredCritical leaf concentrations (mg g−1 DM)
Sufficiency Toxicity
Nitrogen (N) NH4+, NO3
− 15–40
Potassium (K) K+ 5–40 >50
Phosphorus (P) H2PO4− 2–5 >10
Calcium (Ca) Ca2+ 0.5–10 >100
Magnesium (Mg) Mg2+ 1.5–3.5 >15
Sulphur (S) SO42− 1.0–5.0
Chlorine (Cl) Cl− 0.1–6.0 4.0–7.0
Boron (B) B(OH)3 5–100 × 10−3 0.1–1.0
Iron (Fe)Fe2+
Fe3+-chelates50–150 × 10−3 >0.5
Manganese (Mn)Mn2+
Mn-chelates10–20 × 10−3 0.2–5.3
Copper (Cu)Cu+, Cu2+
Cu-chelates1–5 × 10⁻³ 15–30 × 10−3
Zinc (Zn)Zn2+
Zn-chelates15–30 × 10−3 100–300 × 10−3
Nickel (Ni)Ni2+
Ni-chelates0.1 × 10−3 20–30 × 10−3
Molybdenum (Mo) MoO42− 0.1–1.0 × 10⁻³ >1
Sodium (Na) Na+ — 2–5
Aluminium (Al) Al3+ — 40–200 × 10−3
Cobalt (Co) Co2+ — 10–20 × 10−3
Lead (Pb) Pb2+ — 10–20 × 10−3
Cadmium (Cd)Cd2+
Cd-chelates— 5–10 × 10−3
Mercury (Hg) Hg2+ — 2–5 × 10⁻³
Arsenic (As) H2AsO−4 , H3AsO3 — 1–20 × 10−3
Chromium (Cr) Cr3+, CrO42−, Cr2O7
2− — 1-2 × 10⁻³
elements that are essential for plants, humans require signif-icant amounts of sodium (Na), selenium (Se), cobalt (Co)and iodine (I) in their diet and possibly small amounts offluorine (F), lithium (Li), lead (Pb), arsenic (As), vanadium(V), chromium (Cr), and silicon (Si) also. Ultimately, plantproducts provide humans with the majority of these mineralelements. Unfortunately, the diets of over two-thirds ofthe world’s population lack one or more of these essentialmineral elements [13–15]. In particular, over 60% of theworld’s 6 billion people are Fe deficient, over 30% are Zndeficient, almost 30% are I deficient, and about 15% are Sedeficient. In addition, dietary deficiencies of Ca, Mg and Cuoccur in many developed and developing countries. Mineralmalnutrition is attributed to either crop production on soilswith low phytoavailability of mineral elements essential tohuman nutrition or consumption of staple crops, such ascereals, or phloem-fed tissues, such as fruit, seeds, and tubers,that have inherently low tissue concentrations of certain
mineral elements [14, 16], compounded by a lack of fish oranimal products in the diet. Soils with low phytoavailabilityof mineral elements include (1) alkaline and calcareous soilsthat have low phytoavailabilities of Fe, Zn, and Cu, andcomprise 25–30% of all agricultural land [10, 14, 17–21],(2) coarse-textured, calcareous, or strongly acidic soils thathave low Mg content [22], (3) midcontinental regions thathave low I content [23, 24], and (4) soils derived mostly fromigneous rocks that have low Se content [25, 26]. Currently,mineral malnutrition is considered to be amongst the mostserious global challenges to humankind and is avoidable [13–15, 27].
The presence of excessive concentrations of potentiallyharmful mineral elements also compromises both crop pro-duction (Table 1) and human health. On acid soils, toxicitiesof Mn and aluminium (Al) limit crop production [3, 4,10, 28]. Soil acidity occurs on about 40% of the world’sagricultural land [29, 30]. Additionally, Na, B, and Cl
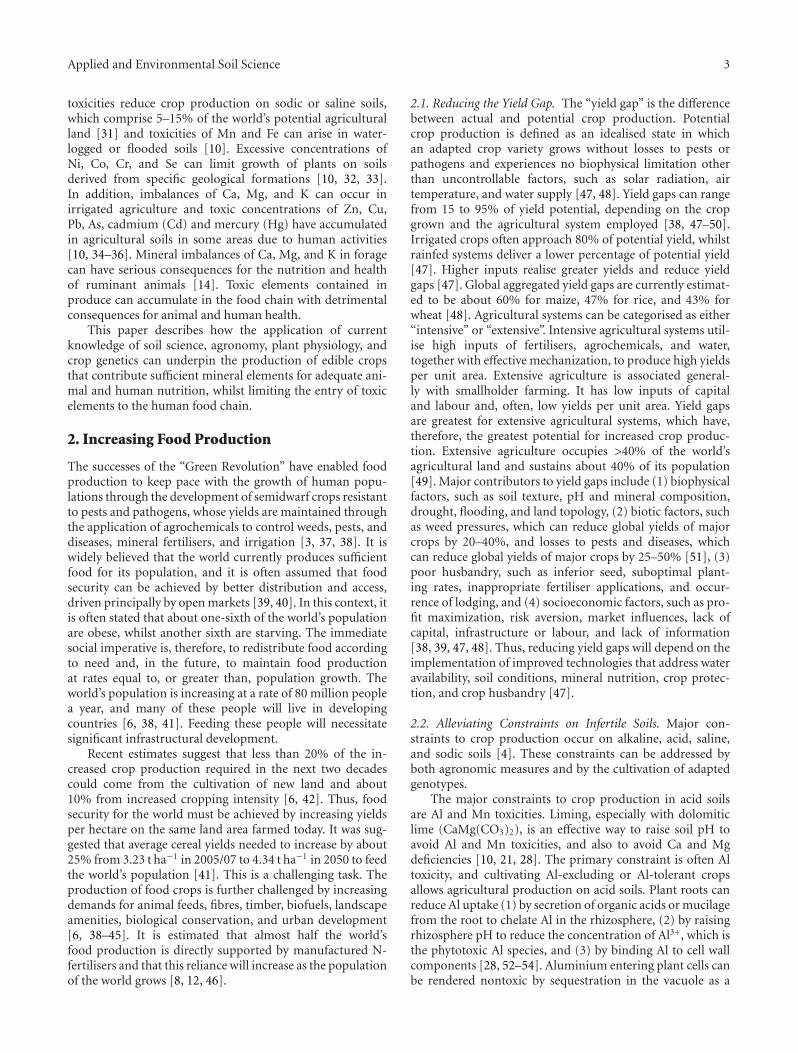
Applied and Environmental Soil Science 3
toxicities reduce crop production on sodic or saline soils,which comprise 5–15% of the world’s potential agriculturalland [31] and toxicities of Mn and Fe can arise in water-logged or flooded soils [10]. Excessive concentrations ofNi, Co, Cr, and Se can limit growth of plants on soilsderived from specific geological formations [10, 32, 33].In addition, imbalances of Ca, Mg, and K can occur inirrigated agriculture and toxic concentrations of Zn, Cu,Pb, As, cadmium (Cd) and mercury (Hg) have accumulatedin agricultural soils in some areas due to human activities[10, 34–36]. Mineral imbalances of Ca, Mg, and K in foragecan have serious consequences for the nutrition and healthof ruminant animals [14]. Toxic elements contained inproduce can accumulate in the food chain with detrimentalconsequences for animal and human health.
This paper describes how the application of currentknowledge of soil science, agronomy, plant physiology, andcrop genetics can underpin the production of edible cropsthat contribute sufficient mineral elements for adequate ani-mal and human nutrition, whilst limiting the entry of toxicelements to the human food chain.
2. Increasing Food Production
The successes of the “Green Revolution” have enabled foodproduction to keep pace with the growth of human popu-lations through the development of semidwarf crops resistantto pests and pathogens, whose yields are maintained throughthe application of agrochemicals to control weeds, pests, anddiseases, mineral fertilisers, and irrigation [3, 37, 38]. It iswidely believed that the world currently produces sufficientfood for its population, and it is often assumed that foodsecurity can be achieved by better distribution and access,driven principally by open markets [39, 40]. In this context, itis often stated that about one-sixth of the world’s populationare obese, whilst another sixth are starving. The immediatesocial imperative is, therefore, to redistribute food accordingto need and, in the future, to maintain food productionat rates equal to, or greater than, population growth. Theworld’s population is increasing at a rate of 80 million peoplea year, and many of these people will live in developingcountries [6, 38, 41]. Feeding these people will necessitatesignificant infrastructural development.
Recent estimates suggest that less than 20% of the in-creased crop production required in the next two decadescould come from the cultivation of new land and about10% from increased cropping intensity [6, 42]. Thus, foodsecurity for the world must be achieved by increasing yieldsper hectare on the same land area farmed today. It was sug-gested that average cereal yields needed to increase by about25% from 3.23 t ha−1 in 2005/07 to 4.34 t ha−1 in 2050 to feedthe world’s population [41]. This is a challenging task. Theproduction of food crops is further challenged by increasingdemands for animal feeds, fibres, timber, biofuels, landscapeamenities, biological conservation, and urban development[6, 38–45]. It is estimated that almost half the world’sfood production is directly supported by manufactured N-fertilisers and that this reliance will increase as the populationof the world grows [8, 12, 46].
2.1. Reducing the Yield Gap. The “yield gap” is the differencebetween actual and potential crop production. Potentialcrop production is defined as an idealised state in whichan adapted crop variety grows without losses to pests orpathogens and experiences no biophysical limitation otherthan uncontrollable factors, such as solar radiation, airtemperature, and water supply [47, 48]. Yield gaps can rangefrom 15 to 95% of yield potential, depending on the cropgrown and the agricultural system employed [38, 47–50].Irrigated crops often approach 80% of potential yield, whilstrainfed systems deliver a lower percentage of potential yield[47]. Higher inputs realise greater yields and reduce yieldgaps [47]. Global aggregated yield gaps are currently estimat-ed to be about 60% for maize, 47% for rice, and 43% forwheat [48]. Agricultural systems can be categorised as either“intensive” or “extensive”. Intensive agricultural systems util-ise high inputs of fertilisers, agrochemicals, and water,together with effective mechanization, to produce high yieldsper unit area. Extensive agriculture is associated general-ly with smallholder farming. It has low inputs of capitaland labour and, often, low yields per unit area. Yield gapsare greatest for extensive agricultural systems, which have,therefore, the greatest potential for increased crop produc-tion. Extensive agriculture occupies >40% of the world’sagricultural land and sustains about 40% of its population[49]. Major contributors to yield gaps include (1) biophysicalfactors, such as soil texture, pH and mineral composition,drought, flooding, and land topology, (2) biotic factors, suchas weed pressures, which can reduce global yields of majorcrops by 20–40%, and losses to pests and diseases, whichcan reduce global yields of major crops by 25–50% [51], (3)poor husbandry, such as inferior seed, suboptimal plant-ing rates, inappropriate fertiliser applications, and occur-rence of lodging, and (4) socioeconomic factors, such as pro-fit maximization, risk aversion, market influences, lack ofcapital, infrastructure or labour, and lack of information[38, 39, 47, 48]. Thus, reducing yield gaps will depend on theimplementation of improved technologies that address wateravailability, soil conditions, mineral nutrition, crop protec-tion, and crop husbandry [47].
2.2. Alleviating Constraints on Infertile Soils. Major con-straints to crop production occur on alkaline, acid, saline,and sodic soils [4]. These constraints can be addressed byboth agronomic measures and by the cultivation of adaptedgenotypes.
The major constraints to crop production in acid soilsare Al and Mn toxicities. Liming, especially with dolomiticlime (CaMg(CO3)2), is an effective way to raise soil pH toavoid Al and Mn toxicities, and also to avoid Ca and Mgdeficiencies [10, 21, 28]. The primary constraint is often Altoxicity, and cultivating Al-excluding or Al-tolerant cropsallows agricultural production on acid soils. Plant roots canreduce Al uptake (1) by secretion of organic acids or mucilagefrom the root to chelate Al in the rhizosphere, (2) by raisingrhizosphere pH to reduce the concentration of Al3+, which isthe phytotoxic Al species, and (3) by binding Al to cell wallcomponents [28, 52–54]. Aluminium entering plant cells canbe rendered nontoxic by sequestration in the vacuole as a
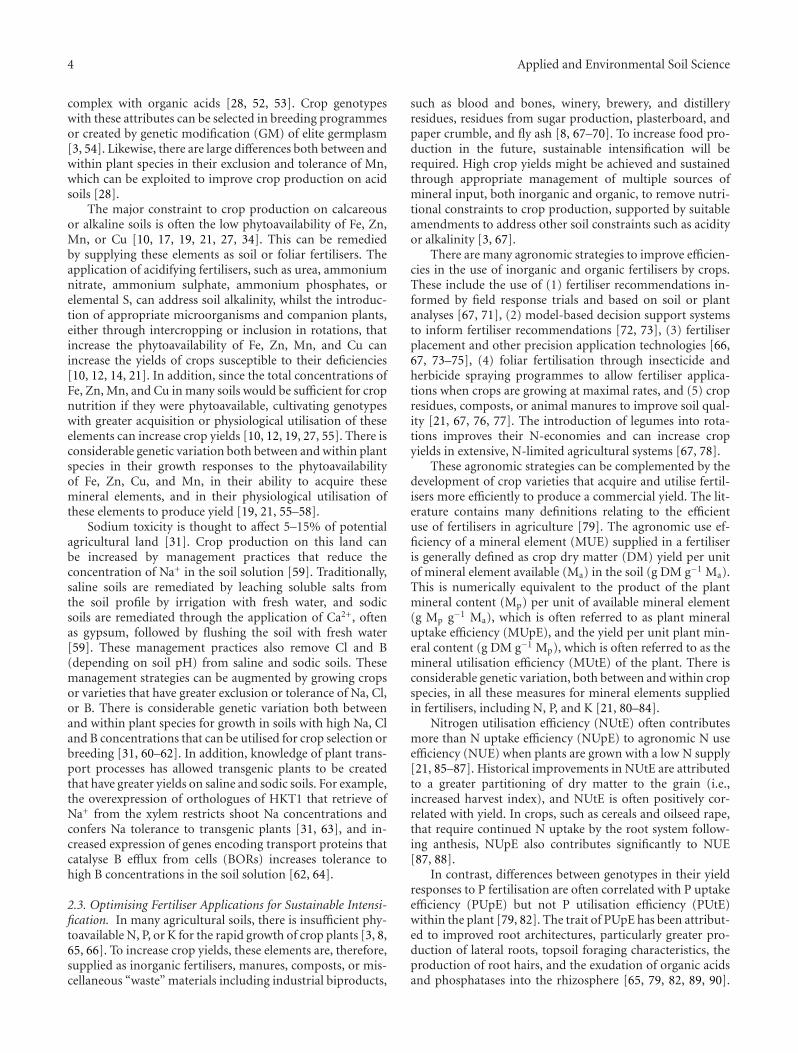
4 Applied and Environmental Soil Science
complex with organic acids [28, 52, 53]. Crop genotypeswith these attributes can be selected in breeding programmesor created by genetic modification (GM) of elite germplasm[3, 54]. Likewise, there are large differences both between andwithin plant species in their exclusion and tolerance of Mn,which can be exploited to improve crop production on acidsoils [28].
The major constraint to crop production on calcareousor alkaline soils is often the low phytoavailability of Fe, Zn,Mn, or Cu [10, 17, 19, 21, 27, 34]. This can be remediedby supplying these elements as soil or foliar fertilisers. Theapplication of acidifying fertilisers, such as urea, ammoniumnitrate, ammonium sulphate, ammonium phosphates, orelemental S, can address soil alkalinity, whilst the introduc-tion of appropriate microorganisms and companion plants,either through intercropping or inclusion in rotations, thatincrease the phytoavailability of Fe, Zn, Mn, and Cu canincrease the yields of crops susceptible to their deficiencies[10, 12, 14, 21]. In addition, since the total concentrations ofFe, Zn, Mn, and Cu in many soils would be sufficient for cropnutrition if they were phytoavailable, cultivating genotypeswith greater acquisition or physiological utilisation of theseelements can increase crop yields [10, 12, 19, 27, 55]. There isconsiderable genetic variation both between and within plantspecies in their growth responses to the phytoavailabilityof Fe, Zn, Cu, and Mn, in their ability to acquire thesemineral elements, and in their physiological utilisation ofthese elements to produce yield [19, 21, 55–58].
Sodium toxicity is thought to affect 5–15% of potentialagricultural land [31]. Crop production on this land canbe increased by management practices that reduce theconcentration of Na+ in the soil solution [59]. Traditionally,saline soils are remediated by leaching soluble salts fromthe soil profile by irrigation with fresh water, and sodicsoils are remediated through the application of Ca2+, oftenas gypsum, followed by flushing the soil with fresh water[59]. These management practices also remove Cl and B(depending on soil pH) from saline and sodic soils. Thesemanagement strategies can be augmented by growing cropsor varieties that have greater exclusion or tolerance of Na, Cl,or B. There is considerable genetic variation both betweenand within plant species for growth in soils with high Na, Cland B concentrations that can be utilised for crop selection orbreeding [31, 60–62]. In addition, knowledge of plant trans-port processes has allowed transgenic plants to be createdthat have greater yields on saline and sodic soils. For example,the overexpression of orthologues of HKT1 that retrieve ofNa+ from the xylem restricts shoot Na concentrations andconfers Na tolerance to transgenic plants [31, 63], and in-creased expression of genes encoding transport proteins thatcatalyse B efflux from cells (BORs) increases tolerance tohigh B concentrations in the soil solution [62, 64].
2.3. Optimising Fertiliser Applications for Sustainable Intensi-fication. In many agricultural soils, there is insufficient phy-toavailable N, P, or K for the rapid growth of crop plants [3, 8,65, 66]. To increase crop yields, these elements are, therefore,supplied as inorganic fertilisers, manures, composts, or mis-cellaneous “waste” materials including industrial biproducts,
such as blood and bones, winery, brewery, and distilleryresidues, residues from sugar production, plasterboard, andpaper crumble, and fly ash [8, 67–70]. To increase food pro-duction in the future, sustainable intensification will berequired. High crop yields might be achieved and sustainedthrough appropriate management of multiple sources ofmineral input, both inorganic and organic, to remove nutri-tional constraints to crop production, supported by suitableamendments to address other soil constraints such as acidityor alkalinity [3, 67].
There are many agronomic strategies to improve efficien-cies in the use of inorganic and organic fertilisers by crops.These include the use of (1) fertiliser recommendations in-formed by field response trials and based on soil or plantanalyses [67, 71], (2) model-based decision support systemsto inform fertiliser recommendations [72, 73], (3) fertiliserplacement and other precision application technologies [66,67, 73–75], (4) foliar fertilisation through insecticide andherbicide spraying programmes to allow fertiliser applica-tions when crops are growing at maximal rates, and (5) cropresidues, composts, or animal manures to improve soil qual-ity [21, 67, 76, 77]. The introduction of legumes into rota-tions improves their N-economies and can increase cropyields in extensive, N-limited agricultural systems [67, 78].
These agronomic strategies can be complemented by thedevelopment of crop varieties that acquire and utilise fertil-isers more efficiently to produce a commercial yield. The lit-erature contains many definitions relating to the efficientuse of fertilisers in agriculture [79]. The agronomic use ef-ficiency of a mineral element (MUE) supplied in a fertiliseris generally defined as crop dry matter (DM) yield per unitof mineral element available (Ma) in the soil (g DM g−1 Ma).This is numerically equivalent to the product of the plantmineral content (Mp) per unit of available mineral element(g Mp g−1 Ma), which is often referred to as plant mineraluptake efficiency (MUpE), and the yield per unit plant min-eral content (g DM g−1 Mp), which is often referred to as themineral utilisation efficiency (MUtE) of the plant. There isconsiderable genetic variation, both between and within cropspecies, in all these measures for mineral elements suppliedin fertilisers, including N, P, and K [21, 80–84].
Nitrogen utilisation efficiency (NUtE) often contributesmore than N uptake efficiency (NUpE) to agronomic N useefficiency (NUE) when plants are grown with a low N supply[21, 85–87]. Historical improvements in NUtE are attributedto a greater partitioning of dry matter to the grain (i.e.,increased harvest index), and NUtE is often positively cor-related with yield. In crops, such as cereals and oilseed rape,that require continued N uptake by the root system follow-ing anthesis, NUpE also contributes significantly to NUE[87, 88].
In contrast, differences between genotypes in their yieldresponses to P fertilisation are often correlated with P uptakeefficiency (PUpE) but not P utilisation efficiency (PUtE)within the plant [79, 82]. The trait of PUpE has been attribut-ed to improved root architectures, particularly greater pro-duction of lateral roots, topsoil foraging characteristics, theproduction of root hairs, and the exudation of organic acidsand phosphatases into the rhizosphere [65, 79, 82, 89, 90].
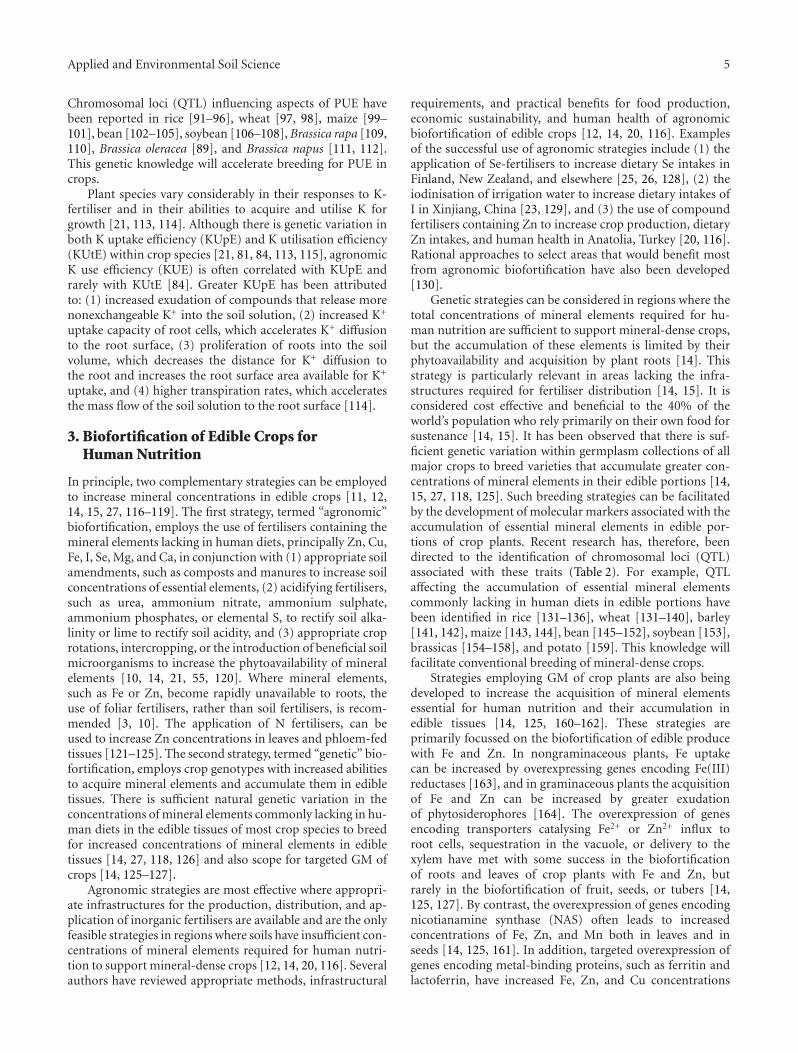
Applied and Environmental Soil Science 5
Chromosomal loci (QTL) influencing aspects of PUE havebeen reported in rice [91–96], wheat [97, 98], maize [99–101], bean [102–105], soybean [106–108], Brassica rapa [109,110], Brassica oleracea [89], and Brassica napus [111, 112].This genetic knowledge will accelerate breeding for PUE incrops.
Plant species vary considerably in their responses to K-fertiliser and in their abilities to acquire and utilise K forgrowth [21, 113, 114]. Although there is genetic variation inboth K uptake efficiency (KUpE) and K utilisation efficiency(KUtE) within crop species [21, 81, 84, 113, 115], agronomicK use efficiency (KUE) is often correlated with KUpE andrarely with KUtE [84]. Greater KUpE has been attributedto: (1) increased exudation of compounds that release morenonexchangeable K+ into the soil solution, (2) increased K+
uptake capacity of root cells, which accelerates K+ diffusionto the root surface, (3) proliferation of roots into the soilvolume, which decreases the distance for K+ diffusion tothe root and increases the root surface area available for K+
uptake, and (4) higher transpiration rates, which acceleratesthe mass flow of the soil solution to the root surface [114].
3. Biofortification of Edible Crops forHuman Nutrition
In principle, two complementary strategies can be employedto increase mineral concentrations in edible crops [11, 12,14, 15, 27, 116–119]. The first strategy, termed “agronomic”biofortification, employs the use of fertilisers containing themineral elements lacking in human diets, principally Zn, Cu,Fe, I, Se, Mg, and Ca, in conjunction with (1) appropriate soilamendments, such as composts and manures to increase soilconcentrations of essential elements, (2) acidifying fertilisers,such as urea, ammonium nitrate, ammonium sulphate,ammonium phosphates, or elemental S, to rectify soil alka-linity or lime to rectify soil acidity, and (3) appropriate croprotations, intercropping, or the introduction of beneficial soilmicroorganisms to increase the phytoavailability of mineralelements [10, 14, 21, 55, 120]. Where mineral elements,such as Fe or Zn, become rapidly unavailable to roots, theuse of foliar fertilisers, rather than soil fertilisers, is recom-mended [3, 10]. The application of N fertilisers, can beused to increase Zn concentrations in leaves and phloem-fedtissues [121–125]. The second strategy, termed “genetic” bio-fortification, employs crop genotypes with increased abilitiesto acquire mineral elements and accumulate them in edibletissues. There is sufficient natural genetic variation in theconcentrations of mineral elements commonly lacking in hu-man diets in the edible tissues of most crop species to breedfor increased concentrations of mineral elements in edibletissues [14, 27, 118, 126] and also scope for targeted GM ofcrops [14, 125–127].
Agronomic strategies are most effective where appropri-ate infrastructures for the production, distribution, and ap-plication of inorganic fertilisers are available and are the onlyfeasible strategies in regions where soils have insufficient con-centrations of mineral elements required for human nutri-tion to support mineral-dense crops [12, 14, 20, 116]. Severalauthors have reviewed appropriate methods, infrastructural
requirements, and practical benefits for food production,economic sustainability, and human health of agronomicbiofortification of edible crops [12, 14, 20, 116]. Examplesof the successful use of agronomic strategies include (1) theapplication of Se-fertilisers to increase dietary Se intakes inFinland, New Zealand, and elsewhere [25, 26, 128], (2) theiodinisation of irrigation water to increase dietary intakes ofI in Xinjiang, China [23, 129], and (3) the use of compoundfertilisers containing Zn to increase crop production, dietaryZn intakes, and human health in Anatolia, Turkey [20, 116].Rational approaches to select areas that would benefit mostfrom agronomic biofortification have also been developed[130].
Genetic strategies can be considered in regions where thetotal concentrations of mineral elements required for hu-man nutrition are sufficient to support mineral-dense crops,but the accumulation of these elements is limited by theirphytoavailability and acquisition by plant roots [14]. Thisstrategy is particularly relevant in areas lacking the infra-structures required for fertiliser distribution [14, 15]. It isconsidered cost effective and beneficial to the 40% of theworld’s population who rely primarily on their own food forsustenance [14, 15]. It has been observed that there is suf-ficient genetic variation within germplasm collections of allmajor crops to breed varieties that accumulate greater con-centrations of mineral elements in their edible portions [14,15, 27, 118, 125]. Such breeding strategies can be facilitatedby the development of molecular markers associated with theaccumulation of essential mineral elements in edible por-tions of crop plants. Recent research has, therefore, beendirected to the identification of chromosomal loci (QTL)associated with these traits (Table 2). For example, QTLaffecting the accumulation of essential mineral elementscommonly lacking in human diets in edible portions havebeen identified in rice [131–136], wheat [131–140], barley[141, 142], maize [143, 144], bean [145–152], soybean [153],brassicas [154–158], and potato [159]. This knowledge willfacilitate conventional breeding of mineral-dense crops.
Strategies employing GM of crop plants are also beingdeveloped to increase the acquisition of mineral elementsessential for human nutrition and their accumulation inedible tissues [14, 125, 160–162]. These strategies areprimarily focussed on the biofortification of edible producewith Fe and Zn. In nongraminaceous plants, Fe uptakecan be increased by overexpressing genes encoding Fe(III)reductases [163], and in graminaceous plants the acquisitionof Fe and Zn can be increased by greater exudationof phytosiderophores [164]. The overexpression of genesencoding transporters catalysing Fe2+ or Zn2+ influx toroot cells, sequestration in the vacuole, or delivery to thexylem have met with some success in the biofortificationof roots and leaves of crop plants with Fe and Zn, butrarely in the biofortification of fruit, seeds, or tubers [14,125, 127]. By contrast, the overexpression of genes encodingnicotianamine synthase (NAS) often leads to increasedconcentrations of Fe, Zn, and Mn both in leaves and inseeds [14, 125, 161]. In addition, targeted overexpression ofgenes encoding metal-binding proteins, such as ferritin andlactoferrin, have increased Fe, Zn, and Cu concentrations
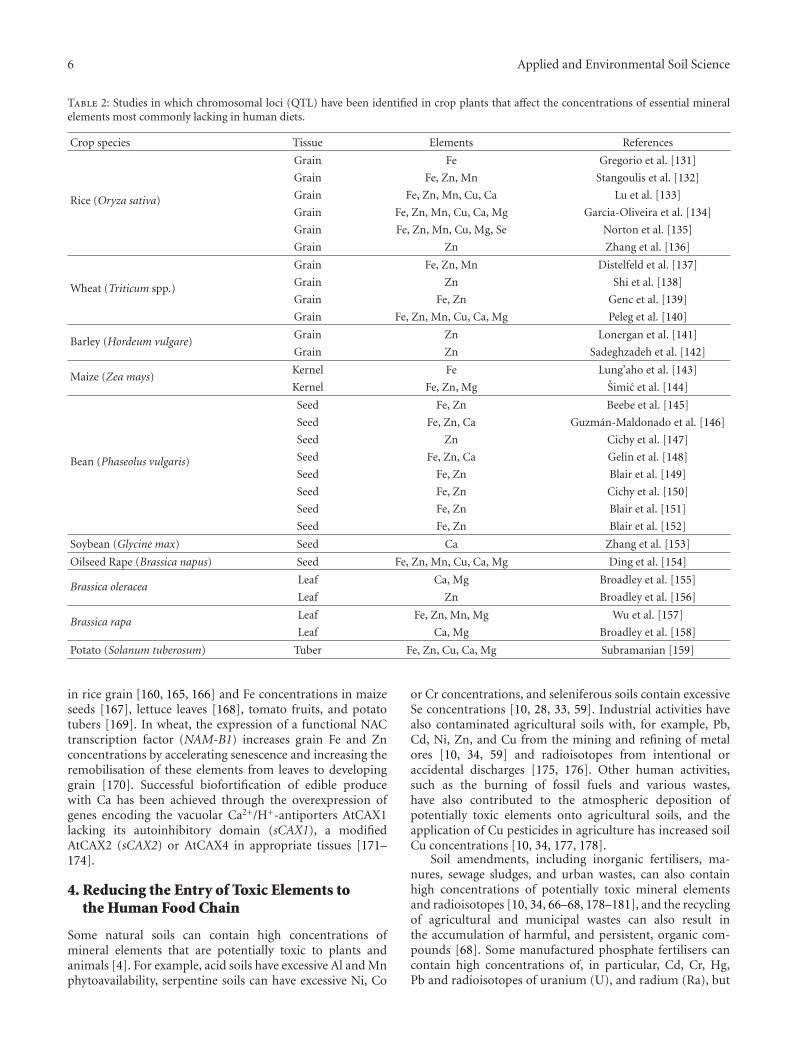
6 Applied and Environmental Soil Science
Table 2: Studies in which chromosomal loci (QTL) have been identified in crop plants that affect the concentrations of essential mineralelements most commonly lacking in human diets.
Crop species Tissue Elements References
Rice (Oryza sativa)
Grain Fe Gregorio et al. [131]
Grain Fe, Zn, Mn Stangoulis et al. [132]
Grain Fe, Zn, Mn, Cu, Ca Lu et al. [133]
Grain Fe, Zn, Mn, Cu, Ca, Mg Garcia-Oliveira et al. [134]
Grain Fe, Zn, Mn, Cu, Mg, Se Norton et al. [135]
Grain Zn Zhang et al. [136]
Wheat (Triticum spp.)
Grain Fe, Zn, Mn Distelfeld et al. [137]
Grain Zn Shi et al. [138]
Grain Fe, Zn Genc et al. [139]
Grain Fe, Zn, Mn, Cu, Ca, Mg Peleg et al. [140]
Barley (Hordeum vulgare)Grain Zn Lonergan et al. [141]
Grain Zn Sadeghzadeh et al. [142]
Maize (Zea mays)Kernel Fe Lung’aho et al. [143]
Kernel Fe, Zn, Mg Simic et al. [144]
Bean (Phaseolus vulgaris)
Seed Fe, Zn Beebe et al. [145]
Seed Fe, Zn, Ca Guzman-Maldonado et al. [146]
Seed Zn Cichy et al. [147]
Seed Fe, Zn, Ca Gelin et al. [148]
Seed Fe, Zn Blair et al. [149]
Seed Fe, Zn Cichy et al. [150]
Seed Fe, Zn Blair et al. [151]
Seed Fe, Zn Blair et al. [152]
Soybean (Glycine max) Seed Ca Zhang et al. [153]
Oilseed Rape (Brassica napus) Seed Fe, Zn, Mn, Cu, Ca, Mg Ding et al. [154]
Brassica oleraceaLeaf Ca, Mg Broadley et al. [155]
Leaf Zn Broadley et al. [156]
Brassica rapaLeaf Fe, Zn, Mn, Mg Wu et al. [157]
Leaf Ca, Mg Broadley et al. [158]
Potato (Solanum tuberosum) Tuber Fe, Zn, Cu, Ca, Mg Subramanian [159]
in rice grain [160, 165, 166] and Fe concentrations in maizeseeds [167], lettuce leaves [168], tomato fruits, and potatotubers [169]. In wheat, the expression of a functional NACtranscription factor (NAM-B1) increases grain Fe and Znconcentrations by accelerating senescence and increasing theremobilisation of these elements from leaves to developinggrain [170]. Successful biofortification of edible producewith Ca has been achieved through the overexpression ofgenes encoding the vacuolar Ca2+/H+-antiporters AtCAX1lacking its autoinhibitory domain (sCAX1), a modifiedAtCAX2 (sCAX2) or AtCAX4 in appropriate tissues [171–174].
4. Reducing the Entry of Toxic Elements tothe Human Food Chain
Some natural soils can contain high concentrations ofmineral elements that are potentially toxic to plants andanimals [4]. For example, acid soils have excessive Al and Mnphytoavailability, serpentine soils can have excessive Ni, Co
or Cr concentrations, and seleniferous soils contain excessiveSe concentrations [10, 28, 33, 59]. Industrial activities havealso contaminated agricultural soils with, for example, Pb,Cd, Ni, Zn, and Cu from the mining and refining of metalores [10, 34, 59] and radioisotopes from intentional oraccidental discharges [175, 176]. Other human activities,such as the burning of fossil fuels and various wastes,have also contributed to the atmospheric deposition ofpotentially toxic elements onto agricultural soils, and theapplication of Cu pesticides in agriculture has increased soilCu concentrations [10, 34, 177, 178].
Soil amendments, including inorganic fertilisers, ma-nures, sewage sludges, and urban wastes, can also containhigh concentrations of potentially toxic mineral elementsand radioisotopes [10, 34, 66–68, 178–181], and the recyclingof agricultural and municipal wastes can also result inthe accumulation of harmful, and persistent, organic com-pounds [68]. Some manufactured phosphate fertilisers cancontain high concentrations of, in particular, Cd, Cr, Hg,Pb and radioisotopes of uranium (U), and radium (Ra), but
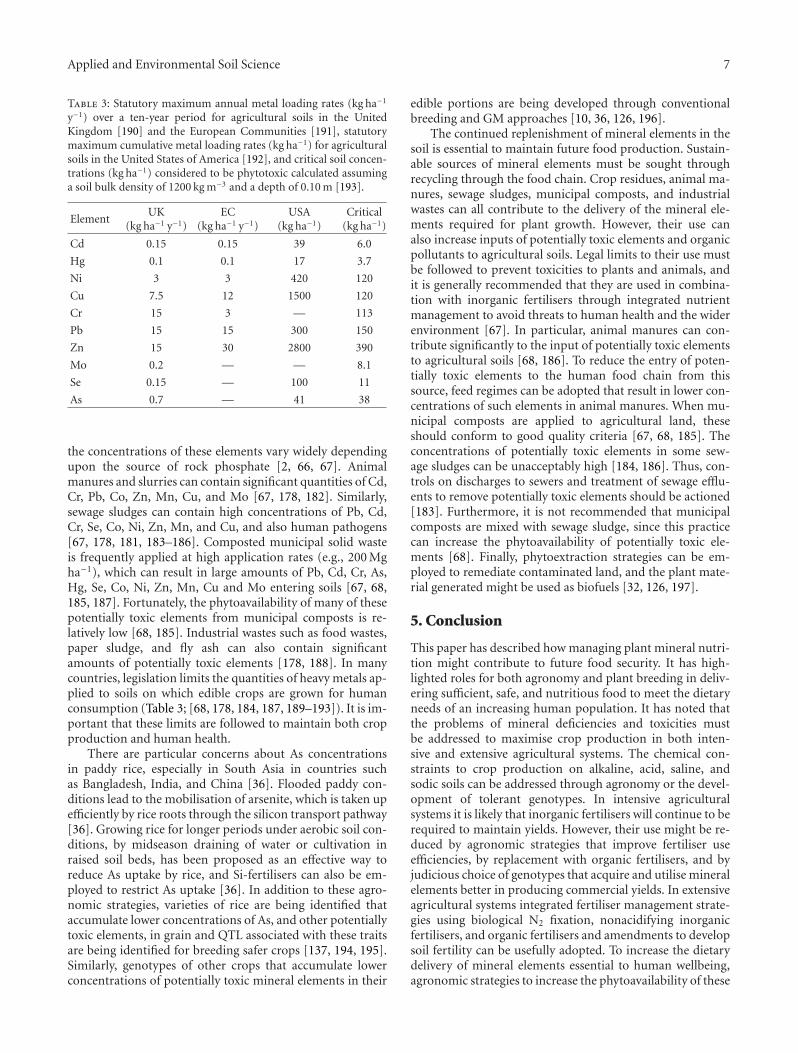
Applied and Environmental Soil Science 7
Table 3: Statutory maximum annual metal loading rates (kg ha−1
y−1) over a ten-year period for agricultural soils in the UnitedKingdom [190] and the European Communities [191], statutorymaximum cumulative metal loading rates (kg ha−1) for agriculturalsoils in the United States of America [192], and critical soil concen-trations (kg ha−1) considered to be phytotoxic calculated assuminga soil bulk density of 1200 kg m−3 and a depth of 0.10 m [193].
ElementUK
(kg ha−1 y−1)EC
(kg ha−1 y−1)USA
(kg ha−1)Critical
(kg ha−1)
Cd 0.15 0.15 39 6.0
Hg 0.1 0.1 17 3.7
Ni 3 3 420 120
Cu 7.5 12 1500 120
Cr 15 3 — 113
Pb 15 15 300 150
Zn 15 30 2800 390
Mo 0.2 — — 8.1
Se 0.15 — 100 11
As 0.7 — 41 38
the concentrations of these elements vary widely dependingupon the source of rock phosphate [2, 66, 67]. Animalmanures and slurries can contain significant quantities of Cd,Cr, Pb, Co, Zn, Mn, Cu, and Mo [67, 178, 182]. Similarly,sewage sludges can contain high concentrations of Pb, Cd,Cr, Se, Co, Ni, Zn, Mn, and Cu, and also human pathogens[67, 178, 181, 183–186]. Composted municipal solid wasteis frequently applied at high application rates (e.g., 200 Mgha−1), which can result in large amounts of Pb, Cd, Cr, As,Hg, Se, Co, Ni, Zn, Mn, Cu and Mo entering soils [67, 68,185, 187]. Fortunately, the phytoavailability of many of thesepotentially toxic elements from municipal composts is re-latively low [68, 185]. Industrial wastes such as food wastes,paper sludge, and fly ash can also contain significantamounts of potentially toxic elements [178, 188]. In manycountries, legislation limits the quantities of heavy metals ap-plied to soils on which edible crops are grown for humanconsumption (Table 3; [68, 178, 184, 187, 189–193]). It is im-portant that these limits are followed to maintain both cropproduction and human health.
There are particular concerns about As concentrationsin paddy rice, especially in South Asia in countries suchas Bangladesh, India, and China [36]. Flooded paddy con-ditions lead to the mobilisation of arsenite, which is taken upefficiently by rice roots through the silicon transport pathway[36]. Growing rice for longer periods under aerobic soil con-ditions, by midseason draining of water or cultivation inraised soil beds, has been proposed as an effective way toreduce As uptake by rice, and Si-fertilisers can also be em-ployed to restrict As uptake [36]. In addition to these agro-nomic strategies, varieties of rice are being identified thataccumulate lower concentrations of As, and other potentiallytoxic elements, in grain and QTL associated with these traitsare being identified for breeding safer crops [137, 194, 195].Similarly, genotypes of other crops that accumulate lowerconcentrations of potentially toxic mineral elements in their
edible portions are being developed through conventionalbreeding and GM approaches [10, 36, 126, 196].
The continued replenishment of mineral elements in thesoil is essential to maintain future food production. Sustain-able sources of mineral elements must be sought throughrecycling through the food chain. Crop residues, animal ma-nures, sewage sludges, municipal composts, and industrialwastes can all contribute to the delivery of the mineral ele-ments required for plant growth. However, their use canalso increase inputs of potentially toxic elements and organicpollutants to agricultural soils. Legal limits to their use mustbe followed to prevent toxicities to plants and animals, andit is generally recommended that they are used in combina-tion with inorganic fertilisers through integrated nutrientmanagement to avoid threats to human health and the widerenvironment [67]. In particular, animal manures can con-tribute significantly to the input of potentially toxic elementsto agricultural soils [68, 186]. To reduce the entry of poten-tially toxic elements to the human food chain from thissource, feed regimes can be adopted that result in lower con-centrations of such elements in animal manures. When mu-nicipal composts are applied to agricultural land, theseshould conform to good quality criteria [67, 68, 185]. Theconcentrations of potentially toxic elements in some sew-age sludges can be unacceptably high [184, 186]. Thus, con-trols on discharges to sewers and treatment of sewage efflu-ents to remove potentially toxic elements should be actioned[183]. Furthermore, it is not recommended that municipalcomposts are mixed with sewage sludge, since this practicecan increase the phytoavailability of potentially toxic ele-ments [68]. Finally, phytoextraction strategies can be em-ployed to remediate contaminated land, and the plant mate-rial generated might be used as biofuels [32, 126, 197].
5. Conclusion
This paper has described how managing plant mineral nutri-tion might contribute to future food security. It has high-lighted roles for both agronomy and plant breeding in deliv-ering sufficient, safe, and nutritious food to meet the dietaryneeds of an increasing human population. It has noted thatthe problems of mineral deficiencies and toxicities mustbe addressed to maximise crop production in both inten-sive and extensive agricultural systems. The chemical con-straints to crop production on alkaline, acid, saline, andsodic soils can be addressed through agronomy or the devel-opment of tolerant genotypes. In intensive agriculturalsystems it is likely that inorganic fertilisers will continue to berequired to maintain yields. However, their use might be re-duced by agronomic strategies that improve fertiliser useefficiencies, by replacement with organic fertilisers, and byjudicious choice of genotypes that acquire and utilise mineralelements better in producing commercial yields. In extensiveagricultural systems integrated fertiliser management strate-gies using biological N2 fixation, nonacidifying inorganicfertilisers, and organic fertilisers and amendments to developsoil fertility can be usefully adopted. To increase the dietarydelivery of mineral elements essential to human wellbeing,agronomic strategies to increase the phytoavailability of these
8 Applied and Environmental Soil Science
elements combined with the cultivation of crops that acquireand accumulate greater concentrations of these elements intheir edible tissues can be pursued where there is sufficiencyof these elements present in the soil to support mineral-dense crops. However, where these essential elements are notpresent in the soil, the application of fertilisers containingthese elements is required to increase their amounts inhuman diets, if diets remain unchanged. To reduce the entryof toxic elements into the human food chain, strict qualityrequirements for inorganic and organic fertilisers might beenforced, agronomic strategies could be used to reduce thephytoavailability of these elements, and crop genotypes canbe developed that do not accumulate toxic concentrationsof mineral elements in their edible tissues. Thus, ongoinginterdisciplinary research in plant mineral nutrition, soilscience, agronomy, and crop breeding is required for futurefood security to improve soil quality, optimise fertiliserapplications for sustainable crop production, and developstrategies for the biofortification of edible crops with essen-tial mineral elements to address mineral malnutrition inhumans and other animals.
Acknowledgment
This paper is based on a talk given by P. J. White at the Euro-pean Geosciences Union General Assembly in April 2011.The work was supported by the Rural and Environment Sci-ence and Analytical Services Division (RESAS) of the ScottishGovernment through Work package 7.2 (2011–2016).
References
[1] Food and Agriculture Organization of the United Nations[FAO], The Strategic Framework for FAO: 2000–2015—ASummary, FAO, Rome, Italy, 2000.
[2] M. Lægreid, O. C. Bøckman, and O. Kaarstad, Agriculture,Fertilizers and the Environment, CABI Publishing, Walling-ford, UK, 1999.
[3] N. K. Fageria, V. C. Baligar, and C. A. Jones, Growth andMineral Nutrition of Field Crops, CRC Press, Boca Raton, Fla,USA, 3rd edition, 2011.
[4] P. J. White and P. H. Brown, “Plant nutrition for sustainabledevelopment and global health,” Annals of Botany, vol. 105,no. 7, pp. 1073–1080, 2010.
[5] D. I. Gregory and B. L. Bump, “Agriculture and rural devel-opment discussion paper 24. Factors affecting supply of fer-tilizer in Sub-Saharan Africa,” The World Bank, Washington,DC, USA, 2005.
[6] C. Nellemann, M. MacDevette, T. Manders et al., “The envi-ronmental food crisis. The environment’s role in averting fu-ture food crises. A UNEP rapid response assessment,”Birkeland Trykkeri AS, Norway, 2009.
[7] P. M. Vitousek, R. Naylor, T. Crews et al., “Nutrient im-balances in agricultural development,” Science, vol. 324, no.5934, pp. 1519–1520, 2009.
[8] C. J. Dawson and J. Hilton, “Fertiliser availability in a re-source-limited world: production and recycling of nitrogenand phosphorus,” Food Policy, vol. 36, no. 1, supplement, pp.S14–S22, 2011.
[9] P. J. White, “Ion uptake mechanisms of individual cellsand roots: short-distance transport,” in Marschner’s Mineral
Nutrition of Higher Plants, P. Marschner, Ed., pp. 7–47,Academic Press, London, UK, 3rd edition, 2012.
[10] P. J. White and D. J. Greenwood, “Properties and manage-ment of cationic elements for crop growth,” in Russell’s SoilConditions and Plant Growth, P. J. Gregory and S. Nortcliff,Eds., Wiley-Blackwell, Oxford, UK, 12th edition, 2012.
[11] P. J. White and M. R. Broadley, “Biofortifying crops withessential mineral elements,” Trends in Plant Science, vol. 10,no. 12, pp. 586–593, 2005.
[12] R. D. Graham, R. M. Welch, D. A. Saunders et al., “NutritiousSubsistence Food Systems,” Advances in Agronomy, vol. 92,pp. 1–74, 2007.
[13] A. J. Stein, “Global impacts of human mineral malnutrition,”Plant and Soil, vol. 335, no. 1, pp. 133–154, 2010.
[14] P. J. White and M. R. Broadley, “Biofortification of crops withseven mineral elements often lacking in human diets—iron,zinc, copper, calcium, magnesium, selenium and iodine,”New Phytologist, vol. 182, no. 1, pp. 49–84, 2009.
[15] H. E. Bouis and R. M. Welch, “Biofortification—a sustainableagricultural strategy for reducing micronutrient malnutri-tion in the Global South,” Crop Science, vol. 50, pp. S20–S32,2010.
[16] A. J. Karley and P. J. White, “Moving cationic minerals to edi-ble tissues: potassium, magnesium, calcium,” Current Opin-ion in Plant Biology, vol. 12, no. 3, pp. 291–298, 2009.
[17] E. Frossard, M. Bucher, F. Machler, A. Mozafar, and R. Hur-rell, “Potential for increasing the content and bioavailabilityof Fe, Zn and Ca in plants for human nutrition,” Journal ofthe Science of Food and Agriculture, vol. 80, no. 7, pp. 861–879, 2000.
[18] Z. Rengel, “Genotypic differences in micronutrient use effi-ciency in crops,” Communications in Soil Science and PlantAnalysis, vol. 32, no. 7-8, pp. 1163–1186, 2001.
[19] M. R. Broadley, P. J. White, J. P. Hammond, I. Zelko, andA. Lux, “Zinc in plants: tansley review,” New Phytologist, vol.173, no. 4, pp. 677–702, 2007.
[20] I. Cakmak, “Enrichment of fertilizers with zinc: an excellentinvestment for humanity and crop production in India,”Journal of Trace Elements in Medicine and Biology, vol. 23, no.4, pp. 281–289, 2009.
[21] N. K. Fageria, The Use of Nutrients in Crop Plants, CRC Press,Boca Raton, Fla, USA, 2009.
[22] S. R. Wilkinson, R. M. Welch, H. F. Mayland, and D. L.Grunes, “Magnesium in plants: uptake, distribution, func-tion, and utilization by man and animals,” Metal Ions in Bio-logical Systems, vol. 26, pp. 33–56, 1990.
[23] G. H. Lyons, J. C. R. Stangoulis, and R. D. Graham, “Exploit-ing micronutrient interaction to optimize biofortificationprograms: the case for inclusion of selenium and iodine inthe HarvestPlus program,” Nutrition Reviews, vol. 62, no. 6,pp. 247–252, 2004.
[24] J. F. Risher and L. S. Keith, Iodine and Inorganic Iodides: Hu-man Health Aspects, WHO Press, Geneva, Switzerland, 2009.
[25] H. Hartikainen, “Biogeochemistry of selenium and its impacton food chain quality and human health,” Journal of TraceElements in Medicine and Biology, vol. 18, no. 4, pp. 309–318,2005.
[26] M. R. Broadley, P. J. White, R. J. Bryson et al., “Biofortifica-tion of UK food crops with selenium,” Proceedings of the Nu-trition Society, vol. 65, no. 2, pp. 169–181, 2006.
[27] I. Cakmak, “Enrichment of cereal grains with zinc: agro-nomic or genetic biofortification?” Plant and Soil, vol. 302,no. 1-2, pp. 1–17, 2008.
Applied and Environmental Soil Science 9
[28] E. George, W. J. Horst, and E. Neumann, “Adaptation ofplants to adverse chemical soil conditions,” in Marschner’sMineral Nutrition of Higher Plants, P. Marschner, Ed., pp.409–472, Academic Press, London, UK, 3rd edition, 2012.
[29] H. R. von Uexkull and E. Mutert, “Global extent, develop-ment and economic impact of acid soils,” Plant and Soil, vol.171, no. 1, pp. 1–15, 1995.
[30] M. E. Sumner and A. D. Noble, “Soil acidification: the worldstory,” in Handbook of Soil Acidity, Z. Rengel, Ed., pp. 1–28,Marcel Dekker, New York, NY, USA, 2003.
[31] R. Munns and M. Tester, “Mechanisms of salinity tolerance,”Annual Review of Plant Biology, vol. 59, pp. 651–681, 2008.
[32] S. N. Whiting, R. D. Reeves, D. G. Richards et al., “Use ofplants to manage sites contaminated with metals,” in PlantNutritional Genomics, M. R. Broadley and P. J. White, Eds.,pp. 287–315, Blackwell Publishing, Oxford, UK, 2005.
[33] P. J. White, M. R. Broadley, H. C. Bowen, and S. E. Johnson,“Selenium and its relationship with sufur,” in Sulfur inPlants—An Ecological Perspective, M. J. Hawkesford and L.J. de Kok, Eds., pp. 225–252, Springer, Dordrecht, TheNetherlands, 2007.
[34] Z. L. He, X. E. Yang, and P. J. Stoffella, “Trace elements inagroecosystems and impacts on the environment,” Journal ofTrace Elements in Medicine and Biology, vol. 19, no. 2-3, pp.125–140, 2005.
[35] P. Higueras, R. Oyarzun, J. Lillo et al., “The Almadendistrict (Spain): anatomy of one of the world’s largest Hg-contaminated sites,” Science of the Total Environment, vol.356, no. 1-3, pp. 112–124, 2006.
[36] F. J. Zhao, S. P. McGrath, and A. A. Meharg, “Arsenic as afood chain contaminant: mechanisms of plant uptake andmetabolism and mitigation strategies,” Annual Review ofPlant Biology, vol. 61, pp. 535–559, 2010.
[37] L. T. Evans, “Adapting and improving crops: the endless task,”Philosophical Transactions of the Royal Society B, vol. 352, no.1356, pp. 901–906, 1997.
[38] H. C. J. Godfray, J. R. Beddington, I. R. Crute et al., “Foodsecurity: the challenge of feeding 9 billion people,” Science,vol. 327, no. 5967, pp. 812–818, 2010.
[39] N. Koning and M. K. van Ittersum, “Will the world haveenough to eat?” Current Opinion in Environmental Sustain-ability, vol. 1, no. 1, pp. 77–82, 2009.
[40] P. J. Gregory and T. S. George, “Feeding nine billion: thechallenge to sustainable crop production,” Journal of Experi-mental Botany, vol. 62, no. 15, pp. 5233–5239, 2011.
[41] J. Bruinsma, “The resource outlook to 2050: by how muchdo land, water, and crop yields need to increase by 2050?” inProceedings of the FAO Expert Meeting on ‘How to Feed theWorld in 2050, FAO, Rome, Italy, June 2009.
[42] J. Bruinsma, World Agriculture: Towards 2015/2030. An FAOPerspective, Earthscan Publications, London, UK, 2003.
[43] Food and Agriculture Organization of the United Nations[FAO], The State of Food and Agriculture 2008. Biofuels:Prospects, Risks and Opportunities, FAO, Rome, Italy, 2008.
[44] P. Pingali, T. Raney, and K. Wiebe, “Biofuels and food secu-rity: missing the point,” Review of Agricultural Economics, vol.30, no. 3, pp. 506–516, 2008.
[45] P. Smith, P. J. Gregory, D. Van Vuuren et al., “Competition forland,” Philosophical Transactions of the Royal Society B, vol.365, no. 1554, pp. 2941–2957, 2010.
[46] J. W. Erisman, M. A. Sutton, J. Galloway, Z. Klimont, and W.Winiwarter, “How a century of ammonia synthesis changedthe world,” Nature Geoscience, vol. 1, no. 10, pp. 636–639,2008.
[47] D. B. Lobell, K. G. Cassman, and C. B. Field, “Crop yield gaps:their importance, magnitudes, and causes,” Annual Review ofEnvironment and Resources, vol. 34, pp. 179–204, 2009.
[48] K. Neumann, P. H. Verburg, E. Stehfest, and C. Muller,“The yield gap of global grain production: a spatial analysis,”Agricultural Systems, vol. 103, no. 5, pp. 316–326, 2010.
[49] The World Bank, World Development Report 2008. Agriculturefor Development, The World Bank, Washington DC, USA,2007.
[50] K. W. Jaggard, A. Qi, and S. Ober, “Possible changes to arablecrop yields by 2050,” Philosophical Transactions of the RoyalSociety B, vol. 365, no. 1554, pp. 2835–2851, 2010.
[51] E. C. Oerke, “Crop losses to pests,” Journal of AgriculturalScience, vol. 144, no. 1, pp. 31–43, 2006.
[52] J. F. Ma, P. R. Ryan, and E. Delhaize, “Aluminium tolerancein plants and the complexing role of organic acids,” Trends inPlant Science, vol. 6, no. 6, pp. 273–278, 2001.
[53] L. V. Kochian, O. A. Hoekenga, and M. A. Pineros, “Howdo crop plants tolerate acid soils? Mechanisms of aluminumtolerance and phosphorous efficiency,” Annual Review ofPlant Biology, vol. 55, pp. 459–493, 2004.
[54] E. Delhaize, B. D. Gruber, and P. R. Ryan, “The roles oforganic anion permeases in aluminium resistance and min-eral nutrition,” FEBS Letters, vol. 581, no. 12, pp. 2255–2262,2007.
[55] R. D. Graham, “Genotype differences in tolerance to man-ganese deficiency,” in Manganese in Soils and Plants, R. D.Graham, R. J. Hannam, and N. C. Uren, Eds., pp. 261–276,Kluwer Academic Publishers, Dordrecht, The Netherlands,1988.
[56] G. Hacisalihoglu and L. V. Kochian, “How do some plantstolerate low levels of soil zinc? Mechanisms of zinc efficiencyin crop plants,” New Phytologist, vol. 159, no. 2, pp. 341–350,2003.
[57] V. D. Jolley, K. A. Cook, N. C. Hansen, and W. B. Stevens,“Plant physiological responses for genotypic evaluation ofiron efficiency in strategy I and strategy II plants—a review,”Journal of Plant Nutrition, vol. 19, no. 8-9, pp. 1241–1255,1996.
[58] I. Evans, E. Solberg, and D. M. Huber, “Copper and plantdisease,” in Mineral Nutrition and Plant Disease, L. E.Datnoff, W. H. Elmer, and D. M. Huber, Eds., pp. 177–188, The American Phytopathological Society, St Paul, Minn,USA, 2007.
[59] M. Hodson, “Managing adverse soil chemical environments,”in Russell’s Soil Conditions and Plant Growth, P. J. Gregory andS. Nortcliff, Eds., Wiley-Blackwell, Oxford, UK, 12th edition,2012.
[60] P. J. White and M. R. Broadley, “Chloride in soils and itsuptake and movement within the plant: a review,” Annals ofBotany, vol. 88, no. 6, pp. 967–988, 2001.
[61] D. G. Masters, S. E. Benes, and H. C. Norman, “Biosalineagriculture for forage and livestock production,” Agriculture,Ecosystems and Environment, vol. 119, no. 3-4, pp. 234–248,2007.
[62] R. Reid, “Can we really increase yields by making crop plantstolerant to boron toxicity?” Plant Science, vol. 178, no. 1, pp.9–11, 2010.
[63] S. J. Roy, E. J. Tucker, and M. Tester, “Genetic analysis ofabiotic stress tolerance in crops,” Current Opinion in PlantBiology, vol. 14, no. 3, pp. 232–239, 2011.
[64] K. Miwa and T. Fujiwara, “Boron transport in plants: co-ordinated regulation of transporters,” Annals of Botany, vol.105, no. 7, pp. 1103–1108, 2010.
10 Applied and Environmental Soil Science
[65] J. P. Lynch, “Roots of the second green revolution,” AustralianJournal of Botany, vol. 55, no. 5, pp. 493–512, 2007.
[66] E. A. Kirkby and A. E. Johnson, “Soil and fertilizer phos-phorus in relation to crop nutrition,” in The Ecophysiologyof Plant-Phosphorus Interactions, P. J. White and J. P.Hammond, Eds., pp. 177–223, Springer, Dordrecht, TheNetherlands, 2008.
[67] R. N. Roy, A. Finck, G. J. Blair, and H. L. S. Tandon, FAOFertilizer and Plant Nutrition Bulletin 16. Plant Nutrition forFood Security. A Guide for Integrated Nutrient Management,FAO, Rome, Italy, 2006.
[68] J. C. Hargreaves, M. S. Adl, and P. R. Warman, “A review ofthe use of composted municipal solid waste in agriculture,”Agriculture, Ecosystems and Environment, vol. 123, no. 1-3,pp. 1–14, 2008.
[69] Department for Environment, Food and Rural Affairs[Defra], Fertiliser Manual (RB209), The Stationery Office,London, UK, 8th edition, 2010.
[70] F. J. Garcıa Navarro, J. A. Amoros ortiz-Villajos, C. J. SanchezJimenez, S. B. Martın-Consuegra, E. M. Cubero, and R. J.Ballesta, “Application of sugar foam to red soils in a semiaridMediterranean environment,” Environmental Earth Sciences,vol. 59, no. 3, pp. 603–611, 2009.
[71] J. P. Hammond and P. J. White, “Diagnosing phosphorusdeficiency in crop plants,” in The Ecophysiology of Plant-Phosphorus Interactions, P. J. White and J. P. Hammond, Eds.,pp. 225–246, Springer, Dordrecht, The Netherlands, 2008.
[72] K. Zhang, D. J. Greenwood, P. J. White, and I. G. Burns,“A dynamic model for the combined effects of N, P and Kfertilizers on yield and mineral composition; description andexperimental test,” Plant and Soil, vol. 298, no. 1-2, pp. 81–98, 2007.
[73] R. Gebbers and V. I. Adamchuk, “Precision agriculture andfood security,” Science, vol. 327, no. 5967, pp. 828–831, 2010.
[74] R. J. Bryson, Proceedings of The International Fertiliser Society577. Improvement in Farm and Nutrient Management throughPrecision Farming, IFS, York, UK, 2005.
[75] I. G. Burns, J. P. Hammond, and P. J. White, “Precisionplacement of fertiliser for optimising the early nutrition ofvegetable crops—a review of the implications for the yieldand quality of crops, and their nutrient use efficiency,” ActaHorticulturae, vol. 852, pp. 177–188, 2010.
[76] M. Herrero, P. K. Thornton, A. M. Notenbaert et al., “Smartinvestments in sustainable food production: revisiting mixedcrop-livestock systems,” Science, vol. 327, no. 5967, pp. 822–825, 2010.
[77] P. Hallett and A. G. Bengough, “Managing the soil physicalenvironment for plants,” in Russell’s Soil Conditions and PlantGrowth, P. J. Gregory and S. Nortcliff, Eds., Wiley-Blackwell,Oxford, UK, 12th edition, 2012.
[78] G. Hardarson and W. J. Broughton, Maximising the Use ofBiological Nitrogen Fixation in Agriculture, Kluwer AcademicPublishers, Dordrecht, The Netherlands, 2003.
[79] P. J. White, M. R. Broadley, D. J. Greenwood, and J. P.Hammond, Proceedings of The International Fertiliser Society568. Genetic Modifications to Improve Phosphorus Acquisitionby Roots, IFS, York, UK, 2005.
[80] B. Hirel, J. Le Gouis, B. Ney, and A. Gallais, “The challengeof improving nitrogen use efficiency in crop plants: towardsa more central role for genetic variability and quantitativegenetics within integrated approaches,” Journal of Experi-mental Botany, vol. 58, no. 9, pp. 2369–2387, 2007.
[81] Z. Rengel and P. M. Damon, “Crops and genotypes differin efficiency of potassium uptake and use,” PhysiologiaPlantarum, vol. 133, no. 4, pp. 624–636, 2008.
[82] P. J. White and J. P. Hammond, “Phosphorus nutrition ofterrestrial plants,” in The Ecophysiology of Plant—PhosphorusInteractions, P. J. White and J. P. Hammond, Eds., pp. 51–81,Springer, Dordrecht, The Netherlands, 2008.
[83] R. Sylvester-Bradley and D. R. Kindred, “Analysing nitrogenresponses of cereals to prioritize routes to the improvementof nitrogen use efficiency,” Journal of Experimental Botany,vol. 60, no. 7, pp. 1939–1951, 2009.
[84] P. J. White, J. P. Hammond, G. J. King et al., “Genetic analysisof potassium use efficiency in Brassica oleracea,” Annals ofBotany, vol. 105, no. 7, pp. 1199–1210, 2010.
[85] P. B. Barraclough, J. R. Howarth, J. Jones et al., “Nitrogen effi-ciency of wheat: genotypic and environmental variation andprospects for improvement,” European Journal of Agronomy,vol. 33, no. 1, pp. 1–11, 2010.
[86] P. H. Beatty, Y. Anbessa, P. Juskiw, R. T. Carroll, J. Wang, andA. G. Good, “Nitrogen use efficiencies of spring barley grownunder varying nitrogen conditions in the field and growthchamber,” Annals of Botany, vol. 105, no. 7, pp. 1171–1182,2010.
[87] I. J. Bingham, A. J. Karley, P. J. White, W. T. B. Thomas,and J. R. Russell, “Analysis of improvements in nitrogenuse efficiency associated with 75 years of barley breeding,”European Journal of Agronomy. In press.
[88] P. M. Berry, J. Spink, M. J. Foulkes, and P. J. White, “Thephysiological basis of genotypic differences in nitrogen useefficiency in oilseed rape (Brassica napus L.),” Field CropsResearch, vol. 119, no. 2-3, pp. 365–373, 2010.
[89] J. P. Hammond, M. R. Broadley, P. J. White et al., “Shootyield drives phosphorus use efficiency in Brassica oleraceaand correlates with root architecture traits,” Journal ofExperimental Botany, vol. 60, no. 7, pp. 1953–1968, 2009.
[90] A. Fita, F. Nuez, and B. Pico, “Diversity in root architectureand response to P deficiency in seedlings of Cucumis melo L,”Euphytica, vol. 181, no. 3, pp. 323–339, 2011.
[91] J. J. Ni, P. Wu, D. Senadhira, and N. Huang, “Mapping QTLsfor phosphorus deficiency tolerance in rice (Oryza sativa L.),”Theoretical and Applied Genetics, vol. 97, no. 8, pp. 1361–1369, 1998.
[92] F. Ming, X. Zheng, G. Mi, L. Zhu, and F. Zhang, “Detectionand verification of quantitative trait loci affecting toleranceto low phosphorus in rice,” Journal of Plant Nutrition, vol.24, no. 9, pp. 1399–1408, 2001.
[93] P. Mu, C. Huang, J. X. Li, L. F. Liu, and Z. C. Li, “Yieldtrait variation and QTL mapping in a DH population of riceunder phosphorus deficiency,” Acta Agronomica Sinica, vol.34, no. 7, pp. 1137–1142, 2008.
[94] S. Heuer, X. Lu, J. H. Chin et al., “Comparative sequenceanalyses of the major quantitative trait locus phosphorusuptake 1 (Pup1) reveal a complex genetic structure,” PlantBiotechnology Journal, vol. 7, no. 5, pp. 456–471, 2009.
[95] J. Li, Y. Xie, A. Dai, L. Liu, and Z. Li, “Root and shoottraits responses to phosphorus deficiency and QTL analysisat seedling stage using introgression lines of rice,” Journal ofGenetics and Genomics, vol. 36, no. 3, pp. 173–183, 2009.
[96] J. H. Chin, R. Gamuyao, C. Dalid et al., “Developing rice withhigh yield under phosphorus deficiency: Pup1 sequence toapplication,” Plant Physiology, vol. 156, no. 3, pp. 1202–1216,2011.
[97] J. Su, Y. Xiao, M. Li et al., “Mapping QTLs for phosphorus-deficiency tolerance at wheat seedling stage,” Plant and Soil,vol. 281, no. 1-2, pp. 25–36, 2006.
[98] J. Y. Su, Q. Zheng, H. W. Li et al., “Detection of QTLsfor phosphorus use efficiency in relation to agronomicperformance of wheat grown under phosphorus sufficient
Applied and Environmental Soil Science 11
and limited conditions,” Plant Science, vol. 176, no. 6, pp.824–836, 2009.
[99] J. Chen, L. Xu, Y. Cai, and J. Xu, “QTL mapping of phos-phorus efficiency and relative biologic characteristics inmaize (Zea mays L.) at two sites,” Plant and Soil, vol. 313,no. 1-2, pp. 251–266, 2008.
[100] J. Chen, L. Xu, Y. Cai, and J. Xu, “Identification of QTLsfor phosphorus utilization efficiency in maize (Zea mays L.)across P levels,” Euphytica, vol. 167, no. 2, pp. 245–252, 2009.
[101] M. Li, X. Guo, M. Zhang et al., “Mapping QTLs for grainyield and yield components under high and low phosphorustreatments in maize (Zea mays L.),” Plant Science, vol. 178,no. 5, pp. 454–462, 2010.
[102] H. Liao, X. Yan, G. Rubio, S. E. Beebe, M. W. Blair, and J.P. Lynch, “Genetic mapping of basal root gravitropism andphosphorus acquisition efficiency in common bean,” Func-tional Plant Biology, vol. 31, no. 10, pp. 959–970, 2004.
[103] S. E. Beebe, M. Rojas-Pierce, X. Yan et al., “Quantitative traitloci for root architecture traits correlated with phosphorusacquisition in common bean,” Crop Science, vol. 46, no. 1,pp. 413–423, 2006.
[104] I. E. Ochoa, M. W. Blair, and J. P. Lynch, “QTL analysis ofadventitious root formation in common bean under contras-ting phosphorus availability,” Crop Science, vol. 46, no. 4, pp.1609–1621, 2006.
[105] K. A. Cichy, M. W. Blair, C. H. Galeano Mendoza, S. S. Snapp,and J. D. Kelly, “QTL analysis of root architecture traits andlow phosphorus tolerance in an andean bean population,”Crop Science, vol. 49, no. 1, pp. 59–68, 2009.
[106] Y. D. Li, Y. J. Wang, Y. P. Tong, J. G. Gao, J. S. Zhang, and S. Y.Chen, “QTL mapping of phosphorus deficiency tolerance insoybean (Glycine max L. Merr.),” Euphytica, vol. 142, no. 1-2,pp. 137–142, 2005.
[107] D. Zhang, H. Cheng, L. Geng et al., “Detection of quantitativetrait loci for phosphorus deficiency tolerance at soybeanseedling stage,” Euphytica, vol. 167, no. 3, pp. 313–322, 2009.
[108] Q. Liang, X. Cheng, M. Mei, X. Yan, and H. Liao, “QTLanalysis of root traits as related to phosphorus efficiency insoybean,” Annals of Botany, vol. 106, no. 1, pp. 223–234, 2010.
[109] J. Zhao, D. C. L. Jamar, P. Lou et al., “Quantitative trait locianalysis of phytate and phosphate concentrations in seedsand leaves of Brassica rapa,” Plant, Cell and Environment, vol.31, no. 7, pp. 887–900, 2008.
[110] J. P. Hammond, S. Mayes, H. C. Bowen et al., “Regulatoryhotspots are associated with plant gene expression undervarying soil phosphorus supply in Brassica rapa,” PlantPhysiology, vol. 156, no. 3, pp. 1230–1241, 2011.
[111] M. Yang, G. Ding, L. Shi, J. Feng, F. Xu, and J. Meng,“Quantitative trait loci for root morphology in response tolow phosphorus stress in Brassica napus,” Theoretical andApplied Genetics, vol. 121, no. 1, pp. 181–193, 2010.
[112] M. Yang, G. Ding, L. Shi, F. Xu, and J. Meng, “Detection ofQTL for phosphorus efficiency at vegetative stage in Brassicanapus,” Plant and Soil, vol. 339, no. 1, pp. 97–111, 2011.
[113] S. P. Trehan, “Nutrient management by exploiting geneticdiversity of potato—a review,” Potato Journal, vol. 32, pp. 1–15, 2005.
[114] P. J. White and A. J. Karley, “Potassium,” in Plant Cell Mono-graphs 17, Cell Biology of Metals and Nutrients, R. Hell andR.-R. Mendel, Eds., pp. 199–224, Springer, Dordrecht, TheNetherlands, 2010.
[115] V. C. Baligar, N. K. Fageria, and Z. L. He, “Nutrient use ef-ficiency in plants,” Communications in Soil Science and PlantAnalysis, vol. 32, no. 7-8, pp. 921–950, 2001.
[116] I. Cakmak, Proceedings of the International Fertiliser Society552. Identification and Correction of Widespread Zinc Defi-ciency in Turkey—A Success Story, IFS, York, UK, 2004.
[117] T. Johns and P. B. Eyzaguirre, “Biofortification, biodiversityand diet: a search for complementary applications againstpoverty and malnutrition,” Food Policy, vol. 32, no. 1, pp. 1–24, 2007.
[118] W. H. Pfeiffer and B. McClafferty, “HarvestPlus: breedingcrops for better nutrition,” Crop Science, vol. 47, pp. S88–S105, 2007.
[119] A. H. Khoshgoftarmanesh, R. Schulin, R. L. Chaney, B.Daneshbakhsh, and M. Afyuni, “Micronutrient-efficientgenotypes for crop yield and nutritional quality in sustain-able agriculture. A review,” Agronomy for Sustainable Devel-opment, vol. 30, no. 1, pp. 83–107, 2010.
[120] X. He and K. Nara, “Element biofortification: can myc-orrhizas potentially offer a more effective and sustainablepathway to curb human malnutrition?” Trends in PlantScience, vol. 12, no. 8, pp. 331–333, 2007.
[121] H. L. Hao, Y. Z. Wei, X. E. Yang, Y. Feng, and C. Y. Wu,“Effects of different nitrogen fertilizer levels on Fe, Mn, Cuand Zn concentrations in shoot and grain quality in rice(Oryza sativa),” Rice Science, vol. 14, no. 4, pp. 289–294, 2007.
[122] R. Shi, Y. Zhang, X. Chen et al., “Influence of long-termnitrogen fertilization on micronutrient density in grain ofwinter wheat (Triticum aestivum L.),” Journal of Cereal Sci-ence, vol. 51, no. 1, pp. 165–170, 2010.
[123] U. B. Kutman, B. Yildiz, and I. Cakmak, “Improved nitrogenstatus enhances zinc and iron concentrations both in thewhole grain and the endosperm fraction of wheat,” Journalof Cereal Science, vol. 53, pp. 118–125, 2011.
[124] U. B. Kutman, B. Yildiz, and I. Cakmak, “Effect of nitrogenon uptake, remobilization and partitioning of zinc and ironthroughout the development of durum wheat,” Plant andSoil, vol. 342, no. 1-2, pp. 149–164, 2011.
[125] P. J. White and M. R. Broadley, “Physiological limits to zincbiofortification of edible crops,” Frontiers in Plant Nutrition,vol. 2, article 80, 2011.
[126] F. J. Zhao and S. P. McGrath, “Biofortification and phytore-mediation,” Current Opinion in Plant Biology, vol. 12, no. 3,pp. 373–380, 2009.
[127] B. M. Waters and R. P. Sankaran, “Moving micronutrientsfrom the soil to the seeds: genes and physiological processesfrom a biofortification perspective,” Plant Science, vol. 180,no. 4, pp. 562–574, 2011.
[128] P. Ekholm, H. Reinivuo, P. Mattila et al., “Changes in themineral and trace element contents of cereals, fruits andvegetables in Finland,” Journal of Food Composition andAnalysis, vol. 20, no. 6, pp. 487–495, 2007.
[129] X. M. Jiang, X. Y. Cao, J. Y. Jiang et al., “Dynamics of envi-ronmental supplementation of iodine: four years’ experienceof iodination of irrigation water in Hotien, Xinjiang, China,”Archives of Environmental Health, vol. 52, no. 6, pp. 399–408,1997.
[130] E. Zapata-Caldas, G. Hyman, H. Pachon, F. A. Monserrate,and L. V. Varela, “Identifying candidate sites for crop bio-fortification in Latin America: case studies in Colombia,Nicaragua and Bolivia,” International Journal of Health Geo-graphics, vol. 8, no. 1, article 29, 2009.
[131] G. B. Gregorio, D. Senadhira, H. Htut, and R. D. Graham,“Breeding for trace mineral density in rice,” Food andNutrition Bulletin, vol. 21, no. 4, pp. 382–386, 2000.
[132] J. C. R. Stangoulis, B. L. Huynh, R. M. Welch, E. Y. Choi,and R. D. Graham, “Quantitative trait loci for phytate in
12 Applied and Environmental Soil Science
rice grain and their relationship with grain micronutrientcontent,” Euphytica, vol. 154, no. 3, pp. 289–294, 2007.
[133] K. Lu, L. Li, X. Zheng, Z. Zhang, T. Mou, and Z. Hu,“Quantitative trait loci controlling Cu, Ca, Zn, Mn and Fecontent in rice grains,” Journal of Genetics, vol. 87, no. 3, pp.305–310, 2008.
[134] A. L. Garcia-Oliveira, L. Tan, Y. Fu, and C. Sun, “Geneticidentification of quantitative trait loci for contents of mineralnutrients in rice grain,” Journal of Integrative Plant Biology,vol. 51, no. 1, pp. 84–92, 2009.
[135] G. J. Norton, C. M. Deacon, L. Xiong, S. Huang, A. A.Meharg, and A. H. Price, “Genetic mapping of the riceionome in leaves and grain: identification of QTLs for 17 ele-ments including arsenic, cadmium, iron and selenium,” Plantand Soil, vol. 329, no. 1, pp. 139–153, 2010.
[136] X. Zhang, G. Zhang, L. Guo et al., “Identification ofquantitative trait loci for Cd and Zn concentrations of brownrice grown in Cd-polluted soils,” Euphytica, vol. 180, no. 2,pp. 173–179, 2011.
[137] A. Distelfeld, I. Cakmak, Z. Peleg et al., “Multiple QTL-effectsof wheat Gpc-B1 locus on grain protein and micronutrientconcentrations,” Physiologia Plantarum, vol. 129, no. 3, pp.635–643, 2007.
[138] R. Shi, H. Li, Y. Tong, R. Jing, F. Zhang, and C. Zou, “Iden-tification of quantitative trait locus of zinc and phosphorusdensity in wheat (Triticum aestivum L.) grain,” Plant and Soil,vol. 306, no. 1-2, pp. 95–104, 2008.
[139] Y. Genc, A. P. Verbyla, A. A. Torun et al., “Quantitative traitloci analysis of zinc efficiency and grain zinc concentration inwheat using whole genome average interval mapping,” Plantand Soil, vol. 314, no. 1-2, pp. 49–66, 2009.
[140] Z. Peleg, I. Cakmak, L. Ozturk et al., “Quantitative trait lociconferring grain mineral nutrient concentrations in durumwheat × wild emmer wheat RIL population,” Theoretical andApplied Genetics, vol. 119, no. 2, pp. 353–369, 2009.
[141] P. F. Lonergan, M. A. Pallotta, M. Lorimer, J. G. Paull, S. J.Barker, and R. D. Graham, “Multiple genetic loci for zincuptake and distribution in barley (Hordeum vulgare),” NewPhytologist, vol. 184, no. 1, pp. 168–179, 2009.
[142] B. Sadeghzadeh, Z. Rengel, C. Li, and H. Yang, “Molecularmarker linked to a chromosome region regulating seed Znaccumulation in barley,” Molecular Breeding, vol. 25, no. 1,pp. 167–177, 2009.
[143] M. G. Lung’aho, A. M. Mwaniki, S. J. Szalma et al., “Geneticand physiological analysis of iron biofortification in MaizeKernels,” PLoS ONE, vol. 6, no. 6, article e20429, 2011.
[144] D. Simic, S. Mladenovic Drinic, Z. Zdunic et al., “Quan-titative trait loci for biofortification traits in maize grain,”Journal of Heredity, vol. 103, no. 1, pp. 47–54, 2012.
[145] S. Beebe, A. V. Gonzalez, and J. Rengifo, “Research on traceminerals in the common bean,” Food and Nutrition Bulletin,vol. 21, no. 4, pp. 387–391, 2000.
[146] S. H. Guzman-Maldonado, O. Martınez, J. A. Acosta-Gallegos, F. Guevara-Lara, and O. Paredes-Lopez, “Putativequantitative trait loci for physical and chemical componentsof common bean,” Crop Science, vol. 43, no. 3, pp. 1029–1035,2003.
[147] K. A. Cichy, S. Forster, K. F. Grafton, and G. L. Hosfield,“Inheritance of seed zinc accumulation in navy bean,” CropScience, vol. 45, no. 3, pp. 864–870, 2005.
[148] J. R. Gelin, S. Forster, K. F. Grafton, P. E. McClean, and G.A. Rojas-Cifuentes, “Analysis of seed zinc and other mineralsin a recombinant inbred population of navy bean (Phaseolusvulgaris L.),” Crop Science, vol. 47, no. 4, pp. 1361–1366, 2007.
[149] M. W. Blair, C. Astudillo, M. A. Grusak, R. Graham, and S. E.Beebe, “Inheritance of seed iron and zinc concentrations in
common bean (Phaseolus vulgaris L.),” Molecular Breeding,vol. 23, no. 2, pp. 197–207, 2009.
[150] K. A. Cichy, G. V. Caldas, S. S. Snapp, and M. W. Blair,“QTL analysis of seed iron, zinc, and phosphorus levels inan andean bean population,” Crop Science, vol. 49, no. 5, pp.1742–1750, 2009.
[151] M. W. Blair, J. I. Medina, C. Astudillo et al., “QTL for seediron and zinc concentration and content in a Mesoamericancommon bean (Phaseolus vulgaris L.) population,” Theoreti-cal and Applied Genetics, vol. 121, no. 6, pp. 1059–1070, 2010.
[152] M. W. Blair, C. Astudillo, J. Rengifo, S. E. Beebe, and R.Graham, “QTL analyses for seed iron and zinc concentrationsin an intra-genepool population of Andean common beans(Phaseolus vulgaris L.),” Theoretical and Applied Genetics, vol.122, no. 3, pp. 511–521, 2011.
[153] B. Zhang, P. Chen, A. Shi, A. Hou, T. Ishibashi, and D. Wang,“Putative quantitative trait loci associated with calciumcontent in soybean seed,” Journal of Heredity, vol. 100, no.2, pp. 263–269, 2009.
[154] G. Ding, M. Yang, Y. Hu et al., “Quantitative trait lociaffecting seed mineral concentrations in Brassica napusgrown with contrasting phosphorus supplies,” Annals ofBotany, vol. 105, no. 7, pp. 1221–1234, 2010.
[155] M. R. Broadley, J. P. Hammond, G. J. King et al., “Shoot cal-cium and magnesium concentrations differ between subtaxa,are highly heritable, and associate with potentially pleiotropicloci in Brassica oleracea,” Plant Physiology, vol. 146, no. 4, pp.1707–1720, 2008.
[156] M. R. Broadley, S. O. Lochlainn, J. P. Hammond et al., “Shootzinc (Zn) concentration varies widely within Brassica oleraceaL. and is affected by soil Zn and phosphorus (P) levels,”Journal of Horticultural Science and Biotechnology, vol. 85, no.5, pp. 375–380, 2010.
[157] J. Wu, Y. X. Yuan, X. W. Zhang et al., “Mapping QTLs formineral accumulation and shoot dry biomass under differentZn nutritional conditions in Chinese cabbage (Brassica rapaL. ssp. pekinensis),” Plant and Soil, vol. 310, no. 1-2, pp. 25–40, 2008.
[158] M. R. Broadley, J. P. Hammond, G. J. King et al., “Biofor-tifying Brassica with calcium (Ca) and magnesium (Mg),”in Proceedings of the 16th International Plant NutritionColloquium, Paper 1256, 2009.
[159] N. K. Subramanian, Genetics of mineral accumulation inpotato tubers, Ph.D. thesis, University of Nottingham, UK,2012.
[160] P. Lucca, S. Poletti, and C. Sautter, “Genetic engineeringapproaches to enrich rice with iron and vitamin A,” Physi-ologia Plantarum, vol. 126, no. 3, pp. 291–303, 2006.
[161] A. A.T. Johnson, B. Kyriacou, D. L. Callahan et al., “Constitu-tive overexpression of the OsNAS gene family reveals single-gene strategies for effective iron- and zinc-biofortification ofrice endosperm,” PLoS ONE, vol. 6, no. 9, article e24476,2011.
[162] R. Sayre, J. R. Beeching, E. B. Cahoon et al., “The biocassavaplus program: biofortification of cassava for sub-SaharanAfrica,” Annual Review of Plant Biology, vol. 62, pp. 251–272,2011.
[163] M. Vasconcelos, K. Datta, N. Oliva et al., “Enhanced iron andzinc accumulation in transgenic rice with the ferritin gene,”Plant Science, vol. 164, no. 3, pp. 371–378, 2003.
[164] M. Suzuki, K. C. Morikawa, H. Nakanishi et al., “Transgenicrice lines that include barley genes have increased tolerance tolow iron availability in a calcareous paddy soil,” Soil Scienceand Plant Nutrition, vol. 54, no. 1, pp. 77–85, 2008.
Applied and Environmental Soil Science 13
[165] S. Nandi, Y. A. Suzuki, J. Huang et al., “Expression of humanlactoferrin in transgenic rice grains for the application ininfant formula,” Plant Science, vol. 163, no. 4, pp. 713–722,2002.
[166] M. Vasconcelos, H. Eckert, V. Arahana, G. Graef, M. A.Grusak, and T. Clemente, “Molecular and phenotypic char-acterization of transgenic soybean expressing the Arabidopsisferric chelate reductase gene, FRO2,” Planta, vol. 224, no. 5,pp. 1116–1128, 2006.
[167] G. Drakakaki, S. Marcel, R. P. Glahn et al., “Endosperm-specific co-expression of recombinant soybean ferritin andAspergillus phytase in maize results in significant increases inthe levels of bioavailable iron,” Plant Molecular Biology, vol.59, no. 6, pp. 869–880, 2005.
[168] F. Goto, T. Yoshihara, and H. Saiki, “Iron accumulationand enhanced growth in transgenic lettuce plants expressingthe iron- binding protein ferritin,” Theoretical and AppliedGenetics, vol. 100, no. 5, pp. 658–664, 2000.
[169] D. K. X. Chong and W. H. R. Langridge, “Expression of full-length bioactive antimicrobial human lactoferrin in potatoplants,” Transgenic Research, vol. 9, no. 1, pp. 71–78, 2000.
[170] C. Uauy, A. Distelfeld, T. Fahima, A. Blechl, and J. Dubcovsky,“A NAC gene regulating senescence improves grain protein,zinc, and iron content in wheat,” Science, vol. 314, no. 5803,pp. 1298–1301, 2006.
[171] S. Park, N. H. Cheng, J. K. Pittman et al., “Increased calciumlevels and prolonged shelf life in tomatoes expressing Arabid-opsis H+/Ca2+ transporters,” Plant Physiology, vol. 139, no. 3,pp. 1194–1206, 2005.
[172] C. K. Kim, J. S. Han, H. S. Lee et al., “Expression ofan Arabidopsis CAX2 variant in potato tubers increasescalcium levels with no accumulation of manganese,” PlantCell Reports, vol. 25, no. 11, pp. 1226–1232, 2006.
[173] J. Morris, K. M. Hawthorne, T. Hotze, S. A. Abrams, and K.D. Hirschi, “Nutritional impact of elevated calcium transportactivity in carrots,” Proceedings of the National Academy ofSciences of the United States of America, vol. 105, no. 5, pp.1431–1435, 2008.
[174] S. Park, M. P. Elless, J. Park et al., “Sensory analysis ofcalcium-biofortified lettuce,” Plant Biotechnology Journal,vol. 7, no. 1, pp. 106–117, 2009.
[175] P. J. White and M. R. Broadley, “Mechanisms of caesiumuptake by plants,” New Phytologist, vol. 147, no. 2, pp. 241–256, 2000.
[176] S. V. Fesenko, R. M. Alexakhin, M. I. Balonov et al., “Anextended critical review of twenty years of countermeasuresused in agriculture after the Chernobyl accident,” Science ofthe Total Environment, vol. 383, no. 1–3, pp. 1–24, 2007.
[177] E. I. B. Chopin, B. Marin, R. Mkoungafoko et al., “Factorsaffecting distribution and mobility of trace elements (Cu,Pb, Zn) in a perennial grapevine (Vitis vinifera L.) in theChampagne region of France,” Environmental Pollution, vol.156, no. 3, pp. 1092–1098, 2008.
[178] F. A. Nicholson, S. R. Smith, B. J. Alloway, C. Carlton-Smith,and B. J. Chambers, “Quantifying heavy metal inputs toagricultural soils in England and Wales,” Water and Environ-ment Journal, vol. 20, no. 2, pp. 87–95, 2006.
[179] R. M. Welch, W. H. Allaway, W. A. House, and J. Kubota,“Geographic distribution of trace element problems,” inMicronutrients in Agriculture, J. J. Mortvedt, F. R. Cox, L.M. Shuman, and R. M. Welch, Eds., pp. 31–57, Soil ScienceSociety of America, Madison, Wis, USA, 2nd edition, 1991.
[180] R. L. Chaney, “Zinc phytotoxicity,” in Zinc in Soil and Plants,A. D. Robson, Ed., pp. 135–150, Kluwer Academic Publishers,Dordrecht, The Netherlands, 1993.
[181] G. Gasco and M. C. Lobo, “Composition of a Spanish sewagesludge and effects on treated soil and olive trees,” WasteManagement, vol. 27, no. 11, pp. 1494–1500, 2007.
[182] M. D. Webber and S. S. Singh, “Contamination of agricul-tural soils,” in The Health of our Soils—Toward SustainableAgriculture in Canada, D. F. Acton and L. J. Gregorich,Eds., pp. 87–96, Centre for Land and Biological ResourcesResearch, Ottawa, Canada, 1995.
[183] S. Babel and D. del Mundo Dacera, “Heavy metal removalfrom contaminated sludge for land application: a review,”Waste Management, vol. 26, no. 9, pp. 988–1004, 2006.
[184] O. Hanay, H. Hasar, N. N. Kocer, and S. Aslan, “Evaluationfor agricultural usage with speciation of heavy metalsin a municipal sewage sludge,” Bulletin of EnvironmentalContamination and Toxicology, vol. 81, no. 1, pp. 42–46, 2008.
[185] S. R. Smith, “A critical review of the bioavailability andimpacts of heavy metals in municipal solid waste compostscompared to sewage sludge,” Environment International, vol.35, no. 1, pp. 142–156, 2009.
[186] G. Murtaza, A. Ghafoor, M. Qadir, G. Owens, M. A. Aziz, andM. H. Zia, “Disposal and use of sewage on agricultural landsin Pakistan: a review,” Pedosphere, vol. 20, no. 1, pp. 23–34,2010.
[187] J. Barth, F. Amlinger, E. Favoino et al., “Compost productionand use in the EU,” ORBIT e.V. / European CompostNetwork ECN, Weimar, Germany, 2008.
[188] A. K. Gupta, R. P. Singh, M. H. Ibrahim, and B.-K. Lee, “Flyash for agriculture: implications for soil properties, nutrients,heavy metals, plant growth and pest control,” SustainableAgriculture Reviews, vol. 8, pp. 269–286, 2012.
[189] K. Mengel, E. A. Kirkby, H. Kosegarten, and T. Appel,Principles of Plant Nutrition, Kluwer Academic Publishers,Dordrecht, The Netherlands, 2001.
[190] U.K. Department of the Environment [DoE], Code of Practicefor Agriculture Use of Sewage Sludge, DoE Publications,London, UK, 1996.
[191] Commission of the European Communities, “Council Direc-tive of 12 June 1986 on the protection of the environment,and in particular of the soil, when sewage sludge is used inagriculture (86/278/EEC),” Official Journal of the EuropeanCommunities, vol. 181, pp. 6–12, 1986.
[192] U.S. Environmental Protection Agency [USEPA], “Biosolidstechnology fact sheet: land application of biosolids (EPA 832-F-00-064),” USEPA, Washington, DC, USA, 2000.
[193] A. Kabata-Pendias and H. Pendias, Trace Elements in Soils andPlants, CRC Press, Boca Raton, Fla, USA, 1992.
[194] S. Ishikawa, N. Ae, and M. Yano, “Chromosomal regions withquantitative trait loci controlling cadmium concentration inbrown rice (Oryza sativa),” New Phytologist, vol. 168, no. 2,pp. 345–350, 2005.
[195] J. Zhang, Y. G. Zhu, D. L. Zeng, W. D. Cheng, Q. Qian, andG. L. Duan, “Mapping quantitative trait loci associated witharsenic accumulation in rice (Oryza sativa),” New Phytologist,vol. 177, no. 2, pp. 350–355, 2008.
[196] P. J. White, K. Swarup, A. J. Escobar-Gutierrez, H. C.Bowen, N. J. Willey, and M. R. Broadley, “Selecting plantsto minimise radiocaesium in the food chain,” Plant and Soil,vol. 249, no. 1, pp. 177–186, 2003.
[197] R. L. Chaney, J. S. Angle, C. L. Broadhurst, C. A. Peters,R. V. Tappero, and D. L. Sparks, “Improved understandingof hyperaccumulation yields commercial phytoextractionand phytomining technologies,” Journal of EnvironmentalQuality, vol. 36, no. 5, pp. 1429–1433, 2007.
Related Documents


