SOCIOECONOMIC INEQUALITIES IN HEALTH EXPECTANCY IN FINLAND AND NORWAY IN THE LATE 1980s ARI-PEKKA SIHVONEN, 1 * ANTON E. KUNST, 1 EERO LAHELMA, 2 TAPANI VALKONEN 3 and JOHAN P. MACKENBACH 1 1 Department of Public Health, Erasmus University Rotterdam, P.O. Box 1738, 3000 DR Rotterdam, The Netherlands, 2 Department of Public Health, University of Helsinki, P.O. Box 41, 00014 Helsinki, Finland and 3 Population Research Unit, Department of Sociology, University of Helsinki, P.O. Box 18, 00014 Helsinki, Finland Abstract—Studies on health inequalities have usually focused either on mortality or on morbidity. This concerns national studies as well as international comparisons of health inequalities. This paper seeks to bridge the gap by applying health expectancy as a synthetic overall measure of health. The purpose of the study is to compare socioeconomic inequalities in health expectancy in Finland and Norway in the late 1980s. Additionally, the major methodological issues in the use of health expectancy in the study of health inequalities are identified. Data on mortality by level of education derive from linked national follow-up studies (1986–1990) of population censuses. Data on the prevalence of morbidity by level of education derive from nationally representative surveys of the noninstitutionalised adult popu- lation in 1985/87. Persons aged 25–74 years were included. Four measures of morbidity were used: lim- iting long-standing illness, extremely limiting long-standing illness, functional disabilities and perceived less than good health. The association between mortality/morbidity and level of education in each 5- year age/sex group was determined by a regression-based method. Partial life expectancies and partial health expectancies for ages 25–74 were then calculated by using the mortality quotients and morbidity prevalences predicted by the regression model for those at the top and the bottom of the educational hierarchy in each 5-year age group, using an application of the method first presented by Sullivan. Although various measures of health expectancy were used, the result were consistent. In absolute terms the size of socioeconomic inequalities in health expectancy in Finland and Norway is on the same level. In relative terms, however, the size of inequalities in health expectancy is greater in Norway. If one considers premature mortality to be more severe than any indicator of morbidity, the mortality– morbidity mix of the health inequalities is less favourable to Finland, since the size of absolute inequal- ities in mortality is greater in Finland. Health expectancy measures provide a promising measure for assessing and comparing the pattern and the size of health inequalities. # 1998 Elsevier Science Ltd. All rights reserved Key words—health expectancy, life expectancy, health inequalities, Finland, Norway INTRODUCTION Since the Black Report (Townsend and Davidson, 1982) health inequalities have been widely studied and discussed in industrialised countries (Macintyre, 1997). Another impetus for studying health inequalities was given by the European re- gional ‘‘Health for All by the Year 2000’’ pro- gramme which emphasised the need to diminish the health inequalities (Targets for Health for All, 1985). By now there is a large body of literature docu- menting socioeconomic health inequalities. A grow- ing number of studies have examined to what extent the size of inequalities in health varies between industrialised countries. If inequalities in one country are larger than in another, this would suggest that there is room for improvement in that country and inequalities are not inevitable, but are at least to some extent avoidable (Kunst et al., 1995). Therefore, cross-country comparisons of health inequalities can point out possible directions for policies that aim at reducing socioeconomic inequalities in health. Cross-country comparisons have concentrated either on mortality (Valkonen, 1989; Va˚gero¨ and Lundberg, 1989; Leclerc et al., 1990; Wagsta et al., 1991; Kunst and Mackenbach, 1994a,b; Kunst et al., 1997a,b) or on morbidity (Karisto et al., 1978; Lundberg, 1986; Aiach and Curtis, 1990; Lahelma et al., 1993, 1994; Lahelma and Arber, 1994; Kunst et al., 1995; van Doorslaer et al., 1997; Cavelaars et al., 1997a,b). No comparative study has yet combined mortality and morbidity; how- ever, there are numerous reasons to combine them into a single measure of health inequalities. First of all, there is an intricate link between mortality and morbidity: most deaths are preceded by longer or Soc. Sci. Med. Vol. 47, No. 3, pp. 303–315, 1998 # 1998 Elsevier Science Ltd. All rights reserved Printed in Great Britain 0277-9536/98 $19.00 + 0.00 PII: S0277-9536(98)00020-3 *Author for correspondence. 303

Welcome message from author
This document is posted to help you gain knowledge. Please leave a comment to let me know what you think about it! Share it to your friends and learn new things together.
Transcript
SOCIOECONOMIC INEQUALITIES IN HEALTH
EXPECTANCY IN FINLAND AND NORWAY IN THE LATE
1980s
ARI-PEKKA SIHVONEN,1* ANTON E. KUNST,1 EERO LAHELMA,2
TAPANI VALKONEN3 and JOHAN P. MACKENBACH1
1Department of Public Health, Erasmus University Rotterdam, P.O. Box 1738, 3000 DR Rotterdam,The Netherlands, 2Department of Public Health, University of Helsinki, P.O. Box 41, 00014 Helsinki,Finland and 3Population Research Unit, Department of Sociology, University of Helsinki, P.O. Box 18,
00014 Helsinki, Finland
AbstractÐStudies on health inequalities have usually focused either on mortality or on morbidity. Thisconcerns national studies as well as international comparisons of health inequalities. This paper seeksto bridge the gap by applying health expectancy as a synthetic overall measure of health. The purposeof the study is to compare socioeconomic inequalities in health expectancy in Finland and Norway inthe late 1980s. Additionally, the major methodological issues in the use of health expectancy in thestudy of health inequalities are identi®ed. Data on mortality by level of education derive from linkednational follow-up studies (1986±1990) of population censuses. Data on the prevalence of morbidity bylevel of education derive from nationally representative surveys of the noninstitutionalised adult popu-lation in 1985/87. Persons aged 25±74 years were included. Four measures of morbidity were used: lim-iting long-standing illness, extremely limiting long-standing illness, functional disabilities and perceivedless than good health. The association between mortality/morbidity and level of education in each 5-year age/sex group was determined by a regression-based method. Partial life expectancies and partialhealth expectancies for ages 25±74 were then calculated by using the mortality quotients and morbidityprevalences predicted by the regression model for those at the top and the bottom of the educationalhierarchy in each 5-year age group, using an application of the method ®rst presented by Sullivan.Although various measures of health expectancy were used, the result were consistent. In absoluteterms the size of socioeconomic inequalities in health expectancy in Finland and Norway is on thesame level. In relative terms, however, the size of inequalities in health expectancy is greater in Norway.If one considers premature mortality to be more severe than any indicator of morbidity, the mortality±morbidity mix of the health inequalities is less favourable to Finland, since the size of absolute inequal-ities in mortality is greater in Finland. Health expectancy measures provide a promising measure forassessing and comparing the pattern and the size of health inequalities. # 1998 Elsevier Science Ltd.All rights reserved
Key wordsÐhealth expectancy, life expectancy, health inequalities, Finland, Norway
INTRODUCTION
Since the Black Report (Townsend and Davidson,
1982) health inequalities have been widely studied
and discussed in industrialised countries
(Macintyre, 1997). Another impetus for studying
health inequalities was given by the European re-
gional ``Health for All by the Year 2000'' pro-
gramme which emphasised the need to diminish the
health inequalities (Targets for Health for All,
1985).
By now there is a large body of literature docu-
menting socioeconomic health inequalities. A grow-
ing number of studies have examined to what
extent the size of inequalities in health varies
between industrialised countries. If inequalities in
one country are larger than in another, this would
suggest that there is room for improvement in that
country and inequalities are not inevitable, but are
at least to some extent avoidable (Kunst et al.,
1995). Therefore, cross-country comparisons of
health inequalities can point out possible directions
for policies that aim at reducing socioeconomic
inequalities in health.
Cross-country comparisons have concentrated
either on mortality (Valkonen, 1989; VaÊ geroÈ and
Lundberg, 1989; Leclerc et al., 1990; Wagsta� et
al., 1991; Kunst and Mackenbach, 1994a,b; Kunst
et al., 1997a,b) or on morbidity (Karisto et al.,
1978; Lundberg, 1986; Aiach and Curtis, 1990;
Lahelma et al., 1993, 1994; Lahelma and Arber,
1994; Kunst et al., 1995; van Doorslaer et al., 1997;
Cavelaars et al., 1997a,b). No comparative study
has yet combined mortality and morbidity; how-
ever, there are numerous reasons to combine them
into a single measure of health inequalities. First of
all, there is an intricate link between mortality and
morbidity: most deaths are preceded by longer or
Soc. Sci. Med. Vol. 47, No. 3, pp. 303±315, 1998# 1998 Elsevier Science Ltd. All rights reserved
Printed in Great Britain0277-9536/98 $19.00+0.00
PII: S0277-9536(98)00020-3
*Author for correspondence.
303

shorter periods of disease and disability, whereas
disease and disability, naturally, prevail only among
the survivors. In addition, the continuing mortality
decline may modify the average health status of the
population if more frail people survive into the
older ages. Therefore, in order to develop a compre-
hensive picture of health inequalities, mortality and
morbidity should be studied together, using a syn-
thetic summary measure.
In this study, life table methods were used to
combine studies on inequalities in mortality with
those on inequalities in morbidity. The summary
measure used is health expectancy, which describes
how long a person can expect to live healthy if the
current age speci®c mortality and morbidity con-
ditions were to prevail in the future (Katz et al.,
1983; Robine et al., 1986; Bebbington, 1988;
Crimmins et al., 1989; Robine and Ritchie, 1991;
Van Ginneken et al., 1991; Bone, 1992). By combin-
ing information on both mortality and morbidity
and expressing these in the same measurement unit
(years) health expectancy measures are useful in
assessing and describing the size of health inequal-
ities. For example when comparing two countries
with one having larger inequalities in mortality and
the other larger inequalities in morbidity, health ex-
pectancy measures make it easier to assess whether
these two countries di�er in the size of overall
health inequalities, taking into account both mor-
tality and morbidity. Sophisticated inequality
measures have been developed for comparisons
(see, for example, Mackenbach and Kunst, 1997)
but these have seldom been applied to life table cal-
culations. In this paper we introduce an application
of a regression based method to estimate the size of
inequalities in life expectancy and health expect-
ancy.
Although there are now health expectancy esti-
mates for over 30 countries (Robine et al., 1992,
1993; Mathers et al., 1994), cross-country compari-
sons of health expectancies have been hampered by
the incomparability of the method of calculation,
the collection of (health) surveys and especially the
measures of morbidity (Boshuizen and van de
Water, 1994). Especially, there are no cross-country
comparisons on the size of socioeconomic inequal-
ities in health expectancy, due also to scarcity of
comparable data on mortality and morbidity by
socioeconomic status. There are only few (incom-
parable) estimates of health expectancies by socioe-
conomic status for individual countries, like
Canada (Wilkins and Adams, 1983), England and
Wales (Bebbington, 1993), U.S.A. (Guralnik et al.,
1993; Crimmins et al., 1996), the Netherlands (van
den Bos and van der Maas, 1993; van de Water et
al., 1996) and Finland (Valkonen et al., 1997). In
this study highly comparable individual level data
on mortality and morbidity by educational level in
Finland and Norway were used.
The reasons for selecting Finland and Norwayfor this study were the similarity of the countries
and the availability of highly comparable data.Both Finland and Norway are Nordic welfare stateswith largely comparable educational and health
care system, welfare and health policies, culture andsocial and economical structure (Esping-Andersen,1990). In both countries the existence of socioeco-
nomic inequalities in health have been documentedfor both mortality and morbidity indicators(Valkonen, 1989; Lahelma et al., 1993). In both
Finland and Norway, people with lower educationand from lower occupational classes have higherrates of mortality and they more often report dis-ease, disability and perceived ill health. In the 1970s
inequalities (in relative terms) among men in mor-tality (Kunst and Mackenbach, 1994a,b; see alsoValkonen, 1989) as well as in morbidity (Karisto et
al., 1978) were slightly larger in Finland, whereas inthe 1980s inequalities in morbidity (in relativeterms) seemed to be equally large in both countries
(Kunst et al., 1992; Rahkonen et al., 1993; Lahelmaet al., 1994; see also Mackenbach et al., 1997). Inaddition, overall levels of mortality and morbidity
have been substantially higher in Finland than inNorway.The purpose of the paper is to determine to what
extent the pattern and the size of health inequalities
in Finland di�er from those in Norway by usingthe health expectancy as the overall syntheticmeasure of health. Additionally, the most important
methodological issues concerning the use of healthexpectancy in cross-country comparisons of healthinequalities are identi®ed.
MATERIAL AND METHODS
Data
The data on mortality used in this study were de-
rived from the tabulated data base compiled by theEU Concerted Action on ``Socioeconomic inequal-ities in morbidity and mortality in Europe: A com-
parative study'', coordinated by ErasmusUniversity, Rotterdam (Kunst et al., 1996). Data onmorbidity were derived also from the data-base``the Nordic Level of Living Registry'' compiled by
the Central Statistical O�ce of Sweden (Vogel,1991). The original data were from national datasources by statistical authorities.
The Finnish (see Valkonen et al., 1993) and theNorwegian tabulated mortality data were based onthe individual level records of the 1980 Census
linked with the death records for the periods 1981±1985 and 1986±1990. In both countries practicallyall (over 99%) death records could be linked to the
census (Table 1). Only the latter period is usedbecause the morbidity data were from that period.The data on morbidity were derived from three
studies using identical health questions (Table 1).
Ari-Pekka Sihvonen et al.304

The Finnish morbidity data and part of theNorwegian data were derived from the ``Survey on
Living Conditions'' carried out by the statisticalauthorities of these two countries in 1986/1987(Vogel, 1991; Lahelma et al., 1993). These studies
are based on representative samples of the noninsti-tutionalised population aged 15 years or more inFinland and 16±84 years in Norway. AdditionalNorwegian data were derived from the ``Health
Survey'' by Norwegian statistical authorities in1985. This study was representative of the noninsti-tutionalised Norwegian population.
Measures of morbidity
Methodological issues ®rst arise when selectingthe measure for morbidity. The measurement ofmorbidity is more complicated than that of mor-tality and various indicators of (self-reported) mor-
bidity are available. Measures vary from a globalperception of one's own general health status tocomplex indices measuring the consequences of dis-
ease or illness for one's ability to carry on everydayactivities (see, for example, Blaxter, 1989; Bowling,1991).
In this study four self-reported measures of mor-bidity were used: limiting long-standing illness,extremely limiting long-standing illness, perceivedpoor general health status and functional disabil-
ities.Long-standing illness was measured by the ques-
tion: ``Do you have any long-standing illness, in®r-
mity or disability?'' A follow-up question was putto those who responded positively: ``Does your ill-ness/disability restrict your work or does it limit
your daily activities (gainful employment, house-work, schooling, studying)?'' Those whose responsewas ``to a great deal'' or ``to some extent'' were
classi®ed as having a limiting long-standing illness.The response ``to a great deal'' implied having anextremely limiting long-standing illness. In Norway,this morbidity measure was taken from the Survey
on Living Conditions, whereas all other morbiditymeasures were taken from the Health Survey.
Perceived general health was measured by the fol-lowing question in Finland: ``Which of the follow-ing alternatives best describes your present health
status?'' and in Norway: ``How would you evaluateyour own general health?''. The response categoriesin both countries were ``very good'', ``good'', ``mod-erate or average'', ``poor'' and ``very poor''. Those
who perceived their health status as average orpoor were classi®ed as having less than good per-ceived health.
The index of functional disability was based onthe following six items: (1) ``Can you climb stairswithout di�culty?'', (2) ``Can you walk for 5 min at
a fairly fast pace without di�culty?'', (3) ``Can youread ordinary text in a newspaper without di�-culty?'', (4) ``Can you hear without di�culty what
is said in a conversation between several persons?''(Finland) and ``Can you hear what is said in a nor-mal conversation with at least two others?''(Norway). Additionally, two further items were
included, which were asked as part of one question:``Are you in good enough condition to be able tocarry out the following activities without help from
another person?'': (5) ``Dressing and undressing?''and (6) ``Personal hygiene?''. In all questions the re-sponse categories were ``yes'' and ``no''. Individuals
who were unable to manage one or more of theabove activities, were classi®ed as having functionaldisabilities.
Education as a measure of socioeconomic status
Occupational class, education and income are dis-
tinct but related components measuring multipleaspects of a person's socioeconomic status(Liberatos et al., 1988; Valkonen, 1989, 1993;
House et al., 1990; Kunst and Mackenbach, 1994c;Krieger et al., 1997). Level of education createsdi�erences between people in terms of access to in-formation and the level of pro®ciency in bene®ting
Table 1. General description of the data used in the study
Finland Norway
(a) Mortality dataType of study tabulated data based on national
longitudinal follow-up of the 1980population census
tabulated data based on nationallongitudinal follow-up of the 1980population census
Study period 1986±1990 1986±1990Age interval 25±74 years 25±74 yearsUnder-registration of deaths <1% <1%Number of deaths, men 80,542 65,568Number of deaths, women 50,002 38,363Exclusions no no
(b) Morbidity dataData source survey on living conditions health survey survey on living conditionsYear of the study 1986/1987 1985 1987Response rate (all ages) 87% 79% 78%Number of respondents(25±74 years)
9,148 6,169 3,017
Men 47% 49% 49%Women 53% 51% 51%Institutionalized excluded yes yes yes
Inequalities in health expectancy 305
from new knowledge, whereas income creates di�er-
ences in access to material resources. Occupational
status includes both these aspects and adds to them
bene®ts accruing from exercise of speci®c jobs, such
as prestige, privileges, power and technical skills
(Kunst and Mackenbach, 1994c).
The level of education was used to measure
socioeconomic status, because this measure has a
number of advantages in life table calculations over
other measures of socioeconomic status. First of all,
level of education undergoes only small changes
over the course of life. Once acquired, usually in
early adulthood, education cannot be lost. In the
life course perspective it is crucial that individuals
stay in the same category over time. Moreover, the
health status of an individual does not have as
great an e�ect on education as it may have on occu-
pation and income. In addition, level of education
can be measured in a comparable way for all mem-
bers of the population, including those who are
economically inactive. Furthermore, more practical
reasons were considered: comparable individual
level data on mortality and morbidity by edu-
cational level in Finland and Norway was available,
whereas no comparable data on occupational class
was available.
A three-part classi®cation of education based on
individual's own education was used, on the base of
the highest examination s/he has passed (derived
from a national register of educational degrees):
(1) ``Higher education'' equals a degree from uni-
versity or other higher educational institution (at
least 13 years).
(2) ``Secondary education'' equals upper second-
ary school, vocational training, or the matriculation
examination (10±12 years).
(3) ``Basic education'' equals compulsory edu-
cation or less (9 years or less).
An important methodological issue concerns the
cohort-comparability of education: is the meaning
of speci®c levels of education the same for di�erent
cohorts? The distribution of education is rather
skewed (Table 2). Most people in Finland and
Norway have a basic education only, especially in
the elderly cohorts. The population sizes of the edu-
cational levels and therefore also the relative pos-
itions of each educational level, vary strongly
between cohorts. For example, those with onlybasic education might be less disadvantaged when
most people of their cohort have the same edu-cational achievements as they themselves have (asin the case of older age groups) compared to a situ-
ation where most people of their cohort have bettereducation than they themselves have (as in theyounger age groups). Hence the relative position in
the social structure of a person with a given edu-cational level may vary between cohorts. This pro-blem will be dealt with further on.
Health expectancy
The study included persons aged 25±74. The
youngest age groups were excluded as most of themhave not yet completed their education and the old-est age groups because a large proportion of them
are institutionalised and therefore are not includedin the morbidity data.The country, sex and age (5-year age groups)
speci®c probabilities of death by level of educationwere calculated from the (tabulated) baseline popu-lation of 1985 and the number of deaths in theperiod 1986±1990. From these probabilities of
death the partial life expectancies by level of edu-cation in the age bracket 25±74 were calculated byusing the standard methods (Shryock and Siegel,
1976).The partial health expectancies between exact
ages 25 and 75 by level of education were calculated
by applying observed age (5-year age groups) andsex speci®c prevalences of morbidity to the life-table estimates of the number of person-years livedby the synthetic cohort in each 5-year age interval
between ages 25 and 75 (the nLx-column of lifetable). The four indicators of morbidity describedabove were used, respectively, to measure the preva-
lence of morbidity (by country, sex and level ofeducation). The so-called Sullivan (1971) method ofcalculating health expectancies was used (for the
calculation procedure, see for example Crimmins etal., 1989).The term ``health expectancy'' (HE) is used to
refer to (partial) health expectancies (between ages25 and 75) in general, without specifying by whichindicator of morbidity it is calculated (Mathers andRobine, 1993). The maximum length of life expect-
Table 2. Distribution of level of education (%) by age and sex in Finland and Norway in 1985 (as estimated by the mortality data ®le)
Men Women
Country Age basic sec. high. total basic sec. high. total
Finland 25±44 38 51 11 100 37 50 12 10045±59 67 24 9 100 68 24 8 10060±74 79 15 6 100 82 14 4 100all 53 38 9 100 56 34 9 100
Norway 25±44 35 45 20 100 39 44 16 10045±59 56 29 15 100 68 24 8 10060±74 68 23 9 100 81 16 4 100all 48 36 16 100 58 32 11 100
Ari-Pekka Sihvonen et al.306
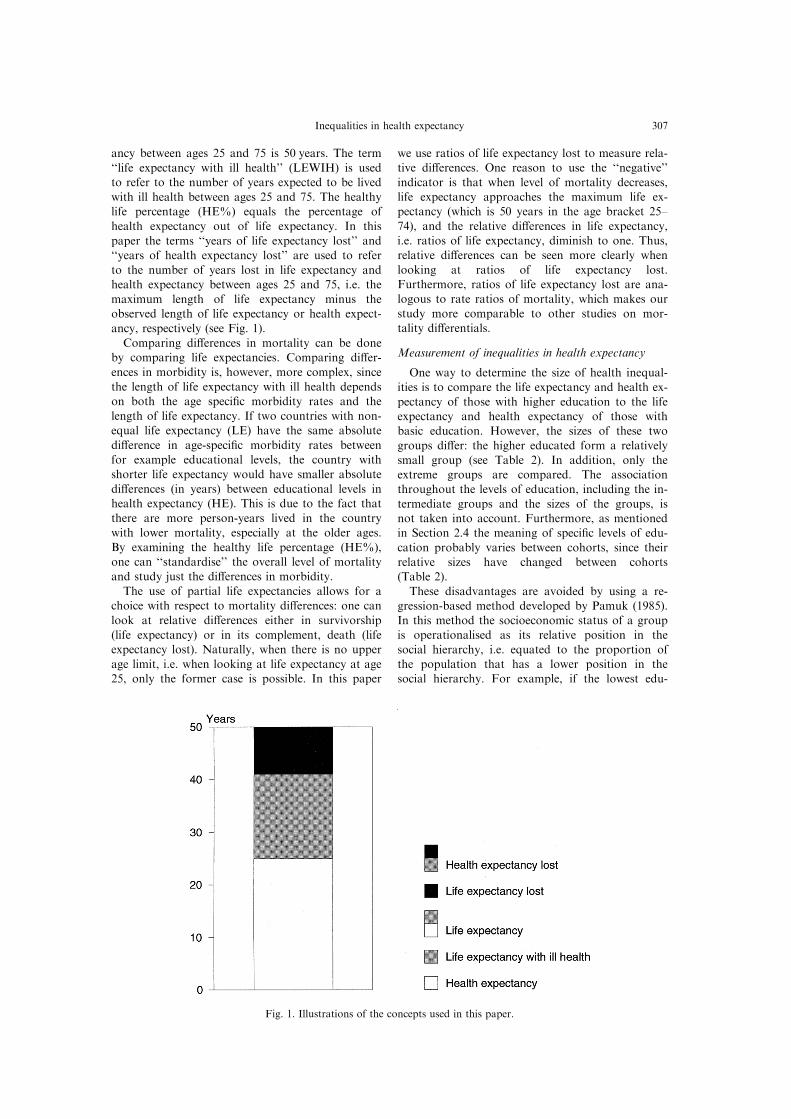
ancy between ages 25 and 75 is 50 years. The term
``life expectancy with ill health'' (LEWIH) is usedto refer to the number of years expected to be lived
with ill health between ages 25 and 75. The healthylife percentage (HE%) equals the percentage of
health expectancy out of life expectancy. In this
paper the terms ``years of life expectancy lost'' and``years of health expectancy lost'' are used to refer
to the number of years lost in life expectancy andhealth expectancy between ages 25 and 75, i.e. the
maximum length of life expectancy minus theobserved length of life expectancy or health expect-
ancy, respectively (see Fig. 1).
Comparing di�erences in mortality can be doneby comparing life expectancies. Comparing di�er-
ences in morbidity is, however, more complex, since
the length of life expectancy with ill health dependson both the age speci®c morbidity rates and the
length of life expectancy. If two countries with non-equal life expectancy (LE) have the same absolute
di�erence in age-speci®c morbidity rates betweenfor example educational levels, the country with
shorter life expectancy would have smaller absolute
di�erences (in years) between educational levels inhealth expectancy (HE). This is due to the fact that
there are more person-years lived in the countrywith lower mortality, especially at the older ages.
By examining the healthy life percentage (HE%),one can ``standardise'' the overall level of mortality
and study just the di�erences in morbidity.
The use of partial life expectancies allows for achoice with respect to mortality di�erences: one can
look at relative di�erences either in survivorship
(life expectancy) or in its complement, death (lifeexpectancy lost). Naturally, when there is no upper
age limit, i.e. when looking at life expectancy at age25, only the former case is possible. In this paper
we use ratios of life expectancy lost to measure rela-tive di�erences. One reason to use the ``negative''
indicator is that when level of mortality decreases,life expectancy approaches the maximum life ex-pectancy (which is 50 years in the age bracket 25±
74), and the relative di�erences in life expectancy,i.e. ratios of life expectancy, diminish to one. Thus,relative di�erences can be seen more clearly when
looking at ratios of life expectancy lost.Furthermore, ratios of life expectancy lost are ana-logous to rate ratios of mortality, which makes our
study more comparable to other studies on mor-tality di�erentials.
Measurement of inequalities in health expectancy
One way to determine the size of health inequal-ities is to compare the life expectancy and health ex-
pectancy of those with higher education to the lifeexpectancy and health expectancy of those withbasic education. However, the sizes of these two
groups di�er: the higher educated form a relativelysmall group (see Table 2). In addition, only theextreme groups are compared. The associationthroughout the levels of education, including the in-
termediate groups and the sizes of the groups, isnot taken into account. Furthermore, as mentionedin Section 2.4 the meaning of speci®c levels of edu-
cation probably varies between cohorts, since theirrelative sizes have changed between cohorts(Table 2).
These disadvantages are avoided by using a re-gression-based method developed by Pamuk (1985).In this method the socioeconomic status of a groupis operationalised as its relative position in the
social hierarchy, i.e. equated to the proportion ofthe population that has a lower position in thesocial hierarchy. For example, if the lowest edu-
Fig. 1. Illustrations of the concepts used in this paper.
Inequalities in health expectancy 307
cational category consists of 50% of the population,
the relative position of its members is 0 < x< 0.5,the average being 0.25. If the next group in the hier-
archy comprises 30% of people, its members' rela-
tive position is 0.5 < x < 0.8, on average 0.65, andso on (see, for example, Kunst and Mackenbach,
1994c; Mackenbach and Kunst, 1997).
When regressing the mortality or morbidity rate
of the educational levels on their relative positions,the weighted ordinary least squares regression in
each 5-year age/sex/country group was used separ-ately for mortality and morbidity. The weights were
the relative sizes of the educational levels in each
age group based on the population numbers in1985 as estimated by the mortality data ®le. The
slope of the regression line for mortality represents
the absolute change in the probability of dying as-sociated with one unit increase in the measure of
socioeconomic status. This one unit increase in themeasure of socioeconomic status is equivalent to
the di�erence between the bottom (0) and the top
of the educational hierarchy (1). The intercept ofthe regression line represents the probability of
dying of those at the bottom of the hierarchy and
the intercept plus the slope represents the prob-ability of dying of those at the top of the hierarchy
(in the 5-year age group in question).
By applying these regression-based probabilitiesof death for the top and the bottom of the edu-
cational hierarchy (instead of the observed ones for
the three educational groups) in each 5-year agegroup by sex and country, one can calculate the life
expectancies between exact ages 25 and 75 which
represent the mortality conditions of the hypotheti-cal top and bottom of the educational hierarchy.
The di�erence of these two life expectancies can be
used as an estimate of the absolute size of inequal-ities in life expectancy.
The health expectancies between exact ages 25and 75 were calculated in an analogous manner, by
using the age-speci®c morbidity prevalences pre-dicted by the regression model for those at the topand bottom of the educational hierarchy in each 5-
year age group, and by applying these prevalencesto the corresponding regression-based life table esti-mates of years lived in each 5-year age interval (the
nL�-column of life table). The di�erence betweenthe health expectancy of those at the top and thoseat the bottom of the educational hierarchy can be
used as an estimate of the absolute size of inequal-ity in health expectancy.The regression procedure used in the calculation
of the size of inequalities assumes a linear associ-
ation between mortality/morbidity and level of edu-cation. Some nonlinearity was observed in the oldercohorts: the mortality probabilities and morbidity
prevalences of the highest educational group werelower than predicted. However, because of thesmall size of this group, this deviation is of minor
importance.
RESULTS
Health expectancy between ages 25 and 75 by levelof education
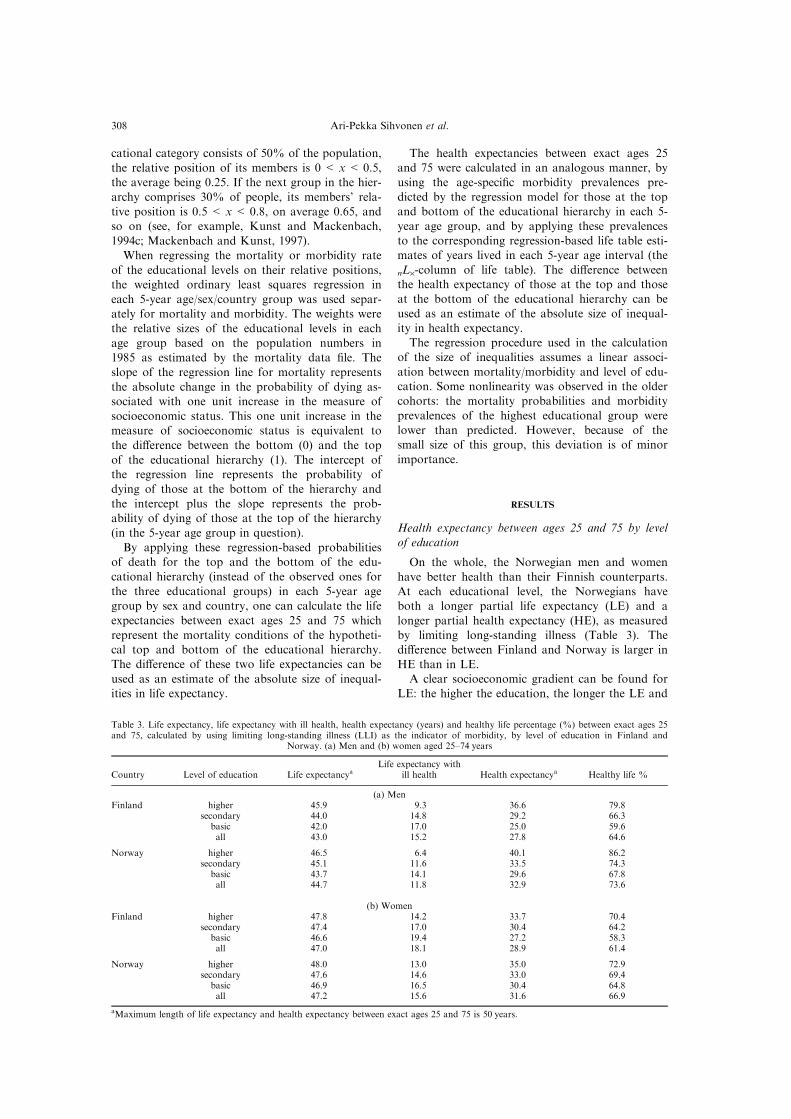
On the whole, the Norwegian men and women
have better health than their Finnish counterparts.At each educational level, the Norwegians haveboth a longer partial life expectancy (LE) and a
longer partial health expectancy (HE), as measuredby limiting long-standing illness (Table 3). Thedi�erence between Finland and Norway is larger in
HE than in LE.A clear socioeconomic gradient can be found for
LE: the higher the education, the longer the LE and
Table 3. Life expectancy, life expectancy with ill health, health expectancy (years) and healthy life percentage (%) between exact ages 25and 75, calculated by using limiting long-standing illness (LLI) as the indicator of morbidity, by level of education in Finland and
Norway. (a) Men and (b) women aged 25±74 years
Country Level of education Life expectancyaLife expectancy with
ill health Health expectancya Healthy life %
(a) MenFinland higher 45.9 9.3 36.6 79.8
secondary 44.0 14.8 29.2 66.3basic 42.0 17.0 25.0 59.6all 43.0 15.2 27.8 64.6
Norway higher 46.5 6.4 40.1 86.2secondary 45.1 11.6 33.5 74.3
basic 43.7 14.1 29.6 67.8all 44.7 11.8 32.9 73.6
(b) WomenFinland higher 47.8 14.2 33.7 70.4
secondary 47.4 17.0 30.4 64.2basic 46.6 19.4 27.2 58.3all 47.0 18.1 28.9 61.4
Norway higher 48.0 13.0 35.0 72.9secondary 47.6 14.6 33.0 69.4
basic 46.9 16.5 30.4 64.8all 47.2 15.6 31.6 66.9
aMaximum length of life expectancy and health expectancy between exact ages 25 and 75 is 50 years.
Ari-Pekka Sihvonen et al.308
consequently the less years of life expectancy are
lost (Table 3). An analogous gradient can be found
for life expectancy with ill health (LEWIH): more
education means less years with ill health. There-
fore, the socioeconomic gradient is steepest in HE.
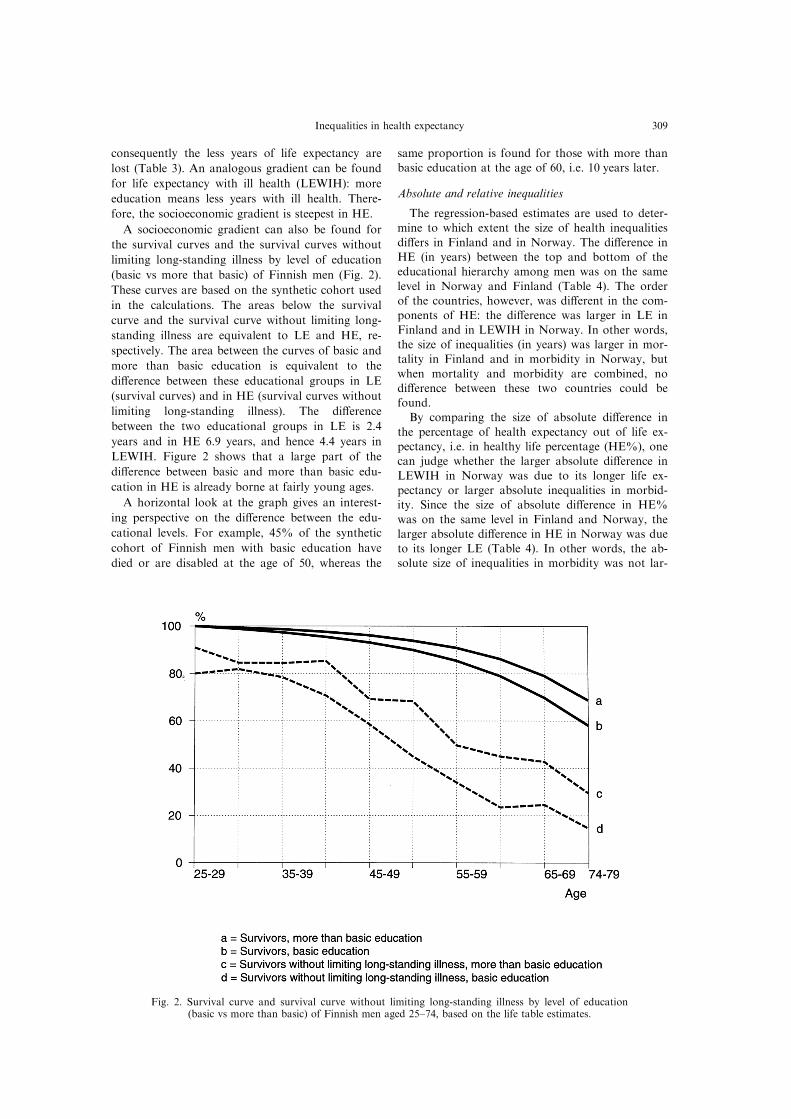
A socioeconomic gradient can also be found for
the survival curves and the survival curves without
limiting long-standing illness by level of education
(basic vs more that basic) of Finnish men (Fig. 2).
These curves are based on the synthetic cohort used
in the calculations. The areas below the survival
curve and the survival curve without limiting long-
standing illness are equivalent to LE and HE, re-
spectively. The area between the curves of basic and
more than basic education is equivalent to the
di�erence between these educational groups in LE
(survival curves) and in HE (survival curves without
limiting long-standing illness). The di�erence
between the two educational groups in LE is 2.4
years and in HE 6.9 years, and hence 4.4 years in
LEWIH. Figure 2 shows that a large part of the
di�erence between basic and more than basic edu-
cation in HE is already borne at fairly young ages.
A horizontal look at the graph gives an interest-
ing perspective on the di�erence between the edu-
cational levels. For example, 45% of the synthetic
cohort of Finnish men with basic education have
died or are disabled at the age of 50, whereas the
same proportion is found for those with more thanbasic education at the age of 60, i.e. 10 years later.
Absolute and relative inequalities
The regression-based estimates are used to deter-mine to which extent the size of health inequalities
di�ers in Finland and in Norway. The di�erence inHE (in years) between the top and bottom of theeducational hierarchy among men was on the same
level in Norway and Finland (Table 4). The orderof the countries, however, was di�erent in the com-ponents of HE: the di�erence was larger in LE in
Finland and in LEWIH in Norway. In other words,the size of inequalities (in years) was larger in mor-tality in Finland and in morbidity in Norway, but
when mortality and morbidity are combined, nodi�erence between these two countries could befound.By comparing the size of absolute di�erence in
the percentage of health expectancy out of life ex-pectancy, i.e. in healthy life percentage (HE%), onecan judge whether the larger absolute di�erence in
LEWIH in Norway was due to its longer life ex-pectancy or larger absolute inequalities in morbid-ity. Since the size of absolute di�erence in HE%
was on the same level in Finland and Norway, thelarger absolute di�erence in HE in Norway was dueto its longer LE (Table 4). In other words, the ab-solute size of inequalities in morbidity was not lar-
Fig. 2. Survival curve and survival curve without limiting long-standing illness by level of education(basic vs more than basic) of Finnish men aged 25±74, based on the life table estimates.
Inequalities in health expectancy 309

ger in Norway when the overall level of mortalitywas standardised.By examining the relative measure, one can judge
whether the larger absolute di�erences (di�erence)are due to larger relative di�erences (ratio) or, alter-natively, to a higher overall level. The measure ofrelative inequality used in this paper based on the
LE-lost, HE-lost, HE%-lost or life expectancy withill health. In each measure, the estimate for those atthe bottom of the educational hierarchy is divided
by the estimate for those at the top of the hierar-chy.The absolute di�erences in HE-lost and HE%-
lost among men were on the same level in Finlandand in Norway (Table 4). However, the relativedi�erences were larger in Norway. The relative
di�erences in LE-lost among men were on the samelevel in Finland and in Norway, although the absol-ute di�erences were larger in Finland. Thus, un-favourable to Finland is in particular its high
overall level of mortality. This is, however, compen-sated by small relative inequalities in morbidity.
Other morbidity indicators
Two other measures of morbidity were used,namely functional disabilities and perceived lessthan good health, to ®nd out whether the order of
Finland and Norway in the size of inequalities inHE depends on the measure of morbidity. Alsoanother cut-o� point for limiting long-standing ill-
ness was used, that is extremely limiting long-stand-ing illness.
The results concerning these three measures werelargely in accordance with the above results,although the prevalence of morbidity and the length
of HE di�er. Substantial socioeconomic inequalitiescould be found for HE according to each measureof morbidity. The absolute size of inequalities inHE according to perceived health was somewhat
larger than according to functional disabilities, orlimiting or extremely limiting long-standing illness(Table 5).
Also according to functional disabilities and per-ceived less than good health, the absolute di�erencein HE and HE% between those at the top and at
the bottom of the educational hierarchy amongmen was on the same level in Finland and Norway,while the relative inequalities were larger in
Norway.The main result concerning extremely limiting
long-standing illness was that a stricter cut-o� pointimplies smaller absolute di�erences (Tables 4 and
5). Furthermore, this morbidity measure suggeststhat also the absolute inequalities in HE were largerin Norway than in Finland.
Women compared to men
This paper has thus far been restricted to menonly. However, substantial health inequalities could
also be found among women (Table 6). The absol-ute and relative size of inequalities in HE was onlyslightly smaller among women than among men, es-
pecially when measured by perceived health or func-tional disabilities. However, according to limiting
Table 4. The size of inequalities (based on the regression estimate) for life expectancy, life expectancy with ill health, health expectancyand healthy life percentage, between exact ages 25 and 75, calculated by using limiting long-standing illness (LLI) as the indicator of mor-
bidity. Finland and Norway, men aged 25-74 years
Country Life expectancy lostLife expectancy with
ill health Health expectancy lost Healthy life % lost
Finland all 7.0 15.2 22.2 35.4di�erencea 5.0 7.7 12.7 22.1
ratioa 2.1 1.7 1.8 1.9
Norway all 5.3 11.8 17.1 26.4di�erencea 3.7 9.1 12.8 22.6
ratioa 2.1 2.2 2.1 2.4
aIn each measure, ratio (di�erence) is the estimate for those at the bottom of the educational hierarchy divided by (minus) the estimatefor those at the top of the hierarchy.
Table 5. The size of inequalities (based on the regression estimate) for life expectancy with ill health, health expectancy and healthy lifepercentage, between exact ages 25 and 75, calculated by using perceived less than good health (PH), functional disabilities (FD) and extre-
mely limiting long-standing illness (XLLI) as the indicator of morbidity. Finland and Norway, men aged 25±74 years
Life expectancy with ill health Health expectancy lost Healthy life % lost
Country PH FD XLLI PH FD XLLI PH FD XLLI
Finland all 20.1 9.6 5.1 27.1 16.6 12.1 46.7 22.4 11.8di�erencea 9.6 4.8 3.8 14.6 9.8 8.8 27.7 13.7 10.2
ratioa 1.6 1.7 2.1 1.7 1.8 2.1 1.8 1.9 2.4
Norway all 10.3 5.4 5.2 15.6 10.8 10.5 23.0 12.2 11.6di�erencea 11.3 5.4 6.0 15.0 9.1 9.7 27.1 13.0 14.5
ratioa 3.9 3.2 3.5 3.0 2.5 2.7 4.3 3.5 3.8
aIn each measure, ratio (di�erence) is the estimate for those at the bottom of the educational hierarchy divided by (minus) the estimatefor those at the top of the hierarchy.
Ari-Pekka Sihvonen et al.310

long-standing illness, the size of inequalities was
much smaller among women than among men.The main di�erence in women's pattern of
inequalities compared to men was that the size of
inequalities in LE (i.e. mortality) was smaller.Women had slightly larger absolute inequalities (inyears) in LEWIH (i.e. morbidity) than men.
However, when mortality was standardised (i.e.looking at HE%) the size of inequalities in morbid-ity was on the same level as among men.Also the order of Finland and Norway in the size
of inequalities in HE was similar to that amongmen: the size of absolute inequalities was on thesame level in these two countries in HE, but the
size of relative inequalities was larger in Norway.
DISCUSSION
Health inequalities are substantial in both
Finland and Norway. In both countries the highereducated can expect to live longer and have morehealthy years than their less educated counterparts.In fact, the higher educated not only have a shorter
life expectancy with ill health but they also have ahigher proportion of total life expectancy spent ingood health. Therefore, the higher educated can
expect to have both absolutely and relatively lessyears with ill health than the less educated (see alsoValkonen et al., 1997).
Our results are in accordance with other studieson socioeconomic di�erentials in health expectancyindicating that the socioeconomic gradient is muchsteeper in health expectancy than in life expectancy.
The common ®nding that the di�erence betweenmen and women is smaller in health expectancythan in life expectancy is also con®rmed by our
study. Among those with higher or secondary edu-cation men actually have a longer partial health ex-pectancy between ages 25 and 75 than women
(calculated by limiting long-standing illness),although women have a longer partial life expect-ancy (Table 3).
Judging from the overall synthetic measure ofhealth analysed in this study, partial health expect-ancy in the age bracket 25±74 years, the size of ab-solute socioeconomic health inequalities is on the
same level in Finland and in Norway. However,
compared to Finland, the size of relative inequal-ities in health expectancy is larger in Norway, dueto the lower overall level of mortality and morbid-
ity.Inequalities in the components of health expect-
ancy were also studied. The absolute inequalities in
mortality are larger in Finland than in Norway.This is due to the higher overall level of mortalityin Finland, but not due to larger relative inequal-ities. The Norwegians and the Finns have equally
large absolute inequalities in morbidity (in terms ofproportion of expected healthy years out of allexpected years), but the Norwegians have larger
relative inequalities.The results should not be interpreted to imply
that the years of ill health are experienced only at
the end of the life course after the years of goodhealth. Since the number of survivors decreaseswith age, the years of ill health and the health
inequalities are more evenly distributed over the lifecourse than one would expect from the morbiditydata (see Fig. 2). This illustrates the importance ofstudying mortality and morbidity together.
Methodological issues
According to the regression-based estimates, thesize of inequalities in health expectancy was on thesame level in absolute terms in Finland and
Norway. If only the extreme educational groups arecompared, the absolute inequalities would be largerin Finland. This is because the higher educated dif-fer from other educational groups especially in
Finland, due to their exceptionally low morbidityand mortality. Since they are a relatively smallgroup, their contribution to the overall health
inequalities is limited. Comparing those with basiceducation only to all those with more than basiceducation, on the other hand, would give similar
results as the regression-based method.Three di�erent morbidity indicators were used
mainly for methodological reasons: to cover various
dimensions of morbidity and to cross-validate theresults. Despite the fact that the length of health ex-pectancy depends strongly on the measure of mor-bidity, the results were highly consistent: according
Table 6. The size of inequalities (based on the regression estimate) for life expectancy, life expectancy with ill health, health expectancyand healthy life percentage, between exact ages 25 and 75, calculated by using limiting long-standing illness (LLI), perceived less than
good health (PH) and functional disabilities (FD) as the indicator of morbidity. Finland and Norway, women aged 25±74 years
LifeLife expectancy with ill health Health expectancy lost Healthy life % lost
Country expectancy lost LLI PH FD LLI PH FD LLI PH FD
Finland all 3.0 18.1 22.5 11.1 21.1 25.5 14.1 38.6 47.8 23.5di�erencea 1.7 6.5 11.4 6.4 8.3 13.2 8.2 15.4 26.1 14.5
ratioa 1.8 1.4 1.7 1.8 1.5 1.7 1.8 1.5 1.7 1.9
Norway all 2.8 15.6 12.4 7.3 18.4 15.2 10.1 33.1 26.3 15.4di�erencea 1.5 6.3 13.3 7.0 7.8 14.8 8.4 14.4 29.0 15.2
ratioa 1.7 1.5 3.7 3.1 1.5 3.1 2.6 1.6 3.9 3.2
aIn each measure, ratio (di�erence) is the estimate for those at the bottom of the educational hierarchy divided by (minus) the estimatefor those at the top of the hierarchy.
Inequalities in health expectancy 311

to all indicators substantial socioeconomic inequal-ities in health expectancy were found and the size
of inequalities was on the same level in Finland andNorway in absolute terms.The absolute size of inequalities depended on the
prevalence of the morbidity indicator: according toperceived less than good health (PH) and limitinglong-standing illness (LLI) the size of inequalities in
years was considerably larger than according tofunctional disabilities (FD). This also applies todi�erent cut-o� points of limiting long-standing ill-
ness: extremely limiting long-standing illness indi-cated smaller absolute inequalities than limitinglong-standing illness. Since the precise magnitude ofhealth inequalities depends on the measure of ill
health chosen, there is no one measure of the sizeof inequalities in health expectancy.LLI indicated smaller relative inequalities than
FD or PH in Norway, but not in Finland. Onecould expect LLI and FD to give similar results,since they both are functional measures, i.e. they
take into account coping in one's physical andsocial environment. However, adaptation to socio-physical environment (due to e.g. health and wel-
fare programs) may play a greater role in LLIbecause this measure covers a broader (and moresubjective) area of activities than FD, which arebased on limited number of concrete tasks, like
walking for 5 min at a fairly fast pace without di�-culty.The reporting tendencies may vary with socioeco-
nomic status. Recent studies from Norway on socialclass (Elstad, 1996) and the Netherlands on edu-cation (Schrijvers et al., 1994; Mackenbach et al.,
1996) indicate that socioeconomic health di�eren-tials are underestimated by self-reported health databecause of relative underreporting by the lowersocial strata. The level of misreporting by socioeco-
nomic status may vary according to morbiditymeasure. However, it is not likely that there aremarked di�erences between LLI and FD, since they
both measure the functional consequences of mor-bidity, and since the relative underreporting by thelower social strata has been observed in various
measures of morbidity, like long-standing illness(Elstad, 1996), chronic lung disease, heart diseaseand diabetes (Mackenbach et al., 1996) and cancer
(Schrijvers et al., 1994). We lack studies on the levelof misreporting by socioeconomic status in Finland,but there are few reasons to expect the reportingtendencies to vary notably between Finland and
Norway since both countries are quite similarNordic welfare states.
The association between inequalities in mortality andinequalities in morbidity
There is a complex relationship between inequal-ities in mortality and inequalities in morbidity. Onehypothesis relates to mortality selection of peopleaccording to their health. According to this hypoth-
esis, when absolute mortality rates are high anddeaths occur principally among people with poor
health, the surviving population remains healthy.This health selection occurs more among lower edu-cated people, thus reducing morbidity di�erences by
education. Therefore large inequalities in mortalityare to be related to fairly small inequalities in mor-bidity.
This hypothesis can be speci®ed by the so calledtheory of insult accumulation (see, for example,Alter and Riley, 1989). This theory describes how
survived sicknesses in¯uence later health. Most sick-ness-episodes end in recovery, but each episodedamages the organism. These damages accumulateover time, adding the likelihood that future ex-
posures, hazards and episodes will produce a dis-ease or result in death. When mortality ratesdecline, some individuals who were most likely to
die under the higher mortality regime survive andthese ``new or marginal survivors'' are frail and sus-ceptible to health problems (Verbrugge, 1984).
Since a cohort in which mortality is low includesmore susceptible individuals at every age, low mor-tality is likely to be associated with higher morbid-
ity (Alter and Riley, 1989). From this point of view,large inequalities in mortality are expected to be re-lated to fairly small inequalities in morbidity.Another hypothesis emphasises that inequalities
in mortality and inequalities in morbidity have com-mon determinants. Since most deaths are precededby periods of ill-health, high rates of (more severe
forms of) morbidity are to be associated with fairlyhigh rates of mortality (see, for example,Verbrugge, 1982). From this point of view, it might
be expected that large inequalities (particularly) inmore severe forms of morbidity are to be related tolarge inequalities in mortality.However, as the larger inequalities in mortality in
Finland as compared to Norway are accompaniedby equally large absolute inequalities in morbidity,the results of this study suggest that there is no sup-
port to any of the above hypotheses, or that theycompensate each other.
Comparing inequalities in health expectancy in Fin-land and in Norway
In the 1970s socioeconomic inequalities in mor-
tality (among men) (Kunst and Mackenbach,1994a,b; see also Valkonen, 1989) and morbidity(Karisto et al., 1978) were larger in Finland than in
Norway. The synthetic overall measure, health ex-pectancy, shows that health inequalities were on thesame level in these two countries in the late 1980s,
although the level of mortality as well as morbiditywere still substantially higher in Finland. However,if one considers premature mortality to be more
severe than any indicator of morbidity, the mor-tality±morbidity mix of the health inequalities wasless favourable to Finland, since the size of absoluteinequalities in mortality was larger in Finland.
Ari-Pekka Sihvonen et al.312
Health expectancy and health policy
Both Finland and Norway are committed to ega-litarian health and welfare policies. Both countriesalso have their national ``Health for All by the
Year 2000'' programmes with the targets of increas-ing the average level of health and reducing thedi�erences between socioeconomic groups. Health
expectancy measures provide a promising measurefor evaluating whether these goals have beenachieved or not.
Health expectancy measures have advantages inthe monitoring of the pattern and the size of healthinequalities. First of all, information on mortalityand morbidity is combined into one ®gure which
gives a more comprehensive picture of healthinequalities than mortality or morbidity separately.Secondly, health expectancy measures can also take
into account the ``positive'' side of the health conti-nuum, that is survivorship and good health, insteadof the ``negative'' side only, that is death and ill
health. Thirdly, the results can be presented in ameasure that has a clear interpretation for research-ers, policymakers and laymen alike, i.e. in years oflife, instead of the more abstract mortality and
morbidity rates. Finally, health expectancymeasures direct attention to the absolute di�erencesin the size of health inequalities, which is particu-
larly important from the public health perspective.
AcknowledgementsÐWe are grateful to J.-K. Borgan andL. GroÈ tvedt (from Statistics Norway) for providing theNorwegian data sets on mortality and on morbidity. Thestudy has been supported by grants from the EuropeanUnion's Biomed 1 programme (CT92-1068), the ResearchCouncil for Culture and Society of the Academy ofFinland (projects 37631 and 30102) and the ResearchCouncil for Health of the Academy of Finland (project8386).
REFERENCES
Aiach, P. and Curtis, S. (1990) Social inequalities in self-reported morbidity: Interpretation and comparison ofdata from Britain and France. Social Science andMedicine 31, 267±274.
Alter, G. and Riley, J. C. (1989) Frailty, sickness, anddeath: Models of morbidity and mortality in historicalpopulations. Population Studies 43, 25±45.
Blaxter, M. (1989) A comparison of measures of inequalityin morbidity. In Health Inequalities in EuropeanCountries, ed. J. Fox, pp. 199±230. Gower, Aldershot.
Bebbington, A. C. (1988) The expectation of life withoutdisability in England and Wales. Social Science andMedicine 27, 321±326.
Bebbington, A. C. (1993) Regional and social variations indisability-free life expectancy in Great Britain. InCalculation of Health Expectancies: Harmonization,Consensus Achieved and Future Perspectives, eds. J.-M.Robine et al., Vol. 226, pp. 175±191. ColloquesINSERM, Paris/John Libbey Eurotext, London.
Bone, M. R. (1992) International e�orts to measure healthexpectancy. Journal of Epidemiology and CommunityHealth 46, 555±558.
van den Bos, G. A. M. and van der Maas, P. J. (1993)Social inequalities in the basic components of health ex-
pectancy: Chronic morbidity, disability and mortality.In Calculation of Health Expectancies: Harmonization,Consensus Achieved and Future Perspectives, eds. J.-M.Robine et al., Vol. 226, pp. 193±201. ColloquesINSERM, Paris/John Libbey Eurotext, London.
Boshuizen, H. C. and van de Water, H. P. A. (1994) AnInternational Comparison of Health Expectancies. TNOHealth Research, TNO-Report TNO-PG 94.046.
Bowling, A. (1991) Measuring Health. A Review of Qualityof Life Measurement Scales. Open University Press,Buckingham.
Cavelaars, A. E. J. M., Kunst, A. E., Geurts, J. J. M. andThe EU Working Group on Socio-economicInequalities in Health (1997a) Di�erences in self-reported morbidity by educational level: a comparisonof 11 western European countries. Journal ofEpidemiology and Community Health (in press).
Cavelaars, A. E. J. M., Kunst, A. E., Geurts, J. J. M. andThe EU Working Group on Socio-economicInequalities in Health (1997b) Morbidity di�erences byoccupational class among men in seven Europeancountries: An application of the Erikson-Gulthorpesocial class scheme. International Journal ofEpidemiology (in press).
Crimmins, E. M., Saito, Y. and Ingegneri, D. (1989)Changes in life expectancy and disability free life expect-ancy in the United States. Population and DevelopmentReview 15, 235±267.
Crimmins, E. M., Hayward, M. D. and Saito, Y. (1996)Di�erentials in active life expectancy in the older popu-lation of the United States. Journal of Gerontology 51,S111±S120.
van Doorslaer, E., Wagsta�, A., Bleichrodt, H. andCalonge, S. et al. (1997) Income-related inequalities inhealth: Some international comparisons. Journal ofHealth Economics 16, 93±112.
Elstad, J. I. (1996) How large are the di�erences, really?Self-reported long-standing illness among working classand middle class men Sociology of Health and Illness 18,475±498.
Esping-Andersen, G. (1990) Three Worlds of WelfareCapitalism. Polity Press, Oxford.
Van Ginneken, J. K. S., Dissevelt, A. G., Van de Water,H. A. and Van Sonsbeek, J. L. A. (1991) Results of twomethods to determine health expectancy in theNetherlands in 1981±1985. Social Science and Medicine32, 1129±1136.
Guralnik, J. M., Land, K. C., Blazer, D., Fillenbaum, G.G. and Branch, L. G. (1993) Educational status andactive life expectancy among older blacks and whites.New England Journal of Medicine 329, 110±116.
House, J. S., Kessler, R. C., Herzog, A. R., Mero, R. P.,Kinney, A. M. and Breslow, M. J. (1990) Age, socioeco-nomic status and health. The Millbank Quarterly 68,383±411.
Karisto, A., Notkola, V. and Valkonen, T. (1978)Socioeconomic status and health in Finland and theother Scandinavian countries. Social Science andMedicine 12, 83±88.
Katz, S., Branch, L. G., Branson, M. H., Papsidero, J. A.,Beck, J. C. and Greer, D. S. (1983) Active life expect-ancy. Journal of Medicine 309, 1218±1224.
Krieger, N., Williams, D. R. and Moss, N. E. (1997)Measuring social class in US public health research:Concepts, methodologies, and guidelines. Annual Reviewof Public Health 18, 341±378.
Kunst, A. E., Geurts, J. J. M. and van den Berg, J. (1992)An International Variation in Socio-economic Inequalitiesin Self-reported Health. A Comparison of the Netherlandswith other Industrial Countries. Netherlands CentralBureau of Statistics and Erasmus University,Rotterdam, Department of Public Health and SocialMedicine, The Hague.
Inequalities in health expectancy 313
Kunst, A. E., Geurts, J. J. M. and van den Berg, J. (1995)International variation in socioeconomic inequalities inself-reported health. Journal of Epidemiology andCommunity Health 49, 117±123.
Kunst, A. E. and Mackenbach, J. P. (1994a) Internationalvariation in the size of mortality di�erences associatedwith occupational status. International Journal ofEpidemiology 23, 742±750.
Kunst, A. E. and Mackenbach, J. P. (1994b) The size ofmortality di�erences associated with educational level innine industrialised countries. American Journal of PublicHealth 84, 932±937.
Kunst, A. E. and Mackenbach, J. P. (1994c) MeasuringSocio-economic Inequalities in Health. World HealthOrganization, Copenhagen.
Kunst, A. E., Cavelaars, A. E. J. M., Groenhof, F.,Geurts, J. J. M., Mackenbach, J. P. and The EUWorking Group on Socio-economic Inequalities inHealth (1996) Socio-economic Inequalities in Mortalityand Morbidity in Europe: A Comparative Study.Erasmus University, Rotterdam.
Kunst, A. E., Groenhof, F., Mackenbach, J. P. and TheEU Working Group on Socio-economic Inequalities inHealth (1997a) Occupational class and mortality amongmen 30±64 years in 11 European countries. SocialScience and Medicine (in press).
Kunst, A. E., Groenhof, F., Mackenbach, J. P. and TheEU Working Group on Socio-economic Inequalities inHealth (1997b) Occupational class and cause-speci®cmortality in 11 European countries. British MedicalJournal (in press).
Lahelma, E., Manderbacka, K., Rahkonen, O. andSihvonen, A.-P. (1993) III-health and its social patterningin Finland, Norway and Sweden. Research Reports 27,National Research and Development Centre for Welfareand Health, Helsinki.
Lahelma, E., Manderbacka, K., Rahkonen, O. andKaristo, A. (1994) Comparison of inequalities in health:Evidence from national surveys in Finland, Norway andSweden. Social Science and Medicine 38, 517±524.
Lahelma, E. and Arber, S. (1994) Health inequalitiesamong men and women in contrasting welfare states.European Journal of Public Health 4, 213±226.
Leclerc, A., Lert, F. and Fabien, C. (1990) Di�erentialmortality: Some comparisons between England andWales, Finland and France, based on inequalitymeasures. International Journal of Epidemiology 19,1001±1010.
Liberatos, P., Link, B. G. and Kelsey, J. L. (1988) Themeasurement of social class in epidemiology.Epidemiologic Reviews 10, 87±121.
Lundberg, O. (1986) Class and health: Comparing Britainand Sweden. Social Science and Medicine 26, 511±517.
Mackenbach, J. P., Loomen, C. W. N. and van der Meer,J. B. W. (1996) Di�erences in the misreporting ofchronic conditions, by level of education: The e�ect oninequalities in prevalence rates. American Journal ofPublic Health 86, 706±711.
Mackenbach, J. P. and Kunst, A. E. (1997) Measuring themagnitude socio-economic inequalities in health: Anoverview of available measures illustrated with twoexamples from Europe. In Special Issue on ``HealthInequalities in Modern Societies and Beyond'', eds. E.,Lahelma and O. Rahkonen. Social Science and Medicine44, 757±772.
The EU Working Group on Socio-economic Inequalitiesin HealthMackenbach, J. P., Kunst, A. E., Cavelaars,A. E. J. M., Groenhof, F. and Geurts, J. J. M. (1997)Socioeconomic inequalities in morbidity and mortalityin western Europe. Lancet 349, 1655±1659.
Macintyre, S. (1997) The Black report and beyond: Whatare the issues? In Special Issue on ``Health Inequalities in
Modern Societies and Beyond'', eds. E. Lahelma and E.O. Rahkonen. Social Science and Medicine 44, 723±747.
Mathers, C. D. and Robine, J.-M. (1993) Health expect-ancy indicators: A review of the work of REVES todate. In Calculation of Health Expectancies:Harmonization, Consensus Achieved and FuturePerspectives, eds. J.-M. Robine, C. D. Mathers, M. R.Bone and I. Romieu, Vol. 226, pp. 1±21. ColloqueINSERM/John Libbey Eurotext.
Mathers, C., McCallum, J. and Robine, J.-M. (eds.)(1994) Advances in health expectancies. Proceedings ofthe 7th meeting of the International Network on HealthExpectancy (REVES), Canberra, February 1994.Australian Institute of Health and Welfare, AGPS,Canberra.
Pamuk, E. R. (1985) Social class and inequality in mor-tality from 1921 to 1972 in England and Wales.Population Studies 39, 17±31.
Rahkonen, O., Lahelma, E., Karisto, A. andManderbacka, K. (1993) Persisting health inequalities:Social class di�erentials in illness in the Scandinaviancountries. Journal of Public Health Policy 13, 95±110.
Robine, J.-M., Colvez, A., Bucquet, D., Hatton, F.,Morel, B. and Lelaidier, S. (1986) L'esperance de viesans incapacite en France en 1982. Population 41, 1025±1042.
Robine, J.-M. and Ritchie, K. (1991) Healthy life expect-ancy: Evaluation of global indicator of change in popu-lation health. British Medical Journal 302, 457±460.
Robine, J.-M., Blanchet, J. M. and Dowd, J. E. (eds.)(1992) Health expectancy. First workshop of theInternational Healthy Life Expectancy Network(REVES). OPCS Studies on Medical PopulationSubjects No. 54. HMSO, London.
Robine, J.-M., Mathers, C. D., Bone, M. R. and Romieu,I. (eds.) (1993) Calculation of Health Expectancies:Harmonization, Consensus Achieved and FuturePerspectives, Vol. 226. Colloques INSERM, Paris/JohnLibbey Eurotext, London.
Schrijvers, C. T. M., Stronks, K., van de Mheen, D. H.,Coebergh, J.-W. W. and Mackenbach, J. P. (1994)Validation of cancer prevalence data from a postal sur-vey by comparison with cancer registry records.American Journal of Epidemiology 139, 408±414.
Shryock, H. S., Siegel, J. et al. (1976) The Methods andMaterials of Demography. Academic Press, New York.
Sullivan, D. F. (1971) A single index of mortality andmorbidity. HSMHA Health Reports 86, 347±354.
Targets for Health for All (1985) Targets in Support of theEuropean Regional Strategy for Health for All. WorldHealth Organization, Regional O�ce for Europe,Copenhagen.
Townsend, P. and Davidson, N. (1982) Inequalities inHealth. The Black Report. Penguin Books,Harmondsworth.
Valkonen, T. (1989) Adult mortality and level of edu-cation: A comparison of six countries. In Healthinequalities in European countries, ed. J. Fox. pp. 142±162. Gower, Aldershot.
Valkonen, T. (1993) Problems in the measurement and in-ternational comparisons of socioeconomic di�erences inmortality. Social Science and Medicine 36, 409±412.
Valkonen, T., Martelin, T., RimpelaÈ , A., Notkola, V. andSavela, S. (1993) Socioeconomic mortality di�erences inFinland 1981±1990. Statistics Finland, Helsinki.
Valkonen, T., Sihvonen, A.-P. and Lahelma, E. (1997)Health expectancy by level of education in Finland. InSpecial Issue on ``Health Inequalities in Modern Societiesand Beyond'', eds. E. Lahelma and O. Rahkonen. SocialScience and Medicine, 44, 801±808.
Verbrugge, L. (1982) Sex di�erentials in health PublicHealth Reports 97, 417±437.
Ari-Pekka Sihvonen et al.314

Verbrugge, L. (1984) Longer life but worsening health?
Trends in health and mortality of middle-aged and
older persons Millbank Memorial Fund Quarterly 62,
475±519.
Vogel, J. (1991) Social Report for the Nordic Countries.
Living Conditions and Inequality in the Late 1980's.
Statistical Report of the Nordic Countries 55,
Copenhagen.
VaÊ geroÈ , D. and Lundberg, O. (1989) Health inequalities in
Britain and Sweden. Lancet II, 35±36.
Wagsta�, A., Paci, P. and van Doorslaer, E. (1991) Onthe measurement of inequalities in health. Social Scienceand Medicine 33, 545±557.
van de Water, H. P. A., Boshuizen, H. C. andPerenboom, R. J. M. (1996) Health expectancy in theNetherlands 1983±1990. European Journal of PublicHealth 6, 21±28.
Wilkins, R. and Adams, O. B. (1983) Healthfulness ofLife. A Uni®ed View of Mortality, Institutionalization,and Non-institutionalized Disability in Canada 1978. TheInstitute for Research on Public Policy, Montreal.
Inequalities in health expectancy 315
Related Documents


![Proposals to Extend Healthy Life Expectancy in Shizuoka ...€¦ · [Gap between life expectancy and healthy life expectancy in Shizuoka Prefecture] Healthy life expectancy *Source:](https://static.cupdf.com/doc/110x72/5f427921a09c2479a15262fb/proposals-to-extend-healthy-life-expectancy-in-shizuoka-gap-between-life-expectancy.jpg)