6σ Note 1 6- σ Requi rement f or Green and Bl ack Belt The green belt must be familiar with and competent in th e following concepts: • The six σ approach. • Basic statistical process control. • Classical design of experiments. • Basic measurement system assessment. • Statistical analysis for process improvement. • Process !"#. • Team problem$solving. • Cost of %uality. &n addition to the re%uirements of the green belt' the blac( belt must have expertise in the following areas: • #dvanced statistical proc ess control. • T aguchi and classical design of experiments. • #dvanced measurement sy stem assessment. • Pro)ect management fundamentals. • Short run SPC. • !ista(e$proofing. • *ean manufacturing. • #dvanced product %uality planning +#P,P-. Customer Satisfaction . Cus tomer sat isfaction is cre ate d thr ough:

Welcome message from author
This document is posted to help you gain knowledge. Please leave a comment to let me know what you think about it! Share it to your friends and learn new things together.
Transcript

8/12/2019 Six Sigma Fundamentals Note
http://slidepdf.com/reader/full/six-sigma-fundamentals-note 1/24
6σ Note
1 6-σ Requirement for Green and Black Belt
The green belt must be familiar with and competent in th e following concepts:
• The six σ approach.
• Basic statistical process control.
• Classical design of experiments.
• Basic measurement system assessment.
• Statistical analysis for process improvement.
• Process !"#.
• Team problem$solving.
• Cost of %uality.
&n addition to the re%uirements of the green belt' the blac( belt must have expertise in the following
areas:
• #dvanced statistical process control.
• Taguchi and classical design of experiments.
• #dvanced measurement system assessment.
• Pro)ect management fundamentals.
• Short run SPC.
• !ista(e$proofing.
• *ean manufacturing.
• #dvanced product %uality planning +#P,P-.
Customer Satisfaction
. Customer satisfaction is created through:
8/12/2019 Six Sigma Fundamentals Note
http://slidepdf.com/reader/full/six-sigma-fundamentals-note 2/24
(nowledge of the customer
overall customer service systems+the above / are all 0hardware1 of CS-
responsiveness and the ability to meet all customer re%uirements and expectations +but
this is the systemic 0software1' which can not be established only by buying software
and hardware-
2 # company has not only 0external1 customer' but has 0internal1 ones too. 3arious departments and
sections are customers to each other in the term of cross$boarder service' information' and product
delivery. So' the hypothetic is' if the internal customers can not be satisfied' it4s hard to believe that the
external customer will be. The %uality of product relates to every section inside and outside the company
and both sides have the same %uality$satisfaction demand and re%uirement. That4s a very important and
edge$cutting perspective of %uality issues' which sets a guideline for the company4s %uality initative.
/. Two of the most common techni%ues for documenting the voice of the customer in their own terms
are:
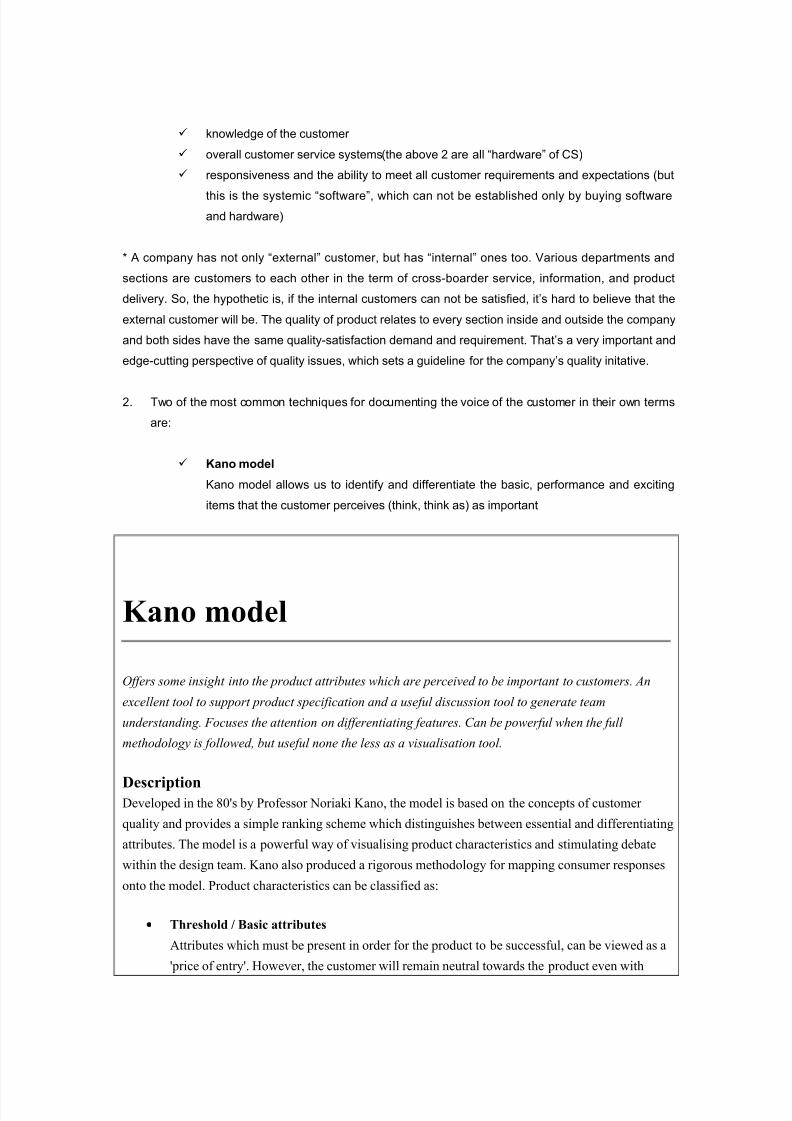
Kano model
5ano model allows us to identify and differentiate the basic' performance and exciting
items that the customer perceives +thin(' thin( as- as important
Kano model
Offers some insight into the product attributes which are perceived to be important to customers. An
excellent tool to support product specification and a useful discussion tool to generate team
understanding. Focuses the attention on differentiating features. Can be powerful when the full
methodology is followed, but useful none the less as a visualisation tool.
DescriptionDeveloped in the 80's by Professor Noriaki Kano, the model is based on the concepts of customer
quality and provides a simple ranking scheme hich distinguishes beteen essential and differentiating
attributes! "he model is a poerful ay of visualising product characteristics and stimulating debate
ithin the design team! Kano also produced a rigorous methodology for mapping consumer responses
onto the model! Product characteristics can be classified as#
• Threshold / Basic attributes
$ttributes hich must be present in order for the product to be successful, can be vieed as a
'price of entry'! %oever, the customer ill remain neutral toards the product even ith

8/12/2019 Six Sigma Fundamentals Note
http://slidepdf.com/reader/full/six-sigma-fundamentals-note 3/24
improved e&ecution of these aspects!
• One dimensional attributes Performance ( )inear*
"hese characteristics are directly correlated to customer satisfaction! +ncreased functionality or
quality of e&ecution ill result in increased customer satisfaction! onversely, decreasedfunctionality results in greater dissatisfaction! Product price is often related to these attributes!
• Attractive attributes -&citers ( Delighters*
ustomers get great satisfaction from a feature . and are illing to pay a price premium!
%oever, satisfaction ill not decrease belo neutral* if the product lacks the feature! "hese
features are often une&pected by customers and they can be difficult to establish as needs up
front so, sometimes the situation ill go conversely so that customer is not illing to pay
price premium for the attractive attributes*! /ometimes called unknon or latent needs!
Product differentiation can either be gained by a high level of e&ecution of the linear attributes or the
inclusion of one or more 'delighter' features! ut, it should be remembered that customer e&pectations
change over time and a cup holder in a car may be today's delighter, but tomorro it ill be e&pected!
/ome users of Kano also suggest that an additional set of attributes can be classified as 'enragers' .
features hich enrage either through their absence or inclusion!

8/12/2019 Six Sigma Fundamentals Note
http://slidepdf.com/reader/full/six-sigma-fundamentals-note 4/24
Figure 1: the Kano model
Method
Kano developed a structured user questioning methodology to help characteri1e different features and
remove ambiguity by ensuring that categori1ation is based on user research! "he methodology is
relatively straightforard, as outlined belo#
2! Determine main features, which need to be classified 3irstly, the features of interest need to be determined
4! Devise questionnaire
"he questionnaire aims to understand ho potential customers ould feel if a feature as either present
or not present! "his is achieved by asking to questions for each feature . a functional question ie . the
feature is present* and a dys.functional question ie the feature is not present*, as shon in the diagram
opposite!
5! Sum responses
$s ith any intervie method, sufficient responses must be sought! $n average response should be

8/12/2019 Six Sigma Fundamentals Note
http://slidepdf.com/reader/full/six-sigma-fundamentals-note 5/24
calculated!
6! Identify classification
ased upon the responses, the type of feature can be determined from a simple look.up table, as shon belo! Note, there are some additional attribute classifications#
• +ndifferent responses# these are attributes to hich the customer pays no attention 7+f they are
present, it is nice! +f they are not present, it does not matter7
• uestionable responses and reversals# responses hich contradict each other!
9! Plot features onto the Kano graph
+deally, the features should be mapped onto the graph to provide a visual guide to the relative
importance from a user perspective of different aspects of functionality!
Figure 2: The Kano charts: M te!ting is a Must "or a mobile phone
#otes
• an be difficult to grasp conceptually, but provides a useful additional dimension to specifying
features . in addition to 'ant', 'must have'
• Needs team involvement, as it links like 3D* product features ith user perceptions
• $ good ay of organi1ing customer input

8/12/2019 Six Sigma Fundamentals Note
http://slidepdf.com/reader/full/six-sigma-fundamentals-note 6/24
• an be used ithout customer input as a visuali1ation tool
QFD qualit! function de"lo!ment#
,6 is a specific techni%ue consisting of a series of interloc(ing matrices that translate
customer functionality into product or service or process characteristics. Specifically'
,6 provides a systematic methodology that helps the organi7ation to:
• Thoroughly translate customer functionalities into re%uirements. $Collect
• Prioriti7e those re%uirements. 8 Prioriti7ation
• Benchmar( characteristics against competition and best practices.$
Compare
• 6ecide how to meet or exceed the re%uirements by incorporating those
features into the product' process or service$ &mplementation or
&mprovment
$ualit% Function Deplo%ment & $FD
QFD is a powerful tool to support product definition and aims to lin customer re!uirements to
technical or engineering characteristics. "he tool provides a conceptual map for communication
across functions and provides a focus for design priorities. QFD promotes cross functional teamwor
and negotiation and focuses the mind on #what you don#t now#.
Description
3D originated in :apan in the late 2;<0's and is used e&tensively in the far east to support product
development in a range of industries including automotive, consumer electronics, clothing, construction
and shipbuilding! /ince the 2;=0's, it has become increasingly adopted in the est and has been
credited ith supporting the revival of the >/ automotive industry!
3D is a tool to help structure product planning and design and aims to ensure that customer needs are
focused on throughout a pro?ect from concept design through to manufacture! $t the heart of 3D is
the %ouse of uality hich links predetermined customer attributes to specific technical
characteristics!

8/12/2019 Six Sigma Fundamentals Note
http://slidepdf.com/reader/full/six-sigma-fundamentals-note 7/24
"he %ouse of uality is built up from < interrelated matrices#
2* The customer attributes
Describing hat the product must do, a structured list of needs and ants, determined bymarket research! @epresents the Aoice of the ustomer
4* The engineering characteristics
Describing ho the product may achieve its required performance in general terms hich are
not solution specific! @epresents the Aoice of the Designer!
5* 'elationships
eteen the customer attributes and the engineering characteristics, indicating here there
are strong, moderate or eak relationships!
6* Technical matri!
+ndicating the technical priorities based on the relationships beteen customer requirements
and engineering characteristics! $lso providing quantitative design targets for each of the
engineering characteristics, based on the technical priorities and competitive benchmarking!
9* Technical (orrelations
@ecording ho the engineering characteristics may be ither mutually supporting or
contradictory
<* )lanning Matri!
Providing quantitative market data for each of the customer attributes! Aalues can be based on
user research, competitive analysis or team assessment

8/12/2019 Six Sigma Fundamentals Note
http://slidepdf.com/reader/full/six-sigma-fundamentals-note 8/24
#otes
• Demands a cross functional team, including market, technical and production representation
•
an be e&ceedingly comple& and time consuming, sometimes tedious • an be too analytical . a numerical anser can be treated as a 'right' anser
• @equires some training and strong facilitation initially
• $lso see document of PFD In Service Industry
#fter anything and all thing you can do on %uality assurance' there will still is some complaint about the
%uality defect or brea(down' so' routing the complaint to concerned department of specific individual is
your next move. *istening to the customer' collecting the complaint and feed bac(ing this to %uality
process and management.
Ta(ing a broader view' the customer satisfaction is not only achieved by the company' but by the
supplier to the company. So' ta(e good care of the communication and partnership with suppliers in
terms of %uality standard and assurance. That4s why 9$σ adds supplier as a important participant into
the %uality schema.
The supplier must become an extension of the buyers organi7ation.
The supplier and buyer organi7ation must wor( closely together for the mutual benefit of both
parties.
They must establish a long$term purchase agreement.
They must initiate )oint %uality$related activities +training' planning' etc.-.
6ata' is very critical for understanding customer satisfaction. So' attention the emphasis on the standard
and process of collecting and analy7ing data.
$ %&e 6-σ D'()C 'odel
6!#&C is for define' measure' analy7e' improve and control +6!#&C- approach.
Define
The first stage;define;serves as the platform for the team to
get organi7ed
determine the roles and responsibilities of each member of the team

8/12/2019 Six Sigma Fundamentals Note
http://slidepdf.com/reader/full/six-sigma-fundamentals-note 9/24
establish team goals and milestones
review the process steps.
The (ey points to be defined at this stage are the voice of the customer' the scope of the pro)ect' the
cause and effect prioriti7ation +a list that the team creates for pursuing the specific pro)ect based on
cause and effect criteria- and pro)ect planning. +#ligning to the business strategy and the preliminary
definition of the pro)ect-.
The 6 phase includes:
Define the problem.
The problem is based on available data' is measurable and excludes any assumptions about
possible causes or solutions. &t must be specific and attainable.
Identify the customer .
This is more demanding as we systematically begin the process of analysis. <e must identify
who is directly impacted by the problem and at what cost. <e begin by conducting a random
sample analysis to identify the overall impact and then we proceed with a detailed analysis of
the cost of poor %uality +C=P,-. The focus of the team here is to identify a large base of
people +>- affected by poor %uality.
Identify critical to quality (CTQ) characteristics.
By identifying CT, characteristics' the pro)ect team determines what is important to each
customer from the customers point of view. &dentification of CT, characteristicts ascertains
how these particular features appear when meeting customer expectations. Typical %uestions
here are: <hat is ?good condition>? and what is ?on time>?
(ritical To $ualit% & (T$
"s ritical to uality* are the key measurable characteristics of a product or process hose
performance standards or specification limits must be met in order to satisfy the customer! "hey align
improvement or design efforts ith customer requirements!
"s represent the product or service characteristics that are defined by the customer internal or
e&ternal*! "hey may include the upper and loer specification limits or any other factors related to the
product or service! $ " usually must be interpreted from a qualitative customer statement to an
actionable, quantitative business specification!

8/12/2019 Six Sigma Fundamentals Note
http://slidepdf.com/reader/full/six-sigma-fundamentals-note 10/24
"o put it in layman's terms, "s are hat the customer e&pects of a product!!! the spoken needs of the
customer! "he customer may often e&press this in plain -nglish, but it is up to us to convert them to
measurable terms using tools such as D3B-$, etc!
Map the process.
!apping of the process in this stage of the define phase of the six σ methodology is nothing
more than a high level visual representation of the current process steps leading up to
fulfillment of the identified CT, characteristics. This ?as is? process map will be useful
throughout the process as:
# method for segmenting complex processes into manageable portions.
# way to identify process inputs and outputs.
# techni%ue to identify areas of rewor(.
# way to identify bottlenec(s' brea(downs and non$value$added steps.
# benchmar( against which future improvements can be compared with the
original process.
Process mapping
A structured way of mapping and criti!uing the existing $%& '$ew %roduct &ntroduction( process, in
order to examine its effectiveness along a number of dimensions. )ncourages a multi*functional teamto identify critical elements in the process and locate potential areas for improvement.
Description
$ 'bron paper' e&ercise, is so called as it uses a large scale format to map an e&isting business process,
ith an emphasis on being 'rough and ready' rather than a precise, neat and tidy document! $pplied to
the product development process, it encourages a shared understanding of the implications of ne
product introduction on different parts of the business and helps to generate a shared onership of the
process! +t is likely that the process map ill illustrate the comple&ity of the NP+ process and
demonstrate critical flos of information, key check points and areas of over or under* bureaucracy!
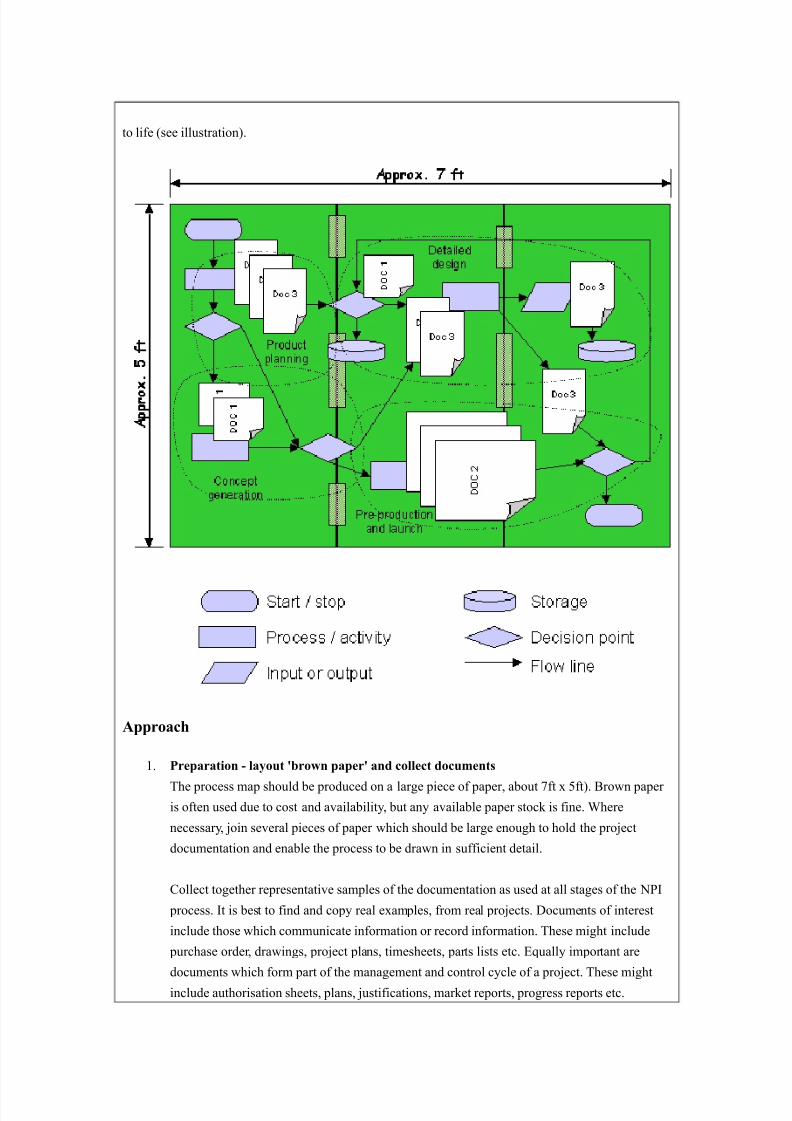
"he output is intentionally physically large, hich can be daunting at first but aims to bring the process
8/12/2019 Six Sigma Fundamentals Note
http://slidepdf.com/reader/full/six-sigma-fundamentals-note 11/24
to life see illustration*!
Approach
2! )reparation & la%out *bro+n paper* and collect documents
"he process map should be produced on a large piece of paper, about =ft & 9ft*! ron paper
is often used due to cost and availability, but any available paper stock is fine! Chere
necessary, ?oin several pieces of paper hich should be large enough to hold the pro?ect
documentation and enable the process to be dran in sufficient detail!
ollect together representative samples of the documentation as used at all stages of the NP+
process! +t is best to find and copy real e&les, from real pro?ects! Documents of interest
include those hich communicate information or record information! "hese might include
purchase order, draings, pro?ect plans, timesheets, parts lists etc! -qually important are
documents hich form part of the management and control cycle of a pro?ect! "hese might
include authorisation sheets, plans, ?ustifications, market reports, progress reports etc!

8/12/2019 Six Sigma Fundamentals Note
http://slidepdf.com/reader/full/six-sigma-fundamentals-note 12/24
4! Arrange documents on paper
$rrange the documents on the paper to demonstrate the overall flo of the process! +t helps to
start at the top left aiming to finish at the bottom right hand corner! /tart by ?ust placing the
documents on the bron paper and move them around to fit as the overall story becomes
clearer!
5! Dra+ process
>sing the documents as a guideline, dra the process, orking from left to right and top to
bottom! Cherever possible, use standard flo chart symbols, to depict# start and stop points
specific processes and activities inputs(outputs to(from activities decision points .
E(N(Baybe document storage! +t should be possible to run through the process and follo the
flo of decisions and information!
6! Map the phases o" the #), process
Bap the key pro?ect phases, ith a dotted line around activities, documents and decision
points ithin that phase! +f no phases are currently defined, them using the process map as a
guide, define some process stages! Bake sure that all phases are represented, from idea to
production implementation
9! (riti-ue process
%aving produced the process map, the real benefit comes from critiquing the e&isting process!
>sing post.itF notes, record any areas of uncertainty, difficulty or general interest using
different coloured post.it notes for different issues*! "he team should vie this stage as an
open brainstorm, here anything goes! Gf particular interest are#
. %o effective is the overall process structureH
. %o effectively are the management and control elements defined, including decision points,reporting and authorisationH
. %o are pro?ect risks managedH
. Cho is involved hen, ho are pro?ects resourced and managedH
. +s there effective leadership and does the organisation support teamorkH
. Chat information and communication is provided to different parts of the businessH
. $re any metrics used to manage efficiency and effectiveness of e&ecutionH
. Chere and hen are e&ternal design specialists involvedH
. Chere, hen and ho often is there any customer or user input into a pro?ectH
<! 'ecord actions . note possible improvements
"he critique should generate some specific actions for further consideration and also possible
ideas for process improvement! "hese should be recorded!
=! 'e&engineer
"aking into account the issues raised during the critique session, re.engineer and simplify the
process!
Scoping the project (Ma!ing deep di"ing in ho# to understand the project itself)

8/12/2019 Six Sigma Fundamentals Note
http://slidepdf.com/reader/full/six-sigma-fundamentals-note 13/24
The last step of the define stage is scoping the pro)ect and if necessary' updating the pro)ect
charter. 6uring this step the team members will further specify pro)ect issues' develop a
refined problem statement and brainstorm suspected sources of variation. The focus of this
step is to reduce the scope of the project to a le"el that ensures the problem is #ithin the
team$s area of control ' that data can be collected to show both the current and improved
states and that improvements can be made within the pro)ects timeframe.
rainstorming
)xtremely popular approach to idea generation, but often not done as effectively as it could be. A basic
tool that all design teams should be able to apply well.
Description
Griginally developed by $le& Gsborn in the 2;50s as a tool so support fact, idea and solution finding,
based on to principles#
• Deferred ?udgement . in a typical meeting, e both ideate and evaluate simultaneously and are
trained to be dominant at ?udgement! +t is essential in a brainstorm to be able to suspend
?udgement and focus on the ideation!
• uantity breeds quality . taking the vie that the best ay to find a good idea is to have lots
of ideas, hich can be combined, built on and developed!
Method
2! arm up and prepare
No physical e&ercise should be taken ithout first arming up and this is also true for mental
e&ercise! "reat brainstorming as mental e&ercise and begin ith some arm up e&ercises, such
as ord games! +n addition, it really helps to start a session having first prepared! +f the
brainstorm is about kettles, then go to a shop and look at some kettles! /ho and tell thing that
you like and dislike and hy! )ook for elegant solutions from other areas!
4! 0stablish and agree pla%"ul rules
"he rules are not there to constrain but to ensure that the brainstorm is effective see
illustration*! Put the rules up on the all so everyone can clearly see them! Nominate a
chairperson to ensure that the rules are adhered to! Baybe have a bu11er to press hen too
much discussion starts, or perhaps a 'yello card' to raise hen the rules are broken!
5! tate and discuss the problem & have a sharp "ocus
$lays begin ith a clear problem statement! $void being too narro e!g! 'spill proof coffee

8/12/2019 Six Sigma Fundamentals Note
http://slidepdf.com/reader/full/six-sigma-fundamentals-note 14/24
cup lids'* and avoid suggesting a solution! Don't be too product focused e!g! 'bicycle cup
holders'* or too inard looking e!g! 'ho can e gain market share, or increase sales of
product I'*! 3ocus on both the problem and the customer's needs e!g! 'ho can e help
cyclists to drink hot drinks ithout spilling it or burning their mouthsH'*!
6! Brainstorm
"ry to build and combine different ideas . build on an ideas strengths and develop any
interesting aspects! ombine elements of different ideas! +f a good idea is proposed, look for
other ays of achieving the same result! Chen ideas dry up, try a ne approach or re.pose the
problem in a different ay!
9! (apture and displa% & be visual
-nsure that all ideas are captured and displayed, either in ritten or graphical form! -ncourage
sketching hoever poor* rather than riting at all times! >se the all space as a ay of
recording and keeping track of the flo and development of ideas! +t can sometimes be useful
to map the relationships beteen different ideas! "o support this stage, it can be useful to
cover the alls ith paper before starting!
$ny visual approaches should be encouraged, from sketching to diagrams, mind maps, stick
figures or even simple models! %ave the necessary materials to hand, including tape, card,
foam, blocks and modelling clay!
<! 0valuate
Gnly once the session has dried up, should the team begin to evaluate the different ideas!
3irstly, sort the ideas into categories, based on some elements of similarity! /econd, evaluate
the ideas against some general criteria for success!
#otes
• Do*s and don*ts
elo is a summary of some brainstorm do's and don'ts, along ith a summary of the key
items hich are needed and the role of the brainstorm leader!

8/12/2019 Six Sigma Fundamentals Note
http://slidepdf.com/reader/full/six-sigma-fundamentals-note 15/24
• Dra+bacs o" brainstorming
+t is possible for a brainstorm to be dominated by one or to individuals, of for the facilitatorto be over 1ealous! "his can result in an atmosphere hich inhibits participation by some
members! +n addition, unless the team is good at e&pressing ideas visually, it is normally orally
and verbally driven!
@@@@so' the lines above indicates a very important principle of 9σ methodology: realistic. The
only way of ma(ing the process of continual improvement is to define' understand and scope
the existing problem within the realistic team4s ability of solving problem. #nd modern team
and pro)ect methodology is exactly to divide the problem into pieces that can be solved by
existing team and talent. That4s why western companies can gain great growth and
outstanding in engineering$ not only the pro)ect engineering' but the management.-
The greatest thing in the world is developing a methodology that can enable a lot of common
people to reali7e very difficult and complicated pro)ect of social' business' and engineering.AAAA
ltimately' the purpose of this stage is to set the foundations for the wor( ahead in solving a
problem. This means that an excellent understanding of the process must exist for all team
members' as well as complete understanding of the CT, characteristics. #fter CT, factors
are identified' everyone in the team must agree on developing an operational definition for
each CT, aspect.
"ffective operational definitions: OUTPUT
• 6escribe the critical to %uality characteristics accurately. $#ccuracy
• #re specific so that the customer expectation is captured correctly. 8Precise' specific
enough to cover all the re%uirements.

8/12/2019 Six Sigma Fundamentals Note
http://slidepdf.com/reader/full/six-sigma-fundamentals-note 16/24
• #re always written to ensure consistent interpretation and measurement by multiple
people. 8 or Continual !anagement and &mprovement
'easure
The second stage of the 6!#&C model;measure;is when the team establishes the techni%ues for
collecting data about current performance that highlights pro)ect opportunities and provides a structure
for monitoring subse%uent improvements. pon completing this stage' we expect to have a plan for:
collecting data that specifies the data type 8 do #hat%
and collection techni%ue$ ho# to do%
a validated measurement system that ensures accuracy and consistency$ ho# to
"alidate #hether the data is the right data collection%
a sufficient sample of data for analysis$ solid data base for analysis
a set of preliminary analysis results that provides pro)ect direction$ initial data analysis
#hich direct the team the direction& sometimes it #ill direct the #rong one& probably
and baseline measurements of current performance.$ output
*%&e difference +et,een ariation and ariance s&ould +e understood in t&e conte.t of 6σ/0
The focus of this stage is to develop a sound data collection plan, identify key process input
variables (KPIV), display variation using Pareto charts, histogras, run charts, and baseline
easures of process capability and process siga level . The steps to carry through this stage are:
• &dentify measurement and variation. The measure subsets establish the re%uirements of
measurement and variation' including: a- the types and sources of variation and the impact of
variation on process performance' b- the different types of measures for variance and the
criteria for establishing good process measures' and c- the different types of data that can be
collected and the important characteristics of each data type. #s part of this step the types of
variation must be defined. There are two types of causes of variation:
o Common causes. These are conditions in a process that generate variation through
the interaction of the !s +machine' material' method' measurement' manpower- and
" +environment-. Common causes affect everyone wor(ing in the process' and affect
all of the outcomes. They are always present and thus are generally predictable. They
are generally accepted sources of variation and offer opportunities for process
improvement.
o Special causes. These are items in a process that generate variation due to
extraordinary circumstances related to one of the !s or ". Special causes are not
always present' do not affect everyone wor(ing in the process and do not affect all of
the outcomes. Special causes are not predictable.

8/12/2019 Six Sigma Fundamentals Note
http://slidepdf.com/reader/full/six-sigma-fundamentals-note 17/24
)areto (hart
+f you record the reasons for a machine, say a photocopier, breaking don over a period of time you might find a
variety of different problems, some more common than others!
+f you no record the frequency of each of these reasons you ill find that a small number of reasons ill
account for most of the breakdons! "he problems ill be far less evenly distributed than you might have
anticipated!
"his is an e&le of the )areto )rinciple, or the 80.40 rule! +n general about 80J of the problems ill result
from about 40J of the causes! "he Pareto principle is not confined to statistics, but crops up in various situations!
3or e&le, it applies to the distribution of ealth in society, about 40J of the people on about 80J of the
ealth! +t applies to the value of inventory, or stock in a typical company about 80J of the value is tied up is in
about 40J of the items held!
"his is important because if you are trying to improve a process it is important to concentrate your attentions on
these vital fe reasons rather than dilute your efforts on the trivial manyH
"he Pareto hart is the basic tool for identifying the vital fe! +t is simply a type of histogram, but ordered by the
frequency of occurrence!
"he breakdons are#
#umber o" De"ects 'epair (ost 34 Total (ost
paper particle buildup =6 50 4440
e&cessive temperature 58 =9 4890
orn roller 9 2;0 ;90
defective paper 20 40 400
guides misaligned not match* 4< 50 =80

8/12/2019 Six Sigma Fundamentals Note
http://slidepdf.com/reader/full/six-sigma-fundamentals-note 18/24
"he diagram belo sho the usual form of a Pareto hart! "he bars represent the number of defect! "he
superimposed line graph shos the cumulative height of the bars! "his makes the charts easier to diagnose!
"he charts can be dran to sho the number of defects or the cost of the defects#
Pareto harts are used as the first stage in a process improvement pro?ect!
Despite their apparent simplicity they provide an ob?ective ay of deciding on the candidates for improvement,
and are remarkably effective!
%ool 123 4areto C&art
#5#
Pareto #nalysis' Pareto Principle
Classification
#naly7ingD&rending +#T-
Tool description
"he Pareto chart is a bar chart arranged in a descending order of si1e or importance from left to right to separate

8/12/2019 Six Sigma Fundamentals Note
http://slidepdf.com/reader/full/six-sigma-fundamentals-note 19/24
and display the critical fe from the trivial many causes of a problem! +t is named after Ailfredo Pareto ho, in
the late 2800s, postulated the 80(40 role, hich states that 80 percent of the trouble is due to 40 percent of the
causes! "he Pareto chart ill also sho the cumulative percentage for each cause on the chart!
T%pical application
• "o prioriti1e potential causes of a problem!
• "o establish and verify cause and effect!
• "o reach consensus on hat needs to be addressed first!
• "o identify improvement opportunities!
• "o measure success of corrective action!
)roblem&solving phase
/elect and define problem or opportunity
+dentify and analy1e causes or potential change
Develop and plan possible solutions or change
+mplement and evaluate solution or change
Beasure and report solution or change results
@ecogni1e and reard team efforts
T%picall% used b%
@esearch(statistics
reativity(innovation
-ngineering
Pro?ect management
2 Banufacturing

8/12/2019 Six Sigma Fundamentals Note
http://slidepdf.com/reader/full/six-sigma-fundamentals-note 20/24
5 Barketing(sales
$dministration(documentation
6 /ervicing(support
7 ustomer(quality metrics
1 hange management
lins to other tools
#otes and e% points
tep&b%&step procedure
• /"-P 2 +dentify the data source! /ee e&le "ape +nit Assembly Defects.
• /"-P 4 alculate percentages for totals of each type of defect!
• /"-P 5 Dra a Pareto chart as shon in the notes and ey points above!
• /"-P 6 Designate left and right vertical scales!
• /"-P 9 Dra the bars in accordance ith total defects per type!
• /"-P < onstruct the cumulative line left to right* by adding the respective percentage for each defect
type and connect plots ith straight lines, as shon in the e&le!
• /"-P = "itle the Pareto chart include time period covered and source of data!

8/12/2019 Six Sigma Fundamentals Note
http://slidepdf.com/reader/full/six-sigma-fundamentals-note 21/24
0!ample o" tool application
Tape 8nit Assembl% De"ects
Tape 8nit Assembl% De"ects April4 $uantit% 9;<
$ . >nit surface scars(scratches* =0 6=
. /ub.assembly defective* 24 8
. Bounting parts incorrect(missing* 8 9
D . +nsulators cracked(missing* 45 29
- . Cire incorrect lenght* 20 =
3 . $ssembling incorrect* = 9
L . /oldering J fill re?ects* 29 20
% . )abeling missing(incorrect* 9 5
M M
290 200
O@ounded

8/12/2019 Six Sigma Fundamentals Note
http://slidepdf.com/reader/full/six-sigma-fundamentals-note 22/24
#bout more Pareto Chart' see Pareto Chart
• 6etermine data type. &n this step the team must be able to answer the %uestion' ?<hat do we
want to (now>? Eeviewing materials developed during the previous stage' the team determines
what process or product characteristics they need to learn more about. # good start is the
definition of the data type. This is determined by what is measured. Two types of data can be
collected by measuring:
o #ttribute data. =ne way to collect data is to merely count the fre%uency of occurrence
for a given process characteristic +e.g. the number of times something happens orfails to happen-. 6ata collected in this manner is (nown as attribute data. #ttribute

8/12/2019 Six Sigma Fundamentals Note
http://slidepdf.com/reader/full/six-sigma-fundamentals-note 23/24
data cannot be meaningfully subdivided into more precise increments and is discrete
by nature. ?FoDno go? and ?passDfail? data are examples of this category.
o 3ariable data. # different way to loo( at data is to describe the process characteristic
in terms of its weight' voltage or si7e. 6ata collected in this manner is (nown asvariable data. <ith this type of data' the measurement scale is continuous$it can be
meaningfully divided into finer and finer increments of precision.
• 6evelop a data collection plan. &n developing and documenting a data collection plan the team
should consider:
o <hat the team wants to (now about the process.
o The potential sources of variation in the process +Gs-.
o <hether there are cycles in the process and how long data must be collected to
obtain a true picture of the process.
o <ho will collect the data.
o How the measurement system will be tested.
o <hether operational definitions contain enough detail.
o How data will be displayed once collected.
o <hether data is currently available' and what data collection tools will be used if
current data does not provide enough information.
o <here errors in data collection might occur and how errors can be avoided or
corrected.
• Perform measurement system analysis. This step involves performing graphical analysis and
conducting baseline analysis. 6uring this step' the team verifies the data collection plan once it
is complete and before the actual data is collected. This type of analysis is called a
measurement system analysis +!S#-. # typical !S# indicates whether the variation measured
is from the process or the measurement tool. The !S# should begin with the data collection
plan and should end when a high level of confidence is reached that the data collected will
accurately depict the variation in the process. By way of a definition' !S# is a %uantitative
evaluation of the tools and processes used in ma(ing data observations. Perhaps the most
important concept in any !S# study is that if the measurement system fails to pass analysis
before collecting data' then further data should not be collected. Eather' the gauge should be
fixed' the measurement system should be fixed and the measurement ta(ers should be
trained.

8/12/2019 Six Sigma Fundamentals Note
http://slidepdf.com/reader/full/six-sigma-fundamentals-note 24/24
• Collect the data. 6uring this step' the team must ma(e sure that the collected data is
appropriate' applicable and accurate' and that it provides enough information to identify the
potential root cause of the problem. &t is not enough to plan carefully before actually collecting
the data and then assume that everything will go smoothly. &t is important to ma(e sure that the
data continues to be consistent and stable as it is collected. The critical rules of data collection
are:
o Be there as the data is collected.
o 6o not turn over data collection to others.
o Plan for data collection' design data collection sheets and train data collectors.
o Stay involved throughout the data collection process.
The outcome of this step must be an ade%uate data set to carry into the analy7e stage.
Related Documents