1 1/1/22 Mohammad Mostafizur Rahman Process Support, COP Introduction to Six Sigma

Welcome message from author
This document is posted to help you gain knowledge. Please leave a comment to let me know what you think about it! Share it to your friends and learn new things together.
Transcript

1April 10, 2023
Mohammad Mostafizur RahmanProcess Support, COP
Introduction to Six Sigma

2April 10, 2023
Six Sigma history.Quality Management Quality Costs TQM.Six Sigma Definition.COPQ Vs Six Sigma.Process and Data analysis.Six Sigma Tools and Techniques.Process Define and Improve.Defects and DPMO.Six Sigma Math.Specification and Control Limits.Sigma Vs DPMO.Six Sigma Belts.
.
Outline

Benefits achieved by Companies
3April 10, 2023

4April 10, 2023
Quality

5April 10, 2023
Dimensions of Quality
Quality of a product or service is measured by eight dimensions

6April 10, 2023
Dimensions of Quality
Performance : Main features like for a car Engine HP, Gear, Speed etc

7April 10, 2023
Dimensions of Quality
Features : Supplementary features like for a car Seat Covers, Color etc

8April 10, 2023
Dimensions of Quality
Reliability : Probability of a product or service malfunction or failing within a specified time period.

9April 10, 2023
Dimensions of Quality
Conformance: Meeting established standards.

10April 10, 2023
Dimensions of Quality
Durable: Measure of product life. Amount of time a product can be used.

11April 10, 2023
Dimensions of Quality
Serviceability: easy of repair, Availability of services, duration and cost of to repair.

12April 10, 2023
Dimensions of Quality
Aesthetics: Objective dimension of quality. How a product will be rated on the ground of personal choice. How it feels, Sounds, Smells etc.

13April 10, 2023
Dimensions of Quality
Perceived: Perceived Quality refers to what consumers perceive to be the quality of a product based on image, advertising, and brand name reputation

14April 10, 2023
Quality Control Vs Quality Assurance

15April 10, 2023
Quality Management System

16April 10, 2023
Quality Management System

17April 10, 2023
Plan Quality
Perform Quality Assurance
Perform Quality Control
Steps in Quality Management
Identify Quality Requirement Define Standards.
Audit Quality Requirement. Ensure Appropriate Quality
Standards are used
Monitoring , recording result of execution.
Recommend necessary change.

18April 10, 2023
Non
conf
orm
ance
cos
t.
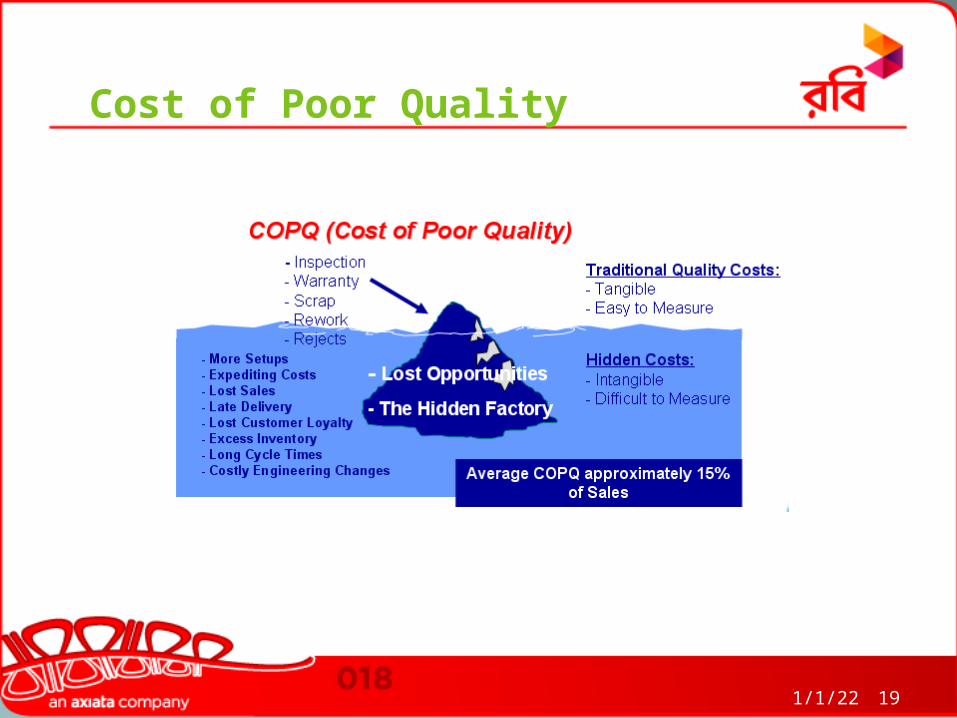
Prevention Cost Training. Doc Processing. Equipment. Time to do right.
Appraisal Costs Testing. Inspection.
Cos
t of
Con
form
ance
Cost of QualityCost Incurred to prevent nonconformance to the quality over the life cycle of a product. Internal Failure
Cost Rework. Scrap.
External Failure Cost Liabilities. Warranty work. Lost of business.
19April 10, 2023
Cost of Poor Quality
20April 10, 2023
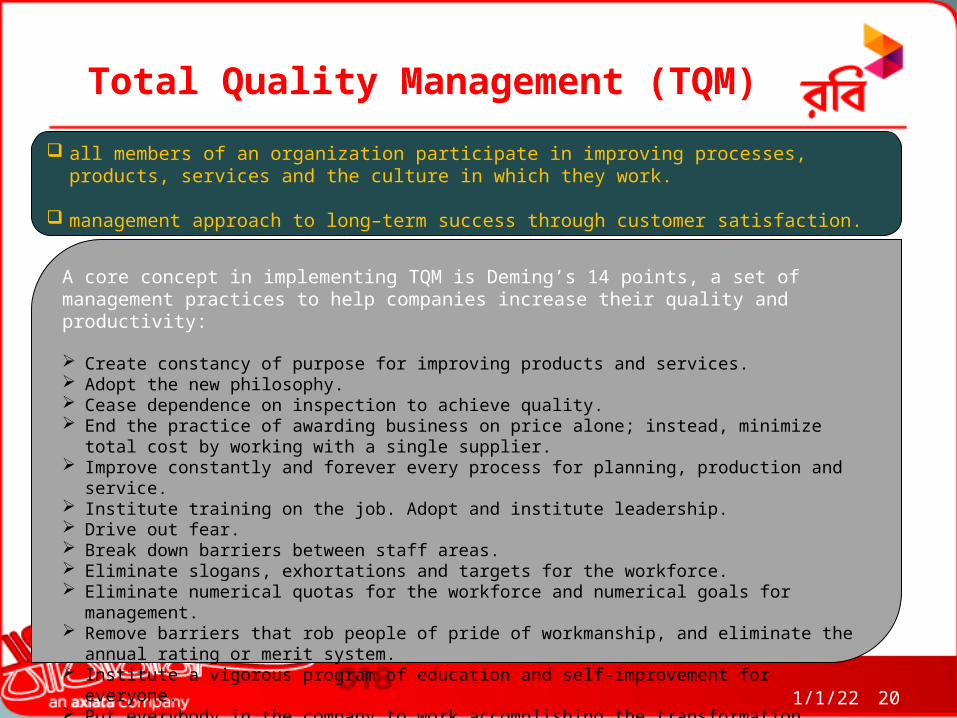
Total Quality Management (TQM)
all members of an organization participate in improving processes, products, services and the culture in which they work.
management approach to long–term success through customer satisfaction.
A core concept in implementing TQM is Deming’s 14 points, a set of management practices to help companies increase their quality and productivity:
Create constancy of purpose for improving products and services. Adopt the new philosophy. Cease dependence on inspection to achieve quality. End the practice of awarding business on price alone; instead, minimize total cost by working with a
single supplier. Improve constantly and forever every process for planning, production and service. Institute training on the job. Adopt and institute leadership. Drive out fear. Break down barriers between staff areas. Eliminate slogans, exhortations and targets for the workforce. Eliminate numerical quotas for the workforce and numerical goals for management. Remove barriers that rob people of pride of workmanship, and eliminate the annual rating or merit
system. Institute a vigorous program of education and self-improvement for everyone. Put everybody in the company to work accomplishing the transformation.

21April 10, 2023
Definition

Definition
22April 10, 2023
Six Sigma is a rigorous and a systematic methodology that utilizes information (management by facts) and statistical analysis to measure and improve a company's operational performance, practices and systems by identifying and preventing 'defects' in manufacturing and service-related processes in order to anticipate and exceed expectations of all stakeholders to accomplish effectiveness.

Definition
23April 10, 2023
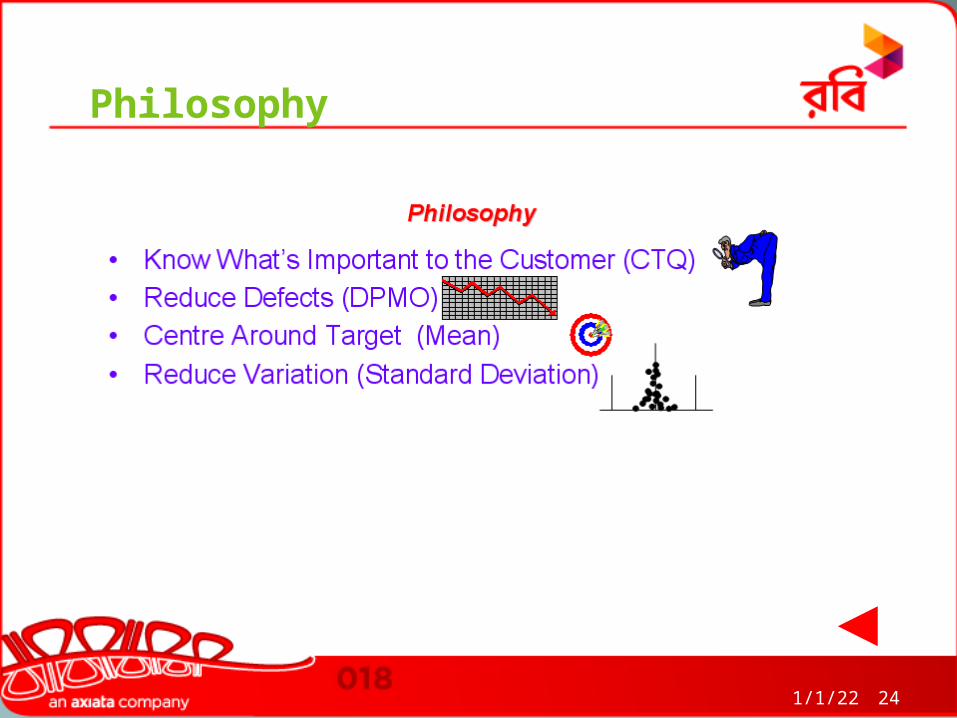
Philosophy
24April 10, 2023
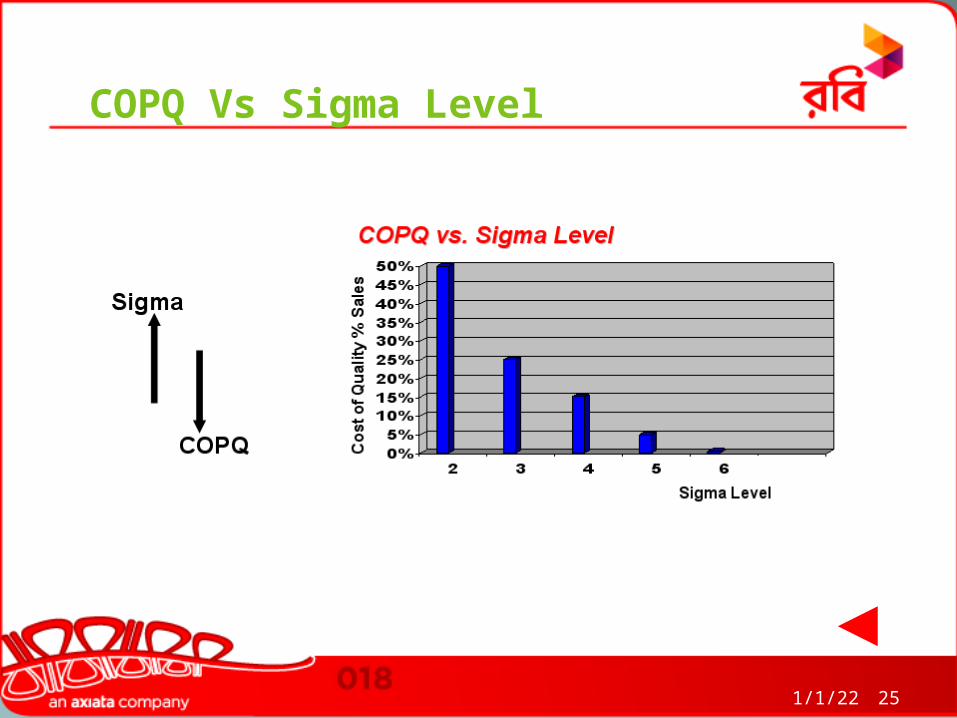
COPQ Vs Sigma Level
25April 10, 2023

Process
26April 10, 2023

Data Analysis
27April 10, 2023
28April 10, 2023
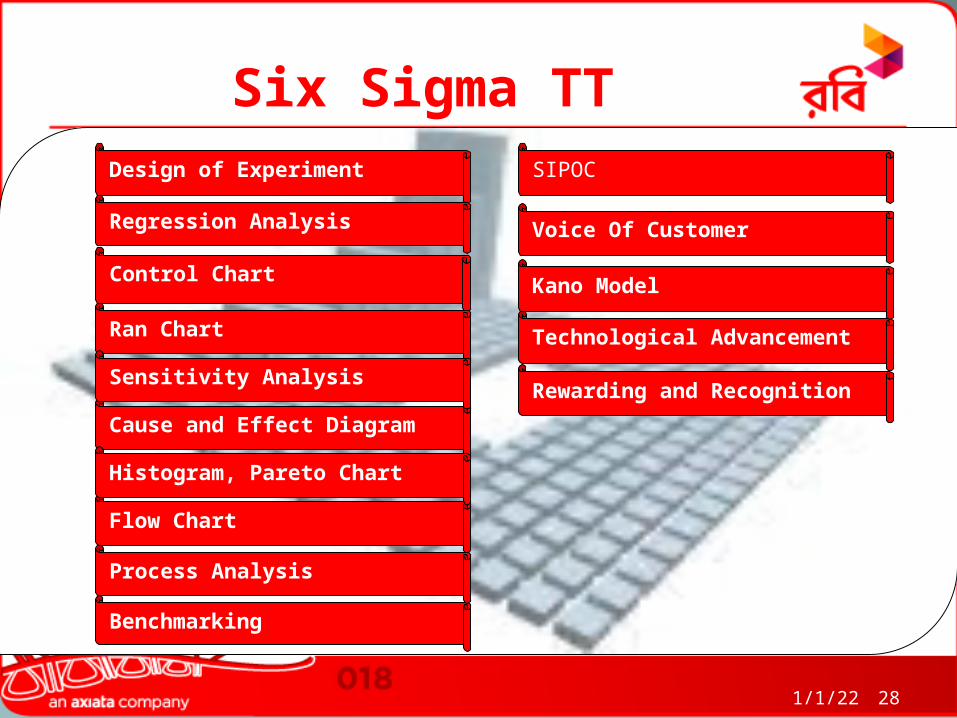
Control Chart
Benchmarking
Design of Experiment
Six Sigma TT
Flow Chart
Process Analysis
Cause and Effect Diagram
Histogram, Pareto Chart
Ran Chart
Regression Analysis
Sensitivity Analysis
Technological Advancement
Rewarding and Recognition
Kano Model
Voice Of Customer
SIPOC

29April 10, 2023
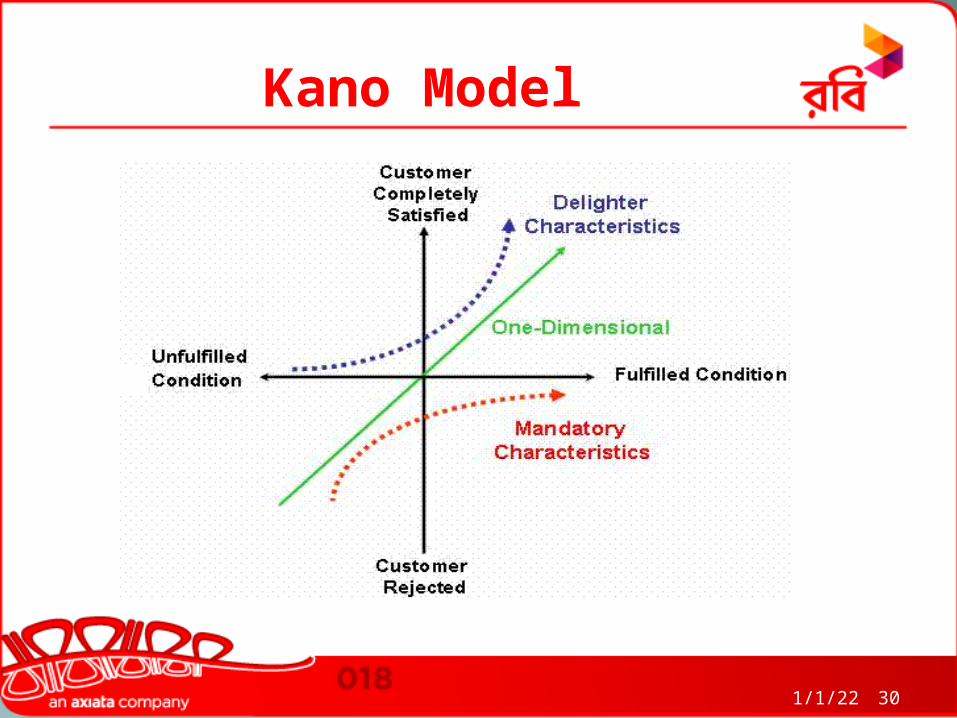
Kano ModelThe Kano Model is used to visually model the customer provided characteristics versus the level of satisifaction each characteristic delivers. It is used after gathering the Voice of the Customer (VOC) phase. It is often used in A DFSS project and works with Quality Functional Deployment (QFD).
Objective: Gather all the customer to deliver the most satisfying product, process, or service.
•Dissatisfying - annoying features - avoided characteristics •Mandatory expectations - basics - must have characteristics •Customer needs - reasonable expectations - performing features •Delighters - surprise - innovators - unexpected features
It is a graphical model that shows the relationship between each characteristic to the level of customer satisfaction.It is used to organize and prioritize activities to design and/or improve.
30April 10, 2023
Kano Model

31April 10, 2023
FMEA
A failure modes and effects analysis (FMEA) is a procedure in product development and operations management for analysis of potential failure modes within a system for classification by the severity and likelihood of the failures. A successful FMEA activity helps a team to identify potential failure modes based on past experience with similar products or processes, enabling the team to design those failures out of the system with the minimum of effort and resource expenditure, thereby reducing development time and costs. It is widely used in manufacturing industries in various phases of the product life cycle and is now increasingly finding use in the service industry. Failure modes are any errors or defects in a process, design, or item, especially those that affect the customer, and can be potential or actual. Effects analysis refers to studying the consequences of those failures.

32April 10, 2023
FMEA
FailureThe loss of an intended function of a device under stated conditions.
Failure modeThe manner by which a failure is observed; it generally describes the way the failure occurs.
Failure effectImmediate consequences of a failure on operation, function or functionality, or status of some item
Indenture levelsAn identifier for item complexity. Complexity increases as levels are closer to one.
Local effectThe failure effect as it applies to the item under analysis.
Next higher level effectThe failure effect as it applies at the next higher indenture level.
End effectThe failure effect at the highest indenture level or total system.
Failure causeDefects in design, process, quality, or part application, which are the underlying cause of the failure or which initiate a process which leads to failure.
SeverityThe consequences of a failure mode. Severity considers the worst potential consequence of a failure, determined by the degree of injury, property damage, or system damage that could ultimately occur.

33April 10, 2023
FMEA
34April 10, 2023
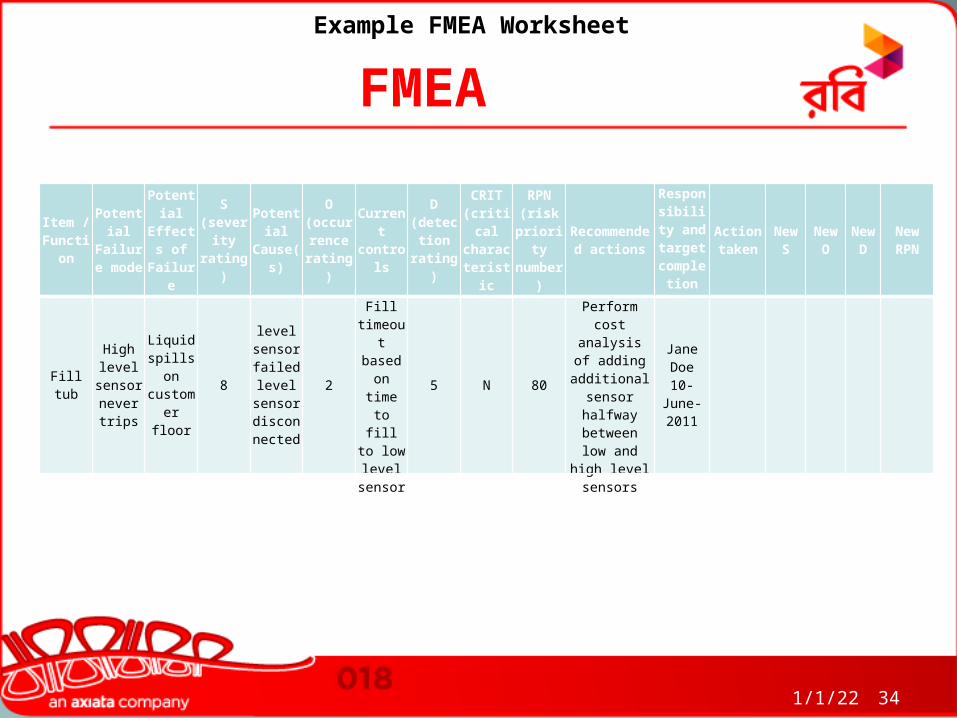
FMEAExample FMEA Worksheet
Item / Functio
n
Potential
Failure mode
Potential
Effects of
Failure
S (severit
y rating)
Potential
Cause(s)
O (occurr
ence rating)
Current control
s
D (detecti
on rating)
CRIT (critical characteristic
RPN (risk
priority number
)
Recommended actions
Responsibility
and target
completion date
Action taken
New S
New O
New D
New RPN
Fill tub
High level
sensor never trips
Liquid spills on customer floor
8
level sensor failedlevel
sensor disconnected
2
Fill timeout based on time to fill to
low level
sensor
5 N 80
Perform cost analysis of
adding additional
sensor halfway
between low and high level
sensors
Jane Doe
10-June-2011
35April 10, 2023
FMEAExample FMEA Worksheet
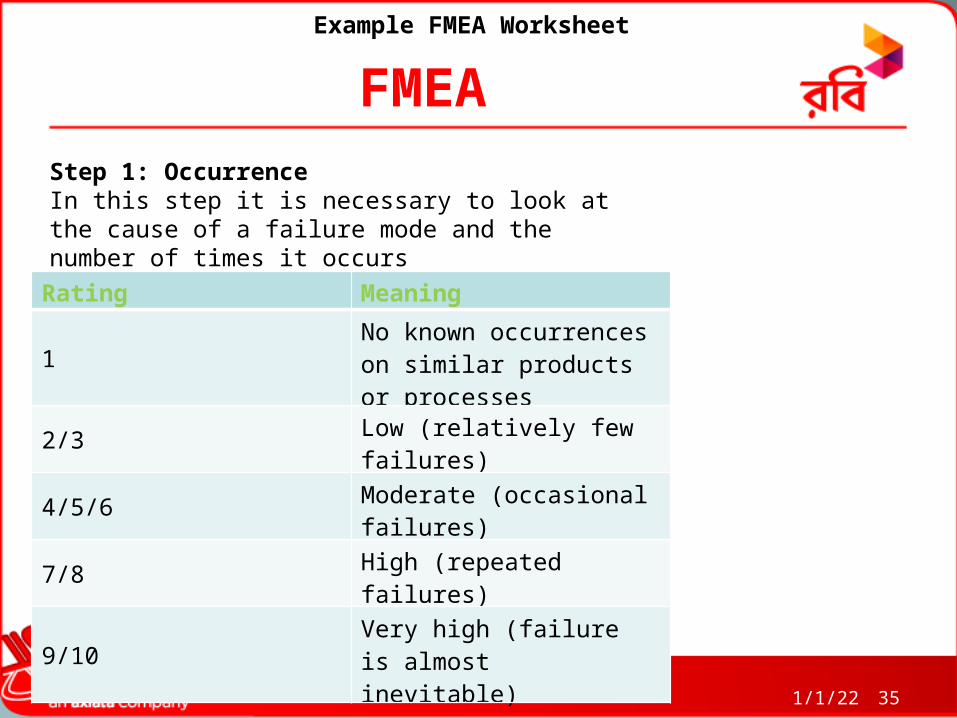
Step 1: OccurrenceIn this step it is necessary to look at the cause of a failure mode and the number of times it occurs
Rating Meaning
1No known occurrences on similar products or processes
2/3 Low (relatively few failures)
4/5/6Moderate (occasional failures)
7/8 High (repeated failures)
9/10Very high (failure is almost inevitable)

36April 10, 2023
FMEAExample FMEA Worksheet
Rating Meaning1 No effect
2 Very minor (only noticed by discriminating customers)
3 Minor (affects very little of the system, noticed by average customer)
4/5/6 Moderate (most customers are annoyed)
7/8 High (causes a loss of primary function; customers are dissatisfied)
9/10Very high and hazardous (product becomes inoperative; customers angered; the failure may result unsafe operation and possible injury)
Step 2: Severityfailure modes are: Electrical short-circuiting, corrosion or deformation. A failure mode in one component can lead to a failure mode in another component, therefore each failure mode should be listed in technical terms and for function. Hereafter the ultimate effect of each failure mode needs to be considered. A failure effect is defined as the result of a failure mode on the function of the system as perceived by the user.

37April 10, 2023
FMEAExample FMEA Worksheet
Rating Meaning
1 Certain - fault will be caught on test
2 Almost Certain
3 High
4/5/6 Moderate
7/8 Low
9/10 Fault will be passed to customer undetected
Step 3: Detection
The assigned detection number measures the risk that the failure will escape detection. A high detection number indicates that the chances are high that the failure will escape detection, or in other words, that the chances of detection are low.

38April 10, 2023
FMEAExample FMEA Worksheet
Risk priority number (RPN)
After ranking the severity, occurrence and detectability the RPN can be easily calculated by multiplying these three numbers: RPN = S × O × D

Process Definition and Improvement
39April 10, 2023

Process Definition and Improvement
40April 10, 2023
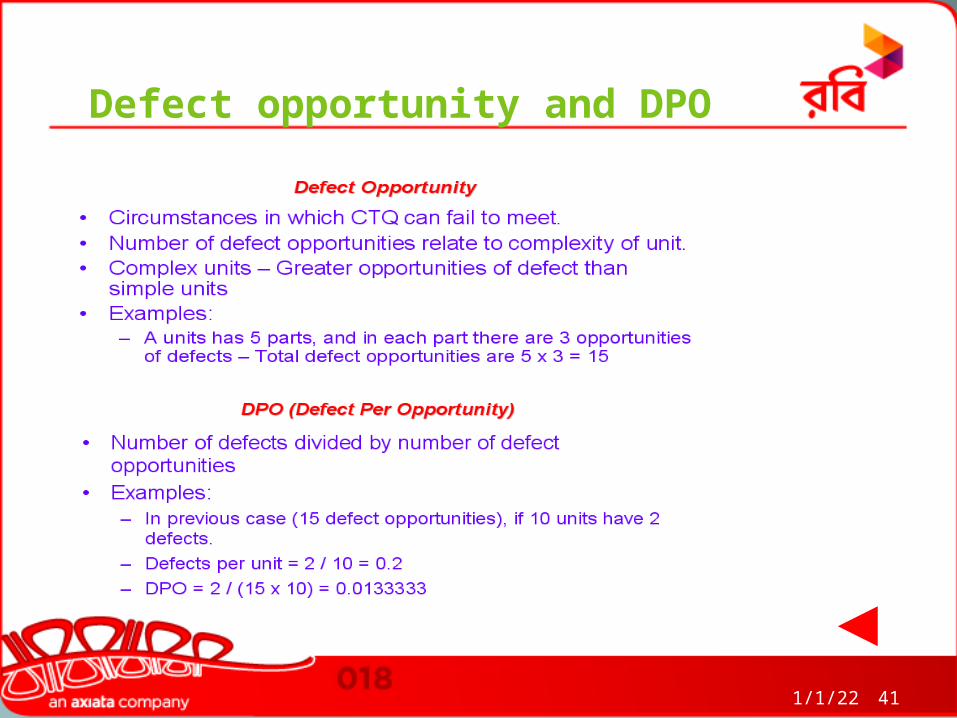
Defect opportunity and DPO
41April 10, 2023

Defect opportunity and DPO
42April 10, 2023
43April 10, 2023
Six Sigma Math
Range
MedianStandard Deviation
Range
Mean
DeviationMode
Confidence Interval
Variance
Median
Null Hypothesis

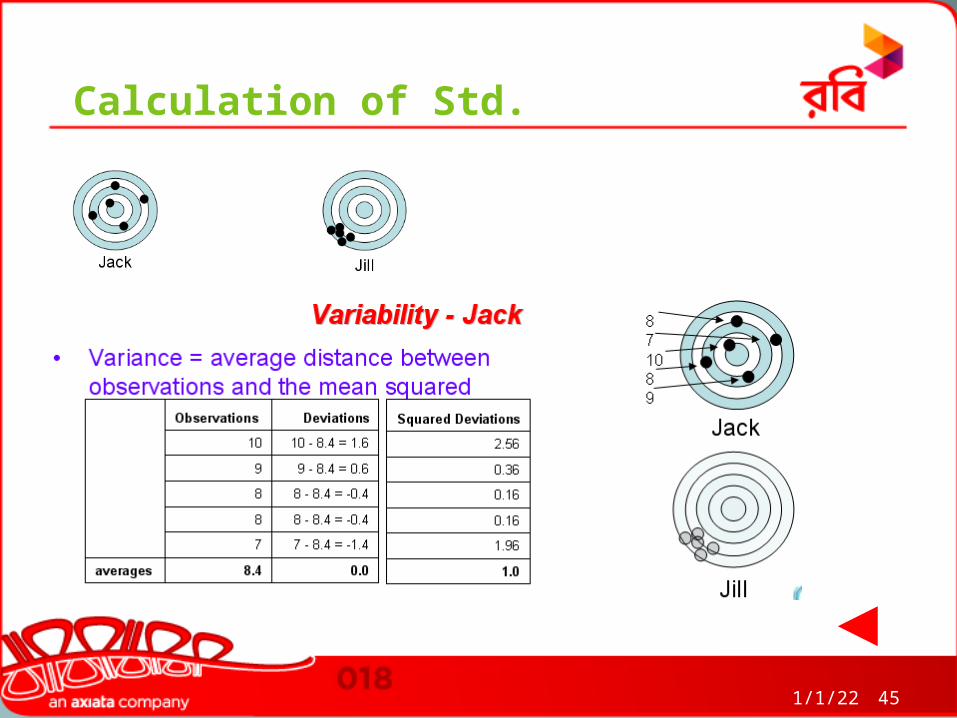
Calculation of Std.
44April 10, 2023
45April 10, 2023
Calculation of Std.

46April 10, 2023
Calculation of Std.

47April 10, 2023
Calculation of Std.

Calculation of Std.
48April 10, 2023

Probability Distribution
49April 10, 2023

Limits
50April 10, 2023
Under Normal Distribution 99.7 % outcome will fall under 3 Std
Deviation

Limits
51April 10, 2023

Six Sigma Process
52April 10, 2023

Process Shift
53April 10, 2023

Sigma Vs DPMO
54April 10, 2023

Six Sigma Approach
55April 10, 2023

Implement Six sigma
56April 10, 2023
Process Management helps us maintain good results as we perform our Mission.
Strategic planning helps us “focus” on key projects to reach our Vision.
Process Improvement using the DMAIC process helps us fix work problems and improve our Performance.
To be successful as an organization, we must learn how to effectively apply ALL three (3) areas.
Strategic Planning
Process Improvement
ProcessManagement
Six Sigma

Application Area
57April 10, 2023
Six Sigma Methods Production
DesignService
Purchase
HRM
Administration
QualityDepart.
Management
M & S
IT

Trainings
58April 10, 2023

59April 10, 2023
Q&A

Related Documents