Signal Processing Toolbox Perform signal processing, analysis, and algorithm development Signal Processing Toolbox™ provides industry-standard algorithms for analog and digital signal processing (DSP). You can use the toolbox to visualize signals in time and frequency domains, compute FFTs for spectral analysis, design FIR and IIR filters, and implement convolution, modulation, resampling, and other signal processing techniques. Algorithms in the toolbox can be used as a basis for developing custom algorithms for audio and speech processing, instrumentation, and baseband wireless communications. Signal Processing Toolbox is included in MATLAB and Simulink Student Version. Key Features ▪ Signal and linear system models ▪ Signal transforms, including fast Fourier transform (FFT), discrete Fourier transform (DFT), and short-time Fourier transform (STFT) ▪ Waveform and pulse generation functions, including sine, square, sawtooth, and Gaussian pulse ▪ Transition metrics, pulse metrics, and state-level estimation functions for bilevel waveforms ▪ Statistical signal measurements and data windowing functions ▪ Power spectral density estimation algorithms, including periodogram, Welch, and Yule-Walker ▪ Digital FIR and IIR filter design, analysis, and implementation methods ▪ Analog filter design methods, including Butterworth, Chebyshev, and Bessel ▪ Linear prediction and parametric time-series modeling 1

Welcome message from author
This document is posted to help you gain knowledge. Please leave a comment to let me know what you think about it! Share it to your friends and learn new things together.
Transcript

Signal Processing ToolboxPerform signal processing, analysis, and algorithm development
Signal Processing Toolbox™ provides industry-standard algorithms for analog and digital signal processing(DSP). You can use the toolbox to visualize signals in time and frequency domains, compute FFTs for spectralanalysis, design FIR and IIR filters, and implement convolution, modulation, resampling, and other signalprocessing techniques. Algorithms in the toolbox can be used as a basis for developing custom algorithms foraudio and speech processing, instrumentation, and baseband wireless communications.
Signal Processing Toolbox is included in MATLAB and Simulink Student Version.
Key Features▪ Signal and linear system models
▪ Signal transforms, including fast Fourier transform (FFT), discrete Fourier transform (DFT), and short-timeFourier transform (STFT)
▪ Waveform and pulse generation functions, including sine, square, sawtooth, and Gaussian pulse
▪ Transition metrics, pulse metrics, and state-level estimation functions for bilevel waveforms
▪ Statistical signal measurements and data windowing functions
▪ Power spectral density estimation algorithms, including periodogram, Welch, and Yule-Walker
▪ Digital FIR and IIR filter design, analysis, and implementation methods
▪ Analog filter design methods, including Butterworth, Chebyshev, and Bessel
▪ Linear prediction and parametric time-series modeling
1

Analysis and visualization tools for verifying numerical accuracy and performance. Example plots from Signal ProcessingToolbox include (clockwise from top left): A periodogram of a numerically controlled oscillator; a reconstructed ECG signalusing the Walsh-Hadamard transform shown with the original ECG signal; the magnitude response of a low-pass FIR filter, witha specification mask overlay; and the impulse response of a Gaussian pulse-shaping filter for various bandwidths.
Generating, Visualizing, and Analyzing Signals
Signal Processing Toolbox enables you to generate and analyze discrete signals in MATLAB®. You can:
▪ Create vectors of discrete signal values
▪ Generate standard waveforms using built-in toolbox functions
▪ Import signals from files
▪ Acquire signals from instruments, multimedia devices, and other hardware
Generating Waveforms
You can generate continuous and discrete signals using signal generation functions in the toolbox. Support forcommonly used waveforms includes:
▪ Periodic waveforms, such as sine, square, sawtooth, and rectangular signals
▪ Aperiodic waveforms, such as chirp and Gaussian pulse signals
▪ Common sequences, such as unit impulse, unit step, and unit ramp
2

Visualizing and Analyzing Waveforms
You can visualize signals in the time domain by plotting them against a time vector that you create in MATLAB.You can also use stem plots, staircase plots, and other MATLAB plots to obtain different views of signalcharacteristics. You can transform time-domain signals to the frequency domain using functions that compute theDFT and STFT.
Visualization of periodic, aperiodic, and swept-frequency waveforms.
Interactive Signal Processing
Signal Processing Tool (SPTool) is an interactive tool that enables basic signal analysis tasks. From the SPToolinterface, you can launch other tools, including Signal Browser, Filter Design and Analysis Tool (FDATool), andSpectrum Viewer. Using these tools, you can:
▪ Import and visualize single-channel or multichannel signals in the time domain
▪ Make signal measurements, such as slope and peak value
▪ Play audio signals on a PC sound card
▪ Design or import FIR and IIR filters of various lengths and response types
▪ View characteristics of a designed or imported filter, including magnitude, phase, impulse, and step responses
▪ Apply the filter to a selected signal
▪ Graphically analyze signals in the frequency domain using a variety of spectral estimation methods
3

Visualizing a speech signal in the time domain using the Signal Browser interface in the Signal Processing Tool (SPTool).
Performing Spectral Analysis in MATLAB
Spectral analysis is key to understanding signal characteristics, and it can be applied across all signal types,including radar signals, audio signals, seismic data, financial stock data, and biomedical signals. SignalProcessing Toolbox provides MATLAB functions for estimating the power spectral density, mean-squarespectrum, pseudo spectrum, and average power of signals.
Algorithms for Spectral Analysis in MATLAB
Spectral estimation algorithms in the toolbox include:
▪ FFT-based methods, such as periodogram, Welch, and multitaper
▪ Parametric methods, such as Burg and Yule-Walker
▪ Eigen-based methods, such as eigenvector and multiple signal classification (MUSIC)
Visualization in the Frequency Domain
Spectral analysis functions in the toolbox enable you to compute and view a signal’s:
▪ Time-frequency representation of a signal using the spectrogram function
▪ Power spectral density
▪ Mean-square spectrum
4
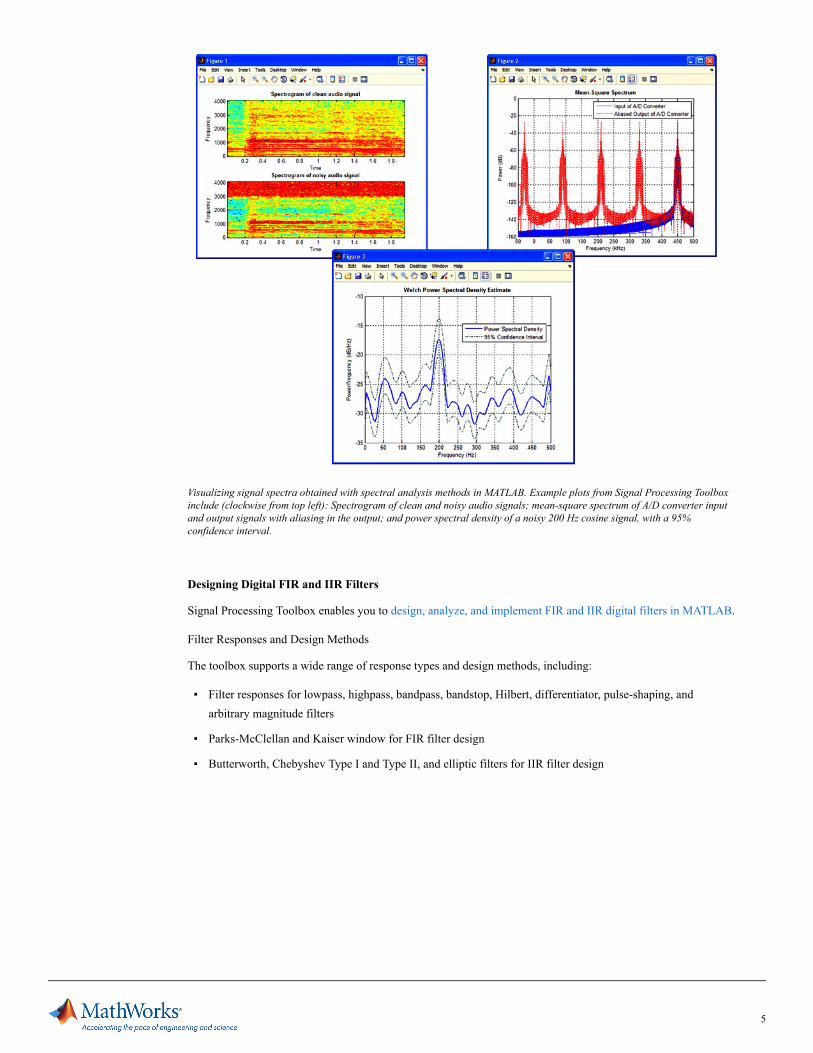
Visualizing signal spectra obtained with spectral analysis methods in MATLAB. Example plots from Signal Processing Toolboxinclude (clockwise from top left): Spectrogram of clean and noisy audio signals; mean-square spectrum of A/D converter inputand output signals with aliasing in the output; and power spectral density of a noisy 200 Hz cosine signal, with a 95%confidence interval.
Designing Digital FIR and IIR Filters
Signal Processing Toolbox enables you to design, analyze, and implement FIR and IIR digital filters in MATLAB.
Filter Responses and Design Methods
The toolbox supports a wide range of response types and design methods, including:
▪ Filter responses for lowpass, highpass, bandpass, bandstop, Hilbert, differentiator, pulse-shaping, andarbitrary magnitude filters
▪ Parks-McClellan and Kaiser window for FIR filter design
▪ Butterworth, Chebyshev Type I and Type II, and elliptic filters for IIR filter design
5

MATLAB code and corresponding plots for FIR (top right) and IIR (bottom right) filter design using algorithms in SignalProcessing Toolbox.
Analyzing Filters
You can analyze your filter design by simultaneously viewing multiple characteristics in the Filter VisualizationTool (FVTool):
▪ Magnitude response, phase response, and group delay in the frequency domain
▪ Impulse response and step response in the time domain
▪ Pole-zero information
FVTool also helps you evaluate filter performance by providing information about filter order, stability, and phaselinearity. Once you design your filter, you can implement it using FIR and IIR filter structures.
6

Analysis of a lowpass FIR filter designed using a Kaiser window method. Example plots from Signal Processing Toolbox include(clockwise from top left): Magnitude and phase responses, impulse response, pole-zero plot, and filter order and stabilityinformation.
Interactive Filter Design and Analysis
Signal Processing Toolbox provides FDATool, FVTool, and Filterbuilder for interactive filter design and analysis.Together, these tools enable you to:
▪ Explore FIR and IIR design methods for a given filter specification
▪ Analyze filters by viewing filter characteristics, including magnitude response, phase response, group delay,pole-zero plot, impulse response, and step response
▪ Obtain filter information, such as filter order, stability, and phase linearity
▪ Import previously designed filters and filter coefficients stored in the MATLAB workspace and export filtercoefficients
7

Filter Design and Analysis Tool (FDATool) showing magnitude response, filter order, and stability information for a lowpassFIR filter.
Designing Analog Filters
Signal Processing Toolbox provides functions for analog filter design and analysis. Supported analog filter typesinclude Butterworth, Chebyshev, Bessel, and elliptic. The toolbox also contains discretization functions foranalog-to-digital filter conversion.
Developing Signal Processing Algorithms
Signal Processing Toolbox offers techniques for developing signal processing algorithms in these categories:
▪ Signal transforms, including discrete cosine transform (DCT), Hilbert, Goertzel, and Walsh-Hadamard
▪ Multirate operations for decimation, interpolation, and resampling
▪ Statistical signal processing functions to compute autocorrelation, covariance, cross-correlation, andcross-covariance of signals
▪ Linear prediction and parametric modeling functions
You can use these techniques to explore various algorithm approaches and perform a variety of signal processingtasks. You can:
▪ Interpolate, decimate, or resample a signal
▪ Modulate and demodulate a signal
▪ Smooth a signal using windowing functions
▪ Encode a signal for a compression algorithm
8

Common signal processing techniques implemented using toolbox functions. Examples include (clockwise from top left):Resampling an audio signal from a DAT sample rate of 48 kHz to a CD sample rate of 44.1 kHz, interpolating a signal by afactor of 4, modulating message signals using double sideband modulation, and encoding floating-point scalars in the range[–1, 1] to uint8 integers.
Creating and Applying Window Functions
Data window functions apply to both spectral analysis and filter design. A window function suppresses the effectsof the Gibbs phenomenon that result from truncating an infinite series. The toolbox contains functions for creatingand applying several window functions including rectangular, Hamming, Hann, Kaiser, and Gaussian.
The interactive Window Design and Analysis Tool (WinTool) lets you design and analyze spectral windows. Youcan:
▪ Display time-domain and frequency-domain representations of selected windows
▪ Export window vectors or window objects to the MATLAB workspace, a MAT-file, or a text file
▪ View typical window measurements, such as leakage factor, relative sidelobe attenuation, and main lobewidth
▪ Visualize, annotate, and print time-domain and frequency-domain plots
9

Product Details, Examples, and System Requirementswww.mathworks.com/products/signal
Trial Softwarewww.mathworks.com/trialrequest
Saleswww.mathworks.com/contactsales
Technical Supportwww.mathworks.com/support
Window Design and Analysis Tool (WinTool) with time-domain and frequency-domain plots of Hamming, Hann, and Kaiserwindows.
Resources
Online User Communitywww.mathworks.com/matlabcentral
Training Serviceswww.mathworks.com/training
Third-Party Products and Serviceswww.mathworks.com/connections
Worldwide Contactswww.mathworks.com/contact
© 2012 The MathWorks, Inc. MATLAB and Simulink are registered trademarks of The MathWorks, Inc. See www.mathworks.com/trademarks for a list ofadditional trademarks. Other product or brand names may be trademarks or registered trademarks of their respective holders. 10
Related Documents