Hideo Shiogama 1 , Masahiro Watanabe 2 , Yukiko Imada 3 , Masato Mori 2 , Youichi Kamae 1 , Masayoshi Ishii 3 , and Masahide Kimoto 2 Attribution of the June-July 2013 heat wave in the southwestern United States Shiogama et al. (2014, SOLA) 1 Center for Global Environmental Research, National Institute for Environmental Studies, Tsukuba, Japan 2 Atmosphere and Ocean Research Institute, the University of Tokyo, Kashiwa, Japan 3 Meteorological Research Institute, Tsukuba, Japan

Welcome message from author
This document is posted to help you gain knowledge. Please leave a comment to let me know what you think about it! Share it to your friends and learn new things together.
Transcript
Hideo Shiogama1, Masahiro Watanabe2, Yukiko Imada3, Masato Mori2,
Youichi Kamae1, Masayoshi Ishii3, and Masahide Kimoto2
Attribution of the June-July 2013
heat wave in the southwestern United States
Shiogama et al. (2014, SOLA)
1Center for Global Environmental Research, National Institute for Environmental Studies, Tsukuba, Japan 2Atmosphere and Ocean Research Institute, the University of Tokyo, Kashiwa, Japan
3Meteorological Research Institute, Tsukuba, Japan
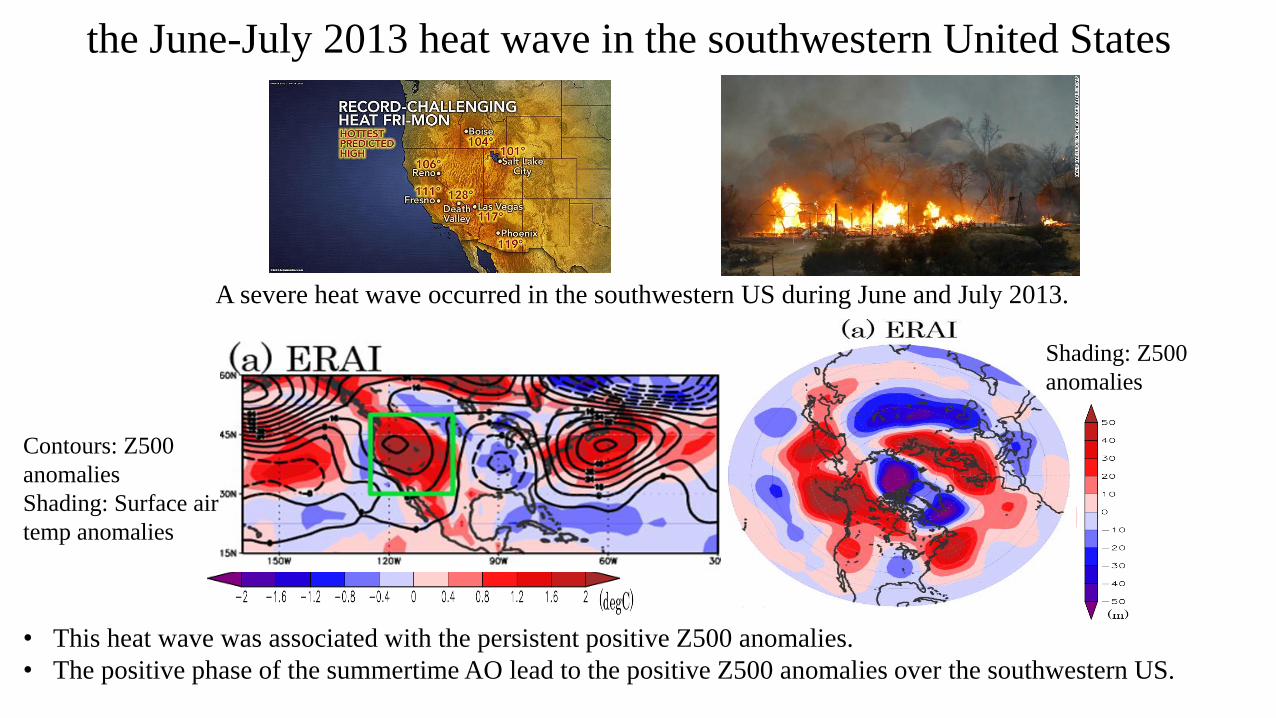
the June-July 2013 heat wave in the southwestern United States
A severe heat wave occurred in the southwestern US during June and July 2013.
• This heat wave was associated with the persistent positive Z500 anomalies.
• The positive phase of the summertime AO lead to the positive Z500 anomalies over the southwestern US.
Contours: Z500
anomalies
Shading: Surface air
temp anomalies
Shading: Z500
anomalies
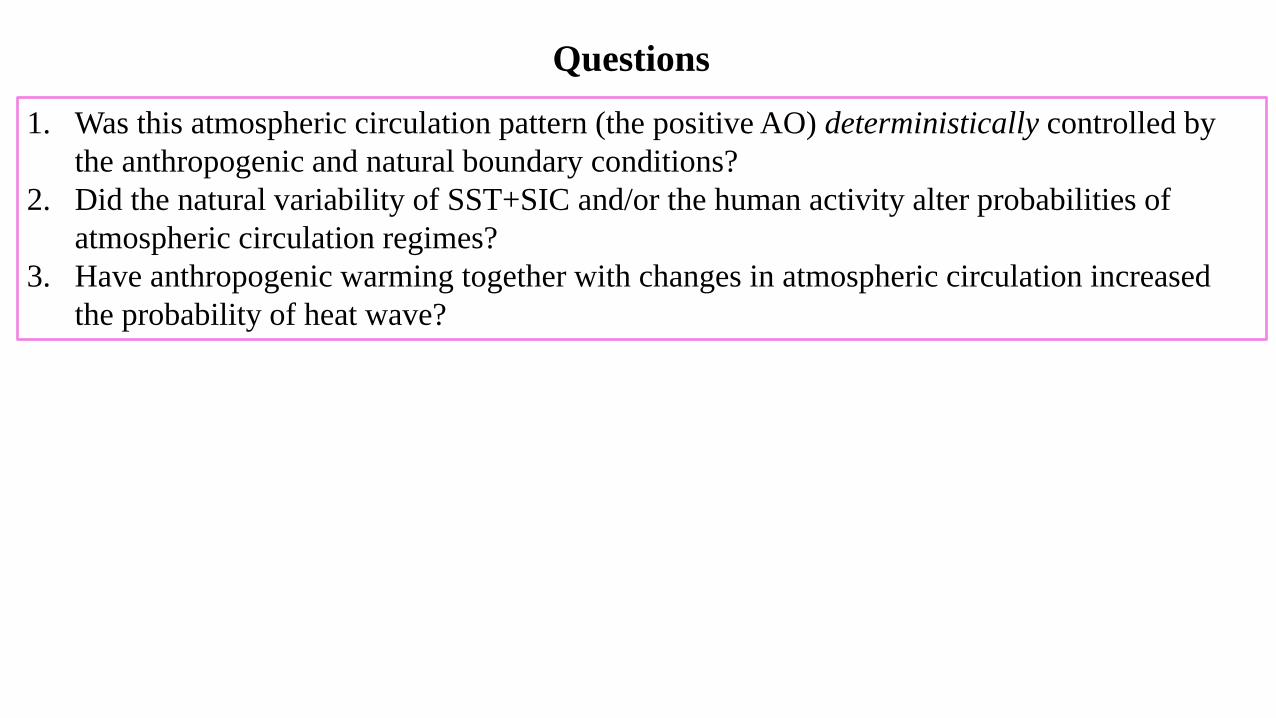
Questions
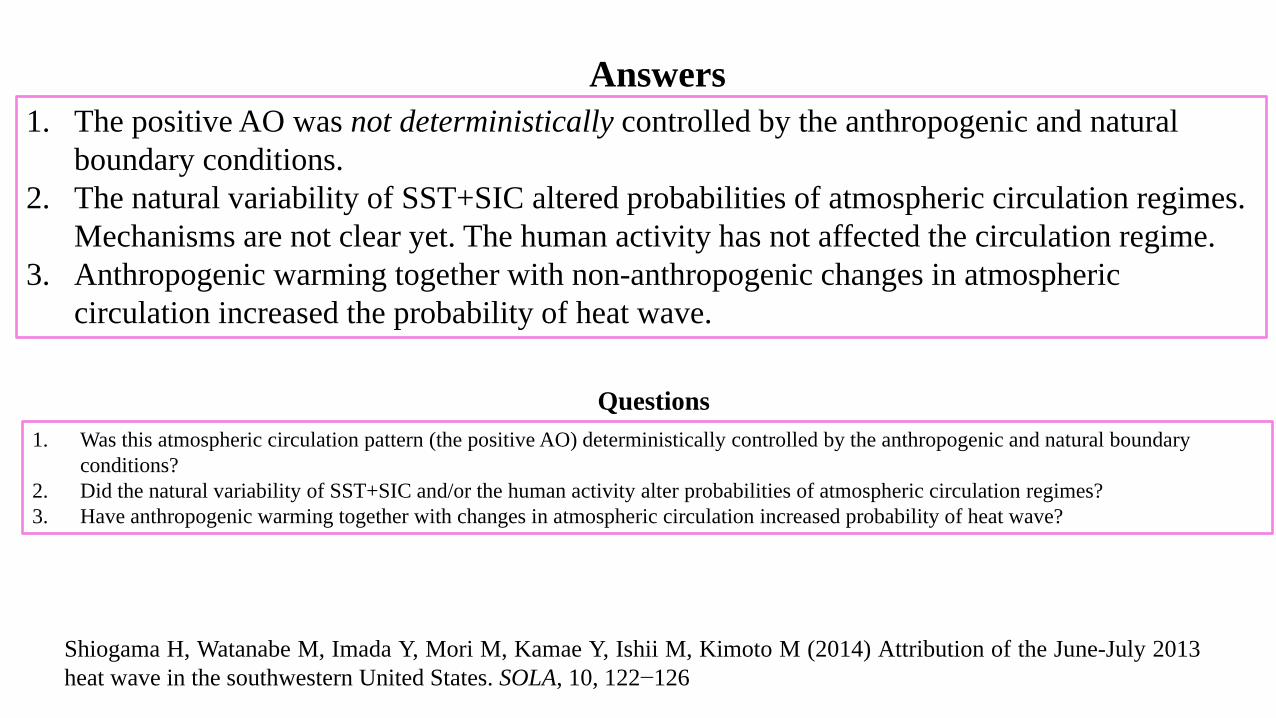
1. Was this atmospheric circulation pattern (the positive AO) deterministically controlled by
the anthropogenic and natural boundary conditions?
2. Did the natural variability of SST+SIC and/or the human activity alter probabilities of
atmospheric circulation regimes?
3. Have anthropogenic warming together with changes in atmospheric circulation increased
the probability of heat wave?
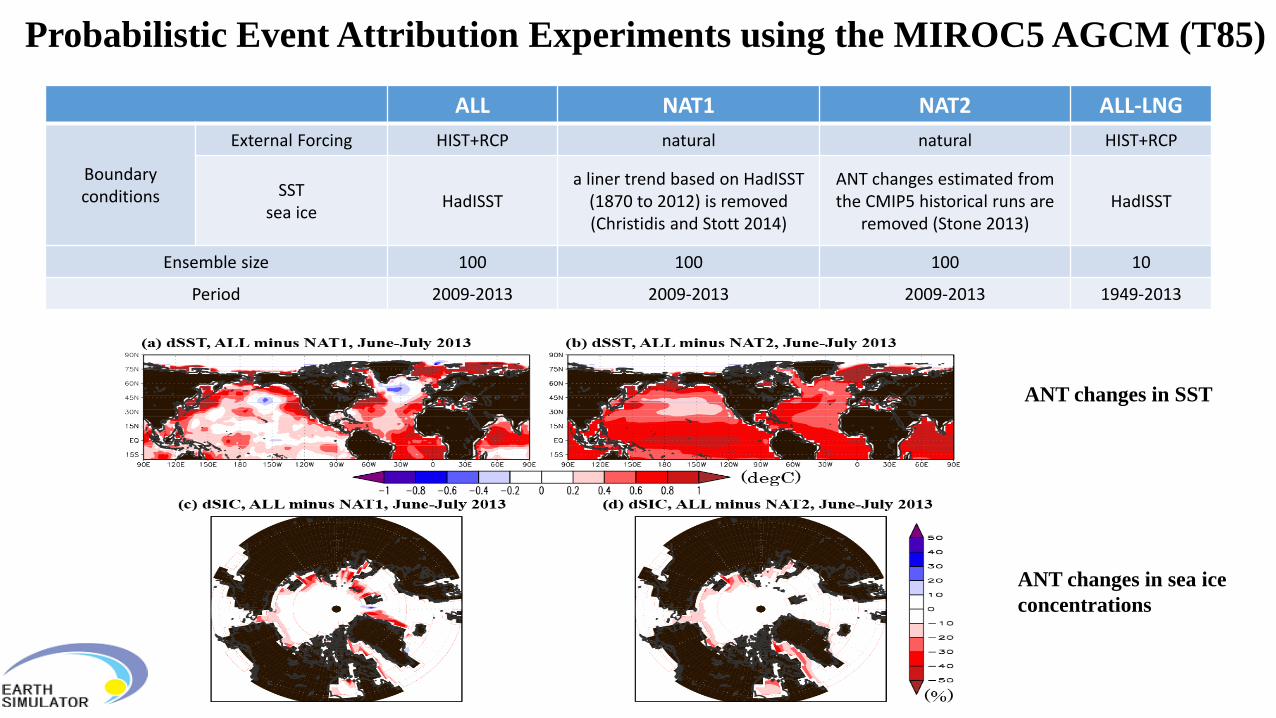
Probabilistic Event Attribution Experiments using the MIROC5 AGCM (T85)
ALL NAT1 NAT2 ALL-LNG
Boundary conditions
External Forcing HIST+RCP natural natural HIST+RCP
SST sea ice
HadISST a liner trend based on HadISST
(1870 to 2012) is removed (Christidis and Stott 2014)
ANT changes estimated from the CMIP5 historical runs are
removed (Stone 2013) HadISST
Ensemble size 100 100 100 10
Period 2009-2013 2009-2013 2009-2013 1949-2013
ANT changes in SST
ANT changes in sea ice
concentrations
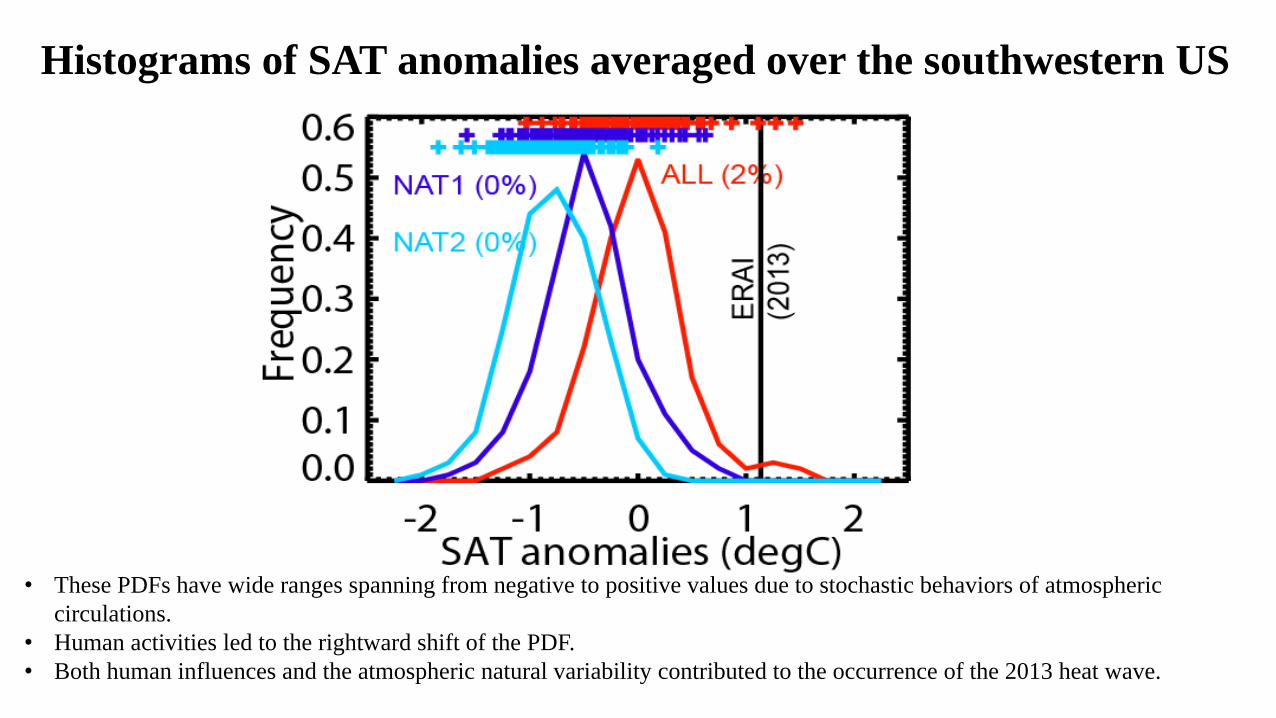
Histograms of SAT anomalies averaged over the southwestern US
• These PDFs have wide ranges spanning from negative to positive values due to stochastic behaviors of atmospheric
circulations.
• Human activities led to the rightward shift of the PDF.
• Both human influences and the atmospheric natural variability contributed to the occurrence of the 2013 heat wave.
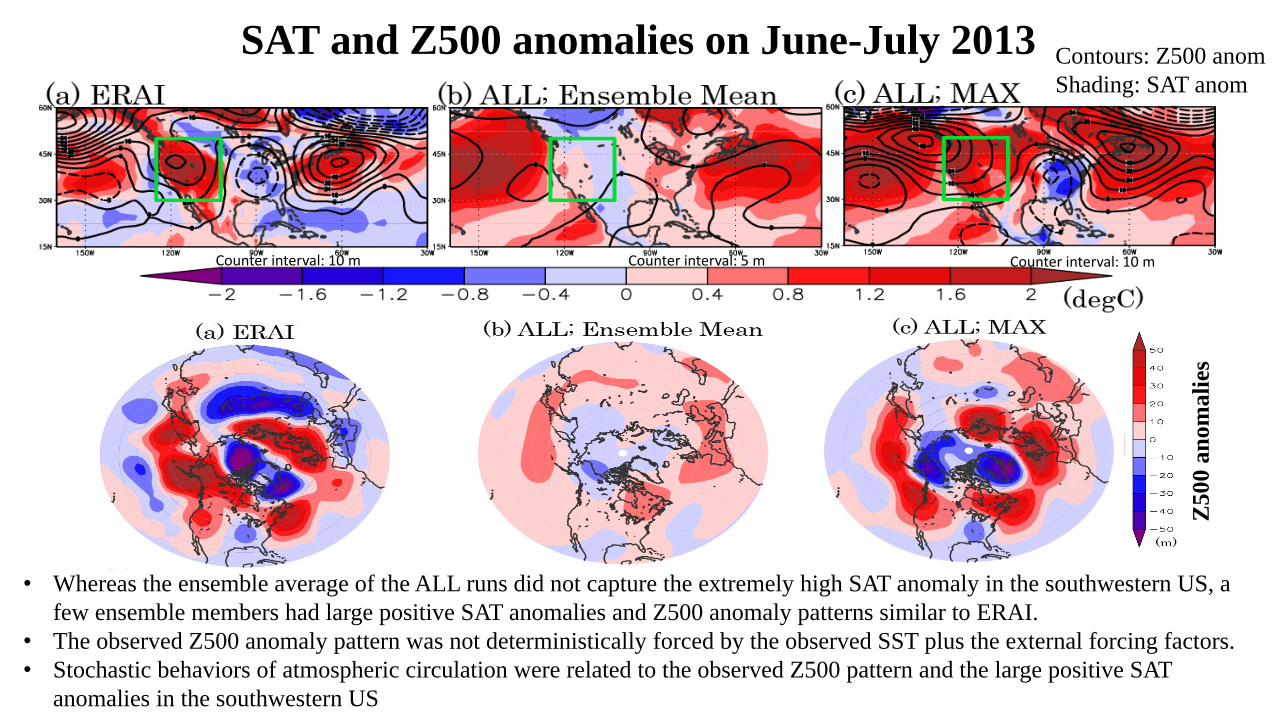
SAT and Z500 anomalies on June-July 2013
Z500 a
nom
ali
es
• Whereas the ensemble average of the ALL runs did not capture the extremely high SAT anomaly in the southwestern US, a
few ensemble members had large positive SAT anomalies and Z500 anomaly patterns similar to ERAI.
• The observed Z500 anomaly pattern was not deterministically forced by the observed SST plus the external forcing factors.
• Stochastic behaviors of atmospheric circulation were related to the observed Z500 pattern and the large positive SAT
anomalies in the southwestern US
Counter interval: 10 m Counter interval: 10 m Counter interval: 5 m
Contours: Z500 anom
Shading: SAT anom
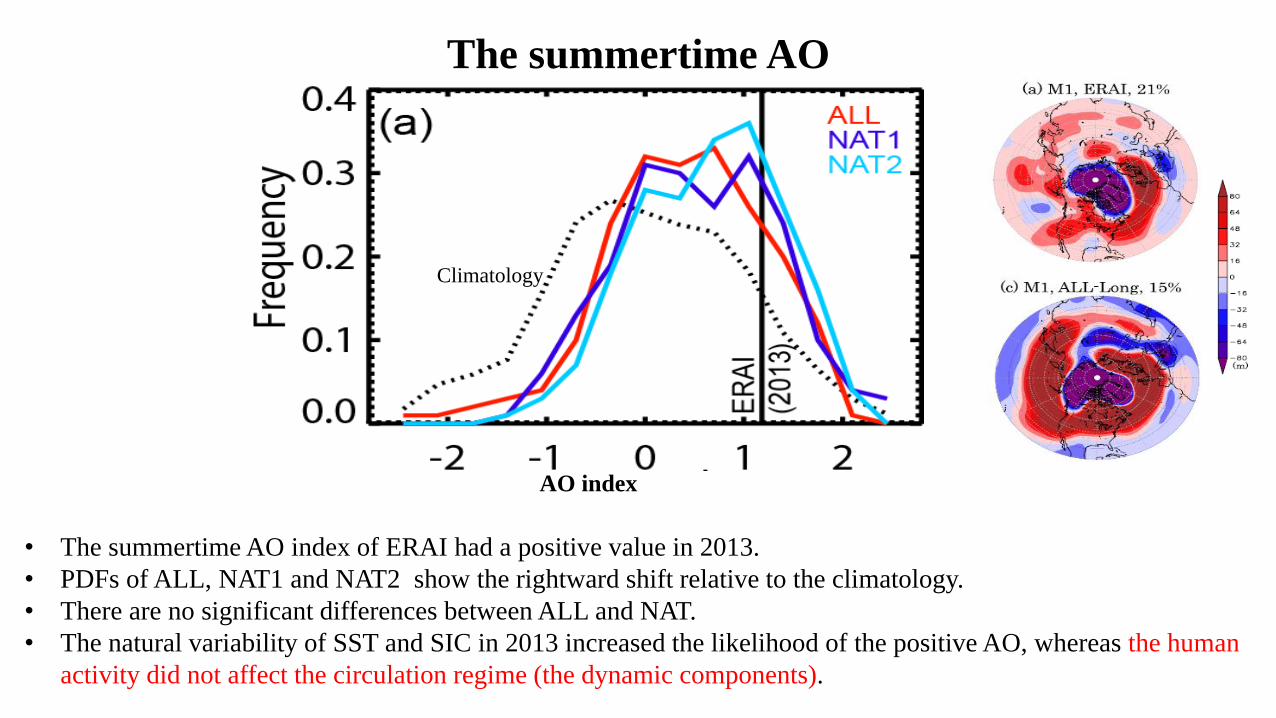
The summertime AO
• The summertime AO index of ERAI had a positive value in 2013.
• PDFs of ALL, NAT1 and NAT2 show the rightward shift relative to the climatology.
• There are no significant differences between ALL and NAT.
• The natural variability of SST and SIC in 2013 increased the likelihood of the positive AO, whereas the human
activity did not affect the circulation regime (the dynamic components).
AO index
Climatology
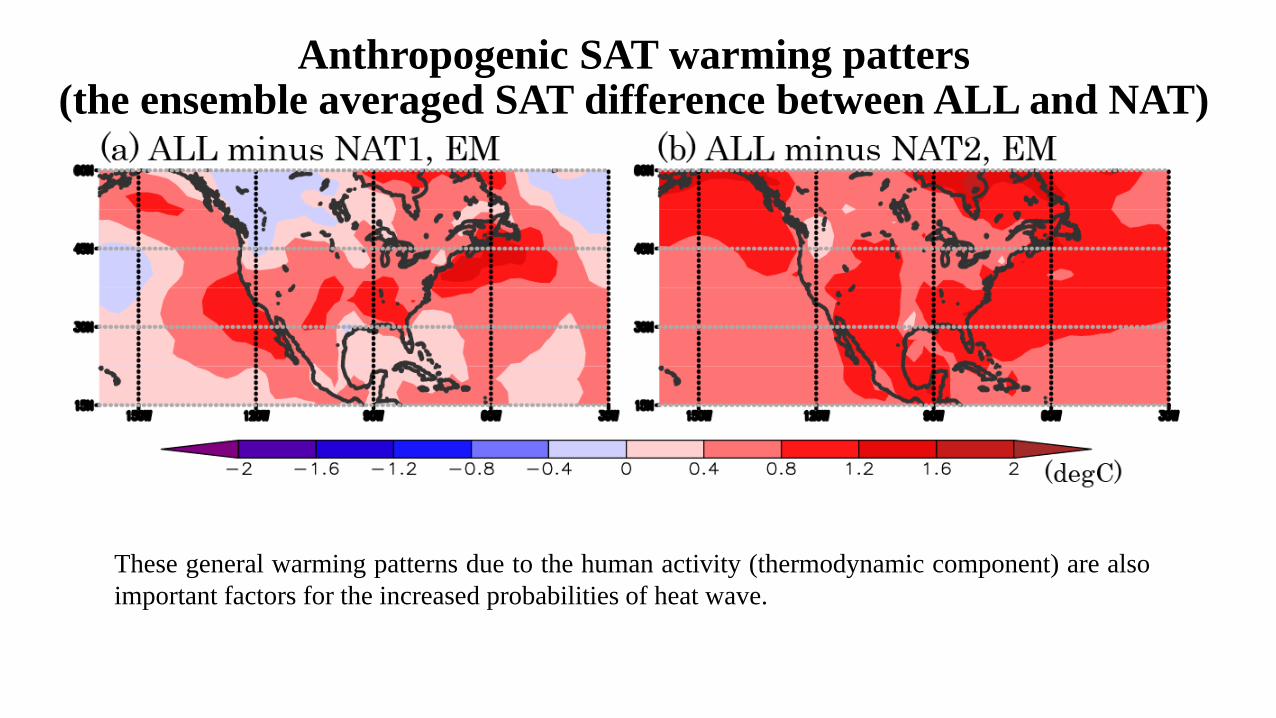
Anthropogenic SAT warming patters (the ensemble averaged SAT difference between ALL and NAT)
These general warming patterns due to the human activity (thermodynamic component) are also
important factors for the increased probabilities of heat wave.
Answers
1. The positive AO was not deterministically controlled by the anthropogenic and natural
boundary conditions.
2. The natural variability of SST+SIC altered probabilities of atmospheric circulation regimes.
Mechanisms are not clear yet. The human activity has not affected the circulation regime.
3. Anthropogenic warming together with non-anthropogenic changes in atmospheric
circulation increased the probability of heat wave.
Shiogama H, Watanabe M, Imada Y, Mori M, Kamae Y, Ishii M, Kimoto M (2014) Attribution of the June-July 2013
heat wave in the southwestern United States. SOLA, 10, 122−126
1. Was this atmospheric circulation pattern (the positive AO) deterministically controlled by the anthropogenic and natural boundary
conditions?
2. Did the natural variability of SST+SIC and/or the human activity alter probabilities of atmospheric circulation regimes?
3. Have anthropogenic warming together with changes in atmospheric circulation increased probability of heat wave?
Questions

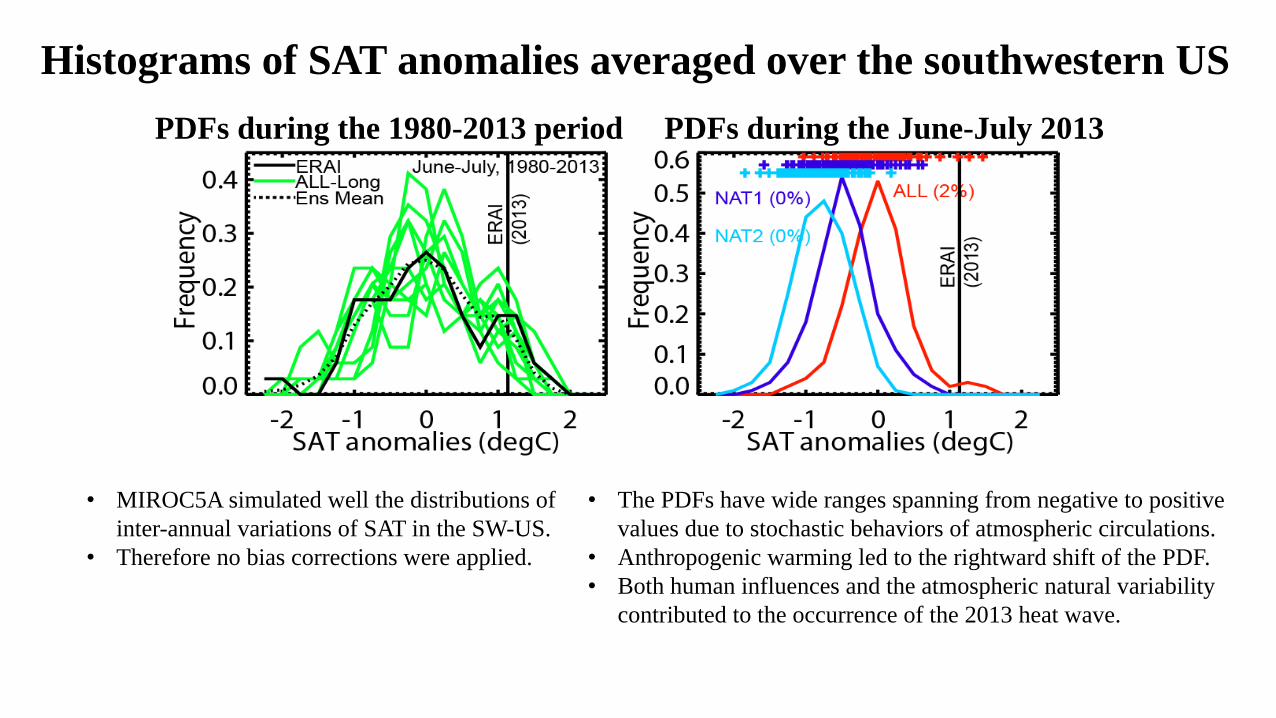
Histograms of SAT anomalies averaged over the southwestern US
• MIROC5A simulated well the distributions of
inter-annual variations of SAT in the SW-US.
• Therefore no bias corrections were applied.
• The PDFs have wide ranges spanning from negative to positive
values due to stochastic behaviors of atmospheric circulations.
• Anthropogenic warming led to the rightward shift of the PDF.
• Both human influences and the atmospheric natural variability
contributed to the occurrence of the 2013 heat wave.
PDFs during the 1980-2013 period PDFs during the June-July 2013
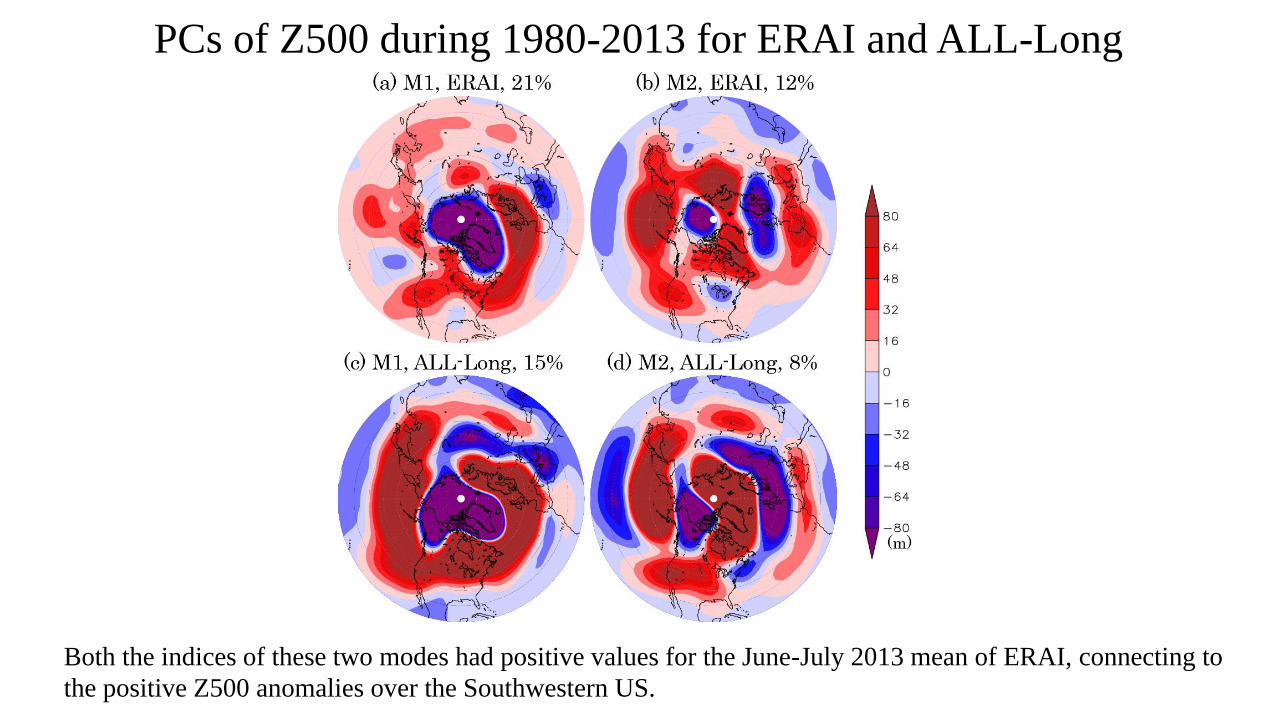
PCs of Z500 during 1980-2013 for ERAI and ALL-Long
Both the indices of these two modes had positive values for the June-July 2013 mean of ERAI, connecting to
the positive Z500 anomalies over the Southwestern US.
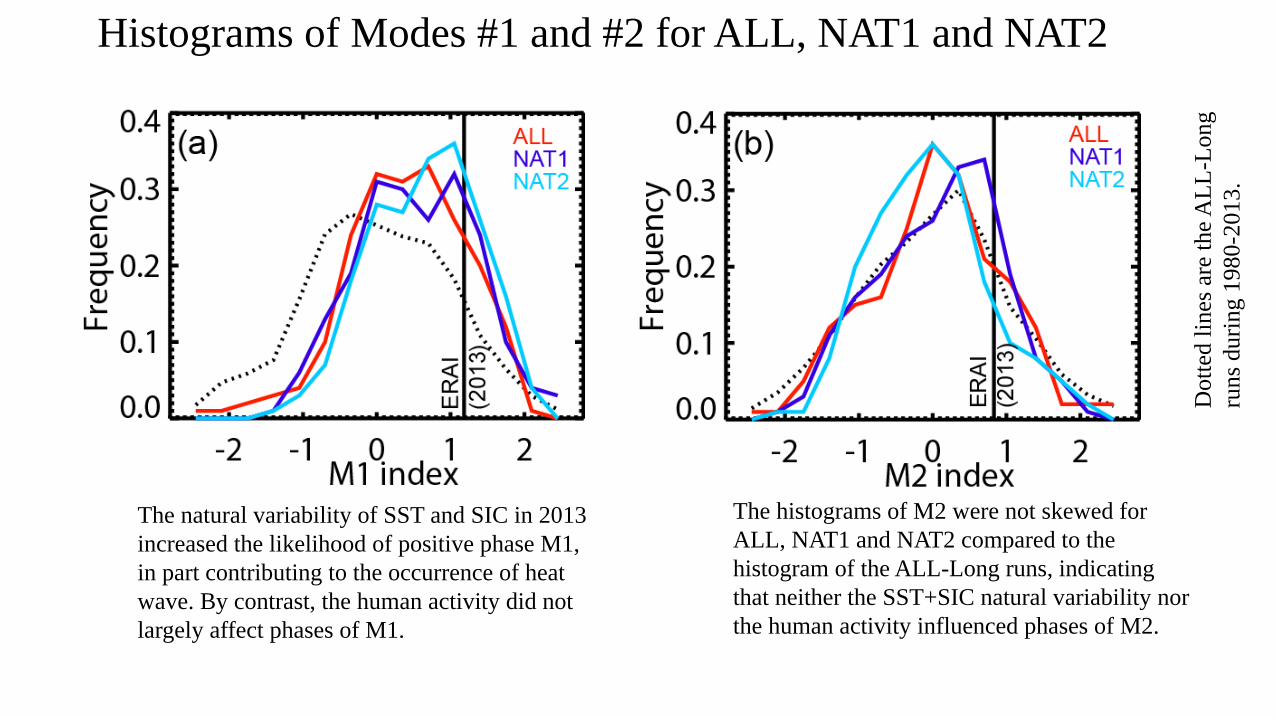
Histograms of Modes #1 and #2 for ALL, NAT1 and NAT2
Dott
ed l
ines
are
the
AL
L-L
ong
runs
duri
ng 1
980
-2013.
The natural variability of SST and SIC in 2013
increased the likelihood of positive phase M1,
in part contributing to the occurrence of heat
wave. By contrast, the human activity did not
largely affect phases of M1.
The histograms of M2 were not skewed for
ALL, NAT1 and NAT2 compared to the
histogram of the ALL-Long runs, indicating
that neither the SST+SIC natural variability nor
the human activity influenced phases of M2.
Related Documents