GIS-based Climate Change Vulnerability Assessment of the Municipality of Del Carmen, Surigao del Norte Province, Philippines Diomedes A. Racelis, Elenita L. Racelis and Angela A. Limpiada University of the Philippines Los Banos

Welcome message from author
This document is posted to help you gain knowledge. Please leave a comment to let me know what you think about it! Share it to your friends and learn new things together.
Transcript
GIS-based Climate Change Vulnerability Assessment of the Municipality of Del Carmen, Surigao del
Norte Province, Philippines
Diomedes A. Racelis, Elenita L. Racelis and Angela A. Limpiada University of the Philippines Los Banos

PRESENTATION OUTLINE
• Country Background: Philippines
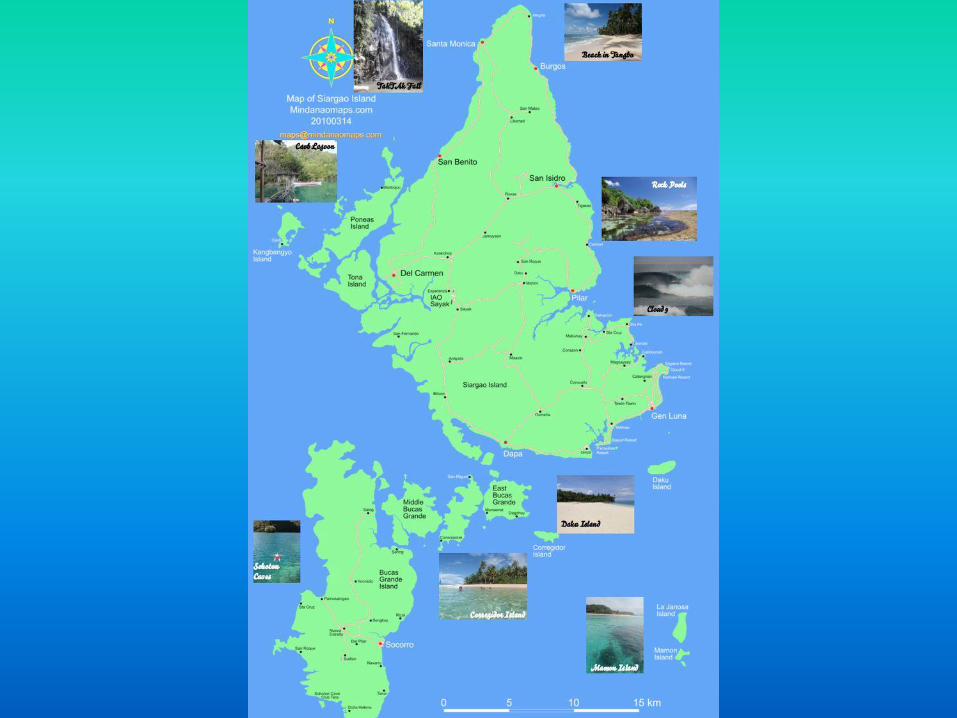
• Study Site: Del Carmen, Siargao Island Surigao del Norte, Mindanao
• Objectives of the Study
• Methodology
• Results of Vulnerability Mapping
• Lessons Learned
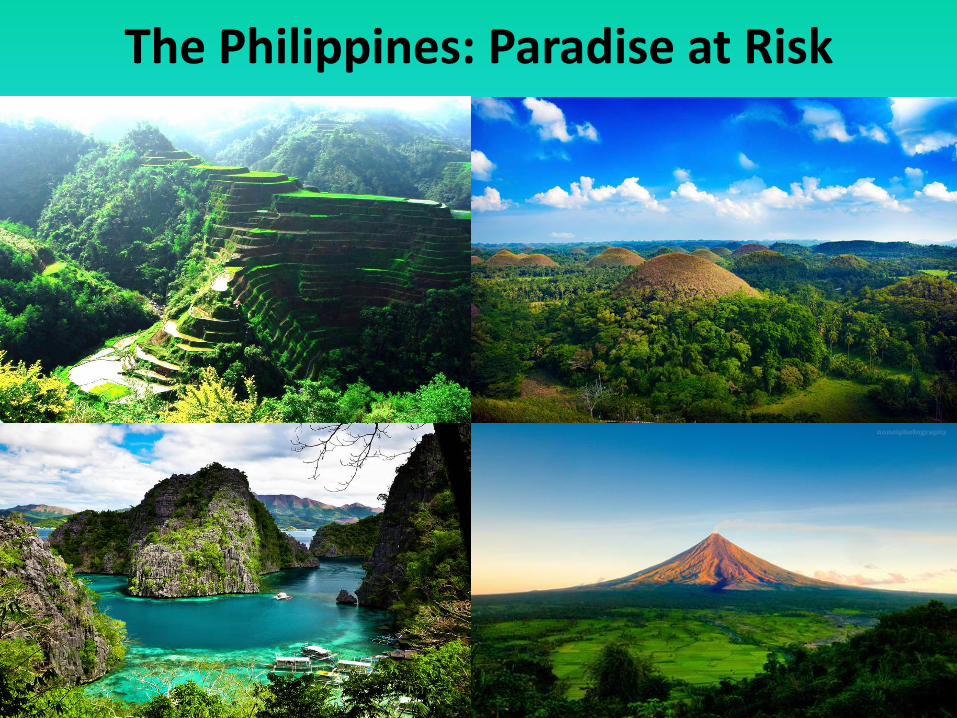
The Philippines: Paradise at Risk
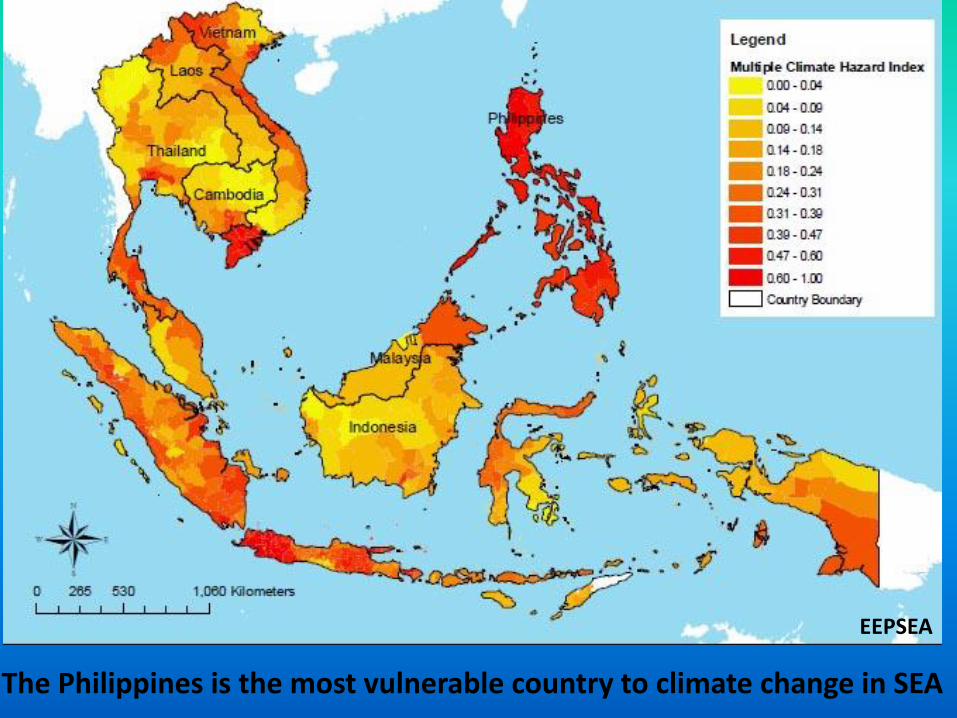
The Philippines is the most vulnerable country to climate change in SEA
EEPSEA
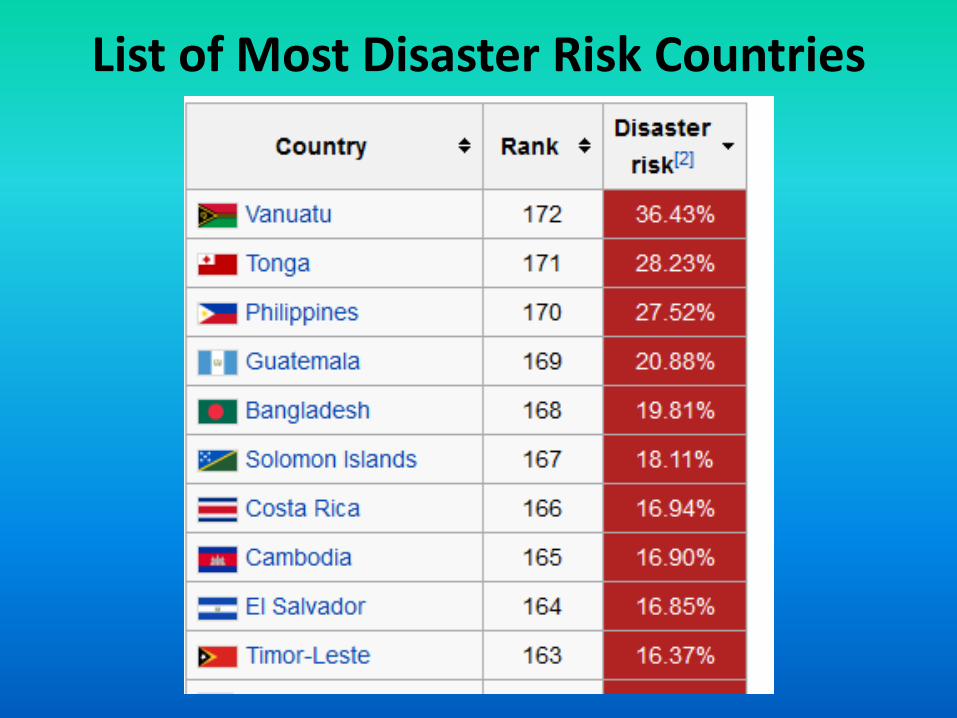
List of Most Disaster Risk Countries
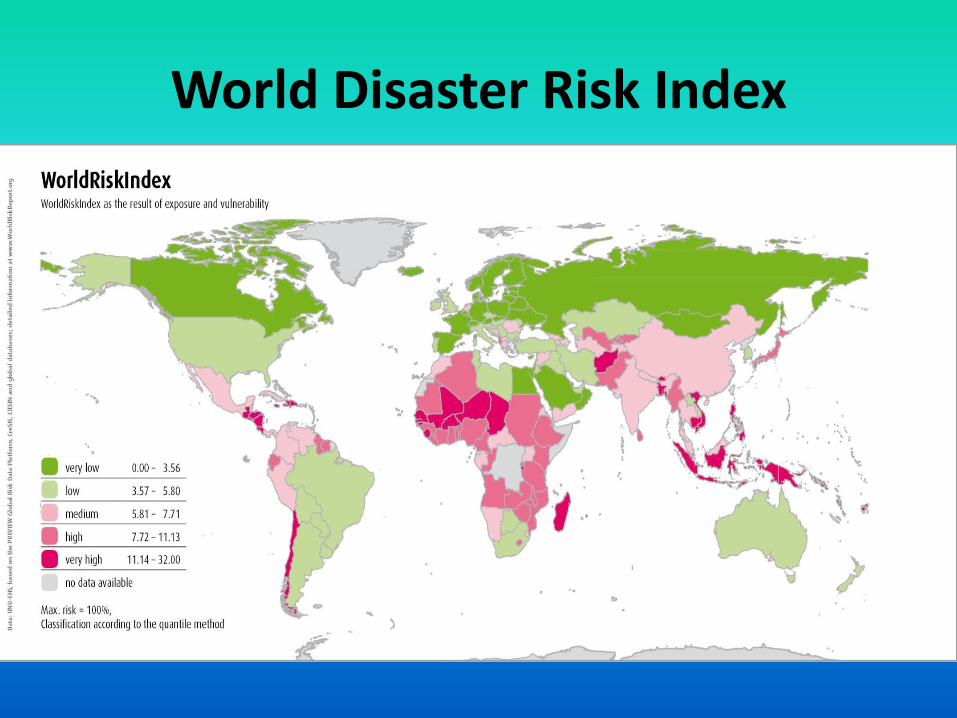
World Disaster Risk Index

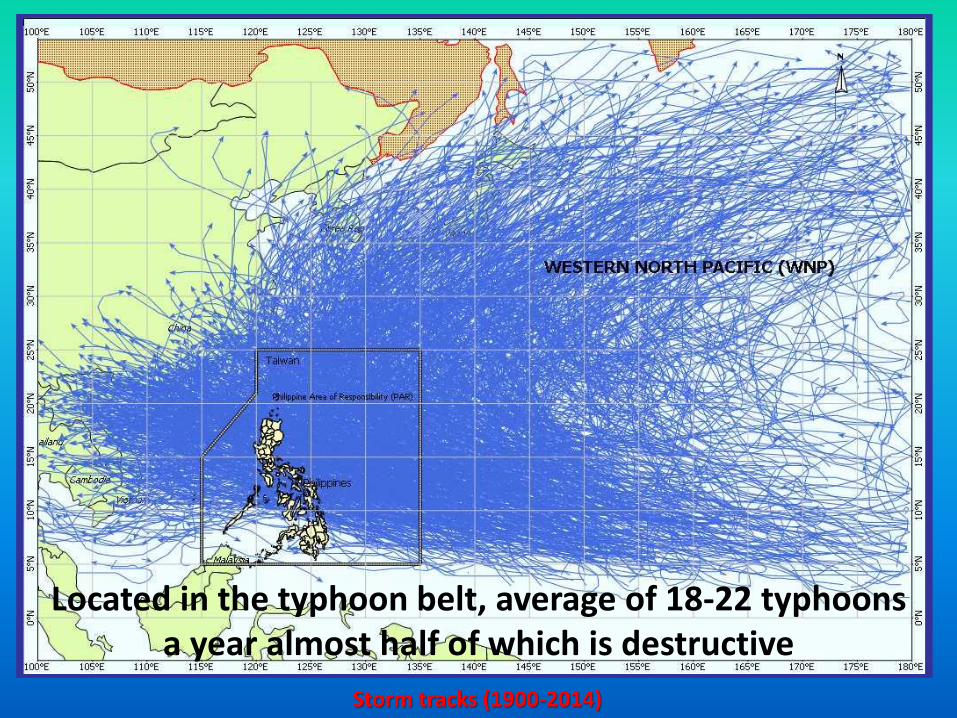
Storm tracks (1900-2014)
Located in the typhoon belt, average of 18-22 typhoons a year almost half of which is destructive
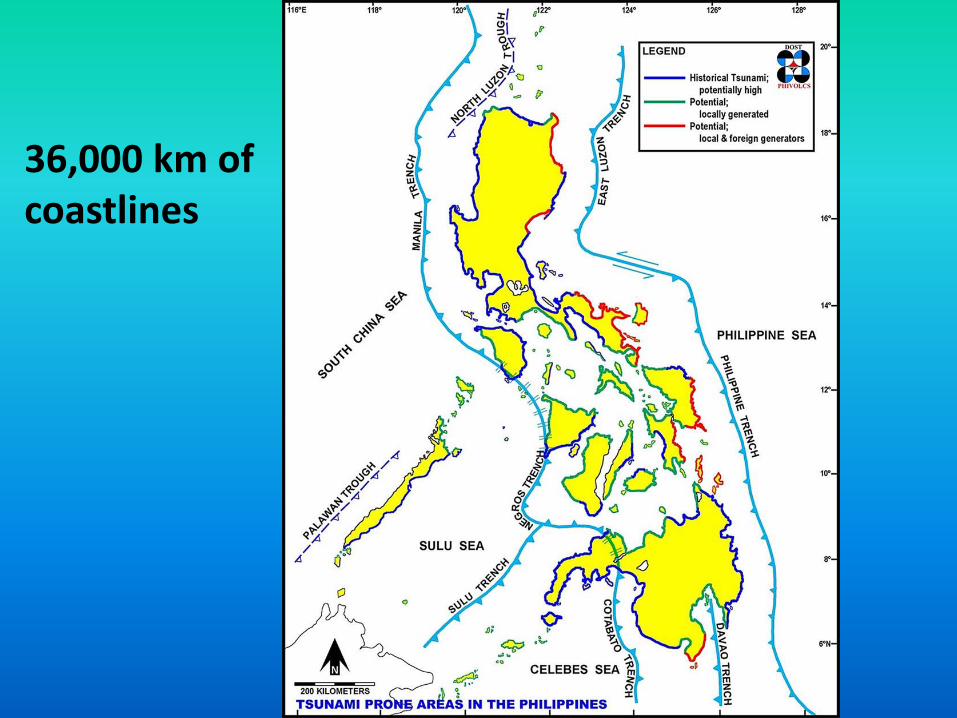
36,000 km of coastlines
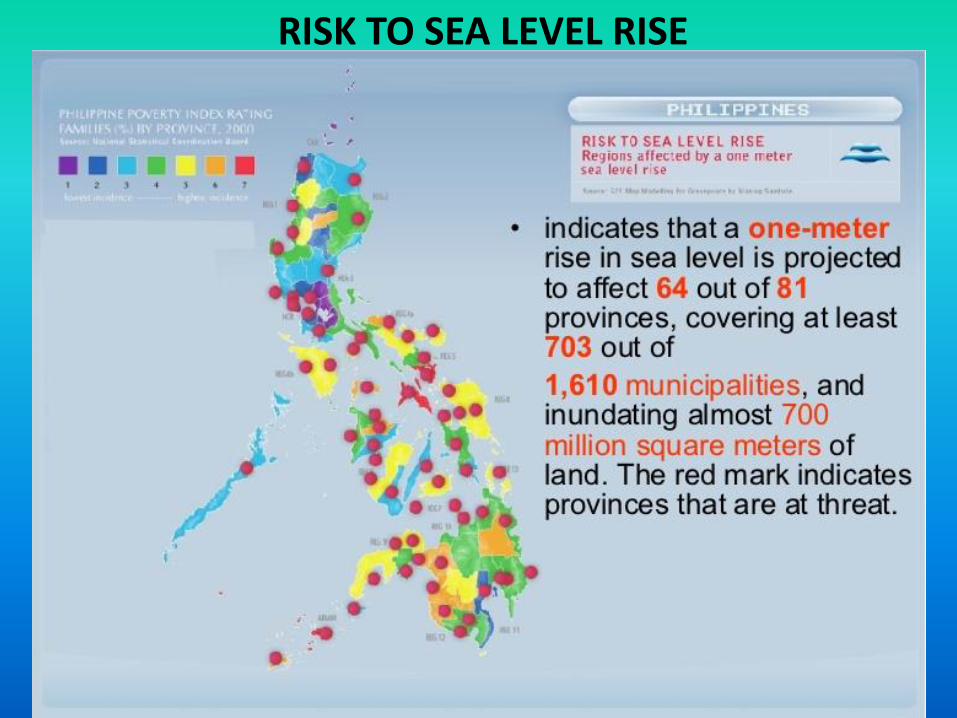
RISK TO SEA LEVEL RISE


RUGGED TOPOGRAPHY

RAPID URBANIZATION and OVERPOPULATION
Photo Credit: Skyscrapercity.com
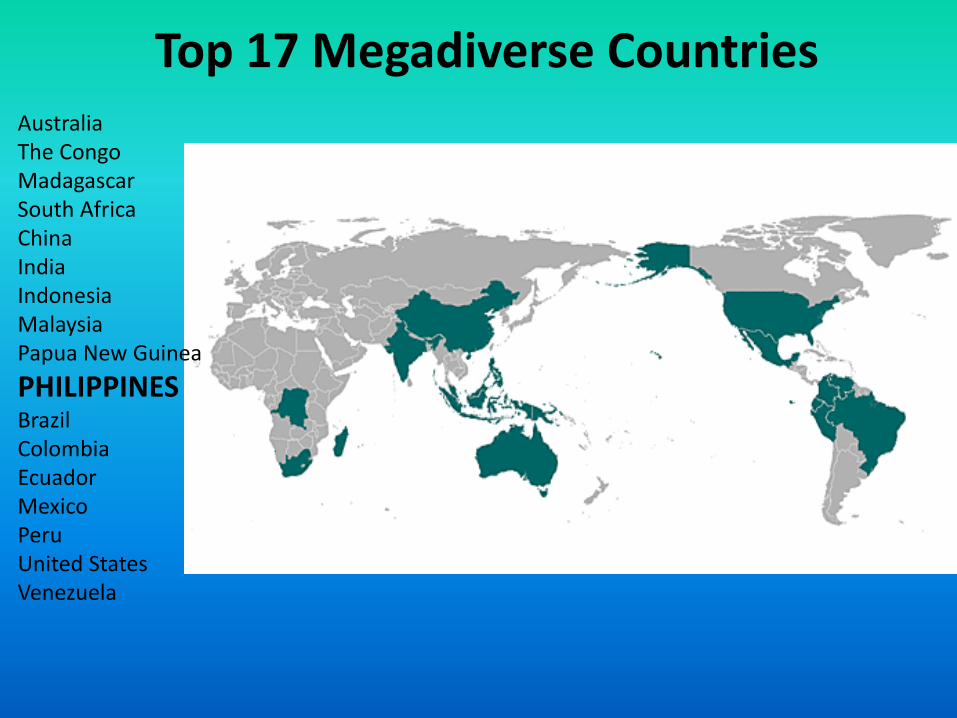
Top 17 Megadiverse Countries Australia The Congo Madagascar South Africa China India Indonesia Malaysia Papua New Guinea
PHILIPPINES Brazil Colombia Ecuador Mexico Peru United States Venezuela

Study Site: Del Carmen, Siargao Island , Surigao del Sur
MANILA
MINDANAO
SIARGAO

Photo Credit: http://www.mindanaotours.com
Siargao Island is well known as “The Surfing Capital of the Philippines”.
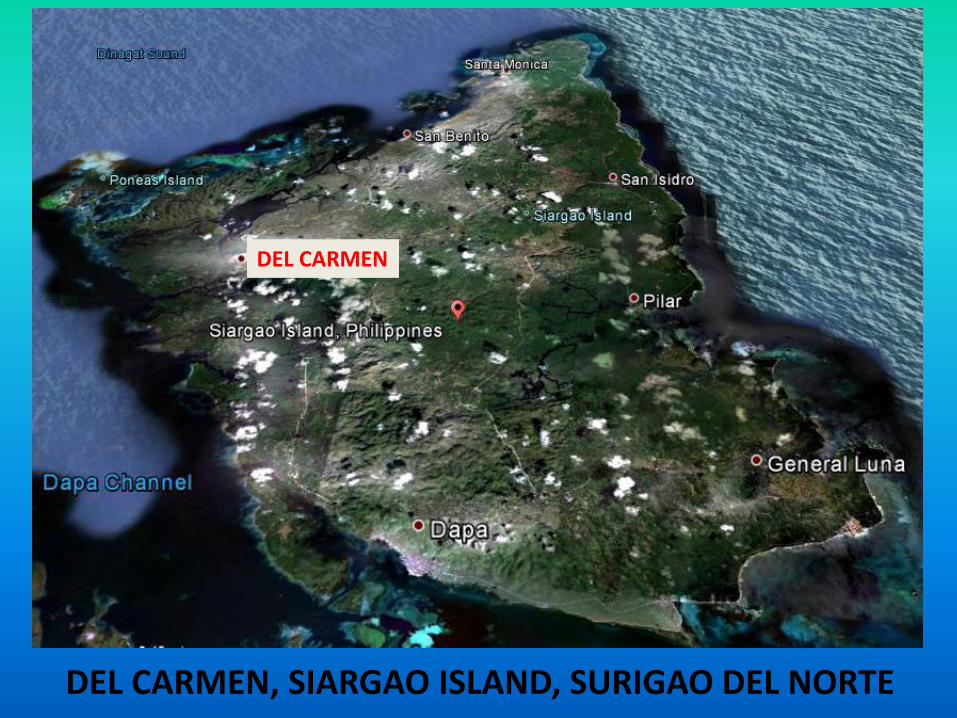
DEL CARMEN, SIARGAO ISLAND, SURIGAO DEL NORTE
DEL CARMEN

Village Map of Del Carmen
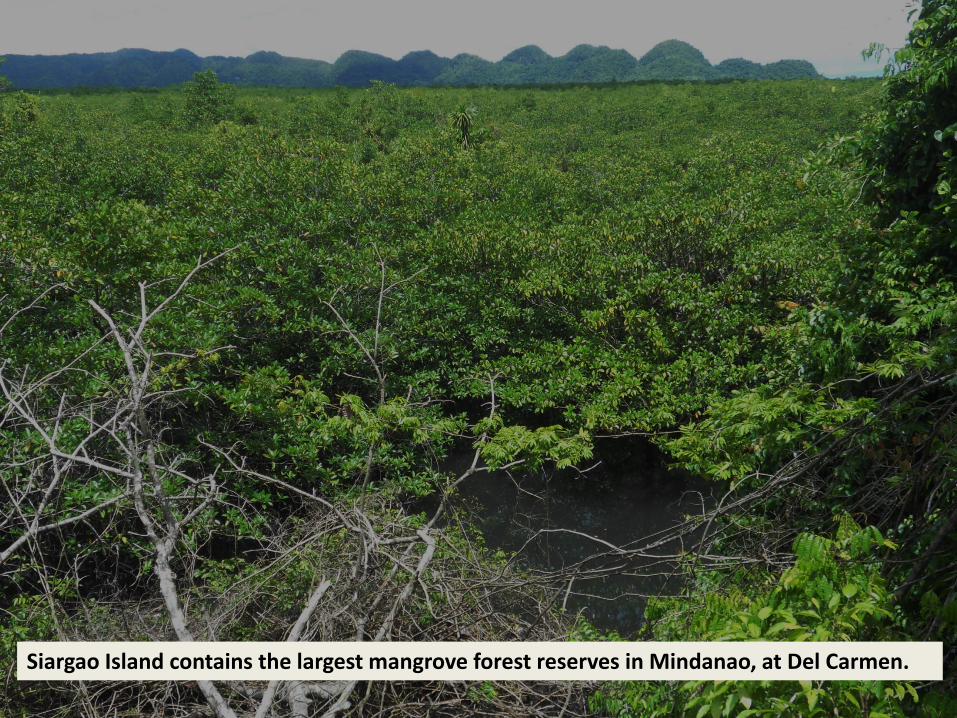
Siargao Island contains the largest mangrove forest reserves in Mindanao, at Del Carmen.
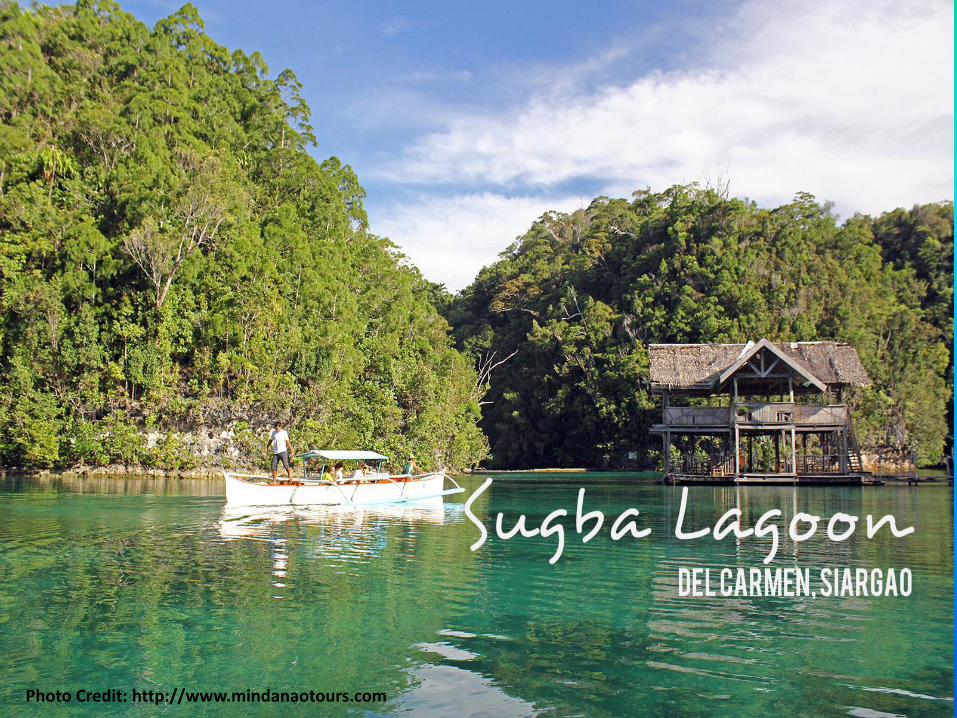
Photo Credit: http://www.mindanaotours.com
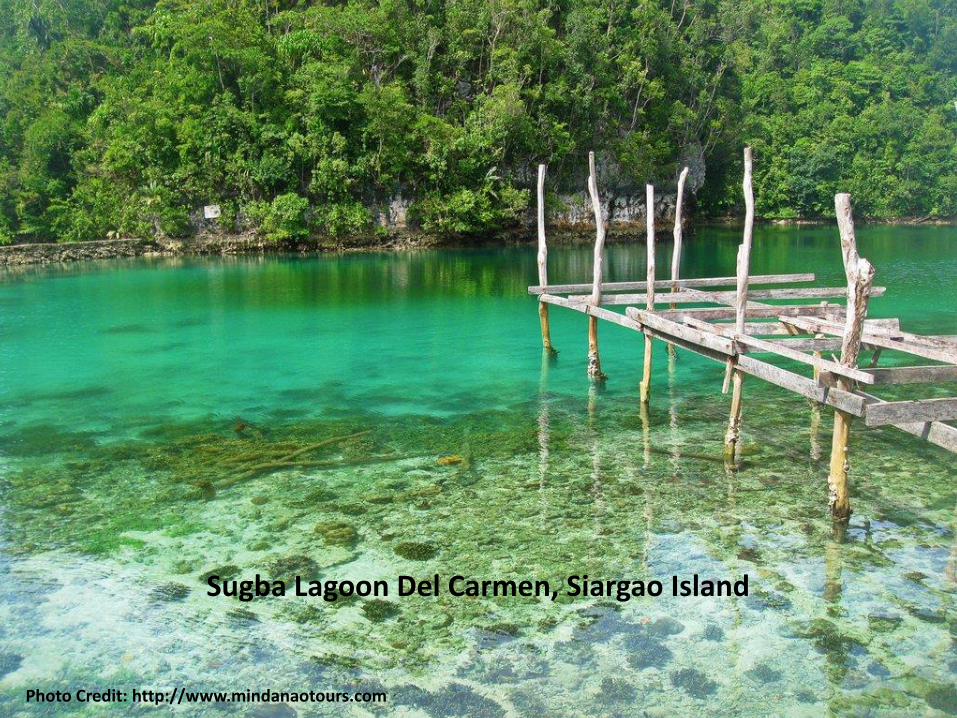
Sugba Lagoon Del Carmen, Siargao Island
Photo Credit: http://www.mindanaotours.com

OBJECTIVES OF THE STUDY Determine using GIS the vulnerability to the impacts of climate change and climate risks of ecosystems, communities, and infrastructure in the municipalities of Del Carmen in Surigao del Norte
METHODOLOGY
A. Site Reconnaissance
B. Coordination with Stakeholders
C. Gathering of Secondary Data
D. Community Mapping
E. Map Consolidation
F. Scanning
G. Georeferencing
H. Digitizing
I. Generation of Vulnerability Maps
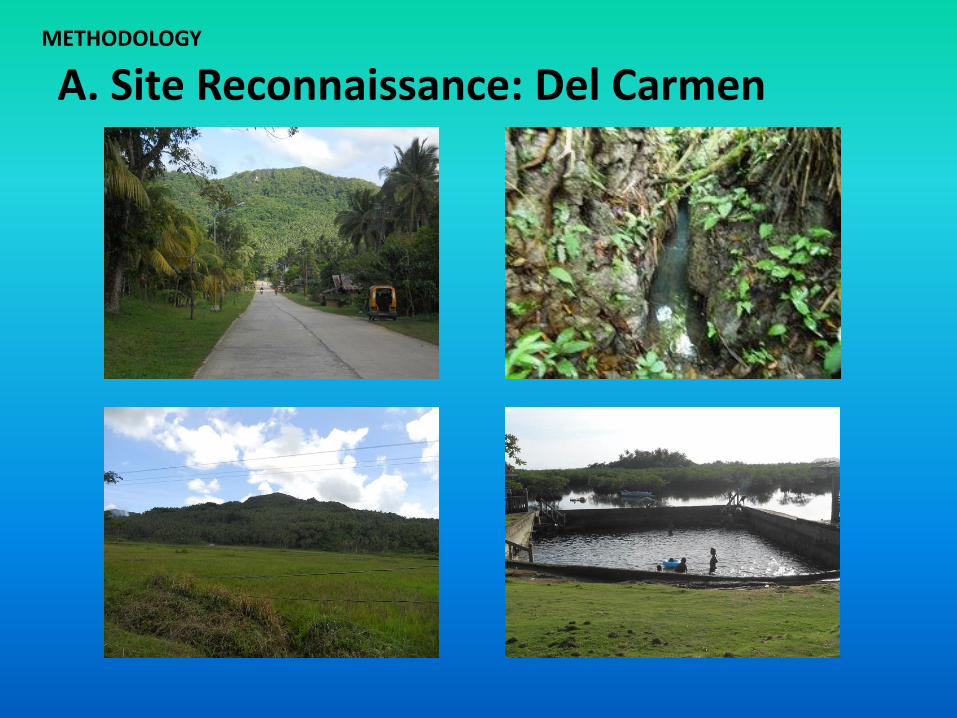
A. Site Reconnaissance: Del Carmen METHODOLOGY

B. Coordination with Stakeholders METHODOLOGY
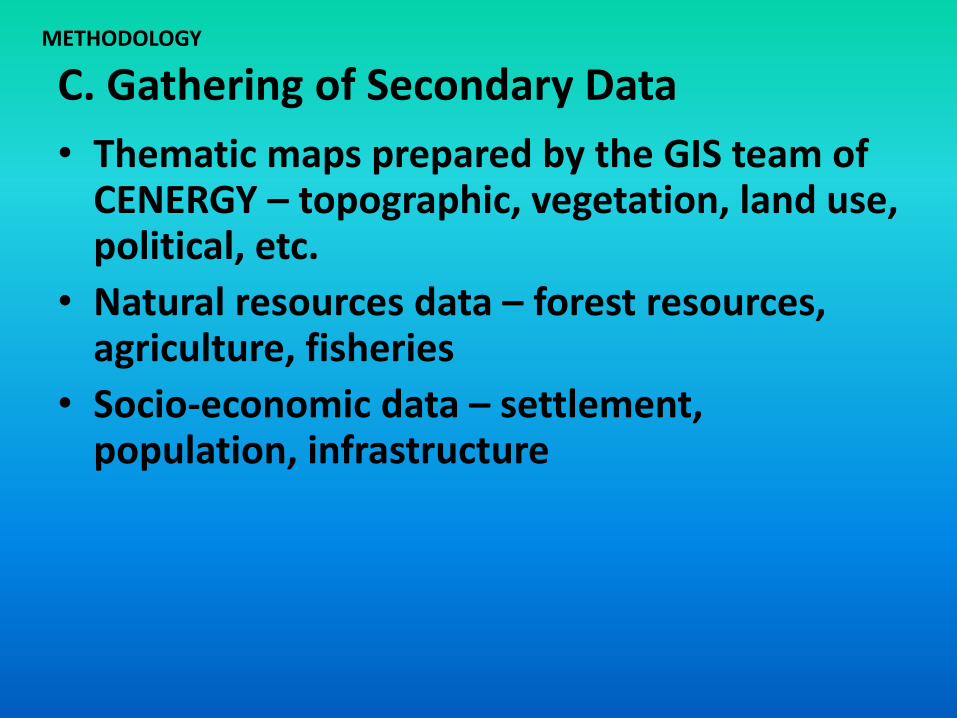
C. Gathering of Secondary Data METHODOLOGY
• Thematic maps prepared by the GIS team of CENERGY – topographic, vegetation, land use, political, etc.
• Natural resources data – forest resources, agriculture, fisheries
• Socio-economic data – settlement, population, infrastructure
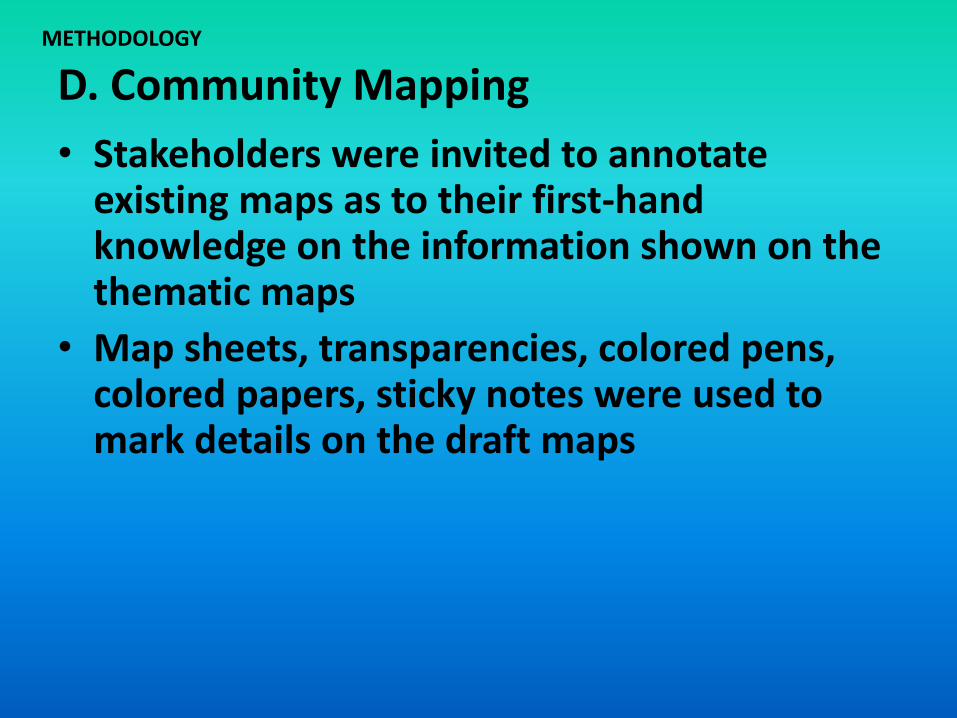
D. Community Mapping METHODOLOGY
• Stakeholders were invited to annotate existing maps as to their first-hand knowledge on the information shown on the thematic maps
• Map sheets, transparencies, colored pens, colored papers, sticky notes were used to mark details on the draft maps
E. Map Consolidation METHODOLOGY
• Involved compiling all analog (paper-based) spatial information prior to GIS mapping.
• In this particular activity, a total of twenty (20) draft thematic maps for the four (4) selected municipalities of Siargao Island were received for conversion to GIS-based digital maps
F. Scanning METHODOLOGY
• transferred analog (paper) maps into a digital format the computer can read
• the maps were scanned individually in preparation for on-screen digitizing.
• each map was placed carefully on ordinary printer-scanner and scanned to produce a digital image for subsequent digitizing
F. Georefencing METHODOLOGY
• involves aligning geographic data to a known coordinate system so it can be viewed, queried, and analyzed with other geographic data
• to georeference an image, one first needs to establish control points, input the known geographic coordinates of these control points, choose the coordinate system and other projection parameters and then minimize residuals
• Residuals are the difference between the actual coordinates of the control points and the coordinates predicted by the geographic model created using the control points
F. Georefencing
METHODOLOGY
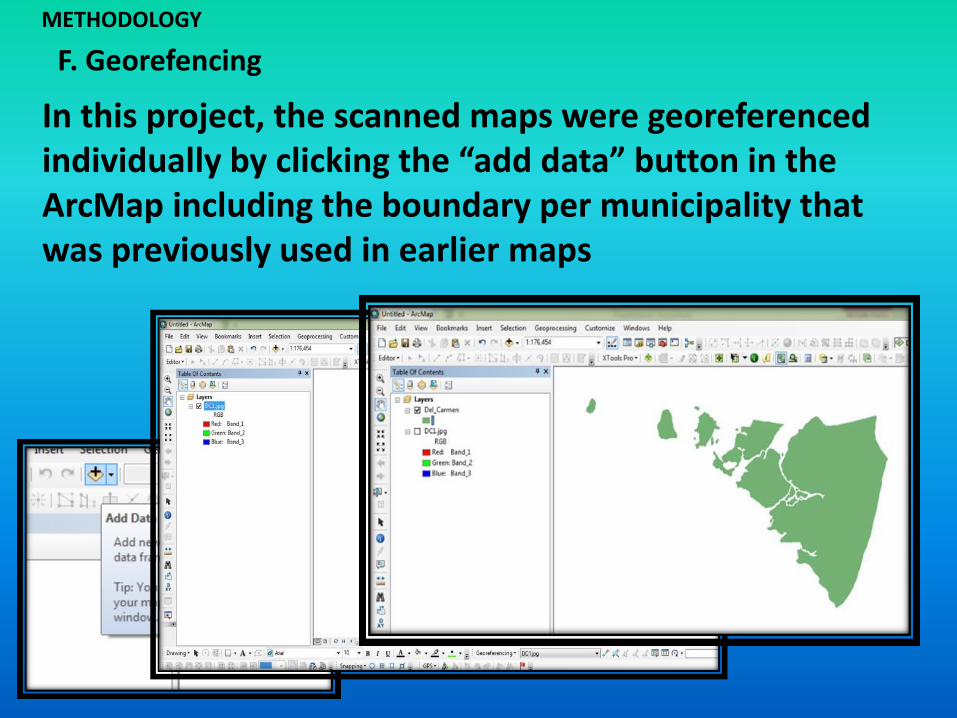
In this project, the scanned maps were georeferenced individually by clicking the “add data” button in the ArcMap including the boundary per municipality that was previously used in earlier maps
F. Georefencing
METHODOLOGY
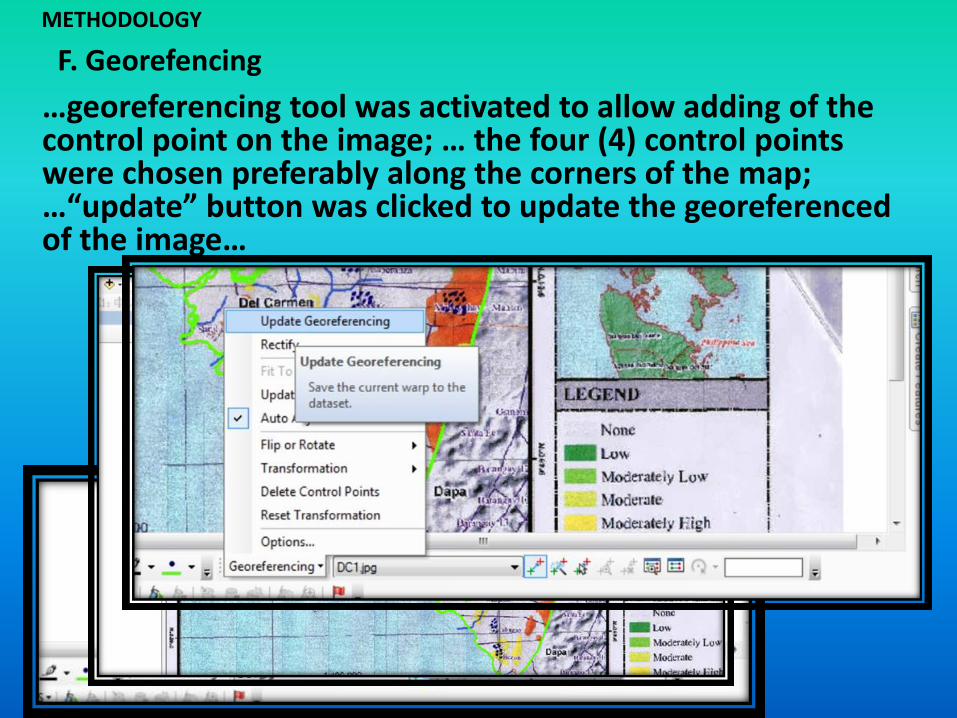
…georeferencing tool was activated to allow adding of the control point on the image; … the four (4) control points were chosen preferably along the corners of the map; …“update” button was clicked to update the georeferenced of the image…
F. Digitizing METHODOLOGY
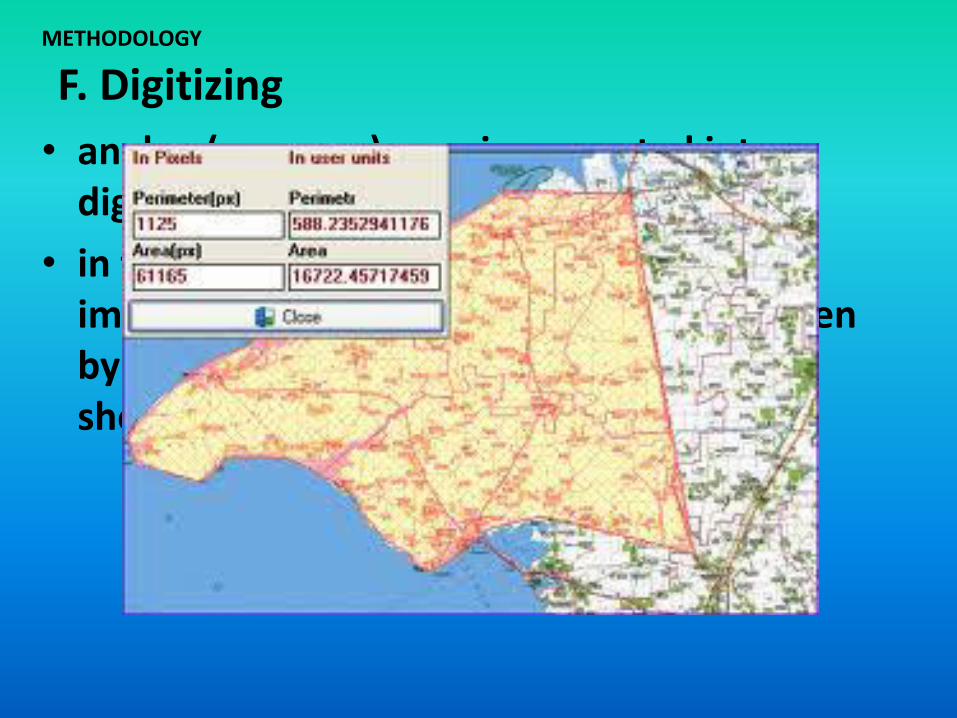
• analog (or paper) map is converted into a digital format
• in this particular set of maps, the scanned images were individually digitized on-screen by encoding all the relevant information shown on each image
F. Digitizing METHODOLOGY
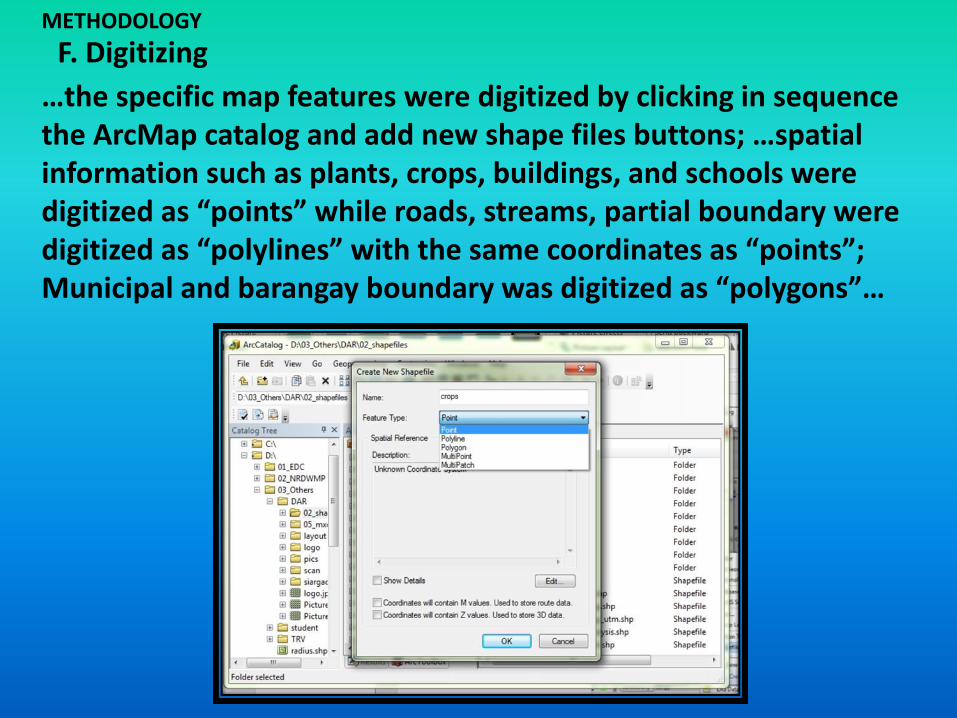
…the specific map features were digitized by clicking in sequence the ArcMap catalog and add new shape files buttons; …spatial information such as plants, crops, buildings, and schools were digitized as “points” while roads, streams, partial boundary were digitized as “polylines” with the same coordinates as “points”; Municipal and barangay boundary was digitized as “polygons”…
F. Digitizing METHODOLOGY
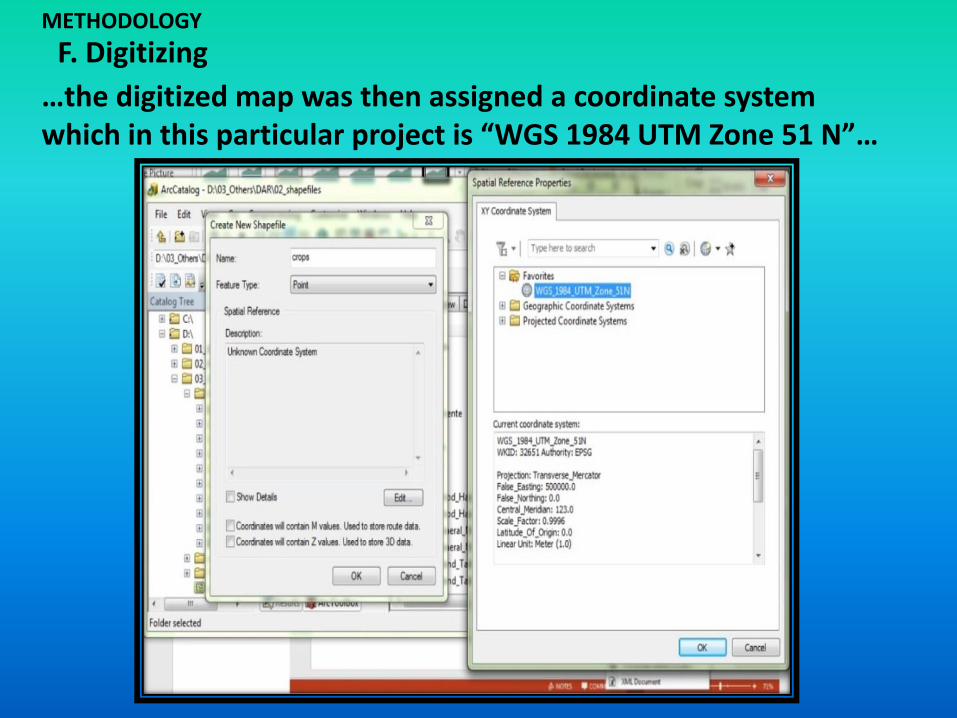
…the digitized map was then assigned a coordinate system which in this particular project is “WGS 1984 UTM Zone 51 N”…
F. Digitizing METHODOLOGY
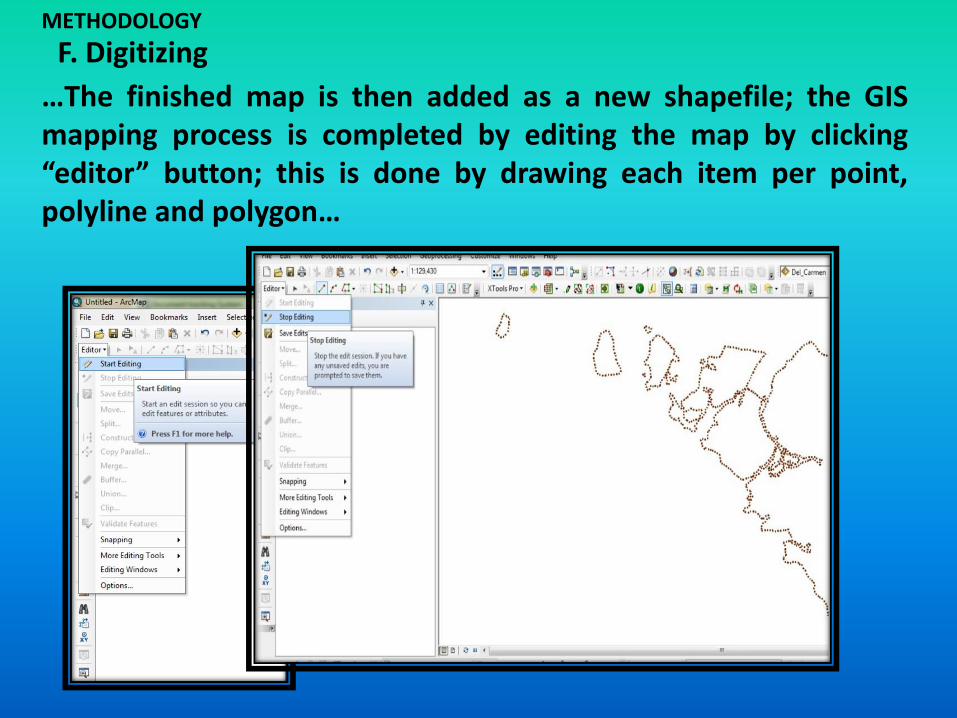
…The finished map is then added as a new shapefile; the GIS mapping process is completed by editing the map by clicking “editor” button; this is done by drawing each item per point, polyline and polygon…
G. Preparation of Vulnerability Maps
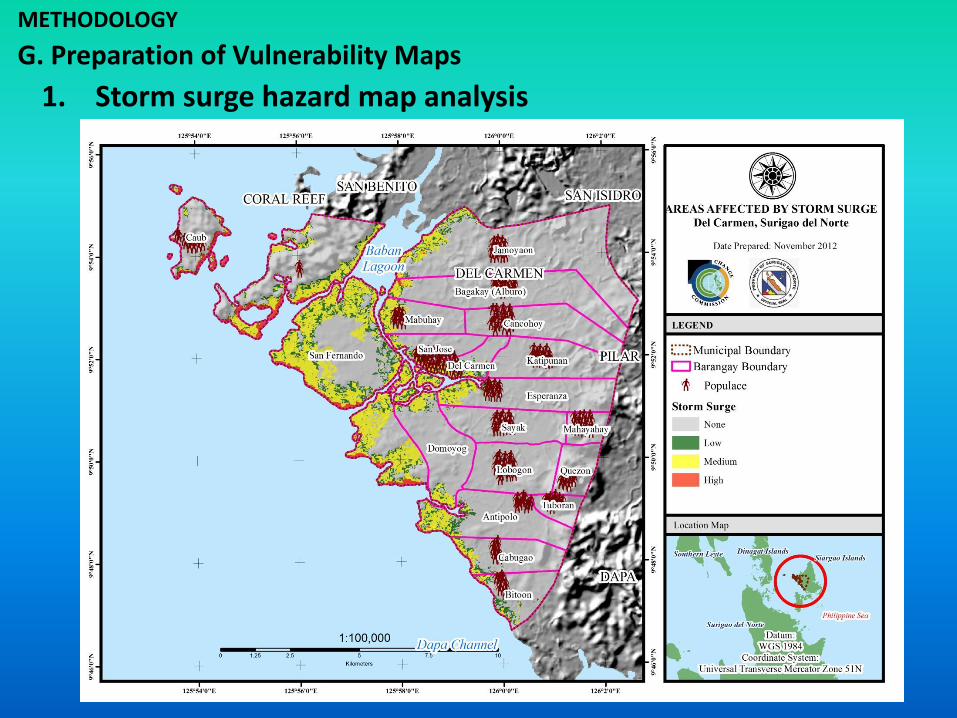
1. Storm surge hazard map analysis
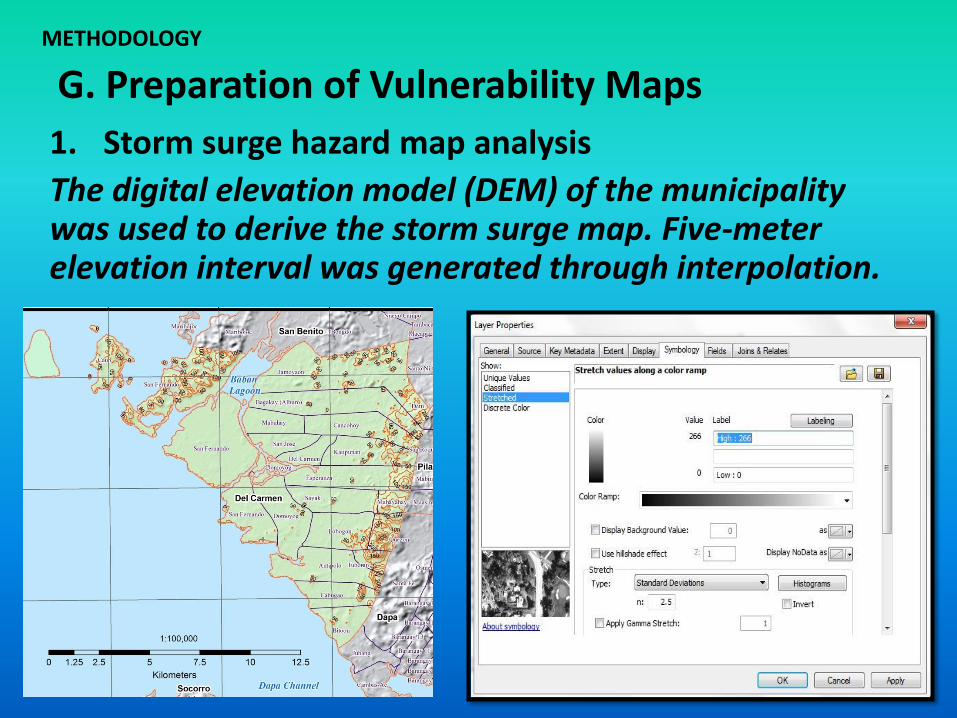
The digital elevation model (DEM) of the municipality was used to derive the storm surge map. Five-meter elevation interval was generated through interpolation.
METHODOLOGY

G. Preparation of Vulnerability Maps
1. Storm surge hazard map analysis
METHODOLOGY
G. Preparation of Vulnerability Maps
1. Storm surge hazard map analysis
METHODOLOGY
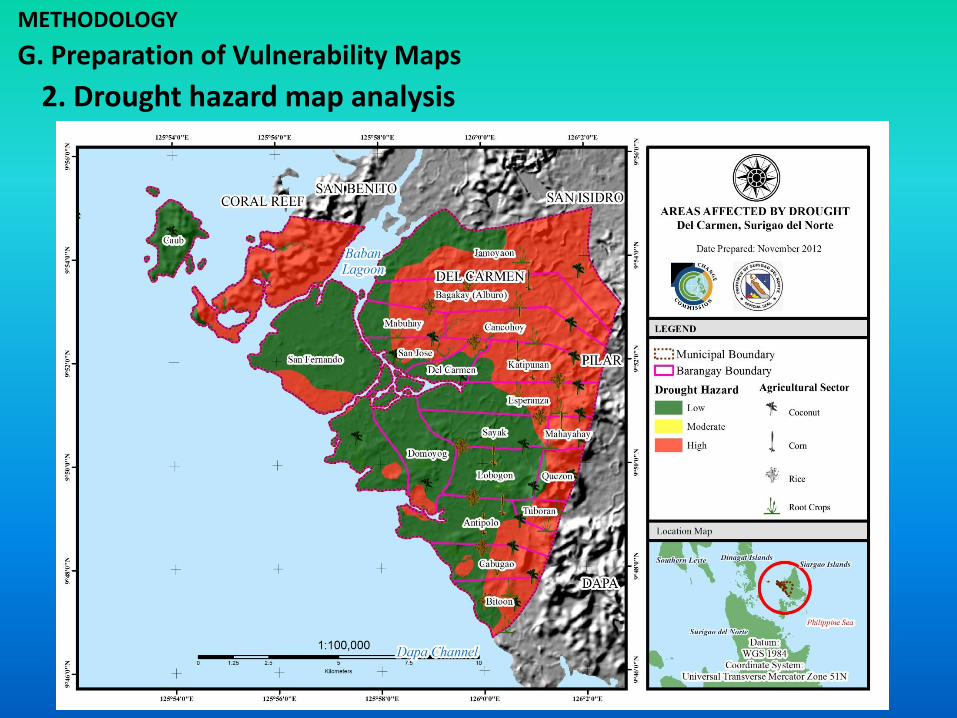
G. Preparation of Vulnerability Maps
2. Drought hazard map analysis
METHODOLOGY
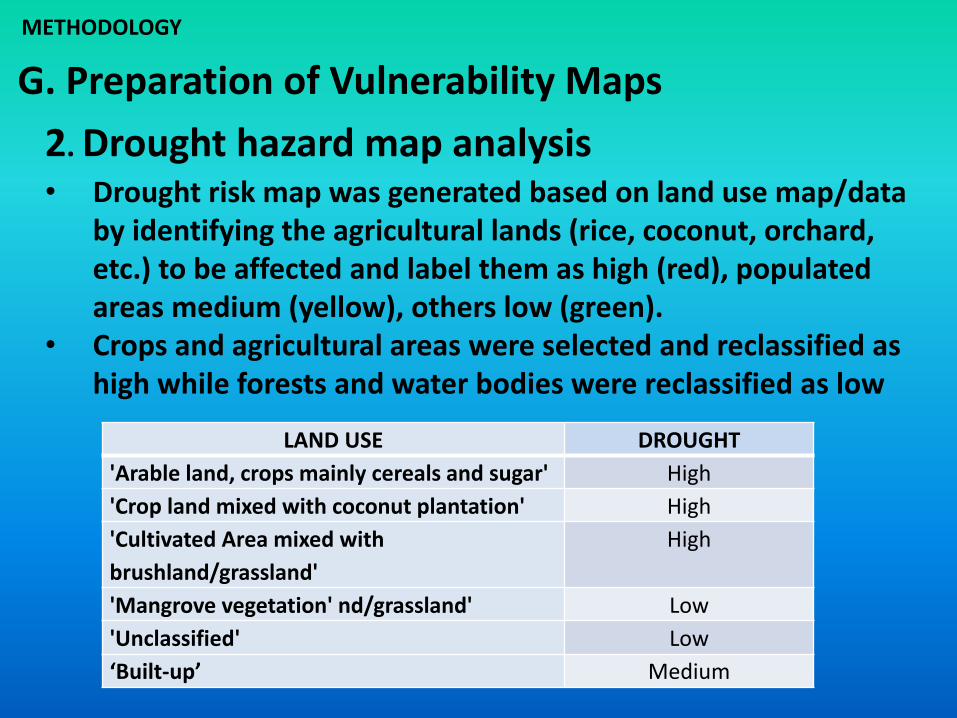
• Drought risk map was generated based on land use map/data by identifying the agricultural lands (rice, coconut, orchard, etc.) to be affected and label them as high (red), populated areas medium (yellow), others low (green).
• Crops and agricultural areas were selected and reclassified as high while forests and water bodies were reclassified as low
LAND USE DROUGHT
'Arable land, crops mainly cereals and sugar' High
'Crop land mixed with coconut plantation' High
'Cultivated Area mixed with
brushland/grassland'
High
'Mangrove vegetation' nd/grassland' Low
'Unclassified' Low
‘Built-up’ Medium
G. Preparation of Vulnerability Maps
2. Drought hazard map analysis
METHODOLOGY
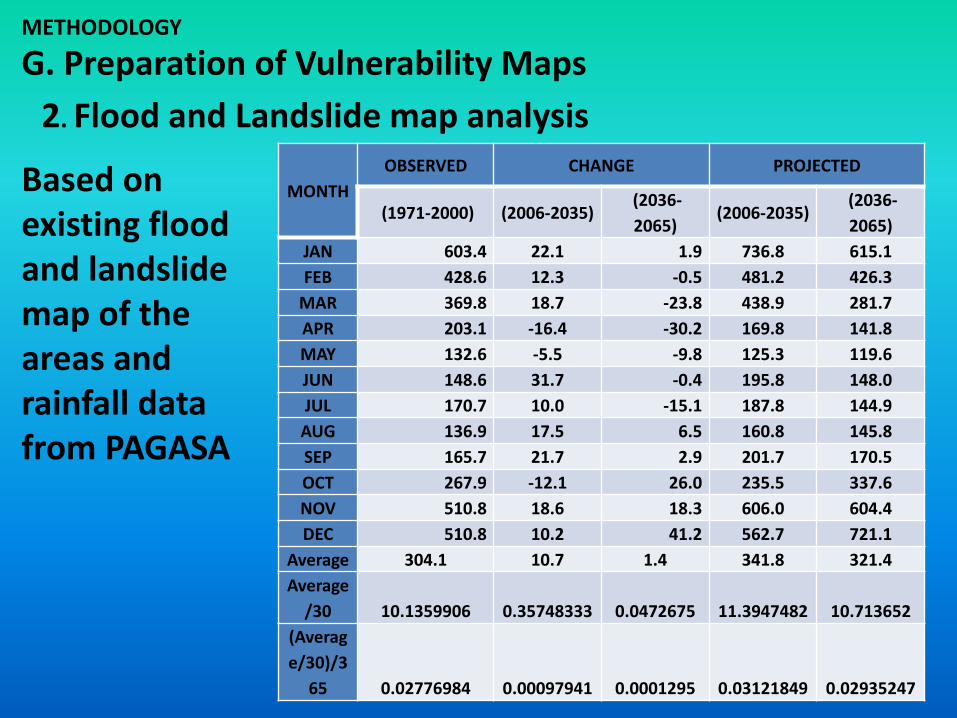
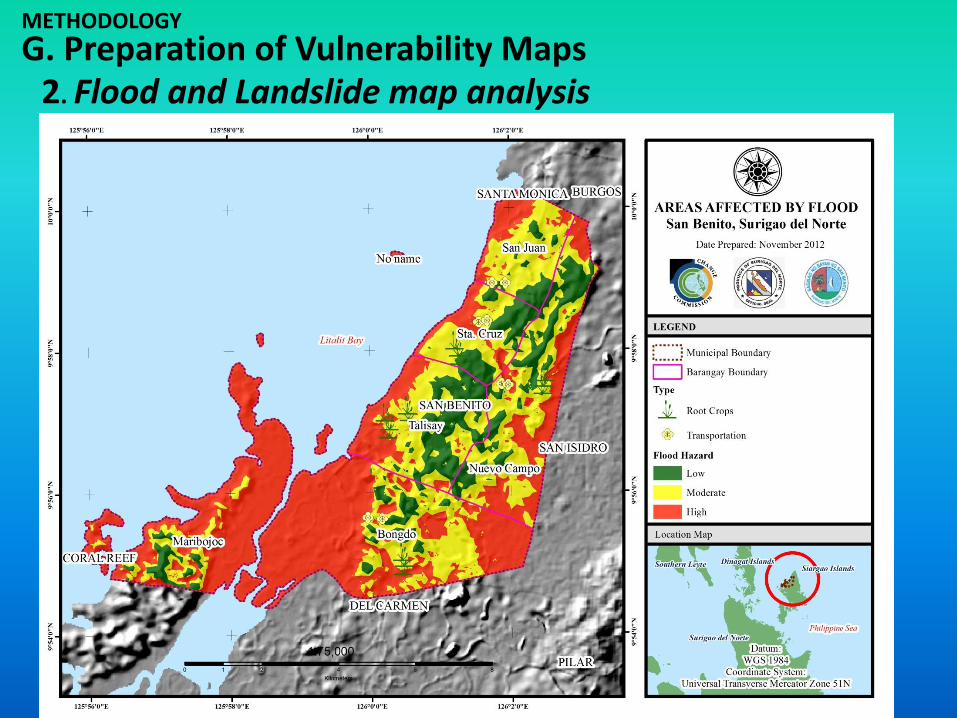
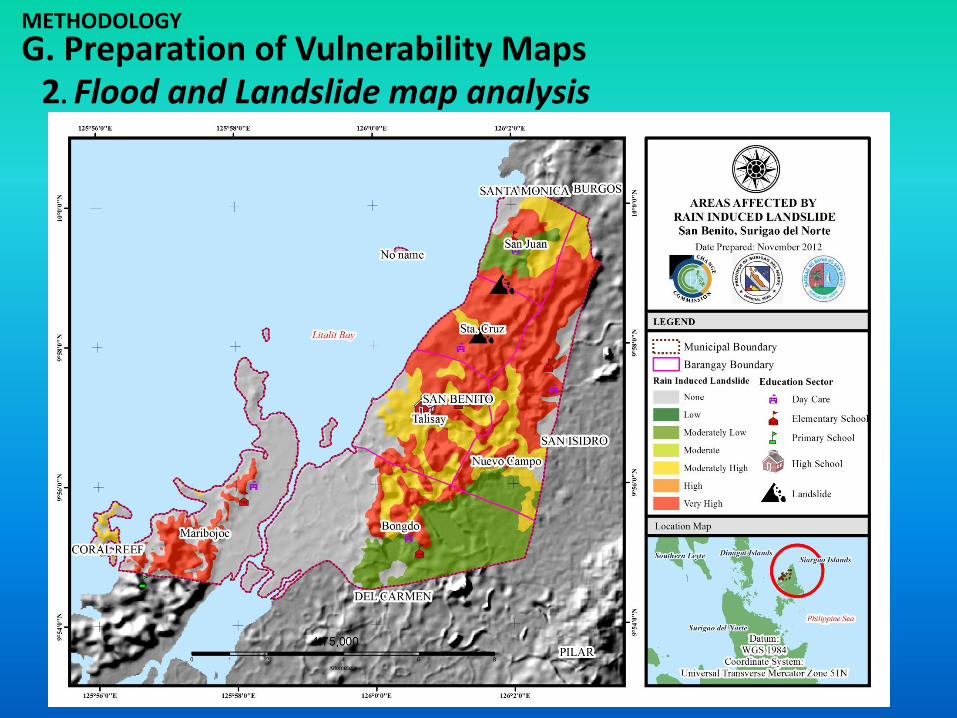
G. Preparation of Vulnerability Maps
2. Flood and Landslide map analysis
METHODOLOGY
Based on existing flood and landslide map of the areas and rainfall data from PAGASA
MONTH
OBSERVED CHANGE PROJECTED
(1971-2000) (2006-2035) (2036-
2065) (2006-2035)
(2036-
2065)
JAN 603.4 22.1 1.9 736.8 615.1
FEB 428.6 12.3 -0.5 481.2 426.3
MAR 369.8 18.7 -23.8 438.9 281.7
APR 203.1 -16.4 -30.2 169.8 141.8
MAY 132.6 -5.5 -9.8 125.3 119.6
JUN 148.6 31.7 -0.4 195.8 148.0
JUL 170.7 10.0 -15.1 187.8 144.9
AUG 136.9 17.5 6.5 160.8 145.8
SEP 165.7 21.7 2.9 201.7 170.5
OCT 267.9 -12.1 26.0 235.5 337.6
NOV 510.8 18.6 18.3 606.0 604.4
DEC 510.8 10.2 41.2 562.7 721.1
Average 304.1 10.7 1.4 341.8 321.4
Average
/30 10.1359906 0.35748333 0.0472675 11.3947482 10.713652
(Averag
e/30)/3
65 0.02776984 0.00097941 0.0001295 0.03121849 0.02935247
G. Preparation of Vulnerability Maps
2. Flood and Landslide map analysis
METHODOLOGY
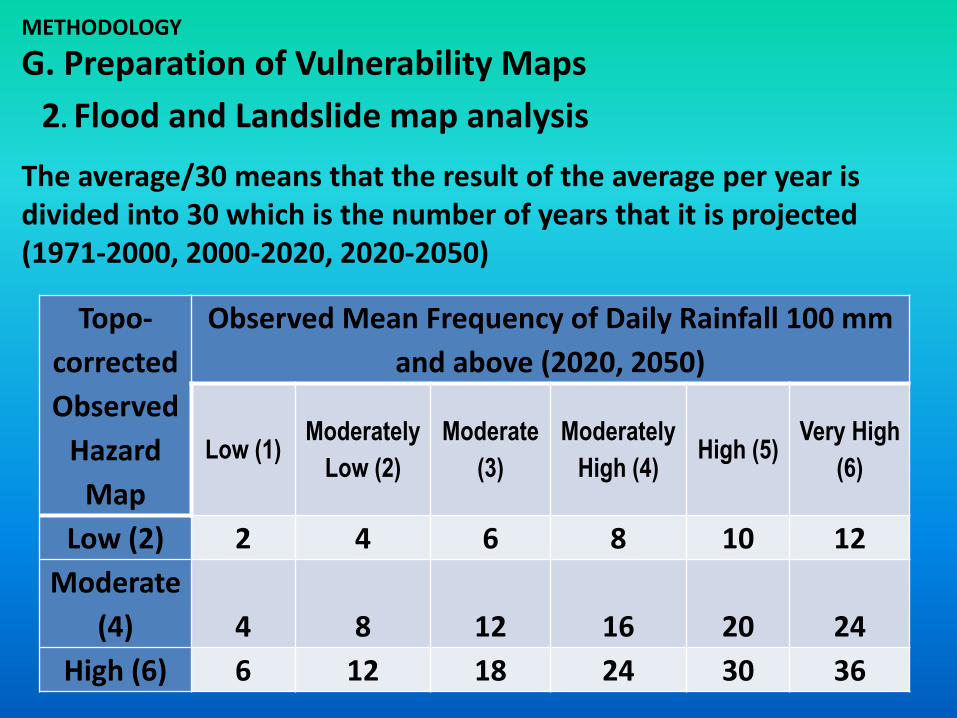
The average/30 means that the result of the average per year is divided into 30 which is the number of years that it is projected (1971-2000, 2000-2020, 2020-2050)
Topo-
corrected
Observed
Hazard
Map
Observed Mean Frequency of Daily Rainfall 100 mm
and above (2020, 2050)
Low (1) Moderately
Low (2)
Moderate
(3)
Moderately
High (4) High (5)
Very High
(6)
Low (2) 2 4 6 8 10 12
Moderate
(4) 4 8 12 16 20 24
High (6) 6 12 18 24 30 36
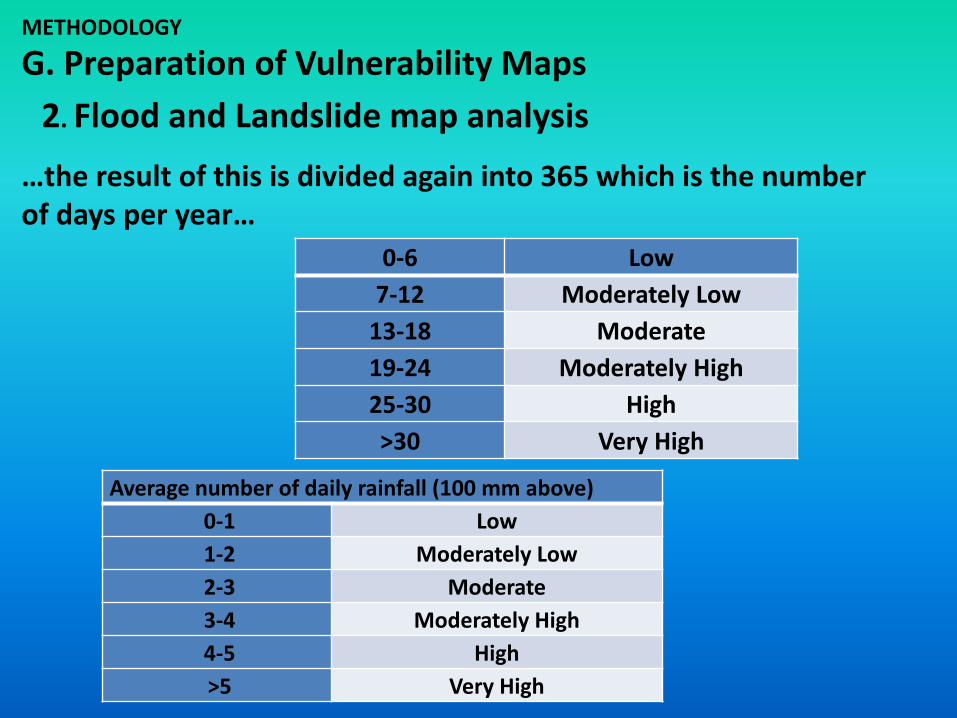
G. Preparation of Vulnerability Maps
2. Flood and Landslide map analysis
METHODOLOGY
…the result of this is divided again into 365 which is the number of days per year…
0-6 Low
7-12 Moderately Low
13-18 Moderate
19-24 Moderately High
25-30 High
>30 Very High
Average number of daily rainfall (100 mm above)
0-1 Low
1-2 Moderately Low
2-3 Moderate
3-4 Moderately High
4-5 High
>5 Very High
G. Preparation of Vulnerability Maps 2. Flood and Landslide map analysis
METHODOLOGY
G. Preparation of Vulnerability Maps 2. Flood and Landslide map analysis
METHODOLOGY

Areas affected by storm surge (Population)
Areas affected by rain-induced landslide (Population)
Areas affected by drought (Agriculture sector)
Vulnerability Maps for Del Carmen
OTHER GIS-RELATED ACTIVITIES
1. Preparation of hazard map in jpeg format:
– Flood map overlayed with topo map. Map showing barangay boundaries and other principal/key features that should be included in the map.
– Landslide map overlayed with topo map. Map showing barangay boundaries and other principal/key features that should be included in the map.
OTHER GIS-RELATED ACTIVITIES
2. Preparation of overlay/thematic maps and attribute tables:
• Spatial Extent for Rainfall-induced Landslides
• Exposed Population for Rainfall-induced Landslides
• Spatial Extent for Flooding
• Exposed Population for Flooding
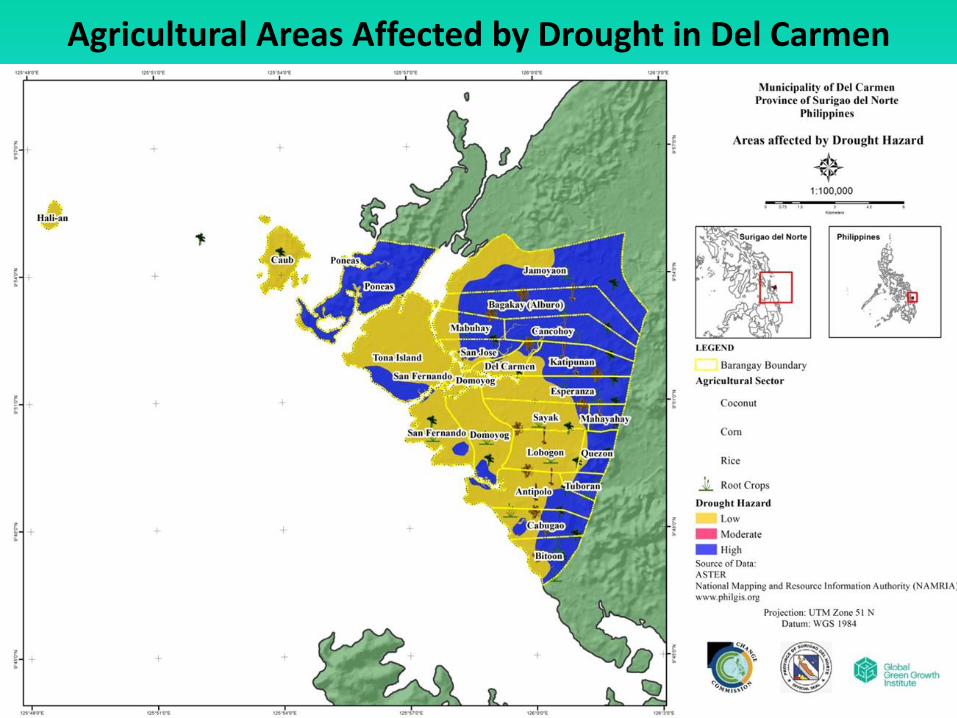
Agricultural Areas Affected by Drought in Del Carmen

Table 23. Agricultural areas at risk to drought in Del Carmen.
Coconut Corn Rice Root Crops Uncultivated Sub-total Coconut Corn Rice Root Crops Uncultivated Sub-total
Antipolo 41.9 121.2 350.5 513.6 35.8 163.6 199.3 713.0
Bagakay (Alburo) 54.1 54.1 85.8 93.2 53.5 650.9 883.4 937.5
Bitoon 114.8 114.8 32.5 1.1 27.5 170.0 231.2 0.1 346.1
Cabugao 18.3 1.8 159.5 179.6 46.9 199.7 246.6 426.3
Cancohoy 7.6 7.6 4.8 49.0 8.4 535.0 597.2 604.8
Caub 13.0 347.5 360.4 - 0.1 360.5
Del Carmen 30.0 139.9 169.9 13.9 33.6 47.5 217.3
Domoyog 16.7 12.3 614.1 643.2 52.9 52.9 0.1 696.2
Esperanza 333.5 333.5 5.5 46.2 296.6 348.3 681.8
Jamoyaon 470.0 470.0 73.3 24.6 1,036.7 1,134.6 0.2 1,604.7
Katipunan 65.0 65.0 5.9 121.4 13.2 352.9 493.6 558.5
Lobogon 0.5 178.7 106.7 273.0 558.8 - 558.8
Mabuhay 130.0 130.0 4.4 200.3 204.6 334.7
Mahayahay - 6.2 2.7 5.8 150.1 164.9 164.9
n.a. ( 30199) 64.5 64.5 - 64.5
Quezon 44.6 44.6 7.2 198.8 205.9 250.5
San Fernando 646.4 11.3 1,089.9 1,747.6 1,186.3 1,186.3 0.6 2,934.4
San Jose 91.7 91.7 6.8 18.2 158.2 183.2 275.0
Sayak 126.5 143.7 185.5 455.7 3.3 41.8 45.1 500.9
Tuboran 34.9 34.9 1.1 115.9 117.0 152.0
Total 706.6 220.6 266.0 275.9 4,570.4 6,039.4 224.9 259.0 124.8 189.7 5,543.3 6,341.6 1.2 12,382.3
TotalNo Risk
Barangay
Agricultural Areas at Risk to Drought (ha)
HighLow
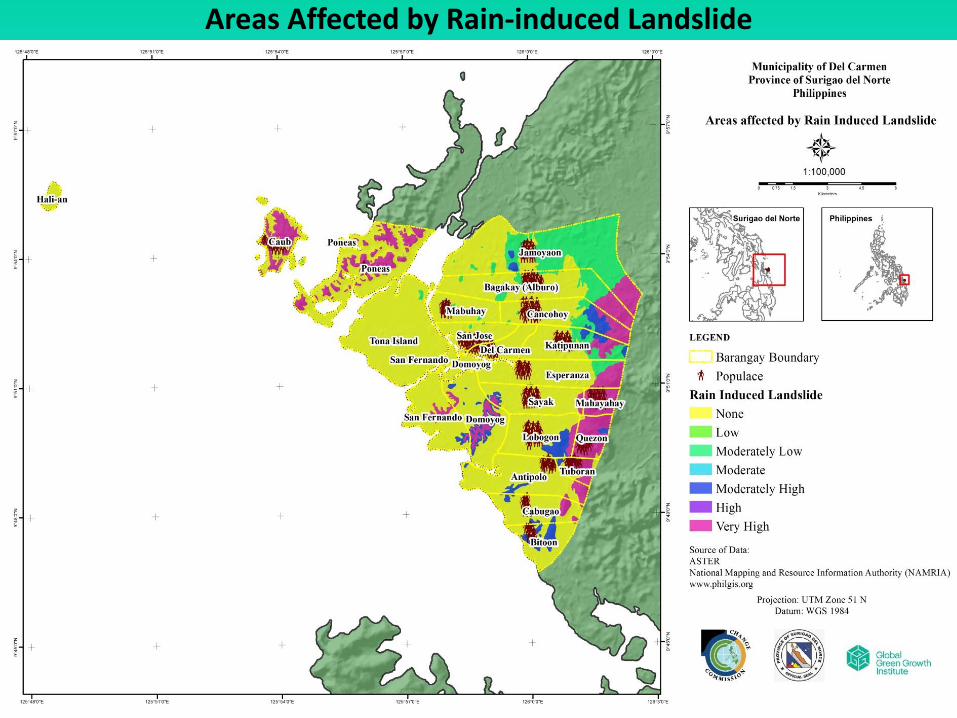
Areas Affected by Rain-induced Landslide
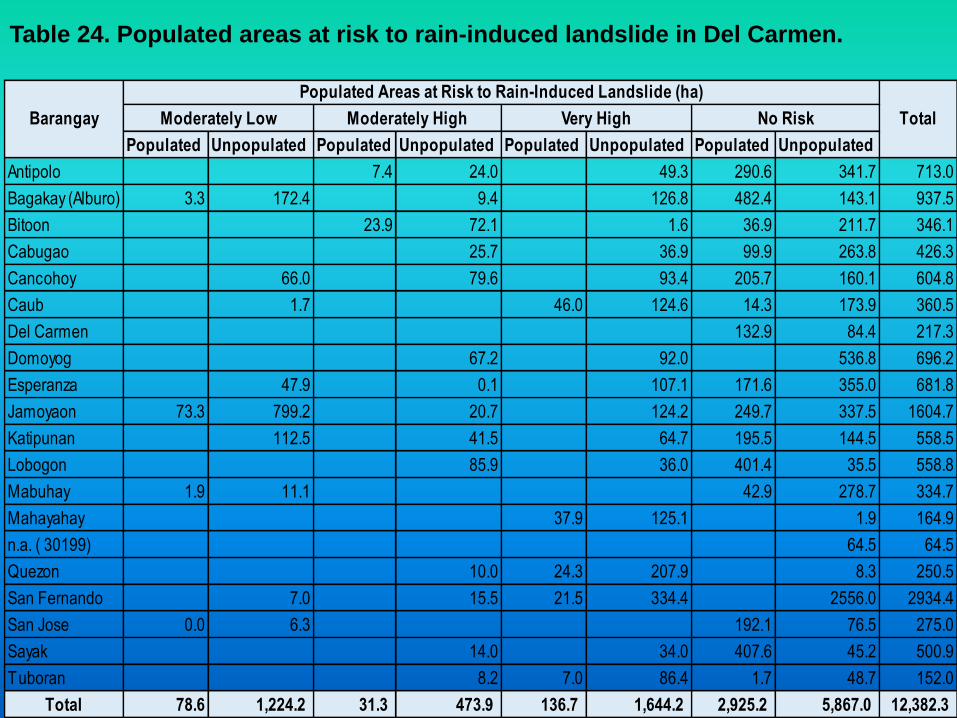
Table 24. Populated areas at risk to rain-induced landslide in Del Carmen.
Populated Unpopulated Populated Unpopulated Populated Unpopulated Populated Unpopulated
Antipolo 7.4 24.0 49.3 290.6 341.7 713.0
Bagakay (Alburo) 3.3 172.4 9.4 126.8 482.4 143.1 937.5
Bitoon 23.9 72.1 1.6 36.9 211.7 346.1
Cabugao 25.7 36.9 99.9 263.8 426.3
Cancohoy 66.0 79.6 93.4 205.7 160.1 604.8
Caub 1.7 46.0 124.6 14.3 173.9 360.5
Del Carmen 132.9 84.4 217.3
Domoyog 67.2 92.0 536.8 696.2
Esperanza 47.9 0.1 107.1 171.6 355.0 681.8
Jamoyaon 73.3 799.2 20.7 124.2 249.7 337.5 1604.7
Katipunan 112.5 41.5 64.7 195.5 144.5 558.5
Lobogon 85.9 36.0 401.4 35.5 558.8
Mabuhay 1.9 11.1 42.9 278.7 334.7
Mahayahay 37.9 125.1 1.9 164.9
n.a. ( 30199) 64.5 64.5
Quezon 10.0 24.3 207.9 8.3 250.5
San Fernando 7.0 15.5 21.5 334.4 2556.0 2934.4
San Jose 0.0 6.3 192.1 76.5 275.0
Sayak 14.0 34.0 407.6 45.2 500.9
Tuboran 8.2 7.0 86.4 1.7 48.7 152.0
Total 78.6 1,224.2 31.3 473.9 136.7 1,644.2 2,925.2 5,867.0 12,382.3
TotalBarangay Moderately Low Moderately High Very High No Risk
Populated Areas at Risk to Rain-Induced Landslide (ha)

Areas Affected by Storm Surge in Del Carmen
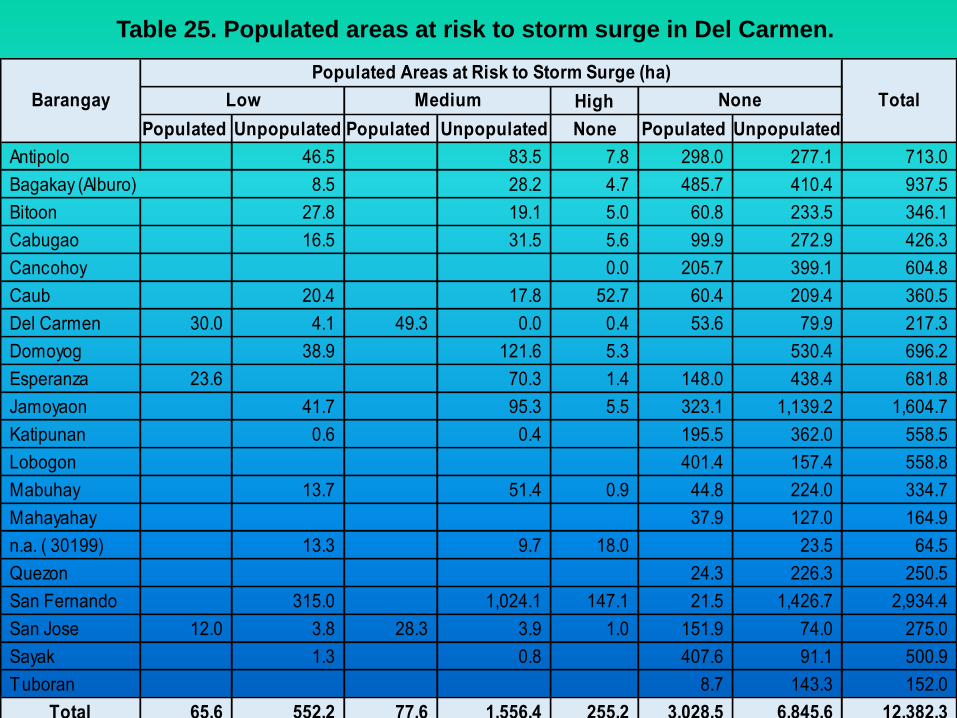
Table 25. Populated areas at risk to storm surge in Del Carmen.
High
Populated Unpopulated Populated Unpopulated None Populated Unpopulated
Antipolo 46.5 83.5 7.8 298.0 277.1 713.0
Bagakay (Alburo) 8.5 28.2 4.7 485.7 410.4 937.5
Bitoon 27.8 19.1 5.0 60.8 233.5 346.1
Cabugao 16.5 31.5 5.6 99.9 272.9 426.3
Cancohoy 0.0 205.7 399.1 604.8
Caub 20.4 17.8 52.7 60.4 209.4 360.5
Del Carmen 30.0 4.1 49.3 0.0 0.4 53.6 79.9 217.3
Domoyog 38.9 121.6 5.3 530.4 696.2
Esperanza 23.6 70.3 1.4 148.0 438.4 681.8
Jamoyaon 41.7 95.3 5.5 323.1 1,139.2 1,604.7
Katipunan 0.6 0.4 195.5 362.0 558.5
Lobogon 401.4 157.4 558.8
Mabuhay 13.7 51.4 0.9 44.8 224.0 334.7
Mahayahay 37.9 127.0 164.9
n.a. ( 30199) 13.3 9.7 18.0 23.5 64.5
Quezon 24.3 226.3 250.5
San Fernando 315.0 1,024.1 147.1 21.5 1,426.7 2,934.4
San Jose 12.0 3.8 28.3 3.9 1.0 151.9 74.0 275.0
Sayak 1.3 0.8 407.6 91.1 500.9
Tuboran 8.7 143.3 152.0
Total 65.6 552.2 77.6 1,556.4 255.2 3,028.5 6,845.6 12,382.3
Low Medium NoneBarangay
Populated Areas at Risk to Storm Surge (ha)
Total
LESSONS LEARNED • Local Government Units (LGUs) play an
important role in mainstreaming Climate Change Adaptation (CCA) strategies
• Attitude, commitment and competence of Local Chief Executives (LCEs) determine the level of success in Climate Change Adaptation strategies
• Local awareness and appreciation of the value of CCA determine the extent of support afforded by communities
• Local and indigenous knowledge complement science-based solutions to CC impacts

ACKNOWLEDGEMENT
The authors wish to thank the following:
• Philippine Climate Change Commission and the Climate Change Office
• Global Green Growth Initiatives
• Local Government of Del Carmen, Surigao del Norte
• University of the Philippines Los Banos
• Philippine Department of Science and Technology

THANK YOU!!!
Related Documents