SEMI-ANNUAL GROUNDWATER MONITORING REPORT Former Midway Petroleum Products (former Precision Valley Auto) 361 RIVER STREET SPRINGFIELD, VERMONT Vermont DEC Site #2000-2782 KAS # 408090349 December 2010 Prepared for: James Ballard 7 Juniper Hill Road Springfield, VT 05156 Phone Number: (802) 885-5090 Prepared by: 368 Avenue D, Suite #15 P.O. Box 787, Williston, Vermont 05495 (802) 383-0486 (ph), (802) 383-0490 (fax) www.kas-consulting.com

Welcome message from author
This document is posted to help you gain knowledge. Please leave a comment to let me know what you think about it! Share it to your friends and learn new things together.
Transcript

SEMI-ANNUAL GROUNDWATER MONITORING REPORT
Former Midway Petroleum Products
(former Precision Valley Auto) 361 RIVER STREET
SPRINGFIELD, VERMONT
Vermont DEC Site #2000-2782 KAS # 408090349
December 2010
Prepared for:
James Ballard 7 Juniper Hill Road
Springfield, VT 05156 Phone Number: (802) 885-5090
Prepared by:
368 Avenue D, Suite #15 P.O. Box 787, Williston, Vermont 05495
(802) 383-0486 (ph), (802) 383-0490 (fax) www.kas-consulting.com

Semi-Annual Groundwater Monitoring Report Former Midway Petroleum Products, Springfield, Vermont
December 2010 VTDEC Site #2000-2782
i
Table of Contents
1. INTRODUCTION..............................................................................................................................................1
2. SITE BACKGROUND ......................................................................................................................................1
3. GROUNDWATER FLOW DIRECTION AND GRADIENT .......................................................................1
4. GROUNDWATER SAMPLING AND ANALYSES ......................................................................................1
5. CONCLUSIONS ................................................................................................................................................2
6. RECOMMENDATIONS...................................................................................................................................2
APPENDICES Appendix A - Maps
1) Site Location Map 2) Site Map 3) Groundwater Contour Map 4) Contaminant Concentration Map
Appendix B – Liquid Level Monitoring Data Appendix C – Groundwater Quality Summary Appendix D – Laboratory Analytical Report

Semi-Annual Groundwater Monitoring Report Former Midway Petroleum Products, Springfield, Vermont
December 2010 1 VTDEC Site #2000-2782
1.0 INTRODUCTION This report summarizes the semi-annual groundwater monitoring conducted at the Former Midway Petroleum Products property (former Precision Valley Auto) located in Springfield, Vermont on October 21, 2010 (see Site Location Map, Appendix A). Semi-annual monitoring is being conducted by KAS, Inc. (KAS) for Mr. James Ballard, the owner of the Site, in accordance with recommendations made by KAS in the April 2010 Supplemental Site Investigation (SSI) and approved by Mr. Gerold Noyes of the Vermont Department of Environmental Conservation (VTDEC) in an electronic mail message dated June 14, 2010.
2.0 SITE BACKGROUND The site was a former gasoline station located in Springfield, VT. The suspected source of on-site contamination is believed to be two former gasoline underground storage tanks (USTs) and associated piping, removed from the site in June 2000. Affected sensitive receptors include groundwater, soil and utility corridors running adjacent to the site along River Street, and Carley Brook. This is the first round of semi-annual monitoring, which was requested by Mr. Noyes of the VTDEC.
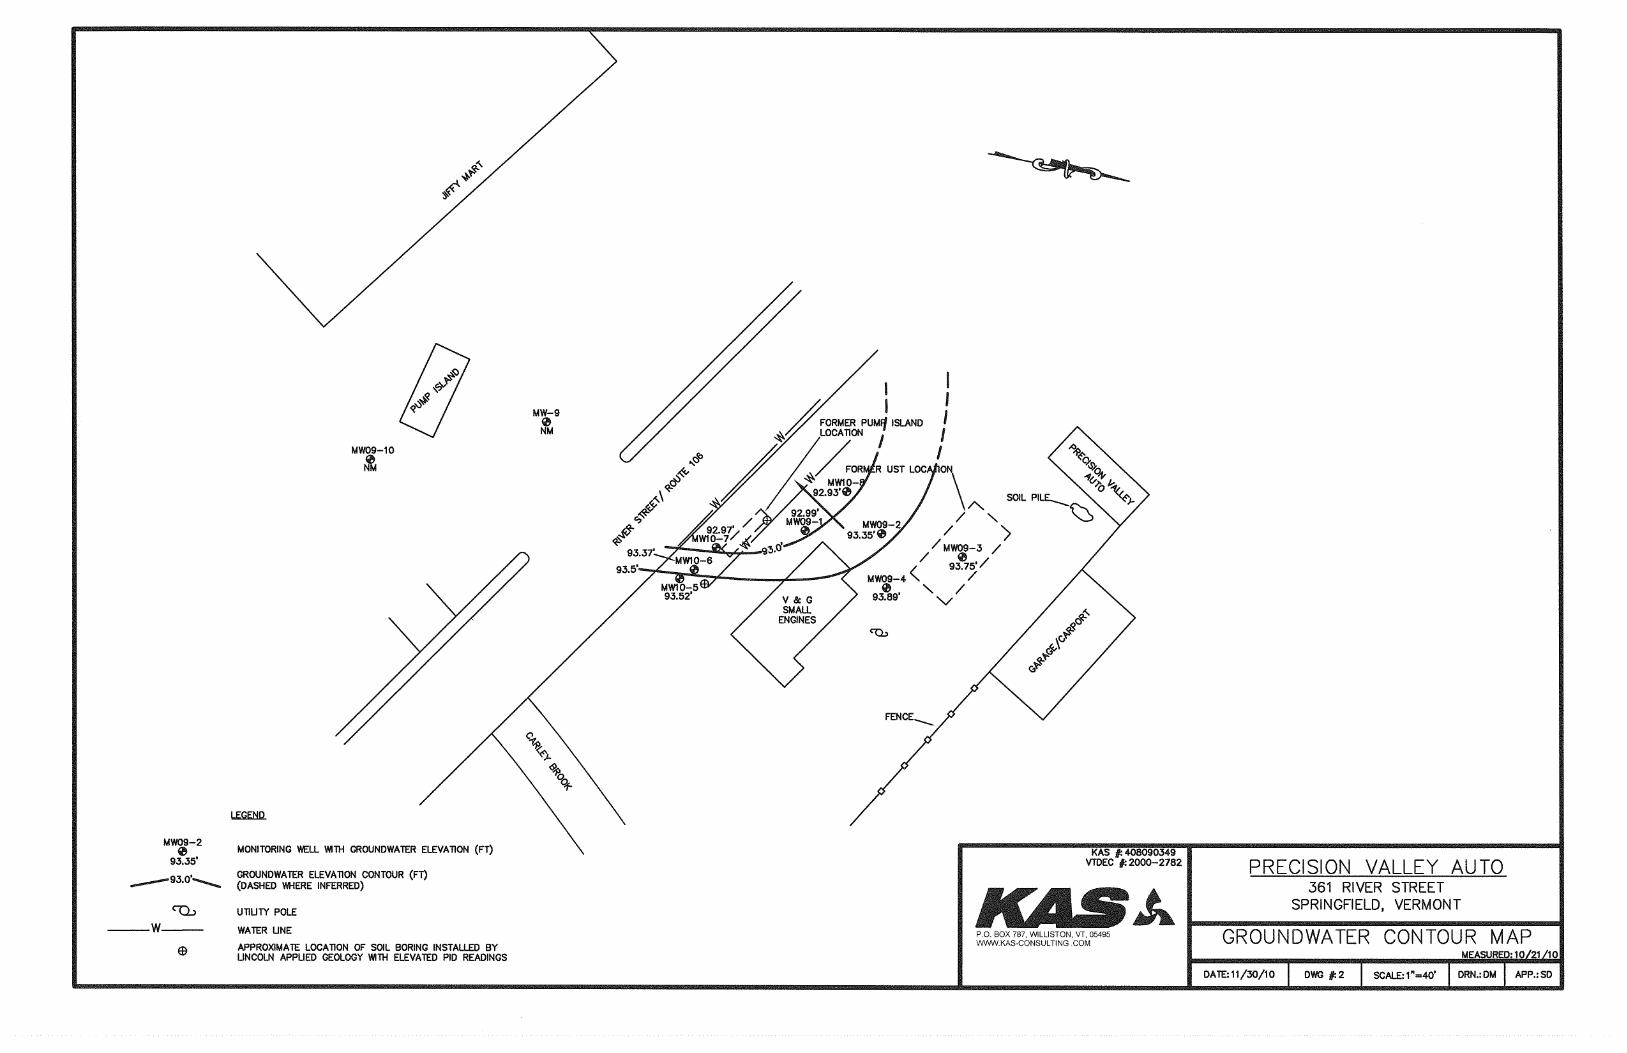
3.0 GROUNDWATER FLOW DIRECTION AND GRADIENT Water table elevation measurements were collected from all eight monitoring wells (MW09-1 through MW10-8) located on site on October 21, 2010. The depth-to-water measurements were subtracted from the top-of-casing elevation to obtain the relative water table elevation in the wells. The depth to water on this date ranged from 5.09 feet below top-of-casing (btoc) in MW09-3 to 7.28 feet btoc in MW10-7. In the eight wells measured the average depth to water was 6.27 feet btoc. No free product was observed in any of the wells during this sampling event. Liquid level monitoring data are presented in Appendix B. The water table elevations for the monitoring wells were plotted on the Site Map to generate the Groundwater Contour Map (see Appendix A). According to the data, groundwater is flowing to the southwest, towards the Black River, at an approximate hydraulic gradient of 2.1%. This groundwater flow direction and gradient is similar to previous results. 4.0 GROUNDWATER SAMPLING AND ANALYSES KAS collected groundwater samples from all eight monitoring wells (MW09-1 through MW10-8) located on site on October 21, 2010. The groundwater samples were collected according to KAS' groundwater sampling protocol, stored on ice in the field, and submitted to Endyne, Inc. of Williston, Vermont under proper chain-of-custody procedures. The groundwater samples were analyzed by EPA Method 8021B for the presence of benzene, toluene, ethylbenzene, and xylenes (BTEX), methyl tertiary butyl ether (MtBE), naphthalene, 1,3,5-trimethylbenzene (TMB), and 1,2,4-TMB. An analytical summary for each monitoring well is presented along with the applicable Vermont Groundwater Enforcement Standards (VGES) in Figure 1 below.

Semi-Annual Groundwater Monitoring Report Former Midway Petroleum Products, Springfield, Vermont
December 2010 VTDEC Site #2000-2782
2
Figure 1: Analytical Summary
VGES VOCs
MW09-1 MW09-2 MW09-3 MW09-4 ppb
Benzene 243 ND(1.0) ND(1.0) ND(1.0) 5 Toluene 234 ND(1.0) ND(1.0) ND(1.0) 1000 Ethylbenzene 222 ND(1.0) ND(1.0) ND(1.0) 700 Xylenes (total) 1,010 ND(2.0) ND(2.0) ND(2.0) 10000
TOTAL BTEX 1,709. ND ND ND - MtBE ND(20.0) ND(2.0) ND(2.0) ND(2.0) 40 1,3,5 & 1,2,4-TMB 621. 3.5 ND(1.0) ND(1.0) 350 Naphthalene 24.5 2.8 ND(2.0) ND(2.0) 20
TOTAL VOCs 2,355. 6.3 ND ND -
VGES VOCs
MW10-5 MW10-6 MW10-7 MW10-8 ppb
Benzene 40.1 36.1 66.0 1.1 5 Toluene ND(10.0) ND(1.0) 19.2 ND(1.0) 1000 Ethylbenzene 347 27.5 47.2 ND(1.0) 700 Xylenes (total) 383 10.0 135 ND(2.0) 10000
TOTAL BTEX 770.1 73.6 267.4 1.1 - MtBE ND(20.0) ND(2.0) ND(20.0) ND(2.0) 40 1,3,5 & 1,2,4-TMB 609 63.7 90.1 ND(1.0) 350 Naphthalene 45.3 6.3 ND(20.0) ND(2.0) 20
TOTAL VOCs 1,424.4 143.6 357.5 1.1 - According to the figure above, the highest contamination at the site appears to be in the vicinity of MW09-1 and MW10-5, which is located east of the former pump island (see Contaminant Distribution Map in Appendix A.). Contaminant concentrations detected in monitoring wells MW10-6 and MW10-7 report only Benzene as the compound above the VGES for this sampling event. No levels above the VGES were reported in the groundwater samples collected from MW09-2 and MW10-8 for this sampling event. Groundwater samples collected from MW09-3 and MW09-4 have reported non-detect levels of Volatile Organic Compounds (VOCs) since sampling began in these wells since October 2009. Analytical results of the groundwater samples from the monitoring wells are tabulated and graphed in Appendix C along with the applicable VGES for the target petroleum compounds. The laboratory analysis report for the October 21, 2010 sampling data is included in Appendix D.

Semi-Annual Groundwater Monitoring Report Former Midway Petroleum Products, Springfield, Vermont
December 2010 VTDEC Site #2000-2782
3
The contaminant concentrations reported for October 21, 2010 sampling event were plotted on the Site Map to generate the Contaminant Distribution Map presented in Appendix A. Based on these results, the extent of the contaminant plume is likely contained on the subject property. The potential still remains that the Carley Brook and utility corridor running adjacent to the site along River Street are at risk of petroleum contamination but it is unlikely at this time. One trip blank and one duplicate sample (MW10-5) were collected for quality assurance/quality control (QA/QC). The results of the duplicate sample analysis were analyzed using a relative percent difference (RPD) method. The RPD is defined as 100 times the difference between the sample result and the duplicate result, divided by the mean of the sample and duplicate result. The RPD calculations are presented in the Groundwater Quality Summary in Appendix C. The RPD ranged from 3.0% for Benzene to -1.8% for 1,3,5-TMB, with an overall RPD of -0.1%, indicating good precision. Because VOC contaminants were not detected in the trip blank, the effect of spurious influences on sample quality is considered insignificant. Screening of the soil stockpiled on site produced during the April 2010 drilling activities was screened during this site visit. PID readings were reported from 0.3 part per million (ppm) to 21.9 ppm. PID readings were above 1 ppm therefore the soils were covered and left on site. 5.0 CONCLUSION Based on the results of this groundwater monitoring at the Former Midway Petroleum Products property (former Precision Valley Auto) located in Springfield, Vermont, KAS presents the following conclusions: 1) The groundwater elevations measured on October 21, 2010 suggests groundwater is flowing
to the southwest, towards the Black River, at an approximate hydraulic gradient of 2.1%. This groundwater flow direction and gradient is similar to previous results;
2) The highest contamination at the site appears to be in the vicinity of MW09-1 and MW10-5,
which is located east of the former pump island. Contaminant concentrations detected in monitoring wells MW10-6 and MW10-7 report only Benzene as the compound above the VGES for this sampling event;
3) No levels above the VGES were reported in the groundwater samples collected from MW09-
2 and MW10-8 for this sampling event. Groundwater samples collected from MW09-3 and MW09-4 have reported non-detect levels of VOCs since sampling began in these well since October 2009;
4) The results of this groundwater monitoring sampling event suggest the extent of the
contaminant plume is likely contained on the subject property. However, the potential still remains that the Carley Brook and utility corridor running adjacent to the site along River Street are at risk of petroleum contamination but it is unlikely at this time; and

Semi-Annual Groundwater Monitoring Report Former Midway Petroleum Products, Springfield, Vermont
December 2010 VTDEC Site #2000-2782
4
5) Screening of the soil stockpiled on site produced during the April 2010 drilling activities was
screened during this site visit. PID readings were reported from 0.3 part per million (ppm) to 21.9 ppm. PID readings were above 1 ppm therefore the soils were covered and left on site.
6.0 RECOMMENDATIONS Groundwater sampling should continue on a semi-annual basis with the next sampling event to occur in April 2011. Groundwater samples should be collected from monitoring wells MW09-1, MW09-2, and MW10-5 through MW10-8. Monitoring well MW09-3 and MW09-4 should be taken off the sampling schedule due to VOC concentrations reported below the VGES since sampling began in October 2009. Groundwater samples collected should be submitted for laboratory analysis via EPA Method 8021B. No further investigation is recommended at this time. During the April 2011 sampling event, screening of the soil stockpile produced during the April 2010 drilling activates should be screened using a PID. If PID readings are below 1 part per million (ppm) the soil should be thin-spread across the site.

Groundwater Monitoring Report Former Midway Petroleum Products, Springfield, Vermont
December 2010 VTDEC Site #2000-2782
Maps

VTDEC Site #2000-2782
KAS Job Number: 4048090349
Source: USGS 7.5 minute quadrangle, Chester, VT, dated 1972.
Scale 1:24,000 Contour interval 20 Feet
Site Location Map
Jim Ballard’s Precision Valley Auto
Former Midway Petroleum Products, Inc.
361 River Street (Route 106)
Springfield, VT
Date: 8/5/09 Drawing: 1/1 Scale: 1” = 24,000’ By: JR
SITE LOCATION

Groundwater Monitoring Report Former Midway Petroleum Products, Springfield, Vermont
December 2010 VTDEC Site #2000-2782
Aerial Photograph of Former Midway Petroleum Products
Ref: Microsoft Terraserver
Subject Property


Groundwater Monitoring Report Former Midway Petroleum Products, Springfield, Vermont
December 2010 VTDEC Site #2000-2782
Liquid Level Monitoring Data

Former Midway Petroleum ProdcutsSpringfield, VT
Top of Depth To Depth To Specific Corrected CorrectedWell I.D. Well Depth Casing Product Water Product Gravity Water Depth Water Table
bgs Elevation btoc btoc Thickness Of Product Equivalent To Water ElevationMW09-1 13 100.00 - 7.01 - - - 7.01 92.99MW09-2 13 98.98 - 5.63 - - - 5.63 93.35MW09-3 13 98.84 - 5.09 - - - 5.09 93.75MW09-4 13 99.18 - 5.29 - - - 5.29 93.89MW10-5 12.5 100.27 - 6.75 - - - 6.75 93.52MW10-6 12.6 100.19 - 6.82 - - - 6.82 93.37MW10-7 12.5 100.25 - 7.28 - - - 7.28 92.97MW10-8 12.5 99.24 - 6.31 - - - 6.31 92.93
MW-9 11.10 100.89 - NM - - - NM NMMW09-10 14.45 98.68 - NM - - - NM NM
Notes: All Values Reported in Feet except specific gravitybtoc - Below Top of Casingbgs - Below Ground SurfaceTop of casing elevations surveyed by KAS on April 6, 2010Elevations determined relative to MW09-1, which was arbitarily set at 100'.NM = Not Measured
LIQUID LEVEL MONITORING DATA
Black River Jiffy Mart Monitoring Wells
Date: October 21, 2010
SMS #2000-2782KAS #408090349

Former Midway Petroleum ProdcutsSpringfield, VT
Well I.D. 10/6/09 4/14/10 10/21/10
MW09-1 92.69 93.18 92.99MW09-2 92.87 93.82 93.35MW09-3 93.46 94.16 93.75MW09-4 93.56 n/a 93.89MW10-5 - 93.45 93.52MW10-6 - 93.29 93.37MW10-7 - 93.14 92.97MW10-8 - 93.09 92.93
MW-9 - 92.44 NMMW09-10 - 91.38 NM
Notes: All Values Reported in Feet except specific gravitybtoc - Below Top of Casingbgs - Below Ground SurfaceTop of casing elevations surveyed by KAS on April 6, 2010Elevations determined relative to MW09-1, which was arbitarily set at 100'.NM = Not Measured
HISTORIC GROUNDWATER ELEVATION
Black River Jiffy Mart Monitoring Wells
SMS #2000-2782KAS #408090349

Groundwater Monitoring Report Former Midway Petroleum Products, Springfield, Vermont
December 2010 VTDEC Site #2000-2782
Groundwater Quality Summary Data

GROUNDWATER QUALITY SUMMARY Former Midway Petroleum ProductsSpringfield, VT
MW09-1Sample Date: 10/6/2009 4/14/2010 10/21/2010 VGES
Analytical Method: 8260B 8260B 8021BVOCs Units: ppb ppb ppb ppbBenzene 279. 106. 243 5Toluene 304. 220. 234 1000Ethylbenzene 553. 179. 222 700Xylenes (total) 2,590. 780. 1,010 10000TOTAL BTEX 3,726. 1,285. 1,709. -MtBE ND(40.0) ND(200.0) ND(20.0) 401,3,5 & 1,2,4-TMB 1,400. 507. 621. 350Naphthalene 56.0 ND(200.0) 24.5 20n-Propylbenzene 222. - - -Isopropylbenzene 73.6 - - -n-Butylbenzene 38.8 - - -TOTAL TARGETED VOCs 5,516. 1,792. 2,355. -
Analytical Method: 8015-GROTPH Units: ppmTotal Petroleum Hydrocarbons 21.5 - - No VGES
Only Method 8021B compounds and reported compounds are included in the tableAll Values Reported in ug/L (ppb) except for TPH which is reported in mg/L (ppm)ND(1) - None Detected above Detection Limit (Detection Limit)TBQ(1) - Trace Below Quantitation Limit (Quantitation Limit)Detections are bolded.Blank cell - not analyzedVGES - Vermont Groundwater Enforcement Standard; VTDEC Groundwater Protection Rule and Strategy, 2/14/05 and revised (TMB, Dioxane, and Manganese) on 2/26/07.
> VGES values greater than current standards are shaded
MW09-1
0.
1,000.
2,000.
3,000.
4,000.
5,000.
6,000.
7,000.
8,000.
Jan-09 Jan-10 Jan-11
Date
Tota
l Tar
gete
d VO
Cs
90.
91.
92.
93.
94.
Wat
er E
leva
tion
(ft)
TOTAL TARGETED VOCs Water Elevation
SMS #2000-2782KAS #408090349

GROUNDWATER QUALITY SUMMARY Former Midway Petroleum ProductsSpringfield, VT
MW09-2Sample Date: 10/6/2009 4/14/2010 10/21/2010 VGES
Analytical Method: 8260B 8260B 8021BVOCs Units: ppb ppb ppb ppbBenzene ND(1.0) ND(5.0) ND(1.0) 5Toluene ND(1.0) ND(5.0) ND(1.0) 1000Ethylbenzene 4.1 5.9 ND(1.0) 700Xylenes (total) 24.1 24.1 ND(2.0) 10000TOTAL BTEX 28.2 30.0 ND -MtBE ND(2.0) ND(10.0) ND(2.0) 401,3,5 & 1,2,4-TMB 68.8 121.8 3.5 350Naphthalene 21.1 39.9 2.8 20n-Propylbenzene 4.1 - - -Isopropylbenzene 3.0 - - -4-Isopropyltoluene 3.9 - - -s-Butylbenzene 2.7 - - -n-Butylbenzene 4.0 - - -1,4-Dichlorobenzene 2.0 - - -TOTAL TARGETED VOCs 137.8 191.7 6.3 -
Analytical Method: 8015-GROTPH Units: ppmTotal Petroleum Hydrocarbons 1.42 - - No VGES
Only Method 8021B compounds and reported compounds are included in the tableAll Values Reported in ug/L (ppb) except for TPH which is reported in mg/L (ppm)ND(1) - None Detected above Detection Limit (Detection Limit)TBQ(1) - Trace Below Quantitation Limit (Quantitation Limit)Detections are bolded.Blank cell - not analyzedVGES - Vermont Groundwater Enforcement Standard; VTDEC Groundwater Protection Rule and Strategy, 2/14/05 and revised (TMB, Dioxane, and Manganese) on 2/26/07.
> VGES values greater than current standards are shaded
MW09-2
0.
50.
100.
150.
200.
Jan-09 Jan-10 Jan-11
Date
Tota
l Tar
gete
d VO
Cs
90.
91.
92.
93.
94.
Wat
er E
leva
tion
(ft)
TOTAL TARGETED VOCs Water Elevation
SMS #2000-2782KAS #408090349

GROUNDWATER QUALITY SUMMARY Fromer Midway Petroleum ProductsSpringfield, VT
MW09-3Sample Date: 10/6/2009 4/14/2010 10/21/2010 VGES
Analytical Method: 8260B 8260B 8021BVOCs Units: ppb ppb ppb ppbBenzene ND(1.0) ND(1.0) ND(1.0) 5Toluene ND(1.0) ND(1.0) ND(1.0) 1000Ethylbenzene ND(1.0) ND(1.0) ND(1.0) 700Xylenes (total) ND(2.0) ND(2.0) ND(2.0) 10000TOTAL BTEX ND ND ND -MtBE ND(2.0) ND(2.0) ND(2.0) 401,3,5 & 1,2,4-TMB ND(2.0) ND(1.0) ND(1.0) 350Naphthalene ND(2.0) ND(2.0) ND(2.0) 20TOTAL TARGETED VOCs ND ND ND -
Analytical Method: 8015-GROTPH Units: ppmTotal Petroleum Hydrocarbons ND(0.20) - - No VGES
Only Method 8021B compounds and reported compounds are included in the tableAll Values Reported in ug/L (ppb) except for TPH which is reported in mg/L (ppm)ND(1) - None Detected above Detection Limit (Detection Limit)TBQ(1) - Trace Below Quantitation Limit (Quantitation Limit)Detections are bolded.Blank cell - not analyzedVGES - Vermont Groundwater Enforcement Standard; VTDEC Groundwater Protection Rule and Strategy, 2/14/05 and revised (TMB, Dioxane, and Manganese) on 2/26/07.
> VGES values greater than current standards are shaded
MW09-3
0.
50.
100.
150.
200.
Jan-09 Jan-10 Jan-11
Date
Tota
l Tar
gete
d VO
Cs
90.
91.
92.
93.
94.
95.
Wat
er E
leva
tion
(ft)
TOTAL TARGETED VOCs Water Elevation
SMS #2000-2782KAS #408090349

GROUNDWATER QUALITY SUMMARY Former Midway Petroleum ProductsSpringfield, VT
MW09-4Sample Date: 10/6/2009 4/14/2010 10/21/2010 VGES
Analytical Method: 8260B 8260B 8021BVOCs Units: ppb ppb ppb ppbBenzene ND(1.0) ND(1.0) 5. Toluene ND(1.0) ND(1.0) 1,000. Ethylbenzene ND(1.0) ND(1.0) 700. Xylenes (total) ND(2.0) ND(2.0) 10,000. TOTAL BTEX ND ND -MtBE ND(2.0) ND(2.0) 40. 1,3,5 & 1,2,4-TMB ND(2.0) ND(1.0) 350. Naphthalene ND(2.0) ND(2.0) 20. TOTAL TARGETED VOCs ND ND -
Analytical Method: 8015-GROTPH Units: ppmTotal Petroleum Hydrocarbons 2.70 - - No VGES
Only Method 8021B compounds and reported compounds are included in the tableAll Values Reported in ug/L (ppb) except for TPH which is reported in mg/L (ppm)ND(1) - None Detected above Detection Limit (Detection Limit)TBQ(1) - Trace Below Quantitation Limit (Quantitation Limit)Detections are bolded.Blank cell - not analyzedVGES - Vermont Groundwater Enforcement Standard; VTDEC Groundwater Protection Rule and Strategy , 2/14/05 and revised (TMB, Dioxane, and Manganese) on 2/26/07.
> VGES values greater than current standards are shaded
Well Not Located
MW09-4
0.
50.
100.
150.
200.
Jan-09 Jan-10 Jan-11
Date
Tota
l Tar
gete
d VO
Cs
92.
93.
94.
95.
Wat
er E
leva
tion
(ft)
TOTAL TARGETED VOCs Water Elevation
SMS #2000-2782KAS #408090349

GROUNDWATER QUALITY SUMMARY Former Midway Petroleum ProductsSpringfield, VT
MW10-5Sample Date: 4/14/2010 10/21/2010 VGES
Analytical Method: 8260B 8021BVOCs Units: ppb ppb ppbBenzene ND(10.0) 40.1 5. Toluene ND(10.0) ND(10.0) 1,000. Ethylbenzene 94.0 347 700. Xylenes (total) 195. 383 10,000. TOTAL BTEX 289. 770.1 -MtBE ND(20.0) ND(20.0) 40. 1,3,5 & 1,2,4-TMB 561.1 609 350. Naphthalene 25.0 45.3 20. TOTAL TARGETED VOCs 875.1 1,424.4 -
Only Method 8021B compounds and reported compounds are included in the tableAll Values Reported in ug/L (ppb)ND(1) - None Detected above Detection Limit (Detection Limit)TBQ(1) - Trace Below Quantitation Limit (Quantitation Limit)Detections are bolded.Blank cell - not analyzedVGES - Vermont Groundwater Enforcement Standard; VTDEC Groundwater Protection Rule and Strategy , 2/14/05 and revised (TMB, Dioxane, and Manganese) on 2/26/07.
> VGES values greater than current standards are shaded
MW10-5
0.
250.
500.
750.
1,000.
1,250.
1,500.
Jan-10 Jan-11Date
Tota
l Tar
gete
d VO
Cs
93.
94.
95.
Wat
er E
leva
tion
(ft)
TOTAL TARGETED VOCs Water Elevation

GROUNDWATER QUALITY SUMMARY Former Midway Petroleum ProductsSpringfield, VT
MW10-6Sample Date: 4/14/2010 10/21/2010 VGES
Analytical Method: 8260B 8021BVOCs Units: ppb ppb ppbBenzene 3.5 36.1 5. Toluene ND(1.0) ND(1.0) 1,000. Ethylbenzene 1.6 27.5 700. Xylenes (total) ND(2.0) 10.0 10,000. TOTAL BTEX 5.1 73.6 -MtBE ND(2.0) ND(2.0) 40. 1,3,5 & 1,2,4-TMB 1.9 63.7 350. Naphthalene ND(2.0) 6.3 20. TOTAL TARGETED VOCs 7.0 143.6 -
Only Method 8021B compounds and reported compounds are included in the tableAll Values Reported in ug/L (ppb) ND(1) - None Detected above Detection Limit (Detection Limit)TBQ(1) - Trace Below Quantitation Limit (Quantitation Limit)Detections are bolded.Blank cell - not analyzedVGES - Vermont Groundwater Enforcement Standard; VTDEC Groundwater Protection Rule and Strategy , 2/14/05 and revised (TMB, Dioxane, and Manganese) on 2/26/07.
> VGES values greater than current standards are shaded
MW10-6
0.
50.
100.
150.
200.
250.
Jan-10 Jan-11Date
Tota
l Tar
gete
d VO
Cs
93.
94.
95.
Wat
er E
leva
tion
(ft)
TOTAL TARGETED VOCs Water Elevation

GROUNDWATER QUALITY SUMMARY Former Midway Petroleum ProductsSpringfield, VT
MW10-7Sample Date: 4/14/2010 10/21/2010 VGES
Analytical Method: 8260B 8021BVOCs Units: ppb ppb ppbBenzene ND(20.0) 66.0 5. Toluene 29.4 19.2 1,000. Ethylbenzene 23.0 47.2 700. Xylenes (total) 106. 135 10,000. TOTAL BTEX 158.4 267 -MtBE ND(40.0) ND(20.0) 40. 1,3,5 & 1,2,4-TMB 55.2 90.1 350. Naphthalene ND(40.0) ND(20.0) 20. TOTAL TARGETED VOCs 213.6 357 -
Only Method 8021B compounds and reported compounds are included in the tableAll Values Reported in ug/L (ppb) ND(1) - None Detected above Detection Limit (Detection Limit)TBQ(1) - Trace Below Quantitation Limit (Quantitation Limit)Detections are bolded.Blank cell - not analyzedVGES - Vermont Groundwater Enforcement Standard; VTDEC Groundwater Protection Rule and Strategy , 2/14/05 and revised (TMB, Dioxane, and Manganese) on 2/26/07.
> VGES values greater than current standards are shaded
MW10-7
0.
50.
100.
150.
200.
250.
300.
350.
400.
450.
500.
Jan-10 Jan-11Date
Tota
l Tar
gete
d VO
Cs
92.
93.
94.
Wat
er E
leva
tion
(ft)
TOTAL TARGETED VOCs Water Elevation

GROUNDWATER QUALITY SUMMARY Former Midway Petroleum ProductsSpringfield, VT
MW10-8Sample Date: 4/14/2010 10/21/2010 VGES
Analytical Method: 8260B 8260BVOCs Units: ppb ppb ppbBenzene 20.4 1.1 5. Toluene ND(1.0) ND(1.0) 1,000. Ethylbenzene 1.0 ND(1.0) 700. Xylenes (total) 34.5 ND(2.0) 10,000. TOTAL BTEX 55.9 1.1 -MtBE ND(2.0) ND(2.0) 40. 1,3,5 & 1,2,4-TMB 17. ND(1.0) 350. Naphthalene ND(2.0) ND(2.0) 20. TOTAL TARGETED VOCs 72.9 1.1 -
Only Method 8021B compounds and reported compounds are included in the tableAll Values Reported in ug/L (ppb)ND(1) - None Detected above Detection Limit (Detection Limit)TBQ(1) - Trace Below Quantitation Limit (Quantitation Limit)Detections are bolded.Blank cell - not analyzedVGES - Vermont Groundwater Enforcement Standard; VTDEC Groundwater Protection Rule and Strategy , 2/14/05 and revised (TMB, Dioxane, and Manganese) on 2/26/07.
> VGES values greater than current standards are shaded
MW10-8
0.
25.
50.
75.
100.
125.
150.
Jan-10 Jan-11Date
Tota
l Tar
gete
d VO
Cs
92.
93.
94.
Wat
er E
leva
tion
(ft)
TOTAL TARGETED VOCs Water Elevation

GROUNDWATER QUALITY SUMMARY Former Midway Petroleum ProdcutsSpringfield, VT
Trip Blank Duplicate MW10-5 RPD *Sample Date: 10/19/2010 10/21/2010 10/21/2010 % VGES
Analytical Method: 8021B 8021B 8021BPARAMETER (ppb)Benzene ND(1.0) 38.9 40.1 3.0 5Toluene ND(1.0) ND(10.0) ND(10.0) - 1000Ethylbenzene ND(1.0) 342 347 1.5 700Xylenes ND(2.0) 380 383 0.8 10000Total BTEX ND 760 770. 1.3 - MtBE ND(2.0) ND(20.0) ND(20.0) - 401,3,5-Trimethylbenzene ND(1.0) 113 111 -1.81,2,4-Trimethylbenzene ND(1.0) 506 498 -1.6Naphthalene ND(2.0) 45.5 45.3 -0.4 20Total M8021B Targeted VOCs ND 1,425. 1,424. 0.0 -
All Values Reported in ug/L (ppb), except RPD which is reported as a percentageNM - Not MeasuredND(1) - None Detected above Detection Limit (Detection Limit)TBQ(1) - Trace Below Quantitation Limit (Quantitation Limit)Detections are bolded.Blank cell - not analyzedVGES - Vermont Groundwater Enforcement Standard; VTDEC Groundwater Protection Rule and Strategy , dated 2/14/05
>VGES
QUALITY ASSURANCE / QUALITY CONTROL (QA/QC) SAMPLES
* RPD = The results of the laboratory analysis of the duplicate sample were analyzed using a relative percent difference (RPD) analysis. The RPD is defined as 100 times the difference in reported concentration between sample and duplicate, divided by the mean of the two samples. A small RPD indicates good correlation between sample and duplicate.
350
SMS #2000-2782KAS #408090349

Groundwater Monitoring Report Former Midway Petroleum Products, Springfield, Vermont
December 2010 VTDEC Site #2000-2782
Groundwater Analytical Reports

Laboratory Report
408090349 Precision Valley A.PROJECT:
DATE RECEIVED:WORK ORDER:
DATE REPORTED:
100306KAS, Inc.PO Box 787Williston, VT 05495
SAMPLER:October 29, 2010
1010-14770
Alan
October 22, 2010
Enclosed please find the results of the analyses performed for the samples referenced on the attached chain of custody located at the end of this report.
The column labeled Lab/Tech in the accompanying report denotes the laboratory facility where the testing was performed and the technician who conducted the assay. A "W" designates the Williston, VT lab under NELAC certification ELAP 11263; "R" designates the Lebanon, NH facility under certification NH 2037 and “N” the Plattsburgh, NY lab under certification ELAP 11892. “Sub” indicates the testing was performed by a subcontracted laboratory. The accreditation status of the subcontracted lab is referenced in the corresponding NELAC and Qual fields.
This NELAC column also denotes the accreditation status of each laboratory for each
reported parameter. “A” indicates the referenced laboratory is NELAC accredited for the parameter reported. “N” indicates the laboratory is not accredited. “U” indicates that NELAC does not offer accreditation for that parameter in that specific matrix. Test results denoted with an “A” meet all National Environmental Laboratory Accreditation Program requirements except where denoted by pertinent data qualifiers. Test results are representative of the samples as they were received at the laboratory.
Endyne, Inc. warrants, to the best of its knowledge and belief, the accuracy of the analytical
test results contained in this report, but makes no other warranty, expressed or implied, especially no warranties of merchantability or fitness for a particular purpose.
Reviewed by:
Harry B. Locker, Ph.D.Laboratory Director
160 James Brown Dr., Williston, VT 05495Ph 802-879-4333 Fax 802-879-7103
ELAP 11263
www.endynelabs.com
NH203756 Etna Road, Lebanon, NH 03766 Ph 603-678-4891 Fax 603-678-4893

Laboratory Report
KAS, Inc.
Page 2 of 3
CLIENT:PROJECT: 408090349 Precision Valley A.
WORK ORDER:DATE RECEIVED:
1010-1477010/22/2010
10/29/2010REPORT DATE:
001 Date Sampled: 10/21/10Site: MW09-1 10/27/10 KAWWAnalysis Date:11:24QualNelacUnitResultParameterQualNelacUnitResultParameter
TEST METHOD: EPA 8021B
< 20.0 NMethyl-t-butyl ether (MTBE) ug/L 243 NBenzene ug/L234 NToluene ug/L 222 NEthylbenzene ug/L
1,010 NXylenes, Total ug/L 185 N1,3,5-Trimethylbenzene ug/L436 N1,2,4-Trimethylbenzene ug/L 24.5 NNaphthalene ug/L107 NSurr. 1 (Bromobenzene) % > 10 NUnidentified Peaks
002 Date Sampled: 10/21/10Site: MW09-2 10/27/10 KAWWAnalysis Date:11:45QualNelacUnitResultParameterQualNelacUnitResultParameter
TEST METHOD: EPA 8021B
< 2.0 NMethyl-t-butyl ether (MTBE) ug/L < 1.0 NBenzene ug/L< 1.0 NToluene ug/L < 1.0 NEthylbenzene ug/L< 2.0 NXylenes, Total ug/L < 1.0 N1,3,5-Trimethylbenzene ug/L3.5 N1,2,4-Trimethylbenzene ug/L 2.8 NNaphthalene ug/L97 NSurr. 1 (Bromobenzene) % > 10 NUnidentified Peaks
003 Date Sampled: 10/21/10Site: MW09-3 10/27/10 KAWWAnalysis Date:12:25QualNelacUnitResultParameterQualNelacUnitResultParameter
TEST METHOD: EPA 8021B
< 2.0 NMethyl-t-butyl ether (MTBE) ug/L < 1.0 NBenzene ug/L< 1.0 NToluene ug/L < 1.0 NEthylbenzene ug/L< 2.0 NXylenes, Total ug/L < 1.0 N1,3,5-Trimethylbenzene ug/L< 1.0 N1,2,4-Trimethylbenzene ug/L < 2.0 NNaphthalene ug/L
97 NSurr. 1 (Bromobenzene) % 0 NUnidentified Peaks
004 Date Sampled: 10/21/10Site: MW09-4 10/27/10 KAWWAnalysis Date:12:03QualNelacUnitResultParameterQualNelacUnitResultParameter
TEST METHOD: EPA 8021B
< 2.0 NMethyl-t-butyl ether (MTBE) ug/L < 1.0 NBenzene ug/L< 1.0 NToluene ug/L < 1.0 NEthylbenzene ug/L< 2.0 NXylenes, Total ug/L < 1.0 N1,3,5-Trimethylbenzene ug/L< 1.0 N1,2,4-Trimethylbenzene ug/L < 2.0 NNaphthalene ug/L103 NSurr. 1 (Bromobenzene) % 0 NUnidentified Peaks
005 Date Sampled: 10/21/10Site: MW10-5 10/27/10 KAWWAnalysis Date:10:03QualNelacUnitResultParameterQualNelacUnitResultParameter
TEST METHOD: EPA 8021B
< 20.0 NMethyl-t-butyl ether (MTBE) ug/L 40.1 NBenzene ug/L< 10.0 NToluene ug/L 347 NEthylbenzene ug/L
383 NXylenes, Total ug/L 111 N1,3,5-Trimethylbenzene ug/L498 N1,2,4-Trimethylbenzene ug/L 45.3 NNaphthalene ug/L88 NSurr. 1 (Bromobenzene) % > 10 NUnidentified Peaks

Laboratory Report
KAS, Inc.
Page 3 of 3
CLIENT:PROJECT: 408090349 Precision Valley A.
WORK ORDER:DATE RECEIVED:
1010-1477010/22/2010
10/29/2010REPORT DATE:
006 Date Sampled: 10/21/10Site: Duplicate 10/27/10 KAWWAnalysis Date:10:03QualNelacUnitResultParameterQualNelacUnitResultParameter
TEST METHOD: EPA 8021B
< 20.0 NMethyl-t-butyl ether (MTBE) ug/L 38.9 NBenzene ug/L< 10.0 NToluene ug/L 342 NEthylbenzene ug/L
380 NXylenes, Total ug/L 113 N1,3,5-Trimethylbenzene ug/L506 N1,2,4-Trimethylbenzene ug/L 45.5 NNaphthalene ug/L88 NSurr. 1 (Bromobenzene) % > 10 NUnidentified Peaks
007 Date Sampled: 10/21/10Site: MW10-6 10/27/10 KAWWAnalysis Date:10:25QualNelacUnitResultParameterQualNelacUnitResultParameter
TEST METHOD: EPA 8021B
< 2.0 NMethyl-t-butyl ether (MTBE) ug/L 36.1 NBenzene ug/L< 1.0 NToluene ug/L 27.5 NEthylbenzene ug/L10.0 NXylenes, Total ug/L 1.4 N1,3,5-Trimethylbenzene ug/L62.3 N1,2,4-Trimethylbenzene ug/L 6.3 NNaphthalene ug/L81 NSurr. 1 (Bromobenzene) % > 10 NUnidentified Peaks
008 Date Sampled: 10/21/10Site: MW10-7 10/27/10 KAWWAnalysis Date:10:45QualNelacUnitResultParameterQualNelacUnitResultParameter
TEST METHOD: EPA 8021B
< 20.0 NMethyl-t-butyl ether (MTBE) ug/L 66.0 NBenzene ug/L19.2 NToluene ug/L 47.2 NEthylbenzene ug/L135 NXylenes, Total ug/L 26.2 N1,3,5-Trimethylbenzene ug/L63.9 N1,2,4-Trimethylbenzene ug/L < 20.0 NNaphthalene ug/L98 NSurr. 1 (Bromobenzene) % > 10 NUnidentified Peaks
009 Date Sampled: 10/21/10Site: MW10-8 10/27/10 KAWWAnalysis Date:11:05QualNelacUnitResultParameterQualNelacUnitResultParameter
TEST METHOD: EPA 8021B
< 2.0 NMethyl-t-butyl ether (MTBE) ug/L 1.1 NBenzene ug/L< 1.0 NToluene ug/L < 1.0 NEthylbenzene ug/L< 2.0 NXylenes, Total ug/L < 1.0 N1,3,5-Trimethylbenzene ug/L< 1.0 N1,2,4-Trimethylbenzene ug/L < 2.0 NNaphthalene ug/L
97 NSurr. 1 (Bromobenzene) % 0 NUnidentified Peaks
010 Date Sampled: 10/19/10Site: Trip Blank 10/27/10 KAWWAnalysis Date:15:00QualNelacUnitResultParameterQualNelacUnitResultParameter
TEST METHOD: EPA 8021B
< 2.0 NMethyl-t-butyl ether (MTBE) ug/L < 1.0 NBenzene ug/L< 1.0 NToluene ug/L < 1.0 NEthylbenzene ug/L< 2.0 NXylenes, Total ug/L < 1.0 N1,3,5-Trimethylbenzene ug/L< 1.0 N1,2,4-Trimethylbenzene ug/L < 2.0 NNaphthalene ug/L
93 NSurr. 1 (Bromobenzene) % 0 NUnidentified Peaks

Related Documents