SELF-RATED HEALTH AND MORTALITY AMONG THE ELDERLY IN MATLAB, BANGLADESH* NOBUKO MIZOGUCHI 1. Introduction Self-reported health status has been well established in industrialized settings as a valid and reliable measure that fairly accurately predicts mortality[5]. In developing countries, however, the validity of self-reported health has been questioned. Sen in his commentary, points to the deficiencies of self-reported measures. Citing the incongruity between life expectancy and self-perceived health status in the Indian states of Kerala and Bihar as examples, he argues that people’s assessment of their own health status is limited by their social experience. In the state of Bihar, life expectancy is low but people report lower rates of morbidity. In Kerala, on the other hand, life expectancy is higher, but self-reported rates of morbidity are also higher. He reasons that in Bihar, people have low perception of illness because literacy level is low and medical infrastructure is poor, but the actual disease burden may be high. Therefore, he concludes, self-reported morbidity can be a misleading.[15] While Sen may be correct in that one’s perception of own health status is limited by social experience, what remains unclear is what these social experiences may be that colors one’s perception of health, how they work, and how self reports of health may predict own mortality in developing country settings. In his example, Sen cites low literacy as a reason for low health perception. However, a number of studies from developing countries contradicts this perception. A study in India observed that people with no education showed the highest odds of reporting poor health compared to those with the highest level of education among the elderly. [16] Similarly, in Bangladesh, people with no formal education were significantly more likely to report poor health compared to those with more than six years of education. Furthermore, those who were in the lowest three socioeconomic quintiles were more likely to report bad or very bad health. [14] In Malaysia, those who were illiterate were more likely to report worse health status, but only in the Chinese population. [18] In addition, both higher education and greater household assets *Preliminary work. Please do not cite without permission from the author. 1

Welcome message from author
This document is posted to help you gain knowledge. Please leave a comment to let me know what you think about it! Share it to your friends and learn new things together.
Transcript
SELF-RATED HEALTH AND MORTALITY AMONG THEELDERLY IN MATLAB, BANGLADESH*
NOBUKO MIZOGUCHI
1. Introduction
Self-reported health status has been well established in industrialized settings as avalid and reliable measure that fairly accurately predicts mortality[5]. In developingcountries, however, the validity of self-reported health has been questioned. Senin his commentary, points to the deficiencies of self-reported measures. Citing theincongruity between life expectancy and self-perceived health status in the Indianstates of Kerala and Bihar as examples, he argues that people’s assessment of theirown health status is limited by their social experience. In the state of Bihar, lifeexpectancy is low but people report lower rates of morbidity. In Kerala, on the otherhand, life expectancy is higher, but self-reported rates of morbidity are also higher.He reasons that in Bihar, people have low perception of illness because literacy levelis low and medical infrastructure is poor, but the actual disease burden may be high.Therefore, he concludes, self-reported morbidity can be a misleading.[15]
While Sen may be correct in that one’s perception of own health status is limitedby social experience, what remains unclear is what these social experiences may bethat colors one’s perception of health, how they work, and how self reports of healthmay predict own mortality in developing country settings.
In his example, Sen cites low literacy as a reason for low health perception. However,a number of studies from developing countries contradicts this perception. A studyin India observed that people with no education showed the highest odds of reportingpoor health compared to those with the highest level of education among the elderly.[16] Similarly, in Bangladesh, people with no formal education were significantlymore likely to report poor health compared to those with more than six years ofeducation. Furthermore, those who were in the lowest three socioeconomic quintileswere more likely to report bad or very bad health. [14] In Malaysia, those who wereilliterate were more likely to report worse health status, but only in the Chinesepopulation. [18] In addition, both higher education and greater household assets
*Preliminary work. Please do not cite without permission from the author.1
2 NOBUKO MIZOGUCHI
increased the probability of reporting good health in the Philippines, Thailand, andTaiwan. [20]
A couple of studies from Africa show no relationship between education and poorself-reported health. In the Khanasa-Nankana District of Ghana, having some formaleducation showed no significant relationship to self-reported health after functionalability was taken into account, although those in the lowest two socioeconomic quin-tiles were more likely to report poor health. [2] Among adolescents in Nairobi’sslums, years of schooling was not associated with self-reported health status aftercontrolling for unobserved characteristics.[9]
Furthermore, some evidence exists that show that self-reported health measures indeveloping countries are highly correlated with physical performance, functional lim-itations, and presence of chronic diseases, adding credibility to the measure. InBangladesh, Rahman and Barsky [11] found that among the elderly population aged50 years and older, self-reported health status was significantly associated with objec-tive measures of physical performance. In fact, differences in physical performance,ADL limitations, and reports of chronic and acute morbidity explained the differ-ences in self-reported health between men and women. Kuhn et al. [6], extending theanalysis to adults over age 15, found the multiple correlation between self-reportedhealth and a set of observed and self-reported measures was about .5. Similarly, thenumber of functional limitations and presence of specific chronic diseases decreasedthe probability of reporting good health in the Philippines, Thailand and Taiwan.[20]Wu and Rudkin’s study also show a strong relationship between functional statusand self-reported health in Malaysia. [18]
The relationship between self-reported health and subsequent mortality has beenshown in a growing number of studies. In Shanghai, China, Yu et al. [19] showedthat self-reported “poor” health among 65-74 year olds increased the adjusted relativerisk of dying by 1.93 compared to those who reported “excellent/good” health duringfive years of follow-up. Those who reported “fair” health had 2.16 times the risk ofdying. Among the elderly aged 75 years and older, those who reported “poor”health had 1.34 times the risk and those who reported “fair” health had 1.14 timesthe risk of dying, but the results were not statistically significant. These results wereconfirmed by a study of the oldest old in China[1]. Similar associations betweenself rated health and mortality were found in Taiwan across ethnic groups[17] andsocioeconomic status[10].
A study in Indonesia showed that self-reported health was highly predictive of mor-tality regardless of gender, socioeconomic status, or education level among thoseaged 50 and above.[8] These results confirm the findings from an earlier study whichused three waves of panel data to show that individuals who reported poor health
SELF-RATED HEALTH AND MORTALITY AMONG THE ELDERLY IN MATLAB, BANGLADESH* 13
were more likely to die in the subsequent follow-up periods. [3] The results were con-sistent across several time periods, for both men and women, and despite inclusionof various indicators of socioeconomic status, height and body mass index, physicalfunctioning, symptoms of poor physical health, symptoms of depression, and physicalhealth assessments.
Self-reported health of men and women aged 50 years and above was also predictive ofmortality in the Vadu Health and Demographic Surveillance Site in Pune District ofIndia, independent of age, sex, socioeconomic status, education, spousal support, andfamily size. [4] Furthermore, self rated health was shown to be as good a predictorof mortality as objective measures of health in Bambuı, Brazil. [7]
Two studies from Matlab, Bangladesh also show self-reported health as a predictorof mortality. In a two year follow-up study, Razzaque et al. [13] reports that self-reported health of elderly aged 50 years and above was predictive of subsequentmortality. Those who reported as having bad or very bad health showed higherrelative risk of dying compared to those who reported as having good or very goodhealth for both sexes and even after controlling for socioeconomic factors. For women,those reporting moderate health also showed increased risk of dying. An earlier studyin the same area showed similar results for both a younger group aged less than 50and an older group aged 50 and above for a five year follow-up period. [6]
While the relationship between self-rated health and mortality is well establishedin industrialized country settings[5], the evidence from developing countries is stillsparse. This study seeks to further our understanding of the relationship betweenself-rated health, sociodemographic factors, and subsequent mortality in a devel-oping country setting. To accomplish this aim, it takes advantage of two uniquedatasets: the Matlab Health and Socioeconomic Survey and the Matlab Healthand Demographic Surveillance System. It builds upon earlier studies in Bangladesh[6, 11, 13, 14] by more closely examining the relationship between self-rated health,sociodemographic factors and mortality. Further, while previous studies have a shortfollow-up period of five years or less, this study is unique in following respondentsfor fifteen years.
The study seeks to answer the following research questions:
(1) What are the correlates of self-rated health?
(2) What is the relationship between self-rated health and subsequent mortality?How does the relationship change over time?
4 NOBUKO MIZOGUCHI
(3) What are the relationships between other self-reported health measures, suchself-reported chronic morbidity, self-reported functional disability and self-reported general health and subsequent mortality?
2. Research Design and Methods
2.1. Study area. The data for this study will come from Matlab, a rural area ofBangladesh about 55 km from the capital city of Dhaka. The International Centrefor Diarroeal Research, Bangladesh (icddr,b) has been maintaining a Health andDemographic Surveillance System (HDSS) in this site since 1966. The HDSS registersall births, deaths, marriage, and migration events occurring in the area. The HDSSdata are collected prospectively on a regular basis.
2.2. Data. The study uses data from the HDSS and the Matlab Health and So-cioeconomic Survey (MHSS). The first round (MHSS1) was conducted in 1996 andcovered 4,364 households. The questions included self-rated health, activities of dailyliving (ADL), and self-reported chronic morbidity. The data also contain sociodemo-graphic measures such as marital status, religion, and education level. The datasetis described in detail elsewhere. [12] A unique feature of the MHSS is that the datacan be linked to the HDSS. Mortality subsequent to 1996 will be obtained from theHDSS dataset to determine survival rates.
2.3. Study Variables.
2.3.1. Self-Reported Health. The main variable of interest is taken from the questionin MHSS: “What is your current health status?: healthy, fairly healthy, and un-healthy/sick.” If the respondent answered “fairly healthy”, the questionnaire asked,“What do you mean by fairly healthy?: Better than average health, Worse than av-erage health.” Since there were no significant differences in outcomes between thosewho reported better than average health and worse than average health and therewere no differences in outcomes between the healthy and fairly healthy groups, theself-reported health responses were combined to form a dummy variable coded ‘1’ ifthe respondent had reported unhealthy/sick and ‘0’ if the respondent had reportedhealthy or fairly healthy.
In addition, MHSS included other measures of self-reported health: reports of func-tional limitations with regard to activities of daily living (ADLs) and whether therespondent has specific chronic diseases. For measuring ADL limitations, the re-spondents were asked if they had to do an activity, could they do it. To which theyresponded “easily”, “have trouble”, or “unable to do it”. I categorized the ADLs
SELF-RATED HEALTH AND MORTALITY AMONG THE ELDERLY IN MATLAB, BANGLADESH* 25
according to Rahman and Barsky’s [11] groupings. The first cluster contained per-sonal care activities of 1) bathing; 2) dressing; 3) getting up and out of bed; and4) using the toilet. The second cluster consisted of activities that define range ofmotion: 1) carrying 10 kg weight for 20 yards; 2) using hand pump for water; 3)standing up from a squatting position; 4) sitting in a squatting position; 5) gettingup from a sitting position in char or stool; and 6) crouching/stooping. If the respon-dent reported limitations in conducting any of the personal care activities in the firstcluster, he/she was categorized as having a major ADL limitation. If the respondentonly reported limitations in the second cluster, then he/she was classified as havinga minor ADL limitation.
Finally, self-reported measures of chronic morbidity were used. These included 14conditions as in Rahman and Barsky [11]: anemia, arthritis, broken bones, cataracts,vision problems, asthma, other breathing problems, diabetes, pain or burning onurination, paralysis, tuberculosis, gastric or ulcer problems, edema, and a residualcategory called “other conditions”. Unlike the earlier study, the variable for chronicmorbidity is a continuous variable that represents the sum of all morbidities reportedby the individual.
2.3.2. Mortality. The main outcome variable of interest is the time to death or cen-soring recorded in days. Dates of deaths were obtained from the HDSS. Censoringmeans moving out of the HDSS area or the final date of observation. The out migra-tion dates are from the HDSS and the final date of observation for this analysis wasDecember 31, 2011. All cause mortality was used in the analysis. Injuries and acci-dents constituted a small portion of the deaths. These were included in the analysisbecause among the elderly, overall frailty can lead to injuries and accidents. Fur-thermore, I kept deaths from infectious diseases in the analysis because the categoryincluded those that could lead to chronic conditions such as tuberculosis and thosewho are in poorer general health may be more susceptible to infections.
2.3.3. Sociodemographic Characteristics. Age, sex, education, marital status, andreligion are added as controls. Age at the time of MHSS is categorized into threegroups: 1) 50-59 years old; 2) 60-69 years old; and 3) 70 years and older. Educationis a dummy variable with no schooling (reference group) and attended some school.Further classification of education levels was not possible due to the small numberof women who attained high levels of education. Marital status is a dummy variablebased on marital status at the time of the MHSS, with “1” for unmarried (whichincludes never married, divorced, separated, or widowed) and “0” for married (ref-erence group). Religion is coded as either Muslim (reference group) or Hindu.
6 NOBUKO MIZOGUCHI
2.3.4. icddr,b Treatment Area. A variable for icddr,b treatment area was includedto see if there were any differences between areas that received services from icddr,band the government service areas. To the extent that access to health care mayinform your life span prospects, those residing in icddr,b service areas may be moreknowledgeable about their true health status. A total of 137 out of the 142 villagesin the HDSS were included in the sample. Of these, 65 were in the treatment areasand 72 were in the comparison areas.
2.4. Statistical Analysis. Before launching into the examination of self-reportedhealth and mortality, a better understanding of the determinants of self-reportedpoor health is necessary. Therefore, I begin my analysis by using logistic regressionto see which sociodemographic and other self-reported health factors are associatedwith reporting poor health. Then, to examine the relationship between self-reportedhealth and mortality, I use Kaplan-Meier estimates to look at the unadjusted re-lationship between self-rated health and mortality. Next, I use Cox proportionalhazards regression to examine the survival time between the 1996 MHSS survey anddeath for individuals aged 50 and above. The analysis is first stratified by sex, thenby sex and follow-up time. Follow-up time is categorized into the first five years andfive to fifteen years. Individual weights from MHSS are used in the analysis. Theweights are described in detail elsewhere [12]. Six models are estimated. The basemodel contains the self-reported health variable plus sex and age as controls. Model2 introduces the sociodemographic variables in a block. The third model examinesthe addition of the icddr,b treatment area. Model 4 adds the Activity of Daily Livingvariable and Model 5, the self-reported chronic morbidity variable. The full modelis presented in Model 6.
3. Results
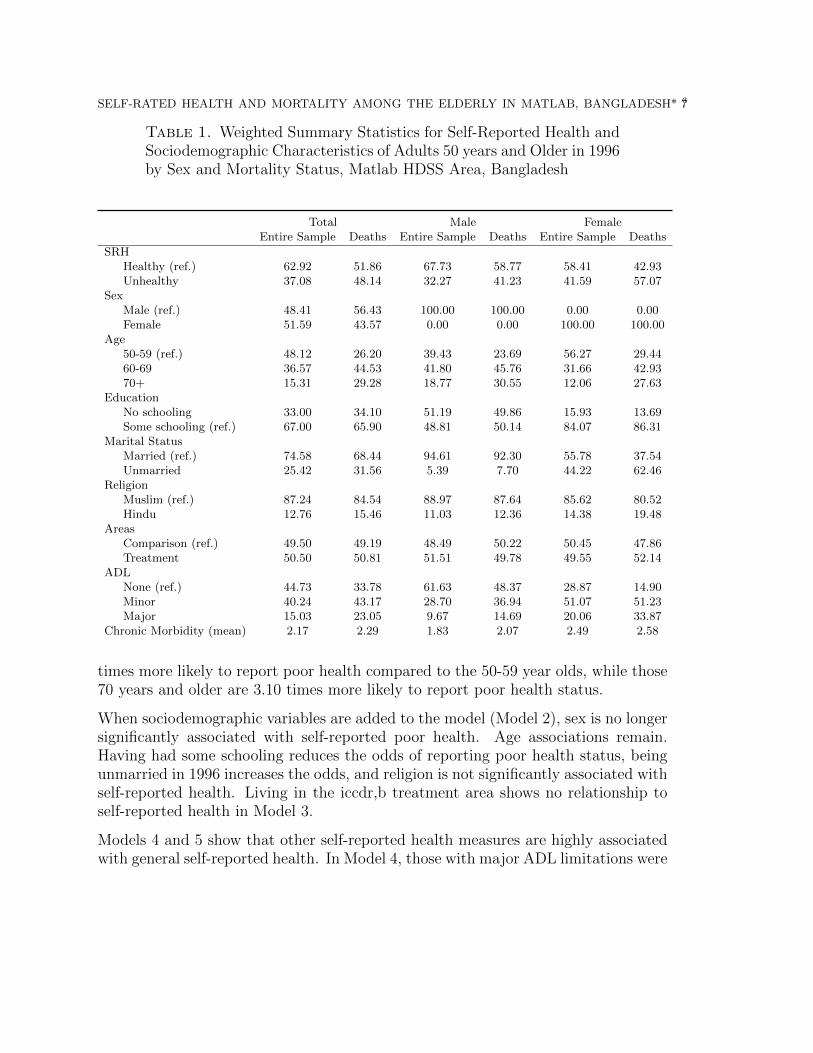
Table 1 shows weighted summary statistics for all variables for the entire sample andfor whose who died during the follow-up period by sex. The table shows the percent-age distribution of self-reported health status (SRH), sex, age, education, maritalstatus, religion, comparison and treatment areas, and ADL. Chronic morbidities arereported as the mean number reported by the respondent.
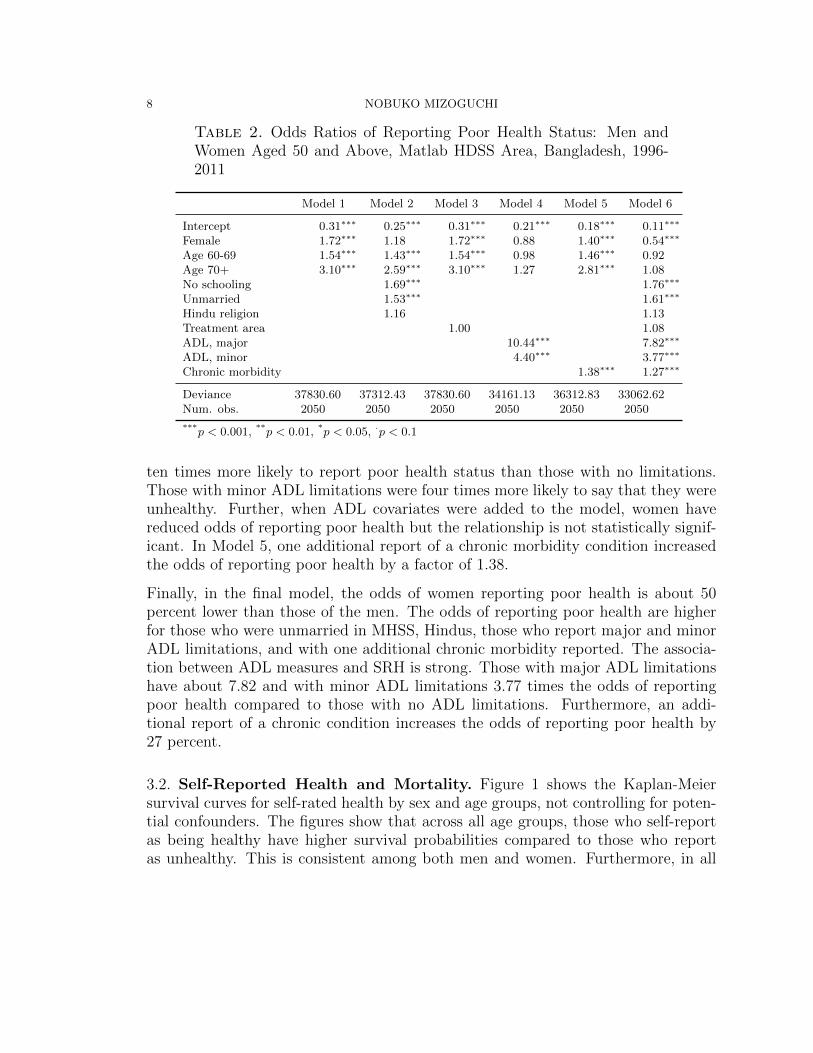
3.1. Correlates of Self-Reported Health. The odds ratios of reporting poorhealth status are shown in Table 2. Model 1 shows that women are 1.72 timesmore likely report poor health status than men. Further, the odds of reporting poorhealth status increases with age. Those in the 60-69 year old age group are 1.54
SELF-RATED HEALTH AND MORTALITY AMONG THE ELDERLY IN MATLAB, BANGLADESH* 37
Table 1. Weighted Summary Statistics for Self-Reported Health andSociodemographic Characteristics of Adults 50 years and Older in 1996by Sex and Mortality Status, Matlab HDSS Area, Bangladesh
Total Male FemaleEntire Sample Deaths Entire Sample Deaths Entire Sample Deaths
SRHHealthy (ref.) 62.92 51.86 67.73 58.77 58.41 42.93Unhealthy 37.08 48.14 32.27 41.23 41.59 57.07
SexMale (ref.) 48.41 56.43 100.00 100.00 0.00 0.00Female 51.59 43.57 0.00 0.00 100.00 100.00
Age50-59 (ref.) 48.12 26.20 39.43 23.69 56.27 29.4460-69 36.57 44.53 41.80 45.76 31.66 42.9370+ 15.31 29.28 18.77 30.55 12.06 27.63
EducationNo schooling 33.00 34.10 51.19 49.86 15.93 13.69Some schooling (ref.) 67.00 65.90 48.81 50.14 84.07 86.31
Marital StatusMarried (ref.) 74.58 68.44 94.61 92.30 55.78 37.54Unmarried 25.42 31.56 5.39 7.70 44.22 62.46
ReligionMuslim (ref.) 87.24 84.54 88.97 87.64 85.62 80.52Hindu 12.76 15.46 11.03 12.36 14.38 19.48
AreasComparison (ref.) 49.50 49.19 48.49 50.22 50.45 47.86Treatment 50.50 50.81 51.51 49.78 49.55 52.14
ADLNone (ref.) 44.73 33.78 61.63 48.37 28.87 14.90Minor 40.24 43.17 28.70 36.94 51.07 51.23Major 15.03 23.05 9.67 14.69 20.06 33.87
Chronic Morbidity (mean) 2.17 2.29 1.83 2.07 2.49 2.58
times more likely to report poor health compared to the 50-59 year olds, while those70 years and older are 3.10 times more likely to report poor health status.
When sociodemographic variables are added to the model (Model 2), sex is no longersignificantly associated with self-reported poor health. Age associations remain.Having had some schooling reduces the odds of reporting poor health status, beingunmarried in 1996 increases the odds, and religion is not significantly associated withself-reported health. Living in the iccdr,b treatment area shows no relationship toself-reported health in Model 3.
Models 4 and 5 show that other self-reported health measures are highly associatedwith general self-reported health. In Model 4, those with major ADL limitations were
8 NOBUKO MIZOGUCHI
Table 2. Odds Ratios of Reporting Poor Health Status: Men andWomen Aged 50 and Above, Matlab HDSS Area, Bangladesh, 1996-2011
Model 1 Model 2 Model 3 Model 4 Model 5 Model 6
Intercept 0.31∗∗∗ 0.25∗∗∗ 0.31∗∗∗ 0.21∗∗∗ 0.18∗∗∗ 0.11∗∗∗
Female 1.72∗∗∗ 1.18 1.72∗∗∗ 0.88 1.40∗∗∗ 0.54∗∗∗
Age 60-69 1.54∗∗∗ 1.43∗∗∗ 1.54∗∗∗ 0.98 1.46∗∗∗ 0.92Age 70+ 3.10∗∗∗ 2.59∗∗∗ 3.10∗∗∗ 1.27 2.81∗∗∗ 1.08No schooling 1.69∗∗∗ 1.76∗∗∗
Unmarried 1.53∗∗∗ 1.61∗∗∗
Hindu religion 1.16 1.13Treatment area 1.00 1.08ADL, major 10.44∗∗∗ 7.82∗∗∗
ADL, minor 4.40∗∗∗ 3.77∗∗∗
Chronic morbidity 1.38∗∗∗ 1.27∗∗∗
Deviance 37830.60 37312.43 37830.60 34161.13 36312.83 33062.62Num. obs. 2050 2050 2050 2050 2050 2050
***p < 0.001, **p < 0.01, *p < 0.05, ·p < 0.1
ten times more likely to report poor health status than those with no limitations.Those with minor ADL limitations were four times more likely to say that they wereunhealthy. Further, when ADL covariates were added to the model, women havereduced odds of reporting poor health but the relationship is not statistically signif-icant. In Model 5, one additional report of a chronic morbidity condition increasedthe odds of reporting poor health by a factor of 1.38.
Finally, in the final model, the odds of women reporting poor health is about 50percent lower than those of the men. The odds of reporting poor health are higherfor those who were unmarried in MHSS, Hindus, those who report major and minorADL limitations, and with one additional chronic morbidity reported. The associa-tion between ADL measures and SRH is strong. Those with major ADL limitationshave about 7.82 and with minor ADL limitations 3.77 times the odds of reportingpoor health compared to those with no ADL limitations. Furthermore, an addi-tional report of a chronic condition increases the odds of reporting poor health by27 percent.
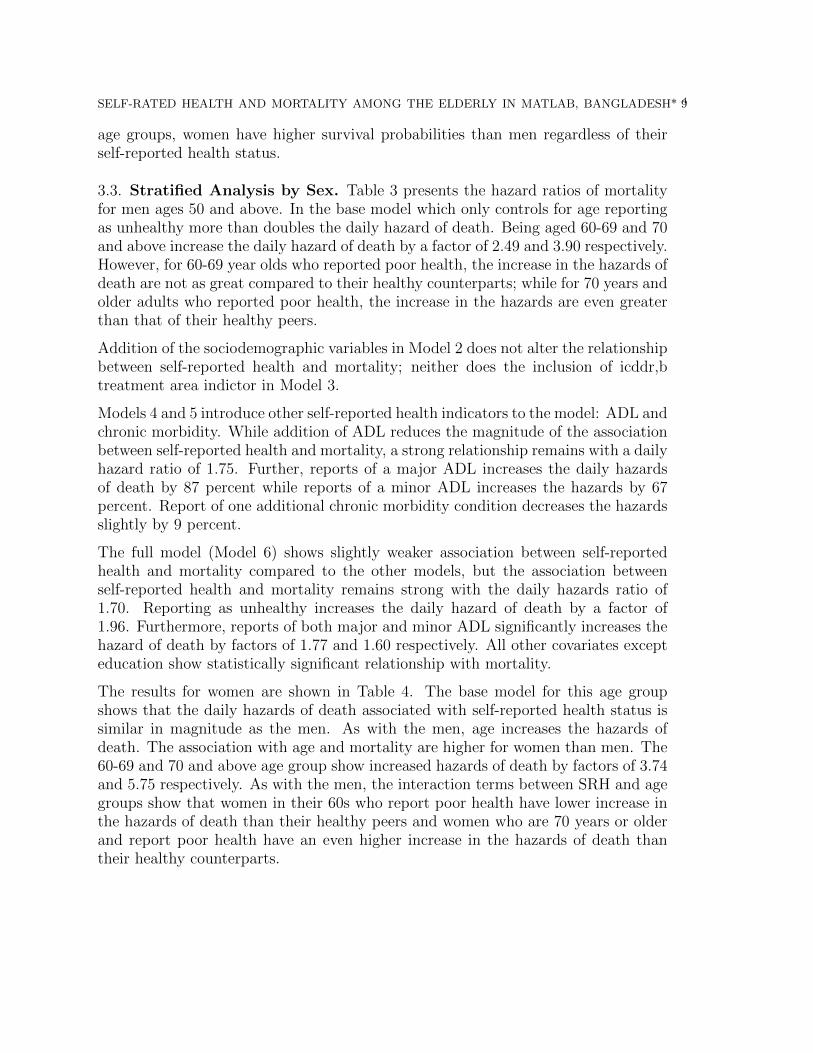
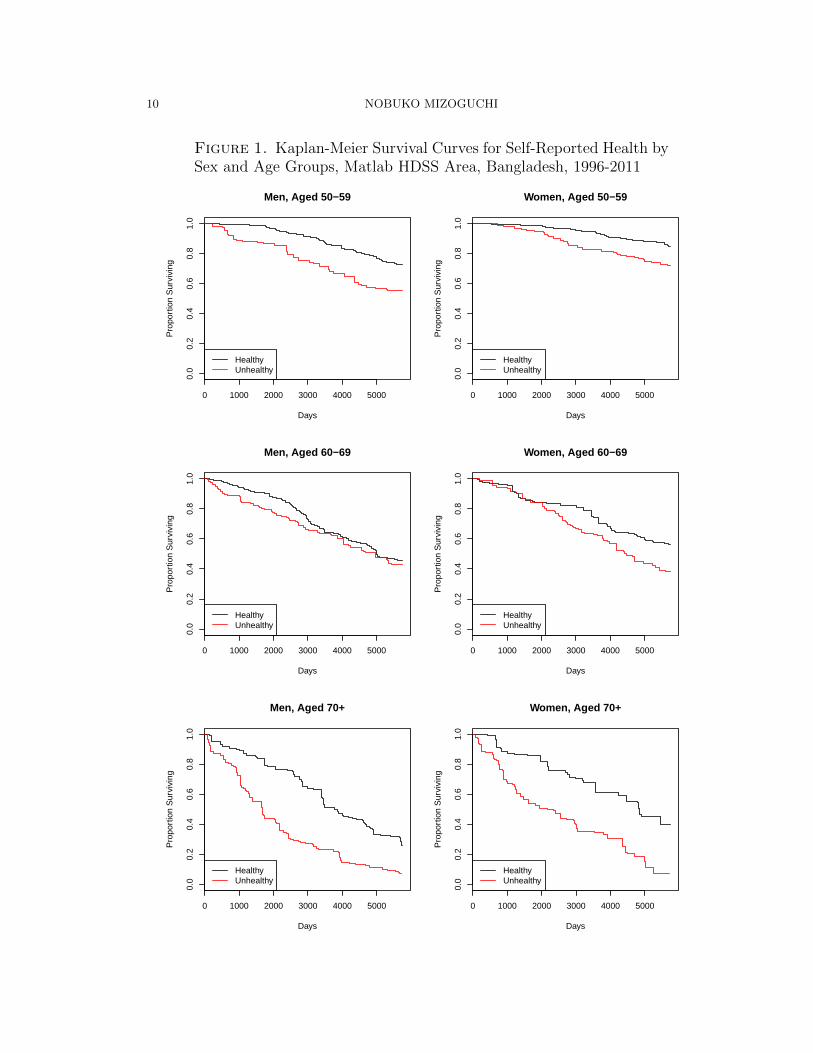
3.2. Self-Reported Health and Mortality. Figure 1 shows the Kaplan-Meiersurvival curves for self-rated health by sex and age groups, not controlling for poten-tial confounders. The figures show that across all age groups, those who self-reportas being healthy have higher survival probabilities compared to those who reportas unhealthy. This is consistent among both men and women. Furthermore, in all
SELF-RATED HEALTH AND MORTALITY AMONG THE ELDERLY IN MATLAB, BANGLADESH* 49
age groups, women have higher survival probabilities than men regardless of theirself-reported health status.
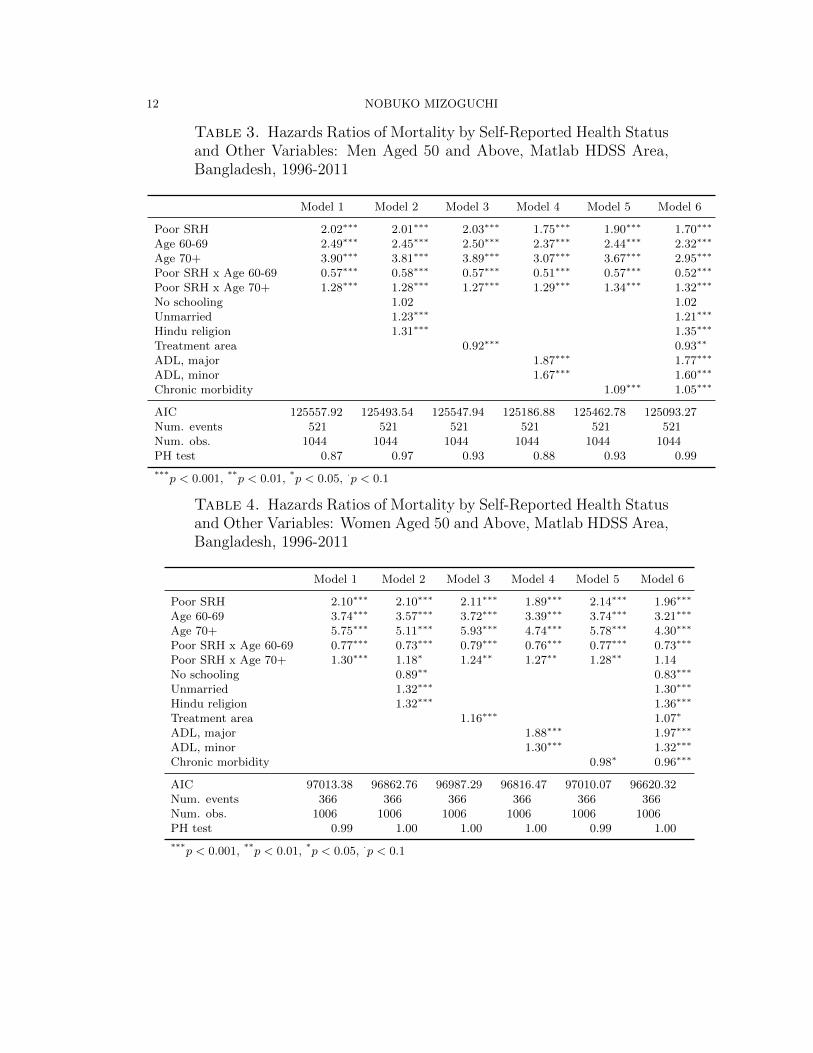
3.3. Stratified Analysis by Sex. Table 3 presents the hazard ratios of mortalityfor men ages 50 and above. In the base model which only controls for age reportingas unhealthy more than doubles the daily hazard of death. Being aged 60-69 and 70and above increase the daily hazard of death by a factor of 2.49 and 3.90 respectively.However, for 60-69 year olds who reported poor health, the increase in the hazards ofdeath are not as great compared to their healthy counterparts; while for 70 years andolder adults who reported poor health, the increase in the hazards are even greaterthan that of their healthy peers.
Addition of the sociodemographic variables in Model 2 does not alter the relationshipbetween self-reported health and mortality; neither does the inclusion of icddr,btreatment area indictor in Model 3.
Models 4 and 5 introduce other self-reported health indicators to the model: ADL andchronic morbidity. While addition of ADL reduces the magnitude of the associationbetween self-reported health and mortality, a strong relationship remains with a dailyhazard ratio of 1.75. Further, reports of a major ADL increases the daily hazardsof death by 87 percent while reports of a minor ADL increases the hazards by 67percent. Report of one additional chronic morbidity condition decreases the hazardsslightly by 9 percent.
The full model (Model 6) shows slightly weaker association between self-reportedhealth and mortality compared to the other models, but the association betweenself-reported health and mortality remains strong with the daily hazards ratio of1.70. Reporting as unhealthy increases the daily hazard of death by a factor of1.96. Furthermore, reports of both major and minor ADL significantly increases thehazard of death by factors of 1.77 and 1.60 respectively. All other covariates excepteducation show statistically significant relationship with mortality.
The results for women are shown in Table 4. The base model for this age groupshows that the daily hazards of death associated with self-reported health status issimilar in magnitude as the men. As with the men, age increases the hazards ofdeath. The association with age and mortality are higher for women than men. The60-69 and 70 and above age group show increased hazards of death by factors of 3.74and 5.75 respectively. As with the men, the interaction terms between SRH and agegroups show that women in their 60s who report poor health have lower increase inthe hazards of death than their healthy peers and women who are 70 years or olderand report poor health have an even higher increase in the hazards of death thantheir healthy counterparts.
10 NOBUKO MIZOGUCHI
Figure 1. Kaplan-Meier Survival Curves for Self-Reported Health bySex and Age Groups, Matlab HDSS Area, Bangladesh, 1996-2011
0 1000 2000 3000 4000 5000
0.0
0.2
0.4
0.6
0.8
1.0
Men, Aged 50−59
Days
Pro
port
ion
Sur
vivi
ng
HealthyUnhealthy
0 1000 2000 3000 4000 5000
0.0
0.2
0.4
0.6
0.8
1.0
Men, Aged 60−69
Days
Pro
port
ion
Sur
vivi
ng
HealthyUnhealthy
0 1000 2000 3000 4000 5000
0.0
0.2
0.4
0.6
0.8
1.0
Men, Aged 70+
Days
Pro
port
ion
Sur
vivi
ng
HealthyUnhealthy
0 1000 2000 3000 4000 5000
0.0
0.2
0.4
0.6
0.8
1.0
Women, Aged 50−59
Days
Pro
port
ion
Sur
vivi
ng
HealthyUnhealthy
0 1000 2000 3000 4000 5000
0.0
0.2
0.4
0.6
0.8
1.0
Women, Aged 60−69
Days
Pro
port
ion
Sur
vivi
ng
HealthyUnhealthy
0 1000 2000 3000 4000 5000
0.0
0.2
0.4
0.6
0.8
1.0
Women, Aged 70+
Days
Pro
port
ion
Sur
vivi
ng
HealthyUnhealthy
SELF-RATED HEALTH AND MORTALITY AMONG THE ELDERLY IN MATLAB, BANGLADESH* 511
Similar to the men, including the sociodemographic variables and the indicator foricddr,b treatment area does not change the association between self-reported healthand mortality considerably (Models 2 and 3).
Furthermore, as with the men, the addition of ADL to the base model reduces themagnitude of the association between self-reported health and the daily hazard ofdeath (Models 4). However, the association remains strong, with reports of beingunhealthy increasing the daily hazard of death by factors of 1.89. Reports of at leastone major ADL limitation increases the hazard of death by 88 percent, while reportsof a minor ADL limitation raises the hazard of death by 30 percent.
Unlike the men, the addition of the chronic morbidity covariate slightly increasesthe hazards of death associated with self-reported health. The hazards of deathassociated with one additional report of chronic morbidity decreases hazards of deathby 2 percent. This finding is counterintuitive and raises questions regarding women’sawareness of own specific chronic disease conditions.
The full model for women shows that those who report as being unhealthy has anincreased daily hazard of death by a factor of 1.96 (Model 6). The interaction termbetween poor self-reported health and age 70 and above is no longer significant. Allother covariates are statistically significant.
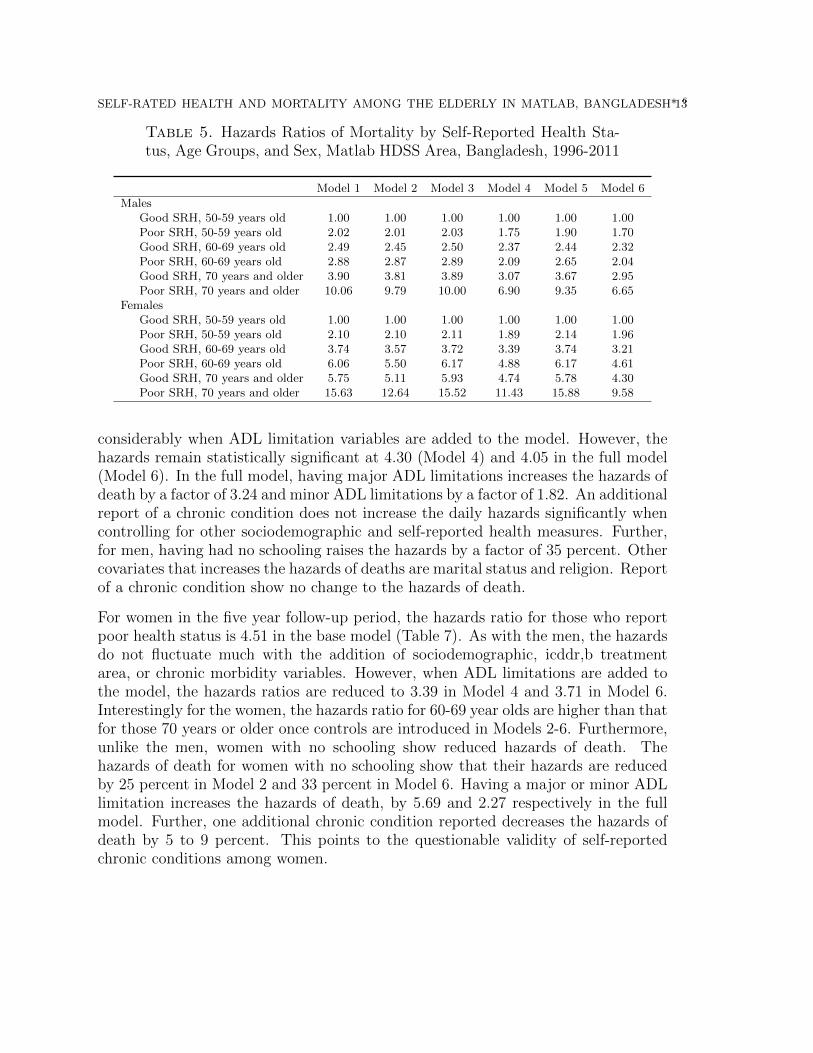
Table 5 shows the hazards ratios for self-reported health status, age, and sex, takinginto account the interaction terms. This table reveals that for the most part, SRHand age interact in expected ways. Those who report poor SRH have higher dailyhazards of death and the older age groups have higher hazards than the younger agegroups. One exception is among 60-69 year old males. In this age group, those whoreport good SRH have higher daily hazards of death than those who report poorhealth status, after controlling for functional limitations. Additionally, 60-69 yearold women who report poor health have higher hazards of death than women in theoldest age group who report good health.
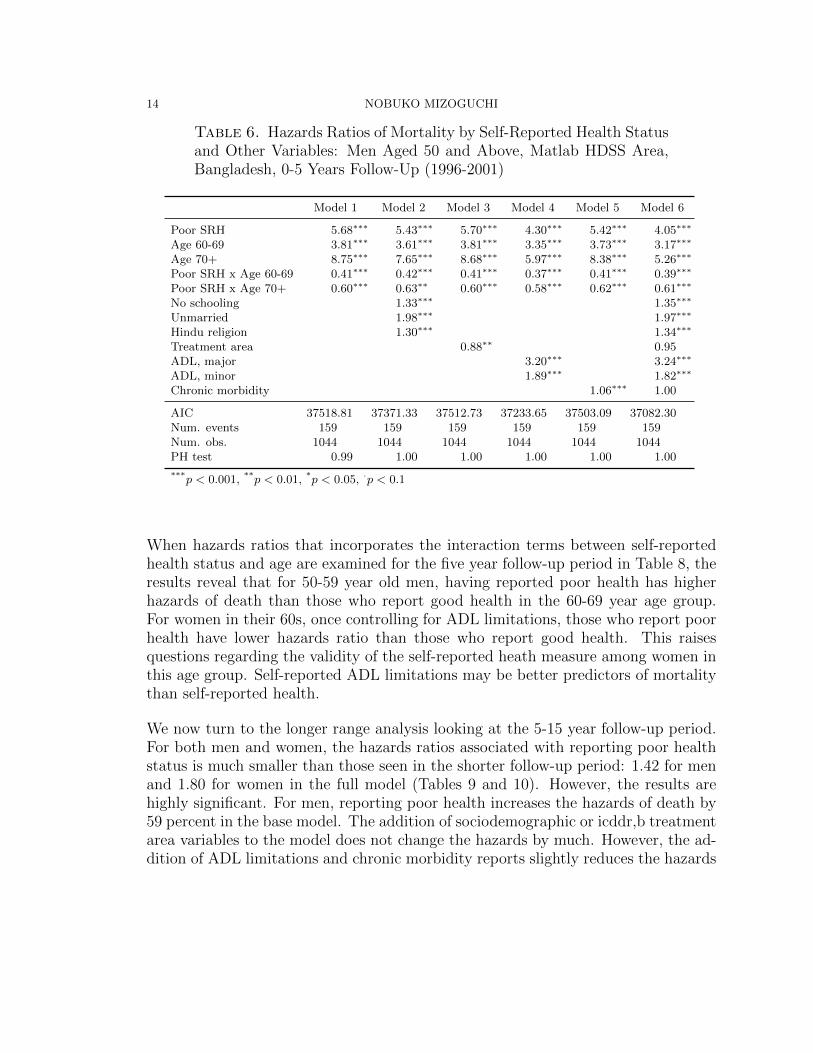
3.4. Stratified Analysis by Sex and Follow-Up Time. To examine how mor-tality prediction by self-reported health holds over time, in the next set of analysis,I stratify by sex and follow-up time. As expected, the results show that the dailyhazards of death for people who report poor health is considerably higher during thefirst five years of follow-up than after five years. Results were consistent for bothmen and women (Tables 6, 7, 9, and 10)
During the first five years of follow-up since the interview, the daily hazards ofdeath for men who report poor health increase by a factor of 5.68 in the base model(Table 6). The hazards ratios are about the same in other models but are reduced
12 NOBUKO MIZOGUCHI
Table 3. Hazards Ratios of Mortality by Self-Reported Health Statusand Other Variables: Men Aged 50 and Above, Matlab HDSS Area,Bangladesh, 1996-2011
Model 1 Model 2 Model 3 Model 4 Model 5 Model 6
Poor SRH 2.02∗∗∗ 2.01∗∗∗ 2.03∗∗∗ 1.75∗∗∗ 1.90∗∗∗ 1.70∗∗∗
Age 60-69 2.49∗∗∗ 2.45∗∗∗ 2.50∗∗∗ 2.37∗∗∗ 2.44∗∗∗ 2.32∗∗∗
Age 70+ 3.90∗∗∗ 3.81∗∗∗ 3.89∗∗∗ 3.07∗∗∗ 3.67∗∗∗ 2.95∗∗∗
Poor SRH x Age 60-69 0.57∗∗∗ 0.58∗∗∗ 0.57∗∗∗ 0.51∗∗∗ 0.57∗∗∗ 0.52∗∗∗
Poor SRH x Age 70+ 1.28∗∗∗ 1.28∗∗∗ 1.27∗∗∗ 1.29∗∗∗ 1.34∗∗∗ 1.32∗∗∗
No schooling 1.02 1.02Unmarried 1.23∗∗∗ 1.21∗∗∗
Hindu religion 1.31∗∗∗ 1.35∗∗∗
Treatment area 0.92∗∗∗ 0.93∗∗
ADL, major 1.87∗∗∗ 1.77∗∗∗
ADL, minor 1.67∗∗∗ 1.60∗∗∗
Chronic morbidity 1.09∗∗∗ 1.05∗∗∗
AIC 125557.92 125493.54 125547.94 125186.88 125462.78 125093.27Num. events 521 521 521 521 521 521Num. obs. 1044 1044 1044 1044 1044 1044PH test 0.87 0.97 0.93 0.88 0.93 0.99
***p < 0.001, **p < 0.01, *p < 0.05, ·p < 0.1
Table 4. Hazards Ratios of Mortality by Self-Reported Health Statusand Other Variables: Women Aged 50 and Above, Matlab HDSS Area,Bangladesh, 1996-2011
Model 1 Model 2 Model 3 Model 4 Model 5 Model 6
Poor SRH 2.10∗∗∗ 2.10∗∗∗ 2.11∗∗∗ 1.89∗∗∗ 2.14∗∗∗ 1.96∗∗∗
Age 60-69 3.74∗∗∗ 3.57∗∗∗ 3.72∗∗∗ 3.39∗∗∗ 3.74∗∗∗ 3.21∗∗∗
Age 70+ 5.75∗∗∗ 5.11∗∗∗ 5.93∗∗∗ 4.74∗∗∗ 5.78∗∗∗ 4.30∗∗∗
Poor SRH x Age 60-69 0.77∗∗∗ 0.73∗∗∗ 0.79∗∗∗ 0.76∗∗∗ 0.77∗∗∗ 0.73∗∗∗
Poor SRH x Age 70+ 1.30∗∗∗ 1.18∗ 1.24∗∗ 1.27∗∗ 1.28∗∗ 1.14No schooling 0.89∗∗ 0.83∗∗∗
Unmarried 1.32∗∗∗ 1.30∗∗∗
Hindu religion 1.32∗∗∗ 1.36∗∗∗
Treatment area 1.16∗∗∗ 1.07∗
ADL, major 1.88∗∗∗ 1.97∗∗∗
ADL, minor 1.30∗∗∗ 1.32∗∗∗
Chronic morbidity 0.98∗ 0.96∗∗∗
AIC 97013.38 96862.76 96987.29 96816.47 97010.07 96620.32Num. events 366 366 366 366 366 366Num. obs. 1006 1006 1006 1006 1006 1006PH test 0.99 1.00 1.00 1.00 0.99 1.00
***p < 0.001, **p < 0.01, *p < 0.05, ·p < 0.1
SELF-RATED HEALTH AND MORTALITY AMONG THE ELDERLY IN MATLAB, BANGLADESH* 613
Table 5. Hazards Ratios of Mortality by Self-Reported Health Sta-tus, Age Groups, and Sex, Matlab HDSS Area, Bangladesh, 1996-2011
Model 1 Model 2 Model 3 Model 4 Model 5 Model 6
MalesGood SRH, 50-59 years old 1.00 1.00 1.00 1.00 1.00 1.00Poor SRH, 50-59 years old 2.02 2.01 2.03 1.75 1.90 1.70Good SRH, 60-69 years old 2.49 2.45 2.50 2.37 2.44 2.32Poor SRH, 60-69 years old 2.88 2.87 2.89 2.09 2.65 2.04Good SRH, 70 years and older 3.90 3.81 3.89 3.07 3.67 2.95Poor SRH, 70 years and older 10.06 9.79 10.00 6.90 9.35 6.65
FemalesGood SRH, 50-59 years old 1.00 1.00 1.00 1.00 1.00 1.00Poor SRH, 50-59 years old 2.10 2.10 2.11 1.89 2.14 1.96Good SRH, 60-69 years old 3.74 3.57 3.72 3.39 3.74 3.21Poor SRH, 60-69 years old 6.06 5.50 6.17 4.88 6.17 4.61Good SRH, 70 years and older 5.75 5.11 5.93 4.74 5.78 4.30Poor SRH, 70 years and older 15.63 12.64 15.52 11.43 15.88 9.58
considerably when ADL limitation variables are added to the model. However, thehazards remain statistically significant at 4.30 (Model 4) and 4.05 in the full model(Model 6). In the full model, having major ADL limitations increases the hazards ofdeath by a factor of 3.24 and minor ADL limitations by a factor of 1.82. An additionalreport of a chronic condition does not increase the daily hazards significantly whencontrolling for other sociodemographic and self-reported health measures. Further,for men, having had no schooling raises the hazards by a factor of 35 percent. Othercovariates that increases the hazards of deaths are marital status and religion. Reportof a chronic condition show no change to the hazards of death.
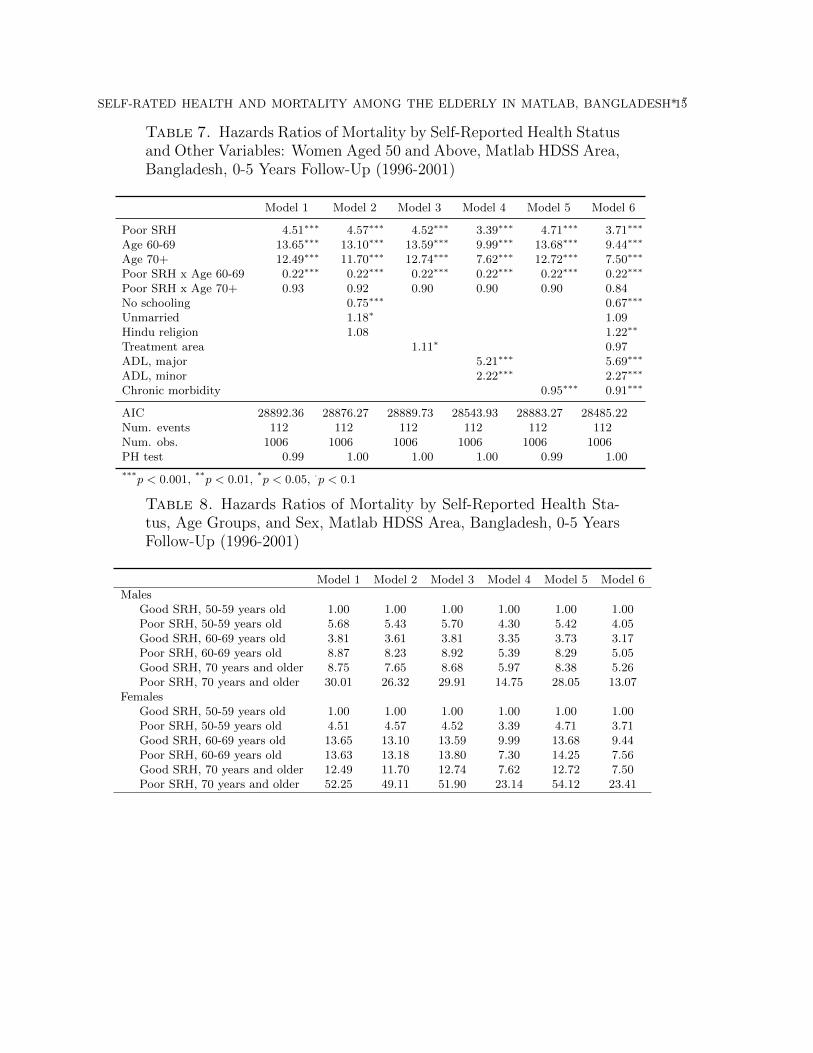
For women in the five year follow-up period, the hazards ratio for those who reportpoor health status is 4.51 in the base model (Table 7). As with the men, the hazardsdo not fluctuate much with the addition of sociodemographic, icddr,b treatmentarea, or chronic morbidity variables. However, when ADL limitations are added tothe model, the hazards ratios are reduced to 3.39 in Model 4 and 3.71 in Model 6.Interestingly for the women, the hazards ratio for 60-69 year olds are higher than thatfor those 70 years or older once controls are introduced in Models 2-6. Furthermore,unlike the men, women with no schooling show reduced hazards of death. Thehazards of death for women with no schooling show that their hazards are reducedby 25 percent in Model 2 and 33 percent in Model 6. Having a major or minor ADLlimitation increases the hazards of death, by 5.69 and 2.27 respectively in the fullmodel. Further, one additional chronic condition reported decreases the hazards ofdeath by 5 to 9 percent. This points to the questionable validity of self-reportedchronic conditions among women.
14 NOBUKO MIZOGUCHI
Table 6. Hazards Ratios of Mortality by Self-Reported Health Statusand Other Variables: Men Aged 50 and Above, Matlab HDSS Area,Bangladesh, 0-5 Years Follow-Up (1996-2001)
Model 1 Model 2 Model 3 Model 4 Model 5 Model 6
Poor SRH 5.68∗∗∗ 5.43∗∗∗ 5.70∗∗∗ 4.30∗∗∗ 5.42∗∗∗ 4.05∗∗∗
Age 60-69 3.81∗∗∗ 3.61∗∗∗ 3.81∗∗∗ 3.35∗∗∗ 3.73∗∗∗ 3.17∗∗∗
Age 70+ 8.75∗∗∗ 7.65∗∗∗ 8.68∗∗∗ 5.97∗∗∗ 8.38∗∗∗ 5.26∗∗∗
Poor SRH x Age 60-69 0.41∗∗∗ 0.42∗∗∗ 0.41∗∗∗ 0.37∗∗∗ 0.41∗∗∗ 0.39∗∗∗
Poor SRH x Age 70+ 0.60∗∗∗ 0.63∗∗ 0.60∗∗∗ 0.58∗∗∗ 0.62∗∗∗ 0.61∗∗∗
No schooling 1.33∗∗∗ 1.35∗∗∗
Unmarried 1.98∗∗∗ 1.97∗∗∗
Hindu religion 1.30∗∗∗ 1.34∗∗∗
Treatment area 0.88∗∗ 0.95ADL, major 3.20∗∗∗ 3.24∗∗∗
ADL, minor 1.89∗∗∗ 1.82∗∗∗
Chronic morbidity 1.06∗∗∗ 1.00
AIC 37518.81 37371.33 37512.73 37233.65 37503.09 37082.30Num. events 159 159 159 159 159 159Num. obs. 1044 1044 1044 1044 1044 1044PH test 0.99 1.00 1.00 1.00 1.00 1.00
***p < 0.001, **p < 0.01, *p < 0.05, ·p < 0.1
When hazards ratios that incorporates the interaction terms between self-reportedhealth status and age are examined for the five year follow-up period in Table 8, theresults reveal that for 50-59 year old men, having reported poor health has higherhazards of death than those who report good health in the 60-69 year age group.For women in their 60s, once controlling for ADL limitations, those who report poorhealth have lower hazards ratio than those who report good health. This raisesquestions regarding the validity of the self-reported heath measure among women inthis age group. Self-reported ADL limitations may be better predictors of mortalitythan self-reported health.
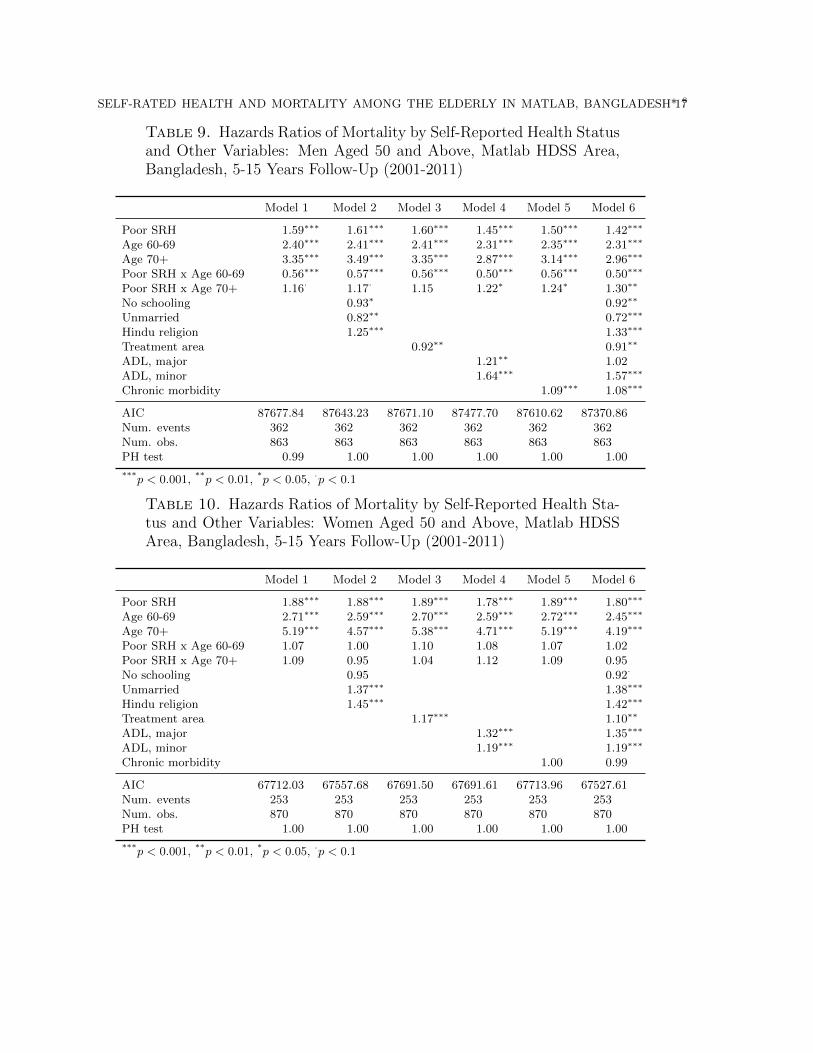
We now turn to the longer range analysis looking at the 5-15 year follow-up period.For both men and women, the hazards ratios associated with reporting poor healthstatus is much smaller than those seen in the shorter follow-up period: 1.42 for menand 1.80 for women in the full model (Tables 9 and 10). However, the results arehighly significant. For men, reporting poor health increases the hazards of death by59 percent in the base model. The addition of sociodemographic or icddr,b treatmentarea variables to the model does not change the hazards by much. However, the ad-dition of ADL limitations and chronic morbidity reports slightly reduces the hazards
SELF-RATED HEALTH AND MORTALITY AMONG THE ELDERLY IN MATLAB, BANGLADESH* 715
Table 7. Hazards Ratios of Mortality by Self-Reported Health Statusand Other Variables: Women Aged 50 and Above, Matlab HDSS Area,Bangladesh, 0-5 Years Follow-Up (1996-2001)
Model 1 Model 2 Model 3 Model 4 Model 5 Model 6
Poor SRH 4.51∗∗∗ 4.57∗∗∗ 4.52∗∗∗ 3.39∗∗∗ 4.71∗∗∗ 3.71∗∗∗
Age 60-69 13.65∗∗∗ 13.10∗∗∗ 13.59∗∗∗ 9.99∗∗∗ 13.68∗∗∗ 9.44∗∗∗
Age 70+ 12.49∗∗∗ 11.70∗∗∗ 12.74∗∗∗ 7.62∗∗∗ 12.72∗∗∗ 7.50∗∗∗
Poor SRH x Age 60-69 0.22∗∗∗ 0.22∗∗∗ 0.22∗∗∗ 0.22∗∗∗ 0.22∗∗∗ 0.22∗∗∗
Poor SRH x Age 70+ 0.93 0.92 0.90 0.90 0.90 0.84No schooling 0.75∗∗∗ 0.67∗∗∗
Unmarried 1.18∗ 1.09Hindu religion 1.08 1.22∗∗
Treatment area 1.11∗ 0.97ADL, major 5.21∗∗∗ 5.69∗∗∗
ADL, minor 2.22∗∗∗ 2.27∗∗∗
Chronic morbidity 0.95∗∗∗ 0.91∗∗∗
AIC 28892.36 28876.27 28889.73 28543.93 28883.27 28485.22Num. events 112 112 112 112 112 112Num. obs. 1006 1006 1006 1006 1006 1006PH test 0.99 1.00 1.00 1.00 0.99 1.00
***p < 0.001, **p < 0.01, *p < 0.05, ·p < 0.1
Table 8. Hazards Ratios of Mortality by Self-Reported Health Sta-tus, Age Groups, and Sex, Matlab HDSS Area, Bangladesh, 0-5 YearsFollow-Up (1996-2001)
Model 1 Model 2 Model 3 Model 4 Model 5 Model 6
MalesGood SRH, 50-59 years old 1.00 1.00 1.00 1.00 1.00 1.00Poor SRH, 50-59 years old 5.68 5.43 5.70 4.30 5.42 4.05Good SRH, 60-69 years old 3.81 3.61 3.81 3.35 3.73 3.17Poor SRH, 60-69 years old 8.87 8.23 8.92 5.39 8.29 5.05Good SRH, 70 years and older 8.75 7.65 8.68 5.97 8.38 5.26Poor SRH, 70 years and older 30.01 26.32 29.91 14.75 28.05 13.07
FemalesGood SRH, 50-59 years old 1.00 1.00 1.00 1.00 1.00 1.00Poor SRH, 50-59 years old 4.51 4.57 4.52 3.39 4.71 3.71Good SRH, 60-69 years old 13.65 13.10 13.59 9.99 13.68 9.44Poor SRH, 60-69 years old 13.63 13.18 13.80 7.30 14.25 7.56Good SRH, 70 years and older 12.49 11.70 12.74 7.62 12.72 7.50Poor SRH, 70 years and older 52.25 49.11 51.90 23.14 54.12 23.41
16 NOBUKO MIZOGUCHI
associated with poor self-reported health. During this follow-up time, reports of ma-jor ADL limitations show lower hazards of mortality compared to reports of minorADL limitations. This is counter-intuitive and raises questions about reports of ADLlimitations in predicting mortality during longer term follow-up. In the full model,hazards of reported a major ADL limitation is not statistically significant. Reportof an additional chronic morbidity increases the hazards of death by 8 percent in thefull model. Unlike in the five year follow-up, having no formal schooling reduces thehazards of death by 8 percent.
For women during the 5-15 year follow-up period, the hazards ratios associated withreporting poor health is higher than those of the men. Reporting poor health in-creases the hazards of death by a facto of 1.88 percent in the base model. Thisrelationship does not change much with the addition of other covariates. As withthe men, when ADL limitations are added to the model, the hazards of self-reportedpoor health are less (Model 4) than in the other models. In the full model, self-reported poor health is associated with increased hazards of death by a factor of 1.8.The interaction terms between poor SRH and age are no longer statistically signifi-cant for women in the 5-15 year follow-up period. Hazards of death associated withmajor or minor ADL limitations continue to show significance. Those who reporthaving major or minor ADL limitation have increased hazards by 35 percent and 19percent respectively after controlling for other covariates (Model 6).
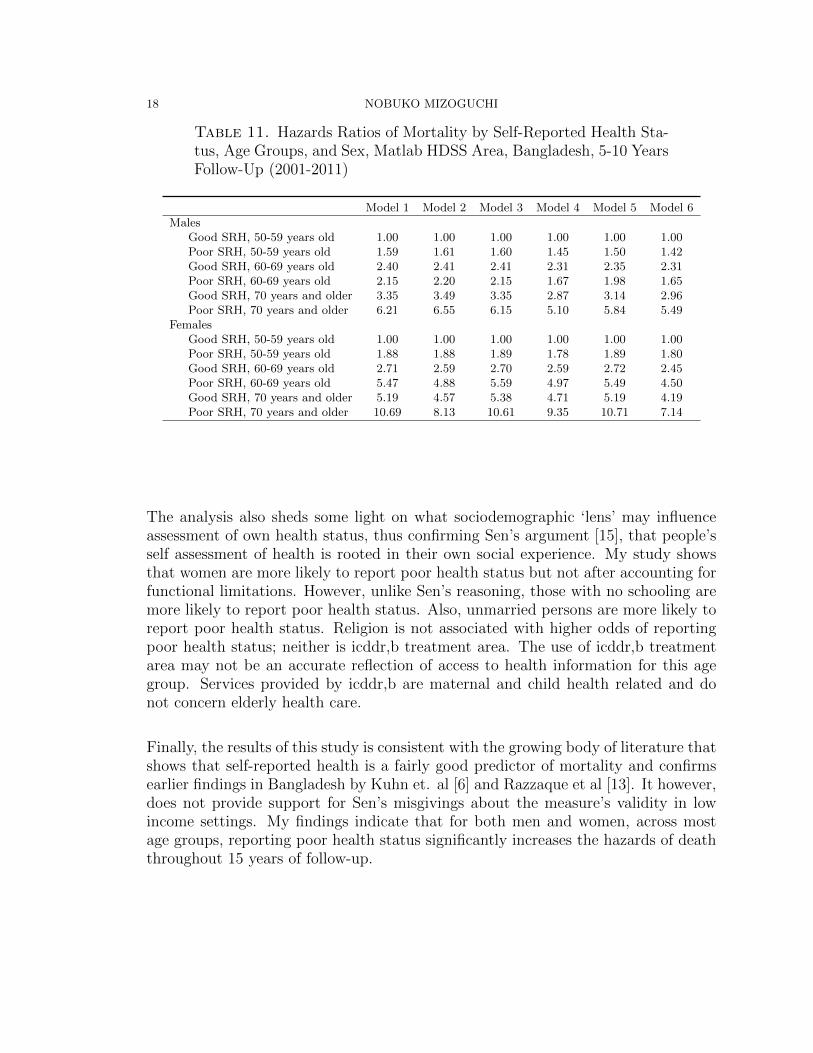
When hazards ratios of self-reported health status are examined with the age inter-action terms by sex for the 5-15 year follow-up period (Table 11), results show thatgenerally, hazards for those who report poor health status are higher than those whoreport good health for the same age group. However, for men in their 60s, those whoreport good health have slightly higher hazards of death than those who report poorhealth. Therefore, the SRH indicator may not be a valid indicator for men in thisage group.
4. Discussion
Despite questions regarding the validity of the self-reported health measure in de-veloping countries, this study presents further evidence that self-reported health is afairly good indicator of overall health status both in the short and longer term. Thelogistic regression analysis has confirmed earlier findings in Bangladesh by Rahmanand Barsky[11] that SRH is highly correlated with ADL limitations and self reportsof chronic morbidity. This was true even after controlling for sociodemographic vari-ables which were not included in Rahman and Barsky’s study.
SELF-RATED HEALTH AND MORTALITY AMONG THE ELDERLY IN MATLAB, BANGLADESH* 817
Table 9. Hazards Ratios of Mortality by Self-Reported Health Statusand Other Variables: Men Aged 50 and Above, Matlab HDSS Area,Bangladesh, 5-15 Years Follow-Up (2001-2011)
Model 1 Model 2 Model 3 Model 4 Model 5 Model 6
Poor SRH 1.59∗∗∗ 1.61∗∗∗ 1.60∗∗∗ 1.45∗∗∗ 1.50∗∗∗ 1.42∗∗∗
Age 60-69 2.40∗∗∗ 2.41∗∗∗ 2.41∗∗∗ 2.31∗∗∗ 2.35∗∗∗ 2.31∗∗∗
Age 70+ 3.35∗∗∗ 3.49∗∗∗ 3.35∗∗∗ 2.87∗∗∗ 3.14∗∗∗ 2.96∗∗∗
Poor SRH x Age 60-69 0.56∗∗∗ 0.57∗∗∗ 0.56∗∗∗ 0.50∗∗∗ 0.56∗∗∗ 0.50∗∗∗
Poor SRH x Age 70+ 1.16· 1.17· 1.15 1.22∗ 1.24∗ 1.30∗∗
No schooling 0.93∗ 0.92∗∗
Unmarried 0.82∗∗ 0.72∗∗∗
Hindu religion 1.25∗∗∗ 1.33∗∗∗
Treatment area 0.92∗∗ 0.91∗∗
ADL, major 1.21∗∗ 1.02ADL, minor 1.64∗∗∗ 1.57∗∗∗
Chronic morbidity 1.09∗∗∗ 1.08∗∗∗
AIC 87677.84 87643.23 87671.10 87477.70 87610.62 87370.86Num. events 362 362 362 362 362 362Num. obs. 863 863 863 863 863 863PH test 0.99 1.00 1.00 1.00 1.00 1.00
***p < 0.001, **p < 0.01, *p < 0.05, ·p < 0.1
Table 10. Hazards Ratios of Mortality by Self-Reported Health Sta-tus and Other Variables: Women Aged 50 and Above, Matlab HDSSArea, Bangladesh, 5-15 Years Follow-Up (2001-2011)
Model 1 Model 2 Model 3 Model 4 Model 5 Model 6
Poor SRH 1.88∗∗∗ 1.88∗∗∗ 1.89∗∗∗ 1.78∗∗∗ 1.89∗∗∗ 1.80∗∗∗
Age 60-69 2.71∗∗∗ 2.59∗∗∗ 2.70∗∗∗ 2.59∗∗∗ 2.72∗∗∗ 2.45∗∗∗
Age 70+ 5.19∗∗∗ 4.57∗∗∗ 5.38∗∗∗ 4.71∗∗∗ 5.19∗∗∗ 4.19∗∗∗
Poor SRH x Age 60-69 1.07 1.00 1.10 1.08 1.07 1.02Poor SRH x Age 70+ 1.09 0.95 1.04 1.12 1.09 0.95No schooling 0.95 0.92·
Unmarried 1.37∗∗∗ 1.38∗∗∗
Hindu religion 1.45∗∗∗ 1.42∗∗∗
Treatment area 1.17∗∗∗ 1.10∗∗
ADL, major 1.32∗∗∗ 1.35∗∗∗
ADL, minor 1.19∗∗∗ 1.19∗∗∗
Chronic morbidity 1.00 0.99
AIC 67712.03 67557.68 67691.50 67691.61 67713.96 67527.61Num. events 253 253 253 253 253 253Num. obs. 870 870 870 870 870 870PH test 1.00 1.00 1.00 1.00 1.00 1.00
***p < 0.001, **p < 0.01, *p < 0.05, ·p < 0.1
18 NOBUKO MIZOGUCHI
Table 11. Hazards Ratios of Mortality by Self-Reported Health Sta-tus, Age Groups, and Sex, Matlab HDSS Area, Bangladesh, 5-10 YearsFollow-Up (2001-2011)
Model 1 Model 2 Model 3 Model 4 Model 5 Model 6
MalesGood SRH, 50-59 years old 1.00 1.00 1.00 1.00 1.00 1.00Poor SRH, 50-59 years old 1.59 1.61 1.60 1.45 1.50 1.42Good SRH, 60-69 years old 2.40 2.41 2.41 2.31 2.35 2.31Poor SRH, 60-69 years old 2.15 2.20 2.15 1.67 1.98 1.65Good SRH, 70 years and older 3.35 3.49 3.35 2.87 3.14 2.96Poor SRH, 70 years and older 6.21 6.55 6.15 5.10 5.84 5.49
FemalesGood SRH, 50-59 years old 1.00 1.00 1.00 1.00 1.00 1.00Poor SRH, 50-59 years old 1.88 1.88 1.89 1.78 1.89 1.80Good SRH, 60-69 years old 2.71 2.59 2.70 2.59 2.72 2.45Poor SRH, 60-69 years old 5.47 4.88 5.59 4.97 5.49 4.50Good SRH, 70 years and older 5.19 4.57 5.38 4.71 5.19 4.19Poor SRH, 70 years and older 10.69 8.13 10.61 9.35 10.71 7.14
The analysis also sheds some light on what sociodemographic ‘lens’ may influenceassessment of own health status, thus confirming Sen’s argument [15], that people’sself assessment of health is rooted in their own social experience. My study showsthat women are more likely to report poor health status but not after accounting forfunctional limitations. However, unlike Sen’s reasoning, those with no schooling aremore likely to report poor health status. Also, unmarried persons are more likely toreport poor health status. Religion is not associated with higher odds of reportingpoor health status; neither is icddr,b treatment area. The use of icddr,b treatmentarea may not be an accurate reflection of access to health information for this agegroup. Services provided by icddr,b are maternal and child health related and donot concern elderly health care.
Finally, the results of this study is consistent with the growing body of literature thatshows that self-reported health is a fairly good predictor of mortality and confirmsearlier findings in Bangladesh by Kuhn et. al [6] and Razzaque et al [13]. It however,does not provide support for Sen’s misgivings about the measure’s validity in lowincome settings. My findings indicate that for both men and women, across mostage groups, reporting poor health status significantly increases the hazards of deaththroughout 15 years of follow-up.
SELF-RATED HEALTH AND MORTALITY AMONG THE ELDERLY IN MATLAB, BANGLADESH* 919
Acknowledgements
I would like to thank the staff at the icddr,b Center for Population, Urbanization,and Climate Change in Dhaka and at the Matlab Health and Demographic Surveil-lance System for data collection, management, and their generosity in giving metime, advice, and office space. Also, I would like to thank Jane Menken for her feed-back. This work was supported by Award Number R01AG033713 from the NationalInstitute on Aging.
References
[1] Jiajian Chen and Zheng Wu. Gender differences in the effects of self-rated healthstatus on mortality among the oldest old in china. In Zeng Yi, Dudley L. Pos-ton Jr, Denese Ashbaugh Vlosky, and Danan Gu, editors, Healthy Longevityin China, number 20 in Demographic Methods and Population Analysis, pages397–418. Springer Netherlands, January 2008.
[2] Cornelius Debpuur, Paul Welaga, George Wak, and Abraham Hodgson. Self-reported health and functional limitations among older people in the Kassena-Nankana District, Ghana. Global Health Action Supplement, 2:2010, 2010.
[3] Elizabeth Frankenberg and Nathan R. Jones. Self-rated health and mortality:Does the relationship extend to a low income setting? Journal of Health andSocial Behavior, 45(4):441–452, December 2004.
[4] Siddhivinayak Hirve, Sanjay Juvekar, Somnath Sambhudas, Pallavi Lele, YuliaBlomstedt, Stig Wall, Lisa Berkman, Steve Tollman, and Nawi Ng. Does self-rated health predict death in adults aged 50 years and above in India? Evidencefrom a rural population under health and demographic surveillance. Interna-tional Journal of Epidemiology, 41(6):1719–1727, December 2012.
[5] Ellen L. Idler and Yael Benyamini. Self-rated health and mortality: A reviewof twenty-seven community studies. Journal of Health and Social Behavior,38(1):21–37, March 1997.
[6] Randall Kuhn, Omar Rahman, and Jane Menken. Survey measure of health:How well do self-reported and observed indicators measure health and predictmortality? In Barney Cohen and Jane Menken, editors, Aging in Sub-SaharanAfrica: Recommendations for Furthering Research. The National AcademiesPress, Washington, D.C., 2006.
[7] Maria Fernanda Lima-Costa, Cibele C. Cesar, Dora Chor, and Fernando A.Proietti. Self-rated health compared with objectively measured health status
20 NOBUKO MIZOGUCHI
as a tool for mortality risk screening in older adults: 10-year follow-up of theBambuı cohort study of aging. American Journal of Epidemiology, 175(3):228–235, February 2012.
[8] Nawi Ng, Mohammad Hakimi, Ailiana Santosa, Peter Byass, Siswanto AgusWilopo, and Stig Wall. Is self-rated health an independent index for mortalityamong older people in Indonesia? PLoS ONE, 7(4):e35308, April 2012.
[9] F. Obare. Self-assessed health status and morbidity experiences of teenagers inNairobi’s low income settings. African Population Studies, 23(1):3–20, 2007.
[10] Christy Pu, Gao-Jun Tang, Nicole Huang, and Yiing-Jenq Chou. Predictivepower of self-rated health for subsequent mortality risk during old age: analysisof data from a nationally representative survey of elderly adults in Taiwan.Journal of epidemiology / Japan Epidemiological Association, 21(4):278–284,2011.
[11] M. O. Rahman and A. J. Barsky. Self-reported health among older Bangladeshis:how good a health indicator is it? The Gerontologist, 43(6):856, 2003.
[12] O. Rahman, J. Menken, A. Foster, and P. Gertler. Matlab [Bangladesh] healthand socioeconomic survey (MHSS), 1996. Ann Arbor, Michigan: Inter-universityConsortium for Political and Social Research (ICPSR 2705), 1999.
[13] A. Razzaque, AHMG Mustafa, and Peter Kim Streatfield. Do self-reportedhealth indicators predict mortality? evidence from matlab, bangladesh. Journalof Biosocial Science, forthcoming.
[14] Abdur Razzaque, Lutfun Nahar, Masuma Akter Khanam, and Peter Kim Streat-field. Socio-demographic differentials of adult health indicators in Matlab,Bangladesh: self-rated health, health state, quality of life and disability level.Global Health Action, 3(0), September 2010.
[15] Amartya Sen. Health: perception versus observation. BMJ : British MedicalJournal, 324(7342):860–861, April 2002.
[16] S.V. Subramanian, Malavika A. Subramanyam, Sakthivel Selvaraj, and IchiroKawachi. Are self-reports of health and morbidities in developing countriesmisleading? evidence from India. Social Science & Medicine, 68(2):260–265,January 2009.
[17] Ho-Jui Tung. Trajectory patterns of self-rated health among the elderly in Tai-wan: A comparison across ethnicity. Journal of Population Studies, 35:113145,2007.
SELF-RATED HEALTH AND MORTALITY AMONG THE ELDERLY IN MATLAB, BANGLADESH* 1021
[18] Z. Helen Wu and Laura Rudkin. Social contact, socioeconomic status, and thehealth status of older Malaysians. The Gerontologist, 40(2):228–234, April 2000.
[19] Elena S. H. Yu, Yin M. Kean, Donald J. Slymen, William T. Liu, MingyuanZhang, and Robert Katzman. Self-perceived health and 5-year mortality risksamong the elderly in Shanghai, China. American Journal of Epidemiology,147(9):880–890, May 1998.
[20] Zachary Zimmer, Josefina Natividad, Hui-Sheng Lin, and Napaporn Chayovan.A cross-national examination of the determinants of self-assessed health. Journalof Health and Social Behavior, 41(4):465–481, December 2000.
Related Documents


![Self-management interventions for adolescents living with ...Ryan & Sawin (2009) [16] Sawin (2017) [11] † Enhancing knowledge and beliefs (self-efficacy, outcome expectancy, goal](https://static.cupdf.com/doc/110x72/613257dddfd10f4dd73a635d/self-management-interventions-for-adolescents-living-with-ryan-sawin-2009.jpg)