Biochem. J. (2012) 447, 125–136 (Printed in Great Britain) doi:10.1042/BJ20120941 125 Selective STAT3-α or -β expression reveals spliceform-specific phosphorylation kinetics, nuclear retention and distinct gene expression outcomes Ivan H. W. NG*†, Dominic C. H. NG*, David A. JANS† and Marie A. BOGOYEVITCH* 1 *Department of Biochemistry and Molecular Biology, Bio21 Molecular Science and Biotechnology Institute, University of Melbourne, Victoria 3010, Australia, and †Department of Biochemistry and Molecular Biology, Monash University, Victoria 3800, Australia Phosphorylation of STAT3 (signal transducer and activator of transcription 3) is critical for its nuclear import and transcriptional activity. Although a shorter STAT3β spliceform was initially described as a negative regulator of STAT3α, gene knockout studies have revealed that both forms play critical roles. We have expressed STAT3α and STAT3β at comparable levels to facilitate a direct comparison of their functional effects, and have shown their different cytokine-stimulated kinetics of phosphorylation and nuclear translocation. Notably, the sustained nuclear translocation and phosphorylation of STAT3β following cytokine exposure contrasted with a transient nuclear translocation and phosphorylation of STAT3α. Importantly, co- expression of the spliceforms revealed that STAT3β enhanced and prolonged the phosphorylation and nuclear retention of STAT3α, but a STAT3β R609L mutant, with a disrupted SH2 (Src homology 2) domain, was not tyrosine phosphorylated following cytokine stimulation and could not cross-regulate STAT3α. The physiological importance of prolonged phosphorylation and nuclear retention was indicated by transcriptome profiling of STAT3 − / − cells expressing either STAT3α or STAT3β , revealing the complexity of genes that are up- and down-regulated by the STAT3 spliceforms, including a distinct set of STAT3β - specific genes regulated under basal conditions and after cytokine stimulation. These results highlight STAT3β as a significant transcriptional regulator in its own right, with additional actions to cross-regulate STAT3α phosphorylation and nuclear retention after cytokine stimulation. Key words: cytokine, interleukin-6 (IL-6), nucleocytoplasmic trafficking, signal transducer and activator of transcription 3 (STAT3), transcription factor, transcriptome analysis. INTRODUCTION STAT3 (signal transducer and activator of transcription 3), initially identified as an acute-phase response factor binding to the acute-phase response element in IL (interleukin)-6-stimulated hepatocytes, is a pleiotropic transcription factor capable of mediating rapid changes in gene expression following cytokine, hormone or growth factor stimulation [1–3]. The IL-6 family of cytokines, which includes OSM (oncostatin M) and LIF (leukaemia inhibitory factor), signals through the common gp130 (glycoprotein 130) receptor chain to activate STAT3 [4]. This activation of STAT3 requires the phosphorylation of Tyr 705 and Ser 727 . In the most widely accepted paradigm of signalling via STAT3, the phosphorylation of STAT3 Tyr 705 by JAKs (Janus kinases) is critical for STAT3 dimerization and subsequent cytokine-stimulated nuclear translocation, whereas the phosphorylation of Ser 727 by serine/threonine kinases such as the MAPKs (mitogen-activated protein kinases) enhances STAT3 transcriptional activity [5,6]. Thus phosphorylation of STAT3 provides a key regulatory mechanism communicating extracellular events to cytokine-induced gene expression changes. The functional importance of STAT3 has been shown by the early embryonic lethality of Stat3 − / − mice [7]. Subsequent tissue-specific deletion studies have revealed important roles of STAT3in inflammatory responses in the liver, proliferation and differentiation in monocytes and neutrophils in response to granulocyte colony-stimulating factor, protection from apoptosis in the mammary epithelium, neuronal cell survival and keratinocyte migration [5,8]. In addition, a persistent activation of STAT3 in a wide variety of cancers and diseases, such as multiple myeloma, head and neck cancer, breast cancer and other solid tumours, leukaemias and lymphomas [9] has further intensified interest in understanding regulators of STAT3 activation. Two distinct STAT3 isoforms originating from alternative splicing have been described. STAT3α (92 kDa) is 770 amino acids in length, whereas STAT3β (84 kDa) is identical in sequence with the exception of 55 amino acids at the C-terminal tail that are replaced with a unique seven-amino-acid sequence (Figure 1A) [10,11]. As a consequence, the transactivation domain of STAT3β is truncated relative to this domain in STAT3α. This has led to suggestions of impaired transcriptional activity and a role as a dominant-negative regulator of STAT3α [10]. Although the generally lower expression levels of STAT3β compared with STAT3α imply that STAT3α plays a more significant functional role in vivo, there are clear exceptions, such as the levels of STAT3β exceeding STAT3α during myeloid differentiation, pointing to a requirement for high STAT3β levels to act as a mediator during these differentiation events Abbreviations used: CLSM, confocal laser-scanning microscopy; DAPI, 4 ,6-diamidino-2-phenylindole; DMEM, Dulbecco’s modified Eagle’s medium; ERt, substrate-binding portion of the oestrogen receptor; F c, cytoplasmic fluorescence; FBS, fetal bovine serum; F n, nuclear fluorescence; F n/F c, ratio of nuclear to cytoplasmic fluorescence; GO, gene ontology; gp130, glycoprotein 130; HEK, human embryonic kidney; Hsp90, heat-shock protein of 90 kDa; 4-HT, 4-hydroxytamoxifen; IL, interleukin; iSTAT3, inducible specific STAT3 spliceform; JAK, Janus kinase; MAPK, mitogen-activated protein kinase; MEF, murine embryonic fibroblast; OSM, oncostatin M; SH2, Src homology 2; SHP, SH2 domain-containing protein tyrosine phosphatase; STAT3, signal transducer and activator of transcription 3; VP16, viral protein 16; WT, wild-type. 1 To whom correspondence should be addressed (email [email protected]). c The Authors Journal compilation c 2012 Biochemical Society Biochemical Journal www.biochemj.org © 2012 The Author(s) The author(s) has paid for this article to be freely available under the terms of the Creative Commons Attribution Non-Commercial Licence (http://creativecommons.org/licenses/by-nc/2.5/) which permits unrestricted non-commercial use, distribution and reproduction in any medium, provided the original work is properly cited.

Welcome message from author
This document is posted to help you gain knowledge. Please leave a comment to let me know what you think about it! Share it to your friends and learn new things together.
Transcript
Biochem. J. (2012) 447, 125–136 (Printed in Great Britain) doi:10.1042/BJ20120941 125
Selective STAT3-α or -β expression reveals spliceform-specificphosphorylation kinetics, nuclear retention and distinct gene expressionoutcomesIvan H. W. NG*†, Dominic C. H. NG*, David A. JANS† and Marie A. BOGOYEVITCH*1
*Department of Biochemistry and Molecular Biology, Bio21 Molecular Science and Biotechnology Institute, University of Melbourne, Victoria 3010, Australia, and †Department ofBiochemistry and Molecular Biology, Monash University, Victoria 3800, Australia
Phosphorylation of STAT3 (signal transducer and activator oftranscription 3) is critical for its nuclear import and transcriptionalactivity. Although a shorter STAT3β spliceform was initiallydescribed as a negative regulator of STAT3α, gene knockoutstudies have revealed that both forms play critical roles. Wehave expressed STAT3α and STAT3β at comparable levelsto facilitate a direct comparison of their functional effects,and have shown their different cytokine-stimulated kineticsof phosphorylation and nuclear translocation. Notably, thesustained nuclear translocation and phosphorylation of STAT3βfollowing cytokine exposure contrasted with a transient nucleartranslocation and phosphorylation of STAT3α. Importantly, co-expression of the spliceforms revealed that STAT3β enhancedand prolonged the phosphorylation and nuclear retention ofSTAT3α, but a STAT3β R609L mutant, with a disrupted SH2 (Srchomology 2) domain, was not tyrosine phosphorylated following
cytokine stimulation and could not cross-regulate STAT3α.The physiological importance of prolonged phosphorylation andnuclear retention was indicated by transcriptome profiling ofSTAT3− / − cells expressing either STAT3α or STAT3β, revealingthe complexity of genes that are up- and down-regulatedby the STAT3 spliceforms, including a distinct set of STAT3β-specific genes regulated under basal conditions and after cytokinestimulation. These results highlight STAT3β as a significanttranscriptional regulator in its own right, with additional actionsto cross-regulate STAT3α phosphorylation and nuclear retentionafter cytokine stimulation.
Key words: cytokine, interleukin-6 (IL-6), nucleocytoplasmictrafficking, signal transducer and activator of transcription 3(STAT3), transcription factor, transcriptome analysis.
INTRODUCTION
STAT3 (signal transducer and activator of transcription 3), initiallyidentified as an acute-phase response factor binding to theacute-phase response element in IL (interleukin)-6-stimulatedhepatocytes, is a pleiotropic transcription factor capable ofmediating rapid changes in gene expression following cytokine,hormone or growth factor stimulation [1–3]. The IL-6 familyof cytokines, which includes OSM (oncostatin M) and LIF(leukaemia inhibitory factor), signals through the commongp130 (glycoprotein 130) receptor chain to activate STAT3[4]. This activation of STAT3 requires the phosphorylationof Tyr705 and Ser727. In the most widely accepted paradigm ofsignalling via STAT3, the phosphorylation of STAT3 Tyr705 byJAKs (Janus kinases) is critical for STAT3 dimerization andsubsequent cytokine-stimulated nuclear translocation, whereasthe phosphorylation of Ser727 by serine/threonine kinases suchas the MAPKs (mitogen-activated protein kinases) enhancesSTAT3 transcriptional activity [5,6]. Thus phosphorylationof STAT3 provides a key regulatory mechanism communicatingextracellular events to cytokine-induced gene expression changes.
The functional importance of STAT3 has been shown bythe early embryonic lethality of Stat3− / − mice [7]. Subsequenttissue-specific deletion studies have revealed important roles
of STAT3 in inflammatory responses in the liver, proliferationand differentiation in monocytes and neutrophils in response togranulocyte colony-stimulating factor, protection from apoptosisin the mammary epithelium, neuronal cell survival andkeratinocyte migration [5,8]. In addition, a persistent activation ofSTAT3 in a wide variety of cancers and diseases, such as multiplemyeloma, head and neck cancer, breast cancer and other solidtumours, leukaemias and lymphomas [9] has further intensifiedinterest in understanding regulators of STAT3 activation.
Two distinct STAT3 isoforms originating from alternativesplicing have been described. STAT3α (92 kDa) is 770 aminoacids in length, whereas STAT3β (84 kDa) is identical in sequencewith the exception of 55 amino acids at the C-terminal tailthat are replaced with a unique seven-amino-acid sequence(Figure 1A) [10,11]. As a consequence, the transactivation domainof STAT3β is truncated relative to this domain in STAT3α.This has led to suggestions of impaired transcriptional activityand a role as a dominant-negative regulator of STAT3α [10].Although the generally lower expression levels of STAT3βcompared with STAT3α imply that STAT3α plays a moresignificant functional role in vivo, there are clear exceptions,such as the levels of STAT3β exceeding STAT3α during myeloiddifferentiation, pointing to a requirement for high STAT3βlevels to act as a mediator during these differentiation events
Abbreviations used: CLSM, confocal laser-scanning microscopy; DAPI, 4′,6-diamidino-2-phenylindole; DMEM, Dulbecco’s modified Eagle’s medium;ERt, substrate-binding portion of the oestrogen receptor; Fc, cytoplasmic fluorescence; FBS, fetal bovine serum; Fn, nuclear fluorescence; Fn/Fc, ratioof nuclear to cytoplasmic fluorescence; GO, gene ontology; gp130, glycoprotein 130; HEK, human embryonic kidney; Hsp90, heat-shock protein of 90kDa; 4-HT, 4-hydroxytamoxifen; IL, interleukin; iSTAT3, inducible specific STAT3 spliceform; JAK, Janus kinase; MAPK, mitogen-activated protein kinase;MEF, murine embryonic fibroblast; OSM, oncostatin M; SH2, Src homology 2; SHP, SH2 domain-containing protein tyrosine phosphatase; STAT3, signaltransducer and activator of transcription 3; VP16, viral protein 16; WT, wild-type.
1 To whom correspondence should be addressed (email [email protected]).
c© The Authors Journal compilation c© 2012 Biochemical Society
Bio
chem
ical
Jo
urn
al
ww
w.b
ioch
emj.o
rg
© 2012 The Author(s)
The author(s) has paid for this article to be freely available under the terms of the Creative Commons Attribution Non-Commercial Licence (http://creativecommons.org/licenses/by-nc/2.5/)which permits unrestricted non-commercial use, distribution and reproduction in any medium, provided the original work is properly cited.
126 I. H. W. Ng and others
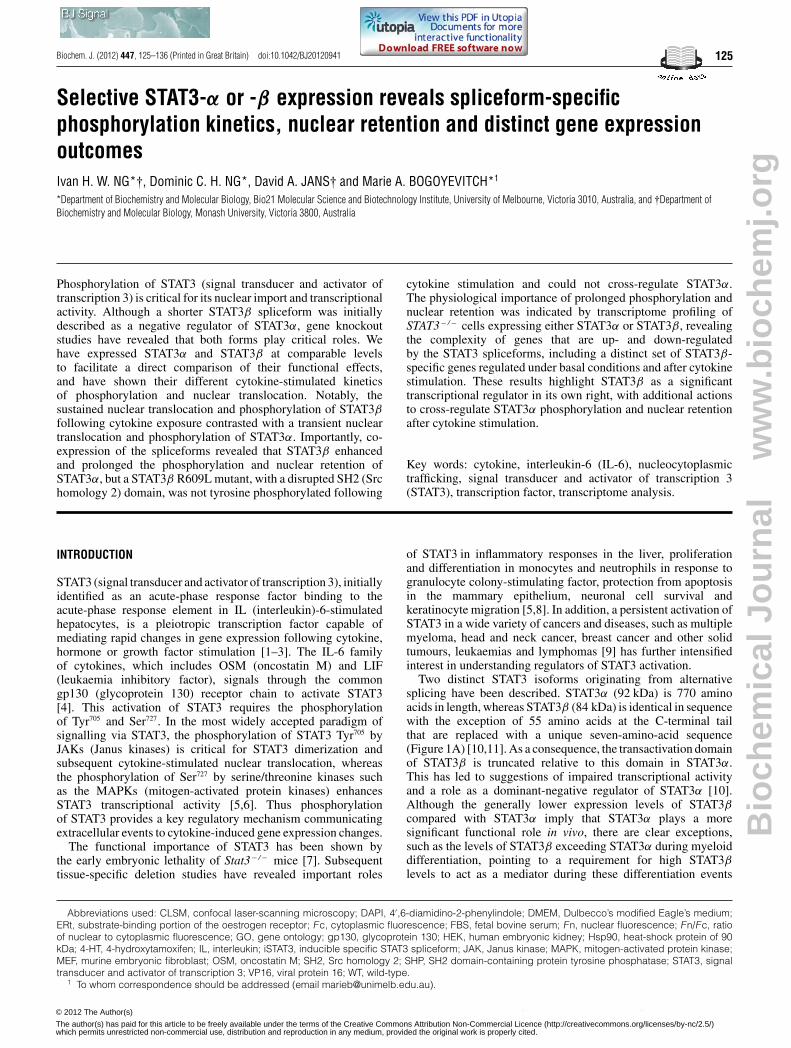
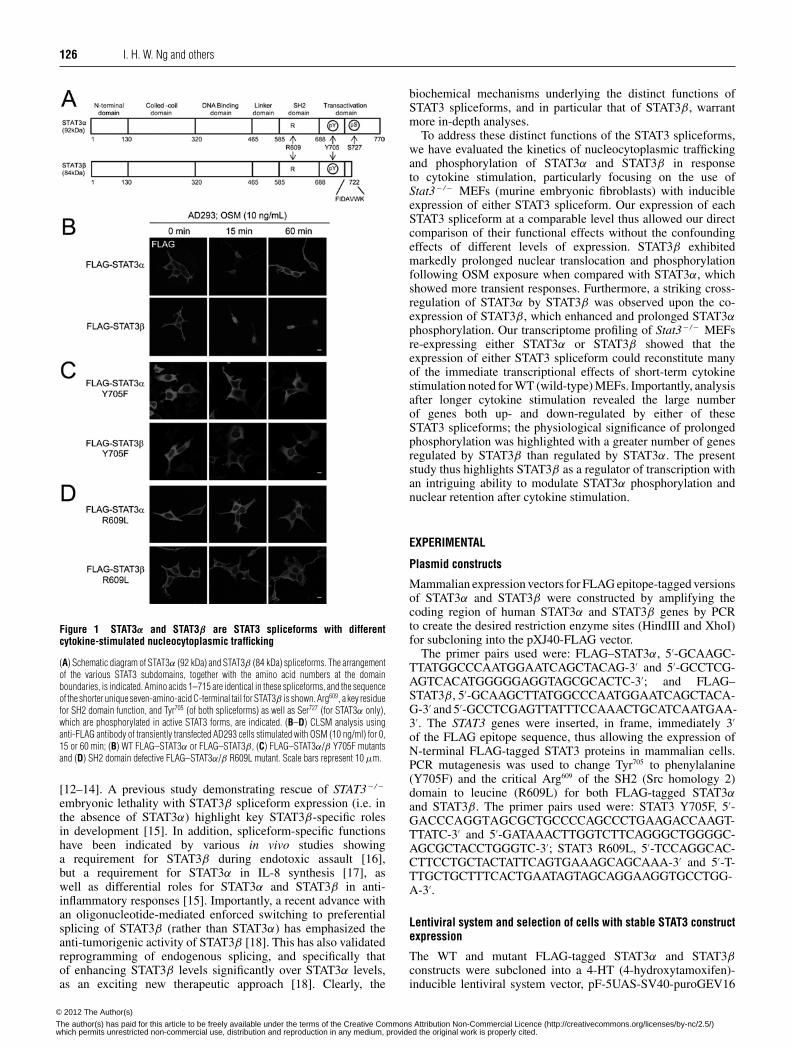
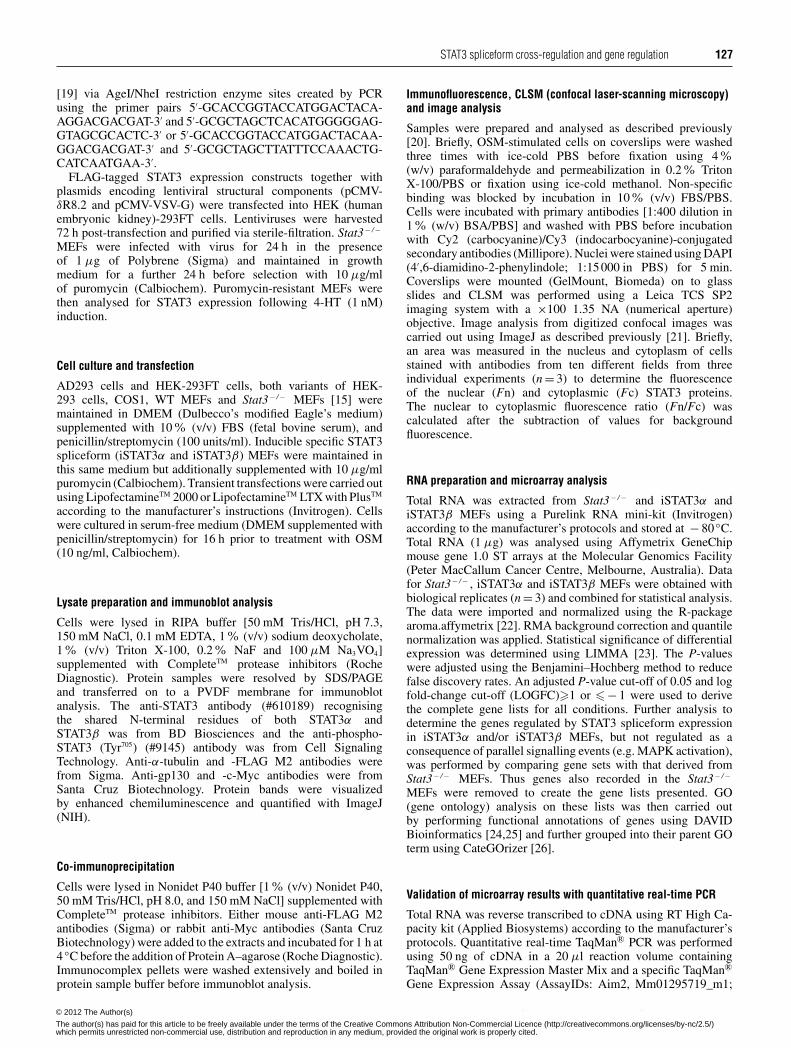
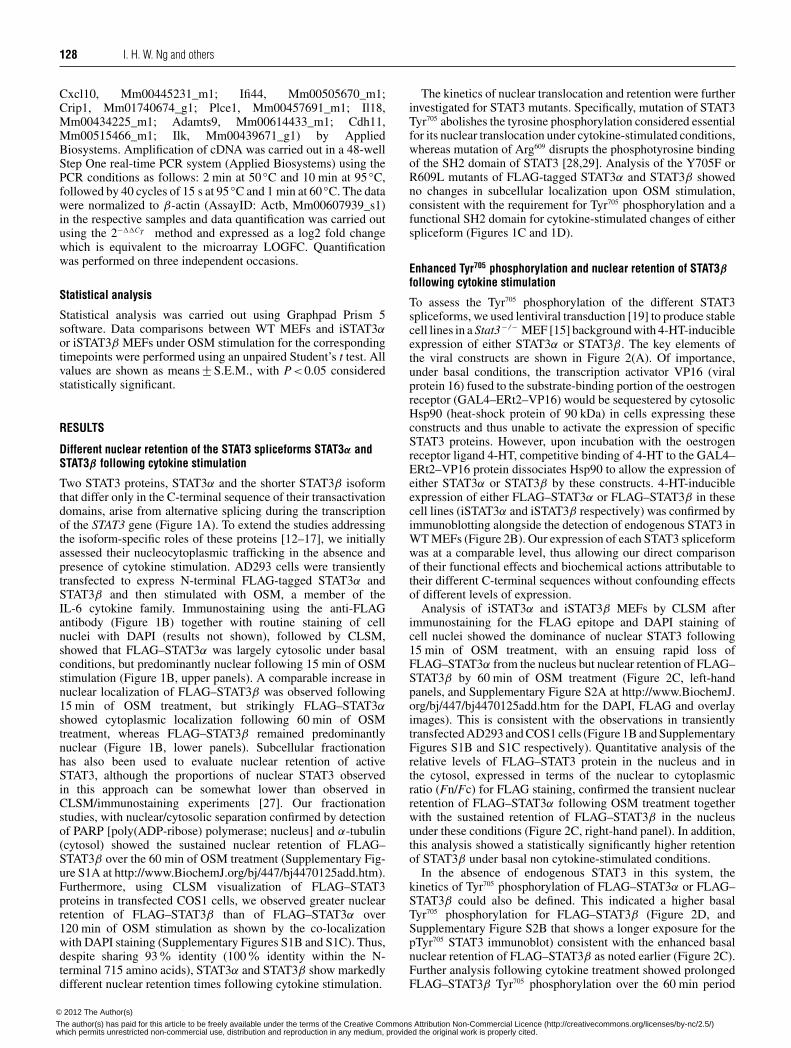
Figure 1 STAT3α and STAT3β are STAT3 spliceforms with differentcytokine-stimulated nucleocytoplasmic trafficking
(A) Schematic diagram of STAT3α (92 kDa) and STAT3β (84 kDa) spliceforms. The arrangementof the various STAT3 subdomains, together with the amino acid numbers at the domainboundaries, is indicated. Amino acids 1–715 are identical in these spliceforms, and the sequenceof the shorter unique seven-amino-acid C-terminal tail for STAT3β is shown. Arg609, a key residuefor SH2 domain function, and Tyr705 (of both spliceforms) as well as Ser727 (for STAT3α only),which are phosphorylated in active STAT3 forms, are indicated. (B–D) CLSM analysis usinganti-FLAG antibody of transiently transfected AD293 cells stimulated with OSM (10 ng/ml) for 0,15 or 60 min; (B) WT FLAG–STAT3α or FLAG–STAT3β , (C) FLAG–STAT3α/β Y705F mutantsand (D) SH2 domain defective FLAG–STAT3α/β R609L mutant. Scale bars represent 10 μm.
[12–14]. A previous study demonstrating rescue of STAT3− / −
embryonic lethality with STAT3β spliceform expression (i.e. inthe absence of STAT3α) highlight key STAT3β-specific rolesin development [15]. In addition, spliceform-specific functionshave been indicated by various in vivo studies showinga requirement for STAT3β during endotoxic assault [16],but a requirement for STAT3α in IL-8 synthesis [17], aswell as differential roles for STAT3α and STAT3β in anti-inflammatory responses [15]. Importantly, a recent advance withan oligonucleotide-mediated enforced switching to preferentialsplicing of STAT3β (rather than STAT3α) has emphasized theanti-tumorigenic activity of STAT3β [18]. This has also validatedreprogramming of endogenous splicing, and specifically thatof enhancing STAT3β levels significantly over STAT3α levels,as an exciting new therapeutic approach [18]. Clearly, the
biochemical mechanisms underlying the distinct functions ofSTAT3 spliceforms, and in particular that of STAT3β, warrantmore in-depth analyses.
To address these distinct functions of the STAT3 spliceforms,we have evaluated the kinetics of nucleocytoplasmic traffickingand phosphorylation of STAT3α and STAT3β in responseto cytokine stimulation, particularly focusing on the use ofStat3− / − MEFs (murine embryonic fibroblasts) with inducibleexpression of either STAT3 spliceform. Our expression of eachSTAT3 spliceform at a comparable level thus allowed our directcomparison of their functional effects without the confoundingeffects of different levels of expression. STAT3β exhibitedmarkedly prolonged nuclear translocation and phosphorylationfollowing OSM exposure when compared with STAT3α, whichshowed more transient responses. Furthermore, a striking cross-regulation of STAT3α by STAT3β was observed upon the co-expression of STAT3β, which enhanced and prolonged STAT3αphosphorylation. Our transcriptome profiling of Stat3− / − MEFsre-expressing either STAT3α or STAT3β showed that theexpression of either STAT3 spliceform could reconstitute manyof the immediate transcriptional effects of short-term cytokinestimulation noted for WT (wild-type) MEFs. Importantly, analysisafter longer cytokine stimulation revealed the large numberof genes both up- and down-regulated by either of theseSTAT3 spliceforms; the physiological significance of prolongedphosphorylation was highlighted with a greater number of genesregulated by STAT3β than regulated by STAT3α. The presentstudy thus highlights STAT3β as a regulator of transcription withan intriguing ability to modulate STAT3α phosphorylation andnuclear retention after cytokine stimulation.
EXPERIMENTAL
Plasmid constructs
Mammalian expression vectors for FLAG epitope-tagged versionsof STAT3α and STAT3β were constructed by amplifying thecoding region of human STAT3α and STAT3β genes by PCRto create the desired restriction enzyme sites (HindIII and XhoI)for subcloning into the pXJ40-FLAG vector.
The primer pairs used were: FLAG–STAT3α, 5′-GCAAGC-TTATGGCCCAATGGAATCAGCTACAG-3′ and 5′-GCCTCG-AGTCACATGGGGGAGGTAGCGCACTC-3′; and FLAG–STAT3β, 5′-GCAAGCTTATGGCCCAATGGAATCAGCTACA-G-3′ and 5′-GCCTCGAGTTATTTCCAAACTGCATCAATGAA-3′. The STAT3 genes were inserted, in frame, immediately 3′
of the FLAG epitope sequence, thus allowing the expression ofN-terminal FLAG-tagged STAT3 proteins in mammalian cells.PCR mutagenesis was used to change Tyr705 to phenylalanine(Y705F) and the critical Arg609 of the SH2 (Src homology 2)domain to leucine (R609L) for both FLAG-tagged STAT3αand STAT3β. The primer pairs used were: STAT3 Y705F, 5′-GACCCAGGTAGCGCTGCCCCAGCCCTGAAGACCAAGT-TTATC-3′ and 5′-GATAAACTTGGTCTTCAGGGCTGGGGC-AGCGCTACCTGGGTC-3′; STAT3 R609L, 5′-TCCAGGCAC-CTTCCTGCTACTATTCAGTGAAAGCAGCAAA-3′ and 5′-T-TTGCTGCTTTCACTGAATAGTAGCAGGAAGGTGCCTGG-A-3′.
Lentiviral system and selection of cells with stable STAT3 constructexpression
The WT and mutant FLAG-tagged STAT3α and STAT3βconstructs were subcloned into a 4-HT (4-hydroxytamoxifen)-inducible lentiviral system vector, pF-5UAS-SV40-puroGEV16
c© The Authors Journal compilation c© 2012 Biochemical Society© 2012 The Author(s)
The author(s) has paid for this article to be freely available under the terms of the Creative Commons Attribution Non-Commercial Licence (http://creativecommons.org/licenses/by-nc/2.5/)which permits unrestricted non-commercial use, distribution and reproduction in any medium, provided the original work is properly cited.
STAT3 spliceform cross-regulation and gene regulation 127
[19] via AgeI/NheI restriction enzyme sites created by PCRusing the primer pairs 5′-GCACCGGTACCATGGACTACA-AGGACGACGAT-3′ and 5′-GCGCTAGCTCACATGGGGGAG-GTAGCGCACTC-3′ or 5′-GCACCGGTACCATGGACTACAA-GGACGACGAT-3′ and 5′-GCGCTAGCTTATTTCCAAACTG-CATCAATGAA-3′.
FLAG-tagged STAT3 expression constructs together withplasmids encoding lentiviral structural components (pCMV-δR8.2 and pCMV-VSV-G) were transfected into HEK (humanembryonic kidney)-293FT cells. Lentiviruses were harvested72 h post-transfection and purified via sterile-filtration. Stat3− / −
MEFs were infected with virus for 24 h in the presenceof 1 μg of Polybrene (Sigma) and maintained in growthmedium for a further 24 h before selection with 10 μg/mlof puromycin (Calbiochem). Puromycin-resistant MEFs werethen analysed for STAT3 expression following 4-HT (1 nM)induction.
Cell culture and transfection
AD293 cells and HEK-293FT cells, both variants of HEK-293 cells, COS1, WT MEFs and Stat3− / − MEFs [15] weremaintained in DMEM (Dulbecco’s modified Eagle’s medium)supplemented with 10% (v/v) FBS (fetal bovine serum), andpenicillin/streptomycin (100 units/ml). Inducible specific STAT3spliceform (iSTAT3α and iSTAT3β) MEFs were maintained inthis same medium but additionally supplemented with 10 μg/mlpuromycin (Calbiochem). Transient transfections were carried outusing LipofectamineTM 2000 or LipofectamineTM LTX with PlusTM
according to the manufacturer’s instructions (Invitrogen). Cellswere cultured in serum-free medium (DMEM supplemented withpenicillin/streptomycin) for 16 h prior to treatment with OSM(10 ng/ml, Calbiochem).
Lysate preparation and immunoblot analysis
Cells were lysed in RIPA buffer [50 mM Tris/HCl, pH 7.3,150 mM NaCl, 0.1 mM EDTA, 1% (v/v) sodium deoxycholate,1% (v/v) Triton X-100, 0.2% NaF and 100 μM Na3VO4]supplemented with CompleteTM protease inhibitors (RocheDiagnostic). Protein samples were resolved by SDS/PAGEand transferred on to a PVDF membrane for immunoblotanalysis. The anti-STAT3 antibody (#610189) recognisingthe shared N-terminal residues of both STAT3α andSTAT3β was from BD Biosciences and the anti-phospho-STAT3 (Tyr705) (#9145) antibody was from Cell SignalingTechnology. Anti-α-tubulin and -FLAG M2 antibodies werefrom Sigma. Anti-gp130 and -c-Myc antibodies were fromSanta Cruz Biotechnology. Protein bands were visualizedby enhanced chemiluminescence and quantified with ImageJ(NIH).
Co-immunoprecipitation
Cells were lysed in Nonidet P40 buffer [1 % (v/v) Nonidet P40,50 mM Tris/HCl, pH 8.0, and 150 mM NaCl] supplemented withCompleteTM protease inhibitors. Either mouse anti-FLAG M2antibodies (Sigma) or rabbit anti-Myc antibodies (Santa CruzBiotechnology) were added to the extracts and incubated for 1 h at4 ◦C before the addition of Protein A–agarose (Roche Diagnostic).Immunocomplex pellets were washed extensively and boiled inprotein sample buffer before immunoblot analysis.
Immunofluorescence, CLSM (confocal laser-scanning microscopy)and image analysis
Samples were prepared and analysed as described previously[20]. Briefly, OSM-stimulated cells on coverslips were washedthree times with ice-cold PBS before fixation using 4 %(w/v) paraformaldehyde and permeabilization in 0.2% TritonX-100/PBS or fixation using ice-cold methanol. Non-specificbinding was blocked by incubation in 10% (v/v) FBS/PBS.Cells were incubated with primary antibodies [1:400 dilution in1% (w/v) BSA/PBS] and washed with PBS before incubationwith Cy2 (carbocyanine)/Cy3 (indocarbocyanine)-conjugatedsecondary antibodies (Millipore). Nuclei were stained using DAPI(4′,6-diamidino-2-phenylindole; 1:15000 in PBS) for 5 min.Coverslips were mounted (GelMount, Biomeda) on to glassslides and CLSM was performed using a Leica TCS SP2imaging system with a ×100 1.35 NA (numerical aperture)objective. Image analysis from digitized confocal images wascarried out using ImageJ as described previously [21]. Briefly,an area was measured in the nucleus and cytoplasm of cellsstained with antibodies from ten different fields from threeindividual experiments (n = 3) to determine the fluorescenceof the nuclear (Fn) and cytoplasmic (Fc) STAT3 proteins.The nuclear to cytoplasmic fluorescence ratio (Fn/Fc) wascalculated after the subtraction of values for backgroundfluorescence.
RNA preparation and microarray analysis
Total RNA was extracted from Stat3− / − and iSTAT3α andiSTAT3β MEFs using a Purelink RNA mini-kit (Invitrogen)according to the manufacturer’s protocols and stored at − 80 ◦C.Total RNA (1 μg) was analysed using Affymetrix GeneChipmouse gene 1.0 ST arrays at the Molecular Genomics Facility(Peter MacCallum Cancer Centre, Melbourne, Australia). Datafor Stat3− / − , iSTAT3α and iSTAT3β MEFs were obtained withbiological replicates (n = 3) and combined for statistical analysis.The data were imported and normalized using the R-packagearoma.affymetrix [22]. RMA background correction and quantilenormalization was applied. Statistical significance of differentialexpression was determined using LIMMA [23]. The P-valueswere adjusted using the Benjamini–Hochberg method to reducefalse discovery rates. An adjusted P-value cut-off of 0.05 and logfold-change cut-off (LOGFC)�1 or �− 1 were used to derivethe complete gene lists for all conditions. Further analysis todetermine the genes regulated by STAT3 spliceform expressionin iSTAT3α and/or iSTAT3β MEFs, but not regulated as aconsequence of parallel signalling events (e.g. MAPK activation),was performed by comparing gene sets with that derived fromStat3− / − MEFs. Thus genes also recorded in the Stat3− / −
MEFs were removed to create the gene lists presented. GO(gene ontology) analysis on these lists was then carried outby performing functional annotations of genes using DAVIDBioinformatics [24,25] and further grouped into their parent GOterm using CateGOrizer [26].
Validation of microarray results with quantitative real-time PCR
Total RNA was reverse transcribed to cDNA using RT High Ca-pacity kit (Applied Biosystems) according to the manufacturer’sprotocols. Quantitative real-time TaqMan® PCR was performedusing 50 ng of cDNA in a 20 μl reaction volume containingTaqMan® Gene Expression Master Mix and a specific TaqMan®
Gene Expression Assay (AssayIDs: Aim2, Mm01295719_m1;
c© The Authors Journal compilation c© 2012 Biochemical Society© 2012 The Author(s)
The author(s) has paid for this article to be freely available under the terms of the Creative Commons Attribution Non-Commercial Licence (http://creativecommons.org/licenses/by-nc/2.5/)which permits unrestricted non-commercial use, distribution and reproduction in any medium, provided the original work is properly cited.
128 I. H. W. Ng and others
Cxcl10, Mm00445231_m1; Ifi44, Mm00505670_m1;Crip1, Mm01740674_g1; Plce1, Mm00457691_m1; Il18,Mm00434225_m1; Adamts9, Mm00614433_m1; Cdh11,Mm00515466_m1; Ilk, Mm00439671_g1) by AppliedBiosystems. Amplification of cDNA was carried out in a 48-wellStep One real-time PCR system (Applied Biosystems) using thePCR conditions as follows: 2 min at 50 ◦C and 10 min at 95 ◦C,followed by 40 cycles of 15 s at 95 ◦C and 1 min at 60 ◦C. The datawere normalized to β-actin (AssayID: Actb, Mm00607939_s1)in the respective samples and data quantification was carried outusing the 2−��CT method and expressed as a log2 fold changewhich is equivalent to the microarray LOGFC. Quantificationwas performed on three independent occasions.
Statistical analysis
Statistical analysis was carried out using Graphpad Prism 5software. Data comparisons between WT MEFs and iSTAT3αor iSTAT3β MEFs under OSM stimulation for the correspondingtimepoints were performed using an unpaired Student’s t test. Allvalues are shown as means +− S.E.M., with P<0.05 consideredstatistically significant.
RESULTS
Different nuclear retention of the STAT3 spliceforms STAT3α andSTAT3β following cytokine stimulation
Two STAT3 proteins, STAT3α and the shorter STAT3β isoformthat differ only in the C-terminal sequence of their transactivationdomains, arise from alternative splicing during the transcriptionof the STAT3 gene (Figure 1A). To extend the studies addressingthe isoform-specific roles of these proteins [12–17], we initiallyassessed their nucleocytoplasmic trafficking in the absence andpresence of cytokine stimulation. AD293 cells were transientlytransfected to express N-terminal FLAG-tagged STAT3α andSTAT3β and then stimulated with OSM, a member of theIL-6 cytokine family. Immunostaining using the anti-FLAGantibody (Figure 1B) together with routine staining of cellnuclei with DAPI (results not shown), followed by CLSM,showed that FLAG–STAT3α was largely cytosolic under basalconditions, but predominantly nuclear following 15 min of OSMstimulation (Figure 1B, upper panels). A comparable increase innuclear localization of FLAG–STAT3β was observed following15 min of OSM treatment, but strikingly FLAG–STAT3αshowed cytoplasmic localization following 60 min of OSMtreatment, whereas FLAG–STAT3β remained predominantlynuclear (Figure 1B, lower panels). Subcellular fractionationhas also been used to evaluate nuclear retention of activeSTAT3, although the proportions of nuclear STAT3 observedin this approach can be somewhat lower than observed inCLSM/immunostaining experiments [27]. Our fractionationstudies, with nuclear/cytosolic separation confirmed by detectionof PARP [poly(ADP-ribose) polymerase; nucleus] and α-tubulin(cytosol) showed the sustained nuclear retention of FLAG–STAT3β over the 60 min of OSM treatment (Supplementary Fig-ure S1A at http://www.BiochemJ.org/bj/447/bj4470125add.htm).Furthermore, using CLSM visualization of FLAG–STAT3proteins in transfected COS1 cells, we observed greater nuclearretention of FLAG–STAT3β than of FLAG–STAT3α over120 min of OSM stimulation as shown by the co-localizationwith DAPI staining (Supplementary Figures S1B and S1C). Thus,despite sharing 93% identity (100 % identity within the N-terminal 715 amino acids), STAT3α and STAT3β show markedlydifferent nuclear retention times following cytokine stimulation.
The kinetics of nuclear translocation and retention were furtherinvestigated for STAT3 mutants. Specifically, mutation of STAT3Tyr705 abolishes the tyrosine phosphorylation considered essentialfor its nuclear translocation under cytokine-stimulated conditions,whereas mutation of Arg609 disrupts the phosphotyrosine bindingof the SH2 domain of STAT3 [28,29]. Analysis of the Y705F orR609L mutants of FLAG-tagged STAT3α and STAT3β showedno changes in subcellular localization upon OSM stimulation,consistent with the requirement for Tyr705 phosphorylation and afunctional SH2 domain for cytokine-stimulated changes of eitherspliceform (Figures 1C and 1D).
Enhanced Tyr705 phosphorylation and nuclear retention of STAT3β
following cytokine stimulation
To assess the Tyr705 phosphorylation of the different STAT3spliceforms, we used lentiviral transduction [19] to produce stablecell lines in a Stat3− / − MEF [15] background with 4-HT-inducibleexpression of either STAT3α or STAT3β. The key elements ofthe viral constructs are shown in Figure 2(A). Of importance,under basal conditions, the transcription activator VP16 (viralprotein 16) fused to the substrate-binding portion of the oestrogenreceptor (GAL4–ERt2–VP16) would be sequestered by cytosolicHsp90 (heat-shock protein of 90 kDa) in cells expressing theseconstructs and thus unable to activate the expression of specificSTAT3 proteins. However, upon incubation with the oestrogenreceptor ligand 4-HT, competitive binding of 4-HT to the GAL4–ERt2–VP16 protein dissociates Hsp90 to allow the expression ofeither STAT3α or STAT3β by these constructs. 4-HT-inducibleexpression of either FLAG–STAT3α or FLAG–STAT3β in thesecell lines (iSTAT3α and iSTAT3β respectively) was confirmed byimmunoblotting alongside the detection of endogenous STAT3 inWT MEFs (Figure 2B). Our expression of each STAT3 spliceformwas at a comparable level, thus allowing our direct comparisonof their functional effects and biochemical actions attributable totheir different C-terminal sequences without confounding effectsof different levels of expression.
Analysis of iSTAT3α and iSTAT3β MEFs by CLSM afterimmunostaining for the FLAG epitope and DAPI staining ofcell nuclei showed the dominance of nuclear STAT3 following15 min of OSM treatment, with an ensuing rapid loss ofFLAG–STAT3α from the nucleus but nuclear retention of FLAG–STAT3β by 60 min of OSM treatment (Figure 2C, left-handpanels, and Supplementary Figure S2A at http://www.BiochemJ.org/bj/447/bj4470125add.htm for the DAPI, FLAG and overlayimages). This is consistent with the observations in transientlytransfected AD293 and COS1 cells (Figure 1B and SupplementaryFigures S1B and S1C respectively). Quantitative analysis of therelative levels of FLAG–STAT3 protein in the nucleus and inthe cytosol, expressed in terms of the nuclear to cytoplasmicratio (Fn/Fc) for FLAG staining, confirmed the transient nuclearretention of FLAG–STAT3α following OSM treatment togetherwith the sustained retention of FLAG–STAT3β in the nucleusunder these conditions (Figure 2C, right-hand panel). In addition,this analysis showed a statistically significantly higher retentionof STAT3β under basal non cytokine-stimulated conditions.
In the absence of endogenous STAT3 in this system, thekinetics of Tyr705 phosphorylation of FLAG–STAT3α or FLAG–STAT3β could also be defined. This indicated a higher basalTyr705 phosphorylation for FLAG–STAT3β (Figure 2D, andSupplementary Figure S2B that shows a longer exposure for thepTyr705 STAT3 immunoblot) consistent with the enhanced basalnuclear retention of FLAG–STAT3β as noted earlier (Figure 2C).Further analysis following cytokine treatment showed prolongedFLAG–STAT3β Tyr705 phosphorylation over the 60 min period
c© The Authors Journal compilation c© 2012 Biochemical Society© 2012 The Author(s)
The author(s) has paid for this article to be freely available under the terms of the Creative Commons Attribution Non-Commercial Licence (http://creativecommons.org/licenses/by-nc/2.5/)which permits unrestricted non-commercial use, distribution and reproduction in any medium, provided the original work is properly cited.
STAT3 spliceform cross-regulation and gene regulation 129
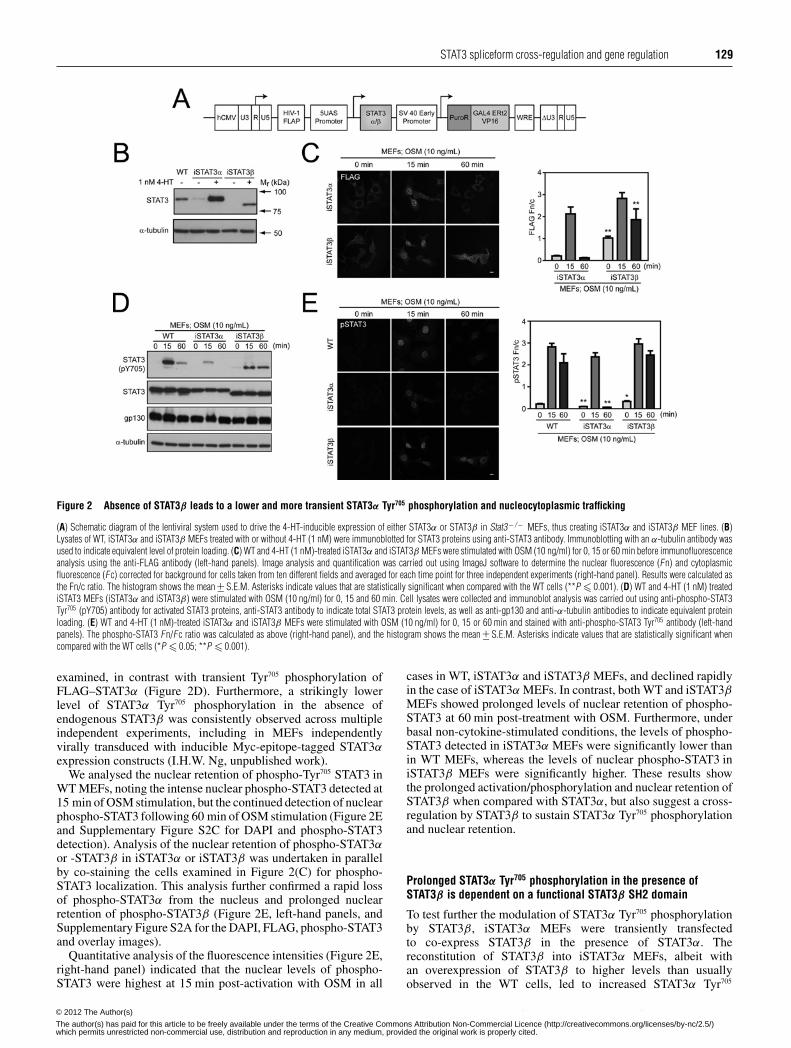
Figure 2 Absence of STAT3β leads to a lower and more transient STAT3α Tyr705 phosphorylation and nucleocytoplasmic trafficking
(A) Schematic diagram of the lentiviral system used to drive the 4-HT-inducible expression of either STAT3α or STAT3β in Stat3− / − MEFs, thus creating iSTAT3α and iSTAT3β MEF lines. (B)Lysates of WT, iSTAT3α and iSTAT3β MEFs treated with or without 4-HT (1 nM) were immunoblotted for STAT3 proteins using anti-STAT3 antibody. Immunoblotting with an α-tubulin antibody wasused to indicate equivalent level of protein loading. (C) WT and 4-HT (1 nM)-treated iSTAT3α and iSTAT3β MEFs were stimulated with OSM (10 ng/ml) for 0, 15 or 60 min before immunofluorescenceanalysis using the anti-FLAG antibody (left-hand panels). Image analysis and quantification was carried out using ImageJ software to determine the nuclear fluorescence (Fn) and cytoplasmicfluorescence (Fc) corrected for background for cells taken from ten different fields and averaged for each time point for three independent experiments (right-hand panel). Results were calculated asthe Fn/c ratio. The histogram shows the mean +− S.E.M. Asterisks indicate values that are statistically significant when compared with the WT cells (**P � 0.001). (D) WT and 4-HT (1 nM) treatediSTAT3 MEFs (iSTAT3α and iSTAT3β) were stimulated with OSM (10 ng/ml) for 0, 15 and 60 min. Cell lysates were collected and immunoblot analysis was carried out using anti-phospho-STAT3Tyr705 (pY705) antibody for activated STAT3 proteins, anti-STAT3 antibody to indicate total STAT3 protein levels, as well as anti-gp130 and anti-α-tubulin antibodies to indicate equivalent proteinloading. (E) WT and 4-HT (1 nM)-treated iSTAT3α and iSTAT3β MEFs were stimulated with OSM (10 ng/ml) for 0, 15 or 60 min and stained with anti-phospho-STAT3 Tyr705 antibody (left-handpanels). The phospho-STAT3 Fn/Fc ratio was calculated as above (right-hand panel), and the histogram shows the mean +− S.E.M. Asterisks indicate values that are statistically significant whencompared with the WT cells (*P � 0.05; **P � 0.001).
examined, in contrast with transient Tyr705 phosphorylation ofFLAG–STAT3α (Figure 2D). Furthermore, a strikingly lowerlevel of STAT3α Tyr705 phosphorylation in the absence ofendogenous STAT3β was consistently observed across multipleindependent experiments, including in MEFs independentlyvirally transduced with inducible Myc-epitope-tagged STAT3αexpression constructs (I.H.W. Ng, unpublished work).
We analysed the nuclear retention of phospho-Tyr705 STAT3 inWT MEFs, noting the intense nuclear phospho-STAT3 detected at15 min of OSM stimulation, but the continued detection of nuclearphospho-STAT3 following 60 min of OSM stimulation (Figure 2Eand Supplementary Figure S2C for DAPI and phospho-STAT3detection). Analysis of the nuclear retention of phospho-STAT3αor -STAT3β in iSTAT3α or iSTAT3β was undertaken in parallelby co-staining the cells examined in Figure 2(C) for phospho-STAT3 localization. This analysis further confirmed a rapid lossof phospho-STAT3α from the nucleus and prolonged nuclearretention of phospho-STAT3β (Figure 2E, left-hand panels, andSupplementary Figure S2A for the DAPI, FLAG, phospho-STAT3and overlay images).
Quantitative analysis of the fluorescence intensities (Figure 2E,right-hand panel) indicated that the nuclear levels of phospho-STAT3 were highest at 15 min post-activation with OSM in all
cases in WT, iSTAT3α and iSTAT3β MEFs, and declined rapidlyin the case of iSTAT3α MEFs. In contrast, both WT and iSTAT3βMEFs showed prolonged levels of nuclear retention of phospho-STAT3 at 60 min post-treatment with OSM. Furthermore, underbasal non-cytokine-stimulated conditions, the levels of phospho-STAT3 detected in iSTAT3α MEFs were significantly lower thanin WT MEFs, whereas the levels of nuclear phospho-STAT3 iniSTAT3β MEFs were significantly higher. These results showthe prolonged activation/phosphorylation and nuclear retention ofSTAT3β when compared with STAT3α, but also suggest a cross-regulation by STAT3β to sustain STAT3α Tyr705 phosphorylationand nuclear retention.
Prolonged STAT3α Tyr705 phosphorylation in the presence ofSTAT3β is dependent on a functional STAT3β SH2 domain
To test further the modulation of STAT3α Tyr705 phosphorylationby STAT3β, iSTAT3α MEFs were transiently transfectedto co-express STAT3β in the presence of STAT3α. Thereconstitution of STAT3β into iSTAT3α MEFs, albeit withan overexpression of STAT3β to higher levels than usuallyobserved in the WT cells, led to increased STAT3α Tyr705
c© The Authors Journal compilation c© 2012 Biochemical Society© 2012 The Author(s)
The author(s) has paid for this article to be freely available under the terms of the Creative Commons Attribution Non-Commercial Licence (http://creativecommons.org/licenses/by-nc/2.5/)which permits unrestricted non-commercial use, distribution and reproduction in any medium, provided the original work is properly cited.
130 I. H. W. Ng and others
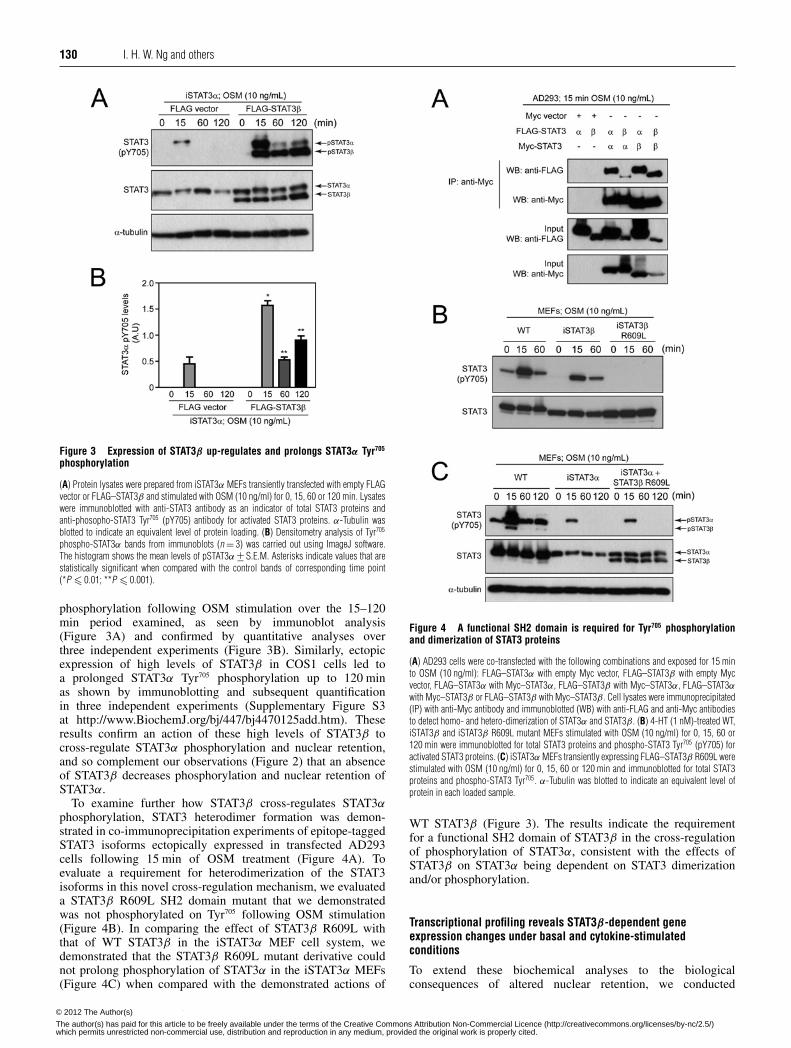
Figure 3 Expression of STAT3β up-regulates and prolongs STAT3α Tyr705
phosphorylation
(A) Protein lysates were prepared from iSTAT3α MEFs transiently transfected with empty FLAGvector or FLAG–STAT3β and stimulated with OSM (10 ng/ml) for 0, 15, 60 or 120 min. Lysateswere immunoblotted with anti-STAT3 antibody as an indicator of total STAT3 proteins andanti-phosopho-STAT3 Tyr705 (pY705) antibody for activated STAT3 proteins. α-Tubulin wasblotted to indicate an equivalent level of protein loading. (B) Densitometry analysis of Tyr705
phospho-STAT3α bands from immunoblots (n = 3) was carried out using ImageJ software.The histogram shows the mean levels of pSTAT3α +− S.E.M. Asterisks indicate values that arestatistically significant when compared with the control bands of corresponding time point(*P � 0.01; **P � 0.001).
phosphorylation following OSM stimulation over the 15–120min period examined, as seen by immunoblot analysis(Figure 3A) and confirmed by quantitative analyses overthree independent experiments (Figure 3B). Similarly, ectopicexpression of high levels of STAT3β in COS1 cells led toa prolonged STAT3α Tyr705 phosphorylation up to 120 minas shown by immunoblotting and subsequent quantificationin three independent experiments (Supplementary Figure S3at http://www.BiochemJ.org/bj/447/bj4470125add.htm). Theseresults confirm an action of these high levels of STAT3β tocross-regulate STAT3α phosphorylation and nuclear retention,and so complement our observations (Figure 2) that an absenceof STAT3β decreases phosphorylation and nuclear retention ofSTAT3α.
To examine further how STAT3β cross-regulates STAT3αphosphorylation, STAT3 heterodimer formation was demon-strated in co-immunoprecipitation experiments of epitope-taggedSTAT3 isoforms ectopically expressed in transfected AD293cells following 15 min of OSM treatment (Figure 4A). Toevaluate a requirement for heterodimerization of the STAT3isoforms in this novel cross-regulation mechanism, we evaluateda STAT3β R609L SH2 domain mutant that we demonstratedwas not phosphorylated on Tyr705 following OSM stimulation(Figure 4B). In comparing the effect of STAT3β R609L withthat of WT STAT3β in the iSTAT3α MEF cell system, wedemonstrated that the STAT3β R609L mutant derivative couldnot prolong phosphorylation of STAT3α in the iSTAT3α MEFs(Figure 4C) when compared with the demonstrated actions of
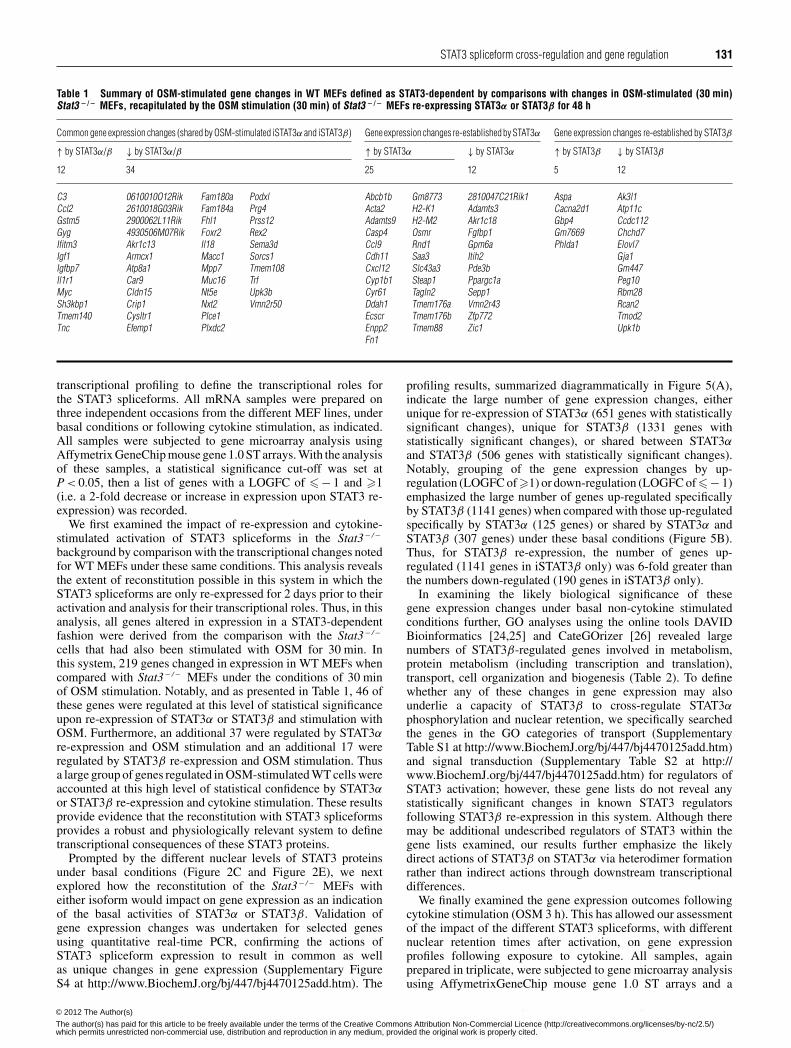
Figure 4 A functional SH2 domain is required for Tyr705 phosphorylationand dimerization of STAT3 proteins
(A) AD293 cells were co-transfected with the following combinations and exposed for 15 minto OSM (10 ng/ml): FLAG–STAT3α with empty Myc vector, FLAG–STAT3β with empty Mycvector, FLAG–STAT3α with Myc–STAT3α, FLAG–STAT3β with Myc–STAT3α, FLAG–STAT3αwith Myc–STAT3β or FLAG–STAT3β with Myc–STAT3β . Cell lysates were immunoprecipitated(IP) with anti-Myc antibody and immunoblotted (WB) with anti-FLAG and anti-Myc antibodiesto detect homo- and hetero-dimerization of STAT3α and STAT3β . (B) 4-HT (1 nM)-treated WT,iSTAT3β and iSTAT3β R609L mutant MEFs stimulated with OSM (10 ng/ml) for 0, 15, 60 or120 min were immunoblotted for total STAT3 proteins and phospho-STAT3 Tyr705 (pY705) foractivated STAT3 proteins. (C) iSTAT3α MEFs transiently expressing FLAG–STAT3β R609L werestimulated with OSM (10 ng/ml) for 0, 15, 60 or 120 min and immunoblotted for total STAT3proteins and phospho-STAT3 Tyr705. α-Tubulin was blotted to indicate an equivalent level ofprotein in each loaded sample.
WT STAT3β (Figure 3). The results indicate the requirementfor a functional SH2 domain of STAT3β in the cross-regulationof phosphorylation of STAT3α, consistent with the effects ofSTAT3β on STAT3α being dependent on STAT3 dimerizationand/or phosphorylation.
Transcriptional profiling reveals STAT3β-dependent geneexpression changes under basal and cytokine-stimulatedconditions
To extend these biochemical analyses to the biologicalconsequences of altered nuclear retention, we conducted
c© The Authors Journal compilation c© 2012 Biochemical Society© 2012 The Author(s)
The author(s) has paid for this article to be freely available under the terms of the Creative Commons Attribution Non-Commercial Licence (http://creativecommons.org/licenses/by-nc/2.5/)which permits unrestricted non-commercial use, distribution and reproduction in any medium, provided the original work is properly cited.
STAT3 spliceform cross-regulation and gene regulation 131
Table 1 Summary of OSM-stimulated gene changes in WT MEFs defined as STAT3-dependent by comparisons with changes in OSM-stimulated (30 min)Stat3 − / − MEFs, recapitulated by the OSM stimulation (30 min) of Stat3 − / − MEFs re-expressing STAT3α or STAT3β for 48 h
Common gene expression changes (shared by OSM-stimulated iSTAT3α and iSTAT3β) Gene expression changes re-established by STAT3α Gene expression changes re-established by STAT3β
↑ by STAT3α/β ↓ by STAT3α/β ↑ by STAT3α ↓ by STAT3α ↑ by STAT3β ↓ by STAT3β
12 34 25 12 5 12
C3 0610010O12Rik Fam180a Podxl Abcb1b Gm8773 2810047C21Rik1 Aspa Ak3l1Ccl2 2610018G03Rik Fam184a Prg4 Acta2 H2-K1 Adamts3 Cacna2d1 Atp11cGstm5 2900062L11Rik Fhl1 Prss12 Adamts9 H2-M2 Akr1c18 Gbp4 Ccdc112Gyg 4930506M07Rik Foxr2 Rex2 Casp4 Osmr Fgfbp1 Gm7669 Chchd7Ifitm3 Akr1c13 Il18 Sema3d Ccl9 Rnd1 Gpm6a Phlda1 Elovl7Igf1 Armcx1 Macc1 Sorcs1 Cdh11 Saa3 Itih2 Gja1Igfbp7 Atp8a1 Mpp7 Tmem108 Cxcl12 Slc43a3 Pde3b Gm447Il1r1 Car9 Muc16 Trf Cyp1b1 Steap1 Ppargc1a Peg10Myc Cldn15 Nt5e Upk3b Cyr61 Tagln2 Sepp1 Rbm28Sh3kbp1 Crip1 Nxt2 Vmn2r50 Ddah1 Tmem176a Vmn2r43 Rcan2Tmem140 Cysltr1 Plce1 Ecscr Tmem176b Zfp772 Tmod2Tnc Efemp1 Plxdc2 Enpp2 Tmem88 Zic1 Upk1b
Fn1
transcriptional profiling to define the transcriptional roles forthe STAT3 spliceforms. All mRNA samples were prepared onthree independent occasions from the different MEF lines, underbasal conditions or following cytokine stimulation, as indicated.All samples were subjected to gene microarray analysis usingAffymetrix GeneChip mouse gene 1.0 ST arrays. With the analysisof these samples, a statistical significance cut-off was set atP < 0.05, then a list of genes with a LOGFC of �− 1 and �1(i.e. a 2-fold decrease or increase in expression upon STAT3 re-expression) was recorded.
We first examined the impact of re-expression and cytokine-stimulated activation of STAT3 spliceforms in the Stat3− / −
background by comparison with the transcriptional changes notedfor WT MEFs under these same conditions. This analysis revealsthe extent of reconstitution possible in this system in which theSTAT3 spliceforms are only re-expressed for 2 days prior to theiractivation and analysis for their transcriptional roles. Thus, in thisanalysis, all genes altered in expression in a STAT3-dependentfashion were derived from the comparison with the Stat3− / −
cells that had also been stimulated with OSM for 30 min. Inthis system, 219 genes changed in expression in WT MEFs whencompared with Stat3− / − MEFs under the conditions of 30 minof OSM stimulation. Notably, and as presented in Table 1, 46 ofthese genes were regulated at this level of statistical significanceupon re-expression of STAT3α or STAT3β and stimulation withOSM. Furthermore, an additional 37 were regulated by STAT3αre-expression and OSM stimulation and an additional 17 wereregulated by STAT3β re-expression and OSM stimulation. Thusa large group of genes regulated in OSM-stimulated WT cells wereaccounted at this high level of statistical confidence by STAT3αor STAT3β re-expression and cytokine stimulation. These resultsprovide evidence that the reconstitution with STAT3 spliceformsprovides a robust and physiologically relevant system to definetranscriptional consequences of these STAT3 proteins.
Prompted by the different nuclear levels of STAT3 proteinsunder basal conditions (Figure 2C and Figure 2E), we nextexplored how the reconstitution of the Stat3− / − MEFs witheither isoform would impact on gene expression as an indicationof the basal activities of STAT3α or STAT3β. Validation ofgene expression changes was undertaken for selected genesusing quantitative real-time PCR, confirming the actions ofSTAT3 spliceform expression to result in common as wellas unique changes in gene expression (Supplementary FigureS4 at http://www.BiochemJ.org/bj/447/bj4470125add.htm). The
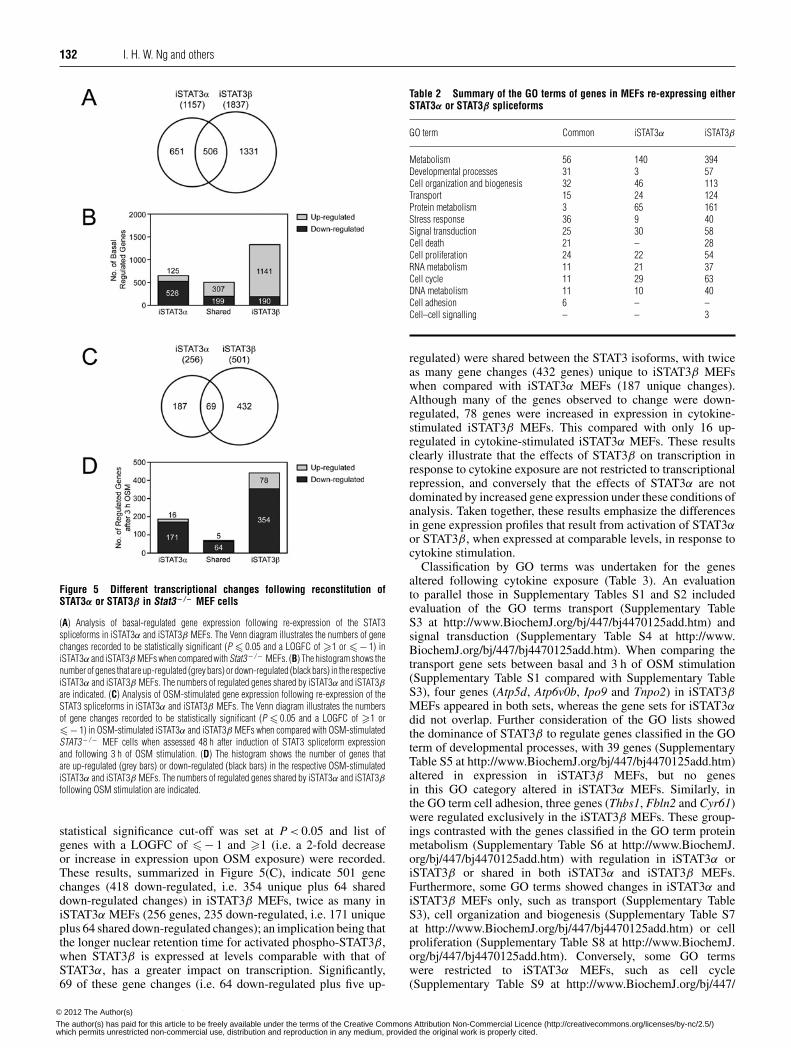
profiling results, summarized diagrammatically in Figure 5(A),indicate the large number of gene expression changes, eitherunique for re-expression of STAT3α (651 genes with statisticallysignificant changes), unique for STAT3β (1331 genes withstatistically significant changes), or shared between STAT3αand STAT3β (506 genes with statistically significant changes).Notably, grouping of the gene expression changes by up-regulation (LOGFC of �1) or down-regulation (LOGFC of �− 1)emphasized the large number of genes up-regulated specificallyby STAT3β (1141 genes) when compared with those up-regulatedspecifically by STAT3α (125 genes) or shared by STAT3α andSTAT3β (307 genes) under these basal conditions (Figure 5B).Thus, for STAT3β re-expression, the number of genes up-regulated (1141 genes in iSTAT3β only) was 6-fold greater thanthe numbers down-regulated (190 genes in iSTAT3β only).
In examining the likely biological significance of thesegene expression changes under basal non-cytokine stimulatedconditions further, GO analyses using the online tools DAVIDBioinformatics [24,25] and CateGOrizer [26] revealed largenumbers of STAT3β-regulated genes involved in metabolism,protein metabolism (including transcription and translation),transport, cell organization and biogenesis (Table 2). To definewhether any of these changes in gene expression may alsounderlie a capacity of STAT3β to cross-regulate STAT3αphosphorylation and nuclear retention, we specifically searchedthe genes in the GO categories of transport (SupplementaryTable S1 at http://www.BiochemJ.org/bj/447/bj4470125add.htm)and signal transduction (Supplementary Table S2 at http://www.BiochemJ.org/bj/447/bj4470125add.htm) for regulators ofSTAT3 activation; however, these gene lists do not reveal anystatistically significant changes in known STAT3 regulatorsfollowing STAT3β re-expression in this system. Although theremay be additional undescribed regulators of STAT3 within thegene lists examined, our results further emphasize the likelydirect actions of STAT3β on STAT3α via heterodimer formationrather than indirect actions through downstream transcriptionaldifferences.
We finally examined the gene expression outcomes followingcytokine stimulation (OSM 3 h). This has allowed our assessmentof the impact of the different STAT3 spliceforms, with differentnuclear retention times after activation, on gene expressionprofiles following exposure to cytokine. All samples, againprepared in triplicate, were subjected to gene microarray analysisusing AffymetrixGeneChip mouse gene 1.0 ST arrays and a
c© The Authors Journal compilation c© 2012 Biochemical Society© 2012 The Author(s)
The author(s) has paid for this article to be freely available under the terms of the Creative Commons Attribution Non-Commercial Licence (http://creativecommons.org/licenses/by-nc/2.5/)which permits unrestricted non-commercial use, distribution and reproduction in any medium, provided the original work is properly cited.
132 I. H. W. Ng and others
Figure 5 Different transcriptional changes following reconstitution ofSTAT3α or STAT3β in Stat3− / − MEF cells
(A) Analysis of basal-regulated gene expression following re-expression of the STAT3spliceforms in iSTAT3α and iSTAT3β MEFs. The Venn diagram illustrates the numbers of genechanges recorded to be statistically significant (P � 0.05 and a LOGFC of �1 or �− 1) iniSTAT3α and iSTAT3β MEFs when compared with Stat3− / − MEFs. (B) The histogram shows thenumber of genes that are up-regulated (grey bars) or down-regulated (black bars) in the respectiveiSTAT3α and iSTAT3β MEFs. The numbers of regulated genes shared by iSTAT3α and iSTAT3βare indicated. (C) Analysis of OSM-stimulated gene expression following re-expression of theSTAT3 spliceforms in iSTAT3α and iSTAT3β MEFs. The Venn diagram illustrates the numbersof gene changes recorded to be statistically significant (P � 0.05 and a LOGFC of �1 or�− 1) in OSM-stimulated iSTAT3α and iSTAT3β MEFs when compared with OSM-stimulatedSTAT3 − / − MEF cells when assessed 48 h after induction of STAT3 spliceform expressionand following 3 h of OSM stimulation. (D) The histogram shows the number of genes thatare up-regulated (grey bars) or down-regulated (black bars) in the respective OSM-stimulatediSTAT3α and iSTAT3β MEFs. The numbers of regulated genes shared by iSTAT3α and iSTAT3βfollowing OSM stimulation are indicated.
statistical significance cut-off was set at P < 0.05 and list ofgenes with a LOGFC of �− 1 and �1 (i.e. a 2-fold decreaseor increase in expression upon OSM exposure) were recorded.These results, summarized in Figure 5(C), indicate 501 genechanges (418 down-regulated, i.e. 354 unique plus 64 shareddown-regulated changes) in iSTAT3β MEFs, twice as many iniSTAT3α MEFs (256 genes, 235 down-regulated, i.e. 171 uniqueplus 64 shared down-regulated changes); an implication being thatthe longer nuclear retention time for activated phospho-STAT3β,when STAT3β is expressed at levels comparable with that ofSTAT3α, has a greater impact on transcription. Significantly,69 of these gene changes (i.e. 64 down-regulated plus five up-
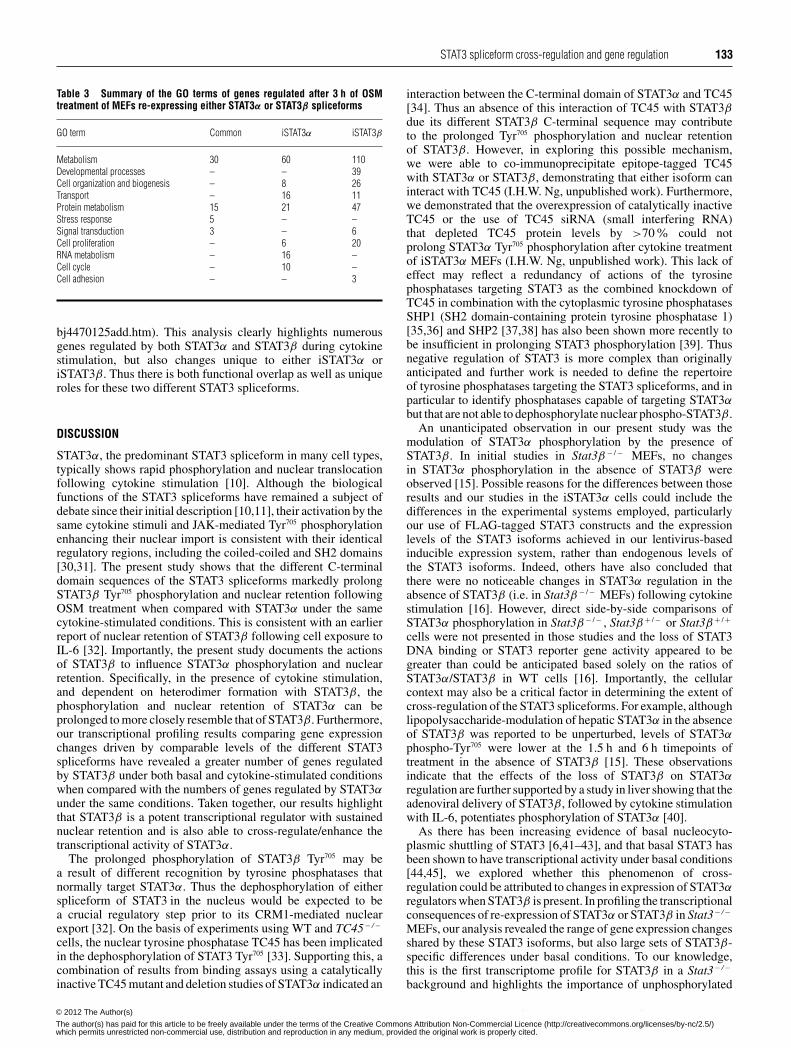
Table 2 Summary of the GO terms of genes in MEFs re-expressing eitherSTAT3α or STAT3β spliceforms
GO term Common iSTAT3α iSTAT3β
Metabolism 56 140 394Developmental processes 31 3 57Cell organization and biogenesis 32 46 113Transport 15 24 124Protein metabolism 3 65 161Stress response 36 9 40Signal transduction 25 30 58Cell death 21 – 28Cell proliferation 24 22 54RNA metabolism 11 21 37Cell cycle 11 29 63DNA metabolism 11 10 40Cell adhesion 6 – –Cell–cell signalling – – 3
regulated) were shared between the STAT3 isoforms, with twiceas many gene changes (432 genes) unique to iSTAT3β MEFswhen compared with iSTAT3α MEFs (187 unique changes).Although many of the genes observed to change were down-regulated, 78 genes were increased in expression in cytokine-stimulated iSTAT3β MEFs. This compared with only 16 up-regulated in cytokine-stimulated iSTAT3α MEFs. These resultsclearly illustrate that the effects of STAT3β on transcription inresponse to cytokine exposure are not restricted to transcriptionalrepression, and conversely that the effects of STAT3α are notdominated by increased gene expression under these conditions ofanalysis. Taken together, these results emphasize the differencesin gene expression profiles that result from activation of STAT3αor STAT3β, when expressed at comparable levels, in response tocytokine stimulation.
Classification by GO terms was undertaken for the genesaltered following cytokine exposure (Table 3). An evaluationto parallel those in Supplementary Tables S1 and S2 includedevaluation of the GO terms transport (Supplementary TableS3 at http://www.BiochemJ.org/bj/447/bj4470125add.htm) andsignal transduction (Supplementary Table S4 at http://www.BiochemJ.org/bj/447/bj4470125add.htm). When comparing thetransport gene sets between basal and 3 h of OSM stimulation(Supplementary Table S1 compared with Supplementary TableS3), four genes (Atp5d, Atp6v0b, Ipo9 and Tnpo2) in iSTAT3βMEFs appeared in both sets, whereas the gene sets for iSTAT3αdid not overlap. Further consideration of the GO lists showedthe dominance of STAT3β to regulate genes classified in the GOterm of developmental processes, with 39 genes (SupplementaryTable S5 at http://www.BiochemJ.org/bj/447/bj4470125add.htm)altered in expression in iSTAT3β MEFs, but no genesin this GO category altered in iSTAT3α MEFs. Similarly, inthe GO term cell adhesion, three genes (Thbs1, Fbln2 and Cyr61)were regulated exclusively in the iSTAT3β MEFs. These group-ings contrasted with the genes classified in the GO term proteinmetabolism (Supplementary Table S6 at http://www.BiochemJ.org/bj/447/bj4470125add.htm) with regulation in iSTAT3α oriSTAT3β or shared in both iSTAT3α and iSTAT3β MEFs.Furthermore, some GO terms showed changes in iSTAT3α andiSTAT3β MEFs only, such as transport (Supplementary TableS3), cell organization and biogenesis (Supplementary Table S7at http://www.BiochemJ.org/bj/447/bj4470125add.htm) or cellproliferation (Supplementary Table S8 at http://www.BiochemJ.org/bj/447/bj4470125add.htm). Conversely, some GO termswere restricted to iSTAT3α MEFs, such as cell cycle(Supplementary Table S9 at http://www.BiochemJ.org/bj/447/
c© The Authors Journal compilation c© 2012 Biochemical Society© 2012 The Author(s)
The author(s) has paid for this article to be freely available under the terms of the Creative Commons Attribution Non-Commercial Licence (http://creativecommons.org/licenses/by-nc/2.5/)which permits unrestricted non-commercial use, distribution and reproduction in any medium, provided the original work is properly cited.
STAT3 spliceform cross-regulation and gene regulation 133
Table 3 Summary of the GO terms of genes regulated after 3 h of OSMtreatment of MEFs re-expressing either STAT3α or STAT3β spliceforms
GO term Common iSTAT3α iSTAT3β
Metabolism 30 60 110Developmental processes – – 39Cell organization and biogenesis – 8 26Transport – 16 11Protein metabolism 15 21 47Stress response 5 – –Signal transduction 3 – 6Cell proliferation – 6 20RNA metabolism – 16 –Cell cycle – 10 –Cell adhesion – – 3
bj4470125add.htm). This analysis clearly highlights numerousgenes regulated by both STAT3α and STAT3β during cytokinestimulation, but also changes unique to either iSTAT3α oriSTAT3β. Thus there is both functional overlap as well as uniqueroles for these two different STAT3 spliceforms.
DISCUSSION
STAT3α, the predominant STAT3 spliceform in many cell types,typically shows rapid phosphorylation and nuclear translocationfollowing cytokine stimulation [10]. Although the biologicalfunctions of the STAT3 spliceforms have remained a subject ofdebate since their initial description [10,11], their activation by thesame cytokine stimuli and JAK-mediated Tyr705 phosphorylationenhancing their nuclear import is consistent with their identicalregulatory regions, including the coiled-coiled and SH2 domains[30,31]. The present study shows that the different C-terminaldomain sequences of the STAT3 spliceforms markedly prolongSTAT3β Tyr705 phosphorylation and nuclear retention followingOSM treatment when compared with STAT3α under the samecytokine-stimulated conditions. This is consistent with an earlierreport of nuclear retention of STAT3β following cell exposure toIL-6 [32]. Importantly, the present study documents the actionsof STAT3β to influence STAT3α phosphorylation and nuclearretention. Specifically, in the presence of cytokine stimulation,and dependent on heterodimer formation with STAT3β, thephosphorylation and nuclear retention of STAT3α can beprolonged to more closely resemble that of STAT3β. Furthermore,our transcriptional profiling results comparing gene expressionchanges driven by comparable levels of the different STAT3spliceforms have revealed a greater number of genes regulatedby STAT3β under both basal and cytokine-stimulated conditionswhen compared with the numbers of genes regulated by STAT3αunder the same conditions. Taken together, our results highlightthat STAT3β is a potent transcriptional regulator with sustainednuclear retention and is also able to cross-regulate/enhance thetranscriptional activity of STAT3α.
The prolonged phosphorylation of STAT3β Tyr705 may bea result of different recognition by tyrosine phosphatases thatnormally target STAT3α. Thus the dephosphorylation of eitherspliceform of STAT3 in the nucleus would be expected to bea crucial regulatory step prior to its CRM1-mediated nuclearexport [32]. On the basis of experiments using WT and TC45− / −
cells, the nuclear tyrosine phosphatase TC45 has been implicatedin the dephosphorylation of STAT3 Tyr705 [33]. Supporting this, acombination of results from binding assays using a catalyticallyinactive TC45 mutant and deletion studies of STAT3α indicated an
interaction between the C-terminal domain of STAT3α and TC45[34]. Thus an absence of this interaction of TC45 with STAT3βdue its different STAT3β C-terminal sequence may contributeto the prolonged Tyr705 phosphorylation and nuclear retentionof STAT3β. However, in exploring this possible mechanism,we were able to co-immunoprecipitate epitope-tagged TC45with STAT3α or STAT3β, demonstrating that either isoform caninteract with TC45 (I.H.W. Ng, unpublished work). Furthermore,we demonstrated that the overexpression of catalytically inactiveTC45 or the use of TC45 siRNA (small interfering RNA)that depleted TC45 protein levels by >70% could notprolong STAT3α Tyr705 phosphorylation after cytokine treatmentof iSTAT3α MEFs (I.H.W. Ng, unpublished work). This lack ofeffect may reflect a redundancy of actions of the tyrosinephosphatases targeting STAT3 as the combined knockdown ofTC45 in combination with the cytoplasmic tyrosine phosphatasesSHP1 (SH2 domain-containing protein tyrosine phosphatase 1)[35,36] and SHP2 [37,38] has also been shown more recently tobe insufficient in prolonging STAT3 phosphorylation [39]. Thusnegative regulation of STAT3 is more complex than originallyanticipated and further work is needed to define the repertoireof tyrosine phosphatases targeting the STAT3 spliceforms, and inparticular to identify phosphatases capable of targeting STAT3αbut that are not able to dephosphorylate nuclear phospho-STAT3β.
An unanticipated observation in our present study was themodulation of STAT3α phosphorylation by the presence ofSTAT3β. In initial studies in Stat3β − / − MEFs, no changesin STAT3α phosphorylation in the absence of STAT3β wereobserved [15]. Possible reasons for the differences between thoseresults and our studies in the iSTAT3α cells could include thedifferences in the experimental systems employed, particularlyour use of FLAG-tagged STAT3 constructs and the expressionlevels of the STAT3 isoforms achieved in our lentivirus-basedinducible expression system, rather than endogenous levels ofthe STAT3 isoforms. Indeed, others have also concluded thatthere were no noticeable changes in STAT3α regulation in theabsence of STAT3β (i.e. in Stat3β − / − MEFs) following cytokinestimulation [16]. However, direct side-by-side comparisons ofSTAT3α phosphorylation in Stat3β − / − , Stat3β + / − or Stat3β + / +
cells were not presented in those studies and the loss of STAT3DNA binding or STAT3 reporter gene activity appeared to begreater than could be anticipated based solely on the ratios ofSTAT3α/STAT3β in WT cells [16]. Importantly, the cellularcontext may also be a critical factor in determining the extent ofcross-regulation of the STAT3 spliceforms. For example, althoughlipopolysaccharide-modulation of hepatic STAT3α in the absenceof STAT3β was reported to be unperturbed, levels of STAT3αphospho-Tyr705 were lower at the 1.5 h and 6 h timepoints oftreatment in the absence of STAT3β [15]. These observationsindicate that the effects of the loss of STAT3β on STAT3αregulation are further supported by a study in liver showing that theadenoviral delivery of STAT3β, followed by cytokine stimulationwith IL-6, potentiates phosphorylation of STAT3α [40].
As there has been increasing evidence of basal nucleocyto-plasmic shuttling of STAT3 [6,41–43], and that basal STAT3 hasbeen shown to have transcriptional activity under basal conditions[44,45], we explored whether this phenomenon of cross-regulation could be attributed to changes in expression of STAT3αregulators when STAT3β is present. In profiling the transcriptionalconsequences of re-expression of STAT3α or STAT3β in Stat3− / −
MEFs, our analysis revealed the range of gene expression changesshared by these STAT3 isoforms, but also large sets of STAT3β-specific differences under basal conditions. To our knowledge,this is the first transcriptome profile for STAT3β in a Stat3− / −
background and highlights the importance of unphosphorylated
c© The Authors Journal compilation c© 2012 Biochemical Society© 2012 The Author(s)
The author(s) has paid for this article to be freely available under the terms of the Creative Commons Attribution Non-Commercial Licence (http://creativecommons.org/licenses/by-nc/2.5/)which permits unrestricted non-commercial use, distribution and reproduction in any medium, provided the original work is properly cited.

134 I. H. W. Ng and others
STAT3β in the regulation of diverse subsets of genes. Importantly,in the context of understanding cross-regulation mechanisms,no known STAT3α regulators were identified in the genessignificantly altered in expression by STAT3β, thus suggestingthat the action of STAT3β to cross-regulate STAT3α is notdependent on longer-term transcriptional events.
We therefore also explored the possibility of directcross-regulation mediated by a STAT3β–STAT3α interaction.Dimerization between STAT3 proteins has been a prerequisitefor nuclear translocation upon activation and this interactionoccurs via its functional SH2 domain [28,29]. Previously, theR609L mutation that disrupts the SH2 domain function ofSTAT3 has only been made in the context of STAT3α, but itsexpression in cells with endogenous STAT3α levels precludedits detailed characterization of phosphorylation and nucleartranslocation kinetics [29]. As revealed in the present study,STAT3β R609L could no longer up-regulate or prolong STAT3αTyr705 phosphorylation. Thus the regulation of STAT3α bySTAT3β appears to require a functional STAT3β SH2 domainand/or the tyrosine phosphorylation of STAT3β.
In evaluating further the gene expression changes in theStat3− / − MEFs as driven uniquely by the re-expressionof STAT3β, we noted prominent representation of severalGO classes: metabolism (394 STAT3β-specific changes),protein metabolism (161 STAT3β-specific changes), transport(124 STAT3β-specific changes) as well as cell organizationand biogenesis (113 STAT3β-specific changes). Furthermore,STAT3β re-expression was sufficient to change the expression forgenes for the GO class of cell death, but our statistical analysesshowed that no genes in this class were uniquely regulated bySTAT3α. These results thus highlight the large repertoire ofSTAT3α- and STAT3β-dependent changes, and that the STAT3β-dependent changes do not simply recapitulate the STAT3α-depen-dent changes observed.
STAT3 transcriptional activity has been attributed to itstransactivation domain that binds transcription co-activators suchas p300 [46]. STAT3α and STAT3β would thus activate acommon subset of genes via their interaction with co-activators toform enhanceosome complexes [47]. Alternatively, other sharedtranscription factor partners, such as c-Jun, which can regulateinduction of the α2-macroglobulin promoter [48], may underpinthe regulation of genes targeted by either STAT3α or STAT3β.However, the truncated transactivation domain of STAT3β has ledto the suggestion that STAT3β may lack transcriptional activityand so act as a dominant-negative regulator of STAT3α [10]. Initialsupport for this came with the repression and/or down-regulationof a number of recognized STAT3α target genes when STAT3βwas overexpressed [10,48]. Furthermore, in COS cells,STAT3β was unable to initiate a transcriptional response asdetermined by luciferase reporter assay in cells expressing theICAM-1 (intercellular adhesion molecule 1) promoter [10], andin cancer cells STAT3β suppressed the transformation activityof STAT3α by repressing the expression of Bcl-xL, p21WAF/CIP1
and cyclin D1, leading to apoptosis and regression of thecancer cells [49,50]. The ability of STAT3β to rescue STAT3− / −
embryonic lethality has clearly indicated that STAT3β canperform at least some of the roles of STAT3α [15]. Furthermore,STAT3β has been shown to initiate transcription of the p27Kip1
gene in myeloblastic cells [51], α1-anti-chymotrypsin and α2-macroglobulin in hepatocytes [52], acute-phase genes in the liverduring inflammation [15], and so can act as an up-regulator oftranscription of specific gene sets.
The differences in gene expression profiles in the presenceof the different STAT3 spliceforms, but also following cellexposure to cytokine, highlight further the remarkable spliceform-
dependent differences in gene expression. Thus both STAT3αand STAT3β are transcriptional regulators following cytokinestimulation, and STAT3β should not simply be viewed as arepressor or negative regulator of gene transcription. Indeed,although the established paradigms illustrate STAT3α as atranscriptional activator, it is clear from previous studies thatSTAT3α can also act as a negative regulator of its target geneexpression. Notably, STAT3 has been demonstrated to activateor repress its direct target genes in NIH 3T3 cells, with OSMtreatment increasing six of 18 direct target genes specificallytested, but decreasing expression of ten of these 18 direct targetgenes [53]. Similarly, the STAT3-dependent repression of geneshas been shown to be critical for muscle cell differentiation [53].These results are consistent with the association of STAT3 withboth active and inactive promoters in embryonic stem cells [54]and the reported actions of STAT3 to down-regulate expressionof specific target genes, such as that recently described for thenegative growth regulator Necdin [55]. In addition to direct generegulatory mechanisms, increased attention should be directed tomore complex regulatory mechanisms, such as those requiringSTAT3-dependent up-regulation of microRNAs (such as miR-21and miR-181b-1 [56]) that mediate repression of gene expression.
In conclusion, the present study reinforces the transcriptionalfunctions of STAT3β under basal conditions as well as itsdirect actions to modulate STAT3α activation following cytokinestimulation. These functions of STAT3β indicate its importanceas a modulator of gene expression in its own right, but also nowhighlight the exciting possibility that an additional importantaction of STAT3β may be in extending the activation kineticsfor STAT3α. Given the striking changes in the levels of STAT3αand STAT3β noted during myeloid differentiation [12–14], andthe interest in the directed expression of STAT3β in the placeof STAT3α by manipulation of alternative splice regulation,further exploration of these mechanisms of these differences andtranscription factor cross-regulation is clearly warranted.
AUTHOR CONTRIBUTION
Ivan Ng performed and analysed all the experiments. Ivan Ng, Dominic Ng, David Jansand Marie Bogoyevitch designed the experiments, discussed the analyses and resultsinterpretation, and wrote the paper.
ACKNOWLEDGEMENTS
We thank Dr John Silke (Walter and Eliza Hall Institute of Medical Research, Melbourne,Australia) for the inducible lentiviral expression constructs and Professor Valeria Poli(Department of Genetics, Biology and Biochemistry, University of Turin, Italy) for the WTand Stat3− / − MEFs. We thank Jason Li (Bioinformatics Core Facility, Research DivisionPeter MacCallum Cancer Centre, Melbourne, Australia) for statistical analysis of themicroarray gene expression data.
FUNDING
This work was supported by a National Health and Medical Research Council (NHMRC)Project Grant [grant number 353592 (to M.A.B.)] and a National Heart Foundation ofAustralia Grant-in-aid [grant number G09M4435 (to D.C.H.N.)]. I.H.W.N. is a recipientof a Monash University: Monash Graduate Scholarship and Faculty of MedicineInternational Postgraduate Research Scholarship, D.C.H.N. is a recipient of a Universityof Melbourne MDHS CR Roper Fellowship, and D.A.J. is an NHMRC Senior PrincipalResearch Fellow [number #APP1002486].
REFERENCES
1 Akira, S., Nishio, Y., Inoue, M., Wang, X. J., Wei, S., Matsusaka, T., Yoshida, K., Sudo, T.,Naruto, M. and Kishimoto, T. (1994) Molecular cloning of APRF, a novel IFN-stimulatedgene factor 3 p91-related transcription factor involved in the gp130-mediated signalingpathway. Cell 77, 63–71
c© The Authors Journal compilation c© 2012 Biochemical Society© 2012 The Author(s)
The author(s) has paid for this article to be freely available under the terms of the Creative Commons Attribution Non-Commercial Licence (http://creativecommons.org/licenses/by-nc/2.5/)which permits unrestricted non-commercial use, distribution and reproduction in any medium, provided the original work is properly cited.
STAT3 spliceform cross-regulation and gene regulation 135
2 Lutticken, C., Wegenka, U. M., Yuan, J., Buschmann, J., Schindler, C., Ziemiecki, A.,Harpur, A. G., Wilks, A. F., Yasukawa, K., Taga, T. et al. (1994) Association of transcriptionfactor APRF and protein kinase Jak1 with the interleukin-6 signal transducer gp130.Science 263, 89–92
3 Zhong, Z., Wen, Z. and Darnell, Jr, J. E. (1994) Stat3: a STAT family member activated bytyrosine phosphorylation in response to epidermal growth factor and interleukin-6.Science 264, 95–98
4 Heinrich, P. C., Behrmann, I., Haan, S., Hermanns, H. M., Muller-Newen, G. and Schaper,F. (2003) Principles of interleukin (IL)-6-type cytokine signalling and its regulation.Biochem. J. 374, 1–20
5 Levy, D. E. and Lee, C. K. (2002) What does Stat3 do? J. Clin. Invest. 109, 1143–11486 Liu, L., McBride, K. M. and Reich, N. C. (2005) STAT3 nuclear import is independent of
tyrosine phosphorylation and mediated by importin-α3. Proc. Natl. Acad. Sci. U.S.A.102, 8150–8155
7 Takeda, K., Noguchi, K., Shi, W., Tanaka, T., Matsumoto, M., Yoshida, N., Kishimoto, T.and Akira, S. (1997) Targeted disruption of the mouse Stat3 gene leads to early embryoniclethality. Proc. Natl. Acad. Sci. U.S.A. 94, 3801–3804
8 Poli, V. (2003) STAT3 function in vivo. In Signal Transducers and Activators ofTranscription (STATs) (Sehgal, P. B., ed.), pp. 492–512, Kluwer Academic Publishers,Dordecht
9 Yu, H. and Jove, R. (2004) The STATs of cancer–new molecular targets come of age. Nat.Rev. Cancer 4, 97–105
10 Caldenhoven, E., van Dijk, T. B., Solari, R., Armstrong, J., Raaijmakers, J. A., Lammers,J. W., Koenderman, L. and de Groot, R. P. (1996) STAT3β , a splice variant of transcriptionfactor STAT3, is a dominant negative regulator of transcription. J. Biol. Chem. 271,13221–13227
11 Shao, H., Quintero, A. J. and Tweardy, D. J. (2001) Identification and characterization ofcis elements in the STAT3 gene regulating STAT3 α and STAT3 β messenger RNAsplicing. Blood 98, 3853–3856
12 Biethahn, S., Alves, F., Wilde, S., Hiddemann, W. and Spiekermann, K. (1999) Expressionof granulocyte colony-stimulating factor- and granulocyte-macrophagecolony-stimulating factor-associated signal transduction proteins of the JAK/STATpathway in normal granulopoiesis and in blast cells of acute myelogenous leukemia. Exp.Hematol. 27, 885–894
13 Dewilde, S., Vercelli, A., Chiarle, R. and Poli, V. (2008) Of alphas and betas: distinct andoverlapping functions of STAT3 isoforms. Front. Biosci. 13, 6501–6514
14 Hevehan, D. L., Miller, W. M. and Papoutsakis, E. T. (2002) Differential expression andphosphorylation of distinct STAT3 proteins during granulocytic differentiation. Blood 99,1627–1637
15 Maritano, D., Sugrue, M. L., Tininini, S., Dewilde, S., Strobl, B., Fu, X., Murray-Tait, V.,Chiarle, R. and Poli, V. (2004) The STAT3 isoforms α and β have unique and specificfunctions. Nat. Immunol. 5, 401–409
16 Yoo, J. Y., Huso, D. L., Nathans, D. and Desiderio, S. (2002) Specific ablation of Stat3βdistorts the pattern of Stat3-responsive gene expression and impairs recovery fromendotoxic shock. Cell 108, 331–344
17 Yeh, M., Gharavi, N. M., Choi, J., Hsieh, X., Reed, E., Mouillesseaux, K. P., Cole, A. L.,Reddy, S. T. and Berliner, J. A. (2004) Oxidized phospholipids increase interleukin 8(IL-8) synthesis by activation of the c-src/signal transducers and activators oftranscription (STAT)3 pathway. J. Biol. Chem. 279, 30175–30181
18 Zammarchi, F., de Stanchina, E., Bournazou, E., Supakorndej, T., Martires, K., Riedel, E.,Corben, A. D., Bromberg, J. F. and Cartegni, L. (2011) Antitumorigenic potential of STAT3alternative splicing modulation. Proc. Natl. Acad. Sci. U.S.A. 108, 17779–17784
19 Yeap, Y. Y., Ng, I. H., Badrian, B., Nguyen, T. V., Yip, Y. Y., Dhillon, A. S., Mutsaers, S. E.,Silke, J., Bogoyevitch, M. A. and Ng, D. C. (2010) c-Jun N-terminal kinase/c-Jun inhibitsfibroblast proliferation by negatively regulating the levels of stathmin/oncoprotein 18.Biochem. J. 430, 345–354
20 Ng, D. C., Ng, I. H., Yeap, Y. Y., Badrian, B., Tsoutsman, T., McMullen, J. R., Semsarian,C. and Bogoyevitch, M. A. (2011) Opposing actions of extracellular signal-regulatedkinase (ERK) and signal transducer and activator of transcription 3 (STAT3) in regulatingmicrotubule stabilization during cardiac hypertrophy. J. Biol. Chem. 286, 1576–1587
21 Poon, I. K., Oro, C., Dias, M. M., Zhang, J. and Jans, D. A. (2005) Apoptin nuclearaccumulation is modulated by a CRM1-recognized nuclear export signal that is active innormal but not in tumor cells. Cancer Res. 65, 7059–7064
22 Bengtsson, H., Wirapati, P. and Speed, T. P. (2009) A single-array preprocessing methodfor estimating full-resolution raw copy numbers from all Affymetrix genotyping arraysincluding GenomeWideSNP 5 & 6. Bioinformatics 25, 2149–2156
23 Smyth, G. K. (2004) Linear models and empirical bayes methods for assessing differentialexpression in microarray experiments. Stat. Appl. Genet. Mol. Biol. 3, Article3
24 Huang da, W., Sherman, B. T. and Lempicki, R. A. (2009) Systematic and integrativeanalysis of large gene lists using DAVID bioinformatics resources. Nat. Protoc. 4, 44–57
25 Huang da, W., Sherman, B. T. and Lempicki, R. A. (2009) Bioinformatics enrichment tools:paths toward the comprehensive functional analysis of large gene lists. Nucleic AcidsRes. 37, 1–13
26 Hu, Z. L., Bao, J. and Reecy, J. M. (2008) CateGOrizer: a web-based program to batchanalyze gene ontology classification categories. Online J. Bioinform. 9, 108–112
27 Sehgal, P. B. (2008) Paradigm shifts in the cell biology of STAT signaling. Semin. Cell.Dev. Biol. 19, 329–340
28 Shuai, K., Horvath, C. M., Huang, L. H., Qureshi, S. A., Cowburn, D. and Darnell, Jr, J. E.(1994) Interferon activation of the transcription factor Stat91 involves dimerizationthrough SH2-phosphotyrosyl peptide interactions. Cell 76, 821–828
29 Zhang, T., Kee, W. H., Seow, K. T., Fung, W. and Cao, X. (2000) The coiled-coil domain ofStat3 is essential for its SH2 domain-mediated receptor binding and subsequentactivation induced by epidermal growth factor and interleukin-6. Mol. Cell. Biol. 20,7132–7139
30 Schaefer, T. S., Sanders, L. K., Park, O. K. and Nathans, D. (1997) Functional differencesbetween Stat3α and Stat3β . Mol. Cell. Biol. 17, 5307–5316
31 Wilks, A. F. (1989) Two putative protein-tyrosine kinases identified by application of thepolymerase chain reaction. Proc. Natl. Acad. Sci. U.S.A. 86, 1603–1607
32 Huang, Y., Qiu, J., Dong, S., Redell, M. S., Poli, V., Mancini, M. A. and Tweardy, D. J.(2007) Stat3 isoforms, α and β , demonstrate distinct intracellular dynamics withprolonged nuclear retention of Stat3β mapping to its unique C-terminal end. J. Biol.Chem. 282, 34958–34967
33 ten Hoeve, J., de Jesus Ibarra-Sanchez, M., Fu, Y., Zhu, W., Tremblay, M., David, M. andShuai, K. (2002) Identification of a nuclear Stat1 protein tyrosine phosphatase. Mol. Cell.Biol. 22, 5662–5668
34 Yamamoto, T., Sekine, Y., Kashima, K., Kubota, A., Sato, N., Aoki, N. and Matsuda, T.(2002) The nuclear isoform of protein-tyrosine phosphatase TC-PTP regulatesinterleukin-6-mediated signaling pathway through STAT3 dephosphorylation. Biochem.Biophys. Res. Commun. 297, 811–817
35 Han, Y., Amin, H. M., Frantz, C., Franko, B., Lee, J., Lin, Q. and Lai, R. (2006) Restorationof shp1 expression by 5-AZA-2′-deoxycytidine is associated with downregulation ofJAK3/STAT3 signaling in ALK-positive anaplastic large cell lymphoma. Leukemia 20,1602–1609
36 Han, Y., Amin, H. M., Franko, B., Frantz, C., Shi, X. and Lai, R. (2006) Loss of SHP1enhances JAK3/STAT3 signaling and decreases proteosome degradation of JAK3 andNPM-ALK in ALK + anaplastic large-cell lymphoma. Blood 108, 2796–2803
37 Xu, D. and Qu, C. K. (2008) Protein tyrosine phosphatases in the JAK/STAT pathway.Front. Biosci. 13, 4925–4932
38 Lehmann, U., Schmitz, J., Weissenbach, M., Sobota, R. M., Hortner, M., Friederichs, K.,Behrmann, I., Tsiaris, W., Sasaki, A., Schneider-Mergener, J. et al. (2003) SHP2 andSOCS3 contribute to Tyr-759-dependent attenuation of interleukin-6 signaling throughgp130. J. Biol. Chem. 278, 661–671
39 Kim, D. J., Tremblay, M. L. and Digiovanni, J. (2010) Protein tyrosine phosphatases,TC-PTP, SHP1, and SHP2, cooperate in rapid dephosphorylation of Stat3 in keratinocytesfollowing UVB irradiation. PLoS ONE 5, e10290
40 Ramadoss, P., Unger-Smith, N. E., Lam, F. S. and Hollenberg, A. N. (2009) STAT3 targetsthe regulatory regions of gluconeogenic genes in vivo. Mol. Endocrinol. 23,827–837
41 Herrmann, A., Vogt, M., Monnigmann, M., Clahsen, T., Sommer, U., Haan, S., Poli, V.,Heinrich, P. C. and Muller-Newen, G. (2007) Nucleocytoplasmic shuttling of persistentlyactivated STAT3. J. Cell Sci. 120, 3249–3261
42 Pranada, A. L., Metz, S., Herrmann, A., Heinrich, P. C. and Muller-Newen, G. (2004)Real time analysis of STAT3 nucleocytoplasmic shuttling. J. Biol. Chem. 279,15114–15123
43 Vogt, M., Domoszlai, T., Kleshchanok, D., Lehmann, S., Schmitt, A., Poli, V., Richtering,W. and Muller-Newen, G. (2011) The role of the N-terminal domain in dimerization andnucleocytoplasmic shuttling of latent STAT3. J. Cell Sci. 124, 900–909
44 Yang, J., Chatterjee-Kishore, M., Staugaitis, S. M., Nguyen, H., Schlessinger, K., Levy,D. E. and Stark, G. R. (2005) Novel roles of unphosphorylated STAT3 in oncogenesis andtranscriptional regulation. Cancer Res. 65, 939–947
45 Yang, J., Liao, X., Agarwal, M. K., Barnes, L., Auron, P. E. and Stark, G. R. (2007)Unphosphorylated STAT3 accumulates in response to IL-6 and activates transcription bybinding to NFκB. Genes Dev. 21, 1396–1408
46 Schuringa, J. J., Schepers, H., Vellenga, E. and Kruijer, W. (2001) Ser727-dependenttranscriptional activation by association of p300 with STAT3 upon IL-6 stimulation. FEBSLett. 495, 71–76
47 Nakashima, K., Yanagisawa, M., Arakawa, H., Kimura, N., Hisatsune, T., Kawabata, M.,Miyazono, K. and Taga, T. (1999) Synergistic signaling in fetal brain by STAT3-Smad1complex bridged by p300. Science 284, 479–482
48 Schaefer, T. S., Sanders, L. K. and Nathans, D. (1995) Cooperative transcriptional activityof Jun and Stat3β , a short form of Stat3. Proc. Natl. Acad. Sci. U.S.A. 92, 9097–9101
49 Niu, G., Shain, K. H., Huang, M., Ravi, R., Bedi, A., Dalton, W. S., Jove, R. and Yu, H.(2001) Overexpression of a dominant-negative signal transducer and activator oftranscription 3 variant in tumor cells leads to production of soluble factors that induceapoptosis and cell cycle arrest. Cancer Res. 61, 3276–3280
c© The Authors Journal compilation c© 2012 Biochemical Society© 2012 The Author(s)
The author(s) has paid for this article to be freely available under the terms of the Creative Commons Attribution Non-Commercial Licence (http://creativecommons.org/licenses/by-nc/2.5/)which permits unrestricted non-commercial use, distribution and reproduction in any medium, provided the original work is properly cited.
136 I. H. W. Ng and others
50 Sinibaldi, D., Wharton, W., Turkson, J., Bowman, T., Pledger, W. J. and Jove, R. (2000)Induction of p21WAF1/CIP1 and cyclin D1 expression by the Src oncoprotein in mousefibroblasts: role of activated STAT3 signaling. Oncogene 19, 5419–5427
51 de Koning, J. P., Soede-Bobok, A. A., Ward, A. C., Schelen, A. M., Antonissen, C., vanLeeuwen, D., Lowenberg, B. and Touw, I. P. (2000) STAT3-mediated differentiation andsurvival and of myeloid cells in response to granulocyte colony-stimulating factor: rolefor the cyclin-dependent kinase inhibitor p27Kip1. Oncogene 19, 3290–3298
52 Sasse, J., Hemmann, U., Schwartz, C., Schniertshauer, U., Heesel, B., Landgraf, C.,Schneider-Mergener, J., Heinrich, P. C. and Horn, F. (1997) Mutational analysis ofacute-phase response factor/Stat3 activation and dimerization. Mol. Cell. Biol. 17,4677–4686
53 Snyder, M., Huang, X. Y. and Zhang, J. J. (2008) Identification of novel direct Stat3target genes for control of growth and differentiation. J. Biol. Chem. 283,3791–3798
54 Kidder, B. L., Yang, J. and Palmer, S. (2008) Stat3 and c-Myc genome-wide promoteroccupancy in embryonic stem cells. PLoS ONE 3, e3932
55 Haviland, R., Eschrich, S., Bloom, G., Ma, Y., Minton, S., Jove, R. and Cress, W. D. (2011)Necdin, a negative growth regulator, is a novel STAT3 target gene down-regulated inhuman cancer. PLoS ONE 6, e24923
56 Iliopoulos, D., Jaeger, S. A., Hirsch, H. A., Bulyk, M. L. and Struhl, K. (2010) STAT3activation of miR-21 and miR-181b-1 via PTEN and CYLD are part of the epigeneticswitch linking inflammation to cancer. Mol. Cell 39, 493–506
Received 7 June 2012/13 July 2012; accepted 17 July 2012Published as BJ Immediate Publication 17 July 2012, doi:10.1042/BJ20120941
c© The Authors Journal compilation c© 2012 Biochemical Society© 2012 The Author(s)
The author(s) has paid for this article to be freely available under the terms of the Creative Commons Attribution Non-Commercial Licence (http://creativecommons.org/licenses/by-nc/2.5/)which permits unrestricted non-commercial use, distribution and reproduction in any medium, provided the original work is properly cited.
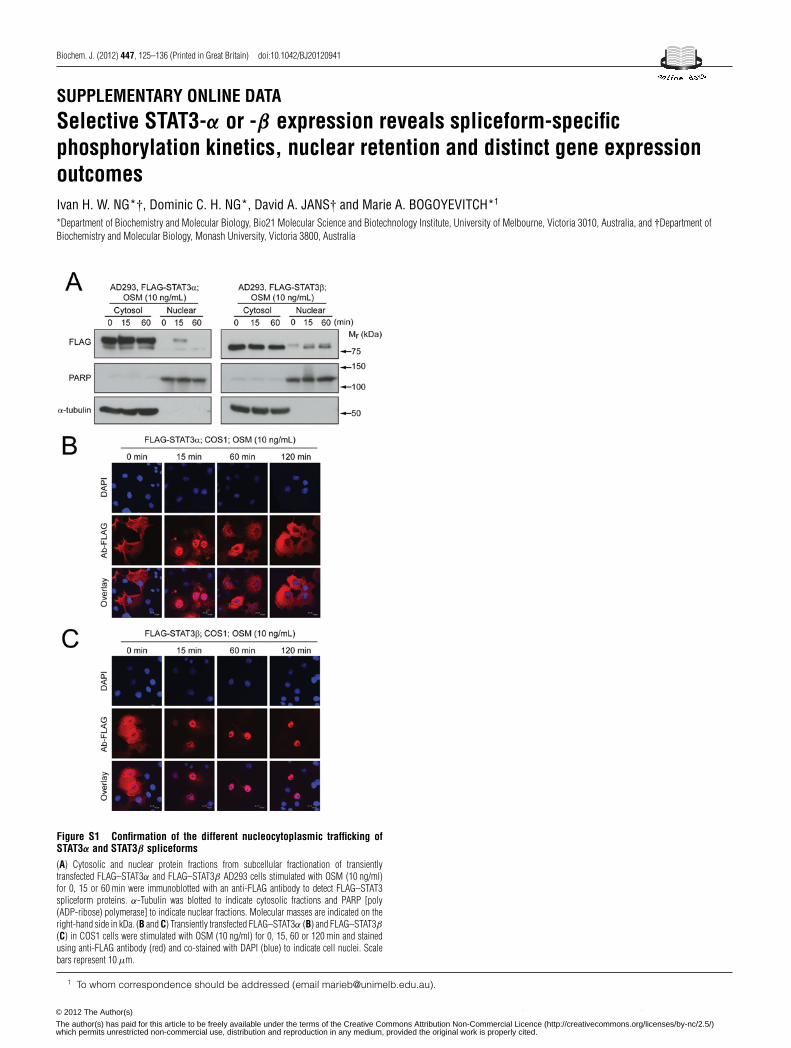
Biochem. J. (2012) 447, 125–136 (Printed in Great Britain) doi:10.1042/BJ20120941
SUPPLEMENTARY ONLINE DATASelective STAT3-α or -β expression reveals spliceform-specificphosphorylation kinetics, nuclear retention and distinct gene expressionoutcomesIvan H. W. NG*†, Dominic C. H. NG*, David A. JANS† and Marie A. BOGOYEVITCH*1
*Department of Biochemistry and Molecular Biology, Bio21 Molecular Science and Biotechnology Institute, University of Melbourne, Victoria 3010, Australia, and †Department ofBiochemistry and Molecular Biology, Monash University, Victoria 3800, Australia
Figure S1 Confirmation of the different nucleocytoplasmic trafficking ofSTAT3α and STAT3β spliceforms(A) Cytosolic and nuclear protein fractions from subcellular fractionation of transientlytransfected FLAG–STAT3α and FLAG–STAT3β AD293 cells stimulated with OSM (10 ng/ml)for 0, 15 or 60 min were immunoblotted with an anti-FLAG antibody to detect FLAG–STAT3spliceform proteins. α-Tubulin was blotted to indicate cytosolic fractions and PARP [poly(ADP-ribose) polymerase] to indicate nuclear fractions. Molecular masses are indicated on theright-hand side in kDa. (B and C) Transiently transfected FLAG–STAT3α (B) and FLAG–STAT3β(C) in COS1 cells were stimulated with OSM (10 ng/ml) for 0, 15, 60 or 120 min and stainedusing anti-FLAG antibody (red) and co-stained with DAPI (blue) to indicate cell nuclei. Scalebars represent 10 μm.
1 To whom correspondence should be addressed (email [email protected]).
c© The Authors Journal compilation c© 2012 Biochemical Society© 2012 The Author(s)
The author(s) has paid for this article to be freely available under the terms of the Creative Commons Attribution Non-Commercial Licence (http://creativecommons.org/licenses/by-nc/2.5/)which permits unrestricted non-commercial use, distribution and reproduction in any medium, provided the original work is properly cited.
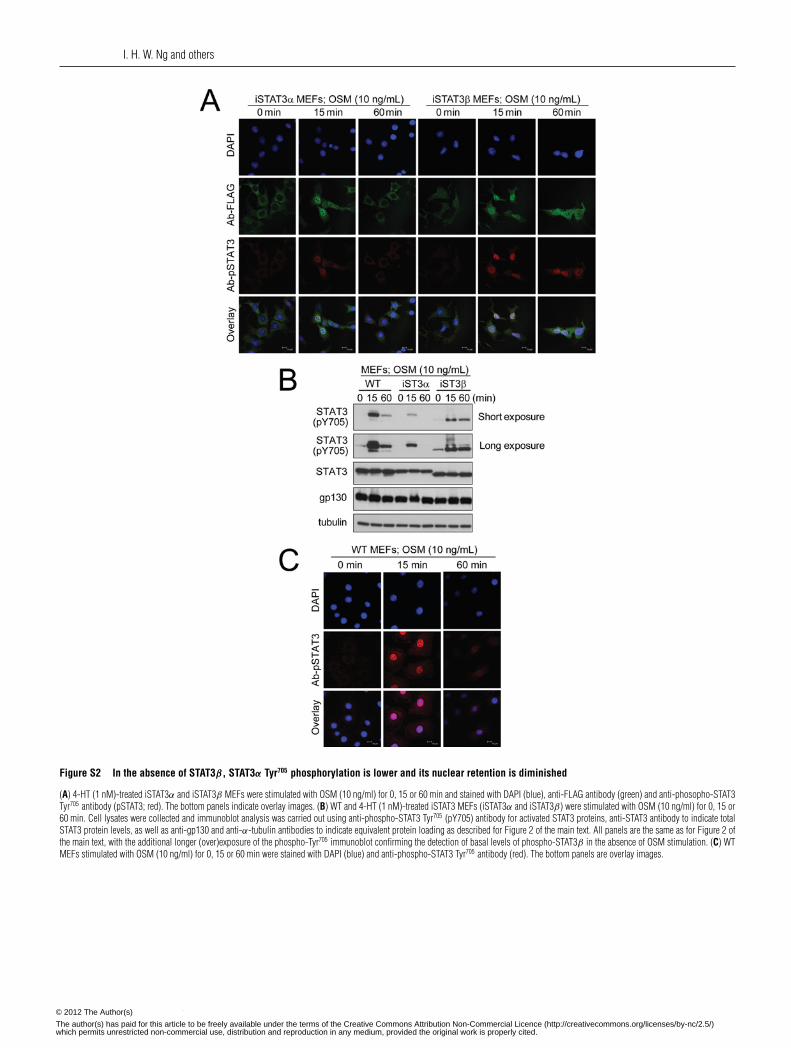
I. H. W. Ng and others
Figure S2 In the absence of STAT3β, STAT3α Tyr705 phosphorylation is lower and its nuclear retention is diminished
(A) 4-HT (1 nM)-treated iSTAT3α and iSTAT3β MEFs were stimulated with OSM (10 ng/ml) for 0, 15 or 60 min and stained with DAPI (blue), anti-FLAG antibody (green) and anti-phosopho-STAT3Tyr705 antibody (pSTAT3; red). The bottom panels indicate overlay images. (B) WT and 4-HT (1 nM)-treated iSTAT3 MEFs (iSTAT3α and iSTAT3β) were stimulated with OSM (10 ng/ml) for 0, 15 or60 min. Cell lysates were collected and immunoblot analysis was carried out using anti-phospho-STAT3 Tyr705 (pY705) antibody for activated STAT3 proteins, anti-STAT3 antibody to indicate totalSTAT3 protein levels, as well as anti-gp130 and anti-α-tubulin antibodies to indicate equivalent protein loading as described for Figure 2 of the main text. All panels are the same as for Figure 2 ofthe main text, with the additional longer (over)exposure of the phospho-Tyr705 immunoblot confirming the detection of basal levels of phospho-STAT3β in the absence of OSM stimulation. (C) WTMEFs stimulated with OSM (10 ng/ml) for 0, 15 or 60 min were stained with DAPI (blue) and anti-phospho-STAT3 Tyr705 antibody (red). The bottom panels are overlay images.
c© The Authors Journal compilation c© 2012 Biochemical Society© 2012 The Author(s)
The author(s) has paid for this article to be freely available under the terms of the Creative Commons Attribution Non-Commercial Licence (http://creativecommons.org/licenses/by-nc/2.5/)which permits unrestricted non-commercial use, distribution and reproduction in any medium, provided the original work is properly cited.
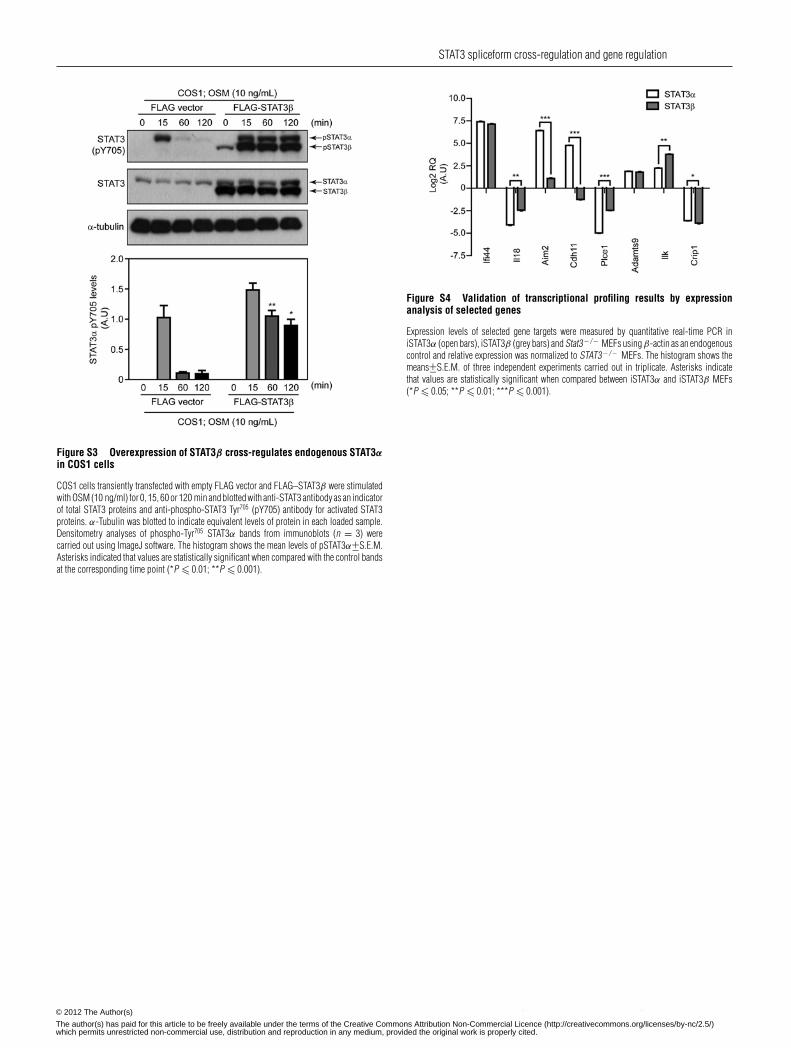
STAT3 spliceform cross-regulation and gene regulation
Figure S3 Overexpression of STAT3β cross-regulates endogenous STAT3αin COS1 cells
COS1 cells transiently transfected with empty FLAG vector and FLAG–STAT3β were stimulatedwith OSM (10 ng/ml) for 0, 15, 60 or 120 min and blotted with anti-STAT3 antibody as an indicatorof total STAT3 proteins and anti-phospho-STAT3 Tyr705 (pY705) antibody for activated STAT3proteins. α-Tubulin was blotted to indicate equivalent levels of protein in each loaded sample.Densitometry analyses of phospho-Tyr705 STAT3α bands from immunoblots (n = 3) werecarried out using ImageJ software. The histogram shows the mean levels of pSTAT3α+−S.E.M.Asterisks indicated that values are statistically significant when compared with the control bandsat the corresponding time point (*P � 0.01; **P � 0.001).
Figure S4 Validation of transcriptional profiling results by expressionanalysis of selected genes
Expression levels of selected gene targets were measured by quantitative real-time PCR iniSTAT3α (open bars), iSTAT3β (grey bars) and Stat3− / − MEFs using β-actin as an endogenouscontrol and relative expression was normalized to STAT3− / − MEFs. The histogram shows themeans+−S.E.M. of three independent experiments carried out in triplicate. Asterisks indicatethat values are statistically significant when compared between iSTAT3α and iSTAT3β MEFs(*P � 0.05; **P � 0.01; ***P � 0.001).
c© The Authors Journal compilation c© 2012 Biochemical Society© 2012 The Author(s)
The author(s) has paid for this article to be freely available under the terms of the Creative Commons Attribution Non-Commercial Licence (http://creativecommons.org/licenses/by-nc/2.5/)which permits unrestricted non-commercial use, distribution and reproduction in any medium, provided the original work is properly cited.
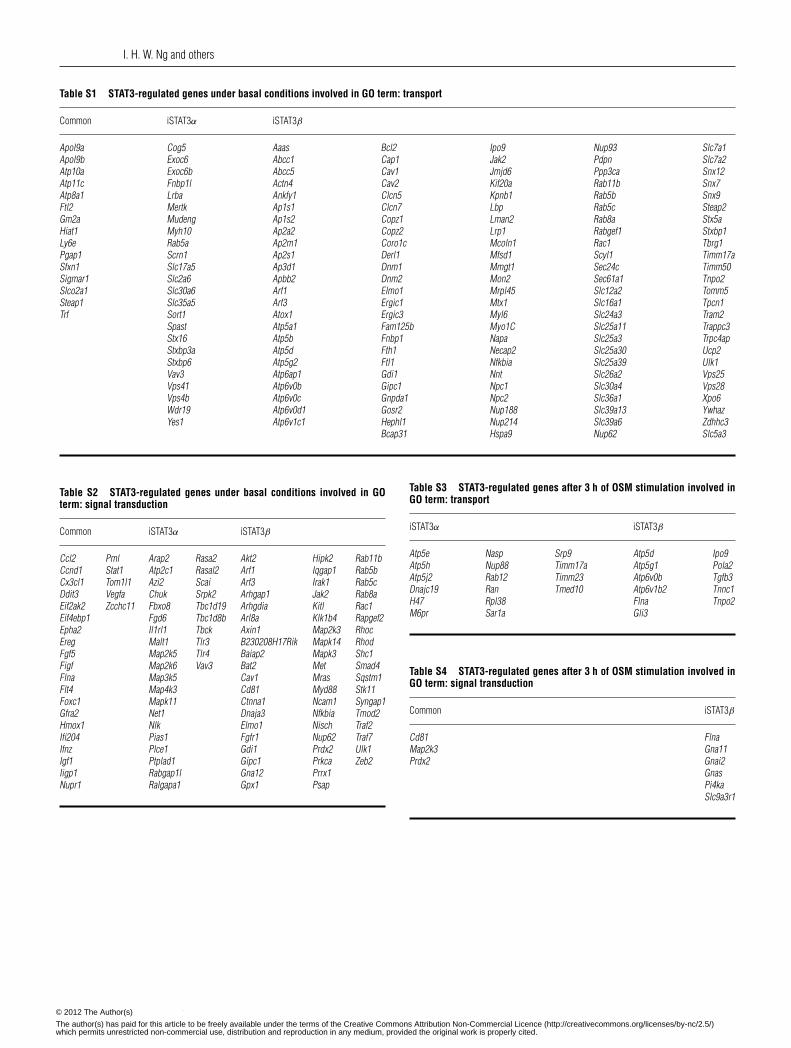
I. H. W. Ng and others
Table S1 STAT3-regulated genes under basal conditions involved in GO term: transport
Common iSTAT3α iSTAT3β
Apol9a Cog5 Aaas Bcl2 Ipo9 Nup93 Slc7a1Apol9b Exoc6 Abcc1 Cap1 Jak2 Pdpn Slc7a2Atp10a Exoc6b Abcc5 Cav1 Jmjd6 Ppp3ca Snx12Atp11c Fnbp1l Actn4 Cav2 Kif20a Rab11b Snx7Atp8a1 Lrba Ankfy1 Clcn5 Kpnb1 Rab5b Snx9Ftl2 Mertk Ap1s1 Clcn7 Lbp Rab5c Steap2Gm2a Mudeng Ap1s2 Copz1 Lman2 Rab8a Stx5aHiat1 Myh10 Ap2a2 Copz2 Lrp1 Rabgef1 Stxbp1Ly6e Rab5a Ap2m1 Coro1c Mcoln1 Rac1 Tbrg1Pgap1 Scrn1 Ap2s1 Derl1 Mfsd1 Scyl1 Timm17aSfxn1 Slc17a5 Ap3d1 Dnm1 Mmgt1 Sec24c Timm50Sigmar1 Slc2a6 Apbb2 Dnm2 Mon2 Sec61a1 Tnpo2Slco2a1 Slc30a6 Arf1 Elmo1 Mrpl45 Slc12a2 Tomm5Steap1 Slc35a5 Arf3 Ergic1 Mtx1 Slc16a1 Tpcn1Trf Sort1 Atox1 Ergic3 Myl6 Slc24a3 Tram2
Spast Atp5a1 Fam125b Myo1C Slc25a11 Trappc3Stx16 Atp5b Fnbp1 Napa Slc25a3 Trpc4apStxbp3a Atp5d Fth1 Necap2 Slc25a30 Ucp2Stxbp6 Atp5g2 Ftl1 Nfkbia Slc25a39 Ulk1Vav3 Atp6ap1 Gdi1 Nnt Slc26a2 Vps25Vps41 Atp6v0b Gipc1 Npc1 Slc30a4 Vps28Vps4b Atp6v0c Gnpda1 Npc2 Slc36a1 Xpo6Wdr19 Atp6v0d1 Gosr2 Nup188 Slc39a13 YwhazYes1 Atp6v1c1 Hephl1 Nup214 Slc39a6 Zdhhc3
Bcap31 Hspa9 Nup62 Slc5a3
Table S2 STAT3-regulated genes under basal conditions involved in GOterm: signal transduction
Common iSTAT3α iSTAT3β
Ccl2 Pml Arap2 Rasa2 Akt2 Hipk2 Rab11bCcnd1 Stat1 Atp2c1 Rasal2 Arf1 Iqgap1 Rab5bCx3cl1 Tom1l1 Azi2 Scai Arf3 Irak1 Rab5cDdit3 Vegfa Chuk Srpk2 Arhgap1 Jak2 Rab8aEif2ak2 Zcchc11 Fbxo8 Tbc1d19 Arhgdia Kitl Rac1Eif4ebp1 Fgd6 Tbc1d8b Arl8a Klk1b4 Rapgef2Epha2 Il1rl1 Tbck Axin1 Map2k3 RhocEreg Malt1 Tlr3 B230208H17Rik Mapk14 RhodFgf5 Map2k5 Tlr4 Baiap2 Mapk3 Shc1Figf Map2k6 Vav3 Bat2 Met Smad4Flna Map3k5 Cav1 Mras Sqstm1Flt4 Map4k3 Cd81 Myd88 Stk11Foxc1 Mapk11 Ctnna1 Ncam1 Syngap1Gfra2 Net1 Dnaja3 Nfkbia Tmod2Hmox1 Nlk Elmo1 Nisch Traf2Ifi204 Pias1 Fgfr1 Nup62 Traf7Ifnz Plce1 Gdi1 Prdx2 Ulk1Igf1 Ptplad1 Gipc1 Prkca Zeb2Iigp1 Rabgap1l Gna12 Prrx1Nupr1 Ralgapa1 Gpx1 Psap
Table S3 STAT3-regulated genes after 3 h of OSM stimulation involved inGO term: transport
iSTAT3α iSTAT3β
Atp5e Nasp Srp9 Atp5d Ipo9Atp5h Nup88 Timm17a Atp5g1 Pola2Atp5j2 Rab12 Timm23 Atp6v0b Tgfb3Dnajc19 Ran Tmed10 Atp6v1b2 Tnnc1H47 Rpl38 Flna Tnpo2M6pr Sar1a Gli3
Table S4 STAT3-regulated genes after 3 h of OSM stimulation involved inGO term: signal transduction
Common iSTAT3β
Cd81 FlnaMap2k3 Gna11Prdx2 Gnai2
GnasPi4kaSlc9a3r1
c© The Authors Journal compilation c© 2012 Biochemical Society© 2012 The Author(s)
The author(s) has paid for this article to be freely available under the terms of the Creative Commons Attribution Non-Commercial Licence (http://creativecommons.org/licenses/by-nc/2.5/)which permits unrestricted non-commercial use, distribution and reproduction in any medium, provided the original work is properly cited.
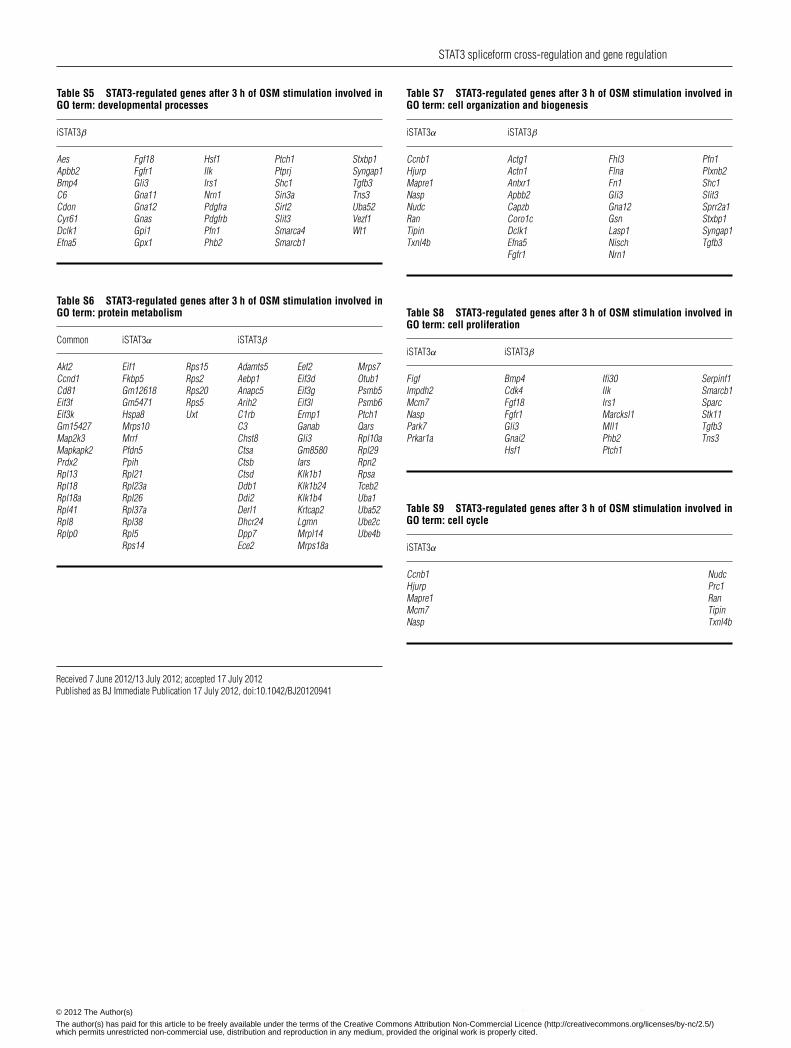
STAT3 spliceform cross-regulation and gene regulation
Table S5 STAT3-regulated genes after 3 h of OSM stimulation involved inGO term: developmental processes
iSTAT3β
Aes Fgf18 Hsf1 Ptch1 Stxbp1Apbb2 Fgfr1 Ilk Ptprj Syngap1Bmp4 Gli3 Irs1 Shc1 Tgfb3C6 Gna11 Nrn1 Sin3a Tns3Cdon Gna12 Pdgfra Sirt2 Uba52Cyr61 Gnas Pdgfrb Slit3 Vezf1Dclk1 Gpi1 Pfn1 Smarca4 Wt1Efna5 Gpx1 Phb2 Smarcb1
Table S6 STAT3-regulated genes after 3 h of OSM stimulation involved inGO term: protein metabolism
Common iSTAT3α iSTAT3β
Akt2 Eif1 Rps15 Adamts5 Eef2 Mrps7Ccnd1 Fkbp5 Rps2 Aebp1 Eif3d Otub1Cd81 Gm12618 Rps20 Anapc5 Eif3g Psmb5Eif3f Gm5471 Rps5 Arih2 Eif3l Psmb6Eif3k Hspa8 Uxt C1rb Ermp1 Ptch1Gm15427 Mrps10 C3 Ganab QarsMap2k3 Mrrf Chst8 Gli3 Rpl10aMapkapk2 Pfdn5 Ctsa Gm8580 Rpl29Prdx2 Ppih Ctsb Iars Rpn2Rpl13 Rpl21 Ctsd Klk1b1 RpsaRpl18 Rpl23a Ddb1 Klk1b24 Tceb2Rpl18a Rpl26 Ddi2 Klk1b4 Uba1Rpl41 Rpl37a Derl1 Krtcap2 Uba52Rpl8 Rpl38 Dhcr24 Lgmn Ube2cRplp0 Rpl5 Dpp7 Mrpl14 Ube4b
Rps14 Ece2 Mrps18a
Table S7 STAT3-regulated genes after 3 h of OSM stimulation involved inGO term: cell organization and biogenesis
iSTAT3α iSTAT3β
Ccnb1 Actg1 Fhl3 Pfn1Hjurp Actn1 Flna Plxnb2Mapre1 Antxr1 Fn1 Shc1Nasp Apbb2 Gli3 Slit3Nudc Capzb Gna12 Sprr2a1Ran Coro1c Gsn Stxbp1Tipin Dclk1 Lasp1 Syngap1Txnl4b Efna5 Nisch Tgfb3
Fgfr1 Nrn1
Table S8 STAT3-regulated genes after 3 h of OSM stimulation involved inGO term: cell proliferation
iSTAT3α iSTAT3β
Figf Bmp4 Ifi30 Serpinf1Impdh2 Cdk4 Ilk Smarcb1Mcm7 Fgf18 Irs1 SparcNasp Fgfr1 Marcksl1 Stk11Park7 Gli3 Mll1 Tgfb3Prkar1a Gnai2 Phb2 Tns3
Hsf1 Ptch1
Table S9 STAT3-regulated genes after 3 h of OSM stimulation involved inGO term: cell cycle
iSTAT3α
Ccnb1 NudcHjurp Prc1Mapre1 RanMcm7 TipinNasp Txnl4b
Received 7 June 2012/13 July 2012; accepted 17 July 2012Published as BJ Immediate Publication 17 July 2012, doi:10.1042/BJ20120941
c© The Authors Journal compilation c© 2012 Biochemical Society© 2012 The Author(s)
The author(s) has paid for this article to be freely available under the terms of the Creative Commons Attribution Non-Commercial Licence (http://creativecommons.org/licenses/by-nc/2.5/)which permits unrestricted non-commercial use, distribution and reproduction in any medium, provided the original work is properly cited.
Related Documents