Science of Science Research and Tools Tutorial #10 of 12 Dr. Katy Börner Cyberinfrastructure for Network Science Center, Director Information Visualization Laboratory, Director School of Library and Information Science Indiana University, Bloomington, IN http:// info.slis.indiana.edu/~katy With special thanks to Kevin W. Boyack, Micah Linnemeier, Russell J. Duhon, Patrick Phillips, Joseph Biberstine, Chintan Tank Nianli Ma, Hanning Guo, Mark A. Price, Angela M. Zoss, and Scott Weingart Invited by Robin M. Wagner, Ph.D., M.S. Chief Reporting Branch, Division of Information Services Office of Research Information Systems, Office of Extramural Research Office of the Director, National Institutes of Health Suite 4090, 6705 Rockledge Drive, Bethesda, MD 20892 10a-noon, July 27, 2010

Science of Science Research and Tools Tutorial #10 of 12 Dr. Katy Börner Cyberinfrastructure for Network Science Center, Director Information Visualization.
Dec 18, 2015
Welcome message from author
This document is posted to help you gain knowledge. Please leave a comment to let me know what you think about it! Share it to your friends and learn new things together.
Transcript

Science of Science Research and Tools Tutorial #10 of 12
Dr. Katy Börner Cyberinfrastructure for Network Science Center, DirectorInformation Visualization Laboratory, DirectorSchool of Library and Information ScienceIndiana University, Bloomington, INhttp://info.slis.indiana.edu/~katy
With special thanks to Kevin W. Boyack, Micah Linnemeier, Russell J. Duhon, Patrick Phillips, Joseph Biberstine, Chintan TankNianli Ma, Hanning Guo, Mark A. Price, Angela M. Zoss, andScott Weingart
Invited by Robin M. Wagner, Ph.D., M.S.Chief Reporting Branch, Division of Information ServicesOffice of Research Information Systems, Office of Extramural ResearchOffice of the Director, National Institutes of Health
Suite 4090, 6705 Rockledge Drive, Bethesda, MD 2089210a-noon, July 27, 2010

What was the most valuable you learned today? How large data can be processed and visualized (2x) Intro to large scale network analysis—totally new to me. Identification of specific tools needed to do this. TARL and DrL algorithms
What was irrelevant for your work/needs? The listing of other tools—let’s focus on 1-2 things and actually
learn them. Nothing is irrelevant because all helps us think about what we can
do with the tools and what they could be used for in our work.What topics or examples would you like to explore in more
detail? What the various capabilities of Sci2 actually DO. We’ve been
clicking a lot of buttons without knowing what the tool id doing or how to interpret results.
Requirements to identify most relevant tool. Cytoscape visualizations
12 Tutorials in 12 Days at NIH—Feedback from Tutorial #8
2
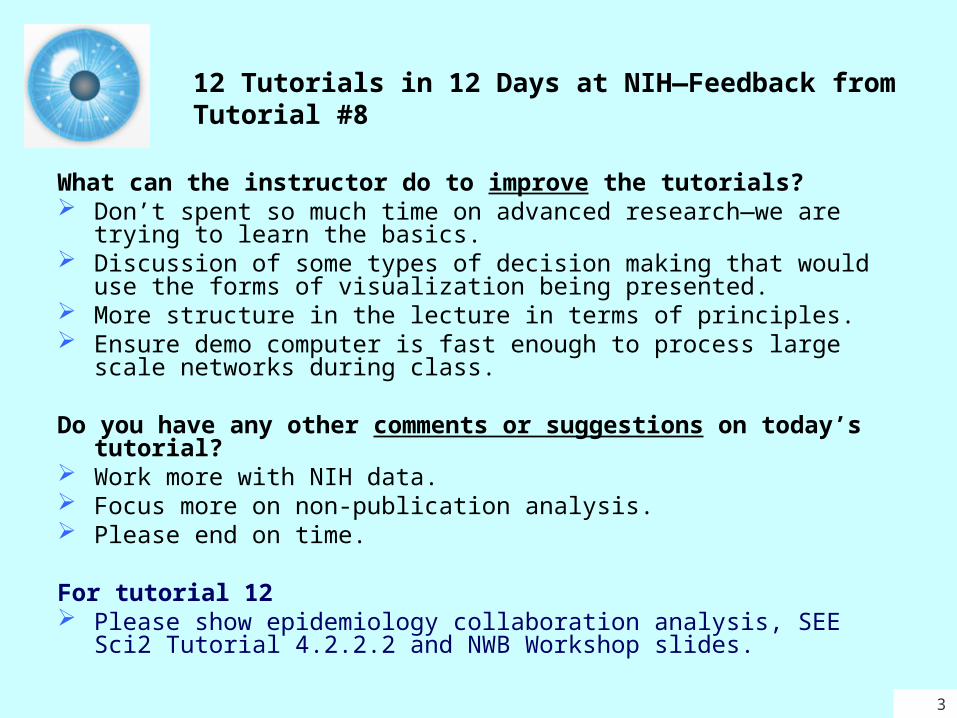
What can the instructor do to improve the tutorials? Don’t spent so much time on advanced research—we are trying to
learn the basics. Discussion of some types of decision making that would use the
forms of visualization being presented. More structure in the lecture in terms of principles. Ensure demo computer is fast enough to process large scale
networks during class.
Do you have any other comments or suggestions on today’s tutorial?
Work more with NIH data. Focus more on non-publication analysis. Please end on time.
For tutorial 12 Please show epidemiology collaboration analysis, SEE Sci2
Tutorial 4.2.2.2 and NWB Workshop slides.
12 Tutorials in 12 Days at NIH—Feedback from Tutorial #8
3

1. Science of Science Research 2. Information Visualization 3. CIShell Powered Tools: Network Workbench and Science of
Science Tool
4. Temporal Analysis—Burst Detection5. Geospatial Analysis and Mapping6. Topical Analysis & Mapping
7. Tree Analysis and Visualization8. Network Analysis9. Large Network Analysis
10. Using the Scholarly Database at IU11. VIVO National Researcher Networking 12. Future Developments
12 Tutorials in 12 Days at NIH—Overview
4
1st Week
2nd Week
3rd Week
4th Week

[#10] Using the Scholarly Database at IU Motivation Functionality / Sample Usage Implementation Documentation Outlook Exercise: Identify Promising SDB Collaborations
Recommended Reading La Rowe, Gavin, Ambre, Sumeet, Burgoon, John, Ke,
Weimao and Börner, Katy. (2007) The Scholarly Database and Its Utility for Scientometrics Research. In Proceedings of the 11th International Conference on Scientometrics and Informetrics, Madrid, Spain, June 25-27, 2007, pp. 457-462. http://ella.slis.indiana.edu/~katy/paper/07-issi-sdb.pdf
Scholarly Database home page, http://sdb.slis.indiana.edu.
12 Tutorials in 12 Days at NIH—Overview
5

[#11] VIVO National Researcher Networking Motivation Users, Their Needs, and Usage Scenarios Development Implementation Usage Outlook Exercise: Identify Promising VIVO Collaborations
Recommended ReadingVIVO home page, http://vivoweb.orgVIVO Conference in NYC in August 2010, http://
conferences.dce.ufl.edu/vivo
12 Tutorials in 12 Days at NIH—Overview
6

[#12] Future Developments Validation Studies Needed Data/Documentation Needed and New Tool Functionality Needed Documentation/Tutorials Promising Research Questions Exercise: Identify Promising Collaborations
Recommended ReadingBörner, Katy (2010) Atlas of Science. MIT Press. http://scimaps.org/atlas Börner, Katy, Bettencourt, Luis M. A., Gerstein, Mark & Uzzo, Stephen
Miles (Eds.), Knowledge Management and Visualization Tools in Support of Discovery. (2009). NSF CDI Initiative Workshop Report, National Science Foundation, Indiana University. http://vw.slis.indiana.edu/cdi2008/whitepaper.html
12 Tutorials in 12 Days at NIH—Overview
7

[#10] Using the Scholarly Database at IU
Motivation Functionality / Sample Usage Implementation Documentation Outlook Exercise: Identify Promising SDB
Collaborations
8

9Börner, Katy (2010) Atlas of Science. MIT Press. http://scimaps.org/atlas
Number of Awards/Funding and Researchers Over Time
10Börner, Katy (2010) Atlas of Science. MIT Press. http://scimaps.org/atlas
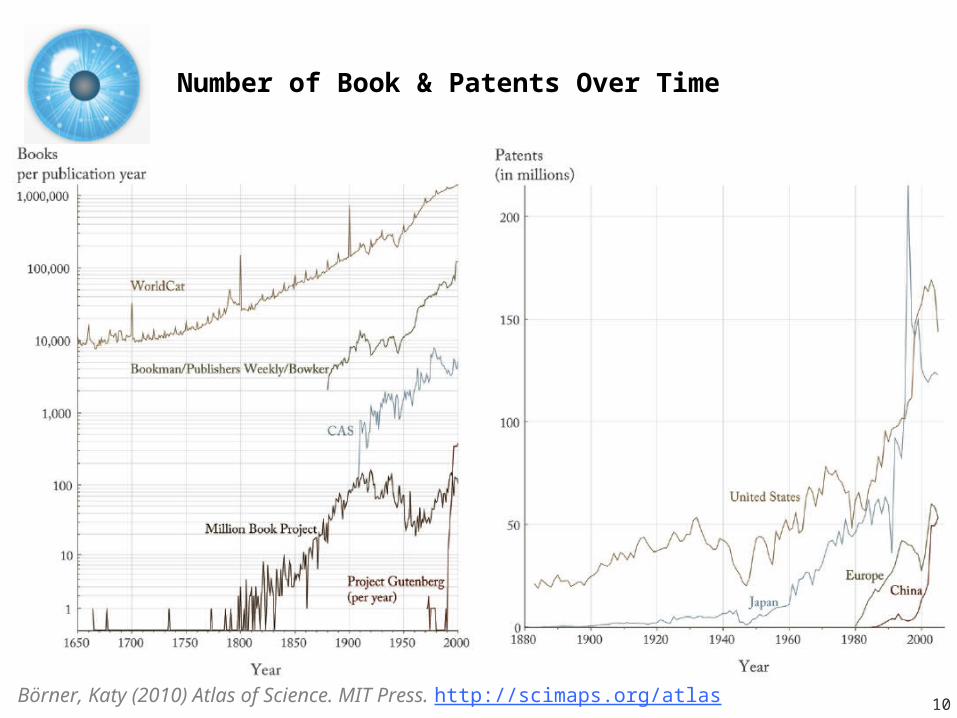
Number of Book & Patents Over Time

11Börner, Katy (2010) Atlas of Science. MIT Press. http://scimaps.org/atlas
Number of Journal Publications (Wikipedia entries) Over Time

Informed science and technology policy (and Science of Science Studies) depend
on comprehensive and useful data that has high Accuracy Integrity (structured & managed) Consistency Validity (rules, standards are followed) Reliability
However, publications, patents, grants are kept in data silos with few interlinkages, incompatible formats, unknown quality and coverage.
Obama Administration is committed to evidence-based policymaking and making
data used for policymaking accessible, relevant, and timely. … Data and analyses
should be factual and policy-neutral.http://www.whitehouse.gov/blog/2010/01/18/science-and-engineering-
indicators-2010-a-report-card-us-science-engineering-and-tec
Data Needs
12

[#10] Using the Scholarly Database at IU
Motivation Functionality / Sample Usage Implementation Documentation Outlook Exercise: Identify Promising SDB
Collaborations
13

Scholarly Databasehttp://sdb.slis.indiana.edu
“From Data Silos to Wind Chimes”
Create public databases that any scholar can use. Share the burden of data cleaning and federation.
Interlink creators, data, software/tools, publications, patents, funding, etc.
La Rowe, Gavin, Ambre, Sumeet, Burgoon, John, Ke, Weimao and Börner, Katy. (2007) The Scholarly Database and Its Utility for
Scientometrics Research. In Proceedings of the 11th International Conference on Scientometrics and Informetrics, Madrid, Spain, June 25-
27, 2007, pp. 457-462. http://ella.slis.indiana.edu/~katy/paper/07-issi-sdb.pdf
Nianli Ma
14
15
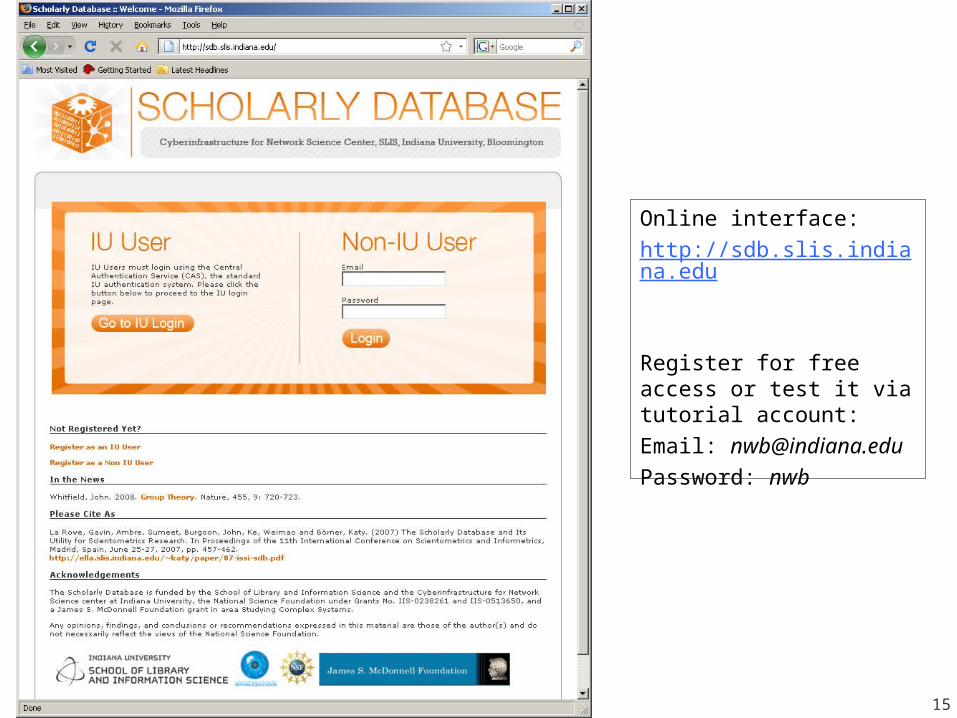
Online interface: http://sdb.slis.indiana.edu
Register for free access or test it via tutorial account:Email: [email protected]: nwb

16
Scholarly Database: About
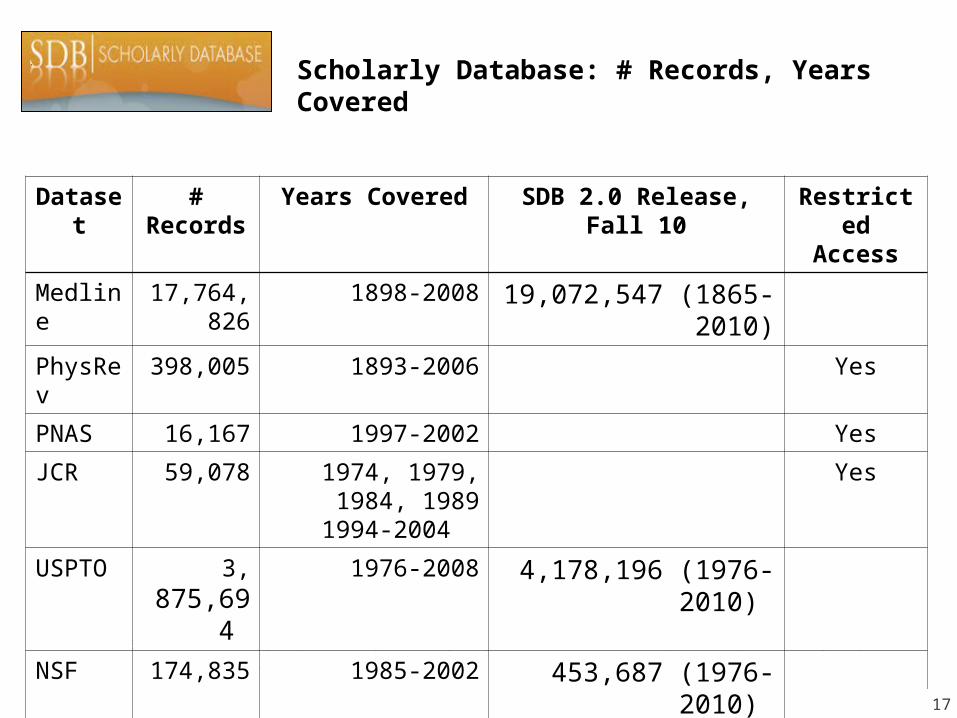
NIH awards are not aggregated by base project. Some have up to 3,000 subprojects.http://sdb.slis.indiana.edu/about
Dataset
# Records
Years Covered SDB 2.0 Release, Fall 10
Restricted Access
Medline
17,764,826
1898-2008 19,072,547 (1865-2010)
PhysRev
398,005 1893-2006 Yes
PNAS 16,167 1997-2002 Yes
JCR 59,078 1974, 1979, 1984, 1989
1994-2004
Yes
USPTO
3, 875,69
4
1976-2008 4,178,196 (1976-2010)
NSF 174,835 1985-2002 453,687 (1976-2010)
NIH 1,043,804
1961-2002 1,770,770 (1961-2010)*
Total 23,167,642
1893-2006 3
Scholarly Database: # Records, Years Covered
17
18
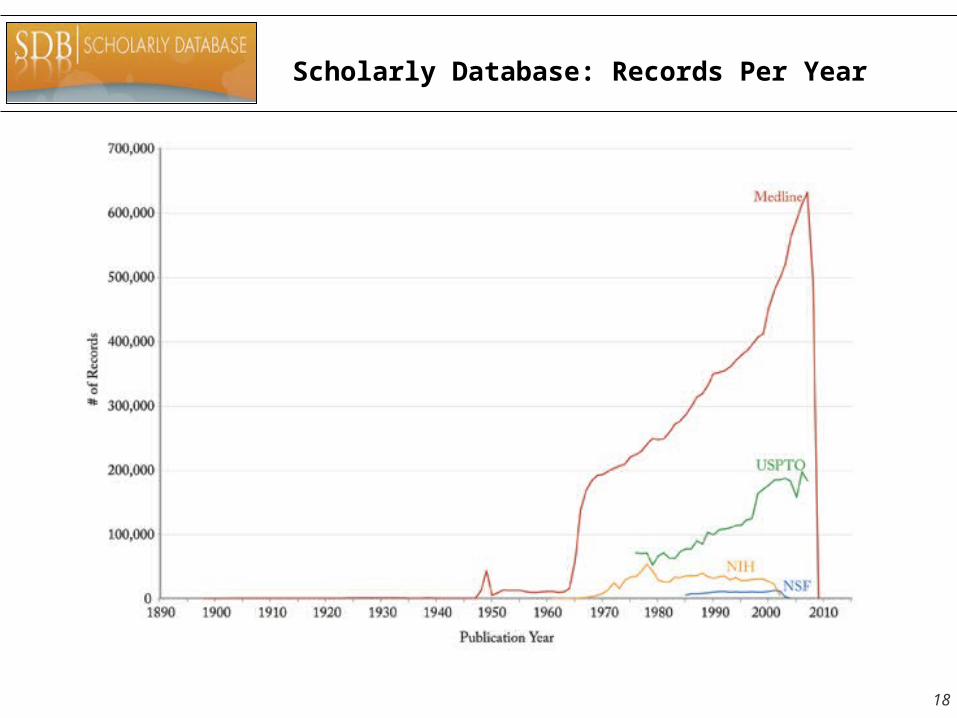
Scholarly Database: Records Per Year
http://sdb.slis.indiana.edu/about

19
Scholarly Database: Records Per Year
https://nwb.slis.indiana.edu/community/?n=ScientometricsDatasets.USPTO
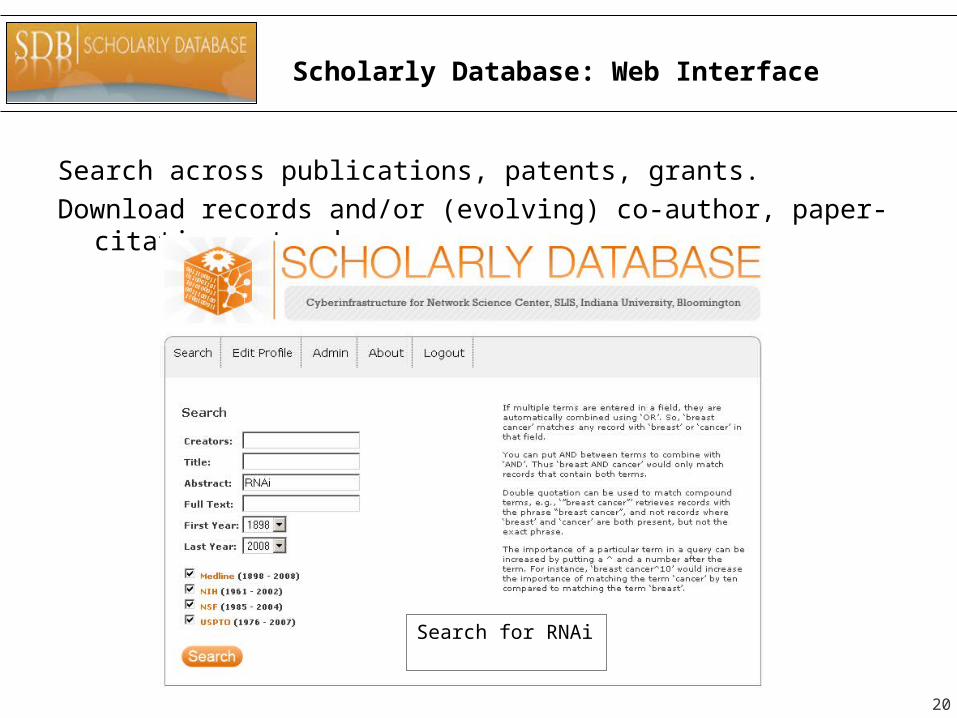
Scholarly Database: Web Interface
Search across publications, patents, grants.Download records and/or (evolving) co-author, paper-citation
networks.
20
Search for RNAi

Scholarly Database: Browse Search Results
21
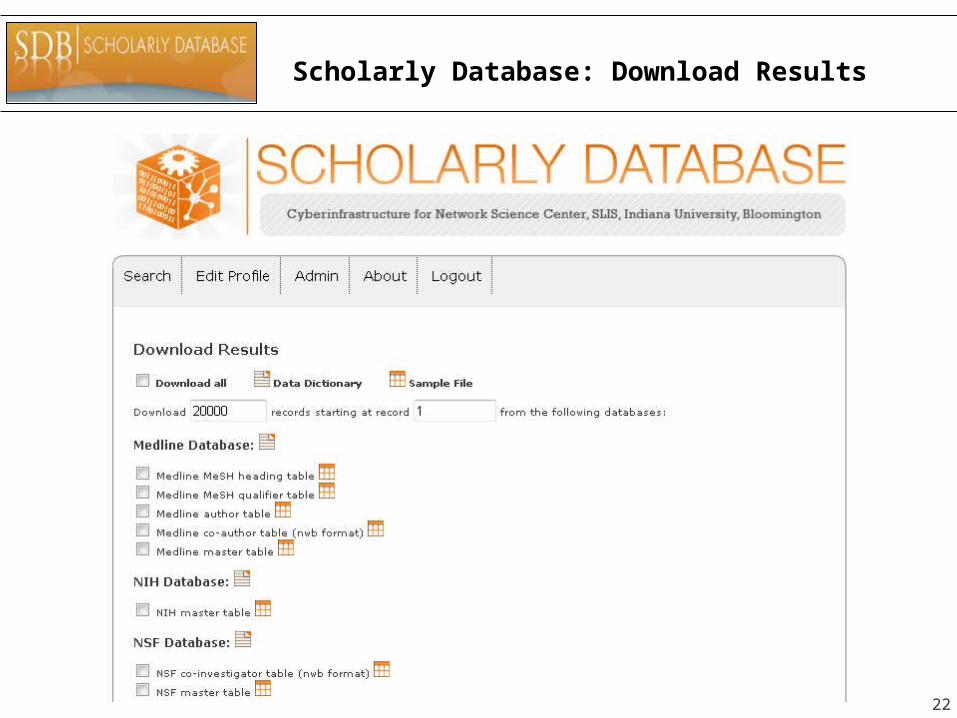
Scholarly Database: Download Results
22

Since March 2009:Users can download networks: - Co-author - Co-investigator - Co-inventor - Patent citationand tables for burst analysis in NWB.
23

Mapping the Field of RNAi Research (SDB Data) (Sci2 Tutorial, Section 5.2.7)
How many papers, patents, and funding awards exist on a specific topic? Here we selected research on RNA interference (RNAi) is a system within living cells that helps to control which genes are active and how active they are. The data for this analysis comes from a search of the Scholarly Database (SDB) (http://sdb.slis.indiana.edu/) for “RNAi” in “All Text” from MEDLINE, NSF, NIH and USPTO. A copy of this data is available in ‘*yoursci2directory*/sampledata/scientometrics/sdb/RNAi’. The default export format is .csv, which can be loaded in the Sci2 Tool directly.
24
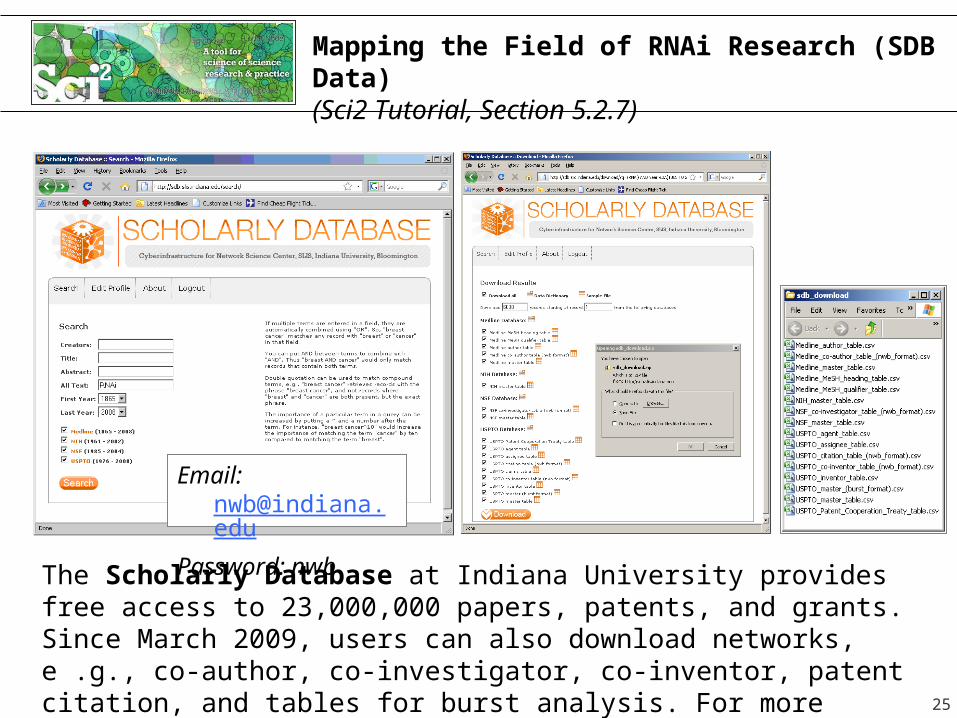
Mapping the Field of RNAi Research (SDB Data) (Sci2 Tutorial, Section 5.2.7)
The Scholarly Database at Indiana University provides free access to 23,000,000 papers, patents, and grants. Since March 2009, users can also download networks, e .g., co-author, co-investigator, co-inventor, patent citation, and tables for burst analysis. For more information and to register, visit http://sdb.slis.indiana.edu.
25
Email: [email protected]
Password: nwb

Mapping the Field of RNAi Research (SDB Data) (Sci2 Tutorial, Section 5.2.7)
.
26
Co-Author NetworkLoad ‘*yoursci2directory*/sampledata/scientometrics/sdb/RNAi/Medline_co-author_table_(nwb_format).csv’ as a standard csv file. SDB tables are already pre-normalized, so now simply run ‘Data Preparation > Text Files > Extract Co-Occurrence Network’ using the default parameters.
Network Analysis Toolkit (NAT):21,578 nodes with 131 isolates, 77,739 edges.
Extract only the largest component by running ‘Analysis > Networks > Unweighted and Undirected > Weak Component Clustering.’
Visualize with GUESS using ‘Layout > GEM’. Use a custom python script to color and size the network. 26

Mapping the Field of RNAi Research (SDB Data) (Sci2 Tutorial, Section 5.2.7)
.
27
Patent Citation Network
To visualize the citation patterns of patents on RNAi, load ‘*yoursci2directory*/sampledata/scientometrics/sdb/RNAi/USPTO_citation_table_(nwb_format).csv’ as a standard csv file and follow the instructions in the tutorial.
Mapping the Field of RNAi Research (SDB Data) (Sci2 Tutorial, Section 5.2.7)
.
28
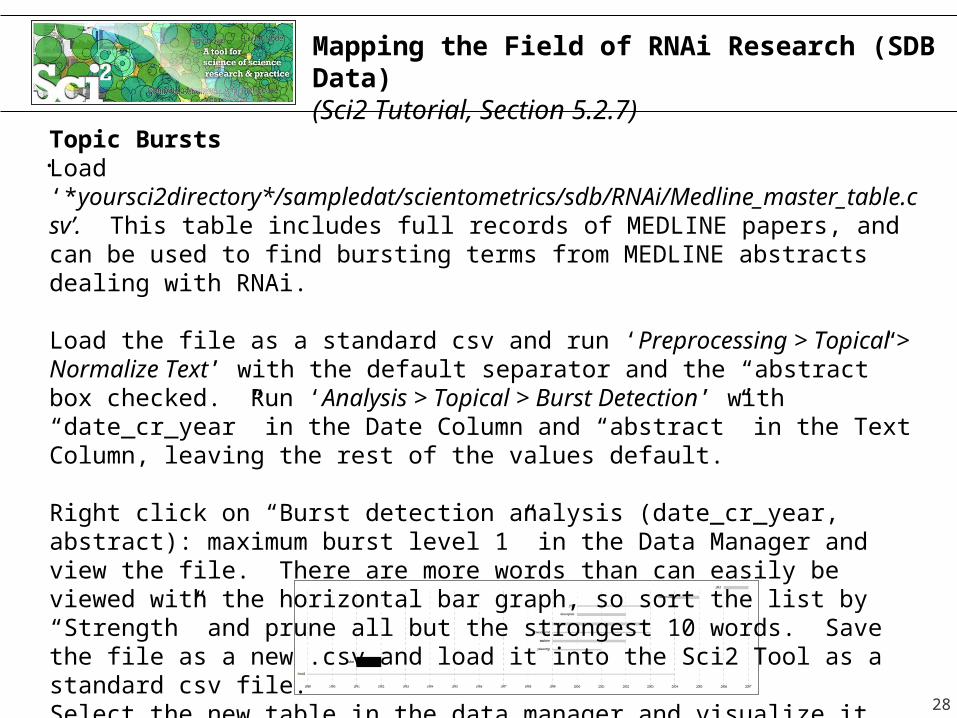
Topic BurstsLoad ‘*yoursci2directory*/sampledat/scientometrics/sdb/RNAi/Medline_master_table.csv’. This table includes full records of MEDLINE papers, and can be used to find bursting terms from MEDLINE abstracts dealing with RNAi.
Load the file as a standard csv and run ‘Preprocessing > Topical > Normalize Text’ with the default separator and the “abstract” box checked. Run ‘Analysis > Topical > Burst Detection’ with “date_cr_year” in the Date Column and “abstract” in the Text Column, leaving the rest of the values default.
Right click on “Burst detection analysis (date_cr_year, abstract): maximum burst level 1” in the Data Manager and view the file. There are more words than can easily be viewed with the horizontal bar graph, so sort the list by “Strength” and prune all but the strongest 10 words. Save the file as a new .csv and load it into the Sci2 Tool as a standard csv file. Select the new table in the data manager and visualize it using ‘Visualize > Temporal > Horizontal Bar Graph.’
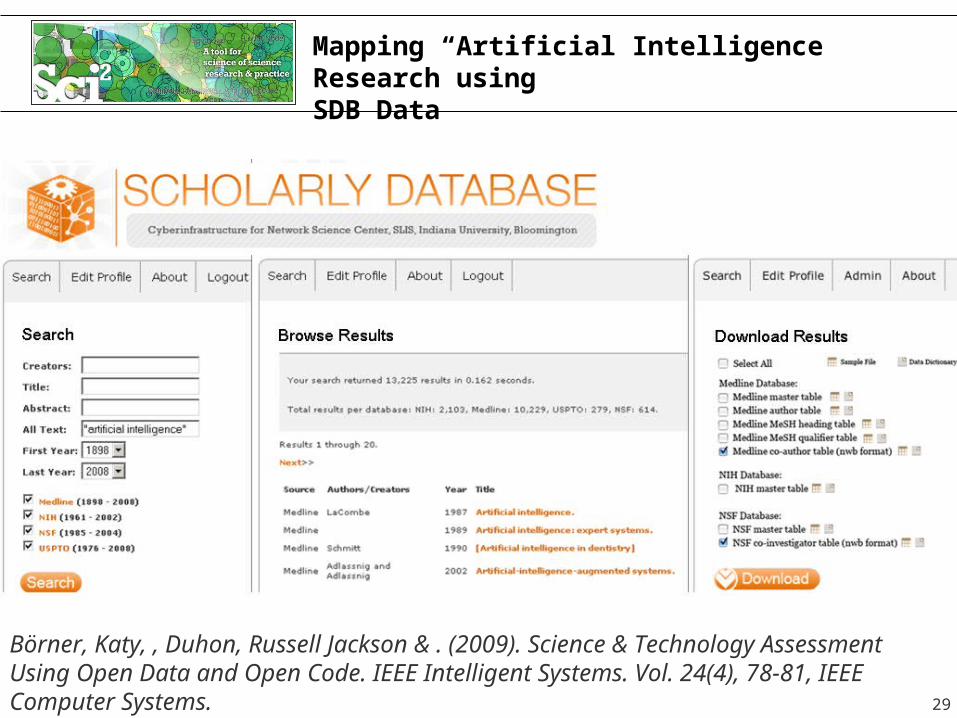
Mapping “Artificial Intelligence Research using SDB Data
29
Börner, Katy, , Duhon, Russell Jackson & . (2009). Science & Technology Assessment Using Open Data and Open Code. IEEE Intelligent Systems. Vol. 24(4), 78-81, IEEE Computer Systems.

Medcline Co-
30

31

32
[#10] Using the Scholarly Database at IU
Motivation Functionality / Sample Usage Implementation Documentation Outlook Exercise: Identify Promising SDB
Collaborations
33

34
35
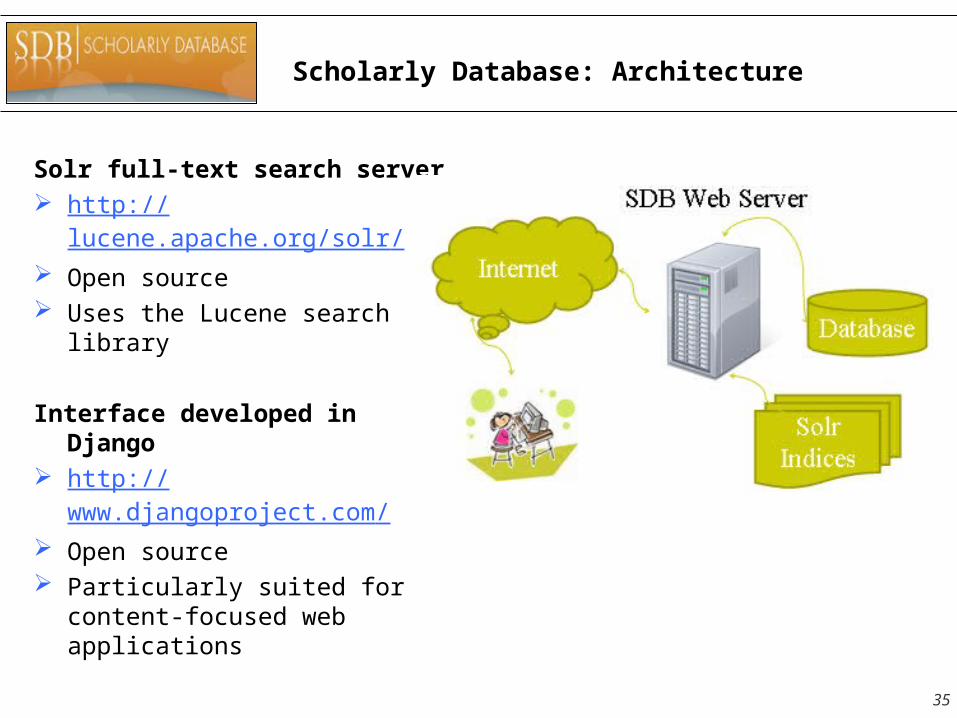
Scholarly Database: Architecture
Solr full-text search server http://
lucene.apache.org/solr/ Open source Uses the Lucene search
library
Interface developed in Django
http://www.djangoproject.com/
Open source Particularly suited for
content-focused web applications

NIH Grants
36

Medline Publications
37

NSF Grants
38

US Patents
39

[#10] Using the Scholarly Database at IU
Motivation Functionality / Sample Usage Implementation Documentation Outlook Exercise: Identify Promising SDB
Collaborations
40
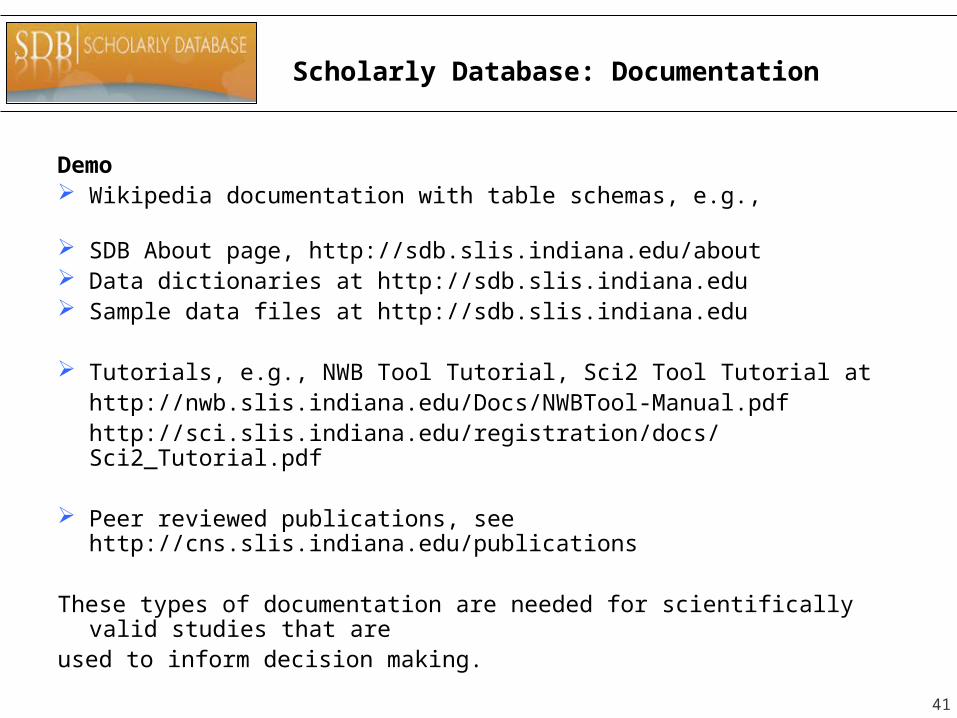
Scholarly Database: Documentation
Demo Wikipedia documentation with table schemas, e.g.,
https://nwb.slis.indiana.edu/community/?n=ScientometricsDatasets.USPTO
SDB About page, http://sdb.slis.indiana.edu/about Data dictionaries at http://sdb.slis.indiana.edu Sample data files at http://sdb.slis.indiana.edu
Tutorials, e.g., NWB Tool Tutorial, Sci2 Tool Tutorial athttp://nwb.slis.indiana.edu/Docs/NWBTool-Manual.pdf http://sci.slis.indiana.edu/registration/docs/Sci2_Tutorial.pdf
Peer reviewed publications, see http://cns.slis.indiana.edu/publications
These types of documentation are needed for scientifically valid studies that are
used to inform decision making.41

[#10] Using the Scholarly Database at IU
Motivation Functionality / Sample Usage Implementation Documentation Outlook Exercise: Identify Promising SDB
Collaborations
42

Planned SDB Extensions
Regular update of SDB Data (add NIH ExPORTER data)Adding linkage data, e.g., awards-> publications, grants, news.Adding job market dataExposing SDB data to the Linked Open Data
Extend SDB-Sci2 Tool synergies.
43

Adding NIH ExPORTER Data
Source: NIH ExPORTER at http://projectreporter.nih.gov/exporter/ExPORTER_Catalog.aspx?sid=1&index=0Year coverage: from 2000 till June 2010Update schedule: monthly for 2010 awardsFile formats available: xml/csvDescription from Web siteExPORTER makes downloadable versions of the data accessed through the RePORT Expenditures and Results (RePORTER) interface available to the public. This site is a key component of NIH "open government" initiatives to provide more transparency in NIH activities, improve the quality of the data we collect, and increase its utility. The NIH ExPORTER now is beta version. Original they only released the data from FY 2005 to FY 2009. On Jun 2010, they increased the historical data from FY 2000 to FY 2004 and refined record formats in response to user feedback. They will post release notes describing these changes until both xml and vsv record formats are finalized on Oct 1, 2010.
Data FieldsPlease see the NIH ExPORTER data dictionary.
44

[#10] Using the Scholarly Database at IU
Motivation Functionality / Sample Usage Implementation Documentation Outlook Exercise: Identify Promising SDB
Collaborations
45
Exercise
Please identify promising SDB usages and/or collaborations.
Document it by listing Project title User, i.e., who would be most interested in the result? Insight need addressed, i.e., what would you/user like to
understand? Data used, be as specific as possible. Analysis algorithms used. Visualization generated. Please make a sketch with legend.
46

All papers, maps, cyberinfrastructures, talks, press are linked from http://cns.slis.indiana.edu
47
Related Documents