Science of Science Research and Tools Tutorial #03 of 12 Dr. Katy Börner Cyberinfrastructure for Network Science Center, Director Information Visualization Laboratory, Director School of Library and Information Science Indiana University, Bloomington, IN http://info.slis.indiana.edu/~katy With special thanks to Kevin W. Boyack, Micah Linnemeier, Russell J. Duhon, Patrick Phillips, Joseph Biberstine, Chintan Tank Nianli Ma, Hanning Guo, Mark A. Price, Angela M. Zoss, and Scott Weingart Invited by Robin M. Wagner, Ph.D., M.S. Chief Reporting Branch, Division of Information Services Office of Research Information Systems, Office of Extramural Research Office of the Director, National Institutes of Health Suite 4090, 6705 Rockledge Drive, Bethesda, MD 20892 10a-noon, July 8, 2010

Science of Science Research and Tools Tutorial #03 of 12 Dr. Katy Börner Cyberinfrastructure for Network Science Center, Director Information Visualization.
Dec 29, 2015
Welcome message from author
This document is posted to help you gain knowledge. Please leave a comment to let me know what you think about it! Share it to your friends and learn new things together.
Transcript

Science of Science Research and Tools Tutorial #03 of 12
Dr. Katy Börner Cyberinfrastructure for Network Science Center, DirectorInformation Visualization Laboratory, DirectorSchool of Library and Information ScienceIndiana University, Bloomington, INhttp://info.slis.indiana.edu/~katy
With special thanks to Kevin W. Boyack, Micah Linnemeier, Russell J. Duhon, Patrick Phillips, Joseph Biberstine, Chintan TankNianli Ma, Hanning Guo, Mark A. Price, Angela M. Zoss, andScott Weingart
Invited by Robin M. Wagner, Ph.D., M.S.Chief Reporting Branch, Division of Information ServicesOffice of Research Information Systems, Office of Extramural ResearchOffice of the Director, National Institutes of Health
Suite 4090, 6705 Rockledge Drive, Bethesda, MD 2089210a-noon, July 8, 2010

1. Science of Science Research 2. Network Science / Information Visualization 3. CIShell Powered Tools: Network Workbench and Science of
Science Tool
4. Temporal Analysis—Burst Detection5. Geospatial Analysis and Mapping6. Topical Analysis & Mapping
7. Network Analysis 8. Network Analysis cont. 9. Extending the Sci2 Tool
10. Using the Scholarly Database at IU11. VIVO National Researcher Networking 12. Future Developments
12 Tutorials in 12 Days at NIH—Overview
2
1st Week
2nd Week
3rd Week
4th Week
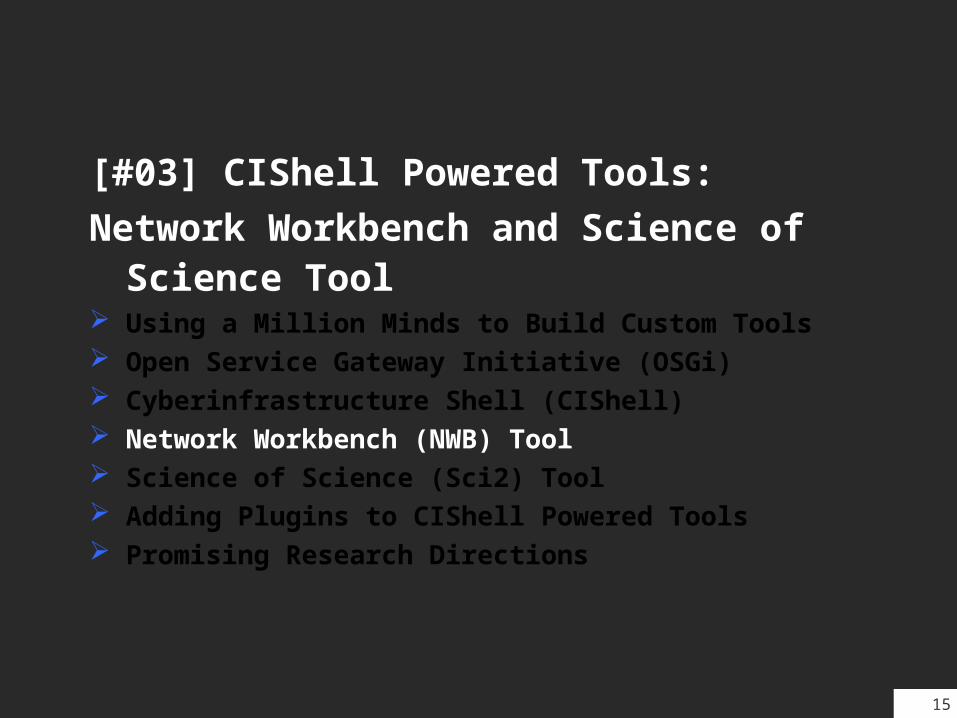
[#03] CIShell Powered Tools:
Network Workbench and Science of Science Tool
Using a Million Minds to Build Custom Tools Open Service Gateway Initiative (OSGi) Cyberinfrastructure Shell (CIShell) Network Workbench (NWB) Tool Science of Science (Sci2) Tool Adding Plugins to CIShell Powered Tools Promising Research Directions
3
[#03] CIShell Powered Tools:
Network Workbench and Science of Science Tool
Using a Million Minds to Build Custom Tools Open Service Gateway Initiative (OSGi) Cyberinfrastructure Shell (CIShell) Network Workbench (NWB) Tool Science of Science (Sci2) Tool Adding Plugins to CIShell Powered Tools Promising Research Directions
4

The Changing Scientific Landscape
Star Scientist -> Research Teams: In former times, science was driven by key scientists. Today, science is driven by effectively collaborating co-author teams often comprising expertise from multiple disciplines and several geospatial locations (Börner, Dall'Asta, Ke, & Vespignani, 2005; Shneiderman, 2008).
Users -> Contributors: Web 2.0 technologies empower anybody to contribute to Wikipedia or to exchange images and videos via Fickr and YouTube. WikiSpecies, WikiProfessionals, or WikiProteins combine wiki and semantic technology in support of real time community annotation of scientific datasets (Mons et al., 2008).
Cross-disciplinary: The best tools frequently borrow and synergistically combine methods and techniques from different disciplines of science and empower interdisciplinary and/or international teams of researchers, practitioners, or educators to fine-tune and interpret results collectively.
One Specimen -> Data Streams: Microscopes and telescopes were originally used to study one specimen at a time. Today, many researchers must make sense of massive streams of multiple types of data with different formats, dynamics, and origin.
Static Instrument -> Evolving Cyberinfrastructure (CI): The importance of hardware instruments that are rather static and expensive decreases relative to software infrastructures that are highly flexible and continuously evolving according to the needs of different sciences. Some of the most successful services and tools are decentralized increasing scalability and fault tolerance.

Just as the microscope empowered our naked eyes to see cells, microbes, and viruses thereby advancing the progress of biology and medicine or the telescope opened our minds to the immensity of the cosmos and has prepared mankind for the conquest of space, macroscopes promise to help us cope with another infinite: the infinitely complex. Macroscopes give us a ‘vision of the whole’ and help us ‘synthesize’. They let us detect patterns, trends, outliers, and access details in the landscape of science. Instead of making things larger or smaller, macroscopes let us observe what is at once too great, too slow, or too complex for our eyes.
Microscopes, Telescopes, and Macrocopes

Desirable Features of Macroscopes
Core Architecture & Plugins/Division of Labor: Computer scientists need to design the standardized, modular, easy to maintain and extend “core architecture”. Dataset and algorithm plugins, i.e., the “filling”, are provided by those that care and know most about the data and developed the algorithms: the domain experts.
Ease of Use: As most plugin contributions and usage will come from non-computer scientists it must be possible to contribute, share, and use new plugins without writing one line of code. Users need guidance for constructing effective workflows from 100+ continuously changing plugins.
Modularity: The design of software modules with well defined functionality that can be flexibly combined helps reduce costs, makes it possible to have many contribute, and increases flexibility in tool development, augmentation, and customization.
Standardization: Adoption of (industry) standards speeds up development as existing code can be leveraged. It helps pool resources, supports interoperability, but also eases the migration from research code to production code and hence the transfer of research results into industry applications and products.
Open Data and Open Code: Lets anybody check, improve, or repurpose code and eases the replication of scientific studies.
Börner, Katy (in press) Plug-and-Play Macroscopes. Communications of the ACM.

Example: Science of Science Studies
About 5-20 algorithms are involved in one single study/workflow.
Domain has about 300 core researchers, 10 key data sources, 20 common tools.
Approaches/algorithms from network science, social science, political science, economics, physics, information science, webometrics, etc. are highly relevant and new ones become available every day.
, Topics
Börner, Katy, Chen, Chaomei, and Boyack, Kevin. (2003) Visualizing Knowledge Domains. ARIST, pp. 179-255.
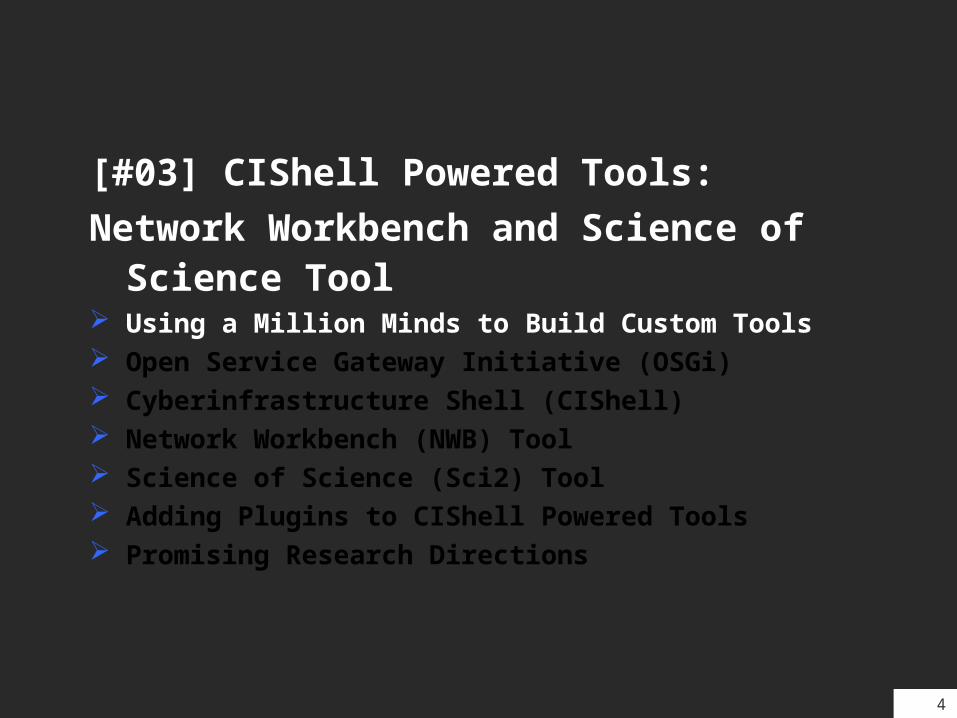
Custom Tools for Different Scientific CommunitiesInformation Visualization Cyberinfrastructure
http://iv.slis.indiana.edu Network Workbench Tool + Community Wiki
http://nwb.slis.indiana.edu Science of Science (Sci2) Tool and Portal
http://sci.slis.indiana.edu Epidemics Cyberinfrastructure
http://epic.slis.indiana.edu/
180+ Algorithm Plugins and Branded GUIs+
Core Architecture
Open Services Gateway Initiative (OSGi) Framework.http://orgi.org
Cyberinfrastructure Shell (CIShell)http://cishell.org
Macroscope Design
9

Scholarly Database: 23 million scholarly recordshttp://sdb.slis.indiana.edu
VIVO Research Networkinghttp://vivoweb.org
Information Visualization Cyberinfrastructurehttp://iv.slis.indiana.edu
Network Workbench Tool + Community Wikihttp://nwb.slis.indiana.edu
Sci2 Tool and Science of Science CI Portalhttp://sci.slis.indiana.edu
Epidemics Cyberinfrastructurehttp://epic.slis.indiana.edu/
Computational Scientometrics CI
10

[#03] CIShell Powered Tools:
Network Workbench and Science of Science Tool
Using a Million Minds to Build Custom Tools Open Service Gateway Initiative (OSGi) Cyberinfrastructure Shell (CIShell) Network Workbench (NWB) Tool Science of Science (Sci2) Tool Adding Plugins to CIShell Powered Tools Promising Research Directions
11

12
Cyberinfrastructure Shell (CIShell) http://cishell.org
CIShell IV Tool
NWB Interface
CIShell Wizards
Developers
CIShell is an open source software specification for the integration and utilization of datasets, algorithms, and tools.
It extends the Open Services Gateway Initiative (OSGi) (http://www.osgi.org), a standardized, component oriented, computing environment for networked services widely used in industry since 10 years.
Specifically, CIShell provides “sockets” into which existing and new datasets, algorithms, and tools can be plugged using a wizard-driven process. Users

CIShell – Builds on OSGi Industry Standard
CIShell is built upon the Open Services Gateway Initiative (OSGi) Framework.
OSGi (http://www.osgi.org) is A standardized, component oriented, computing environment for
networked services. Successfully used in the industry from high-end servers to
embedded mobile devices since 8 years. Alliance members include IBM (Eclipse), Sun, Intel, Oracle,
Motorola, NEC and many others. Widely adopted in open source realm, especially since Eclipse 3.0
that uses OSGi R4 for its plugin model.
Advantages of Using OSGi Any CIShell algorithm is a service that can be used in any OSGi-
framework based system. Using OSGi, running CIShells/tools can connected via RPC/RMI
supporting peer-to-peer sharing of data, algorithms, and computing power.
Ideally, CIShell becomes a standard for creating OSGi Services for algorithms.
13

CIShell – Converter Graph
No central data format. Sci2 Tool has 26 external and internal data formats and 35
converters. Their relationships can be derived by running ‘File >
Converter Graph’ and plotted as shown here. Note that some conversions are symmetrical (double arrow) while others are one-directional (arrow).
14
[#03] CIShell Powered Tools:
Network Workbench and Science of Science Tool
Using a Million Minds to Build Custom Tools Open Service Gateway Initiative (OSGi) Cyberinfrastructure Shell (CIShell) Network Workbench (NWB) Tool Science of Science (Sci2) Tool Adding Plugins to CIShell Powered Tools Promising Research Directions
15

16
Network Workbench Tool http://nwb.slis.indiana.edu
The Network Workbench (NWB) tool supports researchers, educators, and practitioners interested in the study of biomedical, social and behavioral science, physics, and other networks. In February 2009, the tool provides more 169 plugins that support the preprocessing, analysis, modeling, and visualization of networks. More than 50 of these plugins can be applied or were specifically designed for S&T studies.
It has been downloaded more than 65,000 times since December 2006.
Börner, Katy, Huang, Weixia (Bonnie), Linnemeier, Micah, Duhon, Russell Jackson, Phillips, Patrick, Ma, Nianli, Zoss, Angela, Guo, Hanning & Price, Mark. (2010). Rete-Netzwerk-Red: Analyzing and Visualizing Scholarly Networks Using the Network Workbench Tool. Scientometrics. Vol. 83(3), 863-876.

Project Details
Investigators: Katy Börner, Albert-Laszlo Barabasi, Santiago Schnell, Alessandro Vespignani & Stanley Wasserman, Eric Wernert
Software Team: Lead: Micah LinnemeierMembers: Patrick Phillips, Russell Duhon, Tim Kelley & Ann McCraniePrevious Developers: Weixia (Bonnie) Huang, Bruce Herr, Heng Zhang, Duygu Balcan, Bryan Hook, Ben Markines, Santo Fortunato, Felix Terkhorn, Ramya Sabbineni, Vivek S. Thakre & Cesar Hidalgo
Goal: Develop a large-scale network analysis, modeling and visualization toolkit for physics, biomedical, and social science research.
Amount: $1,120,926, NSF IIS-0513650 awardDuration: Sept. 2005 - Aug. 2009 Website: http://nwb.slis.indiana.edu

Project Details (cont.)
NWB Advisory Board:James Hendler (Semantic Web) http://www.cs.umd.edu/~hendler/Jason Leigh (CI) http://www.evl.uic.edu/spiff/ Neo Martinez (Biology) http://online.sfsu.edu/~webhead/ Michael Macy, Cornell University (Sociology)http://www.soc.cornell.edu/faculty/macy.shtml Ulrik Brandes (Graph Theory) http://www.inf.uni-konstanz.de/~brandes/ Mark Gerstein, Yale University (Bioinformatics) http://bioinfo.mbb.yale.edu/ Stephen North (AT&T) http://public.research.att.com/viewPage.cfm?PageID=81Tom Snijders, University of Groningen http://stat.gamma.rug.nl/snijders/
Noshir Contractor, Northwestern University http://www.spcomm.uiuc.edu/nosh/

Computational Proteomics What relationships exist between protein targets of all drugs
and all disease-gene products in the human protein–protein interaction
network?
Yildriim, Muhammed A., Kwan-II Goh, Michael E. Cusick, Albert-László Barabási, and Marc Vidal. (2007). Drug-target Network. Nature Biotechnology 25 no. 10: 1119-1126.
19

Computational EconomicsDoes the type of product that a country exports matter for subsequent economic performance?
C. A. Hidalgo, B. Klinger, A.-L. Barabási, R. Hausmann (2007) The Product Space Conditions the Development of Nations. Science 317, 482 (2007).
20

Computational Social ScienceStudying large scale social networks such as Wikipedia
Second Sight: An Emergent Mosaic of Wikipedian Activity, The NewScientist, May 19, 2007
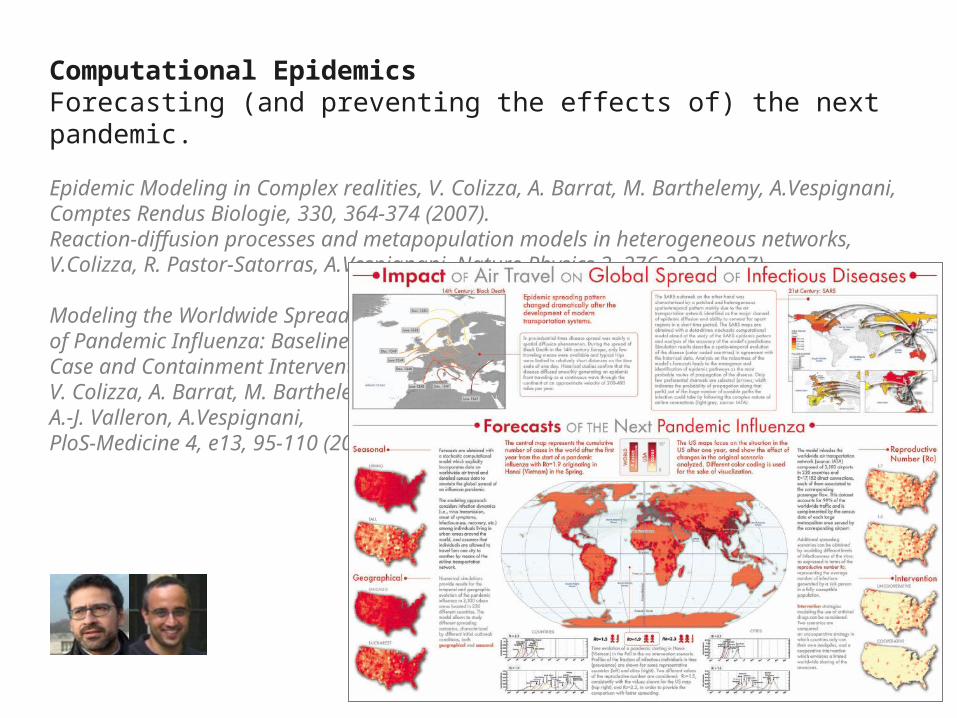
Computational EpidemicsForecasting (and preventing the effects of) the next pandemic.
Epidemic Modeling in Complex realities, V. Colizza, A. Barrat, M. Barthelemy, A.Vespignani, Comptes Rendus Biologie, 330, 364-374 (2007).Reaction-diffusion processes and metapopulation models in heterogeneous networks, V.Colizza, R. Pastor-Satorras, A.Vespignani, Nature Physics 3, 276-282 (2007).
Modeling the Worldwide Spread of Pandemic Influenza: Baseline Case and Containment Interventions, V. Colizza, A. Barrat, M. Barthelemy, A.-J. Valleron, A.Vespignani, PloS-Medicine 4, e13, 95-110 (2007).

NWB Tool Download, Install, and Run
NWB Tool 1.0.0Can be freely downloaded for all major operating systems from http://nwb.slis.indiana.edu Select your operating system from the pull down menu and download. Unpack into a /nwb directory.Run /nwb/nwb.exe
Session log files are stored in ‘*yournwbdirectory*/logs’ directory.
Cite asNWB Team. (2006). Network Workbench Tool. Indiana University, Northeastern University, and University of Michigan, http://nwb.slis.indiana.edu.
23
The file was also made available as nwb-N-1.0.0.200909181911NGT-
win32.win32.x86.zipon the computers in the tutorial room.
24
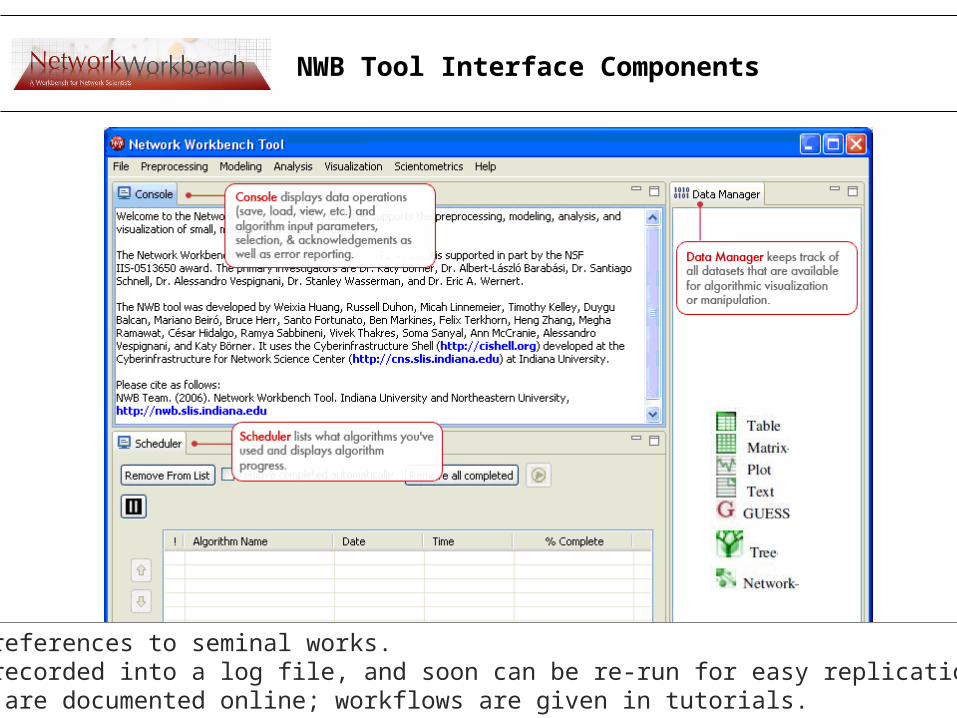
NWB Tool Interface Components
Console shows references to seminal works.Workflows are recorded into a log file, and soon can be re-run for easy replication.All algorithms are documented online; workflows are given in tutorials.

File, Preprocessing, Modeling, and Visualization Menus
25
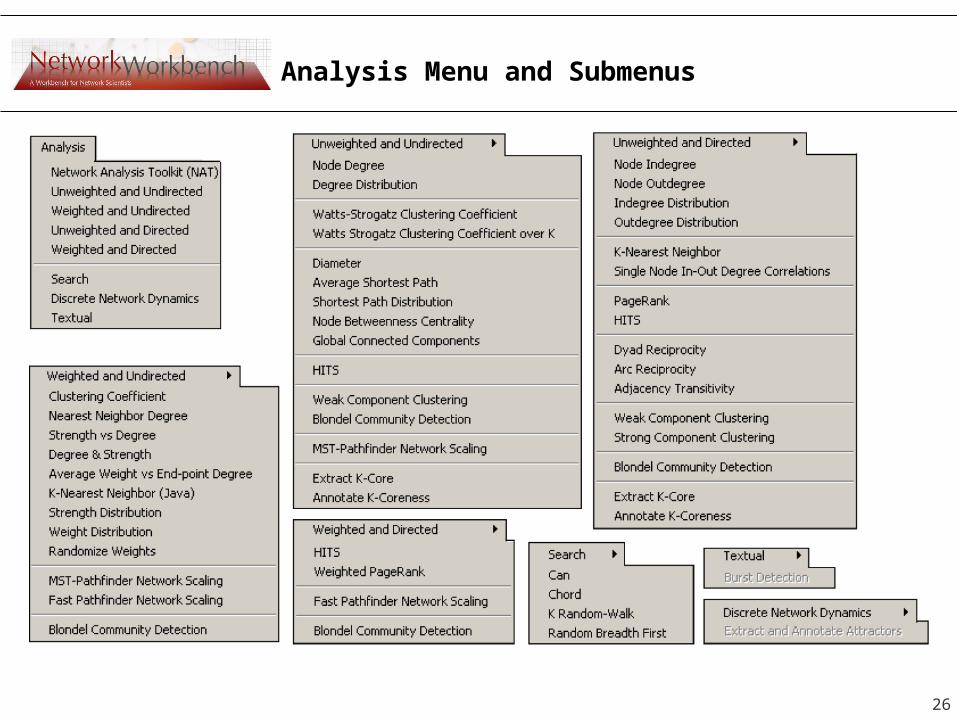
Analysis Menu and Submenus
26

Integrated Tools
Gnuplotportable command-line driven interactive data and function plotting utility http://www.gnuplot.info/.
GUESSexploratory data analysis and visualization tool for graphs and networks. https://nwb.slis.indiana.edu/community/?n=VisualizeData.GUESS.
27
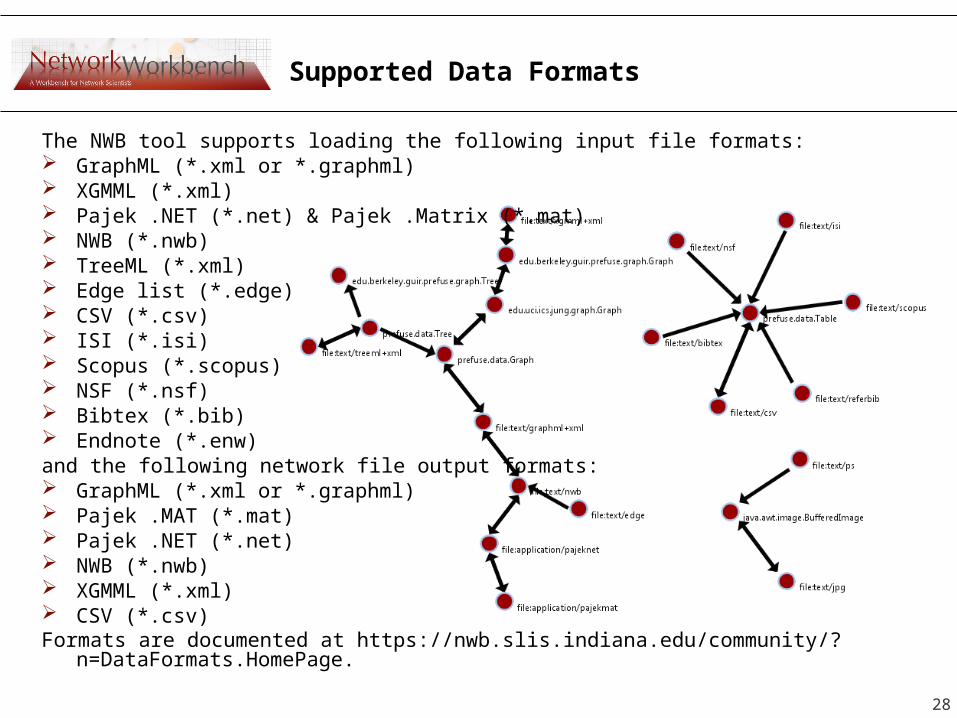
Supported Data Formats
The NWB tool supports loading the following input file formats: GraphML (*.xml or *.graphml) XGMML (*.xml) Pajek .NET (*.net) & Pajek .Matrix (*.mat) NWB (*.nwb) TreeML (*.xml) Edge list (*.edge) CSV (*.csv) ISI (*.isi) Scopus (*.scopus) NSF (*.nsf) Bibtex (*.bib) Endnote (*.enw)and the following network file output formats: GraphML (*.xml or *.graphml) Pajek .MAT (*.mat) Pajek .NET (*.net) NWB (*.nwb) XGMML (*.xml) CSV (*.csv)Formats are documented at https://nwb.slis.indiana.edu/community/?
n=DataFormats.HomePage. 28

Reading and Visualizing a Directory Hierarchy
Use ‘File > Read Directory Hierarchy’ with parameters
Visualize resulting ‘Directory Tree - Prefuse (Beta) Graph’ using
• ‘Visualization > Tree View (prefuse beta)’• ‘Visualization > Tree Map (prefuse beta)’• ‘Visualization > Balloon Graph (prefuse alpha)’• ‘Visualization > Radial Tree/Graph (prefuse alpha)’
29

Different views of the /nwb directory hierarchy.
Note the size of the /plugin directory.
30

Compute Basic Network Properties & View in GUESS
Select florentine.nwb in Data Manager. Run ‘Analysis > Network Analysis Toolkit (NAT)’ to get basic
properties.
Optional: Run ‘Analysis > Unweighted & Undirected > Node Betweenness Centrality’ with default parameters.
Select network and run ‘Visualization > GUESS’ to open GUESS with file loaded.
Apply ‘Layout -> GEM’.31

32
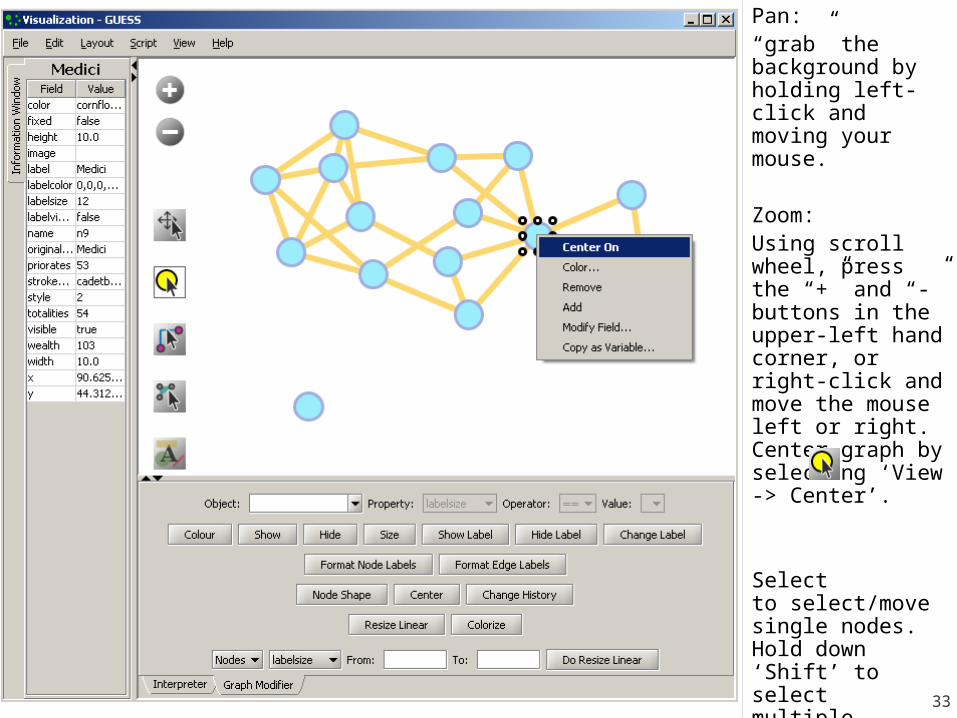
Pan:“grab” the background by holding left-click and moving your mouse.
Zoom:Using scroll wheel, press the “+” and “-” buttons in the upper-left hand corner, or right-click and move the mouse left or right. Center graph by selecting ‘View -> Center’.
Select to select/move single nodes. Hold down ‘Shift’ to select multiple.
Right click to modify Color, etc.
33

Graph Modifier:Select “all nodes” in the Object drop-down menu and click ‘Show Label’ button.
Select ‘Resize Linear > Nodes > totalities’ drop-down menu, then type “5” and “20” into the From” and To” Value box separately. Then select ‘Do Resize Linear’.
Select ‘Colorize> Nodes>totalities’, then select white and enter (204,0,51) in the pop-up color boxes on in the “From” and “To” buttons.
Select “Format Node Labels”, replace default text {originallabel} with your own label in the pop-up box ‘Enter a formatting string for node labels.’
34

Interpreter:Uses Jython a combination of Java and Python.
Trycolorize(wealth, white, red)
resizeLinear(sitebetweenness, 5, 25)
35

[#03] CIShell Powered Tools:
Network Workbench and Science of Science Tool
Using a Million Minds to Build Custom Tools Open Service Gateway Initiative (OSGi) Cyberinfrastructure Shell (CIShell) Network Workbench (NWB) Tool Science of Science (Sci2) Tool Adding Plugins to CIShell Powered Tools Promising Research Directions
36

37
Science of Science (Sci2) Toolhttp://sci.slis.indiana.edu
Explicitly designed for SoS research and practice, well documented, easy to use.
Empowers many to run common studies while making it easy for exports to perform novel research.
Advanced algorithms, effective visualizations, and many (standard) workflows.
Supports micro-level documentation and replication of studies.
Is open source—anybody can review and extend the code, or use it for commercial purposes.
37

Sci2 Tool – “Open Code for S&T Assessment”
OSGi/CIShell powered tool with NWB plugins and many new scientometrics and visualizations plugins.
Börner, Katy, Huang, Weixia (Bonnie), Linnemeier, Micah, Duhon, Russell Jackson, Phillips, Patrick, Ma, Nianli, Zoss, Angela, Guo, Hanning & Price, Mark. (2009). Rete-Netzwerk-Red: Analyzing and Visualizing Scholarly Networks Using the Scholarly Database and the Network Workbench Tool. Proceedings of ISSI 2009: 12th International Conference on Scientometrics and Informetrics, Rio de Janeiro, Brazil, July 14-17 . Vol. 2, pp. 619-630.
Horizontal Time Graphs
Sci Maps GUESS Network Vis

Sci2 Tool
Geo Maps
Circular Hierarchy

40
Sci2 Tool: Algorithms See https://nwb.slis.indiana.edu/community
PreprocessingExtract Top N% RecordsExtract Top N RecordsNormalize TextSlice Table by Line---------------------------------------------Extract Top NodesExtract Nodes Above or Below
ValueDelete Isolates---------------------------------------------Extract top EdgesExtract Edges Above or Below
ValueRemove Self LoopsTrim by DegreeMST-Pathfinder Network
ScalingFast Pathfinder Network
Scaling---------------------------------------------Snowball Sampling (in nodes)Node SamplingEdge Sampling---------------------------------------------SymmetrizeDichotomizeMultipartite Joining---------------------------------------------Geocoder---------------------------------------------Extract ZIP Code
ModelingRandom GraphWatts-Strogatz Small WorldBarabási-Albert Scale-FreeTARL
AnalysisNetwork Analysis Toolkit (NAT)Unweighted & Undirected
Node DegreeDegree Distribution---------------------------------------------K-Nearest Neighbor (Java)Watts-Strogatz Clustering
CoefficientWatts Strogatz Clustering
Coefficient over K---------------------------------------------DiameterAverage Shortest PathShortest Path DistributionNode Betweenness Centrality---------------------------------------------Weak Component ClusteringGlobal Connected Components---------------------------------------------Extract K-CoreAnnotate K-Coreness---------------------------------------------HITS
Weighted & UndirectedClustering CoefficientNearest Neighbor DegreeStrength vs DegreeDegree & StrengthAverage Weight vs End-point
DegreeStrength DistributionWeight DistributionRandomize Weights---------------------------------------------Blondel Community Detection---------------------------------------------HITS
Unweighted & DirectedNode IndegreeNode OutdegreeIndegree DistributionOutdegree Distribution---------------------------------------------K-Nearest NeighborSingle Node in-Out Degree
Correlations---------------------------------------------Dyad ReciprocityArc ReciprocityAdjacency Transitivity---------------------------------------------Weak Component ClusteringStrong Component Clustering---------------------------------------------

41
Sci2 Tool: Algorithms cont.See https://nwb.slis.indiana.edu/community
--------------------------------Extract K-CoreAnnotate K-Coreness--------------------------------HITSPageRank
Weighted & DirectedHITSWeighted PageRank
TextualBurst Detection
VisualizationGnuPlotGUESSImage Viewer---------------------------------------------Radial Tree/Graph (prefuse alpha)Radial Tree/Graph with Annotation (prefuse beta)Tree View (prefuse beta)Tree Map (prefuse beta)Force Directed with Annotation (prefuse beta)Fruchterman-Reingold with Annotation (prefuse beta)---------------------------------------------DrL (VxOrd)Specified (prefuse beta)---------------------------------------------Horizontal Line GraphCircular HierarchyGeo Map (Circle Annotation Style)Geo Map (Colored-Region
Annotation Style)*Science Map (Circle Annotation)
ScientometricsRemove ISI Duplicate RecordsRemove Rows with Multitudinous
FieldsDetect Duplicate NodesUpdate Network by Merging Nodes---------------------------------------------Extract Directed NetworkExtract Paper Citation NetworkExtract Author Paper Network---------------------------------------------Extract Co-Occurrence NetworkExtract Word Co-Occurrence
NetworkExtract Co-Author NetworkExtract Reference Co-Occurrence (Bibliographic Coupling)
Network---------------------------------------------Extract Document Co-Citation
Network
* Requires permission from UCSD All four+ save into Postscript files.Automatic legends.
NEW:Database support for ISI and NSF data.

42
Sci2 Tool: Download, Install, and Run
Sci2 Tool Alpha 3 (March 2010)Can be freely downloaded for all major operating systems from http://sci.slis.indiana.edu/sci2Select your operating system from the pull down menu and download. Unpack into a /sci2 directory.Run /sci2/sci2.exe
Session log files are stored in ‘*yournwbdirectory*/logs’ directory.
Cite as Sci2 Team. (2009). Science of Science (Sci2) Tool. Indiana University and SciTech Strategies, http://sci.slis.indiana.edu.
The file was also made available assci2-N-1.0.0.201003270106NGT-win32.win32.x86.zip on the computers in the tutorial room.


[#03] CIShell Powered Tools:
Network Workbench and Science of Science Tool
Using a Million Minds to Build Custom Tools Open Service Gateway Initiative (OSGi) Cyberinfrastructure Shell (CIShell) Network Workbench (NWB) Tool Science of Science (Sci2) Tool Adding Plugins to CIShell Powered Tools Promising Research Directions
44
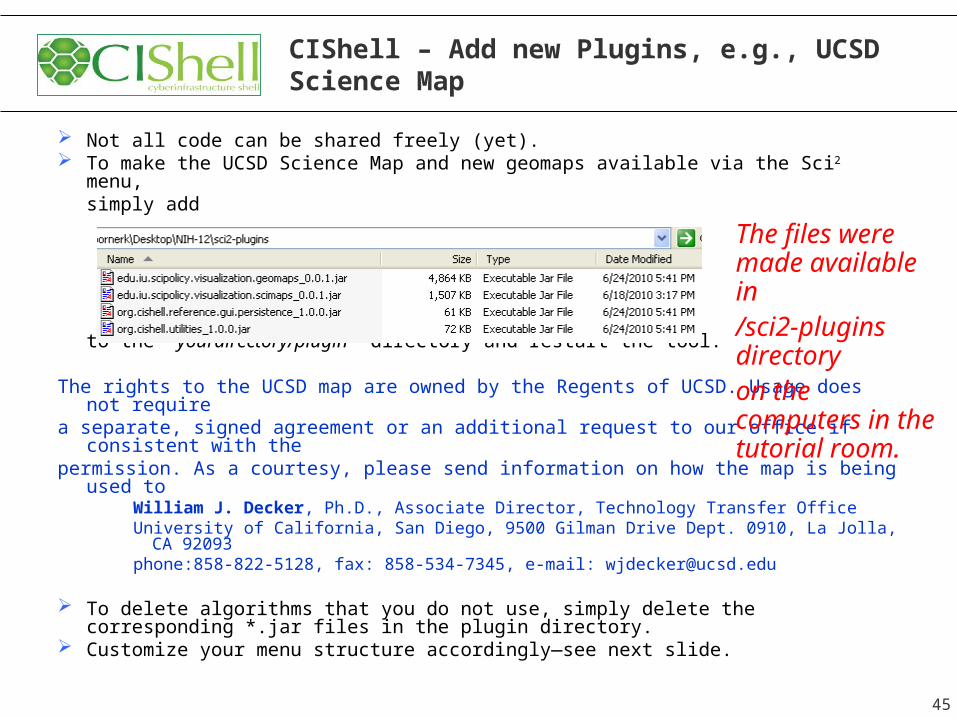
CIShell – Add new Plugins, e.g., UCSD Science Map
Not all code can be shared freely (yet). To make the UCSD Science Map and new geomaps available via the Sci2 menu,
simply add
to the ‘yourdirectory/plugin’ directory and restart the tool.
The rights to the UCSD map are owned by the Regents of UCSD. Usage does not require
a separate, signed agreement or an additional request to our office if consistent with the
permission. As a courtesy, please send information on how the map is being used to
William J. Decker, Ph.D., Associate Director, Technology Transfer OfficeUniversity of California, San Diego, 9500 Gilman Drive Dept. 0910, La Jolla, CA
92093phone:858-822-5128, fax: 858-534-7345, e-mail: [email protected]
To delete algorithms that you do not use, simply delete the corresponding *.jar files in the plugin directory.
Customize your menu structure accordingly—see next slide.
45
The files were made available in /sci2-plugins directory on the computers in the tutorial room.

CIShell – Add new Plugins, e.g., UCSD Science Map
After you added the new plugins, load an ISI file using ‘File > Load and Clean ISI File > EugeneGarfield.isi.’ The file can be found in the /sampledata/scientometrics/isi directory.
Select ‘99 Unique ISI Records’ file in Data Manger and run ‘Visualization > Topical > Science Map via Journals’ with parameters:
The result is a science map overlay of Garfield’s papers and a listing of journals in 13 fields of science below.See details in Tutorial #6.
46

CIShell – Customize Menu
The file ‘yourtooldirectory/configuration/default_menu.xml’ encodes the structure of the menu system.
In NWB Tool, the Modeling menu (left) is encoded by the following piece of xml code:
47

CIShell – Integrate New Algorithms
http://cishell.org/?n=DevGuide.NewGuide 48

[#03] CIShell Powered Tools:
Network Workbench and Science of Science Tool
Using a Million Minds to Build Custom Tools Open Service Gateway Initiative (OSGi) Cyberinfrastructure Shell (CIShell) Network Workbench (NWB) Tool Science of Science (Sci2) Tool Adding Plugins to CIShell Powered Tools Promising Research Directions
49
OSGi/CIShell Adoption
CIShell/OSGi is at the core of different CIs and a total of 169 unique plugins are used in the
- Information Visualization (http://iv.slis.indiana.edu), - Network Science (NWB Tool) (http://nwb.slis.indiana.edu), - Scientometrics and Science Policy (Sci2 Tool) (http://sci.slis.indiana.edu), and - Epidemics (http://epic.slis.indiana.edu) research communities.
Most interestingly, a number of other projects recently adopted OSGi and one adopted CIShell:
Cytoscape (http://www.cytoscape.org) lead by Trey Ideker, UCSD is an open source bioinformatics software platform for visualizing molecular interaction networks and integrating these interactions with gene expression profiles and other state data (Shannon et al., 2002).
Taverna Workbench (http://taverna.sourceforge.net) lead by Carol Goble, University of Manchester, UK is a free software tool for designing and executing workflows (Hull et al., 2006). Taverna allows users to integrate many different software tools, including over 30,000 web services.
MAEviz (https://wiki.ncsa.uiuc.edu/display/MAE/Home) managed by Shawn Hampton, NCSA is an open-source, extensible software platform which supports seismic risk assessment based on the Mid-America Earthquake (MAE) Center research.
TEXTrend (http://www.textrend.org) lead by George Kampis, Eötvös University, Hungary develops a framework for the easy and flexible integration, configuration, and extension of plugin-based components in support of natural language processing (NLP), classification/mining, and graph algorithms for the analysis of business and governmental text corpuses with an inherently temporal component.
As the functionality of OSGi-based software frameworks improves and the number and diversity of
dataset and algorithm plugins increases, the capabilities of custom tools will expand.

The Changing Scientific Landscape
Star Scientist -> Research Teams might have 100 or more members & exist few months only.
Users -> Contributors students, faculty, practitioners.Disciplinary -> Cross-disciplinary with different cultures, languages,
approaches.One Specimen -> Data Streams updated nightly or even more frequently
High Quality Open Data Scholarly Database: 23 million scholarly records http://sdb.slis.indiana.edu VIVO National Researcher Networking http://vivoweb.org
Static Instrument -> Evolving Cyberinfrastructure (CI) daily learning and documentation.
Macroscopes can make a major difference if they support:Division of Labor – proper incentive structures are key.Ease of Use – learn from YouTube, Flickr, WikipediaModularity – plug-and-play helps reduce costs; increases flexibility,
augmentation, customizationStandardization – speeds up ‘translation’ into products/practice.Open Data and Open Code – use the minds of millions!

http://dev.epic.slis.indiana.edu
Epidemics Marketplace
52

All papers, maps, cyberinfrastructures, talks, press are linked from http://cns.slis.indiana.edu
53
Related Documents