Envisioning Science and Technology: Maps and Tools Katy Börner Cyberinfrastructure for Network Science Center, Director Information Visualization Laboratory, Director School of Library and Information Science Indiana University, Bloomington, IN, USA [email protected] With special thanks to the members at the Cyberinfrastructure for Network Science Center; the Sci2 and NWB teams; and the VIVO Collaboration Keynote talk at NACIS Conference Portland, Oregon October 19, 2012 Science Maps Compared to Geospatial Maps Design and Deployment Examples

Welcome message from author
This document is posted to help you gain knowledge. Please leave a comment to let me know what you think about it! Share it to your friends and learn new things together.
Transcript

Envisioning Science and Technology:
Maps and Tools
Katy BörnerCyberinfrastructure for Network Science Center, DirectorInformation Visualization Laboratory, DirectorSchool of Library and Information ScienceIndiana University, Bloomington, IN, USA [email protected]
With special thanks to the members at the Cyberinfrastructure for Network Science Center; the Sci2 and NWB teams; and the VIVO Collaboration
Keynote talk at NACIS Conference Portland, Oregon
October 19, 2012
Science Maps Compared to Geospatial Maps Design and Deployment
Examples

Early Maps of the World VERSUS Early Maps of Science
3D n-DPhysically-based Abstract spaceAccuracy is measurable Accuracy is difficultTrade-offs have more to do with granularity Trade-offs indirectly affect accuracy2-D projections are very accurate at local levels 2-D projections neglect a great deal of dataCenturies of experience Decades of experienceGeo-maps can be a template for other data Science maps can be a template for other data
Kevin W. Boyack, UCGIS Summer Meeting, June, 20093
Needs-Driven Workflow Design using a modular data acquisition/analysis/ modeling/ visualization pipeline as well as modular visualization layers.
Börner, Katy (2010) Atlas of Science. MIT Press. 4

Places & Spaces: Mapping Science Exhibit (http://scimaps.org )
After eight years, there now exist 80 out of 100 maps.
Mapping Science Exhibit at MEDIA X, Wallenberg Hall, Stanford University, 2009http://mediax.stanford.edu, http://scaleindependentthought.typepad.com/photos/scimaps
6

Almila Akdag Salah, Cheng Gao, Krzysztof Suchecki, and Andrea Scharnhorst (2011) Design vs. Emergence: Visualization of Knowledge Orders.
Council for Chemical Research. 2009. Chemical R&D Powers the U.S. Innovation Engine. Washington, DC. Courtesy of the Council for Chemical Research. 8

Loet Leydesdorff, Thomas Schank and the Journal of the American Society for Information Science and Technology. 2010. The Emergence of Nanoscience & Technology. 10

Bollen, Johan, Herbert Van de Sompel, Aric Hagberg, Luis M.A. Bettencourt, Ryan Chute, Marko A. Rodriquez, Lyudmila Balakireva. 2008. A Clickstream Map of Science. 11
Ward Shelley. 2011. History of Science Fiction.

Science Maps in “Expedition Zukunft” science train visiting 62 cities in 7 months 12 coaches, 300 m long Opening was on April 23rd, 2009 by German Chancellor Merkelhttp://www.expedition-zukunft.de
13

Illuminated Diagram Display on display at the Smithsonian in DC.http://scimaps.org/exhibit_info/#ID
15
16
17
Ingo Gunther's Worldprocessor globe design now on display at the Giant Geo Cosmos OLED Display at the Museum of Emerging Science and Innovation in Tokyo, Japan
18

Online Interactive Maps NIH Topic Map
VIVO International Researcher Network
Sustainability Research Map
Gene Therapy Research Map
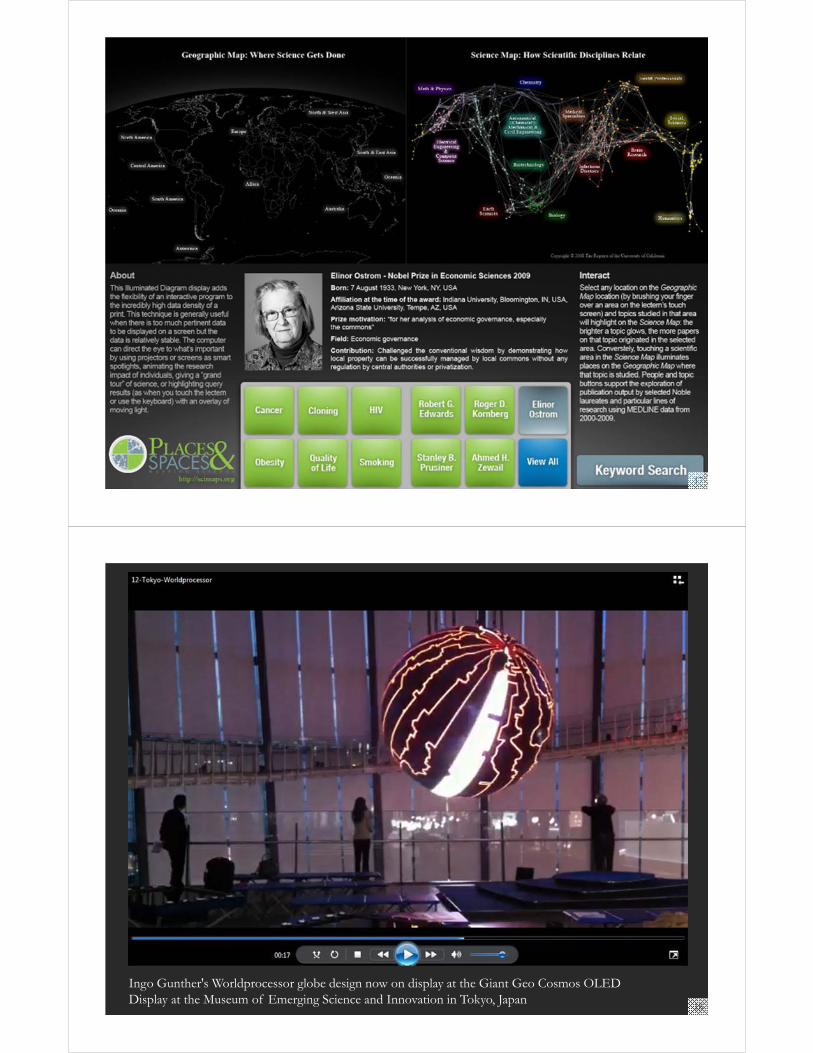
Bruce W. Herr II, Gully Burns, David Newman, Edmund Talley. 2007. A Topic Map of NIH Grants 200720
https://app.nihmaps.org21
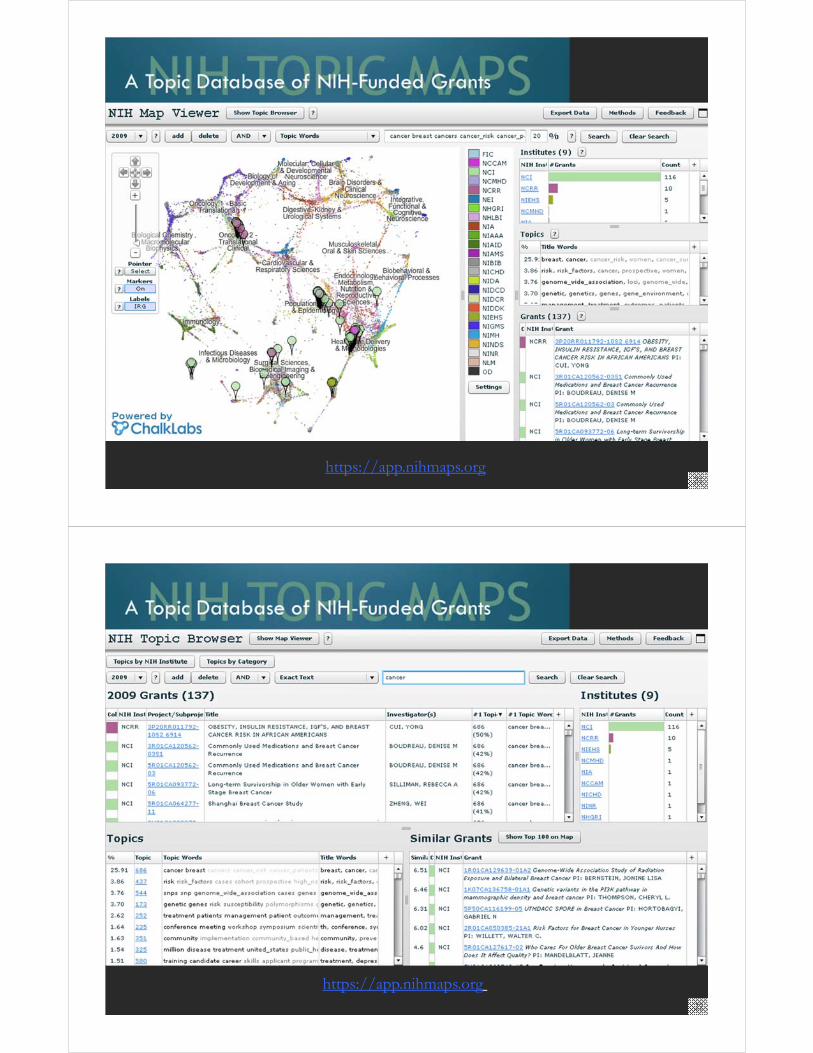
https://app.nihmaps.org22

VIVO: A Semantic Approach to Creating a National Network of Researchers (http://vivoweb.org)
• Semantic web application and ontology editor originally developed at Cornell U.
• Integrates research and scholarship info from systems of record across institution(s).
• Facilitates research discovery and cross-disciplinary collaboration.
• Simplify reporting tasks, e.g., generate biosketch, department report.
Funded by $12 million NIH award. Cornell University: Dean Krafft (Cornell PI), Manolo Bevia, Jim Blake, Nick Cappadona, Brian Caruso, Jon Corson-Rikert, Elly Cramer, Medha Devare, John Fereira, Brian Lowe, Stella Mitchell, Holly Mistlebauer, Anup Sawant, Christopher Westling, Rebecca Younes. University of Florida: Mike Conlon (VIVO and UF PI), Cecilia Botero, Kerry Britt, Erin Brooks, Amy Buhler, Ellie Bushhousen, Chris Case, Valrie Davis, Nita Ferree, Chris Haines, Rae Jesano, Margeaux Johnson, Sara Kreinest, Yang Li, Paula Markes, Sara Russell Gonzalez, Alexander Rockwell, Nancy Schaefer, Michele R. Tennant, George Hack, Chris Barnes, Narayan Raum, Brenda Stevens, Alicia Turner, Stephen Williams. Indiana University: Katy Borner (IU PI), William Barnett, Shanshan Chen, Ying Ding, Russell Duhon, Jon Dunn, Micah Linnemeier, Nianli Ma, Robert McDonald, Barbara Ann O'Leary, Mark Price, Yuyin Sun, Alan Walsh, Brian Wheeler, Angela Zoss. Ponce School of Medicine: Richard Noel (Ponce PI), Ricardo Espada, Damaris Torres. The Scripps Research Institute: Gerald Joyce (Scripps PI), Greg Dunlap, Catherine Dunn, Brant Kelley, Paula King, Angela Murrell, Barbara Noble, Cary Thomas, Michaeleen Trimarchi. Washington University, St. Louis: Rakesh Nagarajan (WUSTL PI), Kristi L. Holmes, Sunita B. Koul, Leslie D. McIntosh. Weill Cornell Medical College: Curtis Cole (Weill PI), Paul Albert, Victor Brodsky, Adam Cheriff, Oscar Cruz, Dan Dickinson, Chris Huang, Itay Klaz, Peter Michelini, Grace Migliorisi, John Ruffing, Jason Specland, Tru Tran, Jesse Turner, Vinay Varughese.
23
24

Temporal Analysis (When) Temporal visualizations of the number of papers/funding award at the institution, school, department, and people level 25
Topical Analysis (What) Science map overlays will show where a person, department, or university publishes most in the world of science. (in work) 26
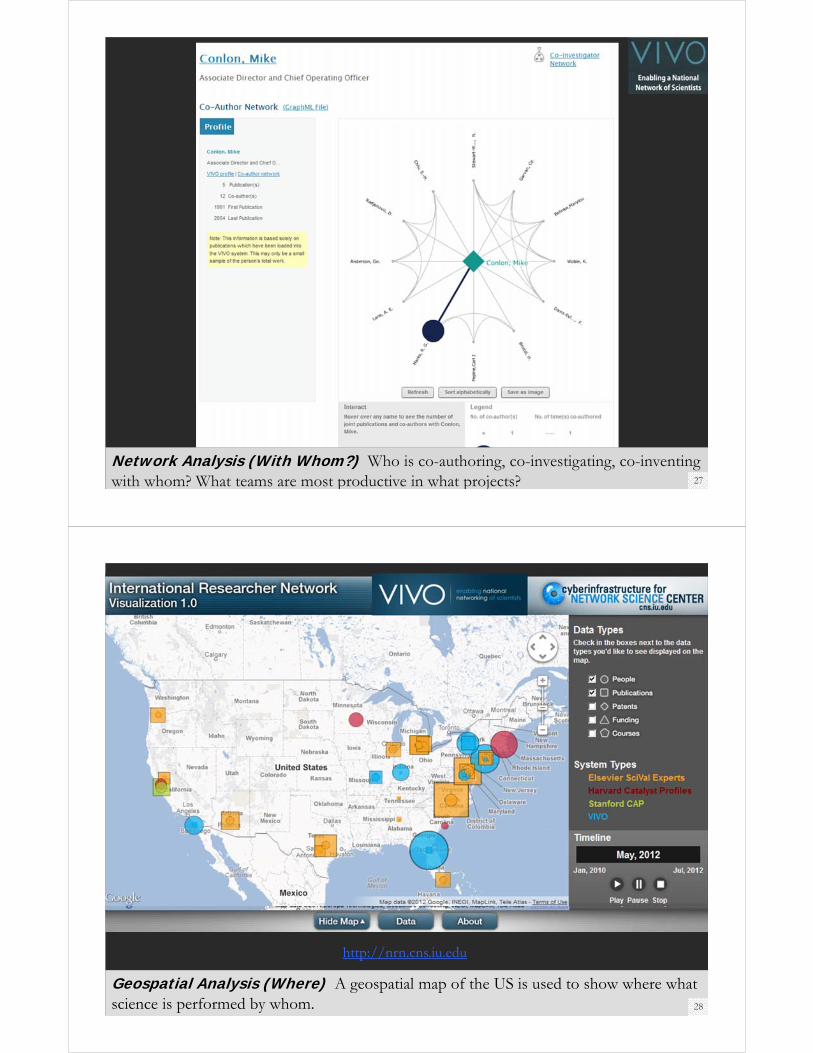
Network Analysis (With Whom?) Who is co-authoring, co-investigating, co-inventing with whom? What teams are most productive in what projects? 27
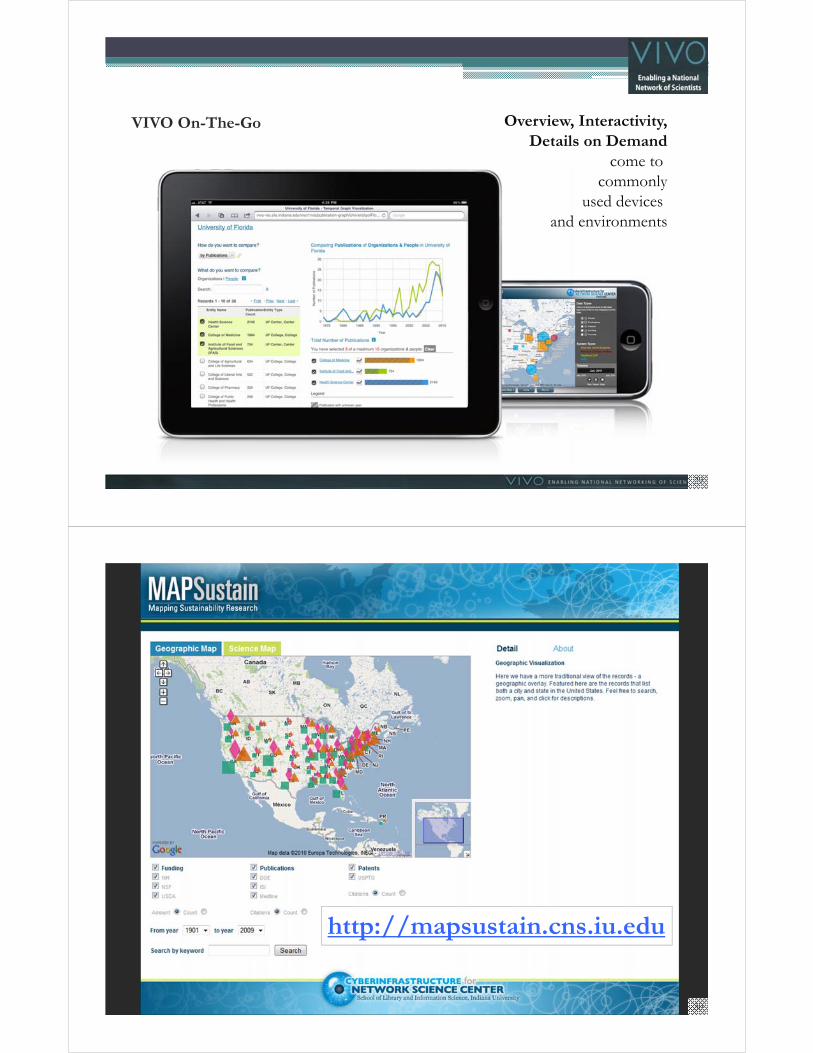
http://nrn.cns.iu.edu
Geospatial Analysis (Where) A geospatial map of the US is used to show where what science is performed by whom. 28
29
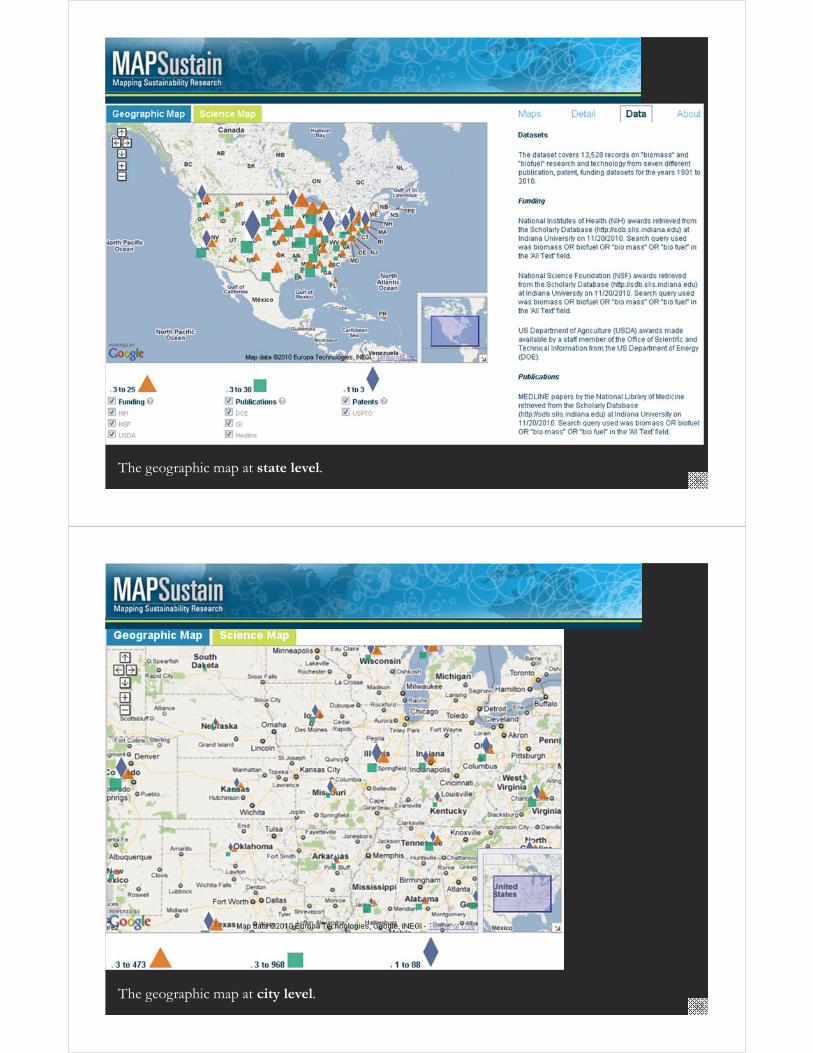
Overview, Interactivity,Details on Demand
come to commonly
used devices and environments
VIVO On-The-Go
http://mapsustain.cns.iu.edu
30
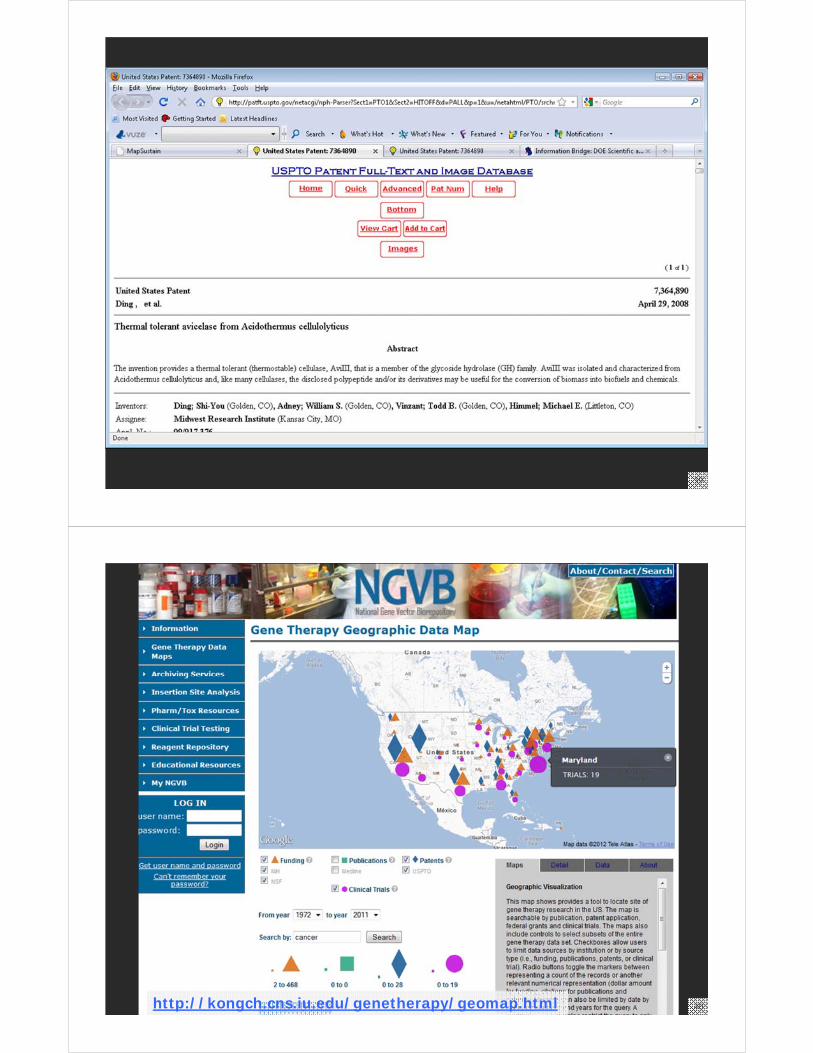
31The geographic map at state level.
32The geographic map at city level.

Search result for “corn”Icons have same size but represent different #records
33
Click on one icon to display all records of one type.Here publications in the state of Florida.
34

Detailed information on demand via original source site for exploration and study.
35
The science map at 13 top-level scientific disciplines level.
36

37
The science map at 554 sub-disciplines level.
38
39
40http://kongch.cns.iu.edu/genetherapy/geomap.html

41
42

Science of Science (Sci2) Tool Use your own data
Run your own analysis
Identify overlap, gaps and emerging areas
Interpret results to improve decision making
Börner, Katy. (2011).
Plug-and-Play Macroscopes. Communications of the ACM, 54(3), 60-69.
Video and paper are athttp://www.scivee.tv/node/27704
44
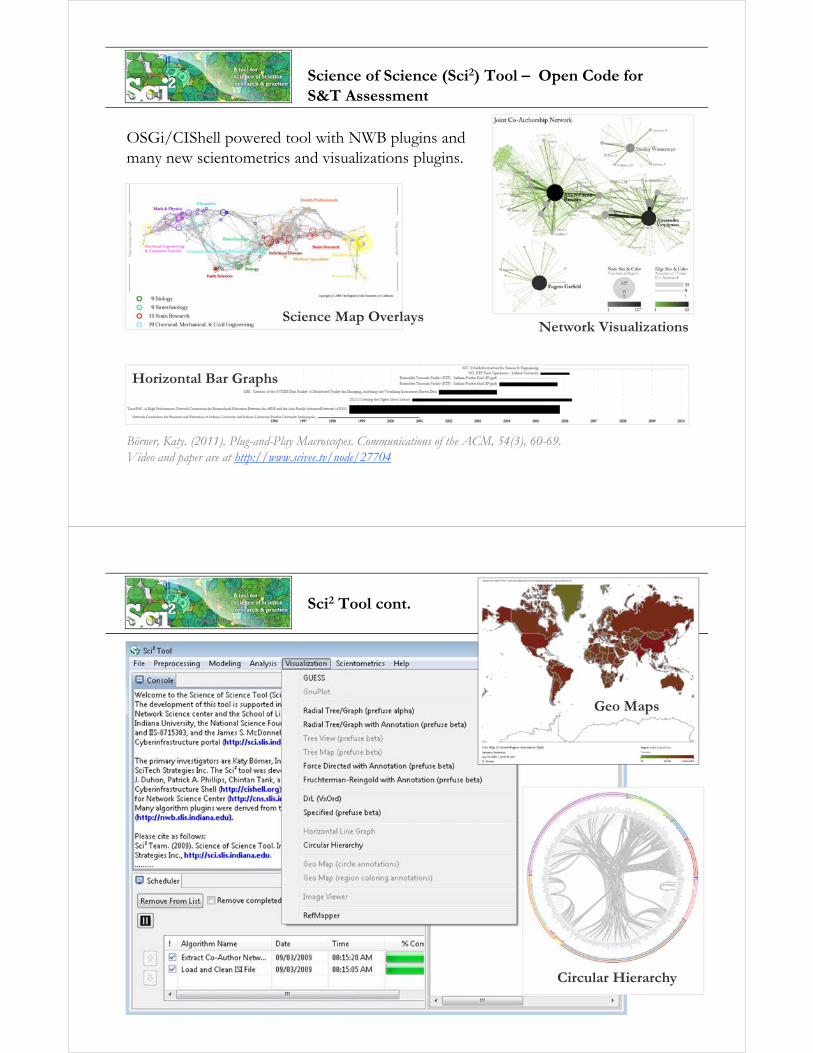
Science of Science (Sci2) Tool – Open Code for S&T Assessment
OSGi/CIShell powered tool with NWB plugins and many new scientometrics and visualizations plugins.
Börner, Katy. (2011). Plug-and-Play Macroscopes. Communications of the ACM, 54(3), 60-69. Video and paper are at http://www.scivee.tv/node/27704
Horizontal Bar Graphs
Science Map OverlaysNetwork Visualizations
Sci2 Tool cont.
Geo Maps
Circular Hierarchy

http://sci2.cns.iu.eduhttp://sci2.wiki.cns.iu.edu
47
48
Science of Science (Sci2) Tool – Usage
The Sci2 Tool is used by the
National Science Foundation,
National Institutes of Health,
US Department of Agriculture, and
National Oceanic and Atmospheric Administration
Tool registrations come from 73 countries and professions such as

49
Sci2 Tool – Type of Analysis vs. Level of Analysis
Micro/Individual(1-100 records)
Meso/Local(101–10,000 records)
Macro/Global(10,000 < records)
Statistical Analysis/Profiling
Individual person and their expertise profiles
Larger labs, centers, universities, research domains, or states
All of NSF, all of USA, all of science.
Temporal Analysis (When)
Funding portfolio of one individual
Mapping topic bursts in 20-years of PNAS
113 Years of Physics Research
Geospatial Analysis (Where)
Career trajectory of one individual
Mapping a states intellectual landscape
PNAS publications
Topical Analysis (What)
Base knowledge from which one grant draws.
Knowledge flows in Chemistry research
VxOrd/Topic maps of NIH funding
Network Analysis (With Whom?)
NSF Co-PI network of one individual
Co-author network NIH’s core competency
50
Sci2 Tool – Type of Analysis vs. Level of Analysis
Micro/Individual(1-100 records)
Meso/Local(101–10,000 records)
Macro/Global(10,000 < records)
Statistical Analysis/Profiling
Individual person and their expertise profiles
Larger labs, centers, universities, research domains, or states
All of NSF, all of USA, all of science.
Temporal Analysis (When)
Funding portfolio of one individual
Mapping topic bursts in 20-years of PNAS
113 Years of Physics Research
Geospatial Analysis (Where)
Career trajectory of one individual
Mapping a states intellectual landscape
PNAS publications
Topical Analysis (What)
Base knowledge from which one grant draws.
Knowledge flows in Chemistry research
VxOrd/Topic maps of NIH funding
Network Analysis (With Whom?)
NSF Co-PI network of one individual
Co-author network NIH’s core competency

Mapping Indiana’s Intellectual Space
Identify
Pockets of innovation
Pathways from ideas to products
Interplay of industry and academia
51
Individual Co-PI Network Ke & Börner, (2006)
52

Mapping the Evolution of Co-Authorship Networks Ke, Visvanath & Börner, (2004) Won 1st price at the IEEE InfoVis Contest.
53
54

Compare R01 investigator based funding with TTURC Center awards in terms of number of publications and evolving co-author networks.Zoss & Börner, forthcoming.
Supported by NIH/NCI Contract HHSN261200800812
Mapping Transdisciplinary Tobacco Use Research Centers Publications
55
Spatio-Temporal Information Production and Consumption of Major U.S. Research InstitutionsBörner, Katy, Penumarthy, Shashikant, Meiss, Mark and Ke, Weimao. (2006) Mapping the Diffusion of Scholarly Knowledge Among Major U.S. Research Institutions. Scientometrics. 68(3), pp. 415-426.
Research questions:1. Does space still matter
in the Internet age? 2. Does one still have to
study and work at major research institutions in order to have access to high quality data and expertise and to produce high quality research?
3. Does the Internet lead to more global citation patterns, i.e., more citation links between papers produced at geographically distant research instructions?
Contributions: Answer to Qs 1 + 2 is YES. Answer to Qs 3 is NO. Novel approach to analyzing the dual role of
institutions as information producers and consumers and to study and visualize the diffusion of information among them. 56
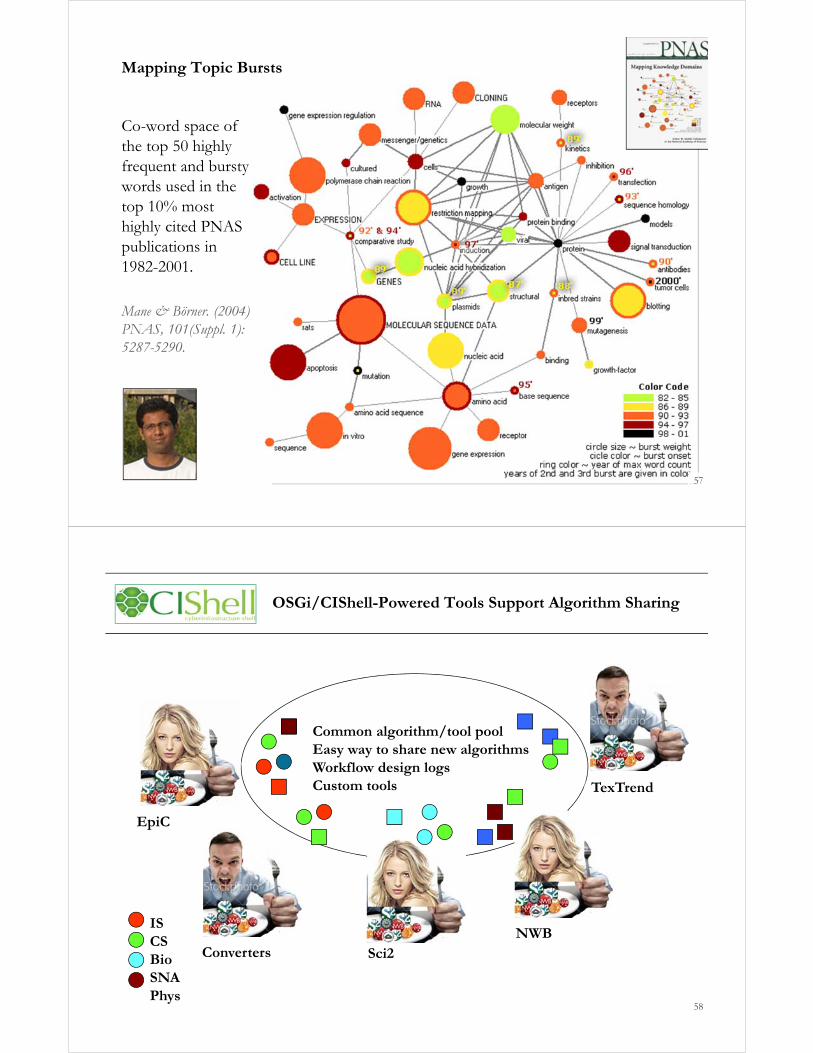
Co-word space of the top 50 highly frequent and burstywords used in the top 10% most highly cited PNAS publications in 1982-2001.
Mane & Börner. (2004) PNAS, 101(Suppl. 1):5287-5290.
Mapping Topic Bursts
57
OSGi/CIShell-Powered Tools Support Algorithm Sharing
58
TexTrend
NWB
EpiC
Sci2
Common algorithm/tool poolEasy way to share new algorithmsWorkflow design logsCustom tools
Converters
ISCSBioSNAPhys

CIShell – Integrate New Algorithms
59
CIShell Developer Guide is at http://cishell.wiki.cns.iu.edu
Additional Sci2 Plugins are at http://sci2.wiki.cns.iu.edu/3.2+Additional+Plugins
CIShell – Customize Menu
The file ‘yourtooldirectory/configuration/default_menu.xml’ encodes the structure of the menu system.
In NWB Tool, the Modeling menu (left) is encoded by the following piece of xml code:
60
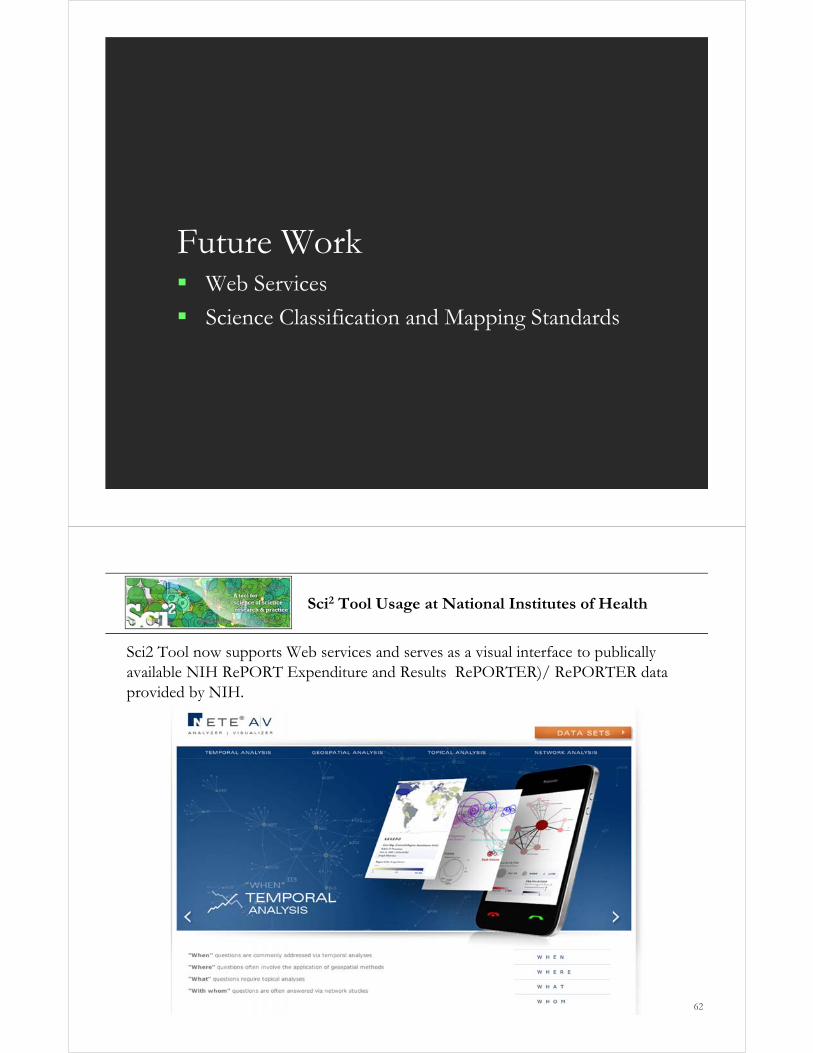
Future Work Web Services
Science Classification and Mapping Standards
Sci2 Tool Usage at National Institutes of Health
Sci2 Tool now supports Web services and serves as a visual interface to publically available NIH RePORT Expenditure and Results RePORTER)/ RePORTER data provided by NIH.
62

Sci2 Tool Usage at National Institutes of Health
63
Find and select one or multiple PIs
NETE A|V ‐ Temporal Analysis
Sci2 Tool Usage at National Institutes of Health
64
Visualize portfolio of projects on the timescale
o Projects with award amounts
o Projects by IC funding
o Projects by PIs
NETE A|V ‐ Temporal Analysis
Sci2 Tool Usage at National Institutes of Health
65
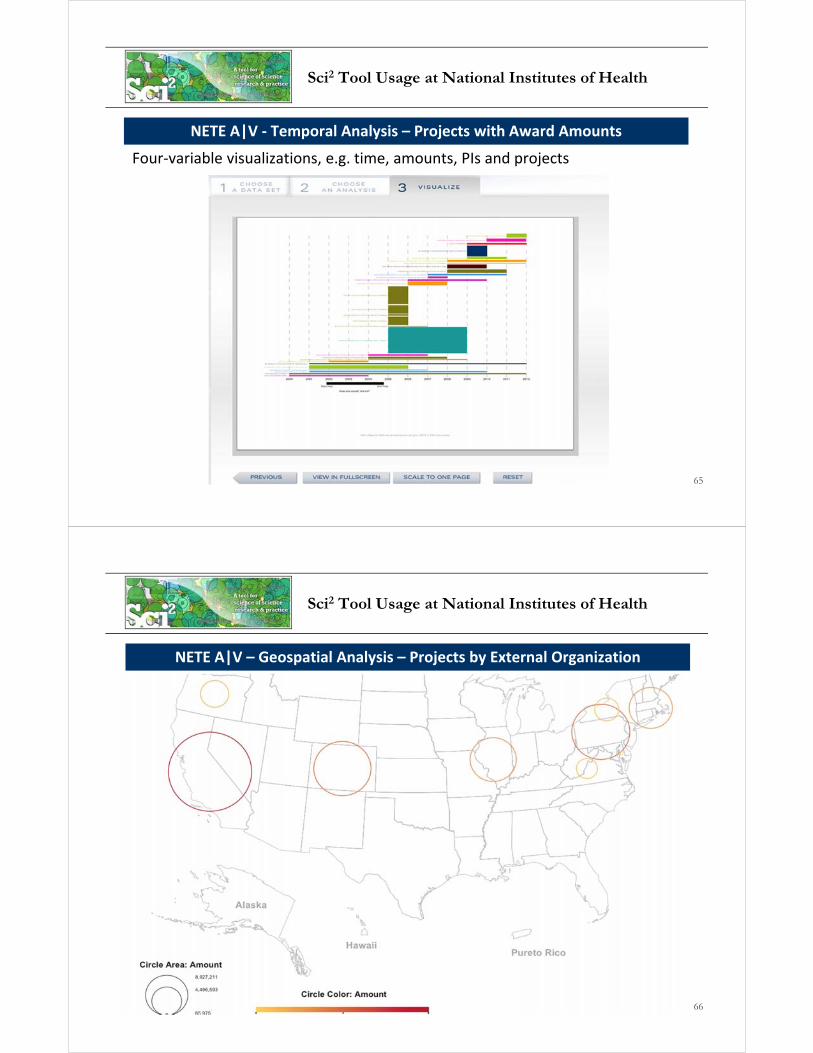
NETE A|V ‐ Temporal Analysis – Projects with Award Amounts
Four‐variable visualizations, e.g. time, amounts, PIs and projects
Sci2 Tool Usage at National Institutes of Health
66
NETE A|V – Geospatial Analysis – Projects by External Organization

Sci2 Tool Usage at National Institutes of Health
67
NETE A|V – Topical Analysis – Publications in a Project Portfolio
Sci2 Tool Usage at National Institutes of Health
68
NETE A|V – Network Analysis – (Co‐) PIs to Projects
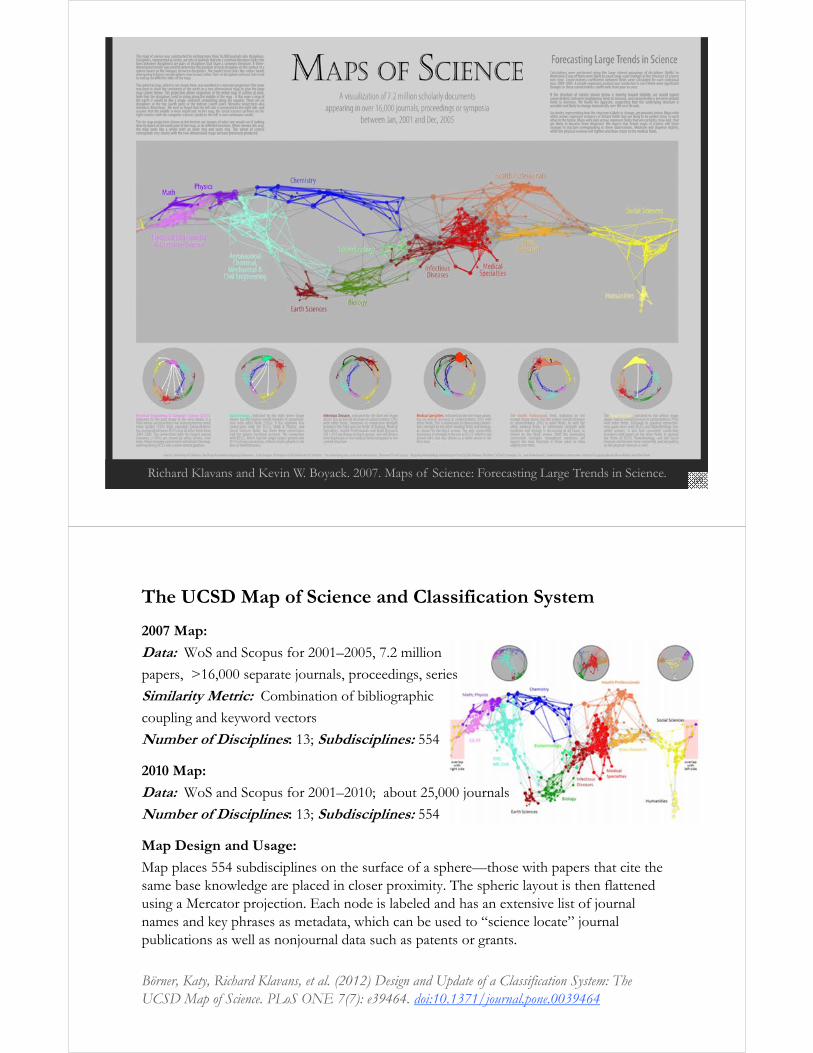
Richard Klavans and Kevin W. Boyack. 2007. Maps of Science: Forecasting Large Trends in Science.69
The UCSD Map of Science and Classification System
2007 Map:
Data: WoS and Scopus for 2001–2005, 7.2 million
papers, >16,000 separate journals, proceedings, series
Similarity Metric: Combination of bibliographic
coupling and keyword vectors
Number of Disciplines: 13; Subdisciplines: 554
2010 Map:
Data: WoS and Scopus for 2001–2010; about 25,000 journals
Number of Disciplines: 13; Subdisciplines: 554
Map Design and Usage:
Map places 554 subdisciplines on the surface of a sphere—those with papers that cite the same base knowledge are placed in closer proximity. The spheric layout is then flattened using a Mercator projection. Each node is labeled and has an extensive list of journal names and key phrases as metadata, which can be used to “science locate” journal publications as well as nonjournal data such as patents or grants.
Börner, Katy, Richard Klavans, et al. (2012) Design and Update of a Classification System: The UCSD Map of Science. PLoS ONE 7(7): e39464. doi:10.1371/journal.pone.0039464

UCSD Map of Science: Deployments
Börner, Katy, Richard Klavans, et al. (2012) Design and Update of a Classification System: The UCSD Map of Science. PLoS ONE 7(7): e39464. Data is at http://sci.cns.iu.edu/ucsdmap
72
Aligning Science Basemaps using the Sci2 Tool
UCSD Map Loet et al science maps ISI categories http://vosviewer.com
NIH MapElsevier’s SciVal Map Science-Metrix.com (https://app.nihmaps.org)
References
Börner, Katy, Chen, Chaomei, and Boyack, Kevin. (2003). Visualizing Knowledge Domains. In Blaise Cronin (Ed.), ARIST, Medford, NJ: Information Today, Volume 37, Chapter 5, pp. 179-255. http://ivl.slis.indiana.edu/km/pub/2003-borner-arist.pdf
Shiffrin, Richard M. and Börner, Katy (Eds.) (2004). Mapping Knowledge Domains. Proceedings of the National Academy of Sciences of the United States of America, 101(Suppl_1). http://www.pnas.org/content/vol101/suppl_1/
Börner, Katy, Sanyal, Soma and Vespignani, Alessandro (2007). Network Science. In Blaise Cronin (Ed.), ARIST, Information Today, Inc., Volume 41, Chapter 12, pp. 537-607.
http://ivl.slis.indiana.edu/km/pub/2007-borner-arist.pdf
Börner, Katy (2010) Atlas of Science. MIT Press.http://scimaps.org/atlas
Scharnhorst, Andrea, Börner, Katy, van den Besselaar, Peter (2012) Models of Science Dynamics. Springer Verlag.
73
All papers, maps, tools, talks, press are linked from http://cns.iu.edu
CNS Facebook: http://www.facebook.com/cnscenterMapping Science Exhibit Facebook: http://www.facebook.com/mappingscience
74
Related Documents


![Building a Science Observatory: Data, Tools, and Maps · Börner: Building a Science Observatory 3 “Validate Science [of Science Results and] Maps” to understand and utilize their](https://static.cupdf.com/doc/110x72/606d4e2923da9211c04d2f28/building-a-science-observatory-data-tools-and-maps-brner-building-a-science.jpg)