Science of Science Research and Tools Tutorial #04 of 12 Dr. Katy Börner Cyberinfrastructure for Network Science Center, Director Information Visualization Laboratory, Director School of Library and Information Science Indiana University, Bloomington, IN http:// info.slis.indiana.edu/~katy With special thanks to Kevin W. Boyack, Micah Linnemeier, Russell J. Duhon, Patrick Phillips, Joseph Biberstine, Chintan Tank Nianli Ma, Hanning Guo, Mark A. Price, Angela M. Zoss, and Scott Weingart Invited by Robin M. Wagner, Ph.D., M.S. Chief Reporting Branch, Division of Information Services Office of Research Information Systems, Office of Extramural Research Office of the Director, National Institutes of Health Suite 4090, 6705 Rockledge Drive, Bethesda, MD 20892 10a-noon, July 12, 2010

Science of Science Research and Tools Tutorial #04 of 12 Dr. Katy Börner Cyberinfrastructure for Network Science Center, Director Information Visualization.
Jan 12, 2016
Welcome message from author
This document is posted to help you gain knowledge. Please leave a comment to let me know what you think about it! Share it to your friends and learn new things together.
Transcript
Science of Science Research and Tools Tutorial #04 of 12
Dr. Katy Börner Cyberinfrastructure for Network Science Center, DirectorInformation Visualization Laboratory, DirectorSchool of Library and Information ScienceIndiana University, Bloomington, INhttp://info.slis.indiana.edu/~katy
With special thanks to Kevin W. Boyack, Micah Linnemeier, Russell J. Duhon, Patrick Phillips, Joseph Biberstine, Chintan TankNianli Ma, Hanning Guo, Mark A. Price, Angela M. Zoss, andScott Weingart
Invited by Robin M. Wagner, Ph.D., M.S.Chief Reporting Branch, Division of Information ServicesOffice of Research Information Systems, Office of Extramural ResearchOffice of the Director, National Institutes of Health
Suite 4090, 6705 Rockledge Drive, Bethesda, MD 2089210a-noon, July 12, 2010
What was the most valuable you learned today? Intro to/hands-on NWB in real time 4x NWB seems very interesting and I definitely anticipate using it
in our work Practical documentation
What was irrelevant for your work/needs? Nothing – it makes me think of new ways to analyze our data
What topics or examples would you like to explore in more detail?
Step by step documentation of how to produce visualizations Deeper introduction to 1-2 elements of the most useful
elements of the tools. Not sure how the tool advances science or public health.
Publication itself has no use. Explain citation network. How to load our data
12 Tutorials in 12 Days at NIH—Feedback from Tutorial #3
2

What can the instructor do to improve the tutorials? Definitions of each major menu tab and its options-what doe the
algorithms do? SLOW DOWN! It would be so much more valuable to explain several
concepts in the tools then try to a rapid fire data dump into my brain. I could not follow and stopped learning anything. 2x
More structured exercises—it is impossible to listen and follow along on the software. Present basic theory behind algorithms. The maps are cool but we do not know what we are looking at.
Use one structured example, give purpose of analysis, and explain steps, algorithms used.
Have more examples Shorten the slides/presentation. Use time better – time management.
Do you have any other comments or suggestions on today’s tutorial? Need URLs for all key reference documents We are time sensitive as we are still managing same workflow with 2h
less time because we are in this training. When selecting algorithms/parameters, explain why you select those. Hands-on was good. Use NIH data.
12 Tutorials in 12 Days at NIH—Feedback from Tutorial #3
3

1. Science of Science Research 2. Network Science / Information Visualization 3. CIShell Powered Tools: Network Workbench and Science
of Science Tool
4. Temporal Analysis—Burst Detection5. Geospatial Analysis and Mapping6. Topical Analysis & Mapping
7. Network Analysis 8. Network Analysis cont. 9. Extending the Sci2 Tool
10. Using the Scholarly Database at IU11. VIVO National Researcher Networking 12. Future Developments
12 Tutorials in 12 Days at NIH—Overview
4
1st Week
2nd Week
3rd Week
4th Week

[#04] Temporal Analysis—Burst Detection Science of Science (Sci2) Tool (left over from Tutorial #3) Temporal Analysis Overview Designing Effective Charts Sci2-Horizontal Bar Charts Sci2-Burst Analysis and Visualization Outlook Exercise: Identify Promising Temporal Analyses of NIH Data
Recommended Reading Information Visualization Cyberinfrastructure > Learning Modules > Visualizing Time Series
Data, http://iv.slis.indiana.edu/lm/lm-time-series.html NWB Team (2009) Network Workbench Tool, User Manual 1.0.0,
http://nwb.slis.indiana.edu/Docs/NWBTool-Manual.pdf Scott Weingart, Hanning Guo, Katy Borner, Kevin W. Boyack, Micah W. Linnemeier, Russell J.
Duhon, Patrick A. Phillips, Chintan Tank, and Joseph Biberstine (2010) Science of Science (Sci2) Tool User Manual. Cyberinfrastructure for Network Science Center, School of Library and Information Science, Indiana University, Bloomington. http://sci.slis.indiana.edu/registration/docs/Sci2_Tutorial.pdf
12 Tutorials in 12 Days at NIH—Overview
5

[#05] Geospatial Analysis and Mapping General Overview Designing Effective Geomaps Sci2-Geomaps With Circle and Colored Region Annotation Sci2-Animations Geographic Information Systems (GIS) Outlook Exercise: Identify Promising Geospatial Analyses of NIH Data
Recommended Reading NWB Team (2009) Network Workbench Tool, User Manual 1.0.0,
http://nwb.slis.indiana.edu/Docs/NWBTool-Manual.pdf Scott Weingart, Hanning Guo, Katy Borner, Kevin W. Boyack, Micah W. Linnemeier,
Russell J. Duhon, Patrick A. Phillips, Chintan Tank, and Joseph Biberstine (2010) Science of Science (Sci2) Tool User Manual. Cyberinfrastructure for Network Science Center, School of Library and Information Science, Indiana University, Bloomington. http://sci.slis.indiana.edu/registration/docs/Sci2_Tutorial.pdf
12 Tutorials in 12 Days at NIH—Overview
6
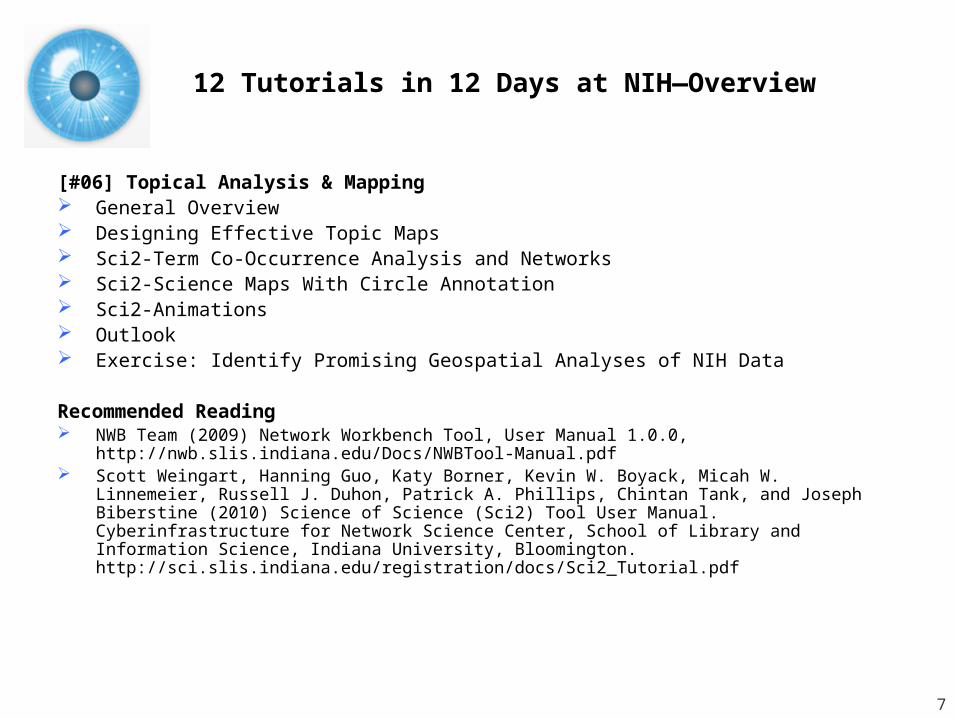
[#06] Topical Analysis & Mapping General Overview Designing Effective Topic Maps Sci2-Term Co-Occurrence Analysis and Networks Sci2-Science Maps With Circle Annotation Sci2-Animations Outlook Exercise: Identify Promising Geospatial Analyses of NIH Data
Recommended Reading NWB Team (2009) Network Workbench Tool, User Manual 1.0.0,
http://nwb.slis.indiana.edu/Docs/NWBTool-Manual.pdf Scott Weingart, Hanning Guo, Katy Borner, Kevin W. Boyack, Micah W. Linnemeier,
Russell J. Duhon, Patrick A. Phillips, Chintan Tank, and Joseph Biberstine (2010) Science of Science (Sci2) Tool User Manual. Cyberinfrastructure for Network Science Center, School of Library and Information Science, Indiana University, Bloomington. http://sci.slis.indiana.edu/registration/docs/Sci2_Tutorial.pdf
12 Tutorials in 12 Days at NIH—Overview
7
[#04] Temporal Analysis—Burst Detection
Science of Science (Sci2) Tool (left over from Tutorial #3)
Temporal Analysis Overview Designing Effective Charts Sci2-Horizontal Bar Charts Sci2-Burst Analysis and Visualization Outlook Exercise: Identify Promising Temporal Analyses
of NIH Data
8
9
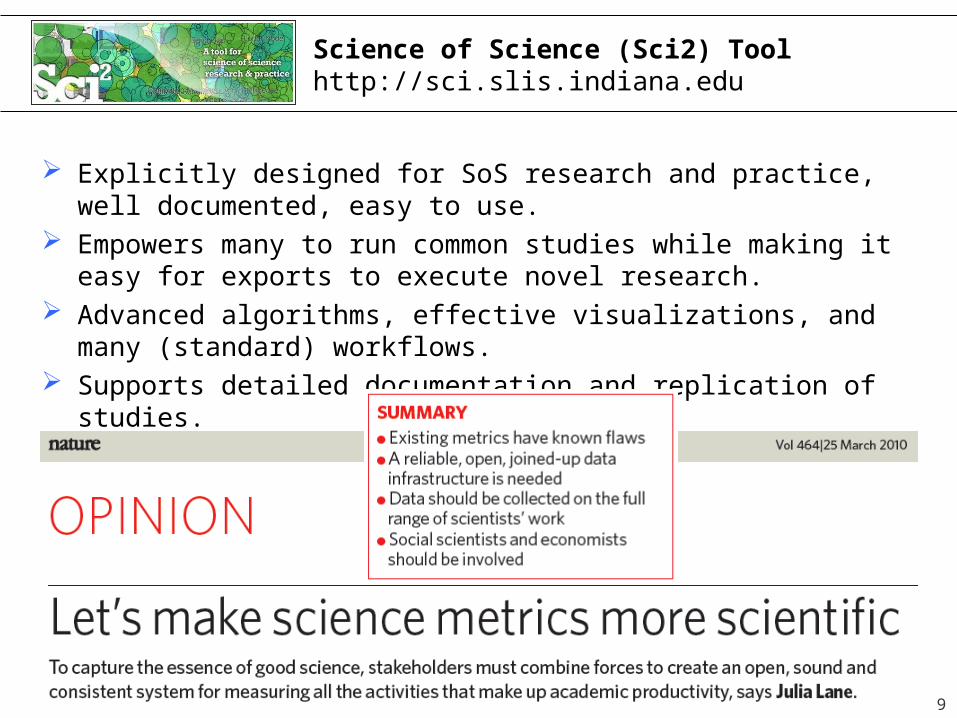
Science of Science (Sci2) Toolhttp://sci.slis.indiana.edu
Explicitly designed for SoS research and practice, well documented, easy to use.
Empowers many to run common studies while making it easy for exports to execute novel research.
Advanced algorithms, effective visualizations, and many (standard) workflows.
Supports detailed documentation and replication of studies. Is open source—anybody can review and extend the code, or
use it for commercial purposes.
9

Sci2 Tool – “Open Code for S&T Assessment”
OSGi/CIShell powered tool with NWB plugins and many new scientometrics and visualizations plugins.
Börner, Katy, Huang, Weixia (Bonnie), Linnemeier, Micah, Duhon, Russell Jackson, Phillips, Patrick, Ma, Nianli, Zoss, Angela, Guo, Hanning & Price, Mark. (2009). Rete-Netzwerk-Red: Analyzing and Visualizing Scholarly Networks Using the Scholarly Database and the Network Workbench Tool. Proceedings of ISSI 2009: 12th International Conference on Scientometrics and Informetrics, Rio de Janeiro, Brazil, July 14-17 . Vol. 2, pp. 619-630.
Horizontal Time Graphs
Sci Maps GUESS Network Vis
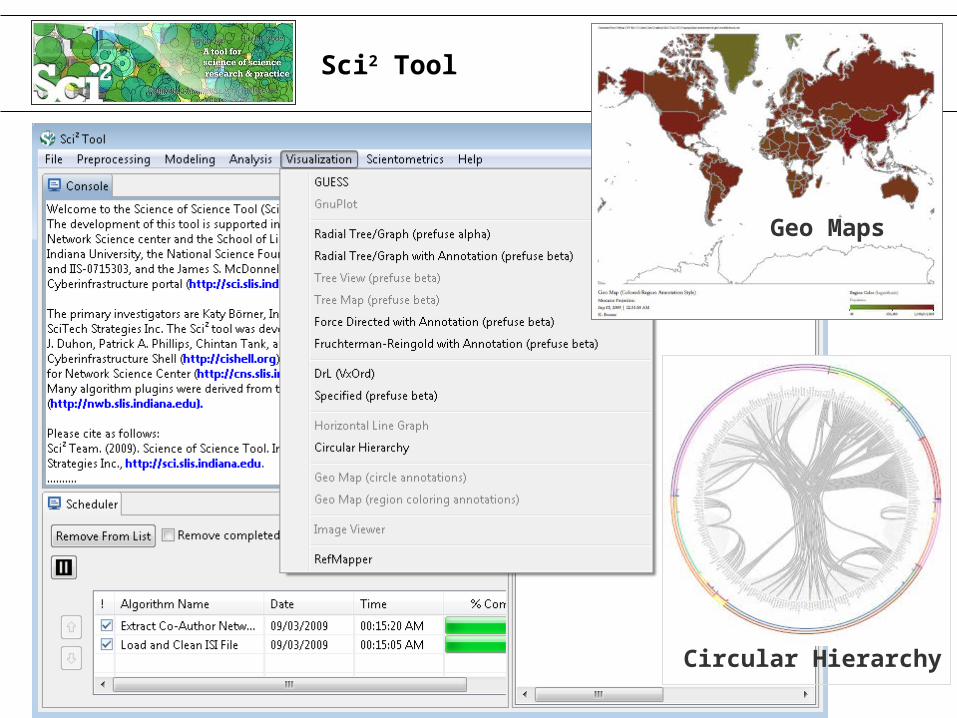
Sci2 Tool
Geo Maps
Circular Hierarchy

12
Sci2 Tool: Algorithms See https://nwb.slis.indiana.edu/community
PreprocessingExtract Top N% RecordsExtract Top N RecordsNormalize TextSlice Table by Line---------------------------------------------Extract Top NodesExtract Nodes Above or Below
ValueDelete Isolates---------------------------------------------Extract top EdgesExtract Edges Above or Below
ValueRemove Self LoopsTrim by DegreeMST-Pathfinder Network
ScalingFast Pathfinder Network
Scaling---------------------------------------------Snowball Sampling (in nodes)Node SamplingEdge Sampling---------------------------------------------SymmetrizeDichotomizeMultipartite Joining---------------------------------------------Geocoder---------------------------------------------Extract ZIP Code
ModelingRandom GraphWatts-Strogatz Small WorldBarabási-Albert Scale-FreeTARL
AnalysisNetwork Analysis Toolkit (NAT)Unweighted & Undirected
Node DegreeDegree Distribution---------------------------------------------K-Nearest Neighbor (Java)Watts-Strogatz Clustering
CoefficientWatts Strogatz Clustering
Coefficient over K---------------------------------------------DiameterAverage Shortest PathShortest Path DistributionNode Betweenness Centrality---------------------------------------------Weak Component ClusteringGlobal Connected Components---------------------------------------------Extract K-CoreAnnotate K-Coreness---------------------------------------------HITS
Weighted & UndirectedClustering CoefficientNearest Neighbor DegreeStrength vs DegreeDegree & StrengthAverage Weight vs End-point
DegreeStrength DistributionWeight DistributionRandomize Weights---------------------------------------------Blondel Community Detection---------------------------------------------HITS
Unweighted & DirectedNode IndegreeNode OutdegreeIndegree DistributionOutdegree Distribution---------------------------------------------K-Nearest NeighborSingle Node in-Out Degree
Correlations---------------------------------------------Dyad ReciprocityArc ReciprocityAdjacency Transitivity---------------------------------------------Weak Component ClusteringStrong Component Clustering---------------------------------------------

13
Sci2 Tool: Algorithms cont.See https://nwb.slis.indiana.edu/community
--------------------------------Extract K-CoreAnnotate K-Coreness--------------------------------HITSPageRank
Weighted & DirectedHITSWeighted PageRank
TextualBurst Detection
VisualizationGnuPlotGUESSImage Viewer---------------------------------------------Radial Tree/Graph (prefuse alpha)Radial Tree/Graph with Annotation (prefuse beta)Tree View (prefuse beta)Tree Map (prefuse beta)Force Directed with Annotation (prefuse beta)Fruchterman-Reingold with Annotation (prefuse beta)---------------------------------------------DrL (VxOrd)Specified (prefuse beta)---------------------------------------------Horizontal Line GraphCircular HierarchyGeo Map (Circle Annotation Style)Geo Map (Colored-Region
Annotation Style)*Science Map (Circle Annotation)
ScientometricsRemove ISI Duplicate RecordsRemove Rows with Multitudinous
FieldsDetect Duplicate NodesUpdate Network by Merging Nodes---------------------------------------------Extract Directed NetworkExtract Paper Citation NetworkExtract Author Paper Network---------------------------------------------Extract Co-Occurrence NetworkExtract Word Co-Occurrence
NetworkExtract Co-Author NetworkExtract Reference Co-Occurrence (Bibliographic Coupling)
Network---------------------------------------------Extract Document Co-Citation
Network
* Requires permission from UCSD All four+ save into Postscript files.Automatic legends.
NEW:Database support for ISI and NSF data.
See Sci2 Manual, Section 3.1 for details.http://sci.slis.indiana.edu/registration/docs/Sci2_Tutorial.pdf

14
Sci2 Tool: Download, Install, and Run
Sci2 Tool Alpha 3 (March 2010)Can be freely downloaded for all major operating systems from http://sci.slis.indiana.edu/sci2Select your operating system from the pull down menu and download. Unpack into a /sci2 directory.Run /sci2/sci2.exe
Session log files are stored in ‘*yournwbdirectory*/logs’ directory.
Cite as Sci2 Team. (2009). Science of Science (Sci2) Tool. Indiana University and SciTech Strategies, http://sci.slis.indiana.edu.
The file was also made available assci2-N-1.0.0.201003270106NGT-win32.win32.x86.zip on the computers in the tutorial room.

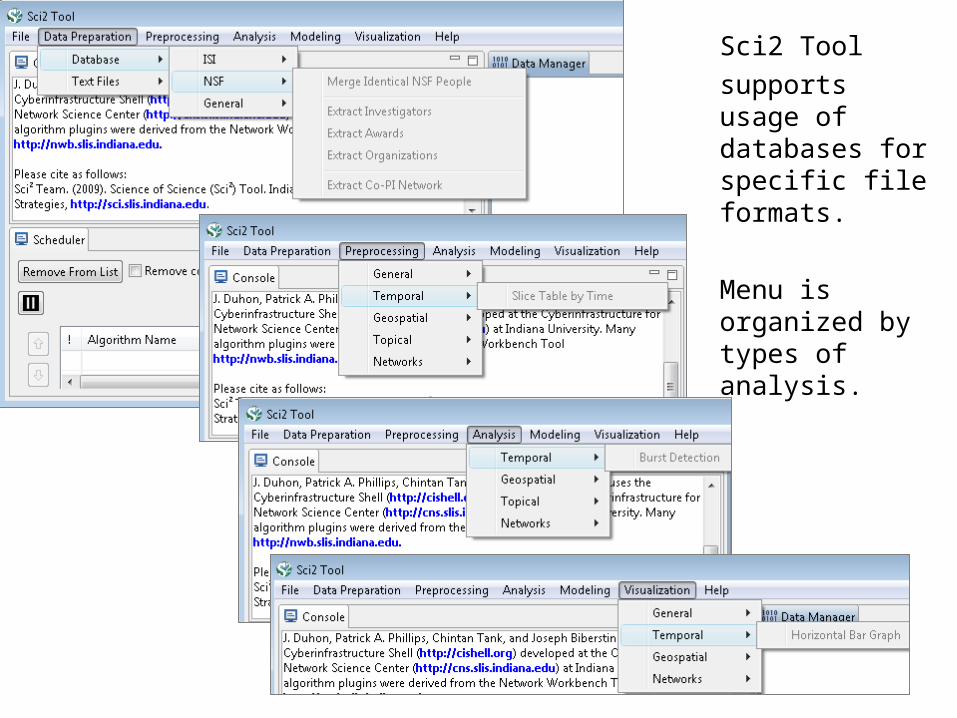
Sci2 Toolsupports usage of databases for specific file formats.
Menu is organized by types of analysis.

[#04] Temporal Analysis—Burst Detection
Science of Science (Sci2) Tool (left over from Tutorial #3)
Temporal Analysis Overview Designing Effective Charts Sci2-Horizontal Bar Charts Sci2-Burst Analysis and Visualization Outlook Exercise: Identify Promising Temporal Analyses
of NIH Data
17
Information Visualization Course, Katy Börner, Indiana University
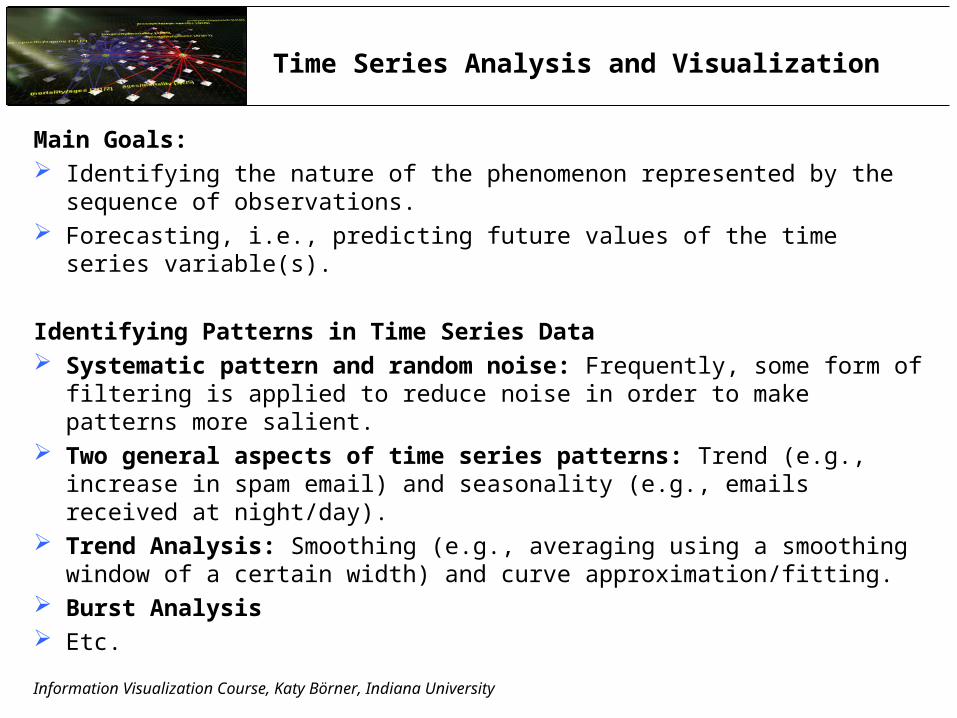
Time Series Analysis and Visualization
Main Goals: Identifying the nature of the phenomenon represented by the
sequence of observations. Forecasting, i.e., predicting future values of the time series
variable(s).
Identifying Patterns in Time Series Data Systematic pattern and random noise: Frequently, some form of
filtering is applied to reduce noise in order to make patterns more salient.
Two general aspects of time series patterns: Trend (e.g., increase in spam email) and seasonality (e.g., emails received at night/day).
Trend Analysis: Smoothing (e.g., averaging using a smoothing window of a certain width) and curve approximation/fitting.
Burst Analysis Etc.
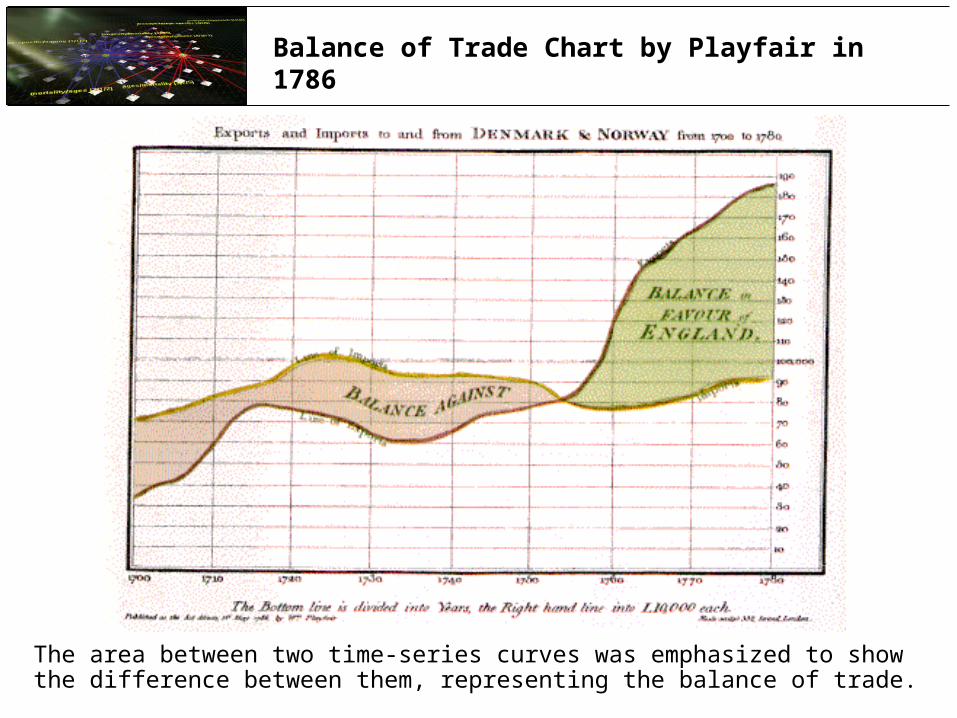
Balance of Trade Chart by Playfair in 1786
The area between two time-series curves was emphasized to show the difference between them, representing the balance of trade.

Interactive Baby Name Wizardhttp://babynamewizard.com/namevoyager/lnv0105.html
Information Visualization Course, Katy Börner, Indiana University
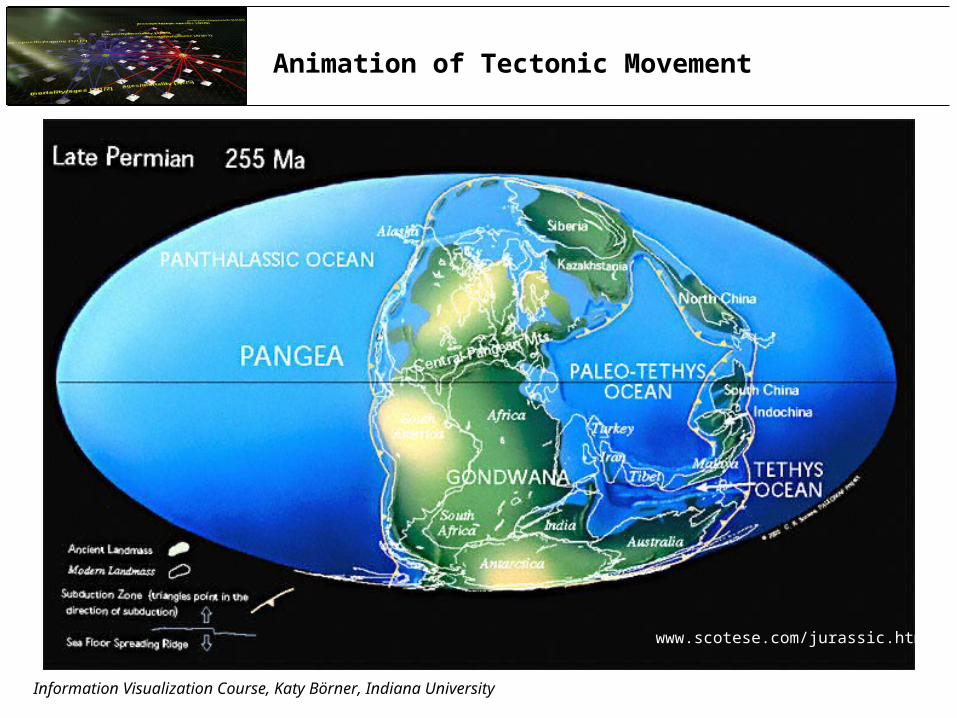
Animation of Tectonic Movement
www.scotese.com/jurassic.htm
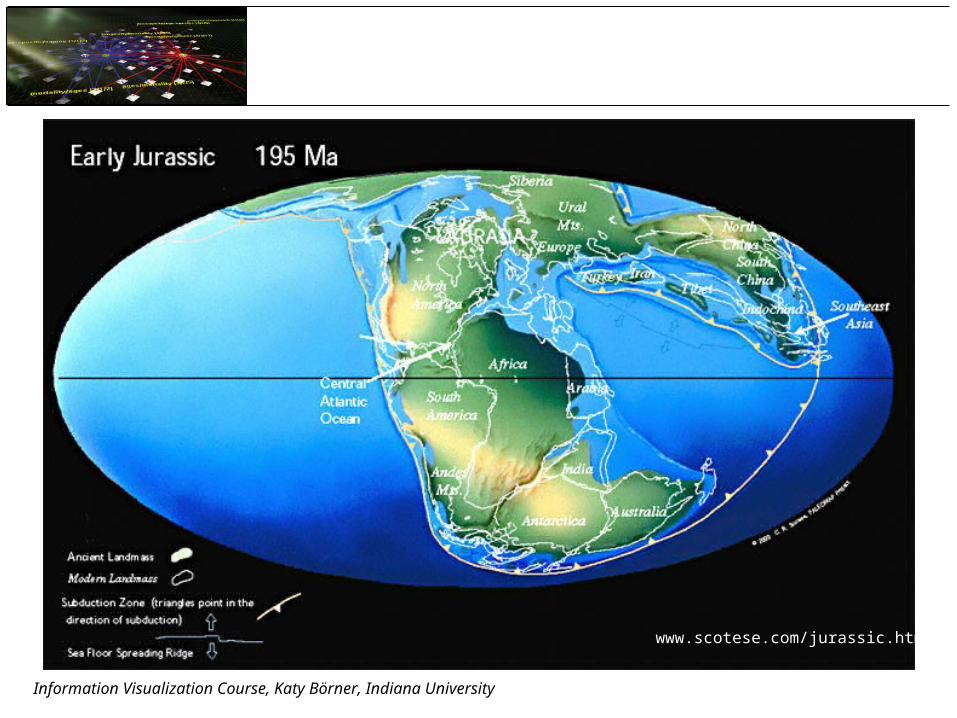
Information Visualization Course, Katy Börner, Indiana University
www.scotese.com/jurassic.htm
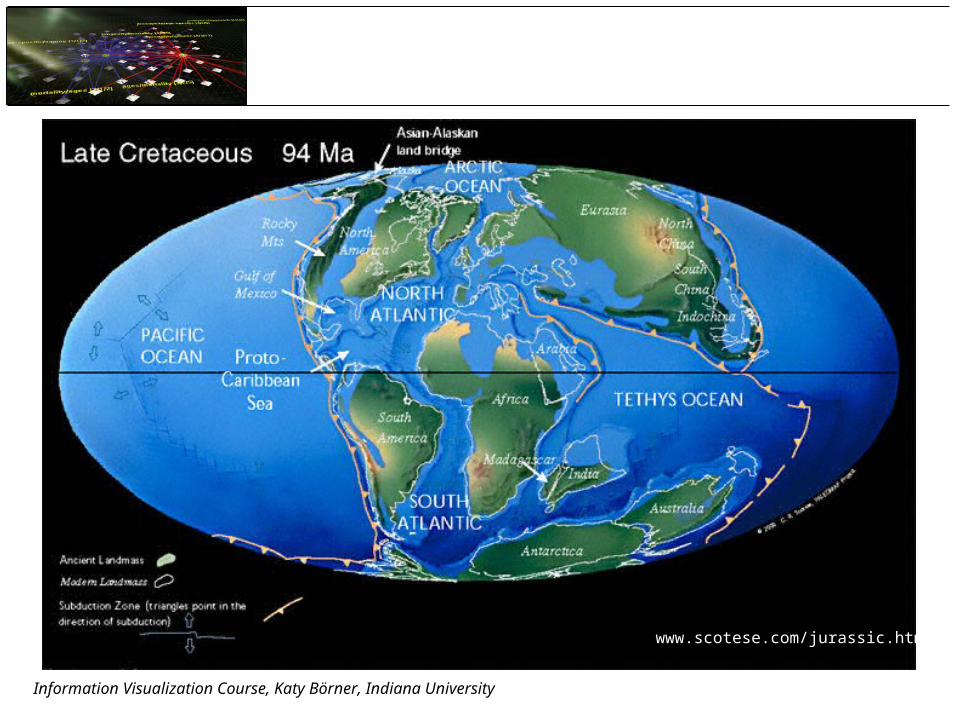
Information Visualization Course, Katy Börner, Indiana University
www.scotese.com/jurassic.htm

Continental Drift Animationhttp://www.ucmp.berkeley.edu/geology/anim1.html

Gapminder presentation by Hans Rosling http://www.ucmp.berkeley.edu/geology/anim1.html
http://www.ted.com/index.php/talks/hans_rosling_shows_the_best_stats_you_ve_ever_seen.html

[#04] Temporal Analysis—Burst Detection
Science of Science (Sci2) Tool (left over from Tutorial #3)
Temporal Analysis Overview Designing Effective Charts Sci2-Horizontal Bar Charts Sci2-Burst Analysis and Visualization Outlook Exercise: Identify Promising Temporal Analyses
of NIH Data
26
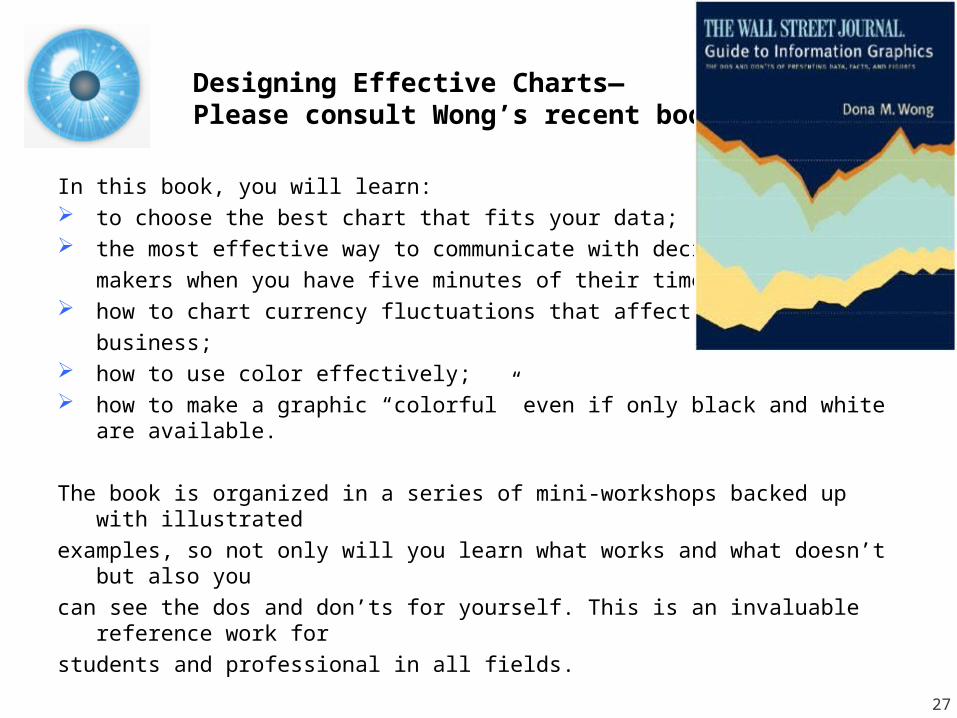
In this book, you will learn: to choose the best chart that fits your data; the most effective way to communicate with decision
makers when you have five minutes of their time; how to chart currency fluctuations that affect global
business; how to use color effectively; how to make a graphic “colorful” even if only black and white are
available.
The book is organized in a series of mini-workshops backed up with illustrated
examples, so not only will you learn what works and what doesn’t but also you
can see the dos and don’ts for yourself. This is an invaluable reference work for
students and professional in all fields.
Designing Effective Charts— Please consult Wong’s recent book
27
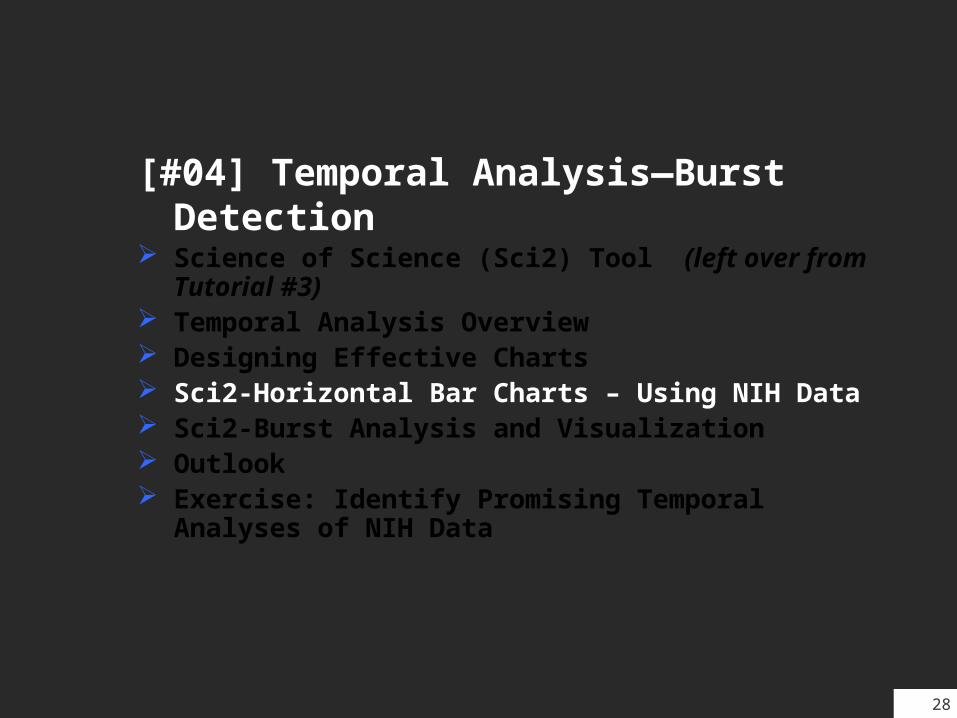
[#04] Temporal Analysis—Burst Detection
Science of Science (Sci2) Tool (left over from Tutorial #3)
Temporal Analysis Overview Designing Effective Charts Sci2-Horizontal Bar Charts – Using NIH Data Sci2-Burst Analysis and Visualization Outlook Exercise: Identify Promising Temporal Analyses
of NIH Data
28

QVR Query for MIDAS* Grants
* NIGMS Modeling of Infectious Disease Agent Study
Select awarded grants in the Primary Search section
Enter MIDAS RFA numbers in the application ID section
Download hit list
Execute search
Slide provided by James Onken 29
RePORTER Datasets

Select data elements
Export to Excel
QVR Query for MIDAS Grants (Cont’d)
30Slide provided by James Onken

SPIRES Query for MIDAS Publications
Conduct Publication Search
Open Project Detail Search Screen
Clear your IC from selection box (if necessary)
Select custom download
31Slide provided by James Onken

SPIRES Query for MIDAS Publications (cont’d)
Select data elements
Download Excel file
Search Publications
Repeat process for GM05-011
Enter MIDAS RFA Number
32Slide provided by James Onken
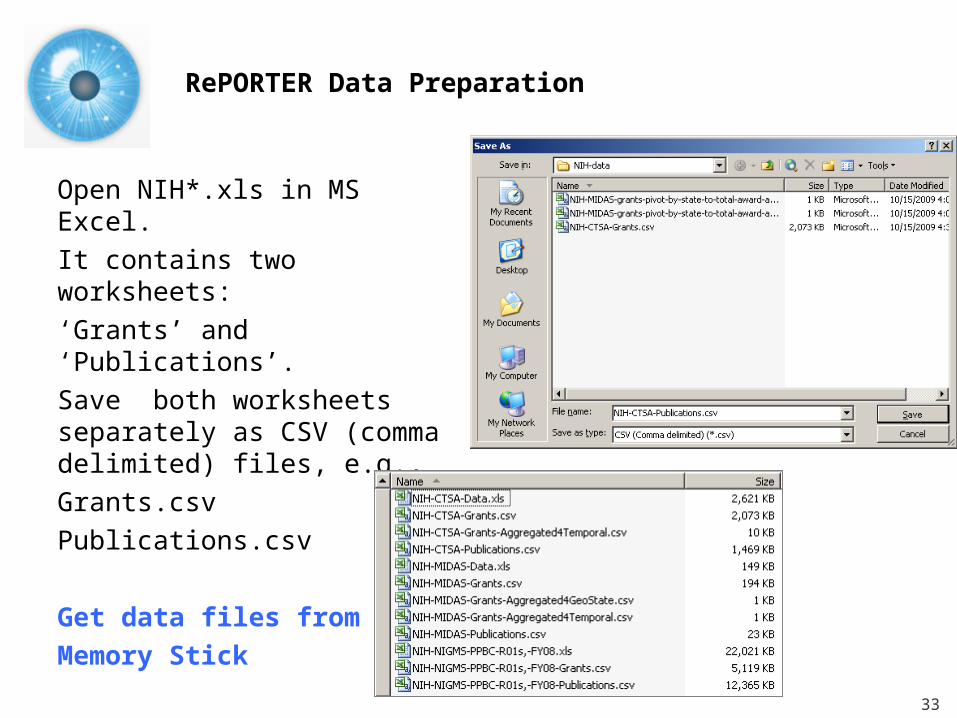
RePORTER Data Preparation
Open NIH*.xls in MS Excel.It contains two worksheets:‘Grants’ and ‘Publications’.Save both worksheets separately as CSV (comma delimited) files, e.g., Grants.csvPublications.csv
Get data files fromMemory Stick
33
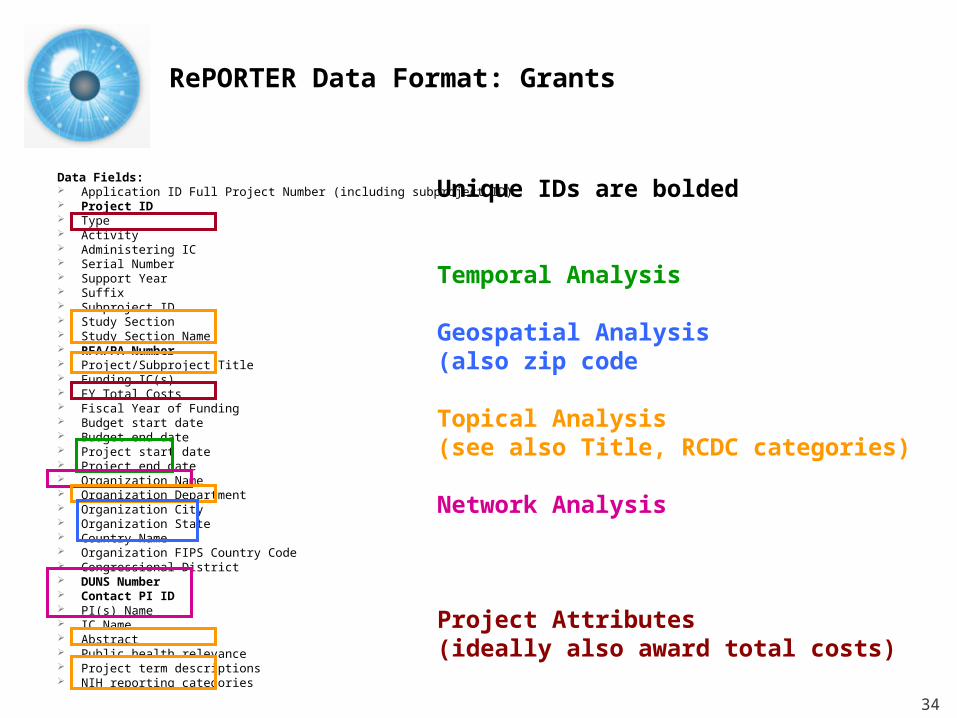
RePORTER Data Format: Grants
Data Fields: Application ID Full Project Number (including subproject ID) Project ID Type Activity Administering IC Serial Number Support Year Suffix Subproject ID Study Section Study Section Name RFA/PA Number Project/Subproject Title Funding IC(s) FY Total Costs Fiscal Year of Funding Budget start date Budget end date Project start date Project end date Organization Name Organization Department Organization City Organization State Country Name Organization FIPS Country Code Congressional District DUNS Number Contact PI ID PI(s) Name IC Name Abstract Public health relevance Project term descriptions NIH reporting categories
Unique IDs are bolded
Temporal Analysis
Geospatial Analysis(also zip code
Topical Analysis(see also Title, RCDC categories)
Network Analysis
Project Attributes (ideally also award total costs)
34

RePORTER Data Format: Publications
Data Fields: Application ID Project ID PubMed ID Publication Title Authors ISSN Journal Title Abbr Journal Volume Journal Issue Page Number Publish Date Mesh Terms
Unique IDs are bolded
Temporal Analysis
Geospatial Analysis(also zip code
Topical Analysis(see also Title, RCDC categories)
Network Analysis
Project Attributes (Times Cited via Web of Science)
35
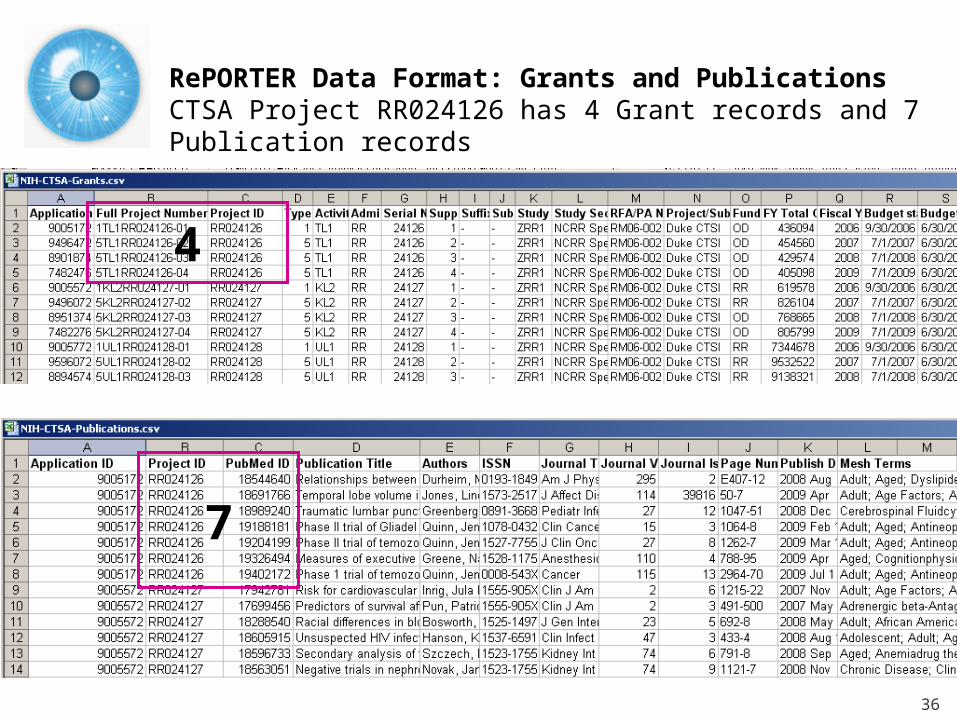
7
RePORTER Data Format: Grants and PublicationsCTSA Project RR024126 has 4 Grant records and 7 Publication records
4
36

NIH CTSA Grants: Over Time
Grant records with identical title were aggregated.
Project/Subproject Title # Records
Clinical and Translational Science Award33
Clinical and Translational Science Institute22
UC Davis CTSA 20Duke CTSI ` 19
See NIH-CTSA-Grants-Aggregated4Temporal.csv
Start date
End date
Area size equals numerical value, e.g., award amount.
Text, e.g., title
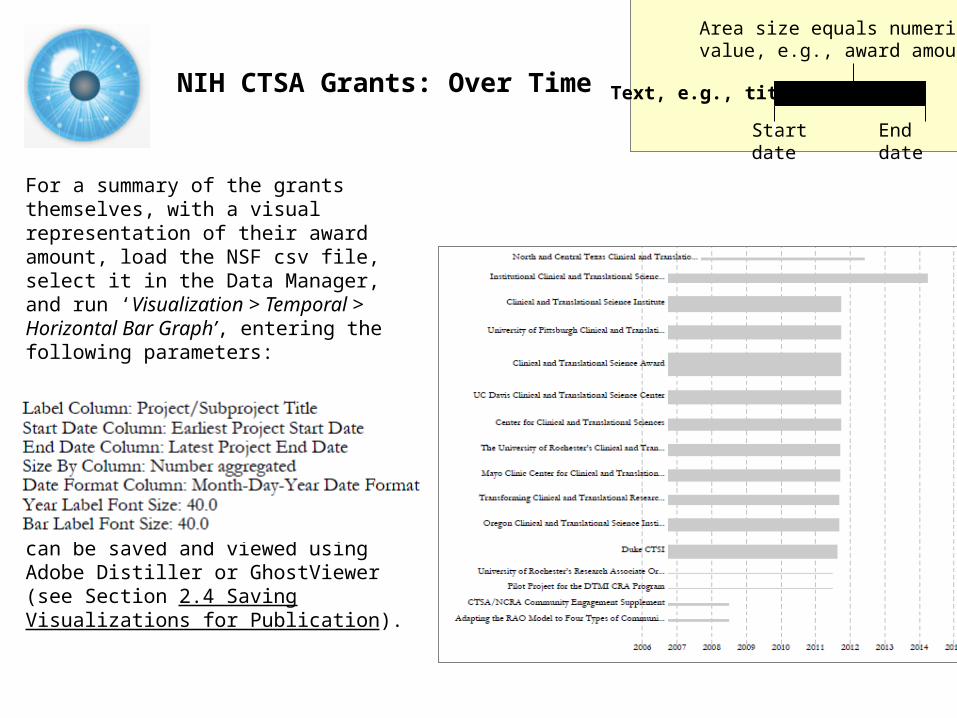
NIH CTSA Grants: Over Time
For a summary of the grants themselves, with a visual representation of their award amount, load the NSF csv file, select it in the Data Manager, and run ‘Visualization > Temporal > Horizontal Bar Graph’, entering the following parameters:
The generated postscript file can be saved and viewed using Adobe Distiller or GhostViewer (see Section 2.4 Saving Visualizations for Publication).
Start date
End date
Area size equals numerical value, e.g., award amount.
Text, e.g., title
[#04] Temporal Analysis—Burst Detection
Science of Science (Sci2) Tool (left over from Tutorial #3)
Temporal Analysis Overview Designing Effective Charts Sci2-Horizontal Bar Charts – Using NSF Data –
Topic Area Sci2-Burst Analysis and Visualization Outlook Exercise: Identify Promising Temporal Analyses
of NIH Data
39
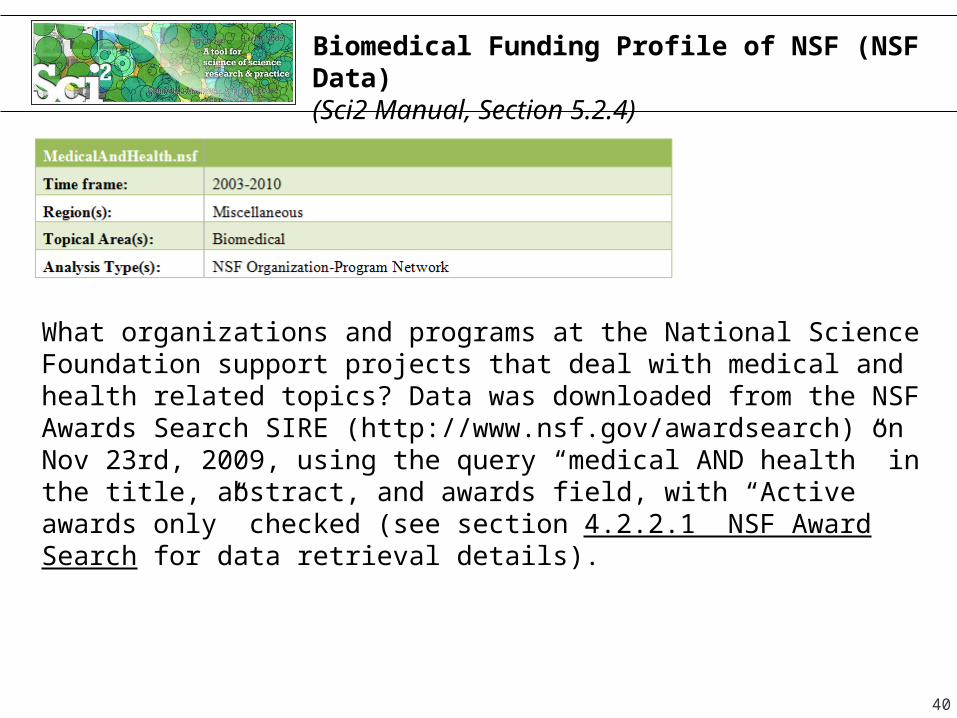
Biomedical Funding Profile of NSF (NSF Data) (Sci2 Manual, Section 5.2.4)
What organizations and programs at the National Science Foundation support projects that deal with medical and health related topics? Data was downloaded from the NSF Awards Search SIRE (http://www.nsf.gov/awardsearch) on Nov 23rd, 2009, using the query “medical AND health” in the title, abstract, and awards field, with “Active awards only” checked (see section 4.2.2.1 NSF Award Search for data retrieval details).
40
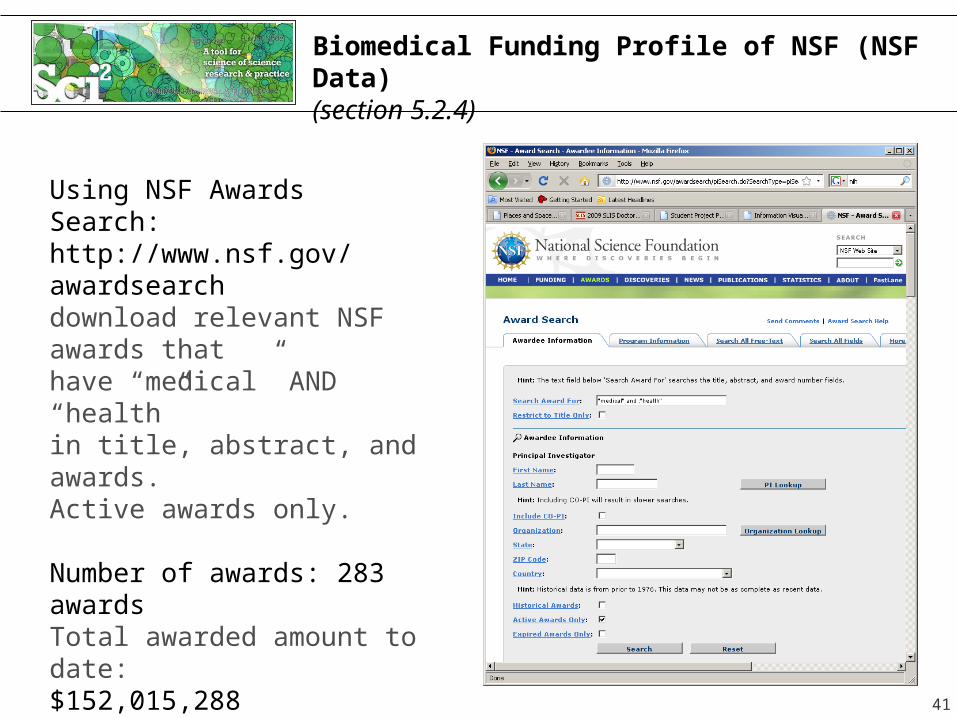
Biomedical Funding Profile of NSF (NSF Data) (section 5.2.4)
41
Using NSF Awards Search:http://www.nsf.gov/awardsearch download relevant NSF awards that have “medical” AND “health”in title, abstract, and awards.Active awards only.
Number of awards: 283 awardsTotal awarded amount to date: $152,015,288
File is available in /sampledata/scientometrics/nsf/MedicalAndHealth.nsf
Retrieved on Oct 18, 2009

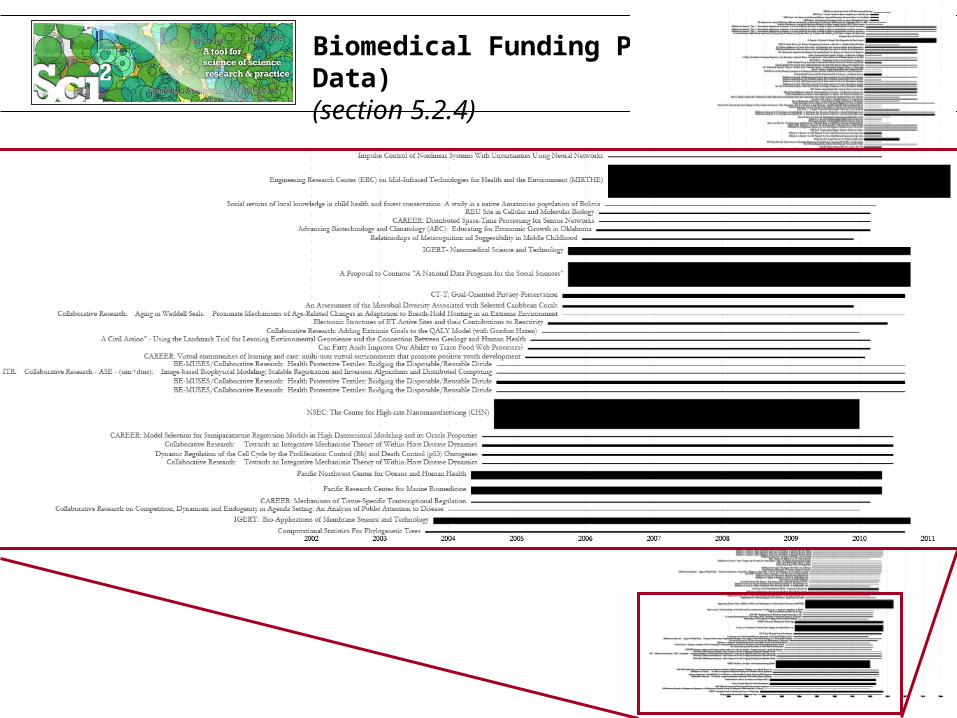
For a summary of the grants themselves, with a visual representation of their award amount, load the NSF csv file, select it in the Data Manager, and run ‘Visualization > Temporal > Horizontal Bar Graph’, entering the following parameters:
The generated postscript file can be saved and viewed using Adobe Distiller or GhostViewer (see Section 2.4 Saving Visualizations for Publication).
42
Biomedical Funding Profile of NSF (NSF Data)(section 5.2.4)

43
Start date
End date
Area size equals numerical value, e.g., award amount.
Text, e.g., title
Top-10 grants with highest $Awarded to Date:
Biomedical Funding Profile of NSF (NSF Data) (section 5.2.4)
How to read a Horizontal Bar Graph:
Biomedical Funding Profile of NSF (NSF Data) (section 5.2.4)
44
Horizontal Bargraph
Biomedical Funding Profile of NSF (NSF Data) (section 5.2.4)
45
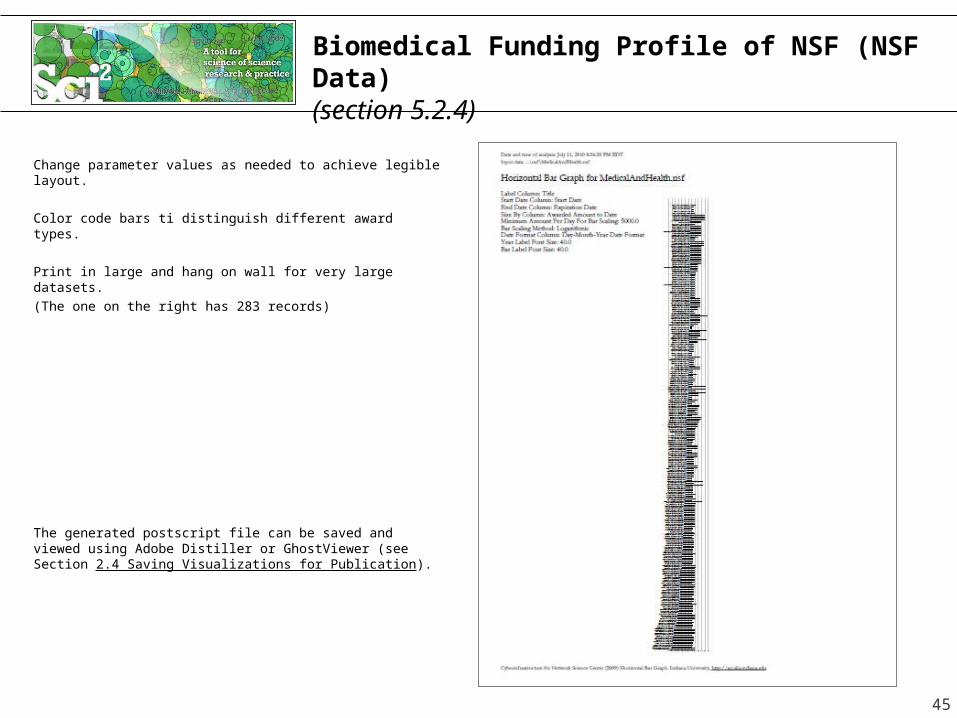
Change parameter values as needed to achieve legible layout.
Color code bars ti distinguish different award types.
Print in large and hang on wall for very large datasets. (The one on the right has 283 records)
The generated postscript file can be saved and viewed using Adobe Distiller or GhostViewer (see Section 2.4 Saving Visualizations for Publication).
[#04] Temporal Analysis—Burst Detection
Science of Science (Sci2) Tool (left over from Tutorial #3)
Temporal Analysis Overview Designing Effective Charts Sci2-Horizontal Bar Charts – Using NSF Data –
Comparing Individual Funding Profiles Sci2-Burst Analysis and Visualization Outlook Exercise: Identify Promising Temporal Analyses
of NIH Data
46

Mapping Funding Portfolios at the Individual LevelUsing NSF Awards Search via http://www.nsf.gov/awardsearch
Save in CSV format as *name*.nsf
Save in CSV format as *name*.nsf
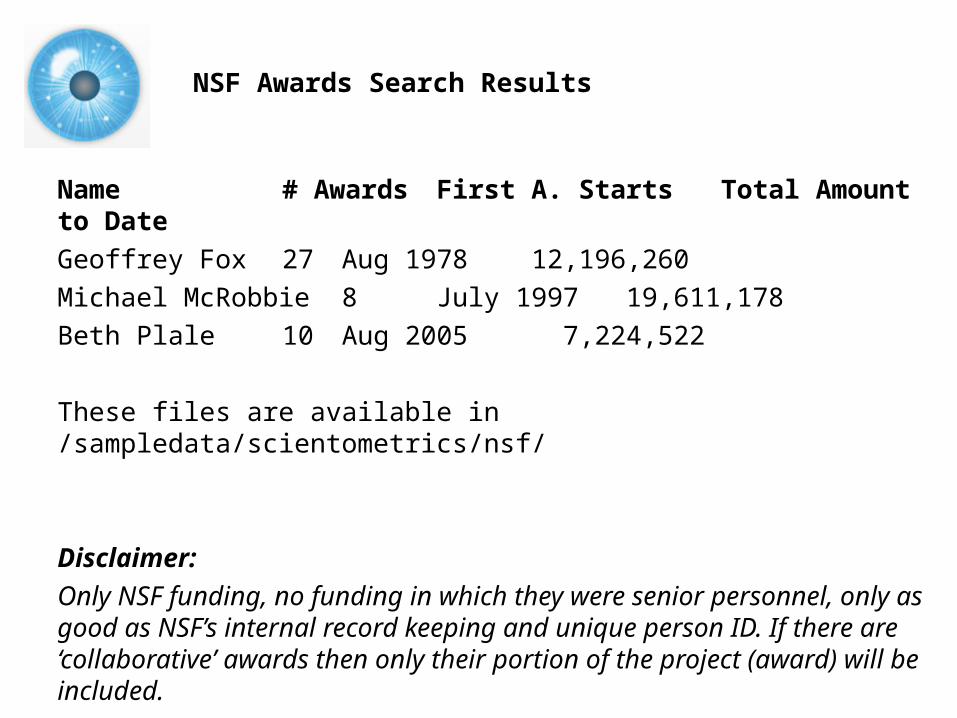
NSF Awards Search Results
Name # Awards First A. Starts Total Amount to DateGeoffrey Fox 27 Aug 1978 12,196,260Michael McRobbie 8 July 199719,611,178Beth Plale 10 Aug 2005 7,224,522
These files are available in /sampledata/scientometrics/nsf/
Disclaimer:Only NSF funding, no funding in which they were senior personnel, only as good as NSF’s internal record keeping and unique person ID. If there are ‘collaborative’ awards then only their portion of the project (award) will be included.

Comparing Funding Portfolios at the Individual Level
Last Expiration date
Geoffrey Fox
July 10
Michael McRobbie
Feb 10
Beth Plale
Sept 09

[#04] Temporal Analysis—Burst Detection
Science of Science (Sci2) Tool (left over from Tutorial #3)
Temporal Analysis Overview Designing Effective Charts Sci2-Horizontal Bar Charts Sci2-Burst Analysis and Visualization Outlook Exercise: Identify Promising Temporal Analyses
of NIH Data
50
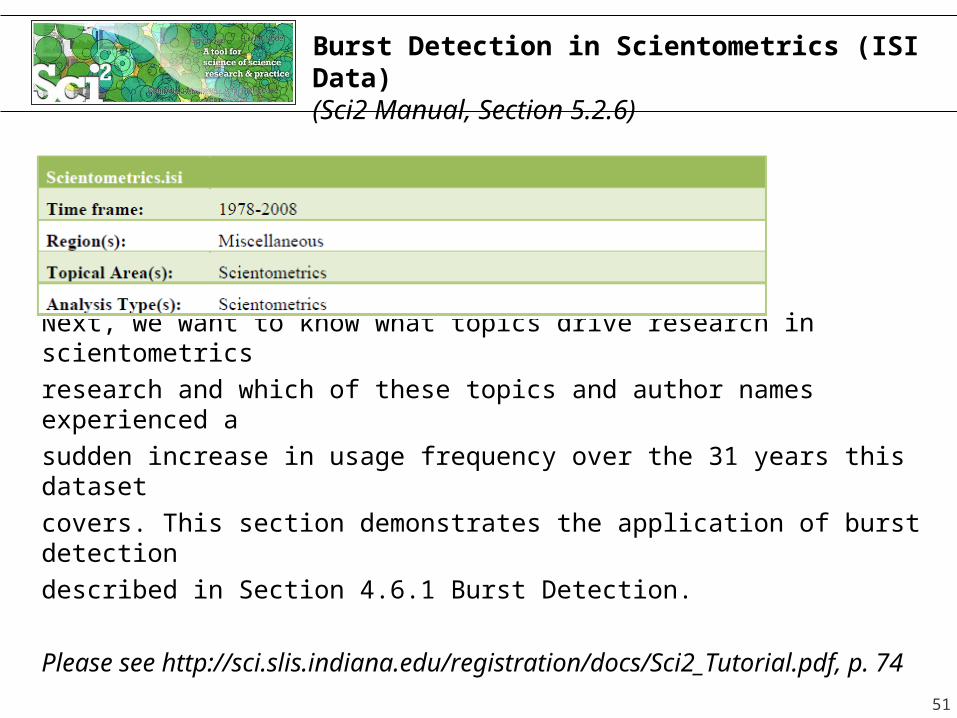
Burst Detection in Scientometrics (ISI Data)(Sci2 Manual, Section 5.2.6)
Next, we want to know what topics drive research in scientometrics research and which of these topics and author names experienced asudden increase in usage frequency over the 31 years this dataset covers. This section demonstrates the application of burst detection described in Section 4.6.1 Burst Detection.
Please see http://sci.slis.indiana.edu/registration/docs/Sci2_Tutorial.pdf, p. 74
51
[#04] Temporal Analysis—Burst Detection
Science of Science (Sci2) Tool (left over from Tutorial #3)
Temporal Analysis Overview Designing Effective Charts Sci2-Horizontal Bar Charts Sci2-Burst Analysis and Visualization Sci2-Animations Outlook Exercise: Identify Promising Temporal Analyses
of NIH Data
52

Outlook
Planned extensions of Sci2 Tool: Database support for RePORTER -> merging into ‘project
buckets’, correct time/data formats for subsequent analysis, time slicing.
Temporal animations, e.g., network overlays for geo maps and science maps.
53
[#04] Temporal Analysis—Burst Detection
Science of Science (Sci2) Tool (left over from Tutorial #3)
Temporal Analysis Overview Designing Effective Charts Sci2-Horizontal Bar Charts Sci2-Burst Analysis and Visualization Sci2-Animations Outlook Exercise: Identify Promising Temporal Analyses
of NIH Data
54
Exercise
Please identify a promising temporal analysis of NIH data.
Document it by listing Project title User, i.e., who would be most interested in the result? Insight need addressed, i.e., what would you/user like to
understand? Data used, be as specific as possible. Analysis algorithms used. Visualization generated. Please make a sketch with legend.
55
Exercise

All papers, maps, cyberinfrastructures, talks, press are linked from http://cns.slis.indiana.edu
56
Related Documents