A LOCAL SNAPSHOT School Construction SUMMER BULLETIN • JUNE 2012 2006 2007 2008 2009 2010 2011 2012 135 Elections 165 Elections 131 Elections 107 Elections • $3,228,447,000 79 Elections • $3,149,603,033 School Bonds that Have Carried in Texas $6,164,297,085 2012 – TURNING POINT? Growth in the Houston MSA job market has resulted in more jobs in the area than ever before. Real estate inventories are going down. Housing is picking up. Employment forecast shows Construction Industry with an 8% increase in hiring for 2013 compared to 2012. Money supply is up. With the tide starting to swing with a growing Houston economy, many School Districts will have to start talking and planning for their next School Bond Program. This may be a scary thought, but the alternative could be worse. In these uncertain times districts are facing some big unknowns which make the decision-making process even more difficult. Outcome of School finance reform? Fall Elections? Is the growing Houston economy sustainable? Is the housing bubble really over? Will Global issues affect Houston? Euro Crisis How reliable are the Demographic Projections? What legislative changes are still to come? Can we accurately predict future Construction Cost? Everything is circling around one word - “Confidence” - in the direction of our economy and government. It is evident that businesses and people are becoming more confident with the Houston MSA based on the recent indicators illustrated in this Bulletin. With the turning of the page to a more vibrant Houston MSA, it will take time for School Districts to benefit from this growth. Businesses have to grow and people have to spend money for the tax revenues to increase and filter to our Schools. Be patient and start planning. TRENDS Demographics are changing. (See PASA report page 3) CONSTRUCTION COSTS STARTING TO INCREASE with material and fuel costs being the biggest drivers. The price increase ranges from a few percent to double digits depending on the trade. Schools are still feeling the budget cuts to compound the issue. Over half the school districts in Texas are involved in lawsuits against the State on School Financing. Energy Efficiency in Schools becoming a big target for battling budget cuts. HOUSTON HOUSING ON THE RISE INDICATORS: Sales volume is up 7.8% compared to last year, 10th consecutive monthly increase Total property sales are up 7.4% from a year ago Foreclosure sales are down 12.8% year over year 5.6 months inventory of single-family homes is the lowest level since December 2008 and compares favorably to the national average of 6.4 months Source: Houston Area Realtors Mar 2011 Mar 2012 % Change West Texas Intermediate Spot Market Price $93.43 $103.00 10.2% Henry Hub Natural Gas Price $4.12 $2.36 -42.7% Source: Baker Hughes; Energy Information Administration OIL & NATURAL GAS INDICATORS $11,148,510,479 79 Elections • $1,599,164,995 May - 44 Elections • $634,810,000 $8,686,683,101 2012 Elementary School Cost Data Square Foot Size Average Cost/SF 92,000 - 114,000 SF $135.00/SF $ 2 4 6 7 8 9 10 1 12 (Billion)

Welcome message from author
This document is posted to help you gain knowledge. Please leave a comment to let me know what you think about it! Share it to your friends and learn new things together.
Transcript
A LOCAL SNAPSHOTSchool Construction
S U M M E R B U L L E T I N • J U N E 2 0 1 2
2006 2007 2008 2009 2010 2011 2012
135 Elections
165 Elections
131 Elections
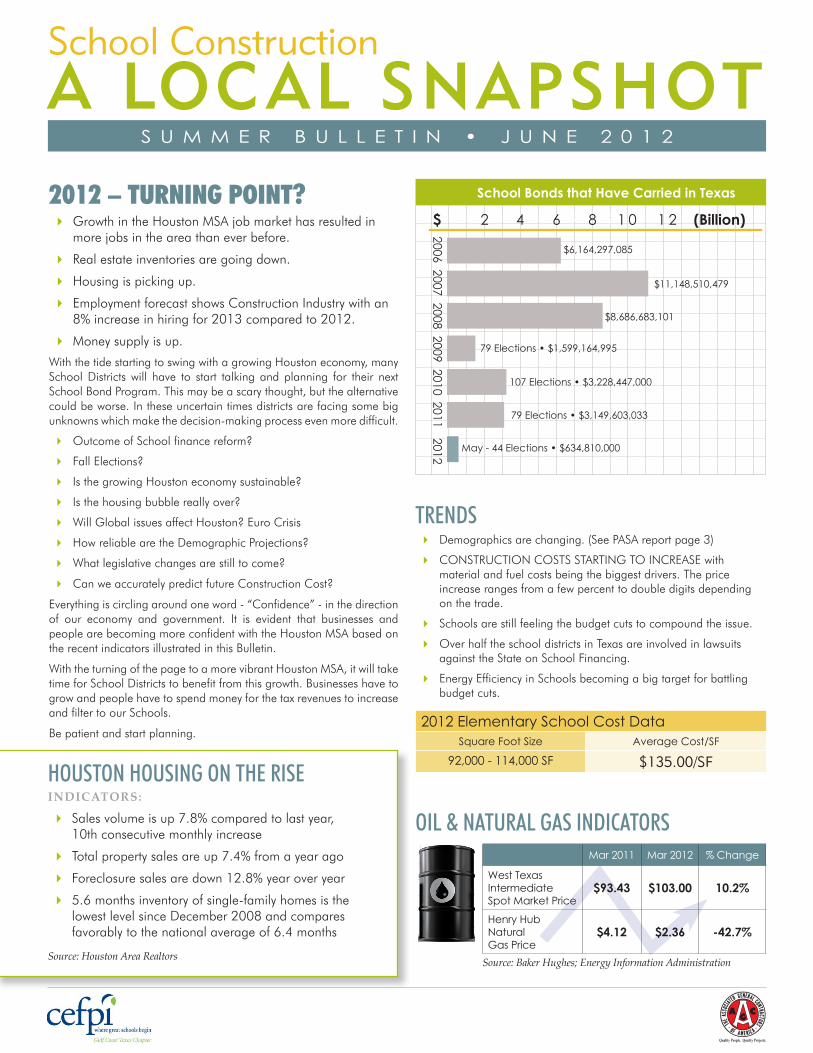
107 Elections • $3,228,447,000
79 Elections • $3,149,603,033
School Bonds that Have Carried in Texas
$6,164,297,085
2012 – TURNING POINT?�� Growth�in�the�Houston�MSA�job�market�has�resulted�in�more�jobs�in�the�area�than�ever�before.
�� Real�estate�inventories�are�going�down.
�� Housing�is�picking�up.
�� Employment�forecast�shows�Construction�Industry�with�an�8%�increase�in�hiring�for�2013�compared�to�2012.
�� Money�supply�is�up.
With�the�tide�starting�to�swing�with�a�growing�Houston�economy,�many�School�Districts�will� have� to� start� talking� and�planning� for� their� next�School�Bond�Program.�This�may�be�a�scary�thought,�but�the�alternative�could�be�worse.�In�these�uncertain�times�districts�are�facing�some�big�unknowns�which�make�the�decision-making�process�even�more�difficult.
�� Outcome�of�School�finance�reform?
�� Fall�Elections?
�� Is�the�growing�Houston�economy�sustainable?
�� Is�the�housing�bubble�really�over?
�� Will�Global�issues�affect�Houston?�Euro�Crisis
�� How�reliable�are�the�Demographic�Projections?
�� What�legislative�changes�are�still�to�come?
�� Can�we�accurately�predict�future�Construction�Cost?
Everything�is�circling�around�one�word�-�“Confidence”�-�in�the�direction�of� our� economy� and� government.� It� is� evident� that� businesses� and�people�are�becoming�more�confident�with�the�Houston�MSA�based�on�the�recent�indicators�illustrated�in�this�Bulletin.�
With�the�turning�of�the�page�to�a�more�vibrant�Houston�MSA,�it�will�take�time�for�School�Districts�to�benefit�from�this�growth.�Businesses�have�to�grow�and�people�have�to�spend�money�for�the�tax�revenues�to�increase�and�filter�to�our�Schools.�
Be�patient�and�start�planning.
TRENDS�� Demographics�are�changing.�(See�PASA�report�page�3)
�� CONSTRUCTION�COSTS�STARTING�TO�INCREASE�with�material�and�fuel�costs�being�the�biggest�drivers.�The�price�increase�ranges�from�a�few�percent�to�double�digits�depending�on�the�trade.
�� Schools�are�still�feeling�the�budget�cuts�to�compound�the�issue.
�� Over�half�the�school�districts�in�Texas�are�involved�in�lawsuits�against�the�State�on�School�Financing.
�� Energy�Efficiency�in�Schools�becoming�a�big�target�for�battling�budget�cuts.�
HOUSTON HOUSING ON THE RISEINDICATORS:
�� Sales�volume�is�up�7.8%�compared�to�last�year,��10th�consecutive�monthly�increase
�� Total�property�sales�are�up�7.4%�from�a�year�ago
�� Foreclosure�sales�are�down�12.8%�year�over�year�
�� 5.6�months�inventory�of�single-family�homes�is�the�lowest�level�since�December�2008�and�compares�favorably�to�the�national�average�of�6.4�months
Source: Houston Area Realtors
Mar 2011 Mar 2012 % Change
West Texas Intermediate Spot Market Price
$93.43 $103.00 10.2%
Henry Hub Natural Gas Price
$4.12 $2.36 -42.7%
Source: Baker Hughes; Energy Information Administration
OIL & NATURAL GAS INDICATORS
$11,148,510,479
79 Elections • $1,599,164,995
May - 44 Elections • $634,810,000
$8,686,683,101
2012 Elementary School Cost DataSquare Foot Size Average Cost/SF
92,000 - 114,000 SF $135.00/SF
$ 2 4 6 7 8 9 1 0 1 1 2 (Billion)
S U M M E R B U L L E T I N • J U N E 2 0 1 2
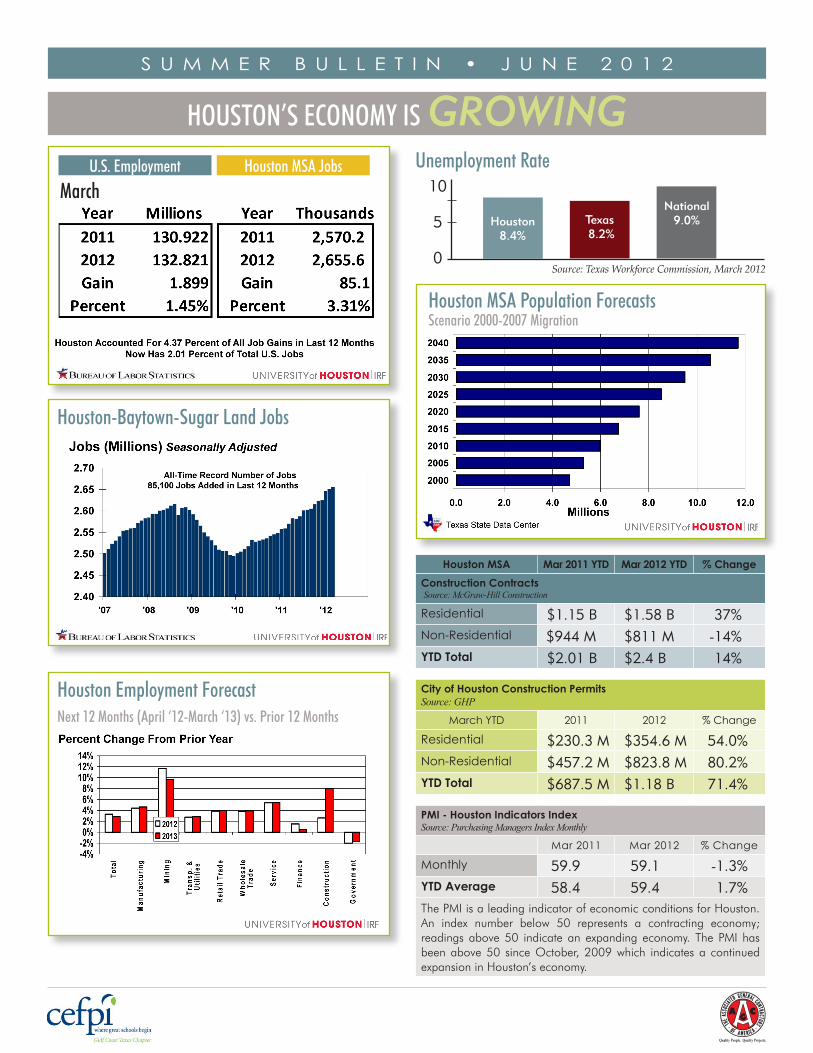
HOUSTON’S ECONOMY IS GROWING
Houston MSA Mar 2011 YTD Mar 2012 YTD % ChangeConstruction Contracts Source: McGraw-Hill Construction
Residential $1.15 B $1.58 B 37%Non-Residential $944 M $811 M -14%YTD Total $2.01 B $2.4 B 14%
City of Houston Construction PermitsSource: GHP
March YTD 2011 2012 % Change
Residential $230.3 M $354.6 M 54.0%Non-Residential $457.2 M $823.8 M 80.2%YTD Total $687.5 M $1.18 B 71.4%
PMI - Houston Indicators Index Source: Purchasing Managers Index Monthly
Mar 2011 Mar 2012 % Change
Monthly 59.9 59.1 -1.3%YTD Average 58.4 59.4 1.7%The�PMI�is�a�leading�indicator�of�economic�conditions�for�Houston.�An� index� number� below� 50� represents� a� contracting� economy;�readings� above�50� indicate� an� expanding� economy.� The� PMI� has�been�above�50� since�October,�2009�which� indicates� a� continued�expansion�in�Houston’s�economy.
Source: Texas Workforce Commission, March 2012
10
5
0
Houston8.4%
Texas 8.2%
National9.0%
Unemployment RateU.S. Employment Houston MSA Jobs
March
Houston-Baytown-Sugar Land Jobs
Houston Employment ForecastNext 12 Months (April ‘12-March ‘13) vs. Prior 12 Months
Houston MSA Population ForecastsScenario 2000-2007 Migration
S U M M E R B U L L E T I N • J U N E 2 0 1 2
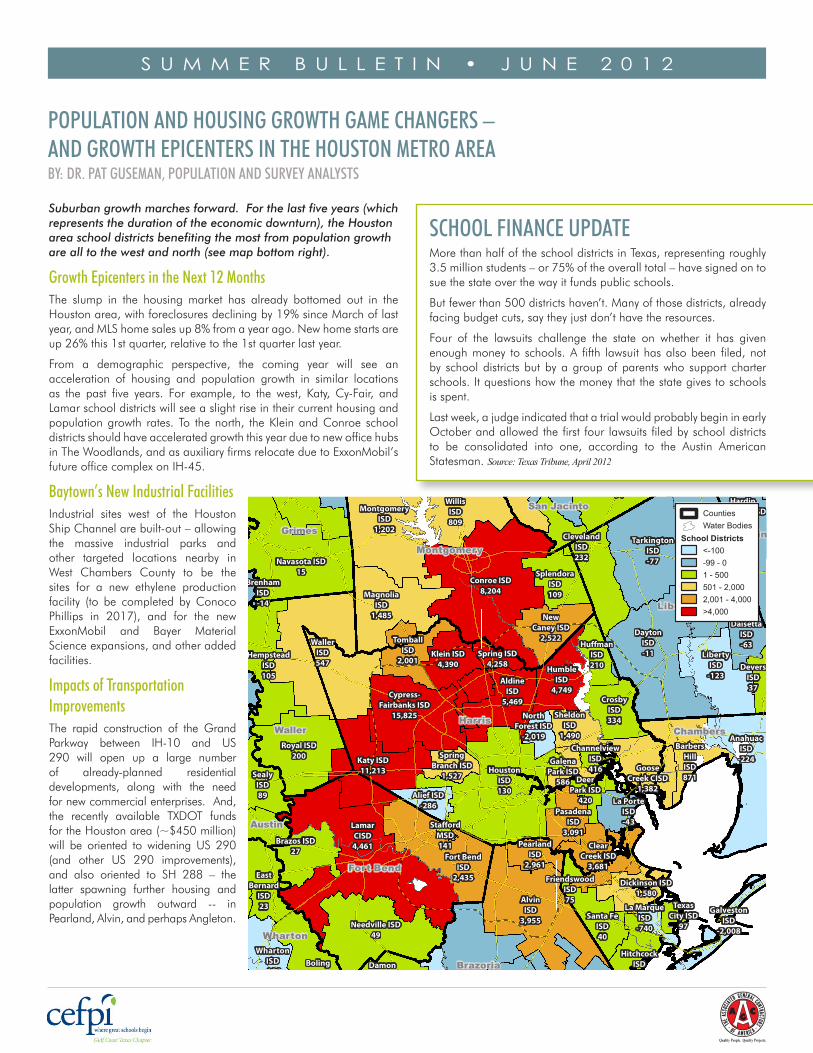
Suburban growth marches forward. For the last five years (which represents the duration of the economic downturn), the Houston area school districts benefiting the most from population growth are all to the west and north (see map bottom right).
Growth Epicenters in the Next 12 MonthsThe� slump� in� the� housing� market� has� already� bottomed� out� in� the�Houston�area,�with�foreclosures�declining�by�19%�since�March�of�last�year,�and�MLS�home�sales�up�8%�from�a�year�ago.�New�home�starts�are�up�26%�this�1st�quarter,�relative�to�the�1st�quarter�last�year.
From� a� demographic� perspective,� the� coming� year� will� see� an�acceleration� of� housing� and� population� growth� in� similar� locations�as� the� past� five� years.� For� example,� to� the� west,� Katy,� Cy-Fair,� and�Lamar�school�districts�will�see�a�slight�rise�in�their�current�housing�and�population�growth� rates.� To� the�north,� the�Klein�and�Conroe� school�districts�should�have�accelerated�growth�this�year�due�to�new�office�hubs�in�The�Woodlands,�and�as�auxiliary�firms�relocate�due�to�ExxonMobil’s�future�office�complex�on�IH-45.��
Baytown’s New Industrial FacilitiesIndustrial� sites� west� of� the� Houston�Ship�Channel�are�built-out�–�allowing�the� massive� industrial� parks� and�other� targeted� locations� nearby� in�West� Chambers� County� to� be� the�sites� for� a� new� ethylene� production�facility� (to� be� completed� by� Conoco�Phillips� in� 2017),� and� for� the� new�ExxonMobil� and� Bayer� Material�Science�expansions,�and�other�added�facilities.��
Impacts of Transportation ImprovementsThe� rapid� construction� of� the� Grand�Parkway� between� IH-10� and� US�290� will� open� up� a� large� number�of� already-planned� residential�developments,� along� with� the� need�for�new�commercial�enterprises.��And,�the� recently� available� TXDOT� funds�for�the�Houston�area�(~$450�million)�will� be� oriented� to� widening�US� 290�(and� other� US� 290� improvements),�and� also� oriented� to� SH� 288� –� the�latter� spawning� further� housing� and�population� growth� outward� --� in�Pearland,�Alvin,�and�perhaps�Angleton.
SCHOOL FINANCE UPDATEMore�than�half�of�the�school�districts�in�Texas,�representing�roughly�3.5�million�students�–�or�75%�of�the�overall�total�–�have�signed�on�to�sue�the�state�over�the�way�it�funds�public�schools.
But�fewer�than�500�districts�haven’t.�Many�of�those�districts,�already�facing�budget�cuts,�say�they�just�don’t�have�the�resources.
Four� of� the� lawsuits� challenge� the� state� on� whether� it� has� given�enough�money� to� schools.�A� fifth� lawsuit�has�also�been� filed,�not�by� school�districts�but�by�a�group�of�parents�who� support� charter�schools.�It�questions�how�the�money�that�the�state�gives�to�schools�is�spent.
Last�week,�a�judge�indicated�that�a�trial�would�probably�begin�in�early�October�and�allowed�the�first� four� lawsuits� filed�by�school�districts�to� be� consolidated� into� one,� according� to� the� Austin� American�Statesman.�Source: Texas Tribune, April 2012
La Marque
ISD
-740
Devers
ISD
37
Dickinson ISD
1,580
Goose
Creek CISD
1,382
Sweeny
ISD
-115
Hardin
ISD
-64
Liberty
ISD
-123
Dayton
ISD
-11
Stafford
MSD
141
Santa Fe
ISD
40
Hempstead
ISD
105
Hull-
Daisetta
ISD
-63
West
Hardin
County CISD
-5
Damon
ISD
32
Texas
City ISD
97
Humble
ISD
4,749
Bay
City ISD
-232
Big Sandy ISD
16
Boling
ISD
71
Aldine
ISD
5,469
Spring ISD
4,258
Brazos ISD
27
Splendora
ISD
109
Katy ISD
11,213
Van
Vleck ISD
-38
Shepherd ISD
91
East
Bernard
ISD
23
Tomball
ISD
2,001
Houston
ISD
130
Galena
Park ISD
586
Klein ISD
4,390
Deer
Park ISD
420
El Campo
ISD
105
Sealy
ISD
89
New
Caney ISD
2,522
La Porte
ISD
-43
Coldspring-
Oakhurst CISD
-17
Wharton
ISD
-198
Cypress-
Fairbanks ISD
15,825
New Waverly ISD
75
Pearland
ISD
2,961
Pasadena
ISD
3,091
Willis
ISD
809
Alief ISD
-286
Spring
Branch ISD
1,527
Conroe ISD
8,204
Brazosport ISD
-624
Barbers
Hill
ISD
871
Crosby
ISD
334
Cleveland
ISD
232
Tarkington
ISD
-77
Huffman
ISD
210
Anahuac
ISD
-224
Royal ISD
200
Huntsville
ISD
23
Friendswood
ISD
75
Sheldon
ISD
1,490
Channelview
ISD
416
North
Forest ISD
-2,019
Richards ISD
0
Clear
Creek ISD
3,681
Livingston ISD
-5
Montgomery
ISD
1,202
Waller
ISD
547
Magnolia
ISD
1,485
Anderson-Shiro
CISD
113
Hitchcock
ISD
310
Fort Bend
ISD
2,435
Columbia-
Brazoria ISD
-104
Danbury
ISD
-50
Alvin
ISD
3,955
Angleton
ISD
-37
Needville ISD
49
Galveston
ISD
-2,008
Lamar
CISD
4,461
Brenham
ISD
-14
Navasota ISD
15
Grimes
San Jacinto
Montgomery
Liberty
WallerHarris
Austin
Chambers
Fort Bend
Wharton
Brazoria
Matagorda
Hardin
5-Year Change: 2006-07 to 2011-12
A b s o l u t e C h a n g e i n S c h o o l D i s t r i c t E n r o l l m e n t
HOUSTON
Source: Texas Education Agency, Public Education Information Management System Division0 10 205 Miles[
CountiesWater Bodies
School Districts<-100-99 - 01 - 500501 - 2,0002,001 - 4,000>4,000
POPULATION AND HOUSING GROWTH GAME CHANGERS – AND GROWTH EPICENTERS IN THE HOUSTON METRO AREABY: DR. PAT GUSEMAN, POPULATION AND SURVEY ANALYSTS

S U M M E R B U L L E T I N • J U N E 2 0 1 2
LightingOne�of�the�biggest�trends�in�new�construction�is�LED�lighting.��LED�has�made�big�advances�over� the�past� few� years� to� the�point�where� LED�site�lighting�and�LED�can�lights�are�a�smart�investment.��Switching�out�lamps�to�high�efficient�florescent�lamps�are�another�low-cost�method�of�saving�energy�that�many�schools�are�employing.
Also,�schools�are�looking�to�bring�more�natural�light�into�the�classroom.��Tubular�daylighting�devices�can�be�used�in�both�new�construction�and�renovation�to�introduce�natural�light.��These�tubular�daylighting�devices�can�be�controlled�and�even�shut�off�when�the�classroom�needs�to�be�darkened�for�presentation.
Geothermal Heating and CoolingAnother� popular� trend� that� can� be� used� for� both� new� schools� and�renovations� is� geothermal� heating� and� cooling.� � This� method� of�“geoexchange”�uses�the�constant�temperature�of�the�Earth�to�heat�and�cool�a�building.� �While�geothermal� requires�an�up-front� investment,�the�system�can�pay�for�itself�via�energy�savings�in�three�to�five�years.��Geothermal�systems�are�simple�and�easy�to�operate.
SummaryKnowing�a�building’s�energy�benchmark�is�the�first�step�to�instituting�an�energy�savings�program.��This�allows�school�personnel�to�set�goals�and�determine�which�changes�in�either�behavior�or�equipment�need�to�be�made�to�meet�the�goals.��Also,�demonstrating�to�staff�that�had�to�give�up�their�personal�coffee�pot�or�wear�a�sweater� in� the�classroom�that�these�actions�are�having�a�positive�affect�is�a�great�way�to�reinforce�and�obtain�‘buy-in’�for�the�low-hanging�fruit�behaviors.
1�American Society of Heating, Refrigeration and Air-Conditioning Engineers, Advanced Energy Design Guide, 2008.2www.energystar.gov
As� schools� are� squeezed� by� operational� cost-cutting,� many� schools�are� looking� to� save�money�by� reducing�energy�use.� �Not�only� does�reducing�energy�use�save�money�for�school�districts,�it�can�provide�an�opportunity�to�integrate�energy�savings�into�classroom�curriculum.�
BenchmarkingKnowing�how�much�energy�your�school�is�using�(measured�in�kBtu/sf�yr)� is� the�first�step�in�an�energy�savings�program.��The�“average”�for�Houston’s�climate�zone�in�a�school�designed�to�meet�code�is�62�kBtu/sf�yr.��While�there�are�consulting�engineering�firms�that�can�provide�this�analysis,�school�staff�can�utilize�the�Environmental�Protection�Agency’s�ENERGY�STAR��program�and�enter�data�into�the�“Target�Finder.”��This�will�provide�a�snapshot�of�the�school’s�Energy�Use�Index�(EUI)�expressed�in�kBtu/sf�yr.
The�62�kBtu/sf�yr�is�an�“average”�and�new�and�renovated�schools�are�demonstrating�energy�saving�of�50�to�75�percent�less�than�the�average,�which�translates�to�lower�energy�bills.
Low-hanging FruitInstituting�systems�and�controls�to�reduce�energy�use�doesn’t�necessarily�mean�an�investment�in�lots�of�expensive�equipment.��Many�local�school�boards�are�considering�formal�policies�to�reduce�the�use�of�personal�refrigerators,�coffee�pots�and�space�heaters�in�the�classrooms.��While�these�appliances�seem�innocuous�as�far�as�energy�use,�when�multiplied�by�several�classrooms�in�several�schools,�they�can�produce�a�noticeable�increase�in�energy�use.��
Setting�up�computers�on�power�strips�that�can�be�switched�off�at�the�end�of�the�day�is�another�simple�method�of�saving�energy.��Some�schools�are� involving� students� in� “energy”� teams�where� students� ensure� that�classroom�lights�and�computers�are�turned�off�at�the�end�of�the�day.
Controls and Occupancy SensorsMore�districts�are�taking�away�user�space�temperature�adjustments�and�maintaining� complete� control� at� a� central� level.� � The� schools’� have�specific�set�points�for�heating�and�cooling.��Building�occupants�can’t�switch�to�cooling�in�the�winter�or�heating�in�the�summer�to�adjust�room�temperature.
Room�occupancy�sensors�are�being�tied�into�the�building�automation�system�(BAS).��When�a�room�goes�unoccupied�(for�lunch�or�other�school�activity)�during�a�normally�occupied�period,�the�classroom�occupancy�sensor� is� used� to� detect� the� condition� and� the� room� temperature� is�automatically� set�up� two� to� four�degrees.� �When�motion� is�detected�in�the�room,�the�space�temperature�is�set�back�to�its�normal�occupied�temperature.
In�the�past,�IT�departments�have�discouraged�shutting�down�computers�because� they� lose� the� ability� to� remotely� update� software.� � Now,�new� software�exists� that� allows� the�district� to�manage�updates�when�computers�are�being�operated.
TRENDS IN ENERGY SAVINGS IN HOUSTON-AREA SCHOOLSBY: MARK SEIBERT, CMTA CONSULTING ENGINEERS
S U M M E R B U L L E T I N • J U N E 2 0 1 2
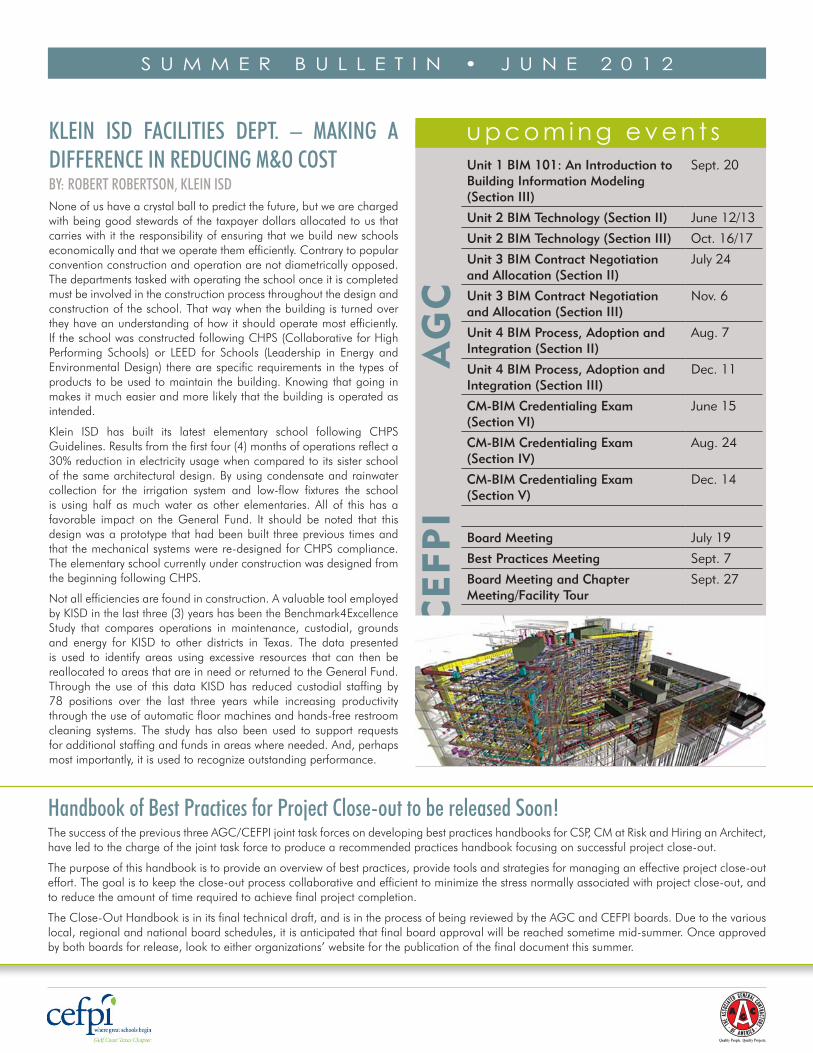
KLEIN ISD FACILITIES DEPT. – MAKING A DIFFERENCE IN REDUCING M&O COSTBY: ROBERT ROBERTSON, KLEIN ISDNone�of�us�have�a�crystal�ball�to�predict�the�future,�but�we�are�charged�with�being�good�stewards�of�the�taxpayer�dollars�allocated�to�us�that�carries�with�it�the�responsibility�of�ensuring�that�we�build�new�schools�economically�and�that�we�operate�them�efficiently.�Contrary�to�popular�convention�construction�and�operation�are�not�diametrically�opposed.�The�departments�tasked�with�operating�the�school�once�it�is�completed�must�be�involved�in�the�construction�process�throughout�the�design�and�construction�of�the�school.�That�way�when�the�building�is�turned�over�they�have�an�understanding�of�how�it�should�operate�most�efficiently.�If�the�school�was�constructed�following�CHPS�(Collaborative�for�High�Performing� Schools)� or� LEED� for� Schools� (Leadership� in� Energy� and�Environmental�Design)� there�are�specific�requirements� in� the�types�of�products� to�be�used�to�maintain� the�building.�Knowing�that�going� in�makes�it�much�easier�and�more�likely�that�the�building�is�operated�as�intended.
Klein� ISD� has� built� its� latest� elementary� school� following� CHPS�Guidelines.�Results�from�the�first�four�(4)�months�of�operations�reflect�a�30%�reduction�in�electricity�usage�when�compared�to�its�sister�school�of� the�same�architectural�design.�By�using�condensate�and�rainwater�collection� for� the� irrigation� system� and� low-flow� fixtures� the� school�is� using� half� as�much�water� as� other� elementaries.� All� of� this� has� a�favorable� impact� on� the�General� Fund.� It� should� be� noted� that� this�design�was�a�prototype�that�had�been�built� three�previous�times�and�that�the�mechanical�systems�were�re-designed�for�CHPS�compliance.�The�elementary�school�currently�under�construction�was�designed�from�the�beginning�following�CHPS.
Not�all�efficiencies�are�found�in�construction.�A�valuable�tool�employed�by�KISD�in�the�last�three�(3)�years�has�been�the�Benchmark4Excellence�Study� that� compares� operations� in�maintenance,� custodial,� grounds�and� energy� for� KISD� to� other� districts� in� Texas.� The� data� presented�is� used� to� identify� areas� using� excessive� resources� that� can� then� be�reallocated�to�areas�that�are�in�need�or�returned�to�the�General�Fund.�Through� the�use�of� this�data�KISD�has� reduced�custodial� staffing�by�78� positions� over� the� last� three� years� while� increasing� productivity�through�the�use�of�automatic�floor�machines�and�hands-free�restroom�cleaning� systems.� The� study�has�also�been�used� to� support� requests�for�additional�staffing�and�funds�in�areas�where�needed.�And,�perhaps�most�importantly,�it�is�used�to�recognize�outstanding�performance.
Handbook of Best Practices for Project Close-out to be released Soon!The�success�of�the�previous�three�AGC/CEFPI�joint�task�forces�on�developing�best�practices�handbooks�for�CSP,�CM�at�Risk�and�Hiring�an�Architect,�have�led�to�the�charge�of�the�joint�task�force�to�produce�a�recommended�practices�handbook�focusing�on�successful�project�close-out.�
The�purpose�of�this�handbook�is�to�provide�an�overview�of�best�practices,�provide�tools�and�strategies�for�managing�an�effective�project�close-out�effort.�The�goal�is�to�keep�the�close-out�process�collaborative�and�efficient�to�minimize�the�stress�normally�associated�with�project�close-out,�and�to�reduce�the�amount�of�time�required�to�achieve�final�project�completion.
The�Close-Out�Handbook�is�in�its�final�technical�draft,�and�is�in�the�process�of�being�reviewed�by�the�AGC�and�CEFPI�boards.�Due�to�the�various�local,�regional�and�national�board�schedules,�it�is�anticipated�that�final�board�approval�will�be�reached�sometime�mid-summer.�Once�approved�by�both�boards�for�release,�look�to�either�organizations’�website�for�the�publication�of�the�final�document�this�summer.
u p c o m i n g e v e n t s
CEFPI
AGC
Unit 1 BIM 101: An Introduction to Building Information Modeling (Section III)
Sept. 20
Unit 2 BIM Technology (Section II) June 12/13
Unit 2 BIM Technology (Section III) Oct. 16/17
Unit 3 BIM Contract Negotiation and Allocation (Section II)
July 24
Unit 3 BIM Contract Negotiation and Allocation (Section III)
Nov. 6
Unit 4 BIM Process, Adoption and Integration (Section II)
Aug. 7
Unit 4 BIM Process, Adoption and Integration (Section III)
Dec. 11
CM-BIM Credentialing Exam (Section VI)
June 15
CM-BIM Credentialing Exam (Section IV)
Aug. 24
CM-BIM Credentialing Exam (Section V)
Dec. 14
Board Meeting July 19
Best Practices Meeting Sept. 7
Board Meeting and Chapter Meeting/Facility Tour
Sept. 27
Related Documents