School Construction A Local Snapshot GREATER HOUSTON BULLETIN FEBRUARY 2017 Looking Back: Two Construcon Cost Trends Clearly Emerged Last Year Recent Cost Impacts On Bond Budgets And Potenal Future Impacts Specialty Contractor Surveys & Trends 2016 Cost Ranges, Average Costs & Future Projecons Design Profession Issues Survey Naonal Construcon Market Trends Construcon Funding Data Houston Housing Indicators City Of Houston Building Permits Construcon Starts K-12 Construcon Issues In The 2017 Texas Legislave Session School Finance Update Potenal Immigraon Legislave Effects On K-12 Construcon Labor Costs 2016 K-12 School Bonds Elecon Results Flexible Furniture - Rising Costs Square Foot Cost Increase Trends Highest Growth School Districts In The Houston Area Projected New Homes And Mulfamily Units Over Next 10 Years Housing Starts In School Districts 2014-2016 The New State Energy Code And Its Impact On School Construcon AGC Houston/A4LE Commiee Members 1 3 4 5 6 7 A publication of AGC Houston and the Gulf Coast Chapter A4LE Table of Contents 8 9 10 11 13 12 14

Welcome message from author
This document is posted to help you gain knowledge. Please leave a comment to let me know what you think about it! Share it to your friends and learn new things together.
Transcript

School Construction
A Local SnapshotGREATER HOUSTON BULLETINFEBRUARY 2017
Looking Back: Two Construction Cost Trends Clearly Emerged Last Year Recent Cost Impacts On Bond Budgets And Potential Future Impacts
Specialty Contractor Surveys & Trends
2016 Cost Ranges, Average Costs & Future ProjectionsDesign Profession Issues SurveyNational Construction Market TrendsConstruction Funding Data
Houston Housing IndicatorsCity Of Houston Building PermitsConstruction Starts
K-12 Construction Issues In The 2017 Texas Legislative Session
School Finance Update
Potential Immigration Legislative Effects On K-12 Construction Labor Costs
2016 K-12 School Bonds Election Results
Flexible Furniture - Rising CostsSquare Foot Cost Increase Trends
Highest Growth School Districts In The Houston Area
Projected New Homes And Multifamily Units Over Next 10 YearsHousing Starts In School Districts 2014-2016
The New State Energy Code And Its Impact On School Construction
AGC Houston/A4LE Committee Members
1
3
4
5
6
7
A publication of AGC Houston and the Gulf Coast Chapter A4LE
Table of Contents
8
9
10
11
13
12
14
Two construction cost trends clearly emerged last year
2016 was a surprising year for costs. As projected last year by the AGC/A4LE
forecasts, the rate of cost increases tempered by the third and fourth quarters.
Subcontractor prices for trades required early in the project lifecycle ( i.e., dirt, utilities) varied greatly as some subcontractors in early cycle trades who were overly dependent on office construction began to panic, while others remained secure in significant existing workloads. This affect began to ripple through
all the trades and to the General Contractor pricing. Most significantly, two trends clearly emerged in
2016. One was contractors who had overloaded on projects began to work their order book down to a more manageable level and this began to be reflected in costs.
Second, General Contractors began to participate more actively in projects where they have the capability to advance plan their future staff assignments and less actively in projects requiring immediate staffing.
By Bob Richardson, Durotech, Inc.
AGC Houston & Gulf Coast A4LE SPRING 20171
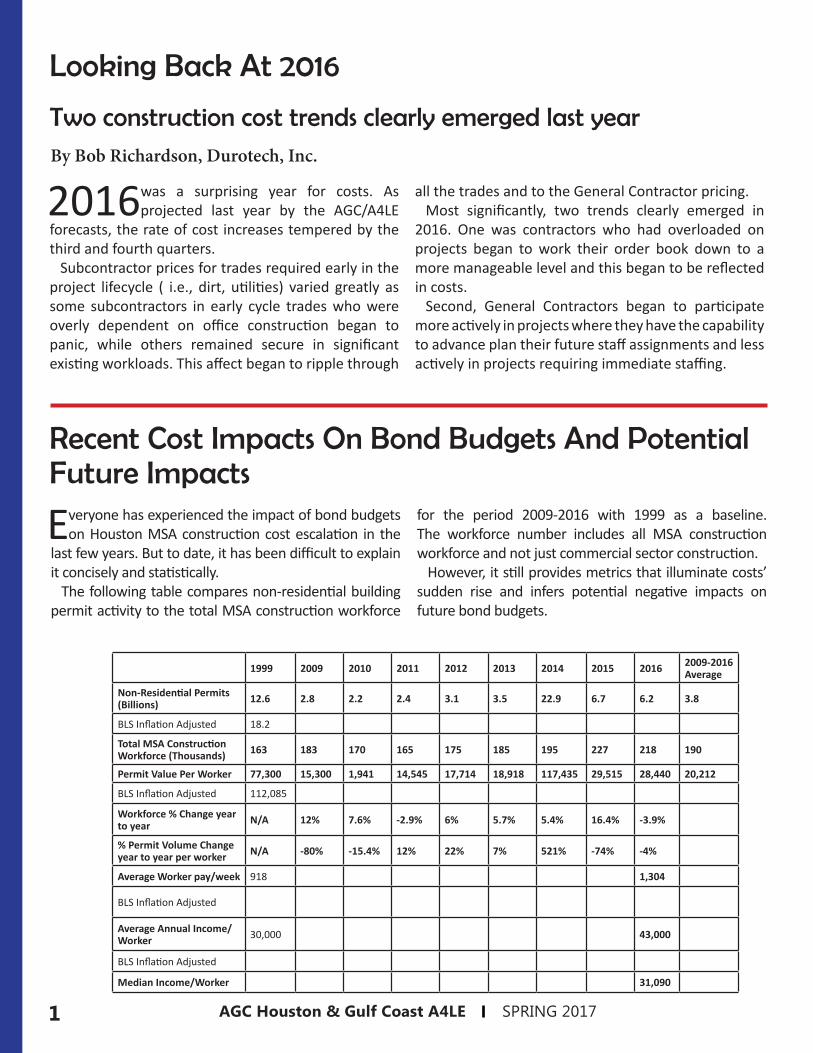
Everyone has experienced the impact of bond budgets on Houston MSA construction cost escalation in the
last few years. But to date, it has been difficult to explain it concisely and statistically.
The following table compares non-residential building permit activity to the total MSA construction workforce
for the period 2009-2016 with 1999 as a baseline. The workforce number includes all MSA construction workforce and not just commercial sector construction.
However, it still provides metrics that illuminate costs’ sudden rise and infers potential negative impacts on future bond budgets.
1999 2009 2010 2011 2012 2013 2014 2015 2016 2009-2016 Average
Non-Residential Permits (Billions) 12.6 2.8 2.2 2.4 3.1 3.5 22.9 6.7 6.2 3.8
BLS Inflation Adjusted 18.2
Total MSA Construction Workforce (Thousands) 163 183 170 165 175 185 195 227 218 190
Permit Value Per Worker 77,300 15,300 1,941 14,545 17,714 18,918 117,435 29,515 28,440 20,212
BLS Inflation Adjusted 112,085
Workforce % Change year to year N/A 12% 7.6% -2.9% 6% 5.7% 5.4% 16.4% -3.9%
% Permit Volume Change year to year per worker N/A -80% -15.4% 12% 22% 7% 521% -74% -4%
Average Worker pay/week 918 1,304
BLS Inflation Adjusted
Average Annual Income/Worker 30,000 43,000
BLS Inflation Adjusted
Median Income/Worker 31,090
Recent Cost Impacts On Bond Budgets And Potential Future Impacts
Looking Back At 2016

2AGC Houston & Gulf Coast A4LE SPRING 2017
It is worthwhile to recap what happened in the years shown on the previous table.
The 2008 financial crisis impact was registered in the construction market in 2009, and 2010.
This is not unusual since it takes several years (12-36 months) to complete projects as reflected in the 2009 workforce capacity increase when the tran-sient workforce immigrated as backlog from prior years was worked off. The transient nature of the construction workforce is also shown in 2010-11 as workers exited the industry or the MSA.
Workforce growth trailed permit volume and in years 2011-14 significantly trailed work volume increases per worker. This indicates a tightening workforce supply.
In 2013 a significant amount of private sector work was in design and CMAR preconstruction. Nothing historically prepared Districts, design firms, or con-tractors to anticipate the unprecedented amount of work and its impact on the cost structure.
In the years 2014-16, local design and construction industry ability to produce work nearly collapsed as volume increased by an incredible 521%. Workforce capacity only grew at 5%. This resulted in cost prediction and control difficulty. The labor shortage created bidding wars for personnel from field laborers through senior management officers and a surge in wage rates.
2015 local labor workforce increased by 16.4%, even though new work fell by 74%. This is because large projects take several years to complete. From 2014 to 2015, Houston MSA new commer-cial work volume fell by $16 billion and design and construction firms were still busy due to backlog.
1999 is a key benchmark. In 1999, the design/construction industry volume was such that local industry was close to an overload, similar to 2014-16. However, the workforce was better trained. Comparing 1999 to 2014-15 and the size of the 1999 to 2009-16 workforce clearly demonstrates a significant loss of productivity in local industry skilled trades since 1999.
1
2
3
4
5
1 The recent difficulties in containing cost in some bond issues are due to an economic incident aberrational
to a workforce generation, not to inadequate budgeting by design teams, District facility professionals, or CMAR’s. This event appears to occur in Houston in 15+/- year cycles (1981-83; 1998-99; 2014-15) related to upstream oil and gas activity and it’s 7+/- year cyclicity. Comparing the 1999 inflation adjusted permit volume per worker to the same statistics in 2014-15 and to the total workforce size differential show a serious drop in skilled trades capacity.
2 The ability to ameliorate the skilled trades shortage is not going to be solved only by CTE’s at secondary
and post-secondary levels.
The median and annual income worker statistics show wages have failed to provide sufficient attraction for new personnel. By way of contrast 2016-17 union journeyman carpenter wages in Chicago are $45.35 per straight time hour ($1,824 per week or $95,000 annually) plus additional paid hourly fringes of $30.47 per hour. This type of gap explains the migratory nature of some construction labor.
3 The trends noted here can also affect design professions. That impact translates into cost
consequences for Owners. Design professions are impacted by the same labor/cost issues as the construction trades. Reduced fees and rising technology costs have stressed many firms.
Several conclusions can be drawn from these statistics on why some bond issues have not been able to contain costs.
3 AGC Houston & Gulf Coast A4LE SPRING 2017
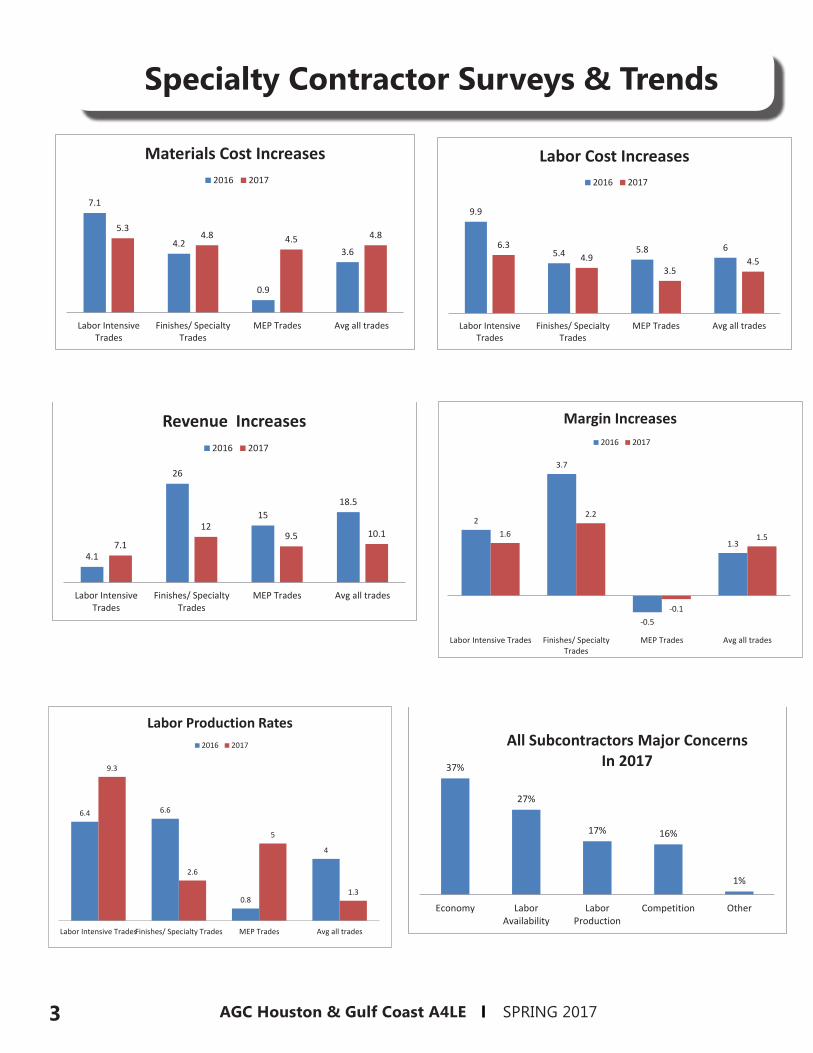
9.9
5.4 5.8 6 6.3 4.9
3.5 4.5
Labor IntensiveTrades
Finishes/ SpecialtyTrades
MEP Trades Avg all trades
Labor Cost Increases 2016 2017
7.1
4.2
0.9
3.6
5.3 4.8 4.5 4.8
Labor IntensiveTrades
Finishes/ SpecialtyTrades
MEP Trades Avg all trades
Materials Cost Increases 2016 2017
4.1
26
15 18.5
7.1
12 9.5 10.1
Labor IntensiveTrades
Finishes/ SpecialtyTrades
MEP Trades Avg all trades
Revenue Increases 2016 2017
2
3.7
-0.5
1.3 1.6
2.2
-0.1
1.5
Labor Intensive Trades Finishes/ SpecialtyTrades
MEP Trades Avg all trades
Margin Increases 2016 2017
6.4 6.6
0.8
4
9.3
2.6
5
1.3
Labor Intensive TradesFinishes/ Specialty Trades MEP Trades Avg all trades
Labor Production Rates 2016 2017
Specialty Contractor Surveys & Trends
37%
27%
17% 16%
1%
Economy LaborAvailability
LaborProduction
Competition Other
All Subcontractors Major Concerns In 2017

4AGC Houston & Gulf Coast A4LE SPRING 2017
National Construction Market Trends• High end apartments overbuilt (nationally and locally).
• National Industrial Real Estate is breaking records for construction and high occupancy.
• New types of industrial buildings are appearing (2 story warehouse due to land costs; 40 foot clear height due to land costs and high racking, changes in Logistics). Low vacancy will continue to drive construction.
• As of October, 2016, the national construction backlog is at a cyclical high of 8 months. Our region is 20% over national average
Local Non-Developer Construction Funding BacklogDownstream (refinery, Chemical Plant) Projects Delivered by Year
2016 2018 2019$10 billion $12 billion $4 billion
Houston Education Projects Funding in PlaceLocal School Districts 2014-16 Bonds:
$7 billion
Local Higher Education $2 billionSources: FMI Corporation, CBRE, Federal Reserve Bank of Dallas)
Construction Funding Data
2016 Cost Ranges, Average Costs & Future Projections2016 is the biggest swing in cost ranges we have seen. Typically the biggest swing is $30 per sf maximum in a school type.Due to some extreme outliers based on program and finishes, an average 2016 cost is also included.
Elementary Middle/JHS High School
2016 $169-220 $171-245 $210-253Average 2016 $195 $207 $241
2017 $200-240 $215-250 $250-276
2018 $205-259 $223-269 $255-298
Design Profession Issues Survey For the first time, in 2016 we surveyed design professionals on issues they are facing.
Dealing with cost issues: The major method of dealing with cost issue was timing delivery of product to the market and choosing delivery methods. No other issues or solutions came remotely close to the 50% response on this issue and solution.
5 AGC Houston & Gulf Coast A4LE SPRING 2017
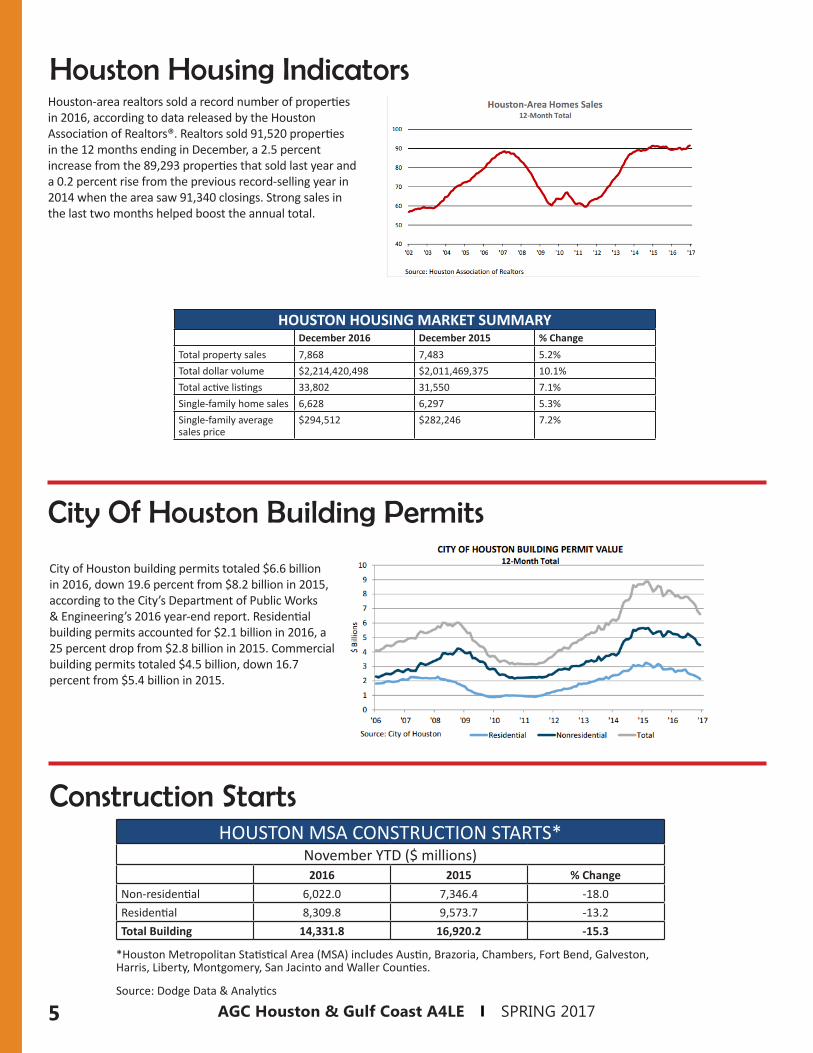
Houston-area realtors sold a record number of properties in 2016, according to data released by the Houston Association of Realtors®. Realtors sold 91,520 properties in the 12 months ending in December, a 2.5 percent increase from the 89,293 properties that sold last year and a 0.2 percent rise from the previous record-selling year in 2014 when the area saw 91,340 closings. Strong sales in the last two months helped boost the annual total.
HOUSTON HOUSING MARKET SUMMARYDecember 2016 December 2015 % Change
Total property sales 7,868 7,483 5.2%Total dollar volume $2,214,420,498 $2,011,469,375 10.1%Total active listings 33,802 31,550 7.1%Single-family home sales 6,628 6,297 5.3%Single-family average sales price
$294,512 $282,246 7.2%
Houston Housing Indicators
City Of Houston Building Permits
City of Houston building permits totaled $6.6 billion in 2016, down 19.6 percent from $8.2 billion in 2015, according to the City’s Department of Public Works & Engineering’s 2016 year-end report. Residential building permits accounted for $2.1 billion in 2016, a 25 percent drop from $2.8 billion in 2015. Commercial building permits totaled $4.5 billion, down 16.7 percent from $5.4 billion in 2015.
Construction StartsHOUSTON MSA CONSTRUCTION STARTS*
November YTD ($ millions)2016 2015 % Change
Non-residential 6,022.0 7,346.4 -18.0Residential 8,309.8 9,573.7 -13.2Total Building 14,331.8 16,920.2 -15.3
*Houston Metropolitan Statistical Area (MSA) includes Austin, Brazoria, Chambers, Fort Bend, Galveston, Harris, Liberty, Montgomery, San Jacinto and Waller Counties.
Source: Dodge Data & Analytics

AGC Houston & Gulf Coast A4LE SPRING 2017 6
1Right to repair construction defects – Legislation will be filed to address the various issues that surround construction defect claims, both for public and private projects. The legislation will require that owners give
contractors/designers notice of possible defects as identified by an independent, third-party engineer—and that contractors/designers be allowed an opportunity to repair those defects before being sued. The legislation is modeled after condo defects legislation that successfully passed into law during the 2015 Session.
2 E-verify of contractor employees – Legislation has been filed requiring those who contract with the state to E-verify employees. The legislation has been designated a priority but is currently limited to only those entities
who contract with the state.
3 Limiting contractor liability for design defects – Legislation will be filed to limit contractors’ liability for building projects to specs that were defective and that the contractor could not have known were defective.
4 Enforcement provisions for violating public procurement statutes – Through past consolidations of various procurement statutes, some have enforcement provisions for when owners violate bidding laws, others do not.
Legislation will be filed to ensure that all procurement statutes have enforcement remedies during the bidding stage, and not merely after the parties enter into a contract.
5 Shortening the statute of repose – Legislation has been filed that will shorten the period for suing for construction/design defects from 10 years to 5 years, which is more in line with surrounding states.
6 School background checks – Legislation will attempt to create more uniformity, predictability, and portability among the school districts for background checks of construction workers on school projects.
7 Uniform general conditions for local governmental entities & ISDs – State law requires the periodic convening of a statutory workgroup to craft uniform general conditions for state construction contracts. Legislation may
be filed to extend this workgroup to local governmental entities’ representatives, or to create a similar process for local governmental entities.
8 Adopting wage rates – Legislation will be filed clarifying requirements for adopting prevailing wages for construction on public works as an alternative to Davis-Bacon wage rates.
9 Contract labor on public projects – Legislation will attempt to address the “misclassification” of labor issue on public projects through the prevailing wage statute.
10 Venue and choice-of-law for Texas construction contract lawsuits – Legislation will be filed clarifying that lawsuits re: Texas construction projects must have the option of being filed in Texas and being governed by
Texas law.
By Corbin VanArsdale, AGC Texas Building Branch

AGC Houston & Gulf Coast A4LE SPRING 20177
On the school finance front, one major change from a year ago is that on May 13, 2016, the Texas Su-
preme Court issued its ruling in the state school finance lawsuit, Michael Williams, et al., vs. The Texas Taxpayer and Student Fairness Coalition, et al., which was heard by the Court on September 1, 2015, the first day of the Court’s most recent session.
The Court upheld the current school finance system as meeting minimal constitutional standards on all fronts. The key constitutional phrase referenced by the Court is, “It shall be the duty of the Legislature” in establishing policies for public education in Texas.
For the last 30 years, rulings by the Supreme Court have provided the impetus (and cover) for a number of advances in funding and programs for Texas public schools.
That will no longer be the case and the nature of the Court’s ruling will make it extremely difficult for plain-tiff groups to bring litigation forward in the future on the traditional standards of equity, adequacy or the state property tax issue that have been effective in the past.
Even the fact that the state had not prepared school finance studies every two years as required by statute in order to keep the finance system current did not influence the Court.
The disparities in tax rates for fast-growth school districts also seemed to have little impact on the Court, despite the disproportionate demand for school facili-ties in these communities.
Appropriations Both the House and Senate appropriations bills for
the 2018-19 biennium were released in the second week of the new legislative session. Based on the Comptroller’s biennial revenue estimate, the import-ant General Revenue available for this budget will total $108.5 billion for 2018-19, compared with spending of $109.9 billion for the current 2016-17 biennium.
Unfortunately, the lower starting point does not ad-dress a number on unmet needs for the next two years or pay the bills that will require supplemental appropri-
ations for the current biennium. One key factor is the new highway dedication of $4.7 billion in sales tax reve-nue for the next two years, which comes off the top.
Appropriations for Public EducationWhile the Supreme Court rejected the argument that
the school property tax functions like a state property tax, its interaction with the school funding formula system suggests otherwise.
School property value growth is expected to reduce state funding obligations by $3.6 billion over the next biennium. Recapture costs paid to the state by high-wealth school districts are expected to increase by $1.1 billion (all paid from local property taxes), totaling $4.6 billion for the two-year budget period.
Both the House and Senate fund enrollment growth of an expected 80,000 – 83,000 new students per year for a biennial cost of $2.7 billion. Several formula items already on the books are expected to cost an additional $1.5 billion for the biennium.
The General Revenue Fund appropriation for the Foundation School Program is $36.2 billion in the Senate budget, down by $1.4 billion from the current biennium. The House budget is slightly above the $37.7 billion appropriation for the current biennium. One unique aspect of the House budget is that it includes a contingency appropriation of $1.47 billion, (all paid from local property taxes), totaling $4.6 billion for the two-year budget period.
Both the House and Senate fund enrollment growth of an expected 80,000 – 83,000 new students per year for a biennial cost of $2.7 billion. Several formula items already on the books are expected to cost an additional $1.5 billion for the biennium.
The General Revenue Fund appropriation for the Foundation School Program is $36.2 billion in the Senate budget, down by $1.4 billion from the current
By Dan Casey, Moak, Casey & Associates
School Finance Update

AGC Houston & Gulf Coast A4LE SPRING 2017 8
By Bob Richardson, Durotech, Inc.
Potential Immigration Legislation EffectsOn K-12 Construction Labor Costs
Demographic and skills set trends in K-12 construction labor productivity and their cost effect
are sometimes mentioned, but their direct economic impact is not often apparent.
An aging skilled workforce is not being replaced by trained, skilled tradesmen. Wages are not increasing at a cost of living balanced rate to attract sufficient replacements. And programs that progressively hone craft skills along with on the job field mentoring in preparation for field work careers are seldom available. Missing from this dialogue is consideration of legislative actions. A new administration in Washington, D.C. may change that discussion.
Legislatures have long ignored very large blocks of undocumented workers who are not paying any money into the federal income tax system. Those workers are heavily distributed in construction and service industries.
However, the new administration has focused attention on illegal workers and may create conditions that solve illegal worker issues, but which raise construction costs for owners.
If the Trump administration negotiates an agreement with Mexico where illegal workers become documented guest workers who pay U.S. federal and state taxes (a “wall” against illegal immigration) open shop construction wages will rise as a result. Under
such a system, non-resident workers – concentrated now in the Southwest – will also then become transitory across the U.S as long as they have a valid driver’s license and tax certificate. This will distribute non-resident construction workers across more states than present.
Any such distribution will constrict parts of our regional construction labor supply and raise regional wage rates, affecting K-12 construction costs.
Conversely, any legislation that effectively curtails
the current widespread use of illegal workers through deportation or immigration controls will also contract the labor supply, and wage rates will have to rise due to a similar displacement in labor market supply and demand. Should either case come to pass, construction labor costs are likely to rise.
School Finance Update Continued
biennium. The House budget is slightly above the $37.7 billion appropriation for the current biennium. One unique aspect of the House budget is that it includes a contingency appropriation of $1.47 billion, triggered by new legislation that improves equity, reduces recapture and increases the state share of funding for the Foun-dation School Program.
In terms of funding for school facilities, neither bud-get reflects improvements under current law. Funding for the current equalized facilities programs (IFA and EDA) decreases by $366 million to $1.1 billion for the
biennium, driven down by the anticipated increases in local property values that feed into these calculations. The $55 million awarded for additional IFA increases in 2017 is not renewed under these budgets. School districts would continue to receive $23.75 million per year for new campus start-up costs.
It is expected to be a difficult year in terms of state funding and school choice programs are expected dom-inate much of the discussion in the coming months. Education is a major state responsibility and will contin-ue to be a major topic of debate in the coming months.
AGC Houston & Gulf Coast A4LE SPRING 20179
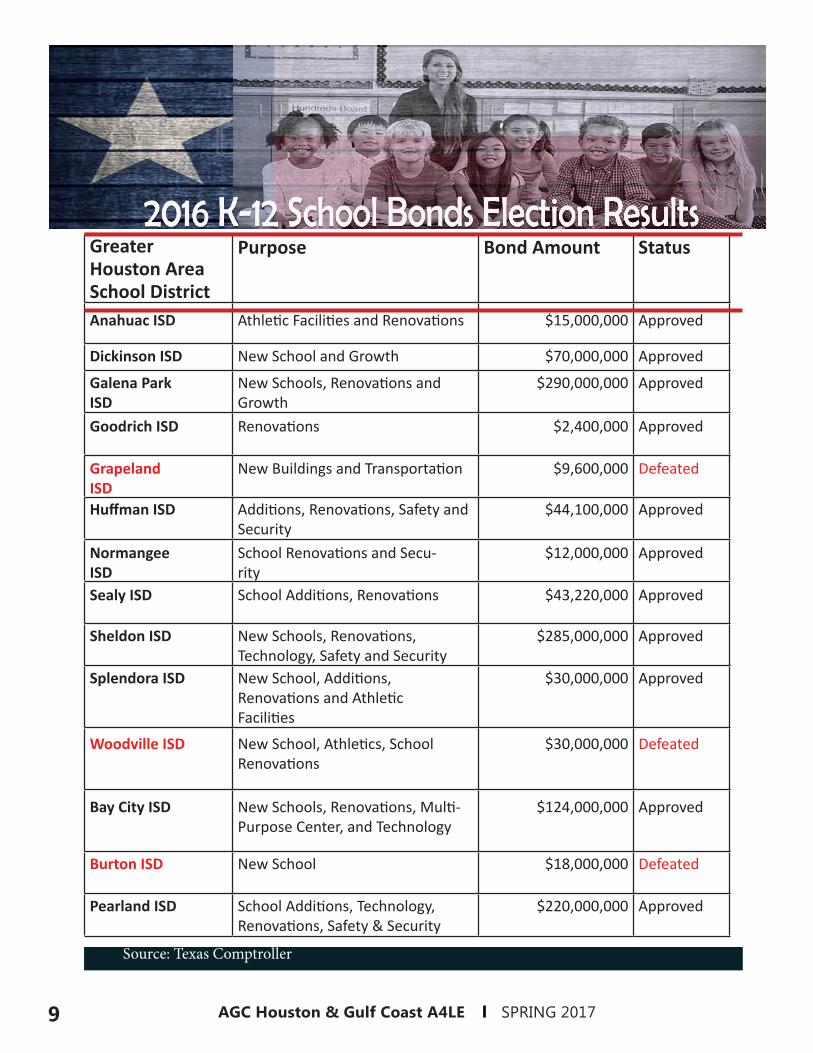
Greater Houston Area School District
Purpose Bond Amount Status
Anahuac ISD Athletic Facilities and Renovations
$15,000,000 Approved
Dickinson ISD New School and Growth $70,000,000 Approved
Galena Park ISD
New Schools, Renovations and Growth
$290,000,000 Approved
Goodrich ISD
Renovations $2,400,000 Approved
Grapeland ISD
New Buildings and Transportation $9,600,000 Defeated
Huffman ISD
Additions, Renovations, Safety and Security
$44,100,000 Approved
Normangee ISD
School Renovations and Secu-rity
$12,000,000 Approved
Sealy ISD
School Additions, Renovations $43,220,000 Approved
Sheldon ISD
New Schools, Renovations, Technology, Safety and Security
$285,000,000 Approved
Splendora ISD
New School, Additions, Renovations and Athletic Facilities
$30,000,000 Approved
Woodville ISD New School, Athletics, School Renovations
$30,000,000 Defeated
Bay City ISD New Schools, Renovations, Multi-Purpose Center, and Technology
$124,000,000 Approved
Burton ISD
New School $18,000,000 Defeated
Pearland ISD
School Additions, Technology, Renovations, Safety & Security
$220,000,000 Approved
Source: Texas Comptroller

AGC Houston & Gulf Coast A4LE SPRING 2017 10
By Steve Aloway, Huckabee
Flexible Furniture – Rising Costs
Demographic and skills set trends in K-12 flexibili-ty, adaptability and collaboration are influencing
school design and furniture selection. To meet the needs of 21st century learning spaces, schools are us-ing a more diverse catalog of furniture.
Soft seating, tilt-top tables, writable surfaces, mov-able and interchangeable desks, charging stations and flexible storage options are becoming more common-place. Schools are also looking to collegiate and profes-sional environments to inspire design choices, creating spaces that are adaptable to multi-purpose uses.
As a result of these changes, many school districts are choosing to increase their FFE budgets. From a numbers perspective, furniture budgets for traditional learning environments average $800 per student. The integration of collaborative and flexible options run around $1,200 per student, while highly innovative and adaptable spac-es reach up to $1,500 per student or more.
The primary drivers of this increase include: 1. Inclusion of more collaborative learning space2. Focus on adaptability and flexibility3. Mobile storage versus stationary casework
Collaborative learning spaceOur schools have evolved into collaborative learn-
ing hubs. School districts are including small and
large group instructional space outside of the class-room—from learning nooks and learning commons to multi-purpose libraries that feature STEM labs, maker spaces and meeting rooms. Traditional wood tables and chairs are minimized, making room for soft seating, counter-height tables and writable surfaces.
Schools are also taking cues from higher education and professional environments, offering students va-riety in seating. Cafeterias and student unions feature traditional lunch tables as well as modular furniture, coffee bars and bistro-style gathering spaces.
Adaptability and flexibilityThe 21st century classroom supports different types
of instruction—from teacher focused and teacher as facilitator to peer-to-peer engagement. Adaptable and durable features allow desks and chairs to move quickly into a variety of instructional settings.
Mobile storage versus stationary caseworkDynamic scheduling and the immergence of central
teacher planning spaces require more mobile storage options and less stationary casework. Cost for linear sf of casework can be re-purposed into more resourceful mobile storage options that allow teachers to move from classroom to classroom quickly and efficiently.
By Christopher Fields, Heery International, Inc.
Square Foot Cost Increase Trends
It comes as no surprise that square footage costs for schools have more than doubled
over the last 10 years. Estimates show that in most cases, increases total 50-75%. However, the simple material and labor rate increases the industry has endured are not the only reasons for the steady incline. Educational facility designs have changed significantly over the past decade.
3
2
Examples and factors include:
The majority of school districts, both locally and national-ly, have begun approving educational facility designs with 25% more cubic footage (volume) than designed just 10 years ago.
Educational facilities have experienced an increase in their linear (perimeter) footage by 80% since 2007 to accomodate the same square footage.
The percentage of glass and glazing systems used on a high school has increased by 266% over the last 10 years, and 305% on elementary schools.
The average floor-to-deck height has gone from 12’ to 15’ over the past decade. 4
1
AGC Houston & Gulf Coast A4LE SPRING 201711
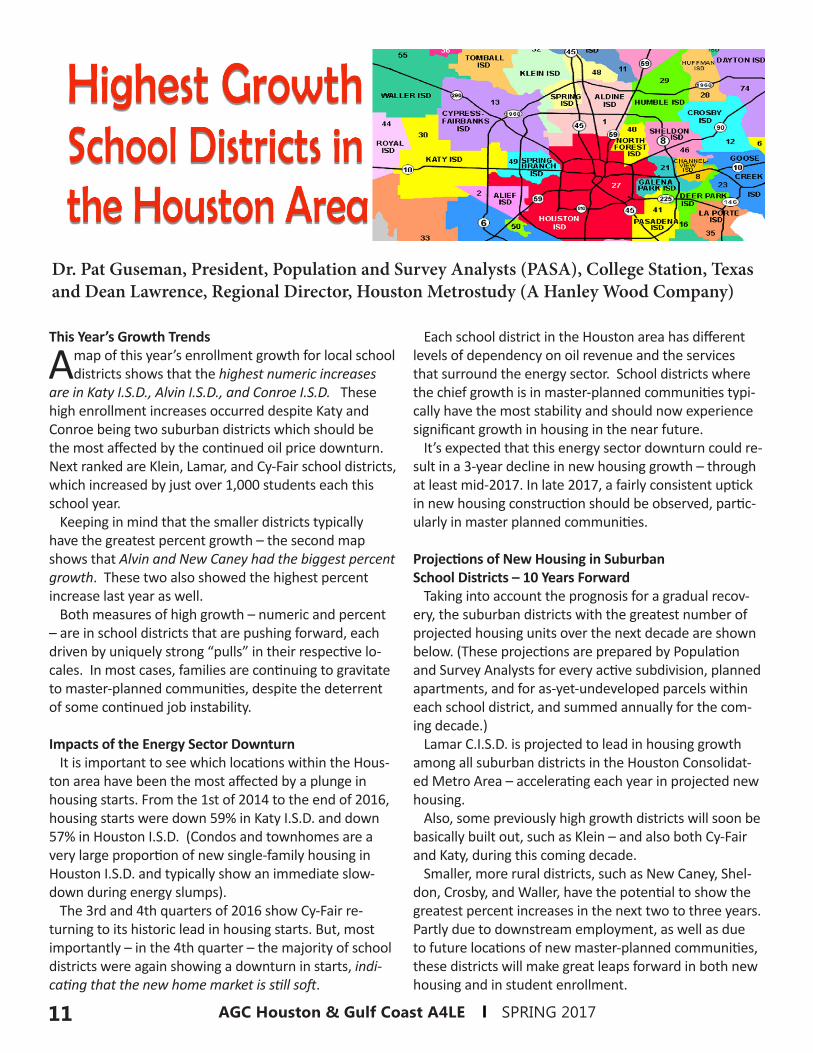
Dr. Pat Guseman, President, Population and Survey Analysts (PASA), College Station, Texasand Dean Lawrence, Regional Director, Houston Metrostudy (A Hanley Wood Company)
This Year’s Growth Trends
A map of this year’s enrollment growth for local school districts shows that the highest numeric increases
are in Katy I.S.D., Alvin I.S.D., and Conroe I.S.D. These high enrollment increases occurred despite Katy and Conroe being two suburban districts which should be the most affected by the continued oil price downturn. Next ranked are Klein, Lamar, and Cy-Fair school districts, which increased by just over 1,000 students each this school year.
Keeping in mind that the smaller districts typically have the greatest percent growth – the second map shows that Alvin and New Caney had the biggest percent growth. These two also showed the highest percent increase last year as well.
Both measures of high growth – numeric and percent – are in school districts that are pushing forward, each driven by uniquely strong “pulls” in their respective lo-cales. In most cases, families are continuing to gravitate to master-planned communities, despite the deterrent of some continued job instability.
Impacts of the Energy Sector DownturnIt is important to see which locations within the Hous-
ton area have been the most affected by a plunge in housing starts. From the 1st of 2014 to the end of 2016, housing starts were down 59% in Katy I.S.D. and down 57% in Houston I.S.D. (Condos and townhomes are a very large proportion of new single-family housing in Houston I.S.D. and typically show an immediate slow-down during energy slumps).
The 3rd and 4th quarters of 2016 show Cy-Fair re-turning to its historic lead in housing starts. But, most importantly – in the 4th quarter – the majority of school districts were again showing a downturn in starts, indi-cating that the new home market is still soft.
Each school district in the Houston area has different levels of dependency on oil revenue and the services that surround the energy sector. School districts where the chief growth is in master-planned communities typi-cally have the most stability and should now experience significant growth in housing in the near future.
It’s expected that this energy sector downturn could re-sult in a 3-year decline in new housing growth – through at least mid-2017. In late 2017, a fairly consistent uptick in new housing construction should be observed, partic-ularly in master planned communities.
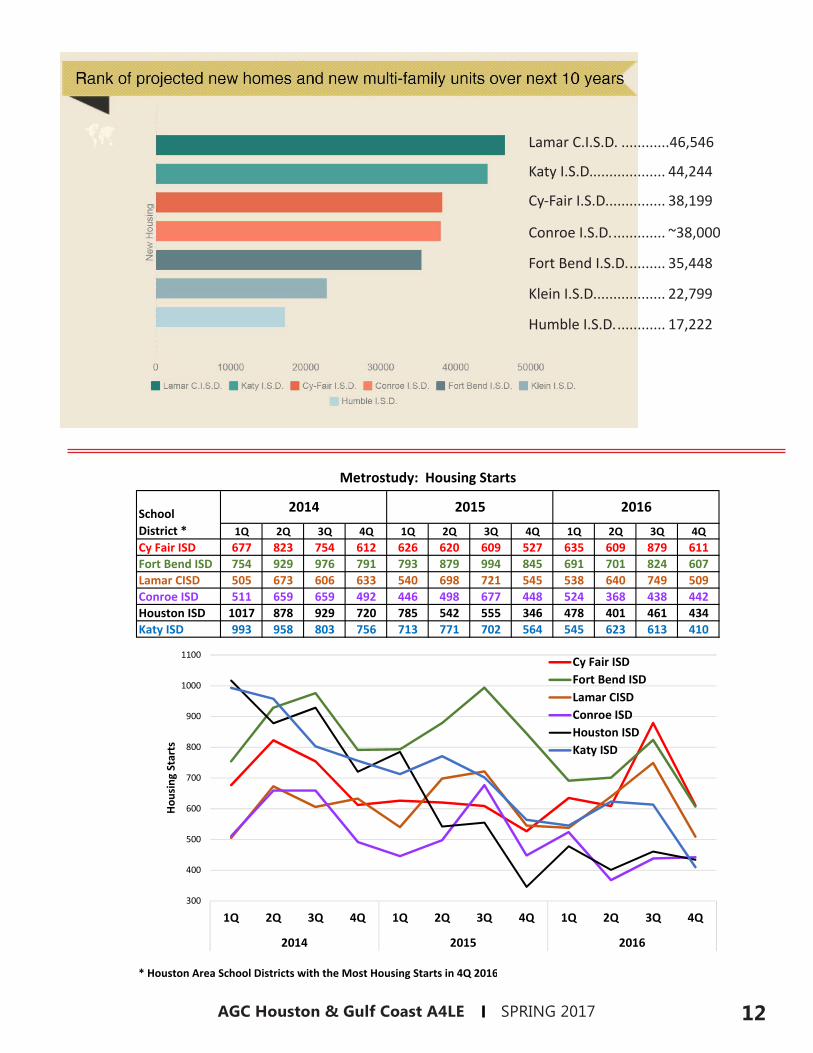
Projections of New Housing in SuburbanSchool Districts – 10 Years Forward
Taking into account the prognosis for a gradual recov-ery, the suburban districts with the greatest number of projected housing units over the next decade are shown below. (These projections are prepared by Population and Survey Analysts for every active subdivision, planned apartments, and for as-yet-undeveloped parcels within each school district, and summed annually for the com-ing decade.)
Lamar C.I.S.D. is projected to lead in housing growth among all suburban districts in the Houston Consolidat-ed Metro Area – accelerating each year in projected new housing.
Also, some previously high growth districts will soon be basically built out, such as Klein – and also both Cy-Fair and Katy, during this coming decade.
Smaller, more rural districts, such as New Caney, Shel-don, Crosby, and Waller, have the potential to show the greatest percent increases in the next two to three years. Partly due to downstream employment, as well as due to future locations of new master-planned communities, these districts will make great leaps forward in both new housing and in student enrollment.
AGC Houston & Gulf Coast A4LE SPRING 2017 12
Lamar C.I.S.D. ............46,546
Katy I.S.D................... 44,244
Cy-Fair I.S.D. .............. 38,199
Conroe I.S.D. ............. ~38,000
Fort Bend I.S.D. ......... 35,448
Klein I.S.D. ................. 22,799
Humble I.S.D. ............ 17,222
1Q 2Q 3Q 4Q 1Q 2Q 3Q 4Q 1Q 2Q 3Q 4QCy Fair ISD 677 823 754 612 626 620 609 527 635 609 879 611Fort Bend ISD 754 929 976 791 793 879 994 845 691 701 824 607Lamar CISD 505 673 606 633 540 698 721 545 538 640 749 509Conroe ISD 511 659 659 492 446 498 677 448 524 368 438 442Houston ISD 1017 878 929 720 785 542 555 346 478 401 461 434Katy ISD 993 958 803 756 713 771 702 564 545 623 613 410
* Houston Area School Districts with the Most Housing Starts in 4Q 2016
2014 2015 2016School District *
Metrostudy: Housing Starts
300
400
500
600
700
800
900
1000
1100
1Q 2Q 3Q 4Q 1Q 2Q 3Q 4Q 1Q 2Q 3Q 4Q
2014 2015 2016
Housing Starts
Cy Fair ISDFort Bend ISDLamar CISDConroe ISDHouston ISDKaty ISD
AGC Houston & Gulf Coast A4LE SPRING 201713
In an effort to continually reduce energy consumption in buildings, the State of Texas has adopted the 2015 International Energy Conservation Code (IECC). The new state energy code was enacted as of November 1, 2016.
While the effects of the energy code changes are being experienced by all areas of new design and construction, the K-12 and other public entity bond referendums are of the most heavily impacted.
School construction bond scopes and budgets are established and approved by voter’s years prior to the design and construction phases commencing. Although countless efforts are made to predict the
consequences these items would have should new codes be adopted, many of the code changes included in the new state energy code could not be predicted or accounted for due to the vast differences between it and the past version of the energy code (2009 IECC).
While there are changes to all building components in the new state energy code, the Mechanical and Electrical code changes appear to have the greatest influence on new building construction and design budgets.
An example of a change between the past state energy code and the new energy code, that has sizable cost implications, is the requirements to utilize a lighting control system which includes automatic daylight harvesting and the use of vacancy sensors.
Another item presenting a budgetary challenge is the addition of commissioning and functional testing on all
HVAC systems, HVAC and service water heating control systems. The code indicates commissioning is required on buildings with a mechanical cooling capacity larger than 480,000 Btu/h (40 tons) and 600,000 Btu/h total water heating and building heating capacity. The 2015 IECC changes the occupant density from 40 people per 1,000 square feet to 25 people per 1,000 square foot on the Demand Control Ventilation section. The new description will now encompass all classrooms unless one of the few exceptions apply.
Furthermore, the explanation of when Energy Recovery Ventilation (ERV) systems are valid have been further refined and now includes a chart that
dictates the specific air handler size and outside air percentages when and ERV must be employed. The last major mechanical cost impacting item, is the energy efficiency of the equipment being specified. For example, a 150-ton air cooled chiller in the 2009 IEEC must have a full load efficiency of 9.56 EER and a part load efficiency of 12.75 EER. The 2015 IECC requires that same 150-ton chiller have a full load efficiency of 10.10 EER and a part load efficiency of 14.00 EER.
The increase of efficiency in this example amounts to approximately a 6% increase on the full load and a 10% increase on the part load. In addition, there are numerous building envelope items that must be accounted for, including but not limited to, insulation R-values of new roof systems.
The challenge this presents is the elevation of the roof compared to roof mounted equipment, parapets,
By Sean Holder, Salas O’Brien and Dillon Brady, Cypress Fairbanks ISD
The Mechanical and Electrical code changes appear to have the greatest influence
on new building construction and design budgets.

14AGC Houston & Gulf Coast A4LE SPRING 2017
Steve Aloway Huckabee, Inc.Dillon Brady Cypress Fairbanks ISDFreddie Bustillo Gilbane Building CompanyJay Carlton Sterling Structures, Inc.Chris Fields Heery, InternationalEasy Foster Conroe ISDMark French IBI GroupCarlos Garza Balfour Beatty ConstructionMike Gordy Sterling Structures, Inc.Tom Haggerty Klein ISDTamara Hancock AGC HoustonCandace Hernandez FMI CorporationJennifer Henrikson SHW GroupGary Hutton Tomball ISDLisa Kassman Katy ISDTodd Lien VLK ArchitectsJohn Marshall Satterfield & Pontikes Construction, Inc.Jerry Nevlud AGC HoustonBob Richardson Durotech, Inc.David Rowe Durotech, Inc.Marshall Schroeder Conroe ISDEric Smith PBK ArchitectsRoy Sprague Cypress Fairbanks ISDDanny Struzick Balfour Beatty ConstructionDavid Waggoner Heery, International
AGC Houston/A4LE Committee Members
HOUSTON
access paths/doors, etc. Not to mention the weight limits on existing structures.
Now that “the sky is falling” has been established, we must understand that there are many hurdles that must first be overcome in order for these changes to be fully employed.
The Attorney General is still, at the time of writing this, deliberating on the requirements and enforcement of part and/or all of the 2015 IEEC. Once enacted, the capacity and capability of the local governmental
entities to inspect and enforce the new code will cause a dramatic cost impact to such agencies whom will also be in search of the golden ticket to fund these tasks.
In summary, we as designers, constructors, and owners should plan for the worst, but be mindful of what ultimately is the right thing to do. The more energy conservative we learn to become, the better stewards of the planet and its environment we are and thus better citizens, ultimately more money can be saved on utilities in an age of tightening budgets.
Related Documents