Rhythms of Our Coastal Waters: Yaquina Bay Touch here to begin!

Welcome message from author
This document is posted to help you gain knowledge. Please leave a comment to let me know what you think about it! Share it to your friends and learn new things together.
Transcript

Rhythms of Our Coastal Waters:Yaquina
Bay
Touch here to begin!

Welcome! Yaquina Bay, the estuary just outside, is an interesting, complex, and ever changing habitat.
My friends and I live in the Bay, and we are excited to explain this data to you and show you what a fascinating place the Bay is!
What is an estuary?
What is LOBO?
Touch here to continue
Introduction
Researchers are currently collecting data about the water in the Bay using an instrument named LOBO.

Level 1: Check out how graphs are built using salinity dataLevel 2: Explore the links
between rainfall, river flow, and salinity
Level 3: Learn how to interpret real-time salinity graphs
Level 4: Challenge your abilities with a rainfall and salinity
match-upLevel 5: Test your data sleuthing skills to explore Yaquina Bay’s
story
Are you unsure of how to understand line graphs? I would start here.
As a team, my friends and I will walk you through 5 different levels so that you can help us tell the story of Yaquina Bay.
Feel free to navigate through levels as you feel comfortable. The levels become more difficult as you progress up the food chain from Level 1 to Level 5.
Start here to look at Yaquina Bay’s current salinity.
Introduction
More info

More info pageAre you confused by a word or interested to learn more? You have come to the right place! Touch a button below to explore that topic.
Build a graph
(Level 1)
Read LOBO Graphs (Level 3)
LOBO Data Match-up(Level 4)
Test Your LOBO
Abilities(Level 5)
Interpret Graphs
(Level 2)
More info
What is an estuary?
What is PSU?
What is salinity?
How do tides affect an estuary?
What is LOBO?
About the exhibit

Howdy! I’m Mega, a crab plankton! I am going to be walking you through how salinity changes in the Bay as well as how to read salinity graphs.
Touch here to start!
Remember you will always have the home and back button if you get lost.
Use the buttons on the left to navigate to a different level at any time.
How To Build A GraphBuild A Graph
(Level 1)
Read LOBO Graphs (Level 3)
LOBO Data Match-up(Level 4)
Test Your LOBO
Abilities(Level 5)
Interpret Graphs
(Level 2)
More info
0 psu
20 psu
30 psu
40 psu
10 psu
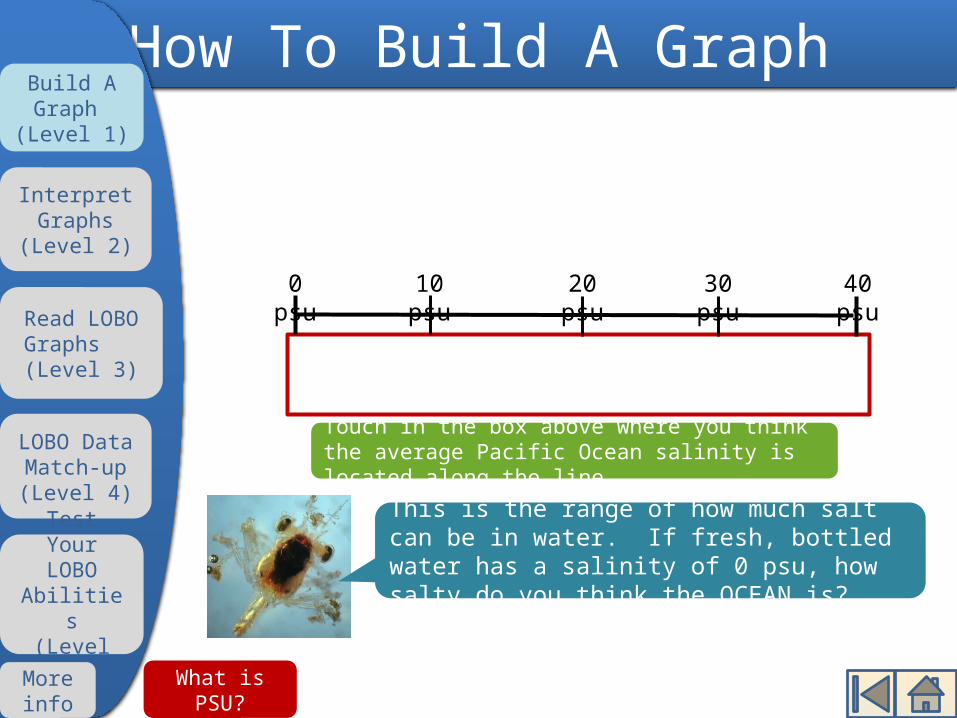
This is the range of how much salt can be in water. If fresh, bottled water has a salinity of 0 psu, how salty do you think the OCEAN is?
Touch in the box above where you think the average Pacific Ocean salinity is located along the line.
How To Build A GraphBuild A Graph
(Level 1)
Read LOBO Graphs (Level 3)
LOBO Data Match-up(Level 4)
Test Your LOBO
Abilities(Level 5)
Interpret Graphs
(Level 2)
More info
What is PSU?

How To Build A Graph
0 psu
20 psu
30 psu
40 psu
10 psu
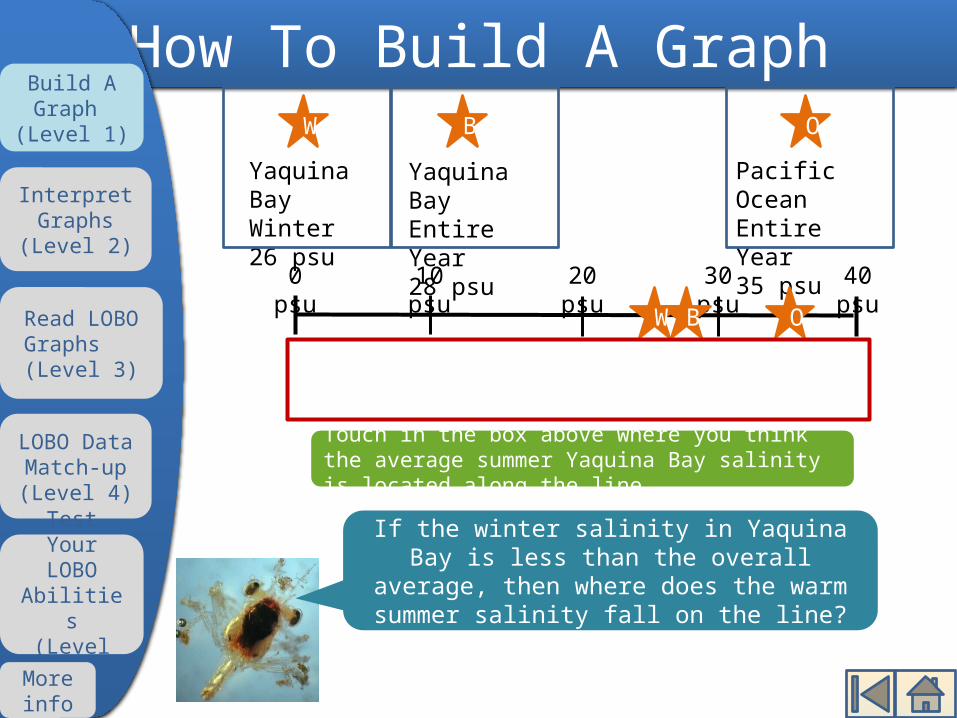
The average salinity of the Pacific Ocean is 35 psu!
Touch here to continue
Pacific OceanEntire Year35 psu
O
O
Great!
Build A Graph
(Level 1)
Read LOBO Graphs (Level 3)
LOBO Data Match-up(Level 4)
Test Your LOBO
Abilities(Level 5)
Interpret Graphs
(Level 2)
More info

0 psu
20 psu
30 psu
40 psu
10 psu
The average salinity of the Pacific Ocean is actually 35 psu!
Touch here to continue
Pacific OceanEntire Year35 psu
O
O
Not quite!
How To Build A GraphBuild A Graph
(Level 1)
Read LOBO Graphs (Level 3)
LOBO Data Match-up(Level 4)
Test Your LOBO
Abilities(Level 5)
Interpret Graphs
(Level 2)
More info

0 psu
20 psu
30 psu
40 psu
10 psu
If the salinity of the ocean is 35 psu, and Yaquina Bay is an estuary where the ocean meets fresh, river water, what do you think the average YAQUINA BAY salinity is?
Pacific OceanEntire Year35 psu
O
O
How To Build A GraphBuild A Graph
(Level 1)
Read LOBO Graphs (Level 3)
LOBO Data Match-up(Level 4)
Test Your LOBO
Abilities(Level 5)
Interpret Graphs
(Level 2)
More info
Touch in the box above where you think the average Yaquina Bay salinity is located along the line.

0 psu
20 psu
30 psu
40 psu
10 psu
The average salinity of Yaquina Bay is 28 psu!
Touch here to continue
Pacific OceanEntire Year35 psu
OBYaquina BayEntire Year28 psu
B O
Great job!
How To Build A GraphBuild A Graph
(Level 1)
Read LOBO Graphs (Level 3)
LOBO Data Match-up(Level 4)
Test Your LOBO
Abilities(Level 5)
Interpret Graphs
(Level 2)
More info

0 psu
20 psu
30 psu
40 psu
10 psu
The average salinity of Yaquina Bay is actually 28 psu!
Touch here to continue
Pacific OceanEntire Year35 psu
OBYaquina BayEntire Year28 psu
B O
Not quite!
How To Build A GraphBuild A Graph
(Level 1)
Read LOBO Graphs (Level 3)
LOBO Data Match-up(Level 4)
Test Your LOBO
Abilities(Level 5)
Interpret Graphs
(Level 2)
More info

0 psu
20 psu
30 psu
40 psu
10 psu
Because of our seasonal weather patterns here on the coast of Oregon, the salinity in the Bay does not stay constant through out the year. Do you know what the average salinity is in YAQUINA BAY during the rainy winter?
Pacific OceanEntire Year35 psu
BYaquina BayEntire Year28 psu
O
B O
How To Build A GraphBuild A Graph
(Level 1)
Read LOBO Graphs (Level 3)
LOBO Data Match-up(Level 4)
Test Your LOBO
Abilities(Level 5)
Interpret Graphs
(Level 2)
More info
Touch in the box above where you think the average winter Yaquina Bay salinity is located along the line.

0 psu
20 psu
30 psu
40 psu
10 psu
The average salinity of Yaquina Bay during the winter is around
26 psu!
Touch here to continue
Pacific OceanEntire Year35 psu
BYaquina BayEntire Year28 psu
OWYaquina BayWinter26 psu
BW O
Great job!
How To Build A GraphBuild A Graph
(Level 1)
Read LOBO Graphs (Level 3)
LOBO Data Match-up(Level 4)
Test Your LOBO
Abilities(Level 5)
Interpret Graphs
(Level 2)
More info

0 psu
20 psu
30 psu
40 psu
10 psu
The average salinity of Yaquina Bay during the winter is around
26 psu!
Touch here to continue
Pacific OceanEntire Year35 psu
BYaquina BayEntire Year28 psu
OWYaquina BayWinter26 psu
BW O
Not quite!
How To Build A GraphBuild A Graph
(Level 1)
Read LOBO Graphs (Level 3)
LOBO Data Match-up(Level 4)
Test Your LOBO
Abilities(Level 5)
Interpret Graphs
(Level 2)
More info
How To Build A Graph
0 psu
20 psu
30 psu
40 psu
10 psu
If the winter salinity in Yaquina Bay is less than the overall average, then where does the warm summer salinity fall on
the line?
Pacific OceanEntire Year35 psu
BYaquina BayEntire Year28 psu
WYaquina BayWinter26 psu
O
BW O
Build A Graph
(Level 1)
Read LOBO Graphs (Level 3)
LOBO Data Match-up(Level 4)
Test Your LOBO
Abilities(Level 5)
Interpret Graphs
(Level 2)
More info
Touch in the box above where you think the average summer Yaquina Bay salinity is located along the line.

0 psu
20 psu
30 psu
40 psu
10 psu
The average salinity of Yaquina Bay during the summer is around
32 psu!
Touch here to continue
Pacific OceanEntire Year35 psu
BYaquina BayEntire Year28 psu
WYaquina BayWinter26 psu
OSYaquina BaySummer32 psu
BW OS
Great job!
How To Build A GraphBuild A Graph
(Level 1)
Read LOBO Graphs (Level 3)
LOBO Data Match-up(Level 4)
Test Your LOBO
Abilities(Level 5)
Interpret Graphs
(Level 2)
More info

0 psu
20 psu
30 psu
40 psu
10 psu
The average salinity of Yaquina Bay during the summer is
around 32 psu!
Touch here to continue
Pacific OceanEntire Year35 psu
BYaquina BayEntire Year28 psu
WYaquina BayWinter26 psu
OSYaquina BaySummer32 psu
BW OS
Not quite!
How To Build A GraphBuild A Graph
(Level 1)
Read LOBO Graphs (Level 3)
LOBO Data Match-up(Level 4)
Test Your LOBO
Abilities(Level 5)
Interpret Graphs
(Level 2)
More info

How To Build A Graph
0 psu
20 psu
30 psu
40 psu
10 psu
You can see that the ocean has a higher salinity, or more salt, than Yaquina Bay! Lets look more closely at how the Bay’s salinity changes during the year.
Pacific OceanEntire Year35 psu
BYaquina BayEntire Year28 psu
WYaquina BayWinter26 psu
OSYaquina BaySummer32 psu
BW OS
Touch here to continue
Build A Graph
(Level 1)
Read LOBO Graphs (Level 3)
LOBO Data Match-up(Level 4)
Test Your LOBO
Abilities(Level 5)
Interpret Graphs
(Level 2)
More info
To do this, we must first flip the line graph on its head.

Touch here to add the months
Pacific OceanEntire Year35 psu
BYaquina BayEntire Year28 psu
WYaquina BayWinter26 psu
OSYaquina BaySummer32 psu0
psu20 psu
30 psu
40 psu
10 psu BW OS
0 psu
20 psu
30 psu
40 psu
10 psu
BW
OS
Now we have to add a timeline to our graph. By adding the months, we can look at changes over one year.
How To Build A GraphBuild A Graph
(Level 1)
Read LOBO Graphs (Level 3)
LOBO Data Match-up(Level 4)
Test Your LOBO
Abilities(Level 5)
Interpret Graphs
(Level 2)
More info

Now we have the salinity range and time defined, we need the data.
Touch here to see Yaquina Bay’s average salinity for
each month
0 psu
20 psu
30 psu
40 psu
10 psu
Septembe
rMay
March
February
January
April June JulyAugust
October
November
December
How To Build A GraphBuild A Graph
(Level 1)
Read LOBO Graphs (Level 3)
LOBO Data Match-up(Level 4)
Test Your LOBO
Abilities(Level 5)
Interpret Graphs
(Level 2)
More info
0 psu
20 psu
30 psu
40 psu
10 psu
BW
OS

0 psu
20 psu
30 psu
40 psu
10 psu
Septembe
rMay
March
February
January
April June JulyAugust
October
November
December
We can make two different types of graphs with this data. The first is a bar graph.
Touch here to add the bars for each
month
How To Build A GraphBuild A Graph
(Level 1)
Read LOBO Graphs (Level 3)
LOBO Data Match-up(Level 4)
Test Your LOBO
Abilities(Level 5)
Interpret Graphs
(Level 2)
More info
25.0 28.1 32.1 33.133.332.826.724.622.9 27.5 31.3 32.5

25.00 psu
20 psu
30 psu
40 psu
10 psu
Septembe
rMay
March
February
January
April June JulyAugust
October
November
December
28.1 32.1 33.133.332.826.724.622.9 27.5 31.3 32.5
You can see that for a bar graph, the largest numbers during the summer have the highest
bars.
Touch here to make the second type of graph, a line
graph
How To Build A GraphBuild A Graph
(Level 1)
Read LOBO Graphs (Level 3)
LOBO Data Match-up(Level 4)
Test Your LOBO
Abilities(Level 5)
Interpret Graphs
(Level 2)
More info

25.0
The first step is to replace the bars with dots, or data points.
0 psu
20 psu
30 psu
40 psu
10 psu
Septembe
rMay
March
February
January
April June JulyAugust
October
November
December
32.1 33.133.332.8
24.622.927.5
31.3 32.5
Now that we have our data points, we have to connect the
dots.Touch here to create the connecting lines
28.1 26.7
How To Build A GraphBuild A Graph
(Level 1)
Read LOBO Graphs (Level 3)
LOBO Data Match-up(Level 4)
Test Your LOBO
Abilities(Level 5)
Interpret Graphs
(Level 2)
More info

25.0
0 psu
20 psu
30 psu
40 psu
10 psu
Septembe
rMay
March
February
January
April June JulyAugust
October
November
December
32.1 33.133.332.8
24.622.927.5
31.3 32.528.1 26.7
You can see that just like in the bar graph, the highest salinity is in the summer, where the data points are the highest.
That’s the end of this section! Touch here to move on to
Level 2!
How To Build A GraphBuild A Graph
(Level 1)
Read LOBO Graphs (Level 3)
LOBO Data Match-up(Level 4)
Test Your LOBO
Abilities(Level 5)
Interpret Graphs
(Level 2)
More info

Hiya! I am Myt the Mussel and I will help you use graphs and understand what they are telling us.
Touch here to interpret rainfall, river flow, and salinity graphs!
In this section, there are a series of multiple choice questions: 4 about the rainfall and river flow relationship, and 4 about the rainfall and salinity relationship.
Remember that you have the home, back, and help button if you get lost.
How To Interpret GraphsBuild A Graph
(Level 1)
Read LOBO Graphs (Level 3)
LOBO Data Match-up(Level 4)
Test Your LOBO
Abilities(Level 5)
Interpret Graphs
(Level 2)
More info
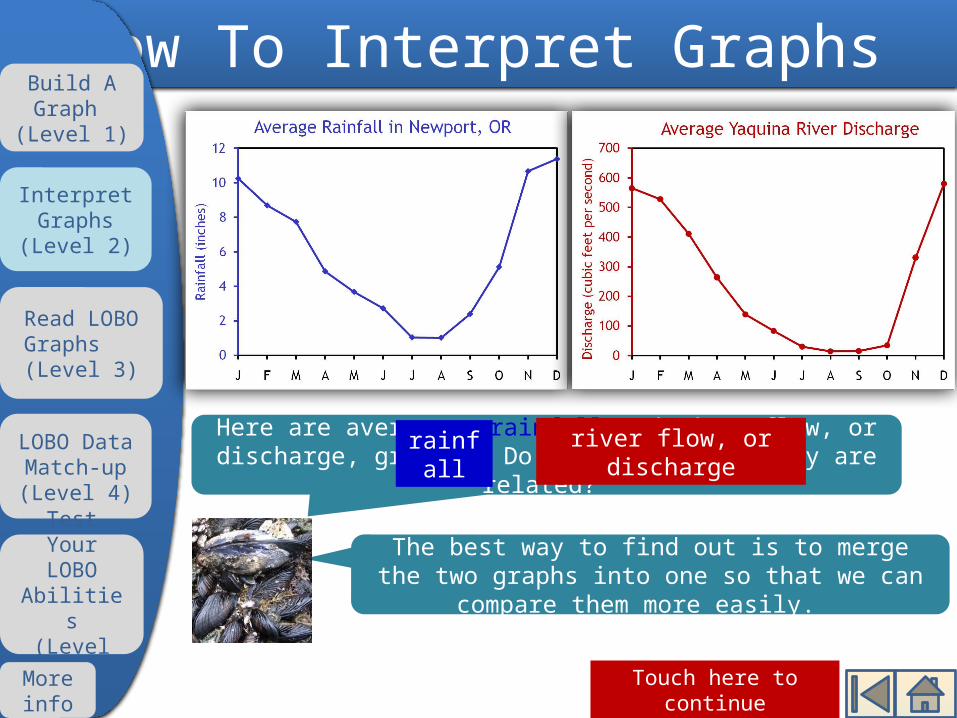
The best way to find out is to merge the two graphs into one so that we can compare them
more easily.
Here are average rainfall and river flow, or discharge, graphs. Do you think that they are related?
rainfall
river flow, or discharge
How To Interpret GraphsBuild A Graph
(Level 1)
Read LOBO Graphs (Level 3)
LOBO Data Match-up(Level 4)
Test Your LOBO
Abilities(Level 5)
Interpret Graphs
(Level 2)
More info
Touch here to continue

Do you see any patterns due to seasons in this graph?
This graph has the same bottom axes as the other two, but now we have two vertical axes instead of one.
Yes No
In case you are confused, blue is for rainfall and red is for river
discharge.
How To Interpret GraphsBuild A Graph
(Level 1)
Read LOBO Graphs (Level 3)
LOBO Data Match-up(Level 4)
Test Your LOBO
Abilities(Level 5)
Interpret Graphs
(Level 2)
More info
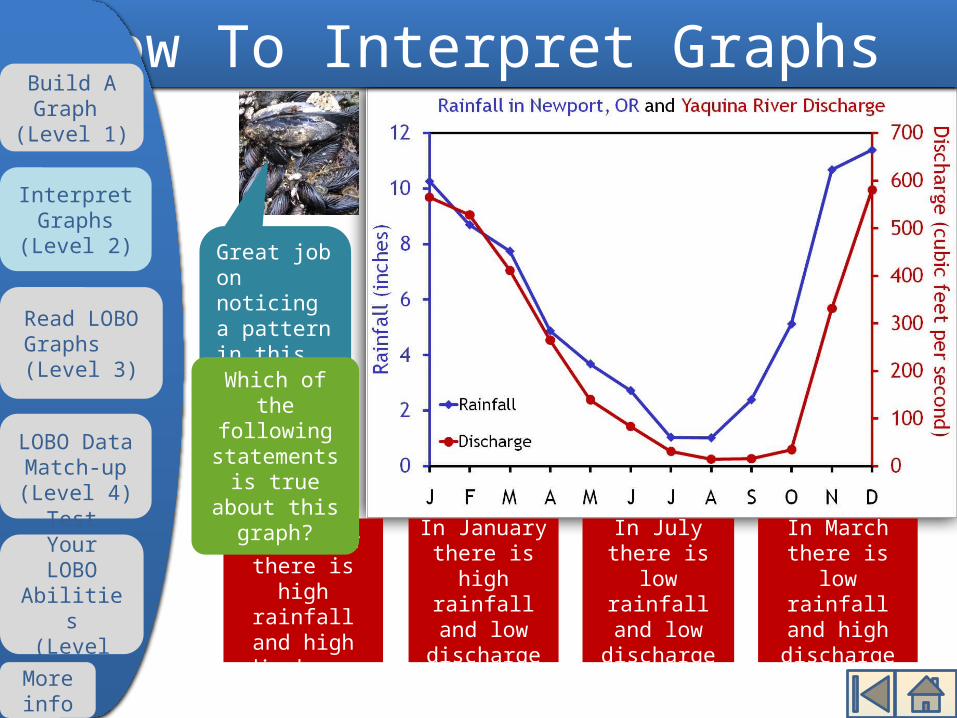
Great job on noticing a pattern in this graph!
In July there is low
rainfall and low
discharge
In January there is
high rainfall and low
discharge
In March there is low rainfall and
high discharge
In September
there is high rainfall and
high discharge
Which of the following
statements is true about this graph?
How To Interpret GraphsBuild A Graph
(Level 1)
Read LOBO Graphs (Level 3)
LOBO Data Match-up(Level 4)
Test Your LOBO
Abilities(Level 5)
Interpret Graphs
(Level 2)
More info
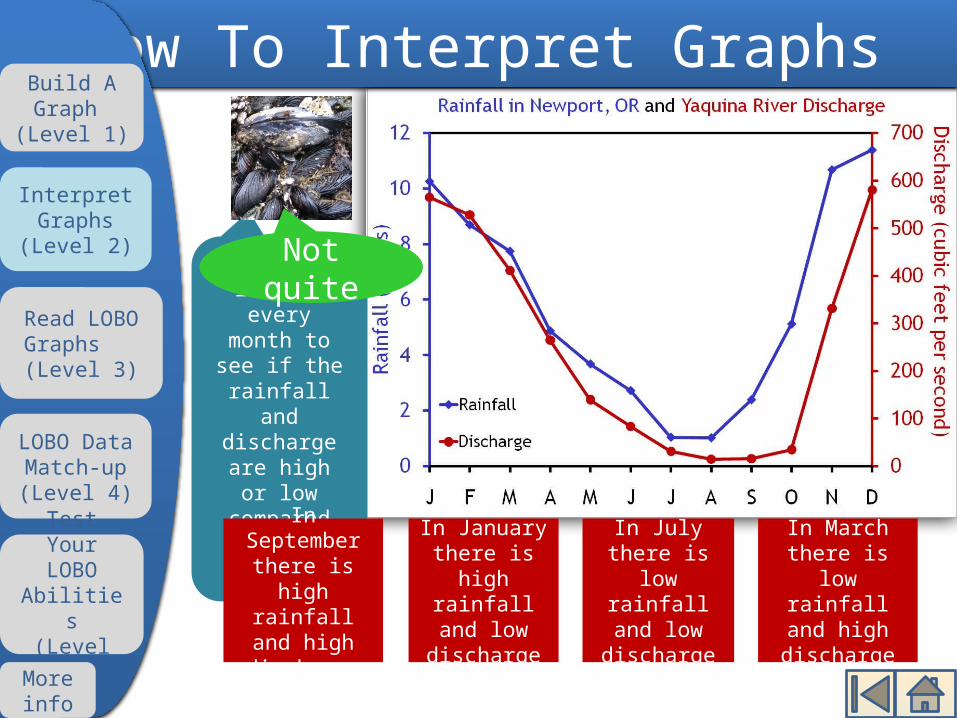
Be sure to look at every
month to see if the
rainfall and discharge are high or
low compared to
other months.
In July there is low
rainfall and low
discharge
In January there is
high rainfall and low
discharge
In March there is low rainfall and
high discharge
In September
there is high rainfall and
high discharge
Not quite
How To Interpret GraphsBuild A Graph
(Level 1)
Read LOBO Graphs (Level 3)
LOBO Data Match-up(Level 4)
Test Your LOBO
Abilities(Level 5)
Interpret Graphs
(Level 2)
More info

Check out the lines I
added. They show you
that rainfall and
discharge follow each
other.
High
Low
In July there is low
rainfall and low
discharge
In January there is
high rainfall and low
discharge
In March there is low rainfall and
high discharge
In September
there is high rainfall and
high discharge
Not quite
How To Interpret GraphsBuild A Graph
(Level 1)
Read LOBO Graphs (Level 3)
LOBO Data Match-up(Level 4)
Test Your LOBO
Abilities(Level 5)
Interpret Graphs
(Level 2)
More info

Do you think that the rainfall and discharge lines follow, mirror image, or have no relationship with each other?
Focusing just on the blue rainfall line, what can you say about the amount of rainfall in winter compared to the rest of the year? How about in summer, are these the same or different from winter?
Now do the same for the red discharge line.
Let’s review how to
read this graph.
Not quite
How To Interpret GraphsBuild A Graph
(Level 1)
Read LOBO Graphs (Level 3)
LOBO Data Match-up(Level 4)
Test Your LOBO
Abilities(Level 5)
Interpret Graphs
(Level 2)
More info
Touch here to
continue

Let’s take a closer look at
this graph.
How To Interpret GraphsBuild A Graph
(Level 1)
Read LOBO Graphs (Level 3)
LOBO Data Match-up(Level 4)
Test Your LOBO
Abilities(Level 5)
Interpret Graphs
(Level 2)
More info
Do you think that the rainfall and discharge lines follow, mirror image, or have no relationship with each other?
Focusing just on the blue rainfall line, what can you say about the amount of rainfall in winter compared to the rest of the year? How about in summer, are these the same or different from winter?
Now do the same for the red discharge line. Touch here
to continue

The major pattern to focus on is that rainfall and discharge follow each other and both have a dip, or less amount measured, in the summer months. When there is not much
rain, the river doesn’t have as much water running in it.
How To Interpret GraphsBuild A Graph
(Level 1)
Read LOBO Graphs (Level 3)
LOBO Data Match-up(Level 4)
Test Your LOBO
Abilities(Level 5)
Interpret Graphs
(Level 2)
More info
Touch here to continue
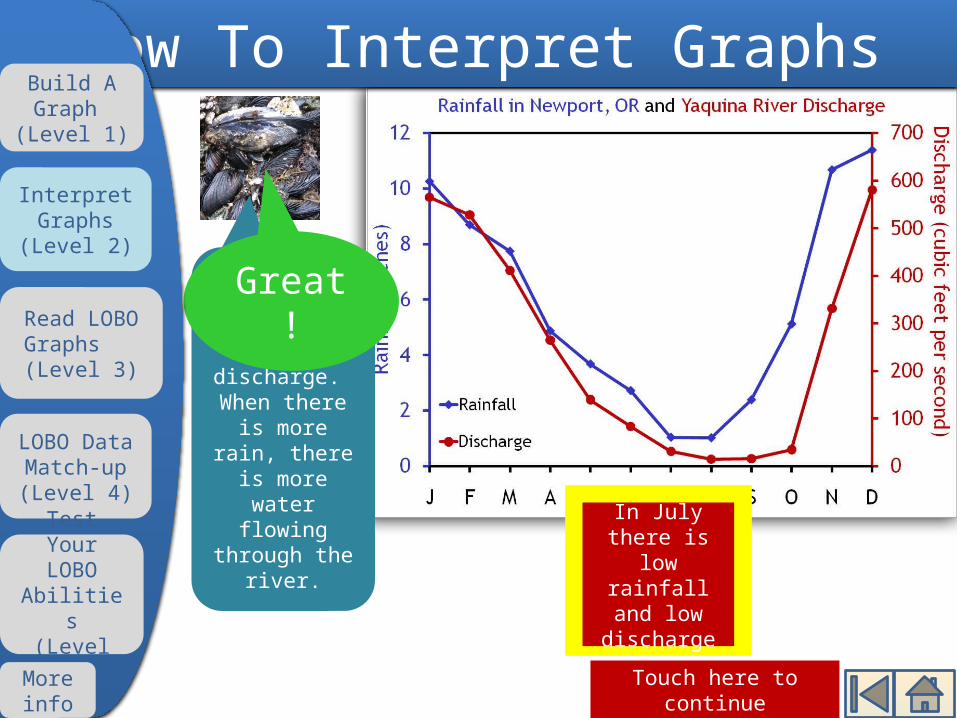
Rainfall affects the amount of
river discharge. When there is more rain, there is more water flowing through the
river. In July there is low
rainfall and low
discharge
Great!
How To Interpret GraphsBuild A Graph
(Level 1)
Read LOBO Graphs (Level 3)
LOBO Data Match-up(Level 4)
Test Your LOBO
Abilities(Level 5)
Interpret Graphs
(Level 2)
More info
Touch here to continue

Summer: March - July
Winter: August - January
Summer: May - October
Winter: December -
FebruaryWhich do you think describes
one of these seasons the
best?
These data can also help
us understand the seasons
in the estuary.
Based on this graph, I can
tell the difference between 2 seasons.
How To Interpret GraphsBuild A Graph
(Level 1)
Read LOBO Graphs (Level 3)
LOBO Data Match-up(Level 4)
Test Your LOBO
Abilities(Level 5)
Interpret Graphs
(Level 2)
More info

Think about how much rainfall and discharge occur in Newport during
winter and summer.
Summer: March - July
Winter: August - January
Summer: May - October
Winter: December -
February
Which months incorporate an entire high or low level of rainfall and discharge?
Not quite
How To Interpret GraphsBuild A Graph
(Level 1)
Read LOBO Graphs (Level 3)
LOBO Data Match-up(Level 4)
Test Your LOBO
Abilities(Level 5)
Interpret Graphs
(Level 2)
More info

Summer: March - July
Winter: August - January
Summer: May - October
Winter: December -
February
The months with both rain and discharge levels above
the line should be grouped
together, and same for the months under
the line.
Not quiteI added a line that helped me. Does it help you?
How To Interpret GraphsBuild A Graph
(Level 1)
Read LOBO Graphs (Level 3)
LOBO Data Match-up(Level 4)
Test Your LOBO
Abilities(Level 5)
Interpret Graphs
(Level 2)
More info

Do these labels help
you?
Summer: March - July
Winter: August - January
Summer: May - October
Winter: December -
February
WinterSummer
Not quite
The months with both rain and discharge levels above the line are during the winter, and the months
under the line are summer.
How To Interpret GraphsBuild A Graph
(Level 1)
Read LOBO Graphs (Level 3)
LOBO Data Match-up(Level 4)
Test Your LOBO
Abilities(Level 5)
Interpret Graphs
(Level 2)
More info

Using this graph, we can tell that Summer is May- October and Winter is
November- April.
Touch here to continue
Winter
Summer
Not quite
Winter
Summer: May - October
How To Interpret GraphsBuild A Graph
(Level 1)
Read LOBO Graphs (Level 3)
LOBO Data Match-up(Level 4)
Test Your LOBO
Abilities(Level 5)
Interpret Graphs
(Level 2)
More info

Using this graph, we can tell that Summer is May- October and Winter is
November- April.
Touch here to continue
Excellent!
Summer: May - October
How To Interpret GraphsBuild A Graph
(Level 1)
Read LOBO Graphs (Level 3)
LOBO Data Match-up(Level 4)
Test Your LOBO
Abilities(Level 5)
Interpret Graphs
(Level 2)
More info
Winter
Summer
Winter

Touch on the graph that
shows a winter month.
Here are two new graphs of
rainfall during an entire month.
How To Interpret GraphsBuild A Graph
(Level 1)
Read LOBO Graphs (Level 3)
LOBO Data Match-up(Level 4)
Test Your LOBO
Abilities(Level 5)
Interpret Graphs
(Level 2)
More info

How To Interpret Graphs
Is it high or low? Which of these
graphs show that amount?
Not quite Can you think of the amount
of rain that falls in winter?
Touch on the graph that
shows a winter month.
Build A Graph
(Level 1)
Read LOBO Graphs (Level 3)
LOBO Data Match-up(Level 4)
Test Your LOBO
Abilities(Level 5)
Interpret Graphs
(Level 2)
More info

Touch here to continue
Month A is actually the
winter month. Notice how
more rain fell on more of the days in Month
A than in Month B.
Not quite
How To Interpret GraphsBuild A Graph
(Level 1)
Read LOBO Graphs (Level 3)
LOBO Data Match-up(Level 4)
Test Your LOBO
Abilities(Level 5)
Interpret Graphs
(Level 2)
More info
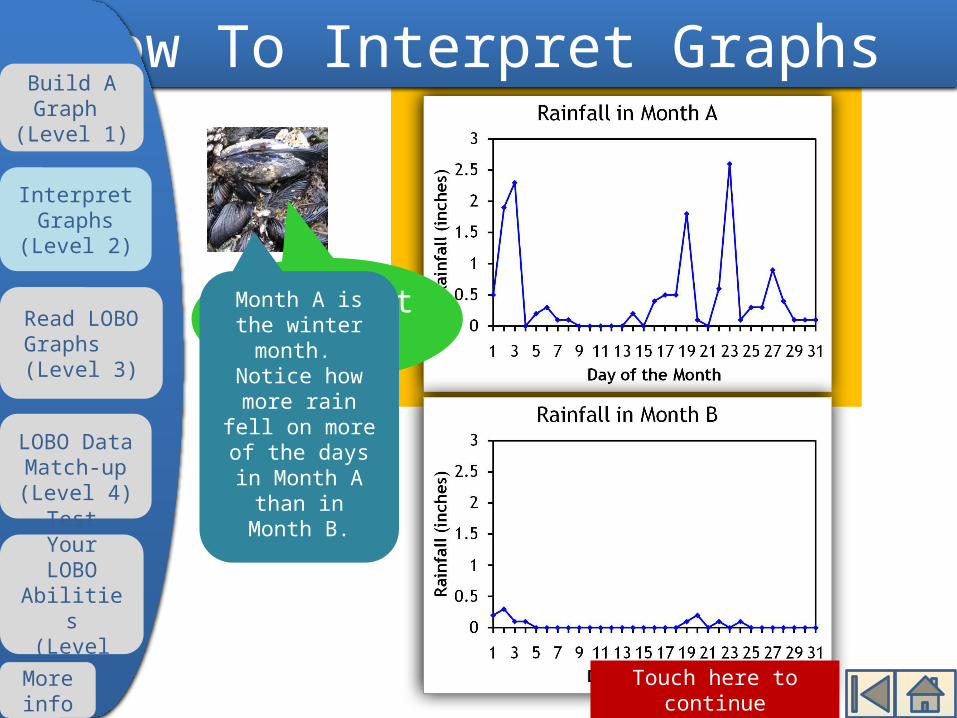
Touch here to continue
Excellent!Month A is the winter month.
Notice how more rain fell
on more of the days in Month
A than in Month B.
How To Interpret GraphsBuild A Graph
(Level 1)
Read LOBO Graphs (Level 3)
LOBO Data Match-up(Level 4)
Test Your LOBO
Abilities(Level 5)
Interpret Graphs
(Level 2)
More info
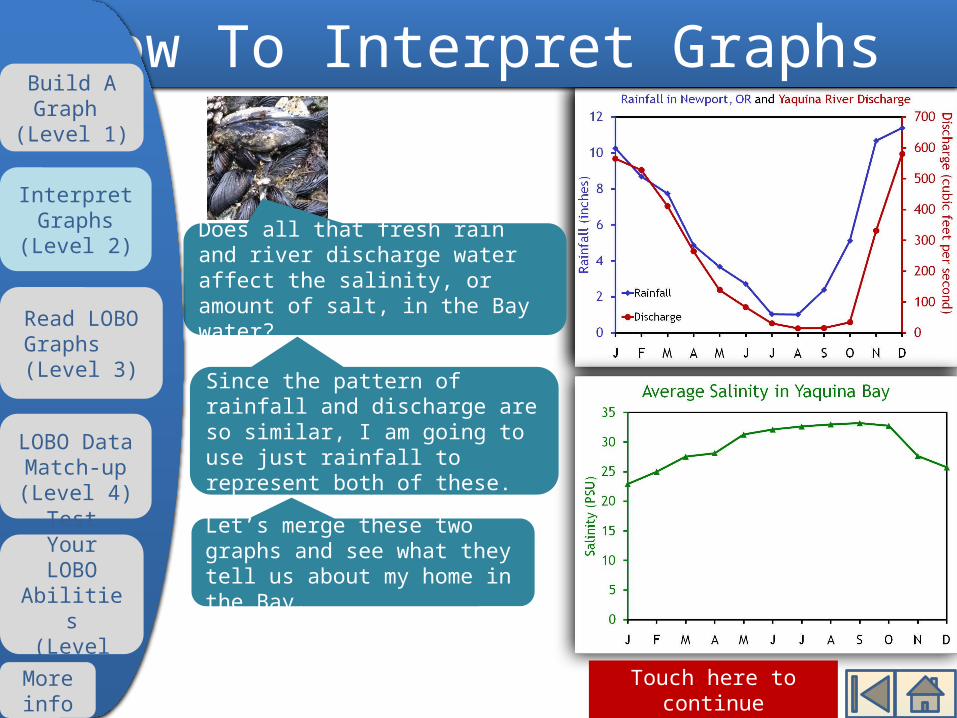
Since the pattern of rainfall and discharge are so similar, I am going to use just rainfall to represent both of these.
Does all that fresh rain and river discharge water affect the salinity, or amount of salt, in the Bay water?
Let’s merge these two graphs and see what they tell us about my home in the Bay.
How To Interpret GraphsBuild A Graph
(Level 1)
Read LOBO Graphs (Level 3)
LOBO Data Match-up(Level 4)
Test Your LOBO
Abilities(Level 5)
Interpret Graphs
(Level 2)
More info
Touch here to continue

Yes No
Compare the lines of this graph to the rainfall and discharge graph.
Do you think the rainfall and salinity lines in this graph fit in the same summer and winter seasons that we decided on before?
How To Interpret GraphsBuild A Graph
(Level 1)
Read LOBO Graphs (Level 3)
LOBO Data Match-up(Level 4)
Test Your LOBO
Abilities(Level 5)
Interpret Graphs
(Level 2)
More info
What is PSU?

Touch here to continue
Remember that we determined seasons based on high and low rainfall.
Low
Low
HighHigh
The rainfall season lines are added to see if the majority of the high or low salinity fits in these lines.
Well, we can do the same thing with salinity.
How To Interpret GraphsBuild A Graph
(Level 1)
Read LOBO Graphs (Level 3)
LOBO Data Match-up(Level 4)
Test Your LOBO
Abilities(Level 5)
Interpret Graphs
(Level 2)
More info

Which of these
statements describes the relationship between the
salinity pattern and the rainfall pattern?
The patterns are identical
The patterns are mirror images or
opposites
The patterns have no
relationship
How To Interpret GraphsBuild A Graph
(Level 1)
Read LOBO Graphs (Level 3)
LOBO Data Match-up(Level 4)
Test Your LOBO
Abilities(Level 5)
Interpret Graphs
(Level 2)
More info

The patterns are identical
The patterns are mirror images or
opposites
The patterns have no
relationship
Check out the time of year when rainfall is lowest. What is salinity doing?
How about when rainfall is highest?
Not quite
How To Interpret GraphsBuild A Graph
(Level 1)
Read LOBO Graphs (Level 3)
LOBO Data Match-up(Level 4)
Test Your LOBO
Abilities(Level 5)
Interpret Graphs
(Level 2)
More info

The patterns are mirror images or
opposites
The patterns are
mirror images or opposites because salinity is highest
when there is the least amount of rain, and
vice versa.
Click here to continue
Not quite
How To Interpret GraphsBuild A Graph
(Level 1)
Read LOBO Graphs (Level 3)
LOBO Data Match-up(Level 4)
Test Your LOBO
Abilities(Level 5)
Interpret Graphs
(Level 2)
More info

The patterns are mirror images or
opposites
Touch here to continue
Excellent!
The patterns are
mirror images or opposites because salinity is highest
when there is the least amount of rain, and
vice versa.
How To Interpret GraphsBuild A Graph
(Level 1)
Read LOBO Graphs (Level 3)
LOBO Data Match-up(Level 4)
Test Your LOBO
Abilities(Level 5)
Interpret Graphs
(Level 2)
More info

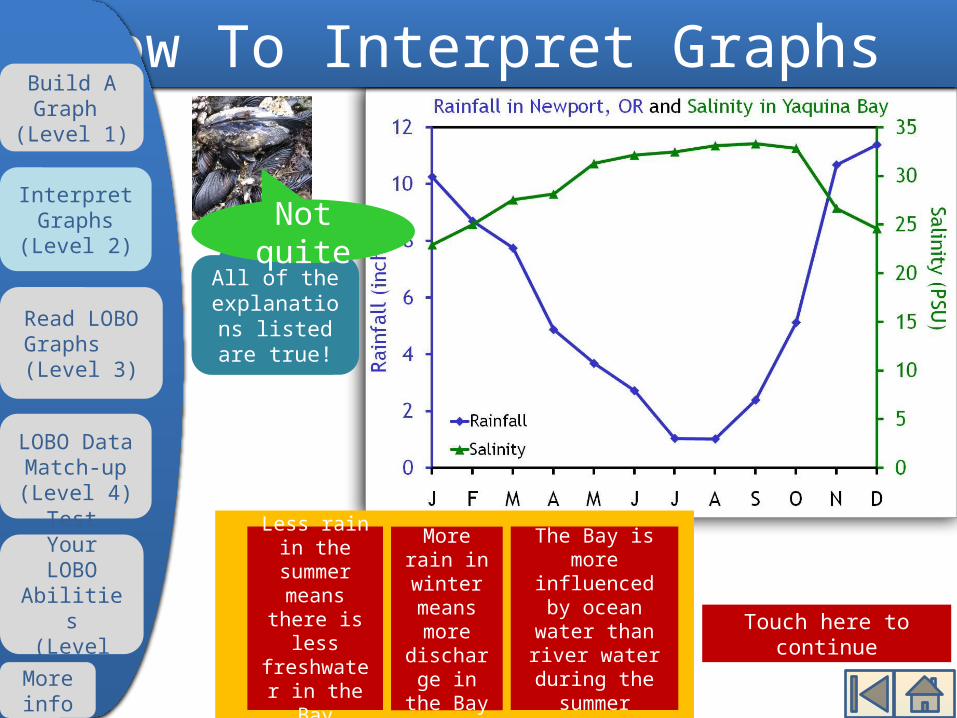
More rain in winter means more
discharge in the
Bay
Less rain in the
summer means there is
less freshwater in the Bay
The Bay is more
influenced by ocean water
than river water during the summer
All of these
reasons
Why is this?
So the salinity
pattern fits in the same
seasons but has an
opposite response
than rainfall.
How To Interpret GraphsBuild A Graph
(Level 1)
Read LOBO Graphs (Level 3)
LOBO Data Match-up(Level 4)
Test Your LOBO
Abilities(Level 5)
Interpret Graphs
(Level 2)
More info

Is that the only reason
that explains
this relationship
?
Almost!
How To Interpret GraphsBuild A Graph
(Level 1)
Read LOBO Graphs (Level 3)
LOBO Data Match-up(Level 4)
Test Your LOBO
Abilities(Level 5)
Interpret Graphs
(Level 2)
More info
More rain in winter means more
discharge in the
Bay
Less rain in the
summer means there is
less freshwater in the Bay
The Bay is more
influenced by ocean water
than river water during the summer
All of these
reasons
Touch here to continue
All of the explanations
listed are true!
Not quite
How To Interpret GraphsBuild A Graph
(Level 1)
Read LOBO Graphs (Level 3)
LOBO Data Match-up(Level 4)
Test Your LOBO
Abilities(Level 5)
Interpret Graphs
(Level 2)
More info
More rain in winter means more
discharge in the
Bay
Less rain in the
summer means there is
less freshwater in the Bay
The Bay is more
influenced by ocean water
than river water during the summer

Touch here to continue
All of the explanations
listed are true!
Excellent
How To Interpret GraphsBuild A Graph
(Level 1)
Read LOBO Graphs (Level 3)
LOBO Data Match-up(Level 4)
Test Your LOBO
Abilities(Level 5)
Interpret Graphs
(Level 2)
More info
More rain in winter means more
discharge in the
Bay
Less rain in the
summer means there is
less freshwater in the Bay
The Bay is more
influenced by ocean water
than river water during the summer

Now here are two new graphs
of salinity in Yaquina Bay
during an entire month.
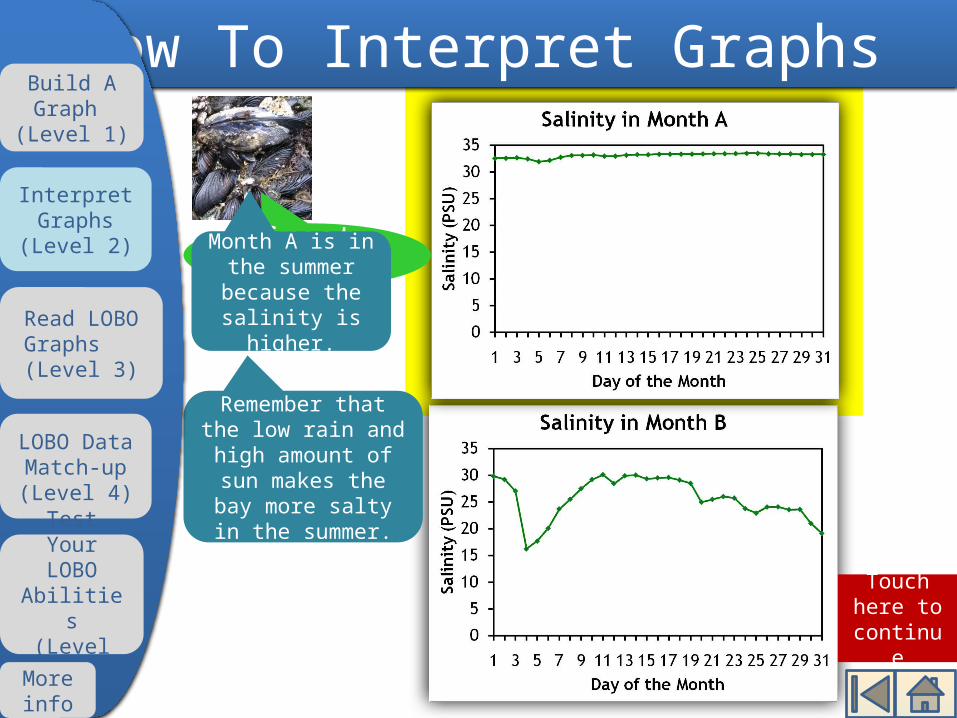
Using what you know about
seasons in the Bay, touch on the graph that
shows a summer month.
How To Interpret GraphsBuild A Graph
(Level 1)
Read LOBO Graphs (Level 3)
LOBO Data Match-up(Level 4)
Test Your LOBO
Abilities(Level 5)
Interpret Graphs
(Level 2)
More info
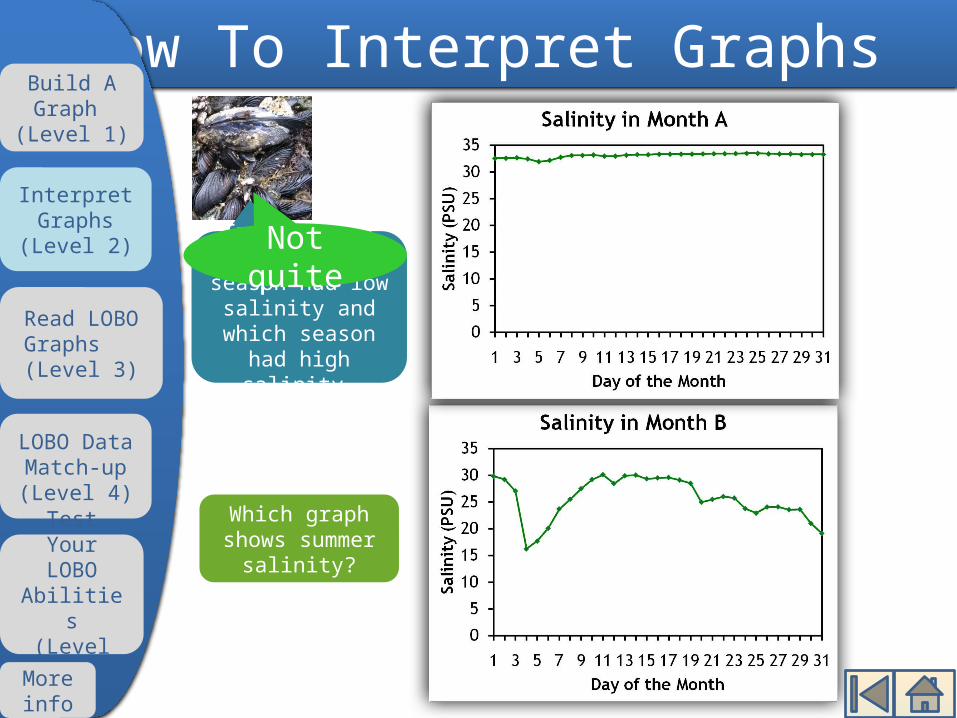
Try to think back to which season had low salinity
and which season had high
salinity.
Which graph shows summer
salinity?
Not quite
How To Interpret GraphsBuild A Graph
(Level 1)
Read LOBO Graphs (Level 3)
LOBO Data Match-up(Level 4)
Test Your LOBO
Abilities(Level 5)
Interpret Graphs
(Level 2)
More info
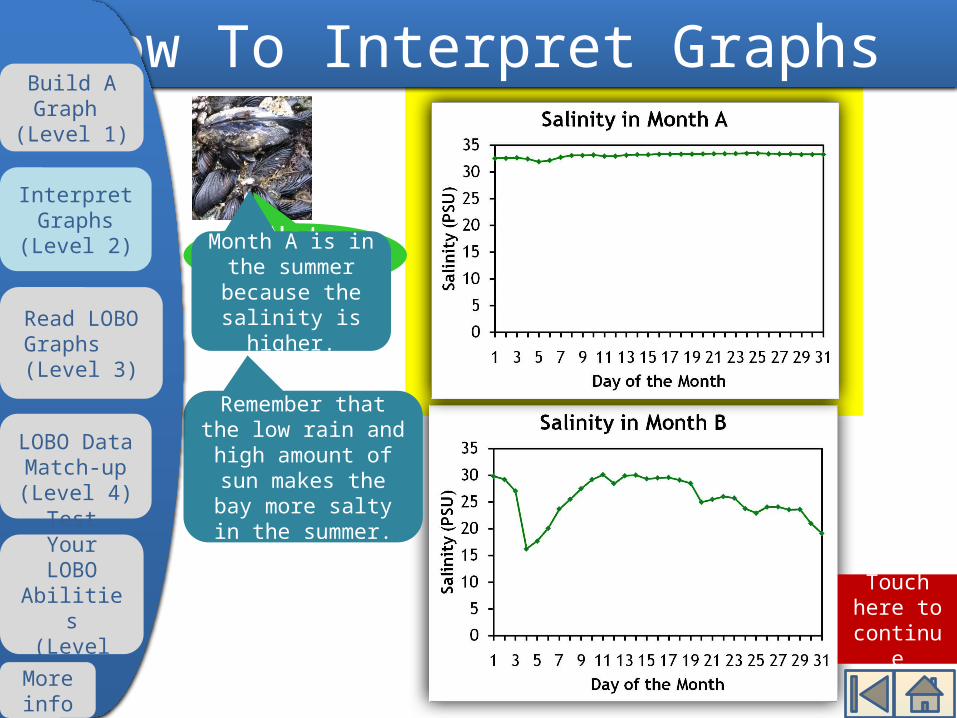
Remember that the low rain and high amount of
sun makes the bay more salty in the
summer.
Not quite
Month A is in the summer because the
salinity is higher.
Touch here to
continue
How To Interpret GraphsBuild A Graph
(Level 1)
Read LOBO Graphs (Level 3)
LOBO Data Match-up(Level 4)
Test Your LOBO
Abilities(Level 5)
Interpret Graphs
(Level 2)
More info
Remember that the low rain and high amount of
sun makes the bay more salty in the
summer.
Touch here to
continue
Great job!
Month A is in the summer because the
salinity is higher.
How To Interpret GraphsBuild A Graph
(Level 1)
Read LOBO Graphs (Level 3)
LOBO Data Match-up(Level 4)
Test Your LOBO
Abilities(Level 5)
Interpret Graphs
(Level 2)
More info

We found that when rainfall increases, river discharge also increases, but the Bay salinity decreases.Now that we know the seasonal patterns during the year, do you think that we could see these patterns in data that is being collected right now by LOBO?
Excellent! Here’s a summary of the graphs we looked at.
Touch here to continue to Level 3
How To Interpret GraphsBuild A Graph
(Level 1)
Read LOBO Graphs (Level 3)
LOBO Data Match-up(Level 4)
Test Your LOBO
Abilities(Level 5)
Interpret Graphs
(Level 2)
More info

Touch here to begin!
Hi there, I am Dungie the Crab and I am your guide to understanding the story of salinity in Yaquina Bay!
The Bay is a complex system that is changing every moment. Some of these changes are predictable patterns, but some are unexpected variations. Do you think you can tell the difference?
How To Read LOBO DataBuild A Graph
(Level 1)
Read LOBO Graphs (Level 3)
LOBO Data Match-up(Level 4)
Test Your LOBO
Abilities(Level 5)
Interpret Graphs
(Level 2)
More info
I will be asking you questions in boxes similar to this one. Try to figure them out before you move on.
There are 3 different sections in this level:Section 1: Determine what is a pattern or variation in salinity dataSection 2: Explore the influence of tides on salinity
Section 3: Four challenges to test your salinity interpretation skills

Seasonal Monthly Daily Tidal Hourly
Let’s start with a familiar graph from Levels 1 & 2.
Touch here to see if you are correct
How To Read LOBO DataBuild A Graph
(Level 1)
Read LOBO Graphs (Level 3)
LOBO Data Match-up(Level 4)
Test Your LOBO
Abilities(Level 5)
Interpret Graphs
(Level 2)
More info
(Mentally) Choose one word from EACH of the orange boxes below that you think best describes this graph.
Pattern Variation
This graph was made with averaged data from 3 different years, and shows us expected Bay conditions for all the seasons spanning one year.
Progress: 1/11
What is PSU?

Seasonal Monthly Daily Tidal Hourly
Touch here to continue
How To Read LOBO DataBuild A Graph
(Level 1)
Read LOBO Graphs (Level 3)
LOBO Data Match-up(Level 4)
Test Your LOBO
Abilities(Level 5)
Interpret Graphs
(Level 2)
More info
Winter
Summer
Winter
Pattern VariationSeasonal
Pattern
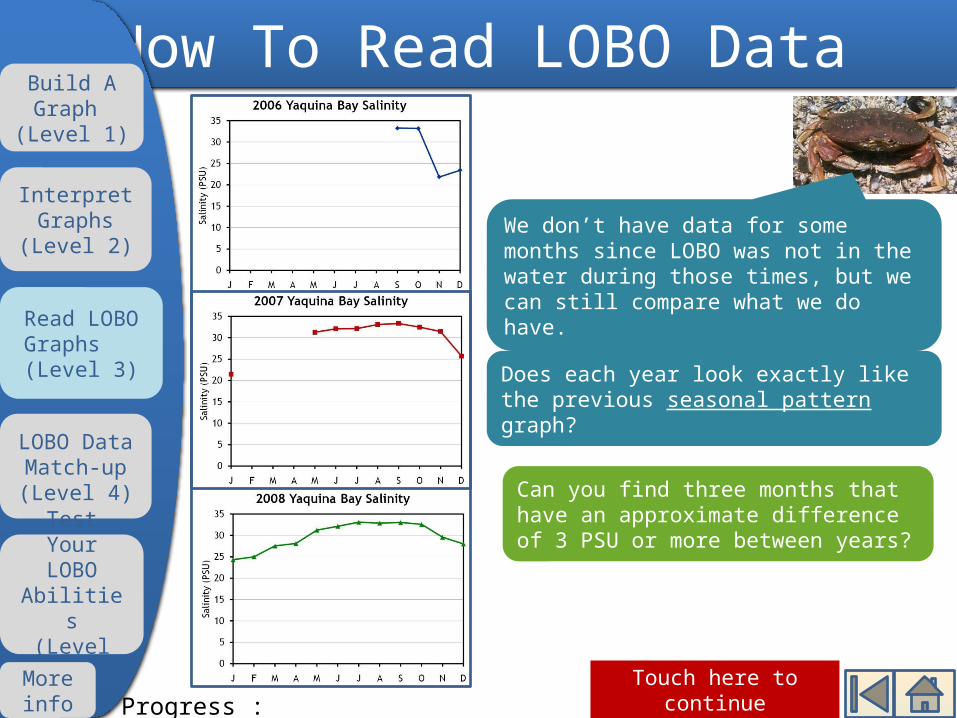
Next, let’s look at each year, 2006, 2007 & 2008, individually.
Progress: 2/11
In the Bay, the summer season has the highest salinity and the winter season has the lowest.
This graph shows me the predictable seasonal pattern of salinity in the Bay.
Touch here to continue
How To Read LOBO DataBuild A Graph
(Level 1)
Read LOBO Graphs (Level 3)
LOBO Data Match-up(Level 4)
Test Your LOBO
Abilities(Level 5)
Interpret Graphs
(Level 2)
Can you find three months that have an approximate difference of 3 PSU or more between years?
More info
Does each year look exactly like the previous seasonal pattern graph?
We don’t have data for some months since LOBO was not in the water during those times, but we can still compare what we do have.
Progress : 3/11

Touch here to see if you are correct
How To Read LOBO DataBuild A Graph
(Level 1)
Read LOBO Graphs (Level 3)
LOBO Data Match-up(Level 4)
Test Your LOBO
Abilities(Level 5)
Interpret Graphs
(Level 2)
More info
Seasonal Monthly Daily Tidal HourlyPattern Variation
(Mentally) Choose one word from EACH of the orange boxes below that you think best describes these graphs.
I can see that each year is different, especially when comparing January, November and December.Using this information, do you think you can classify what these graphs represent from the words below?
Progress : 4/11

Touch here to continue
How To Read LOBO DataBuild A Graph
(Level 1)
Read LOBO Graphs (Level 3)
LOBO Data Match-up(Level 4)
Test Your LOBO
Abilities(Level 5)
Interpret Graphs
(Level 2)
More info
Seasonal Monthly Daily Tidal HourlyPattern Variation
Monthly Variation
Can you predict what the graphs will look like if we graph the average salinity for each DAY instead of each MONTH?
I consider these graphs to show me monthly variation.
We can still see the seasonal pattern, but superimposed over it is the monthly variation during each year.
What do you think causes these changes from year to year?
Progress : 5/11

Can you find 4 time periods when the season in the Bay switched between summer or winter?
Touch here to continue
How To Read LOBO DataBuild A Graph
(Level 1)
Read LOBO Graphs (Level 3)
LOBO Data Match-up(Level 4)
Test Your LOBO
Abilities(Level 5)
Interpret Graphs
(Level 2)
More info
What do you think is characteristic of a change in seasons for salinity?
Are these daily averaged graphs similar or different to what you predicted?
Having salinity graphed for each day tells us a lot more information. For instance, I can see fairly distinct season changes.
Progress : 6/11

How To Read LOBO Data
Touch here to continue
Read LOBO Graphs (Level 3)
LOBO Data Match-up(Level 4)
Test Your LOBO
Abilities(Level 5)
Interpret Graphs
(Level 2)
More info
This is when I see winter started:• 2006: early November • 2007: mid to late November • 2008: early November to late
DecemberThis is when I see summer began:• 2008: mid-May
Do you still see the seasonal pattern?
Can you see anything else, besides higher or lower salinity, that distinguishes the seasons?
Build A Graph
(Level 1)
Progress : 7/11
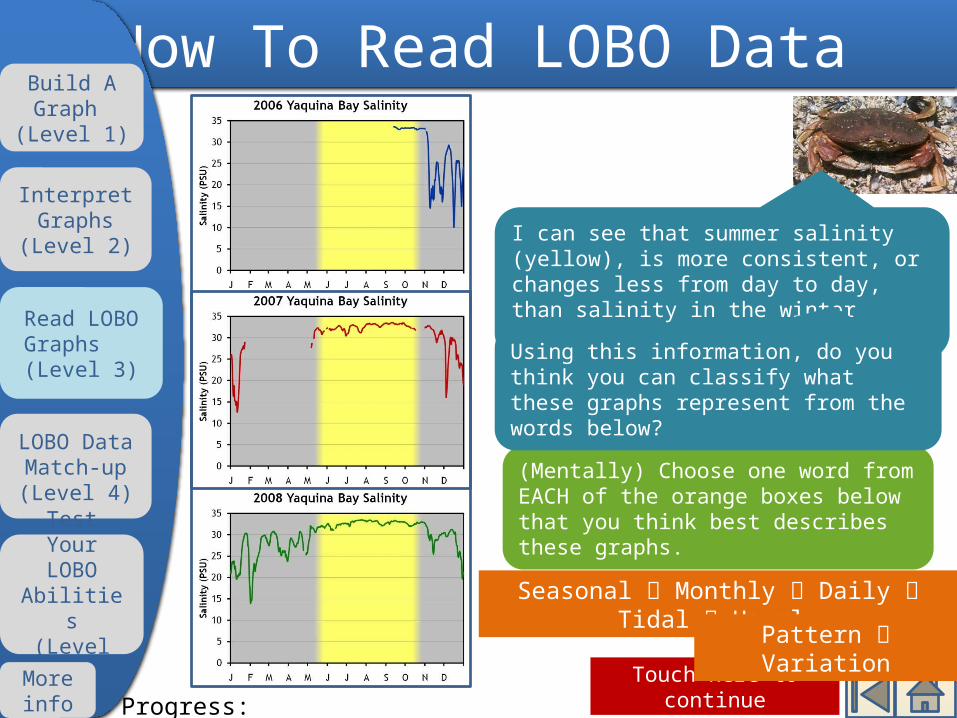
I can see that summer salinity (yellow), is more consistent, or changes less from day to day, than salinity in the winter (grey).
Touch here to continue
How To Read LOBO DataBuild A Graph
(Level 1)
Read LOBO Graphs (Level 3)
LOBO Data Match-up(Level 4)
Test Your LOBO
Abilities(Level 5)
Interpret Graphs
(Level 2)
More info
(Mentally) Choose one word from EACH of the orange boxes below that you think best describes these graphs.
Seasonal Monthly Daily Tidal HourlyPattern Variation
Using this information, do you think you can classify what these graphs represent from the words below?
Progress: 8/11

I consider these graphs to show me daily variation overlying the seasonal pattern.Do you have any guesses as to what causes the daily variation in the Bay’s salinity?
Touch here to continue
How To Read LOBO DataBuild A Graph
(Level 1)
Read LOBO Graphs (Level 3)
LOBO Data Match-up(Level 4)
Test Your LOBO
Abilities(Level 5)
Interpret Graphs
(Level 2)
More info
Seasonal Monthly Daily Tidal HourlyPattern Variation
DailyVariation
Progress : 9/11

River
Ocean
Estuary
A storm drops rain on the river and watershed, which increases the river’s water volume and discharge into the Bay.
How To Read LOBO DataBuild A Graph
(Level 1)
Read LOBO Graphs (Level 3)
LOBO Data Match-up(Level 4)
Test Your LOBO
Abilities(Level 5)
Interpret Graphs
(Level 2)
More info
Fresh water
Salinity
The large influx of freshwater into the Bay lowers the salinity during the storm.
After the storm, the salinity will gradually increase as the river height subsides back to normal.
Daily Variation: Storms!
Progress : 10/11
River water level
Touch here to continue
Estuary salinity
Jan 28 Feb 1 Feb 50
102030
Salin
ity (P
SU)

Storms during the winter explain:• the seasonal pattern of lower salinity• the high daily variability in salinity
Touch here to continue
How To Read LOBO DataBuild A Graph
(Level 1)
Read LOBO Graphs (Level 3)
LOBO Data Match-up(Level 4)
Test Your LOBO
Abilities(Level 5)
Interpret Graphs
(Level 2)
More info Progress:
11/11
Infrequent rain during the summer explains:• the seasonal pattern of higher
salinity• the low daily variability in salinityBut there is one more piece to the puzzle: what happens in the Bay over the course of one day.
Can you think of anything that would change salinity during a 24 hour
period?

Beach
Touch here to continue
How To Read LOBO DataBuild A Graph
(Level 1)
Read LOBO Graphs (Level 3)
LOBO Data Match-up(Level 4)
Test Your LOBO
Abilities(Level 5)
Interpret Graphs
(Level 2)
More info
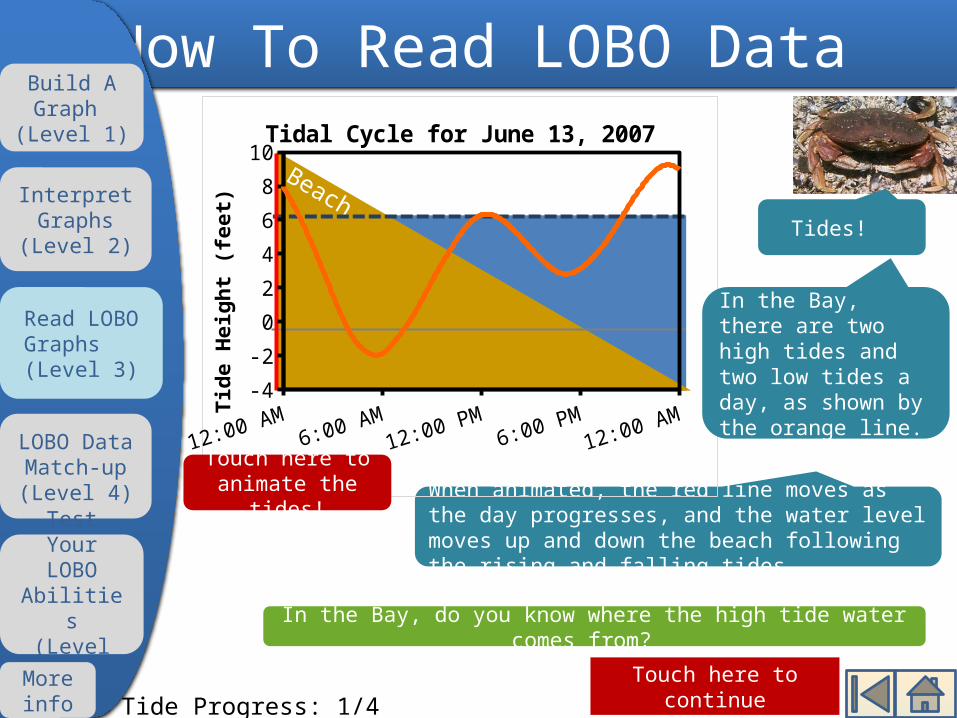
In the Bay, do you know where the high tide water comes from?
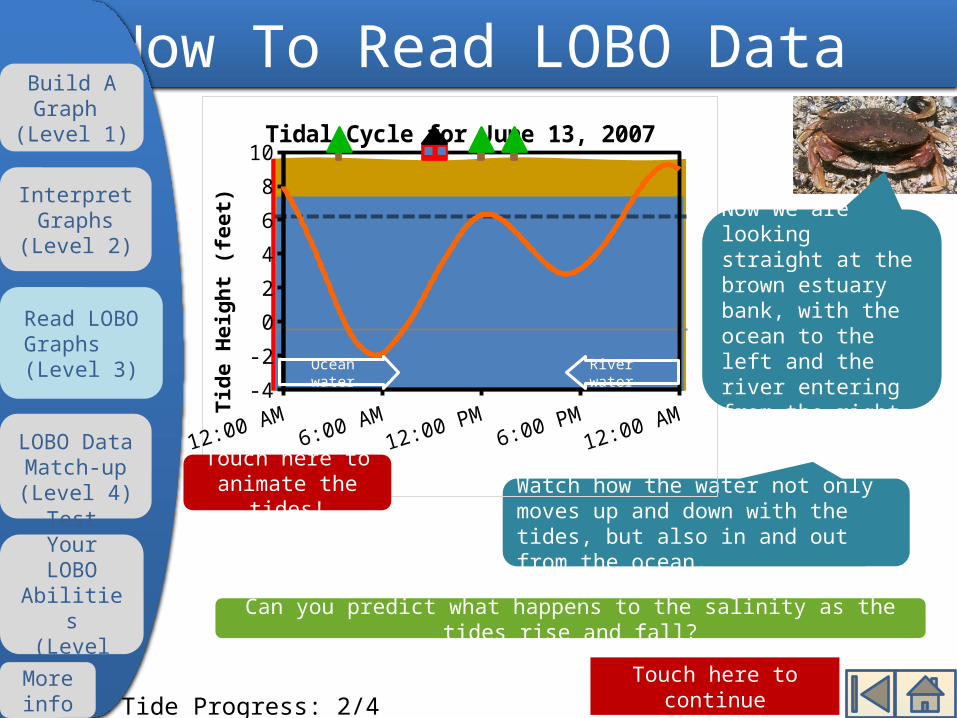
When animated, the red line moves as the day progresses, and the water level moves up and down the beach following the rising and falling tides.
-4-202468
10Tidal Cycle for June 13, 2007
Tide
Hei
ght (
feet
)
Tide Progress: 1/4
Touch here to animate the
tides!
Tides!
In the Bay, there are two high tides and two low tides a day, as shown by the orange line.

Beach
Touch here to continue
How To Read LOBO DataBuild A Graph
(Level 1)
Read LOBO Graphs (Level 3)
LOBO Data Match-up(Level 4)
Test Your LOBO
Abilities(Level 5)
Interpret Graphs
(Level 2)
More info
In the Bay, do you know where the high tide water comes from?
When animated, the red line moves as the day progresses, and the water level moves up and down the beach following the rising and falling tides.
-4-202468
10Tidal Cycle for June 13, 2007
Tide
Hei
ght (
feet
)
Tide Progress: 1/4
Touch here to animate the
tides!
Tides!
In the Bay, there are two high tides and two low tides a day, as shown by the orange line.

Can you predict what happens to the salinity as the tides rise and fall?
Touch here to continue
How To Read LOBO DataBuild A Graph
(Level 1)
Read LOBO Graphs (Level 3)
LOBO Data Match-up(Level 4)
Test Your LOBO
Abilities(Level 5)
Interpret Graphs
(Level 2)
More info
Watch how the water not only moves up and down with the tides, but also in and out from the ocean.
Tide Progress: 2/4
-4-202468
10Tidal Cycle for June 13, 2007
Tide
Hei
ght (
feet
)
Ocean water
River water
Touch here to animate the
tides!
Now we are looking straight at the brown estuary bank, with the ocean to the left and the river entering from the right.
30
31
32
33
Salin
ity (
PSU)
Tide Progress: 3/4
How To Read LOBO Data
More info
Interpret Graphs
(Level 2)
Test Your LOBO
Abilities(Level 5)
LOBO Data Match-up(Level 4)
Read LOBO Graphs (Level 3)
-4-202468
10
Tide
Hei
ght (
feet
)
Build A Graph
(Level 1)
-4-202468
1012
30
31
32
33
Tide
Hei
ght
(fee
t)
Salin
ity
(PSU
)
Touch here to continue
Touch here to animate the
tides!
Ocean water
River water
Ocean water
River water
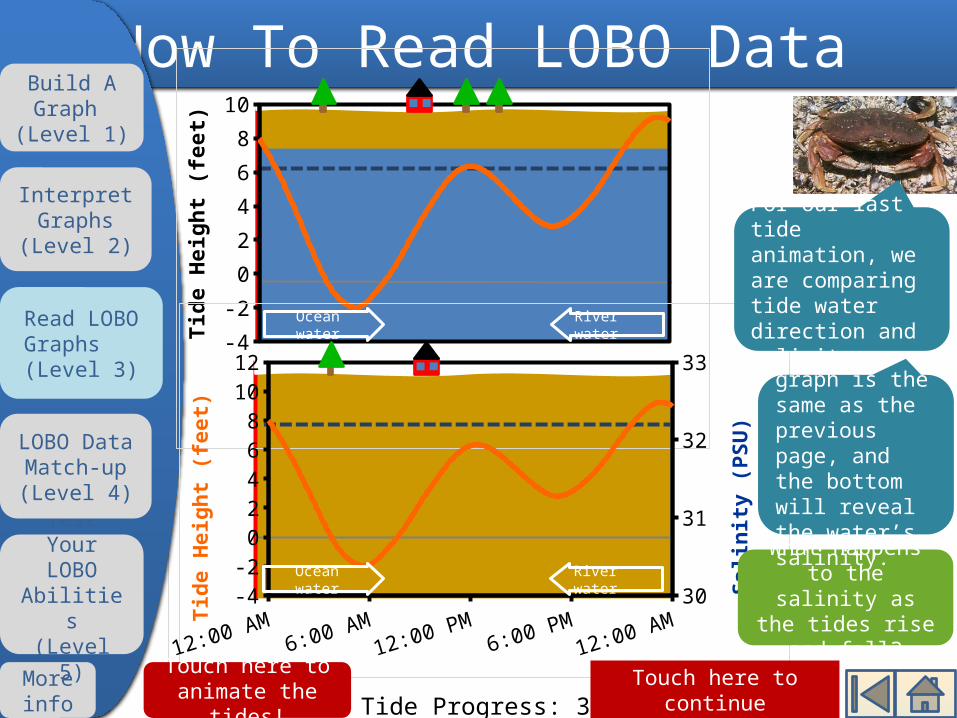
What happens to the salinity as
the tides rise and fall?
The top graph is the same as the previous page, and the bottom will reveal the water’s salinity.
For our last tide animation, we are comparing tide water direction and salinity.

30
31
32
33
Salin
ity (
PSU)
Tide Progress: 3/4
How To Read LOBO Data
More info
Interpret Graphs
(Level 2)
Test Your LOBO
Abilities(Level 5)
LOBO Data Match-up(Level 4)
Read LOBO Graphs (Level 3)
-4-202468
10
Tide
Hei
ght (
feet
)
Build A Graph
(Level 1)
-4-202468
1012
30
31
32
33
Tide
Hei
ght
(fee
t)
Salin
ity
(PSU
)
Ocean water
River water
Ocean water
River water
Touch here to animate the
tides!Touch here to
continue
What happens to the salinity as
the tides rise and fall?
For our last tide animation, we are comparing tide water direction and salinity.
The top graph is the same as the previous page, and the bottom will reveal the water’s salinity.

30
31
32
33
Salin
ity (
PSU)
Tide Progress: 3/4
How To Read LOBO Data
More info
Interpret Graphs
(Level 2)
Test Your LOBO
Abilities(Level 5)
LOBO Data Match-up(Level 4)
Read LOBO Graphs (Level 3)
-4-202468
10
Tide
Hei
ght (
feet
)
Build A Graph
(Level 1)
-4-202468
1012
30
31
32
33
Tide
Hei
ght
(fee
t)
Salin
ity
(PSU
)
Ocean water
River water
Ocean water
River water
Touch here to animate the
tides!Touch here to
continue
What happens to the salinity as
the tides rise and fall?
For our last tide animation, we are comparing tide water direction and salinity.
The top graph is the same as the previous page, and the bottom will reveal the water’s salinity.

Touch here to continue on to the Challenge
section
How To Read LOBO DataBuild A Graph
(Level 1)
Read LOBO Graphs (Level 3)
LOBO Data Match-up(Level 4)
Test Your LOBO
Abilities(Level 5)
Interpret Graphs
(Level 2)
More info
In general, salinity follows the tidal pattern of the Bay.
The rising tide pulls salty ocean water into the Bay (causing high tide have higher salinity), and the falling tide allows more river water into the Bay (causing low tide to have lower salinity).
12:00 AM6:00 AM
12:00 PM6:00 PM
12:00 AM-4-202468
10
30
31
32
33Tidal Cycle for June 13, 2007
Tide
Hei
ght (
feet
)
Salin
ity (
PSU)
Do the tide and salinity highs and lows occur at the same time? What do you think is causing this?

How To Read LOBO DataBuild A Graph
(Level 1)
Read LOBO Graphs (Level 3)
LOBO Data Match-up(Level 4)
Test Your LOBO
Abilities(Level 5)
Interpret Graphs
(Level 2)
More info
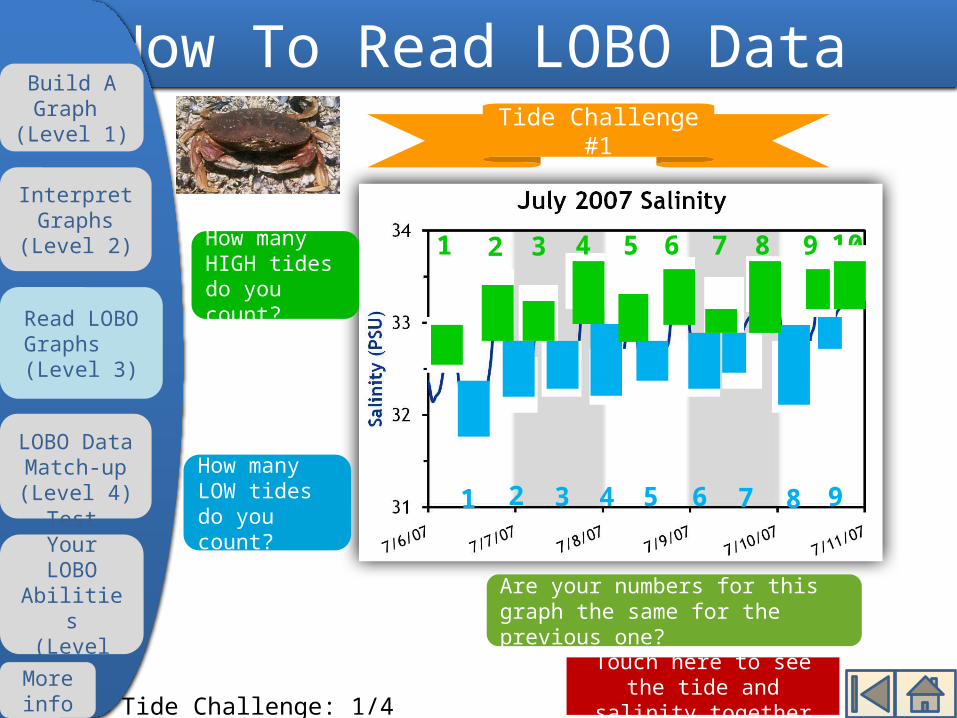
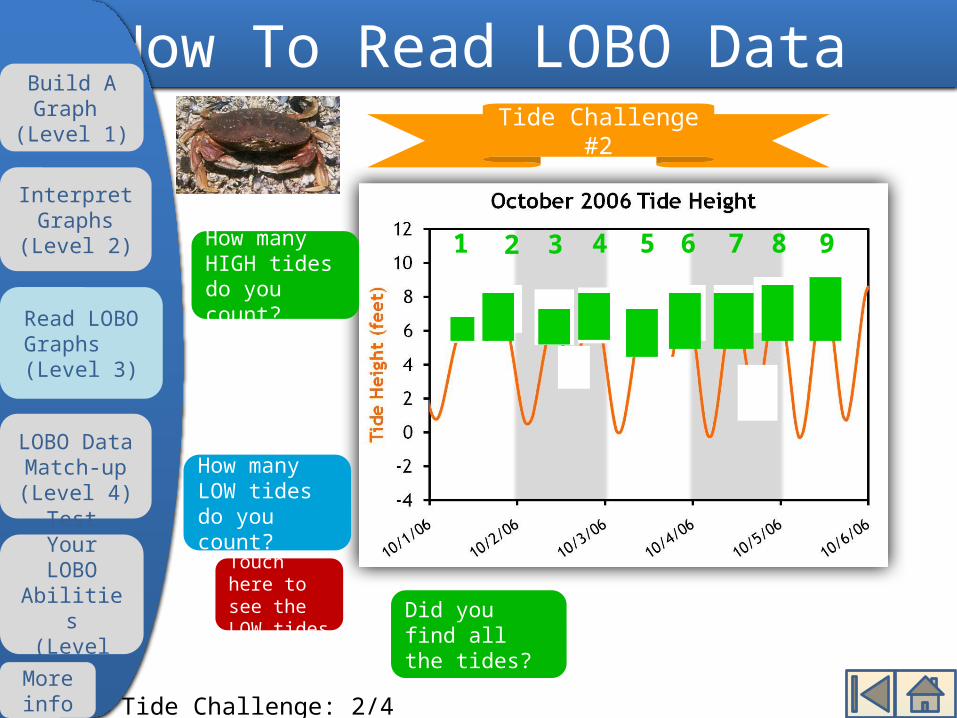
How many HIGH tides do you count?
How many LOW tides do you count?
Tide Challenge #1
Tide Challenge: 1/4
Touch here to see the HIGH tides
Touch here to see the LOW tides

How To Read LOBO DataBuild A Graph
(Level 1)
Read LOBO Graphs (Level 3)
LOBO Data Match-up(Level 4)
Test Your LOBO
Abilities(Level 5)
Interpret Graphs
(Level 2)
More info
How many HIGH tides do you count?
How many LOW tides do you count?
1 2 3 4 5 6 7 8 109
Tide Challenge #1
Tide Challenge: 1/4
Touch here to see the LOW tides Did you find
all the tides?

Touch here to see the salinity
How To Read LOBO DataBuild A Graph
(Level 1)
Read LOBO Graphs (Level 3)
LOBO Data Match-up(Level 4)
Test Your LOBO
Abilities(Level 5)
Interpret Graphs
(Level 2)
More info
How many HIGH tides do you count?
How many LOW tides do you count?
1 2 3 4 5 6 7 8 109
1 2 3 4 5 6 7 8 9
Tide Challenge #1
Tide Challenge: 1/4
Did you find all the tides?

How To Read LOBO DataBuild A Graph
(Level 1)
Read LOBO Graphs (Level 3)
LOBO Data Match-up(Level 4)
Test Your LOBO
Abilities(Level 5)
Interpret Graphs
(Level 2)
More info
How many HIGH tides do you count?
How many LOW tides do you count?
1 2 3 4 5 6 7 8 9
Tide Challenge #1
Tide Challenge: 1/4
Touch here to see the HIGH tides
Did you find all the tides?

Touch here to see the salinity
How To Read LOBO DataBuild A Graph
(Level 1)
Read LOBO Graphs (Level 3)
LOBO Data Match-up(Level 4)
Test Your LOBO
Abilities(Level 5)
Interpret Graphs
(Level 2)
More info
How many HIGH tides do you count?
How many LOW tides do you count?
1 2 3 4 5 6 7 8 109
1 2 3 4 5 6 7 8 9
Tide Challenge #1
Tide Challenge: 1/4
Did you find all the tides?

How To Read LOBO DataBuild A Graph
(Level 1)
Read LOBO Graphs (Level 3)
LOBO Data Match-up(Level 4)
Test Your LOBO
Abilities(Level 5)
Interpret Graphs
(Level 2)
More info
Are your numbers for this graph the same for the previous one?
How many HIGH tides do you count?
How many LOW tides do you count?
Tide Challenge #1
Tide Challenge: 1/4
Touch here to see the HIGH tides
Touch here to see the LOW tides

How To Read LOBO DataBuild A Graph
(Level 1)
Read LOBO Graphs (Level 3)
LOBO Data Match-up(Level 4)
Test Your LOBO
Abilities(Level 5)
Interpret Graphs
(Level 2)
More info
Are your numbers for this graph the same for the previous one?
1 2 3 4 5 6 7 8 109How many HIGH tides do you count?
How many LOW tides do you count?
Tide Challenge #1
Tide Challenge: 1/4
Touch here to see the LOW tides

Touch here to see the tide and salinity
together
How To Read LOBO DataBuild A Graph
(Level 1)
Read LOBO Graphs (Level 3)
LOBO Data Match-up(Level 4)
Test Your LOBO
Abilities(Level 5)
Interpret Graphs
(Level 2)
More info
Are your numbers for this graph the same for the previous one?
1 2 3 4 5 6 7 8 109
1 2 3 4 5 6 7 8 9
How many HIGH tides do you count?
How many LOW tides do you count?
Tide Challenge #1
Tide Challenge: 1/4

How To Read LOBO DataBuild A Graph
(Level 1)
Read LOBO Graphs (Level 3)
LOBO Data Match-up(Level 4)
Test Your LOBO
Abilities(Level 5)
Interpret Graphs
(Level 2)
More info
Are your numbers for this graph the same for the previous one?
1 2 3 4 5 6 7 8 9
How many HIGH tides do you count?
How many LOW tides do you count?
Tide Challenge #1
Tide Challenge: 1/4
Touch here to see the HIGH tides
Touch here to see the tide and salinity
together
How To Read LOBO DataBuild A Graph
(Level 1)
Read LOBO Graphs (Level 3)
LOBO Data Match-up(Level 4)
Test Your LOBO
Abilities(Level 5)
Interpret Graphs
(Level 2)
More info
Are your numbers for this graph the same for the previous one?
1 2 3 4 5 6 7 8 109
1 2 3 4 5 6 7 8 9
How many HIGH tides do you count?
How many LOW tides do you count?
Tide Challenge #1
Tide Challenge: 1/4
Touch here for Challenge #2
How To Read LOBO DataBuild A Graph
(Level 1)
Read LOBO Graphs (Level 3)
LOBO Data Match-up(Level 4)
Test Your LOBO
Abilities(Level 5)
Interpret Graphs
(Level 2)
More info
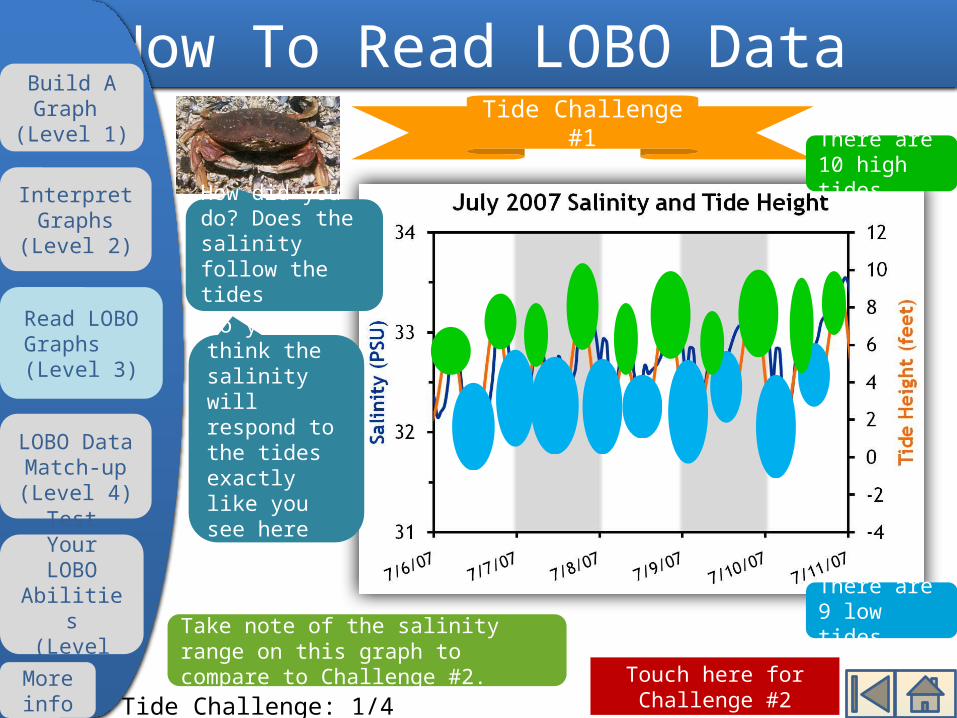
Tide Challenge #1 There are
10 high tides.
There are 9 low tides.Take note of the salinity range on
this graph to compare to Challenge #2.
How did you do? Does the salinity follow the tides exactly?
Do you think the salinity will respond to the tides exactly like you see here every day?
Tide Challenge: 1/4

How To Read LOBO DataBuild A Graph
(Level 1)
Read LOBO Graphs (Level 3)
LOBO Data Match-up(Level 4)
Test Your LOBO
Abilities(Level 5)
Interpret Graphs
(Level 2)
More info
How many HIGH tides do you count?
How many LOW tides do you count?
Tide Challenge #2
Tide Challenge: 2/4
Touch here to see the HIGH tides
Touch here to see the LOW tides
How To Read LOBO DataBuild A Graph
(Level 1)
Read LOBO Graphs (Level 3)
LOBO Data Match-up(Level 4)
Test Your LOBO
Abilities(Level 5)
Interpret Graphs
(Level 2)
More info
1 2 3 4 5 6 7 8 9How many HIGH tides do you count?
How many LOW tides do you count?
Tide Challenge #2
Tide Challenge: 2/4
Touch here to see the LOW tides Did you find
all the tides?

Touch here to see the salinity
How To Read LOBO DataBuild A Graph
(Level 1)
Read LOBO Graphs (Level 3)
LOBO Data Match-up(Level 4)
Test Your LOBO
Abilities(Level 5)
Interpret Graphs
(Level 2)
More info
1 2 3 4 5 6 7 8
10
9
1 2 3 4 5 6 7 8 9
How many HIGH tides do you count?
How many LOW tides do you count?
Tide Challenge #2
Tide Challenge: 2/4
Did you find all the tides?

How To Read LOBO DataBuild A Graph
(Level 1)
Read LOBO Graphs (Level 3)
LOBO Data Match-up(Level 4)
Test Your LOBO
Abilities(Level 5)
Interpret Graphs
(Level 2)
More info
101 2 3 4 5 6 7 8 9
How many HIGH tides do you count?
How many LOW tides do you count?
Tide Challenge #2
Tide Challenge: 2/4
Touch here to see the HIGH tides
Did you find all the tides?

Touch here to see the salinity
How To Read LOBO DataBuild A Graph
(Level 1)
Read LOBO Graphs (Level 3)
LOBO Data Match-up(Level 4)
Test Your LOBO
Abilities(Level 5)
Interpret Graphs
(Level 2)
More info
1 2 3 4 5 6 7 8
10
9
1 2 3 4 5 6 7 8 9
How many HIGH tides do you count?
How many LOW tides do you count?
Tide Challenge #2
Tide Challenge: 2/4
Did you find all the tides?

How To Read LOBO DataBuild A Graph
(Level 1)
Read LOBO Graphs (Level 3)
LOBO Data Match-up(Level 4)
Test Your LOBO
Abilities(Level 5)
Interpret Graphs
(Level 2)
More info
Are your numbers for this graph the same for the previous one?
How many HIGH tides do you count?
How many LOW tides do you count?
Tide Challenge #2
Tide Challenge: 2/4
Touch here to see the HIGH tides
Touch here to see the LOW tides

How To Read LOBO DataBuild A Graph
(Level 1)
Read LOBO Graphs (Level 3)
LOBO Data Match-up(Level 4)
Test Your LOBO
Abilities(Level 5)
Interpret Graphs
(Level 2)
More info
1 2 3 4 5 6 7 8 9
Are your numbers for this graph the same for the previous one?
How many HIGH tides do you count?
How many LOW tides do you count?
Tide Challenge #2
Tide Challenge: 2/4
Touch here to see the LOW tides

Touch here to see the tide and salinity
together
How To Read LOBO DataBuild A Graph
(Level 1)
Read LOBO Graphs (Level 3)
LOBO Data Match-up(Level 4)
Test Your LOBO
Abilities(Level 5)
Interpret Graphs
(Level 2)
More info
1 2 3 4 5 6 7 8
10
9
1 2 3 4 5 6 7 8 9
Are your numbers for this graph the same for the previous one?
How many HIGH tides do you count?
How many LOW tides do you count?
Tide Challenge #2
Tide Challenge: 2/4

How To Read LOBO DataBuild A Graph
(Level 1)
Read LOBO Graphs (Level 3)
LOBO Data Match-up(Level 4)
Test Your LOBO
Abilities(Level 5)
Interpret Graphs
(Level 2)
More info
101 2 3 4 5 6 7 8 9
Are your numbers for this graph the same for the previous one?
How many HIGH tides do you count?
How many LOW tides do you count?
Tide Challenge #2
Tide Challenge: 2/4
Touch here to see the HIGH tides

Touch here to see the tide and salinity
together
How To Read LOBO DataBuild A Graph
(Level 1)
Read LOBO Graphs (Level 3)
LOBO Data Match-up(Level 4)
Test Your LOBO
Abilities(Level 5)
Interpret Graphs
(Level 2)
More info
1 2 3 4 5 6 7 8
10
9
1 2 3 4 5 6 7 8 9
Are your numbers for this graph the same for the previous one?
How many HIGH tides do you count?
How many LOW tides do you count?
Tide Challenge #2
Tide Challenge: 2/4

Touch here for Challenge #3
How To Read LOBO DataBuild A Graph
(Level 1)
Read LOBO Graphs (Level 3)
LOBO Data Match-up(Level 4)
Test Your LOBO
Abilities(Level 5)
Interpret Graphs
(Level 2)
More info
Tide Challenge #2 There are 9
high tides.
There are 10 low tides.How do you think the salinity range
plays a role in the salinity response to tides?
How did you do? Does the salinity follow the tides exactly?Does the salinity here look the same as the salinity in Challenge #1? (Challenge #1 salinity range: 31-34 PSU.
Tide Challenge: 2/4
Touch here to see the answer
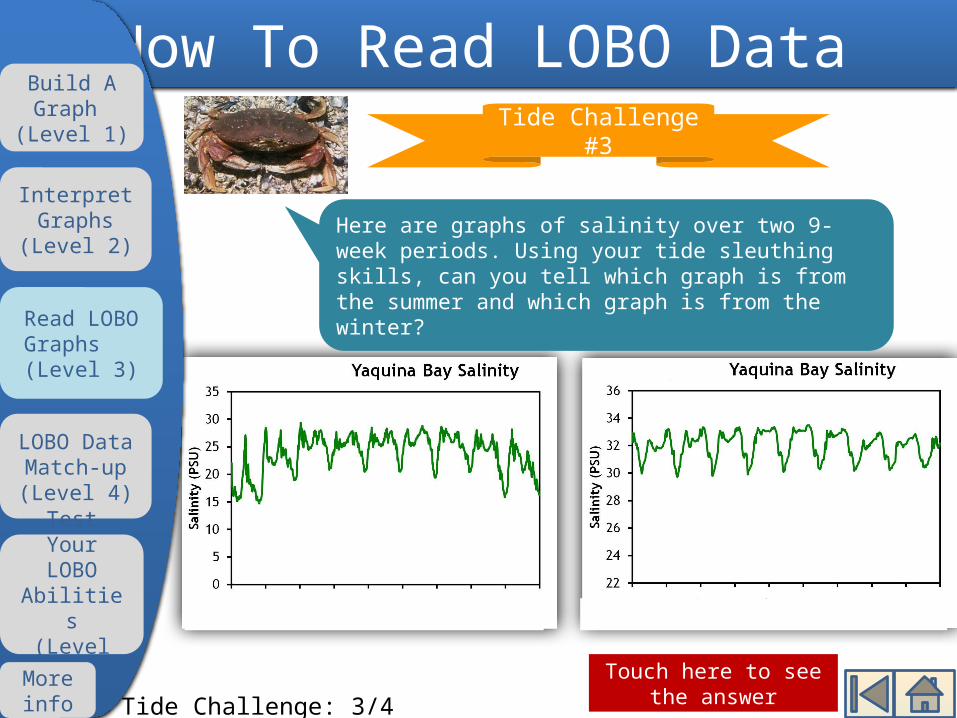
Here are graphs of salinity over two 9-week periods. Using your tide sleuthing skills, can you tell which graph is from the summer and which graph is from the winter?
How To Read LOBO DataBuild A Graph
(Level 1)
Read LOBO Graphs (Level 3)
LOBO Data Match-up(Level 4)
Test Your LOBO
Abilities(Level 5)
Interpret Graphs
(Level 2)
More info
Tide Challenge #3
Tide Challenge: 3/4
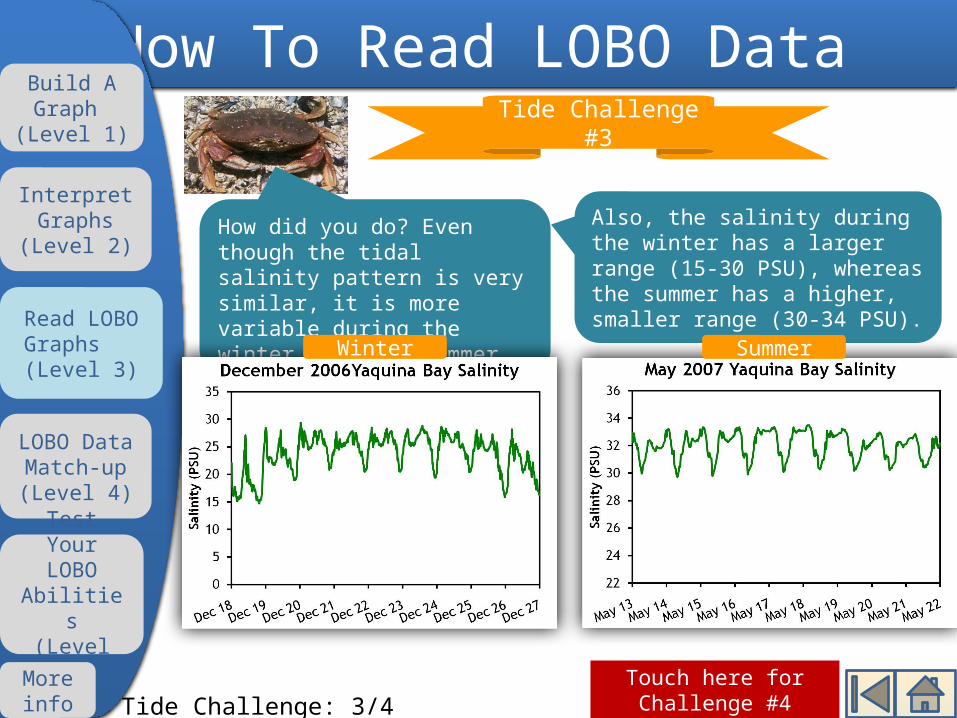
Also, the salinity during the winter has a larger range (15-30 PSU), whereas the summer has a higher, smaller range (30-34 PSU).
Touch here for Challenge #4
How did you do? Even though the tidal salinity pattern is very similar, it is more variable during the winter than the summer.
How To Read LOBO DataBuild A Graph
(Level 1)
Read LOBO Graphs (Level 3)
LOBO Data Match-up(Level 4)
Test Your LOBO
Abilities(Level 5)
Interpret Graphs
(Level 2)
More info
Tide Challenge #3
Winter Summer
Tide Challenge: 3/4

Touch here to see the answer
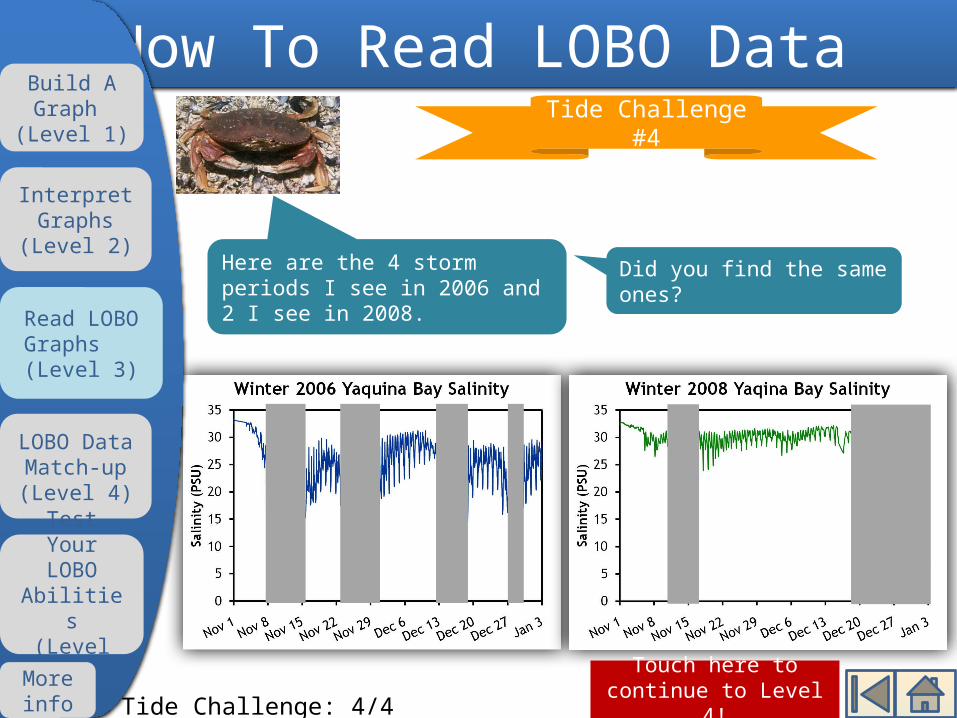
This last challenge tests your storm detecting skills!
How To Read LOBO DataBuild A Graph
(Level 1)
Read LOBO Graphs (Level 3)
LOBO Data Match-up(Level 4)
Test Your LOBO
Abilities(Level 5)
Interpret Graphs
(Level 2)
More info
Tide Challenge #4
I chose two years with very different rain patterns. How many distinct storm periods can you count for the same 9 weeks in each year?
Tide Challenge: 4/4
Touch here to continue to Level 4!
Here are the 4 storm periods I see in 2006 and 2 I see in 2008.
How To Read LOBO DataBuild A Graph
(Level 1)
Read LOBO Graphs (Level 3)
LOBO Data Match-up(Level 4)
Test Your LOBO
Abilities(Level 5)
Interpret Graphs
(Level 2)
More info
Tide Challenge #4
Did you find the same ones?
Tide Challenge: 4/4

Touch here to start your Yaquina Bay
data investigation!
Hey, I’m Seb the Rockfish. In this section, you will help me match up graphs of rain and salinity!
LOBO is measuring rhythms of Yaquina Bay right now, and since it takes measurements every hour, we can look closely at these rhythms.
Do you have the skills to figure out how much rain changes the salinity of the Bay on a day to day basis? Lets find out!
LOBO Data Match-upBuild A Graph
(Level 1)
Read LOBO Graphs (Level 3)
LOBO Data Match-up(Level 4)
Test Your LOBO
Abilities(Level 5)
Interpret Graphs
(Level 2)
More info

Here are graphs of daily rainfall for four 20-day periods (they are also on one of the signs next to the computer). Touch the buttons below to look at the salinity data graphs of those same 20-day time periods.
Nov 25, 2007 to Dec 11,
2007Feb 1, 2008 to Feb 20, 2008
May 19, 2008 to June 7, 2008Aug 11, 2008
to Aug 30, 2008
Your task: Compare the rainfall graphs here and the salinity graphs on the web site to match up the correct dates with each rainfall graph.
Graph 1
Graph 2
Graph 3
Graph 4
Think you figured it out? Touch here to check your answers!
LOBO Data Match-upBuild A Graph
(Level 1)
Read LOBO Graphs (Level 3)
LOBO Data Match-up(Level 4)
Test Your LOBO
Abilities(Level 5)
Interpret Graphs
(Level 2)
More info
What is PSU?

How did you do matching up the rainfall and salinity
graphs?
LOBO Data Match-upBuild A Graph
(Level 1)
Read LOBO Graphs (Level 3)
LOBO Data Match-up(Level 4)
Test Your LOBO
Abilities(Level 5)
Interpret Graphs
(Level 2)
More info
Touch here to continue to Level 5!

Hi, I am Stella the Sea lion. Are you up for a challenge?
Touch here to test your Yaquina Bay LOBO data ability!
Now is your chance to sleuth around the real-time data collected by LOBO and find some patterns for yourself!
If you think this level is too difficult, jump back a few levels for something easier.
Test Your LOBO AbilitiesBuild A Graph
(Level 1)
Read LOBO Graphs (Level 3)
LOBO Data Match-up(Level 4)
Test Your LOBO
Abilities(Level 5)
Interpret Graphs
(Level 2)
More info
Data from LOBO is online and updated every hour. You can make your own graphs using the website to check out what’s been going on in the Bay since it was deployed in November 2007.

What is the salinity for the past 24 hours, week or month?
Touch here visit the LOBO website and see the data online!
If you find any of these, share your interpretation of what is happening in the exhibit notebook. Good luck!
Can you create a story about what happened with the weather, ocean, and river water to explain the data collected from the Bay?
Test Your LOBO AbilitiesBuild A Graph
(Level 1)
Read LOBO Graphs (Level 3)
LOBO Data Match-up(Level 4)
Test Your LOBO
Abilities(Level 5)
Interpret Graphs
(Level 2)
More info
Not sure how to begin? Touch here to see an example.
Your task: Answer any of the following questions about Yaquina Bay’s salinity using data from the LOBO website.
What is the lowest salinity of the most recent rain storm?
Is there 24 hours when the salinity changed at least 10, 15, or 20 PSU?
Is there a week when the salinity didn’t change more than 2 PSU?
Can you find any other period of time or salinity pattern that is interesting to you?
Find the salinity… Find when…
What is PSU?
Test Your LOBO Abilities
Touch here to continue
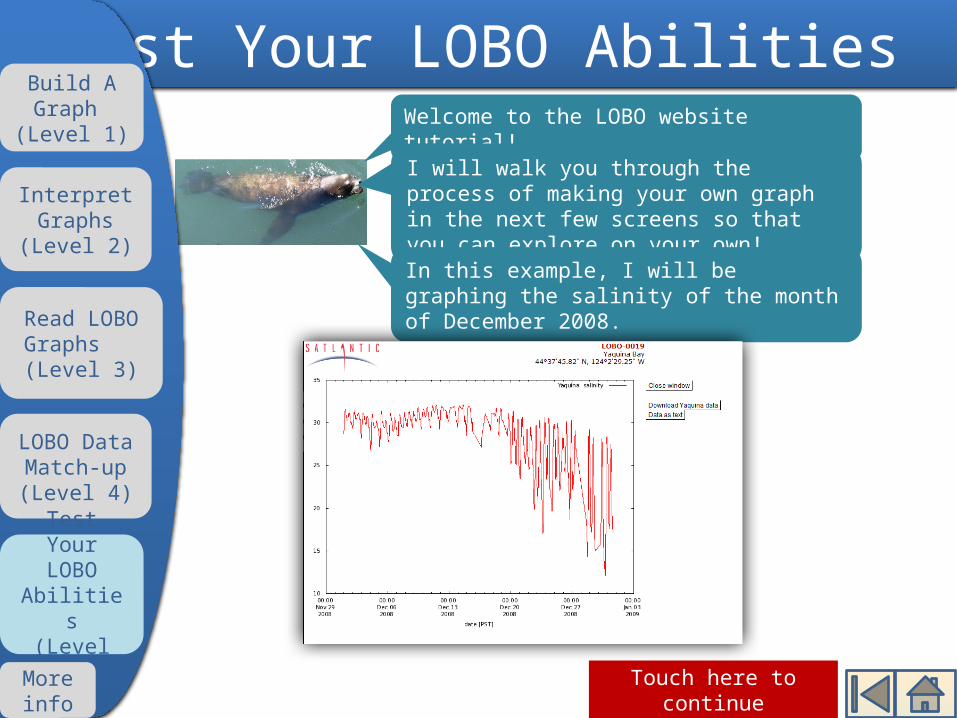
Welcome to the LOBO website tutorial!
I will walk you through the process of making your own graph in the next few screens so that you can explore on your own!
Build A Graph
(Level 1)
Read LOBO Graphs (Level 3)
LOBO Data Match-up(Level 4)
Test Your LOBO
Abilities(Level 5)
Interpret Graphs
(Level 2)
More info
In this example, I will be graphing the salinity of the month of December 2008.

Test Your LOBO Abilities
Touch here to continue
The current conditions in the Bay.
The data to be graphed on the horizontal or bottom axis.
The data to be graphed on the vertical or left axis.
The date range to be graphed.
The first page you will encounter is called LOBOviz. There are 4 different columns of information.
Build A Graph
(Level 1)
Read LOBO Graphs (Level 3)
LOBO Data Match-up(Level 4)
Test Your LOBO
Abilities(Level 5)
Interpret Graphs
(Level 2)
More info
Test Your LOBO Abilities
Touch here to continue
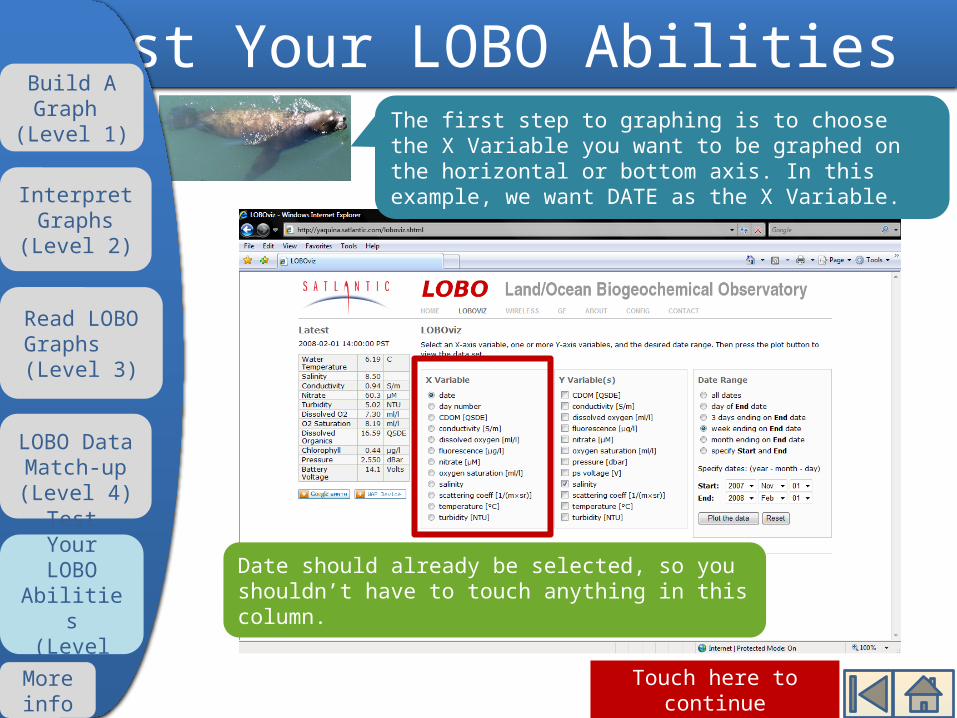
Date should already be selected, so you shouldn’t have to touch anything in this column.
The first step to graphing is to choose the X Variable you want to be graphed on the horizontal or bottom axis. In this example, we want DATE as the X Variable.
Build A Graph
(Level 1)
Read LOBO Graphs (Level 3)
LOBO Data Match-up(Level 4)
Test Your LOBO
Abilities(Level 5)
Interpret Graphs
(Level 2)
More info

Test Your LOBO Abilities
Touch here to continue
To look at salinity, uncheck Nitrate and check Salinity. You may choose later to look at other variables as well.
Step 2: Choose the Y Variable you want to be graphed on the vertical or left axis. We want SALINITY as the Y Variable.
Build A Graph
(Level 1)
Read LOBO Graphs (Level 3)
LOBO Data Match-up(Level 4)
Test Your LOBO
Abilities(Level 5)
Interpret Graphs
(Level 2)
More info

Test Your LOBO Abilities
Touch here to continue
Select “Specify Start and End”, and using the pull-down menus, input the date range you want to look at.
Step 3: Choose the date range that you want to graph. We want the month of DECEMBER 2008, so we will have to specify Start and End dates.
Build A Graph
(Level 1)
Read LOBO Graphs (Level 3)
LOBO Data Match-up(Level 4)
Test Your LOBO
Abilities(Level 5)
Interpret Graphs
(Level 2)
More info

Test Your LOBO Abilities
Touch here to continue
Step 4: Make sure you selected everything correctly then touch “Plot the data” to make your graph!
The graph will show up in a new web page.
Build A Graph
(Level 1)
Read LOBO Graphs (Level 3)
LOBO Data Match-up(Level 4)
Test Your LOBO
Abilities(Level 5)
Interpret Graphs
(Level 2)
More info

Test Your LOBO Abilities
Touch here to go make your own
graph!
The range of the Y axis changes to fit the graph.
Close the window by touching the button on the page or X-ing out in the upper right corner.
Step 5: Check out the graph you made! Can you think of any reasons why the first half of the month looks so different from the second half?
Build A Graph
(Level 1)
Read LOBO Graphs (Level 3)
LOBO Data Match-up(Level 4)
Test Your LOBO
Abilities(Level 5)
Interpret Graphs
(Level 2)
More info

Ocean
RiverEstuary
Yaquina Bay Estuary
= location of HMSC/ You Are Here
Ocean
River
Estuaries are coastal bodies of water that have a mix of salty ocean water and fresh river water.
Salt water Fresh water
They provide habitat and nursing grounds for many animals that are important to the ecosystem and humans.
Plants and animals living in the estuary have adapted to live in both fresh and salty water.
What is an estuary?Build A Graph
(Level 1)
Read LOBO Graphs (Level 3)
LOBO Data Match-up(Level 4)
Test Your LOBO
Abilities(Level 5)
Interpret Graphs
(Level 2)
More info

Tides wash in and out daily creating a predicable pattern of high and low tides.
This movement of the water is influenced by the gravity of the moon.
Ocean
RiverEstuary
A flooding tide creates high tide by pushing ocean water into the estuary
Tide Source: NOAA Moon Image Source: NASA
Tide Height at South Beach, OR Over An Entire Lunar Cycle
Touch here to go to a NOAA website that further explains tides
An ebbing tide creates low tide by pulling river water into the estuary
How do tides affect an estuary?Build A Graph
(Level 1)
Read LOBO Graphs (Level 3)
LOBO Data Match-up(Level 4)
Test Your LOBO
Abilities(Level 5)
Interpret Graphs
(Level 2)
More info

Salinity is the amount of salt in water. In estuaries, it is affected by:
• Fresh water from rain and rivers• Salty water from the ocean
Salinity is measured in PSU, or Practical Salinity Units.
RiverEstuary
Summer
Little Rain
Low River flow
High Evaporation
RiverEstuary
Lots of Rain
High River flow
Winter
Low Evaporation
In the winter, there are many big storms that increase the fresh water flow into the estuary, making it less salty.
In the summer, low rain and river flow creates a more ocean-influenced and saltier estuary.
What is PSU and salinity?Build A Graph
(Level 1)
Read LOBO Graphs (Level 3)
LOBO Data Match-up(Level 4)
Test Your LOBO
Abilities(Level 5)
Interpret Graphs
(Level 2)
More info
PSU is similar to parts per thousand, or ppt, another unit of measure for salinity. The way that salinity data is collected results in numbers with no units, so scientists use PSU.
Salinity is measured in PSU, or Practical Salinity Units.
What is PSU and salinity?Build A Graph
(Level 1)
Read LOBO Graphs (Level 3)
LOBO Data Match-up(Level 4)
Test Your LOBO
Abilities(Level 5)
Interpret Graphs
(Level 2)
More info
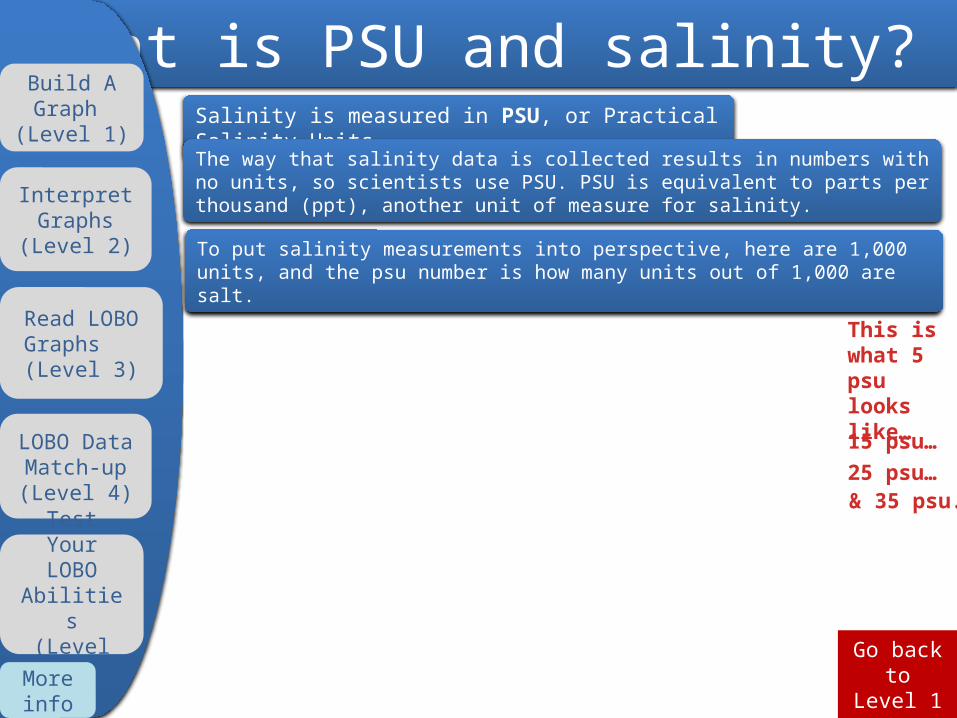
The way that salinity data is collected results in numbers with no units, so scientists use PSU. PSU is equivalent to parts per thousand (ppt), another unit of measure for salinity.
To put salinity measurements into perspective, here are 1,000 units, and the psu number is how many units out of 1,000 are salt.
This is what 5 psu looks like…15 psu…25 psu…& 35 psu.
Go back to Level
1

Salinity is measured in PSU, or Practical Salinity Units.
What is PSU and salinity?Build A Graph
(Level 1)
Read LOBO Graphs (Level 3)
LOBO Data Match-up(Level 4)
Test Your LOBO
Abilities(Level 5)
Interpret Graphs
(Level 2)
More info
The way that salinity data is collected results in numbers with no units, so scientists use PSU. PSU is equivalent to parts per thousand (ppt), another unit of measure for salinity.
To put salinity measurements into perspective, here are 1,000 units, and the psu number is how many units out of 1,000 are salt.
This is what 5 psu looks like…15 psu…25 psu…& 35 psu.
Go back to Level
2

Salinity is measured in PSU, or Practical Salinity Units.
What is PSU and salinity?Build A Graph
(Level 1)
Read LOBO Graphs (Level 3)
LOBO Data Match-up(Level 4)
Test Your LOBO
Abilities(Level 5)
Interpret Graphs
(Level 2)
More info
The way that salinity data is collected results in numbers with no units, so scientists use PSU. PSU is equivalent to parts per thousand (ppt), another unit of measure for salinity.
To put salinity measurements into perspective, here are 1,000 units, and the psu number is how many units out of 1,000 are salt.
This is what 5 psu looks like…15 psu…25 psu…& 35 psu.
Go back to Level
3

Salinity is measured in PSU, or Practical Salinity Units.
What is PSU and salinity?Build A Graph
(Level 1)
Read LOBO Graphs (Level 3)
LOBO Data Match-up(Level 4)
Test Your LOBO
Abilities(Level 5)
Interpret Graphs
(Level 2)
More info
The way that salinity data is collected results in numbers with no units, so scientists use PSU. PSU is equivalent to parts per thousand (ppt), another unit of measure for salinity.
To put salinity measurements into perspective, here are 1,000 units, and the psu number is how many units out of 1,000 are salt.
This is what 5 psu looks like…15 psu…25 psu…& 35 psu.
Go back to Level
4

Salinity is measured in PSU, or Practical Salinity Units.
What is PSU and salinity?Build A Graph
(Level 1)
Read LOBO Graphs (Level 3)
LOBO Data Match-up(Level 4)
Test Your LOBO
Abilities(Level 5)
Interpret Graphs
(Level 2)
More info
The way that salinity data is collected results in numbers with no units, so scientists use PSU. PSU is equivalent to parts per thousand (ppt), another unit of measure for salinity.
To put salinity measurements into perspective, here are 1,000 units, and the psu number is how many units out of 1,000 are salt.
This is what 5 psu looks like…15 psu…25 psu…& 35 psu.
Go back to Level
5

Salinity is measured in PSU, or Practical Salinity Units.
What is PSU and salinity?Build A Graph
(Level 1)
Read LOBO Graphs (Level 3)
LOBO Data Match-up(Level 4)
Test Your LOBO
Abilities(Level 5)
Interpret Graphs
(Level 2)
More info
The way that salinity data is collected results in numbers with no units, so scientists use PSU. PSU is equivalent to parts per thousand (ppt), another unit of measure for salinity.
To put salinity measurements into perspective, here are 1,000 units, and the psu number is how many units out of 1,000 are salt.
This is what 5 psu looks like…15 psu…25 psu…& 35 psu.
Go back to More
Info

LOBO stands for Land-Ocean Biogeochemical Observatory.
LOBO is dock-deployed across the Bay from HMSC. It has been collecting data about the water on the hour everyday since November 2007.
Plant and
Animal Life
Temperature Salinity
Dissolved Oxygen Nitrate
Dissolved organics
Bio - Geo-physical - Chemistry
Break it down!Temperature
SalinityDissolved OxygenNitrate
Fluorescence/Chlorophyll
Turbidity
Dissolved Organics
How the data gets
online
Select a button below to learn more about the instrumentation:
What is LOBO?Build A Graph
(Level 1)
Read LOBO Graphs (Level 3)
LOBO Data Match-up(Level 4)
Test Your LOBO
Abilities(Level 5)
Interpret Graphs
(Level 2)
More info

Temperature, Salinity, and Dissolved Oxygen Sensor
Select a button below to learn more about the instrumentation:
Measures:TemperatureHow cold or hot the water is
SalinityHow much salt is in the water
Dissolved OxygenHow much oxygen is in the water
TemperatureSalinity
Dissolved OxygenNitrate
Fluorescence/Chlorophyll
Turbidity
Dissolved Organics
How the data gets
online
What is LOBO?Build A Graph
(Level 1)
Read LOBO Graphs (Level 3)
LOBO Data Match-up(Level 4)
Test Your LOBO
Abilities(Level 5)
Interpret Graphs
(Level 2)
More info

Dissolved Organic Sensor
Select a button below to learn more about the instrumentation:
Measures:Dissolved OrganicsHow discolored the water is due to pigments (tannins) being released by broken down plants and animals
TemperatureSalinity
Dissolved OxygenNitrate
Fluorescence/Chlorophyll
Turbidity
Dissolved Organics
How the data gets
online
What is LOBO?Build A Graph
(Level 1)
Read LOBO Graphs (Level 3)
LOBO Data Match-up(Level 4)
Test Your LOBO
Abilities(Level 5)
Interpret Graphs
(Level 2)
More info

Nitrate Sensor
Select a button below to learn more about the instrumentation:
Measures:NitrateHow much nutrients are in the water
TemperatureSalinity
Dissolved OxygenNitrate
Fluorescence/Chlorophyll
Turbidity
Dissolved Organics
How the data gets
online
What is LOBO?Build A Graph
(Level 1)
Read LOBO Graphs (Level 3)
LOBO Data Match-up(Level 4)
Test Your LOBO
Abilities(Level 5)
Interpret Graphs
(Level 2)
More info

Fluorescence and Turbidity Sensor
Select a button below to learn more about the instrumentation:
Measures:Chlorophyll
How much pigment used by plants for photosynthesis is in the water
TurbidityHow clear or cloudy the water is
TemperatureSalinity
Dissolved OxygenNitrate
Fluorescence/Chlorophyll
Turbidity
Dissolved Organics
How the data gets
online
What is LOBO?Build A Graph
(Level 1)
Read LOBO Graphs (Level 3)
LOBO Data Match-up(Level 4)
Test Your LOBO
Abilities(Level 5)
Interpret Graphs
(Level 2)
More info

Telemetry System
Select a button below to learn more about the instrumentation:
LOBO Telemetry SystemLinks to the internet every
hour, via cell phone, and sends an email of the data to the
website
TemperatureSalinity
Dissolved OxygenNitrate
Fluorescence/Chlorophyll
Turbidity
Dissolved Organics
How the data gets
online
What is LOBO?Build A Graph
(Level 1)
Read LOBO Graphs (Level 3)
LOBO Data Match-up(Level 4)
Test Your LOBO
Abilities(Level 5)
Interpret Graphs
(Level 2)
More info

LOBO stands for Land-Ocean Biogeochemical Observatory.
LOBO is dock-deployed across the Bay from HMSC. It has been collecting data about the water on the hour everyday since November 2007.
Plant and
Animal Life
Temperature Salinity
Dissolved Oxygen Nitrate
Dissolved organics
Bio - Geo-physical - Chemistry
Break it down!Temperature
SalinityDissolved OxygenNitrate
Fluorescence/Chlorophyll
Turbidity
Dissolved Organics
How the data gets
online
Select a button below to learn more about the instrumentation:
What is LOBO?Build A Graph
(Level 1)
Read LOBO Graphs (Level 3)
LOBO Data Match-up(Level 4)
Test Your LOBO
Abilities(Level 5)
Interpret Graphs
(Level 2)
More info

Temperature, Salinity, and Dissolved Oxygen Sensor
Select a button below to learn more about the instrumentation:
Measures:TemperatureHow cold or hot the water is
SalinityHow much salt is in the water
Dissolved OxygenHow much oxygen is in the water
What is LOBO?Build A Graph
(Level 1)
Read LOBO Graphs (Level 3)
LOBO Data Match-up(Level 4)
Test Your LOBO
Abilities(Level 5)
Interpret Graphs
(Level 2)
More info
TemperatureSalinity
Dissolved OxygenNitrate
Fluorescence/Chlorophyll
Turbidity
Dissolved Organics
How the data gets
online
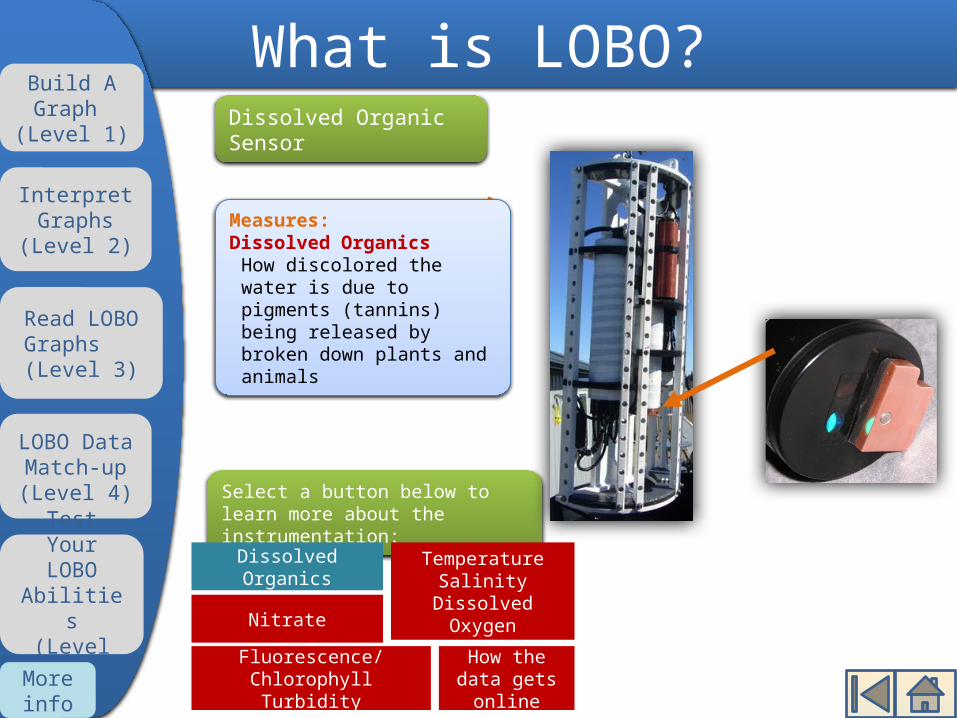
Dissolved Organic Sensor
Select a button below to learn more about the instrumentation:
Measures:Dissolved OrganicsHow discolored the water is due to pigments (tannins) being released by broken down plants and animals
What is LOBO?Build A Graph
(Level 1)
Read LOBO Graphs (Level 3)
LOBO Data Match-up(Level 4)
Test Your LOBO
Abilities(Level 5)
Interpret Graphs
(Level 2)
More info
TemperatureSalinity
Dissolved OxygenNitrate
Fluorescence/Chlorophyll
Turbidity
Dissolved Organics
How the data gets
online

Nitrate Sensor
Select a button below to learn more about the instrumentation:
Measures:NitrateHow much nutrients are in the water
What is LOBO?Build A Graph
(Level 1)
Read LOBO Graphs (Level 3)
LOBO Data Match-up(Level 4)
Test Your LOBO
Abilities(Level 5)
Interpret Graphs
(Level 2)
More info
TemperatureSalinity
Dissolved OxygenNitrate
Fluorescence/Chlorophyll
Turbidity
Dissolved Organics
How the data gets
online
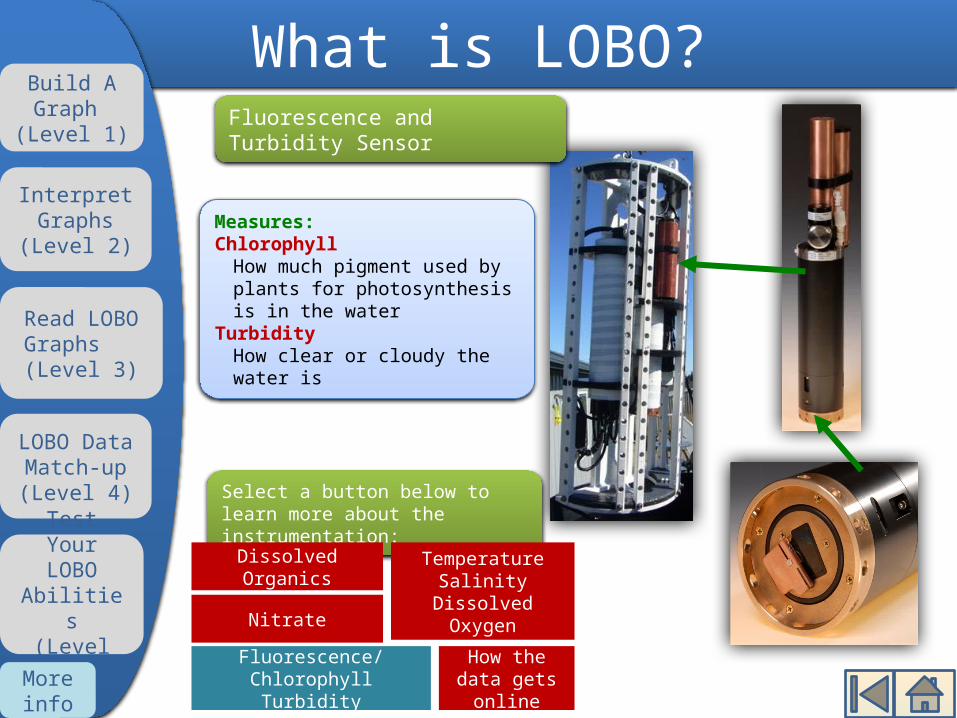
Fluorescence and Turbidity Sensor
Select a button below to learn more about the instrumentation:
Measures:Chlorophyll
How much pigment used by plants for photosynthesis is in the water
TurbidityHow clear or cloudy the water is
What is LOBO?Build A Graph
(Level 1)
Read LOBO Graphs (Level 3)
LOBO Data Match-up(Level 4)
Test Your LOBO
Abilities(Level 5)
Interpret Graphs
(Level 2)
More info
TemperatureSalinity
Dissolved OxygenNitrate
Fluorescence/Chlorophyll
Turbidity
Dissolved Organics
How the data gets
online
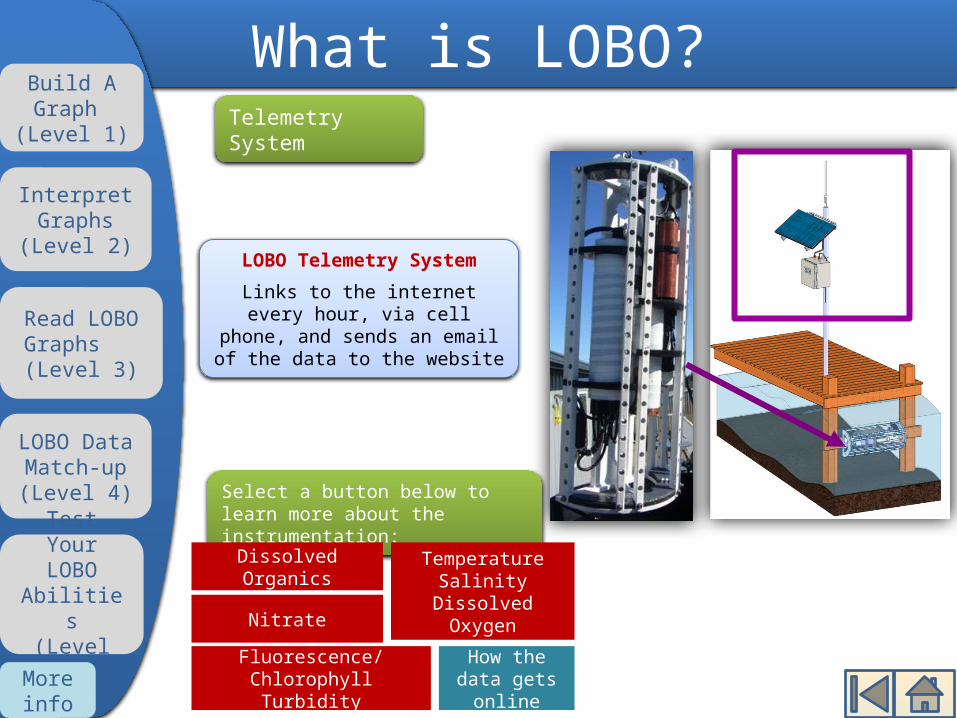
Telemetry System
Select a button below to learn more about the instrumentation:
LOBO Telemetry SystemLinks to the internet every
hour, via cell phone, and sends an email of the data to the
website
What is LOBO?Build A Graph
(Level 1)
Read LOBO Graphs (Level 3)
LOBO Data Match-up(Level 4)
Test Your LOBO
Abilities(Level 5)
Interpret Graphs
(Level 2)
More info
TemperatureSalinity
Dissolved OxygenNitrate
Fluorescence/Chlorophyll
Turbidity
Dissolved Organics
How the data gets
online
Additional Support:
Concept design and support:- WET Labs: Cristina Orrico, Andrew Barnard- Sea Grant/HMSC: Shawn Rowe, Nancee Hunter, Bill Hanshumaker,
Olga Rowe- NANOOS: Craig Risien, Mike Kosro, Amy Sprenger, Jan NewtonExhibit development and evaluation:- OSU COAS: Sarah Mikulak
About the exhibitBuild A Graph
(Level 1)
Read LOBO Graphs (Level 3)
LOBO Data Match-up(Level 4)
Test Your LOBO
Abilities(Level 5)
Interpret Graphs
(Level 2)
More info
Funding:
Related Documents