1 CAPITAL APPRECIATION LIMITED REVIEWED PROVISIONAL RESULTS ‘18 for the year ended 31 March 2018 1

Welcome message from author
This document is posted to help you gain knowledge. Please leave a comment to let me know what you think about it! Share it to your friends and learn new things together.
Transcript

1
CAPITALAPPRECIATION
LIMITED
REVIEWED
PROVISIONAL
RESULTS
‘18for the year ended
31 March 2018
1

2
Introduction to CAPPREC
Highlights for the period
The opportunity
Financial performance
About our investments
Prospects
OUTLINE 1
2
3
4
5
6
7 Annexure

3
ABOUT CAPITAL APPRECIATION
We own, manage, invest in, and promote enterprises that
innovate and seek to serve or partner with established and
emerging Financial Institutions
PAYMENTS & PAYMENT
INFRASTRUCTURE
SOFTWARE &
SERVICESINTERNATIONAL *
AUSTRALIA
* 17.5% interest

4
2018
HIGHLIGHTS
5
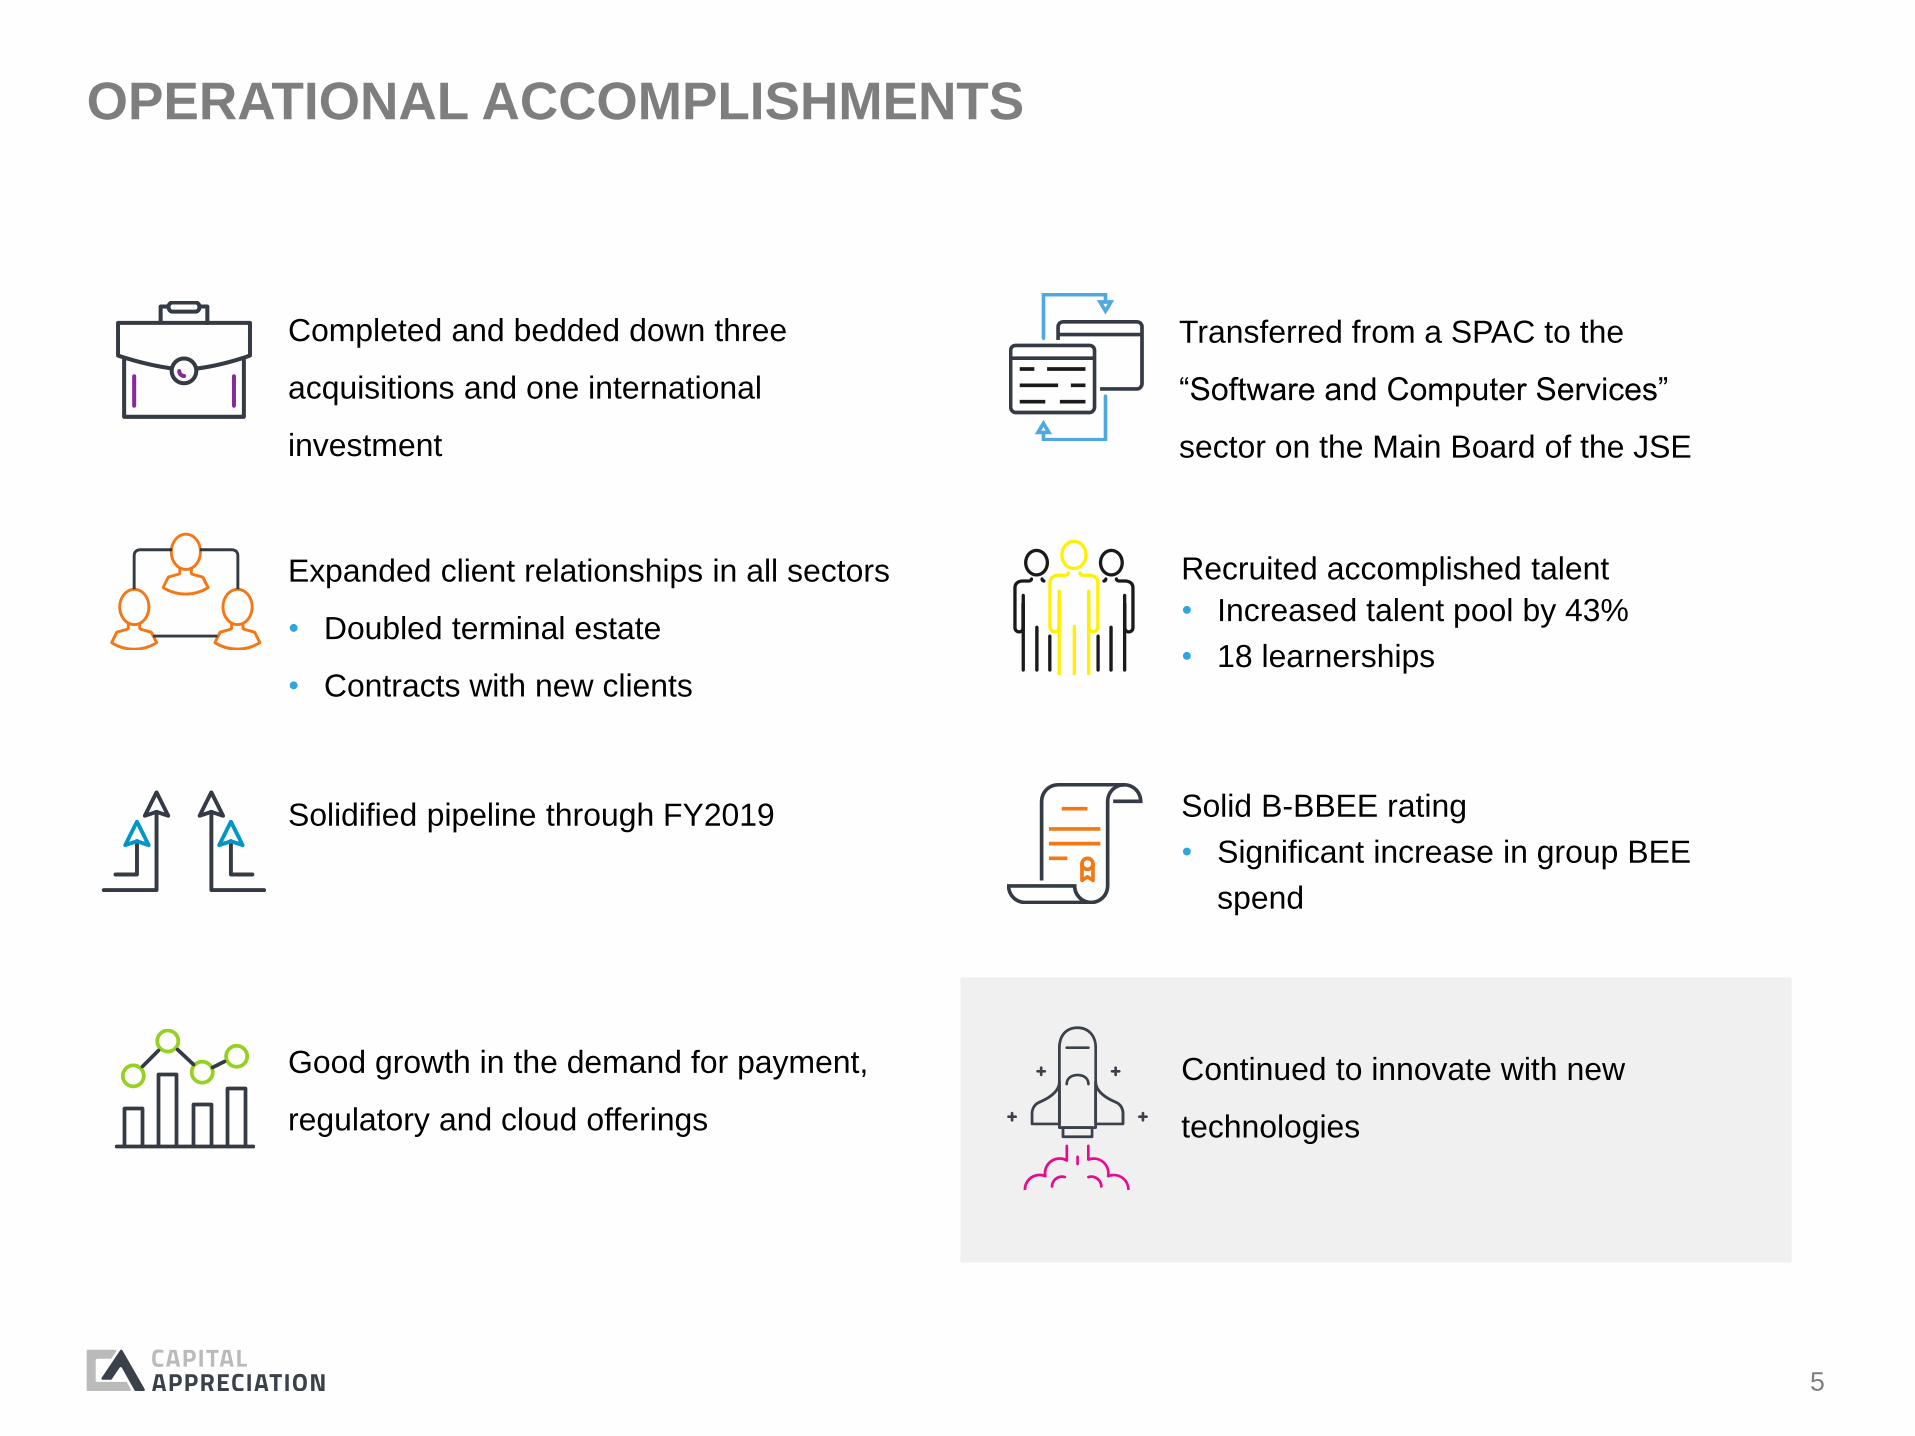
OPERATIONAL ACCOMPLISHMENTS
Completed and bedded down three
acquisitions and one international
investment
Transferred from a SPAC to the
“Software and Computer Services”
sector on the Main Board of the JSE
Good growth in the demand for payment,
regulatory and cloud offerings
Expanded client relationships in all sectors
• Doubled terminal estate
• Contracts with new clients
Recruited accomplished talent
• Increased talent pool by 43%
• 18 learnerships
Continued to innovate with new
technologies
Solidified pipeline through FY2019 Solid B-BBEE rating
• Significant increase in group BEE
spend
6
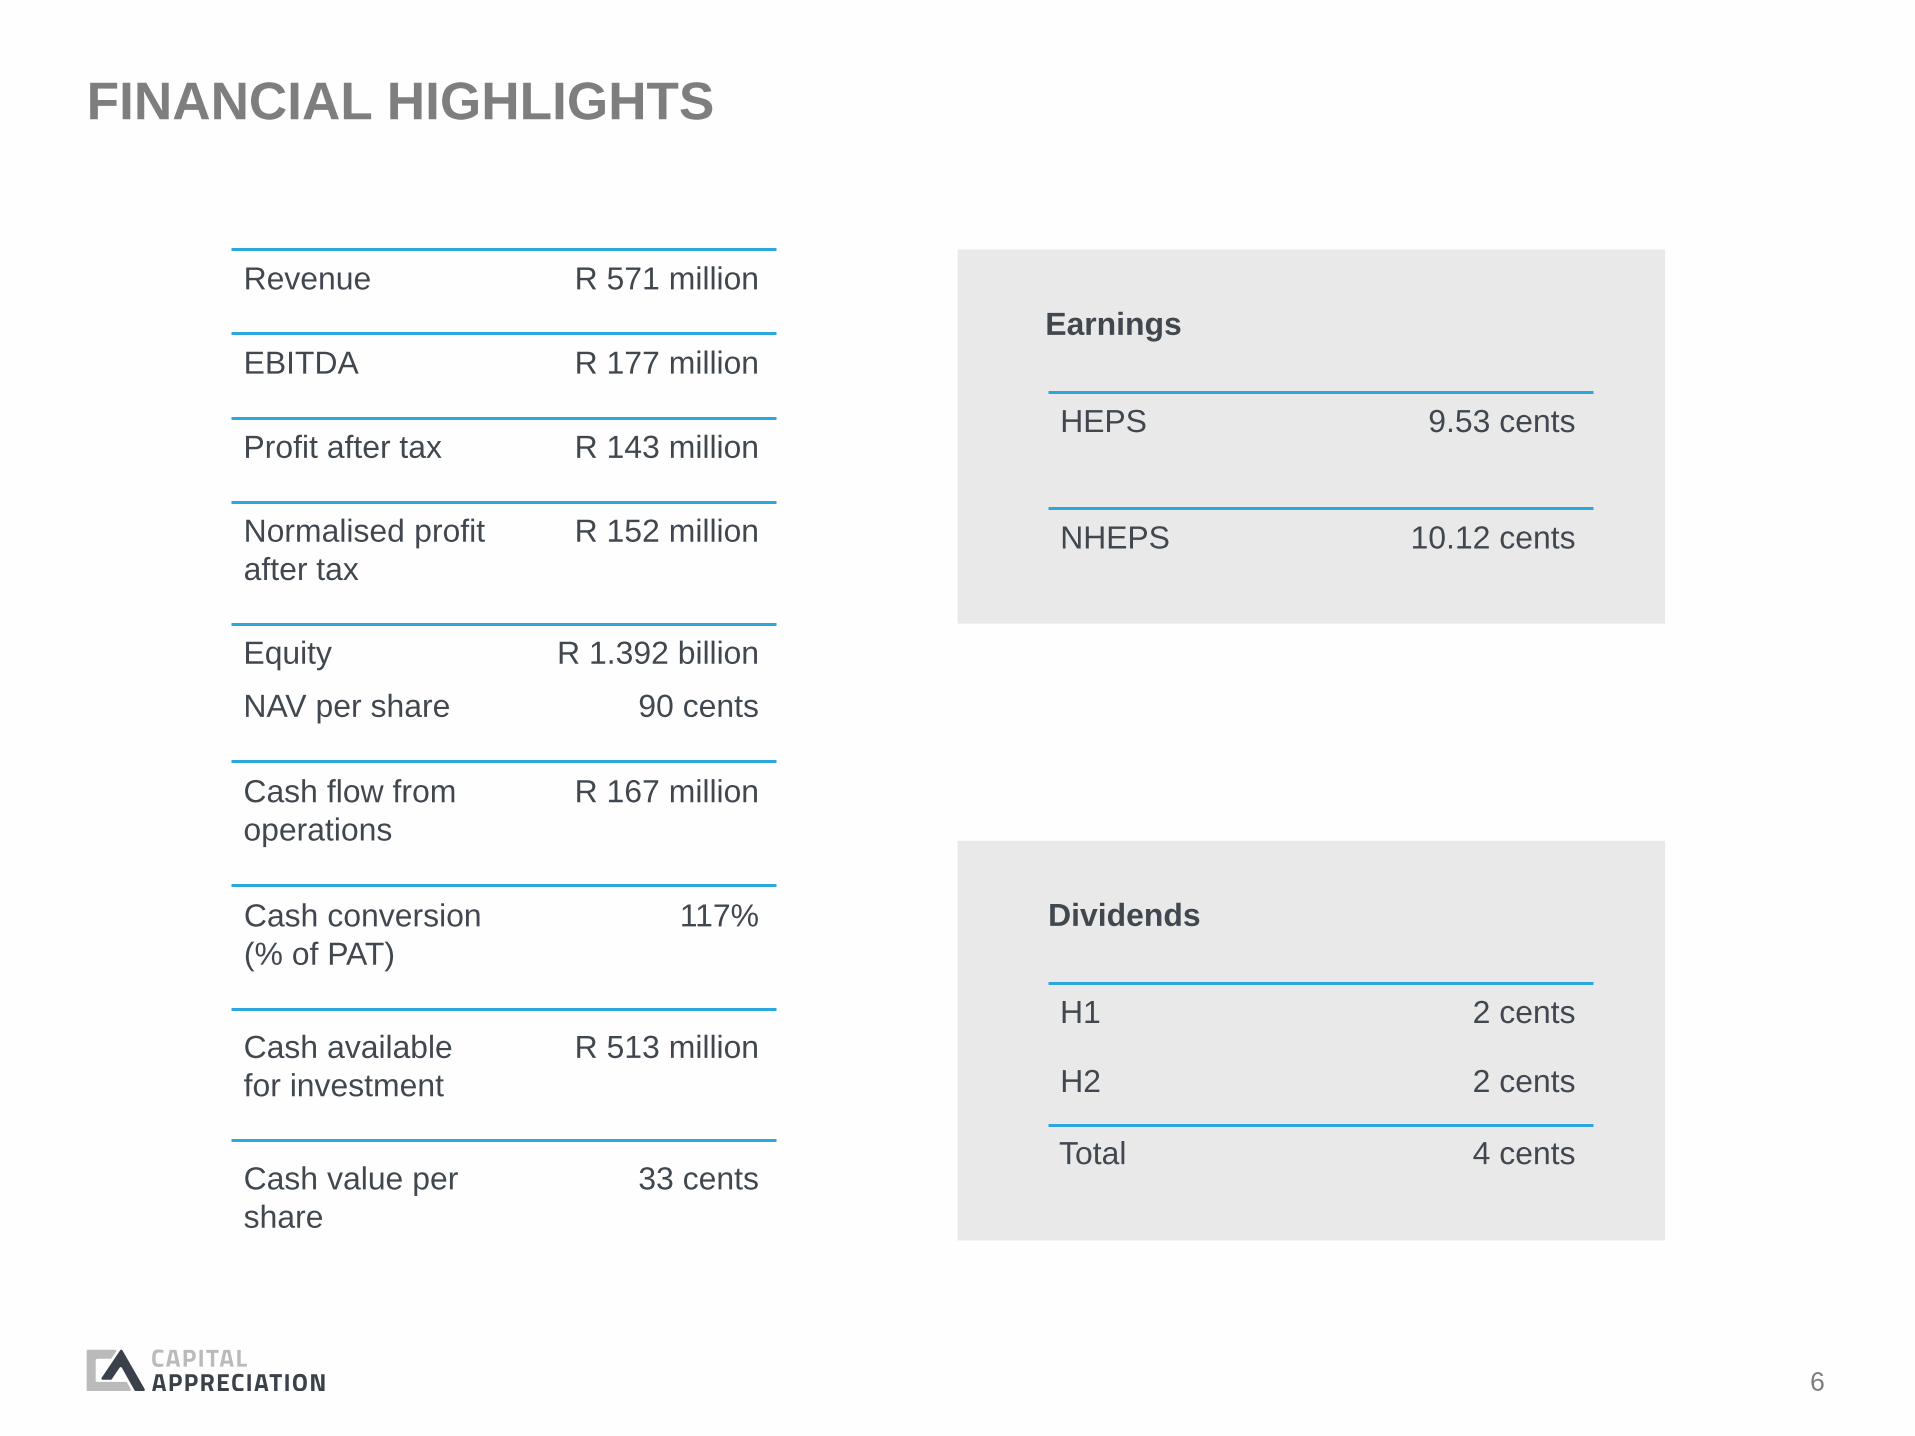
FINANCIAL HIGHLIGHTS
Revenue R 571 million
EBITDA R 177 million
Profit after tax R 143 million
Normalised profit
after tax
R 152 million
Cash flow from
operations
R 167 million
Cash conversion
(% of PAT)
117%
Cash value per
share
33 cents
HEPS 9.53 cents
NHEPS 10.12 cents
H1 2 cents
H2 2 cents
Total 4 cents
Dividends
Equity R 1.392 billion
NAV per share 90 cents
Earnings
Cash available
for investment
R 513 million
7
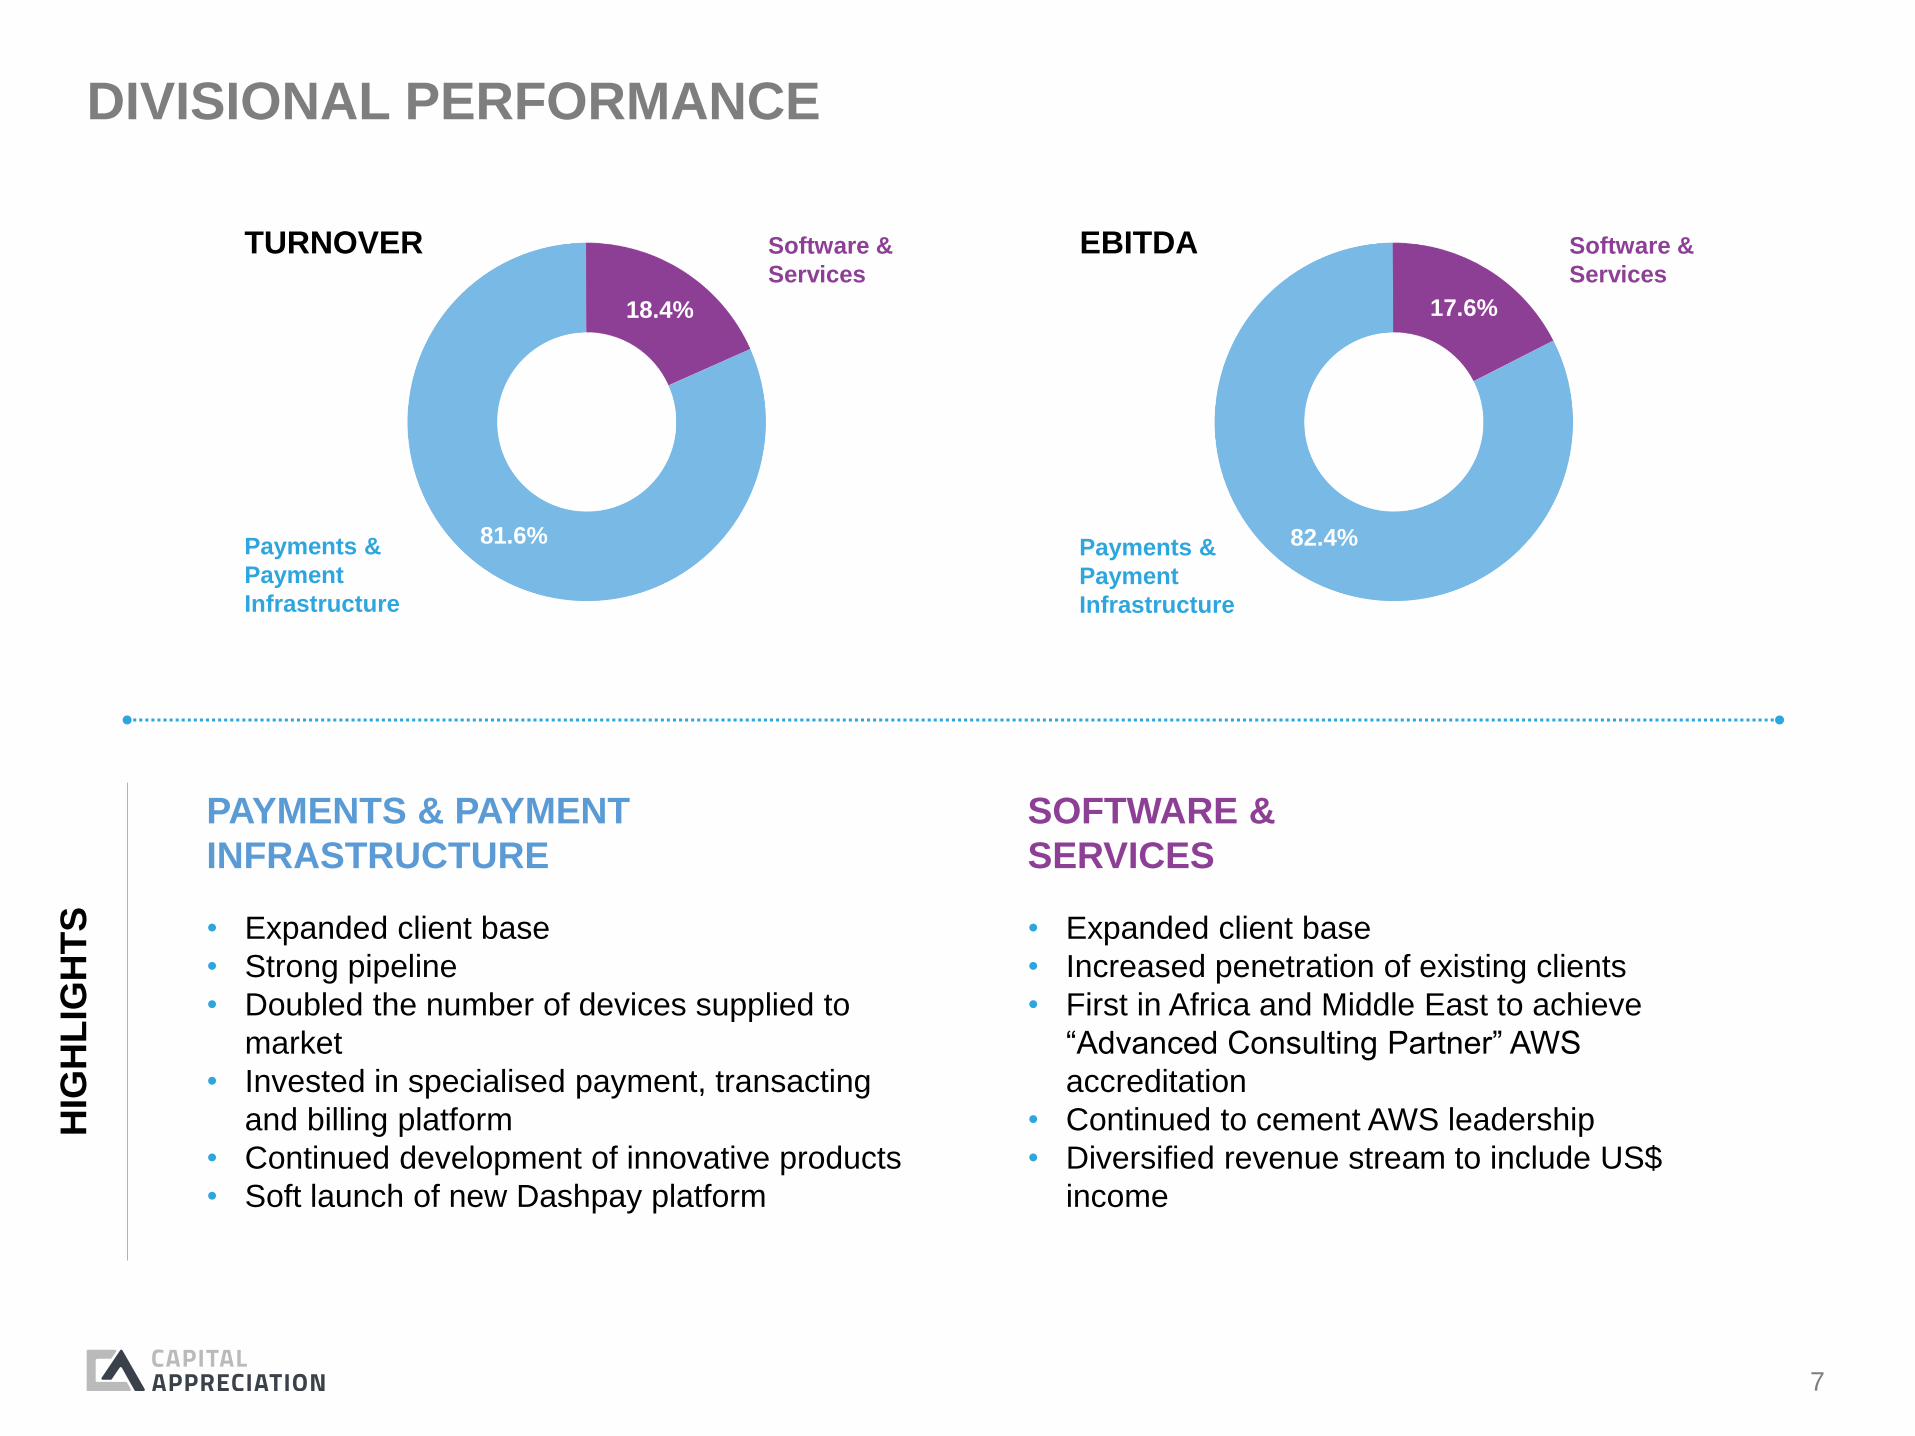
81.6%
18.4%
Payments &
Payment
Infrastructure
Software &
Services
82.4%
17.6%
Payments &
Payment
Infrastructure
Software &
Services
DIVISIONAL PERFORMANCE
PAYMENTS & PAYMENT
INFRASTRUCTURE
SOFTWARE &
SERVICES
• Expanded client base
• Strong pipeline
• Doubled the number of devices supplied to
market
• Invested in specialised payment, transacting
and billing platform
• Continued development of innovative products
• Soft launch of new Dashpay platform
• Expanded client base
• Increased penetration of existing clients
• First in Africa and Middle East to achieve
“Advanced Consulting Partner” AWS
accreditation
• Continued to cement AWS leadership
• Diversified revenue stream to include US$
income
TURNOVER EBITDA
HIG
HL
IGH
TS

8
Kuseni Dlamini (May 2018)
• Chairman, Massmart
• Chairman, Aspen
Pharmacare
• Former CEO, Old Mutual
SA
Errol Kruger (May 2018)
• Director, Nedbank Group
• Chairman, Nedbank Private
Wealth
• Former Registrar of Banks, SA
Reserve Bank
• Former MD of Supervision &
Authorisation, Qatar Financial
Centre Regulatory Authority
Rep laces Dr Dan Mat j i l a
Mathukana Mokoka (May 2018)
• Director, Contract Services
Group
• Director, Sanlam
• Director, Palabora Mining
• Director, PIC
Eitan Neishlos (May 2018)
• CEO, Resonance Australia
Prof. Hanoch Neishlos (Nov 2017)
• Founder, African Resonance
INDEPENDENT NON-INDEPENDENT
CHANGES TO THE BOARD OF DIRECTORS

9
THE
OPPORTUNITY

10
CHARACTERISTICS OF FUTURE PAYMENTS GLOBALLYInnovations will make payments more cashless and invisible also
enabling data driven engagement platforms for clients
CASHLESS //
More cash will be displaced by electronic
transactions as payments innovations make
it beneficial for clients to use currencies
other than cash
BACK OF MIND //
As more transactions become virtual and
automated, more payments processes
become invisible to end clients, changing
their needs and behaviours
ENGAGEMENT //
As payments and mobility becomes more
integrated, the importance of payment
transactions as a potential customer
interaction point will increase for merchants
and financial institutions
DATA DRIVEN //
With greater adoption of electronic
payments, more data will be accumulated
from payment transactions, allowing
financial institutions, services providers and
merchants to gain greater understanding of
clients and businesses
ACCESS TO LOANS //
As more payments are processed through
electronic rails, financial institutions’ visibility
into individuals’ and businesses’ cash flow
and spending patterns will increase,
improving their ability to extend loans to
clients previously less understood
REDUCED COSTS //
Because innovative solutions build on the
existing infrastructure, which has very low
variable costs, the cost of making electronic
transactions will fall as electronic payments
gain more volume
SOURCE: DERIVED FROM WORLD ECONOMIC FORUM REPORT
11
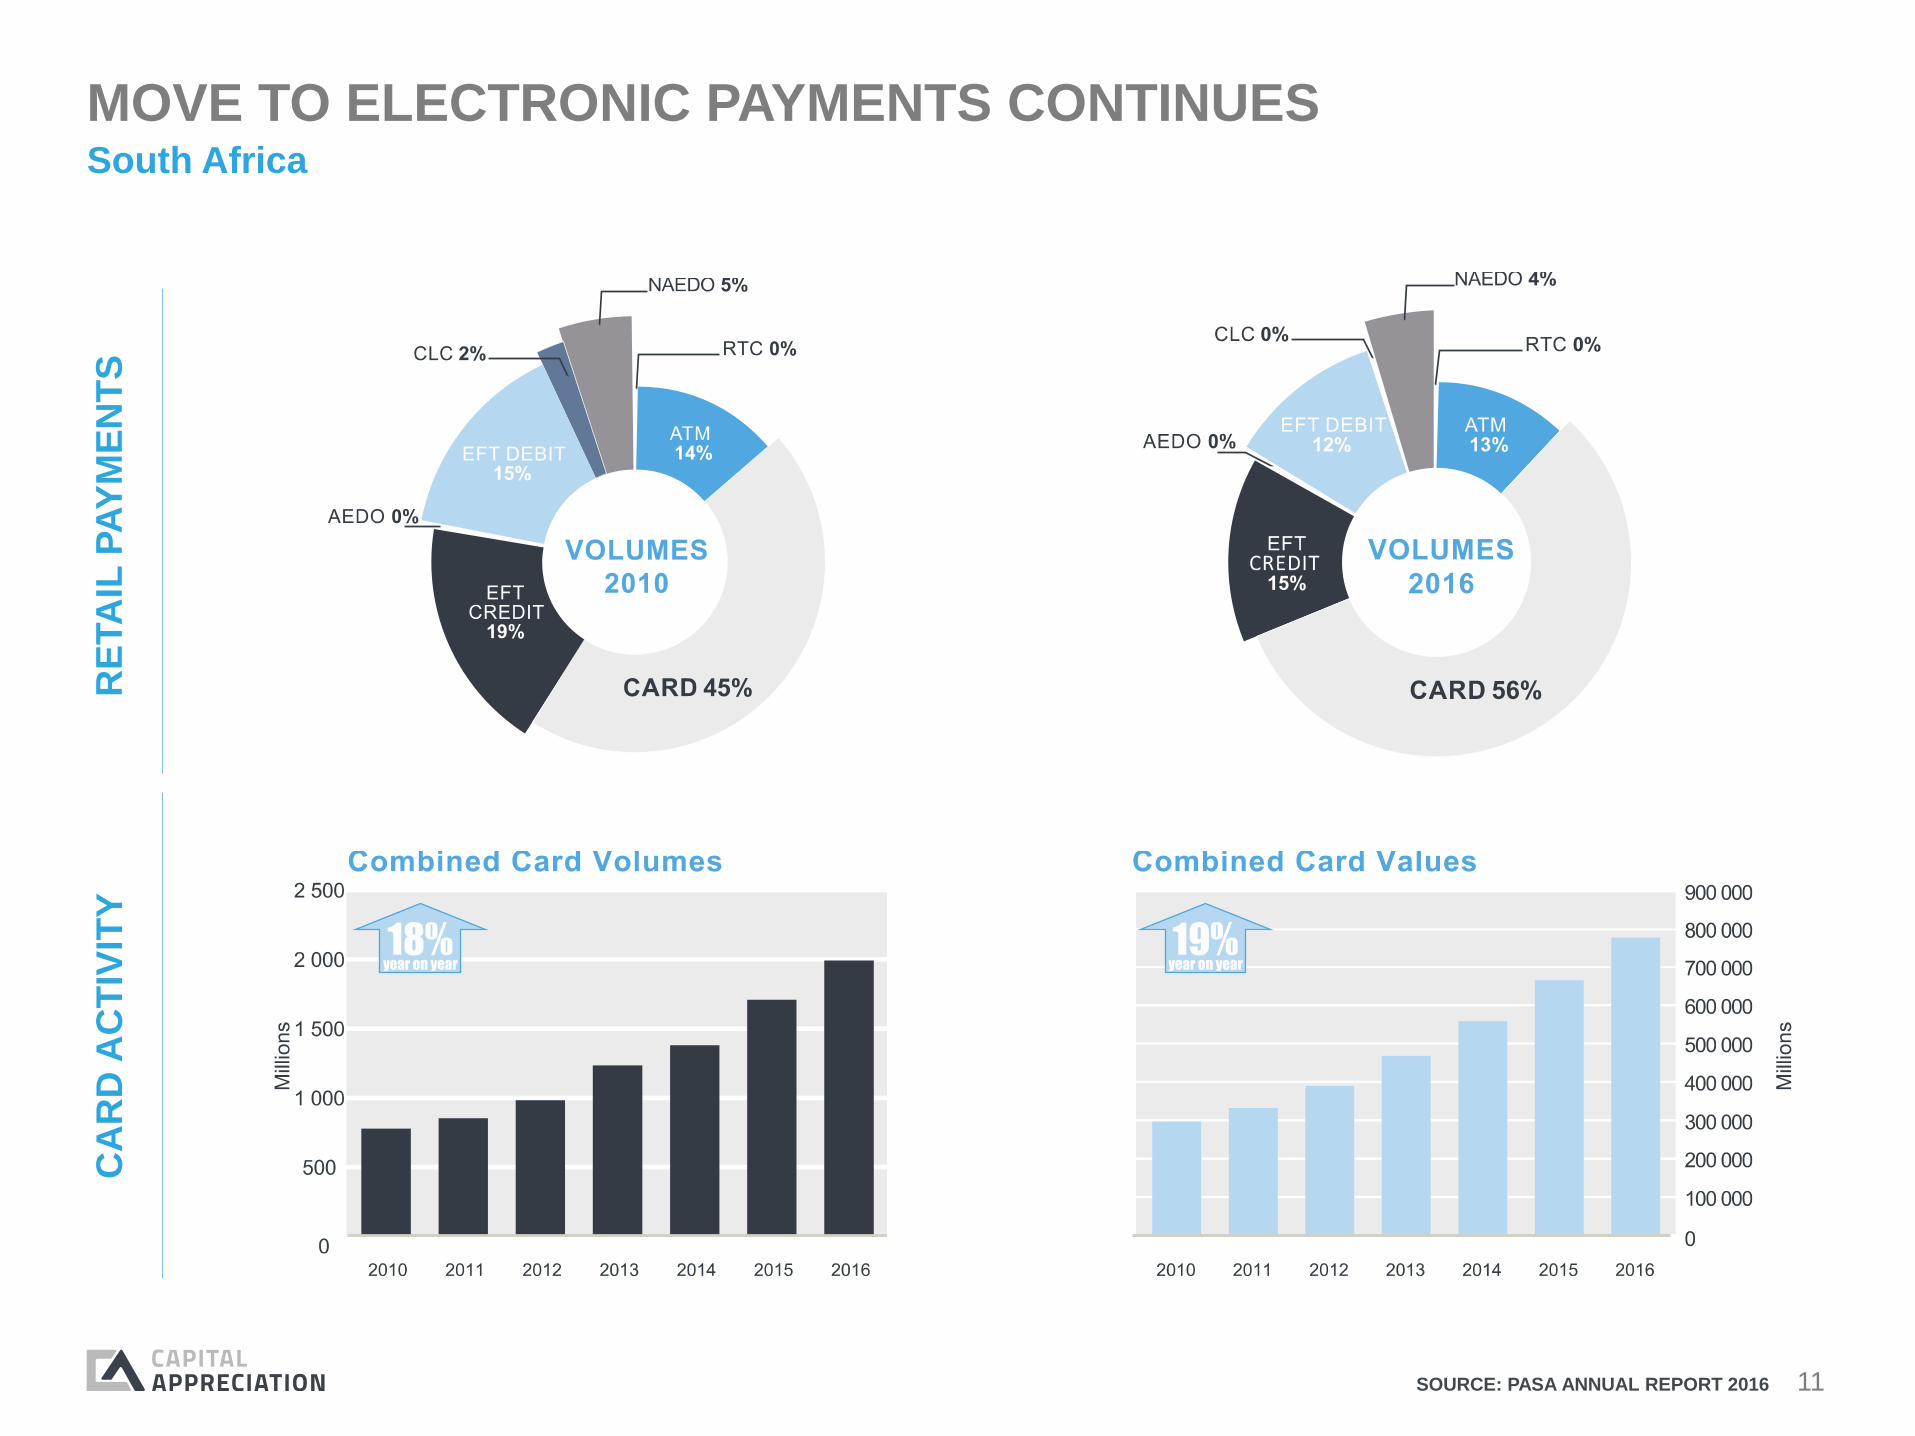
MOVE TO ELECTRONIC PAYMENTS CONTINUESSouth Africa
SOURCE: PASA ANNUAL REPORT 2016
RE
TA
IL P
AY
ME
NT
SC
AR
D A
CT
IVIT
Y

12
POS DEVICE PENETRATIONPOS installed devices per 1 000 people
5 10 15 5 25 30 35
AUSTRALIA
TURKEY
SPAIN
FRANCE
UK
ITALY
U.S.
CANADA
BRAZIL
SOUTH AMERICA
GERMANY
MEXICO
CHINA
RUSSIA
INDIA
SOURCE: BANK OF INTERNATIONAL SETTLEMENTS
SOUTH AFRICA’S
PENETRATION IS ONLY 4.5
Significant opportunity to
increase penetration as costs
decline and value increases

13
CAPITAL APPRECIATION GROWTH STRATEGY
• Continue to grow POS device estate
• Existing clients
• New clients
• New applications
• Deployment of new platforms across
estates
• Introduction of new products
PAYMENTS & PAYMENT
INFRASTRUCTURE
SOFTWARE &
SERVICES
• Licensing of software applications for
regulatory compliance
• Cloud migration opportunities continue
to accelerate
• International expansion of service
offerings
• New technology deployments
(blockchain, AI, etc.)OR
GA
NIC
GR
OW
TH
AC
QU
ISIT
ION
S • Pursue attractive investment and acquisition opportunities in Payments & Payment
Infrastructure sector in South Africa, Africa and other international markets that (i)
expand our capabilities, (ii) expand our market opportunity, and (iii) build on our business
models
• Pursue attractive acquisition opportunities in Software & Services sector in South Africa
Capital Appreciation is well capitalised, with the management
skills and technology to drive it’s growth strategy

14
ABOUT OUR
INVESTMENTS

15
CAPITAL APPRECIATION EXECUTION STRATEGY
Work with financial institutions
PARTNER INNOVATE EXECUTE
Create ecosystems for
collaboration
B2B2C
Deliver solutions to help clients
realise their strategy
Focus on infrastructure
State of the art proprietary
technology platforms for services
Entrepreneurial culture
Hardware agnostic
Integrate seamlessly with
legacy systems
Service excellence
Alleviate pain points
User experience
Create eco-system
Engender trust
Add value
Grow market
Act as an innovation
catalyst for clients
B2B
16
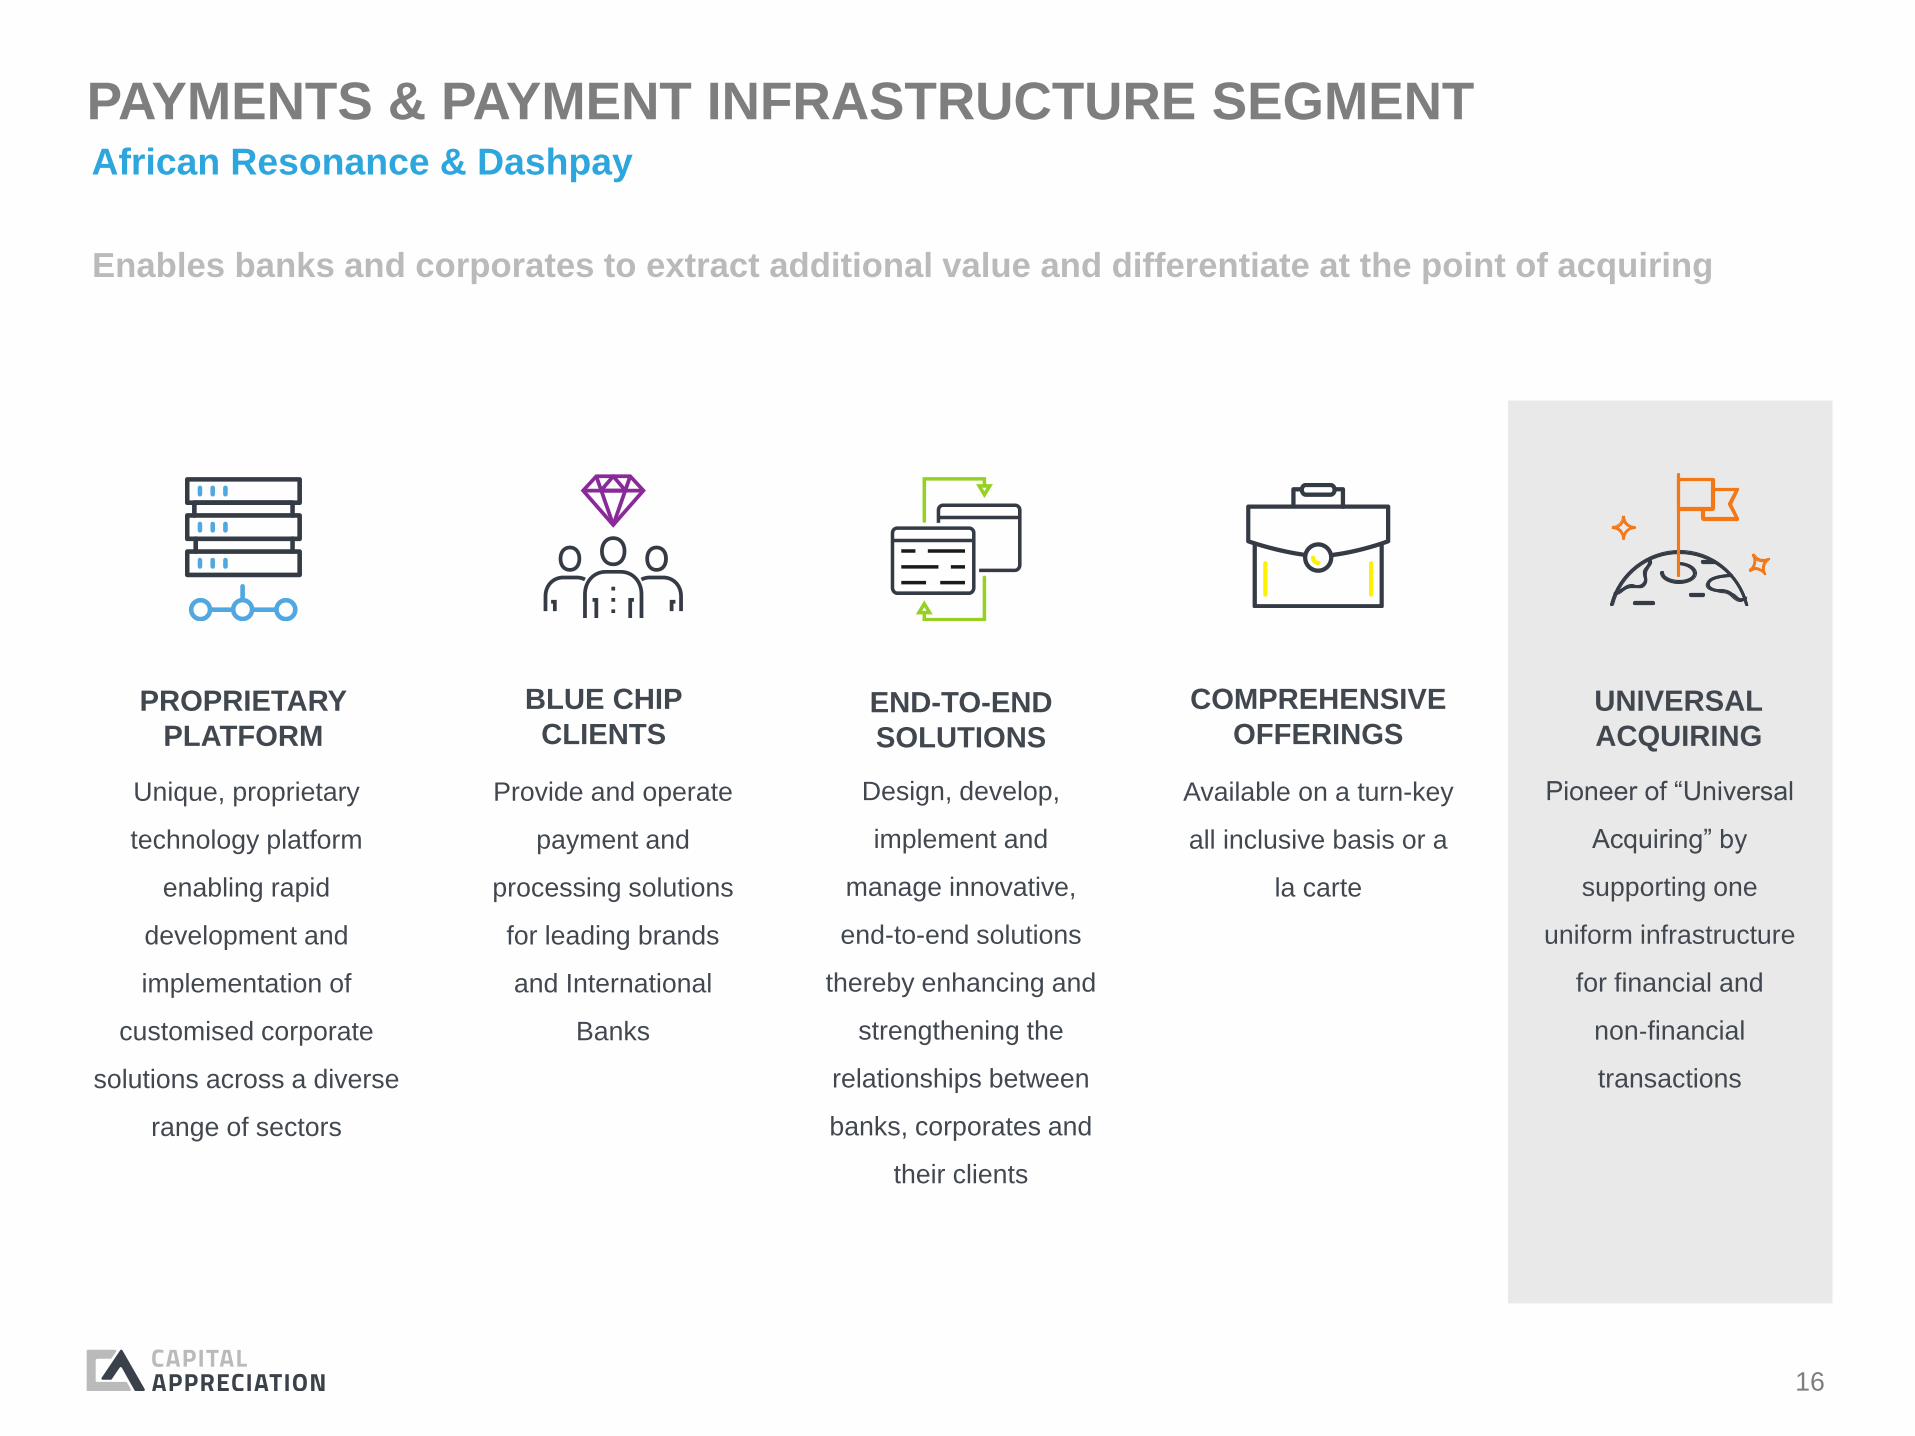
PAYMENTS & PAYMENT INFRASTRUCTURE SEGMENT
Enables banks and corporates to extract additional value and differentiate at the point of acquiring
BLUE CHIP
CLIENTS
Provide and operate
payment and
processing solutions
for leading brands
and International
Banks
PROPRIETARY
PLATFORM
Unique, proprietary
technology platform
enabling rapid
development and
implementation of
customised corporate
solutions across a diverse
range of sectors
END-TO-END
SOLUTIONS
Design, develop,
implement and
manage innovative,
end-to-end solutions
thereby enhancing and
strengthening the
relationships between
banks, corporates and
their clients
COMPREHENSIVE
OFFERINGS
Available on a turn-key
all inclusive basis or a
la carte
UNIVERSAL
ACQUIRING
Pioneer of “Universal
Acquiring” by
supporting one
uniform infrastructure
for financial and
non‐financial
transactions
African Resonance & Dashpay

17
PAYMENTS REVENUE MODEL
MAINTENANCE
& REPAIRS
• Generates monthly
recurring annuity
revenue depending on
level and scope of
services contracted
TRANSACTIONS
• Variable based on
transaction type and
value of transaction
LICENSING &
SOLUTIONS
• Generates monthly
recurring annuity
revenue dependent
on solution
• Flat fee
• Commission
POS ESTATE
MANAGEMENT
• Generates monthly
recurring annuity
revenue depending on
level and scope of
services contracted
POS DEVICES
• Sales generate gross
profit
• Rental generates
monthly recurring
revenue
• Relationship with
major clients subject to
long-term master
supply agreements
Predictable but
lumpy
Annuity tied to the
size of the estate
Annuity and
predictable
Unlimited subject to
established
economic models
Unlimited
18
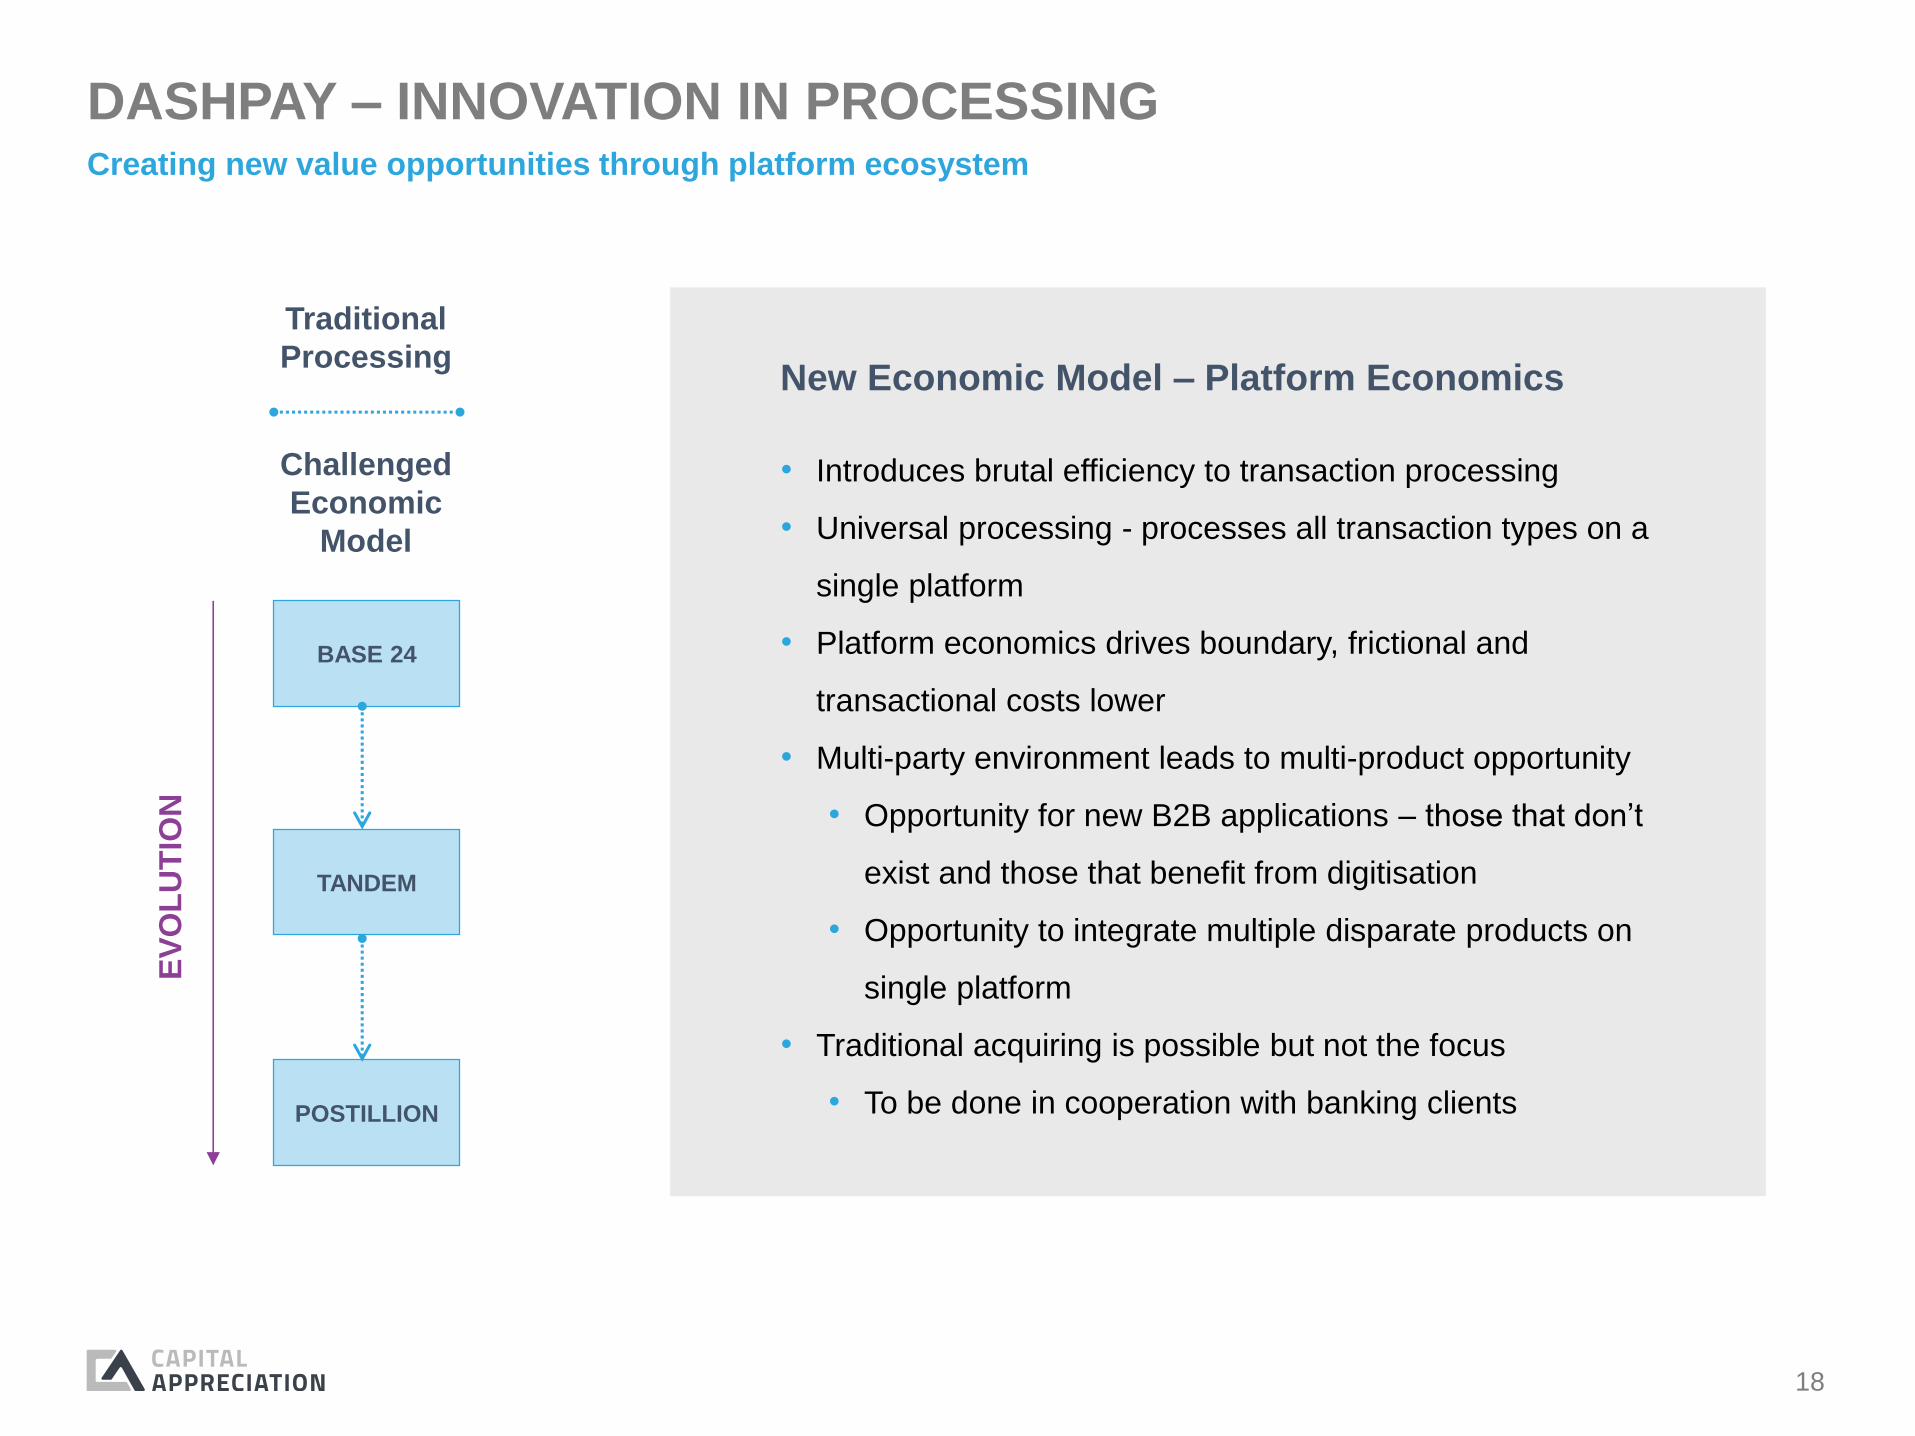
DASHPAY – INNOVATION IN PROCESSINGCreating new value opportunities through platform ecosystem
New Economic Model – Platform Economics
• Introduces brutal efficiency to transaction processing
• Universal processing - processes all transaction types on a
single platform
• Platform economics drives boundary, frictional and
transactional costs lower
• Multi-party environment leads to multi-product opportunity
• Opportunity for new B2B applications – those that don’t
exist and those that benefit from digitisation
• Opportunity to integrate multiple disparate products on
single platform
• Traditional acquiring is possible but not the focus
• To be done in cooperation with banking clients
Challenged
Economic
Model
Traditional
Processing
BASE 24
TANDEM
POSTILLION
EV
OL
UT
ION
19
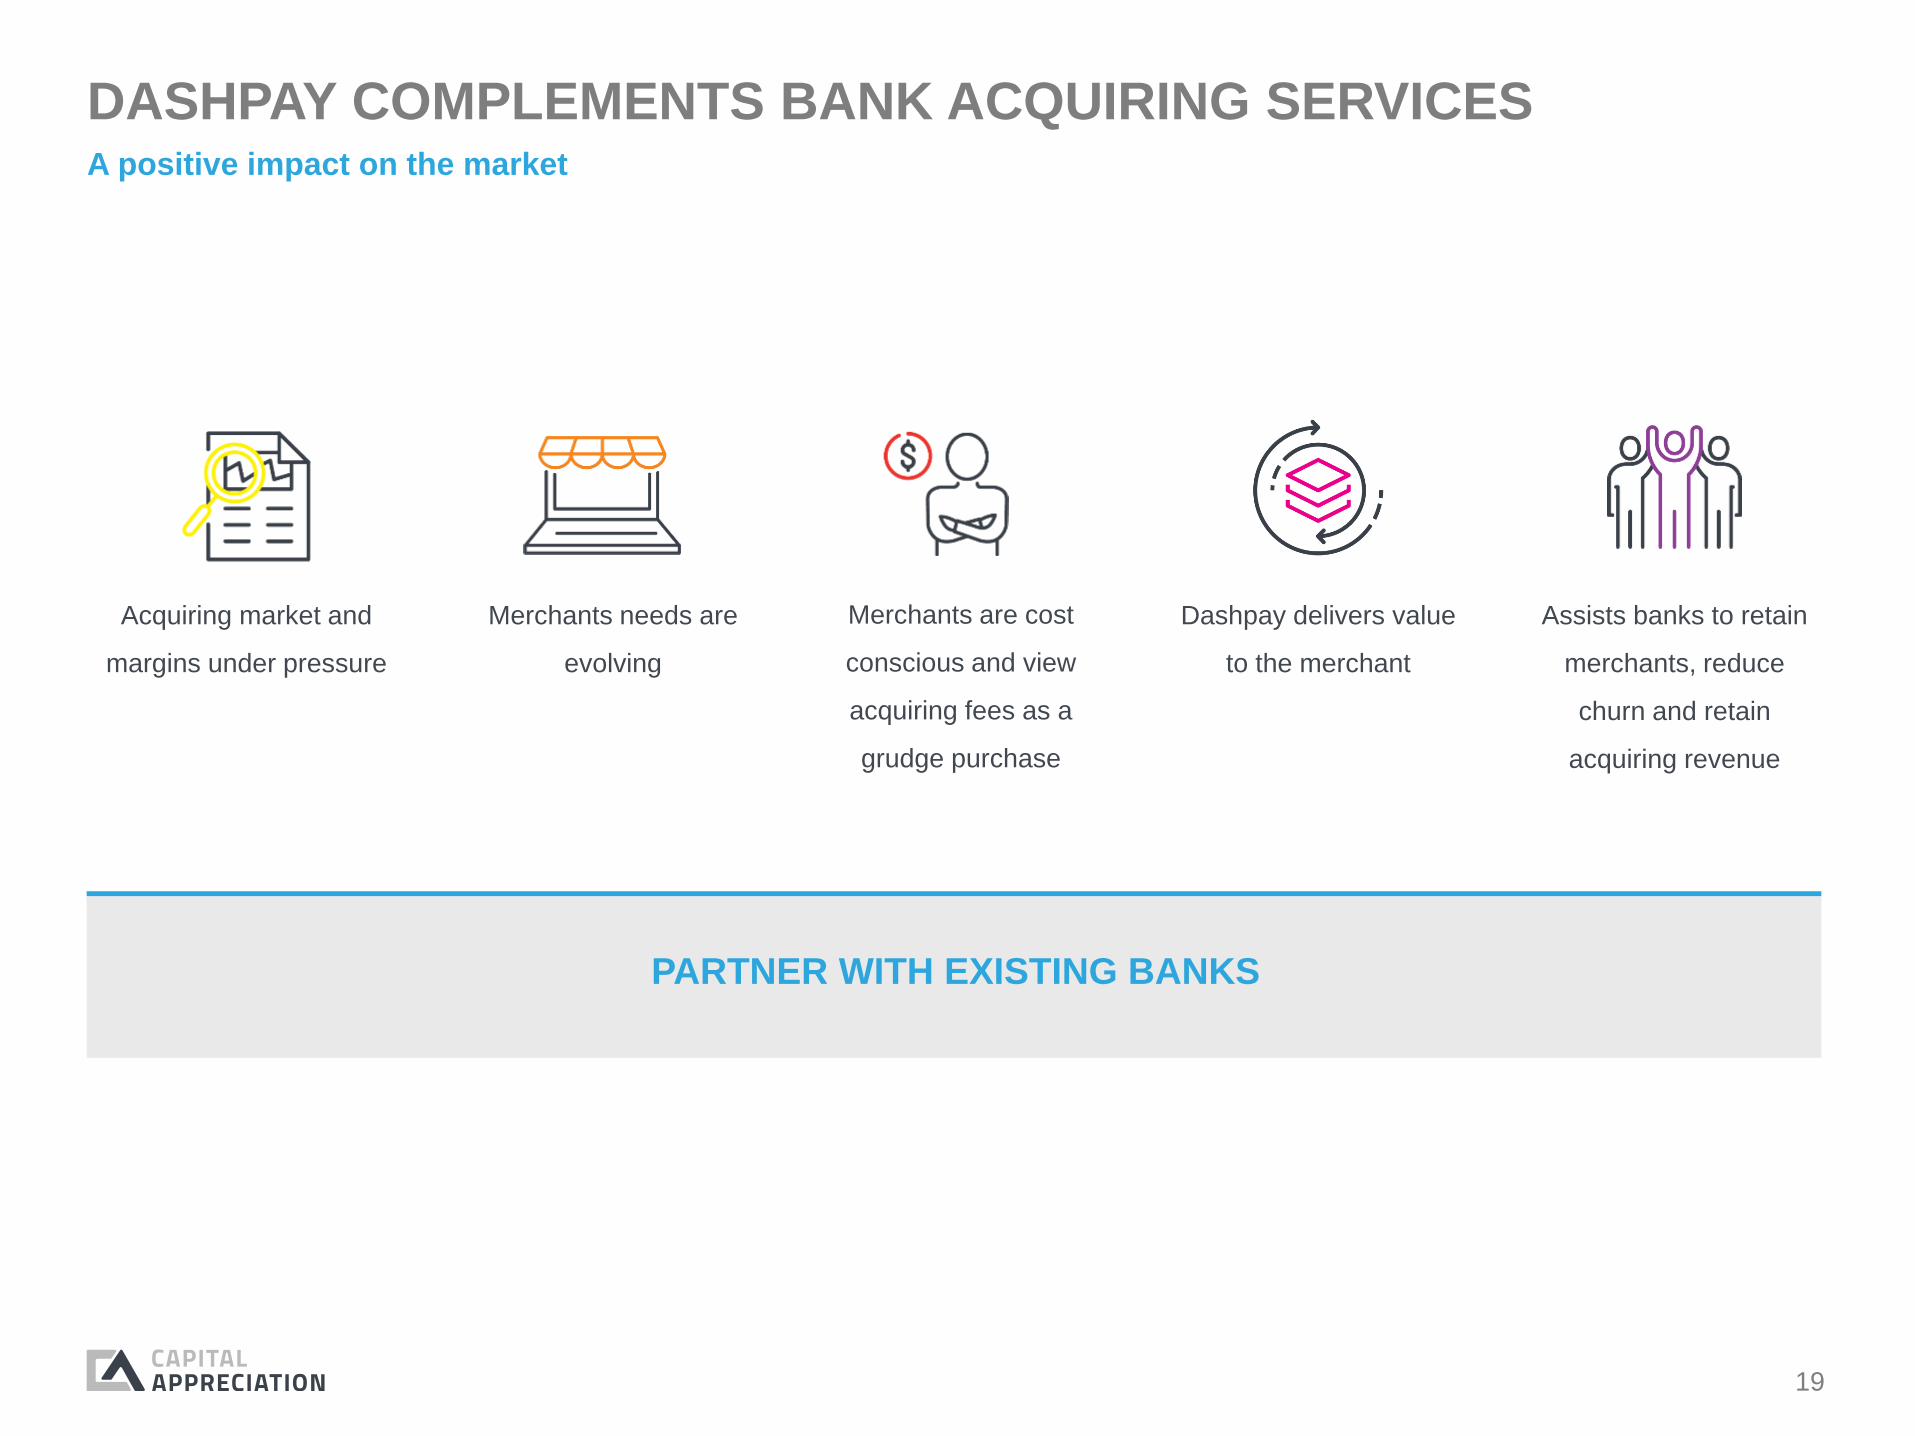
DASHPAY COMPLEMENTS BANK ACQUIRING SERVICESA positive impact on the market
Merchants needs are
evolving
Acquiring market and
margins under pressure
Merchants are cost
conscious and view
acquiring fees as a
grudge purchase
Dashpay delivers value
to the merchant
Assists banks to retain
merchants, reduce
churn and retain
acquiring revenue
PARTNER WITH EXISTING BANKS
20
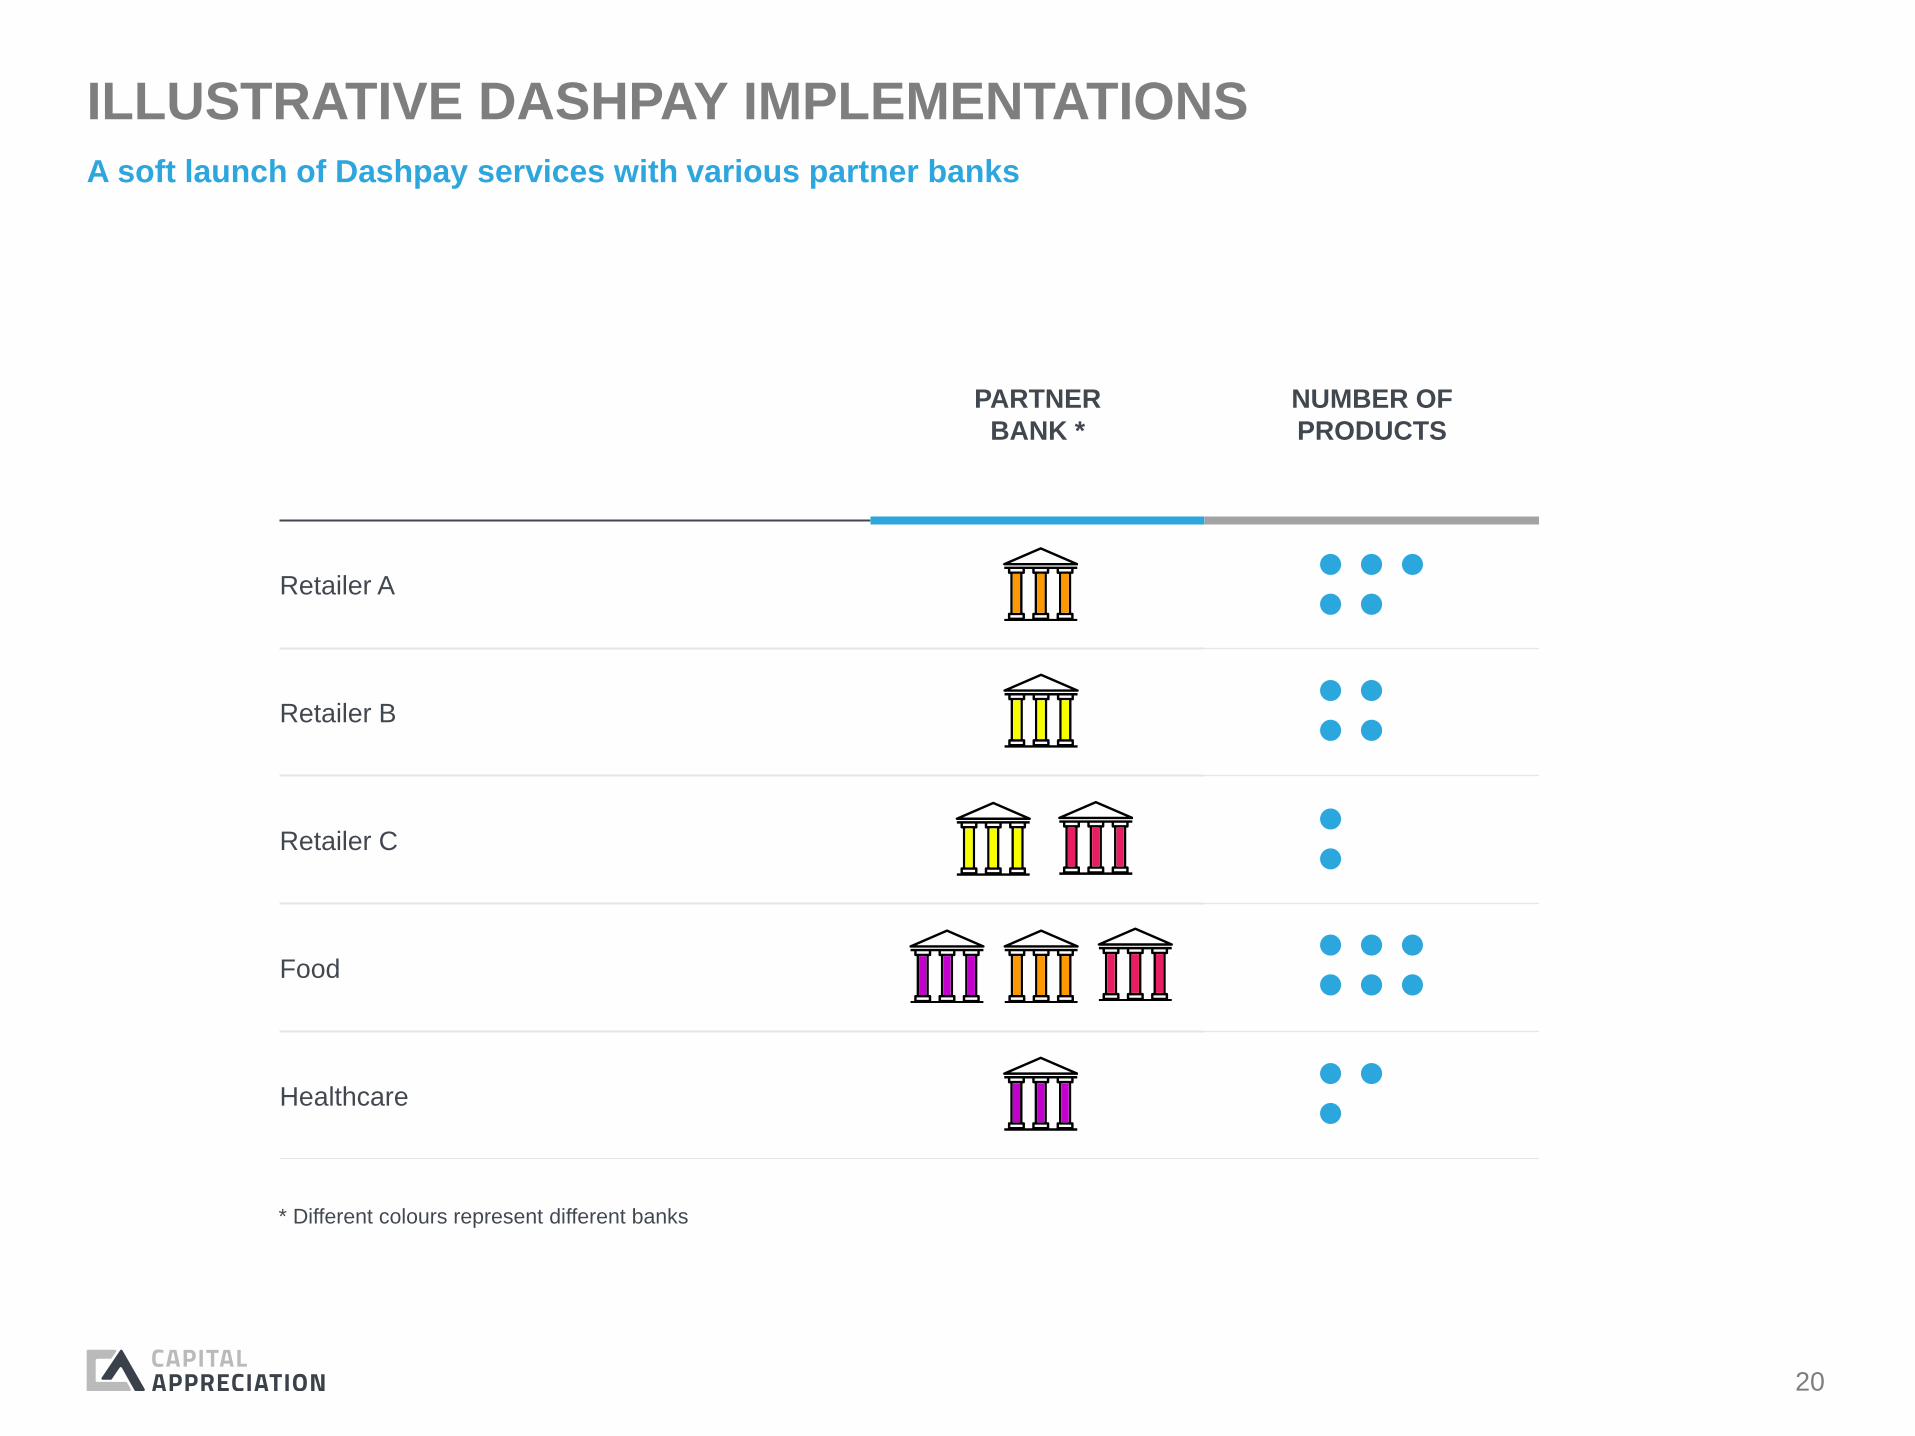
ILLUSTRATIVE DASHPAY IMPLEMENTATIONS
A soft launch of Dashpay services with various partner banks
PARTNER
BANK *
NUMBER OF
PRODUCTS
Retailer A
Retailer B
Retailer C
Food
Healthcare
* Different colours represent different banks
21
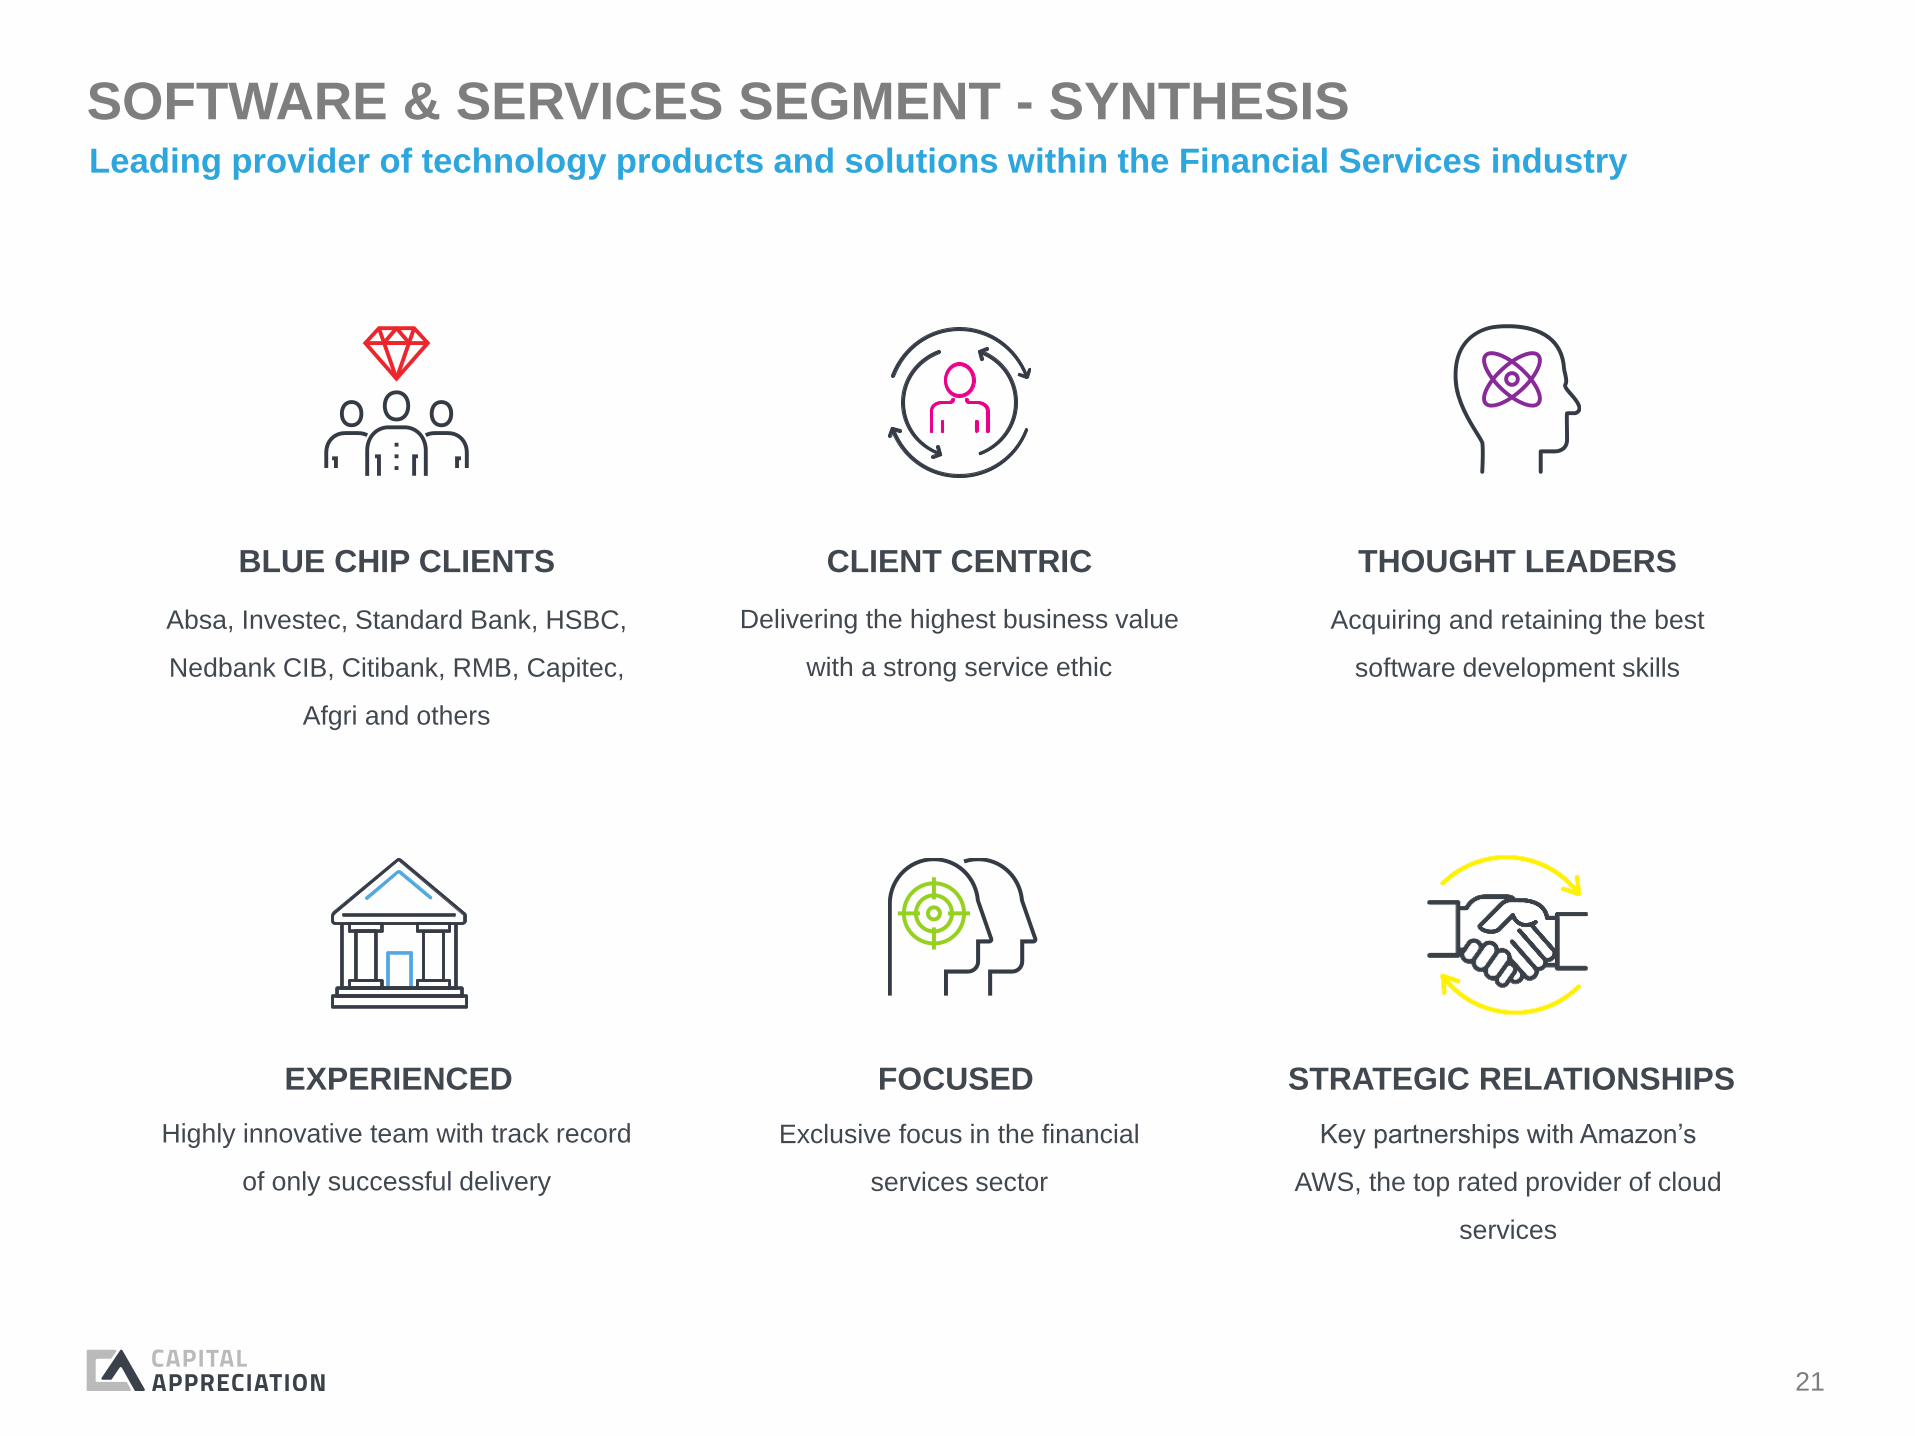
SOFTWARE & SERVICES SEGMENT - SYNTHESIS
BLUE CHIP CLIENTS
Absa, Investec, Standard Bank, HSBC,
Nedbank CIB, Citibank, RMB, Capitec,
Afgri and others
Leading provider of technology products and solutions within the Financial Services industry
CLIENT CENTRIC
Delivering the highest business value
with a strong service ethic
THOUGHT LEADERS
Acquiring and retaining the best
software development skills
FOCUSED
Exclusive focus in the financial
services sector
EXPERIENCED
Highly innovative team with track record
of only successful delivery
STRATEGIC RELATIONSHIPS
Key partnerships with Amazon’s
AWS, the top rated provider of cloud
services

22
OPERATING UNITS WITHIN SYNTHESIS
Cloud transformation to assist the
Enterprise in becoming cloud ready,
execute mass migrations and to harness
the benefits of public cloud platform
First AWS Advanced Consulting
partner in MEA
CLOUD
CONSULTING
Delivering exceptional end-user
client experience web and
mobile touch points for financial
services institutions while
maintaining information security
and transactional integrity
DIGITAL
CHANNELS
Integration to enable regulatory
reporting solutions for SARS (tax)
and SARB (balance of
payments), payment processing
and exchange connectivity
PLATFORM
INTEGRATION
PRODUCTS
SYNTHESIS LABS
Artificial intelligence, blockchain, machine learning

23
FINANCIAL
PERFORMANCE

24
44.2
140.7
196.1
202.9
415.1
9.4
24.9 4
2.1
77.5
151.7
1.1 1
0.6 22.7
60.9
149.5
0
50
100
150
200
250
300
350
400
450
2014 2015 2016 2017 2018
Gross Revenue EBITDA Operating Profit
FINANCIAL PERFORMANCE
FY ‘14 FY ‘15 FY ‘16 FY ‘17 FY ‘18
Payments & Payment Infrastructure Division
CAGR(a)
Revenue 75%
EBITDA 100%
Revenue
EBITDA 59%
56%44%
41%
a Compound annual growth from FY’14 through FY’18.
FY’18 results reflect 11 months trading.
H1
FY 2018 CONTRIBUTION
H1 5 months annualised vs. H2
H2
TERMINALS AT PERIOD END
22
00
0
32
00
0 48
00
0
75
00
0
0
10 000
20 000
30 000
40 000
50 000
60 000
70 000
80 000
FY'16 FY'17 H1 FY'18 H2 FY'18

25
FINANCIAL PERFORMANCE
CAGR(a)
Revenue 22%
EBITDA 28%
FY’18 operating profit
annualised amounts to R36.2
million (with 23% growth),
notwithstanding exceptional
ramp-up costs related to AWS
Cloud Migration projects, the
benefits of which will be
revealed in subsequent periods
41.6 4
6.1
51.9
77.6
93.1
12.6 15.9 19.8
29.9 3
3.9
12.4 15.6 1
9.4
29.4 33.2
0
10
20
30
40
50
60
70
80
90
100
2014 2015 2016 2017 2018
Gross Revenue EBITDA Operating Profit
FY ‘14 FY ‘15 FY ‘16 FY ‘17 FY ‘18
Software & Services Division
Revenue
EBITDA 62%
55%45%
38%
H1
FY 2018 CONTRIBUTION
H1 5 months annualised vs. H2
H2
a Compound annual growth from FY’14 through FY’18.
FY’18 results reflect 11 months trading.

26
GROUP SUMMARISED STATEMENT OF COMPREHENSIVE INCOME
(R million) FY 18 FY 17 % increase
Revenue 571.3 80.2
Trading profit (loss) 178.3 (5.0)
Net finance income 38.7 80.2
Profit before taxation 200.0 60.3
Profit after tax 142.9 39.2 265%
Normalised profit after tax 152.3 39.2 288%
Headline earnings per share
(cents)9.53 3.14 204%
Normalised headline earnings
per share (cents)10.12 3.14 222%
Number of shares in issue
(millions)1 550.0 1 250.0
Weighted average number of
shares (millions)1 505.4 1 250.0
Acquisitions completed
5 May 2017 and FY’18
results reflect only eleven
months trading for
acquired businesses
After adjustment for
amortisation of intangibles
arising from acquisitions
Cash utilised for
acquisitions, repurchase
of shares and dividends
paid
305 million shares issued
as part of acquisition
consideration
27
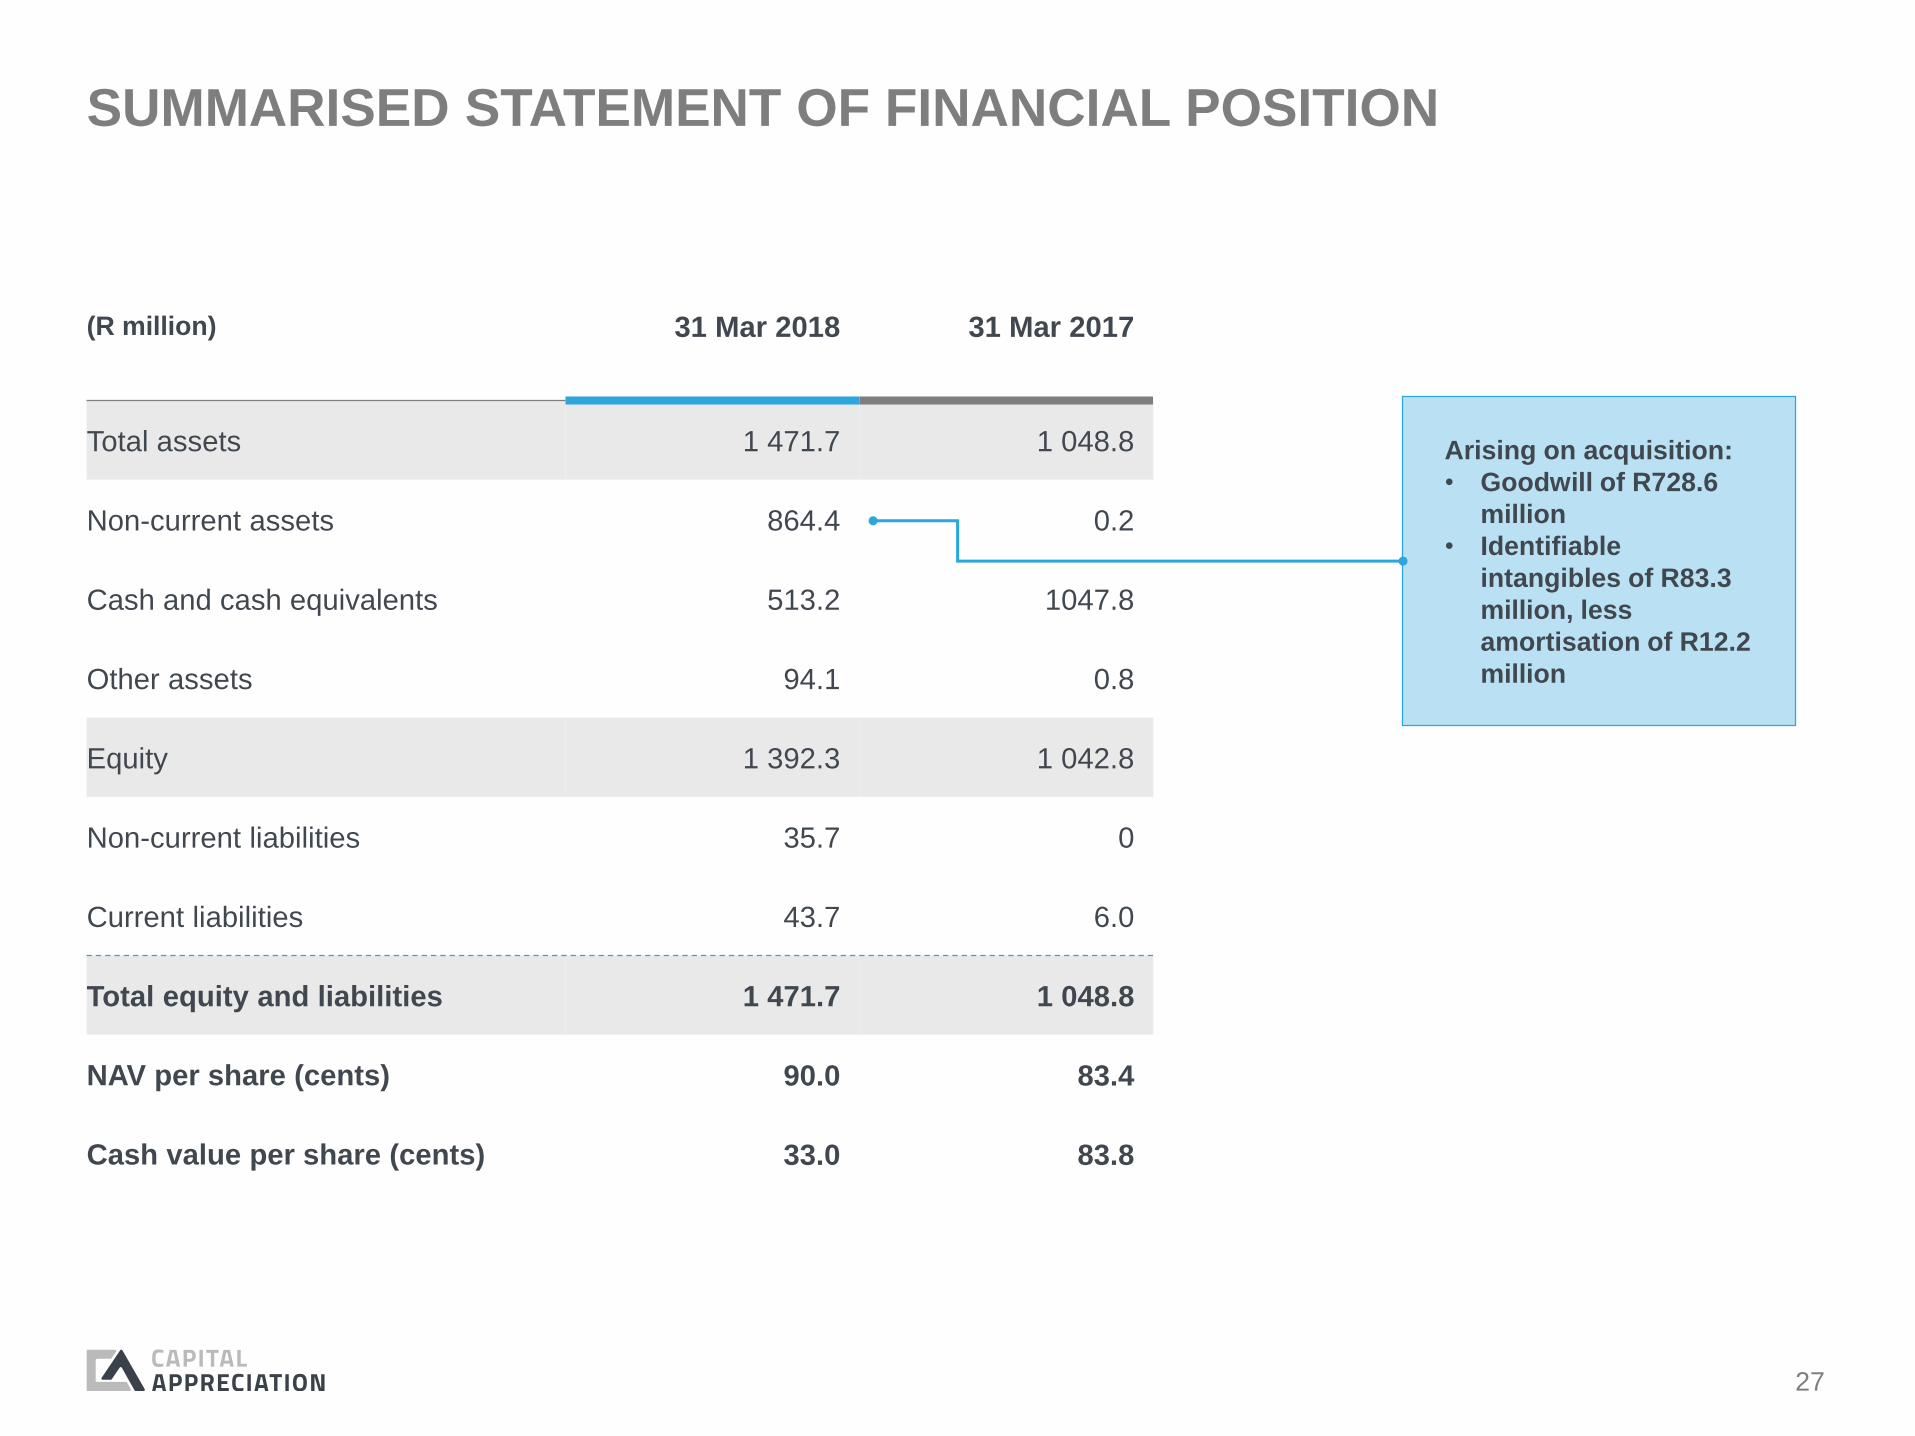
SUMMARISED STATEMENT OF FINANCIAL POSITION
(R million) 31 Mar 2018 31 Mar 2017
Total assets 1 471.7 1 048.8
Non-current assets 864.4 0.2
Cash and cash equivalents 513.2 1047.8
Other assets 94.1 0.8
Equity 1 392.3 1 042.8
Non-current liabilities 35.7 0
Current liabilities 43.7 6.0
Total equity and liabilities 1 471.7 1 048.8
NAV per share (cents) 90.0 83.4
Cash value per share (cents) 33.0 83.8
Arising on acquisition:
• Goodwill of R728.6
million
• Identifiable
intangibles of R83.3
million, less
amortisation of R12.2
million
28
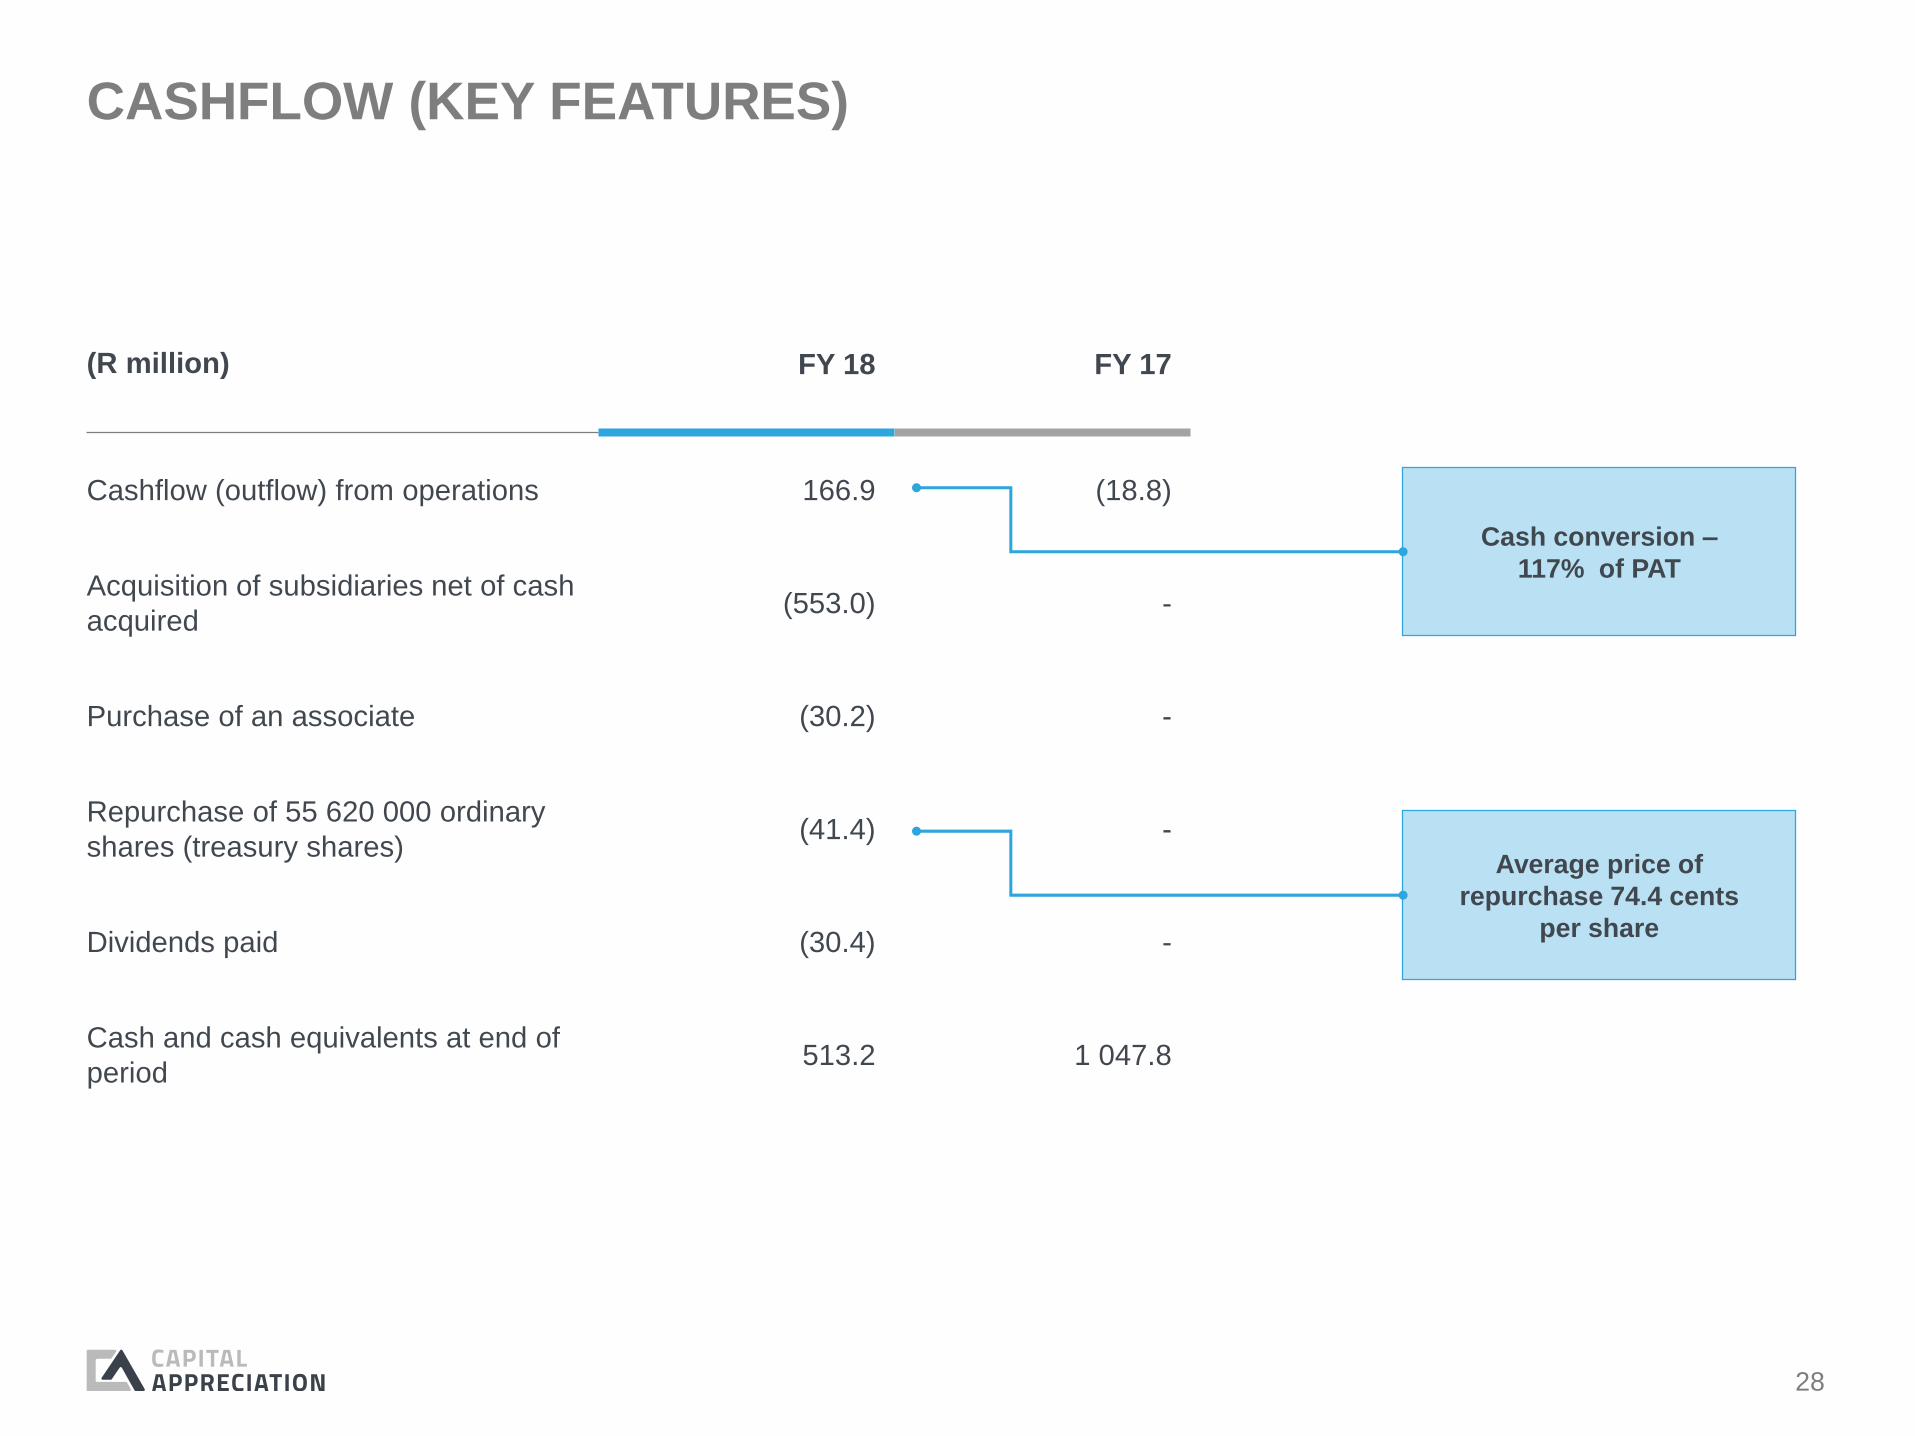
CASHFLOW (KEY FEATURES)
(R million) FY 18 FY 17
Cashflow (outflow) from operations 166.9 (18.8)
Acquisition of subsidiaries net of cash
acquired(553.0) -
Purchase of an associate (30.2) -
Repurchase of 55 620 000 ordinary
shares (treasury shares)(41.4) -
Dividends paid (30.4) -
Cash and cash equivalents at end of
period513.2 1 047.8
Cash conversion –
117% of PAT
Average price of
repurchase 74.4 cents
per share

29
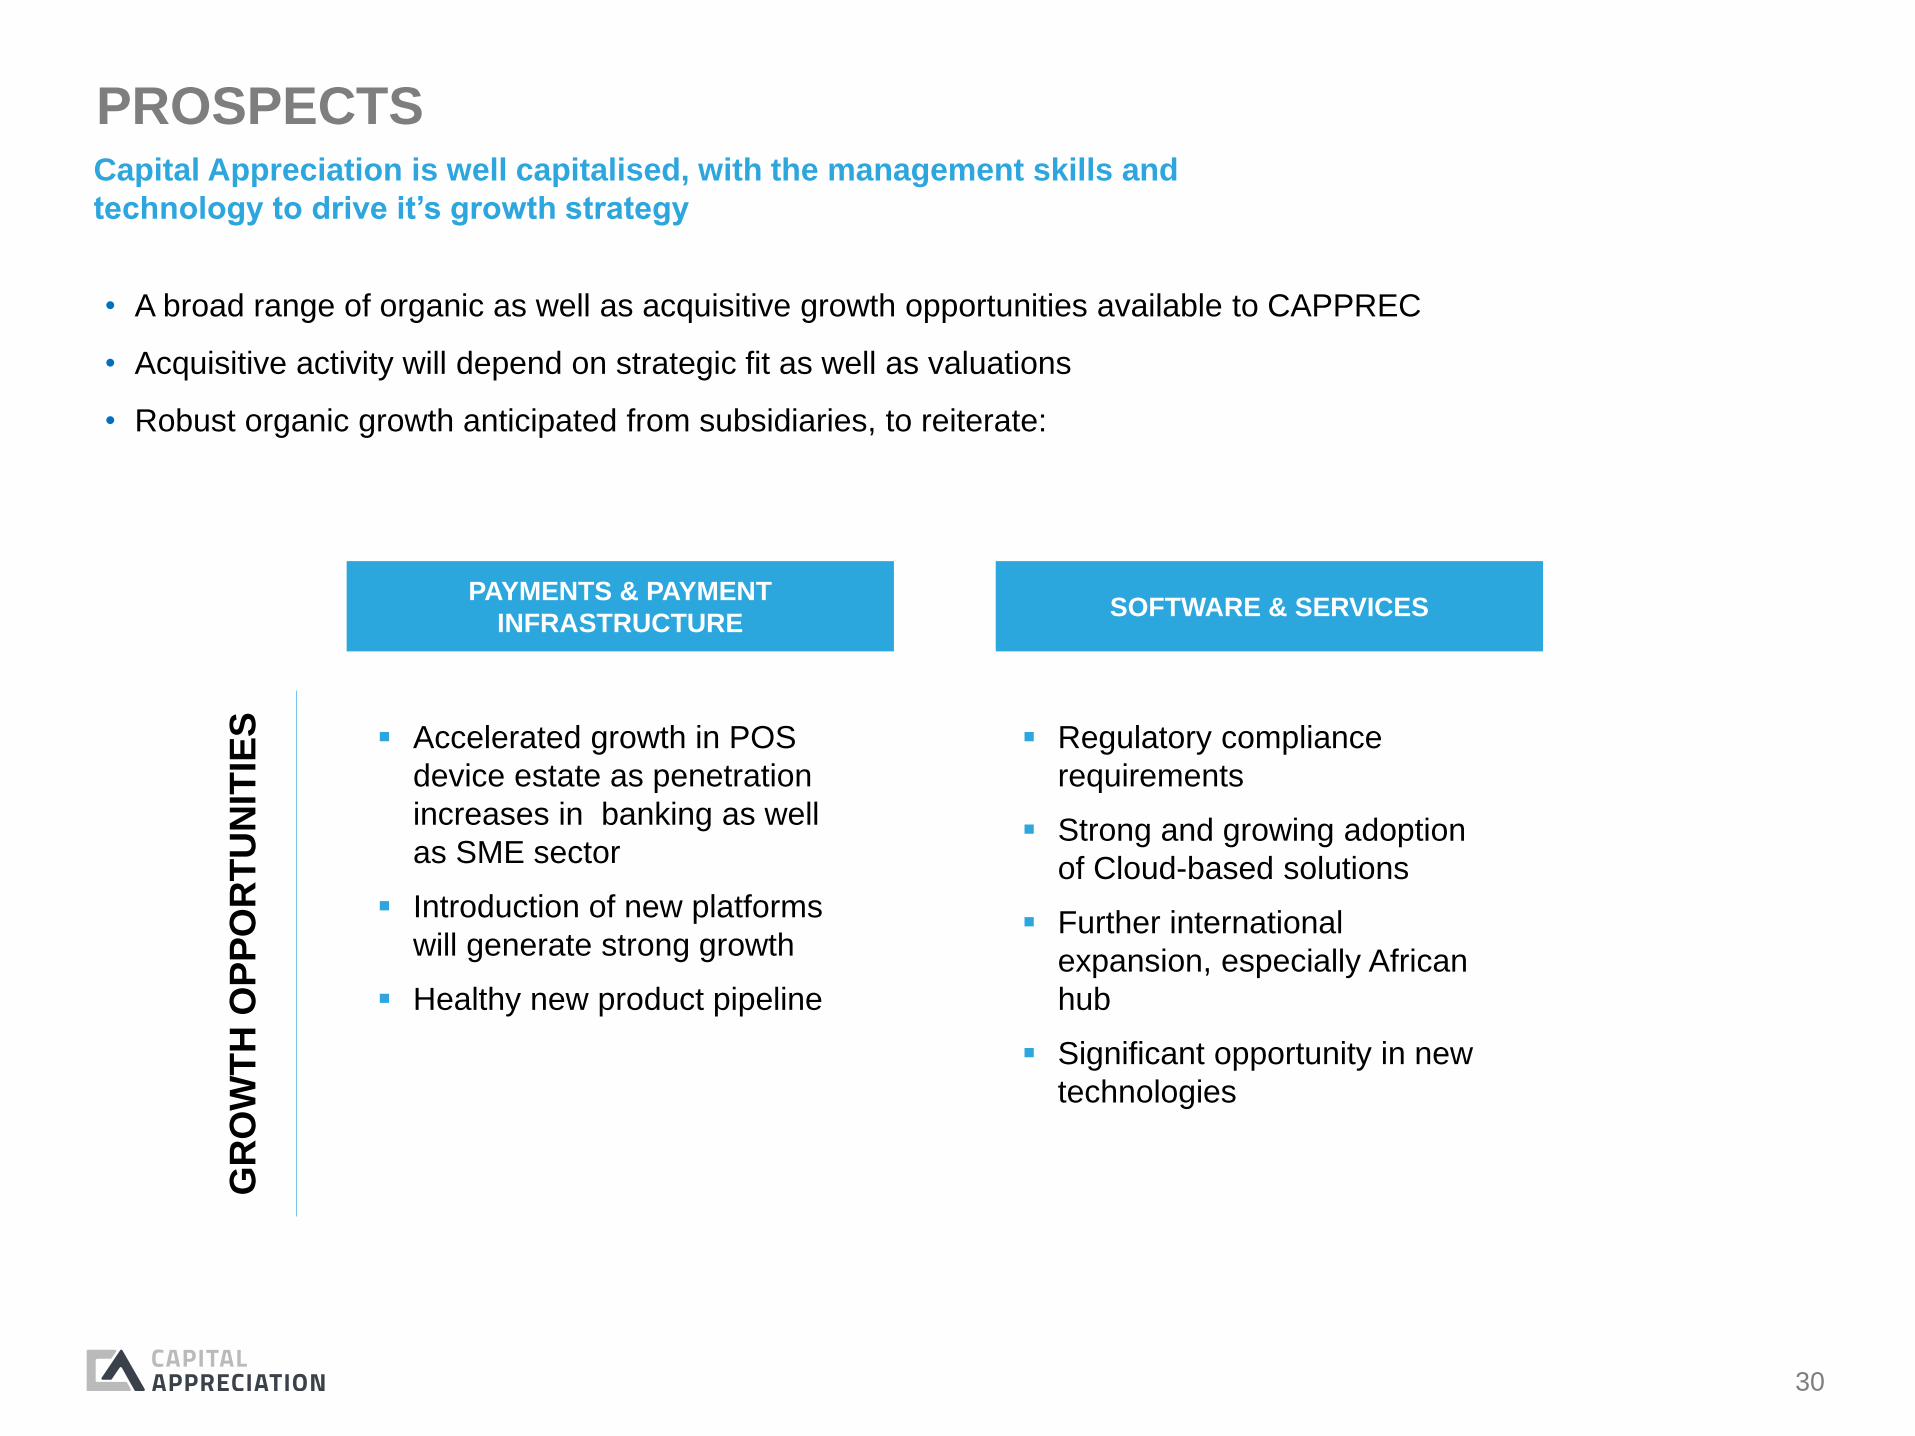
PROSPECTS
30
▪ Accelerated growth in POS
device estate as penetration
increases in banking as well
as SME sector
▪ Introduction of new platforms
will generate strong growth
▪ Healthy new product pipeline
PAYMENTS & PAYMENT
INFRASTRUCTURESOFTWARE & SERVICES
▪ Regulatory compliance
requirements
▪ Strong and growing adoption
of Cloud-based solutions
▪ Further international
expansion, especially African
hub
▪ Significant opportunity in new
technologies
• A broad range of organic as well as acquisitive growth opportunities available to CAPPREC
• Acquisitive activity will depend on strategic fit as well as valuations
• Robust organic growth anticipated from subsidiaries, to reiterate:
GR
OW
TH
OP
PO
RT
UN
ITIE
S
PROSPECTSCapital Appreciation is well capitalised, with the management skills and
technology to drive it’s growth strategy

31
OUR INVESTMENT CASE
• A trusted partner to a strong network of large financial institutions
• Clients are well capitalised and established
• Clients already have a presence in Africa – providing the potential ability for CAPPREC to
expand regionally with them
• Founders with a very strong network of relationships on which to build future business
• Well-established FinTech subsidiaries with strong track records
• Innovation
• Quality execution
• Financial performance
• A strong balance sheet with adequate headroom for organic and acquisitive growth
• Subsidiaries are cash generative with cash conversion of close to 100%
• Well-positioned in an industry with very rapid growth
• Our products and services are targeted at mission-critical applications

32
T H A N K Y O U

33
ANNEXURE
34
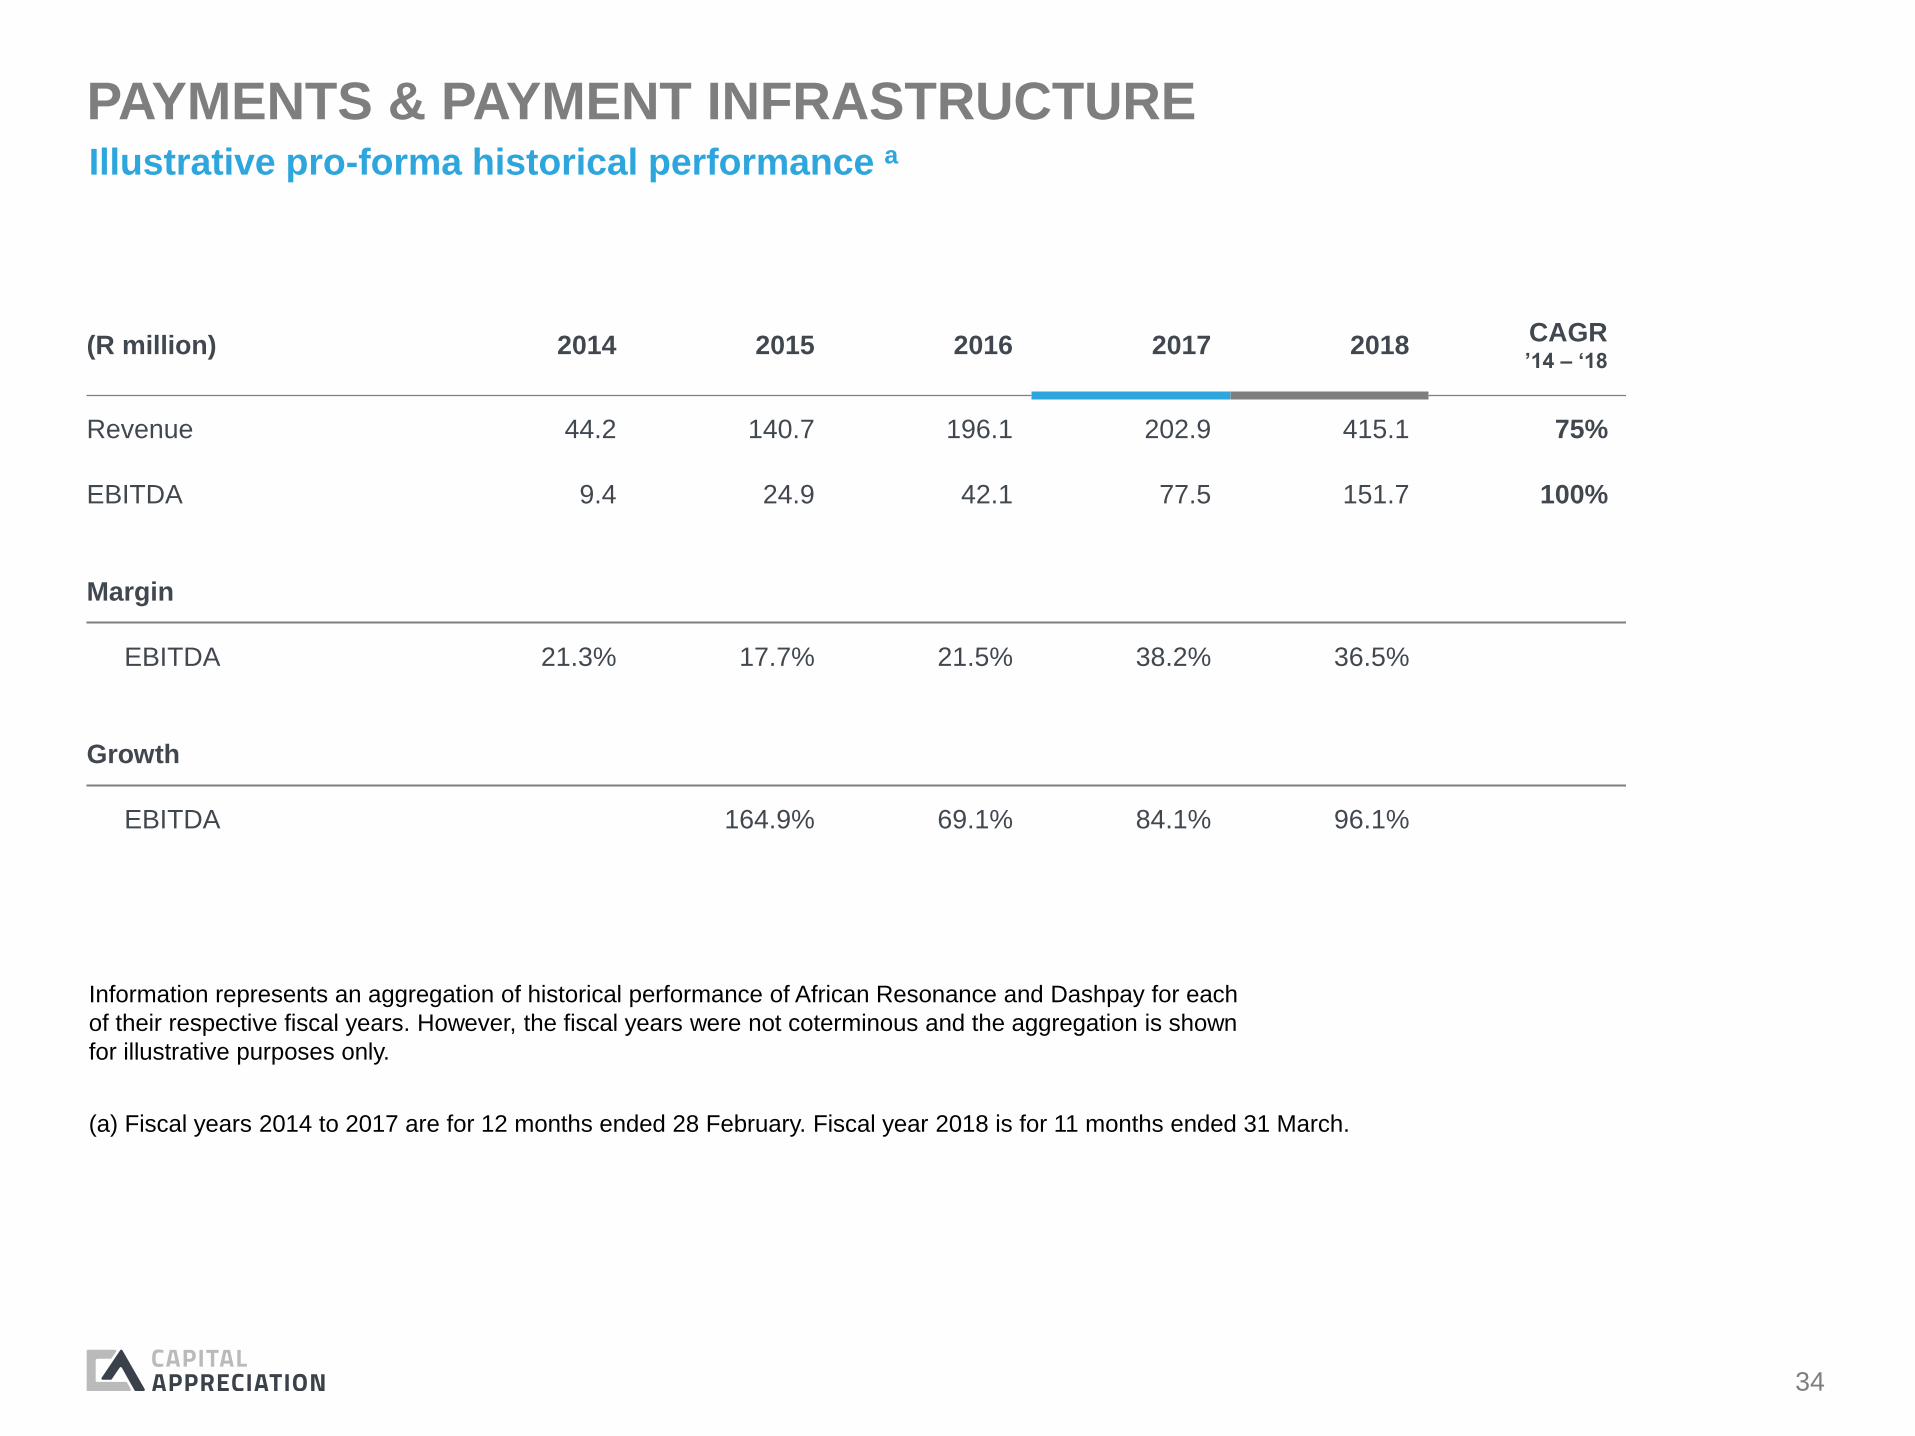
PAYMENTS & PAYMENT INFRASTRUCTUREIllustrative pro-forma historical performance a
(R million) 2014 2015 2016 2017 2018CAGR’14 – ‘18
Revenue 44.2 140.7 196.1 202.9 415.1 75%
EBITDA 9.4 24.9 42.1 77.5 151.7 100%
Margin
EBITDA 21.3% 17.7% 21.5% 38.2% 36.5%
Growth
EBITDA 164.9% 69.1% 84.1% 96.1%
Information represents an aggregation of historical performance of African Resonance and Dashpay for each
of their respective fiscal years. However, the fiscal years were not coterminous and the aggregation is shown
for illustrative purposes only.
(a) Fiscal years 2014 to 2017 are for 12 months ended 28 February. Fiscal year 2018 is for 11 months ended 31 March.
35
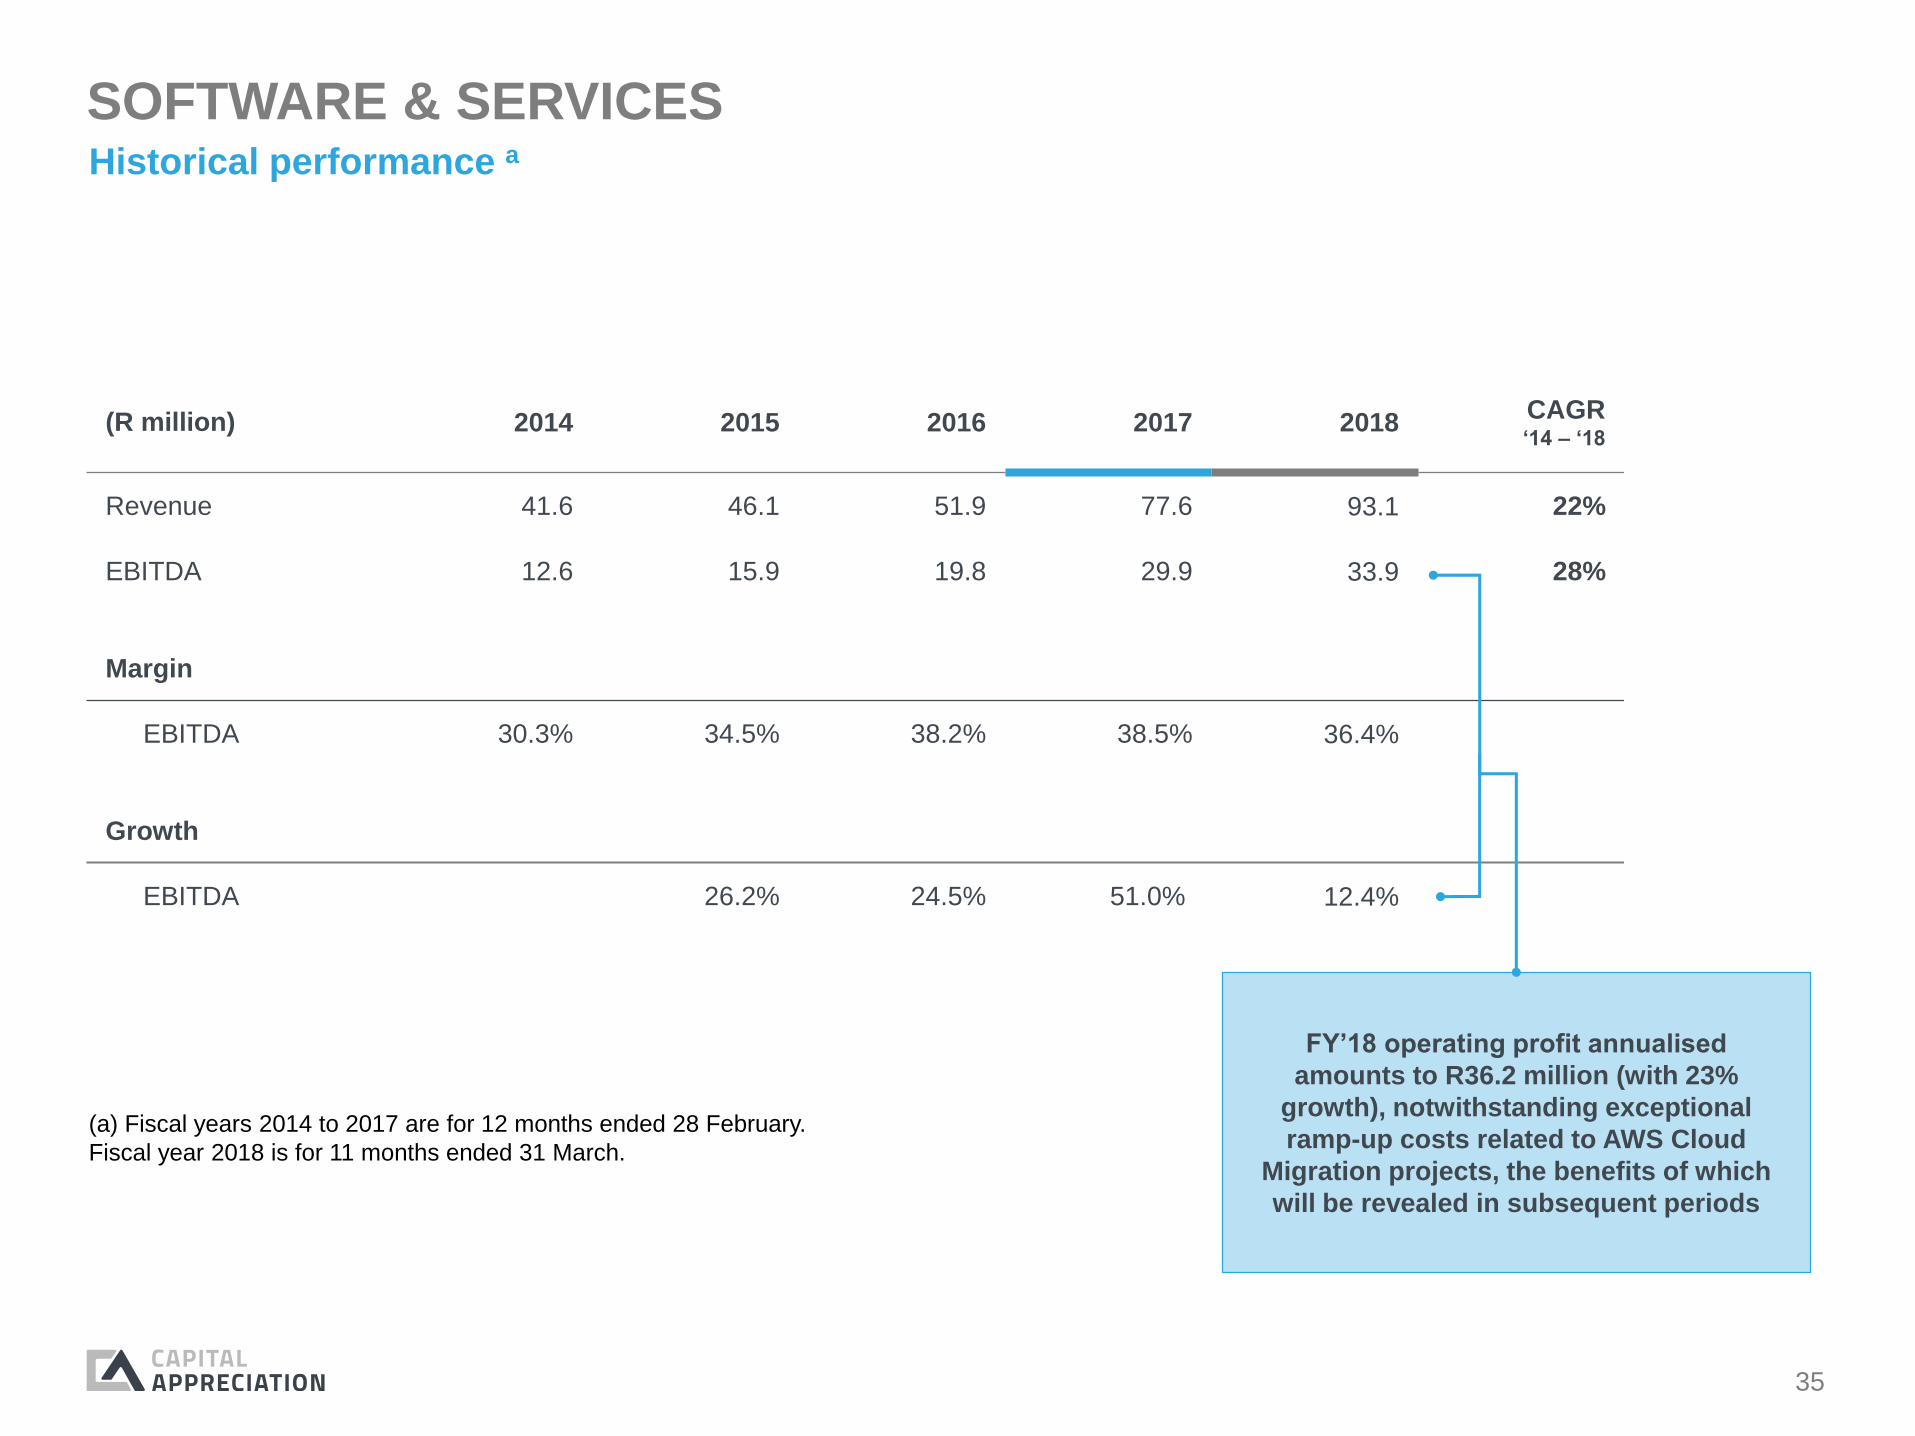
SOFTWARE & SERVICESHistorical performance a
(R million) 2014 2015 2016 2017 2018CAGR ‘14 – ‘18
Revenue 41.6 46.1 51.9 77.6 93.1 22%
EBITDA 12.6 15.9 19.8 29.9 33.9 28%
Margin
EBITDA 30.3% 34.5% 38.2% 38.5% 36.4%
Growth
EBITDA 26.2% 24.5% 51.0% 12.4%
(a) Fiscal years 2014 to 2017 are for 12 months ended 28 February.
Fiscal year 2018 is for 11 months ended 31 March.
FY’18 operating profit annualised
amounts to R36.2 million (with 23%
growth), notwithstanding exceptional
ramp-up costs related to AWS Cloud
Migration projects, the benefits of which
will be revealed in subsequent periods

36
COMPARABLE INTERNATIONAL COMPANIESIllustrative of breadth and depth of international “Payments” marketplace
NETWORKS EMERGING PAYMENTSMERCHANT ACQUIRORSPOS / CASH
DISBURSEMENT
$297,010 // 20.6x
$205,856 // 22.9x
$19,248 // 12.2x
$6,819 // 14.6x
$13,836 // 10.5x
$18,699 // 16.5x
$1,626 // 11.6x
$509 // 4.2x $16,441 // 15.3x
$24,724 // 16.6x
$96,834 // 23.2x
$1,171 // 9.7x
$24,999 // NM
$730 // NM
$17,858 // 27.9x
$663 // 14.9x
$817 // NA
$5,601 // 11.6x
$812 // 9.3x
$2,633 // 10.7x
$1,479 // 8.9x
$217 // 13.6x
MARKET CAPITALISATION (IN US $ MILLIONS) // CY18E EV/EBITDA AS OF 11/05/2018
$7,822 // 18.1x
Enterprise Value =
c.17x FY18 Rev

37
COST COMMODITISATION
Financial institutions will accelerate the
commoditisation of their cost bases, removing them
as points of competition and creating new grounds
for differentiation
PROFIT REDISTRIBUTION
Technology and new partnerships will enable
organisations to bypass traditional value chains,
thereby redistributing profit pools
“EXPERIENCE” OWNERSHIP
Power will transfer to the owner of the client
interface; pure manufacturers must therefore
become hyper-scaled or hyper-focused
PLATFORMS RISING
Platforms that offer the ability to engage with
different financial institutions from a single channel
will become the dominant model for the delivery of
financial services
DATA MONETISATION
BIONIC WORKFORCE
SYSTEMATICALLY IMPORTANT TECHS
SOURCE: DERIVED FROM WORLD ECONOMIC FORUM REPORT
INSTANT GRATIFICATION
REGULATORY COMPLIANCE & REFORM
Regulators are increasing oversight and compliance obligations over
established players while also looking to encourage innovation and
reduce transaction friction
1
2
3
4
5
6
7
8
9
Data will become increasingly important for differentiation, but static data
sets will be enriched by flows of data from multiple sources combined and
used in real time
As the ability for machines to replicate the behaviour of humans continues
to evolve, financial institutions will need to manage labour and capital as
a single set of capabilities
Financial institutions increasingly resemble, and are dependent on, large
tech firms to acquire critical infrastructure and differentiating technologies
User experience of "online" environment is impacting all industries where
bespoke solutions are offered instantly
A BROAD RANGE OF GROWTH DRIVERS GLOBALLY

38
INTERNATIONAL TRENDS
• Increasing from new
entrants
• New payment types
• Disruptive
COMPETITION
• Empowering new
entrants not constrained
by legacy platforms
• High IT investment
required to respond to
client needs
TECHNOLOGY
• Sector expertise and
focus driving costs
down
• Consolidation and
exit of banks from
payments
FOCUS
• Increasingly more
demanding of
innovative solutions
that require non-legacy
technology platforms
• Lifestyle tailored
solutions
CLIENTS
• Requires expenditure on
divergent priorities and
cannot remain current
• Security directives are
mandatory or risk and
liability is substantial
• Driving deployment of
new devices
REGULATION
A leading indicator for South African banks – industry in flux
39
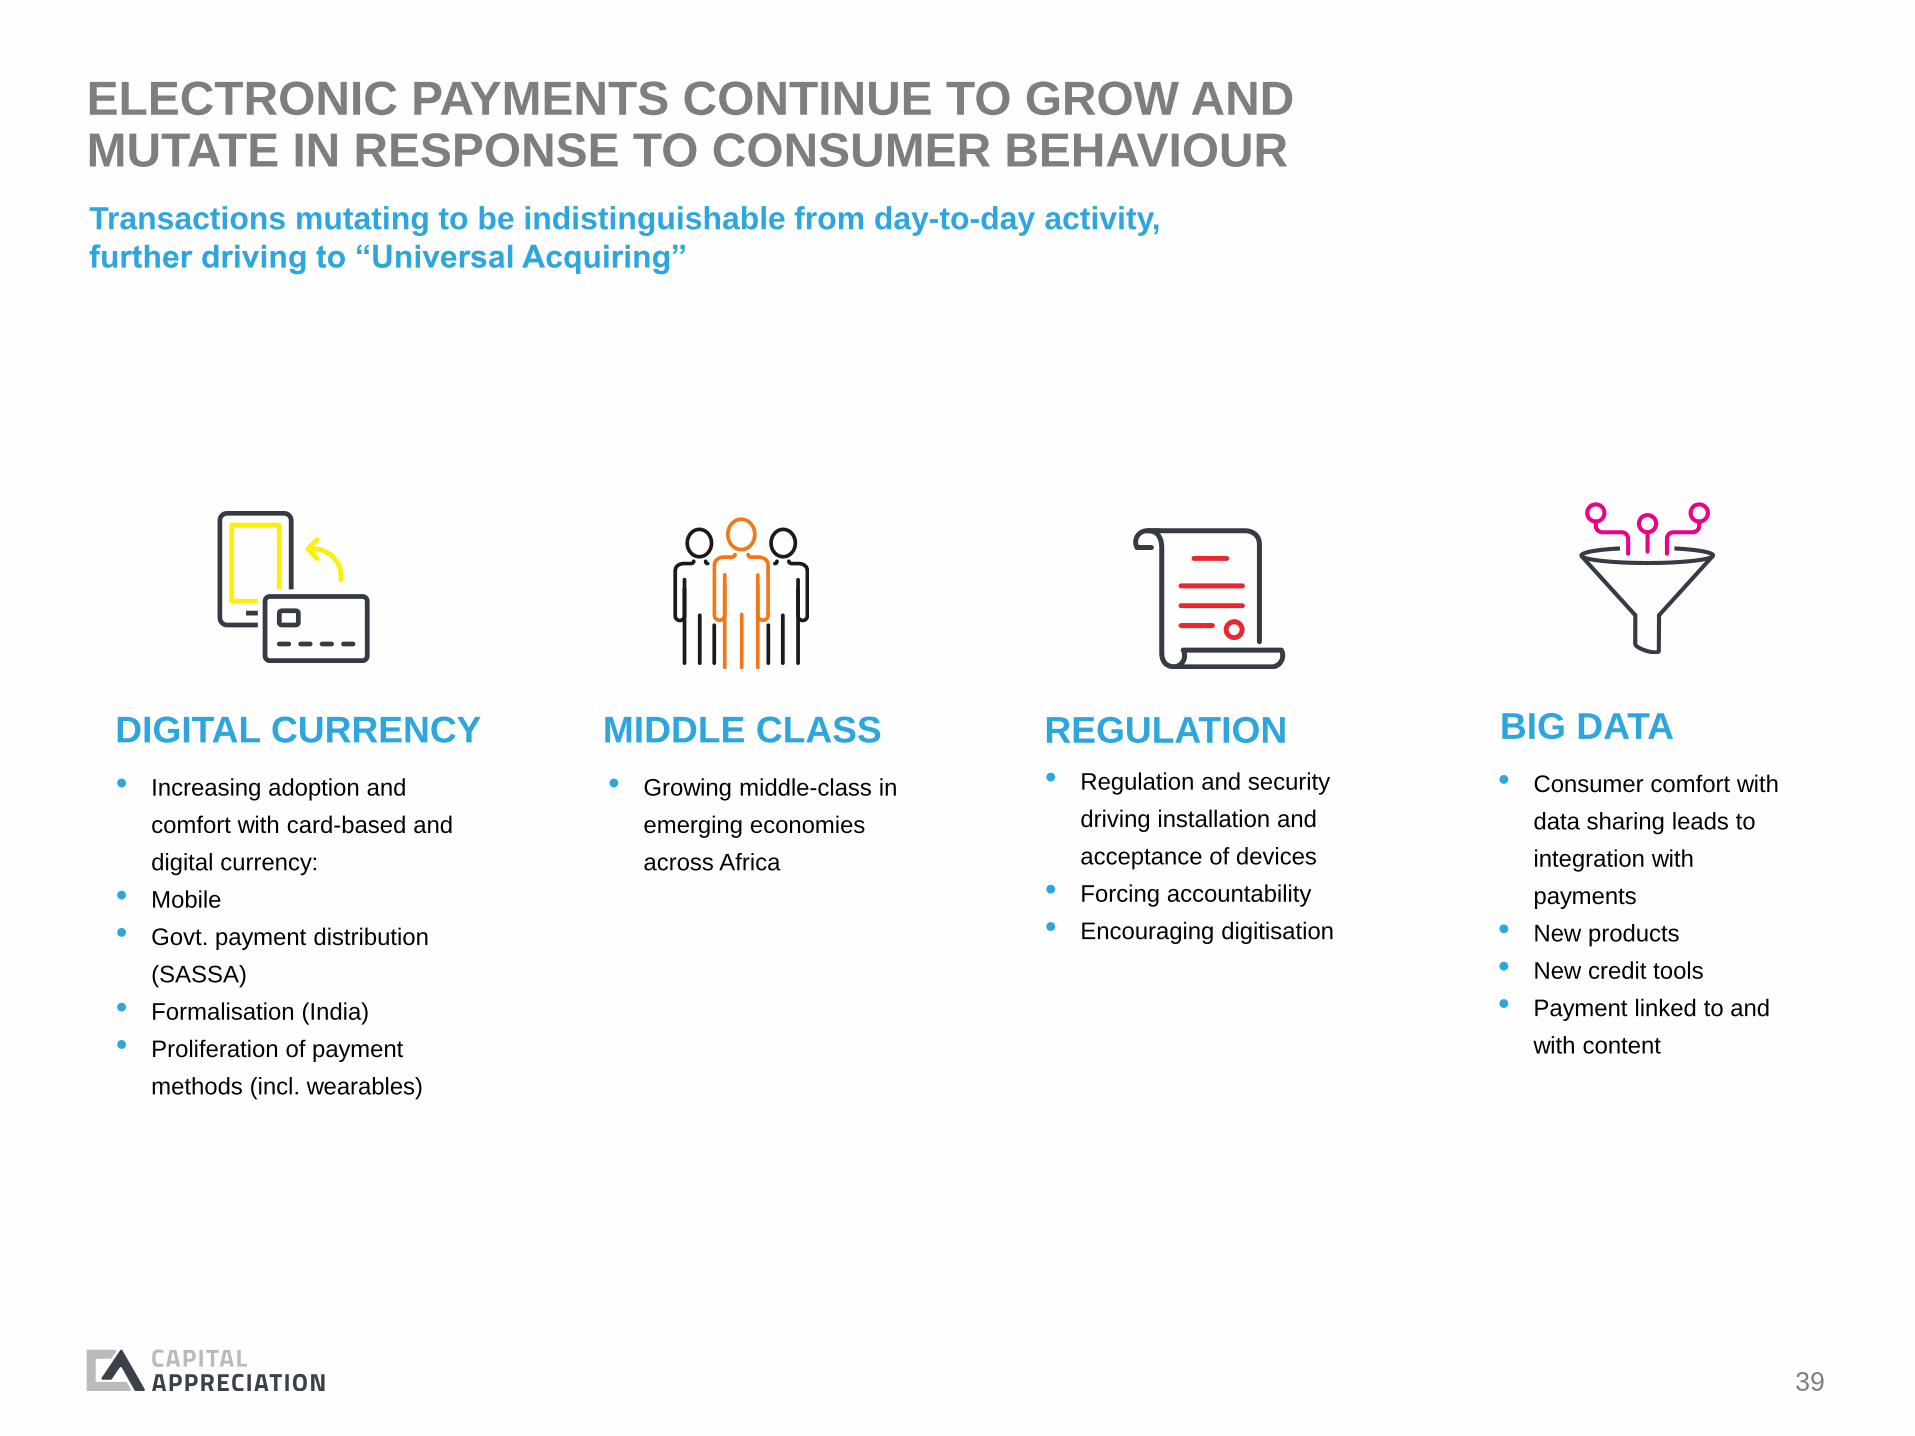
ELECTRONIC PAYMENTS CONTINUE TO GROW AND MUTATE IN RESPONSE TO CONSUMER BEHAVIOUR
• Increasing adoption and
comfort with card-based and
digital currency:
• Mobile
• Govt. payment distribution
(SASSA)
• Formalisation (India)
• Proliferation of payment
methods (incl. wearables)
DIGITAL CURRENCY
• Growing middle-class in
emerging economies
across Africa
MIDDLE CLASS
• Regulation and security
driving installation and
acceptance of devices
• Forcing accountability
• Encouraging digitisation
REGULATION
• Consumer comfort with
data sharing leads to
integration with
payments
• New products
• New credit tools
• Payment linked to and
with content
BIG DATA
Transactions mutating to be indistinguishable from day-to-day activity,
further driving to “Universal Acquiring”
40
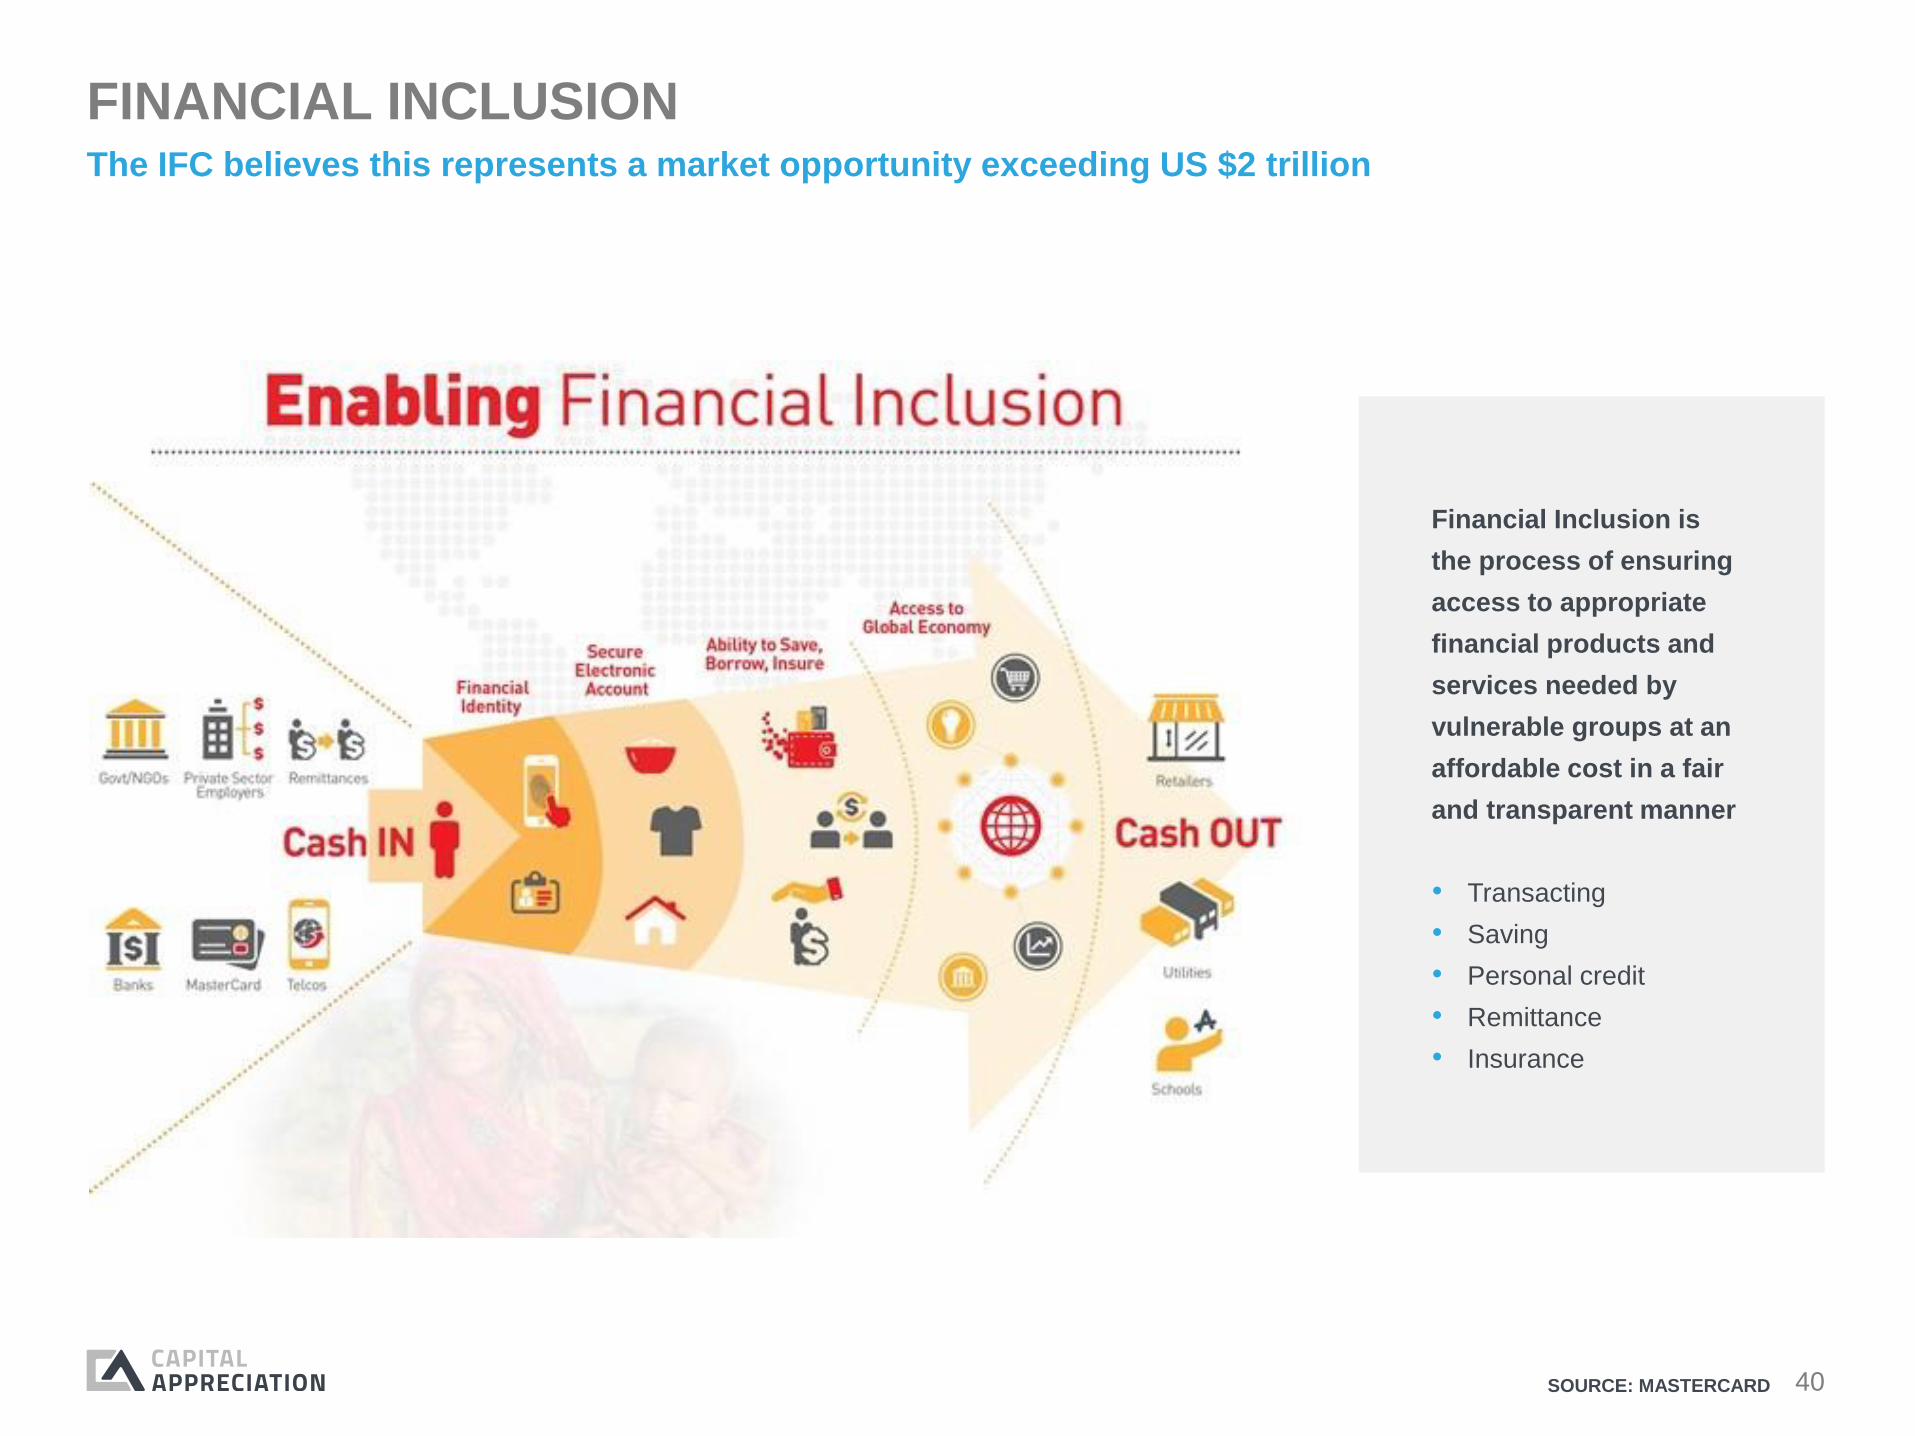
FINANCIAL INCLUSION
Financial Inclusion is
the process of ensuring
access to appropriate
financial products and
services needed by
vulnerable groups at an
affordable cost in a fair
and transparent manner
• Transacting
• Saving
• Personal credit
• Remittance
• Insurance
The IFC believes this represents a market opportunity exceeding US $2 trillion
SOURCE: MASTERCARD
41
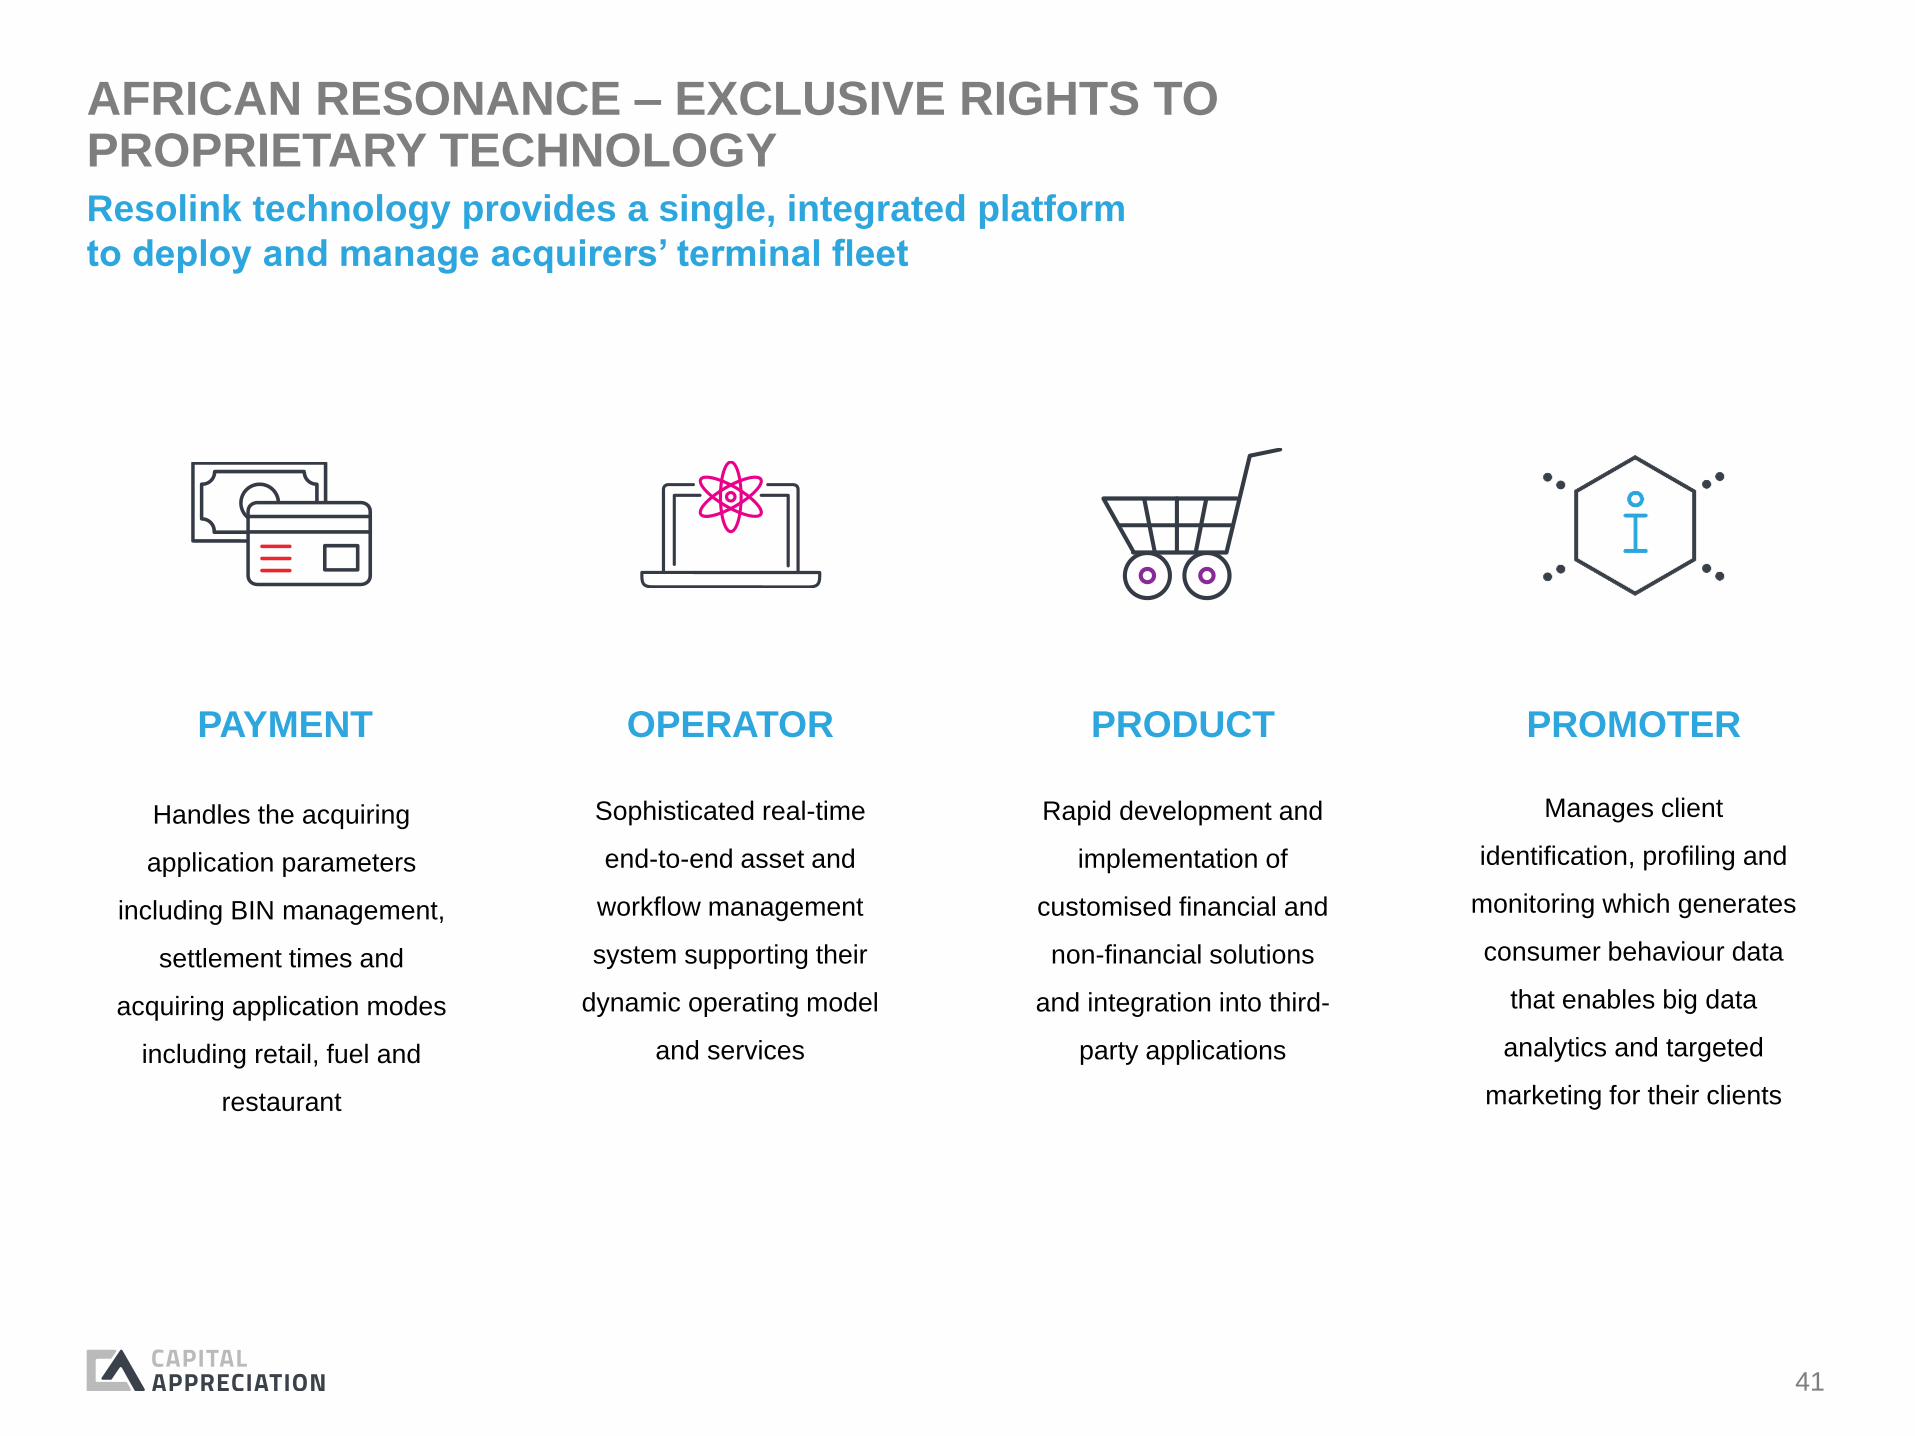
AFRICAN RESONANCE – EXCLUSIVE RIGHTS TO PROPRIETARY TECHNOLOGY
Rapid development and
implementation of
customised financial and
non-financial solutions
and integration into third-
party applications
PRODUCT
Sophisticated real-time
end-to-end asset and
workflow management
system supporting their
dynamic operating model
and services
OPERATOR
Manages client
identification, profiling and
monitoring which generates
consumer behaviour data
that enables big data
analytics and targeted
marketing for their clients
PROMOTER
Handles the acquiring
application parameters
including BIN management,
settlement times and
acquiring application modes
including retail, fuel and
restaurant
Resolink technology provides a single, integrated platform
to deploy and manage acquirers’ terminal fleet
PAYMENT
42
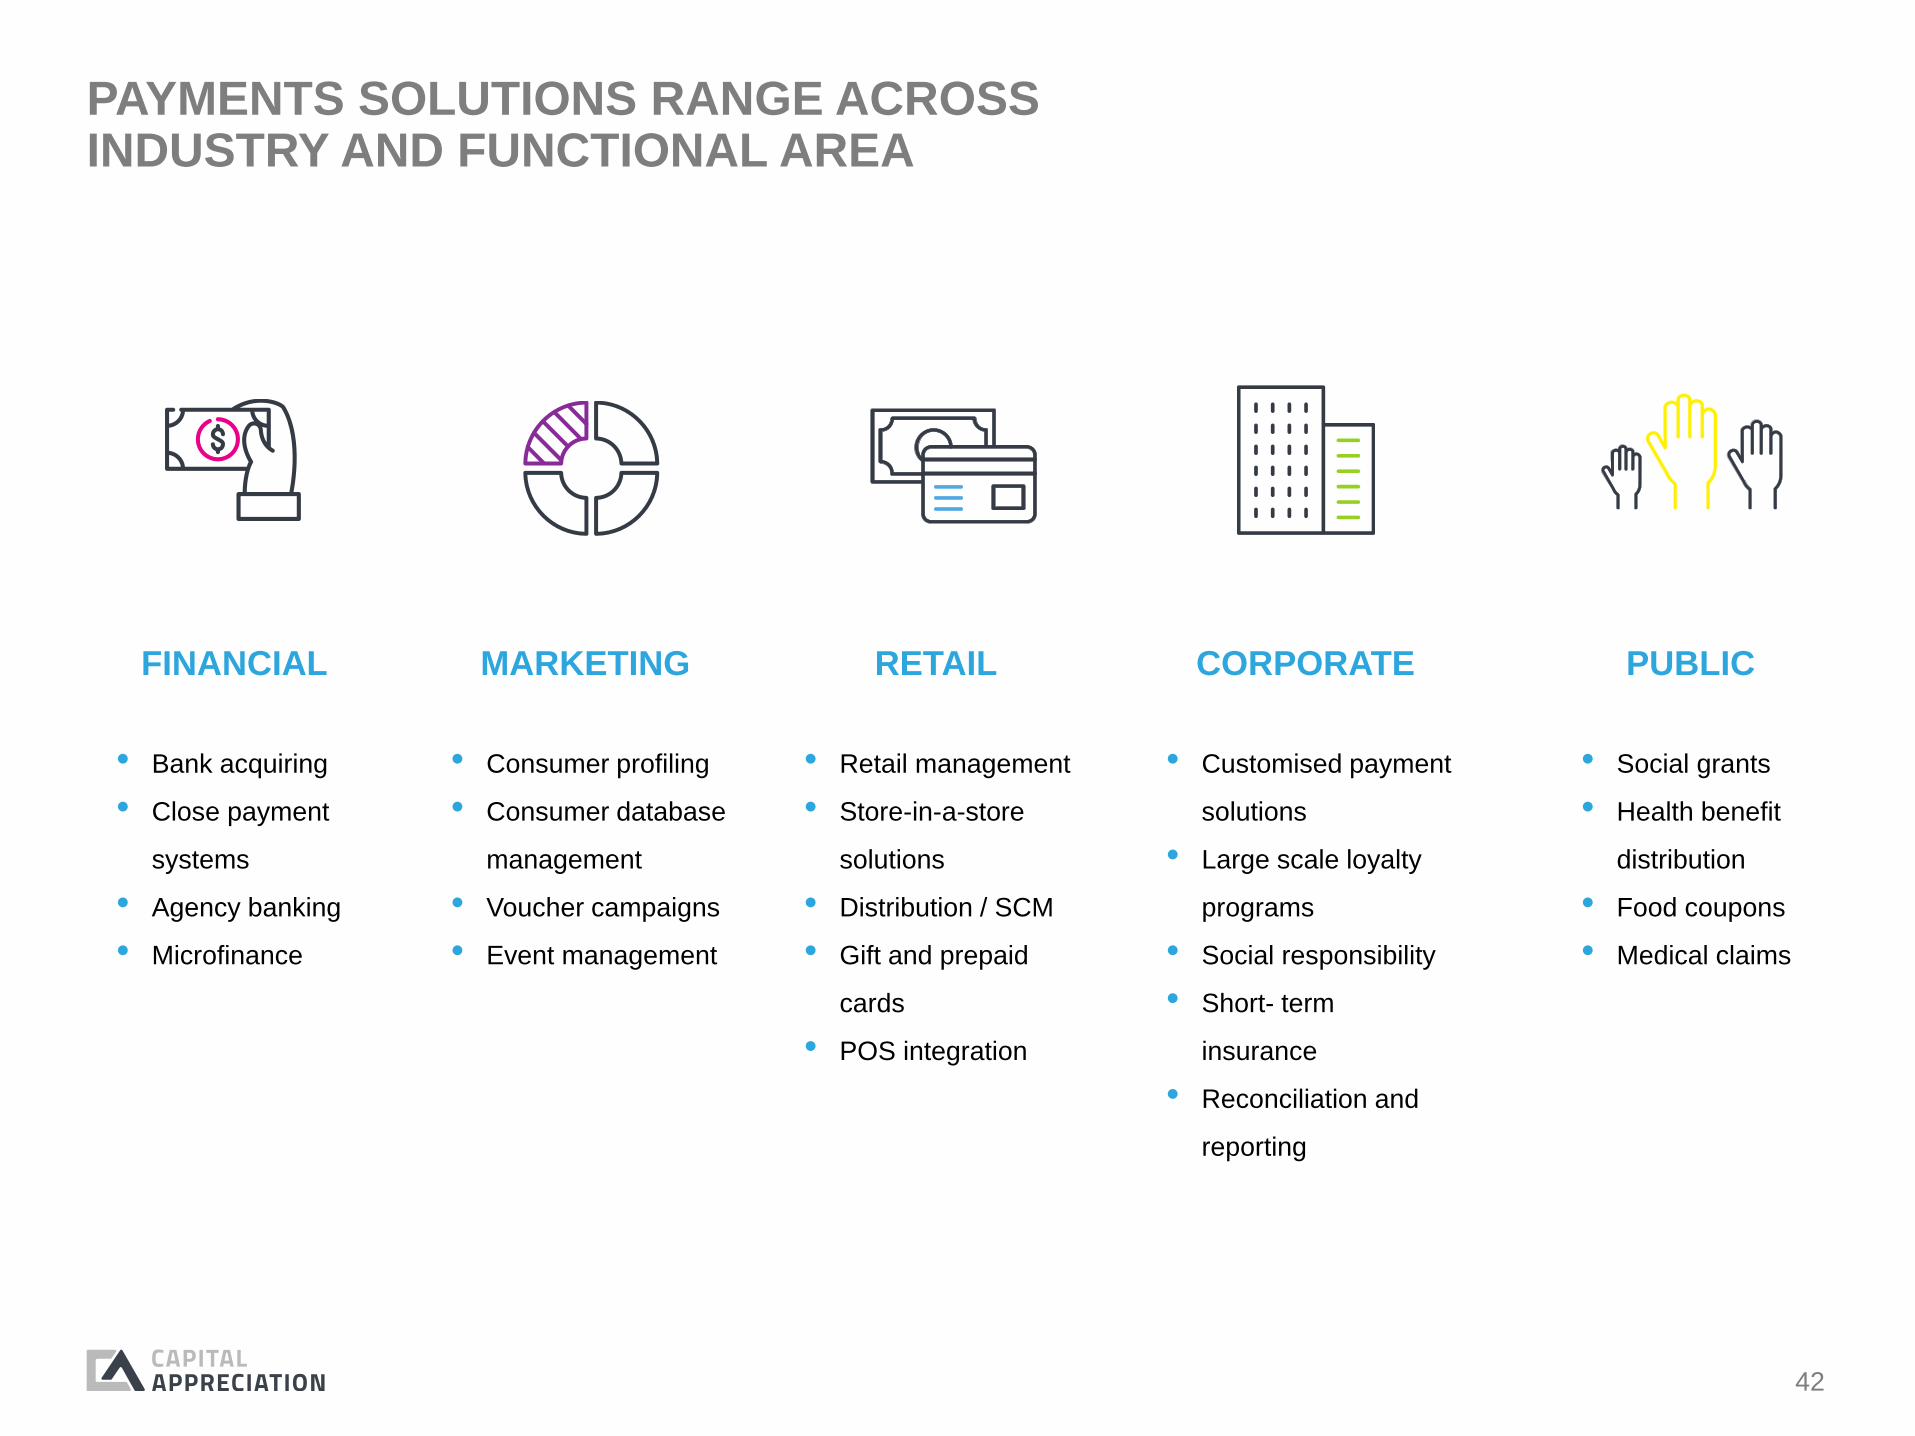
PAYMENTS SOLUTIONS RANGE ACROSS INDUSTRY AND FUNCTIONAL AREA
• Bank acquiring
• Close payment
systems
• Agency banking
• Microfinance
FINANCIAL
• Retail management
• Store-in-a-store
solutions
• Distribution / SCM
• Gift and prepaid
cards
• POS integration
RETAIL
• Consumer profiling
• Consumer database
management
• Voucher campaigns
• Event management
MARKETING
• Social grants
• Health benefit
distribution
• Food coupons
• Medical claims
PUBLIC
• Customised payment
solutions
• Large scale loyalty
programs
• Social responsibility
• Short- term
insurance
• Reconciliation and
reporting
CORPORATE
43
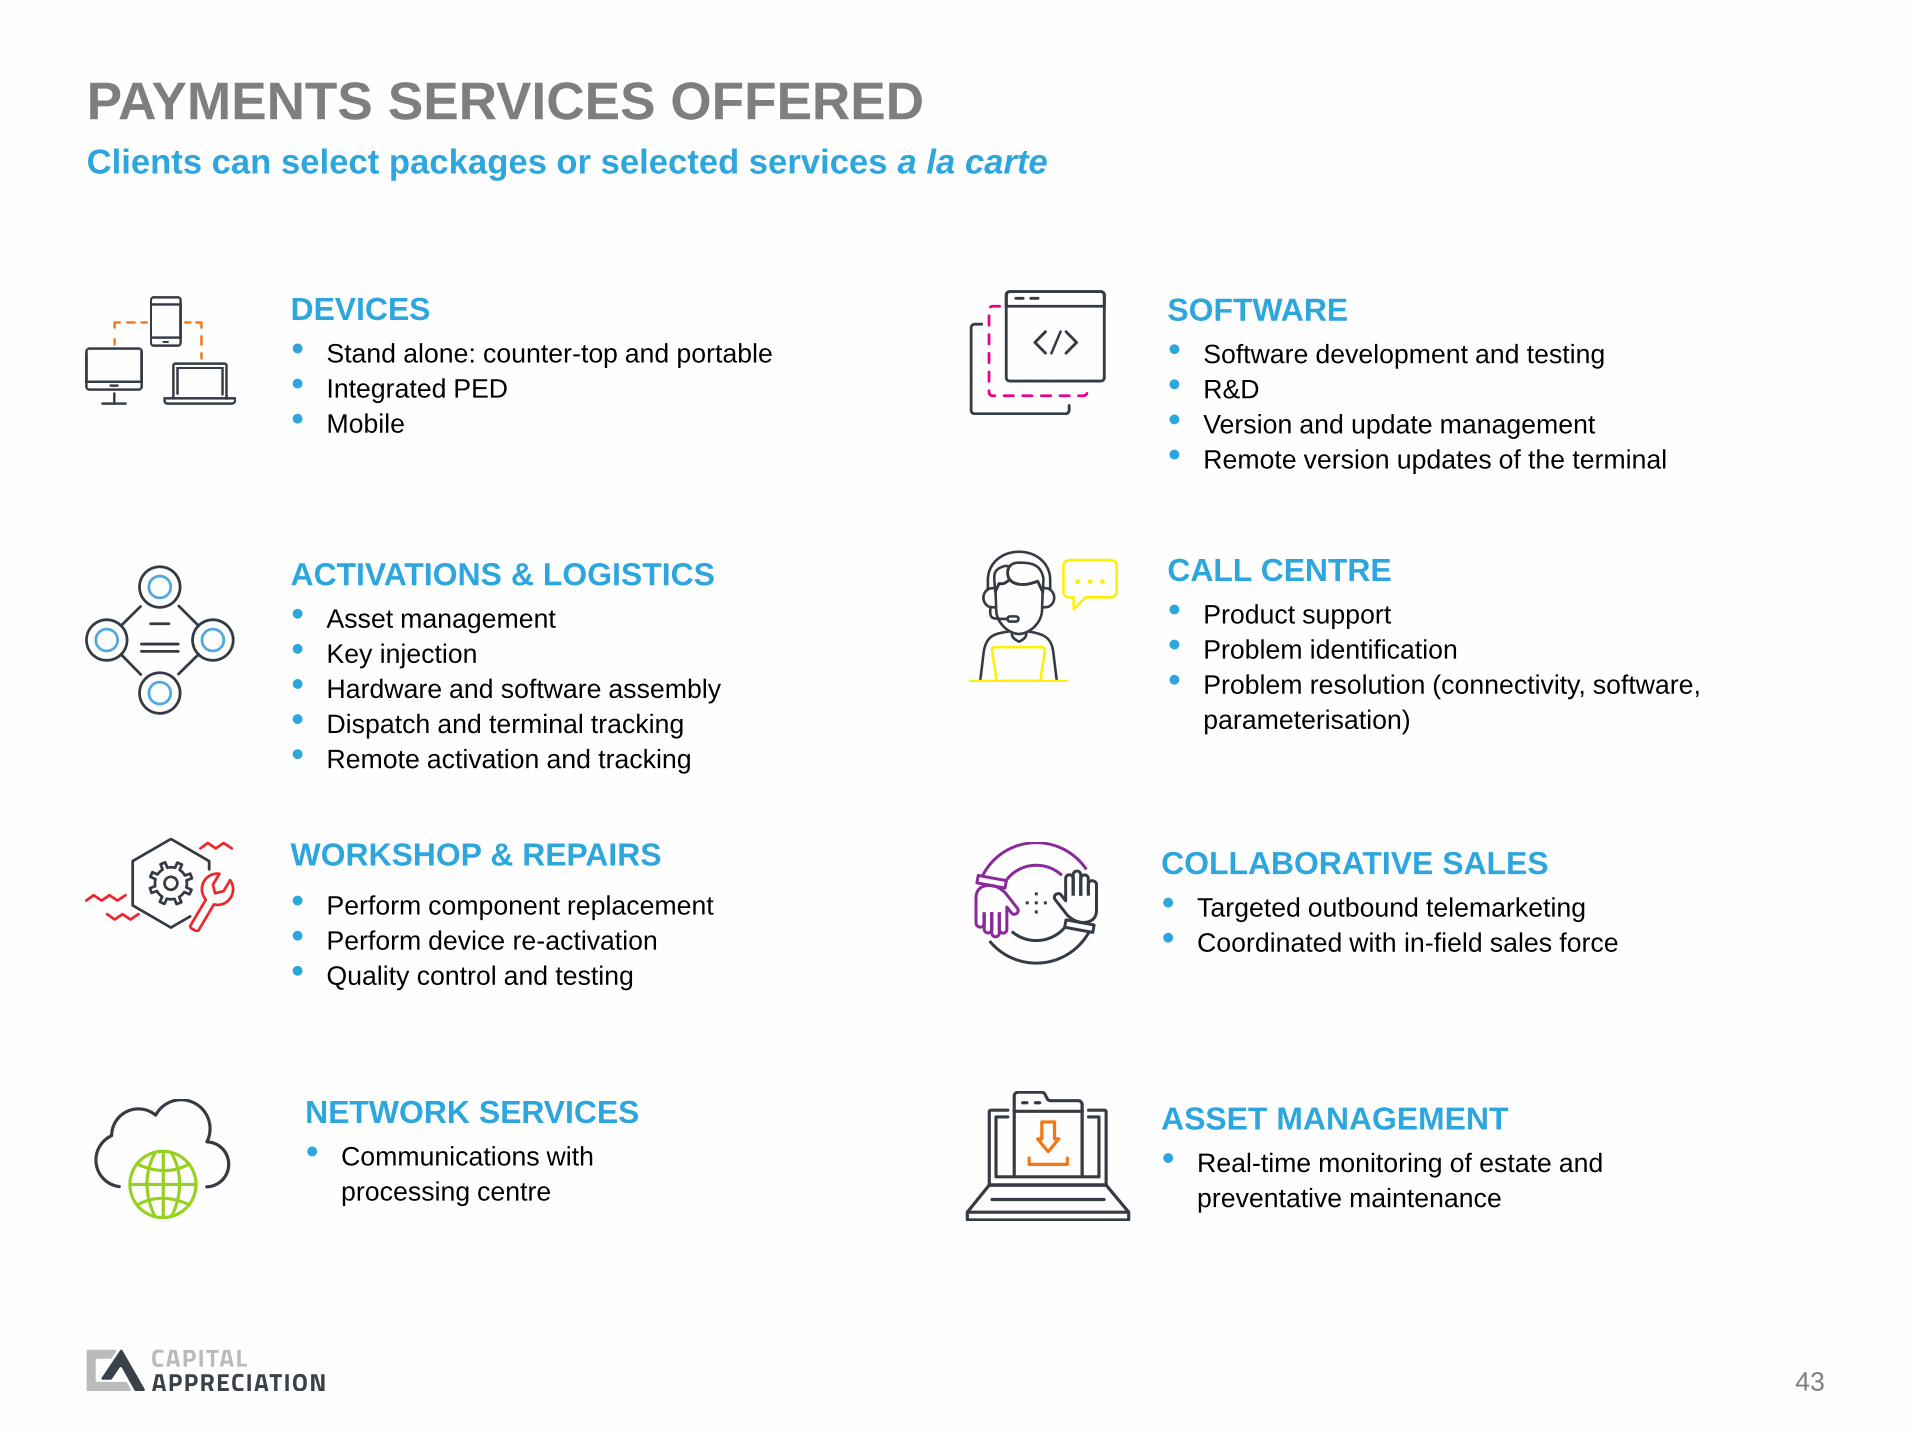
PAYMENTS SERVICES OFFERED
ACTIVATIONS & LOGISTICS
• Stand alone: counter-top and portable
• Integrated PED
• Mobile
DEVICES
• Asset management
• Key injection
• Hardware and software assembly
• Dispatch and terminal tracking
• Remote activation and tracking
• Perform component replacement
• Perform device re-activation
• Quality control and testing
WORKSHOP & REPAIRS
• Communications with
processing centre
NETWORK SERVICES
• Software development and testing
• R&D
• Version and update management
• Remote version updates of the terminal
SOFTWARE
• Product support
• Problem identification
• Problem resolution (connectivity, software,
parameterisation)
CALL CENTRE
• Targeted outbound telemarketing
• Coordinated with in-field sales force
COLLABORATIVE SALES
• Real-time monitoring of estate and
preventative maintenance
ASSET MANAGEMENT
Clients can select packages or selected services a la carte

44
PAYMENTS STRENGTHS
Blue chip client base
CLIENTS
Blue chip supplier base
SUPPLIERS
History of innovation
INNOVATION
Sector expertise
Experienced team
EXPERTISE /
MANAGEMENT
Unique technologies
TECHNOLOGY
Speed of deployment and ability
to respond to market needs
SPEED
Single interface with integrated device
and CRM records
INTERFACE
Universal acquiring capability
(bundled products)
UNIVERSAL
Compliant with best practice
SECURITY
Visa and Mastercard accredited
ACCREDITATION
45
For the purposes of this notice, this presentation (the “Presentation”)
shall mean and include the pages and slides that follow, its contents
including the information forming part thereof or referred to in the
Presentation, the oral presentation of the pages and slides by
Capital Appreciation Limited ("CAPPREC") its officers, directors,
employees and/or advisers, any question-and-answer session that
follows that oral presentation, hard copies of this document and any
materials and/or information (in whatever form) distributed at, or in
connection with, that oral presentation. By attending the meeting at
which the Presentation is made, or by reading the Presentation
slides, you will be deemed to have (i) agreed to all of the following
restrictions and made the following undertakings; and (ii)
acknowledged that you understand the legal and regulatory
sanctions attached to the misuse, disclosure or improper circulation
of the Presentation.
This Presentation is provided to you solely for information purposes
and does not constitute, and may not be relied on in any manner as,
legal, tax or investment advice and/or an investment
recommendation.
This Presentation is not directed to, or intended for distribution to or
use by, any person or entity that is a citizen or resident of, or located
in, any locality, state, country or other jurisdiction where such
distribution or use would be contrary to law or regulation or which
would require any action (including registration or licensing) within
such jurisdiction for such purpose.
This Presentation is not, and should not be construed so as to
constitute, an offer of securities for sale or acquisition in any
jurisdiction, including in the United States, Canada, Australia or
Japan.
This Presentation does not constitute or form part of, and should not
be construed as, an advertisement, invitation, solicitation and/or offer
to sell, issue, purchase or subscribe for, any shares and/or securities
in any jurisdiction, or an inducement to enter into investment activity.
This Presentation does not constitute an offer to the public for the
sale of or subscription for, or an advertisement or the solicitation of
an offer to buy and/or subscribe for, securities as defined in the
Companies Act, 71 of 2008 ("the Act") or otherwise and will not be
distributed to any person in South Africa in any manner which could
be construed as an offer to the public in terms of the Act.
Furthermore, this Presentation does not constitute an advertisement
or a prospectus registered and/or issued under the Act.
The information contained herein has been prepared using
information available to CAPPREC at the time of preparation of this
Presentation. External or other factors may have impacted on the
business of CAPPREC and the content of this Presentation, since its
preparation. In addition all relevant information about CAPPREC may
not be included in this Presentation.
The information in this Presentation has not been independently
verified. No representation or warranty, expressed or implied, is
made as to the accuracy, completeness or reliability of the
information contained herein and no reliance should be placed on
such information.
Neither CAPPREC, its officers, directors, employees nor any of its
advisers, connected persons or any other person accepts any
liability for any loss howsoever arising, directly or indirectly, from this
Presentation or its contents.
This Presentation contains forward-looking statements, including in
relation to the prospects of CAPPREC, which include all statements
other than statements of historical facts, including, without limitation,
any statements preceded by, followed by or including the words
“targets”, “believes”, “expects”, “aims”, “intends”, “may”, “anticipates”,
“would”, “could” or similar expressions or the negative thereof.
Forward-looking statements by their nature involve known and
unknown risks, uncertainties, assumptions and other important
factors because they relate to events and depend on circumstances
that might occur in the future whether or not outside the control of
CAPPREC.
Such factors may cause actual results, performance or
achievements to be materially different from future results,
performance, developments or achievements expressed or implied
by such forward-looking statements. Such forward-looking
statements are based on numerous assumptions regarding present
and future business strategies, prospects and the relevant operating
environment in the future.
Accordingly, no assurance is given that any such forward-looking
statements will prove to have been correct. These forward-looking
statements speak only as at the date of this Presentation. CAPPREC
expressly disclaims any obligation or undertaking to disseminate any
updates or revisions to any forward-looking statements contained
herein to reflect any change in its expectations with regard thereto or
any change in events, conditions or circumstances on which any of
such statements are based.
IMPORTANT NOTICE, DISCLAIMER AND BASIS OF PRESENTATION
Related Documents