0 FP&M SETA Tracking and Tracing study of Learnerships, Apprenticeships and Bursaries - 2014 A Tracking and Tracing study of the impact of learnerships, apprenticeships and bursaries funded by FP&M SETA December 2014 Impact assessment of Learnerships, Apprenticeships and Bursaries

Welcome message from author
This document is posted to help you gain knowledge. Please leave a comment to let me know what you think about it! Share it to your friends and learn new things together.
Transcript

0
FP&M SETA Tracking and Tracing study of Learnerships, Apprenticeships and Bursaries - 2014
A Tracking and Tracing study of the impact of learnerships, apprenticeships and bursaries funded by FP&M SETA
December 2014
Impact assessment of Learnerships, Apprenticeships
and Bursaries
1
FP&M SETA Tracking and Tracing study of Learnerships, Apprenticeships and Bursaries - 2014
Contents Chapter 1
Profile of Learners Enrolled for Learnerships, Apprenticeships and Bursaries
Executive Summary ................................................................................................................................ 7
1. Objective ........................................................................................................................................ 12
2. Methodology .................................................................................................................................. 12
2.1 Process of compiling data ..................................................................................................... 12
2.1.1 Compiling Data for Learnerships and Apprenticeships ..................................................... 12
2.1.2 Compiling Data for Bursaries ............................................................................................ 13
2.1.3 Fields of interest for analysis ............................................................................................. 13
2.1.4 Missing data in variables ................................................................................................... 16
2.2 Analysis of data ..................................................................................................................... 16
3. Results: Description of the population ........................................................................................... 17
3.1 Summary ............................................................................................................................... 17
3.2 Qualifications ......................................................................................................................... 17
3.3 Learnership Profile ................................................................................................................ 19
3.3.1 Geographical distribution for learnerships ........................................................................ 20
3.3.2 Age distribution for learnerships ........................................................................................ 20
3.3.3 Socio-status distribution for learnerships .......................................................................... 21
3.3.4 Equity distribution .............................................................................................................. 21
3.3.5 Home language distribution .............................................................................................. 22
3.4 Apprenticeships ..................................................................................................................... 23
3.4.1 Geographical distribution for apprenticeships ................................................................... 24
3.4.2 Age distribution for apprenticeships .................................................................................. 24
3.4.3 Socio-status distribution for apprenticeships .................................................................... 25
3.4.4 Equity distribution for apprenticeships .............................................................................. 25
3.4.5 Home language distribution for apprenticeships ............................................................... 26
3.5 Bursaries ............................................................................................................................... 27
3.5.1 Age distribution .................................................................................................................. 28
3.5.2 Equity distribution .............................................................................................................. 29
Chapter 2
Geographic Distribution of
SETA funded projects
1. Objective ........................................................................................................................................ 30
2. Methodology .................................................................................................................................. 30
3. Detailed results of geographic distribution of SETA funded projects ............................................ 30
2
FP&M SETA Tracking and Tracing study of Learnerships, Apprenticeships and Bursaries - 2014
3.1 Summary of geographic distribution of funding ..................................................................... 30
3.2 Geographic distribution of funding for Learnerships ............................................................. 31
3.3 Geographic distribution of funding for Apprenticeships ........................................................ 33
3.4 Geographic distribution of funding for Bursaries ................................................................... 34
Chapter 3 The success of learning interventions
in creating an impact
1. Objective ........................................................................................................................................ 37
2. Methodology .................................................................................................................................. 37
2.1 Primary research design to collect the opinions of learners ................................................. 37
2.1.1 Objectives of the learner surveys ...................................................................................... 37
2.1.2 Population and sample for the learners surveys ............................................................... 38
2.1.3 Data collection for the learner surveys .............................................................................. 38
2.1.4 Data analysis of the learner surveys ................................................................................. 38
2.1.5 Methodology for the qualitative focus groups ................................................................... 38
2.2 Primary research to collect the opinions of employers ......................................................... 39
2.2.1 Objectives of the employer survey .................................................................................... 39
2.2.2 Population and sampling for employer survey .................................................................. 39
2.2.3 Data collection for employer survey .................................................................................. 39
2.2.4 Data Analysis .................................................................................................................... 40
3. Detailed results of impact study ..................................................................................................... 40
3.1 Completion rates ................................................................................................................... 40
3.2 Alignment of skills to needs ................................................................................................... 41
3.3 The impact of learning interventions on learners .................................................................. 43
3.3.1 Creating employment for the unemployed ........................................................................ 44
3.3.2 Increased earnings potential ............................................................................................. 45
3.3.3 Improving inter-personal skills ........................................................................................... 47
3.3.4 Improving chances of promotion and career advancement .............................................. 47
3.3.5 Increased interest in future study and further improvement ............................................. 48
3.3.6 Providing the disadvantaged with access to training ........................................................ 48
3.3.7 Learning skills that can assist in self-employment ............................................................ 48
3.4 The impact of learning interventions on employers .............................................................. 49
3.4.1 Well-trained employees that are multi-skilled and efficient ............................................... 49
3.4.2 Employees show improved workplace behaviour ............................................................. 49
3.4.3 Positive effect on productivity ............................................................................................ 50
3.4.4 Improves company morale and assists in staff retention and career planning ................. 50
3.5 Challenges faced by employers and learners ....................................................................... 50
3.5.1 Long training hours ........................................................................................................... 50
3.5.2 Challenge of insufficient funding and slow grant disbursement ........................................ 51
3
FP&M SETA Tracking and Tracing study of Learnerships, Apprenticeships and Bursaries - 2014
3.5.3 Challenge of slow and inefficient communication with FP&M SETA ................................ 53
3.5.4 Lack of training providers in certain geographic areas ..................................................... 53
3.5.5 Approving training ............................................................................................................. 53
3.5.6 Certification ....................................................................................................................... 54
3.6 Suggestions for improvement ............................................................................................... 54
3.6.1 Suggestions for changes in funding structures and payment of stipends ......................... 54
3.6.2 Improvements to the grants application process .............................................................. 55
3.6.3 Assist smaller companies .................................................................................................. 55
3.6.4 Consider supporting more rural areas .............................................................................. 56
Chapter 4 Key Trends and Challenges
for Education and FP&M Sub-sectors
1. Objective ........................................................................................................................................ 57
2. Methodology .................................................................................................................................. 57
3. The South African educational context .......................................................................................... 57
3.1 Skills Challenges in South Africa .......................................................................................... 58
4. FP&M Sector Trends ..................................................................................................................... 61
4.1 Closing the gap: Gap between education and being able to transfer skills in into the
workplace .......................................................................................................................................... 61
4.2 Trends in the sub-sectors ...................................................................................................... 62
4.3 Challenges in the sub-sectors ............................................................................................... 63
4.4 Drivers for change in the sub-sectors ................................................................................... 63
Chapter 5 Conclusion
1. Summary of activities ..................................................................................................................... 64
2. Conclusions ................................................................................................................................... 65
3. The way forward ............................................................................................................................ 65
Appendix APPENDIX 1: Codes from MIS database ......................................................................................... 67
APPENDIX 2: Detailed description of the South African Context ..................................................... 68
2.1.1 Challenges identified by DHET ......................................................................................... 69
2.1.2 General challenges ........................................................................................................... 69
2.2 Closing the gap ..................................................................................................................... 70
2.2.1 Gap between education and being able to transfer skills into workplace ......................... 70
2.3 Education levels in South Africa............................................................................................ 72
2.3.1 Literacy in South Africa: Completion of Grade 7 and higher ............................................. 72
2.4 Educational institutions ......................................................................................................... 73
2.4.1 Attendance of educational institutions............................................................................... 75
2.4.2 The causes of non-attendance .......................................................................................... 76

4
FP&M SETA Tracking and Tracing study of Learnerships, Apprenticeships and Bursaries - 2014
2.4.3 Problems at educational institutions.................................................................................. 77
2.4.4 Repeaters .......................................................................................................................... 78
2.5 Delivery of Education ............................................................................................................ 78
2.5.1 FET Colleges ..................................................................................................................... 78
2.5.2 Pass and throughput rates for NC (V) Levels at FET Colleges ........................................ 79
2.5.3 Pass and throughput rate for Report 191 at FET Colleges ............................................... 79
2.5.4 Adult Education and training (AET) ................................................................................... 80
Bibliography .......................................................................................................................................... 84
List of Figures Figure 1: Summary of methodologies per learning intervention ............................................................. 9 Figure 2: FP&M SETA Sub-sector relationship..................................................................................... 14 Figure 3: CTFL Sector Course Overlap ................................................................................................ 14 Figure 4: Forestry, Wood Products, Pulp and Paper and Furniture sectors course overlap ................ 15 Figure 5: Packaging, Printing, Publishing and Print Media sectors course overlap ............................. 15 Figure 6: Percentage Data Unknown in Fields of Interest .................................................................... 16 Figure 7: Infographic showing the profile of those enrolled for a learnership ....................................... 19 Figure 8: Learnerships - Geographical distribution by sector ............................................................... 20 Figure 9: Learnerships - Age distribution at enrolment date by sector ................................................. 20 Figure 10: Learnership - Socio-status by sector ................................................................................... 21 Figure 11: Learnership - Equity distribution by sector .......................................................................... 21 Figure 12: Learnerships - Home language by sector ............................................................................ 22 Figure 13: Infographic showing the profile of those enrolled for an apprenticeship ............................. 23 Figure 14: Apprenticeships - Geographical distribution by sector ........................................................ 24 Figure 15: Apprenticeships - Age distribution at enrolment date by sector .......................................... 24 Figure 16: Apprenticeships - Socio-status by sector ............................................................................ 25 Figure 17: Apprenticeships - Equity distribution by sector .................................................................... 25 Figure 18: Apprenticeships - Home language by sector ....................................................................... 26 Figure 19: Infographic showing the profile of those enrolled for a bursary ........................................... 27 Figure 20: Bursaries - Age distribution by province .............................................................................. 28 Figure 21: Bursaries - Gender by age interval at enrolment ................................................................. 28 Figure 22: Bursaries – Equity distribution ............................................................................................. 29 Figure 23: Bursaries - Gender distribution by equity ............................................................................ 29 Figure 24: Learnership commitment register by year ........................................................................... 31 Figure 25: Learnership commitment register total - by province and year ........................................... 31 Figure 26: Learnership commitment register total - by province........................................................... 32 Figure 27: Apprenticeship commitment register by year ...................................................................... 33 Figure 28: Apprenticeships commitment register - by province and year ............................................. 33 Figure 29: Apprenticeship commitment register total – by province ..................................................... 34 Figure 30: Bursaries commitment register - by year ............................................................................. 35 Figure 31: Bursary commitment register - by province and year .......................................................... 35 Figure 32: Bursaries commitment register total - by province .............................................................. 36 Figure 33: Employers who offer apprenticeships and learnerships rating the skills of graduate learners
.............................................................................................................................................................. 41 Figure 34: Employers’ rating of theory component of learnerships ...................................................... 41 Figure 35: Summary relevance of training to FP&M subsectors .......................................................... 43 Figure 36: Employment created by learnerships for the unemployed .................................................. 44

5
FP&M SETA Tracking and Tracing study of Learnerships, Apprenticeships and Bursaries - 2014
Figure 37: Employer survey - Earnings potential for new hires, as well as experienced learners with a
learnership certificate ............................................................................................................................ 46 Figure 38: Increase in income from before to after completing the apprenticeship .............................. 46 Figure 39: Learner surveys – Improved communication skills .............................................................. 47 Figure 40: Employer survey - Improved chances of promotion according of learnership graduates ... 47 Figure 41: Learner Surveys: Impact of training initiatives on the motivation to further studies ............ 48 Figure 42: Employer Survey - Perceived improvement of learners’ attitude towards work .................. 49 Figure 43: Employer Survey - Influence of learnership on getting up to speed in the workplace ......... 50 Figure 44: Employer Survey - Influence of learning interventions on company productivity ................ 50 Figure 45: Employer Survey - Working hours during learnership and apprenticeships ....................... 51 Figure 46: Employer Survey - Stipend sufficiency as rated by learnership students............................ 52 Figure 47: Percentage of population group between the age of 18 and 24: Highest level of education
achieved ................................................................................................................................................ 58 Figure 48: Percentage 15-24 y/o who completed Gr7 and above, 2002 – 2012 .................................. 59 Figure 49: AET Pass and Throughput rates ......................................................................................... 59 Figure 50: Post-secondary education sector ........................................................................................ 60 Figure 51: FP&M Sub-sector reports .................................................................................................... 61 Figure 52: Summary of research activities ............................................................................................ 64 Figure 53: Data code classifications ..................................................................................................... 67 Figure 54: Type of educational institution attended by youth aged 18–24, by population group, 2002
and 2012 ............................................................................................................................................... 69 Figure 55: Unemployment rate by level of education ........................................................................... 71 Figure 56: Skills mismatch and little or no skills.................................................................................... 72 Figure 57: Percentage of the population aged 20 years and above who completed Grade 7 and above
by gender, 1995 to 2012 ....................................................................................................................... 72 Figure 58: Percentage of 15 to 24 year old youth who have completed Grade 7 and above, 2002-2012
.............................................................................................................................................................. 73 Figure 59: Post-secondary education sector ........................................................................................ 73 Figure 60: CHET undergraduate throughput ........................................................................................ 74 Figure 61: Geographical spread of learning institutions ....................................................................... 74 Figure 62: Percentage of youth that attended an educational institution by population group and age,
2012 (StatsSA, 2013) ............................................................................................................................ 75 Figure 63: 16- to 18-year-olds attending educational institutions, 2002 to 2012 .................................. 75 Figure 64: Reason for non-attendance of educational institute ............................................................ 77 Figure 65: Problems experienced at schools ........................................................................................ 77 Figure 66: Percentage repeaters .......................................................................................................... 78 Figure 67: Average pass and throughput rates for NC(V) .................................................................... 79 Figure 68: Average pass and throughput rates or Report 191 ............................................................. 80 Figure 69: AET Pass and Throughput rates 2011 ................................................................................ 81
List of Tables Table 1: FP&M SETA learner frequency per course – 2011/12 to 2013/14 ......................................... 17 Table 2: Completion rates of learners as recorded in MIS ................................................................... 40 Table 3: Completion rates of apprentices as recorded in MIS .............................................................. 41 Table 4: Sectors not offering any learnerships, apprenticeships or bursaries ...................................... 42 Table 5: Employment increase by sector (based on those who completed a learnership): ................. 44 Table 6: Employment increase by sector (based on those who completed the apprenticeship) .......... 45 Table 7: Average salary and income by sector ..................................................................................... 45 Table 8: Workplace conduct of learnership graduates once appointed ................................................ 49 Table 9: Average monthly stipend paid to learners on a learnership.................................................... 52 Table 10: Average monthly stipend for learnerships by sector ............................................................. 52
6
FP&M SETA Tracking and Tracing study of Learnerships, Apprenticeships and Bursaries - 2014
Table 11: Level of education, 18-24 and 25-34 .................................................................................... 68 Table 12: Breakdown of attendance per province ................................................................................ 76 Table 13: Reason for non-attendance of educational institute ............................................................. 76 Table 14: Number and percentage of students in public and private FET Colleges who wrote and
passed, by qualification type, from 2011 to 2012 ................................................................................. 78 Table 15: Number of public and private FET College students who entered, wrote and passed NC (V)
examination in 2012 .............................................................................................................................. 79 Table 16: Number of public and private FET College students who entered, wrote and passed the
Report 191 N1-N3 December 2012 examinations for engineering studies, by province in 2012 ...... 79 Table 17: Number of learners, educators and institutions in AET Centres by province: 2011 ............. 80 Table 18: Number of learners entered, wrote and passed, per province: 2011 ................................... 81
List of Acronyms
Abbreviation Description AET Adult Education and Training
AOE African Economic Outlook
DHET Department of Higher Education and Training
DPE Department of Public Enterprises
DoL Department of Labour
FET Further Education and Training
GHS General Household Survey
HRD Human resource development
IPAPA Industrial Policy Action Plan
LIC Low income countries
NAMB New policy on Artisan Development & Strengthening of National Artisan Moderation
Body
NEET Not in employment, education or training
NDP National Development Plan
NGP New Growth Path
NFAS National Student Financing Scheme
NQF National Qualifications Framework
MIC Medium income countries
MOA Memorandum of agreement
MoU Memorandum of understanding
PIVOTAL Professional, Vocational, Technical and Academic Learning (PIVOTAL) Programmes;
SABC South African Broadcasting Corporation
SAQA South African Qualifications Authority
SIC Standard Industrial Classification
SDA Skills Development Act
SETA Sector Education and Training Authority
SMME Small, Micro and Medium Enterprise
SOC State owned company
WSP Workplace Skills Plan
7
FP&M SETA Tracking and Tracing study of Learnerships, Apprenticeships and Bursaries - 2014
Executive Summary Introduction and aim of the study
The Fibre, Processing and Manufacturing (FP&M) SETA was established by the Minister of Higher
Education and Training on 1 April 2011. The FP&M SETA is a result of the amalgamation of the
Clothing, Textiles, Footwear and Leather (CTFL) SETA, Forest Industries Education and Training
Authority (FIETA) and the Printing, Packaging and Publishing sectors of the Media, Advertising,
Publishing, Printing and Packaging (MAPPP) SETA. The FP&M SETA facilitates skills development in
the following sub-sectors: Clothing, Footwear, Forestry, Furniture, General Goods, Leather,
Packaging, Print Media, Printing, Publishing, Pulp and Paper, Textile and Wood.
The FP&M SETA commissioned a Tracking and Tracing study that would empirically examine the
impact of Learnerships, Apprenticeships and Bursaries on learners, and determine the extent to which
these programmes are achieving their objectives. This project served to understand, explore and
document key features, trends, challenges and the impact of these three skills interventions in the
different FP&M sub-sectors. This project was undertaken to assist in the further development of a
sustainable skills development strategy for the FP&M SETA.
The objectives of the study can be summarised in terms of four key aspects, with their related sub-
objectives. These include:
a) Report on the profile of learners enrolled for learnerships, apprenticeships and bursaries incentivised by the FP&M SETA for the financial years 2011/12 to 2013/14.
Provide an understanding of the characteristics of the learner in terms of demographics, skills,
qualifications and employment profile (employed versus unemployed).
b) Ascertain the geographic distribution of SETA-funded projects / activities.
c) Determine the success of these learning interventions in creating the desired impact.
Determine the rate for completion of learnerships and apprenticeships.
Evaluate the alignment of the skills provided with industry needs.
Determine the impact of the training initiatives on the student, with specific reference to
understanding the absorption of learners into the labour market and the economic value that
is created.
Determining the main impact of these training interventions on the employers in the FP&M
subsectors.
Highlighting challenges and making suggestions for improvements.
d) Assess the career path opportunities for learners within the FP&M SETA sub-sectors through understanding key trends and challenges in the sub-sectors.
The report will be structured around these main objectives, and a summary of the results will be
presented in chapters addressing each of these objectives.
8
FP&M SETA Tracking and Tracing study of Learnerships, Apprenticeships and Bursaries - 2014
Communication strategy
IQ Business and FP&M SETA worked together to create a communication strategy for the Tracking
and Tracing Study. The main purpose of the communication strategy was to ensure a consistent
approach when communicating to both FP&M internal and external stakeholders. The communication
strategy outlined all stakeholders involved in the project, the regularity with which they were to receive
the communications, the type of communication, including the party responsible for distributing the
message.
Methodology
As mentioned, this report addresses each of the main objectives in subsequent chapters and each of
these chapters provide a detailed methodology, applicable to the objective addressed. This section
provides an overview of the methodology by describing the stakeholders that were targeted, and the
different types of research designs used.
Stakeholders
The stakeholders identified for this study were the FP&M SETA, the learners (apprenticeships and
learnerships), the employers, as well as the training providers. There is an overlap of training
providers and employers as a number of employers are also training providers. There are various
ways of classifying learners; for example, according to their employment status on entering the
training programme or after completion of the training. Learners could be classified as employed, self-
employed or unemployed. The learner stakeholder group can also be classified according to status of
training; either completed, still studying or terminated.
Methodologies
To address the first objective, of understanding the characteristics of learners, data received from the
FP&M Management Information System (MIS) was analysed and reported on. This data contained
information for learnership and apprenticeship students in terms of many demographic variables, and
a few of interest, such as age and sector, were added using ID numbers or cross-referencing South
African Qualifications Authority (SAQA) codes with sector information. A total of 6 207 learners were
considered to fall within scope for this analysis, having either enrolled during 2011/12 to 2013/14, or
were reasonably expected to be studying during this period. Bursary data is not housed inside the
MIS, and a separate spreadsheet, containing fewer demographic variables, was used to analyse
bursary students.
The second objective of the study was to understand the geographic spread of the FP&M SETA
funding. This objective was met by analysing the commitment register, which keeps a record of all
approved funding.
To address the objective of determining the success and impact of
the learning interventions, both qualitative and quantitative research
methodologies were employed to contact students, employers and
training providers.
The two main qualitative methodologies used in this study were:
Focus groups: In this study, two mini-focus groups were conducted; one with employed
graduate learners, the other with unemployed graduate learners. Recruitment of respondents
for these groups was limited to all who live geographically close to the research venue in
Johannesburg. It was possible to recruit three employed and two unemployed learners, within
the timeframe of this study.
Personal interviews: Personal interviews were conducted with employers and training
providers in many of the FP&M sub-sectors. A total of ten employer interviews were possible
in the timeframe of this study.
9
FP&M SETA Tracking and Tracing study of Learnerships, Apprenticeships and Bursaries - 2014
Two forms of quantitative research were conducted: telephone surveys with learners and
online surveys with employers.
Telephone surveys with learners: A structured questionnaire was created with the aim of
determining the impact of learnerships and apprenticeships on employment and other aspects
of the learners’ lives.
Trained interviewers, fluent in a number of vernacular languages, conducted telephone
interviews with learners for whom contact details were available. Contact details were
available for approximately 24% of the total population. A final sample of 303 learnership
students and 81 apprentices were achieved. This represents a 25% response rate for the
learnership sample and 28% for the apprenticeship sample. Full analysis of the findings of
these telephone surveys are provided in separate reports; namely “The Voice of the
Learner” and “The Voice of the Apprentice”. This report provides a summary of results
from these two reports.
Online survey with employers: A web-based survey was created that would allow
employers to provide their opinions on the value of the learning interventions. The survey
focused on aspects such as training practices, absorption of learners into the market and
value perceived. A final sample of 259 employers was achieved, with 71 employers rating
learnerships, 67 rating apprenticeships and 23 rating bursaries. A further 121 employers did
not offer any of these training initiatives over the last few years.
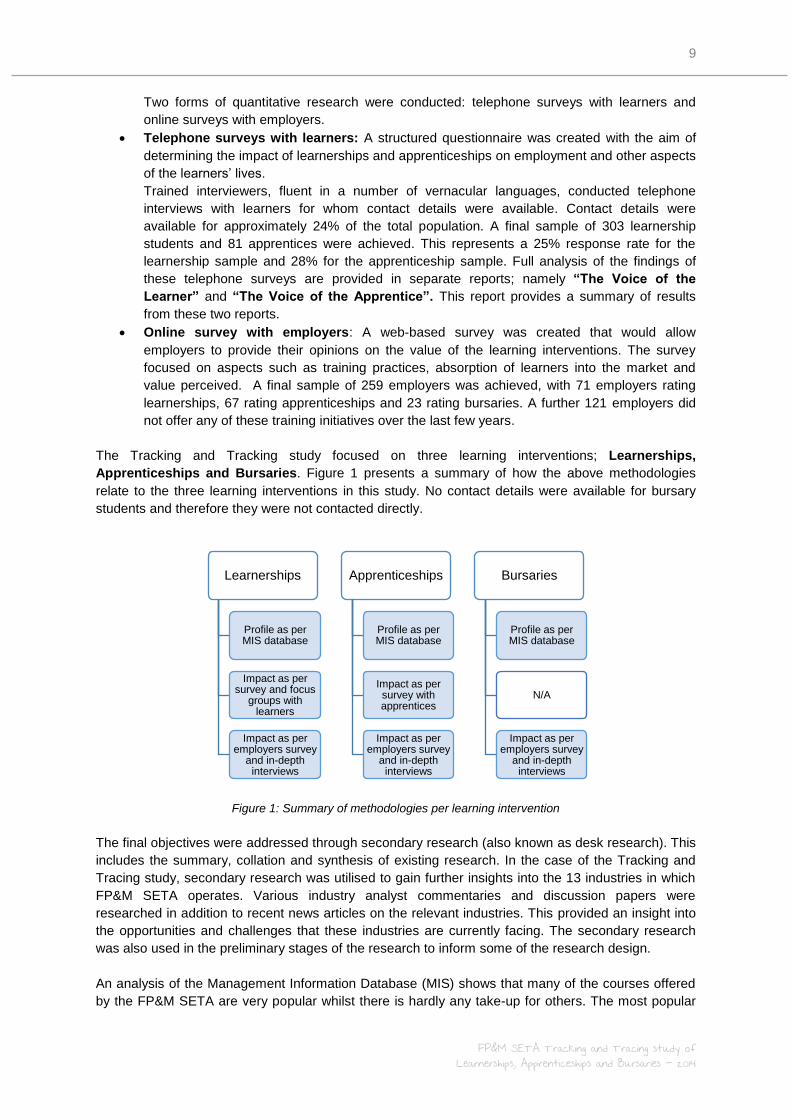
The Tracking and Tracking study focused on three learning interventions; Learnerships,
Apprenticeships and Bursaries. Figure 1 presents a summary of how the above methodologies
relate to the three learning interventions in this study. No contact details were available for bursary
students and therefore they were not contacted directly.
Figure 1: Summary of methodologies per learning intervention
The final objectives were addressed through secondary research (also known as desk research). This
includes the summary, collation and synthesis of existing research. In the case of the Tracking and
Tracing study, secondary research was utilised to gain further insights into the 13 industries in which
FP&M SETA operates. Various industry analyst commentaries and discussion papers were
researched in addition to recent news articles on the relevant industries. This provided an insight into
the opportunities and challenges that these industries are currently facing. The secondary research
was also used in the preliminary stages of the research to inform some of the research design.
An analysis of the Management Information Database (MIS) shows that many of the courses offered
by the FP&M SETA are very popular whilst there is hardly any take-up for others. The most popular
Learnerships
Profile as per MIS database
Impact as per survey and focus
groups with learners
Impact as per employers survey
and in-depth interviews
Apprenticeships
Profile as per MIS database
Impact as per survey with apprentices
Impact as per employers survey
and in-depth interviews
Bursaries
Profile as per MIS database
N/A
Impact as per employers survey
and in-depth interviews
10
FP&M SETA Tracking and Tracing study of Learnerships, Apprenticeships and Bursaries - 2014
course offered is the National Certificate: Clothing, Textiles, Footwear and Leather
Manufacturing Process (43%), followed by a two national certificate in furniture making (SAQA ID
49091 at 12% and 49105 at 7%). On the other hand Knitting Machine Mechanician and Technical
Dyer-Finisher are courses where only one student is listed as having enrolled over the last three
years.
The commitment registers, as well as the profile of enrolled students, show the most training is
offered in Gauteng, KwaZulu Natal and the Western Cape. Learnerships are training initiatives mostly
taken up by young black South African men or women. While Apprenticeships offer opportunities to a
wider range of ethnic and age groups, it is mostly men who enrol for these (88%). Bursaries students
are mostly black, female South Africans between the ages of 21 and 25, living in the Western Cape or
Gauteng.
A combination of sources, such as data from the MIS system as well as the surveys conducted,
shows that a fair estimation of completion rates for learnerships is between 70-80% and between 40-
50% for apprentices. Apprenticeships do take longer to complete than learnerships, typically 3 to 4
years, and would naturally have a higher dropout rate.
One objective of a SETA is the continuous improvement of education at workplaces in order to
address the mismatches and shortages of skills in the most efficient manner. This study has found
that among employers who offer training, there is high agreement that the skills of graduate learners
meet the requirements of the workplace. In addition, qualitative interviews highlight the role that
training initiatives play in improving the basic levels of literacy and numeracy.
Employers and learners are positive about the value of learnerships, apprenticeships and bursaries.
These skills interventions create multi-skilled employees who contribute positively to the productivity
of the companies who employ them. Unfortunately employers can not employ all learners trained, due
to economic and other pressures. A positive outcome is that trained employees are now exposed to
the market, which benefits smaller companies who cannot afford, or do not qualify to train employees.
The learner surveys showed that unemployment dropped from 72% to 44% among those unemployed
on entering the learnership program. Those still unemployed remain positive about their future
prospects. The employment statistics for apprenticeships are even more impressive with 71% of the
unemployed, who graduated from apprenticeship programmes, having found employment at the time
of the survey. Data gathered through discussions with employers in different sectors revealed that
employers are cautions about hiring as a result of economic conditions but that employee numbers
remain fairly stable. Survey results confirm that employee numbers are stable in many sectors, with
the most opportunities for learners coming from growth in staff numbers in Clothing, Textiles,
Footwear, Furniture and Forestry. While the Printing and Publishing sectors report fairly stable
employee numbers, with limited growth opportunities, 50% of Print Media companies report a decline
in staff numbers.
This study has found that the earnings of a learner increases on completion of training with even
greater increases to be expected once more work experience has been gained. On average,
employees with a learnership earned R1 400 more per month after completion of their training while
apprentices earned, on average, more than double what they use to at R9 810 per month.
In addition to the above mentioned benefits, students show great improvement in personal
development. Learnership graduates who took part in the focus groups expressed their gratitude for
the improved soft skills, financial skills, attitude towards life, confidence and self-esteem that they saw
upon completing their learnership. The results from the learner and employer surveys also confirmed
that students leave the programs with better communication skills and improved self-esteem.
11
FP&M SETA Tracking and Tracing study of Learnerships, Apprenticeships and Bursaries - 2014
Employers and learners do face challenges during the course of training, and have made suggestions
for improvements. They would however greatly regret not having access to these training initiatives,
and overall consider it worth the effort. Learners are challenged by a low stipend and some find it
difficult to afford food and transport during their training. Employers agree that the funding is too low
and attribute some of the dropout to this. Some learners question the long hours they work during
their practical training and felt a few employers might misuse the learnership to obtain cheap labour. A
critical concern for many learnership graduates is the fact that they have not received their certificates
on completion, even as much as three years later. Steps are already underway to address this
concern.
Employers are challenged by slow and inefficient communication from the FP&M SETA as well as by
slow grant disbursement. The new MIS system is noted as being an improvement yet many more
recommendations are made for improving the application process.
Recommendations
The MIS system provides process improvements and employers are seeing the value. The
FP&M SETA should consider increasing the speed at which it is adopted as to move away
from using the old and the new system simultaneously. The SETA would benefit from a
dedicated data manager tasked with ensuring an effective change management process. A
data manager could also review the current processes for collecting and holding student data
in light of the new PoPI (Protection of Personal Information) act. The SETA might be at risk of
breaching the act.
While the increased adoption of the MIS system would address some of the concerns around
the certification of completed learners, the SETA should consider further investigation of the
process flow to highlight any additional areas that could be hindering the process. Learners
who are not employed after the learnership might lose touch with the employer after leaving
the company and the SETA should consider a system of delivering the certificates to learners
directly, as opposed via the employers, or, at the very least, following up directly with learners
on the receipt of their certificates.
The SETA might consider investigating the reasons why certain courses have low
attendances, and whether it is economically advisable to continue to offer these.
The SETA could benefit from improving the transparency of grant approvals
Small and rural enterprises could benefit from additional support. While many are ignorant of
the process, others simply do not qualify. They do however operate in areas where possible
learners could benefit greatly from an opportunity at training.
A review of internal processes could be considered, where an improvement would result in a
reduction in administration. Likewise, a review of current communication structures could
results in improved communication with stakeholders.
12
FP&M SETA Tracking and Tracing study of Learnerships, Apprenticeships and Bursaries - 2014
Chapter 1 Profile of Learners Enrolled for
Learnerships, Apprenticeships and Bursaries
1. Objective The purpose of this chapter is to report on the profiles of enrolled learners for learnerships,
apprenticeships and bursaries incentivised by the FP&M SETA for the period 2011-2013. This
includes details of characteristics of the learners regarding demographics and qualifications.
2. Methodology
2.1 Process of compiling data
2.1.1 Compiling Data for Learnerships and Apprenticeships
The FP&M SETA supplied two datasets from their Management Information System
(MIS), containing 23 209 and 18 131 entries respectively. The datasets included learners entered
from as far back as the year 2000, and therefore needed to be merged and cleaned before
commencement of analysis. After merging the datasets, duplicate values were removed by creating a
unique variable, which combined ID number and SAQA ID number. Thereafter 19 632 unique entries
remained in the single, new dataset.
This study is limited to students studying in the financial years of 2011/12, 2012/13 and 2013/14. In an
attempt to limit the number of cases to the appropriate years of focus, a unique variable was created,
using the month and year of study to create a financial year indicator spanning from April to March of
each year. Learnership students who enrolled in the financial year of 2010/11 were included, as they
could foreseeably still have been studying and/or enrolled in 2011/12. Likewise, apprentices who
started their studies in 2008/09 were included, as they would still form part of the 2011/12 group.
The study focuses only on the apprenticeships, learnerships and bursaries skills programmes. The
data received from the FP&M SETA had to be limited to these training interventions only. However,
no field existed in the data to classify intervention type, so the SAQA ID field was used to create this
variable. Skills programmes and other courses that fall outside of the scope of this study were deleted
from the dataset. The following training programmes were removed from the data, since it was
concluded that these training interventions are not in the FP&M SETA’s subsectors:
General Education and Training Certificate: Business Practice
Further Education and Training Certificate: Contact Centre Operations
National Certificate: New Venture Creation (SMME)
A total number of 6 290 learners remained after the above procedures were carried out. These
learners could be considered as “in scope”. However, a few duplicate cases where the same learners
were enrolled for multiple courses in the same year were identified and excluded. Out of 6 290
learners remaining in the dataset at this stage, 253 (506 entries) learners appeared twice and 12 (36
entries) learners appeared three times. This is a duplicate error rate of (506+36) / 6290 = 8.6%. It was
decided to keep learners in the dataset who enrolled for different courses in different years, but not if
the learner enrolled for multiple courses in the same financial year. Therefore, 83 duplicate students
were removed, leaving a final number of 6 207 learners for analysis in this study.

13
FP&M SETA Tracking and Tracing study of Learnerships, Apprenticeships and Bursaries - 2014
2.1.2 Compiling Data for Bursaries
Bursary data was received separately from the FP&M SETA, as it is not kept in the MIS system. The
excel spread sheet consisted of four sheets namely:
Outcome 4.2.1: middle and high level skills needs are identified and addressed in all sectors
(workers learning programmes entered - excluding artisans - workers)
o 171 entries
Outcome 4.2.1: middle and high level skills needs are identified and addressed in all sectors
(workers learning programmes certificated - excluding artisans - workers)
o 20 entries
Outcome 4.2.1: middle and high level skills needs are identified and addressed in all sectors
(unemployed learning programmes entered - excluding artisans - workers)
o 776 entries
Outcome 4.2.1: middle and high level skills needs are identified and addressed in all sectors
(all learning programmes entered - excluding artisans - workers)
o 127 entries
These sheets were combined to add up to 1 094 learners from four sheets. 32 learners were
excluded, which included 22 whose commencement field was not populated, and ten who completed
their course between 2007 and 2010. There were 1 062 learners in the data set remaining.
In order to find duplicate values, the ID number, year and learning institute was combined and 46
duplicates were found. 23 line items were manually deleted to bring the total learners in the bursary
data to 1 039 for the period 2011-2014. A summary of these duplicates can be found in Appendix 2.
2.1.3 Fields of interest for analysis
The data obtained from the MIS contained coded information in the following fields: equity, province,
disability status, home language, gender and socio-economic status. See Appendix 1 for a list of all
codes. 191 learners with the equity code ‘BI’ was assumed to be ‘BL’ which refers to ‘Black: Indian /
Asian’. The province codes ‘0’, ‘15’ and ‘X’ were assumed to be undefined. Industry, intervention,
province and equity status classifications were supplemented by cross referencing SQMR data with
MIS data.
Age at time of enrolment was calculated by taking into account the enrolment date of learners. (I.e. if
enrolled in 2011, current age was reduced by three years in order to calculate age at time of
enrolment). The age at time of enrolment is henceforth referred to simply as “age”.
A variable of great significance to the study is that of industry classification. This variable was not
provided in the MIS data received from the FP&M SETA, and this field was also created by using the
SAQA code as a reference point. 43% of learners could only be classified as Clothing, Textiles,
Footwear and Leather (CTFL) when using this method. An attempt was made to further classify this
43% into a sector, by attempting to link an employer to a learner and then cross-reference the
employer with a sector using a number of other FP&M databases. It was possible to further classify
31% into a sector based on the employer they are linked to.
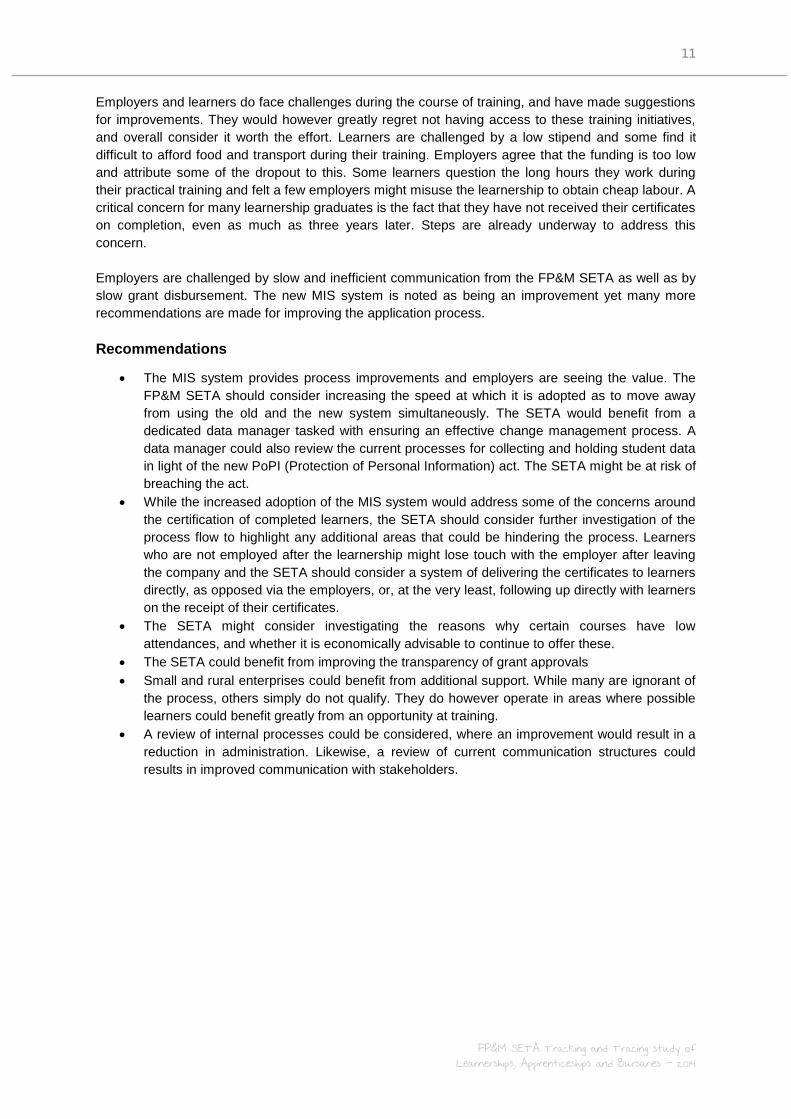
Classifying the learners based on qualification might not be a 100% accurate due to the overlap
between the different subsectors. Figure 2 visually depicts how the FP&M SETA sub sectors overlap.
The sectors form three large clusters, with the furniture sector bridging two clusters and the other
clusters being very closely related. The centre cluster is related to both of the other clusters.
14
FP&M SETA Tracking and Tracing study of Learnerships, Apprenticeships and Bursaries - 2014
Figure 2: FP&M SETA Sub-sector relationship
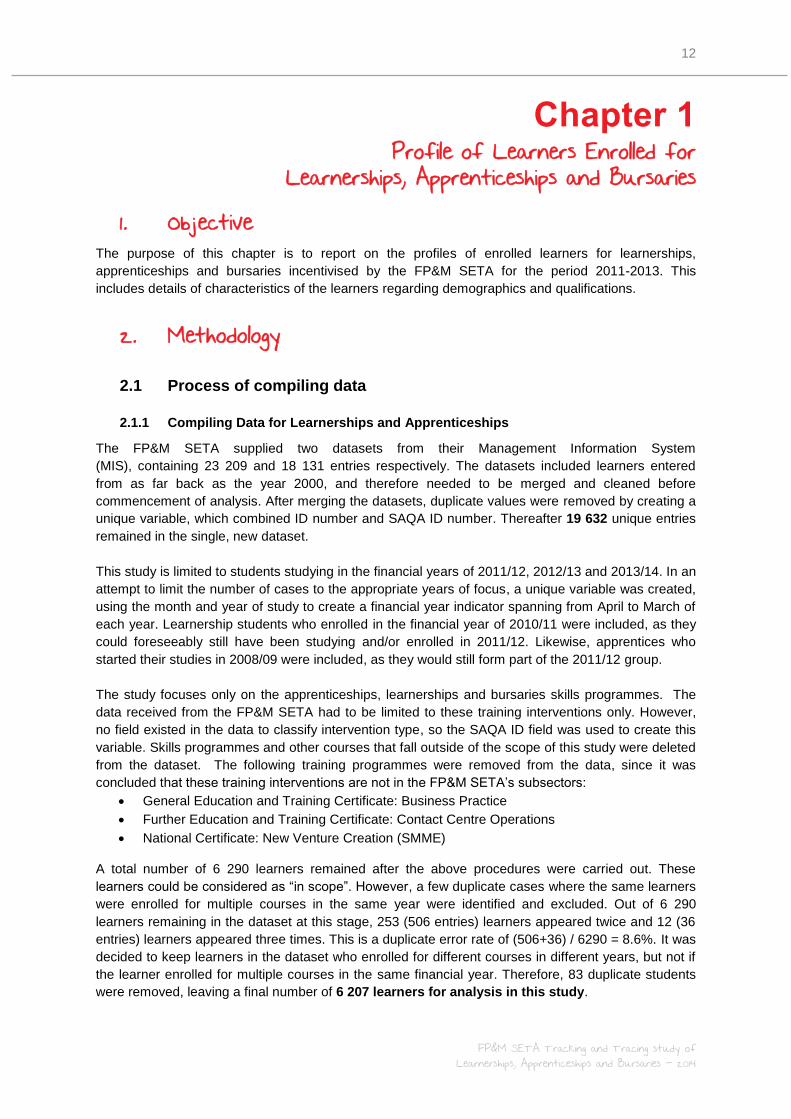
Figures 3 to 5 show the overlap of sectors, as well as the SAQA courses and the sectors into which
they are formally classified by the FP&M. It is based on this classification that the majority of learners
were allocated into a sector. The inter-relatedness of the sectors could mean that a learner is doing a
course classified into a specific sector, whilst in reality working in another related sector.
Clothing, Textiles, Footwear and Leather sectors
Figure 3: CTFL Sector Course Overlap
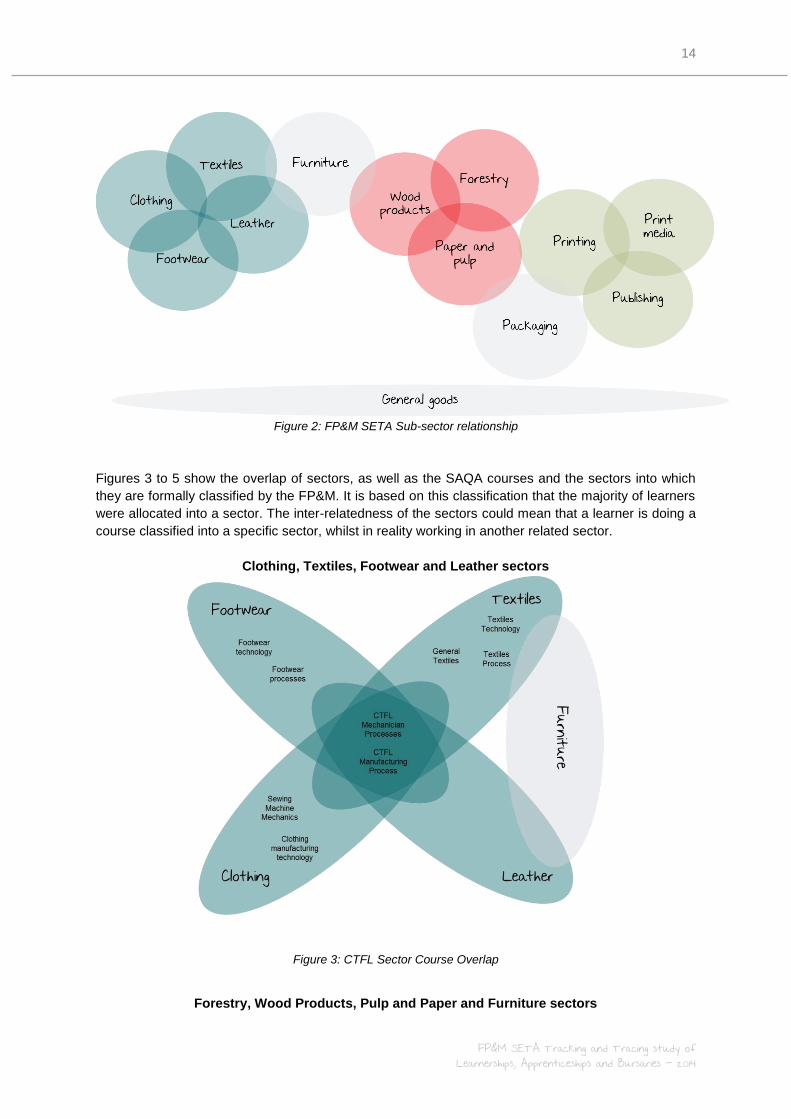
Forestry, Wood Products, Pulp and Paper and Furniture sectors
15
FP&M SETA Tracking and Tracing study of Learnerships, Apprenticeships and Bursaries - 2014
Figure 4: Forestry, Wood Products, Pulp and Paper and Furniture sectors course overlap
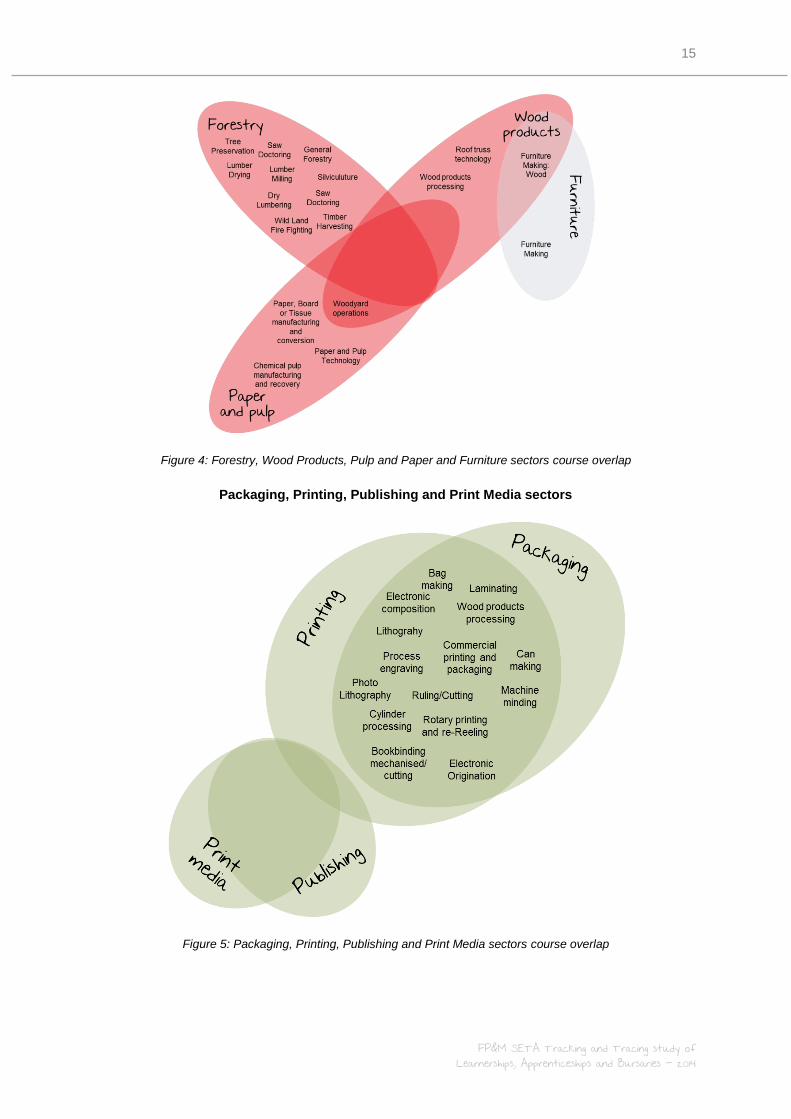
Packaging, Printing, Publishing and Print Media sectors
Figure 5: Packaging, Printing, Publishing and Print Media sectors course overlap
16
FP&M SETA Tracking and Tracing study of Learnerships, Apprenticeships and Bursaries - 2014
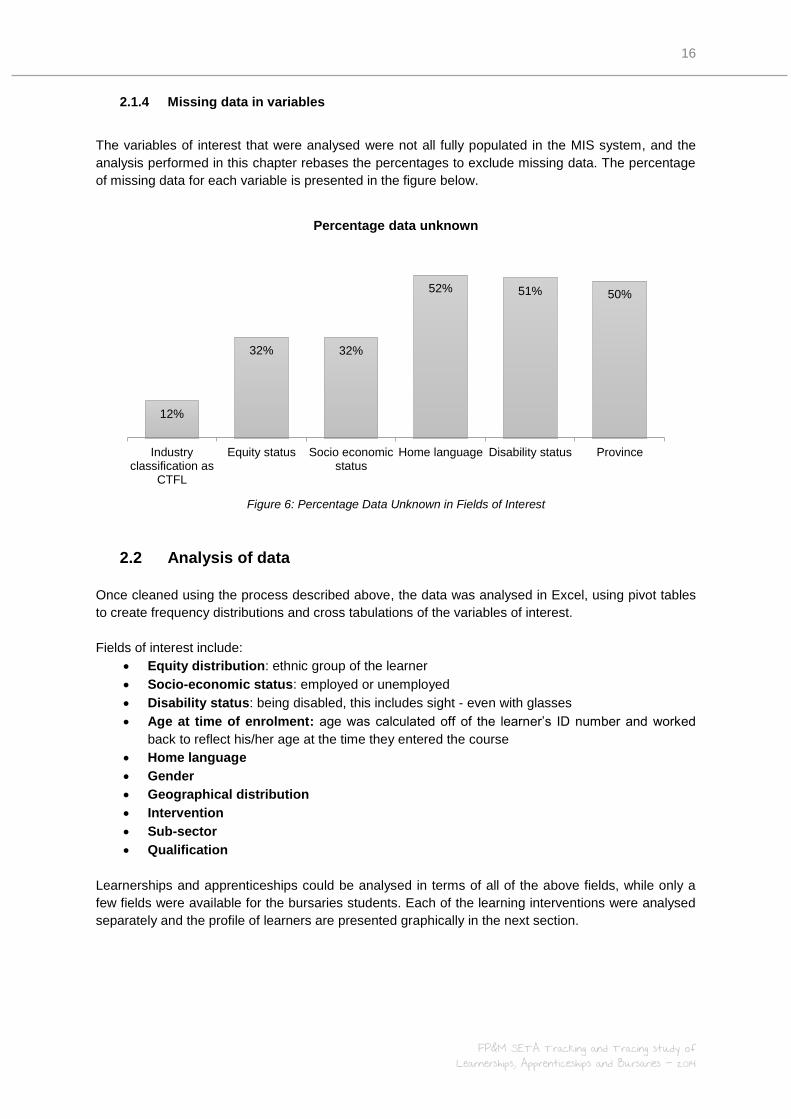
2.1.4 Missing data in variables
The variables of interest that were analysed were not all fully populated in the MIS system, and the
analysis performed in this chapter rebases the percentages to exclude missing data. The percentage
of missing data for each variable is presented in the figure below.
Figure 6: Percentage Data Unknown in Fields of Interest
2.2 Analysis of data
Once cleaned using the process described above, the data was analysed in Excel, using pivot tables
to create frequency distributions and cross tabulations of the variables of interest.
Fields of interest include:
Equity distribution: ethnic group of the learner
Socio-economic status: employed or unemployed
Disability status: being disabled, this includes sight - even with glasses
Age at time of enrolment: age was calculated off of the learner’s ID number and worked
back to reflect his/her age at the time they entered the course
Home language
Gender
Geographical distribution
Intervention
Sub-sector
Qualification
Learnerships and apprenticeships could be analysed in terms of all of the above fields, while only a
few fields were available for the bursaries students. Each of the learning interventions were analysed
separately and the profile of learners are presented graphically in the next section.
12%
32% 32%
52% 51% 50%
Industryclassification as
CTFL
Equity status Socio economicstatus
Home language Disability status Province
Percentage data unknown
17
FP&M SETA Tracking and Tracing study of Learnerships, Apprenticeships and Bursaries - 2014
3. Results: Description of the population FP&M SETA data was analysed subsequent to the procedure described in the preceding section. The
proceeding section discusses learnerships, apprenticeships and bursaries learners’ characteristics, in
order to provide a comprehensive description of the population.
A one page infographic1 summary showing the profile of learners who were assumed to be enrolled in
the 2011/12, 2012/13 and 2013/14 financial years, is included for learnerships, apprenticeships and
bursaries. In addition, a detailed breakdown of geographical, age, socio-status, equity and home
language distribution is also included in this section.
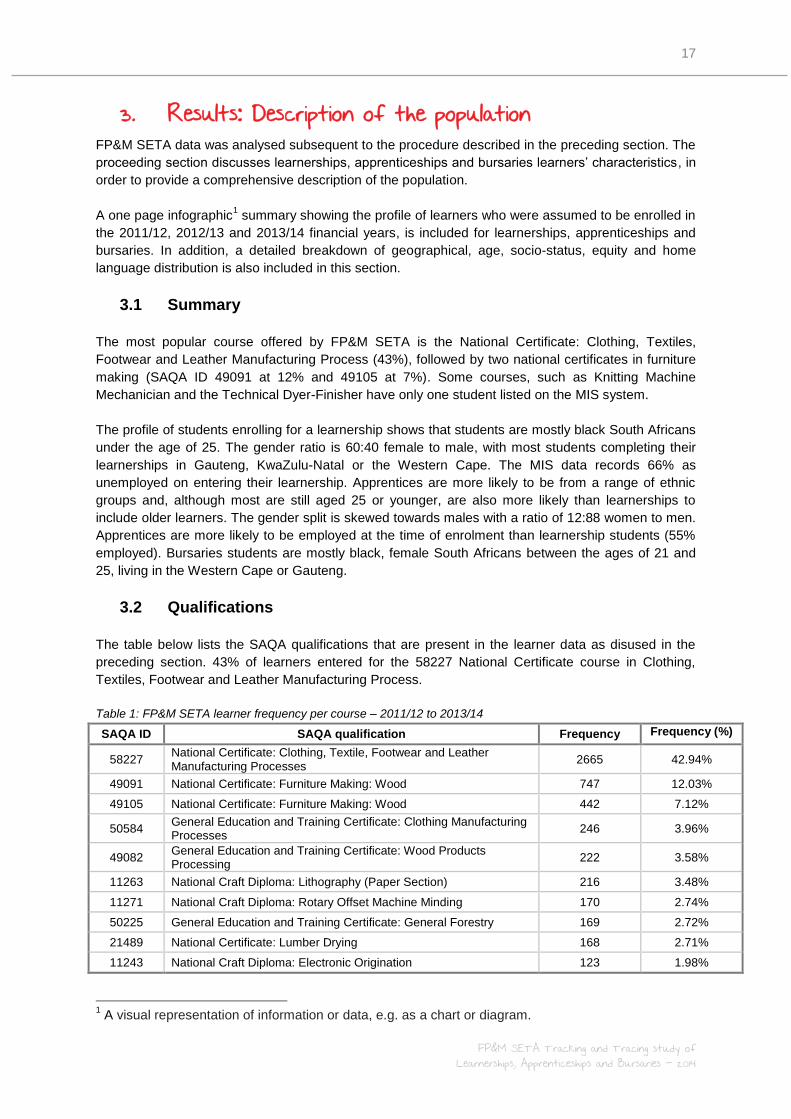
3.1 Summary
The most popular course offered by FP&M SETA is the National Certificate: Clothing, Textiles,
Footwear and Leather Manufacturing Process (43%), followed by two national certificates in furniture
making (SAQA ID 49091 at 12% and 49105 at 7%). Some courses, such as Knitting Machine
Mechanician and the Technical Dyer-Finisher have only one student listed on the MIS system.
The profile of students enrolling for a learnership shows that students are mostly black South Africans
under the age of 25. The gender ratio is 60:40 female to male, with most students completing their
learnerships in Gauteng, KwaZulu-Natal or the Western Cape. The MIS data records 66% as
unemployed on entering their learnership. Apprentices are more likely to be from a range of ethnic
groups and, although most are still aged 25 or younger, are also more likely than learnerships to
include older learners. The gender split is skewed towards males with a ratio of 12:88 women to men.
Apprentices are more likely to be employed at the time of enrolment than learnership students (55%
employed). Bursaries students are mostly black, female South Africans between the ages of 21 and
25, living in the Western Cape or Gauteng.
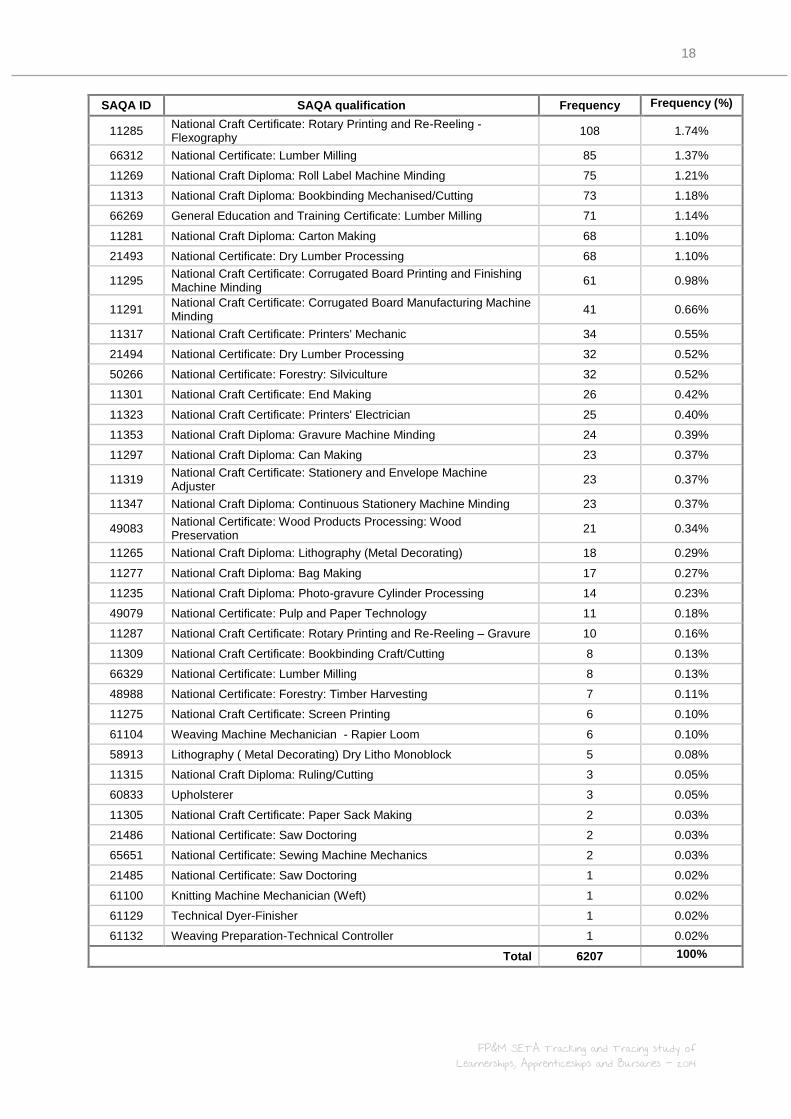
3.2 Qualifications
The table below lists the SAQA qualifications that are present in the learner data as disused in the
preceding section. 43% of learners entered for the 58227 National Certificate course in Clothing,
Textiles, Footwear and Leather Manufacturing Process.
Table 1: FP&M SETA learner frequency per course – 2011/12 to 2013/14
SAQA ID SAQA qualification Frequency Frequency (%)
58227 National Certificate: Clothing, Textile, Footwear and Leather Manufacturing Processes
2665 42.94%
49091 National Certificate: Furniture Making: Wood 747 12.03%
49105 National Certificate: Furniture Making: Wood 442 7.12%
50584 General Education and Training Certificate: Clothing Manufacturing Processes
246 3.96%
49082 General Education and Training Certificate: Wood Products Processing
222 3.58%
11263 National Craft Diploma: Lithography (Paper Section) 216 3.48%
11271 National Craft Diploma: Rotary Offset Machine Minding 170 2.74%
50225 General Education and Training Certificate: General Forestry 169 2.72%
21489 National Certificate: Lumber Drying 168 2.71%
11243 National Craft Diploma: Electronic Origination 123 1.98%
1 A visual representation of information or data, e.g. as a chart or diagram.
18
FP&M SETA Tracking and Tracing study of Learnerships, Apprenticeships and Bursaries - 2014
SAQA ID SAQA qualification Frequency Frequency (%)
11285 National Craft Certificate: Rotary Printing and Re-Reeling - Flexography
108 1.74%
66312 National Certificate: Lumber Milling 85 1.37%
11269 National Craft Diploma: Roll Label Machine Minding 75 1.21%
11313 National Craft Diploma: Bookbinding Mechanised/Cutting 73 1.18%
66269 General Education and Training Certificate: Lumber Milling 71 1.14%
11281 National Craft Diploma: Carton Making 68 1.10%
21493 National Certificate: Dry Lumber Processing 68 1.10%
11295 National Craft Certificate: Corrugated Board Printing and Finishing Machine Minding
61 0.98%
11291 National Craft Certificate: Corrugated Board Manufacturing Machine Minding
41 0.66%
11317 National Craft Certificate: Printers' Mechanic 34 0.55%
21494 National Certificate: Dry Lumber Processing 32 0.52%
50266 National Certificate: Forestry: Silviculture 32 0.52%
11301 National Craft Certificate: End Making 26 0.42%
11323 National Craft Certificate: Printers' Electrician 25 0.40%
11353 National Craft Diploma: Gravure Machine Minding 24 0.39%
11297 National Craft Diploma: Can Making 23 0.37%
11319 National Craft Certificate: Stationery and Envelope Machine Adjuster
23 0.37%
11347 National Craft Diploma: Continuous Stationery Machine Minding 23 0.37%
49083 National Certificate: Wood Products Processing: Wood Preservation
21 0.34%
11265 National Craft Diploma: Lithography (Metal Decorating) 18 0.29%
11277 National Craft Diploma: Bag Making 17 0.27%
11235 National Craft Diploma: Photo-gravure Cylinder Processing 14 0.23%
49079 National Certificate: Pulp and Paper Technology 11 0.18%
11287 National Craft Certificate: Rotary Printing and Re-Reeling – Gravure 10 0.16%
11309 National Craft Certificate: Bookbinding Craft/Cutting 8 0.13%
66329 National Certificate: Lumber Milling 8 0.13%
48988 National Certificate: Forestry: Timber Harvesting 7 0.11%
11275 National Craft Certificate: Screen Printing 6 0.10%
61104 Weaving Machine Mechanician - Rapier Loom 6 0.10%
58913 Lithography ( Metal Decorating) Dry Litho Monoblock 5 0.08%
11315 National Craft Diploma: Ruling/Cutting 3 0.05%
60833 Upholsterer 3 0.05%
11305 National Craft Certificate: Paper Sack Making 2 0.03%
21486 National Certificate: Saw Doctoring 2 0.03%
65651 National Certificate: Sewing Machine Mechanics 2 0.03%
21485 National Certificate: Saw Doctoring 1 0.02%
61100 Knitting Machine Mechanician (Weft) 1 0.02%
61129 Technical Dyer-Finisher 1 0.02%
61132 Weaving Preparation-Technical Controller 1 0.02%
Total 6207 100%

19
FP&M SETA Tracking and Tracing study of Learnerships, Apprenticeships and Bursaries - 2014
3.3 Learnership Profile
This section provides a full profile of those enrolled to complete a learnership during 2011/12 to
2013/14 – 5 014 learners. Firstly an overall summary is provided in the form of an infographic in
Figure 7 below.
Figure 7: Infographic showing the profile of those enrolled for a learnership
20
FP&M SETA Tracking and Tracing study of Learnerships, Apprenticeships and Bursaries - 2014
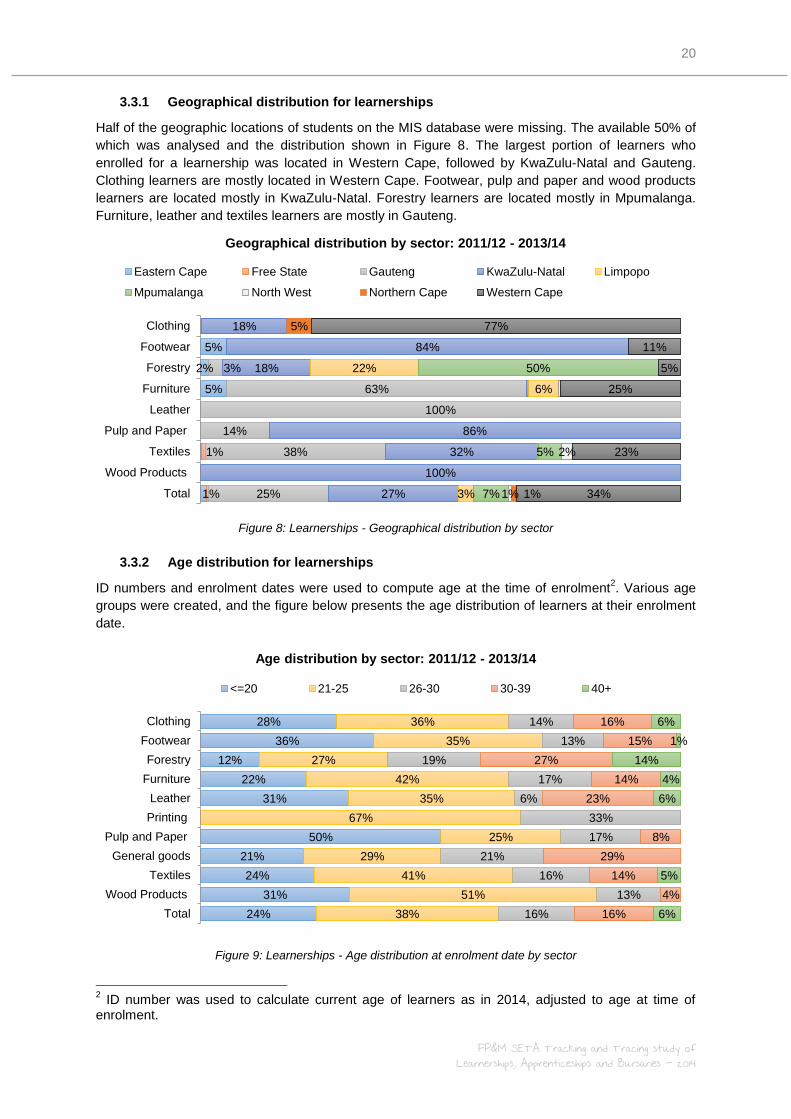
3.3.1 Geographical distribution for learnerships
Half of the geographic locations of students on the MIS database were missing. The available 50% of
which was analysed and the distribution shown in Figure 8. The largest portion of learners who
enrolled for a learnership was located in Western Cape, followed by KwaZulu-Natal and Gauteng.
Clothing learners are mostly located in Western Cape. Footwear, pulp and paper and wood products
learners are located mostly in KwaZulu-Natal. Forestry learners are located mostly in Mpumalanga.
Furniture, leather and textiles learners are mostly in Gauteng.
Figure 8: Learnerships - Geographical distribution by sector
3.3.2 Age distribution for learnerships
ID numbers and enrolment dates were used to compute age at the time of enrolment2. Various age
groups were created, and the figure below presents the age distribution of learners at their enrolment
date.
Figure 9: Learnerships - Age distribution at enrolment date by sector
2 ID number was used to calculate current age of learners as in 2014, adjusted to age at time of
enrolment.
5%
2%
5%
1%
1%
3%
63%
100%
14%
38%
25%
18%
84%
18%
86%
32%
100%
27%
22%
6%
3%
50%
5%
7%
2%
1%
5%
1%
77%
11%
5%
25%
23%
34%
Clothing
Footwear
Forestry
Furniture
Leather
Pulp and Paper
Textiles
Wood Products
Total
Geographical distribution by sector: 2011/12 - 2013/14
Eastern Cape Free State Gauteng KwaZulu-Natal Limpopo
Mpumalanga North West Northern Cape Western Cape
28%
36%
12%
22%
31%
50%
21%
24%
31%
24%
36%
35%
27%
42%
35%
67%
25%
29%
41%
51%
38%
14%
13%
19%
17%
6%
33%
17%
21%
16%
13%
16%
16%
15%
27%
14%
23%
8%
29%
14%
4%
16%
6%
1%
14%
4%
6%
5%
6%
Clothing
Footwear
Forestry
Furniture
Leather
Printing
Pulp and Paper
General goods
Textiles
Wood Products
Total
Age distribution by sector: 2011/12 - 2013/14
<=20 21-25 26-30 30-39 40+
21
FP&M SETA Tracking and Tracing study of Learnerships, Apprenticeships and Bursaries - 2014
The age distribution of learners shows that learners are predominately young adults. 24% are 20
years old or younger and have most likely entered the learnership directly, or shortly after, finishing
school. General Goods, Forestry and Leather has a larger proportion of older learners.
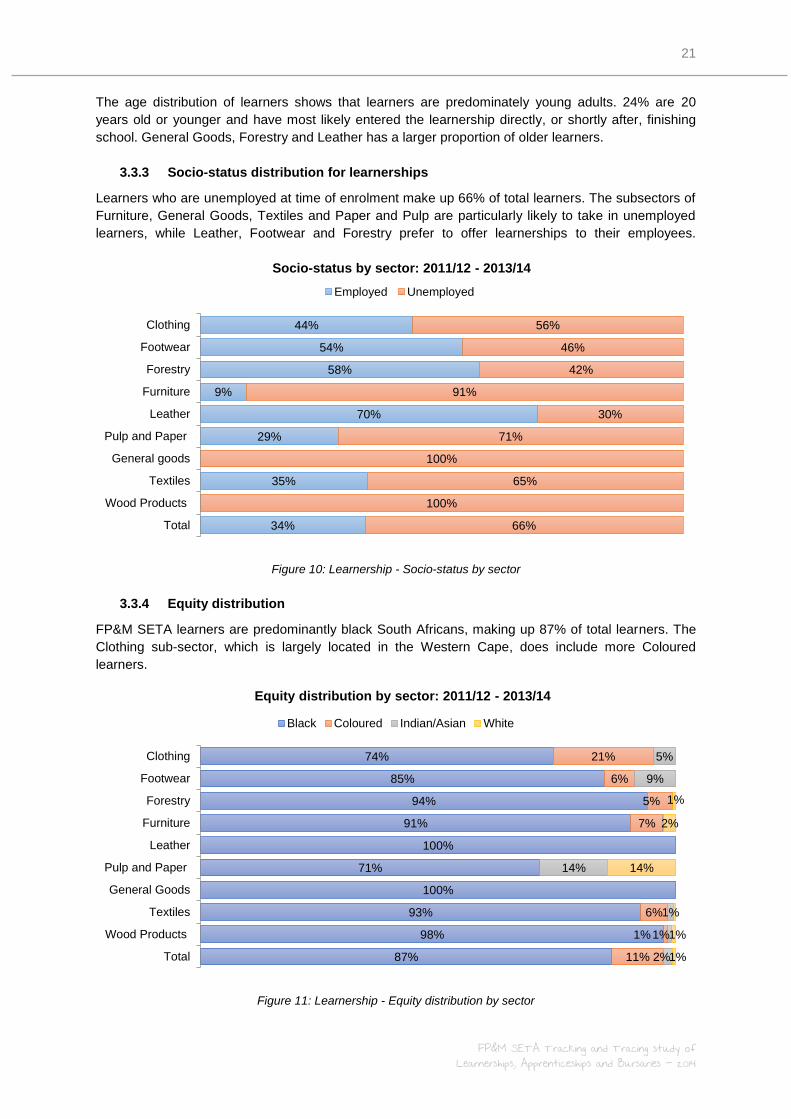
3.3.3 Socio-status distribution for learnerships
Learners who are unemployed at time of enrolment make up 66% of total learners. The subsectors of
Furniture, General Goods, Textiles and Paper and Pulp are particularly likely to take in unemployed
learners, while Leather, Footwear and Forestry prefer to offer learnerships to their employees.
Figure 10: Learnership - Socio-status by sector
3.3.4 Equity distribution
FP&M SETA learners are predominantly black South Africans, making up 87% of total learners. The
Clothing sub-sector, which is largely located in the Western Cape, does include more Coloured
learners.
Figure 11: Learnership - Equity distribution by sector
44%
54%
58%
9%
70%
29%
35%
34%
56%
46%
42%
91%
30%
71%
100%
65%
100%
66%
Clothing
Footwear
Forestry
Furniture
Leather
Pulp and Paper
General goods
Textiles
Wood Products
Total
Socio-status by sector: 2011/12 - 2013/14
Employed Unemployed
74%
85%
94%
91%
100%
71%
100%
93%
98%
87%
21%
6%
5%
7%
6%
1%
11%
5%
9%
14%
1%
1%
2%
1%
2%
14%
1%
1%
Clothing
Footwear
Forestry
Furniture
Leather
Pulp and Paper
General Goods
Textiles
Wood Products
Total
Equity distribution by sector: 2011/12 - 2013/14
Black Coloured Indian/Asian White
22
FP&M SETA Tracking and Tracing study of Learnerships, Apprenticeships and Bursaries - 2014
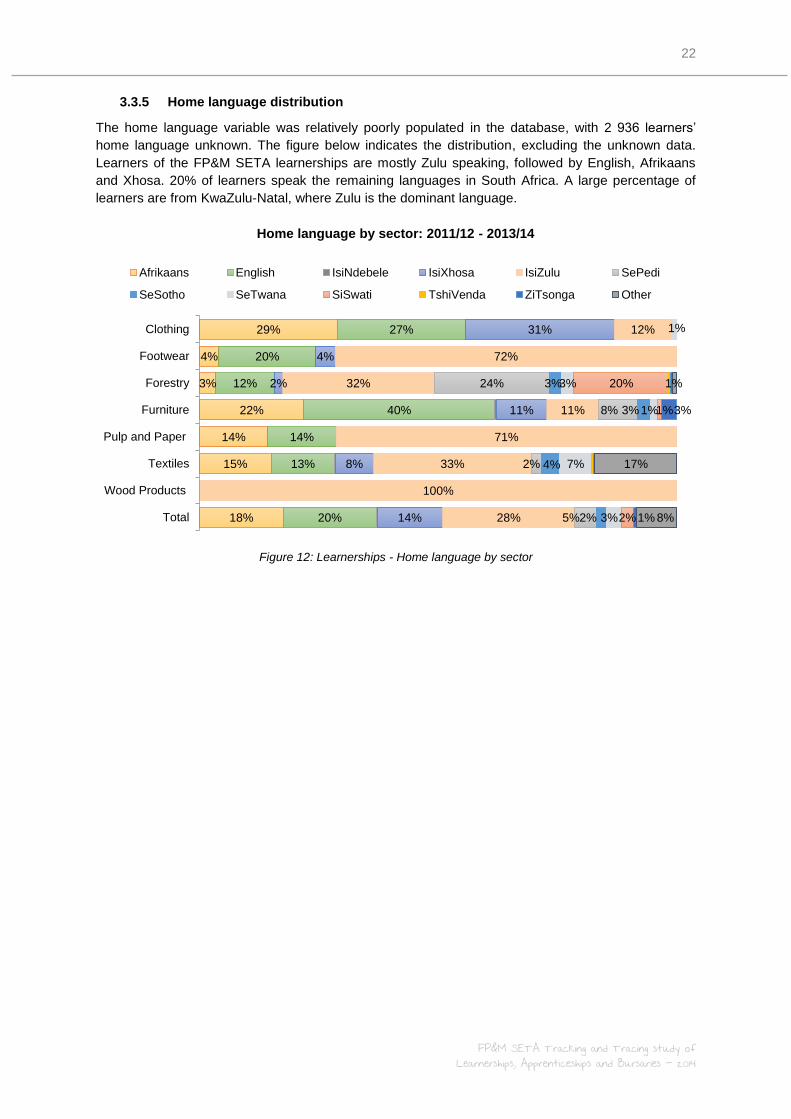
3.3.5 Home language distribution
The home language variable was relatively poorly populated in the database, with 2 936 learners’
home language unknown. The figure below indicates the distribution, excluding the unknown data.
Learners of the FP&M SETA learnerships are mostly Zulu speaking, followed by English, Afrikaans
and Xhosa. 20% of learners speak the remaining languages in South Africa. A large percentage of
learners are from KwaZulu-Natal, where Zulu is the dominant language.
Figure 12: Learnerships - Home language by sector
29%
4%
3%
22%
14%
15%
18%
27%
20%
12%
40%
14%
13%
20%
31%
4%
2%
11%
8%
14%
12%
72%
32%
11%
71%
33%
100%
28%
24%
8%
2%
5%
3%
3%
4%
2%
1%
3%
1%
7%
3%
20%
1%
2%
3%
1%
1%
17%
8%
Clothing
Footwear
Forestry
Furniture
Pulp and Paper
Textiles
Wood Products
Total
Home language by sector: 2011/12 - 2013/14
Afrikaans English IsiNdebele IsiXhosa IsiZulu SePedi
SeSotho SeTwana SiSwati TshiVenda ZiTsonga Other
23
FP&M SETA Tracking and Tracing study of Learnerships, Apprenticeships and Bursaries - 2014
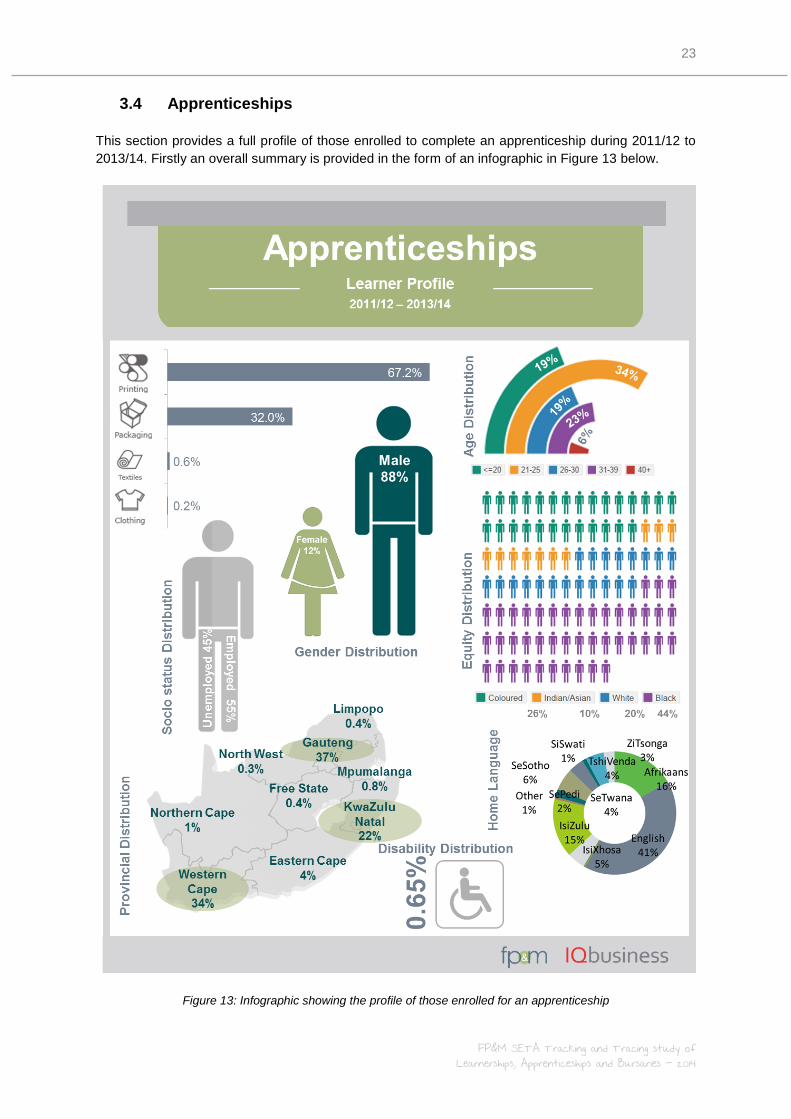
3.4 Apprenticeships
This section provides a full profile of those enrolled to complete an apprenticeship during 2011/12 to
2013/14. Firstly an overall summary is provided in the form of an infographic in Figure 13 below.
Figure 13: Infographic showing the profile of those enrolled for an apprenticeship
24
FP&M SETA Tracking and Tracing study of Learnerships, Apprenticeships and Bursaries - 2014
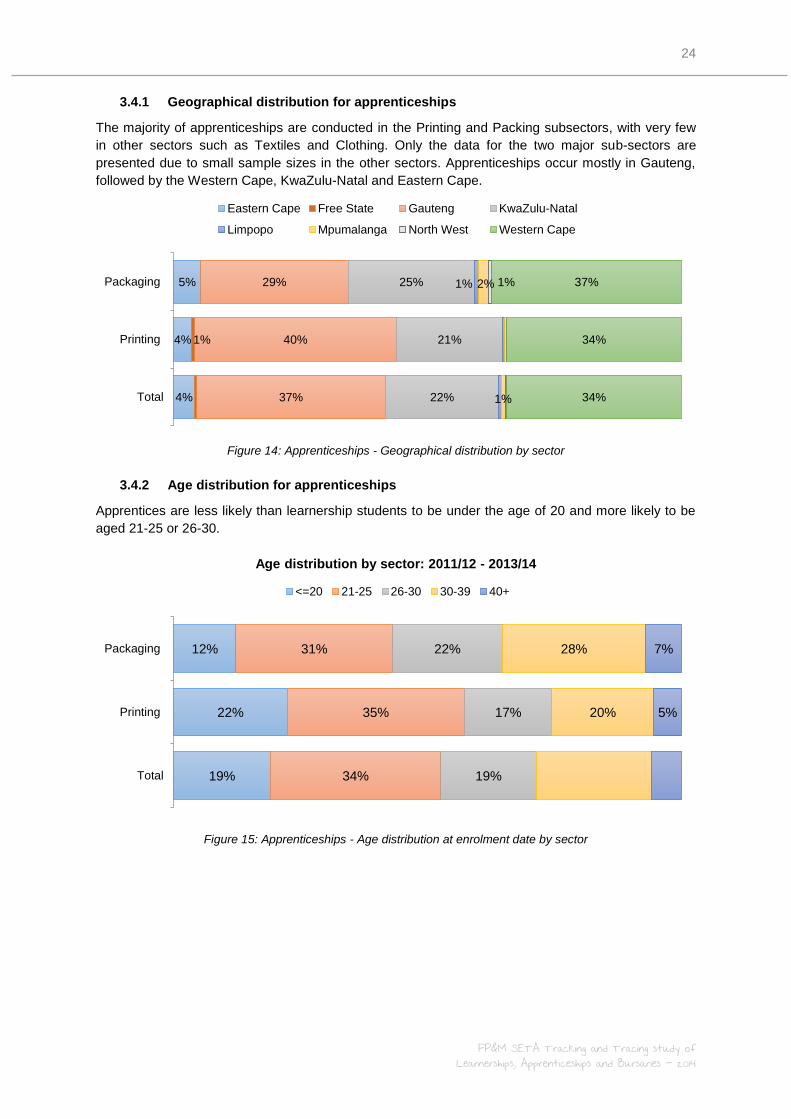
3.4.1 Geographical distribution for apprenticeships
The majority of apprenticeships are conducted in the Printing and Packing subsectors, with very few
in other sectors such as Textiles and Clothing. Only the data for the two major sub-sectors are
presented due to small sample sizes in the other sectors. Apprenticeships occur mostly in Gauteng,
followed by the Western Cape, KwaZulu-Natal and Eastern Cape.
Figure 14: Apprenticeships - Geographical distribution by sector
3.4.2 Age distribution for apprenticeships
Apprentices are less likely than learnership students to be under the age of 20 and more likely to be
aged 21-25 or 26-30.
Figure 15: Apprenticeships - Age distribution at enrolment date by sector
5%
4%
4%
1%
29%
40%
37%
25%
21%
22%
1% 2%
1%
1% 37%
34%
34%
Packaging
Printing
Total
Eastern Cape Free State Gauteng KwaZulu-Natal
Limpopo Mpumalanga North West Western Cape
12%
22%
19%
31%
35%
34%
22%
17%
19%
28%
20%
7%
5%
Packaging
Printing
Total
Age distribution by sector: 2011/12 - 2013/14
<=20 21-25 26-30 30-39 40+
25
FP&M SETA Tracking and Tracing study of Learnerships, Apprenticeships and Bursaries - 2014
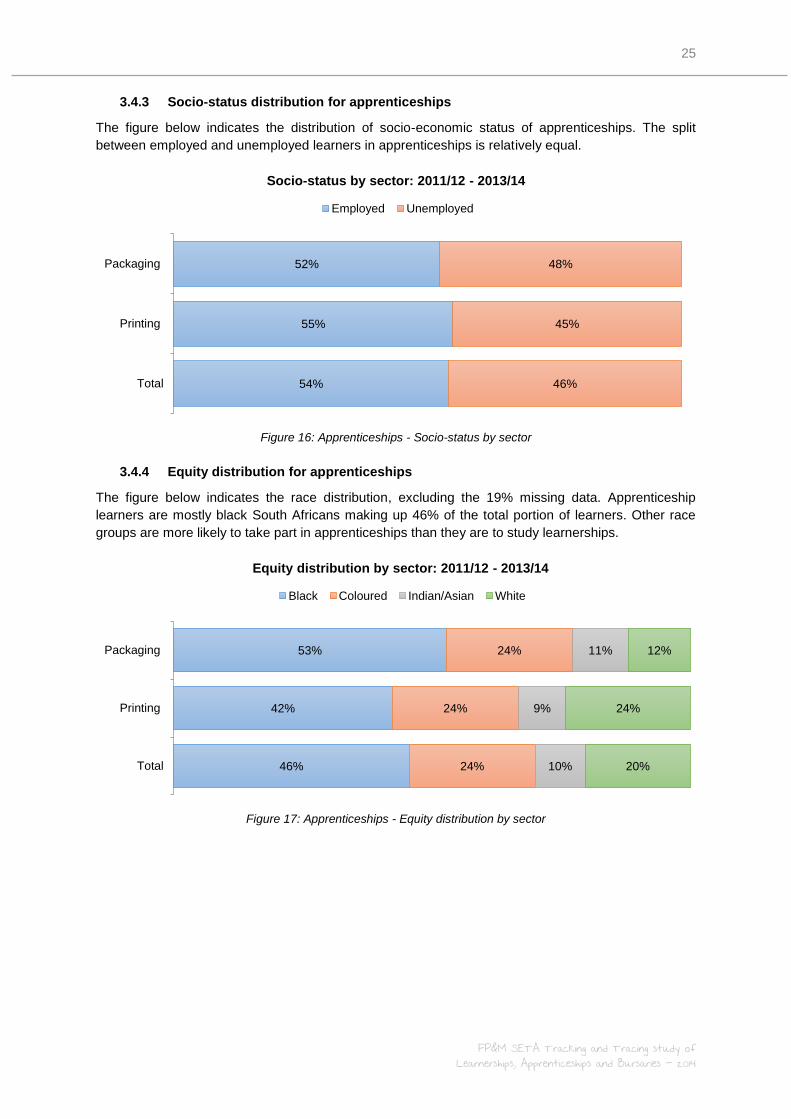
3.4.3 Socio-status distribution for apprenticeships
The figure below indicates the distribution of socio-economic status of apprenticeships. The split
between employed and unemployed learners in apprenticeships is relatively equal.
Figure 16: Apprenticeships - Socio-status by sector
3.4.4 Equity distribution for apprenticeships
The figure below indicates the race distribution, excluding the 19% missing data. Apprenticeship
learners are mostly black South Africans making up 46% of the total portion of learners. Other race
groups are more likely to take part in apprenticeships than they are to study learnerships.
Figure 17: Apprenticeships - Equity distribution by sector
52%
55%
54%
48%
45%
46%
Packaging
Printing
Total
Socio-status by sector: 2011/12 - 2013/14
Employed Unemployed
53%
42%
46%
24%
24%
24%
11%
9%
10%
12%
24%
20%
Packaging
Printing
Total
Equity distribution by sector: 2011/12 - 2013/14
Black Coloured Indian/Asian White
26
FP&M SETA Tracking and Tracing study of Learnerships, Apprenticeships and Bursaries - 2014
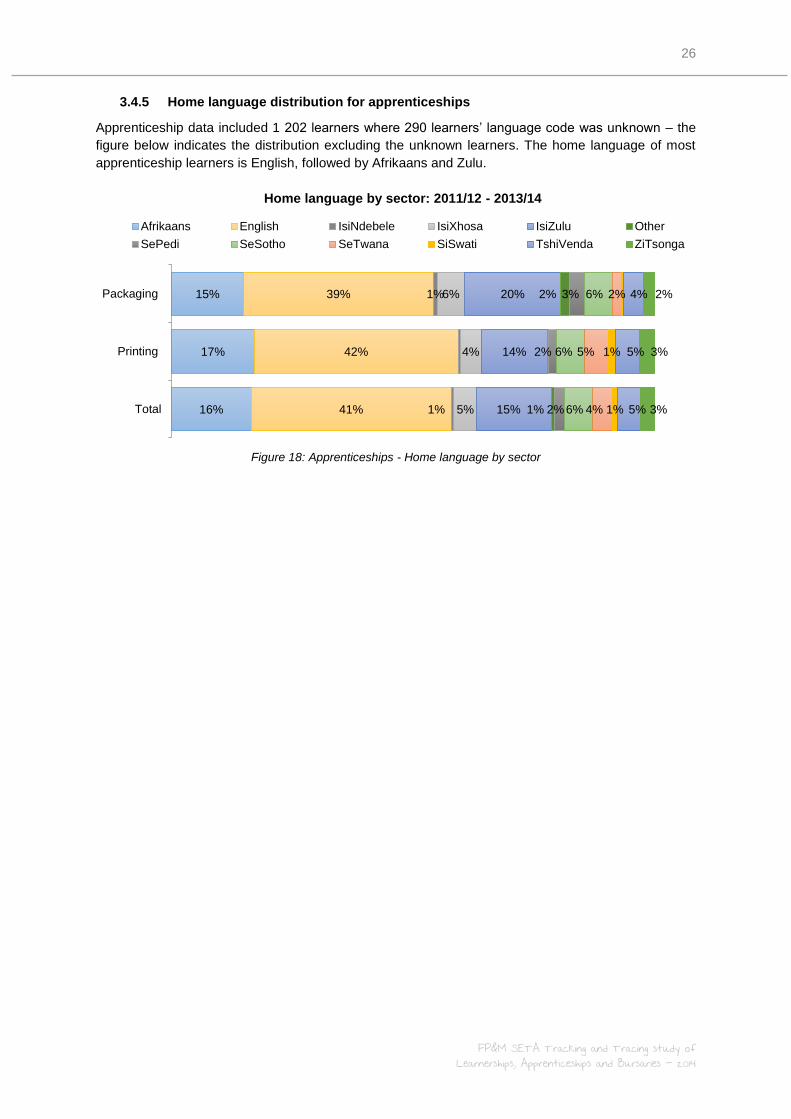
3.4.5 Home language distribution for apprenticeships
Apprenticeship data included 1 202 learners where 290 learners’ language code was unknown – the
figure below indicates the distribution excluding the unknown learners. The home language of most
apprenticeship learners is English, followed by Afrikaans and Zulu.
Figure 18: Apprenticeships - Home language by sector
15%
17%
16%
39%
42%
41%
1%
1%
6%
4%
5%
20%
14%
15%
2%
1%
3%
2%
2%
6%
6%
6%
2%
5%
4%
1%
1%
4%
5%
5%
2%
3%
3%
Packaging
Printing
Total
Home language by sector: 2011/12 - 2013/14
Afrikaans English IsiNdebele IsiXhosa IsiZulu Other
SePedi SeSotho SeTwana SiSwati TshiVenda ZiTsonga
27
FP&M SETA Tracking and Tracing study of Learnerships, Apprenticeships and Bursaries - 2014
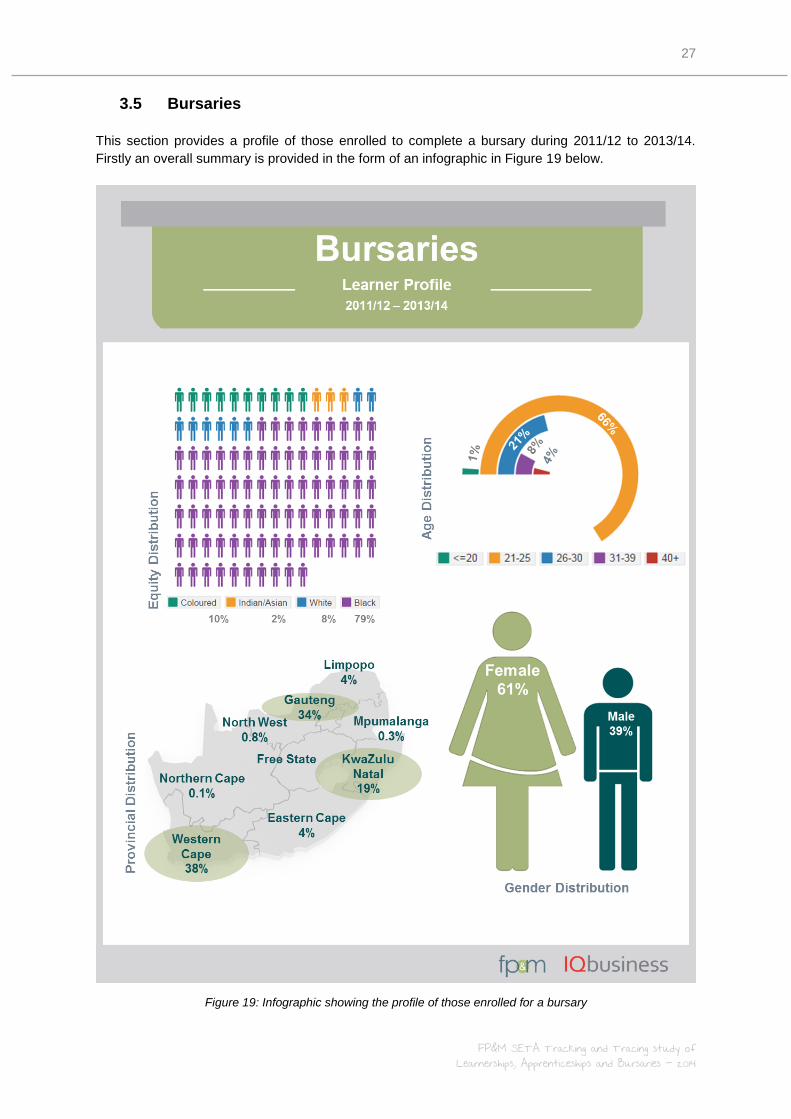
3.5 Bursaries
This section provides a profile of those enrolled to complete a bursary during 2011/12 to 2013/14.
Firstly an overall summary is provided in the form of an infographic in Figure 19 below.
Figure 19: Infographic showing the profile of those enrolled for a bursary
28
FP&M SETA Tracking and Tracing study of Learnerships, Apprenticeships and Bursaries - 2014
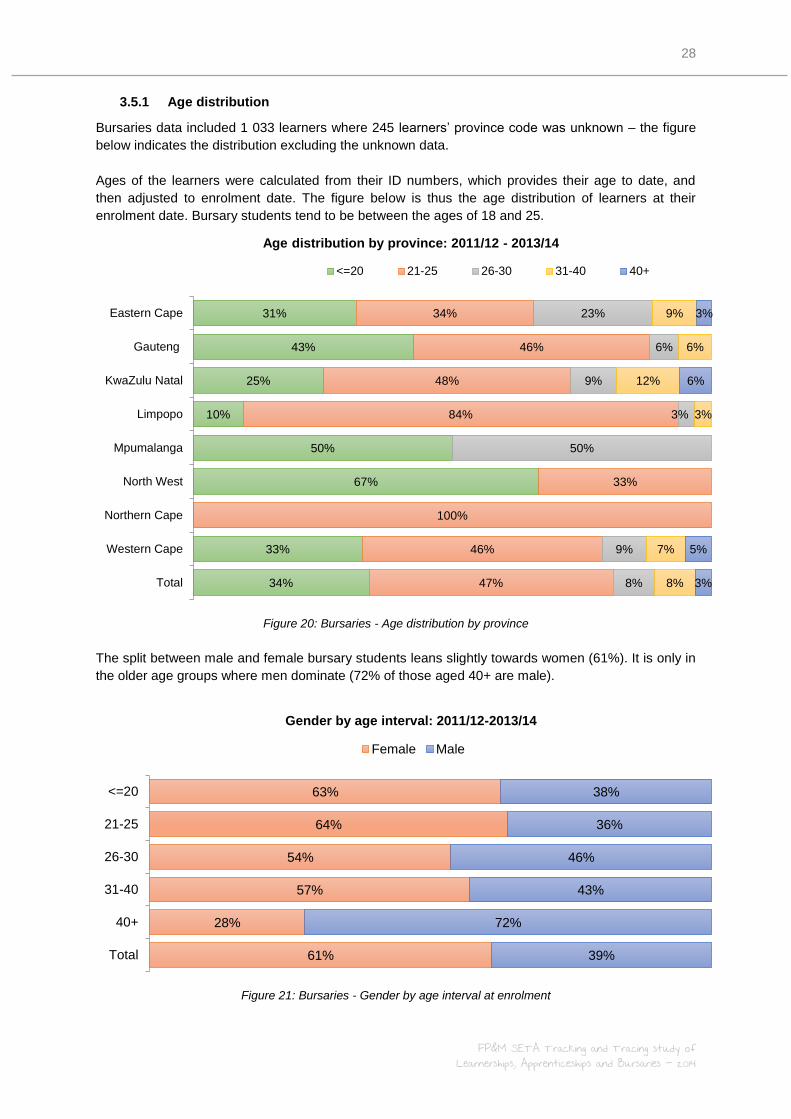
3.5.1 Age distribution
Bursaries data included 1 033 learners where 245 learners’ province code was unknown – the figure
below indicates the distribution excluding the unknown data.
Ages of the learners were calculated from their ID numbers, which provides their age to date, and
then adjusted to enrolment date. The figure below is thus the age distribution of learners at their
enrolment date. Bursary students tend to be between the ages of 18 and 25.
Figure 20: Bursaries - Age distribution by province
The split between male and female bursary students leans slightly towards women (61%). It is only in
the older age groups where men dominate (72% of those aged 40+ are male).
Figure 21: Bursaries - Gender by age interval at enrolment
31%
43%
25%
10%
50%
67%
33%
34%
34%
46%
48%
84%
33%
100%
46%
47%
23%
6%
9%
3%
50%
9%
8%
9%
6%
12%
3%
7%
8%
3%
6%
5%
3%
Eastern Cape
Gauteng
KwaZulu Natal
Limpopo
Mpumalanga
North West
Northern Cape
Western Cape
Total
Age distribution by province: 2011/12 - 2013/14
<=20 21-25 26-30 31-40 40+
63%
64%
54%
57%
28%
61%
38%
36%
46%
43%
72%
39%
<=20
21-25
26-30
31-40
40+
Total
Gender by age interval: 2011/12-2013/14
Female Male
29
FP&M SETA Tracking and Tracing study of Learnerships, Apprenticeships and Bursaries - 2014
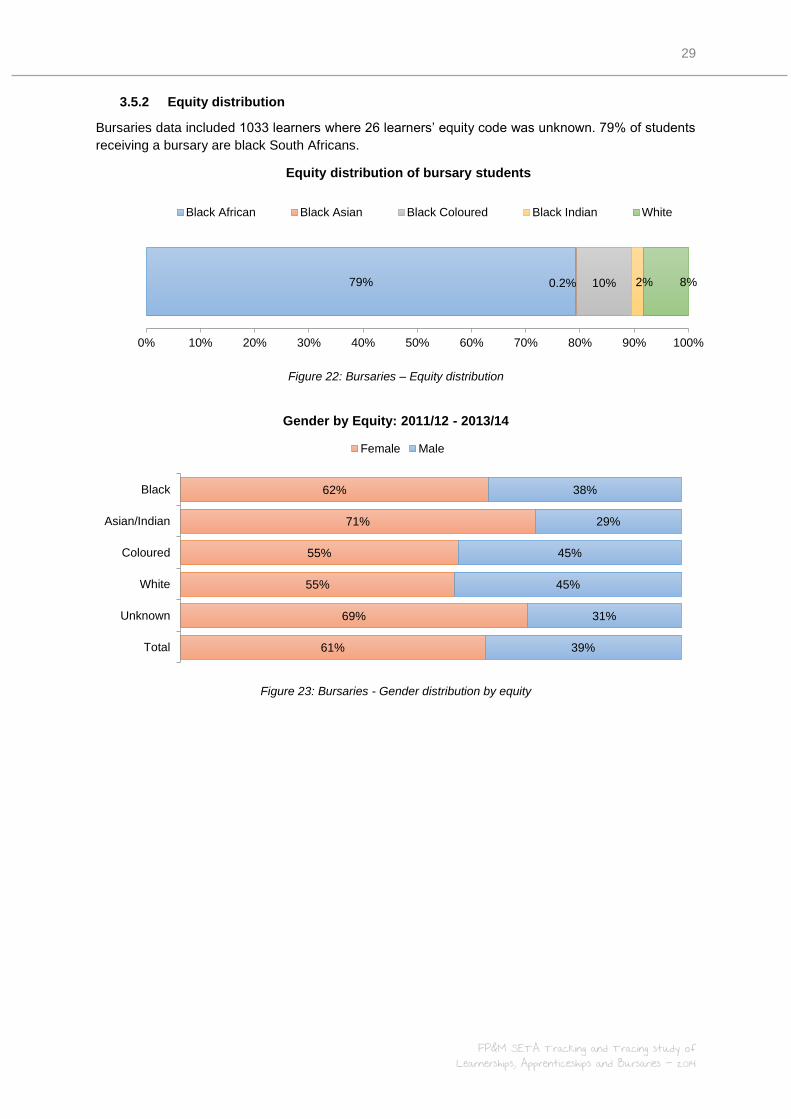
3.5.2 Equity distribution
Bursaries data included 1033 learners where 26 learners’ equity code was unknown. 79% of students
receiving a bursary are black South Africans.
Figure 22: Bursaries – Equity distribution
Figure 23: Bursaries - Gender distribution by equity
79% 0.2% 10% 2% 8%
0% 10% 20% 30% 40% 50% 60% 70% 80% 90% 100%
Equity distribution of bursary students
Black African Black Asian Black Coloured Black Indian White
62%
71%
55%
55%
69%
61%
38%
29%
45%
45%
31%
39%
Black
Asian/Indian
Coloured
White
Unknown
Total
Gender by Equity: 2011/12 - 2013/14
Female Male

30
FP&M SETA Tracking and Tracing study of Learnerships, Apprenticeships and Bursaries - 2014
Chapter 2 Geographic Distribution of
SETA funded projects
1. Objective The second aim of this study, as outlined by the tender request document, was to understand the
geographic distribution of SETA-funded projects. This is important as it would help the SETA evaluate
the geographic spread of current interventions, enabling a review with the aim of improving the
distribution according to industry needs. This chapter focusses on the geographic distribution of the
FP&M SETA funded.
2. Methodology The Commitment register provided by FP&M SETA for the periods 2011/12 to 2013/14 was analysed,
in order to get a picture of where the SETA’’s fund are concentrated. The commitment register
contains the records of all applications approved for funding, as well as a record of the Memorandum
of Agreement (MOA), showing the agreements in place.
The findings of the analysis of the commitment register are presented in this chapter for each of the
three interventions; learnerships, bursaries and apprenticeships and each analysis provides a view of
total spending patterns as well as spending patterns per province.
To gain insight into the spending patterns of the SETA, the analysis focused on the board-approved
and MOA funding as well as the number of individual companies receiving funding.
3. Detailed results of geographic distribution of SETA funded projects
3.1 Summary of geographic distribution of funding
Most of the SETA funded training initiatives are in Gauteng, Kwazulu-Natal and the Western Cape.
Over the three financial years of 2011/12 to 2012/13 the FP&M SETA spent R33 199 million in the
Western Cape on learnerships, R36 272 million in Gauteng and R43 831 million in KwaZulu-Natal.
The most any other province received is R4 201 million for Mpumalanga.
The amount of funding approved for spending on apprenticeships has increased drastically over the
last three financial years, from approximately R13 million to R56.2 million. There is, however, a large
shortfall between the amount approved by the board and the amount spent (MOA signed). In 2011/12
the shortfall was 52%, 20% in 2012/13 and 25% in 2013/14. This compares unfavourably to the 8%
shortfall observed for learnerships.

31
FP&M SETA Tracking and Tracing study of Learnerships, Apprenticeships and Bursaries - 2014
3.2 Geographic distribution of funding for Learnerships
The amount of funding approved for spending on learnerships has increased steadily over the last
three financial years, from approximately R44 million to R68.6 million. This is a growth rate of 56%.
The total amount spent, based on employers submitting the MOA, is relatively close to the amount of
funding approved by the board. The difference between Board Approval and MOA stayed consistent
between 8% and 8.2% since 2011/12.
Figure 24: Learnership commitment register by year
The number of companies offering learnerships has increased from 268 to 351 from 2011/12 to
2013/14. The substantial increase from 2011/12 to 2012/13 could, in part be due to the fact the FP&M
SETA was only formed in 2011.
Figure 25: Learnership commitment register total - by province and year
R 44.0
R 57.8
R 68.6
R 40.4
R 53.0
R 63.1 268
325
351
0
50
100
150
200
250
300
350
400
0
10
20
30
40
50
60
70
80
2011/12 2012/13 2013/14
Nr
of
Co
mp
an
ies
Ran
d (
Mil
lio
ns)
Learnership commitment register - by year
Board Approval MOA Nr of Companies
R 0.1 R 0.1 R 4.9 R 7.4
R 1.5 R 1.6 R 2.8 R 8.5
R 26.4
R 0.3 R 0.1
R 14.8 R 14.3 R 9.8
R 27.4
R 2.1 R 1.6
R 16.5
R 22.1
R 1.7 R 2.6 R 0.8 R 0.8
R 14.9
0
10
20
30
40
50
60
Ran
d (
Mil
lio
ns)
Learnerships commitment register (MOA) - Total
2011/12 2012/13 2013/14
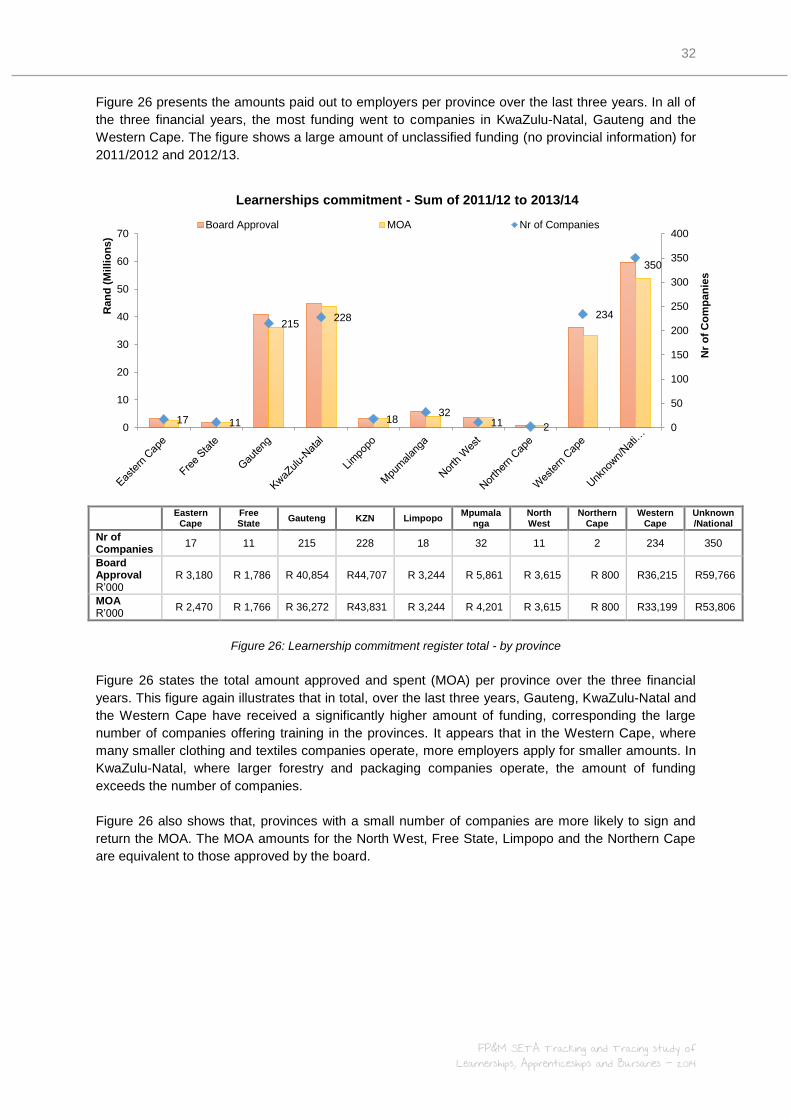
32
FP&M SETA Tracking and Tracing study of Learnerships, Apprenticeships and Bursaries - 2014
Figure 26 presents the amounts paid out to employers per province over the last three years. In all of
the three financial years, the most funding went to companies in KwaZulu-Natal, Gauteng and the
Western Cape. The figure shows a large amount of unclassified funding (no provincial information) for
2011/2012 and 2012/13.
Eastern Cape
Free State
Gauteng KZN Limpopo Mpumala
nga North West
Northern Cape
Western Cape
Unknown/National
Nr of Companies
17 11 215 228 18 32 11 2 234 350
Board Approval R’000
R 3,180 R 1,786 R 40,854 R44,707 R 3,244 R 5,861 R 3,615 R 800 R36,215 R59,766
MOA R’000
R 2,470 R 1,766 R 36,272 R43,831 R 3,244 R 4,201 R 3,615 R 800 R33,199 R53,806
Figure 26: Learnership commitment register total - by province
Figure 26 states the total amount approved and spent (MOA) per province over the three financial
years. This figure again illustrates that in total, over the last three years, Gauteng, KwaZulu-Natal and
the Western Cape have received a significantly higher amount of funding, corresponding the large
number of companies offering training in the provinces. It appears that in the Western Cape, where
many smaller clothing and textiles companies operate, more employers apply for smaller amounts. In
KwaZulu-Natal, where larger forestry and packaging companies operate, the amount of funding
exceeds the number of companies.
Figure 26 also shows that, provinces with a small number of companies are more likely to sign and
return the MOA. The MOA amounts for the North West, Free State, Limpopo and the Northern Cape
are equivalent to those approved by the board.
17 11
215 228
18 32
11 2
234
350
0
50
100
150
200
250
300
350
400
0
10
20
30
40
50
60
70
Nr
of
Co
mp
an
ies
Ran
d (
Mil
lio
ns)
Learnerships commitment - Sum of 2011/12 to 2013/14
Board Approval MOA Nr of Companies
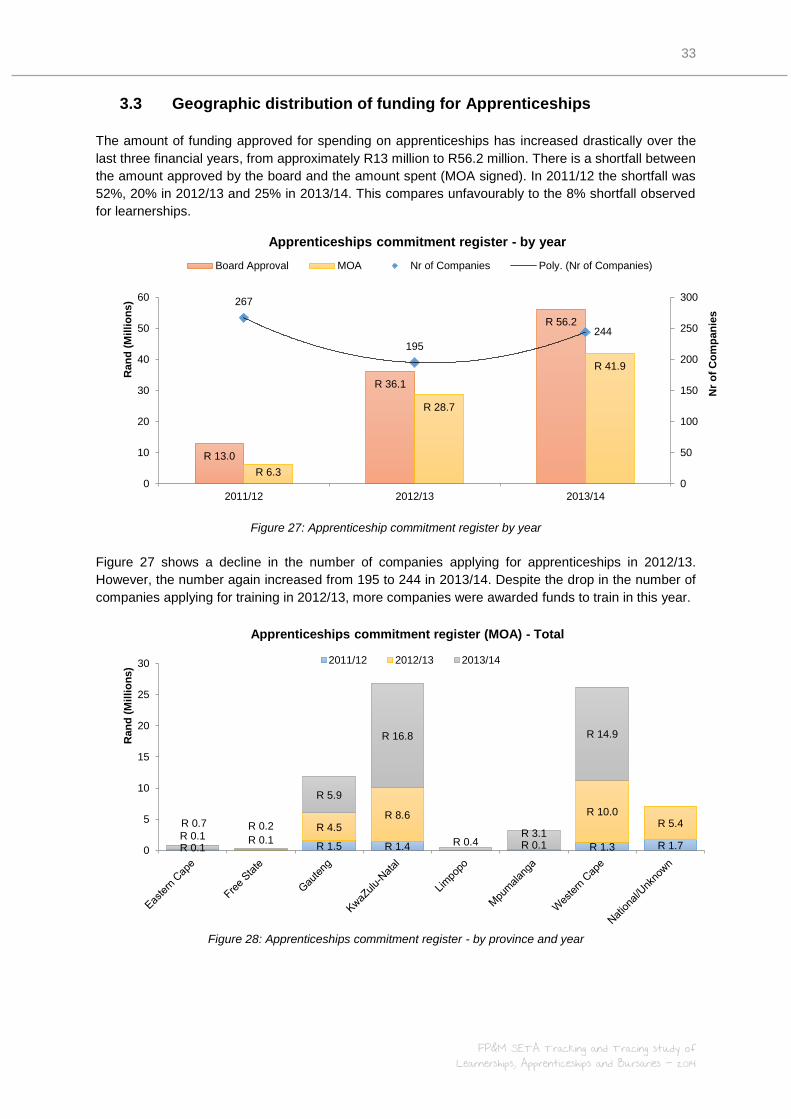
33
FP&M SETA Tracking and Tracing study of Learnerships, Apprenticeships and Bursaries - 2014
3.3 Geographic distribution of funding for Apprenticeships
The amount of funding approved for spending on apprenticeships has increased drastically over the
last three financial years, from approximately R13 million to R56.2 million. There is a shortfall between
the amount approved by the board and the amount spent (MOA signed). In 2011/12 the shortfall was
52%, 20% in 2012/13 and 25% in 2013/14. This compares unfavourably to the 8% shortfall observed
for learnerships.
Figure 27: Apprenticeship commitment register by year
Figure 27 shows a decline in the number of companies applying for apprenticeships in 2012/13.
However, the number again increased from 195 to 244 in 2013/14. Despite the drop in the number of
companies applying for training in 2012/13, more companies were awarded funds to train in this year.
Figure 28: Apprenticeships commitment register - by province and year
R 13.0
R 36.1
R 56.2
R 6.3
R 28.7
R 41.9
267
195
244
0
50
100
150
200
250
300
0
10
20
30
40
50
60
2011/12 2012/13 2013/14
Nr
of
Co
mp
an
ies
Ran
d (
Mil
lio
ns)
Apprenticeships commitment register - by year
Board Approval MOA Nr of Companies Poly. (Nr of Companies)
R 0.1 R 1.5 R 1.4 R 0.1 R 1.3 R 1.7 R 0.1 R 0.1
R 4.5 R 8.6 R 10.0
R 5.4 R 0.7 R 0.2
R 5.9
R 16.8
R 0.4 R 3.1
R 14.9
0
5
10
15
20
25
30
Ran
d (
Mil
lio
ns)
Apprenticeships commitment register (MOA) - Total
2011/12 2012/13 2013/14

34
FP&M SETA Tracking and Tracing study of Learnerships, Apprenticeships and Bursaries - 2014
The data presented in Figure 28 indicates that, similarly to learnerships, most apprentices are funded
in Gauteng, Kwazulu-Natal and the Western Cape.
Eastern Cape
Free State Gauteng KwaZulu-Natal
Limpopo Mpumalanga Western Cape
Unknown/ National
Nr of Companies
20 4 175 158 6 24 228 91
Board Approval R’000
R 1,215 R 485 R 25,557 R 31,050 R 515 R 4,285 R 31,750 R 10,395
MOA R’000
R 875 R 310 R 11,900 R 26,810 R 465 R 3,160 R 26,210 R 7,130
Figure 29: Apprenticeship commitment register total – by province
As shown in Figure 29, Gauteng saw a particularly large shortfall between the board-approved
funding and funding paid out to companies who signed the MOA. Again, KwaZulu-Natal seems to
include fewer companies, but include larger companies who receive more funding as they offer more
training per company.
3.4 Geographic distribution of funding for Bursaries
The amount of funding approved for spending on bursaries increased from 2011/12 to 2012/13, but
then declined from 2012/13 to 2013/14. Figure 30 indicates that the number of companies who submit
their MOA has increased. The difference between the amount approved and the amount spent, based
on employers submitting the MOA, was 24% in 2011/12, 19% in 2012/13 and only 10% in 2013/14.
20 4
175
158
6
24
228
91
0
50
100
150
200
250
0
5
10
15
20
25
30
35
Nr
of
Co
mp
an
ies
Ran
d (
Mil
lio
ns)
Apprenticeships commitment - Sum of 2011/12 to 2013/14 by province
Board Approval MOA Nr of Companies
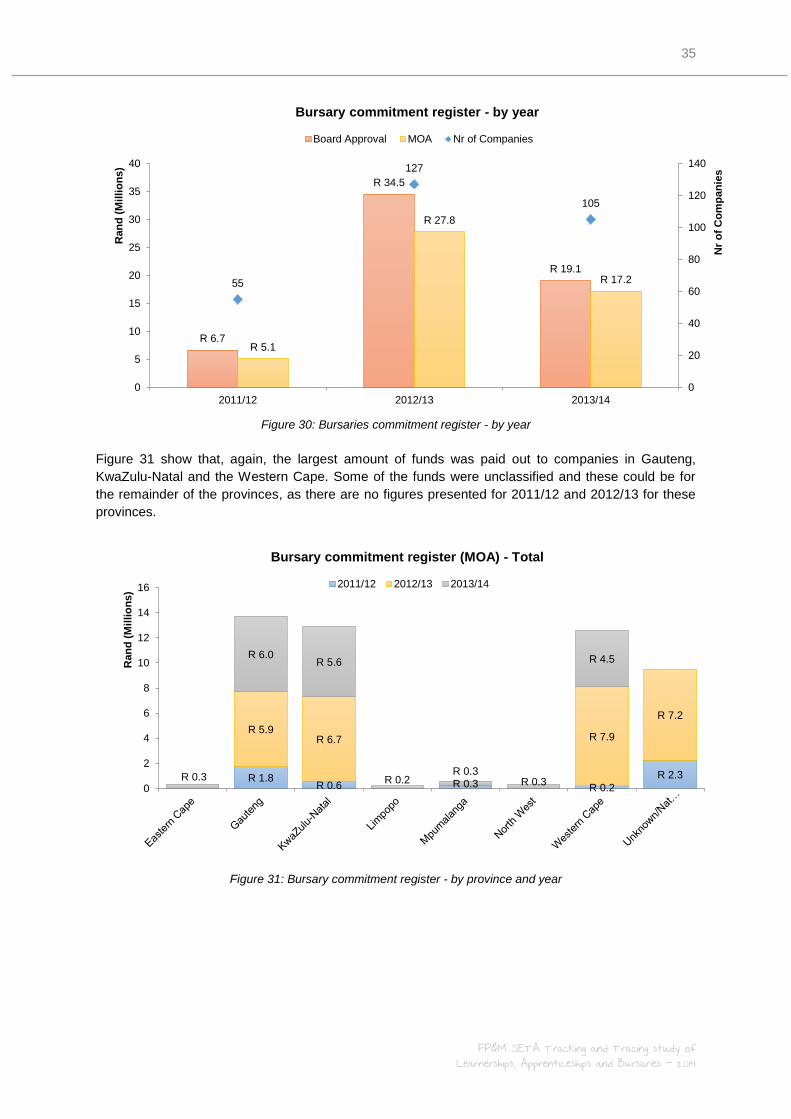
35
FP&M SETA Tracking and Tracing study of Learnerships, Apprenticeships and Bursaries - 2014
Figure 30: Bursaries commitment register - by year
Figure 31 show that, again, the largest amount of funds was paid out to companies in Gauteng,
KwaZulu-Natal and the Western Cape. Some of the funds were unclassified and these could be for
the remainder of the provinces, as there are no figures presented for 2011/12 and 2012/13 for these
provinces.
Figure 31: Bursary commitment register - by province and year
R 6.7
R 34.5
R 19.1
R 5.1
R 27.8
R 17.2 55
127
105
0
20
40
60
80
100
120
140
0
5
10
15
20
25
30
35
40
2011/12 2012/13 2013/14
Nr
of
Co
mp
an
ies
Ran
d (
Mil
lio
ns)
Bursary commitment register - by year
Board Approval MOA Nr of Companies
R 1.8 R 0.6 R 0.3 R 0.2
R 2.3
R 5.9 R 6.7 R 7.9
R 7.2
R 0.3
R 6.0 R 5.6
R 0.2 R 0.3
R 0.3
R 4.5
0
2
4
6
8
10
12
14
16
Ran
d (
Mil
lio
ns)
Bursary commitment register (MOA) - Total
2011/12 2012/13 2013/14
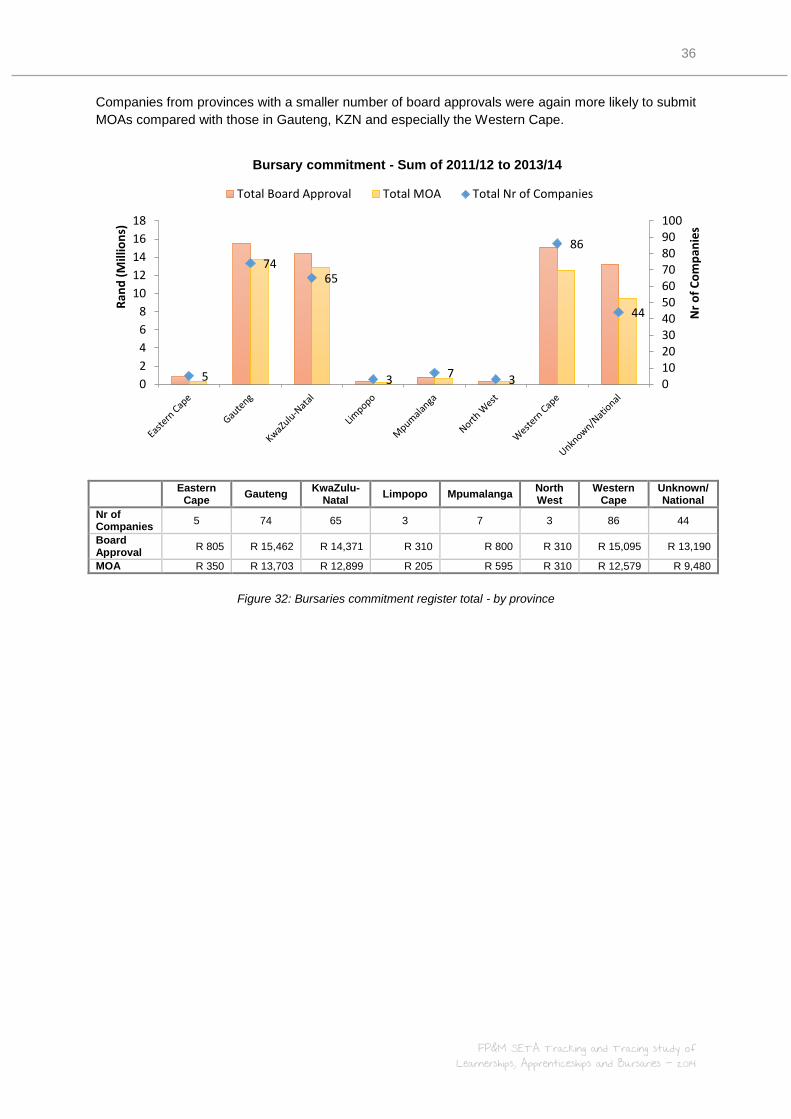
36
FP&M SETA Tracking and Tracing study of Learnerships, Apprenticeships and Bursaries - 2014
Companies from provinces with a smaller number of board approvals were again more likely to submit
MOAs compared with those in Gauteng, KZN and especially the Western Cape.
Eastern
Cape Gauteng
KwaZulu-Natal
Limpopo Mpumalanga North West
Western Cape
Unknown/National
Nr of Companies
5 74 65 3 7 3 86 44
Board Approval
R 805 R 15,462 R 14,371 R 310 R 800 R 310 R 15,095 R 13,190
MOA R 350 R 13,703 R 12,899 R 205 R 595 R 310 R 12,579 R 9,480
Figure 32: Bursaries commitment register total - by province
5
74 65
3 7 3
86
44
0102030405060708090100
0
2
4
6
8
10
12
14
16
18
Nr
of
Co
mp
anie
s
Ran
d (
Mill
ion
s)
Bursary commitment - Sum of 2011/12 to 2013/14
Total Board Approval Total MOA Total Nr of Companies

37
FP&M SETA Tracking and Tracing study of Learnerships, Apprenticeships and Bursaries - 2014
Chapter 3 Impact Assessment of
the Learning Interventions
1. Objective This chapter seeks to understand the success of learning interventions in the FP&M sub-sectors, with
reference to the value they create for both the learner and the employer. Specific objectives of this
chapter include:
Determining the rate of completion of learnerships and apprenticeships.
Evaluating the alignment of the skills provided with industry needs.
Determining the impact of the training initiatives on the student, with special reference to
understanding the absorption of learners into the labour market and the economic value that
is created.
Determining the main impact of these training interventions on the employers in the FP&M
subsectors.
Highlighting challenges and making suggestions for improvements.
2. Methodology To address the above objectives, primary research was deemed necessary, as no database analysis
or secondary research would be able to comprehensively shed light on these issues. An extensive
research design was developed, which incorporated both qualitative and quantitative methodologies
to collect data from learners and employers / training providers. This section provides a full
description of the methodologies employed in collecting the opinions of learners and employers. The
section below firstly outlines the research design used to collect information from learners.
2.1 Primary research design to collect the opinions of learners
The study focused on three groups of learners, those from learnerships, apprenticeships and
bursaries. Contact details were available for some of learnership and apprenticeship students who
enrolled during the last few years yet no contact details were available for bursary students and they
could not be contacted as part of this study.
2.1.1 Objectives of the learner surveys
The learner surveys had the following specific questions:
What is the status of the learnership or apprenticeship - completed, currently registered or
terminated?
Why do the employed and the unemployed decide to pursue learnerships or apprenticeships?
What are the reasons for discontinuing or terminating learnerships and apprenticeships?
Have unemployed learners been absorbed into the market place after completing their
studies, either directly through the learnership or later by finding other related employment?
What is the impact that the learnership or apprenticeship has had on lives of the learners?
What future changes do these learners anticipate as a result of the learnership?
IQ Business and the FP&M SETA collaborated to design a survey around these main objectives.

38
FP&M SETA Tracking and Tracing study of Learnerships, Apprenticeships and Bursaries - 2014
2.1.2 Population and sample for the learners surveys
The population for this study is defined as: “All students who are listed on the MIS database as having
entered a learnership during the period of 2010/2012 – 2013/2014 and apprentices having entered
during the period 2007/08 – 2013/14”.
The MIS database contained 5 005 learnership records for this period, as well as 1 202
apprenticeship records. Approximately 24% of these student records contained telephone numbers,
and this was considered to be the sample frame for the study. All of these learners were contacted for
the purposes of the study. Contacting all enrolled students, for whom contact details exist, effectively
means that no sampling procedures were applied to the sample frame. Contact details considered
valid for the study could be a home telephone number, a cell phone number or a work phone number.
Due to refusals, and out of date contact details, not all available students took part in the study, and a
final response of 81 completed surveys was obtained from the apprenticeships survey, and 303
completed surveys from the learnerships survey. This represents a 28% response rate for
apprenticeships and 25% for learnerships. This response rate is in line, or even slightly better than,
the approximate 20% found in a similar study by the HSRC, using the MERSETA database (HRSC,
2008).
2.1.3 Data collection for the learner surveys
The quantitative data for learnerships and apprenticeships were collected using telephone surveys.
Trained interviewers contacted students telephonically and completed the survey with them over the
phone. Fieldwork took place during October 2014 and the surveys took approximately ten minutes per
student to complete.
2.1.4 Data analysis of the learner surveys
The data from the survey questionnaires was captured into Excel, and then transferred into SPSS.
SPSS was used to analyse the data, and this report presents a summary the key findings from the
surveys.
The sampling process for the quantitative surveys could not be described as purely random. Only
24% of the population had contact details and all of these numbers were contacted, therefore no
further sampling took place. There is, however, a close correlation between the sample’s
demographic profile and that of the population, as pointed out in the detailed survey reports namely
“Voice of the Learner” and “Voice of the Apprentice”. The population demographics are presented in
Chapter 1 of this document. A close correlation assists in establishing the validity and reliability of the
survey results where the premise is that, should a close correlation exist between known data such as
population demographic data and survey data, one can most likely generalise other survey findings to
the population with a greater degree of confidence.
2.1.5 Methodology for the qualitative focus groups
IQ Business conducted focus groups with the learners who completed learnership programmes
funded by the FP&M SETA between 2011 and 2014. The purpose of conducting the focus groups
was to probe issues relating to the impact of learnerships on students. The focus groups were also
conducted prior to the telephone survey and therefore could assist in highlighting issues for inclusion
in the quantitative survey. The focus groups were held in Johannesburg in September 2014.

39
FP&M SETA Tracking and Tracing study of Learnerships, Apprenticeships and Bursaries - 2014
The issues explored during the focus groups covered areas such as challenges faced by learners
during the course of their learnership programme, employment opportunities and the benefits that
learners obtained as a result of completing the learnership programme.
Non-probability convenience sampling was used to recruit learners for the focus groups. The focus
groups were held in Johannesburg and only local students would be able to attend. Given the
timeframe of the study, only five participants were able to attend the focus groups.
2.2 Primary research to collect the opinions of employers
2.2.1 Objectives of the employer survey
Data collected from employers took the form of qualitative in-depth interviews, using semi-structured
questions, as well as an online survey. Specific objectives that were addressed in the research with
employers include:
Measuring the absorption rates of students from learnerships and apprenticeships after the
completion of their training.
Determining the value that employers find in learnerships, apprenticeships and bursaries, as
well as the benefits to the learners as perceived by employers.
Measuring perceptions around the sufficiency of funding by the SETA, as well as satisfaction
with administrative elements.
Understanding general training practices, such as working hours and stipends paid.
Gauging the future of employment and trends that will influence employment levels.
2.2.2 Population and sampling for employer survey
The population for this study is defined as: “All employers who pay levies to the FP&M SETA and who
have submitted a Workplace Skills Plan (WSP) during the last three years”
Once a WSP is submitted, the contact details for the appropriate contact person in the employer
organisation is recorded, and this list, which contains email addresses, was considered as the sample
frame for the study. The Communication and Marketing department of the FP&M provided a list of
emails to which the survey could be sent. A final sample of 259 employers was achieved. This
represents a 1% response of all levy-paying companies and 7% of all contacted. However, the
response rate among those offering training was much higher. For example, the approximate
response rate among employers who offer apprenticeships was 28%.
2.2.3 Data collection for employer survey
Three surveys were created: one for learnerships, one for bursaries and one for apprenticeships.
Employers could choose to complete these based on the training that they offer. For those not
offering training, a separate set of questions were presented. The surveys were programmed using
online survey software. A single survey link was emailed to all respondents, but depending on the
learning interventions that they chose to rate, employers would have answered the learnership
survey, and/or bursary survey, or the apprenticeship survey. In an attempt to limit the length of the
survey, employers who offer apprenticeships and other learning interventions, were presented only
with the apprenticeship survey.
Once an employer clicked on the link, they would complete the relevant survey online, and all data
was automatically captured by the survey software.
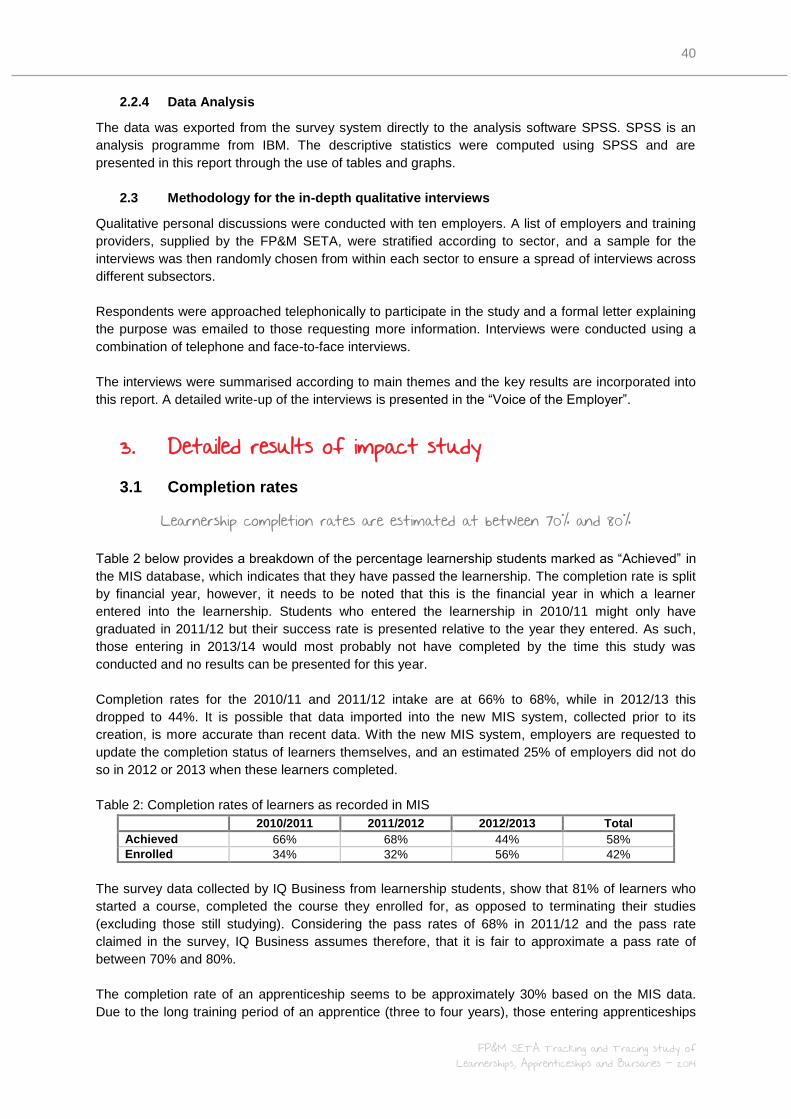
40
FP&M SETA Tracking and Tracing study of Learnerships, Apprenticeships and Bursaries - 2014
2.2.4 Data Analysis
The data was exported from the survey system directly to the analysis software SPSS. SPSS is an
analysis programme from IBM. The descriptive statistics were computed using SPSS and are
presented in this report through the use of tables and graphs.
2.3 Methodology for the in-depth qualitative interviews
Qualitative personal discussions were conducted with ten employers. A list of employers and training
providers, supplied by the FP&M SETA, were stratified according to sector, and a sample for the
interviews was then randomly chosen from within each sector to ensure a spread of interviews across
different subsectors.
Respondents were approached telephonically to participate in the study and a formal letter explaining
the purpose was emailed to those requesting more information. Interviews were conducted using a
combination of telephone and face-to-face interviews.
The interviews were summarised according to main themes and the key results are incorporated into
this report. A detailed write-up of the interviews is presented in the “Voice of the Employer”.
3. Detailed results of impact study
3.1 Completion rates
Learnership completion rates are estimated at between 70% and 80%
Table 2 below provides a breakdown of the percentage learnership students marked as “Achieved” in
the MIS database, which indicates that they have passed the learnership. The completion rate is split
by financial year, however, it needs to be noted that this is the financial year in which a learner
entered into the learnership. Students who entered the learnership in 2010/11 might only have
graduated in 2011/12 but their success rate is presented relative to the year they entered. As such,
those entering in 2013/14 would most probably not have completed by the time this study was
conducted and no results can be presented for this year.
Completion rates for the 2010/11 and 2011/12 intake are at 66% to 68%, while in 2012/13 this
dropped to 44%. It is possible that data imported into the new MIS system, collected prior to its
creation, is more accurate than recent data. With the new MIS system, employers are requested to
update the completion status of learners themselves, and an estimated 25% of employers did not do
so in 2012 or 2013 when these learners completed.
Table 2: Completion rates of learners as recorded in MIS
2010/2011 2011/2012 2012/2013 Total
Achieved 66% 68% 44% 58%
Enrolled 34% 32% 56% 42%
The survey data collected by IQ Business from learnership students, show that 81% of learners who
started a course, completed the course they enrolled for, as opposed to terminating their studies
(excluding those still studying). Considering the pass rates of 68% in 2011/12 and the pass rate
claimed in the survey, IQ Business assumes therefore, that it is fair to approximate a pass rate of
between 70% and 80%.
The completion rate of an apprenticeship seems to be approximately 30% based on the MIS data.
Due to the long training period of an apprentice (three to four years), those entering apprenticeships
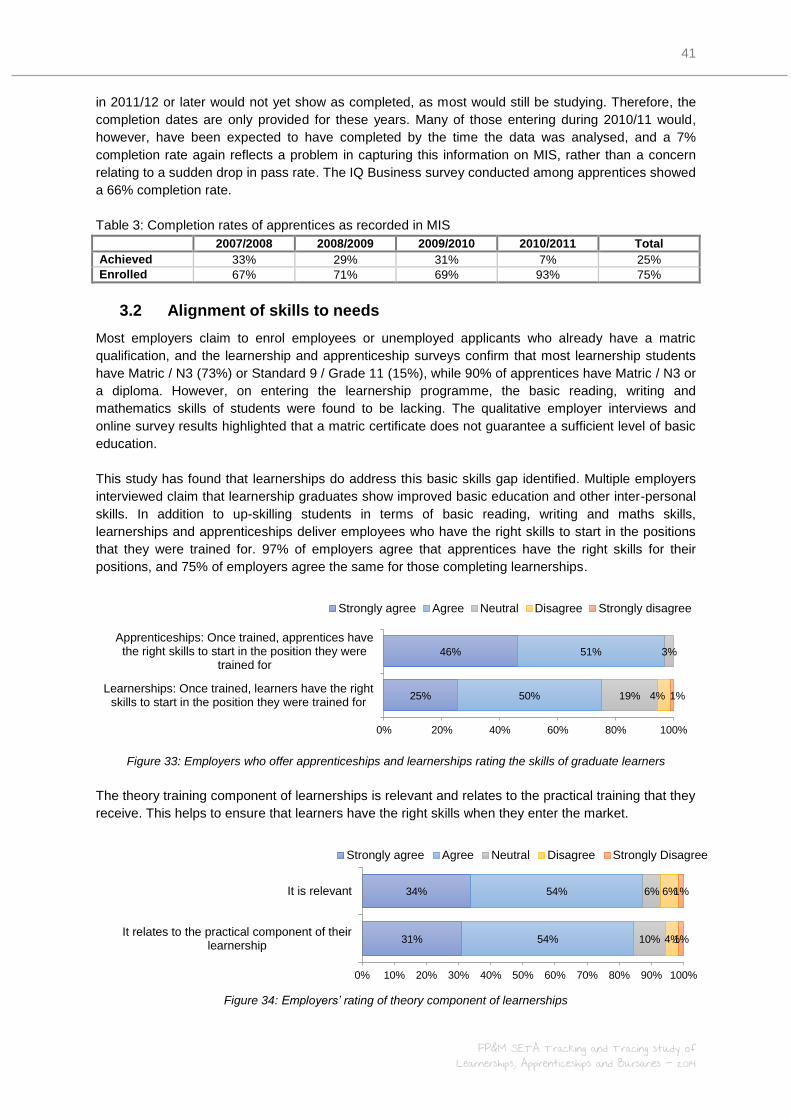
41
FP&M SETA Tracking and Tracing study of Learnerships, Apprenticeships and Bursaries - 2014
in 2011/12 or later would not yet show as completed, as most would still be studying. Therefore, the
completion dates are only provided for these years. Many of those entering during 2010/11 would,
however, have been expected to have completed by the time the data was analysed, and a 7%
completion rate again reflects a problem in capturing this information on MIS, rather than a concern
relating to a sudden drop in pass rate. The IQ Business survey conducted among apprentices showed
a 66% completion rate.
Table 3: Completion rates of apprentices as recorded in MIS
2007/2008 2008/2009 2009/2010 2010/2011 Total
Achieved 33% 29% 31% 7% 25%
Enrolled 67% 71% 69% 93% 75%
3.2 Alignment of skills to needs
Most employers claim to enrol employees or unemployed applicants who already have a matric
qualification, and the learnership and apprenticeship surveys confirm that most learnership students
have Matric / N3 (73%) or Standard 9 / Grade 11 (15%), while 90% of apprentices have Matric / N3 or
a diploma. However, on entering the learnership programme, the basic reading, writing and
mathematics skills of students were found to be lacking. The qualitative employer interviews and
online survey results highlighted that a matric certificate does not guarantee a sufficient level of basic
education.
This study has found that learnerships do address this basic skills gap identified. Multiple employers
interviewed claim that learnership graduates show improved basic education and other inter-personal
skills. In addition to up-skilling students in terms of basic reading, writing and maths skills,
learnerships and apprenticeships deliver employees who have the right skills to start in the positions
that they were trained for. 97% of employers agree that apprentices have the right skills for their
positions, and 75% of employers agree the same for those completing learnerships.
Figure 33: Employers who offer apprenticeships and learnerships rating the skills of graduate learners
The theory training component of learnerships is relevant and relates to the practical training that they
receive. This helps to ensure that learners have the right skills when they enter the market.
Figure 34: Employers’ rating of theory component of learnerships
25%
46%
50%
51%
19%
3%
4% 1%
0% 20% 40% 60% 80% 100%
Learnerships: Once trained, learners have the rightskills to start in the position they were trained for
Apprenticeships: Once trained, apprentices havethe right skills to start in the position they were
trained for
Strongly agree Agree Neutral Disagree Strongly disagree
31%
34%
54%
54%
10%
6%
4%
6%
1%
1%
0% 10% 20% 30% 40% 50% 60% 70% 80% 90% 100%
It relates to the practical component of theirlearnership
It is relevant
Strongly agree Agree Neutral Disagree Strongly Disagree
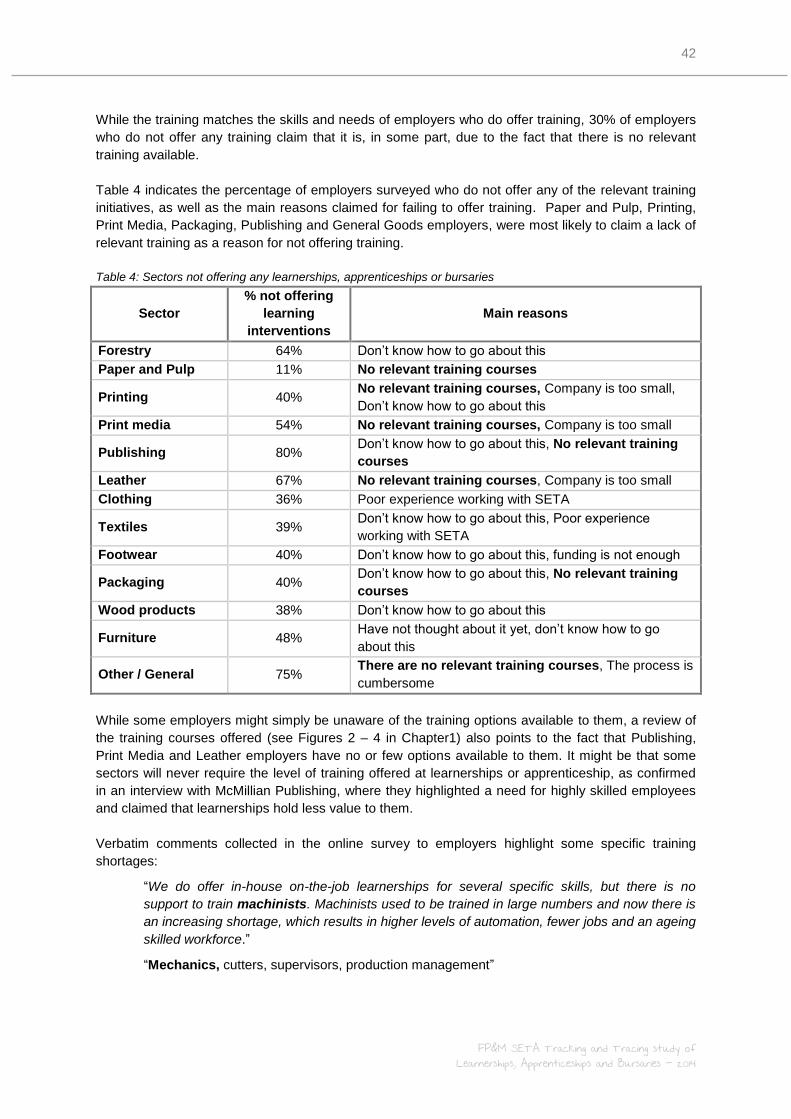
42
FP&M SETA Tracking and Tracing study of Learnerships, Apprenticeships and Bursaries - 2014
While the training matches the skills and needs of employers who do offer training, 30% of employers
who do not offer any training claim that it is, in some part, due to the fact that there is no relevant
training available.
Table 4 indicates the percentage of employers surveyed who do not offer any of the relevant training
initiatives, as well as the main reasons claimed for failing to offer training. Paper and Pulp, Printing,
Print Media, Packaging, Publishing and General Goods employers, were most likely to claim a lack of
relevant training as a reason for not offering training.
Table 4: Sectors not offering any learnerships, apprenticeships or bursaries
Sector
% not offering
learning
interventions
Main reasons
Forestry 64% Don’t know how to go about this
Paper and Pulp 11% No relevant training courses
Printing 40% No relevant training courses, Company is too small,
Don’t know how to go about this
Print media 54% No relevant training courses, Company is too small
Publishing 80% Don’t know how to go about this, No relevant training
courses
Leather 67% No relevant training courses, Company is too small
Clothing 36% Poor experience working with SETA
Textiles 39% Don’t know how to go about this, Poor experience
working with SETA
Footwear 40% Don’t know how to go about this, funding is not enough
Packaging 40% Don’t know how to go about this, No relevant training
courses
Wood products 38% Don’t know how to go about this
Furniture 48% Have not thought about it yet, don’t know how to go
about this
Other / General 75% There are no relevant training courses, The process is
cumbersome
While some employers might simply be unaware of the training options available to them, a review of
the training courses offered (see Figures 2 – 4 in Chapter1) also points to the fact that Publishing,
Print Media and Leather employers have no or few options available to them. It might be that some
sectors will never require the level of training offered at learnerships or apprenticeship, as confirmed
in an interview with McMillian Publishing, where they highlighted a need for highly skilled employees
and claimed that learnerships hold less value to them.
Verbatim comments collected in the online survey to employers highlight some specific training
shortages:
“We do offer in-house on-the-job learnerships for several specific skills, but there is no
support to train machinists. Machinists used to be trained in large numbers and now there is
an increasing shortage, which results in higher levels of automation, fewer jobs and an ageing
skilled workforce.”
“Mechanics, cutters, supervisors, production management”
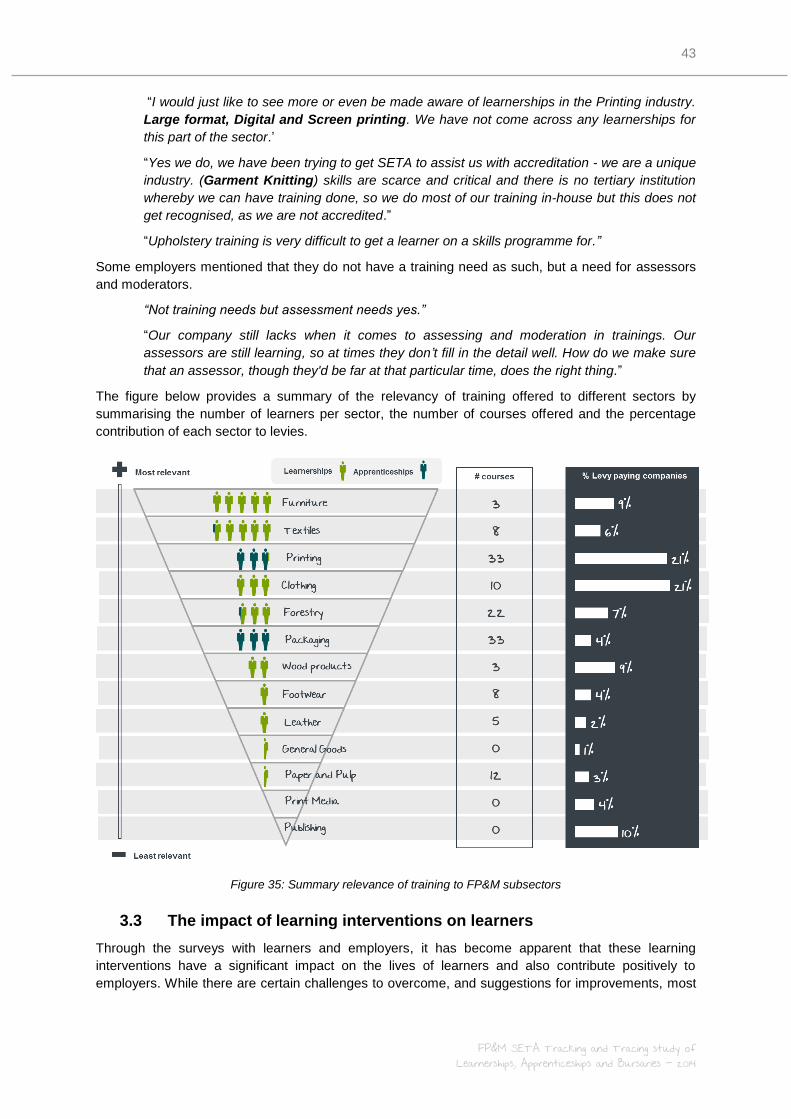
43
FP&M SETA Tracking and Tracing study of Learnerships, Apprenticeships and Bursaries - 2014
“I would just like to see more or even be made aware of learnerships in the Printing industry.
Large format, Digital and Screen printing. We have not come across any learnerships for
this part of the sector.’
“Yes we do, we have been trying to get SETA to assist us with accreditation - we are a unique
industry. (Garment Knitting) skills are scarce and critical and there is no tertiary institution
whereby we can have training done, so we do most of our training in-house but this does not
get recognised, as we are not accredited.”
“Upholstery training is very difficult to get a learner on a skills programme for.”
Some employers mentioned that they do not have a training need as such, but a need for assessors
and moderators.
“Not training needs but assessment needs yes.”
“Our company still lacks when it comes to assessing and moderation in trainings. Our
assessors are still learning, so at times they don’t fill in the detail well. How do we make sure
that an assessor, though they'd be far at that particular time, does the right thing.”
The figure below provides a summary of the relevancy of training offered to different sectors by
summarising the number of learners per sector, the number of courses offered and the percentage
contribution of each sector to levies.
Figure 35: Summary relevance of training to FP&M subsectors
3.3 The impact of learning interventions on learners
Through the surveys with learners and employers, it has become apparent that these learning
interventions have a significant impact on the lives of learners and also contribute positively to
employers. While there are certain challenges to overcome, and suggestions for improvements, most
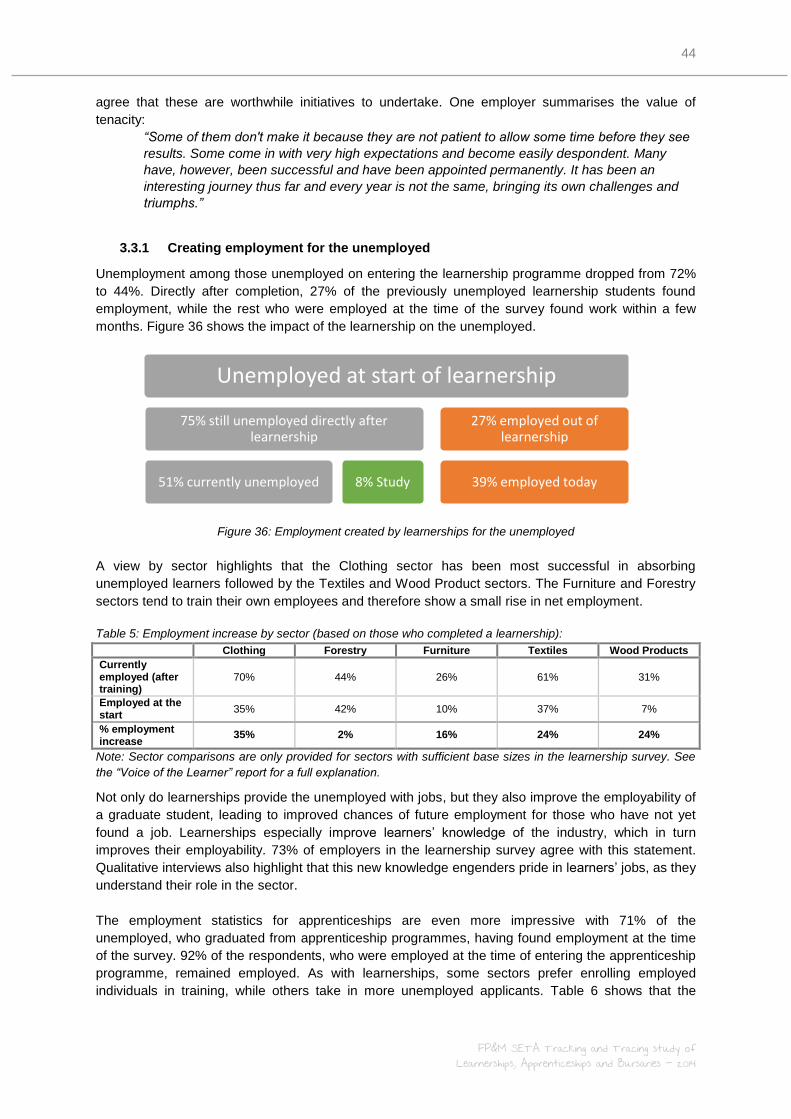
44
FP&M SETA Tracking and Tracing study of Learnerships, Apprenticeships and Bursaries - 2014
agree that these are worthwhile initiatives to undertake. One employer summarises the value of
tenacity:
“Some of them don't make it because they are not patient to allow some time before they see
results. Some come in with very high expectations and become easily despondent. Many
have, however, been successful and have been appointed permanently. It has been an
interesting journey thus far and every year is not the same, bringing its own challenges and
triumphs.”
3.3.1 Creating employment for the unemployed
Unemployment among those unemployed on entering the learnership programme dropped from 72%
to 44%. Directly after completion, 27% of the previously unemployed learnership students found
employment, while the rest who were employed at the time of the survey found work within a few
months. Figure 36 shows the impact of the learnership on the unemployed.
Figure 36: Employment created by learnerships for the unemployed
A view by sector highlights that the Clothing sector has been most successful in absorbing
unemployed learners followed by the Textiles and Wood Product sectors. The Furniture and Forestry
sectors tend to train their own employees and therefore show a small rise in net employment.
Table 5: Employment increase by sector (based on those who completed a learnership):
Clothing Forestry Furniture Textiles Wood Products
Currently employed (after training)
70% 44% 26% 61% 31%
Employed at the start
35% 42% 10% 37% 7%
% employment increase
35% 2% 16% 24% 24%
Note: Sector comparisons are only provided for sectors with sufficient base sizes in the learnership survey. See
the “Voice of the Learner” report for a full explanation.
Not only do learnerships provide the unemployed with jobs, but they also improve the employability of
a graduate student, leading to improved chances of future employment for those who have not yet
found a job. Learnerships especially improve learners’ knowledge of the industry, which in turn
improves their employability. 73% of employers in the learnership survey agree with this statement.
Qualitative interviews also highlight that this new knowledge engenders pride in learners’ jobs, as they
understand their role in the sector.
The employment statistics for apprenticeships are even more impressive with 71% of the
unemployed, who graduated from apprenticeship programmes, having found employment at the time
of the survey. 92% of the respondents, who were employed at the time of entering the apprenticeship
programme, remained employed. As with learnerships, some sectors prefer enrolling employed
individuals in training, while others take in more unemployed applicants. Table 6 shows that the
Unemployed at start of learnership
75% still unemployed directly after learnership
51% currently unemployed 8% Study
27% employed out of learnership
39% employed today
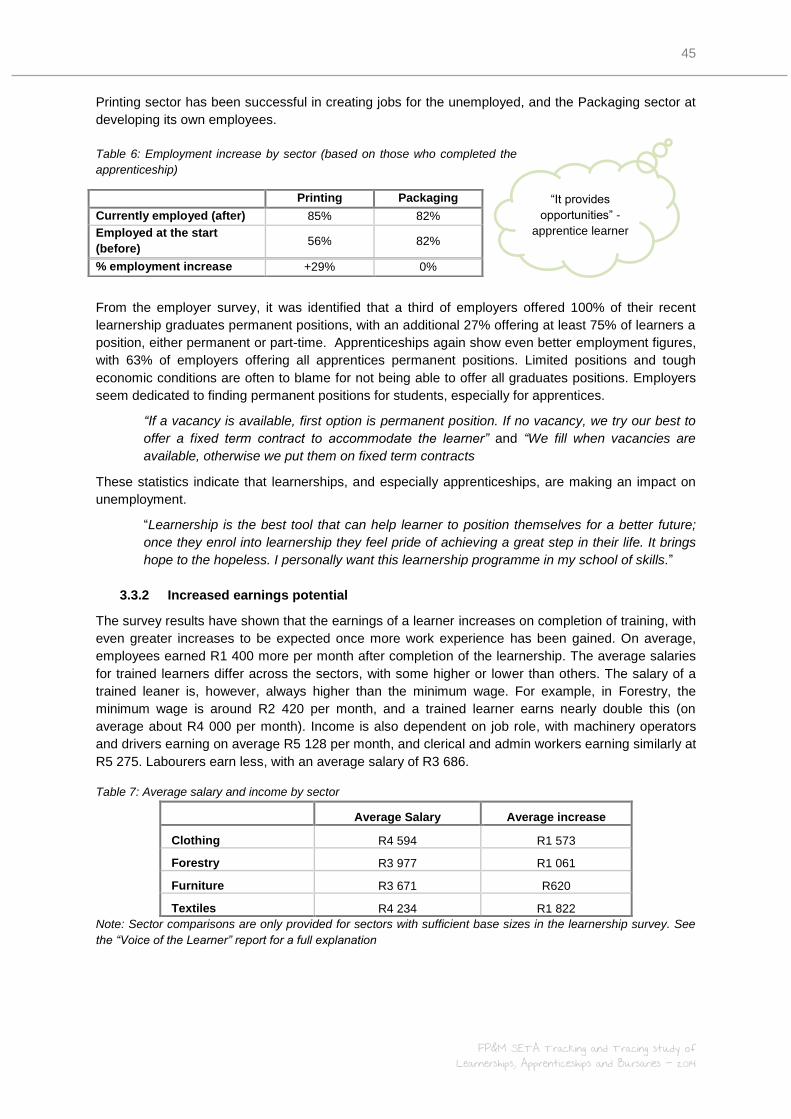
45
FP&M SETA Tracking and Tracing study of Learnerships, Apprenticeships and Bursaries - 2014
“It provides
opportunities” -
apprentice learner
Printing sector has been successful in creating jobs for the unemployed, and the Packaging sector at
developing its own employees.
Table 6: Employment increase by sector (based on those who completed the
apprenticeship)
From the employer survey, it was identified that a third of employers offered 100% of their recent
learnership graduates permanent positions, with an additional 27% offering at least 75% of learners a
position, either permanent or part-time. Apprenticeships again show even better employment figures,
with 63% of employers offering all apprentices permanent positions. Limited positions and tough
economic conditions are often to blame for not being able to offer all graduates positions. Employers
seem dedicated to finding permanent positions for students, especially for apprentices.
“If a vacancy is available, first option is permanent position. If no vacancy, we try our best to
offer a fixed term contract to accommodate the learner” and “We fill when vacancies are
available, otherwise we put them on fixed term contracts
These statistics indicate that learnerships, and especially apprenticeships, are making an impact on
unemployment.
“Learnership is the best tool that can help learner to position themselves for a better future;
once they enrol into learnership they feel pride of achieving a great step in their life. It brings
hope to the hopeless. I personally want this learnership programme in my school of skills.”
3.3.2 Increased earnings potential
The survey results have shown that the earnings of a learner increases on completion of training, with
even greater increases to be expected once more work experience has been gained. On average,
employees earned R1 400 more per month after completion of the learnership. The average salaries
for trained learners differ across the sectors, with some higher or lower than others. The salary of a
trained leaner is, however, always higher than the minimum wage. For example, in Forestry, the
minimum wage is around R2 420 per month, and a trained learner earns nearly double this (on
average about R4 000 per month). Income is also dependent on job role, with machinery operators
and drivers earning on average R5 128 per month, and clerical and admin workers earning similarly at
R5 275. Labourers earn less, with an average salary of R3 686.
Table 7: Average salary and income by sector
Average Salary Average increase
Clothing R4 594 R1 573
Forestry R3 977 R1 061
Furniture R3 671 R620
Textiles R4 234 R1 822
Note: Sector comparisons are only provided for sectors with sufficient base sizes in the learnership survey. See
the “Voice of the Learner” report for a full explanation
Printing Packaging
Currently employed (after) 85% 82%
Employed at the start
(before) 56% 82%
% employment increase +29% 0%
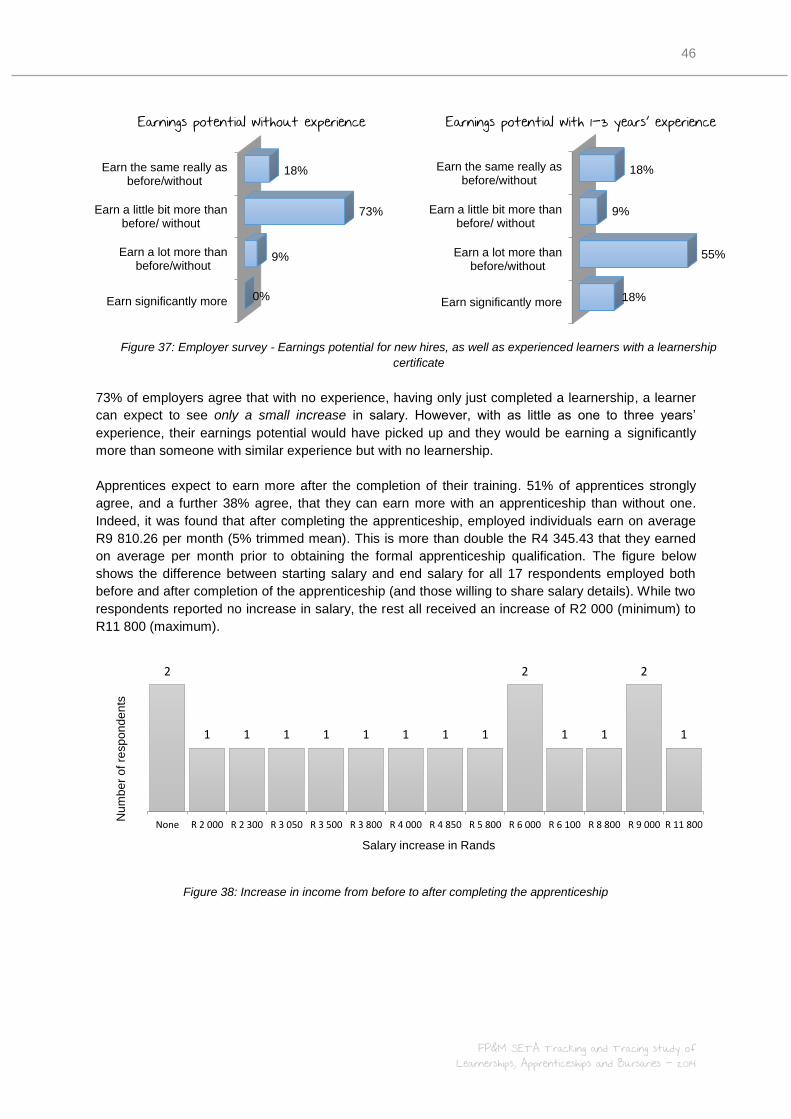
46
FP&M SETA Tracking and Tracing study of Learnerships, Apprenticeships and Bursaries - 2014
73% of employers agree that with no experience, having only just completed a learnership, a learner
can expect to see only a small increase in salary. However, with as little as one to three years’
experience, their earnings potential would have picked up and they would be earning a significantly
more than someone with similar experience but with no learnership.
Apprentices expect to earn more after the completion of their training. 51% of apprentices strongly
agree, and a further 38% agree, that they can earn more with an apprenticeship than without one.
Indeed, it was found that after completing the apprenticeship, employed individuals earn on average
R9 810.26 per month (5% trimmed mean). This is more than double the R4 345.43 that they earned
on average per month prior to obtaining the formal apprenticeship qualification. The figure below
shows the difference between starting salary and end salary for all 17 respondents employed both
before and after completion of the apprenticeship (and those willing to share salary details). While two
respondents reported no increase in salary, the rest all received an increase of R2 000 (minimum) to
R11 800 (maximum).
Figure 38: Increase in income from before to after completing the apprenticeship
2
1 1 1 1 1 1 1 1
2
1 1
2
1
None R 2 000 R 2 300 R 3 050 R 3 500 R 3 800 R 4 000 R 4 850 R 5 800 R 6 000 R 6 100 R 8 800 R 9 000 R 11 800
Num
be
r o
f re
sp
on
de
nts
Salary increase in Rands
Earn the same really asbefore/without
Earn a little bit more thanbefore/ without
Earn a lot more thanbefore/without
Earn significantly more
18%
73%
9%
0%
Earn the same really asbefore/without
Earn a little bit more thanbefore/ without
Earn a lot more thanbefore/without
Earn significantly more
18%
9%
55%
18%
Earnings potential without experience Earnings potential with 1-3 years’ experience
Figure 37: Employer survey - Earnings potential for new hires, as well as experienced learners with a learnership
certificate
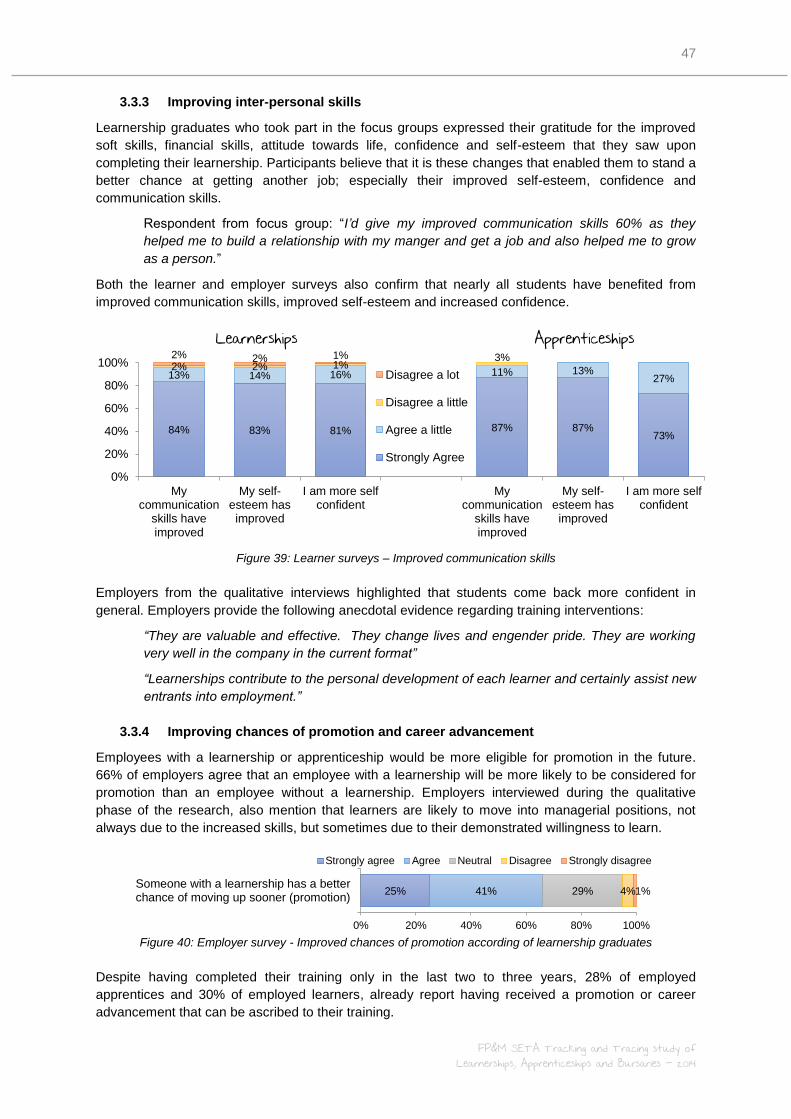
47
FP&M SETA Tracking and Tracing study of Learnerships, Apprenticeships and Bursaries - 2014
3.3.3 Improving inter-personal skills
Learnership graduates who took part in the focus groups expressed their gratitude for the improved
soft skills, financial skills, attitude towards life, confidence and self-esteem that they saw upon
completing their learnership. Participants believe that it is these changes that enabled them to stand a
better chance at getting another job; especially their improved self-esteem, confidence and
communication skills.
Respondent from focus group: “I’d give my improved communication skills 60% as they
helped me to build a relationship with my manger and get a job and also helped me to grow
as a person.”
Both the learner and employer surveys also confirm that nearly all students have benefited from
improved communication skills, improved self-esteem and increased confidence.
Figure 39: Learner surveys – Improved communication skills
Employers from the qualitative interviews highlighted that students come back more confident in
general. Employers provide the following anecdotal evidence regarding training interventions:
“They are valuable and effective. They change lives and engender pride. They are working
very well in the company in the current format”
“Learnerships contribute to the personal development of each learner and certainly assist new
entrants into employment.”
3.3.4 Improving chances of promotion and career advancement
Employees with a learnership or apprenticeship would be more eligible for promotion in the future.
66% of employers agree that an employee with a learnership will be more likely to be considered for
promotion than an employee without a learnership. Employers interviewed during the qualitative
phase of the research, also mention that learners are likely to move into managerial positions, not
always due to the increased skills, but sometimes due to their demonstrated willingness to learn.
Figure 40: Employer survey - Improved chances of promotion according of learnership graduates
Despite having completed their training only in the last two to three years, 28% of employed
apprentices and 30% of employed learners, already report having received a promotion or career
advancement that can be ascribed to their training.
84% 83% 81% 87% 87% 73%
13% 14% 16% 11% 13% 27%
2% 2% 1% 3% 2% 2% 1%
0%
20%
40%
60%
80%
100%
Mycommunication
skills haveimproved
My self-esteem hasimproved
I am more selfconfident
Mycommunication
skills haveimproved
My self-esteem hasimproved
I am more selfconfident
Disagree a lot
Disagree a little
Agree a little
Strongly Agree
Learnerships Apprenticeships
25% 41% 29% 4% 1%
0% 20% 40% 60% 80% 100%
Someone with a learnership has a betterchance of moving up sooner (promotion)
Strongly agree Agree Neutral Disagree Strongly disagree

48
FP&M SETA Tracking and Tracing study of Learnerships, Apprenticeships and Bursaries - 2014
Short skills courses
57%
Degree with a
university 19%
None of the above
16%
Short skills
courses 43%
Degree with a
university 7%
None of the
above 30%
3.3.5 Increased interest in future study and further improvement
Both apprenticeship and learnership students show an improved motivation towards future study. The
training initiatives have created a strong motivation in the majority of students to consider studying
further; 74% of apprentices strongly agree and 79% of learnership students strongly agree. The
majority of learners feel motivated to do short skills courses, and apprentices in particular are
considering university degrees.
Comments from the focus groups also highlight the importance of learnerships in creating motivation
for future study:
“It motivated me to rewrite matric and also proved that I am capable of achieving anything”
“It also did the same to me, I did my business management course and saw that I was just
lazy before the learnership”
3.3.6 Providing the disadvantaged with access to training
78% of employers from the learnership survey feel that one of the main advantages of the learnership
training programme is that it provides opportunities for people who would have had no other way of
accessing training.
“The Learnerships Training Programme is an opportunity for those who want to develop a skill
in our Clothing Sector and want to develop further in other positions within the Clothing
Sector, but also for the individual who can’t afford to study any further or the academic
dropouts that can develop themselves on a learnership programme.”
During the focus groups, participants indicated that if they had not taken the learnership opportunity,
they would have not achieved their personal goals and would have perhaps still been looking for work
that is not related to a particular career or still stuck in an underpaying job.
3.3.7 Learning skills that can assist in self-employment
Entrepreneurial activity does not appear to be reaching its full potential, with only 4% of apprentices
and 2% of learnership graduates moving into self-employment after completing their training.
Comments from the focus groups, however, provide some insight into how skills obtained on the
learnership could potentially help unemployed learners earn an income. One participant made matric
dance dresses for her local community, while another fixes computers. Many could therefore be
involved in activities to earn extra money.
Certificate or diploma (12%)
Certificate or diploma (20%)
Figure 41: Learner Surveys: Impact of training initiatives on the motivation to further studies
Learnerships Apprenticeships
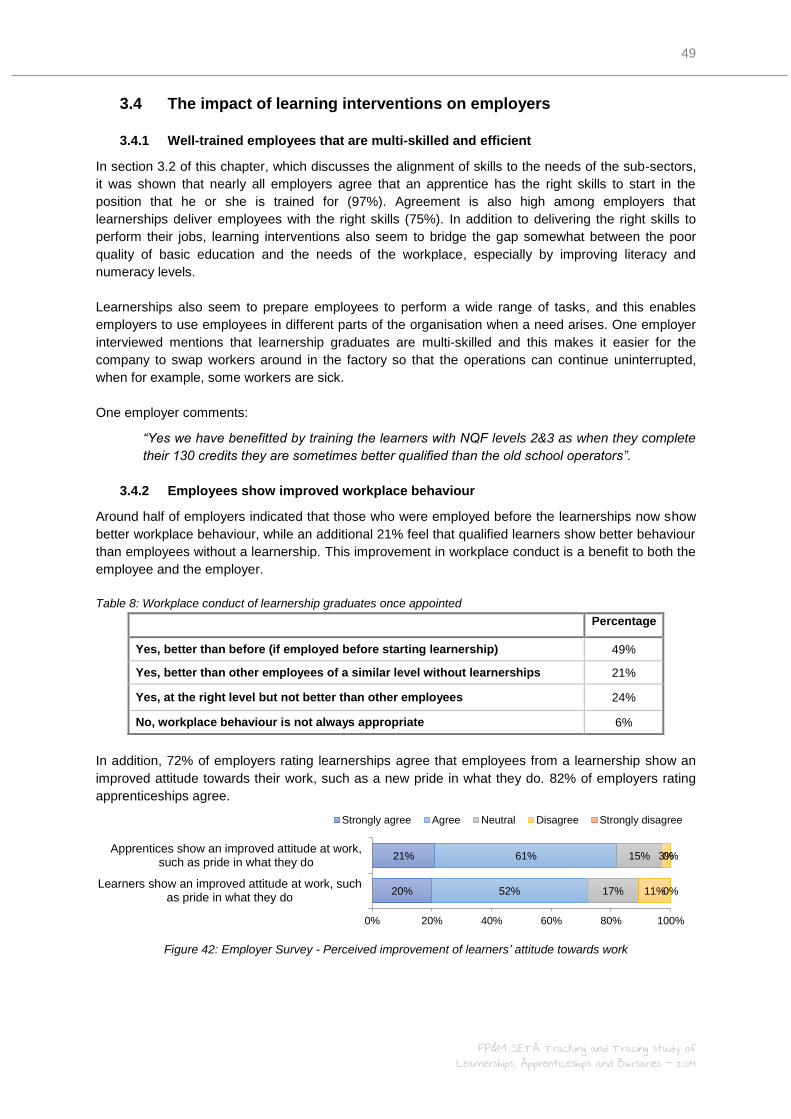
49
FP&M SETA Tracking and Tracing study of Learnerships, Apprenticeships and Bursaries - 2014
3.4 The impact of learning interventions on employers
3.4.1 Well-trained employees that are multi-skilled and efficient
In section 3.2 of this chapter, which discusses the alignment of skills to the needs of the sub-sectors,
it was shown that nearly all employers agree that an apprentice has the right skills to start in the
position that he or she is trained for (97%). Agreement is also high among employers that
learnerships deliver employees with the right skills (75%). In addition to delivering the right skills to
perform their jobs, learning interventions also seem to bridge the gap somewhat between the poor
quality of basic education and the needs of the workplace, especially by improving literacy and
numeracy levels.
Learnerships also seem to prepare employees to perform a wide range of tasks, and this enables
employers to use employees in different parts of the organisation when a need arises. One employer
interviewed mentions that learnership graduates are multi-skilled and this makes it easier for the
company to swap workers around in the factory so that the operations can continue uninterrupted,
when for example, some workers are sick.
One employer comments:
“Yes we have benefitted by training the learners with NQF levels 2&3 as when they complete
their 130 credits they are sometimes better qualified than the old school operators”.
3.4.2 Employees show improved workplace behaviour
Around half of employers indicated that those who were employed before the learnerships now show
better workplace behaviour, while an additional 21% feel that qualified learners show better behaviour
than employees without a learnership. This improvement in workplace conduct is a benefit to both the
employee and the employer.
Table 8: Workplace conduct of learnership graduates once appointed
Percentage
Yes, better than before (if employed before starting learnership) 49%
Yes, better than other employees of a similar level without learnerships 21%
Yes, at the right level but not better than other employees 24%
No, workplace behaviour is not always appropriate 6%
In addition, 72% of employers rating learnerships agree that employees from a learnership show an
improved attitude towards their work, such as a new pride in what they do. 82% of employers rating
apprenticeships agree.
Figure 42: Employer Survey - Perceived improvement of learners’ attitude towards work
20%
21%
52%
61%
17%
15%
11%
3%
0%
0%
0% 20% 40% 60% 80% 100%
Learners show an improved attitude at work, suchas pride in what they do
Apprentices show an improved attitude at work,such as pride in what they do
Strongly agree Agree Neutral Disagree Strongly disagree
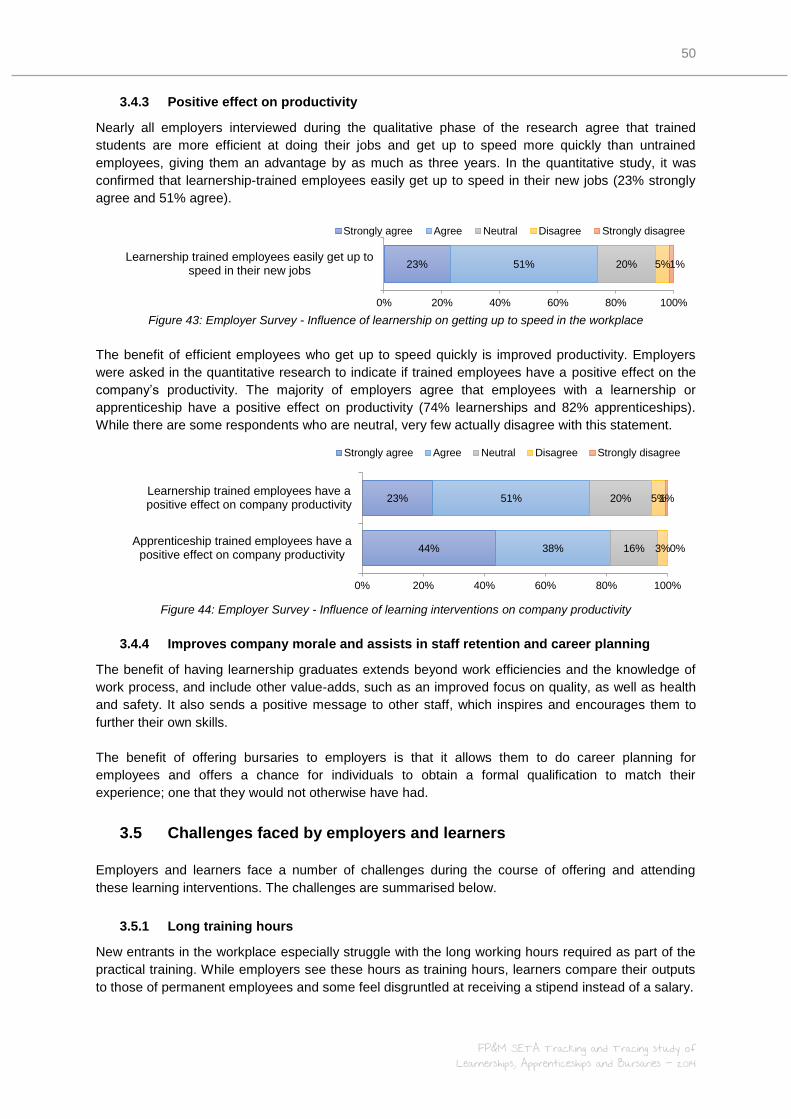
50
FP&M SETA Tracking and Tracing study of Learnerships, Apprenticeships and Bursaries - 2014
3.4.3 Positive effect on productivity
Nearly all employers interviewed during the qualitative phase of the research agree that trained
students are more efficient at doing their jobs and get up to speed more quickly than untrained
employees, giving them an advantage by as much as three years. In the quantitative study, it was
confirmed that learnership-trained employees easily get up to speed in their new jobs (23% strongly
agree and 51% agree).
Figure 43: Employer Survey - Influence of learnership on getting up to speed in the workplace
The benefit of efficient employees who get up to speed quickly is improved productivity. Employers
were asked in the quantitative research to indicate if trained employees have a positive effect on the
company’s productivity. The majority of employers agree that employees with a learnership or
apprenticeship have a positive effect on productivity (74% learnerships and 82% apprenticeships).
While there are some respondents who are neutral, very few actually disagree with this statement.
Figure 44: Employer Survey - Influence of learning interventions on company productivity
3.4.4 Improves company morale and assists in staff retention and career planning
The benefit of having learnership graduates extends beyond work efficiencies and the knowledge of
work process, and include other value-adds, such as an improved focus on quality, as well as health
and safety. It also sends a positive message to other staff, which inspires and encourages them to
further their own skills.
The benefit of offering bursaries to employers is that it allows them to do career planning for
employees and offers a chance for individuals to obtain a formal qualification to match their
experience; one that they would not otherwise have had.
3.5 Challenges faced by employers and learners
Employers and learners face a number of challenges during the course of offering and attending
these learning interventions. The challenges are summarised below.
3.5.1 Long training hours
New entrants in the workplace especially struggle with the long working hours required as part of the
practical training. While employers see these hours as training hours, learners compare their outputs
to those of permanent employees and some feel disgruntled at receiving a stipend instead of a salary.
23% 51% 20% 5% 1%
0% 20% 40% 60% 80% 100%
Learnership trained employees easily get up tospeed in their new jobs
Strongly agree Agree Neutral Disagree Strongly disagree
44%
23%
38%
51%
16%
20%
3%
5%
0%
1%
0% 20% 40% 60% 80% 100%
Apprenticeship trained employees have apositive effect on company productivity
Learnership trained employees have apositive effect on company productivity
Strongly agree Agree Neutral Disagree Strongly disagree
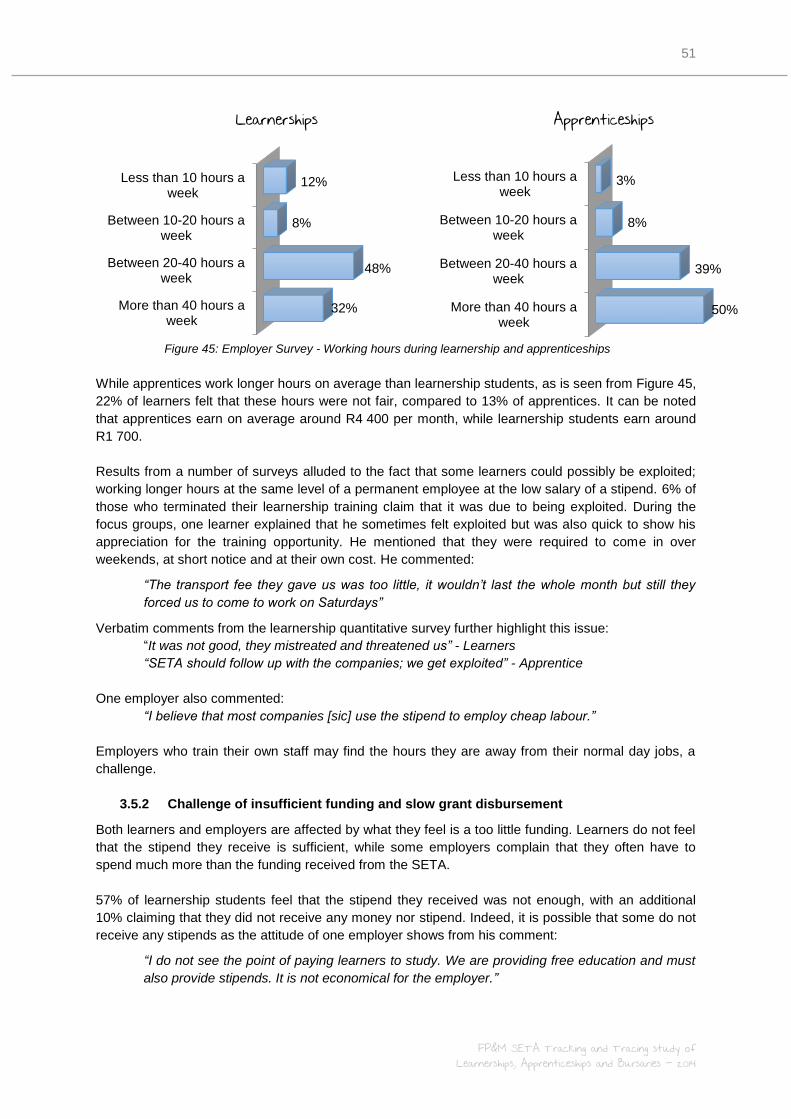
51
FP&M SETA Tracking and Tracing study of Learnerships, Apprenticeships and Bursaries - 2014
While apprentices work longer hours on average than learnership students, as is seen from Figure 45,
22% of learners felt that these hours were not fair, compared to 13% of apprentices. It can be noted
that apprentices earn on average around R4 400 per month, while learnership students earn around
R1 700.
Results from a number of surveys alluded to the fact that some learners could possibly be exploited;
working longer hours at the same level of a permanent employee at the low salary of a stipend. 6% of
those who terminated their learnership training claim that it was due to being exploited. During the
focus groups, one learner explained that he sometimes felt exploited but was also quick to show his
appreciation for the training opportunity. He mentioned that they were required to come in over
weekends, at short notice and at their own cost. He commented:
“The transport fee they gave us was too little, it wouldn’t last the whole month but still they
forced us to come to work on Saturdays”
Verbatim comments from the learnership quantitative survey further highlight this issue:
“It was not good, they mistreated and threatened us” - Learners
“SETA should follow up with the companies; we get exploited” - Apprentice
One employer also commented:
“I believe that most companies [sic] use the stipend to employ cheap labour.”
Employers who train their own staff may find the hours they are away from their normal day jobs, a
challenge.
3.5.2 Challenge of insufficient funding and slow grant disbursement
Both learners and employers are affected by what they feel is a too little funding. Learners do not feel
that the stipend they receive is sufficient, while some employers complain that they often have to
spend much more than the funding received from the SETA.
57% of learnership students feel that the stipend they received was not enough, with an additional
10% claiming that they did not receive any money nor stipend. Indeed, it is possible that some do not
receive any stipends as the attitude of one employer shows from his comment:
“I do not see the point of paying learners to study. We are providing free education and must
also provide stipends. It is not economical for the employer.”
Less than 10 hours aweek
Between 10-20 hours aweek
Between 20-40 hours aweek
More than 40 hours aweek
12%
8%
48%
32%
Less than 10 hours aweek
Between 10-20 hours aweek
Between 20-40 hours aweek
More than 40 hours aweek
3%
8%
39%
50%
Learnerships Apprenticeships
Figure 45: Employer Survey - Working hours during learnership and apprenticeships
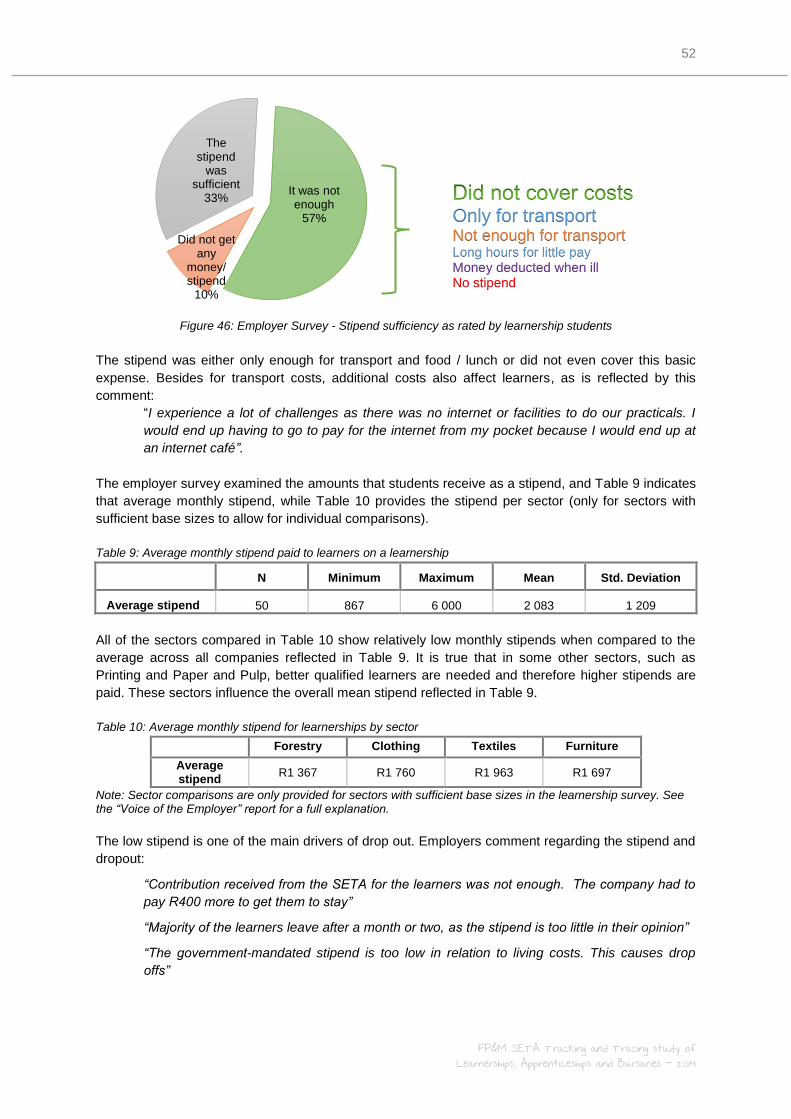
52
FP&M SETA Tracking and Tracing study of Learnerships, Apprenticeships and Bursaries - 2014
Figure 46: Employer Survey - Stipend sufficiency as rated by learnership students
The stipend was either only enough for transport and food / lunch or did not even cover this basic
expense. Besides for transport costs, additional costs also affect learners, as is reflected by this
comment:
“I experience a lot of challenges as there was no internet or facilities to do our practicals. I
would end up having to go to pay for the internet from my pocket because I would end up at
an internet café”.
The employer survey examined the amounts that students receive as a stipend, and Table 9 indicates
that average monthly stipend, while Table 10 provides the stipend per sector (only for sectors with
sufficient base sizes to allow for individual comparisons).
Table 9: Average monthly stipend paid to learners on a learnership
N Minimum Maximum Mean Std. Deviation
Average stipend 50 867 6 000 2 083 1 209
All of the sectors compared in Table 10 show relatively low monthly stipends when compared to the
average across all companies reflected in Table 9. It is true that in some other sectors, such as
Printing and Paper and Pulp, better qualified learners are needed and therefore higher stipends are
paid. These sectors influence the overall mean stipend reflected in Table 9.
Table 10: Average monthly stipend for learnerships by sector
Forestry Clothing Textiles Furniture
Average stipend
R1 367 R1 760 R1 963 R1 697
Note: Sector comparisons are only provided for sectors with sufficient base sizes in the learnership survey. See the “Voice of the Employer” report for a full explanation.
The low stipend is one of the main drivers of drop out. Employers comment regarding the stipend and
dropout:
“Contribution received from the SETA for the learners was not enough. The company had to
pay R400 more to get them to stay”
“Majority of the learners leave after a month or two, as the stipend is too little in their opinion”
“The government-mandated stipend is too low in relation to living costs. This causes drop
offs”
The stipend
was sufficient
33% It was not enough
57%
Did not get any
money/ stipend
10%
Only for transport Not enough for transport Long hours for little pay Money deducted when ill No stipend

53
FP&M SETA Tracking and Tracing study of Learnerships, Apprenticeships and Bursaries - 2014
“We lose most of our excellent 18.2 learners for the stipend is too little for time period on the
Learnership Training Programme. Unless the Training Provider uses initiative to increase the
stipend while the learner progresses in his/her practical training.”
“We recruit learners with degrees into our programmes because of the level of work. The
industry is a very skills-intensive industry. If [sic] could pay at least R5000 in accordance with
their qualification that will also motivate learners. R2000 is simply just too little for a person
with a degree”
One employer highlights that sometimes the learners do not use the stipend for its intended purposes
due to poverty and need:
“I believe that most learners are attracted by the stipend. Whilst the purpose of the stipend is
to provide learners with the means to travel to work and to buy food, in most cases it is used
to support their families.”
It is not only learners who appear to suffer from too little funding, but employers also feel that the
funding is insufficient. 71% of those offering learnerships list this as one the main challenges they
face in delivering training. One employer explains:
“It is great to have and adds value but is costly on the company's side in terms of budget i.e.
Stipend / Facilitators / Resources / Administration, etc. which outweighs the funding. Also with
18.2 Learners, after completion they leave to find other jobs in other sectors.”
In addition to finding the funding insufficient, employers are also challenged by slow grant
disbursement, which affects their cash flow. Smaller employers in particular find it difficult to carry the
cost of training while waiting for funding to be paid over.
3.5.3 Challenge of slow and inefficient communication with FP&M SETA
The most frequently mentioned challenge from the qualitative interviews with employers is that of slow
and inefficient communication from the SETA on queries. The companies highlight the following
communication issues in particular:
Difficult to make contact and to get in touch with the correct persons.
FP&M SETA is slow to respond to queries.
Too many processes involved. Everything needs to be simplified.
Related to the need for improved communication, is the need for clarity on notices of information
sessions, and official lists of training providers and courses.
3.5.4 Lack of training providers in certain geographic areas
Particularly in some sectors, companies are challenged by a lack of available training providers close
by. For example, Forestry plantations are located equally in Mpumalanga and KwaZulu-Natal, yet
there are not enough training providers in Mpumalanga. Forestry companies in Mpumalanga opt to
send their learners to KwaZulu-Natal, which incurs further cost to the company.
3.5.5 Approving training
A large number of companies who took part in the employer survey feel that the SETA fails to
recognise the training that they do, or that they should receive funding to do training, but are refused.
Some feel that this is due to bias or even misconduct by the SETA. A few comments that relate to this
issue are presented below as illustration:
“Please look at honest companies who actually make use of all funding constructively. We are
a company providing employment to 1000s. We train mostly youth and disabled yet are never
54
FP&M SETA Tracking and Tracing study of Learnerships, Apprenticeships and Bursaries - 2014
recognised by the SETA. We have received no funding for 2015 learnerships and feel that
SETA are biased.”
“We are a company that has always complied with all FPM regulations. We spend millions
worth of rands every year training unemployed, youth, women and disabled people yet the
FPM SETA fails to recognise our organisation. 2014 DG grant applications were disappointing
and employees feel demotivated.”
“We are accredited for FLC training programmes and wish to roll-out these programmes
within the FP&M SETA as there is a great need for FLC training. During the April funding
window we applied for funding to provide FLC training programmes, but the application were
declined. We would like to request the FP&M SETA to approve funding for FLC training.”
“We have a fully equipped training centre with qualified staff, with no learnerships to run”
While some employers are not approved for training at all, some feel that they go through
considerable effort, only to receive a small number of approvals.
“The SETA Opens the DG Window and advertise just to find that the approvals are so few
due to budget, an abundance of work done by the companies and the approvals were so
poor, no need for all that work if there are budget constraints, why advertise for all those
applications?”
3.5.6 Certification
The study has brought to light that many learners are not receiving their certificates due slow or no
action taken by employers in populating completion data on the new FP&M MIS system and other
procedural problems. 46% of graduate from learnership programs claim to not have received a
certificate. Verbatim comments suggest that not being able to produce a certificate makes it hard for
job seekers to prove that they have done the learnership. Employment figures for learnerships would
most likely once the certificates reach graduates promptly. This issue is now being addressed through
pro-active interventions to address the backlog as well as to avoid a repeat in future.
3.6 Suggestions for improvement
3.6.1 Suggestions for changes in funding structures and payment of stipends
Employers make the following suggestions for improving the funding structure / stipend system:
Consider the nature of the course when funding, not only the number of credits
“Funding needs to be realistic to the courses offered. Should you get a grant for the
unemployed they need to consider transport, possible housing equipment and PPE needed to
be given the candidates, not just the number of credits the course offers for the funding.”
Consider increasing the stipend from theory to practical training, or at set times during the
training
“Yes the stipend passed by law is too low and does not cover the learners’ bus fares etc., as a
result learners do not accept it. With the Company paying R700 p/week, the wage cost actually
exceeds the SETA Funding drastically.”
“We pay them R1500/month when they are doing the theory part of the learnership and
R7000/month when they do the practical training.”
“We pay an hourly rate of 13.20 and increase it 3 times during the learnership, upon completion of
elective outcome 1, 2 and 3. We give a completion bonus of R1000-00 to those who graduate.”
55
FP&M SETA Tracking and Tracing study of Learnerships, Apprenticeships and Bursaries - 2014
An increase, or bonus, might be a solution to those experiencing dropout during practical
work
“They also drop out when they start with their practical on the production floor, where they have to
do the same work as the qualified machinists, but get paid less.”
3.6.2 Improvements to the grants application process
Many employers find the grants application process slow, with too much paperwork. The new MIS
system is recognised as improving the process somewhat, yet not all employers are using this system
yet.
“The new MIS system is working well.”
“I think the discretionary grant application process has greatly improved, however the
paperwork is a killer!”
“The grant application window needs to be open for longer”
“Must improve turnaround time in processing claims”
“Timing of allocations needs to be synchronized with calendar year”
The SETA can consider leaving the grant window open for longer or completely reviewing the new
windows in consultation with stakeholders:
“FP&M SETA must engage with its stakeholders as the new window will not accommodate
our printing and packaging sector.”
Clear guidance is needed on what documentation is needed during the grants process:
“The SETA needs to have payments processed on time and most importantly advise correctly
on the documentation required to avoid tranche payments being processed. Example: I was
advised that all my learners must complete FPM SETA learner contracts. It took me 3 months
to get these documents sorted only to be told that for bursaries they do not have to complete
this document.
“We need the SETA personnel to come and visit us and train us to do the correct thing. We
ask for help but don’t get any.”
In addition to adjustments to the grants application process, the SETA could also consider improving
efforts to educate employers who have never offered training before. A lack of knowledge on the
process and the available training was provided as the main reasons why companies do not offer
training.
3.6.3 Assist smaller companies
22% of employers who have not offered training through the SETA over the past few years said that it
was attributed to the company being too small to offer training. Smaller businesses find it hard to
comply with the criteria, as well as managing all the paper work. A number of smaller companies
would like to offer training but make the following suggestions for improvements:
“Make it easy for small businesses. We just don't have time to deal with all the paper work
and admin. Submitting the Workplace Skills plan is time consuming enough.”
“The company is too small. Time management: it seems like a lot of work and almost need to employ someone to help with implementing a WSP. We are a small company of 20-30 employers. Would just not be cost effective for me to employ someone to implement a WSP”

56
FP&M SETA Tracking and Tracing study of Learnerships, Apprenticeships and Bursaries - 2014
3.6.4 Consider supporting more rural areas
There is a call for more grants to be paid to companies in rural areas.
“The discretionary grant funding should not be disbursed based on urban and traditional
beneficiaries. I recommend more organisations in the poor provinces such as Limpopo should
be given special preference. There are limited opportunities in poor provinces. Also
discretionary grants should not be based on levy payment organisations at the expense of
NGO that are basically working in the poor rural areas which do not pay levies by nature of
their business.”
“Give preference to rural companies and give continuous support”
“SETA should also consider small, emerging and rural based companies than putting large
amounts to big companies in metros”
57
FP&M SETA Tracking and Tracing study of Learnerships, Apprenticeships and Bursaries - 2014
Chapter 4 Key Trends and Challenges
For Education and FP&M Sub-sectors
1. Objective The objective of this section is to address the study’s aim of understanding key trends and
opportunities in the FP&M sub-sectors.
2. Methodology Secondary research, also known as desk research, was conducted to understand the trends and
opportunities for the FP&M sub-sectors. Secondary research involves the summary, collation and
synthesis of existing research. In the case of the Tracking and Tracing study, secondary research was
utilised to gain further insights into the 13 industries in which FP&M SETA operates. Various industry
analyst commentaries and discussion papers were researched, as well as recent news articles on the
relevant industries. This enabled the researcher to get a sense of the challenges and opportunities
that these industries are currently facing.
This secondary analysis included a review of the education sector in South Africa and other relevant
information that might inform skills planning or the interpretation of information in this report.
This chapter provides a brief summary of what is presented in more detail in Appendix 2, as well as in
six separate reports, profiling the FP&M subsectors in more detail. (Available as separate documents)
3. The South African educational context According to the Michael and Susan Dell Foundation, barely one in ten students qualify for university
and only 5% graduate in South Africa (Michael and Susan Dell Foundation, 2014). Throughput rates
indicate that fewer than five South Africans in 100 who enrol in Grade One of schooling, graduate
from university. This problem is particularly serious for disadvantaged students: only 28% of students
in the National Student Financial Aid Scheme of South Africa (NSFAS) end up graduating (Govender,
2013). This places a much higher importance on the SETAs role in the development of skills, and the
intervention they have to offer, in working towards supplementing the existing institutions and
providing learners with alternative opportunities through the education system and into the labour
market.
The figure below depicts, the change in the highest level of education received per population group
looking at those aged between 18 and 24 for the period 2002 to 2012. The figure shows that the
percentage of Black Africans who hold incomplete secondary school has remained relatively constant
over this period, while the percentage that completed secondary and post-school education has
increased. Among the highest percentage of the population who completed secondary school and
post-school and lowest incomplete secondary school, is the Indian/Asian population group and White
population group. (The complete data set can be found in the in appendix 2.) (StatsSA, 2013)
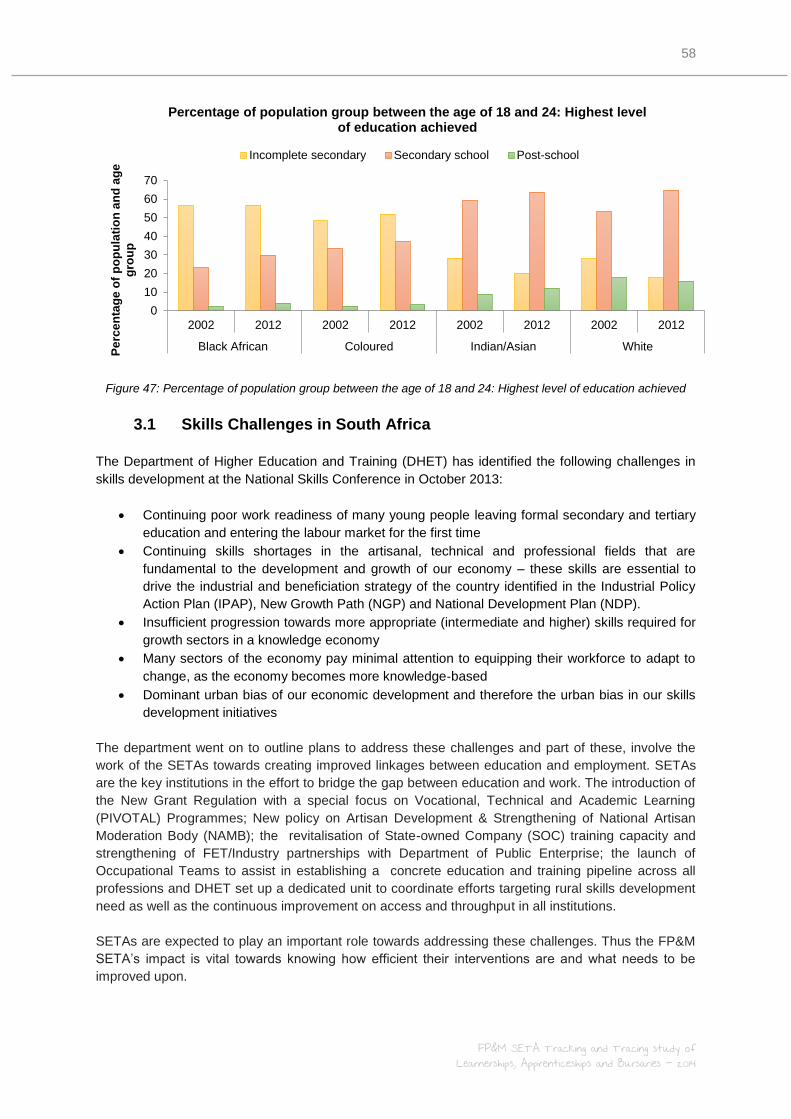
58
FP&M SETA Tracking and Tracing study of Learnerships, Apprenticeships and Bursaries - 2014
Figure 47: Percentage of population group between the age of 18 and 24: Highest level of education achieved
3.1 Skills Challenges in South Africa
The Department of Higher Education and Training (DHET) has identified the following challenges in
skills development at the National Skills Conference in October 2013:
Continuing poor work readiness of many young people leaving formal secondary and tertiary
education and entering the labour market for the first time
Continuing skills shortages in the artisanal, technical and professional fields that are
fundamental to the development and growth of our economy – these skills are essential to
drive the industrial and beneficiation strategy of the country identified in the Industrial Policy
Action Plan (IPAP), New Growth Path (NGP) and National Development Plan (NDP).
Insufficient progression towards more appropriate (intermediate and higher) skills required for
growth sectors in a knowledge economy
Many sectors of the economy pay minimal attention to equipping their workforce to adapt to
change, as the economy becomes more knowledge‐based
Dominant urban bias of our economic development and therefore the urban bias in our skills
development initiatives
The department went on to outline plans to address these challenges and part of these, involve the
work of the SETAs towards creating improved linkages between education and employment. SETAs
are the key institutions in the effort to bridge the gap between education and work. The introduction of
the New Grant Regulation with a special focus on Vocational, Technical and Academic Learning
(PIVOTAL) Programmes; New policy on Artisan Development & Strengthening of National Artisan
Moderation Body (NAMB); the revitalisation of State-owned Company (SOC) training capacity and
strengthening of FET/Industry partnerships with Department of Public Enterprise; the launch of
Occupational Teams to assist in establishing a concrete education and training pipeline across all
professions and DHET set up a dedicated unit to coordinate efforts targeting rural skills development
need as well as the continuous improvement on access and throughput in all institutions.
SETAs are expected to play an important role towards addressing these challenges. Thus the FP&M
SETA’s impact is vital towards knowing how efficient their interventions are and what needs to be
improved upon.
0
10
20
30
40
50
60
70
2002 2012 2002 2012 2002 2012 2002 2012
Black African Coloured Indian/Asian White
Pe
rce
nta
ge
of
po
pu
lati
on
an
d a
ge
g
rou
p
Percentage of population group between the age of 18 and 24: Highest level of education achieved
Incomplete secondary Secondary school Post-school
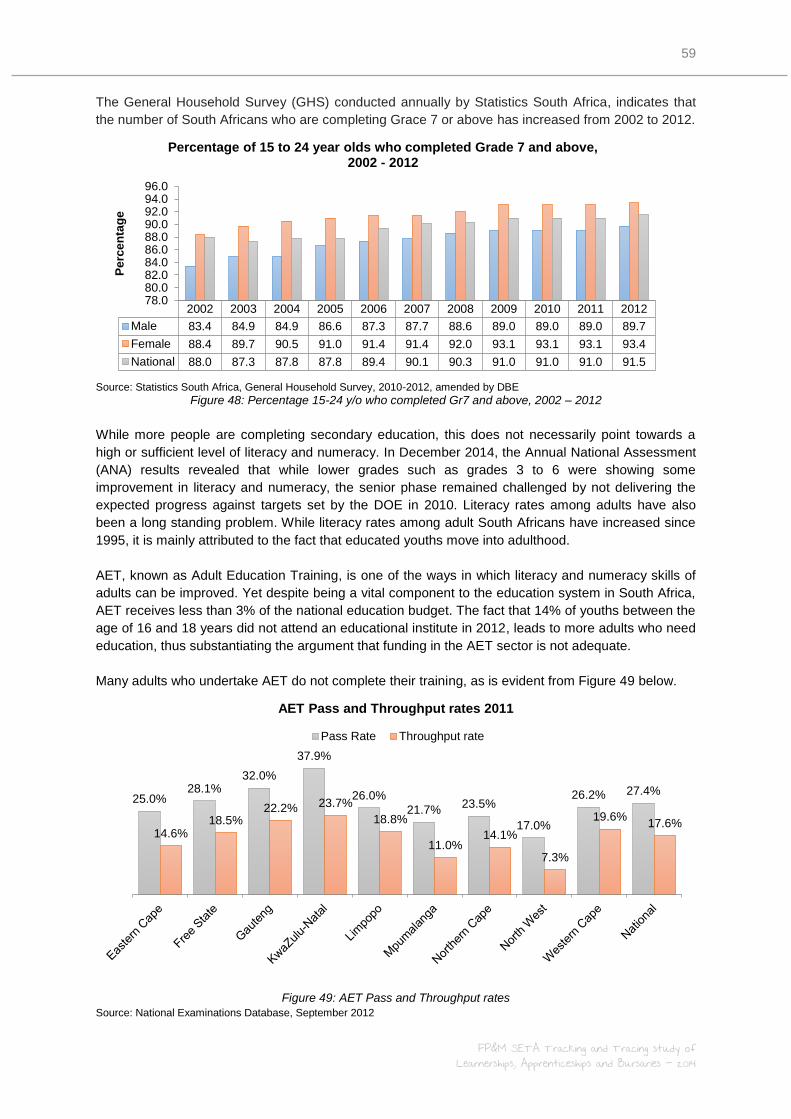
59
FP&M SETA Tracking and Tracing study of Learnerships, Apprenticeships and Bursaries - 2014
The General Household Survey (GHS) conducted annually by Statistics South Africa, indicates that
the number of South Africans who are completing Grace 7 or above has increased from 2002 to 2012.
Source: Statistics South Africa, General Household Survey, 2010-2012, amended by DBE
Figure 48: Percentage 15-24 y/o who completed Gr7 and above, 2002 – 2012
While more people are completing secondary education, this does not necessarily point towards a
high or sufficient level of literacy and numeracy. In December 2014, the Annual National Assessment
(ANA) results revealed that while lower grades such as grades 3 to 6 were showing some
improvement in literacy and numeracy, the senior phase remained challenged by not delivering the
expected progress against targets set by the DOE in 2010. Literacy rates among adults have also
been a long standing problem. While literacy rates among adult South Africans have increased since
1995, it is mainly attributed to the fact that educated youths move into adulthood.
AET, known as Adult Education Training, is one of the ways in which literacy and numeracy skills of
adults can be improved. Yet despite being a vital component to the education system in South Africa,
AET receives less than 3% of the national education budget. The fact that 14% of youths between the
age of 16 and 18 years did not attend an educational institute in 2012, leads to more adults who need
education, thus substantiating the argument that funding in the AET sector is not adequate.
Many adults who undertake AET do not complete their training, as is evident from Figure 49 below.
Figure 49: AET Pass and Throughput rates
Source: National Examinations Database, September 2012
2002 2003 2004 2005 2006 2007 2008 2009 2010 2011 2012
Male 83.4 84.9 84.9 86.6 87.3 87.7 88.6 89.0 89.0 89.0 89.7
Female 88.4 89.7 90.5 91.0 91.4 91.4 92.0 93.1 93.1 93.1 93.4
National 88.0 87.3 87.8 87.8 89.4 90.1 90.3 91.0 91.0 91.0 91.5
78.080.082.084.086.088.090.092.094.096.0
Pe
rce
nta
ge
Percentage of 15 to 24 year olds who completed Grade 7 and above, 2002 - 2012
25.0% 28.1%
32.0%
37.9%
26.0%
21.7% 23.5%
17.0%
26.2% 27.4%
14.6% 18.5%
22.2% 23.7%
18.8%
11.0% 14.1%
7.3%
19.6% 17.6%
AET Pass and Throughput rates 2011
Pass Rate Throughput rate

60
FP&M SETA Tracking and Tracing study of Learnerships, Apprenticeships and Bursaries - 2014
Learnerships have been found to assist in improving the basic education levels of learners, such as
improved numeracy and literacy, and are therefore assisting in meeting the objectives of improving
the basic level of education of adults, even among those with matric certificates.
Low levels of, or insufficient, education is linked to unemployed and a mismatch between skills and
the requirements of employers. In a survey done by African Economic Outlook (AEO), 54% of
respondents reported a mismatch of skills between what job seekers have to offer and what
employers require.
The General Household Survey of 2012, conducted by StatsSA, shows that the main cause of non-
attendance of educational institutes is lack of money in order to cover fees. When these youths are
sent to an educational institute, the main problem at the schools is a lack of books.
Repeaters are mainly seen in the Grade 10 phase of a school career, with 22% of enrolled students
repeating in 2012. Grade 11 follows at 20% of enrolled students repeating. The students doing
learnerships also complain, in particular, about the pressure of a low stipend and a lack of money is
one of the main reasons for drop-out. Employers in the FP&M subsectors also highlight the fact that
due to the poverty that some learners live in, they simply have to use the stipend to sustain
themselves and their families and then do not have enough for transport and other requirements of
the course.
The shape of the post-secondary education sector is set out by the Centre for Higher Education and
Training (CHET) as in the figure below, with an inverted triangle shape. The inverted triangle shape of
the post-secondary education sector in South Africa is not conducive to narrowing the skills shortage,
and the focus should be on creating quality opportunities for youth in the college space to rectify the
shape.
A few factors to consider within the inverted shape:
When the shape is inverted, it is a clear indication that College is not an appropriate
alternative for students who seek further education and only a few accept the alternative.
There are not enough places available for new students in the university space to absorb the
more than 2.7 million students who are not in an educational institute or training and
unemployed. The College space should be geared to absorb most of these students.
The University space is over capacity and quality suffers.
The focus should be to create quality opportunities in the College space.
Source: CHET, 2013
Figure 50: Post-secondary education sector
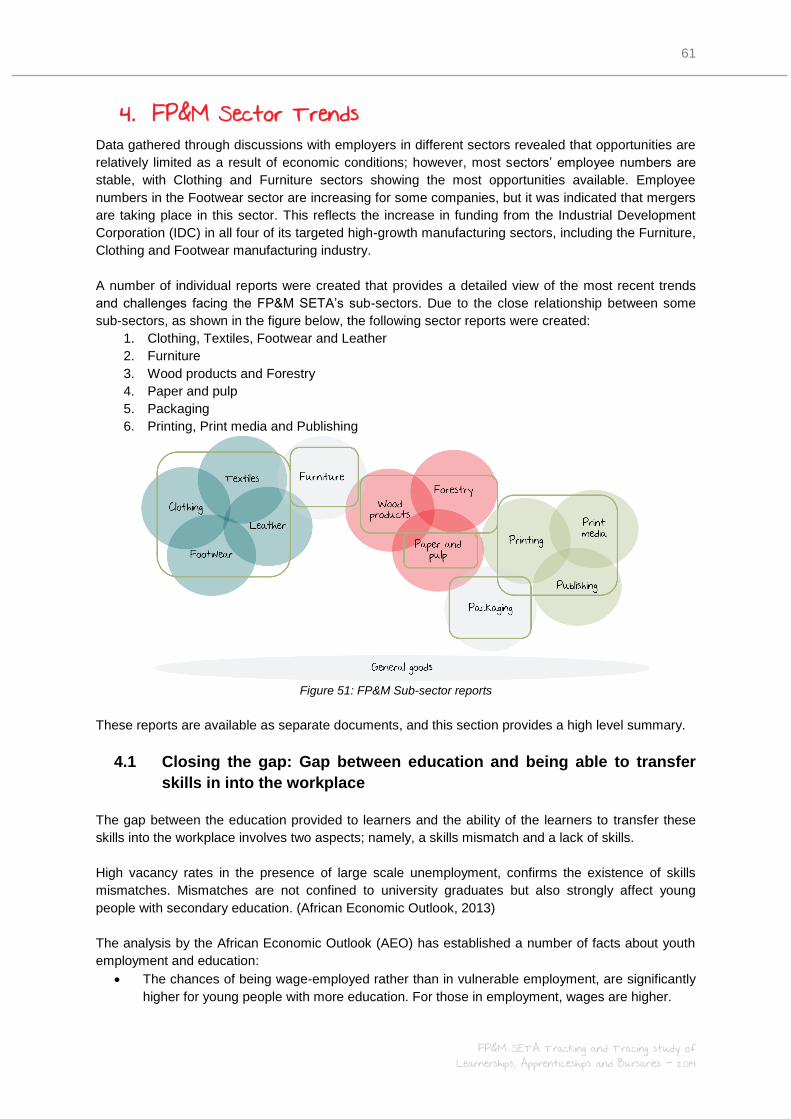
61
FP&M SETA Tracking and Tracing study of Learnerships, Apprenticeships and Bursaries - 2014
4. FP&M Sector Trends Data gathered through discussions with employers in different sectors revealed that opportunities are
relatively limited as a result of economic conditions; however, most sectors’ employee numbers are
stable, with Clothing and Furniture sectors showing the most opportunities available. Employee
numbers in the Footwear sector are increasing for some companies, but it was indicated that mergers
are taking place in this sector. This reflects the increase in funding from the Industrial Development
Corporation (IDC) in all four of its targeted high-growth manufacturing sectors, including the Furniture,
Clothing and Footwear manufacturing industry.
A number of individual reports were created that provides a detailed view of the most recent trends
and challenges facing the FP&M SETA’s sub-sectors. Due to the close relationship between some
sub-sectors, as shown in the figure below, the following sector reports were created:
1. Clothing, Textiles, Footwear and Leather
2. Furniture
3. Wood products and Forestry
4. Paper and pulp
5. Packaging
6. Printing, Print media and Publishing
Figure 51: FP&M Sub-sector reports
These reports are available as separate documents, and this section provides a high level summary.
4.1 Closing the gap: Gap between education and being able to transfer
skills in into the workplace
The gap between the education provided to learners and the ability of the learners to transfer these
skills into the workplace involves two aspects; namely, a skills mismatch and a lack of skills.
High vacancy rates in the presence of large scale unemployment, confirms the existence of skills
mismatches. Mismatches are not confined to university graduates but also strongly affect young
people with secondary education. (African Economic Outlook, 2013)
The analysis by the African Economic Outlook (AEO) has established a number of facts about youth
employment and education:
The chances of being wage-employed rather than in vulnerable employment, are significantly
higher for young people with more education. For those in employment, wages are higher.
62
FP&M SETA Tracking and Tracing study of Learnerships, Apprenticeships and Bursaries - 2014
Higher education is linked to higher unemployment among young people but lower
unemployment among adults.
Among those with higher education, the unemployment rate varies by type of educational
degree.
Young people with education face a higher likelihood of unemployment and discouragement
in Medium Income Countries (MICs) than in Low Income Countries (LICs).
Discouragement and being out of the labour force are higher among young people with no, or
only a little, education. Overall, not in employment, education or training (NEET) rates are
lowest among young people with tertiary education.
The analysis suggests that much unemployment and even discouragement, observed among
educated young people, are largely transitory phenomena and the result of the better-off
queuing for good jobs. However, the length of this transition, which can often take many
years, and the strong link between field of study and unemployment rate, suggest a serious
mismatch between the skills that young people bring with them when they leave the education
system and those that are sought after in labour markets.
4.2 Trends in the sub-sectors
As the FP&M SETA’s sectors are closely related, there are common threads among the trends in
these sub-sectors.
The most consistent factor that affects any business, is the impact of the economic downturn. As the
disposable income of consumers comes under pressure, the demand for non-essential goods
declines – seen especially in the Furniture sector. Consumers turn to imported, low cost goods that
put more pressure on the manufacturing companies of South Africa.
Companies are dealing with the rising costs of doing business, with energy costs especially impacting
profits. Most companies resort to a focus on cost management, others import goods and there are
some that revert to a quick turnaround time to boost business. Quick turnarounds are achieved by
sourcing some resources locally, which has a positive impact on the South African economy, but
turnaround times are also achieved through innovation and technology. Many a time individual jobs
are replaced by machines that improve the cost efficiency, speed of manufacturing and quality of
products – this has a large negative impact on the communities who rely on this source of income for
survival.
General growth can be seen in these sectors where private companies and government push funding
into expansions and improvements. Examples thereof are:
The IDC has increased funding levels in all four of its targeted high-growth manufacturing
sectors, including the Furniture, Clothing and Footwear manufacturing industry.
Clothing:
o R25 million clothing design centre by Trade Core Investments Apparel clothing
factory in Epping.
o IDC’s investment in fast fashion (quick turnaround times) and government’s
preferential procurement opportunities.
o Government’s CTC Programme’s support to address product design, hardware and
capital equipment needs.
“Conscious”, “responsible” and “sustainable” are key words in the manufacturing sectors. Global
awareness of the impact that humanity has on the planet is ever increasing and companies are
required by social and legal standards to ensure that operations have a positive effect on the
environment. The Forestry, Wood Products, Paper and Pulp, and Packaging sector are heavily
affected by these requirements. Forestry, being a long term investment and a high impact sector, has
63
FP&M SETA Tracking and Tracing study of Learnerships, Apprenticeships and Bursaries - 2014
immense requirements to practice responsible and sustainable forestry with resource efficacy. The
impact of irresponsible operations is felt not only in local communities, but also on long term economic
growth, biodiversity and nature.
Regulation in terms of fair and proper social responsibility is a top priority in the manufacturing sector.
Workers are entitled to reasonable wages and working environments. All the sectors have workers’
unions available to them to make their voices heard.
4.3 Challenges in the sub-sectors
The largest challenge impacting the manufacturing sector is the rising cost of doing business.
Increasing labour and licencing costs, as well as infrastructure upkeep puts pressure on businesses.
Other challenges include increased regulations around health and safety in the workplace. Trade
unions and strikes are a threat to these sectors’ profitability, while skills shortages loom in the
background. Technological efficiencies are curbing some of the impact of rising labour costs, but have
had a negative effect on communities and ordinary South Africans. In the print media sector,
technological advances are a large threat to business.
The depletion of natural resources in Forestry is of course a challenge, as is water pollution, poorly
developed infrastructure, and a changing workforce. Manufacturing is a labour intensive environment
and with the rural population declining due to urbanisation, young, skilled workers are hard to find.
Companies are therefore challenged by their ageing workforce.
Sub-sectors of the FP&M SETA are mainly high investment industries where large amounts of capital
are needed to initiate operations, such as in the Packaging sector. The exception is the Furniture
sector, that is among the lowest capital investment sectors, where the cost to create one job averages
at R20 000. This causes high structural barriers to entry in these sectors and many Small, Medium
and Micro-Enterprises (SMME) do not survive in this environment.
4.4 Drivers for change in the sub-sectors
Factors that drive change in the sub-sectors are, among others:
Technology
Competitiveness
The need to be efficient and sustainable
Requirement of quality and reliable products and service
Responsibility to reduce poverty and unemployment
New investment opportunities and government support programmes
Fraud, corruption and illegal imports drive regulatory change
Electricity shortages drive alternative energy sources (biomass-based energy in Pulp and
Paper)
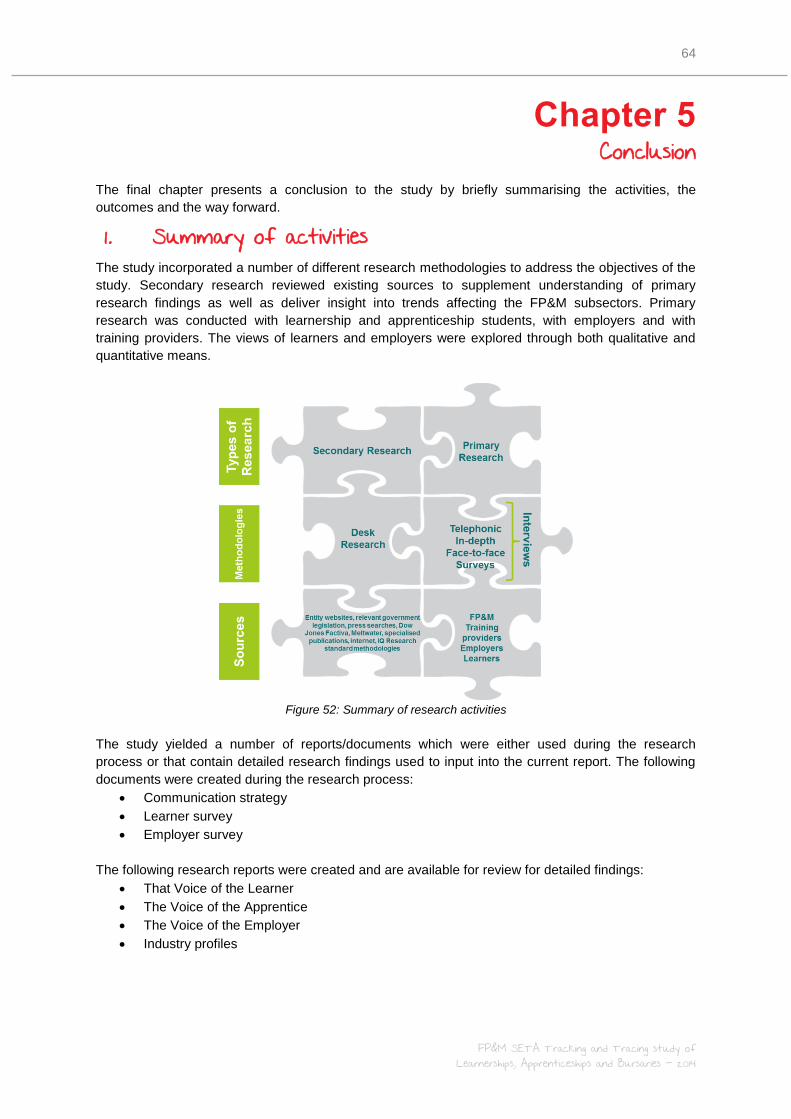
64
FP&M SETA Tracking and Tracing study of Learnerships, Apprenticeships and Bursaries - 2014
Chapter 5 Conclusion
The final chapter presents a conclusion to the study by briefly summarising the activities, the
outcomes and the way forward.
1. Summary of activities The study incorporated a number of different research methodologies to address the objectives of the
study. Secondary research reviewed existing sources to supplement understanding of primary
research findings as well as deliver insight into trends affecting the FP&M subsectors. Primary
research was conducted with learnership and apprenticeship students, with employers and with
training providers. The views of learners and employers were explored through both qualitative and
quantitative means.
Figure 52: Summary of research activities
The study yielded a number of reports/documents which were either used during the research
process or that contain detailed research findings used to input into the current report. The following
documents were created during the research process:
Communication strategy
Learner survey
Employer survey
The following research reports were created and are available for review for detailed findings:
That Voice of the Learner
The Voice of the Apprentice
The Voice of the Employer
Industry profiles
65
FP&M SETA Tracking and Tracing study of Learnerships, Apprenticeships and Bursaries - 2014
2. Conclusions SETAs play a major role in the implementation of the National Skills Development Strategy as they
aim to reverse the country’s skills crisis and thereby address the plight of the millions of youth who are
not in employment, education or training. Much criticism has been levelled at SETAS for being
ineffective. In 2012 only 6 of the 21 SETAs received clean audit reports. Many critics say the SETAs'
effect on the economy to date has been minuscule (Karl Gernetzky, Business Day, August 2012). A
main concern often cited is a lack of follow follow-throughs by the SETAS to determine whether
learners, who had been supported with skills development levies, have since been employed. As a
consequence, the impact of projects being implemented by the SETAs cannot be seen (Nkosi, Mail
and Gaurdian, 20 August 2014).
The current study aims to shed light on the employment of learners from the programs and the impact
that the interventions have on the lives of learners. The study results found that employment
opportunities are being created, although the desired rate of employment is not yet achieved.
Focussing on learnerships, 27% of the unemployed (18.2 learners) were employed directly out of the
learnership, yet the employment percentage rose to 39% after a few months. Additionally 8% of the
unemployed have chosen to further their formal studies. As a result, unemployment was halved for
those unemployed prior to doing a learnership. Apprenticeships are even more effective at creating
employment; 71% of unemployed apprentices were employed at the time of the survey. Employees
with learnerships tend to stay with their employers for a long time, indicating that employment is
sustainable
These training initiatives of course also benefit employed individuals. The research results found
evidence that the income potential and career prospects of an employee with a learnership increases,
significantly so for artisans. The training interventions have also been found to improve the soft skills
of learners, such as confidence and communication skills. Improved levels of basic reading and
writing skills have been observed by employers, filling the gaps often experienced when hiring
employees with a matric qualification. Not only learners, but also employers benefit from the training.
Employers report increased productivity and better workplace behaviour from trained employees.
While learnerships and apprenticeships undoubtedly deliver value, the FP&M SETA is faced with the
need to improve certain processes and customer services aspects. Most improvement areas have
already been identified and their route course identified, mostly stemming from the fairly recent
amalgamation in 2011. Continuous efforts are in place to improve, including the introduction of a new
business model.
3. The way forward From the research process as well as the research results, recommendations for consideration have
been formulated. The recommendations relate to FP&M SETA processes and customer satisfaction,
possible improvements to the training interventions.
Review of databases and data collection processes
The MIS system provides process improvements and employers are seeing the value. The FP&M
SETA should consider increasing the speed at which it is adopted as to move away from using the old
and the new system simultaneously. The SETA would benefit from a dedicated data manager tasked
with ensuring an effective change management process. A data manager could also review the
current processes for collecting and holding student data in light of the new PoPI (Protection of
Personal Information) act. The SETA might be at risk of breaching the act.
66
FP&M SETA Tracking and Tracing study of Learnerships, Apprenticeships and Bursaries - 2014
Adopt a clear definition and approach to industry classification, should reporting be
required at industry level
The research process highlighted that there is no single field in the learner data– in either the MIS or
SQMR - that links a learner directly to an industry. Industry classification has to be deduced from a
number of other variables and there are often inconsistencies or missing data hampering the process.
During the process it also emerged that many employers have a presence in multiple industries and
would not be accurate to label all of their activities into one industry. Therefore a classification system
needs to be developed that is sensitive to multiple operations.
Prioritise the issuing of certificates, with follow-up procedures to ensure receipt by
learners
The FP&M SETA should consider further investigation of the process followed to issue certificates to
learners with the goal of highlight any areas that could be hindering the process. Learners who are
not employed after the learnership might lose touch with the employer after leaving the company and
the SETA should consider a system of delivering the certificates to learners directly, as opposed via
the employers, or, at the very least, following up directly with learners on the receipt of their
certificates.
The SETA might consider investigating the reasons why certain courses have low
attendances, and whether it is economically advisable to continue to offer these.
The SETA could benefit from improving the transparency of grant approvals
Small and rural enterprises could benefit from additional support. While many are
ignorant of the process, others simply do not qualify. They do however operate in
areas where possible learners could benefit greatly from an opportunity at training.
A review of internal processes could be considered, where an improvement would
result in a reduction in administration. Likewise, a review of current communication
structures could results in improved communication with stakeholders.

67
FP&M SETA Tracking and Tracing study of Learnerships, Apprenticeships and Bursaries - 2014
APPENDIX APPENDIX 1: Codes from MIS database The following code descriptions were received from FP&M SETA.
Figure 53: Data code classifications
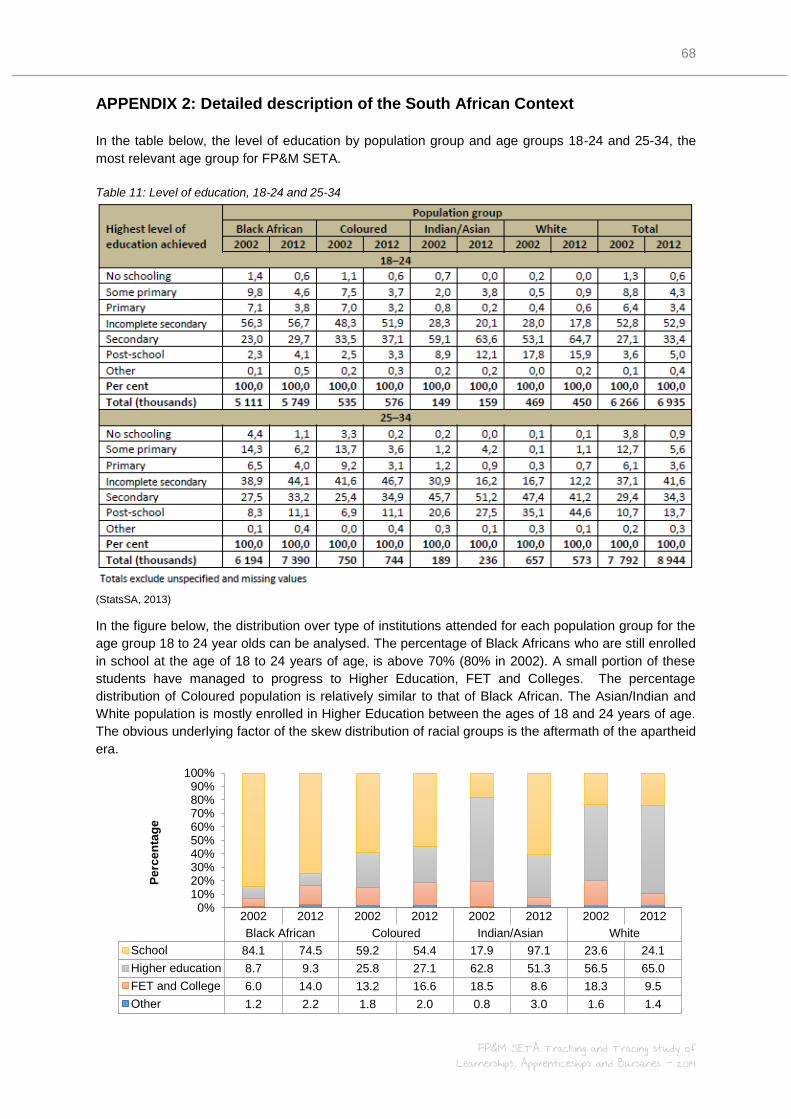
68
FP&M SETA Tracking and Tracing study of Learnerships, Apprenticeships and Bursaries - 2014
APPENDIX 2: Detailed description of the South African Context
In the table below, the level of education by population group and age groups 18-24 and 25-34, the
most relevant age group for FP&M SETA.
Table 11: Level of education, 18-24 and 25-34
(StatsSA, 2013)
In the figure below, the distribution over type of institutions attended for each population group for the
age group 18 to 24 year olds can be analysed. The percentage of Black Africans who are still enrolled
in school at the age of 18 to 24 years of age, is above 70% (80% in 2002). A small portion of these
students have managed to progress to Higher Education, FET and Colleges. The percentage
distribution of Coloured population is relatively similar to that of Black African. The Asian/Indian and
White population is mostly enrolled in Higher Education between the ages of 18 and 24 years of age.
The obvious underlying factor of the skew distribution of racial groups is the aftermath of the apartheid
era.
2002 2012 2002 2012 2002 2012 2002 2012
Black African Coloured Indian/Asian White
School 84.1 74.5 59.2 54.4 17.9 97.1 23.6 24.1
Higher education 8.7 9.3 25.8 27.1 62.8 51.3 56.5 65.0
FET and College 6.0 14.0 13.2 16.6 18.5 8.6 18.3 9.5
Other 1.2 2.2 1.8 2.0 0.8 3.0 1.6 1.4
0%10%20%30%40%50%60%70%80%90%
100%
Pe
rce
nta
ge
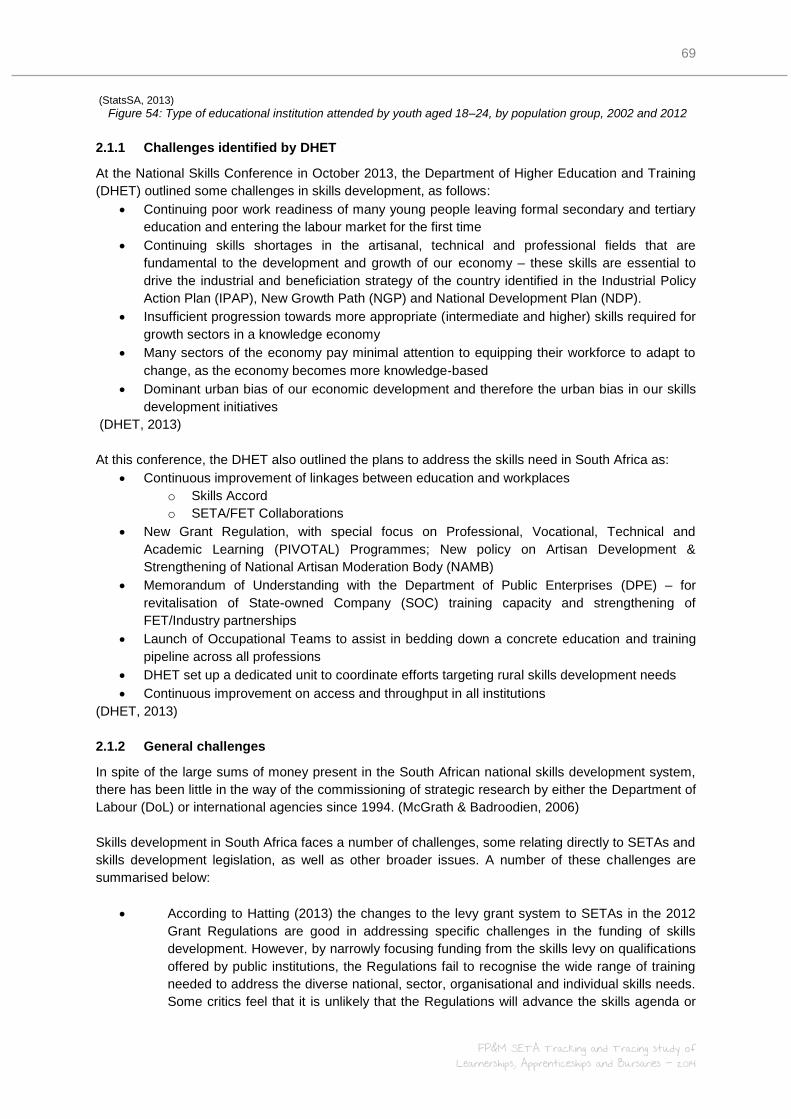
69
FP&M SETA Tracking and Tracing study of Learnerships, Apprenticeships and Bursaries - 2014
(StatsSA, 2013)
Figure 54: Type of educational institution attended by youth aged 18–24, by population group, 2002 and 2012
2.1.1 Challenges identified by DHET
At the National Skills Conference in October 2013, the Department of Higher Education and Training
(DHET) outlined some challenges in skills development, as follows:
Continuing poor work readiness of many young people leaving formal secondary and tertiary
education and entering the labour market for the first time
Continuing skills shortages in the artisanal, technical and professional fields that are
fundamental to the development and growth of our economy – these skills are essential to
drive the industrial and beneficiation strategy of the country identified in the Industrial Policy
Action Plan (IPAP), New Growth Path (NGP) and National Development Plan (NDP).
Insufficient progression towards more appropriate (intermediate and higher) skills required for
growth sectors in a knowledge economy
Many sectors of the economy pay minimal attention to equipping their workforce to adapt to
change, as the economy becomes more knowledge‐based
Dominant urban bias of our economic development and therefore the urban bias in our skills
development initiatives
(DHET, 2013)
At this conference, the DHET also outlined the plans to address the skills need in South Africa as:
Continuous improvement of linkages between education and workplaces
o Skills Accord
o SETA/FET Collaborations
New Grant Regulation, with special focus on Professional, Vocational, Technical and
Academic Learning (PIVOTAL) Programmes; New policy on Artisan Development &
Strengthening of National Artisan Moderation Body (NAMB)
Memorandum of Understanding with the Department of Public Enterprises (DPE) – for
revitalisation of State-owned Company (SOC) training capacity and strengthening of
FET/Industry partnerships
Launch of Occupational Teams to assist in bedding down a concrete education and training
pipeline across all professions
DHET set up a dedicated unit to coordinate efforts targeting rural skills development needs
Continuous improvement on access and throughput in all institutions
(DHET, 2013)
2.1.2 General challenges
In spite of the large sums of money present in the South African national skills development system,
there has been little in the way of the commissioning of strategic research by either the Department of
Labour (DoL) or international agencies since 1994. (McGrath & Badroodien, 2006)
Skills development in South Africa faces a number of challenges, some relating directly to SETAs and
skills development legislation, as well as other broader issues. A number of these challenges are
summarised below:
According to Hatting (2013) the changes to the levy grant system to SETAs in the 2012
Grant Regulations are good in addressing specific challenges in the funding of skills
development. However, by narrowly focusing funding from the skills levy on qualifications
offered by public institutions, the Regulations fail to recognise the wide range of training
needed to address the diverse national, sector, organisational and individual skills needs.
Some critics feel that it is unlikely that the Regulations will advance the skills agenda or
70
FP&M SETA Tracking and Tracing study of Learnerships, Apprenticeships and Bursaries - 2014
promote strategic government objectives in the National Development Plan and the
Human Resources Development (HRD) Strategy for 2010-2030 (Hatting, 2013).
The operations of all SETAs should be standardised by a specific body appointed by the
Minister of Education, since too many officials have too much power to disburse funds
(Robertson, 2006). Funds allocated to respective SETAs are of concern and should be
investigated if it is used for the same purpose as it was allocated to.
According to Robertson (2006) communication with SETAs is also a challenge since
stakeholders at individual SETAs simply cannot be reached, although they are public
entities.
The mismanagement of public funds is a huge tragedy, which is going to defeat the
purpose of skills development in this country. This is the result of improper controls
(Robertson, 2006). Huge amounts of money and a lack of transparency in the awarding of
many contracts are allowing dishonest people to manipulate funding of education and
training in a way that suits them.
More rules and more controls are being implemented for SETAs. This means that more
professional bodies and officials are needed to manage these changes. Organisations in
education are more likely to have slow processes and be slow to grow their own staff
(Miller, 2012).
Miller (2012) states that the largest and most challenging group to provide skills
development to, is the millions of unemployed, under-schooled, desperate and potentially
volatile young people who see a community learning centre as a place for redress and a
quick-fix entry point into the world of tertiary education and employment. The slow pace of
a formal curriculum and the mixed group of students in the adult classroom, have left
these young people dissatisfied and often further alienated.
Challenges faced by learning centres and part-time educators, second-chance
Matriculants and actual Adult Basic Education and Training (AET) students are not
addressed by separate task teams advising the minister of education on the way forward.
Another challenge centres around students who complete a very basic literacy course, as
well as the failure of attempts to fill the public adult learning centres with new, eager
students in the lower-level courses. Some students choose only basic literacy and decide
not to progress, and it is the failure to link two separate systems - now also divided
between two ministries - that remains a problem.
A critical problem that is not addressed is the stop-start method of funding, which has
resulted in thousands of adults completing one level of learning, only to wait a year or
more for the programme to be offered again. Such haphazard funding shrinks the
capacity of AET providers and leaves students disillusioned. (Mail and Guardian, 2012)
On July 12, 2013 Higher Education and Training Minister Blade Nzimande stated that the
Sector Education and Training Authorities (SETAs) are not serving their purpose (SABC,
2013). According to Nzimande, those who come through these facilities are still
unemployable. Nzimande feels that SETAs are failing because they make use of private
facilities, while they could use Further Education and Training (FET) colleges and
universities. After a frank assessment of the sector, the Minister says that billions of
Rands invested in the SETA programmes have gone to waste, as critical skills shortages
remain.
2.2 Closing the gap
2.2.1 Gap between education and being able to transfer skills into workplace
The gap between the education provided to learners and the ability of the learners to transfer these
skills into the workplace involves two aspects; namely, a skills mismatch and a lack of skills.
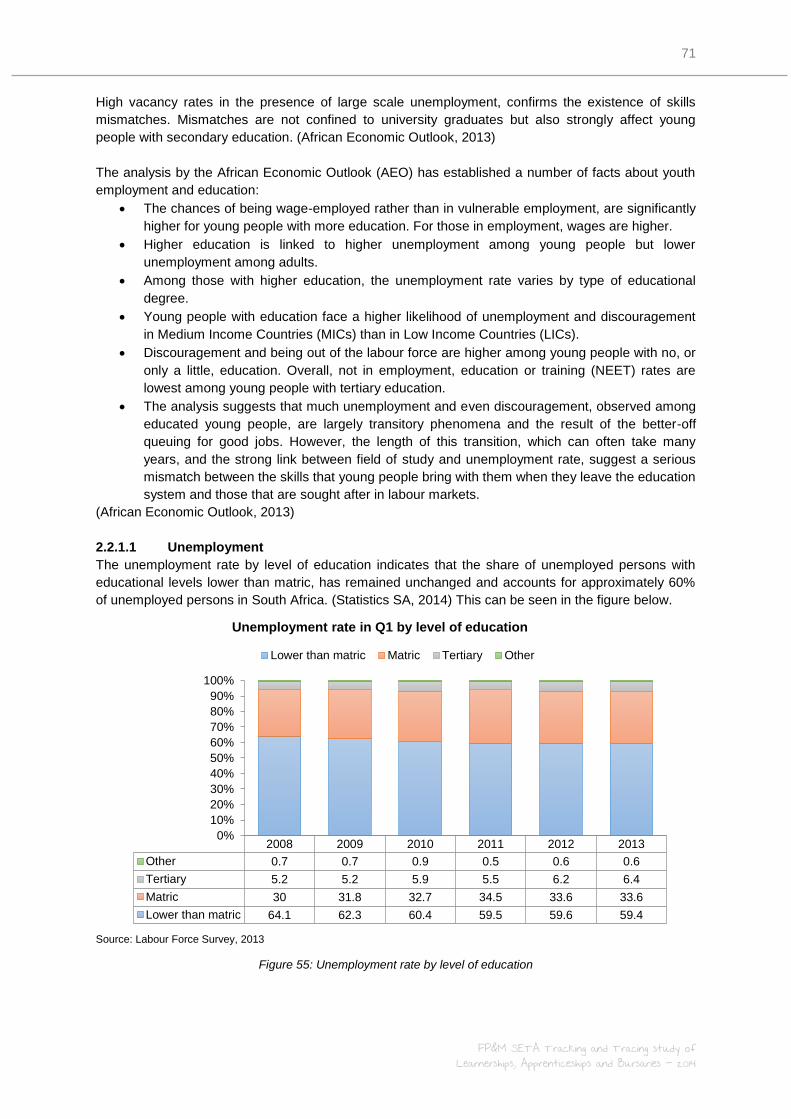
71
FP&M SETA Tracking and Tracing study of Learnerships, Apprenticeships and Bursaries - 2014
High vacancy rates in the presence of large scale unemployment, confirms the existence of skills
mismatches. Mismatches are not confined to university graduates but also strongly affect young
people with secondary education. (African Economic Outlook, 2013)
The analysis by the African Economic Outlook (AEO) has established a number of facts about youth
employment and education:
The chances of being wage-employed rather than in vulnerable employment, are significantly
higher for young people with more education. For those in employment, wages are higher.
Higher education is linked to higher unemployment among young people but lower
unemployment among adults.
Among those with higher education, the unemployment rate varies by type of educational
degree.
Young people with education face a higher likelihood of unemployment and discouragement
in Medium Income Countries (MICs) than in Low Income Countries (LICs).
Discouragement and being out of the labour force are higher among young people with no, or
only a little, education. Overall, not in employment, education or training (NEET) rates are
lowest among young people with tertiary education.
The analysis suggests that much unemployment and even discouragement, observed among
educated young people, are largely transitory phenomena and the result of the better-off
queuing for good jobs. However, the length of this transition, which can often take many
years, and the strong link between field of study and unemployment rate, suggest a serious
mismatch between the skills that young people bring with them when they leave the education
system and those that are sought after in labour markets.
(African Economic Outlook, 2013)
2.2.1.1 Unemployment
The unemployment rate by level of education indicates that the share of unemployed persons with
educational levels lower than matric, has remained unchanged and accounts for approximately 60%
of unemployed persons in South Africa. (Statistics SA, 2014) This can be seen in the figure below.
Source: Labour Force Survey, 2013
Figure 55: Unemployment rate by level of education
2008 2009 2010 2011 2012 2013
Other 0.7 0.7 0.9 0.5 0.6 0.6
Tertiary 5.2 5.2 5.9 5.5 6.2 6.4
Matric 30 31.8 32.7 34.5 33.6 33.6
Lower than matric 64.1 62.3 60.4 59.5 59.6 59.4
0%
10%
20%
30%
40%
50%
60%
70%
80%
90%
100%
Unemployment rate in Q1 by level of education
Lower than matric Matric Tertiary Other
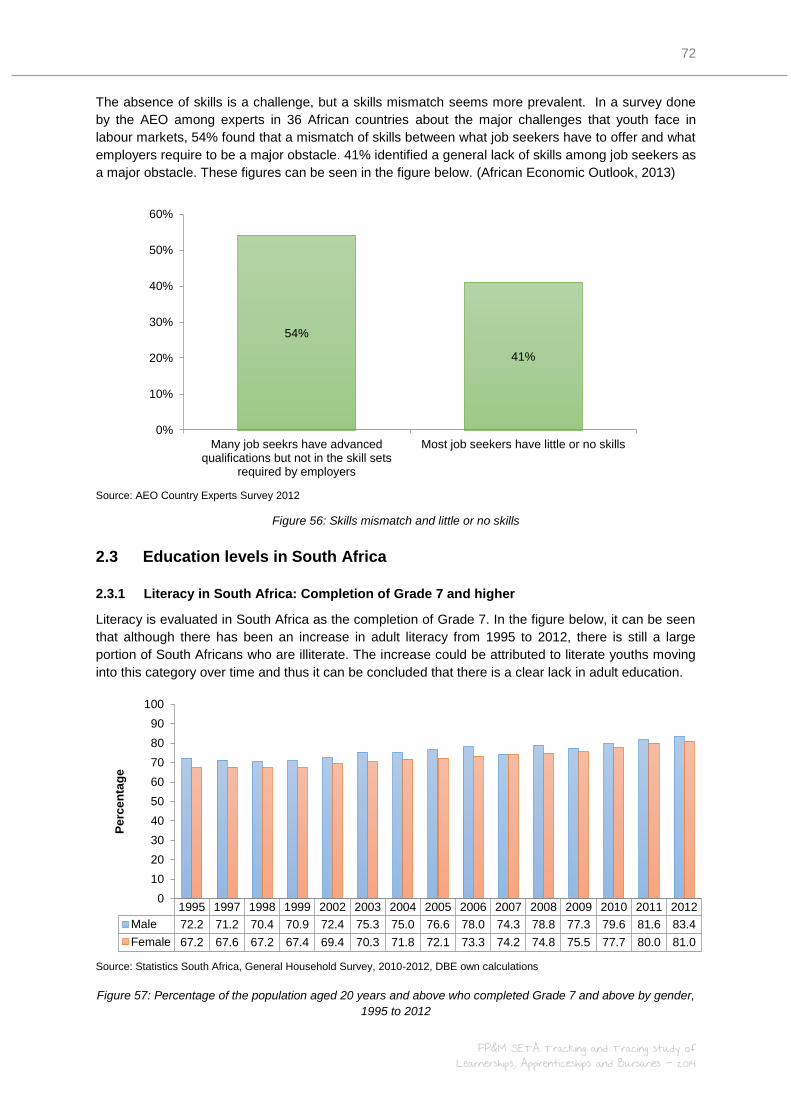
72
FP&M SETA Tracking and Tracing study of Learnerships, Apprenticeships and Bursaries - 2014
The absence of skills is a challenge, but a skills mismatch seems more prevalent. In a survey done
by the AEO among experts in 36 African countries about the major challenges that youth face in
labour markets, 54% found that a mismatch of skills between what job seekers have to offer and what
employers require to be a major obstacle. 41% identified a general lack of skills among job seekers as
a major obstacle. These figures can be seen in the figure below. (African Economic Outlook, 2013)
Source: AEO Country Experts Survey 2012
Figure 56: Skills mismatch and little or no skills
2.3 Education levels in South Africa
2.3.1 Literacy in South Africa: Completion of Grade 7 and higher
Literacy is evaluated in South Africa as the completion of Grade 7. In the figure below, it can be seen
that although there has been an increase in adult literacy from 1995 to 2012, there is still a large
portion of South Africans who are illiterate. The increase could be attributed to literate youths moving
into this category over time and thus it can be concluded that there is a clear lack in adult education.
Source: Statistics South Africa, General Household Survey, 2010-2012, DBE own calculations
Figure 57: Percentage of the population aged 20 years and above who completed Grade 7 and above by gender,
1995 to 2012
54%
41%
0%
10%
20%
30%
40%
50%
60%
Many job seekrs have advancedqualifications but not in the skill sets
required by employers
Most job seekers have little or no skills
1995 1997 1998 1999 2002 2003 2004 2005 2006 2007 2008 2009 2010 2011 2012
Male 72.2 71.2 70.4 70.9 72.4 75.3 75.0 76.6 78.0 74.3 78.8 77.3 79.6 81.6 83.4
Female 67.2 67.6 67.2 67.4 69.4 70.3 71.8 72.1 73.3 74.2 74.8 75.5 77.7 80.0 81.0
0
10
20
30
40
50
60
70
80
90
100
Pe
rce
nta
ge
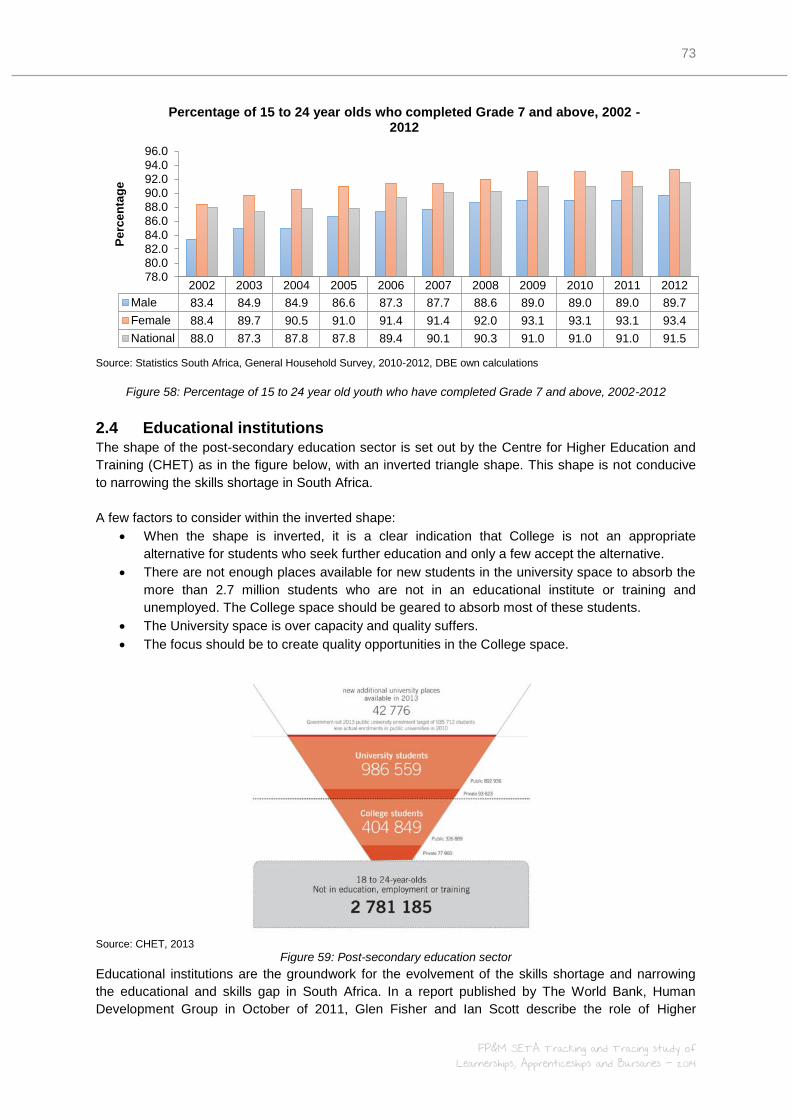
73
FP&M SETA Tracking and Tracing study of Learnerships, Apprenticeships and Bursaries - 2014
Source: Statistics South Africa, General Household Survey, 2010-2012, DBE own calculations
Figure 58: Percentage of 15 to 24 year old youth who have completed Grade 7 and above, 2002-2012
2.4 Educational institutions The shape of the post-secondary education sector is set out by the Centre for Higher Education and
Training (CHET) as in the figure below, with an inverted triangle shape. This shape is not conducive
to narrowing the skills shortage in South Africa.
A few factors to consider within the inverted shape:
When the shape is inverted, it is a clear indication that College is not an appropriate
alternative for students who seek further education and only a few accept the alternative.
There are not enough places available for new students in the university space to absorb the
more than 2.7 million students who are not in an educational institute or training and
unemployed. The College space should be geared to absorb most of these students.
The University space is over capacity and quality suffers.
The focus should be to create quality opportunities in the College space.
Source: CHET, 2013
Figure 59: Post-secondary education sector
Educational institutions are the groundwork for the evolvement of the skills shortage and narrowing
the educational and skills gap in South Africa. In a report published by The World Bank, Human
Development Group in October of 2011, Glen Fisher and Ian Scott describe the role of Higher
2002 2003 2004 2005 2006 2007 2008 2009 2010 2011 2012
Male 83.4 84.9 84.9 86.6 87.3 87.7 88.6 89.0 89.0 89.0 89.7
Female 88.4 89.7 90.5 91.0 91.4 91.4 92.0 93.1 93.1 93.1 93.4
National 88.0 87.3 87.8 87.8 89.4 90.1 90.3 91.0 91.0 91.0 91.5
78.080.082.084.086.088.090.092.094.096.0
Pe
rce
nta
ge
Percentage of 15 to 24 year olds who completed Grade 7 and above, 2002 -
2012
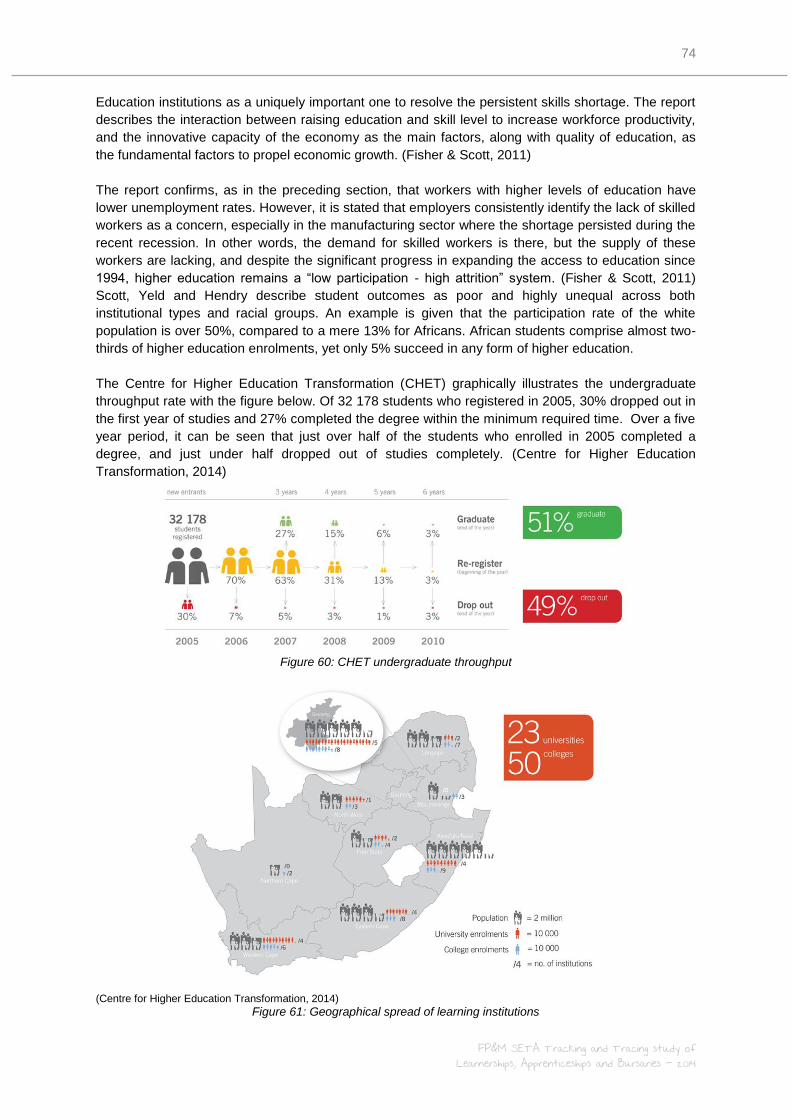
74
FP&M SETA Tracking and Tracing study of Learnerships, Apprenticeships and Bursaries - 2014
Education institutions as a uniquely important one to resolve the persistent skills shortage. The report
describes the interaction between raising education and skill level to increase workforce productivity,
and the innovative capacity of the economy as the main factors, along with quality of education, as
the fundamental factors to propel economic growth. (Fisher & Scott, 2011)
The report confirms, as in the preceding section, that workers with higher levels of education have
lower unemployment rates. However, it is stated that employers consistently identify the lack of skilled
workers as a concern, especially in the manufacturing sector where the shortage persisted during the
recent recession. In other words, the demand for skilled workers is there, but the supply of these
workers are lacking, and despite the significant progress in expanding the access to education since
1994, higher education remains a “low participation - high attrition” system. (Fisher & Scott, 2011)
Scott, Yeld and Hendry describe student outcomes as poor and highly unequal across both
institutional types and racial groups. An example is given that the participation rate of the white
population is over 50%, compared to a mere 13% for Africans. African students comprise almost two-
thirds of higher education enrolments, yet only 5% succeed in any form of higher education.
The Centre for Higher Education Transformation (CHET) graphically illustrates the undergraduate
throughput rate with the figure below. Of 32 178 students who registered in 2005, 30% dropped out in
the first year of studies and 27% completed the degree within the minimum required time. Over a five
year period, it can be seen that just over half of the students who enrolled in 2005 completed a
degree, and just under half dropped out of studies completely. (Centre for Higher Education
Transformation, 2014)
Figure 60: CHET undergraduate throughput
(Centre for Higher Education Transformation, 2014)
Figure 61: Geographical spread of learning institutions
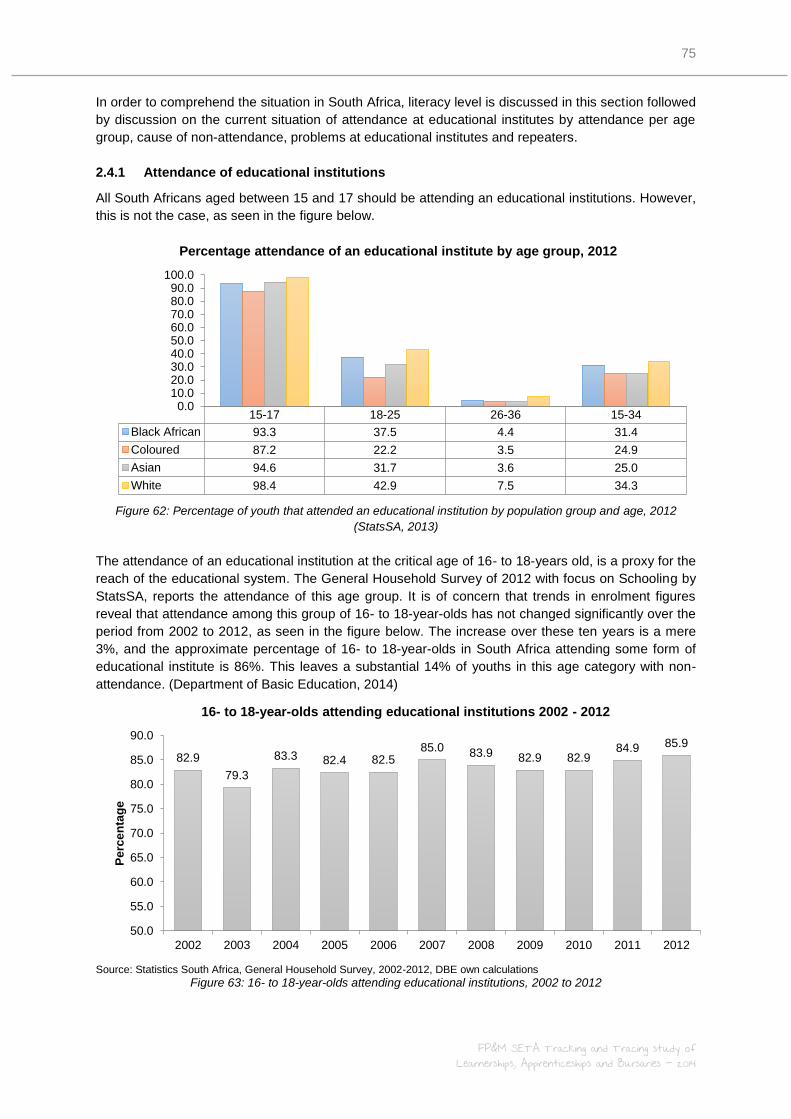
75
FP&M SETA Tracking and Tracing study of Learnerships, Apprenticeships and Bursaries - 2014
In order to comprehend the situation in South Africa, literacy level is discussed in this section followed
by discussion on the current situation of attendance at educational institutes by attendance per age
group, cause of non-attendance, problems at educational institutes and repeaters.
2.4.1 Attendance of educational institutions
All South Africans aged between 15 and 17 should be attending an educational institutions. However,
this is not the case, as seen in the figure below.
Figure 62: Percentage of youth that attended an educational institution by population group and age, 2012
(StatsSA, 2013)
The attendance of an educational institution at the critical age of 16- to 18-years old, is a proxy for the
reach of the educational system. The General Household Survey of 2012 with focus on Schooling by
StatsSA, reports the attendance of this age group. It is of concern that trends in enrolment figures
reveal that attendance among this group of 16- to 18-year-olds has not changed significantly over the
period from 2002 to 2012, as seen in the figure below. The increase over these ten years is a mere
3%, and the approximate percentage of 16- to 18-year-olds in South Africa attending some form of
educational institute is 86%. This leaves a substantial 14% of youths in this age category with non-
attendance. (Department of Basic Education, 2014)
Source: Statistics South Africa, General Household Survey, 2002-2012, DBE own calculations
Figure 63: 16- to 18-year-olds attending educational institutions, 2002 to 2012
15-17 18-25 26-36 15-34
Black African 93.3 37.5 4.4 31.4
Coloured 87.2 22.2 3.5 24.9
Asian 94.6 31.7 3.6 25.0
White 98.4 42.9 7.5 34.3
0.010.020.030.040.050.060.070.080.090.0
100.0
Percentage attendance of an educational institute by age group, 2012
82.9
79.3
83.3 82.4 82.5 85.0 83.9 82.9 82.9
84.9 85.9
50.0
55.0
60.0
65.0
70.0
75.0
80.0
85.0
90.0
2002 2003 2004 2005 2006 2007 2008 2009 2010 2011 2012
Pe
rce
nta
ge
16- to 18-year-olds attending educational institutions 2002 - 2012
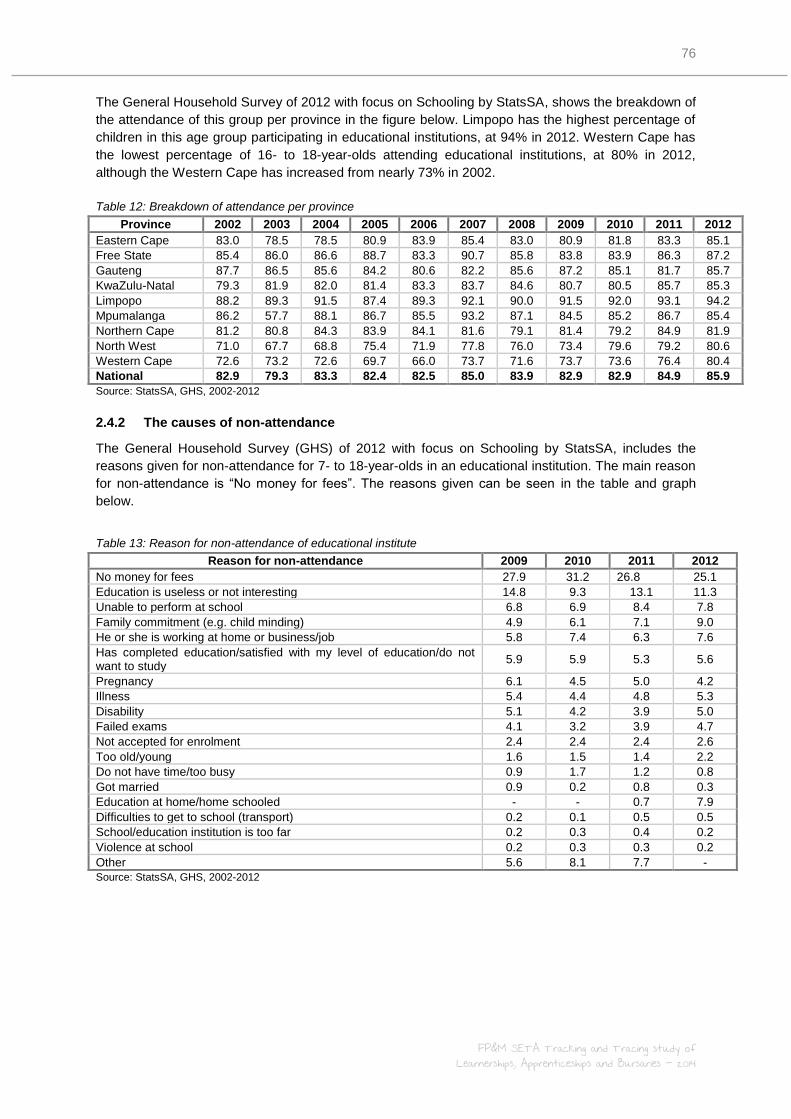
76
FP&M SETA Tracking and Tracing study of Learnerships, Apprenticeships and Bursaries - 2014
The General Household Survey of 2012 with focus on Schooling by StatsSA, shows the breakdown of
the attendance of this group per province in the figure below. Limpopo has the highest percentage of
children in this age group participating in educational institutions, at 94% in 2012. Western Cape has
the lowest percentage of 16- to 18-year-olds attending educational institutions, at 80% in 2012,
although the Western Cape has increased from nearly 73% in 2002.
Table 12: Breakdown of attendance per province
Province 2002 2003 2004 2005 2006 2007 2008 2009 2010 2011 2012
Eastern Cape 83.0 78.5 78.5 80.9 83.9 85.4 83.0 80.9 81.8 83.3 85.1
Free State 85.4 86.0 86.6 88.7 83.3 90.7 85.8 83.8 83.9 86.3 87.2
Gauteng 87.7 86.5 85.6 84.2 80.6 82.2 85.6 87.2 85.1 81.7 85.7
KwaZulu-Natal 79.3 81.9 82.0 81.4 83.3 83.7 84.6 80.7 80.5 85.7 85.3
Limpopo 88.2 89.3 91.5 87.4 89.3 92.1 90.0 91.5 92.0 93.1 94.2
Mpumalanga 86.2 57.7 88.1 86.7 85.5 93.2 87.1 84.5 85.2 86.7 85.4
Northern Cape 81.2 80.8 84.3 83.9 84.1 81.6 79.1 81.4 79.2 84.9 81.9
North West 71.0 67.7 68.8 75.4 71.9 77.8 76.0 73.4 79.6 79.2 80.6
Western Cape 72.6 73.2 72.6 69.7 66.0 73.7 71.6 73.7 73.6 76.4 80.4
National 82.9 79.3 83.3 82.4 82.5 85.0 83.9 82.9 82.9 84.9 85.9
Source: StatsSA, GHS, 2002-2012
2.4.2 The causes of non-attendance
The General Household Survey (GHS) of 2012 with focus on Schooling by StatsSA, includes the
reasons given for non-attendance for 7- to 18-year-olds in an educational institution. The main reason
for non-attendance is “No money for fees”. The reasons given can be seen in the table and graph
below.
Table 13: Reason for non-attendance of educational institute
Reason for non-attendance 2009 2010 2011 2012
No money for fees 27.9 31.2 26.8 25.1
Education is useless or not interesting 14.8 9.3 13.1 11.3
Unable to perform at school 6.8 6.9 8.4 7.8
Family commitment (e.g. child minding) 4.9 6.1 7.1 9.0
He or she is working at home or business/job 5.8 7.4 6.3 7.6
Has completed education/satisfied with my level of education/do not want to study
5.9 5.9 5.3 5.6
Pregnancy 6.1 4.5 5.0 4.2
Illness 5.4 4.4 4.8 5.3
Disability 5.1 4.2 3.9 5.0
Failed exams 4.1 3.2 3.9 4.7
Not accepted for enrolment 2.4 2.4 2.4 2.6
Too old/young 1.6 1.5 1.4 2.2
Do not have time/too busy 0.9 1.7 1.2 0.8
Got married 0.9 0.2 0.8 0.3
Education at home/home schooled - - 0.7 7.9
Difficulties to get to school (transport) 0.2 0.1 0.5 0.5
School/education institution is too far 0.2 0.3 0.4 0.2
Violence at school 0.2 0.3 0.3 0.2
Other 5.6 8.1 7.7 -
Source: StatsSA, GHS, 2002-2012
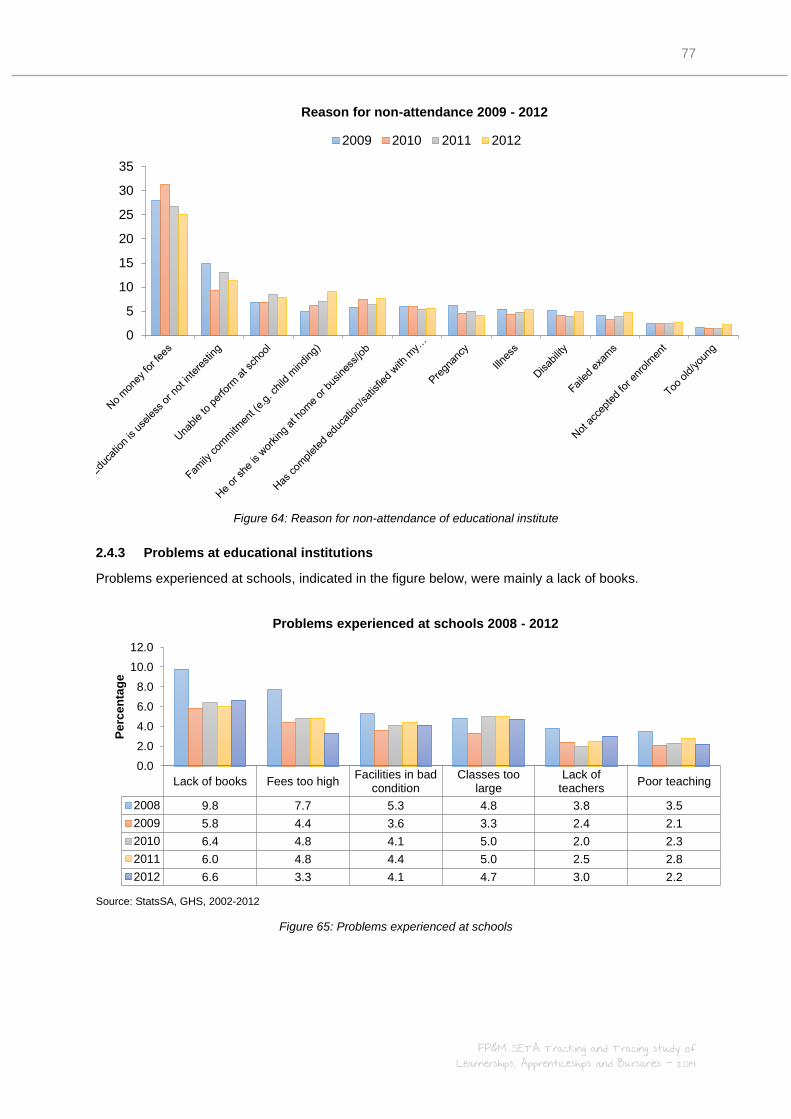
77
FP&M SETA Tracking and Tracing study of Learnerships, Apprenticeships and Bursaries - 2014
Figure 64: Reason for non-attendance of educational institute
2.4.3 Problems at educational institutions
Problems experienced at schools, indicated in the figure below, were mainly a lack of books.
Source: StatsSA, GHS, 2002-2012
Figure 65: Problems experienced at schools
0
5
10
15
20
25
30
35
Reason for non-attendance 2009 - 2012
2009 2010 2011 2012
Lack of books Fees too highFacilities in bad
conditionClasses too
largeLack of
teachersPoor teaching
2008 9.8 7.7 5.3 4.8 3.8 3.5
2009 5.8 4.4 3.6 3.3 2.4 2.1
2010 6.4 4.8 4.1 5.0 2.0 2.3
2011 6.0 4.8 4.4 5.0 2.5 2.8
2012 6.6 3.3 4.1 4.7 3.0 2.2
0.0
2.0
4.0
6.0
8.0
10.0
12.0
Pe
rce
nta
ge
Problems experienced at schools 2008 - 2012
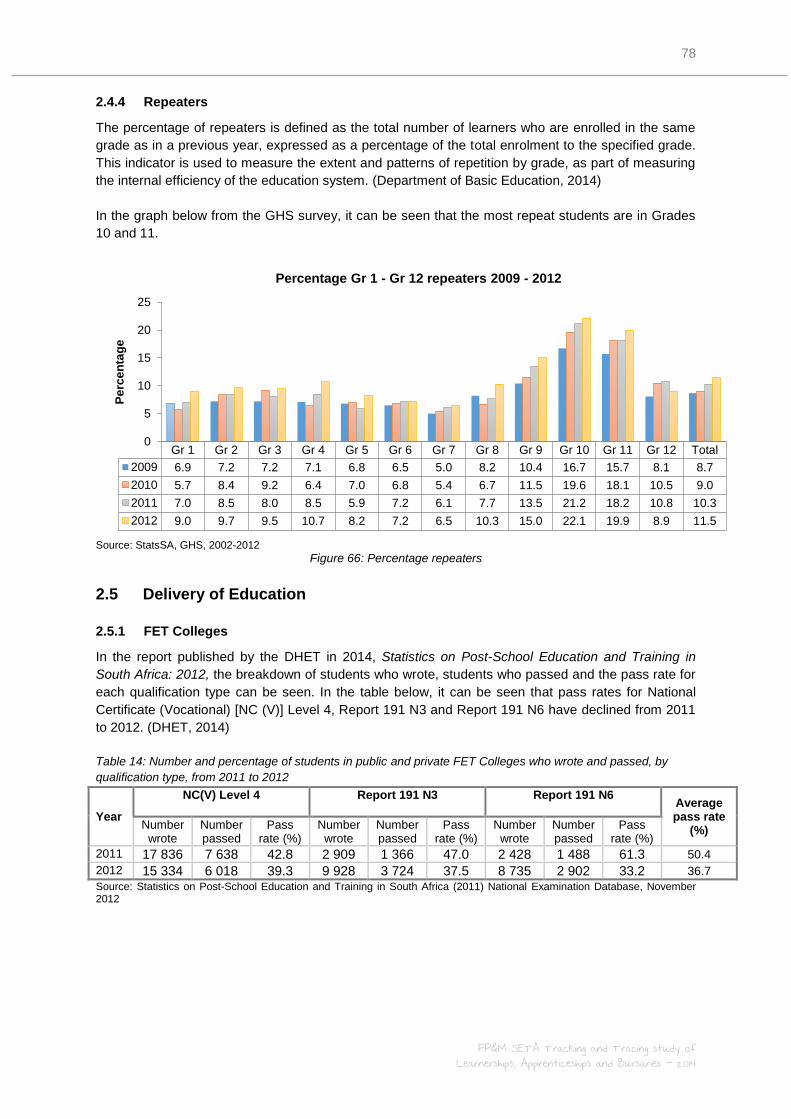
78
FP&M SETA Tracking and Tracing study of Learnerships, Apprenticeships and Bursaries - 2014
2.4.4 Repeaters
The percentage of repeaters is defined as the total number of learners who are enrolled in the same
grade as in a previous year, expressed as a percentage of the total enrolment to the specified grade.
This indicator is used to measure the extent and patterns of repetition by grade, as part of measuring
the internal efficiency of the education system. (Department of Basic Education, 2014)
In the graph below from the GHS survey, it can be seen that the most repeat students are in Grades
10 and 11.
Source: StatsSA, GHS, 2002-2012
Figure 66: Percentage repeaters
2.5 Delivery of Education
2.5.1 FET Colleges
In the report published by the DHET in 2014, Statistics on Post-School Education and Training in
South Africa: 2012, the breakdown of students who wrote, students who passed and the pass rate for
each qualification type can be seen. In the table below, it can be seen that pass rates for National
Certificate (Vocational) [NC (V)] Level 4, Report 191 N3 and Report 191 N6 have declined from 2011
to 2012. (DHET, 2014)
Table 14: Number and percentage of students in public and private FET Colleges who wrote and passed, by
qualification type, from 2011 to 2012
Year
NC(V) Level 4
Report 191 N3
Report 191 N6
Average pass rate
(%) Number wrote
Number passed
Pass rate (%)
Number wrote
Number passed
Pass rate (%)
Number wrote
Number passed
Pass rate (%)
2011 17 836 7 638 42.8 2 909 1 366 47.0 2 428 1 488 61.3 50.4
2012 15 334 6 018 39.3 9 928 3 724 37.5 8 735 2 902 33.2 36.7
Source: Statistics on Post-School Education and Training in South Africa (2011) National Examination Database, November 2012
Gr 1 Gr 2 Gr 3 Gr 4 Gr 5 Gr 6 Gr 7 Gr 8 Gr 9 Gr 10 Gr 11 Gr 12 Total
2009 6.9 7.2 7.2 7.1 6.8 6.5 5.0 8.2 10.4 16.7 15.7 8.1 8.7
2010 5.7 8.4 9.2 6.4 7.0 6.8 5.4 6.7 11.5 19.6 18.1 10.5 9.0
2011 7.0 8.5 8.0 8.5 5.9 7.2 6.1 7.7 13.5 21.2 18.2 10.8 10.3
2012 9.0 9.7 9.5 10.7 8.2 7.2 6.5 10.3 15.0 22.1 19.9 8.9 11.5
0
5
10
15
20
25
Pe
rce
nta
ge
Percentage Gr 1 - Gr 12 repeaters 2009 - 2012

79
FP&M SETA Tracking and Tracing study of Learnerships, Apprenticeships and Bursaries - 2014
2.5.2 Pass3 and throughput
4 rates for NC (V) Levels at FET Colleges
Table 15: Number of public and private FET College students who entered, wrote and passed NC (V)
examination in 2012
Province
NC(V) Level 2 NC(V) Level 3 NC(V) Level 4 Ave. pass rate (%)
Nr enter
Nr wrote
Nr pass
Pass rate (%)
Nr enter
Nr wrote
Nr pass
Pass rate (%)
Nr enter
Nr wrote
Nr pass
Pass rate (%)
Eastern Cape 9 769 4 243 2 045 48.2 4 114 2 340 1 088 46.5 2 251 1 901 803 42.2 45.6
Free State 3 116 1 223 336 27.5 581 308 130 42.2 376 274 104 37.9 35.9
Gauteng 14 958 8 231 3 059 37.2 5 013 3 542 1 360 38.4 3 606 3 215 1 300 40.4 38.7
KwaZulu-Natal
17 769 9 788 3 793 38.8 6 596 4 116 1 347 32.7 3 842 2 960 788 26.6 32.7
Limpopo 10 034 5 847 2 107 36.0 3 773 2 814 1 046 37.1 3 531 2 938 1 014 34.5 35.9
Mpumalanga 3 966 2 457 1 402 57.1 2 000 1 360 704 51.8 1 464 1 307 675 51.6 53.5
Northern Cape
1 474 541 202 37.3 512 263 71 27.0 249 214 73 34.1 32.8
North West 3 728 2 263 972 42.9 1 527 1 118 577 51.6 1 044 941 501 53.2 49.2
Western Cape
8 230 4 199 2 601 61.9 3 901 2 444 1 340 54.8 2 244 1 584 760 47.9 54.9
National 73 044 38 792 16 517 42.6 28 017 18 305 7 663 41.9 18 607 15 334 6 018 39.3 41.3
Source: DHET, Statistics on Post-School Education and Training in South Africa: 2012
The throughput rate is a good indication of the commitment a student had to finish the course when
enrolling. The overall throughput rates can be calculated as:
Figure 67: Average pass and throughput rates for NC(V)
2.5.3 Pass and throughput rate for Report 191 at FET Colleges
Table 16: Number of public and private FET College students who entered, wrote and passed the Report 191 N1-
N3 December 2012 examinations for engineering studies, by province in 2012
Province
Report 191 N1 Report 191 N2 Report 191 N3 Ave. pass rate (%)
Nr enter
Nr wrote
Nr pass
Pass rate (%)
Nr enter
Nr wrote
Nr pass
Pass rate (%)
Nr enter
Nr wrote
Nr pass
Pass rate (%)
Eastern Cape 459 241 88 36.5 832 592 166 28.0 679 533 156 29.3 31.3
Free State 798 590 224 37.9 834 682 173 25.4 494 377 138 36.6 33.3
Gauteng 2 497 1 542 567 36.8 3 514 2 863 879 30.7 5 340 3 726 1 406 37.7 35.1
KwaZulu-Natal
1 501 1 060 320 30.2 2 692 2 231 741 33.2 2 857 1 975 756 38.3 33.9
Limpopo 433 288 115 39.9 1 655 1 272 294 23.1 2 084 1 463 481 32.9 32.0
Mpumalanga 781 629 286 45.5 1 330 942 229 24.3 1 424 1 013 485 47.9 39.2
Northern Cape
78 66 19 28.8 249 207 85 41.1 97 80 33 41.3 37.1
North West 650 472 141 29.9 1 446 752 166 22.1 566 382 123 31.2 28.1
Western Cape
1 096 542 321 59.2 1 042 613 280 45.7 675 379 146 38.5 47.8
National 8 293 5 430 2 081 38.3 13 594 10 154 3 013 29.7 14 216 9 928 3 724 37.5 35.2
Source: DHET, Statistics on Post-School Education and Training in South Africa: 2012
3 Pass rate is equal to the number of students who passed a specified programme’s examination, divided by the
number of students who wrote the examination. 4 Throughput rate is equal to the number of students who passed a specified programme’s examination, divided
by the number of students who enrolled for the programme.
28%
46%
20% 36%
28% 39%
21% 33%
26% 36% 39%
54%
19% 33% 37%
49% 33%
55%
27% 41%
0%10%20%30%40%50%60%
Thro
ug
hp
ut
Pass
Thro
ug
hp
ut
Pass
Thro
ug
hp
ut
Pass
Thro
ug
hp
ut
Pass
Thro
ug
hp
ut
Pass
Thro
ug
hp
ut
Pass
Thro
ug
hp
ut
Pass
Thro
ug
hp
ut
Pass
Thro
ug
hp
ut
Pass
Thro
ug
hp
ut
Pass
Eastern Cape Free State Gauteng KwaZuluNatal
Limpopo Mpumalanga NorthernCape
North West WesternCape
National
Average pass and throughput rates for NC(V)
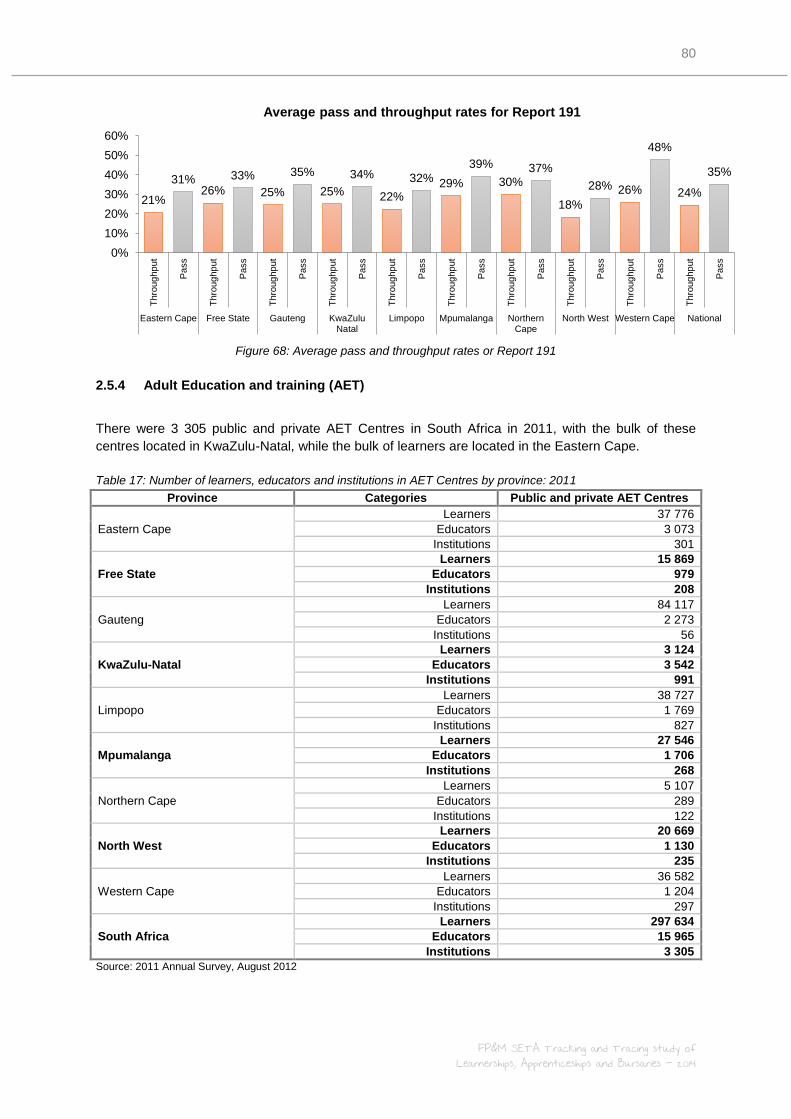
80
FP&M SETA Tracking and Tracing study of Learnerships, Apprenticeships and Bursaries - 2014
Figure 68: Average pass and throughput rates or Report 191
2.5.4 Adult Education and training (AET)
There were 3 305 public and private AET Centres in South Africa in 2011, with the bulk of these
centres located in KwaZulu-Natal, while the bulk of learners are located in the Eastern Cape.
Table 17: Number of learners, educators and institutions in AET Centres by province: 2011
Province Categories Public and private AET Centres
Eastern Cape
Learners 37 776
Educators 3 073
Institutions 301
Free State
Learners 15 869
Educators 979
Institutions 208
Gauteng
Learners 84 117
Educators 2 273
Institutions 56
KwaZulu-Natal
Learners 3 124
Educators 3 542
Institutions 991
Limpopo
Learners 38 727
Educators 1 769
Institutions 827
Mpumalanga
Learners 27 546
Educators 1 706
Institutions 268
Northern Cape
Learners 5 107
Educators 289
Institutions 122
North West
Learners 20 669
Educators 1 130
Institutions 235
Western Cape
Learners 36 582
Educators 1 204
Institutions 297
South Africa
Learners 297 634
Educators 15 965
Institutions 3 305
Source: 2011 Annual Survey, August 2012
21%
31% 26%
33%
25%
35%
25%
34%
22%
32% 29%
39%
30% 37%
18%
28% 26%
48%
24%
35%
0%
10%
20%
30%
40%
50%
60%
Thro
ug
hp
ut
Pass
Thro
ug
hp
ut
Pass
Thro
ug
hp
ut
Pass
Thro
ug
hp
ut
Pass
Thro
ug
hp
ut
Pass
Thro
ug
hp
ut
Pass
Thro
ug
hp
ut
Pass
Thro
ug
hp
ut
Pass
Thro
ug
hp
ut
Pass
Thro
ug
hp
ut
Pass
Eastern Cape Free State Gauteng KwaZuluNatal
Limpopo Mpumalanga NorthernCape
North West Western Cape National
Average pass and throughput rates for Report 191
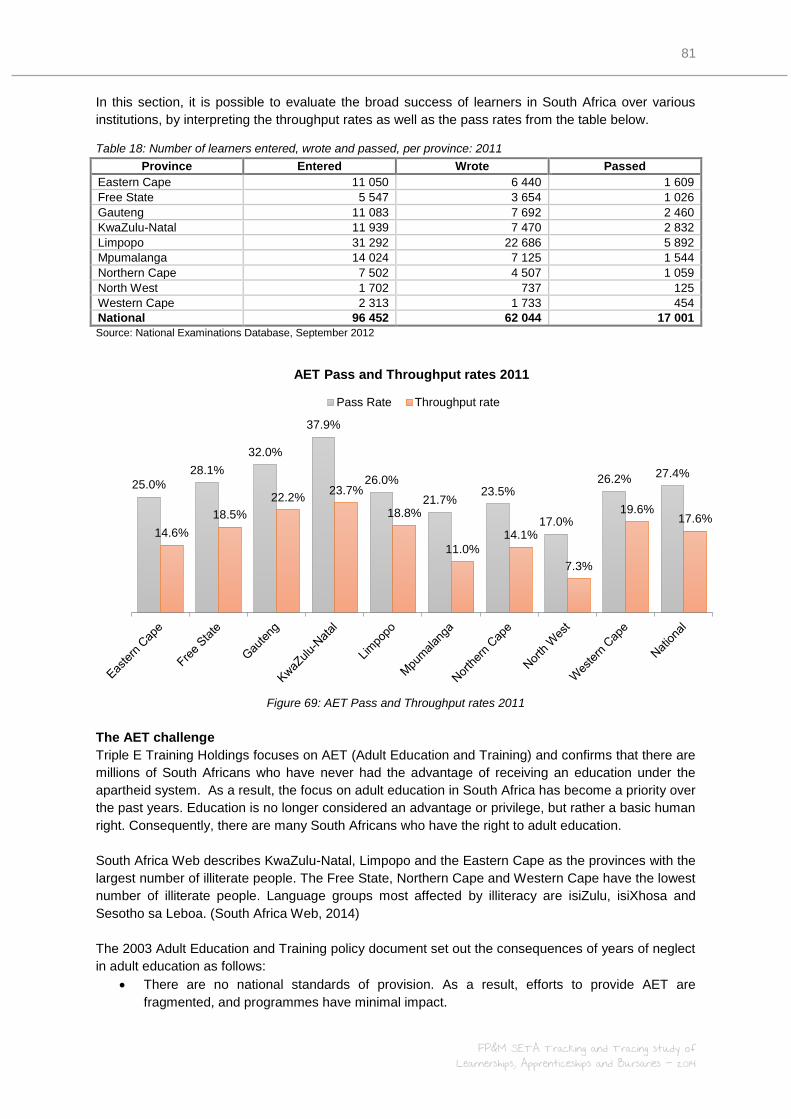
81
FP&M SETA Tracking and Tracing study of Learnerships, Apprenticeships and Bursaries - 2014
In this section, it is possible to evaluate the broad success of learners in South Africa over various
institutions, by interpreting the throughput rates as well as the pass rates from the table below.
Table 18: Number of learners entered, wrote and passed, per province: 2011
Province Entered Wrote Passed
Eastern Cape 11 050 6 440 1 609
Free State 5 547 3 654 1 026
Gauteng 11 083 7 692 2 460
KwaZulu-Natal 11 939 7 470 2 832
Limpopo 31 292 22 686 5 892
Mpumalanga 14 024 7 125 1 544
Northern Cape 7 502 4 507 1 059
North West 1 702 737 125
Western Cape 2 313 1 733 454
National 96 452 62 044 17 001
Source: National Examinations Database, September 2012
Figure 69: AET Pass and Throughput rates 2011
The AET challenge
Triple E Training Holdings focuses on AET (Adult Education and Training) and confirms that there are
millions of South Africans who have never had the advantage of receiving an education under the
apartheid system. As a result, the focus on adult education in South Africa has become a priority over
the past years. Education is no longer considered an advantage or privilege, but rather a basic human
right. Consequently, there are many South Africans who have the right to adult education.
South Africa Web describes KwaZulu-Natal, Limpopo and the Eastern Cape as the provinces with the
largest number of illiterate people. The Free State, Northern Cape and Western Cape have the lowest
number of illiterate people. Language groups most affected by illiteracy are isiZulu, isiXhosa and
Sesotho sa Leboa. (South Africa Web, 2014)
The 2003 Adult Education and Training policy document set out the consequences of years of neglect
in adult education as follows:
There are no national standards of provision. As a result, efforts to provide AET are
fragmented, and programmes have minimal impact.
25.0%
28.1%
32.0%
37.9%
26.0%
21.7% 23.5%
17.0%
26.2% 27.4%
14.6%
18.5%
22.2% 23.7%
18.8%
11.0%
14.1%
7.3%
19.6% 17.6%
AET Pass and Throughput rates 2011
Pass Rate Throughput rate

82
FP&M SETA Tracking and Tracing study of Learnerships, Apprenticeships and Bursaries - 2014
There has been little or no recognition of the adult education sector as a whole, nor, in
particular, for the educators of adults.
AET provision has suffered from an inadequate infrastructure and support system, with
minimal resources.
There have been very few attempts to link AET to development and training. As a result, no
inter-departmental and institutional linkages exist within government, the private sector and
non-governmental organisations.
State-provided adult education has had an inappropriate, narrow, formal school focus and,
despite its location in the schooling environment, adult education has not been able to draw
meaningfully upon the professional educational resources and infrastructure of the formal
school system.
These factors have made it impossible to treat AET as a coherent system of teaching and
learning. In 1995/6, a total of 335 481 adult learners were participating in AET programmes
throughout the country. While this figure is higher than was previously estimated, it is
extremely low, even if South Africa aims to achieve universal adult basic education within a
reasonable period of time.
(Department of Education, 2003)
According to Skills Portal, the conventional learner population in AET used to be second-chance
learners (i.e. illiterate mature adults who never went to school, and semi-literate adults who had an
interrupted schooling due to discriminatory educational practices). These learners are adults with
responsibilities that they balance against the demand of learning. Consequently the environment of
adult learning is more sensitive to situational challenges that could impede learning ability. (Daniels,
2013)
Daniels explains the issue as follows:
“Anyone older than 15 who is not enrolled in formal schooling is considered to be
an adult and is thus eligible to complete his general education through AET. The
lack of a separate learning pathway for out-of-school youth who are re-entering
education, has led to AET centres becoming catchment areas for adolescent
learners.
There seems to be a lack of critical engagement about what this changing learner
population is doing to the traditional ethos of AET centres, and the pressures that
a more youthful learner population place on already overextended resources. The
educational trajectory of formally schooled youths, differs greatly from that of the
second-chance adult learners, which necessitates changes in course offerings
and pedagogies to be inclusive. It is my contention that illiterate and semi-literate
adult learners are being disadvantaged by these restructurings.”
It should be noted that AET receives less than 3% of the national education budget and as a
result, this limits financial, physical and human resources. The institutions do not have the
capacity and ability to deal with the unique challenges that the formally-educated youth
present to the AET system. Daniels feels that the Department of Basic Education needs to
be reminded of their constitutional obligation to provide quality adult basic education to all
learners, illiterate adults included. (Daniels, 2013)
Umalusi’s issues and recommendations
The Council for Quality Assurance in General and Further Education and Training, Umalusi, is the
quality assurer in the general and further education and training bands of the national qualifications
framework (NQF). The Council ensures that the providers of education and training have the capacity
83
FP&M SETA Tracking and Tracing study of Learnerships, Apprenticeships and Bursaries - 2014
to deliver and assess qualifications and learning programmes and are doing so to expected standards
of quality.
An overview of Umalusi research done over the period 2003-2011 describes recommendations and
issues arising in the AET system.
A well-functioning adult learning sector in education required:
A coherent national and provincial education system that supported a
unified and consistent approach to Adult Education and Training (AET)/adult
learning.
Single, nationally developed and dated curriculum documents for all
learning areas and electives (created by the National DoE in collaboration with
provinces, subject experts, and representatives of business, labour and civil
society), which provided proper guidance on content and levels of achievement,
and which were made readily available. Umalusi’s guidelines for curriculum
evaluation could provide a sound framework for curriculum development.
Adult qualifications and curricula that could provide a pathway that began with
learning to read and write and ended with being able to achieve a matric – or
beyond. While it was important for the NQF Levels 1 and 4 curricula for adults
to be determined, AET Levels 1–3 and NQF Levels 1 and 2 required curriculum
input as well.
Standardised and centralised assessment, especially if certification was to
have specific and nationally recognised meaning. In the case of the General
Education and Training Certificate (GETC), quality assurance of assessment
required national curricula, where the DoE or the Independent Examinations
Board (IEB) would be responsible for assessment, and centralised training
plans in the case of industry-related qualifications, where the newly formed
Quality Council for Trades and Occupations (QCTO), responsible for
occupational qualifications delivered primarily in the workplace, would be
responsible for assessment.
84
FP&M SETA Tracking and Tracing study of Learnerships, Apprenticeships and Bursaries - 2014
Bibliography ABET. (2014). Adult Basic Education and Training. Retrieved June 20, 2014, from The government
and ABET: http://www.abet.co.za/government.html
African Economic Outlook. (2013). Young people need more comprehensive education that responds
to labout market needs. Retrieved June 18, 2014, from Education and Skills Mismatch:
http://www.africaneconomicoutlook.org/en/theme/youth_employment/education-skills-
mismatch/
Centre for Higher Education Transformation. (2014). CHET. Retrieved June 23, 2014, from
http://chet.org.za/files/uploads/data/CHET-Undergrad-Throughput.png
Daniels, D. (2013, September 12). Are adult basic education learners being short-changed? Retrieved
June 20, 2014, from Skills Portal, Adult Basic Education and Training:
http://www.skillsportal.co.za/page/training/training_companies/abet/1634220-Are-adult-basic-
education-learners-being-short-changed#.U6QixPmSxqU
Department of Basic Education. (2014). General Household Survey (GHS) 2012: Focus on Schooling.
Pretoria: Department of Basic Education.
Department of Education. (2003). Policy Document on Adult Basic Education and Training.
DHET. (2013). Summary of progress made on NSDS. National Skills Conference 2013 (p. 22).
Boksburg: DHET.
DHET. (2014). Statistics on Post-School Education and Training in South Africa 2012. Pretoria:
Department of Higher Education and Training.
Fisher, G., & Scott, I. (2011). The role of Higher Educaiton in closing the skills gap in South Africa.
The World Bank.
Govender, T. (2013, April 20). The education gap – Practical solutions to key barriers. Retrieved June
18, 2014, from University World News:
http://www.universityworldnews.com/article.php?story=20130419125136707
Hatting, S. (2013, January 14). New Seta grant regulation cause for concern. Retrieved February 13,
2014, from The Skills Portal: http://www.skillsportal.co.za/page/skills-development/1496034-
New-Seta-grant-regulations-cause-for-concern
McGrath, S., & Badroodien, A. (2006). International influences on the evolution of skills. International
Journal of Educational Development 26, 483–494.
Michael and Susan Dell Foundation. (2014). Michael and Susan Dell Foundation. Retrieved June 18,
2014, from http://www.msdf.org/about/where-we-work/south-africa/
Miller, A. (2012, March 12). Adults need customised education. Retrieved February 13, 2014, from
Mail & Guardin: http://mg.co.za/article/2012-03-02-adults-need-customised-education
Muthethwa, S. M. (2012). Job opportunities and unemployment in the South African labour market.
Pretoria: Department of Labour.
Robertson, C. (2006, June 24). Mismanagement of funds is a tragedy caused by lack on control.
Retrieved February 13, 2014, from The Skills Portal:
http://www.skillsportal.co.za/page/features/letters-to-the-ed/589988-Mismanagement-of-
funds-is-a-tragedy-caused-by-lack-on-controls
SABC. (2013, July 12). SETAs are failing : Nzimande. Retrieved 2014, from SABC:
http://www.sabc.co.za/news/a/c2bbda004053c23fb506bf1cdd67c642/SETAs-are-failing-:-
Nzimande-20131207
South Africa Web. (2014). South Africa Web. Retrieved June 20, 2014, from Adult Education:
http://www.southafricaweb.co.za/page/adult-education-south-africa
Statistics SA. (2014). Quarterly Labour Force Survey.
StatsSA. (2013). Social profile of vulnerable groups 2002-2012. Pretoria: Stats SA.
Related Documents