Research Article Techno-Economic Feasibility of Small Scale Hydropower in Ethiopia: The Case of the Kulfo River, in Southern Ethiopia Zelalem Girma 1,2 1 Electrical and Computer Engineering Department, Arba Minch University, P.O. Box 21, Arba Minch, Ethiopia 2 University of Kassel, M¨ onchebergstraße 19, 34109 Kassel, Germany Correspondence should be addressed to Zelalem Girma; [email protected] Received 1 August 2015; Revised 20 October 2015; Accepted 16 November 2015 Academic Editor: Shuhui Li Copyright © 2016 Zelalem Girma. is is an open access article distributed under the Creative Commons Attribution License, which permits unrestricted use, distribution, and reproduction in any medium, provided the original work is properly cited. is paper presents the technical and economic feasibility of grid connected small scale hydropower construction in selected site of the Kulfo River in southern Ethiopia. In doing so the paper presents the general overview of Ethiopia electric power situation; small scale hydropower situation and barriers and drivers for its development; site assessment and cost estimation methods and at the end presents techno-economic analysis of small scale hydropower development on the Kulfo River in southern Ethiopia. e technical and economic feasibility of the site have been studied by using HOMER, RETscreen, and SMART Mini-IDRO soſtware. e result of simulation shows that the construction of small scale hydropower in the Kulfo River is technically and economically feasible with total net present cost of $13,345,150, cost of energy $0.028/kWh, simple payback period of 12.4 year, and internal rate of return 12.9%. e result also shows that construction of hydropower curtails greenhouse gas emissions such as carbon dioxide by 96,685,45 kg/year, sulfur dioxide by 4,1917 kg/year, and nitrogen dioxide by 20,500 kg/year. 1. Introduction Ethiopia is located in east Africa with total area of 1.1 million sq. kilometres and a population of more than 90 million and is endowed with enormous renewable energy resources that include 45,000 MW hydropower, 10,000 MW geother- mal power, 1,350,000 MW wind, and massive solar and biomass potential [1]. Biomass covers 90% of the total energy consumption, mainly used for cooking in the household. Hydropower contributes significantly to electric generation; the current installed electrical capacity reached 2268 MW and two big hydropower projects with capacity 1870 MW (Gilgel Gibe III) and 6250 MW (Grand Renaissance dam) are under construction. e installed capacity is expected to jump to about 8,000–10,000 MW by the end of the growth and transformation plan (2015) [2]. e country power generation dominated by large hydropower. e mountainous landscape feature coupled with hydrological condition enables the country to generate electricity from hydropower at relatively lower cost when compared to other energy sources. e energy consumption of the country is 45 kWh/capita which is the lowest when compared to averages of 578 and 2752 kWh/capita for Africa and the world, respectively [3, 4]. e total electric access rate is around 41% and less than 10% of the rural people connected to the national grid. e government has taken different measures to increase electrification access in the country of which formulation of energy policy in 1994 is one of the positive drives [5]. e policy encourages the use of indigenous resources and renewable energy to secure energy supply and reduce use and dependency on fossil fuel. e policy puts hydropower resource development as top priority due to availability of high potential site suitable to generate electricity at relatively lower cost. Furthermore, the revised policy in 1997 and 2013 encourages private independent power producer (IPP) to participate in energy generation by formulating necessary incentives and feed in tariff law [6, 7]. e revised policy also gave due attention for rural electrification by using renewable energy based off-grid technology. Ethiopian electric power corporation (EEPCO) and Ethiopian rural energy development and promotion centre (EREDPC) are the implementing agencies of grid expansion and off-grid electrification for rural area, respectively, under Hindawi Publishing Corporation Journal of Renewable Energy Volume 2016, Article ID 8037892, 12 pages http://dx.doi.org/10.1155/2016/8037892

Welcome message from author
This document is posted to help you gain knowledge. Please leave a comment to let me know what you think about it! Share it to your friends and learn new things together.
Transcript

Research ArticleTechno-Economic Feasibility of Small Scale Hydropower inEthiopia: The Case of the Kulfo River, in Southern Ethiopia
Zelalem Girma1,2
1Electrical and Computer Engineering Department, Arba Minch University, P.O. Box 21, Arba Minch, Ethiopia2University of Kassel, Monchebergstraße 19, 34109 Kassel, Germany
Correspondence should be addressed to Zelalem Girma; [email protected]
Received 1 August 2015; Revised 20 October 2015; Accepted 16 November 2015
Academic Editor: Shuhui Li
Copyright © 2016 Zelalem Girma. This is an open access article distributed under the Creative Commons Attribution License,which permits unrestricted use, distribution, and reproduction in any medium, provided the original work is properly cited.
This paper presents the technical and economic feasibility of grid connected small scale hydropower construction in selected siteof the Kulfo River in southern Ethiopia. In doing so the paper presents the general overview of Ethiopia electric power situation;small scale hydropower situation and barriers and drivers for its development; site assessment and cost estimation methods and atthe end presents techno-economic analysis of small scale hydropower development on the Kulfo River in southern Ethiopia. Thetechnical and economic feasibility of the site have been studied by using HOMER, RETscreen, and SMART Mini-IDRO software.The result of simulation shows that the construction of small scale hydropower in the Kulfo River is technically and economicallyfeasible with total net present cost of $13,345,150, cost of energy $0.028/kWh, simple payback period of 12.4 year, and internal rateof return 12.9%. The result also shows that construction of hydropower curtails greenhouse gas emissions such as carbon dioxideby 96,685,45 kg/year, sulfur dioxide by 4,1917 kg/year, and nitrogen dioxide by 20,500 kg/year.
1. Introduction
Ethiopia is located in east Africa with total area of 1.1 millionsq. kilometres and a population of more than 90 millionand is endowed with enormous renewable energy resourcesthat include 45,000MW hydropower, 10,000MW geother-mal power, 1,350,000MW wind, and massive solar andbiomass potential [1]. Biomass covers 90% of the total energyconsumption, mainly used for cooking in the household.Hydropower contributes significantly to electric generation;the current installed electrical capacity reached 2268MWand two big hydropower projects with capacity 1870MW(Gilgel Gibe III) and 6250MW (Grand Renaissance dam)are under construction. The installed capacity is expected tojump to about 8,000–10,000MW by the end of the growthand transformation plan (2015) [2].
The country power generation dominated by largehydropower. The mountainous landscape feature coupledwith hydrological condition enables the country to generateelectricity from hydropower at relatively lower cost whencompared to other energy sources. The energy consumptionof the country is 45 kWh/capita which is the lowest when
compared to averages of 578 and 2752 kWh/capita for Africaand the world, respectively [3, 4]. The total electric accessrate is around 41% and less than 10% of the rural peopleconnected to the national grid. The government has takendifferent measures to increase electrification access in thecountry of which formulation of energy policy in 1994 isone of the positive drives [5]. The policy encourages theuse of indigenous resources and renewable energy to secureenergy supply and reduce use and dependency on fossilfuel. The policy puts hydropower resource development astop priority due to availability of high potential site suitableto generate electricity at relatively lower cost. Furthermore,the revised policy in 1997 and 2013 encourages privateindependent power producer (IPP) to participate in energygeneration by formulating necessary incentives and feed intariff law [6, 7]. The revised policy also gave due attention forrural electrification by using renewable energy based off-gridtechnology.
Ethiopian electric power corporation (EEPCO) andEthiopian rural energy development and promotion centre(EREDPC) are the implementing agencies of grid expansionand off-grid electrification for rural area, respectively, under
Hindawi Publishing CorporationJournal of Renewable EnergyVolume 2016, Article ID 8037892, 12 pageshttp://dx.doi.org/10.1155/2016/8037892

2 Journal of Renewable Energy
Ministry of Water, Irrigation and Energy [8]. EREDPC ismandated for off-grid access expansion by promoting privatesector led off-grid rural electrification through participa-tion of the private sector, cooperatives, community basedorganization, and local government where EEPCO cannotcover them due to economic terms. According to a 25-yearmaster plan, EEPCO focused on the development of mediumand large hydropower plant [9] even though the countryhas substantial rivers and streams suitable for small scalehydropower development.
The country generates around 91% of its power from largescale hydropower and small scale hydropower developmentgets little attention from the government side and contributesa small portion in the energy pool of the country. The totalgeneration potential of hydropower is estimated to be 45GWof which only 2% is taped to date [10, 11]. The governmentfive-year (2010–2015) growth and transformation planmainlyfocus on the development of large hydropower, whereassmall and micro hydropower development have been left toprivate sector and NGO who are willing to support ruralelectrification program. As a result the contribution of smalland micro hydropower in the energy pool of the countryis insignificant. However, there are numerous potential sitesidentified by the government to generate electric powerin small, mini, and micro hydropower capacity. Currentlythere are few small hydropower plants operational; mostof them built by the German Cooperation Organization(GIZ). According to [6], the potential of small and microhydropower development of the country is estimated from1500 to 3000MW or about 10% of the overall hydropowerpotential. If this potential is exploited and put into operation,it could provide a considerable contribution to the energymixof the country by meeting the power deficit in the nationalgrid, substituting diesel generators in main and isolated gridand electrifying remote rural area.
In recent times the country has registered remarkableeconomic performance with average annual growth of 10%over the past 10 years, which is double the sub-Saharan Africaand triple the world average growth over this period [12].Thefast growing economy demands a high energy with annualconsumption rate increment of 25%. In recent times, theimbalance between demand and supply of electricity coupledwith the inefficiency of electric utility service created hugegap and also negatively affected the economy of the country.The development of small hydropower in potential rivers inthe country with low construction and commissioning timewill alleviate the power imbalance.
Therefore, this paper examines techno-economic feasi-bility of small hydropower development on the Kulfo Riverin the Gamo Gofa zone, near to Arba Minch town in thesouthern part of Ethiopia to give insight to government,private sector investors, and interested NGO who are willingto contribute to small scale power generation development ofthe country.
The paper is organized in eight sections. Section 1 isan introduction; Section 2 describes the situation of smallscale hydropower development in Ethiopia, its classification,barriers, and drivers; the working principle is describedin Section 3; Section 4 discusses site assessment and cost
RiverRegional boundaryInternational boundaryLakes
River basinAbayAwashAyishaBaro Akobo
DanakilGenale DawaMereb GashOgadenOmo GibeRift VallyTekezeWabi Shebele
Figure 1: Location of major river basin in Ethiopia [15].
estimationmethod; Section 5 discusses the backgroundof thestudy site and load profile; Section 6 discusses methodolo-gies; the simulation result will be discussed in Section 7; andconclusion is put in Section 8.
2. Small Scale HydropowerDevelopment in Ethiopia
Small scale hydropower is estimated to be 10% of the totalhydropower potential of the country. However, in terms oftechnical feasibility, the potential could be reduced by morethan half to about 5% due to inaccessibility, and proximity togrid and service centres [13]. The available potential of smallscale hydropower in the country has hardly been exploitedso far due to government focus on large scale hydropowerdevelopment to meet the energy demand of the country.
As feasibility study, the government identified around 299hydropower potential sites within eleven river basins with atotal potential of 7877MW including both large and smallhydropower. Figure 1 shows major location of river basin inEthiopia. The Abay river basin is the largest basin in termsof hydropower potential site estimated about 79000Gwh/yrwhich cover about 49% of all river basins [14]. The potentialfor small scale hydropower lies in western and southwesternEthiopia, where annual rainfall ranges from 300mm to over900mm especially in Omo Gihbe basin and Abay basin.
2.1. Classification of Hydropower Plant. The hydropowerplant is classified broadly into different classes based on quan-tity of water available, available head, and nature of the load[16]. However, classifications vary from country to country asthere is currently no internationally agreed standard. Ethiopiauses a classification of hydropower systems which differsfrom other countries as shown in Table 1.
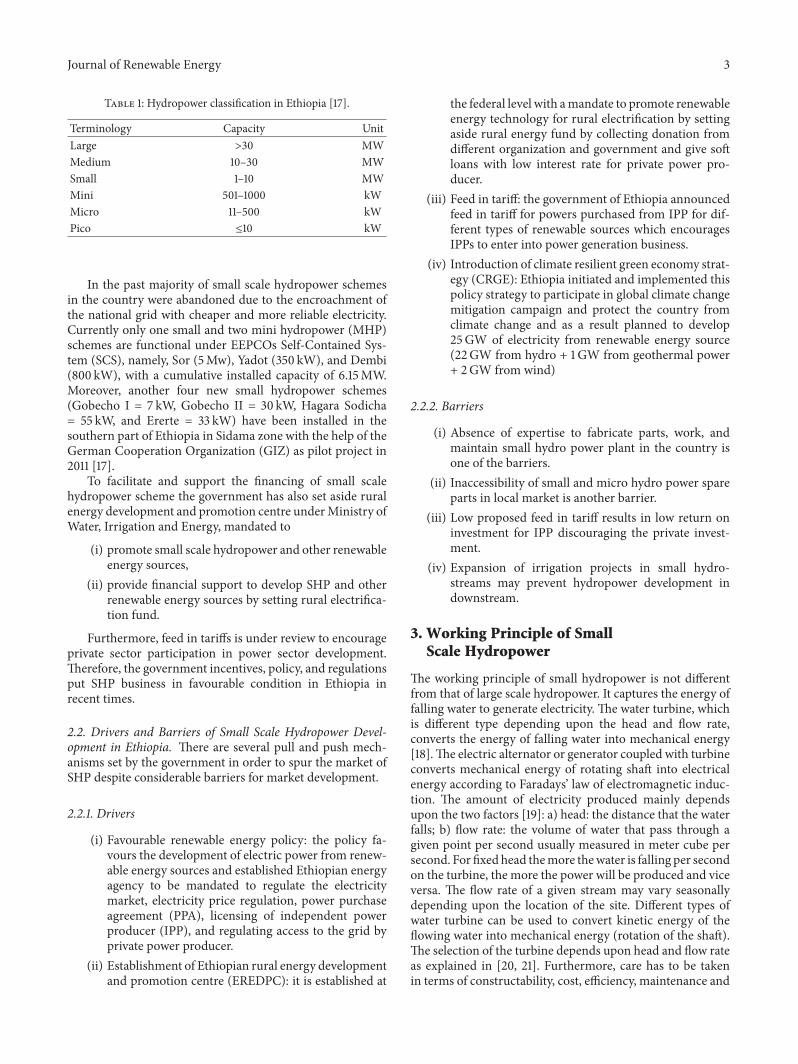
Journal of Renewable Energy 3
Table 1: Hydropower classification in Ethiopia [17].
Terminology Capacity UnitLarge >30 MWMedium 10–30 MWSmall 1–10 MWMini 501–1000 kWMicro 11–500 kWPico ≤10 kW
In the past majority of small scale hydropower schemesin the country were abandoned due to the encroachment ofthe national grid with cheaper and more reliable electricity.Currently only one small and two mini hydropower (MHP)schemes are functional under EEPCOs Self-Contained Sys-tem (SCS), namely, Sor (5Mw), Yadot (350 kW), and Dembi(800 kW), with a cumulative installed capacity of 6.15MW.Moreover, another four new small hydropower schemes(Gobecho I = 7 kW, Gobecho II = 30 kW, Hagara Sodicha= 55 kW, and Ererte = 33 kW) have been installed in thesouthern part of Ethiopia in Sidama zone with the help of theGerman Cooperation Organization (GIZ) as pilot project in2011 [17].
To facilitate and support the financing of small scalehydropower scheme the government has also set aside ruralenergy development and promotion centre underMinistry ofWater, Irrigation and Energy, mandated to
(i) promote small scale hydropower and other renewableenergy sources,
(ii) provide financial support to develop SHP and otherrenewable energy sources by setting rural electrifica-tion fund.
Furthermore, feed in tariffs is under review to encourageprivate sector participation in power sector development.Therefore, the government incentives, policy, and regulationsput SHP business in favourable condition in Ethiopia inrecent times.
2.2. Drivers and Barriers of Small Scale Hydropower Devel-opment in Ethiopia. There are several pull and push mech-anisms set by the government in order to spur the market ofSHP despite considerable barriers for market development.
2.2.1. Drivers
(i) Favourable renewable energy policy: the policy fa-vours the development of electric power from renew-able energy sources and established Ethiopian energyagency to be mandated to regulate the electricitymarket, electricity price regulation, power purchaseagreement (PPA), licensing of independent powerproducer (IPP), and regulating access to the grid byprivate power producer.
(ii) Establishment of Ethiopian rural energy developmentand promotion centre (EREDPC): it is established at
the federal level with amandate to promote renewableenergy technology for rural electrification by settingaside rural energy fund by collecting donation fromdifferent organization and government and give softloans with low interest rate for private power pro-ducer.
(iii) Feed in tariff: the government of Ethiopia announcedfeed in tariff for powers purchased from IPP for dif-ferent types of renewable sources which encouragesIPPs to enter into power generation business.
(iv) Introduction of climate resilient green economy strat-egy (CRGE): Ethiopia initiated and implemented thispolicy strategy to participate in global climate changemitigation campaign and protect the country fromclimate change and as a result planned to develop25GW of electricity from renewable energy source(22GW from hydro + 1GW from geothermal power+ 2GW from wind)
2.2.2. Barriers
(i) Absence of expertise to fabricate parts, work, andmaintain small hydro power plant in the country isone of the barriers.
(ii) Inaccessibility of small and micro hydro power spareparts in local market is another barrier.
(iii) Low proposed feed in tariff results in low return oninvestment for IPP discouraging the private invest-ment.
(iv) Expansion of irrigation projects in small hydro-streams may prevent hydropower development indownstream.
3. Working Principle of SmallScale Hydropower
The working principle of small hydropower is not differentfrom that of large scale hydropower. It captures the energy offalling water to generate electricity. The water turbine, whichis different type depending upon the head and flow rate,converts the energy of falling water into mechanical energy[18].The electric alternator or generator coupled with turbineconverts mechanical energy of rotating shaft into electricalenergy according to Faradays’ law of electromagnetic induc-tion. The amount of electricity produced mainly dependsupon the two factors [19]: a) head: the distance that the waterfalls; b) flow rate: the volume of water that pass through agiven point per second usually measured in meter cube persecond. For fixed head themore thewater is falling per secondon the turbine, the more the power will be produced and viceversa. The flow rate of a given stream may vary seasonallydepending upon the location of the site. Different types ofwater turbine can be used to convert kinetic energy of theflowing water into mechanical energy (rotation of the shaft).The selection of the turbine depends upon head and flow rateas explained in [20, 21]. Furthermore, care has to be takenin terms of constructability, cost, efficiency, maintenance and

4 Journal of Renewable Energy
serviceability, portability, and scope of modularity duringturbine selection.
4. Site Assessment and Cost Estimation
Assessment of the site is a prerequisite in any hydropowerdevelopment [22–24]. From the result of site assessmentone can decide whether the given site is a viable option forhydropower development or not [25]. The key parametersduring the assessment are the pressure head, the flow rateof the given river, and wire to water efficiency of the overallsystem.This parameter can be easily found throughmeasure-ment and manufacturer specification. Then the power whichcan be generated at a specific site can be calculated by usingthe following formula:
𝑃 = 9.81 × 𝑄 × 𝐻 × 𝜂, (1)
where𝑃 is power output in kW,𝑄 is turbine flow inm3/sec,𝐻is net head inmeter (elevation between intake at the river andout late at the turbine less head loss along the power channel),9.81 is acceleration due to gravity (m/sec2), and 𝜂 is overallefficiency of the system.
As seen from the above equation the power generatedfrom the turbine depends upon the discharge rate 𝑄, thenet head 𝐻, and overall efficiency of the system since othervariables are constant in the equation. For the same poweroutput one can either increase head or discharge rate. Usuallythe head is site-dependent and could not be varied. However,the flow rate can be varied by controlling the water enteringinto the penstock. However, the turbine should have acapacity to accommodate the increased discharge.
Furthermore, the head, the discharge, and the desiredrotational speed of the generator determine the type ofturbine to be used. More head or faster flowing water meansmore power.
Design flow is themaximumflow for which the hydrosys-tem is designed. It will likely be less than the maximumflow of the stream (especially during the rainy season), morethan theminimumflow, and a compromise between potentialelectrical output and system cost [26]. The flow durationcurve (FDC) provides means of selecting the right designdischarge by taking into account reserved (residual) flow forenvironmental and aquatic life purpose. Usually the designflow is assumed to be the difference between themean annualflow and the residual flow [27]:
𝑄design = 𝑄mean − 𝑄residual. (2)
Once the design flow and net head are estimated, suitablehead can be selected from turbine selection chart and alsonote that every turbine has a minimum technical flow underwhich the turbine cannot operate or has very low efficiency.
In general, planning a hydropower project is a complexand iterative process, where consideration is given to theenvironmental impact, technological options, economic eval-uation, and other constraints. Even though it is difficult toprovide a detailed guide on how to evaluate a hydropowerscheme, it is possible to provide a short feasibility study of
Load demandcalculation
Financialsummary
EnvironmentalassessmentCivil workPower
summary
Evaluationsystem
Hydro turbineand control
Powercalculation
Penstock, intake,and channels
Flow rate ofwater
Hydraulicpressure head
Topography ofthe site
Figure 2: Planning and evaluation of a small hydropower plant [30].
a given site configuration in order to develop the project[28, 29]. Figure 2 shows the steps of developing and planninga micro hydropower project [30].
4.1. Cost Estimation. The geographical and geological fea-tures along with the effective head, available flow, equipment(turbines, generators, etc.), and civil engineeringworks deter-mine the capital required for any small hydropower project[31]. In general the cost of hydropower project highly dependsupon the site and the location of the project, whether the partsare manufactured locally or imported, and the availability oflocal skilled manpower to construct and maintain the plant.
Among the many factors that affect the cost of a projectare site topography, rock quality, availability of access roads,and the distance to the interconnected grid, earthquake risk,and sediment load in the river [32]. Of course, hydrologyand local cost of labor, cement, steel, and explosives alsomust be factored into the cost equation. In order to graspthe cost structure of hydropower plant around the worldand Ethiopia search and review of literatures have beencarried out from relevant published papers and reports [33,34]. Several studies have been carried out to analyze thecost of small hydropower development depending upon thehydraulic characteristics of a given site and a number of costestimation equations were developed to suite the site specificcondition. The researchers on [35–37] developed empiricalequations to estimate the cost of hydropower projects basedon cost of electromechanical equipment, installed power,hydraulic head, location factors, and so forth. However,developed equations have limitation to apply for all countriesin the world since the assumptions used were not inclusive ofthe nature in all countries. Therefore the World Bank groupand IEA [38] studied extensively the project cost of differenthydropower projects in the globe and come out with the costrange table depending upon the hydropower type (Table 2)[38].
A recent study of International Renewable EnergyAgency(IRENA-2012) [39] also shows that the investment cost oflarge hydropower plants with storage typically ranges from aslow as USD 1050/kW to as high as USD 7650/kW while therange of small hydropower projects is betweenUSD 1300/kWand 8000/kW depending upon the site condition. Figure 3shows the investment cost in different country, includingEthiopia, and confirms the investment cost report by theEthiopia’s Ministry of Water, Irrigation and Energy which

Journal of Renewable Energy 5
Table 2: World Bank and IEA cost estimate of hydropower [38, 40].
Project cost $/kW Head range (m) RemarkEstimate of World Bank group 2012
1800–8000 2.3–13.5 Low head1000–3000 27–350 High head
Estimate of IEA 20102000–7500 Small scale hydropower2500–10000 Mini hydropower1500–2500 Low head hydropower
0 5000 10000 2000015000 25000 30000
(kW)
IndiaChinaSouth Africa
EthiopiaRwandaUganda
0
1000
2000
3000
4000
5000
6000
7000
8000
2010
(USD
/kW
)
Figure 3: Installed capital costs for small hydro in developingcountries by capacity [39].
ranges from 3500 to 4000 $/kW [39]. In the economicassessment of proposed hydropower $3500/kW was used toestimate the capital cost of the plant.
5. Background of the Study Site
The Kulfo River basin is situated in relatively dry southernarea of the Ethiopia in Gamo Gofa zone near to Arba Minchtown at latitude 6∘N and 37.5∘E and is still under geographicalmodification with hilly topography and impervious soiltexture as shown in Figure 4. The river flows through ArbaMinch forest and drains into Lake Chamo. The site wasselected due to the fact that the river flows throughout theyear; it is near to national grid so that it can be easilyconnected to national grid with low grid interconnectioncharge; the train of the site is very suitable for hydropowerdevelopment; and the construction of the power plant doesnot have social and environmental impact.
As seen from the eleven-year (1994–2007) daily flow dataof the river in Figure 5 which was collected fromArbaMinchUniversity gauging station, the river has aminimumflow rateof 6m3/sec. on February and maximum flow of 19.1m3/sec.on October. Its average flow rate is 12.4m3/sec. The riverhas high daily and intermonth variability and low interyear
Figure 4: Google satellite map image of the site.
Jan. Feb. Mar. Apr. May Jun. Jul. Aug. Sep. Oct. Nov. Dec.0
5
10
15
20
25Mean flow rate of Kulfo River (1994–2007)
Figure 5: Average stream flow of the Kulfo River (1994–2007).
variability. In cases where therewere gapswithin the data, dueto temporary failures of themeasuring equipment, the recordsystem, or any other reason, the gaps were noted and theaverage data of the previous day and the day after the misseddata was taken. Furthermore, the data sets were carefullyscreened for anomalies. Figure 5 shows the monthly flow rateof the Kulfo River.
Prefeasibility study has been done on the site in orderto get basic information on the situation of the site, thevariability of the river, and the demographic and topographicnature of the site and also to analyze the suitability ofthe topography for hydropower generation. Form feasibilitystudy it is noted that, in downstream of the river, thereis agricultural land owned by private investor which usespart of the river for irrigation. Part of the river is also usedby people settled along the water shed of the river. As aresult, the location selected for construction of small scalehydropower is above the agricultural land and does not affectthe operation of farming in downstream.
As shown in Figure 5 the river has high variability andis not suitable to construct run of river scheme withoutdiversion. The diversion also helps to settle the debris andto control flow of water during rain and dry seasons. Due tohydraulic head limitation and flow constraints the maximumeconomical potential of the river has calculated as 2.2MWby taking 50% of available flow rate (9522 L/sec.) at the grosshead of 25 meters.
SMART Mini-IDRO software [41, 42] has been usedto draw flow duration curve (FDC) and to analyze thepreliminary electric generation potential of the river. SMART

6 Journal of Renewable Energy
0 10 20 30 40 50 60 70 80 90 100
Duration (%)
Flow and power duration curves
Available dischargeHydropower discharge
Actual power
0
500
1000
1500
2000
2500
Pow
er (k
W)
0
4000
8000
12000
16000
20000
Disc
harg
e (L/
s)
Figure 6: FDC and power curve.
Mini-IDRO is a tool for technical and economical evalu-ation of mini hydropower plants and evaluates the energyproduction, benefits, and financial aspects and assesses thedischarge availability. From the SMARTMini-IDRO softwareanalysis, the river has theoretical potential of 4.5MW, thetechnical potential of 4MW, and economic potential of2.2MW. Figure 6 shows FDC and power curve of the site.
6. Methodology
Extensive literature review has been done to grasp the statusof electrification and its challenge in the country by givingparticular attention on small scale hydropower developmentto know its past and present status, drivers, barriers, anddeployment.The site assessment and cost estimation methodin hydropower development have also been reviewed. Aftergetting overall situation on electrification status, small andlarge scale hydropower development, site assessment, andcost estimationmethods, case study site (the Kulfo River) hasbeen selected in southern Ethiopia near Arba Minch townwith the following assumptions:
(i) The developed small hydropower is intended to beowned by the private power producer (IPP).
(ii) The hydropower first supplies the rural village nearbyand supplies surplus power to the national grid at Lowvoltage.
(iii) EEPCO is the only buyer of surplus electricity withagreed feed in tariff.
(iv) Small hydropower station can purchase power fromEEPCO during dry season when hydropower fails tosupply full load to the rural village.
With the above assumptions techno-economic analysisof the small hydropower constructed on the Kulfo River hasbeen done by using HOMER, RETscreen, and SMARTMini-IDRO software. HOMER is micro power optimizationmodeldeveloped by U.S. National Renewable Energy Laboratory(NREL) to assist the design of micro power system and tofacilitate the comparison of different technologies [43, 44].The software can model off-grid and grid connected powersystem. It performs three principal tasks: simulation, opti-mization, and sensitivity analysis. In the simulation process,
ACHydro
Grid
Rural and internal load
2256.00 kWh/d222.12 kW peak
Figure 7: HOMER system configuration.
the software models the performance of a micro power sys-tem configuration each hour of the year to determine its tech-nical feasibility and life cycle cost. In the optimization processit searches among feasible options the one that satisfies tech-nical constraints at the lowest life cycle cost. In the sensitivityanalysis process it assesses the effect of uncertainty or changein the variable over which the designer has no control such aschange in flow rate, interest rate, and inflation rate. HOMERuses net present cost (NPC)method to represent the life cyclecost of the system and rank the optimal feasible one accordingto total net present cost and present the feasible one withlowest total net present cost as the optimal system.
HOMER software has been used to find the optimal totalnet present cost (TNPC), generation cost of the power plant,to do sensitivity analysis on determinant but uncontrollablevariables (flow rate, inflation rate, load change, and grid salecapacity), to compute the total amount electricity purchasedfrom and sold to the grid in kilowatt hour (kWh). RETscreensoftware has been used to compute simple payback period,internal rate of return and to draw cumulative cash flowwithin project life time. SMARTMini-IDRO software is usedto draw flow duration curve, to determine design flow, andto compute theoretical, technical, and economic potential ofproposed hydropower.
7. System Configuration and SimulationResult in HOMER Environment
Figure 7 shows the configuration of the proposed grid con-nected small scale hydropower with local and internal load inHOMER simulation andoptimization environment.The con-figuration contains hydro, grid, and load asmain component.
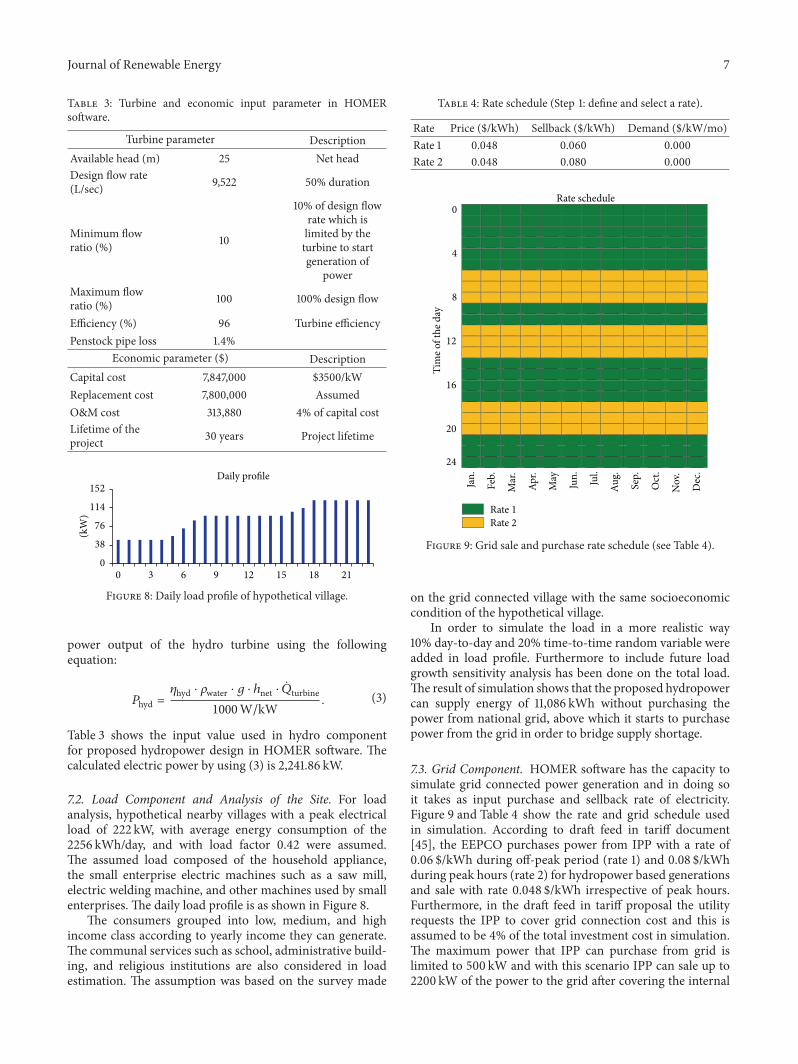
7.1. Hydro Component. The hydro component in the sim-ulation needs equipment capital cost, replacement cost,maintenance, and operation cost as input variable; the systemlifetime for economic evaluation and available head, designflow rate, percentage of minimum and maximum flow rate,efficiency, and pipe friction losses as turbine parameter. Afterinserting input variables HOMER calculates the electrical
Journal of Renewable Energy 7
Table 3: Turbine and economic input parameter in HOMERsoftware.
Turbine parameter DescriptionAvailable head (m) 25 Net headDesign flow rate(L/sec) 9,522 50% duration
Minimum flowratio (%) 10
10% of design flowrate which islimited by theturbine to startgeneration of
powerMaximum flowratio (%) 100 100% design flow
Efficiency (%) 96 Turbine efficiencyPenstock pipe loss 1.4%
Economic parameter ($) DescriptionCapital cost 7,847,000 $3500/kWReplacement cost 7,800,000 AssumedO&M cost 313,880 4% of capital costLifetime of theproject 30 years Project lifetime
Daily profile
0
38
76
114
152
(kW
)
3 6 90 15 18 2112
Figure 8: Daily load profile of hypothetical village.
power output of the hydro turbine using the followingequation:
𝑃hyd =𝜂hyd ⋅ 𝜌water ⋅ 𝑔 ⋅ ℎnet ⋅ ��turbine
1000W/kW. (3)
Table 3 shows the input value used in hydro componentfor proposed hydropower design in HOMER software. Thecalculated electric power by using (3) is 2,241.86 kW.
7.2. Load Component and Analysis of the Site. For loadanalysis, hypothetical nearby villages with a peak electricalload of 222 kW, with average energy consumption of the2256 kWh/day, and with load factor 0.42 were assumed.The assumed load composed of the household appliance,the small enterprise electric machines such as a saw mill,electric welding machine, and other machines used by smallenterprises. The daily load profile is as shown in Figure 8.
The consumers grouped into low, medium, and highincome class according to yearly income they can generate.The communal services such as school, administrative build-ing, and religious institutions are also considered in loadestimation. The assumption was based on the survey made
Table 4: Rate schedule (Step 1: define and select a rate).
Rate Price ($/kWh) Sellback ($/kWh) Demand ($/kW/mo)Rate 1 0.048 0.060 0.000Rate 2 0.048 0.080 0.000
Rate schedule0
Tim
e of t
he d
ay
Rate 1Rate 2
4
8
12
16
20
24Ja
n.
Feb.
Mar
.
Apr.
May
Jun. Jul.
Aug.
Sep.
Oct
.
Nov
.
Dec
.
Figure 9: Grid sale and purchase rate schedule (see Table 4).
on the grid connected village with the same socioeconomiccondition of the hypothetical village.
In order to simulate the load in a more realistic way10% day-to-day and 20% time-to-time random variable wereadded in load profile. Furthermore to include future loadgrowth sensitivity analysis has been done on the total load.The result of simulation shows that the proposed hydropowercan supply energy of 11,086 kWh without purchasing thepower from national grid, above which it starts to purchasepower from the grid in order to bridge supply shortage.
7.3. Grid Component. HOMER software has the capacity tosimulate grid connected power generation and in doing soit takes as input purchase and sellback rate of electricity.Figure 9 and Table 4 show the rate and grid schedule usedin simulation. According to draft feed in tariff document[45], the EEPCO purchases power from IPP with a rate of0.06 $/kWh during off-peak period (rate 1) and 0.08 $/kWhduring peak hours (rate 2) for hydropower based generationsand sale with rate 0.048 $/kWh irrespective of peak hours.Furthermore, in the draft feed in tariff proposal the utilityrequests the IPP to cover grid connection cost and this isassumed to be 4% of the total investment cost in simulation.The maximum power that IPP can purchase from grid islimited to 500 kW and with this scenario IPP can sale up to2200 kW of the power to the grid after covering the internal
8 Journal of Renewable Energy
24
18
12
6
0
(h)
Grid outage1
90 180 270 365
Day number in the year1
0
Figure 10: Reliability of national grid.
and village load. The simulated rate and schedule are shownin Table 4 and Figure 9.
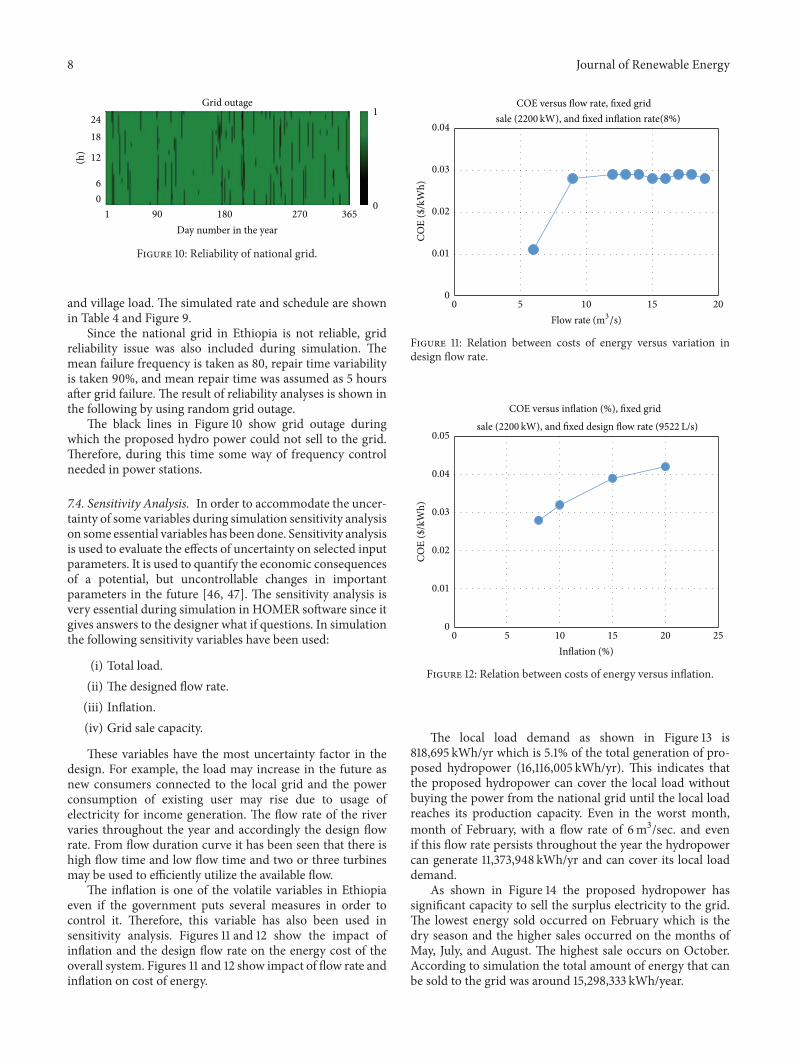
Since the national grid in Ethiopia is not reliable, gridreliability issue was also included during simulation. Themean failure frequency is taken as 80, repair time variabilityis taken 90%, and mean repair time was assumed as 5 hoursafter grid failure. The result of reliability analyses is shown inthe following by using random grid outage.
The black lines in Figure 10 show grid outage duringwhich the proposed hydro power could not sell to the grid.Therefore, during this time some way of frequency controlneeded in power stations.
7.4. Sensitivity Analysis. In order to accommodate the uncer-tainty of some variables during simulation sensitivity analysison some essential variables has been done. Sensitivity analysisis used to evaluate the effects of uncertainty on selected inputparameters. It is used to quantify the economic consequencesof a potential, but uncontrollable changes in importantparameters in the future [46, 47]. The sensitivity analysis isvery essential during simulation in HOMER software since itgives answers to the designer what if questions. In simulationthe following sensitivity variables have been used:
(i) Total load.(ii) The designed flow rate.(iii) Inflation.(iv) Grid sale capacity.
These variables have the most uncertainty factor in thedesign. For example, the load may increase in the future asnew consumers connected to the local grid and the powerconsumption of existing user may rise due to usage ofelectricity for income generation. The flow rate of the rivervaries throughout the year and accordingly the design flowrate. From flow duration curve it has been seen that there ishigh flow time and low flow time and two or three turbinesmay be used to efficiently utilize the available flow.
The inflation is one of the volatile variables in Ethiopiaeven if the government puts several measures in order tocontrol it. Therefore, this variable has also been used insensitivity analysis. Figures 11 and 12 show the impact ofinflation and the design flow rate on the energy cost of theoverall system. Figures 11 and 12 show impact of flow rate andinflation on cost of energy.
COE versus flow rate, fixed grid sale (2200 kW), and fixed inflation rate(8%)
5 10 15 2000
0.01
0.02
0.03
0.04
COE
($/k
Wh)
Flow rate (m3/s)
Figure 11: Relation between costs of energy versus variation indesign flow rate.
COE versus inflation (%), fixed grid
5 10 15 20 250Inflation (%)
0
0.01
0.02
0.03
0.04
0.05CO
E ($
/kW
h)sale (2200 kW), and fixed design flow rate (9522 L/s)
Figure 12: Relation between costs of energy versus inflation.
The local load demand as shown in Figure 13 is818,695 kWh/yr which is 5.1% of the total generation of pro-posed hydropower (16,116,005 kWh/yr). This indicates thatthe proposed hydropower can cover the local load withoutbuying the power from the national grid until the local loadreaches its production capacity. Even in the worst month,month of February, with a flow rate of 6m3/sec. and evenif this flow rate persists throughout the year the hydropowercan generate 11,373,948 kWh/yr and can cover its local loaddemand.
As shown in Figure 14 the proposed hydropower hassignificant capacity to sell the surplus electricity to the grid.The lowest energy sold occurred on February which is thedry season and the higher sales occurred on the months ofMay, July, and August. The highest sale occurs on October.According to simulation the total amount of energy that canbe sold to the grid was around 15,298,333 kWh/year.

Journal of Renewable Energy 9
6 9 12 13 14 15 16 17 18 19
Comparison of energy generated from hydropowerand load demand per year
Energy generated from hydropower (kWh/yr)Load demand (kWh/yr)
0
5
10
15
20
25×10
6
Discharge (m3/s)
Figure 13: Energy generated versus load demand per year.
Jan.
Feb.
Mar
.Ap
r.M
ayJu
n. Jul.
Aug.
Sep.
Oct
.N
ov.
Dec
.0
200,000
400,000
600,000
800,000
1,000,000
1,200,000
1,400,000
1,600,000
1,800,000year in kWh
Energy sold to the grid
Figure 14: Energy sold to the grid in each month of the year.
The total earning from grid sale was around $1,031,914 peryear. Figure 15 shows the monthly income from grid sell. Thelowest sell. occurred in themonth of February and the highestsale occurs in the month of October.
8. Conclusion
Ethiopia has immense potential for small scale hydropowerdevelopment. However, to tap these potential active gov-ernment engagement in facilitating policy and regulatoryreform regrading small hydropower is needed. After decadesof powers sector reform in the country which allows IPPto produce and sale electricity to national grid, no activeparticipation is seen from private sector.Themain bottleneckis the feed in tariff law which is not finalized yet. In addition,
Earning from grid sale in US dollar per year
0
20000
40000
60000
80000
100000
120000
Jan.
Feb.
Mar
.Ap
r.M
ayJu
n. Jul.
Aug.
Sep.
Oct
.N
ov.
Dec
.
Figure 15: Monthly earning from grid sale.($
)
−5000 Year
1 2 3 4 5 6 7 8 910
2930· · ·
0
5000
10,000
15,000
20,000
25,000
0Financial viabilityPretax IRR-equityPretax IRR-assetsSimple paybackEquity payback
(%)(%)(yr)(yr)
12.9%4.9%12.4%13.4%
Figure 16: Cumulative cash flow of the project with RETscreensimulation software.
Table 5: System architecture.
Hydro Hydroelectric 2,242 kWGrid Grid 500 kWDispatch strategy Load following
Table 6: Cost summary.
Total net present cost −13345150 $Levelized cost of energy −0.028 $/kWh
government has to use various push and pull mechanismsto promote and motivate IPP in power generation market.Moreover the required data regarding small hydropower

10 Journal of Renewable Energy
Table 7: Net present costs.
Component Capital Replacement O&M Fuel Salvage TotalHydro 7,847,000 0 9,416,400 0 0 17,263,400Grid 313,880 0 −30,957,424 0 0 −30,643,544Other 5,000 0 30,000 0 0 35,000System 8,165,880 0 −21,511,026 0 0 −13,345,146
Table 8: Annualized costs.
Component Capital Replacement O&M Fuel Salvage TotalHydro 261,567 0 313,880 0 0 575,447Grid 10,463 0 −1,031,914 0 0 −1,021,451Other 167 0 1,000 0 0 1,167System 272,196 0 −717,034 0 0 −444,838
Hydro
Janu
ary
Febr
uary
Mar
ch
April
May
June July
Augu
st
Sept
embe
r
Oct
ober
Nov
embe
r
Dec
embe
r
05001000150020002500
(kW
)
Production (kWh/yr) (%)Hydro 100
10016,116,00516,116,005
Total
(kWh/yr) (%)
0
16,117,025
15,298,330
818,6950.0
94.9
100.0
5.1
Total
ConsumptionAC primary loadDC primary loadGrid sales
(kWh/yr) (%)
0.00.0
0.00.08.7
0.0
Excess electricityUnmet electric loadCapacity shortage
Quantity
100.0100.4
Quantity ValueRenewable fractionMax. renew. penetration
Total NPCLevelized COE:Operating cost:
(3,345,150)($0.028)
($717,034)System architecture:
Grid (500kW)Hydroelectric (2241.9 kW)Load following
Cost summary Cash flow Electrical Grid Hydroelectric Emissions
Figure 17: Electrical output.
development has to be gathered and put into database so thatinterested IPP can access and do informed decisions.
In this work overall electrification status in Ethiopiaand small scale hydropower development situation with itsdrivers and barriers have been reviewed in the first fewsections. The policy and regulatory changes in powers sectorreform have also been dealt. Then techno-economic feasi-bility study on selected site in southern region on the KulfoRiver has been done in order to assess and study technicaland economic feasibility of the project. Techno-economicanalysis has been done by using HOMER and RETscreensoftware has been used to calculate payback period andIRR and also used to draw cumulative cash flow (Figure 16).Overall potential (theoretical, technical, and economic) of
24181260
1 90 180 270 365
Hydro output2,210.47
0
(kW
)
(kW)(kW)
(kWh/yr)(%)
2241.91839.782.063
16116005
Quantity Value UnitsNominal capacityMean outputCapacity factorTotal production
(kW)(kW)
(hrs/yr)($/kWh)
(%)
817.572210.5
0.0357078760
1968.5
Quantity Value UnitsMinimum outputMaximum outputHydro penetrationHours of operationLevelized cost
Total NPCLevelized COE:Operating cost:
(3,345,150)($0.028)
($717,034)System architecture:
Grid (500kW)Hydroelectric (2241.9 kW)Load following
Cost summary Cash flow Electrical Grid Hydroelectric Emissions
Figure 18: Hydroelectric output.
24
18
12
6
0
1 90 180 270 365
2,200.00
0
(kW
)
Figure 19: Energy sold to grid.
proposed hydropower has been computed by using SMARTMini-IDRO software. The objective is to show the overallsituation of small hydropower and its technical and economicfeasibility by using simulation.
The result of HOMER simulation software shows thatsmall hydropower development is profitable in the proposedspecific site. It has very low levelized cost of energy (COE)around $0.028/kWh for proposed local load. It has also leasttotal net present cost of $13,345,150 and can deliver 95% ofthe generated power to the grid after covering the local load.It is also seen from the result of RETscreen software that theproject has simple payback time of 12.4 years with IRR of

Journal of Renewable Energy 11
Table 9: Electrical.
Quantity Value UnitsExcess electricity 9 kWh/yrUnmet load 0 kWh/yrCapacity shortage 0 kWh/yrComponent Production (kWh/yr) Fraction (%)Total 16,116,005 100Load Consumption (kWh/yr) Fraction (%)AC primary load 818,695 5DC primary load 0 0Grid sales 15,298,330 95Total 16,117,025 100
Table 10: Emissions.
Pollutant Emissions UnitsCarbon dioxide −9668545 kg/yrCarbon monoxide 0 kg/yrUnburned hydrocarbons 0 kg/yrParticulate matter 0 kg/yrSulfur dioxide −41917 kg/yrNitrogen oxides −20500 kg/yr
12.9%. As shown in the simulation of this particular site, smallscale hydropower is a technical and economical feasibility inthis specific selected site.
Appendix
Sample HOMER Simulation Output
System Report. See Tables 5, 6, 7, 8, 9, and 10 and Figures17, 18, and 19.
Conflict of Interests
The author declares that there is no conflict of interestsregarding the publication of this paper.
References
[1] D. Derbew, “Ethiopia’s Renewable Energy Power Potentialand Development Opportunities,” 2013, http://www.irena.org/DocumentDownloads/events/2013/July/Africa%20CEC%20ses-sion%203 Ministry%20of%20Water%20and%20Energy%20-Ethiopia Beyene 220613.pdf.
[2] Ethiopian Energy Authority, June 2015, http://www.ethioener-gyauthority.gov.et/attachments/article/63/DRAFT%20FINAL-%20MARCH%206%202015%20%20%20Version%20IIIcom-ment.pdf.
[3] D. Chandrasekharam and V. Chandrasekhar, “Clean devel-opment mechanism through geothermal: Ethiopian scenario,”in Proceedings of the 4th African Rift Geothermal Conference,Nairobi, Kenya, November 2012.
[4] A. Evans, Resources, Risk and Resilience: Scarcity and ClimateChange in Ethiopia, Center on International Cooperation, New
York University, 2012, http://cic.nyu.edu/sites/default/files/evans security ethiopia 2012.pdf.
[5] Small scale Hydro power for rural development, Nile basincapacity building network NBCBN, 2005, http://www.nbcbn.com/Project Documents/Progress Reports/Hp-G1.pdf.
[6] M. Abebe, “The Ethiopian power sector reform and its role forenhancing IPP investment opportunities,”April 2015, http://www.engerati.com/hubs/articles/ethiopian-power-sector-reform-and-its-role-enhancing-ipps-investment-opportunities.
[7] M. Teferra, “Power sector reforms in Ethiopia: options forpromoting local investments in rural electrification,” EnergyPolicy, vol. 30, no. 11-12, pp. 967–975, 2002.
[8] USAID, “InvestmentBrief for energy sector in Ethiopia,”http://www.usaid.gov/powerafrica.
[9] Ethiopian Power System Expansion Master Plan update(EPSEMPU), http://www.bgr.de/geotherm/ArGeoC1/pdf/06%20Energy%20master%20plan.pdf.
[10] M. Abebe, “Hydropower development in Ethiopia vis-a-visperspective regional power trade,” in Proceedings of the Inter-national Information System for the Agricultural Science andTechnology (AGRIS ’05), pp. 155–180, 2005.
[11] Ethiopia Energy Situation, https://energypedia.info/wiki/Ethi-opia Energy Situation#Hydropower.
[12] Country Economic Brief—UNDP in Ethiopia, http://www.et.undp.org/content/dam/ethiopia/docs/Country%20Economic%20Brief%201%20final%20for%20web.pdf.
[13] Shanko, Melessaw Target Market Analysis: Ethiopia’s SmallHydro Energy Market, https://www.giz.de/static/themen um-leitung/index.html.
[14] W. Abtew and A. M. Melesse, “Enhancing water productivityin crop-livestock systems of the Nile Basin: improving systemsand livelihoods,” in Proceedings of the Workshop on Hydrologyand Ecology of the Nile River Basin under Extreme Conditions,pp. 16–19, Aardvark Global, Addis Ababa, Ethiopia, June 2008.
[15] Major River Basins of Ethiopia, February 2015, http://www.idp-uk.org/Resources/Maps/TopographicThematic%20Maps/Major-River-Basins-Map.pdf.
[16] W. J. Klunne, “Small hydropower in Southern Africa—anoverview of five countries in the region,” Journal of Energy inSouthern Africa, vol. 24, no. 3, pp. 14–25, 2013.
[17] K. Meder, Application of environment assessment related to GIZECO micro hydropower plants in the Sidama Zone/Ethiopia[M.S. thesis], HeidelbergUniversity, Heidelberg, Germany, 2011.
[18] O. Paish, “Small hydro power: technology and current status,”Renewable and Sustainable Energy Reviews, vol. 6, no. 6, pp. 537–556, 2002.
[19] A. Omojolaa and O. A. Oladejib, “Small hydro power for ruralelectrification in Nigeria,” American Journal of Science andEngineering, vol. 1, no. 2, 2012.
[20] M. Saikia, “Remote village electrification by small hydropowerproject in Assam,” Indian Journal of Energy, vol. 3, no. 1, pp. 140–147, 2014.
[21] H. Sharma and J. Singh, “Run off river plant: status andprospects,” International Journal of Innovative Technology andExploring Engineering, vol. 3, no. 2, pp. 210–213, 2013.
[22] B. C. Kusre, D. C. Baruah, P. K. Bordoloi, and S. C. Patra,“Assessment of hydropower potential using GIS and hydrologi-cal modeling technique in Kopili River basin in Assam (India),”Applied Energy, vol. 87, no. 1, pp. 298–309, 2010.
[23] C.-S. Yi, J.-H. Lee, and M.-P. Shim, “Site location analysisfor small hydropower using geo-spatial information system,”Renewable Energy, vol. 35, no. 4, pp. 852–861, 2010.

12 Journal of Renewable Energy
[24] L. Kosnik, “The potential for small scale hydropower develop-ment in the US,” Energy Policy, vol. 38, no. 10, pp. 5512–5519,2010.
[25] C. S. Kaunda, C. Z. Kimambo, and T. K. Nielsen, “Potentialof small-scale hydropower for electricity generation in Sub-Saharan Africa,” ISRN Renewable Energy, vol. 2012, Article ID132606, 15 pages, 2012.
[26] BHA, A Guide to UK Mini-Hydro Developments, BHA, 2005,http://www.british-hydro.org/Useful Information/A%20Guide-%20to%20UK%20mini-hydro%20development%20v3.pdf.
[27] http://www.microhydropower.net/.[28] U. G. Wali, “Estimating hydropower potential of an ungauged
stream,” International Journal of Emerging Technology andAdvanced Engineering, vol. 3, no. 11, pp. 592–600, 2013.
[29] M.C. Tuna, “Feasibility assessment of hydroelectric power plantin ungauged river basin: a case study,” Arabian Journal forScience and Engineering, vol. 38, no. 6, pp. 1359–1367, 2013.
[30] Small Hydro power, 2015, http://smallhydro.com.[31] S. K. Singal, R. P. Saini, and C. S. Raghuvanshi, “Analysis for
cost estimation of low head run-of-river small hydropowerschemes,” Energy for Sustainable Development, vol. 14, no. 2, pp.117–126, 2010.
[32] A. Date and A. Akbarzadeh, “Design and cost analysis of lowhead simple reaction hydro turbine for remote area powersupply,” Renewable Energy, vol. 34, no. 2, pp. 409–415, 2009.
[33] H. Motwani, S. V. Jain, R. N. Patel et al., “Cost analysis of pumpas turbine for pico hydropower plants—a case study,” ProcediaEngineering, vol. 51, pp. 721–726, 2013.
[34] S. Mishra, S. K. Singal, and D. K. Khatod, “Costing of a smallhydropower projects,” International Journal of Engineering andTechnology, vol. 4, no. 3, pp. 239–242, 2012.
[35] J. L. Gordon and A. C. Penman, “Quick estimating techniquesfor small hydro potential,” Journal of Water Power and DamConstruction, vol. 31, pp. 46–55, 1979.
[36] D. Papantonis, Small Hydro Power Stations, Simeon, Athens,Greece, 2001.
[37] G. A. Aggidis, E. Luchinskaya, R. Rothschild, andD. C.Howard,“The costs of small-scale hydro power production: impact onthe development of existing potential,” Renewable Energy, vol.35, no. 12, pp. 2632–2638, 2010.
[38] Q. F. (Katherine) Zhang, “Small Hydropower Cost ReferenceModel,” May 2015, http://info.ornl.gov/sites/publications/files/pub39663.pdf.
[39] IRENA, Renewable Energy Technologies: Cost Analysis Series,Hydropower, Volume 1: Power Sector Issue 3/5, InternationalRenewable Energy Agency, Masdar City, United Arab Emirates,2012.
[40] IEA-ETSAP, “Technology Brief E12,” 2010, http://www.etsap.org/.
[41] SEE hydropower clean water clean energy, http://www.seehy-dropower.eu/download tools/details.php?id=1.
[42] Technical/economical evaluation of SHP plants: SMARTMini-Idro tool, April 2015, http://www.seehydropower.eu/.
[43] RETScreen, http://www.retscreen.net/.[44] HOMERsoftware, http://homerenergy.com/software.html.[45] J. Nganga, M.Wohlert, andM.Woods, Powering Africa through
Feed-in Tariffs, Renewable Energy Ventures Kenya, Nairobi,Kenya, 2013, https://www.boell.de/sites/default/files/2013-03-powering-africa through-feed-in-tariffs.pdf.
[46] J. K. Kaldellis, D. S. Vlachou, and G. Korbakis, “Techno-economic evaluation of small hydro power plants in Greece: acomplete sensitivity analysis,” Energy Policy, vol. 33, no. 15, pp.1969–1985, 2005.
[47] A. Salmani, S. Sadeghzadeh, and M. R. Naseh, “Optimizationand sensitivity analysis of a hybrid system in KISH-IRAN,”International Journal of Emerging Technology and AdvancedEngineering, vol. 4, no. 1, 2014.

TribologyAdvances in
Hindawi Publishing Corporationhttp://www.hindawi.com Volume 2014
International Journal of
AerospaceEngineeringHindawi Publishing Corporationhttp://www.hindawi.com Volume 2014
FuelsJournal of
Hindawi Publishing Corporationhttp://www.hindawi.com Volume 2014
Journal ofPetroleum Engineering
Hindawi Publishing Corporationhttp://www.hindawi.com Volume 2014
Industrial EngineeringJournal of
Hindawi Publishing Corporationhttp://www.hindawi.com Volume 2014
Power ElectronicsHindawi Publishing Corporationhttp://www.hindawi.com Volume 2014
Advances in
CombustionJournal of
Hindawi Publishing Corporationhttp://www.hindawi.com Volume 2014
Journal of
Hindawi Publishing Corporationhttp://www.hindawi.com Volume 2014
Renewable Energy
Submit your manuscripts athttp://www.hindawi.com
Hindawi Publishing Corporationhttp://www.hindawi.com Volume 2014
StructuresJournal of
International Journal of
RotatingMachinery
Hindawi Publishing Corporationhttp://www.hindawi.com Volume 2014
EnergyJournal of
Hindawi Publishing Corporationhttp://www.hindawi.com Volume 2014
Hindawi Publishing Corporation http://www.hindawi.com
Journal ofEngineeringVolume 2014
Hindawi Publishing Corporation http://www.hindawi.com Volume 2014
International Journal ofPhotoenergy
Hindawi Publishing Corporationhttp://www.hindawi.com Volume 2014
Nuclear InstallationsScience and Technology of
Hindawi Publishing Corporationhttp://www.hindawi.com Volume 2014
Solar EnergyJournal of
Hindawi Publishing Corporationhttp://www.hindawi.com Volume 2014
Wind EnergyJournal of
Hindawi Publishing Corporationhttp://www.hindawi.com Volume 2014
Nuclear EnergyInternational Journal of
Hindawi Publishing Corporationhttp://www.hindawi.com Volume 2014
High Energy PhysicsAdvances in
The Scientific World JournalHindawi Publishing Corporation http://www.hindawi.com Volume 2014
Related Documents