Journal of Visual Languages and Computing (1997) 8, 563—599 Representation Design Benchmarks: A Design-Time Aid for VPL Navigable Static Representations SHERRY YANG*, MARGARET M. BURNETT * ,² , ELYON DEKOVEN ‡ AND MOSHE ¤ ZLOOF ‡ *Department of Computer Science, Oregon State University, Corvallis, OR 97331-3202 U.S. A. yang@cs.orst.edu, burnett@cs.orst.edu ‡ Hewlett-Packard Labs, P.O. Box 10490, Palo Alto, CA 94303-0969 U.S. A. dekoven@hpl.hp.com, zloof@hpl.hp.com Received 18 August 1995; revised 10 March 1997; accepted 8 April 1997 A weakness of many interactive visual programming languages ( VPLs) is their static representations. Lack of an adequate static representation places a heavy cognitive burden on a VPL’s programmers, because they must remember potentially long dynamic sequences of screen displays in order to understand a previously written program. However, although this problem is widely acknowledged, research on how to design better static representations for interactive VPLs is still in its infancy. Building upon the cognitive dimensions developed for programming languages by cognitive psychologists Green and others, we have developed a set of concrete benchmarks for VPL designers to use when designing new static representations. These benchmarks provide design-time information that can be used to improve a VPL’s static representation. ( 1997 Academic Press Limited 1. Introduction Many visual programming languages (VPLs) are highly interactive. In such languages, the process of creating a program is often incremental, with many opportunities for interactive visual feedback along the way. We can place an object on the screen and experiment with its effects on other objects, peer into the components of an object by clicking on it, and watch its dynamic behavior simply by observing the changes that occur on the screen as a snippet of the program executes. Such dynamic visual feedback integrates support for rapid program construction with continuous debugging, a feature that provides many advantages. But after the program has been so constructed, the maintenance phase begins. Someone—probably someone different from the original programmer—must under- stand the previously written program to be able to modify it. Understanding a previously written program involves tasks that are not as common in creating a new program, because the maintenance process does not provide the contextual information that is s This work was supported in part by Hewlett-Packard and by the National Science Foundation under grant CCR-9308649 and an NSF Young Investigator Award. 1045-926X/97/050563 # 37 $25.00/0/vl970047 ( 1997 Academic Press Limited

Welcome message from author
This document is posted to help you gain knowledge. Please leave a comment to let me know what you think about it! Share it to your friends and learn new things together.
Transcript
Journal of Visual Languages and Computing (1997) 8, 563—599
Representation Design Benchmarks: A Design-Time Aidfor VPL Navigable Static Representations
SHERRY YANG*, MARGARET M. BURNETT*,†,ELYON DEKOVEN
‡AND MOSHE ZLOOF
‡
*Department of Computer Science, Oregon State University, Corvallis, OR 97331-3202 [email protected], [email protected]
‡Hewlett-Packard Labs, P.O. Box 10490, Palo Alto, CA 94303-0969 [email protected], [email protected]
Received 18 August 1995; revised 10 March 1997; accepted 8 April 1997
A weakness of many interactive visual programming languages (VPLs) is their staticrepresentations. Lack of an adequate static representation places a heavy cognitiveburden on a VPL’s programmers, because they must remember potentially longdynamic sequences of screen displays in order to understand a previously writtenprogram. However, although this problem is widely acknowledged, research on how todesign better static representations for interactive VPLs is still in its infancy.
Building upon the cognitive dimensions developed for programming languages bycognitive psychologists Green and others, we have developed a set of concretebenchmarks for VPL designers to use when designing new static representations. Thesebenchmarks provide design-time information that can be used to improve a VPL’sstatic representation.( 1997 Academic Press Limited
1. Introduction
Many visual programming languages (VPLs) are highly interactive. In such languages,the process of creating a program is often incremental, with many opportunities forinteractive visual feedback along the way. We can place an object on the screen andexperiment with its effects on other objects, peer into the components of an object byclicking on it, and watch its dynamic behavior simply by observing the changes thatoccur on the screen as a snippet of the program executes. Such dynamic visual feedbackintegrates support for rapid program construction with continuous debugging, a featurethat provides many advantages.
But after the program has been so constructed, the maintenance phase begins.Someone—probably someone different from the original programmer—must under-stand the previously written program to be able to modify it. Understanding a previouslywritten program involves tasks that are not as common in creating a new program,because the maintenance process does not provide the contextual information that is
sThis work was supported in part by Hewlett-Packard and by the National Science Foundation undergrant CCR-9308649 and an NSF Young Investigator Award.
1045-926X/97/050563#37 $25.00/0/vl970047 ( 1997 Academic Press Limited
564 SHERRY YANG ET AL.
inherent in the creation process. For example, the maintenance programmer will need tolearn the overall structure of the program, will need to search for and identify therelevant section of the program without necessarily having seen it before, and will betrying to figure out what other pieces of the program exist that might be affected by thechanges.
Although dynamic mechanisms can be very helpful during program creation anddebugging, tasks such as those listed in the previous paragraph beg for a static view ofthe program—one that allows the programmer to study the logic and relationshipswithin the program without the heavy cognitive burden of remembering fine-graineddynamic sequences of visual activity to obtain the needed information. Unfortunately,however, lack of adequate static representations has long been a weakness of interactiveVPLs. Numerous research descriptions, taxonomies and analyses have counted staticrepresentation as an important, largely unsolved, issue for many VPLs [1—3].
In this paper, we describe representation design benchmarks, a flexible set of measurementprocedures for VPL designers to use when designing new static representations for theirlanguages. The benchmarks focus exclusively on the static representation part of a VPL,and provide a designer with a yardstick for measuring how well a particular design fulfillsdesign goals related to the static representation’s usefulness to programmers. Thebenchmarks are currently being used at Oregon State University and at Hewlett-PackardLaboratories to design new static representations for the languages Forms/3 [4] andICBE [5, 6].
The representation design benchmarks are a concrete application of several of thecognitive dimensions for programming systems by researchers from the field of cognitivepsychology [7, 8]. The cognitive dimensions provide a foundation that is appropriate tothe cognitive issues of representing programs, and provide an increment in formalityover previous ad hoc methods. We based our measures on the particular cognitivedimensions that could be applied to VPL static representations, and added three kindsof refinements: we provided concrete ways of measuring several of the cognitivedimensions at design time, directly focusing them on the static representation part of a VPL.
2. Related work
Cognitive dimensions (CDs) [ 7, 8] are a set of terms describing the structure ofa programming language’s components as they relate to cognitive issues in program-ming. The CDs, which are listed in Appendix A, provide a framework for assessing thecognitive attributes of a programming system and for understanding the cognitivebenefits and costs of various features in a language or its environment. The dimensionsare intended to be used as high-level discussion tools to examine various aspects oflanguages and environments, and were devised to be usable by language designers andother non-psychologists.
CDs have been used by several researchers to evaluate the cognitive aspects of VPLs,and to make broad comparisons of cognitive aspects of different VPLs. For example,Green and Petre used CDs to contrast cognitive aspects of the commercial VPLsPrograph [9] and LabVIEW [10] (see Appendix A for an excerpt). Modugno used CDsto evaluate Pursuit, a research programming-by-demonstration VPL [11] and Yazdaniand Ford used CDs to evaluate PrologSpace, a general-purpose visual programming
REPRESENTATION DESIGN BENCHMARKS 565
system [12]. Hendry also used CDs to evaluate cognitive aspects of a modification tospreadsheet formula languages [13].
CDs are one of the two design-time evaluation approaches that have been appliedto VPLs [14]. The other is the programming walkthrough [15, 16]. Programmingwalkthroughs are conducted by a team that includes both the language’s designer and anHCI expert (and may include others as well), and is intended for evaluation of a languagewith respect to its suitability for writing new programs. Because of this emphasis, theevaluation is done on a suite of sample programming problems in the context of thelanguage, as opposed to the language itself.
In the realm of software metrics, Glinert introduced a framework for formulatingsoftware metrics to compare visual computing environments [17]. The attractiveness tousers of a visual computing environment is measured by attributes such as speed ofperformance, debugging facilities and support for animation and multiple views. Thisframework does not deal with the cognitive issues of program representation; it dealsonly with the features that make an environment appealing to users.
The cognitive evaluative techniques that are not specific to VPL evaluation, such asthose directed toward graphically oriented software systems in general, are not of muchhelp in evaluating a VPL’s static representation. The main reason is that these techniquesfocus on the user’s interactions of a proposed (or implemented) user interface, not onthe presence of information that is useful to programmers in a representation. GOMS,pattern analysis, heuristic evaluation and layout appropriateness are a few such methods.For example, GOMS [18] is a detailed methodology for giving quantitative timepredictions for the user to perform activities defined as a detailed sequence of simpletasks such as ‘delete a word’. Maximal repeating pattern analysis [19] detects patterns ina user’s actions in a working application, with the intention of optimizing the userinterface to the most commonly performed actions. Heuristic evaluation (HE) [20, 21] isa general evaluative technique that rates a user interface through a set of nine usabilityprinciples, such as ‘use simple and natural dialogue’, ‘speak the user’s language’, and‘minimize user memory load’. Layout appropriateness [22] is a metric aimed at assistingdesigners in organizing widgets in user interfaces based on the frequency of differentsequences of actions users perform. The most important difference between theseevaluative techniques for graphically oriented software and representation design bench-marks is that the former focus on a system’s support for fine-grained user interactions,whereas the latter measure a representation’s ability to present useful information abouta program to programmers.
3. Terminology and Overview
The problem to which we intend representation design benchmarks to contribute is thedesign of better VPL static representations. To focus directly on this problem, wemeasure a VPL’s static representation in isolation from the rest of the VPL. We believethat measuring only the static representation of a VPL—even if the rest of the VPL ishighly interactive and dynamic—is necessary if we are to get a clear view of the strengthsand weaknesses of that static representation. To do this, we must first be precise aboutexactly what is to be measured by the benchmarks, namely the VPL’s navigable staticrepresentation, which we define next.
566 SHERRY YANG ET AL.
3.1. Navigable Static Representations
Informally, a VPL’s static representation is the appearance of a visual program ‘at rest’such as on a screen snapshot. More formally, we will use the term static representation tomean the set of every item of information about a program that can be displayedsimultaneously on an infinitely large piece of paper or screen.
Although the paper supply expands flexibly to accommodate the size of the programbeing printed, a computer’s display screen does not. Thus, to account for the accessibil-ity of static representations when viewed on a display screen, we must also considera VPL’s set of dynamic navigational devices (menus, scrollbars, etc.) that map a staticrepresentation on the infinitely large screen to a finite physical screen. We will term thisset of such devices that take a static representation as input and map it to a subset of thatstatic representation as output the navigational instrumentation. Finally, we define a lan-guage’s navigable static representation as the tuple (S, NI), where S is the VPL’s staticrepresentation and NI is the VPL’s navigational instrumentation.
For the remainder of this paper, the term ‘representation’ when used alone shouldbe read as an abbreviation of the more cumbersome phrase ‘navigable staticrepresentation’.
3.1.1. Applying the Definition: An Example
For example, consider a programming-by-demonstrationVPL that displays a static storyboard of the modifications that were demonstrated on the objects in the program. Alsosuppose a static dataflow view of the program may be placed on the screen viaa pull-down menu selection, and removed similarly. Let us consider whether thedataflow view is part of the VPL’s navigable static representation.
Following the definition of navigable static representations, this view is in thenavigable static representation if and only if it is in S or NI. Static views do not fit thedefinition of dynamic navigation devices, so the static dataflow view is not in NI. A keypoint in determining whether it (or any visible item of information) is in S lies in theword ‘simultaneously’ in the definition of static representations.
In order to achieve simultaneousness, the on-screen lifetime of the item of informa-tion must not be curtailed unless the programmer chooses to remove it. Returning toour example, if the programmer cannot have the dataflow view on display at the sametime the other items of S are displayed (on the infinite screen), then that view is not in S.In other words, if adding the availability of a dataflow view decreases the story boardview’s availability, as would be the case if both are accessed by a browser tool allowingonly one view at a time, then neither view is an element of S. However, if both views canbe displayed simultaneously and permanently, such as by multiple dynamic browsertools that operate independently of one another, then both views are elements of S andtherefore of the VPL’s navigable static representation.
3.1.2. Implications of the Definition
As this example demonstrates, there are elements of VPLs that are neither in S nor inNI. Examples include animations, sound annotations and alternative views that cannotremain indefinitely on the screen. Elements of a VPL that are not in S or NI are not
REPRESENTATION DESIGN BENCHMARKS 567
measured by the benchmarks. This is not to say that such elements are not valuable, butonly that they are outside the scope of the benchmarks, which were devised to help thedesigner focus exclusively on just one portion of the VPL—the navigable staticrepresentation.
Also note that the definition of a navigable static representation does not distinguishbetween language-related versus environment-related aspects of a VPL. Thus, classify-ing an item of information as language-related or environment-related does not helpdetermine whether it is in the navigable static representation. This is because representa-tion design benchmarks focus on the availability and quality of information provided tothe programmer, not on which piece of the VPL is doing the providing.
3.2. From Cognitive Dimensions to Representation Design Benchmarks
We selected CDs as the foundation for our approach because they were the mostconducive to our goal of providing high-level, design-time measures for a VPL designerto use in designing the language’s navigable static representation. From this foundation,we derived a set of benchmarks to obtain quantitative measurements of navigable staticrepresentations as follows.
We started by selecting the CDs that could be applied to considering (1) thecharacteristics (denoted Sc) or (2) the presence (denoted Sp) of the elements of a staticrepresentation S. For example, the Closeness of Mapping CD pertains to characteristicsof static representation elements (Sc), because it considers the characteristic of howa programming language’s constructs compare to the entities in a particular domain. Onthe other hand, the Progressive Evaluation CD refers to the presence of a program’sanswers in a programming environment; since these answers could also be shownon a static view, this CD can be applied as a possible element (Sp) of the staticrepresentation.
We then narrowed the selected dimensions to focus them solely on navigable staticrepresentations. In the above example, the Progressive Evaluation CD relates to thedynamic display of answers, so it was narrowed to focus solely on inclusion of answersin the navigable static representation.
For this narrowed set of CDs, we devised quantitative Sc and Sp measures. In addition,for each Sp benchmark for S, we devised a corresponding coarse-grained effort measureof the number of steps the navigational instrumentation NI requires for the programmerto display that element of information, i.e., to map S from the infinite screen to a finitescreen in such a way that the element is visible.
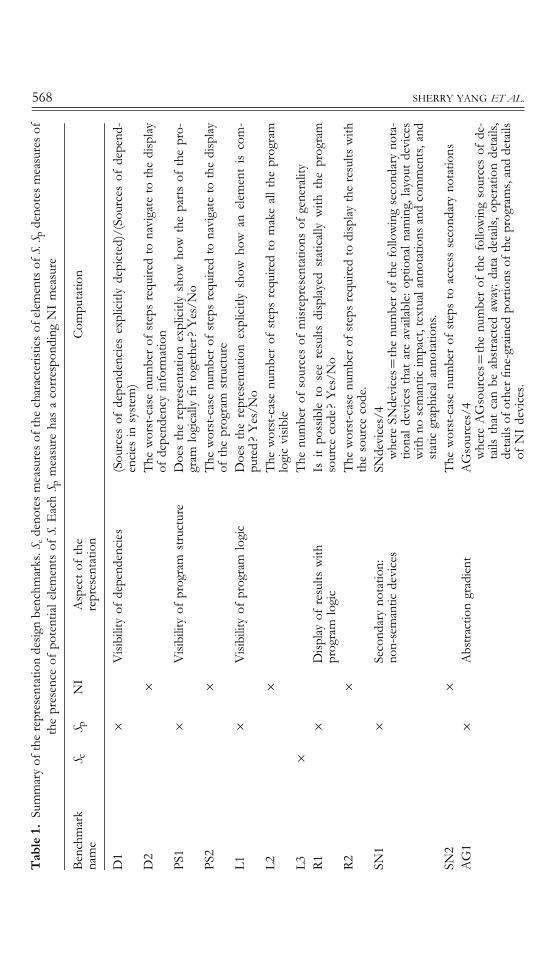
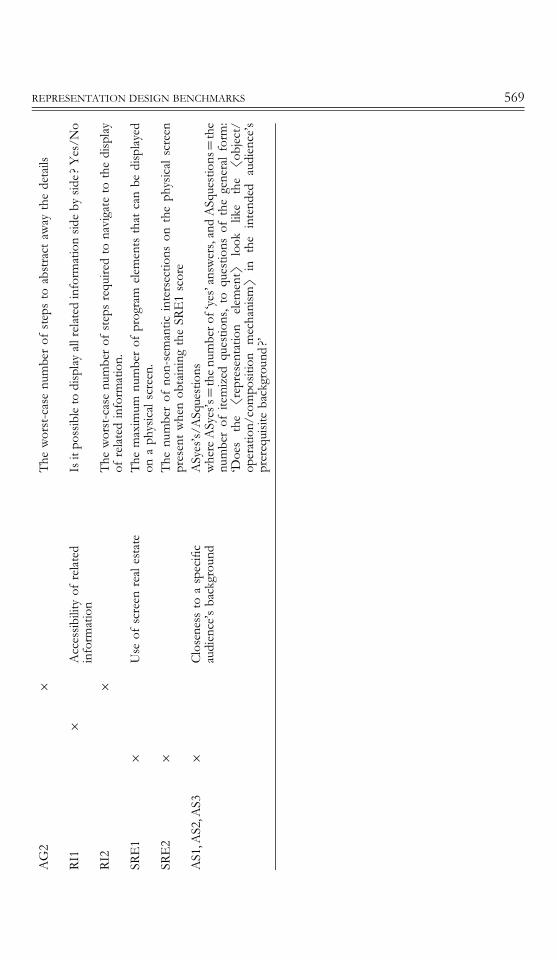
Finally, we conducted an empirical study to learn more about the suitability of thebenchmarks as a design aid. The benchmarks are summarized in Table 1. Sections 4 and5 discuss the relationships of each of the benchmarks with their corresponding CDs andhow to apply them, and Section 6 describes the empirical study.
3.3. Use of the Representation Design Benchmarks:Why, When, Who and How
The purpose of the representation design benchmarks is to provide a set of design-timemeasures that VPL designers can use to measure and improve their design ideas fornavigable static representations in their languages. We wanted a design-time approach
Table
1.
Sum
mar
yof
the
repr
esen
tatio
nde
sign
benc
hmar
ks.S
cde
note
sm
easu
resof
the
char
acte
ristic
sof
elem
ents
ofS.
S pde
note
sm
easu
resof
the
pres
ence
ofpo
tent
iale
lem
ents
ofS.
Eac
hS p
mea
sure
has
aco
rres
pond
ing
NI
mea
sure
Ben
chm
ark
nam
eS c
S pN
IA
spec
tof
the
repr
esen
tatio
nCom
puta
tion
D1
]V
isib
ility
ofde
pend
encies
(Sou
rces
ofde
pend
encies
expl
icitl
yde
pict
ed)/
(Sou
rces
ofde
pend
-en
cies
insy
stem
)D
2]
The
wor
st-c
ase
num
berof
step
sre
quire
dto
navi
gate
toth
edi
splay
ofde
pend
ency
info
rmat
ion
PS1
]V
isib
ility
ofpr
ogra
mstru
ctur
eD
oes
the
repr
esen
tatio
nex
plicitl
ysh
owho
wth
epa
rts
ofth
epr
o-gr
amlo
gica
llyfit
toge
ther
?Yes
/No
PS2
]The
wor
st-c
ase
num
berof
step
sre
quire
dto
navi
gate
toth
edi
splay
ofth
epr
ogra
mstru
ctur
eL1
]V
isib
ility
ofpr
ogra
mlo
gic
Doe
sth
ere
pres
enta
tion
expl
icitl
ysh
owho
wan
elem
ent
isco
m-
pute
d?
Yes
/No
L2]
The
wor
st-c
ase
num
ber
ofstep
sre
quire
dto
mak
eallth
epr
ogra
mlo
gic
visibl
eL3
]The
num
ber
ofso
urce
sof
misre
pres
enta
tions
ofge
nera
lity
R1
]D
ispl
ayof
resu
ltswith
prog
ram
logi
cIs
itpo
ssib
leto
see
resu
ltsdi
splaye
dstat
ically
with
the
prog
ram
sour
ceco
de?
Yes
/No
R2
]The
wor
st-c
ase
num
berof
step
sre
quire
dto
disp
lay
the
resu
ltswith
the
sour
ceco
de.
SN1
]Se
cond
ary
nota
tion:
non-
sem
antic
devi
ces
SNde
vice
s/4
whe
reSN
devi
ces\
the
num
berof
the
follo
win
gse
cond
ary
nota
-tio
nalde
vice
sth
atar
eav
ailabl
e:op
tiona
lna
min
g,layo
utde
vice
swith
nose
man
ticim
pact
,tex
tual
anno
tatio
nsan
dco
mm
ents,a
ndstat
icgr
aphi
cala
nnot
atio
ns.
SN2
]The
wor
st-c
ase
num
berof
step
sto
acce
ssse
cond
ary
nota
tions
AG
1]
Abs
trac
tion
grad
ient
AG
sour
ces/
4whe
reA
Gso
urce
s\th
enu
mbe
rof
the
follo
win
gso
urce
sof
de-
tails
that
can
beab
stra
cted
away
:da
tade
tails
,op
erat
ion
deta
ils,
deta
ilsof
othe
rfin
e-gr
aine
dpo
rtio
nsof
the
prog
ram
s,an
dde
tails
ofN
Ide
vice
s.
568 SHERRY YANG ET AL.
AG
2]
The
wor
st-c
ase
num
berof
step
sto
abstra
ctaw
ayth
ede
tails
RI1
]A
cces
sibi
lity
ofre
late
din
form
atio
nIs
itpo
ssib
leto
disp
lay
allr
elat
edin
form
atio
nside
byside
?Yes
/No
RI2
]The
wor
st-c
ase
num
berof
step
sre
quire
dto
navi
gate
toth
edi
splay
ofre
late
din
form
atio
n.SR
E1
]U
seof
scre
enre
ales
tate
The
max
imum
num
ber
ofpr
ogra
melem
ents
that
can
bedi
splaye
don
aph
ysical
scre
en.
SRE2
]The
num
ber
ofno
n-se
man
ticin
ters
ectio
nson
the
phys
ical
scre
enpr
esen
twhe
nob
tain
ing
the
SRE1
scor
eA
S1,A
S2,A
S3]
Clo
sene
ssto
asp
ecifi
cau
dien
ce’s
back
grou
ndA
Syes
’s/A
Sque
stio
nswhe
reA
Syes
’s\
thenu
mbe
rof
‘yes
’ans
wer
s,an
dA
Sque
stio
ns\
the
num
ber
ofite
mized
ques
tions
,to
ques
tions
ofth
ege
nera
lfo
rm:
‘Doe
sth
eSr
epre
sent
atio
nelem
entT
look
like
the
Sobj
ect/
oper
atio
n/co
mpo
sitio
nm
echa
nism
Tin
the
inte
nded
audi
ence
’spr
ereq
uisite
back
grou
nd?’
REPRESENTATION DESIGN BENCHMARKS 569
570 SHERRY YANG ET AL.
instead of an approach to be used later in the lifecycle, because problems uncovered atdesign time are easier to correct than those uncovered after a prototype has been built.The quality of the problem discovery process can also be greater if done at design time.For example, Winograd points out that in studying usability, a user is more likely toprovide substantive suggestions for a rough design than a polished prototype [23]. Thisobservation was borne out in our experiences, a point upon which we will elaborate laterin this paper.
Using the benchmarks is a three-step process. First, the designer determineswhether the aspect of the representation measured by a benchmark applies totheir VPL and if so, identifies the aspect of their language’s representation thatcorresponds to the element or characteristic to be measured by the benchmark. (Forexample, a designer of a VPL intended for only tiny applications would probably omitthe scalability benchmarks.) Second, the designer computes the measurements. Third,the designer interprets this computation, i.e. he or she maps the measurement toa subjective rating scale. We have provided a sample of such a mapping in Appendix B.Since such a mapping necessarily reflects the goals and value judgments of a particularlanguage’s designers, we would expect different designers to use mappings that aredifferent than the sample.
4. The Benchmarks in Detail
In discussing the benchmarks, we will show how they can be applied to the emergingdesigns of navigable static representations for Forms/3 [4] and ICBE [6]. Forms/3 isa declarative, form-based VPL that aims to achieve the power of traditional program-ming languages while maintaining the simplicity of the spreadsheet model. ICBE isa set-oriented dataflow VPL with a strong emphasis on interoperations betweensystems—such as database, spreadsheets, and graphics—aimed at end-user profes-sionals.
4.1. The Understandability Benchmarks
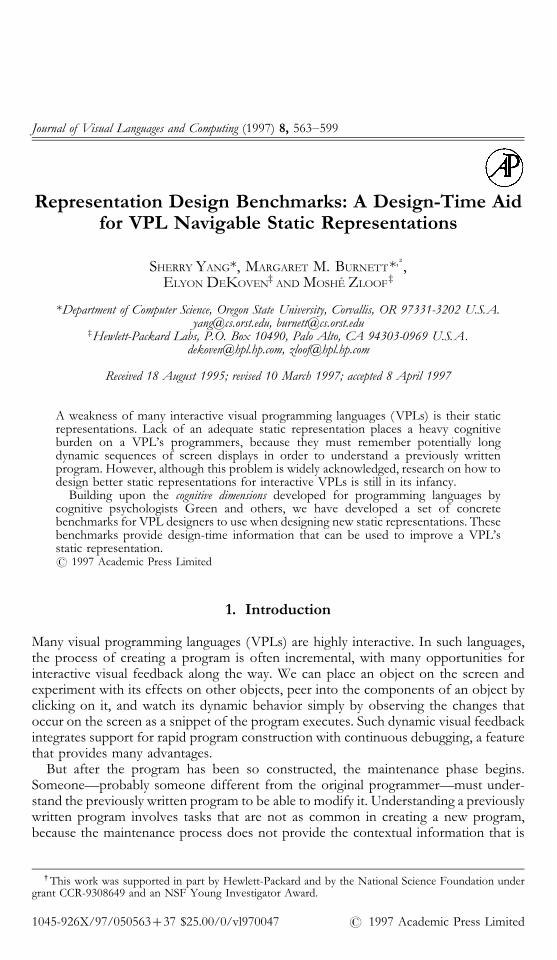
This section describes benchmarks for elements that relate to understandability ofa program’s representation. Forms/3 will be used to provide examples of how designerscan use the benchmarks in this section. Programs in Forms/3 are defined via cells andformulas on forms. Each cell has a formula, which defines its value. Figure 1 and itsdetailed caption demonstrate the basic ideas of Forms/3. (A complete description of thelanguage is given by Burnett and Ambler [4]).
Because representation design benchmarks are intended to help in the process ofdesign, the Forms/3 benchmark examples are presented from the perspective ofForms/3 designers during the design of an improved navigable static representation. Wewill designate the representation used in the current implementation of Forms/3 asDesign 1 and the new design that we are creating with the help of the representationdesign benchmarks as Design 2. All the Design 1 figures are screen shots from thecurrent implementation and all the figures of Design 2 as it emerges through use of thebenchmarks are, of course, hand-constructed sketches.
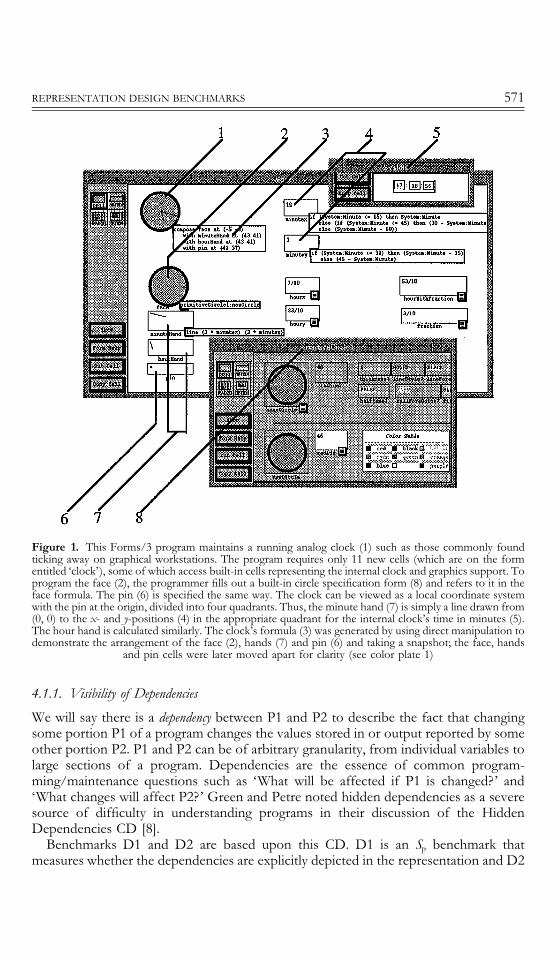
Figure 1. This Forms/3 program maintains a running analog clock (1) such as those commonly foundticking away on graphical workstations. The program requires only 11 new cells (which are on the formentitled ‘clock’), some of which access built-in cells representing the internal clock and graphics support. Toprogram the face (2), the programmer fills out a built-in circle specification form (8) and refers to it in theface formula. The pin (6) is specified the same way. The clock can be viewed as a local coordinate systemwith the pin at the origin, divided into four quadrants. Thus, the minute hand (7) is simply a line drawn from(0, 0) to the x- and y-positions (4) in the appropriate quadrant for the internal clock’s time in minutes (5).The hour hand is calculated similarly. The clock’s formula (3) was generated by using direct manipulation todemonstrate the arrangement of the face (2), hands (7) and pin (6) and taking a snapshot; the face, hands
and pin cells were later moved apart for clarity (see color plate 1)
REPRESENTATION DESIGN BENCHMARKS 571
4.1.1. Visibility of Dependencies
We will say there is a dependency between P1 and P2 to describe the fact that changingsome portion P1 of a program changes the values stored in or output reported by someother portion P2. P1 and P2 can be of arbitrary granularity, from individual variables tolarge sections of a program. Dependencies are the essence of common program-ming/maintenance questions such as ‘What will be affected if P1 is changed?’ and‘What changes will affect P2?’ Green and Petre noted hidden dependencies as a severesource of difficulty in understanding programs in their discussion of the HiddenDependencies CD [8].
Benchmarks D1 and D2 are based upon this CD. D1 is an Sp benchmark thatmeasures whether the dependencies are explicitly depicted in the representation and D2
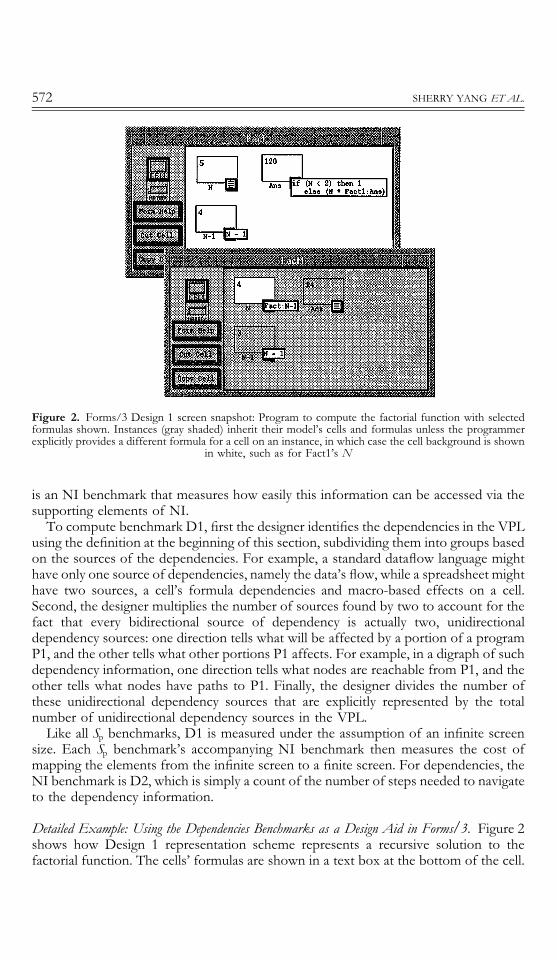
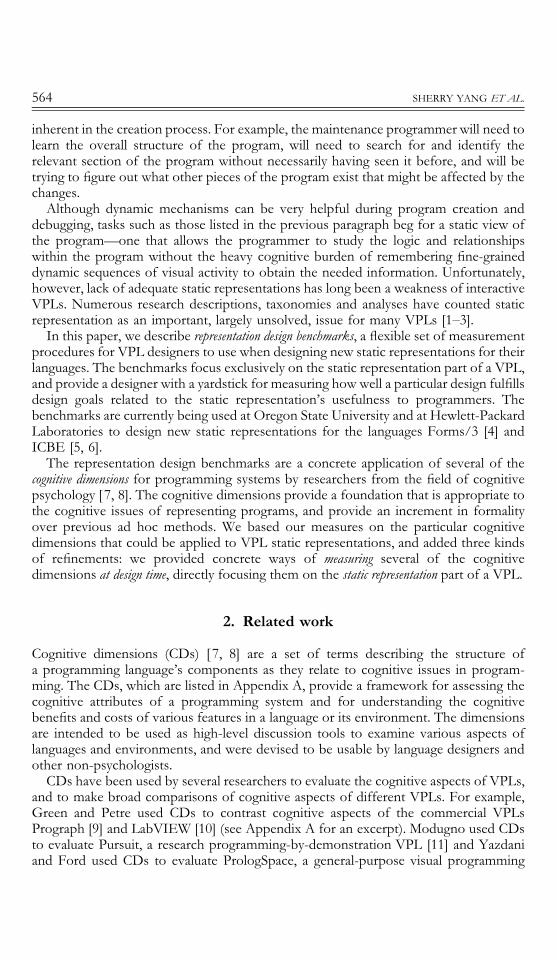
Figure 2. Forms/3 Design 1 screen snapshot: Program to compute the factorial function with selectedformulas shown. Instances (gray shaded) inherit their model’s cells and formulas unless the programmerexplicitly provides a different formula for a cell on an instance, in which case the cell background is shown
in white, such as for Fact1’s N
572 SHERRY YANG ET AL.
is an NI benchmark that measures how easily this information can be accessed via thesupporting elements of NI.
To compute benchmark D1, first the designer identifies the dependencies in the VPLusing the definition at the beginning of this section, subdividing them into groups basedon the sources of the dependencies. For example, a standard dataflow language mighthave only one source of dependencies, namely the data’s flow, while a spreadsheet mighthave two sources, a cell’s formula dependencies and macro-based effects on a cell.Second, the designer multiplies the number of sources found by two to account for thefact that every bidirectional source of dependency is actually two, unidirectionaldependency sources: one direction tells what will be affected by a portion of a programP1, and the other tells what other portions P1 affects. For example, in a digraph of suchdependency information, one direction tells what nodes are reachable from P1, and theother tells what nodes have paths to P1. Finally, the designer divides the number ofthese unidirectional dependency sources that are explicitly represented by the totalnumber of unidirectional dependency sources in the VPL.
Like all Sp benchmarks, D1 is measured under the assumption of an infinite screensize. Each Sp benchmark’s accompanying NI benchmark then measures the cost ofmapping the elements from the infinite screen to a finite screen. For dependencies, theNI benchmark is D2, which is simply a count of the number of steps needed to navigateto the dependency information.
Detailed Example: Using the Dependencies Benchmarks as a Design Aid in Forms/3. Figure 2shows how Design 1 representation scheme represents a recursive solution to thefactorial function. The cells’ formulas are shown in a text box at the bottom of the cell.
REPRESENTATION DESIGN BENCHMARKS 573
The prototypical formula ‘5’ has been specified for cell N on form Fact so that theprogrammer can receive concrete feedback. The solution involves two forms: one formthat computes the factorial of the desired N and another, similar form that computes thefactorial of N!1. The form Fact is termed the model and Fact1, which was copied fromFact and then modified, is an instance of Fact.
The benchmarks were performed on Forms/3’s representation Design 1 and Design2 by members of the Forms/3 design team. There are two bidirectional sources ofdependencies in the Forms/3 language itself: dependencies due to formulas anddependencies due to copying a model form. For example, in the program in Figure 2, theformula for N[1 on Fact defines a formula-based dependency between cell N and cellN[1 on Fact. Fact1’s N[1 cell is dependent on Fact’s N[1 by virtue of the fact thatFact1 was copied from the model form Fact. (Since later changes to the model Factautomatically propagate to the instances—except for formulas that the programmer hasexplicitly changed on the instance—this is an important dependency in Forms/3.)Multiplying these two bidirectional sources by two gives four unidirectional sources ofdependencies.
In Design 1, one direction of copy-based dependencies is shown in the name ofcopied forms, which include the name of the model. This allows the programmer toanswer the quest ion ‘changes on what (model) form will change form Fact1?’ directlyfrom the name ‘Fact1’. But the other direction is not shown; to answer the question ‘ ifI change form Fact, what copies are there that will be changed?’, the programmer mustmanually search for forms whose names start with ‘Fact’.
Regarding formula-based dependencies, Design 1 explicitly depicts only about half ofone direction: the direct dependencies only. For example, cell Ans at the upper right ofFigure 2 explicitly shows what cells directly affect the result of cell Ans, but does notexplicitly show the indirect effects of Fact’s N[1 on Fact1’s Ans; to find out, theprogrammer would have to search through the program. It does not show the otherdirection at all. For example, it does not explicitly show what cells are affected by theresult of Ans; once again, the programmer would have to search through the program tofind out. The Forms/3 design team was somewhat startled to see from this benchmarkthat, despite their popularity, such spreadsheet-like formula displays are a ratherimpoverished depiction of formula-based dependency information—even when all theformulas are displayed together on the screen.
Dividing the total of the numerators by four (the number of unidirectional sources ofdependencies) gives 1.5/4\0.375 for benchmark D1. D2 measures steps to navigate tothat information or to bring it all onto the physical display screen. To add a cell’sformula to the display, a programmer pulls down a cell’s formula tab and selects it. Thisis one step per cell, or a total of n steps to add all the cells’ formulas to the display, wheren is the number of cells in the program.
Mapping these measurements to a subjective rating scale is done by individualdesigners according to the design goals of their language. The Forms/3 designers usedthe rating scale in Appendix B. They interpreted both D1 and D2 to be roughly ‘fair’according to the scale.
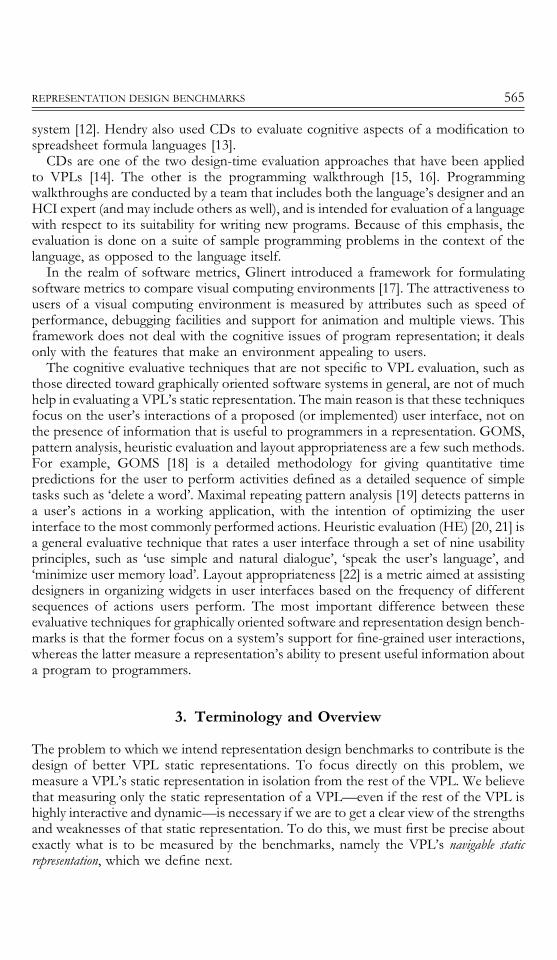
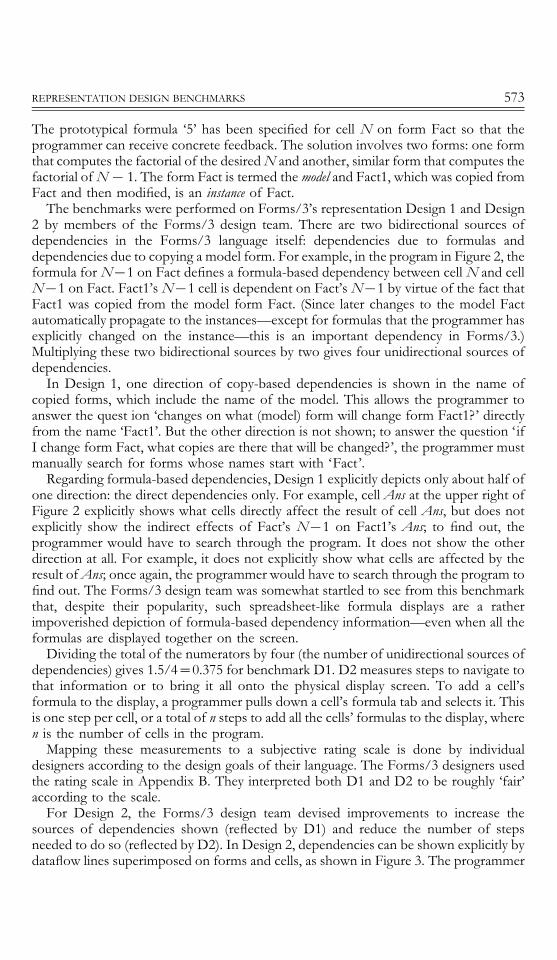
For Design 2, the Forms/3 design team devised improvements to increase thesources of dependencies shown (reflected by D1) and reduce the number of stepsneeded to do so (reflected by D2). In Design 2, dependencies can be shown explicitly bydataflow lines superimposed on forms and cells, as shown in Figure 3. The programmer
Figure 3. The design changes represented by Forms/3’s Design 2 (shown via hand-drawn additions to thecurrent implementation). Dataflow lines are superimposed on the cells. The rightmost window is the controlpanel. The programmer can select more than one cell at a time, but in this example, only cell N[1 was
selected. There is also an option on the control panel to show all the dependencies
574 SHERRY YANG ET AL.
can tailor the amount of information included in the display via the control panel. Withthis design, D1 results in 4/4\1.0 when all possible information is displayed. D2 is thenumber of steps to include the desired dataflow lines in the representation, including thesteps needed to interact with the control panel. It takes one step per cell to include thedesired dataflow lines if done cell-by-cell, or optionally the programmer can include thelines for all cells in one step and then deselect cells one by one if desired. Thus, no morethan n /2 steps are required to include the dataflow lines for all desired cells, plus one totwo steps to interact with the control panel. This is roughly half the number of steps thatwere needed by Design 1. (The steps required to also display the formulas for each cellare not considered for Design 2 because dataflow lines alone are sufficient to show thedependencies. However, formulas are needed to understand the program logic, as willbe discussed in the visibility of program logic section.)
Thus, representation Design 2 makes all the dependencies visible, but there isa cost—Design 2 occupies more real estate and may add clutter. This is the first of manysuch occurrences of this problem: if a designer adds features to the representation inorder to solve deficiencies exposed by one benchmark, he or she may generate newproblems that will be reflected in other benchmarks. Since this is characteristic of theprocess of design, it is not surprising that it is present in the benchmarks. In particular,many of these trade-offs are reflected in the scalability benchmarks, which will bediscussed in Section 4.2.
4.1.2. Visibility of Program Structure
We will use the term program structure to mean the relationships among all the modules ofa program, where a module is a collection of program elements, and the boundaries of
REPRESENTATION DESIGN BENCHMARKS 575
a module are determined in a language-specific manner. For example, in some languagesa module is a procedure, function or macro; in others it is a class or a method; and inothers it is a form or a storyboard. Examples of relationships among them includecaller/callee relationships, inheritance relationships and dataflow relationships.
From the programmer’s standpoint, a depiction of program structure answersquestions such as ‘What modules are there in this program?’ and ‘How do thesemodules logically fit together?’ Example depictions of program structure include callgraphs, inheritance trees and diagrams showing the flow of data among programmodules.
The benchmarks in this group are related to the Role Expressiveness CD. The RoleExpressiveness CD describes how easily a programmer can discern the purpose ofa particular piece of a program. Some of the devices that have been empirically shown tohelp communicate role expressiveness are use of commenting and other secondarynotations, meaningful identifiers and well-structured modules. The benchmarks in thissection consider the representation of the structural role of a portion of a program, andthe benchmarks in the section on secondary notation consider some other kinds of roleinformation. Benchmark PS1 shows the presence or absence of program structureinformation in S and benchmark PS2 measures the number of steps required fora programmer to navigate to this information.
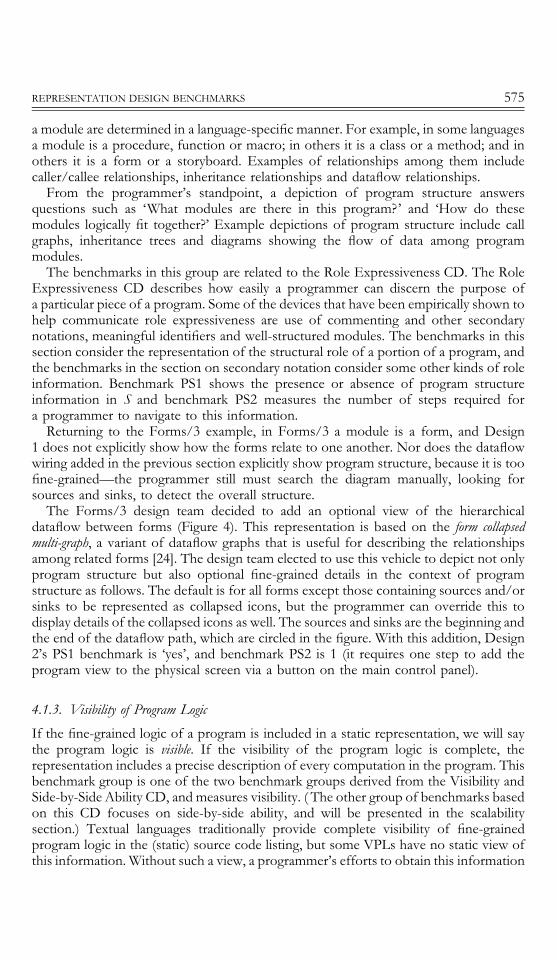
Returning to the Forms/3 example, in Forms/3 a module is a form, and Design1 does not explicitly show how the forms relate to one another. Nor does the dataflowwiring added in the previous section explicitly show program structure, because it is toofine-grained—the programmer still must search the diagram manually, looking forsources and sinks, to detect the overall structure.
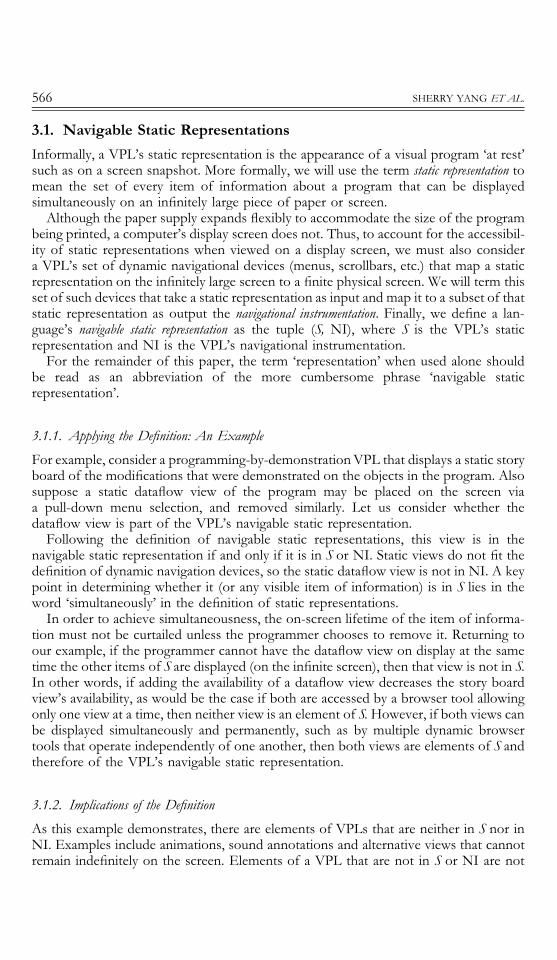
The Forms/3 design team decided to add an optional view of the hierarchicaldataflow between forms (Figure 4). This representation is based on the form collapsedmulti-graph, a variant of dataflow graphs that is useful for describing the relationshipsamong related forms [24]. The design team elected to use this vehicle to depict not onlyprogram structure but also optional fine-grained details in the context of programstructure as follows. The default is for all forms except those containing sources and/orsinks to be represented as collapsed icons, but the programmer can override this todisplay details of the collapsed icons as well. The sources and sinks are the beginning andthe end of the dataflow path, which are circled in the figure. With this addition, Design2’s PS1 benchmark is ‘yes’, and benchmark PS2 is 1 (it requires one step to add theprogram view to the physical screen via a button on the main control panel).
4.1.3. Visibility of Program Logic
If the fine-grained logic of a program is included in a static representation, we will saythe program logic is visible. If the visibility of the program logic is complete, therepresentation includes a precise description of every computation in the program. Thisbenchmark group is one of the two benchmark groups derived from the Visibility andSide-by-Side Ability CD, and measures visibility. ( The other group of benchmarks basedon this CD focuses on side-by-side ability, and will be presented in the scalabilitysection.) Textual languages traditionally provide complete visibility of fine-grainedprogram logic in the (static) source code listing, but some VPLs have no static view ofthis information. Without such a view, a programmer’s efforts to obtain this information
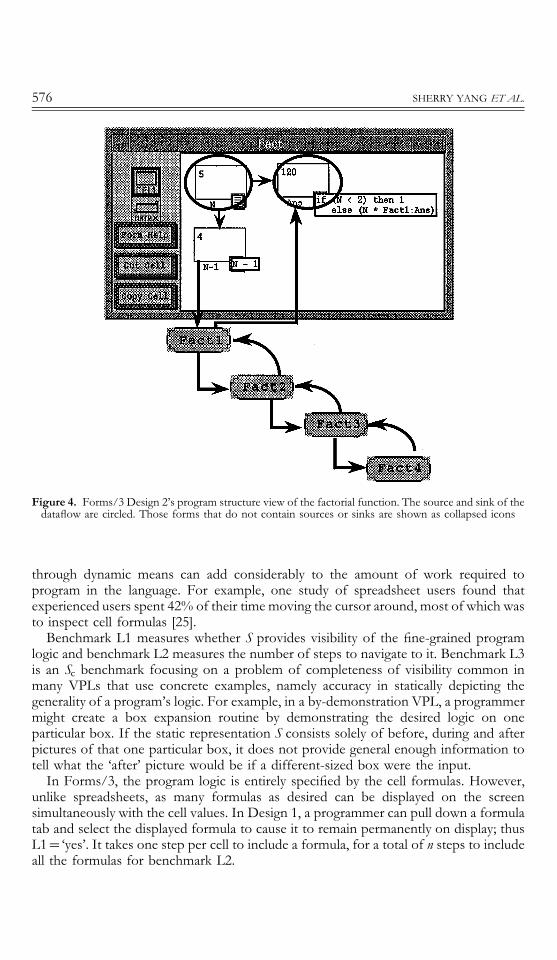
Figure 4. Forms/3 Design 2’s program structure view of the factorial function. The source and sink of thedataflow are circled. Those forms that do not contain sources or sinks are shown as collapsed icons
576 SHERRY YANG ET AL.
through dynamic means can add considerably to the amount of work required toprogram in the language. For example, one study of spreadsheet users found thatexperienced users spent 42% of their time moving the cursor around, most of which wasto inspect cell formulas [25].
Benchmark L1 measures whether S provides visibility of the fine-grained programlogic and benchmark L2 measures the number of steps to navigate to it. Benchmark L3is an Sc benchmark focusing on a problem of completeness of visibility common inmany VPLs that use concrete examples, namely accuracy in statically depicting thegenerality of a program’s logic. For example, in a by-demonstration VPL, a programmermight create a box expansion routine by demonstrating the desired logic on oneparticular box. If the static representation S consists solely of before, during and afterpictures of that one particular box, it does not provide general enough information totell what the ‘after’ picture would be if a different-sized box were the input.
In Forms/3, the program logic is entirely specified by the cell formulas. However,unlike spreadsheets, as many formulas as desired can be displayed on the screensimultaneously with the cell values. In Design 1, a programmer can pull down a formulatab and select the displayed formula to cause it to remain permanently on display; thusL1\‘yes’. It takes one step per cell to include a formula, for a total of n steps to includeall the formulas for benchmark L2.
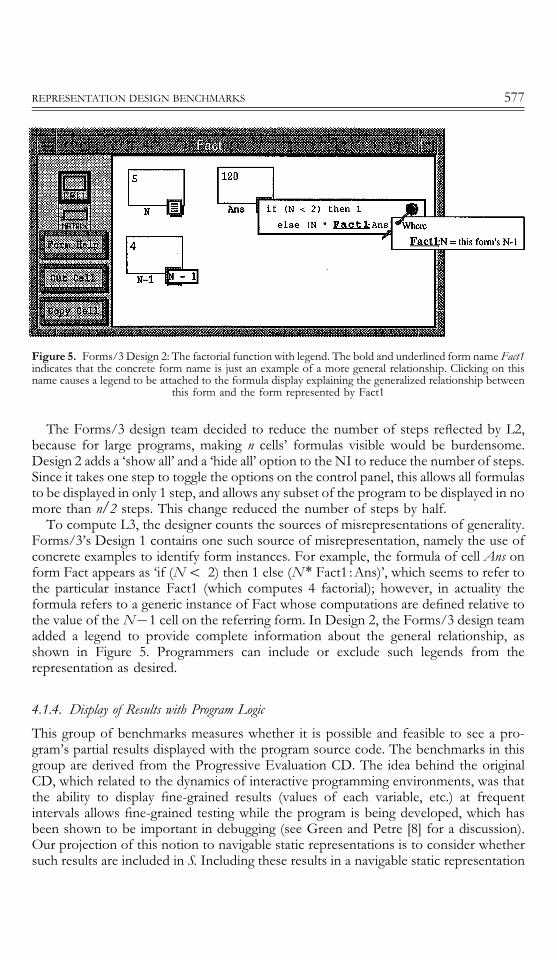
Figure 5. Forms/3 Design 2: The factorial function with legend. The bold and underlined form name Fact1indicates that the concrete form name is just an example of a more general relationship. Clicking on thisname causes a legend to be attached to the formula display explaining the generalized relationship between
this form and the form represented by Fact1
REPRESENTATION DESIGN BENCHMARKS 577
The Forms/3 design team decided to reduce the number of steps reflected by L2,because for large programs, making n cells’ formulas visible would be burdensome.Design 2 adds a ‘show all’ and a ‘hide all’ option to the NI to reduce the number of steps.Since it takes one step to toggle the options on the control panel, this allows all formulasto be displayed in only 1 step, and allows any subset of the program to be displayed in nomore than n/2 steps. This change reduced the number of steps by half.
To compute L3, the designer counts the sources of misrepresentations of generality.Forms/3’s Design 1 contains one such source of misrepresentation, namely the use ofconcrete examples to identify form instances. For example, the formula of cell Ans onform Fact appears as ‘if (N( 2) then 1 else (N* Fact1 :Ans)’, which seems to refer tothe particular instance Fact1 (which computes 4 factorial); however, in actuality theformula refers to a generic instance of Fact whose computations are defined relative tothe value of the N[1 cell on the referring form. In Design 2, the Forms/3 design teamadded a legend to provide complete information about the general relationship, asshown in Figure 5. Programmers can include or exclude such legends from therepresentation as desired.
4.1.4. Display of Results with Program Logic
This group of benchmarks measures whether it is possible and feasible to see a pro-gram’s partial results displayed with the program source code. The benchmarks in thisgroup are derived from the Progressive Evaluation CD. The idea behind the originalCD, which related to the dynamics of interactive programming environments, was thatthe ability to display fine-grained results (values of each variable, etc.) at frequentintervals allows fine-grained testing while the program is being developed, which hasbeen shown to be important in debugging (see Green and Petre [8] for a discussion).Our projection of this notion to navigable static representations is to consider whethersuch results are included in S. Including these results in a navigable static representation
578 SHERRY YANG ET AL.
would allow the programmer to study a static display of this test data integrated with thestatic display of the accompanying program logic.
Benchmark R1 measures whether or not it is possible to see the results displayedstatically with the program source code and benchmark R2 measures the number ofsteps required to do so. In Forms/3’s Design 1, each partial program result (cell value) isautomatically displayed for each cell next to its formula (or by itself if the programmerhas not chosen to leave the formula on display). Thus R1\‘yes’ and, since no action isneeded to navigate to these partial results, R2\0. The Forms/3 design team consideredthese Design 1 scores to be excellent, and made no changes in Design 2.
4.1.5. Secondary Notation: non-semantic devices
A VPL’s secondary notation is its collection of optional non-semantic devices thata programmer can include in a program. Since it is a collection of non-semantic devices,changing an instance of secondary notation, such as a textual comment, does not changea program’s behavior. The benchmarks in this group are derived from the SecondaryNotations CD, and are also related to the Role Expressiveness CD discussed previously.Petre argues that secondary notation is crucial to the comprehensibility of graphicalnotations [26]. For example, the use of secondary notations such as labeling, white spaceand clustering allows clarifications and emphases of important information such asstructure and relationships.
This group of benchmarks focuses on the subset of a VPL’s secondary notationaldevices that are static. Benchmark SN1 simply measures the presence of such notationaldevices, and benchmark SN2 measures the number of steps required to navigate toinstances of them. We identified four non-semantic notational devices that might beincluded in a VPL’s navigable static representation: (1) optional naming or labeling, i.e.the non-required ability to attach a name or label to a portion of the program; (2) layoutof a program in ways that have no semantic impact; (3) textual annotations andcomments; and (4) static graphical means of documenting a program, such as the abilityto circle a particular portion of the program and draw an arrow pointing to it.(Time-based annotations such as animations and sound are by definition not part ofa navigable static representation.) To compute benchmark SN1, the designer divides thenumber of secondary notational devices available in the representation by four, the totalnumber of secondary notational devices listed abovea.
Forms/3’s Design 1 includes all of these notational devices. Textual annotations andgraphical annotations can be anywhere on a form. Layout is also entirely flexible, whichallows non-semantic spatial grouping of related cells, etc. Cell names are optional but areoften provided by programmers, because use of meaningful names provides additionalnon-semantic information. Thus SN1\4/4\1.0. The number of steps required tonavigate to the secondary notations, SN2, is zero because these secondary notations arealways automatically visible.
a Four is simply the number we were able to identify. Obviously, this is a case where experience inpractice may turn up additional kinds of secondary notations, in which case the divisor should be increased.An alternative benchmark would have been to eliminate such a divisor by using a raw count instead ofa ratio, but our experiences indicated that this benchmark was more useful in alerting designers aboutopportunities for improvements if it computed a ratio.
REPRESENTATION DESIGN BENCHMARKS 579
4.2. Scalability Benchmarks
In Burnett et al. [3], a VPL’s navigable static representation is counted as an importantaspect in the language’s overall scalability. By measuring the factors pertinent to therepresentation’s ability to display large programs, the benchmarks in this section reflectboth the scalability of the representation itself and its influence on the VPL’s scalabilityas a whole.
4.2.1. Abstraction Gradient
In the Abstraction Gradient CD, the term abstraction gradient was used to mean a VPL’samount of support for abstraction. When applied to VPL representations, to supportabstraction means to provide the ability to exclude selected collections of details fromthe representation, replacing such a collection by a more abstract (less detailed)depiction of that collection of details. Abstraction is a well-known device for scalabilityin programming languages, because it usually reduces the number of logical detailsa programmer must understand in order to understand a particular aspect of a program.In addition to this benefit, support for abstraction in a navigable static representationgenerally allows a larger fraction of a program to fit on the physical screen, sincereplacing a collection of details by an abstract depiction almost always saves space. Thus,there are both cognitive and spatial ways that a representation’s abstraction gradient istied to its scalability.
Benchmark AG1 measures the sources of details that can be abstracted away froma representation and benchmark AG2 measures the number of steps required to do so.As with the secondary notations benchmark SN1, AG1 is a ratio instead of a raw count,to bring out opportunities for improvement. For the denominator, we identified foursources of detail in a VPL that might be abstracted away in a representation: data,operations, other fine-grained portions of the program and details of navigationalinstrumentation devices (control panels, etc.)b. Thus, to calculate the benchmark AG1,the designer divides the sources of detail that can be abstracted away in S by four.
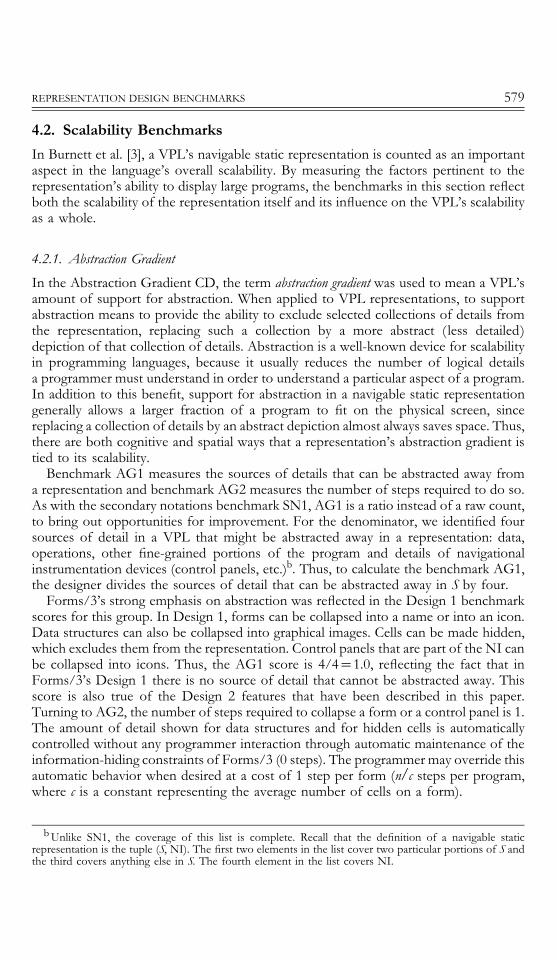
Forms/3’s strong emphasis on abstraction was reflected in the Design 1 benchmarkscores for this group. In Design 1, forms can be collapsed into a name or into an icon.Data structures can also be collapsed into graphical images. Cells can be made hidden,which excludes them from the representation. Control panels that are part of the NI canbe collapsed into icons. Thus, the AG1 score is 4/4\1.0, reflecting the fact that inForms/3’s Design 1 there is no source of detail that cannot be abstracted away. Thisscore is also true of the Design 2 features that have been described in this paper.Turning to AG2, the number of steps required to collapse a form or a control panel is 1.The amount of detail shown for data structures and for hidden cells is automaticallycontrolled without any programmer interaction through automatic maintenance of theinformation-hiding constraints of Forms/3 (0 steps). The programmer may override thisautomatic behavior when desired at a cost of 1 step per form (n/c steps per program,where c is a constant representing the average number of cells on a form).
bUnlike SN1, the coverage of this list is complete. Recall that the definition of a navigable staticrepresentation is the tuple (S, NI). The first two elements in the list cover two particular portions of S andthe third covers anything else in S. The fourth element in the list covers NI.
580 SHERRY YANG ET AL.
4.2.2. Accessibility of Related Information
From a problem-solving point of view, any two pieces of information in a program arerelated if the programmer thinks they are. Based on the Visibility and Side-by-Side-Ability CD, the benchmarks in this group measure a programmer’s ability to displaydesired items side by side. Green and Petre argued that viewing related information sideby side is essential, because the absence of side-by-side viewing amounts to a psycho-logical claim that every problem is solved independently of all other problems [8].Benchmark RI1 measures whether it is possible to include all related information inS and benchmark RI2 measures the number of steps to navigate to it.
In Forms/3’s Design 1, it is possible to view related cells side by side (RI1\‘yes’).A cell can be dragged around on a form as needed; most of the navigational effort arisesin moving the needed forms near each other on the screen. One way is by double-clicking on the form’s icon if it is visible, but this can involve manually moving thingsaround to look for the icon. A less ad hoc way is by scrolling to the form’s name in thecontrol panel’s list of forms and clicking the ‘display’ button, which brings the selectedform into a visible portion of the screen. Thus, counting the time to scroll through thelist, RI2 can approach the square of the number of forms in the program, or (n/c)2,where n is the number of cells in the program and c is the average number of cells perform.
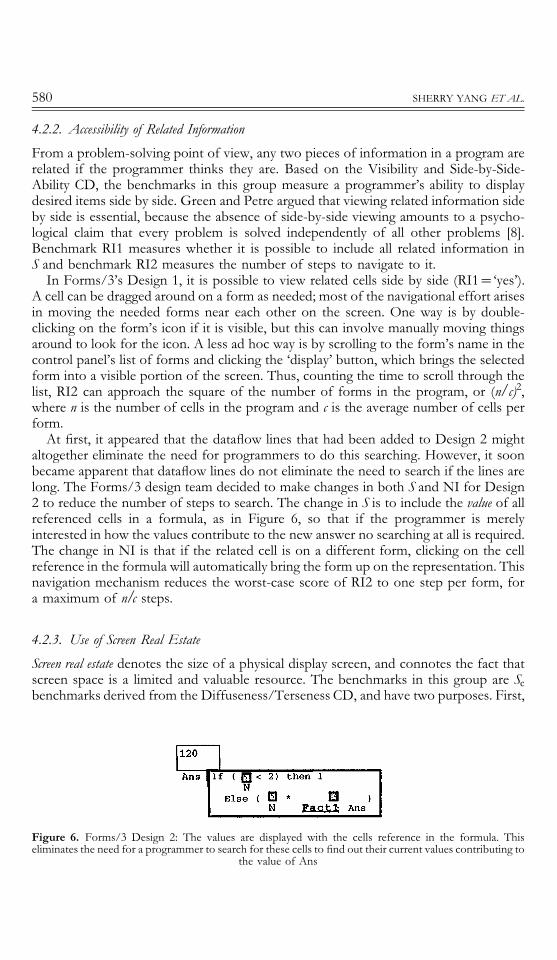
At first, it appeared that the dataflow lines that had been added to Design 2 mightaltogether eliminate the need for programmers to do this searching. However, it soonbecame apparent that dataflow lines do not eliminate the need to search if the lines arelong. The Forms/3 design team decided to make changes in both S and NI for Design2 to reduce the number of steps to search. The change in S is to include the value of allreferenced cells in a formula, as in Figure 6, so that if the programmer is merelyinterested in how the values contribute to the new answer no searching at all is required.The change in NI is that if the related cell is on a different form, clicking on the cellreference in the formula will automatically bring the form up on the representation. Thisnavigation mechanism reduces the worst-case score of RI2 to one step per form, fora maximum of n/c steps.
4.2.3. Use of Screen Real Estate
Screen real estate denotes the size of a physical display screen, and connotes the fact thatscreen space is a limited and valuable resource. The benchmarks in this group are Scbenchmarks derived from the Diffuseness/Terseness CD, and have two purposes. First,
Figure 6. Forms/3 Design 2: The values are displayed with the cells reference in the formula. Thiseliminates the need for a programmer to search for these cells to find out their current values contributing to
the value of Ans
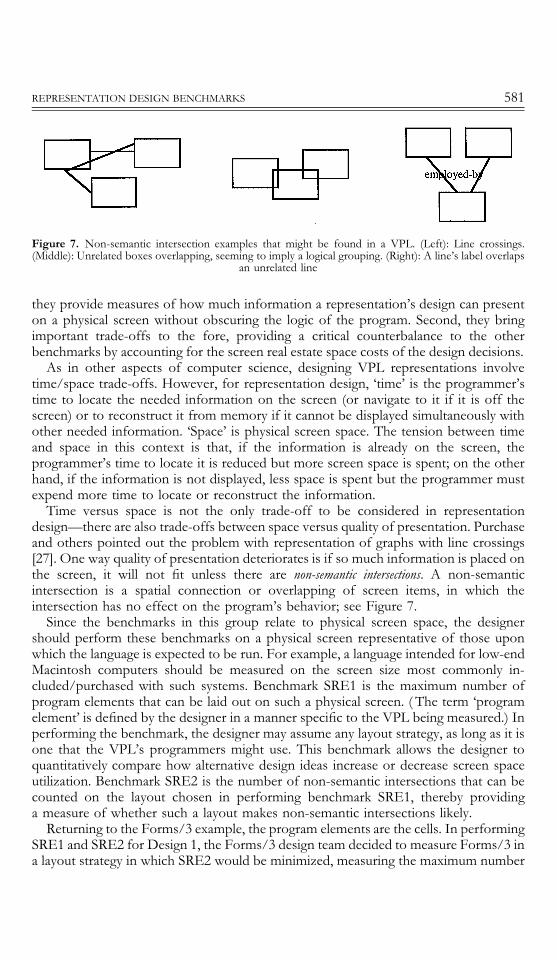
Figure 7. Non-semantic intersection examples that might be found in a VPL. (Left): Line crossings.(Middle): Unrelated boxes overlapping, seeming to imply a logical grouping. (Right): A line’s label overlaps
an unrelated line
REPRESENTATION DESIGN BENCHMARKS 581
they provide measures of how much information a representation’s design can presenton a physical screen without obscuring the logic of the program. Second, they bringimportant trade-offs to the fore, providing a critical counterbalance to the otherbenchmarks by accounting for the screen real estate space costs of the design decisions.
As in other aspects of computer science, designing VPL representations involvetime/space trade-offs. However, for representation design, ‘time’ is the programmer’stime to locate the needed information on the screen (or navigate to it if it is off thescreen) or to reconstruct it from memory if it cannot be displayed simultaneously withother needed information. ‘Space’ is physical screen space. The tension between timeand space in this context is that, if the information is already on the screen, theprogrammer’s time to locate it is reduced but more screen space is spent; on the otherhand, if the information is not displayed, less space is spent but the programmer mustexpend more time to locate or reconstruct the information.
Time versus space is not the only trade-off to be considered in representationdesign—there are also trade-offs between space versus quality of presentation. Purchaseand others pointed out the problem with representation of graphs with line crossings[27]. One way quality of presentation deteriorates is if so much information is placed onthe screen, it will not fit unless there are non-semantic intersections. A non-semanticintersection is a spatial connection or overlapping of screen items, in which theintersection has no effect on the program’s behavior; see Figure 7.
Since the benchmarks in this group relate to physical screen space, the designershould perform these benchmarks on a physical screen representative of those uponwhich the language is expected to be run. For example, a language intended for low-endMacintosh computers should be measured on the screen size most commonly in-cluded/purchased with such systems. Benchmark SRE1 is the maximum number ofprogram elements that can be laid out on such a physical screen. ( The term ‘programelement’ is defined by the designer in a manner specific to the VPL being measured.) Inperforming the benchmark, the designer may assume any layout strategy, as long as it isone that the VPL’s programmers might use. This benchmark allows the designer toquantitatively compare how alternative design ideas increase or decrease screen spaceutilization. Benchmark SRE2 is the number of non-semantic intersections that can becounted on the layout chosen in performing benchmark SRE1, thereby providinga measure of whether such a layout makes non-semantic intersections likely.
Returning to the Forms/3 example, the program elements are the cells. In performingSRE1 and SRE2 for Design 1, the Forms/3 design team decided to measure Forms/3 ina layout strategy in which SRE2 would be minimized, measuring the maximum number
582 SHERRY YANG ET AL.
of cells that would fit on the screen in the absence of any non-semantic intersections.Approximating with an average cell size and formula length, the maximum number ofcells that fit on the physical screen of a Unix-based graphical workstation or X-terminalwith no non-semantic intersections is 36 when all formulas (and values) are shown. Thisis approximately 54% of the amount of source code that would be shown in a full-length window (66 lines) for a textual language. However, the Forms/3 display alsoincludes all the intermediate values and final outputs, which in the textual languagewould require adding a debugger window and a window to show the execution’s finalresults. This score points out that a strength of this cell-based representation is that it isa reasonably compact way to combine a presentation of source code, intermediateresults and final outputs, while still avoiding non-semantic intersections.
The space and non-semantic intersection costs of the design features in Design 2 arecompared with Design 1 individually and in combination in Table 2. Not surprisingly,Design 1 allows more program elements to fit on the screen with fewer intersectionsthan Design 2, because Design 1 contains less information than Design 2. This is anexample of the trade-offs these benchmarks help bring out. The Forms/3 design teamdecided that the space and intersection costs of Design 2 were acceptable because thenavigational instrumentation portion of Design 2 allows the programmer to be the judgeof these trade-offs, including or excluding from the screen as many of the Design 2features as desired.
5. Benchmarks for Audience-Specific VPLs
Many VPLs are special-purpose languages designed to make limited kinds of program-ming accessible to a particular audience. The target audience is composed of people whodo not want to use conventional programming languages for those kinds of program-ming. We will use the term audience-specific VPLs to describe such VPLs.
Examples of audience-specific VPLs range from coarse-grained VPLs for scientistsand engineers to use in visualizing their data, to embedded VPLs for end-users to use inautomating repetitive editing tasks. Although the benchmarks in the previous sectionsapply to these VPLs, because the task at hand is indeed programming, a new issue notcovered by the benchmarks described so far arises: whether the audience-specific VPL’srepresentation is well suited to its particular audience.
The benchmarks in this section focus on this issue. They were derived from theCloseness of Mapping CD. This CD considers the question of whether programming ina given language is similar to the way its audience might solve the same problem by handin the ‘real world’. This question has implications regarding how well the audience canuse the language. For example, Nardi points to a number of empirical studies indicatingthat people consistently perform better at solving problems couched in familiar terms[28]. In the realm of representation design, the issue narrows to whether the appearance ofa VPL’s elements is similar to the appearance of the corresponding elements in theaudience’s experience and background.
These benchmarks are unlike the benchmarks presented thus far in two ways. Thefirst difference is that they compare representation elements with the prerequisitebackground expected of the VPL’s particular audience, and thus make sense onlyfor audience-specific VPLs. The second difference is that all the benchmarks in this
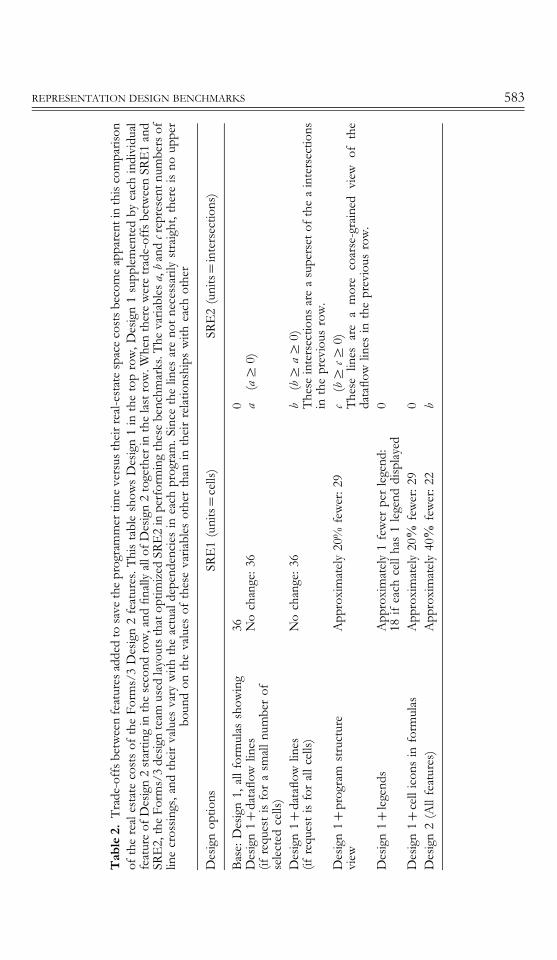
Table
2.
Tra
de-o
ffsbe
twee
nfe
atur
esad
ded
tosa
veth
epr
ogra
mm
ertim
eve
rsus
theirre
al-e
stat
esp
aceco
stsbe
com
eap
pare
ntin
this
com
paris
onof
the
real
esta
teco
stsof
the
Form
s/3
Des
ign
2fe
atur
es.T
hista
ble
show
sD
esig
n1
inth
eto
pro
w,D
esig
n1
supp
lem
ente
dby
each
indi
vidu
alfe
atur
eof
Des
ign
2star
ting
inth
ese
cond
row
,and
finally
allo
fD
esig
n2
toge
ther
inth
elast
row.W
hen
ther
ewer
etrad
e-of
fsbe
twee
nSR
E1
and
SRE2,
theFo
rms/
3de
sign
team
used
layo
utsth
atop
timized
SRE2
inpe
rfor
min
gth
esebe
nchm
arks
.The
varia
bles
a,ban
dcr
epre
sent
num
bers
oflin
ecr
ossing
s,an
dth
eirva
lues
vary
with
the
actu
alde
pend
encies
inea
chpr
ogra
m.S
ince
the
lines
are
notne
cess
arily
stra
ight
,the
reis
noup
per
boun
don
the
valu
esof
thes
eva
riabl
esot
her
than
inth
eirre
latio
nshi
pswith
each
othe
r
Des
ign
optio
nsSR
E1
(uni
ts\
cells
)SR
E2
(uni
ts\
inte
rsec
tions
)
Bas
e:D
esig
n1,
allf
orm
ulas
show
ing
360
Des
ign
1]da
taflo
wlin
es(if
requ
estis
for
asm
alln
umbe
rof
select
edce
lls)
No
chan
ge:3
6a
(a5
0)
Des
ign
1]da
taflo
wlin
es(if
requ
estis
for
allc
ells)
No
chan
ge:3
6b
(b5
a50)
The
sein
ters
ectio
nsar
ea
supe
rset
ofth
ea
inte
rsec
tions
inth
epr
evio
usro
w.
Des
ign
1]pr
ogra
mstru
ctur
evi
ewA
ppro
xim
ately
20%
fewer
:29
c(b5
c50)
The
selin
esar
ea
mor
eco
arse
-gra
ined
view
ofth
eda
taflo
wlin
esin
the
prev
ious
row.
Des
ign
1]lege
nds
App
roxi
mat
ely
1fe
wer
perlege
nd:
18if
each
cell
has
1lege
nddi
splaye
d0
Des
ign
1]ce
llicon
sin
form
ulas
App
roxi
mat
ely
20%
fewer
:29
0D
esig
n2
(All
feat
ures
)A
ppro
xim
ately
40%
fewer
:22
b
REPRESENTATION DESIGN BENCHMARKS 583
584 SHERRY YANG ET AL.
section are performed the same way—by answering the following question: Does theSrepresentation elementT look like the Sobject/operation/composition mechanismTin the intended audience’s prerequisite background?
5.1. How to Apply the Audience-Specific Benchmarks
The audience-specific benchmarks AS1, AS2 and AS3 are Sc benchmarks for the objects,operations, and spatial composition mechanisms, respectively. Computing them isa matter of answering the question from the previous paragraph for each element of therepresentation.
To do this, the designer must first identify what is in the intended audience’sprerequisite background; that is, what prerequisites this audience is expected to havefulfilled. The prerequisites include whatever prior computer experience (if any) isexpected as well as other kinds of knowledge that might be expected. For example, theintended audience of a macro-building VPL for graphical editing might be expected toknow not only about editing graphics on a computer, but also about everyday objectsand phenomena such as telephones, the flow of water through pipes and gravity.
The next step is to identify the objects and operations that are depicted in therepresentation, along with the ways these objects and operations can be spatiallycomposed. (It is not of critical importance whether a particular element is classified as anobject, as an operation or as a composition mechanism, since all are measured the sameway; the division into the three groups is simply a way to help organize the identificationprocess.) Finally, for each object, operation and composition mechanism identified, thedesigner notes whether its appearance looks like the corresponding item from theaudience’s prerequisite background.
Thus, to compute AS1, the designer asks, for each object in the representation, ‘Doesthe Srepresentation elementT look like the SobjectT in the intended audience’s prerequi-site background?’ and divides the total number of ‘yes’ answers by the total number ofobjects. AS2 and AS3 are computed the same way: AS2 for the operations and AS3 forthe spatial composition of objects and operations.
5.2. Detailed Example: Using the Audience-Specific Benchmarksas a Design Aid in ICBE
For concrete examples of applying the audience-specific benchmarks, we will turn to theaudience-specific language ICBE ( Interpretation and Customization By Example).ICBE is a high-level, set-oriented dataflowc VPL for users who are comfortable withcomputers but have no formal training in programming. Its goal is to allow such users tocreate custom applications by combining GUI objects, built-in capabilities such asdatabase querying, plug-in objects such as virtual fax machines and telephones andinteroperations between other applications such as spreadsheets and graphics packages.Programming in ICBE is a matter of simply connecting these objects using dataflow andcontrol-flow lines. See Figure 8 for an example. ICBE is a generalization of the kind of
c The term ‘set-oriented dataflow’ is meant to describe the fact that sets, rather than atomic values, flowalong dataflow paths.
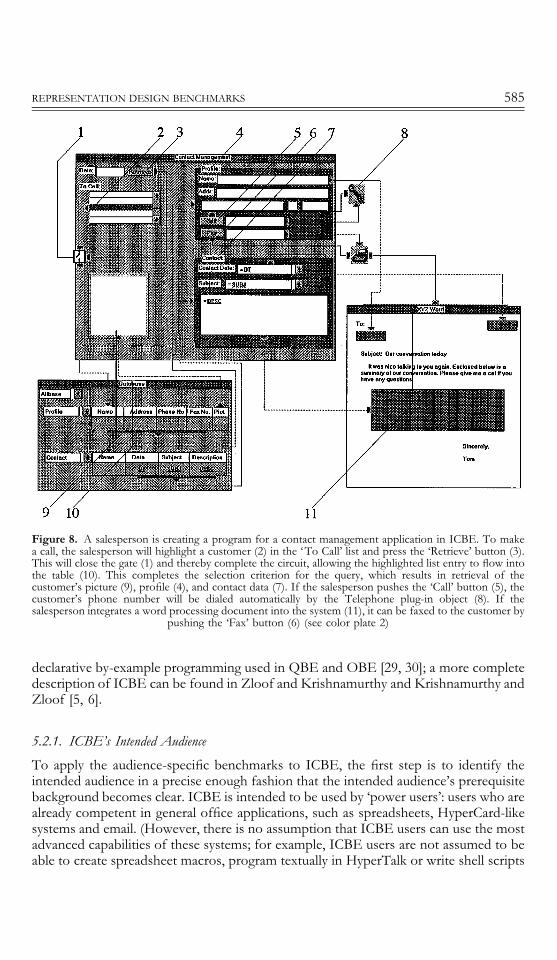
Figure 8. A salesperson is creating a program for a contact management application in ICBE. To makea call, the salesperson will highlight a customer (2) in the ‘To Call’ list and press the ‘Retrieve’ button (3).This will close the gate (1) and thereby complete the circuit, allowing the highlighted list entry to flow intothe table (10). This completes the selection criterion for the query, which results in retrieval of thecustomer’s picture (9), profile (4), and contact data (7). If the salesperson pushes the ‘Call’ button (5), thecustomer’s phone number will be dialed automatically by the Telephone plug-in object (8). If thesalesperson integrates a word processing document into the system (11), it can be faxed to the customer by
pushing the ‘Fax’ button (6) (see color plate 2)
REPRESENTATION DESIGN BENCHMARKS 585
declarative by-example programming used in QBE and OBE [29, 30]; a more completedescription of ICBE can be found in Zloof and Krishnamurthy and Krishnamurthy andZloof [5, 6].
5.2.1. ICBE’s Intended Audience
To apply the audience-specific benchmarks to ICBE, the first step is to identify theintended audience in a precise enough fashion that the intended audience’s prerequisitebackground becomes clear. ICBE is intended to be used by ‘power users’: users who arealready competent in general office applications, such as spreadsheets, HyperCard-likesystems and email. (However, there is no assumption that ICBE users can use the mostadvanced capabilities of these systems; for example, ICBE users are not assumed to beable to create spreadsheet macros, program textually in HyperTalk or write shell scripts
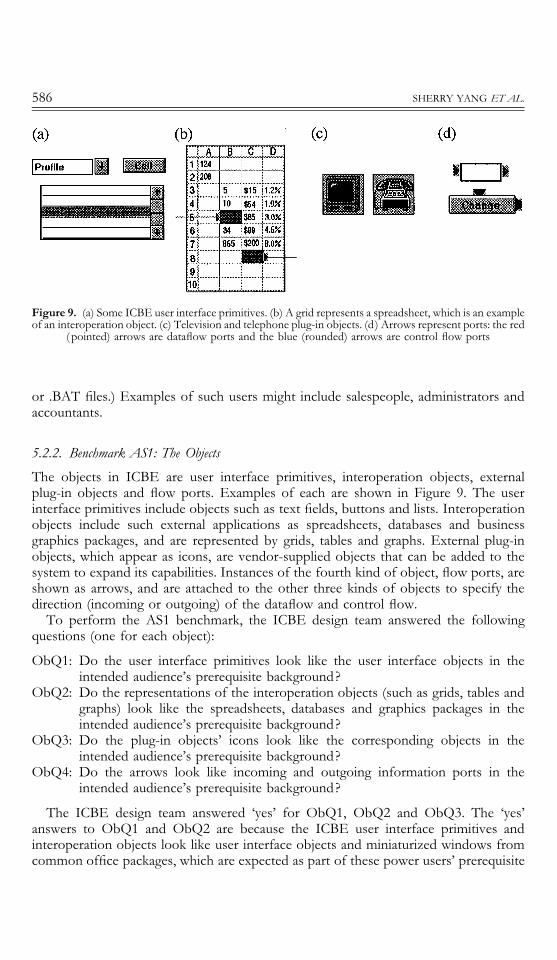
Figure 9. (a) Some ICBE user interface primitives. (b) A grid represents a spreadsheet, which is an exampleof an interoperation object. (c) Television and telephone plug-in objects. (d) Arrows represent ports: the red
(pointed) arrows are dataflow ports and the blue (rounded) arrows are control flow ports
586 SHERRY YANG ET AL.
or .BAT files.) Examples of such users might include salespeople, administrators andaccountants.
5.2.2. Benchmark AS1: The Objects
The objects in ICBE are user interface primitives, interoperation objects, externalplug-in objects and flow ports. Examples of each are shown in Figure 9. The userinterface primitives include objects such as text fields, buttons and lists. Interoperationobjects include such external applications as spreadsheets, databases and businessgraphics packages, and are represented by grids, tables and graphs. External plug-inobjects, which appear as icons, are vendor-supplied objects that can be added to thesystem to expand its capabilities. Instances of the fourth kind of object, flow ports, areshown as arrows, and are attached to the other three kinds of objects to specify thedirection (incoming or outgoing) of the dataflow and control flow.
To perform the AS1 benchmark, the ICBE design team answered the followingquestions (one for each object):
ObQ1: Do the user interface primitives look like the user interface objects in theintended audience’s prerequisite background?
ObQ2: Do the representations of the interoperation objects (such as grids, tables andgraphs) look like the spreadsheets, databases and graphics packages in theintended audience’s prerequisite background?
ObQ3: Do the plug-in objects’ icons look like the corresponding objects in theintended audience’s prerequisite background?
ObQ4: Do the arrows look like incoming and outgoing information ports in theintended audience’s prerequisite background?
The ICBE design team answered ‘yes’ for ObQ1, ObQ2 and ObQ3. The ‘yes’answers to ObQ1 and ObQ2 are because the ICBE user interface primitives andinteroperation objects look like user interface objects and miniaturized windows fromcommon office packages, which are expected as part of these power users’ prerequisite
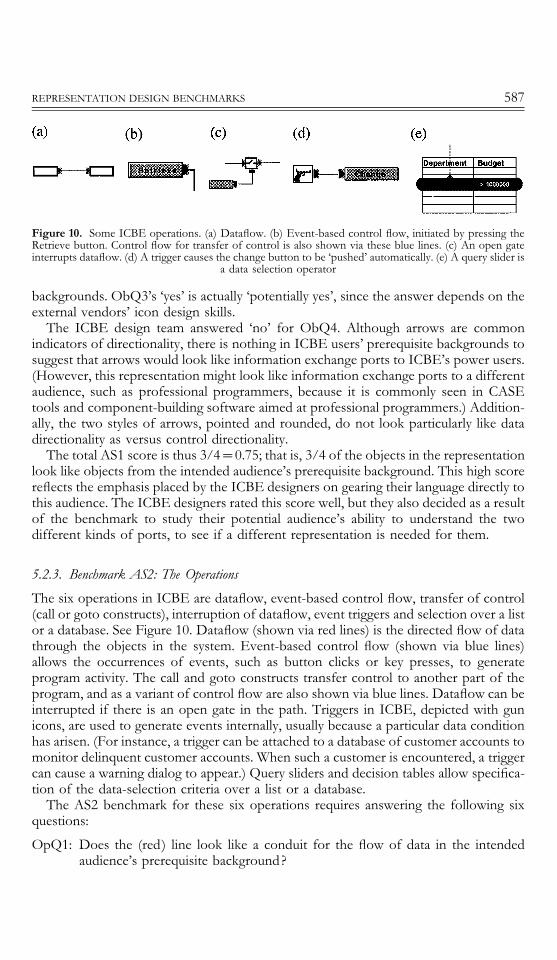
Figure 10. Some ICBE operations. (a) Dataflow. (b) Event-based control flow, initiated by pressing theRetrieve button. Control flow for transfer of control is also shown via these blue lines. (c) An open gateinterrupts dataflow. (d) A trigger causes the change button to be ‘pushed’ automatically. (e) A query slider is
a data selection operator
REPRESENTATION DESIGN BENCHMARKS 587
backgrounds. ObQ3’s ‘yes’ is actually ‘potentially yes’, since the answer depends on theexternal vendors’ icon design skills.
The ICBE design team answered ‘no’ for ObQ4. Although arrows are commonindicators of directionality, there is nothing in ICBE users’ prerequisite backgrounds tosuggest that arrows would look like information exchange ports to ICBE’s power users.(However, this representation might look like information exchange ports to a differentaudience, such as professional programmers, because it is commonly seen in CASEtools and component-building software aimed at professional programmers.) Addition-ally, the two styles of arrows, pointed and rounded, do not look particularly like datadirectionality as versus control directionality.
The total AS1 score is thus 3/4\0.75; that is, 3/4 of the objects in the representationlook like objects from the intended audience’s prerequisite background. This high scorereflects the emphasis placed by the ICBE designers on gearing their language directly tothis audience. The ICBE designers rated this score well, but they also decided as a resultof the benchmark to study their potential audience’s ability to understand the twodifferent kinds of ports, to see if a different representation is needed for them.
5.2.3. Benchmark AS2: The Operations
The six operations in ICBE are dataflow, event-based control flow, transfer of control(call or goto constructs), interruption of dataflow, event triggers and selection over a listor a database. See Figure 10. Dataflow (shown via red lines) is the directed flow of datathrough the objects in the system. Event-based control flow (shown via blue lines)allows the occurrences of events, such as button clicks or key presses, to generateprogram activity. The call and goto constructs transfer control to another part of theprogram, and as a variant of control flow are also shown via blue lines. Dataflow can beinterrupted if there is an open gate in the path. Triggers in ICBE, depicted with gunicons, are used to generate events internally, usually because a particular data conditionhas arisen. (For instance, a trigger can be attached to a database of customer accounts tomonitor delinquent customer accounts. When such a customer is encountered, a triggercan cause a warning dialog to appear.) Query sliders and decision tables allow specifica-tion of the data-selection criteria over a list or a database.
The AS2 benchmark for these six operations requires answering the following sixquestions:
OpQ1: Does the (red) line look like a conduit for the flow of data in the intendedaudience’s prerequisite background?
588 SHERRY YANG ET AL.
OpQ2: Does the (blue) line look like a conduit for event-based control in the intendedaudience’s prerequisite background?
OpQ3: Does the (blue) line look like a conduit for the transfer of control in theintended audience’s prerequisite background?
OpQ4: Do the open gates look like a way to interrupt dataflow in the intendedaudience’s prerequisite background?
OpQ5: Does the gun trigger look like a mechanism for triggering events in the intendedaudience’s prerequisite background?
OpQ6: Do the decision tables and query sliders look like mechanisms for data selectionover a database or a list in the intended audience’s prerequisite background?
The ICBE designers answered ‘yes’ for OpQ1, because the red lines, which areconnected to the arrow objects discussed earlier, look similar to widely understoodconduits for directed flow such as water pipes or map representations of one-waystreets. They also answered ‘yes’ for OpQ2, because the blue lines look and behave thesame way as electrical wiresd. Regarding OpQ3, the designers noted that using the sameblue line to indicate transfer of control overloads this device in the representation.However, this does not impact AS2’s score; rather it would be reflected in the score forBenchmark L1 (Visibility of Program Logic). For AS2’s OpQ3, while lines for transfer-ring control may be familiar to professional programmers and others who have seenflowcharts, they do not resemble anything from prerequisite backgrounds of ICBE’sintended audience, and earned a ‘no’ answer. Interrupting potential flow by openinga gate to disconnect the lines looks like a mechanism that would interrupt the flow ofwater or traffic, and earned a ‘yes’ for OpQ4. The ICBE designers gave questions OpQ5and OpQ6 ‘no’s because, although both of these devices might be familiar to program-mers or engineers, they do not necessarily look like devices ICBE’s intended audiencehas seen before. Adding up the numerators and dividing by 6 gives an AS2 score of3/6\0.50.
5.2.4. Benchmark AS3: Spatial Composition
The spatial composition of elements of a language’s representation is the way they arearranged and connected on the screen. Especially for programs simulating some physicalenvironment, this aspect of a representation can have a strong influence on how closelythe representation matches the way the problem appears in the audience’s prerequisitebackground. In ICBE’s representation, there are four ways objects and/or operationscan be spatially composed: by their layout, by their connections with lines, by theirplacement into containers as a grouping mechanism and by nesting containers withinother containers as a constrained grouping mechanism. Figure 8 shows one example oflayout with several examples of line connections and Figure 11 shows a container nestedwithin another container.
To measure whether the spatial composition mechanisms in the representation mimicthe way the objects and operations fit together in the intended audience’s prerequisite
d However, the designers noted that denoting the difference between water/data lines and electrical/controllines by using the colors red and blue does not map to any generally accepted convention.
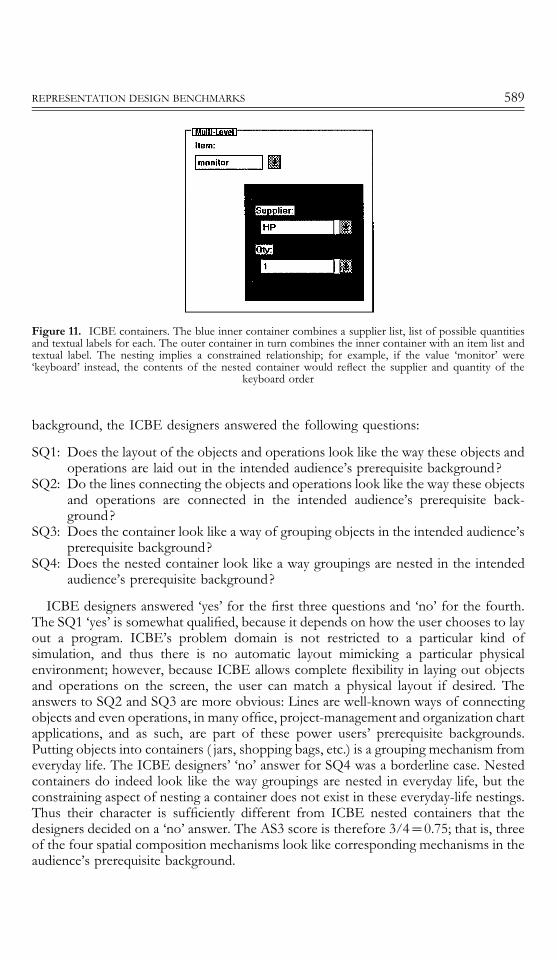
Figure 11. ICBE containers. The blue inner container combines a supplier list, list of possible quantitiesand textual labels for each. The outer container in turn combines the inner container with an item list andtextual label. The nesting implies a constrained relationship; for example, if the value ‘monitor’ were‘keyboard’ instead, the contents of the nested container would reflect the supplier and quantity of the
keyboard order
REPRESENTATION DESIGN BENCHMARKS 589
background, the ICBE designers answered the following questions:
SQ1: Does the layout of the objects and operations look like the way these objects andoperations are laid out in the intended audience’s prerequisite background?
SQ2: Do the lines connecting the objects and operations look like the way these objectsand operations are connected in the intended audience’s prerequisite back-ground?
SQ3: Does the container look like a way of grouping objects in the intended audience’sprerequisite background?
SQ4: Does the nested container look like a way groupings are nested in the intendedaudience’s prerequisite background?
ICBE designers answered ‘yes’ for the first three questions and ‘no’ for the fourth.The SQ1 ‘yes’ is somewhat qualified, because it depends on how the user chooses to layout a program. ICBE’s problem domain is not restricted to a particular kind ofsimulation, and thus there is no automatic layout mimicking a particular physicalenvironment; however, because ICBE allows complete flexibility in laying out objectsand operations on the screen, the user can match a physical layout if desired. Theanswers to SQ2 and SQ3 are more obvious: Lines are well-known ways of connectingobjects and even operations, in many office, project-management and organization chartapplications, and as such, are part of these power users’ prerequisite backgrounds.Putting objects into containers ( jars, shopping bags, etc.) is a grouping mechanism fromeveryday life. The ICBE designers’ ‘no’ answer for SQ4 was a borderline case. Nestedcontainers do indeed look like the way groupings are nested in everyday life, but theconstraining aspect of nesting a container does not exist in these everyday-life nestings.Thus their character is sufficiently different from ICBE nested containers that thedesigners decided on a ‘no’ answer. The AS3 score is therefore 3/4\0.75; that is, threeof the four spatial composition mechanisms look like corresponding mechanisms in theaudience’s prerequisite background.
590 SHERRY YANG ET AL.
5.2.5. Outcomes of the Benchmarks for ICBE
The ICBE designers found that using the representation design benchmarks—both theaudience-specific benchmarks described in this section and the rest of the benchmarksdescribed in Section 4—identified previously unnoticed issues in the representation. Forexample, the AS1 audience-specific benchmark pointed to a possible need for a newport representation. Also, audience-specific benchmarks AS2 and AS3 pointed out thefact that some of the representation elements, while they are very likely familiar toprogrammers or engineers, are not necessarily familiar to the intended audience forICBE. For the representation elements with ‘no’ answers, the next logical step isaudience testing to determine whether the lack of familiarity to this audience of theseparticular elements will affect ICBE’s long-term usability; that is, whether or not theseparticular representation elements can be learned easily by ICBE’s intended audienceafter seeing the language in action.
6. An Empirical Study of VPL Designers
In considering the usefulness of the representation design benchmarks to designers, thefollowing question arises: Does using the representation design benchmarks in thedesign process actually produce better representations? Unfortunately, empiricallyarriving at the answer to this question is probably not feasible. Such a study wouldrequire evaluating many VPLs with dual implementations, one implementation of eachVPL corresponding to a design created without the use of the benchmarks and the othercorresponding to the design created with the use of the benchmarks. The two imple-mentations of each language would have to be empirically compared for their usefulnessto programmers. The primary difficulty with such a study would be finding severaldifferent VPL design teams willing to expend the effort to design and implement dualversions of their representations.
However, useful insights can be gained about this question by considering two relatedquestions that are more tractable for objective analysis:
(1) How usable are the representation design benchmarks by VPL designers?(2) Does using the representation design benchmarks in the design process uncover
problems and issues that would otherwise be overlooked?
To learn more about the answers to these two questions, we conducted a smallempirical study with two goals. The first goal (Goal 1) was to uncover problems VPLdesigners might have in using the benchmarks. The second goal (Goal 2) was to learnwhether VPL designers other than ourselves could use the benchmarks, and whethertheir doing so would be useful in uncovering problems in their designs of navigablestatic representations. The hypothesis to be tested for this second goal was that thesubjects would be able to use the benchmarks and would find at least one problem andmake at least one change, addition or deletion to their representation designs as a directresult of using the representation design benchmarks. The study was very helpfulregarding Goal 1, and the Goal 2 results were favorable about the usefulness of thebenchmarks to VPL designers.
REPRESENTATION DESIGN BENCHMARKS 591
6.1. The Subjects
The subjects for the study needed to be VPL designers who were in the midst ofdesigning a VPL representation. Such subjects would normally be hard to find, but wetimed the study so that we could recruit the five Computer Science graduate studentswho were in the process of designing VPLs (and navigable static representations forthem) for a graduate course taught by one of the authors (Burnett). Recent studies ofusability testing show that five test participants are sufficient to uncover approximately80% of the usability problems [31]. (Virzi also reports that additional subjects are lessand less likely to reveal new information.) Thus, this was a reasonable number ofsubjects for addressing our first goal, finding the usability problems that the Forms/3and ICBE design teams had missed. We would have liked a larger number of subjectsfor our second goal, learning whether the benchmarks were useful to VPL designers.However, this sample size is fairly typical of studies relating to non-traditional program-ming languages, due to the difficulties in finding suitable subjects for theme.
6.2. The Procedure
The subjects were already in the process of designing a small VPL. To test our Goal 2hypothesis, we chose a within-subject experimental design with a before-benchmarksdesign task and a during-benchmarks design task. These tasks also provided informationwe needed to achieve our first goal, finding usability problems.
6.2.1. Before Using the Benchmarks
The subjects’ before-benchmarks task was to submit a design of all viewable aspects oftheir VPLs. This task served two purposes: it provided the baseline data about thedesigns created without the benchmarks, and it served as a training function to helpthem understand what a navigable static representation was.
Because one purpose of this training task was for the collection of baseline data, itwas important to make sure that the subjects’ reporting of their designs was complete,i.e., that they would not omit important information through misunderstandings aboutwhat was part of the navigable static representation. We avoided this potential problemby having them include everything viewable in this task. The training purpose wasaccomplished by having the subjects classify the elements of the design in threecategories: the static representation S, the navigational instrumentation NI and dynamicrepresentations used in the VPL not in NI or S, such as animations, balloon help, etc.They then received feedback about the correctness of their classifications. To give theman incentive to do their best at devising a good representation without the use of thebenchmarks, the task was set up as a graded project. The subjects were given one weekto perform the task.
The students had been gradually prepared for this task during the term. Throughoutthe course, they had been reading papers about VPLs, writing programs in a variety of
e See, for example, the study of the VPL LabView (5 subjects) [32], the study of the VPL ChemTrains(6 subjects) [15], and the study of a generic Petri-net language (12 subjects) [33].
592 SHERRY YANG ET AL.
VPLs and discussing the research problems associated with VPLs, including staticrepresentation. Just before they were asked to perform the task, we defined whata navigable static representation was and motivated its importance, but we did notintroduce the benchmarks.
6.2.2. During Use of the Benchmarks
After the first task was completed, the subjects were given a lecture on representationdesign benchmarks. They were then asked to perform the second task, which was tomeasure the navigable static representation part of their VPL’s design using thebenchmarks, being allowed to make any modifications they thought necessary. Thepurposes of this task were to find usability problems with using the individual bench-marks (Goal 1) and to test our hypothesis about whether they would be able to use thebenchmarks and in doing so would find any problems and make any changes to theirdesigns as a result of using the benchmarks (Goal 2).
The subjects were instructed to measure their designs as follows. They were to startwith their representation design as of the end of the previous task. They were then tomeasure it using the benchmarks. If the outcome of any benchmark pointed outproblems to them, they were permitted to change the design to solve the problem, andthen re-measure. (During the same period, the students were designing their term-project VPLs.) The subjects turned in the results of the during-benchmarks task twoweeks after the assignment was made. For purposes of motivation, it too was a gradedassignment, where the grade was based on the quality of their designs.
Grading this task raised the question of what set of grading criteria would definewhether they had designed a ‘good’ representation. We decided to follow the samplemapping from measurements to ratings shown in Appendix B. This meant that thegrades would be determined by whether a design’s benchmarks mapped into mostly‘good’ ratings. To avoid prejudicing the results by forcing design changes via thesegrading criteria, only ratings for those benchmarks that were deemed important by the subject forthat particular VPL were included in the grading criteria. Any benchmark could beeliminated if the subject explained why it was not an important measure, given theirlanguage’s goals.
The subjects turned in their completed representation design and the rating informa-tion. When they turned in this information, they were given time in class to list anyproblems they had using the benchmarks and to annotate their design pointing outwhich, if any, changes they made as a result of using the representation designbenchmarks, as distinguished from changes they made for other reasons.
6.3. Results and Discussion: Goal 1
All of the subjects were able to complete the before-benchmarks training task, but theyall had trouble categorizing the viewable elements correctly into the three categories(static, navigational aids and dynamic). We clarified the definition of navigable staticrepresentations to partially address this problem. In addition, however, we are inclinedto infer from this evidence that isolating the navigable static representation from the restof the VPL is an academic exercise that does not come naturally for interactive VPLs,and is one that might be omitted in the absence of the benchmarks. The poor track
REPRESENTATION DESIGN BENCHMARKS 593
record of static representations for interactive VPLs lends some support to thisconjecture. Since we believe that this isolation is important if the designer is to obtaina clear understanding of the representation’s strengths and weaknesses, we view this asone advantage of using the benchmarks.
All of the subjects also completed the during-benchmarks task, and reported theproblems they had in understanding how to obtain some of the measurements. Thesubjects were successful with the NI benchmarks, but had some difficulties with theSp and Sc benchmarks. (At the time of the study, the benchmarks measuring NI and thebenchmarks measuring S were not explicitly separated.) Also, the screen real estatebenchmarks were based upon a test suite at that time, and none of the subjects were ableto perform these benchmarks with any accuracy. The subjects also suggested that thebenchmarks as a whole better reflect the trade-offs between adding new features to therepresentation versus the space and navigational effort required by these additionalfeatures.
As a result of the usability issues the subjects found in the during-benchmarks task,we made the following changes, all of which are incorporated in the benchmarks asdescribed in this paper. First, an explicit separation was made between the NI bench-marks versus the benchmarks measuring aspects of S (Sp and Sc). We also revised thescreen real estate benchmarks to measure characteristics of the representation itselfrather than characteristics of test programs, and to include a measure of general spacecharacteristics (SRE1). Finally, we added several new NI benchmarks throughout thebenchmark groups to be sure the trade-offs between adding features and navigationaleffort imposed by those additional features were well represented.
6.4. Results and Discussion: Goal 2
All of the subjects reported that the representation design benchmarks were useful tothem. Their subjective reports were that the benchmarks helped them to think throughtheir design more precisely, thereby focusing on problems that they had overlookedprior to using the benchmarks. The Goal 2 hypothesis was verified—all the subjectswere able to complete the during-benchmarks task, and all the subjects found problemsand made additions and/or changes to their designs as a direct result of using thebenchmarks. Since they had previously been given incentives and time to make the bestdesign they could (without the benchmarks), we expected that these changes made in theduring-benchmarks task were as a direct result of the benchmarks. This fact was verifiedby their annotations on their design documents, which identified the changes resultingfrom using the benchmarks. The problems they found with their designs and thechanges they made are summarized in Table 3.
7. Beyond Design Time?
We have discussed the usefulness of the benchmarks as a design time aid andhave shown how they can be used to evaluate a single design and to compareseveral alternative design ideas. Since the notion of using benchmarks as a designaid is somewhat unusual, a question that naturally arises is whether representa-tion design benchmarks can be used in a more conventional way, such as in
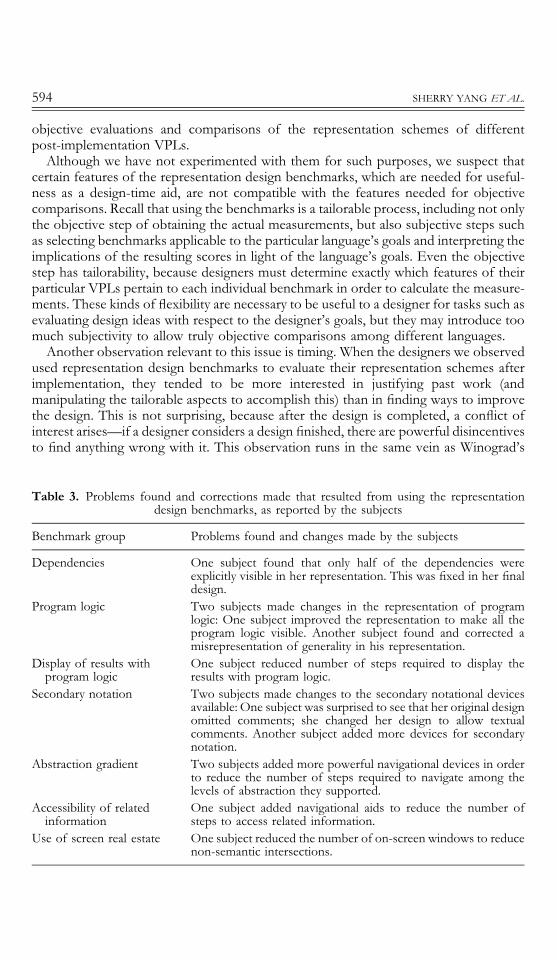
594 SHERRY YANG ET AL.
objective evaluations and comparisons of the representation schemes of differentpost-implementation VPLs.
Although we have not experimented with them for such purposes, we suspect thatcertain features of the representation design benchmarks, which are needed for useful-ness as a design-time aid, are not compatible with the features needed for objectivecomparisons. Recall that using the benchmarks is a tailorable process, including not onlythe objective step of obtaining the actual measurements, but also subjective steps suchas selecting benchmarks applicable to the particular language’s goals and interpreting theimplications of the resulting scores in light of the language’s goals. Even the objectivestep has tailorability, because designers must determine exactly which features of theirparticular VPLs pertain to each individual benchmark in order to calculate the measure-ments. These kinds of flexibility are necessary to be useful to a designer for tasks such asevaluating design ideas with respect to the designer’s goals, but they may introduce toomuch subjectivity to allow truly objective comparisons among different languages.
Another observation relevant to this issue is timing. When the designers we observedused representation design benchmarks to evaluate their representation schemes afterimplementation, they tended to be more interested in justifying past work (andmanipulating the tailorable aspects to accomplish this) than in finding ways to improvethe design. This is not surprising, because after the design is completed, a conflict ofinterest arises—if a designer considers a design finished, there are powerful disincentivesto find anything wrong with it. This observation runs in the same vein as Winograd’s
Table 3. Problems found and corrections made that resulted from using the representationdesign benchmarks, as reported by the subjects
Benchmark group Problems found and changes made by the subjects
Dependencies One subject found that only half of the dependencies wereexplicitly visible in her representation. This was fixed in her finaldesign.
Program logic Two subjects made changes in the representation of programlogic: One subject improved the representation to make all theprogram logic visible. Another subject found and corrected amisrepresentation of generality in his representation.
Display of results withprogram logic
One subject reduced number of steps required to display theresults with program logic.
Secondary notation Two subjects made changes to the secondary notational devicesavailable: One subject was surprised to see that her original designomitted comments; she changed her design to allow textualcomments. Another subject added more devices for secondarynotation.
Abstraction gradient Two subjects added more powerful navigational devices in orderto reduce the number of steps required to navigate among thelevels of abstraction they supported.
Accessibility of relatedinformation
One subject added navigational aids to reduce the number ofsteps to access related information.
Use of screen real estate One subject reduced the number of on-screen windows to reducenon-semantic intersections.
REPRESENTATION DESIGN BENCHMARKS 595
observation mentioned earlier, that uncovering substantive problems is more likely tooccur early in the design stages than later in the lifecycle. Winograd’s observationpertained to users, and our experience was that it also pertained to the designersthemselves. From this we surmise that, even if it is possible to use the representationdesign benchmarks for non-design-oriented purposes (by a language’s designers or byothers), the amount of useful information obtainable from the benchmarks is still likelyto be greatest during the design stage.
8. Conclusions
VPL researchers are continually making advances in devising new ways to createprograms—from the kinds of programs that professional programmers create to thekinds of component interweaving and macro-building that end-users do. To providethese advances, many VPLs make innovative use of the capabilities of today’s graphicalworkstations, including graphics, color, and animation. But most of the design advanceshave been related to VPLs’ dynamic aspects, and as a result, the static representations ofmany VPLs have been their Achilles heel. Unfortunately, this deficiency can seriouslyhandicap VPLs’ suitability for certain tasks that arise in programming, such as workingwith and understanding a program written by someone else.
Representation design benchmarks are the first approach devised specifically to helpVPL designers address this deficiency. Extending the work on cognitive dimensions forprogramming systems, the benchmarks allow a designer to see how a navigable staticrepresentation design’s features impact the accessibility and usefulness of the informa-tion available about a program. Representation design benchmarks have been used bothby experienced VPL designers in designing navigable static representations for theinteractive VPLs Forms/3 at Oregon State University and ICBE at Hewlett-PackardLaboratories, and by student subjects in a small empirical study. Indications from theseuses are that the benchmarks make a measurable difference in helping VPL de signersdiscover problems with their designs.
The key characteristics of representation design benchmarks are that they providea concrete way for VPL designers to apply HCI principles on cognitive aspects ofprogramming, they are a set of measurement procedures rather than a set of guidelines,and they focus directly and exclusively on VPLs’ navigable static representations.Through these characteristics, they provide a practical means to measure a VPL’snavigable static representation in isolation from the other, more dynamic aspects of theVPL, helping the designer obtain a clear view of a proposed navigable static representa-tion’s strengths and weaknesses. In this way, representation design benchmarks can helpVPL designers combine the flexibility and responsiveness that can be supported bya VPL’s dynamic aspects, with the easy access to large amounts of program informationthat ensues from a well-designed navigable static representation.
Acknowledgments
We would like to thank Judith Hays and Eric Wilcox for assistance with this paper,and John Atwood, Baljinder Ghotra, Herkimer Gottfried, Shikha Gottfried, Dianne
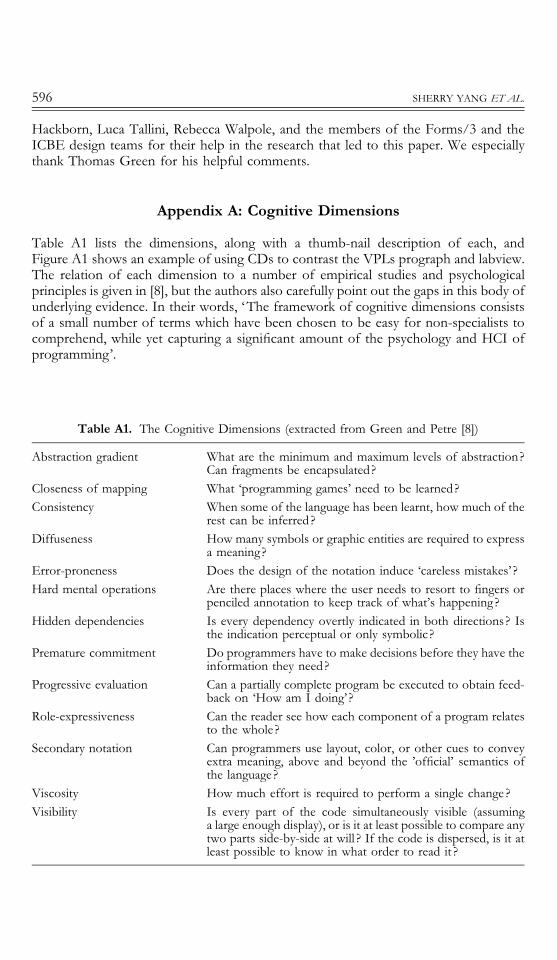
596 SHERRY YANG ET AL.
Hackborn, Luca Tallini, Rebecca Walpole, and the members of the Forms/3 and theICBE design teams for their help in the research that led to this paper. We especiallythank Thomas Green for his helpful comments.
Appendix A: Cognitive Dimensions
Table A1 lists the dimensions, along with a thumb-nail description of each, andFigure A1 shows an example of using CDs to contrast the VPLs prograph and labview.The relation of each dimension to a number of empirical studies and psychologicalprinciples is given in [8], but the authors also carefully point out the gaps in this body ofunderlying evidence. In their words, ‘The framework of cognitive dimensions consistsof a small number of terms which have been chosen to be easy for non-specialists tocomprehend, while yet capturing a significant amount of the psychology and HCI ofprogramming’.
Table A1. The Cognitive Dimensions (extracted from Green and Petre [8])
Abstraction gradient What are the minimum and maximum levels of abstraction?Can fragments be encapsulated?
Closeness of mapping What ‘programming games’ need to be learned?Consistency When some of the language has been learnt, how much of the
rest can be inferred?Diffuseness How many symbols or graphic entities are required to express
a meaning?Error-proneness Does the design of the notation induce ‘careless mistakes’ ?Hard mental operations Are there places where the user needs to resort to fingers or
penciled annotation to keep track of what’s happening?Hidden dependencies Is every dependency overtly indicated in both directions? Is
the indication perceptual or only symbolic?Premature commitment Do programmers have to make decisions before they have the
information they need?Progressive evaluation Can a partially complete program be executed to obtain feed-
back on ‘How am I doing’ ?Role-expressiveness Can the reader see how each component of a program relates
to the whole?Secondary notation Can programmers use layout, color, or other cues to convey
extra meaning, above and beyond the ’official’ semantics ofthe language?
Viscosity How much effort is required to perform a single change ?Visibility Is every part of the code simultaneously visible (assuming
a large enough display), or is it at least possible to compare anytwo parts side-by-side at will ? If the code is dispersed, is it atleast possible to know in what order to read it ?
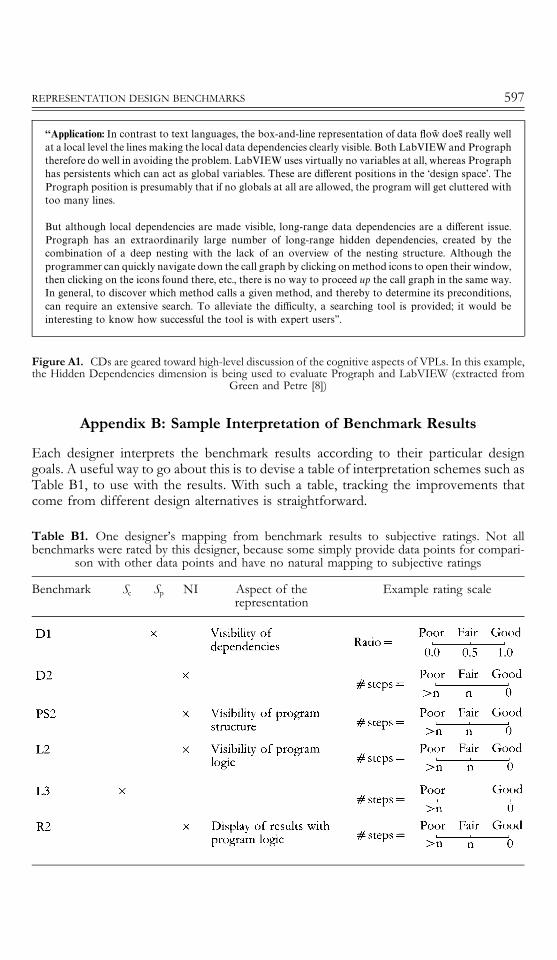
‘‘Application: In contrast to text languages, the box-and-line representation of data flow8 does7 really wellat a local level the lines making the local data dependencies clearly visible. Both LabVIEW and Prographtherefore do well in avoiding the problem. LabVIEW uses virtually no variables at all, whereas Prographhas persistents which can act as global variables. These are different positions in the ‘design space’. ThePrograph position is presumably that if no globals at all are allowed, the program will get cluttered withtoo many lines.
But although local dependencies are made visible, long-range data dependencies are a different issue.Prograph has an extraordinarily large number of long-range hidden dependencies, created by thecombination of a deep nesting with the lack of an overview of the nesting structure. Although theprogrammer can quickly navigate down the call graph by clicking on method icons to open their window,then clicking on the icons found there, etc., there is no way to proceed up the call graph in the same way.In general, to discover which method calls a given method, and thereby to determine its preconditions,can require an extensive search. To alleviate the difficulty, a searching tool is provided; it would beinteresting to know how successful the tool is with expert users’’.
Figure A1. CDs are geared toward high-level discussion of the cognitive aspects of VPLs. In this example,the Hidden Dependencies dimension is being used to evaluate Prograph and LabVIEW (extracted from
Green and Petre [8])
REPRESENTATION DESIGN BENCHMARKS 597
Appendix B: Sample Interpretation of Benchmark Results
Each designer interprets the benchmark results according to their particular designgoals. A useful way to go about this is to devise a table of interpretation schemes such asTable B1, to use with the results. With such a table, tracking the improvements thatcome from different design alternatives is straightforward.
Table B1. One designer’s mapping from benchmark results to subjective ratings. Not allbenchmarks were rated by this designer, because some simply provide data points for compari-
son with other data points and have no natural mapping to subjective ratings
Benchmark Sc Sp NI Aspect of therepresentation
Example rating scale
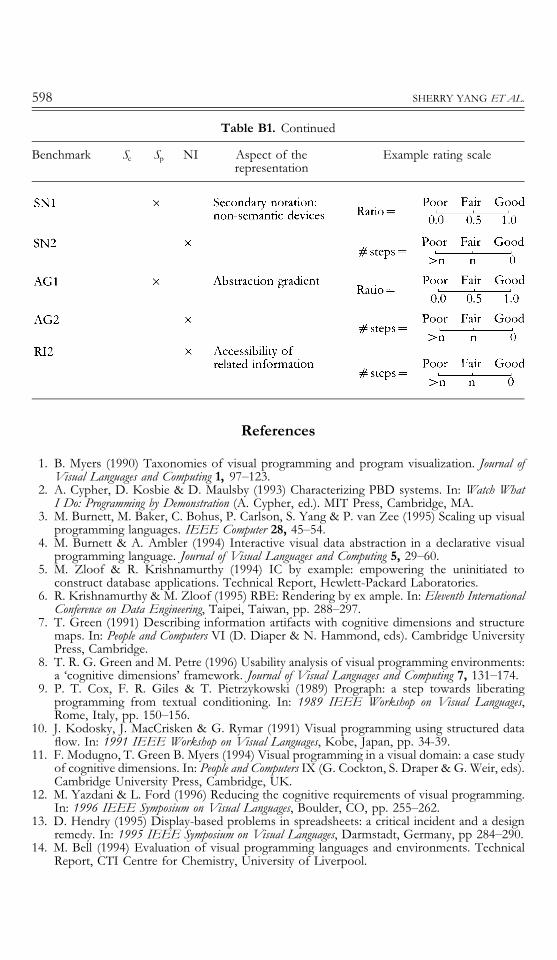
Table B1. Continued
Benchmark Sc Sp NI Aspect of therepresentation
Example rating scale
598 SHERRY YANG ET AL.
References
1. B. Myers (1990) Taxonomies of visual programming and program visualization. Journal ofVisual Languages and Computing 1, 97—123.
2. A. Cypher, D. Kosbie & D. Maulsby (1993) Characterizing PBD systems. In: Watch WhatI Do: Programming by Demonstration (A. Cypher, ed.). MIT Press, Cambridge, MA.
3. M. Burnett, M. Baker, C. Bohus, P. Carlson, S. Yang & P. van Zee (1995) Scaling up visualprogramming languages. IEEE Computer 28, 45—54.
4. M. Burnett & A. Ambler (1994) Interactive visual data abstraction in a declarative visualprogramming language. Journal of Visual Languages and Computing 5, 29—60.
5. M. Zloof & R. Krishnamurthy (1994) IC by example: empowering the uninitiated toconstruct database applications. Technical Report, Hewlett-Packard Laboratories.
6. R. Krishnamurthy & M. Zloof (1995) RBE: Rendering by ex ample. In: Eleventh InternationalConference on Data Engineering, Taipei, Taiwan, pp. 288—297.
7. T. Green (1991) Describing information artifacts with cognitive dimensions and structuremaps. In: People and Computers VI (D. Diaper & N. Hammond, eds). Cambridge UniversityPress, Cambridge.
8. T. R. G. Green and M. Petre (1996) Usability analysis of visual programming environments:a ‘cognitive dimensions’ framework. Journal of Visual Languages and Computing 7, 131—174.
9. P. T. Cox, F. R. Giles & T. Pietrzykowski (1989) Prograph: a step towards liberatingprogramming from textual conditioning. In: 1989 IEEE Workshop on Visual Languages,Rome, Italy, pp. 150—156.
10. J. Kodosky, J. MacCrisken & G. Rymar (1991) Visual programming using structured dataflow. In: 1991 IEEE Workshop on Visual Languages, Kobe, Japan, pp. 34-39.
11. F. Modugno, T. Green B. Myers (1994) Visual programming in a visual domain: a case studyof cognitive dimensions. In: People and Computers IX (G. Cockton, S. Draper & G. Weir, eds).Cambridge University Press, Cambridge, UK.
12. M. Yazdani & L. Ford (1996) Reducing the cognitive requirements of visual programming.In: 1996 IEEE Symposium on Visual Languages, Boulder, CO, pp. 255—262.
13. D. Hendry (1995) Display-based problems in spreadsheets: a critical incident and a designremedy. In: 1995 IEEE Symposium on Visual Languages, Darmstadt, Germany, pp 284—290.
14. M. Bell (1994) Evaluation of visual programming languages and environments. TechnicalReport, CTI Centre for Chemistry, University of Liverpool.
REPRESENTATION DESIGN BENCHMARKS 599
15. B. Bell, J. Rieman & C. Lewis (1991) Usability testing of a graphical programming system:things we missed in a programming walkthrough. In: ACM SIGCHI 1991. ACM Press, NewOrleans, pp. 7—12.
16. B. Bell, W. Citrin, C. Lewis, J. Rieman, R. Weaver, N. Wilde & B. Zorn (1994) Using theprogramming walkthrough to aid in programming language design. Software Practice andExperience 24, 1—25.
17. E. Glinert (1989) Towards a software metrics for visual programming. International Journal ofMan—Machine Studies 30, 425—445.
18. S. Card, T. Moran & A. Newell (1983) The Psychology of Human—Computer Interaction. Erlbaum,Hillsdale, NJ.
19. A. Siochi & D. Hix (1991) A study of computer-supported user interface evaluation usingmaximal repeating pattern analysis. In: ACM SIGCHI 1991, New Orleans, LA, pp. 301— 305.
20. J. Nielsen & R. Molich (1990) Heuristic evaluation of user interfaces. In: ACM SIGCHI1990, Seattle, Washington, pp. 249— 256.
21. J. Nielsen (1992) Finding usability problems through heuristic evaluation. In: ACM SIGCHI1992, pp. 373—380.
22. A. Sears (1993) Layout appropriateness: a metric for evaluating user interface widget layout.IEEE Transactions on Software Engineering 19, pp. 707—719.
23. T. Winograd (1995) From programming environments to environments for designing.Communications of the ACM 38, 65—74.
24. S. Yang & M. Burnett (1994) From concrete forms to generalized abstractions throughperspective-oriented analysis of logical relationships. In: 1994 IEEE Symposium on VisualLanguages, St. Louis, MO, pp. 6—14.
25. P. Brown & J. Gould (1987) An experimental study of people creating spreadsheets. ACMTransactions on Office Information Systems 5, 258—272.
26. M. Petre (1995) Why looking isn’t always seeing: readership skills and graphical program-ming. Communications of the ACM 38, 33—44.
27. H. C. Purchase, R. F. & Cohen M. James (1995) Validating Graph Drawing Aesthetics. In:Lecture Notes in Computer Science (F. Brandenburg, ed.). Springer, Berlin, 1995 .
28. B. Nardi (1993) A Small Matter of Programming: Perspectives on End User Computing. MIT Press,Cambridge, MA.
29. M. Zloof (1977) Query by example: a data base language. IBM Systems Journal 16, 324—343.30. M. Zloof (1981) QBE/OBE: a language for office and business automation. Computer 14,
13—22.31. R. Virzi (1992) Refining the test phase of usability evaluation: How many subjects is enough?
Human Factors 34, 457—468.32. T. Green, M. Petre & R. Bellamy (1991) Comprehensibility of visual and textual programs:
a test of superlativism against the ‘match—mismatch’ conjecture. In: Empirical Studies ofProgrammers: Fourth Workshop ( J. Koenemann-Belliveau, T. Moher & S. Robertson, eds).Ablex Publishing, Norwood, NJ.
33. T. Moher, D. Mak, B. Blumenthal & L. Leventhal (1993) Comparing the comprehensibilityof textual and graphical programs: the case of Petri Nets. In: Proc. Empirical Studies ofProgrammers: Fifth Workshop. Palo Alto, CA, Ablex Publishing, Norwood, NJ.
.
Related Documents