HA Publication PR67/14 App 1 Reported Road Casualties on the Strategic Network 2013 – Appendices September 2014 Issue 1

Welcome message from author
This document is posted to help you gain knowledge. Please leave a comment to let me know what you think about it! Share it to your friends and learn new things together.
Transcript

HA Publication PR67/14 App 1
Reported Road Casualties on the Strategic Network 2013 – Appendices
September 2014
Issue 1

HA Publication PR67/14 App 2
Document Control
Revision History
Version Date Description Author 1.0 7 October 2014 Final for comment URS 1.1 17 October 2014 Final URS 1.2 20 October 2014 Final with revisions URS 1.3 21 October 2014 Final with publication no. URS
Reviewer List
Name Role
Approvals
Name Signature Title Date of Issue
Version
The original format of this document is copyright to the Highways Agency.
Document Title Reported Road Casualties on the Strategic Network 2013 - Appendices Author Elizabeth Girvan / URS Owner Stuart Lovatt Distribution NPPD SAPT Document Status Final

HA Publication PR67/14 App 3
Appendix Table Index Appendix List of Tables ........................................................................................................................................................................................ 4
Appendix A: Glossary ........................................................................................................................................................................................ 14
Appendix B: Collision Statistics .......................................................................................................................................................................... 16
Appendix C: Casualty Statistics ......................................................................................................................................................................... 24
Appendix D: Casualty Rate Statistics ................................................................................................................................................................. 48
Appendix E: Vehicle Statistics ........................................................................................................................................................................... 54
Appendix F: Contributory Factor Statistics ......................................................................................................................................................... 59
Appendix G: Comparison to Great Britain Statistics ........................................................................................................................................... 80
Appendix H: Fatalities ........................................................................................................................................................................................ 82
Appendix I: Seriously Injured Casualties .......................................................................................................................................................... 90
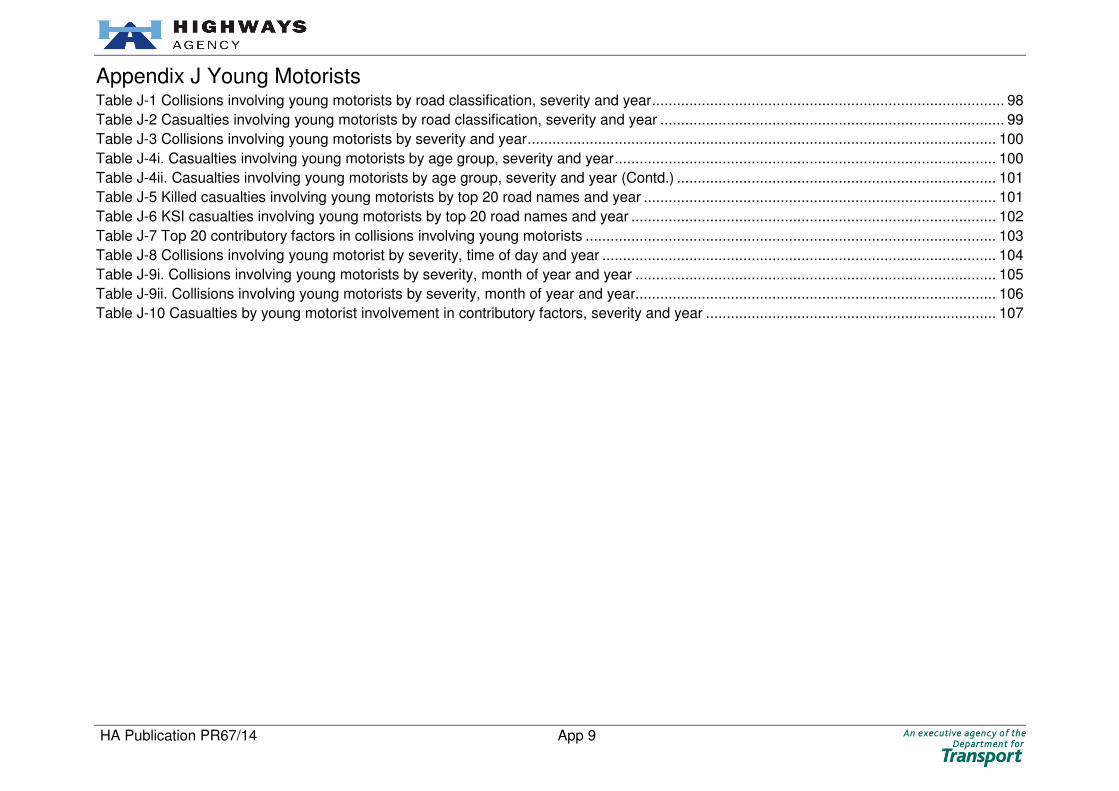
Appendix J: Young Motorists ............................................................................................................................................................................. 98
Appendix K: Smart Motorways ......................................................................................................................................................................... 108
Appendix L: Lighting ........................................................................................................................................................................................ 134
Appendix M: Weather ....................................................................................................................................................................................... 139
Appendix N: Roadworks .................................................................................................................................................................................. 145
Appendix O: Object Hit on and Off Carriageway .............................................................................................................................................. 154
Appendix P: Junction Type .............................................................................................................................................................................. 162
Appendix Q: Tyres ........................................................................................................................................................................................... 169
Appendix R: Goods Vehicles: LGVs (Other GV) and HGVs ............................................................................................................................. 173
Appendix S: Motorcycles ................................................................................................................................................................................. 180
Appendix T: Hard Shoulders and laybys .......................................................................................................................................................... 184

HA Publication PR67/14 App 4
Appendix List of Tables
Appendix A Glossary Table A-1 Glossary of terms ............................................................................................................................................................................... 14
Appendix B Collision Statistics Table B-1 Collisions by road classification, severity and year ............................................................................................................................. 16
Table B-2 Collisions by month and year ............................................................................................................................................................. 17
Table B-3 Fatal and serious collisions by month and year .................................................................................................................................. 17
Table B-4 Collisions by time period, day and year .............................................................................................................................................. 18
Table B-5 Fatal and serious collisions by time period, day and year .................................................................................................................. 19
Table B-6 Collisions by road surface conditions, weather conditions and year ................................................................................................... 20
Table B-7 Collisions involving single vehicles by severity and year .................................................................................................................... 20
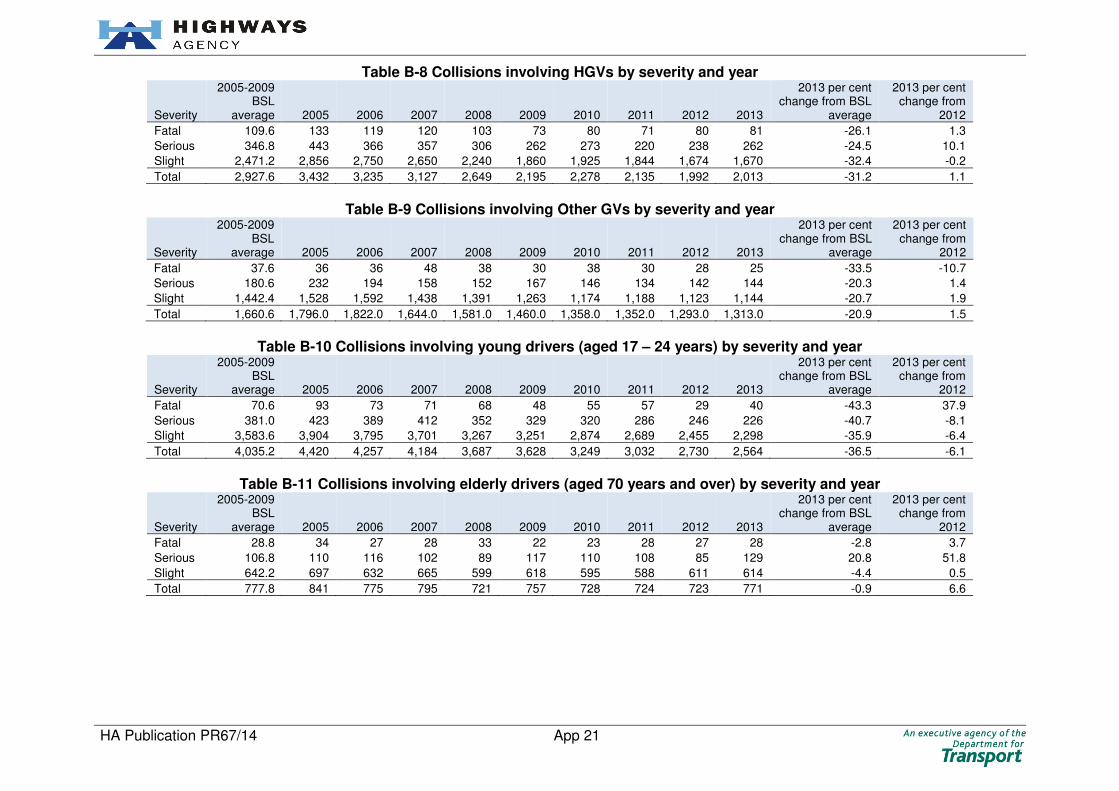
Table B-8 Collisions involving HGVs by severity and year ................................................................................................................................. 21
Table B-9 Collisions involving Other GVs by severity and year .......................................................................................................................... 21
Table B-10 Collisions involving young drivers (aged 17 – 24 years) by severity and year .................................................................................. 21
Table B-11 Collisions involving elderly drivers (aged 70 years and over) by severity and year ........................................................................... 21
Table B-12 Collisions involving towed caravans by severity and year ................................................................................................................ 22
Table B-13 Collisions by top 20 road names and year ....................................................................................................................................... 22
Table B-14 Collisions by collision type and year ................................................................................................................................................. 23
HA Publication PR67/14 App 5
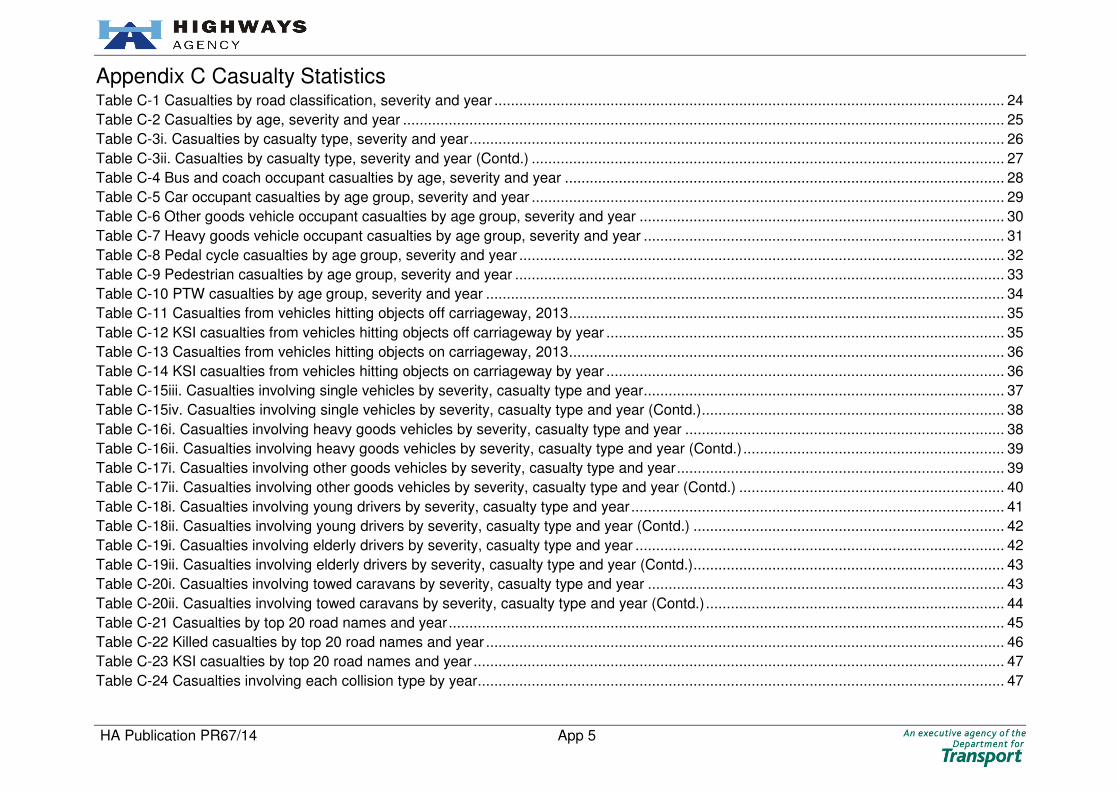
Appendix C Casualty Statistics Table C-1 Casualties by road classification, severity and year ........................................................................................................................... 24
Table C-2 Casualties by age, severity and year ................................................................................................................................................. 25
Table C-3i. Casualties by casualty type, severity and year ................................................................................................................................. 26
Table C-3ii. Casualties by casualty type, severity and year (Contd.) .................................................................................................................. 27
Table C-4 Bus and coach occupant casualties by age, severity and year .......................................................................................................... 28
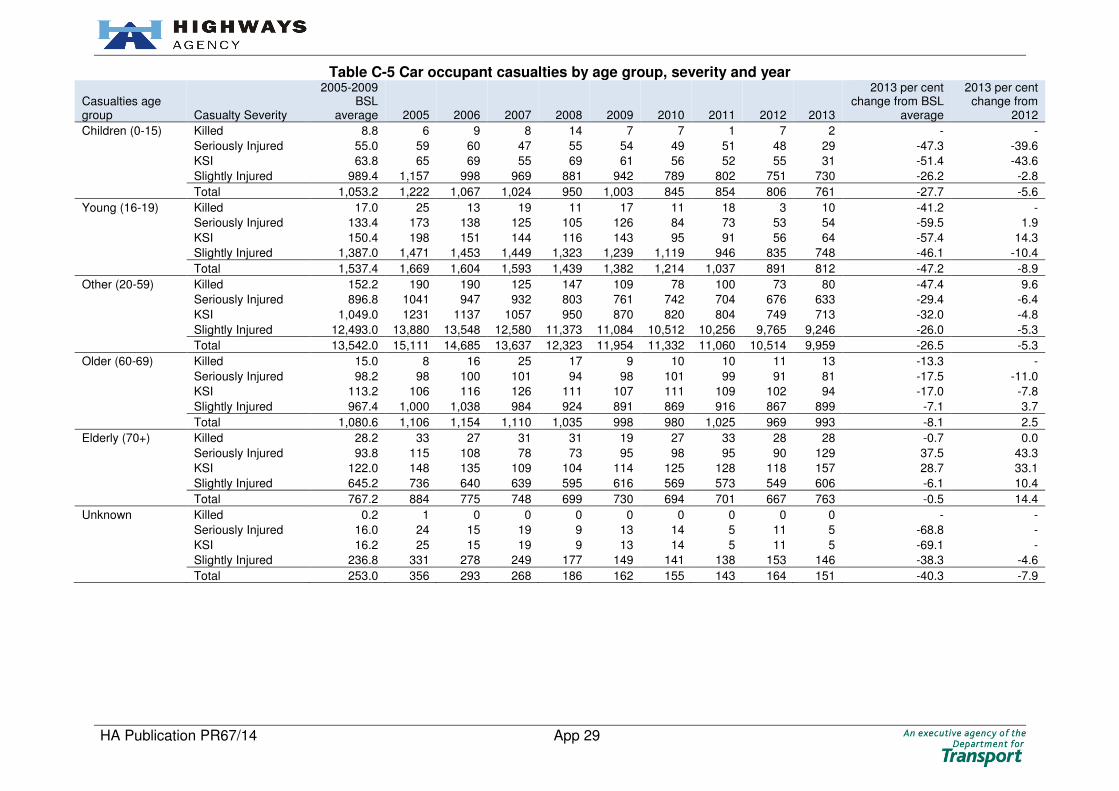
Table C-5 Car occupant casualties by age group, severity and year .................................................................................................................. 29
Table C-6 Other goods vehicle occupant casualties by age group, severity and year ........................................................................................ 30
Table C-7 Heavy goods vehicle occupant casualties by age group, severity and year ....................................................................................... 31
Table C-8 Pedal cycle casualties by age group, severity and year ..................................................................................................................... 32
Table C-9 Pedestrian casualties by age group, severity and year ...................................................................................................................... 33
Table C-10 PTW casualties by age group, severity and year ............................................................................................................................. 34
Table C-11 Casualties from vehicles hitting objects off carriageway, 2013 ......................................................................................................... 35
Table C-12 KSI casualties from vehicles hitting objects off carriageway by year ................................................................................................ 35
Table C-13 Casualties from vehicles hitting objects on carriageway, 2013 ......................................................................................................... 36
Table C-14 KSI casualties from vehicles hitting objects on carriageway by year ................................................................................................ 36
Table C-15iii. Casualties involving single vehicles by severity, casualty type and year ....................................................................................... 37
Table C-15iv. Casualties involving single vehicles by severity, casualty type and year (Contd.) ......................................................................... 38
Table C-16i. Casualties involving heavy goods vehicles by severity, casualty type and year ............................................................................. 38
Table C-16ii. Casualties involving heavy goods vehicles by severity, casualty type and year (Contd.) ............................................................... 39
Table C-17i. Casualties involving other goods vehicles by severity, casualty type and year ............................................................................... 39
Table C-17ii. Casualties involving other goods vehicles by severity, casualty type and year (Contd.) ................................................................ 40
Table C-18i. Casualties involving young drivers by severity, casualty type and year .......................................................................................... 41
Table C-18ii. Casualties involving young drivers by severity, casualty type and year (Contd.) ........................................................................... 42
Table C-19i. Casualties involving elderly drivers by severity, casualty type and year ......................................................................................... 42
Table C-19ii. Casualties involving elderly drivers by severity, casualty type and year (Contd.) ........................................................................... 43
Table C-20i. Casualties involving towed caravans by severity, casualty type and year ...................................................................................... 43
Table C-20ii. Casualties involving towed caravans by severity, casualty type and year (Contd.) ........................................................................ 44
Table C-21 Casualties by top 20 road names and year ...................................................................................................................................... 45
Table C-22 Killed casualties by top 20 road names and year ............................................................................................................................. 46
Table C-23 KSI casualties by top 20 road names and year ................................................................................................................................ 47
Table C-24 Casualties involving each collision type by year ............................................................................................................................... 47

HA Publication PR67/14 App 6
Appendix D Casualty Rate Statistics Table D-1 Total traffic (100 MVM) by top 40 road names and year .................................................................................................................... 48
Table D-2 Total casualties per 100 MVM by top 40 trafficked roads and year .................................................................................................... 49
Table D-3 Total casualties per 100 MVM by top 20 motorways and year ........................................................................................................... 50
Table D-4 Total casualties per 100 MVM by top 20 A-roads and year ................................................................................................................ 50
Table D-5 Casualty per 100 MVM by road classification, severity and year ........................................................................................................ 51
Table D-6 KSI casualties per 100 MVM by top 40 trafficked road names and year ............................................................................................ 52
Table D-7 KSI casualties per 100 MVM by top 20 motorways and year ............................................................................................................. 53
Table D-8 KSI casualties per 100 MVM by top 20 A-Roads and year ................................................................................................................. 53
Appendix E Vehicle Statistics Table E-1i. Number of vehicles by vehicle type, collision severity and year ........................................................................................................ 54
Table E-1ii. Number of vehicles by vehicle type, collision severity and year (Contd.) ......................................................................................... 55
Table E-2i. KSI casualties by vehicle interaction and year ................................................................................................................................. 56
Table E-2ii. KSI casualties by vehicle interaction and year (Contd.) ................................................................................................................... 57
Table E-3 Casualties by vehicle interaction and severity in 2013 ....................................................................................................................... 58

HA Publication PR67/14 App 7
Appendix F Contributory Factor Statistics Table F-1i. Contributory factor group classification and codes ........................................................................................................................... 59
Table F-1ii. Contributory factor group classification and codes (Contd.) ............................................................................................................. 60
Table F-2i. Contributory factors by severity 2013 [1-20] ..................................................................................................................................... 61
Table F-2ii. Contributory factors by severity 2013 [21-50] (Contd.) ..................................................................................................................... 62
Table F-2iii. Contributory factors by severity 2013 [51-78] (Contd.) .................................................................................................................... 63
Table F-3i. Top 20 contributory factors by severity and year [1-8] ...................................................................................................................... 64
Table F-3ii. Top 20 contributory factors by severity and year [9-16] ................................................................................................................... 65
Table F-3iii. Top 20 contributory factors by severity and year [17-20] ................................................................................................................. 66
Table F-4 Casualties involving drivers or riders impaired by alcohol and/or drugs by road classification, severity and year ............................... 67
Table F-5 Collision involving drivers or riders impaired by alcohol and/or drugs by road classification, severity and year .................................. 68
Table F-6 Collisions involving drivers or riders impaired by alcohol and/or drugs by top 20 road names and year ............................................. 69
Table F-7 Casualties involving drivers or riders fatigued by road classification, severity and year ...................................................................... 70
Table F-8 Collisions involving drivers or riders fatigued by road classification, severity and year ....................................................................... 71
Table F-9 Collisions involving drivers or riders fatigued by top 20 road names and year .................................................................................... 72
Table F-10 Casualties involving drivers or riders exceeding the speed limit by road classification, severity and year......................................... 73
Table F-11 Collisions involving drivers or riders exceeding the speed limit by road classification, severity and year .......................................... 74
Table F-12 Collisions involving drivers or riders exceeding the speed limit by top 20 road names and year ....................................................... 75
Table F-13 Casualties involving drivers or riders distracted by road classification, severity and year ................................................................. 76
Table F-14 Collisions involving drivers or riders distracted by road classification, severity and year .................................................................. 77
Table F-15 Collisions involving distracted drivers or riders by top 20 road names and year ............................................................................... 78
Table F-16 Contributory factor recording statistics by year ................................................................................................................................. 79
Appendix G Comparison to Great Britain Statistics Table G-1 Comparison to Great Britain statistics ................................................................................................................................................ 80

HA Publication PR67/14 App 8
Appendix H Fatalities Table H-1 Fatalities by top 20 road names and year .......................................................................................................................................... 82
Table H-2 Fatalities by road classification and year ........................................................................................................................................... 83
Table H-3 Top 20 contributory factors involving fatal collisions by year .............................................................................................................. 83
Table H-4 Fatalities by objects hit on carriageway and year ............................................................................................................................... 84
Table H-5 Fatalities by objects hit off carriageway and year ............................................................................................................................... 84
Table H-6 Fatalities by road condition, skidding and year .................................................................................................................................. 85
Table H-7 Fatalities by light conditions, road classification and year .................................................................................................................. 86
Table H-8 Fatalities by junction detail and year .................................................................................................................................................. 86
Table H-9 Fatalities involving hard shoulders or laybys by vehicle location and year ......................................................................................... 86
Table H-10 Fatalities by driver age group involved and year .............................................................................................................................. 87
Table H-11 Fatalities by vehicle type involved and year ..................................................................................................................................... 87
Table H-12 Fatalities by journey purpose and year ............................................................................................................................................ 88
Table H-13 Fatalities by time of day and year .................................................................................................................................................... 89
Table H-14 Fatalities by day of week and year ................................................................................................................................................... 89
Table H-15 Fatalities distributed by month of year and year ............................................................................................................................... 89
Appendix I Seriously Injured Casualties Table I-1 Seriously injured casualties by road name and year ............................................................................................................................ 90
Table I-2 Seriously injured casualties by road classification and year ................................................................................................................ 91
Table I-3 Serious collisions by contributory factors and year .............................................................................................................................. 91
Table I-4 Seriously injured casualties by objects hit on carriageway and year .................................................................................................... 92
Table I-5 Seriously injured casualties by objects hit off carriageway and year .................................................................................................... 92
Table I-6 Seriously injured casualties by road condition, skidding and year ....................................................................................................... 93
Table I-7 Seriously injured casualties by light conditions, road classification and year ....................................................................................... 94
Table I-8 Seriously injured casualties by junction detail and year ....................................................................................................................... 94
Table I-9 Seriously injured casualties involving hard shoulders or laybys by vehicle location and year .............................................................. 95
Table I-10 Seriously injured casualties by driver age group involved and year ................................................................................................... 95
Table I-11 Seriously injured casualties by vehicle type involved and year .......................................................................................................... 95
Table I-12 Seriously injured casualties by journey purpose and year ................................................................................................................. 96
Table I-13 Seriously injured casualties distributed by time of day and year ........................................................................................................ 97
Table I-14 Seriously injured casualties by day of week and year ........................................................................................................................ 97
Table I-15 Seriously injured casualties distributed by month of year and year .................................................................................................... 97
HA Publication PR67/14 App 9
Appendix J Young Motorists Table J-1 Collisions involving young motorists by road classification, severity and year ..................................................................................... 98
Table J-2 Casualties involving young motorists by road classification, severity and year ................................................................................... 99
Table J-3 Collisions involving young motorists by severity and year ................................................................................................................. 100
Table J-4i. Casualties involving young motorists by age group, severity and year ............................................................................................ 100
Table J-4ii. Casualties involving young motorists by age group, severity and year (Contd.) ............................................................................. 101
Table J-5 Killed casualties involving young motorists by top 20 road names and year ..................................................................................... 101
Table J-6 KSI casualties involving young motorists by top 20 road names and year ........................................................................................ 102
Table J-7 Top 20 contributory factors in collisions involving young motorists ................................................................................................... 103
Table J-8 Collisions involving young motorist by severity, time of day and year ............................................................................................... 104
Table J-9i. Collisions involving young motorists by severity, month of year and year ....................................................................................... 105
Table J-9ii. Collisions involving young motorists by severity, month of year and year....................................................................................... 106
Table J-10 Casualties by young motorist involvement in contributory factors, severity and year ...................................................................... 107

HA Publication PR67/14 App 10
Appendix K Smart Motorways Table K-1 Scheme data for M1 J10-13 ............................................................................................................................................................. 109
Table K-2 Scheme data for M1 J32-35A .......................................................................................................................................................... 110
Table K-3 Scheme data for M1 J28-31 ............................................................................................................................................................. 111
Table K-4 Scheme data for M1 J39-42 ............................................................................................................................................................. 112
Table K-5 Scheme data for M1 J6a-10 ............................................................................................................................................................. 113
Table K-6 Scheme data for M25 J5-7 ............................................................................................................................................................... 114
Table K-7 Scheme data for M25 J23-27 ........................................................................................................................................................... 115
Table K-8 Scheme data for M25 J16-23 ........................................................................................................................................................... 116
Table K-9 Scheme data for M25 J27-30 ........................................................................................................................................................... 117
Table K-10 Scheme data for M3 J2-4a ............................................................................................................................................................. 118
Table K-11 Scheme data for M4 J19-20 and M5 J15-17 .................................................................................................................................. 119
Table K-12 Scheme data for M42 J3a-7 ........................................................................................................................................................... 120
Table K-13 Scheme data for M42 J7-9 ............................................................................................................................................................. 121
Table K-14 Scheme data for M42 J3a – M40 J16 ................................................................................................................................................ 122
Table K-15 Scheme data for M5 J4a-6 ............................................................................................................................................................. 123
Table K-16 Scheme data for M6 J5-8 ............................................................................................................................................................... 124
Table K-17 Scheme data for M6 J4-5 ............................................................................................................................................................... 125
Table K-18 Scheme data for M6 J8-10a ........................................................................................................................................................... 126
Table K-19 Scheme data for M6 J10a-13 ......................................................................................................................................................... 127
Table K-20 Scheme data for M6 J16-19 ........................................................................................................................................................... 128
Table K-21 Scheme data for M6 J13-15 ........................................................................................................................................................... 129
Table K-22 Scheme data for M60 J8-18 ........................................................................................................................................................... 130
Table K-23 Scheme data for M62 J25-30 ......................................................................................................................................................... 131
Table K-24 Scheme data for M62 J18-21 ......................................................................................................................................................... 132
Table K-25 Scheme data for M62 J10-12 ......................................................................................................................................................... 133
Appendix L Lighting Table L-1 Collisions by Lighting condition, road classification and year ............................................................................................................ 134
Table L-2 Casualties by lighting condition, road type and year ......................................................................................................................... 135
Table L-3 Casualties by lighting condition, severity and year ........................................................................................................................... 136
Table L-4 Top 20 contributory factors in collisions during darkness by year ..................................................................................................... 137
Table L-5 Casualties during darkness top 20 road names and year ................................................................................................................. 138

HA Publication PR67/14 App 11
Appendix M Weather Table M-1 Collisions by weather group, road classification and year ................................................................................................................ 139
Table M-2 Casualties by weather group, road classification and year .............................................................................................................. 140
Table M-3 Casualties by weather group, severity and year .............................................................................................................................. 141
Table M-4 Casualties by weather group, severity and vehicle type, 2013 ......................................................................................................... 142
Table M-5 Collisions by weather group and skidding category ......................................................................................................................... 143
Table M-6 Collisions with weather contributory factors ..................................................................................................................................... 144
Table M-7 Casualties with weather contributory factors by severity and year ................................................................................................... 144
Appendix N Roadworks Table N-1 Casualties during roadworks by road classification, severity and year ............................................................................................. 145
Table N-2 Casualties during roadworks by junction detail, severity and year ................................................................................................... 146
Table N-3 Casualties during roadworks by time of day, severity and year ........................................................................................................ 147
Table N-4i. Casualties during roadworks by months of the year, severity and year .......................................................................................... 148
Table N-4ii. Casualties during roadworks by months of the year, severity and year ......................................................................................... 149
Table N-5 Casualties during roadworks by vehicle type, severity and year ...................................................................................................... 150
Table N-6i. Casualties during roadworks by driver age involved, severity and year .......................................................................................... 151
Table N-6ii. Casualties during roadworks by driver age, severity and year ....................................................................................................... 152
Table N-7 Casualties during roadworks by casualty class, severity and year ................................................................................................... 152
Table N-8 Top 20 contributory factors for collisions involving roadworks by year ............................................................................................. 153
Table N-9 Severity per cent for collision at roadworks and not at roadworks by year ....................................................................................... 153

HA Publication PR67/14 App 12
Appendix O Object Hit on and Off Carriageway Table O-1i. Casualties by objects hit on carriageway, severity and year .......................................................................................................... 154
Table O-1ii. Casualties by objects hit on carriageway, severity and year (Contd.) ............................................................................................ 155
Table O-2 Casualties by objects hit on carriageway by road classification and year ........................................................................................ 156
Table O-3i.Casualties by objects hit off carriageway by severity and year ........................................................................................................ 157
Table O-3ii.Casualties by objects hit off carriageway by severity and year ....................................................................................................... 158
Table O-4 Casualties by objects hit off carriageway by road type and year ...................................................................................................... 159
Table O-5 Top 20 contributory factors for collisions involving objects hit on carriageway by year ..................................................................... 160
Table O-6 Top 20 contributory factors for collisions involving objects hit off carriageway by year ..................................................................... 161
Appendix P Junction Type Table P-1i. Collisions by junction detail, junction control and year .................................................................................................................... 162
Table P-1ii. Collisions by junction detail, junction control and year (Contd.) ..................................................................................................... 163
Table P-2 Collisions at junctions by top 20 road names and junction detail, 2013 ............................................................................................ 163
Table P-3 Casualties by junction detail, severity and year ................................................................................................................................ 164
Table P-4 Casualties at junctions by vehicle type and year .............................................................................................................................. 165
Table P-5i. Casualties at junctions by driver age, severity and year ................................................................................................................. 165
Table P-5ii. Casualties at junctions by driver age, severity and year (Contd.) .................................................................................................. 166
Table P-6 Top 20 contributory factors for collisions at junctions by year ........................................................................................................... 167
Table P-7 Top 20 contributory factors for collision not at Junctions by year ..................................................................................................... 168
Appendix Q Tyres Table Q-1 Casualties involving illegal defective or under inflated tyres by severity and year ............................................................................ 169
Table Q-2 Collisions involving illegal, defective or under inflated tyres by top 20 road names and year ........................................................... 169
Table Q-3 Collisions involving illegal, defective or under inflated tyres by road surface conditions, weather conditions and year ..................... 170
Table Q-4 Casualties involving illegal, defective or under inflated tyres by casualty type, severity and year .................................................... 171
Table Q-5 Top 20 contributory factors involving illegal, defective or under inflated tyres by year...................................................................... 172

HA Publication PR67/14 App 13
Appendix R Goods Vehicles: LGVs (Other GV) and HGVs Table R-1 Casualties involving LGVs (other GV) and HGVs by severity and year ............................................................................................ 173
Table R-2 Casualties involving LGV (other GV) by top 20 road names and year .............................................................................................. 174
Table R-3 Casualties involving HGVs by top 20 road names and year ............................................................................................................. 175
Table R-4 Casualties involving HGVs by casualty age, severity and year ........................................................................................................ 176
Table R-5 Casualties involving LGVs (other GV) by casualty age, severity and year ....................................................................................... 177
Table R-6 Top 20 contributory factors for casualties involving LGV (other GV) by year .................................................................................... 178
Table R-7 Top 20 contributory factors for casualties involving HGVs by year ................................................................................................... 179
Appendix S Motorcycles Table S-1 Casualties involving motorcycles by severity and year ..................................................................................................................... 180
Table S-2 Casualties involving motorcycles by top 20 road names and year ................................................................................................... 180
Table S-3 Casualties involving motorcycles by casualty age, severity and year ............................................................................................... 181
Table S-4 Casualties involving motorcycles by road classification, severity and year ....................................................................................... 182
Table S-5 Top 20 contributory factors for casualties involving motorcycles by year ......................................................................................... 183
Appendix T Hard Shoulders and laybys Table T-1 Casualties involving hard shoulders or laybys by severity and year ................................................................................................. 184
Table T-2 Casualties involving hard shoulders or laybys by top 20 road names and year ................................................................................ 185
Table T-3 Casualties involving hard shoulders or laybys by road classification, severity and year ................................................................... 186
Table T-4 Casualties involving hard shoulders or laybys by casualty age, severity and year ............................................................................ 187
Table T-5 Top 20 contributory factors for casualties involving hard shoulders or laybys by year ...................................................................... 188

HA Publication PR67/14 App 14
Appendix A: Glossary Table A-1 Glossary of terms
Adults Person aged 16 years and over (except where otherwise stated)
Baseline average Average of values between the year 2005 and 2009. (2005–2009 baseline average)
Built-up roads Roads with speed limits of 40mph or less
Buses and coaches Vehicle equipped to carry 17 or more passengers regardless of use
Cars Includes cars, private hire cars and private taxis
Collisions See “Personal injury collisions”
Dual carriageway Road where two opposing directions of traffic are separated by a physical barrier. For context of this report only; roundabouts, slip roads and one way streets are classed as dual carriageway.
Fatal collision A collision where at least one person was killed.
Goods vehicles (GV) Includes all weight categories of goods vehicles unless stated otherwise
Head on collision A collision involving at least two vehicles moving in opposite directions at point of impact, where both vehicles first point of impact was recorded as “Front”. For example, the front of vehicle 1 moving North to South collides with the front of vehicle 2 moving South to North. Vehicles that hit an object on or off the carriageway, were parked, or where the vehicle movement was unknown are not included.
HGV Heavy goods vehicle; classed as goods vehicle with known weight over 3.5tonnes respectively.
Junction collision A collision recorded as occurring within 20m of a junction.
Killed Human casualties who sustained injuries which caused death less than 30 days after the collision. Confirmed suicides are excluded. Also referred to as fatalities.
KSI Killed or seriously injured
LGV (Other GV) Light weight goods vehicle; classed as goods vehicle with known weight equal to or less than 3.5tonnes and those GVs without a classification within STATS19 data.
Motorcycle Includes all engine capacities of powered two wheelers or motorcycles.
Motorways Motorway and A(M) roads.
Non built-up roads Roads with speed limits of 50mph or more.
Other vehicles Other vehicles include ambulances, fire engines, trams, refuse vehicles, road rollers, agricultural vehicles, excavators, mobile cranes, tower wagons, army tanks, pedestrian-controlled vehicles with a motor. Other non-motor vehicles include those drawn by animals, ridden horses, invalid carriages, etc.
Overtake collision A collision involving at least one vehicle recorded as overtaking another vehicle.
Pedal cyclist collision A collision involving at least one pedal cyclist casualty.
Pedestrian collision A collision involving at least one pedestrian casualty.
Personal injury collisions Collisions resulting in at least one casualty of any severity.
Serious collision Collision involving at least one casualty who is seriously injured with no casualties killed.
Seriously injured An injury for which a person is detained in hospital as an “in-patient”, or any of the following injuries whether or not they are detained in hospital: fractures, concussion, internal injuries, crushing, burns, severe cuts and lacerations, severe general shock requiring medical treatment and injuries causing death 30 or more days after the collision.
Severity Of a collision; the severity of the most injured casualty (fatal, serious or slight). Of a casualty; killed, seriously injured or slightly injured.

HA Publication PR67/14 App 15
Glossary continued
Shunt collision A collision involving at least two vehicles moving in the same directions at point of impact, where one vehicles first point of impact was recorded as “Front” and the other vehicles as “Back”. For example, the front of vehicle 1 moving North to South collides with the back of vehicle 2 moving North to South. Vehicles that hit an object on or off the carriageway, were parked, or where the vehicle movement was unknown are not included.
Single vehicle collision A collision involving a single vehicle (includes collisions involving pedestrians).
Single vehicle run off collision
A collision involving a single vehicle recorded as leaving the carriageway (excludes collisions involving pedestrians).
Slight collision Collision involving at least one casualty who is slightly injured with no casualties killed or seriously injured.
Slightly injured An injury of a minor character such as a sprain (including neck whiplash injury), bruise or cut which are not judged to be severe, or slight shock requiring roadside attention. This definition includes injuries not requiring medical treatment.
Traffic The number of vehicle-miles of traffic, measured in 100 million vehicle miles (100 MVM). Also referred to as hundred million vehicle miles (HMVM).
Young motorist Drivers of vehicles aged between 17 and 24 years old whose vehicle is not powered two wheelers or pedal cycle.
Young rider Rider of vehicles aged between 16 and 19 years old whose vehicle is a powered two wheelers.

HA Publication PR67/14 App 16
Appendix B: Collision Statistics Table B-1 to Table B-14 Contain breakdowns of collisions referenced to location, time, road conditions and vehicle type.
Table B-1 Collisions by road classification, severity and year
Road Classification Collision Severity
2005-2009 BSL
average 2005 2006 2007 2008 2009 2010 2011 2012 2013
2013 per cent change from BSL
average
2013 per cent change from
2012
Motorway - Fatal 131.2 156 146 132 123 99 105 78 70 85 -35.2 21.4
Serious 684.2 731 710 735 642 603 593 537 483 487 -28.8 0.8
Fatal + Serious 815.4 887 856 867 765 702 698 615 553 572 -29.9 3.4
Slight 6,135.8 6,850 6,657 6,261 5,697 5,214 5,128 4,538 4,445 4,224 -31.2 -5.0
Total 6,951.2 7,737 7,513 7,128 6,462 5,916 5,826 5,153 4,998 4,796 -31.0 -4.0
A-road Dual Carriageway
Built-up Fatal 5.4 8 5 6 3 5 1 4 4 2 - -
Serious 50.8 54 42 58 50 50 45 53 50 41 -19.3 -18.0
Fatal + Serious 56.2 62 47 64 53 55 46 57 54 43 -23.5 -20.4
Slight 612.2 659 612 637 594 559 443 617 537 493 -19.5 -8.2
Total 668.4 721 659 701 647 614 489 674 591 536 -19.8 -9.3
Non Built-up Fatal 114.4 125 125 124 124 74 86 92 77 80 -30.1 3.9
Serious 543.4 658 579 527 490 463 490 467 458 422 -22.3 -7.9
Fatal + Serious 657.8 783 704 651 614 537 576 559 535 502 -23.7 -6.2
Slight 3,753.8 4,092 4,010 3,865 3,468 3,334 3,083 3,176 2,998 2,934 -21.8 -2.1
Total 4,411.6 4,875 4,714 4,516 4,082 3,871 3,659 3,735 3,533 3,436 -22.1 -2.7
A-road Single Carriageway
Built-up Fatal 5.2 4 4 6 9 3 5 7 7 9 - -
Serious 57.2 66 46 66 42 66 52 57 50 44 -23.1 -12.0
Fatal + Serious 62.4 70 50 72 51 69 57 64 57 53 -15.1 -7.0
Slight 397.4 395 400 397 402 393 328 309 306 314 -21.0 2.6
Total 459.8 465 450 469 453 462 385 373 363 367 -20.2 1.1
Non Built-up Fatal 57.8 71 64 58 50 46 34 45 43 50 -13.5 16.3
Serious 235.0 266 251 242 199 217 165 164 187 214 -8.9 14.4
Fatal + Serious 292.8 337 315 300 249 263 199 209 230 264 -9.8 14.8
Slight 1,087.4 1,218 1,184 1,151 934 950 856 803 805 741 -31.9 -8.0
Total 1,380.2 1,555 1,499 1,451 1,183 1,213 1,055 1,012 1,035 1,005 -27.2 -2.9
Other Total 0.0 0 0 0 0 0 0 0 0 5 - -
Notes: (a) Where the road classification is denoted as “Other”, these collisions were located on sections of the reference network that have been downgraded in class (to B or below) since 2010

HA Publication PR67/14 App 17
Table B-2 Collisions by month and year
Quarter Month
2005-2009 BSL
average 2005 2006 2007 2008 2009 2010 2011 2012 2013
2013 per cent change from BSL
average
2013 per cent change from
2012
Q1 Jan 1,117.6 1,205 1,053 1,173 1,116 1,041 771 894 785 709 -36.6 -9.7
Feb 1,033.0 1,133 1,158 1,025 1,072 777 882 867 772 706 -31.7 -8.5
Mar 1,080.6 1,151 1,118 1,101 1,133 900 838 842 810 775 -28.3 -4.3
Q2 Apr 1,055.8 1,121 1,074 1,095 1,076 913 946 875 837 690 -34.6 -17.6
May 1,103.6 1,230 1,176 1,147 1,007 958 941 823 822 827 -25.1 0.6
Jun 1,101.2 1,237 1,221 1,129 978 941 935 929 818 828 -24.8 1.2
Q3 Jul 1,257.8 1,336 1,404 1,340 1,128 1,081 1,015 970 981 987 -21.5 0.6
Aug 1,227.4 1,416 1,254 1,335 1,051 1,081 1,007 947 953 918 -25.2 -3.7
Sep 1,164.4 1,298 1,362 1,171 1,005 986 988 941 910 813 -30.2 -10.7
Q4 Oct 1,231.0 1,419 1,347 1,249 1,109 1,031 1,046 943 909 983 -20.1 8.1
Nov 1,284.6 1,432 1,350 1,280 1,150 1,211 1,111 973 1,006 993 -22.7 -1.3
Dec 1,214.2 1,375 1,318 1,220 1,002 1,156 934 943 917 916 -24.6 -0.1
Table B-3 Fatal and serious collisions by month and year
Quarter Month
2005-2009 BSL
average 2005 2006 2007 2008 2009 2010 2011 2012 2013
2013 per cent change from BSL
average
2013 per cent change from
2012
Q1 Jan 145.4 169 126 165 121 146 91 118 103 85 -41.5 -17.5
Feb 135.2 176 138 121 143 98 104 103 112 87 -35.7 -22.3
Mar 144.0 172 142 144 153 109 107 108 106 97 -32.6 -8.5
Q2 Apr 155.8 155 162 178 153 131 142 115 120 99 -36.5 -17.5
May 158.4 173 170 144 132 173 129 123 126 126 -20.5 0.0
Jun 161.4 186 160 156 144 161 125 123 109 113 -30.0 3.7
Q3 Jul 178.4 200 208 188 173 123 162 147 126 155 -13.1 23.0
Aug 177.0 198 179 182 178 148 171 152 144 152 -14.1 5.6
Sep 163.2 181 170 174 144 147 161 151 114 136 -16.7 19.3
Q4 Oct 153.6 181 152 167 129 139 128 117 132 146 -4.9 10.6
Nov 159.2 184 178 170 134 130 130 124 123 119 -25.3 -3.3
Dec 153.0 164 187 165 128 121 126 123 114 120 -21.6 5.3

HA Publication PR67/14 App 18
Table B-4 Collisions by time period, day and year
Day Grouped Time
2005-2009 BSL
average 2005 2006 2007 2008 2009 2010 2011 2012 2013
2013 per cent change from BSL
average
2013 per cent change from
2012
Monday 0 - 6am 145.8 154 176 168 107 124 105 113 89 90 -38.3 1.1
6 - 10am 555.2 633 583 568 552 440 432 435 393 415 -25.3 5.6
10am - 2pm 427.8 538 433 416 389 363 351 297 316 314 -26.6 -0.6
2 - 6pm 549.0 576 559 582 519 509 458 448 454 421 -23.3 -7.3
6pm - 0am 346.2 375 362 375 317 302 269 301 284 244 -29.5 -14.1
Tuesday 0 - 6am 129.8 167 119 137 123 103 106 98 92 102 -21.4 10.9
6 - 10am 513.6 538 548 534 516 432 396 426 389 402 -21.7 3.3
10am - 2pm 386.6 438 400 424 351 320 324 270 282 285 -26.3 1.1
2 - 6pm 545.2 614 589 547 520 456 423 452 423 436 -20.0 3.1
6pm - 0am 376.8 396 390 404 362 332 323 299 264 290 -23.0 9.8
Wednesday 0 - 6am 117.6 127 105 123 115 118 91 81 71 80 -32.0 12.7
6 - 10am 525.0 566 565 535 496 463 432 375 408 380 -27.6 -6.9
10am - 2pm 369.2 428 397 373 354 294 291 322 315 261 -29.3 -17.1
2 - 6pm 555.0 630 572 562 538 473 465 476 494 400 -27.9 -19.0
6pm - 0am 392.8 449 434 386 331 364 335 311 290 301 -23.4 3.8
Thursday 0 - 6am 134.2 125 148 147 122 129 102 87 93 71 -47.1 -23.7
6 - 10am 482.4 500 538 528 425 421 404 398 376 378 -21.6 0.5
10am - 2pm 392.0 427 437 440 330 326 292 312 286 270 -31.1 -5.6
2 - 6pm 589.6 639 659 598 534 518 508 529 488 442 -25.0 -9.4
6pm - 0am 413.4 513 421 435 343 355 333 334 321 288 -30.3 -10.3
Friday 0 - 6am 145.6 166 145 152 161 104 115 83 129 95 -34.8 -26.4
6 - 10am 387.4 418 427 407 357 328 322 320 279 282 -27.2 1.1
10am - 2pm 522.4 576 597 513 463 463 422 431 387 384 -26.5 -0.8
2 - 6pm 779.6 860 877 724 696 741 728 659 575 573 -26.5 -0.3
6pm - 0am 517.4 601 562 511 460 453 454 389 396 436 -15.7 10.1
Saturday 0 - 6am 202.8 232 226 200 181 175 173 159 137 139 -31.5 1.5
6 - 10am 248.0 256 275 241 234 234 238 172 167 181 -27.0 8.4
10am - 2pm 532.2 570 552 573 479 487 454 415 412 380 -28.6 -7.8
2 - 6pm 444.8 505 469 457 412 381 360 325 341 324 -27.2 -5.0
6pm - 0am 357.4 374 343 374 380 316 269 244 239 269 -24.7 12.6
Sunday 0 - 6am 210.8 226 230 215 197 186 163 164 161 128 -39.3 -20.5
6 - 10am 215.8 208 236 217 210 208 199 198 201 150 -30.5 -25.4
10am - 2pm 442.0 470 466 451 417 406 363 342 337 321 -27.4 -4.7
2 - 6pm 493.8 564 540 488 455 422 388 384 350 326 -34.0 -6.9
6pm - 0am 423.8 493 455 460 381 330 326 298 281 287 -32.3 2.1
Notes: (a) One collision in 2005 was excluded due to no time being recorded.

HA Publication PR67/14 App 19
Table B-5 Fatal and serious collisions by time period, day and year
Day Grouped Time
2005-2009 BSL
average 2005 2006 2007 2008 2009 2010 2011 2012 2013
2013 per cent change from BSL
average
2013 per cent change from
2012
Monday 0 - 6am 34.0 29 43 52 19 27 24 29 16 20 -41.2 25.0
6 - 10am 55.6 68 40 68 53 49 34 49 51 41 -26.3 -19.6
10am - 2pm 49.4 64 46 56 39 42 44 37 44 41 -17.0 -6.8
2 - 6pm 66.2 72 72 75 50 62 67 69 54 53 -19.9 -1.9
6pm - 0am 54.0 55 56 54 61 44 45 40 43 51 -5.6 18.6
Tuesday 0 - 6am 27.6 34 22 35 31 16 20 15 19 24 -13.0 26.3
6 - 10am 59.6 61 63 61 55 58 42 54 42 51 -14.4 21.4
10am - 2pm 45.8 52 55 41 39 42 42 31 41 39 -14.8 -4.9
2 - 6pm 61.6 74 64 66 52 52 51 49 51 53 -14.0 3.9
6pm - 0am 57.2 68 44 59 67 48 42 35 26 53 -7.3 103.8
Wednesday 0 - 6am 30.0 28 35 28 32 27 22 15 20 14 -53.3 -30.0
6 - 10am 50.2 63 59 46 51 32 45 44 43 42 -16.3 -2.3
10am - 2pm 41.8 55 48 38 40 28 34 32 37 35 -16.3 -5.4
2 - 6pm 58.6 59 70 61 57 46 54 55 52 49 -16.4 -5.8
6pm - 0am 62.8 84 56 75 46 53 53 34 35 39 -37.9 11.4
Thursday 0 - 6am 32.6 39 33 28 35 28 21 17 17 23 -29.4 35.3
6 - 10am 48.8 46 59 59 34 46 50 24 46 45 -7.8 -2.2
10am - 2pm 45.0 53 49 51 42 30 30 35 24 33 -26.7 37.5
2 - 6pm 59.2 61 59 61 64 51 56 49 53 53 -10.5 0.0
6pm - 0am 68.2 78 75 74 61 53 46 59 42 36 -47.2 -14.3
Friday 0 - 6am 34.6 43 33 35 30 32 31 15 28 23 -33.5 -17.9
6 - 10am 40.4 39 52 38 35 38 40 39 30 41 1.5 36.7
10am - 2pm 57.0 66 56 55 52 56 51 60 49 60 5.3 22.4
2 - 6pm 79.0 90 84 78 77 66 89 77 63 65 -17.7 3.2
6pm - 0am 76.2 92 78 74 77 60 68 54 59 65 -14.7 10.2
Saturday 0 - 6am 51.4 62 52 59 41 43 44 41 34 34 -33.9 0.0
6 - 10am 37.6 46 41 33 28 40 40 27 29 23 -38.8 -20.7
10am - 2pm 60.2 58 61 61 52 69 53 50 46 46 -23.6 0.0
2 - 6pm 69.8 85 73 72 63 56 49 55 53 52 -25.5 -1.9
6pm - 0am 67.8 73 64 69 79 54 47 43 46 41 -39.5 -10.9
Sunday 0 - 6am 62.0 74 63 68 51 54 44 49 47 26 -58.1 -44.7
6 - 10am 32.6 38 30 29 31 35 43 42 39 26 -20.2 -33.3
10am - 2pm 65.0 66 74 60 65 60 61 69 52 38 -41.5 -26.9
2 - 6pm 74.8 79 96 71 59 69 54 59 56 58 -22.5 3.6
6pm - 0am 67.8 84 67 64 64 60 40 52 42 42 -38.1 0.0
Notes: (a) One collision in 2005 was excluded due to no time being recorded.

HA Publication PR67/14 App 20
Table B-6 Collisions by road surface conditions, weather conditions and year
Road surface Conditions Weather
2005-2009 BSL
average 2005 2006 2007 2008 2009 2010 2011 2012 2013
2013 per cent change from BSL
average
2013 per cent change from
2012
Dry Fine 9,064.6 10,097 9,853 9,456 8,156 7,761 7,313 7,756 6,586 6,755 -25.5 2.6
Rain 11.0 11 10 12 10 12 10 5 13 9 - -
Fog or mist 22.4 21 26 24 26 15 14 22 23 11 -50.9 -52.2
Snow 1.8 0 4 2 0 3 1 0 0 3 - -
Other/unknown 199.8 227 197 205 190 180 159 132 120 136 -31.9 13.3
Wet or damp Fine 1,943.6 2,230 2,135 1,906 1,837 1,610 1,452 1,292 1,471 1,328 -31.7 -9.7
Rain 1,960.4 1,970 2,070 2,140 1,968 1,654 1,368 1,340 1,749 1,259 -35.8 -28.0
Fog or mist 112.2 140 152 93 102 74 88 56 77 53 -52.8 -31.2
Snow 42.6 82 39 31 34 27 56 9 10 50 17.4 -
Other/unknown 178.4 228 167 183 159 155 153 111 118 112 -37.2 -5.1
Flood over 3cm. deep
Fine 3.2 3 2 4 2 5 0 2 3 0 - -
Rain 43.4 37 41 45 46 48 37 27 66 41 -5.5 -37.9
Fog or mist 0.0 0 0 0 0 0 0 0 0 0 - -
Snow 0.6 0 1 0 1 1 0 0 0 2 - -
Other/unknown 1.0 1 0 0 1 3 1 0 1 2 - -
Frost or ice Fine 103.0 90 49 54 110 212 271 101 105 68 -34.0 -35.2
Rain 7.4 5 4 3 8 17 23 12 12 14 - -
Fog or mist 9.6 10 7 8 13 10 38 3 5 7 - -
Snow 20.2 26 13 11 19 32 77 11 21 37 83.2 76.2
Other/unknown 42.6 36 14 20 39 104 114 30 41 46 8.0 12.2
Snow Fine 6.4 8 3 3 4 14 42 2 15 22 - 46.7
Rain 2.6 7 2 0 1 3 2 1 3 6 - -
Fog or mist 0.4 0 0 0 0 2 3 0 4 2 - -
Snow 70.6 92 27 39 80 115 165 24 53 154 118.1 190.6
Other/unknown 3.2 6 0 2 2 6 18 1 3 6 - -
Other Summation of other codes 20.2 26 19 24 19 13 9 10 21 22 8.9 4.8
Table B-7 Collisions involving single vehicles by severity and year
Severity
2005-2009 BSL
average 2005 2006 2007 2008 2009 2010 2011 2012 2013
2013 per cent change from BSL
average
2013 per cent change from
2012
Fatal 109.0 117 123 114 112 79 70 80 65 78 -28.4 20.0
Serious 540.2 625 540 567 494 475 454 467 426 381 -29.5 -10.6
Slight 2,499.6 2,652 2,659 2,579 2,349 2,259 2,064 1,927 1,921 1,716 -31.3 -10.7
Total 3,148.8 3,394 3,322 3,260 2,955 2,813 2,588 2,474 2,412 2,175 -30.9 -9.8
HA Publication PR67/14 App 21
Table B-8 Collisions involving HGVs by severity and year
Severity
2005-2009 BSL
average 2005 2006 2007 2008 2009 2010 2011 2012 2013
2013 per cent change from BSL
average
2013 per cent change from
2012
Fatal 109.6 133 119 120 103 73 80 71 80 81 -26.1 1.3
Serious 346.8 443 366 357 306 262 273 220 238 262 -24.5 10.1
Slight 2,471.2 2,856 2,750 2,650 2,240 1,860 1,925 1,844 1,674 1,670 -32.4 -0.2
Total 2,927.6 3,432 3,235 3,127 2,649 2,195 2,278 2,135 1,992 2,013 -31.2 1.1
Table B-9 Collisions involving Other GVs by severity and year
Severity
2005-2009 BSL
average 2005 2006 2007 2008 2009 2010 2011 2012 2013
2013 per cent change from BSL
average
2013 per cent change from
2012
Fatal 37.6 36 36 48 38 30 38 30 28 25 -33.5 -10.7
Serious 180.6 232 194 158 152 167 146 134 142 144 -20.3 1.4
Slight 1,442.4 1,528 1,592 1,438 1,391 1,263 1,174 1,188 1,123 1,144 -20.7 1.9
Total 1,660.6 1,796.0 1,822.0 1,644.0 1,581.0 1,460.0 1,358.0 1,352.0 1,293.0 1,313.0 -20.9 1.5
Table B-10 Collisions involving young drivers (aged 17 – 24 years) by severity and year
Severity
2005-2009 BSL
average 2005 2006 2007 2008 2009 2010 2011 2012 2013
2013 per cent change from BSL
average
2013 per cent change from
2012
Fatal 70.6 93 73 71 68 48 55 57 29 40 -43.3 37.9
Serious 381.0 423 389 412 352 329 320 286 246 226 -40.7 -8.1
Slight 3,583.6 3,904 3,795 3,701 3,267 3,251 2,874 2,689 2,455 2,298 -35.9 -6.4
Total 4,035.2 4,420 4,257 4,184 3,687 3,628 3,249 3,032 2,730 2,564 -36.5 -6.1
Table B-11 Collisions involving elderly drivers (aged 70 years and over) by severity and year
Severity
2005-2009 BSL
average 2005 2006 2007 2008 2009 2010 2011 2012 2013
2013 per cent change from BSL
average
2013 per cent change from
2012
Fatal 28.8 34 27 28 33 22 23 28 27 28 -2.8 3.7
Serious 106.8 110 116 102 89 117 110 108 85 129 20.8 51.8
Slight 642.2 697 632 665 599 618 595 588 611 614 -4.4 0.5
Total 777.8 841 775 795 721 757 728 724 723 771 -0.9 6.6

HA Publication PR67/14 App 22
Table B-12 Collisions involving towed caravans by severity and year
Severity
2005-2009 BSL
average 2005 2006 2007 2008 2009 2010 2011 2012 2013
2013 per cent change from BSL
average
2013 per cent change from
2012
Fatal 1.8 1 4 0 1 3 0 0 0 3 - -
Serious 7.8 12 6 10 5 6 8 9 7 8 - -
Slight 77.0 94 98 71 62 60 60 59 47 37 -51.9 -21.3
Total 86.6 107 108 81 68 69 68 68 54 48 -44.6 -11.1
Table B-13 Collisions by top 20 road names and year
No. Road name
2005-2009 BSL
average 2005 2006 2007 2008 2009 2010 2011 2012 2013
2013 per cent change from BSL
average
2013 per cent change from
2012
1 M6 896.6 1,017 961 916 861 728 793 670 636 694 -22.6 9.1
2 M1 1,062.8 1,333 1,146 1,077 917 841 855 659 706 664 -37.5 -5.9
3 M25 981.8 1,254 1,083 931 858 783 793 790 765 656 -33.2 -14.2
4 A1 616.6 752 675 589 535 532 500 427 357 381 -38.2 6.7
5 M4 478.6 506 570 506 454 357 422 377 375 361 -24.6 -3.7
6 A5 315.2 351 338 331 277 279 294 276 283 281 -10.9 -0.7
7 A27 312.6 334 348 310 289 282 276 258 247 281 -10.1 13.8
8 A38 344.0 380 363 363 307 307 277 292 310 274 -20.3 -11.6
9 A1(M) 272.6 201 282 308 303 269 269 251 234 260 -4.6 11.1
10 M5 446.4 493 441 496 391 411 330 288 267 246 -44.9 -7.9
11 A14 334.4 383 334 342 327 286 306 270 253 235 -29.7 -7.1
12 M3 240.8 239 288 237 223 217 213 208 196 215 -10.7 9.7
13 A46 285.0 286 312 292 269 266 205 210 224 205 -28.1 -8.5
14 M62 398.0 430 410 424 396 330 315 311 258 199 -50.0 -22.9
15 A30 231.2 273 241 259 198 185 184 203 206 194 -16.1 -5.8
16 A12 264.6 306 266 275 256 220 196 212 195 190 -28.2 -2.6
17 A2 194.6 205 215 193 184 176 198 189 168 182 -6.5 8.3
18 M40 304.2 308 337 344 276 256 266 248 216 178 -41.5 -17.6
19 A47 227.4 255 226 228 219 209 172 180 165 168 -26.1 1.8
20 A34 166.0 139 206 184 162 139 113 181 164 162 -2.4 -1.2
Notes: (a) Ranked by 2013

HA Publication PR67/14 App 23
Table B-14 Collisions by collision type and year
Collision Type
2005-2009 BSL
average 2005 2006 2007 2008 2009 2010 2011 2012 2013
2013 per cent change from BSL
average
2013 per cent change from
2012
Head On 269.4 291 284 293 247 232 189 167 171 183 -32.1 7.0
Shunt 5,732.6 6,347 6,261 5,842 5,278 4,935 4,766 4,655 4,379 4,360 -23.9 -0.4
Junction 4,100.8 4,503 4,257 4,175 3,831 3,738 3,327 3,574 3,389 3,025 -26.2 -10.7
Pedestrian 201.8 210 176 218 219 186 189 179 141 171 -15.3 21.3
Pedal cyclist 148.4 173 157 139 140 133 145 172 169 146 -1.6 -13.6
Overtake 938.2 1,209 985 948 812 737 701 591 545 578 -38.4 6.1
Single vehicle run-off 2,430.8 2,669 2,557 2,523 2,249 2,156 1,984 1,856 1,854 1,676 -31.1 -9.6
Other 2,840.4 3,120 3,139 2,911 2,605 2,427 2,334 2,111 2,048 1,988 -30.0 -2.9
Notes: (a) For definitions of each collision type refer to Appendix A. (b) Collisions may fall within more than one collision type and hence may be counted more than once.

HA Publication PR67/14 App 24
Appendix C: Casualty Statistics Table C-1 to Table C-24 provide breakdowns of casualties by gender, severity, time of day, object hit off/on carriageway, road type and
involving different road user groups.
Table C-1 Casualties by road classification, severity and year
Road Classification Causality Severity
2005-2009 BSL
average 2005 2006 2007 2008 2009 2010 2011 2012 2013
2013 per cent change from BSL
average
2013 per cent change from
2012
Motorway - Killed 153.6 184 169 156 143 116 110 90 78 87 -43.4 11.5
Seriously Injured 859.4 938 876 945 783 755 716 654 577 596 -30.6 3.3
KSI 1,013.0 1,122 1,045 1,101 926 871 826 744 655 683 -32.6 4.3
Slightly Injured 10,186.6 11,360 11,018 10,426 9,391 8,738 8,552 8,008 7,556 7,154 -29.8 -5.3
Total 11,199.6 12,482 12,063 11,527 10,317 9,609 9,378 8,752 8,211 7,837 -30.0 -4.6
A-road Dual Carriageway
Built-up Killed 5.6 8 5 6 4 5 1 6 4 2 - -
Seriously Injured 60.0 63 54 64 58 61 48 56 52 42 -30.0 -19.2
KSI 65.6 71 59 70 62 66 49 62 56 44 -32.9 -21.4
Slightly Injured 839.2 923 808 868 840 757 632 867 771 692 -17.5 -10.2
Total 904.8 994 867 938 902 823 681 929 827 736 -18.7 -11.0
Non Built-up Killed 127.2 145 136 138 137 80 91 97 80 88 -30.8 10.0
Seriously Injured 659.6 819 718 628 591 542 584 566 551 494 -25.1 -10.3
KSI 786.8 964 854 766 728 622 675 663 631 582 -26.0 -7.8
Slightly Injured 5,812.2 6,426 6,187 5,873 5,326 5,249 4,907 5,041 4,674 4,677 -19.5 0.1
Total 6,599.0 7,390 7,041 6,639 6,054 5,871 5,582 5,704 5,305 5,259 -20.3 -0.9
A-road Single Carriageway
Built-up Killed 6.0 6 6 6 9 3 5 8 8 11 - -
Seriously Injured 63.6 71 52 76 48 71 55 68 54 49 -23.0 -9.3
KSI 69.6 77 58 82 57 74 60 76 62 60 -13.8 -3.2
Slightly Injured 600.6 593 610 596 615 589 475 493 500 512 -14.8 2.4
Total 670.2 670 668 678 672 663 535 569 562 572 -14.7 1.8
Non Built-up Killed 64.8 79 73 64 57 51 42 50 47 56 -13.6 19.1
Seriously Injured 321.4 378 351 322 273 283 234 234 245 283 -11.9 15.5
KSI 386.2 457 424 386 330 334 276 284 292 339 -12.2 16.1
Slightly Injured 1,943.0 2,191 2,133 2,023 1,628 1,740 1,570 1,482 1,476 1,345 -30.8 -8.9
Total 2,329.2 2,648 2,557 2,409 1,958 2,074 1,846 1,766 1,768 1,684 -27.7 -4.8
Other - Total 0.0 0 0 0 0 0 0 0 0 6 - -
Notes: (a) Where the road classification is denoted as “Other”, these casualties were located on sections of the reference network that have been downgraded in class (to B or below) since 2010.

HA Publication PR67/14 App 25
Table C-2 Casualties by age, severity and year
Casualties age group Casualty Severity
2005-2009 BSL
average 2005 2006 2007 2008 2009 2010 2011 2012 2013
2013 per cent change from BSL
average
2013 per cent change from
2012
Children (0-15) Killed 11.8 8 10 15 16 10 10 2 7 5 - -
Seriously Injured 70.6 79 77 63 70 64 75 62 53 33 -53.3 -37.7
KSI 82.4 87 87 78 86 74 85 64 60 38 -53.9 -36.7
Slightly Injured 1,059.2 1,235 1,102 1,033 938 988 850 946 802 775 -26.8 -3.4
Total 1,141.6 1,322 1,189 1,111 1,024 1,062 935 1,010 862 813 -28.8 -5.7
Young (16-19) Killed 26.4 30 28 30 22 22 16 20 4 18 -31.8 -
Seriously Injured 172.2 226 176 171 141 147 115 107 75 85 -50.6 13.3
KSI 198.6 256 204 201 163 169 131 127 79 103 -48.1 30.4
Slightly Injured 1,551.0 1,657 1,626 1,636 1,468 1,368 1,205 1,085 961 851 -45.1 -11.4
Total 1,749.6 1,913 1,830 1,837 1,631 1,537 1,336 1,212 1,040 954 -45.5 -8.3
Other (20-59) Killed 258.4 321 290 245 255 181 173 164 151 164 -36.5 8.6
Seriously Injured 1,455.0 1,656 1,535 1,541 1,301 1,242 1,174 1,153 1,102 1,059 -27.2 -3.9
KSI 1,713.4 1,977 1,825 1,786 1,556 1,423 1,347 1,317 1,253 1,223 -28.6 -2.4
Slightly Injured 14,705.8 16,328 15,864 15,000 13,470 12,867 12,307 11,990 11,466 10,936 -25.6 -4.6
Total 16,419.2 18,305 17,689 16,786 15,026 14,290 13,654 13,307 12,719 12,159 -25.9 -4.4
Older (60-69) Killed 23.8 18 23 34 25 19 20 22 21 21 -11.8 0.0
Seriously Injured 136.4 143 122 136 137 144 146 140 130 128 -6.2 -1.5
KSI 160.2 161 145 170 162 163 166 162 151 149 -7.0 -1.3
Slightly Injured 1,101.4 1,128 1,159 1,137 1,065 1,018 1,017 1,063 994 1,008 -8.5 1.4
Total 1,261.6 1,289 1,304 1,307 1,227 1,181 1,183 1,225 1,145 1,157 -8.3 1.0
Elderly (70+) Killed 35.8 43 36 45 32 23 30 43 34 36 0.6 5.9
Seriously Injured 109.4 133 119 103 91 101 108 108 107 152 38.9 42.1
KSI 145.2 176 155 148 123 124 138 151 141 188 29.5 33.3
Slightly Injured 690.4 779 679 682 660 652 606 638 578 636 -7.9 10.0
Total 835.6 955 834 830 783 776 744 789 719 824 -1.4 14.6
Unknown Killed 1.0 2 2 1 0 0 0 0 0 0 - -
Seriously Injured 20.4 32 22 21 13 14 19 8 12 8 -60.8 -
KSI 21.4 34 24 22 13 14 19 8 12 8 -62.6 -
Slightly Injured 273.8 366 326 298 199 180 151 169 176 179 -34.6 1.7
Total 295.2 400 350 320 212 194 170 177 188 187 -36.3 -0.5

HA Publication PR67/14 App 26
Table C-3i. Casualties by casualty type, severity and year
Casualty type Casualty Severity
2005-2009 BSL
average 2005 2006 2007 2008 2009 2010 2011 2012 2013
2013 per cent change from BSL
average
2013 per cent change from
2012
Bus / Coach occupant Killed 0.8 0 0 3 0 1 2 1 1 1 - -
Seriously Injured 14.8 3 10 47 8 6 28 10 6 38 - -
KSI 15.6 3 10 50 8 7 30 11 7 39 150.0 -
Slightly Injured 135.8 92 125 254 134 74 106 228 130 109 -19.7 -16.2
Total 151.4 95 135 304 142 81 136 239 137 148 -2.2 8.0
Car occupants Killed 221.4 263 255 208 220 161 133 162 122 133 -39.9 9.0
Seriously Injured 1,293.2 1,510 1,368 1,302 1,139 1,147 1,088 1,027 969 931 -28.0 -3.9
KSI 1,514.6 1,773 1,623 1,510 1,359 1,308 1,221 1,189 1,091 1,064 -29.8 -2.5
Slightly Injured 16,718.8 18,575 17,955 16,870 15,273 14,921 13,999 13,631 12,920 12,375 -26.0 -4.2
Total 18,233.4 20,348 19,578 18,380 16,632 16,229 15,220 14,820 14,011 13,439 -26.3 -4.1
Other goods vehicle occupant
Killed 12.6 13 11 17 10 12 11 5 11 12 - -
Seriously Injured 94.0 109 105 92 82 82 66 57 67 52 -44.7 -22.4
KSI 106.6 122 116 109 92 94 77 62 78 64 -40.0 -17.9
Slightly Injured 930.4 1,027 1,019 916 907 783 739 774 742 719 -22.7 -3.1
Total 1,037.0 1,149 1,135 1,025 999 877 816 836 820 783 -24.5 -4.5
HGV occupant Killed 22.4 33 21 35 16 7 19 16 16 14 -37.5 -12.5
Seriously Injured 122.4 166 135 136 102 73 74 66 67 66 -46.1 -1.5
KSI 144.8 199 156 171 118 80 93 82 83 80 -44.8 -3.6
Slightly Injured 639.2 786 730 712 554 414 453 373 412 382 -40.2 -7.3
Total 784.0 985 886 883 672 494 546 455 495 462 -41.1 -6.7
Pedal Cyclist Killed 8.0 12 8 5 7 8 12 5 8 6 - -
Seriously Injured 33.0 45 30 31 29 30 40 37 46 28 -15.2 -39.1
KSI 41.0 57 38 36 36 38 52 42 54 34 -17.1 -37.0
Slightly Injured 109.2 120 121 103 105 97 96 131 116 115 5.3 -0.9
Total 150.2 177 159 139 141 135 148 173 170 149 -0.8 -12.4
PTW users Killed 44.0 55 46 39 52 28 30 23 23 37 -15.9 60.9
Seriously Injured 330.4 352 338 354 311 297 273 307 272 277 -16.2 1.8
KSI 374.4 407 384 393 363 325 303 330 295 314 -16.1 6.4
Slightly Injured 651.2 702 635 712 616 591 559 600 517 532 -18.3 2.9
Total 1,025.6 1,109 1,019 1,105 979 916 862 930 812 846 -17.5 4.2
Pedestrian Killed 46.4 44 46 62 45 35 42 36 36 38 -18.1 5.6
Seriously Injured 62.6 67 53 60 71 62 64 58 46 52 -16.9 13.0
KSI 109.0 111 99 122 116 97 106 94 82 90 -17.4 9.8
Slightly Injured 107.2 112 90 115 117 102 93 88 66 93 -13.2 40.9
Total 216.2 223 189 237 233 199 199 182 148 183 -15.4 23.6

HA Publication PR67/14 App 27
Table C-3ii. Casualties by casualty type, severity and year (Contd.)
Casualty type Casualty Severity
2005-2009 BSL
average 2005 2006 2007 2008 2009 2010 2011 2012 2013
2013 per cent change from BSL
average
2013 per cent change from
2012
Other/Unknown Killed 1.6 2 2 1 0 3 0 3 0 3 - -
Seriously Injured 13.6 17 12 13 11 15 4 16 6 21 - -
KSI 15.2 19 14 14 11 18 4 19 6 24 57.9 -
Slightly Injured 89.8 79 81 104 94 91 91 66 74 60 -33.2 -18.9
Total 105.0 98 95 118 105 109 95 85 80 84 -20.0 5.0

HA Publication PR67/14 App 28
Table C-4 Bus and coach occupant casualties by age, severity and year
Casualties age group Casualty Severity
2005-2009 BSL
average 2005 2006 2007 2008 2009 2010 2011 2012 2013
2013 per cent change from BSL
average
2013per cent change from
2012
Children (0-15) Killed 0.0 0 0 0 0 0 1 0 0 0 - -
Seriously Injured 1.4 1 2 3 1 0 14 1 0 0 - -
KSI 1.4 1 2 3 1 0 15 1 0 0 - -
Slightly Injured 16.6 12 44 10 12 5 27 97 23 18 8.4 -21.7
Total 18.0 13 46 13 13 5 42 98 23 18 0.0 -21.7
Young (16-19) Killed 0.0 0 0 0 0 0 1 0 0 1 - -
Seriously Injured 1.4 0 0 5 1 1 3 0 1 0 - -
KSI 1.4 0 0 5 1 1 4 0 1 1 - -
Slightly Injured 12.6 6 10 40 5 2 9 4 21 7 - -66.7
Total 14.0 6 10 45 6 3 13 4 22 8 - -63.6
Other (20-59) Killed 0.6 0 0 2 0 1 0 0 1 0 - -
Seriously Injured 9.0 2 6 29 4 4 8 6 5 29 - -
KSI 9.6 2 6 31 4 5 8 6 6 29 - -
Slightly Injured 71.2 50 51 162 57 36 50 64 70 66 -7.3 -5.7
Total 80.8 52 57 193 61 41 58 70 76 95 17.6 25.0
Older (60-69) Killed 0.0 0 0 0 0 0 0 1 0 0 - -
Seriously Injured 0.6 0 0 2 1 0 3 0 0 3 - -
KSI 0.6 0 0 2 1 0 3 1 0 3 - -
Slightly Injured 13.2 12 5 19 21 9 8 27 10 2 - -
Total 13.8 12 5 21 22 9 11 28 10 5 - -
Elderly (70+) Killed 0.2 0 0 1 0 0 0 0 0 0 - -
Seriously Injured 2.4 0 2 8 1 1 0 3 0 6 - -
KSI 2.6 0 2 9 1 1 0 3 0 6 - -
Slightly Injured 15.4 9 8 14 37 9 9 26 1 3 -80.5 -
Total 18.0 9 10 23 38 10 9 29 1 9 -50.0 -
Unknown Killed 0.0 0 0 0 0 0 0 0 0 0 - -
Seriously Injured 0.0 0 0 0 0 0 0 0 0 0 - -
KSI 0.0 0 0 0 0 0 0 0 0 0 - -
Slightly Injured 6.8 3 7 9 2 13 3 10 5 13 - -
Total 6.8 3 7 9 2 13 3 10 5 13 - -
HA Publication PR67/14 App 29
Table C-5 Car occupant casualties by age group, severity and year
Casualties age group Casualty Severity
2005-2009 BSL
average 2005 2006 2007 2008 2009 2010 2011 2012 2013
2013 per cent change from BSL
average
2013 per cent change from
2012
Children (0-15) Killed 8.8 6 9 8 14 7 7 1 7 2 - -
Seriously Injured 55.0 59 60 47 55 54 49 51 48 29 -47.3 -39.6
KSI 63.8 65 69 55 69 61 56 52 55 31 -51.4 -43.6
Slightly Injured 989.4 1,157 998 969 881 942 789 802 751 730 -26.2 -2.8
Total 1,053.2 1,222 1,067 1,024 950 1,003 845 854 806 761 -27.7 -5.6
Young (16-19) Killed 17.0 25 13 19 11 17 11 18 3 10 -41.2 -
Seriously Injured 133.4 173 138 125 105 126 84 73 53 54 -59.5 1.9
KSI 150.4 198 151 144 116 143 95 91 56 64 -57.4 14.3
Slightly Injured 1,387.0 1,471 1,453 1,449 1,323 1,239 1,119 946 835 748 -46.1 -10.4
Total 1,537.4 1,669 1,604 1,593 1,439 1,382 1,214 1,037 891 812 -47.2 -8.9
Other (20-59) Killed 152.2 190 190 125 147 109 78 100 73 80 -47.4 9.6
Seriously Injured 896.8 1041 947 932 803 761 742 704 676 633 -29.4 -6.4
KSI 1,049.0 1231 1137 1057 950 870 820 804 749 713 -32.0 -4.8
Slightly Injured 12,493.0 13,880 13,548 12,580 11,373 11,084 10,512 10,256 9,765 9,246 -26.0 -5.3
Total 13,542.0 15,111 14,685 13,637 12,323 11,954 11,332 11,060 10,514 9,959 -26.5 -5.3
Older (60-69) Killed 15.0 8 16 25 17 9 10 10 11 13 -13.3 -
Seriously Injured 98.2 98 100 101 94 98 101 99 91 81 -17.5 -11.0
KSI 113.2 106 116 126 111 107 111 109 102 94 -17.0 -7.8
Slightly Injured 967.4 1,000 1,038 984 924 891 869 916 867 899 -7.1 3.7
Total 1,080.6 1,106 1,154 1,110 1,035 998 980 1,025 969 993 -8.1 2.5
Elderly (70+) Killed 28.2 33 27 31 31 19 27 33 28 28 -0.7 0.0
Seriously Injured 93.8 115 108 78 73 95 98 95 90 129 37.5 43.3
KSI 122.0 148 135 109 104 114 125 128 118 157 28.7 33.1
Slightly Injured 645.2 736 640 639 595 616 569 573 549 606 -6.1 10.4
Total 767.2 884 775 748 699 730 694 701 667 763 -0.5 14.4
Unknown Killed 0.2 1 0 0 0 0 0 0 0 0 - -
Seriously Injured 16.0 24 15 19 9 13 14 5 11 5 -68.8 -
KSI 16.2 25 15 19 9 13 14 5 11 5 -69.1 -
Slightly Injured 236.8 331 278 249 177 149 141 138 153 146 -38.3 -4.6
Total 253.0 356 293 268 186 162 155 143 164 151 -40.3 -7.9
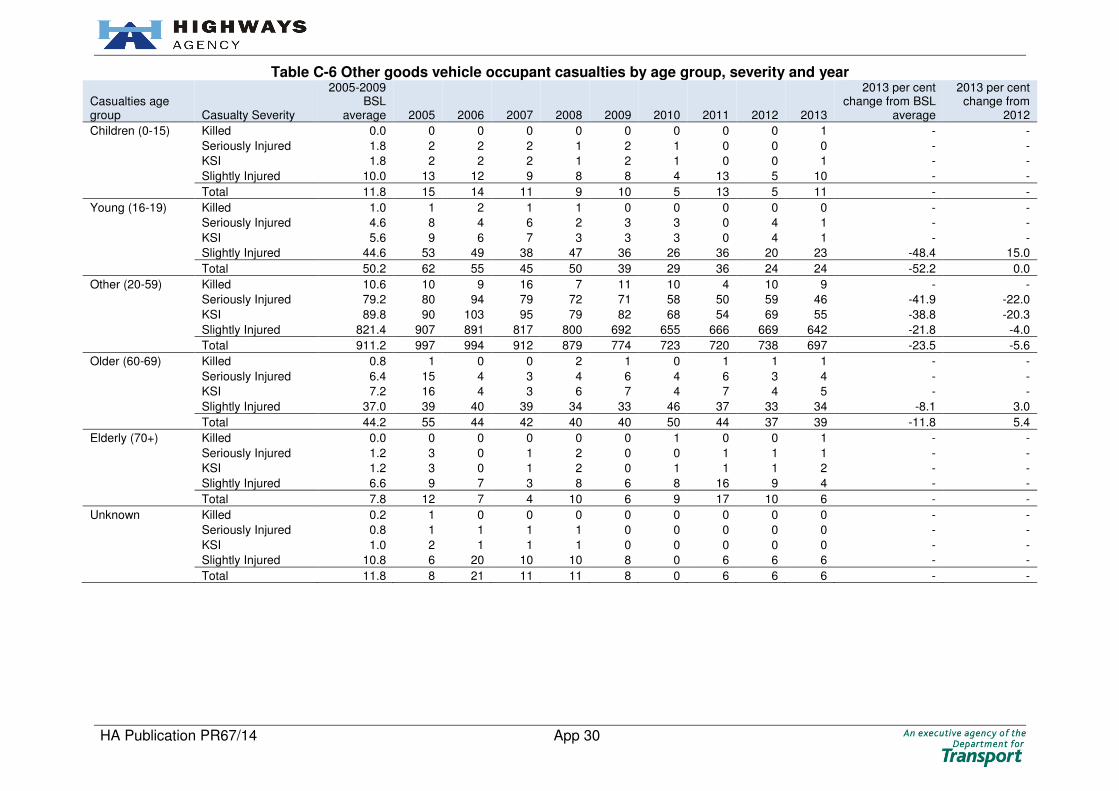
HA Publication PR67/14 App 30
Table C-6 Other goods vehicle occupant casualties by age group, severity and year
Casualties age group Casualty Severity
2005-2009 BSL
average 2005 2006 2007 2008 2009 2010 2011 2012 2013
2013 per cent change from BSL
average
2013 per cent change from
2012
Children (0-15) Killed 0.0 0 0 0 0 0 0 0 0 1 - -
Seriously Injured 1.8 2 2 2 1 2 1 0 0 0 - -
KSI 1.8 2 2 2 1 2 1 0 0 1 - -
Slightly Injured 10.0 13 12 9 8 8 4 13 5 10 - -
Total 11.8 15 14 11 9 10 5 13 5 11 - -
Young (16-19) Killed 1.0 1 2 1 1 0 0 0 0 0 - -
Seriously Injured 4.6 8 4 6 2 3 3 0 4 1 - -
KSI 5.6 9 6 7 3 3 3 0 4 1 - -
Slightly Injured 44.6 53 49 38 47 36 26 36 20 23 -48.4 15.0
Total 50.2 62 55 45 50 39 29 36 24 24 -52.2 0.0
Other (20-59) Killed 10.6 10 9 16 7 11 10 4 10 9 - -
Seriously Injured 79.2 80 94 79 72 71 58 50 59 46 -41.9 -22.0
KSI 89.8 90 103 95 79 82 68 54 69 55 -38.8 -20.3
Slightly Injured 821.4 907 891 817 800 692 655 666 669 642 -21.8 -4.0
Total 911.2 997 994 912 879 774 723 720 738 697 -23.5 -5.6
Older (60-69) Killed 0.8 1 0 0 2 1 0 1 1 1 - -
Seriously Injured 6.4 15 4 3 4 6 4 6 3 4 - -
KSI 7.2 16 4 3 6 7 4 7 4 5 - -
Slightly Injured 37.0 39 40 39 34 33 46 37 33 34 -8.1 3.0
Total 44.2 55 44 42 40 40 50 44 37 39 -11.8 5.4
Elderly (70+) Killed 0.0 0 0 0 0 0 1 0 0 1 - -
Seriously Injured 1.2 3 0 1 2 0 0 1 1 1 - -
KSI 1.2 3 0 1 2 0 1 1 1 2 - -
Slightly Injured 6.6 9 7 3 8 6 8 16 9 4 - -
Total 7.8 12 7 4 10 6 9 17 10 6 - -
Unknown Killed 0.2 1 0 0 0 0 0 0 0 0 - -
Seriously Injured 0.8 1 1 1 1 0 0 0 0 0 - -
KSI 1.0 2 1 1 1 0 0 0 0 0 - -
Slightly Injured 10.8 6 20 10 10 8 0 6 6 6 - -
Total 11.8 8 21 11 11 8 0 6 6 6 - -
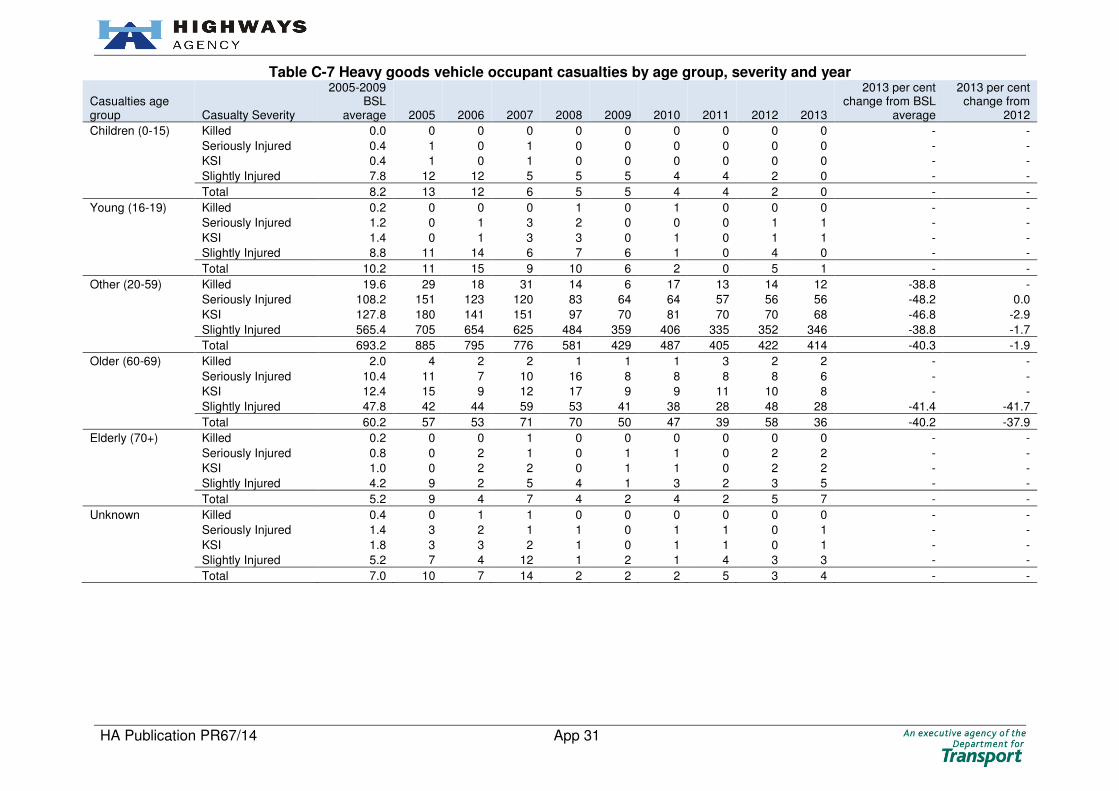
HA Publication PR67/14 App 31
Table C-7 Heavy goods vehicle occupant casualties by age group, severity and year
Casualties age group Casualty Severity
2005-2009 BSL
average 2005 2006 2007 2008 2009 2010 2011 2012 2013
2013 per cent change from BSL
average
2013 per cent change from
2012
Children (0-15) Killed 0.0 0 0 0 0 0 0 0 0 0 - -
Seriously Injured 0.4 1 0 1 0 0 0 0 0 0 - -
KSI 0.4 1 0 1 0 0 0 0 0 0 - -
Slightly Injured 7.8 12 12 5 5 5 4 4 2 0 - -
Total 8.2 13 12 6 5 5 4 4 2 0 - -
Young (16-19) Killed 0.2 0 0 0 1 0 1 0 0 0 - -
Seriously Injured 1.2 0 1 3 2 0 0 0 1 1 - -
KSI 1.4 0 1 3 3 0 1 0 1 1 - -
Slightly Injured 8.8 11 14 6 7 6 1 0 4 0 - -
Total 10.2 11 15 9 10 6 2 0 5 1 - -
Other (20-59) Killed 19.6 29 18 31 14 6 17 13 14 12 -38.8 -
Seriously Injured 108.2 151 123 120 83 64 64 57 56 56 -48.2 0.0
KSI 127.8 180 141 151 97 70 81 70 70 68 -46.8 -2.9
Slightly Injured 565.4 705 654 625 484 359 406 335 352 346 -38.8 -1.7
Total 693.2 885 795 776 581 429 487 405 422 414 -40.3 -1.9
Older (60-69) Killed 2.0 4 2 2 1 1 1 3 2 2 - -
Seriously Injured 10.4 11 7 10 16 8 8 8 8 6 - -
KSI 12.4 15 9 12 17 9 9 11 10 8 - -
Slightly Injured 47.8 42 44 59 53 41 38 28 48 28 -41.4 -41.7
Total 60.2 57 53 71 70 50 47 39 58 36 -40.2 -37.9
Elderly (70+) Killed 0.2 0 0 1 0 0 0 0 0 0 - -
Seriously Injured 0.8 0 2 1 0 1 1 0 2 2 - -
KSI 1.0 0 2 2 0 1 1 0 2 2 - -
Slightly Injured 4.2 9 2 5 4 1 3 2 3 5 - -
Total 5.2 9 4 7 4 2 4 2 5 7 - -
Unknown Killed 0.4 0 1 1 0 0 0 0 0 0 - -
Seriously Injured 1.4 3 2 1 1 0 1 1 0 1 - -
KSI 1.8 3 3 2 1 0 1 1 0 1 - -
Slightly Injured 5.2 7 4 12 1 2 1 4 3 3 - -
Total 7.0 10 7 14 2 2 2 5 3 4 - -

HA Publication PR67/14 App 32
Table C-8 Pedal cycle casualties by age group, severity and year
Casualties age group Casualty Severity
2005-2009 BSL
average 2005 2006 2007 2008 2009 2010 2011 2012 2013
2013 per cent change from BSL
average
2013 per cent change from
2012
Children (0-15) Killed 0.4 1 0 1 0 0 0 0 0 0 - -
Seriously Injured 2.4 4 2 4 2 0 1 1 0 0 - -
KSI 2.8 5 2 5 2 0 1 1 0 0 - -
Slightly Injured 7.4 10 10 6 9 2 5 10 6 5 - -
Total 10.2 15 12 11 11 2 6 11 6 5 - -
Young (16-19) Killed 0.2 0 0 0 1 0 0 0 0 0 - -
Seriously Injured 2.2 4 3 1 1 2 2 1 1 0 - -
KSI 2.4 4 3 1 2 2 2 1 1 0 - -
Slightly Injured 11.0 13 18 9 6 9 9 10 12 5 - -
Total 13.4 17 21 10 8 11 11 11 13 5 - -
Other (20-59) Killed 6.0 9 5 4 6 6 9 4 5 3 - -
Seriously Injured 24.0 32 22 23 21 22 30 30 38 22 -8.3 -42.1
KSI 30.0 41 27 27 27 28 39 34 43 25 -16.7 -41.9
Slightly Injured 73.8 78 75 66 80 70 76 93 87 95 28.7 9.2
Total 103.8 119 102 93 107 98 115 127 130 120 15.6 -7.7
Older (60-69) Killed 0.6 0 1 0 0 2 2 0 2 2 - -
Seriously Injured 2.2 2 0 2 2 5 5 4 3 4 - -
KSI 2.8 2 1 2 2 7 7 4 5 6 - -
Slightly Injured 7.2 9 6 7 4 10 2 8 6 8 - -
Total 10.0 11 7 9 6 17 9 12 11 14 - -
Elderly (70+) Killed 0.8 2 2 0 0 0 1 1 1 1 - -
Seriously Injured 2.0 3 2 1 3 1 1 1 3 2 - -
KSI 2.8 5 4 1 3 1 2 2 4 3 - -
Slightly Injured 5.0 4 6 7 4 4 4 5 2 0 - -
Total 7.8 9 10 8 7 5 6 7 6 3 - -
Unknown Killed 0.0 0 0 0 0 0 0 0 0 0 - -
Seriously Injured 0.2 0 1 0 0 0 1 0 1 0 - -
KSI 0.2 0 1 0 0 0 1 0 1 0 - -
Slightly Injured 4.8 6 6 8 2 2 0 5 3 2 - -
Total 5.0 6 7 8 2 2 1 5 4 2 - -

HA Publication PR67/14 App 33
Table C-9 Pedestrian casualties by age group, severity and year
Casualties age group Casualty Severity
2005-2009 BSL
average 2005 2006 2007 2008 2009 2010 2011 2012 2013
2013 per cent change from BSL
average
2013 per cent change from
2012
Children (0-15) Killed 2.4 1 1 5 2 3 2 1 0 2 - -
Seriously Injured 8.4 10 11 5 10 6 9 7 5 3 - -
KSI 10.8 11 12 10 12 9 11 8 5 5 - -
Slightly Injured 19.4 18 14 29 15 21 20 14 8 10 -48.5 -
Total 30.2 29 26 39 27 30 31 22 13 15 -50.3 -
Young (16-19) Killed 5.4 2 10 8 5 2 3 1 1 3 - -
Seriously Injured 7.2 13 4 6 8 5 11 4 4 6 - -
KSI 12.6 15 14 14 13 7 14 5 5 9 - -
Slightly Injured 9.6 13 6 9 10 10 3 5 9 10 - -
Total 22.2 28 20 23 23 17 17 10 14 19 -14.4 -
Other (20-59) Killed 30.6 33 27 34 34 25 34 24 26 28 -8.5 7.7
Seriously Injured 39.0 32 35 37 45 46 33 40 28 35 -10.3 25.0
KSI 69.6 65 62 71 79 71 67 64 54 63 -9.5 16.7
Slightly Injured 67.0 69 60 66 80 60 61 57 41 67 0.0 63.4
Total 136.6 134 122 137 159 131 128 121 95 130 -4.8 36.8
Older (60-69) Killed 3.2 3 2 5 3 3 2 4 5 0 - -
Seriously Injured 2.6 5 0 3 1 4 6 3 4 3 - -
KSI 5.8 8 2 8 4 7 8 7 9 3 - -
Slightly Injured 4.0 3 5 4 6 2 5 6 1 1 - -
Total 9.8 11 7 12 10 9 13 13 10 4 - -
Elderly (70+) Killed 4.6 5 5 10 1 2 1 6 4 5 - -
Seriously Injured 5.0 6 3 9 6 1 5 3 5 5 - -
KSI 9.6 11 8 19 7 3 6 9 9 10 - -
Slightly Injured 4.6 6 2 5 5 5 2 5 6 2 - -
Total 14.2 17 10 24 12 8 8 14 15 12 - -20.0
Unknown Killed 0.2 0 1 0 0 0 0 0 0 0 - -
Seriously Injured 0.4 1 0 0 1 0 0 1 0 0 - -
KSI 0.6 1 1 0 1 0 0 1 0 0 - -
Slightly Injured 2.6 3 3 2 1 4 2 1 1 3 - -
Total 3.2 4 4 2 2 4 2 2 1 3 - -

HA Publication PR67/14 App 34
Table C-10 PTW casualties by age group, severity and year
Casualties age group Casualty Severity
2005-2009 BSL
average 2005 2006 2007 2008 2009 2010 2011 2012 2013
2013 per cent change from BSL
average
2013 per cent change from
2012
Children (0-15) Killed 0.2 0 0 1 0 0 0 0 0 0 - -
Seriously Injured 0.8 2 0 1 1 0 1 1 0 0 - -
KSI 1.0 2 0 2 1 0 1 1 0 0 - -
Slightly Injured 4.0 7 4 2 4 3 1 3 6 1 - -
Total 5.0 9 4 4 5 3 2 4 6 1 - -
Young (16-19) Killed 2.6 2 3 2 3 3 0 1 0 4 - -
Seriously Injured 21.8 28 24 25 22 10 12 29 11 20 -8.3 -
KSI 24.4 30 27 27 25 13 12 30 11 24 -1.6 -
Slightly Injured 74.2 84 73 83 66 65 36 80 57 57 -23.2 0.0
Total 98.6 114 100 110 91 78 48 110 68 81 -17.8 19.1
Other (20-59) Killed 37.8 49 40 32 47 21 25 17 22 30 -20.6 36.4
Seriously Injured 288.4 304 298 309 268 263 236 255 237 230 -20.2 -3.0
KSI 326.2 353 338 341 315 284 261 272 259 260 -20.3 0.4
Slightly Injured 545.6 585 531 600 517 495 476 474 423 425 -22.1 0.5
Total 871.8 938 869 941 832 779 737 746 682 685 -21.4 0.4
Older (60-69) Killed 1.8 1 1 2 2 3 5 2 0 2 - -
Seriously Injured 14.6 11 11 15 14 22 19 19 20 22 - 10.0
KSI 16.4 12 12 17 16 25 24 21 20 24 46.3 20.0
Slightly Injured 17.6 13 15 18 20 22 38 34 22 34 93.2 54.5
Total 34.0 25 27 35 36 47 62 55 42 58 70.6 38.1
Elderly (70+) Killed 1.6 3 2 2 0 1 0 3 1 1 - -
Seriously Injured 3.4 4 2 4 5 2 2 2 4 3 - -
KSI 5.0 7 4 6 5 3 2 5 5 4 - -
Slightly Injured 3.6 3 5 3 3 4 4 6 5 9 - -
Total 8.6 10 9 9 8 7 6 11 10 13 - -
Unknown Killed 0.0 0 0 0 0 0 0 0 0 0 - -
Seriously Injured 1.4 3 3 0 1 0 3 1 0 2 - -
KSI 1.4 3 3 0 1 0 3 1 0 2 - -
Slightly Injured 6.2 10 7 6 6 2 4 3 4 6 - -
Total 7.6 13 10 6 7 2 7 4 4 8 - -

HA Publication PR67/14 App 35
Table C-11 Casualties from vehicles hitting objects off carriageway, 2013
Object hit off carriageway Number of
vehicles Killed Seriously Injured Slightly Injured Total
casualties Percentage of
total casualties
Central crash barrier 1,166 16 126 1,319 1,461 9.1
Near/Offside crash barrier 744 29 108 855 992 6.2
Tree 331 21 88 352 461 2.9
Other permanent object 256 10 54 271 335 2.1
Entered ditch 171 2 29 193 224 1.4
Road sign or traffic signal 198 4 27 214 245 1.5
Wall or fence 76 3 25 90 118 0.7
Lamp post 96 4 15 107 126 0.8
Telegraph or electricity pole 7 0 2 9 11 0.1
Submerged in water 3 0 1 3 4 0.0
Bus stop or bus shelter 3 0 0 3 3 0.0
Object hit off carriageway total 3,051 89 475 3,416 3,980 24.7
No object hit 9,607 155 990 10,969 12,114 75.3
Total 12,658 244 1,465 14,385 16,094 100.0
Notes: (a) Casualties includes pedestrians. (b) Ranked same as Table C-12 (see below).
Table C-12 KSI casualties from vehicles hitting objects off carriageway by year
Object hit off carriageway
2005-2009 BSL
average 2005 2006 2007 2008 2009 2010 2011 2012 2013
2013 per cent change from BSL
average
2013 per cent change from
2012
Central crash barrier 226.0 270 225 225 217 193 196 148 162 142 -37.2 -12.3
Near/Offside crash barrier 194.4 233 195 214 157 173 159 162 145 137 -29.5 -5.5
Tree 159.2 190 163 155 158 130 114 142 108 109 -31.5 0.9
Other permanent object 128.6 164 144 138 113 84 105 99 78 64 -50.2 -17.9
Entered ditch 89.0 98 92 99 85 71 55 49 43 31 -65.2 -27.9
Road sign or traffic signal 70.6 90 77 65 61 60 36 47 41 31 -56.1 -24.4
Wall or fence 0.0 0 0 0 0 0 0 4 7 28 - -
Lamp post 46.8 56 56 52 37 33 34 18 25 19 -59.4 -24.0
Telegraph or electricity pole 4.8 8 7 5 3 1 2 2 4 2 - -
Submerged in water 1.6 4 0 2 0 2 0 0 0 1 - -
Bus stop or bus shelter 0.2 0 1 0 0 0 0 0 1 0 - -
Object hit off carriageway total 921.2 1,113 960 955 831 747 701 671 614 564 -38.8 -8.1
No object hit 1,400.0 1,578 1,480 1,450 1,272 1,220 1,185 1,158 1,082 1,145 -18.2 5.8
Total 2,321.2 2,691 2,440 2,405 2,103 1,967 1,886 1,829 1,696 1,709 -26.4 0.8
Notes: (a) Casualties includes pedestrians. (b) Ranked by 2013.

HA Publication PR67/14 App 36
Table C-13 Casualties from vehicles hitting objects on carriageway, 2013
Object hit off carriageway Number of
vehicles Killed Seriously
Injured Slightly Injured Total
casualties Percentage of
total casualties
Kerb 203 4 38 222 264 1.6
Parked vehicle 80 10 16 70 96 0.6
Bollard or refuge 106 0 15 133 148 0.9
Other object 77 2 6 89 97 0.6
Road works 20 1 6 16 23 0.1
Previous accident 18 2 4 18 24 0.1
Bridge (side) 15 0 5 17 22 0.1
Any animal (except ridden horse) 29 0 4 33 37 0.2
Central island of roundabout 19 0 3 19 22 0.1
Bridge (roof) 1 0 1 2 3 0.0
Open door of vehicle 0 0 0 0 0 0.0
Object hit on carriageway total 568 19 98 619 736 4.6
No object hit 12,090 225 1,367 13,766 15,358 95.4
Total 12,658 244 1,465 14,385 16,094 100.0
Notes: (a) Casualties includes pedestrians. (b) Ranked same as Table C-14 (see below).
Table C-14 KSI casualties from vehicles hitting objects on carriageway by year
Object hit off carriageway
2005-2009 BSL
average 2005 2006 2007 2008 2009 2010 2011 2012 2013
2013 per cent change from BSL
average
2013 per cent change from
2012
Kerb 65.2 75 71 69 60 51 36 50 33 42 -35.6 27.3
Parked vehicle 35.4 42 40 34 33 28 22 19 21 26 -26.6 23.8
Bollard or refuge 24.0 31 23 20 23 23 18 26 25 15 -37.5 -40.0
Other object 19.0 21 17 15 24 18 10 15 9 8 -57.9 -
Road works 8.4 9 9 5 8 11 10 3 2 7 - -
Previous accident 9.6 11 7 10 11 9 7 3 4 6 - -
Bridge (side) 6.4 8 6 8 8 2 5 5 7 5 - -
Any animal (except ridden horse) 7.4 9 4 10 5 9 4 5 9 4 - -
Central island of roundabout 8.8 10 6 8 11 9 7 6 6 3 - -
Bridge (roof) 0.4 0 2 0 0 0 4 0 0 1 - -
Open door of vehicle 0.4 2 0 0 0 0 0 0 0 0 - -
Object hit on carriageway total 185.0 218 185 179 183 160 123 132 116 117 -36.8 0.9
None 2,136.2 2473 2255 2226 1920 1807 1763 1697 1580 1592 -25.5 0.8
Total 2,321.2 2,691 2,440 2,405 2,103 1,967 1,886 1,829 1,696 1,709 -26.4 0.8
Notes: (a) Casualties includes pedestrians. (b) Ranked by 2013.
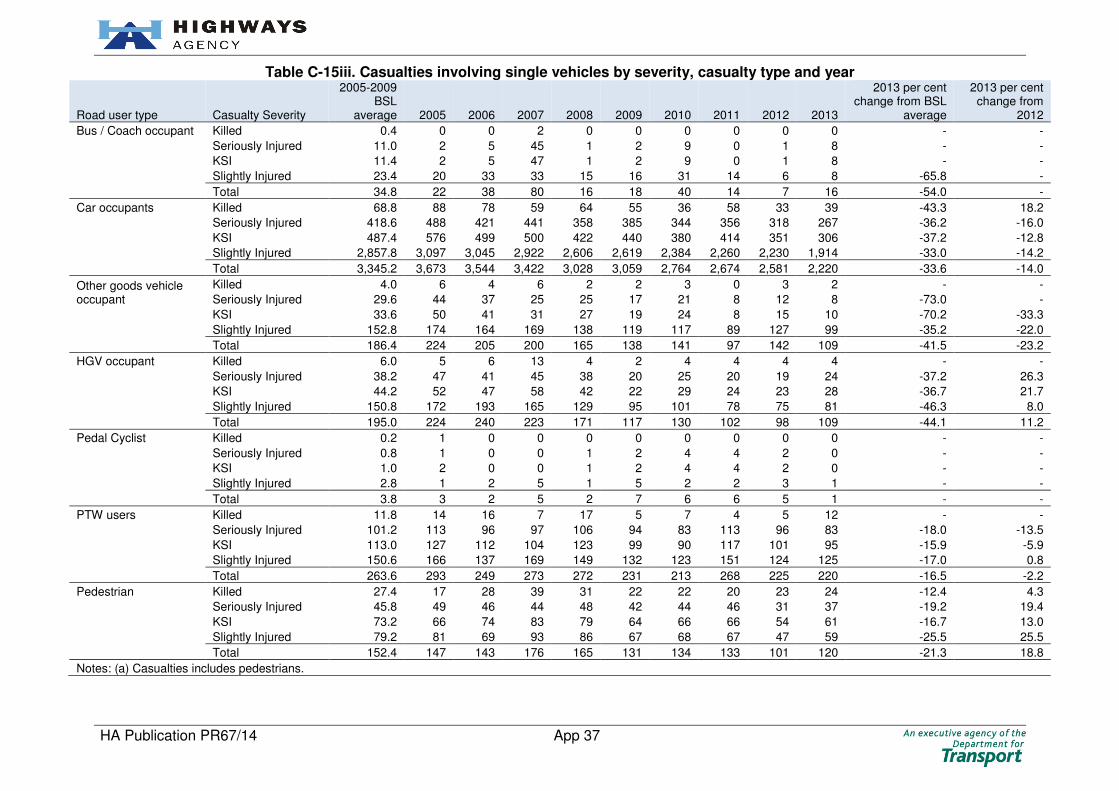
HA Publication PR67/14 App 37
Table C-15iii. Casualties involving single vehicles by severity, casualty type and year
Road user type Casualty Severity
2005-2009 BSL
average 2005 2006 2007 2008 2009 2010 2011 2012 2013
2013 per cent change from BSL
average
2013 per cent change from
2012
Bus / Coach occupant Killed 0.4 0 0 2 0 0 0 0 0 0 - -
Seriously Injured 11.0 2 5 45 1 2 9 0 1 8 - -
KSI 11.4 2 5 47 1 2 9 0 1 8 - -
Slightly Injured 23.4 20 33 33 15 16 31 14 6 8 -65.8 -
Total 34.8 22 38 80 16 18 40 14 7 16 -54.0 -
Car occupants Killed 68.8 88 78 59 64 55 36 58 33 39 -43.3 18.2
Seriously Injured 418.6 488 421 441 358 385 344 356 318 267 -36.2 -16.0
KSI 487.4 576 499 500 422 440 380 414 351 306 -37.2 -12.8
Slightly Injured 2,857.8 3,097 3,045 2,922 2,606 2,619 2,384 2,260 2,230 1,914 -33.0 -14.2
Total 3,345.2 3,673 3,544 3,422 3,028 3,059 2,764 2,674 2,581 2,220 -33.6 -14.0
Other goods vehicle occupant
Killed 4.0 6 4 6 2 2 3 0 3 2 - -
Seriously Injured 29.6 44 37 25 25 17 21 8 12 8 -73.0 -
KSI 33.6 50 41 31 27 19 24 8 15 10 -70.2 -33.3
Slightly Injured 152.8 174 164 169 138 119 117 89 127 99 -35.2 -22.0
Total 186.4 224 205 200 165 138 141 97 142 109 -41.5 -23.2
HGV occupant Killed 6.0 5 6 13 4 2 4 4 4 4 - -
Seriously Injured 38.2 47 41 45 38 20 25 20 19 24 -37.2 26.3
KSI 44.2 52 47 58 42 22 29 24 23 28 -36.7 21.7
Slightly Injured 150.8 172 193 165 129 95 101 78 75 81 -46.3 8.0
Total 195.0 224 240 223 171 117 130 102 98 109 -44.1 11.2
Pedal Cyclist Killed 0.2 1 0 0 0 0 0 0 0 0 - -
Seriously Injured 0.8 1 0 0 1 2 4 4 2 0 - -
KSI 1.0 2 0 0 1 2 4 4 2 0 - -
Slightly Injured 2.8 1 2 5 1 5 2 2 3 1 - -
Total 3.8 3 2 5 2 7 6 6 5 1 - -
PTW users Killed 11.8 14 16 7 17 5 7 4 5 12 - -
Seriously Injured 101.2 113 96 97 106 94 83 113 96 83 -18.0 -13.5
KSI 113.0 127 112 104 123 99 90 117 101 95 -15.9 -5.9
Slightly Injured 150.6 166 137 169 149 132 123 151 124 125 -17.0 0.8
Total 263.6 293 249 273 272 231 213 268 225 220 -16.5 -2.2
Pedestrian Killed 27.4 17 28 39 31 22 22 20 23 24 -12.4 4.3
Seriously Injured 45.8 49 46 44 48 42 44 46 31 37 -19.2 19.4
KSI 73.2 66 74 83 79 64 66 66 54 61 -16.7 13.0
Slightly Injured 79.2 81 69 93 86 67 68 67 47 59 -25.5 25.5
Total 152.4 147 143 176 165 131 134 133 101 120 -21.3 18.8
Notes: (a) Casualties includes pedestrians.

HA Publication PR67/14 App 38
Table C-15iv. Casualties involving single vehicles by severity, casualty type and year (Contd.)
Road user type Casualty Severity
2005-2009 BSL
average 2005 2006 2007 2008 2009 2010 2011 2012 2013
2013 per cent change from BSL
average
2013 per cent change from
2012
Other/Unknown Killed 0.2 1 0 0 0 0 0 1 0 1 - -
Seriously Injured 1.2 0 1 4 1 0 0 1 1 5 - -
KSI 1.4 1 1 4 1 0 0 2 1 6 - -
Slightly Injured 20.6 22 19 27 22 13 13 8 19 12 -41.7 -36.8
Total 22.0 23 20 31 23 13 13 10 20 18 -18.2 -10.0
Notes: (a) Casualties includes pedestrians.
Table C-16i. Casualties involving heavy goods vehicles by severity, casualty type and year
Road user type Casualty Severity
2005-2009 BSL
average 2005 2006 2007 2008 2009 2010 2011 2012 2013
2013 per cent change from BSL
average
2013 per cent change from
2012
Bus / Coach occupant Killed 0.2 0 0 1 0 0 0 1 1 1 - -
Seriously Injured 1.2 0 2 2 2 0 1 8 2 30 - -
KSI 1.4 0 2 3 2 0 1 9 3 31 - -
Slightly Injured 52.4 19 35 136 57 15 8 84 58 59 12.6 1.7
Total 53.8 19 37 139 59 15 9 93 61 90 67.3 47.5
Car occupants Killed 70.2 88 91 68 62 42 36 47 37 35 -50.1 -5.4
Seriously Injured 226.4 301 248 216 180 187 197 152 162 175 -22.7 8.0
KSI 296.6 389 339 284 242 229 233 199 199 210 -29.2 5.5
Slightly Injured 2,832.4 3,237 3,096 2,992 2,629 2,208 2,217 2,178 1,962 1,982 -30.0 1.0
Total 3,129.0 3,626 3,435 3,276 2,871 2,437 2,450 2,377 2,161 2,192 -29.9 1.4
Other goods vehicle occupant
Killed 6.2 7 4 8 6 6 4 2 7 7 - -
Seriously Injured 31.6 38 25 35 34 26 17 26 23 22 -30.4 -4.3
KSI 37.8 45 29 43 40 32 21 28 30 29 -23.3 -3.3
Slightly Injured 228.0 276 266 219 205 174 181 169 148 179 -21.5 20.9
Total 265.8 321 295 262 245 206 202 197 178 208 -21.7 16.9
HGV occupant Killed 22.4 33 21 35 16 7 19 16 16 14 -37.5 -12.5
Seriously Injured 122.4 166 135 136 102 73 74 66 67 66 -46.1 -1.5
KSI 144.8 199 156 171 118 80 93 82 83 80 -44.8 -3.6
Slightly Injured 639.2 786 730 712 554 414 453 373 412 382 -40.2 -7.3
Total 784.0 985 886 883 672 494 546 455 495 462 -41.1 -6.7

HA Publication PR67/14 App 39
Table C-16ii. Casualties involving heavy goods vehicles by severity, casualty type and year (Contd.)
Road user type Casualty Severity
2005-2009 BSL
average 2005 2006 2007 2008 2009 2010 2011 2012 2013
2013 per cent change from BSL
average
2013 per cent change from
2012
Pedal Cyclist Killed 2.2 4 1 1 3 2 3 1 5 4 - -
Seriously Injured 6.2 13 6 6 2 4 3 4 7 1 - -
KSI 8.4 17 7 7 5 6 6 5 12 5 - -
Slightly Injured 7.2 10 8 6 8 4 7 8 4 2 - -
Total 15.6 27 15 13 13 10 13 13 16 7 -55.1 -56.3
PTW users Killed 9.0 10 8 11 10 6 6 3 5 8 - -
Seriously Injured 21.0 25 18 25 25 12 14 11 20 25 19.0 25.0
KSI 30.0 35 26 36 35 18 20 14 25 33 10.0 32.0
Slightly Injured 38.4 54 42 49 21 26 29 29 24 37 -3.6 54.2
Total 68.4 89 68 85 56 44 49 43 49 70 2.3 42.9
Pedestrian Killed 16.6 15 17 18 20 13 18 11 16 18 8.4 12.5
Seriously Injured 13.2 11 14 11 17 13 14 10 6 21 - -
KSI 29.8 26 31 29 37 26 32 21 22 39 30.9 77.3
Slightly Injured 16.8 16 14 16 24 14 4 20 3 13 -22.6 -
Total 46.6 42 45 45 61 40 36 41 25 52 11.6 108.0
Other/Unknown Killed 0.6 0 1 1 0 1 0 1 0 2 - -
Seriously Injured 6.6 7 7 8 3 8 3 4 3 9 - -
KSI 7.2 7 8 9 3 9 3 5 3 11 - -
Slightly Injured 17.2 16 13 26 14 17 14 17 15 18 4.7 20.0
Total 24.4 23 21 35 17 26 17 22 18 29 18.9 61.1
Table C-17i. Casualties involving other goods vehicles by severity, casualty type and year
Road user type Casualty Severity
2005-2009 BSL
average 2005 2006 2007 2008 2009 2010 2011 2012 2013
2013 per cent change from BSL
average
2013 per cent change from
2012
Bus / Coach occupant Killed 0.2 0 0 1 0 0 0 0 0 0 - -
Seriously Injured 0.4 0 1 1 0 0 1 2 0 0 - -
KSI 0.6 0 1 2 0 0 1 2 0 0 - -
Slightly Injured 21.4 4 7 79 14 3 5 89 11 11 -48.6 -
Total 22.0 4 8 81 14 3 6 91 11 11 -50.0 -
Car occupants Killed 19.6 24 15 24 22 13 15 19 10 10 -49.0 -
Seriously Injured 98.6 124 120 80 82 87 84 93 83 83 -15.8 0.0
KSI 118.2 148 135 104 104 100 99 112 93 93 -21.3 0.0
Slightly Injured 1,452.8 1,608 1,565 1,370 1,345 1,376 1,257 1,289 1,158 1,188 -18.2 2.6
Total 1,571.0 1,756 1,700 1,474 1,449 1,476 1,356 1,401 1,251 1,281 -18.5 2.4

HA Publication PR67/14 App 40
Table C-17ii. Casualties involving other goods vehicles by severity, casualty type and year (Contd.)
Road user type Casualty Severity
2005-2009 BSL
average 2005 2006 2007 2008 2009 2010 2011 2012 2013
2013 per cent change from BSL
average
2013 per cent change from
2012
Other goods vehicle occupant
Killed 12.6 13 11 17 10 12 11 5 11 12 - -
Seriously Injured 94.0 109 105 92 82 82 66 57 67 52 -44.7 -22.4
KSI 106.6 122 116 109 92 94 77 62 78 64 -40.0 -17.9
Slightly Injured 930.4 1,027 1,019 916 907 783 739 774 742 719 -22.7 -3.1
Total 1,037.0 1,149 1,135 1,025 999 877 816 836 820 783 -24.5 -4.5
HGV occupant Killed 2.0 1 2 3 3 1 2 5 1 2 - -
Seriously Injured 11.2 21 6 10 11 8 5 4 6 5 - -
KSI 13.2 22 8 13 14 9 7 9 7 7 - -
Slightly Injured 68.0 91 71 61 69 48 49 41 61 54 -20.6 -11.5
Total 81.2 113 79 74 83 57 56 50 68 61 -24.9 -10.3
Pedal Cyclist Killed 0.6 0 1 2 0 0 2 1 0 0 - -
Seriously Injured 3.4 7 3 2 3 2 2 5 4 5 - -
KSI 4.0 7 4 4 3 2 4 6 4 5 - -
Slightly Injured 8.4 8 9 7 5 13 11 7 9 13 - -
Total 12.4 15 13 11 8 15 15 13 13 18 - -
PTW users Killed 4.2 2 3 6 7 3 2 2 5 0 - -
Seriously Injured 20.0 19 24 19 14 24 23 20 17 22 10.0 29.4
KSI 24.2 21 27 25 21 27 25 22 22 22 -9.1 0.0
Slightly Injured 37.6 29 45 39 41 34 32 42 24 29 -22.9 20.8
Total 61.8 50 72 64 62 61 57 64 46 51 -17.5 10.9
Pedestrian Killed 4.0 5 7 3 2 3 10 5 3 4 - -
Seriously Injured 4.0 6 1 3 3 7 7 7 7 8 - -
KSI 8.0 11 8 6 5 10 17 12 10 12 - -
Slightly Injured 11.8 12 14 14 7 12 12 9 12 15 - -
Total 19.8 23 22 20 12 22 29 21 22 27 36.4 22.7
Other/Unknown Killed - 0 0 0 0 0 0 0 0 0 - -
Seriously Injured 1.0 1 2 0 0 2 0 0 0 2 - -
KSI 1.0 1 2 0 0 2 0 0 0 2 - -
Slightly Injured 5.8 6 7 4 5 7 12 8 2 8 - -
Total 6.8 7 9 4 5 9 12 8 2 10 - -
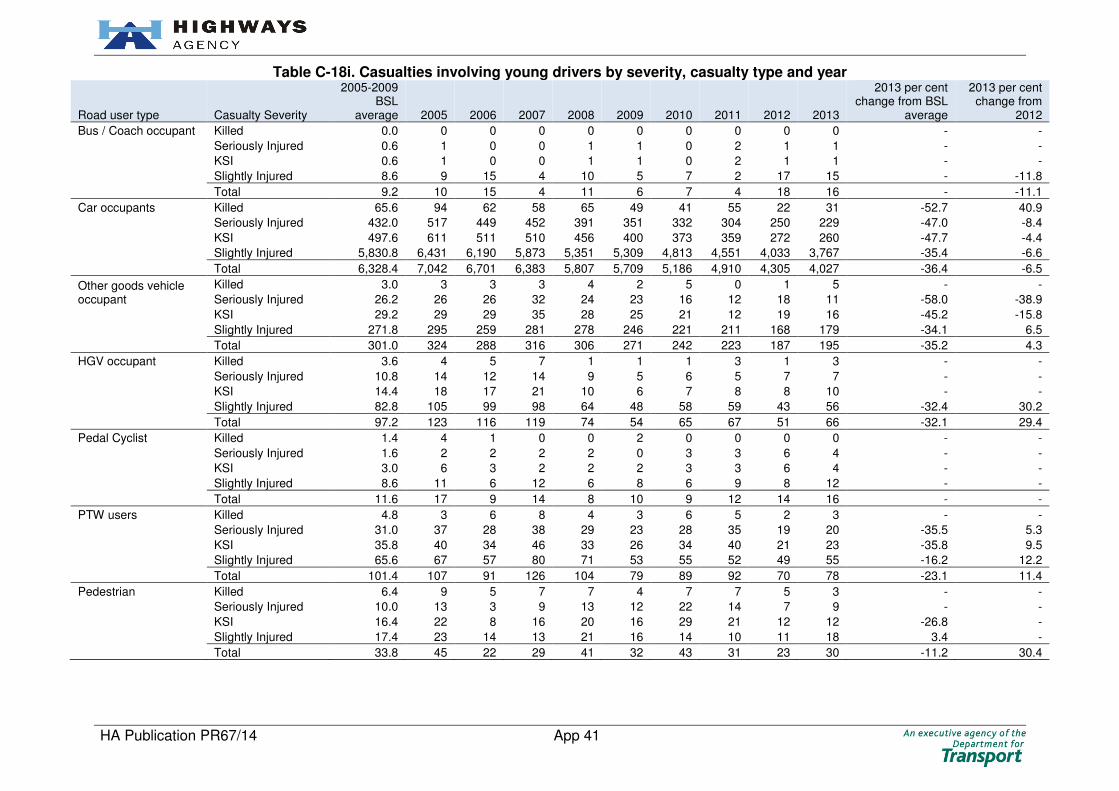
HA Publication PR67/14 App 41
Table C-18i. Casualties involving young drivers by severity, casualty type and year
Road user type Casualty Severity
2005-2009 BSL
average 2005 2006 2007 2008 2009 2010 2011 2012 2013
2013 per cent change from BSL
average
2013 per cent change from
2012
Bus / Coach occupant Killed 0.0 0 0 0 0 0 0 0 0 0 - -
Seriously Injured 0.6 1 0 0 1 1 0 2 1 1 - -
KSI 0.6 1 0 0 1 1 0 2 1 1 - -
Slightly Injured 8.6 9 15 4 10 5 7 2 17 15 - -11.8
Total 9.2 10 15 4 11 6 7 4 18 16 - -11.1
Car occupants Killed 65.6 94 62 58 65 49 41 55 22 31 -52.7 40.9
Seriously Injured 432.0 517 449 452 391 351 332 304 250 229 -47.0 -8.4
KSI 497.6 611 511 510 456 400 373 359 272 260 -47.7 -4.4
Slightly Injured 5,830.8 6,431 6,190 5,873 5,351 5,309 4,813 4,551 4,033 3,767 -35.4 -6.6
Total 6,328.4 7,042 6,701 6,383 5,807 5,709 5,186 4,910 4,305 4,027 -36.4 -6.5
Other goods vehicle occupant
Killed 3.0 3 3 3 4 2 5 0 1 5 - -
Seriously Injured 26.2 26 26 32 24 23 16 12 18 11 -58.0 -38.9
KSI 29.2 29 29 35 28 25 21 12 19 16 -45.2 -15.8
Slightly Injured 271.8 295 259 281 278 246 221 211 168 179 -34.1 6.5
Total 301.0 324 288 316 306 271 242 223 187 195 -35.2 4.3
HGV occupant Killed 3.6 4 5 7 1 1 1 3 1 3 - -
Seriously Injured 10.8 14 12 14 9 5 6 5 7 7 - -
KSI 14.4 18 17 21 10 6 7 8 8 10 - -
Slightly Injured 82.8 105 99 98 64 48 58 59 43 56 -32.4 30.2
Total 97.2 123 116 119 74 54 65 67 51 66 -32.1 29.4
Pedal Cyclist Killed 1.4 4 1 0 0 2 0 0 0 0 - -
Seriously Injured 1.6 2 2 2 2 0 3 3 6 4 - -
KSI 3.0 6 3 2 2 2 3 3 6 4 - -
Slightly Injured 8.6 11 6 12 6 8 6 9 8 12 - -
Total 11.6 17 9 14 8 10 9 12 14 16 - -
PTW users Killed 4.8 3 6 8 4 3 6 5 2 3 - -
Seriously Injured 31.0 37 28 38 29 23 28 35 19 20 -35.5 5.3
KSI 35.8 40 34 46 33 26 34 40 21 23 -35.8 9.5
Slightly Injured 65.6 67 57 80 71 53 55 52 49 55 -16.2 12.2
Total 101.4 107 91 126 104 79 89 92 70 78 -23.1 11.4
Pedestrian Killed 6.4 9 5 7 7 4 7 7 5 3 - -
Seriously Injured 10.0 13 3 9 13 12 22 14 7 9 - -
KSI 16.4 22 8 16 20 16 29 21 12 12 -26.8 -
Slightly Injured 17.4 23 14 13 21 16 14 10 11 18 3.4 -
Total 33.8 45 22 29 41 32 43 31 23 30 -11.2 30.4

HA Publication PR67/14 App 42
Table C-18ii. Casualties involving young drivers by severity, casualty type and year (Contd.)
Road user type Casualty Severity
2005-2009 BSL
average 2005 2006 2007 2008 2009 2010 2011 2012 2013
2013 per cent change from BSL
average
2013 per cent change from
2012
Other/Unknown Killed 0.4 0 0 1 0 1 0 0 0 0 - -
Seriously Injured 2.0 0 2 1 3 4 1 2 1 1 - -
KSI 2.4 0 2 2 3 5 1 2 1 1 - -
Slightly Injured 11.8 7 14 7 15 16 15 12 9 7 - -
Total 14.2 7 16 9 18 21 16 14 10 8 - -
Table C-19i. Casualties involving elderly drivers by severity, casualty type and year
Road user type Casualty Severity
2005-2009 BSL
average 2005 2006 2007 2008 2009 2010 2011 2012 2013
2013 per cent change from BSL
average
2013 per cent change from
2012
Bus / Coach occupant Killed 0.0 0 0 0 0 0 0 0 0 0 - -
Seriously Injured 0.8 0 4 0 0 0 0 2 1 0 - -
KSI 0.8 0 4 0 0 0 0 2 1 0 - -
Slightly Injured 5.8 1 21 1 3 3 4 6 4 0 - -
Total 6.6 1 25 1 3 3 4 8 5 0 - -
Car occupants Killed 26.2 29 23 27 33 19 23 31 32 27 3.1 -15.6
Seriously Injured 122.8 131 139 105 108 131 122 158 104 153 24.6 47.1
KSI 149.0 160 162 132 141 150 145 189 136 180 20.8 32.4
Slightly Injured 1,134.8 1,276 1,114 1,135 1,022 1,127 1,009 1,067 1,019 1,075 -5.3 5.5
Total 1,283.8 1,436 1,276 1,267 1,163 1,277 1,154 1,256 1,155 1,255 -2.2 8.7
Other goods vehicle occupant
Killed 0.4 0 0 0 1 1 1 0 0 2 - -
Seriously Injured 3.6 5 4 2 4 3 0 2 2 3 - -
KSI 4.0 5 4 2 5 4 1 2 2 5 - -
Slightly Injured 30.8 30 25 24 41 34 31 33 37 41 33.1 10.8
Total 34.8 35 29 26 46 38 32 35 39 46 32.2 17.9
HGV occupant Killed 0.8 0 0 4 0 0 0 4 0 0 - -
Seriously Injured 3.0 2 5 2 2 4 2 3 2 2 - -
KSI 3.8 2 5 6 2 4 2 7 2 2 - -
Slightly Injured 18.2 16 13 20 24 18 19 23 22 18 -1.1 -18.2
Total 22.0 18 18 26 26 22 21 30 24 20 -9.1 -16.7

HA Publication PR67/14 App 43
Table C-19ii. Casualties involving elderly drivers by severity, casualty type and year (Contd.)
Road user type Casualty Severity
2005-2009 BSL
average 2005 2006 2007 2008 2009 2010 2011 2012 2013
2013 per cent change from BSL
average
2013 per cent change from
2012
Pedal Cyclist Killed 0.4 0 0 0 0 2 0 0 0 0 - -
Seriously Injured 1.4 1 1 4 0 1 3 3 3 1 - -
KSI 1.8 1 1 4 0 3 3 3 3 1 - -
Slightly Injured 5.4 2 5 6 6 8 8 4 5 6 - -
Total 7.2 3 6 10 6 11 11 7 8 7 - -
PTW users Killed 3.8 5 5 1 5 3 1 2 0 0 - -
Seriously Injured 10.8 9 9 16 8 12 10 6 8 12 - -
KSI 14.6 14 14 17 13 15 11 8 8 12 - -
Slightly Injured 14.4 17 12 15 16 12 18 19 15 16 - 6.7
Total 29.0 31 26 32 29 27 29 27 23 28 -3.4 21.7
Pedestrian Killed 2.0 4 1 2 2 1 0 1 0 2 - -
Seriously Injured 2.0 2 0 3 3 2 1 1 2 3 - -
KSI 4.0 6 1 5 5 3 1 2 2 5 - -
Slightly Injured 3.6 9 3 2 1 3 6 2 4 2 - -
Total 7.6 15 4 7 6 6 7 4 6 7 - -
Other/Unknown Killed 0.2 0 0 0 0 1 0 0 0 0 - -
Seriously Injured 0.4 0 1 0 0 1 0 1 1 0 - -
KSI 0.6 0 1 0 0 2 0 1 1 0 - -
Slightly Injured 2.0 3 3 1 1 2 5 6 1 2 - -
Total 2.6 3 4 1 1 4 5 7 2 2 - -
Table C-20i. Casualties involving towed caravans by severity, casualty type and year
Road user type Casualty Severity
2005-2009 BSL
average 2005 2006 2007 2008 2009 2010 2011 2012 2013
2013 per cent change from BSL
average
2013 per cent change
from2012
Bus / Coach occupant Killed 0.0 0 0 0 0 0 0 0 0 0 - -
Seriously Injured 0.0 0 0 0 0 0 0 0 0 0 - -
KSI 0.0 0 0 0 0 0 0 0 0 0 - -
Slightly Injured 0.6 0 0 0 2 1 0 0 4 0 - -
Total 0.6 0 0 0 2 1 0 0 4 0 - -
Car occupants Killed 1.4 1 1 0 1 4 0 0 0 2 - -
Seriously Injured 7.2 13 5 7 5 6 8 11 5 15 - -
KSI 8.6 14 6 7 6 10 8 11 5 17 - -
Slightly Injured 136.6 179 147 146 114 97 76 118 75 66 -51.7 -12.0
Total 145.2 193 153 153 120 107 84 129 80 83 -42.8 3.8

HA Publication PR67/14 App 44
Table C-20ii. Casualties involving towed caravans by severity, casualty type and year (Contd.)
Road user type Casualty Severity
2005-2009 BSL
average 2005 2006 2007 2008 2009 2010 2011 2012 2013
2013 per cent change from BSL
average
2013 per cent change
from2012
Other goods vehicle occupant
Killed 0.4 0 0 0 2 0 0 0 0 0 - -
Seriously Injured 0.8 2 0 0 0 2 0 0 1 0 - -
KSI 1.2 2 0 0 2 2 0 0 1 0 - -
Slightly Injured 6.2 10 10 2 3 6 7 3 7 5 - -
Total 7.4 12 10 2 5 8 7 3 8 5 - -
HGV occupant Killed 0.0 0 0 0 0 0 0 0 0 0 - -
Seriously Injured 0.4 0 0 1 0 1 0 1 0 0 - -
KSI 0.4 0 0 1 0 1 0 1 0 0 - -
Slightly Injured 3.4 6 3 6 2 0 3 1 1 2 - -
Total 3.8 6 3 7 2 1 3 2 1 2 - -
Pedal Cyclist Killed 0.2 0 1 0 0 0 0 0 0 1 - -
Seriously Injured 0.2 0 0 0 1 0 0 0 1 0 - -
KSI 0.4 0 1 0 1 0 0 0 1 1 - -
Slightly Injured 0.0 0 0 0 0 0 1 0 1 0 - -
Total 0.4 0 1 0 1 0 1 0 2 1 - -
PTW users Killed 0.2 0 1 0 0 0 0 0 0 0 - -
Seriously Injured 0.4 1 1 0 0 0 0 0 1 1 - -
KSI 0.6 1 2 0 0 0 0 0 1 1 - -
Slightly Injured 2.2 1 2 3 0 5 1 1 2 0 - -
Total 2.8 2 4 3 0 5 1 1 3 1 - -
Pedestrian Killed 0.4 0 2 0 0 0 0 0 0 0 - -
Seriously Injured 0.6 0 0 2 0 1 0 0 0 0 - -
KSI 1.0 0 2 2 0 1 0 0 0 0 - -
Slightly Injured 0.6 1 2 0 0 0 1 1 0 0 - -
Total 1.6 1 4 2 0 1 1 1 0 0 - -
Other/Unknown Killed 0.0 0 0 0 0 0 0 0 0 0 - -
Seriously Injured 0.0 0 0 0 0 0 0 0 0 0 - -
KSI 0.0 0 0 0 0 0 0 0 0 0 - -
Slightly Injured 0.6 1 1 1 0 0 0 0 0 0 - -
Total 0.6 1 1 1 0 0 0 0 0 0 - -

HA Publication PR67/14 App 45
Table C-21 Casualties by top 20 road names and year
No. Road name
2005-2009 BSL
average 2005 2006 2007 2008 2009 2010 2011 2012 2013
2013 per cent change from BSL
average
2013 per cent change from
2012
1 M6 1,493.8 1,654 1,627 1,489 1,465 1,234 1,314 1,173 1,070 1,169 -21.7 9.3
2 M1 1,796.0 2,356 1,884 1,850 1,509 1,381 1,355 1,091 1,178 1,096 -39.0 -7.0
3 M25 1,543.0 1,891 1,671 1,554 1,364 1,235 1,250 1,321 1,234 1,037 -32.8 -16.0
4 A1 996.6 1,222 1,106 924 855 876 779 695 565 655 -34.3 15.9
5 M4 749.4 733 904 855 708 547 654 611 627 603 -19.5 -3.8
6 M5 723.0 793 720 792 602 708 505 538 482 430 -40.5 -10.8
7 A38 502.4 568 536 522 438 448 454 446 497 424 -15.6 -14.7
8 A5 457.6 543 481 492 375 397 428 447 413 420 -8.2 1.7
9 A1(M) 444.0 349 468 482 461 460 420 427 359 418 -5.9 16.4
10 A27 460.8 511 499 453 414 427 386 392 350 415 -9.9 18.6
11 M62 702.2 752 739 743 680 597 554 626 423 364 -48.2 -13.9
12 A14 504.0 577 496 520 499 428 445 406 392 351 -30.4 -10.5
13 M3 374.2 379 461 358 344 329 333 357 318 350 -6.5 10.1
14 A46 439.0 455 485 463 413 379 286 314 325 309 -29.6 -4.9
15 A30 351.4 413 366 376 317 285 287 328 310 297 -15.5 -4.2
16 M40 483.2 490 533 551 427 415 437 403 382 291 -39.8 -23.8
17 A47 374.2 415 367 358 360 371 300 301 270 277 -26.0 2.6
18 A2 289.4 314 334 281 254 264 289 282 260 268 -7.4 3.1
19 A12 377.2 459 363 376 350 338 292 324 272 264 -30.0 -2.9
20 A19 354.4 404 390 343 314 321 347 227 298 253 -28.6 -15.1
Notes: (a) Ranks by 2013.

HA Publication PR67/14 App 46
Table C-22 Killed casualties by top 20 road names and year
No. Road name
2005-2009 BSL
average 2005 2006 2007 2008 2009 2010 2011 2012 2013
2013 per cent change from BSL
average
2013 per cent change from
2012
1 A1 19.2 13 22 30 14 17 10 10 14 17 -11.5 -
2 A1(M) 6.2 9 6 4 8 4 7 3 3 14 - -
3 M6 29.2 28 35 24 33 26 12 12 12 12 -58.9 -
4 A30 8.0 7 6 11 11 5 11 1 8 12 - -
5 A47 8.4 15 8 8 5 6 10 14 10 10 - -
6 A5 9.0 13 14 7 6 5 5 8 6 10 - -
7 M1 25.4 36 23 22 24 22 17 15 13 9 -64.6 -
8 A14 9.6 6 15 14 7 6 4 7 13 9 - -
9 M5 10.4 10 10 11 11 10 10 12 9 9 - -
10 A38 9.2 7 12 9 8 10 5 5 8 8 - -
11 A46 8.0 10 10 5 7 8 4 5 6 8 - -
12 A57 7.6 7 7 7 8 9 5 11 3 8 - -
13 A2 2.4 5 3 1 2 1 4 1 1 8 - -
14 A405 25.2 25 25 30 29 17 2 26 13 7 -72.2 -
15 M25 14.6 16 23 18 4 12 8 8 7 7 - -
16 A5103 13.8 12 16 19 18 4 10 7 6 7 - -
17 A690 2.2 4 0 2 2 3 0 9 4 7 - -
18 M48 2.4 6 1 1 0 4 4 6 1 7 - -
19 M40 8.2 7 8 11 7 8 8 3 6 6 - -
20 M62 6.8 6 8 7 7 6 5 3 5 6 - -
Notes: (a) Ranked by 2013.

HA Publication PR67/14 App 47
Table C-23 KSI casualties by top 20 road names and year
No. Road name
2005-2009 BSL
average 2005 2006 2007 2008 2009 2010 2011 2012 2013
2013 per cent change from BSL
average
2013 per cent change from
2012
1 M1 144.2 175 137 146 126 137 131 89 85 81 -43.8 -4.7
2 A1 110.4 126 125 98 93 110 85 78 65 81 -26.6 24.6
3 M6 160.0 174 167 152 179 128 114 126 92 78 -51.3 -15.2
4 M25 116.2 127 139 131 75 109 91 75 71 78 -32.9 9.9
5 M62 53.8 77 59 40 51 42 31 41 38 53 -1.5 39.5
6 A1(M) 47.2 37 48 55 49 47 33 36 28 52 10.2 85.7
7 A27 55.2 56 55 54 52 59 49 57 43 50 -9.4 16.3
8 A5 59.4 83 59 53 47 55 50 54 69 48 -19.2 -30.4
9 M5 58.6 70 49 63 47 64 68 47 53 47 -19.8 -11.3
10 M4 79.2 72 89 120 66 49 64 49 47 47 -40.7 0.0
11 A30 37.6 40 34 47 44 23 39 35 41 43 14.4 4.9
12 A14 66.2 92 64 60 57 58 50 50 54 41 -38.1 -24.1
13 A46 54.8 58 59 55 54 48 25 41 37 40 -27.0 8.1
14 A47 51.2 65 56 50 40 45 53 54 29 39 -23.8 34.5
15 M3 36.2 37 35 40 31 38 30 38 36 38 5.0 5.6
16 M40 56.4 67 51 68 57 39 53 50 51 37 -34.4 -27.5
17 A38 44.4 52 43 47 41 39 36 34 59 36 -18.9 -39.0
18 A34 24.2 14 36 23 24 24 23 22 25 36 48.8 44.0
19 A2 24.4 30 36 27 18 11 22 14 7 36 47.5 -
20 A303 44.0 39 55 51 46 29 53 42 37 33 -25.0 -10.8
Notes: (a) Ranked by 2013.
Table C-24 Casualties involving each collision type by year
Collision Type
2005-2009 BSL
average 2005 2006 2007 2008 2009 2010 2011 2012 2013
2013 per cent change from BSL
average
2013 per cent change from
2012
Head On 651.2 699 683 681 636 557 477 399 403 432 -33.7 7.2
Shunt 9,818.0 10,945 10,720 9,871 8,970 8,584 8,269 8,445 7,719 7,660 -22.0 -0.8
Junction 6,006.8 6,679 6,153 6,165 5,519 5,518 4,916 5,431 5,066 4,525 -24.7 -10.7
Pedestrian 270.8 297 236 291 284 246 243 220 179 289 6.7 61.5
Pedal Cyclist 157.4 189 164 145 149 140 154 176 174 156 -0.9 -10.3
Overtake 1,429.2 1,825 1,518 1,441 1,191 1,171 1,031 875 804 849 -40.6 5.6
Single vehicle run off 3,316.2 3,706 3,477 3,487 2,994 2,917 2,701 2,552 2,491 2,215 -33.2 -11.1
Other 4,265.4 4,679 4,716 4,345 3,911 3,676 3,572 3,274 3,150 3,017 -29.3 -4.2
Note: (a) For definitions of each collision type refer to Appendix A. Casualties may fall within more than one collision type and hence may be counted more than once.

HA Publication PR67/14 App 48
Appendix D: Casualty Rate Statistics Table D-1 to Table D-8 provide breakdowns of traffic and casualties in context of traffic, expressed as a rate of casualties per 100 million
vehicle-miles (MVM).
Table D-1 Total traffic (100 MVM) by top 40 road names and year
No. Road Name
Length (miles) 2010 2011 2012 2013
2013 per cent change from
2012 No. Road Name
Length (miles) 2010 2011 2012 2013
2013 per cent change from
2012
1 M1 198.5 73.18 72.40 74.34 76.75 3.23 21 A30 133.5 11.84 12.03 11.82 11.77 -0.47
2 M6 241.2 73.27 73.94 73.94 74.23 0.39 22 A19 69.0 11.10 11.38 11.49 11.41 -0.66
3 M25 118.2 55.39 55.97 57.96 57.75 -0.36 23 A27 70.2 10.63 10.69 11.06 10.96 -0.88
4 M5 167.6 49.42 49.85 49.44 50.67 2.50 24 A46 111.2 11.79 12.06 11.07 10.88 -1.72
5 M4 118.1 39.86 40.73 40.14 40.00 -0.35 25 A5 136.8 10.18 10.32 10.28 10.35 0.67
6 A1(M) 128.7 29.27 29.91 30.01 30.31 0.99 26 A3 51.2 9.07 9.28 9.45 9.89 4.69
7 M62 96.2 30.57 30.73 29.68 30.00 1.07 27 A47 107.3 8.74 8.71 8.78 8.73 -0.54
8 M40 91.1 27.66 27.54 28.70 28.74 0.16 28 A303 97.0 8.52 8.54 8.62 8.61 -0.11
9 A1 215.3 27.66 28.42 27.74 25.23 -9.04 29 A2 38.8 6.95 7.61 7.62 7.38 -3.17
10 A14 135.5 22.28 22.55 22.54 22.88 1.51 30 A50 44.2 6.97 7.11 7.41 7.28 -1.78
11 M3 61.5 19.77 20.39 19.49 19.86 1.92 31 M61 24.3 6.48 7.04 7.06 7.23 2.39
12 M60 37.3 15.60 15.85 15.97 15.81 -1.00 32 M2 26.6 6.33 6.57 6.55 6.70 2.34
13 A38 114.2 15.92 16.12 16.04 15.79 -1.58 33 M18 29.9 5.60 5.68 6.07 6.22 2.35
14 M42 43.7 15.23 15.46 15.26 15.44 1.20 34 A66 103.0 5.76 5.80 5.82 5.82 -0.04
15 M11 52.1 12.72 13.11 13.25 13.16 -0.68 35 A11 54.8 5.43 5.62 5.75 5.82 1.20
16 A12 65.2 12.41 12.44 12.78 12.91 1.04 36 M23 17.3 5.61 5.67 5.74 5.61 -2.22
17 M56 38.2 12.54 12.89 12.62 12.79 1.32 37 A45 34.5 5.37 5.27 5.39 5.42 0.63
18 A34 63.6 12.42 12.30 11.79 12.14 2.96 38 A64 57.2 5.08 5.25 5.09 5.13 0.87
19 M20 51.4 11.55 11.84 12.01 11.90 -0.90 39 M53 21.3 4.57 4.65 4.53 4.59 1.39
20 M27 33.1 12.01 11.87 12.01 11.84 -1.36 40 M65 21.4 4.30 4.43 4.33 4.57 5.64
Notes: (a) Ranked by 2013. (b) Length is based on 2010 network count points.

HA Publication PR67/14 App 49
Table D-2 Total casualties per 100 MVM by top 40 trafficked roads and year
No. Road Name 2010 2011 2012 2013
2013 per cent change from
2012 2013 casualty
rate ranking No. Road Name 2010 2011 2012 2013
2013 per cent change from
2012 2013 casualty
rate ranking
1 M1 18.52 15.07 15.85 14.28 -9.87 106 21 A30 24.23 27.27 26.23 25.24 -3.75 66
2 M6 17.93 15.87 14.47 15.75 8.83 101 22 A19 31.27 19.94 25.94 22.17 -14.54 76
3 M25 22.57 23.60 21.29 17.96 -15.66 93 23 A27 36.32 36.66 31.66 37.87 19.63 40
4 M5 10.22 10.79 9.75 8.49 -12.96 127 24 A46 24.26 26.04 29.36 28.40 -3.26 55
5 M4 16.41 15.00 15.62 15.08 -3.49 105 25 A5 42.04 43.33 40.19 40.60 1.02 35
6 A1(M) 14.35 14.28 11.96 13.79 15.29 110 26 A3 27.25 31.78 28.26 23.66 -16.28 72
7 M62 18.12 20.37 14.25 12.13 -14.86 115 27 A47 34.31 34.55 30.75 31.72 3.15 48
8 M40 15.80 14.63 13.31 10.12 -23.95 121 28 A303 25.01 22.84 19.14 22.65 18.32 74
9 A1 28.17 24.46 20.37 25.96 27.45 63 29 A2 41.59 37.05 34.11 36.31 6.45 42
10 A14 19.97 18.01 17.39 15.34 -11.79 102 30 A50 24.97 23.05 18.89 25.96 37.45 62
11 M3 16.84 17.51 16.31 17.62 7.99 94 31 M61 18.66 15.34 12.47 9.69 -22.31 123
12 M60 15.77 13.63 11.52 11.96 3.76 116 32 M2 17.05 19.18 21.53 19.39 -9.91 85
13 A38 28.52 27.68 30.98 26.85 -13.32 58 33 M18 21.24 13.91 13.17 15.29 16.02 103
14 M42 8.34 11.06 8.00 9.13 14.21 125 34 A66 33.00 30.19 30.39 31.26 2.86 49
15 M11 11.95 14.87 11.55 11.17 -3.26 119 35 A11 26.17 18.87 28.16 19.58 -30.47 84
16 A12 23.53 26.05 21.28 20.45 -3.94 81 36 M23 22.10 16.92 17.24 19.06 10.53 87
17 M56 14.83 12.64 11.96 15.09 26.15 104 37 A45 19.35 18.22 16.51 18.99 15.01 88
18 A34 13.77 22.28 21.29 18.95 -11.00 89 38 A64 34.82 26.87 27.32 28.64 4.84 54
19 M20 19.40 15.03 21.40 18.57 -13.23 90 39 M53 18.38 14.85 12.81 12.86 0.33 114
20 M27 22.98 15.25 17.74 13.00 -26.70 112 40 M65 26.04 19.65 23.33 20.33 -12.84 83
Notes:(a) Ranked by Table D-1 traffic levels to ensure most trafficked roads reported. (b) 2013 casualty rate ranking reports the overall ranking of the specified road name in comparison to all 142 road names by the 2013 casualty rate. For example, the M1 casualty rate was the 106
th highest out of 142 roads in 2013.

HA Publication PR67/14 App 50
Table D-3 Total casualties per 100 MVM by top 20 motorways and year
Table D-4 Total casualties per 100 MVM by top 20 A-roads and year
No. Road Name 2010 2011 2012 2013
2013 per cent change from
2012 No. Road Name 2010 2011 2012 2013
2013 per cent change from
2012
1 A308(M) 88.65 106.14 35.39 87.50 147.21 1 A59 0.00 172.24 171.01 310.27 81.43
2 M271 69.98 61.50 43.76 54.06 23.55 2 A41 72.09 23.95 302.24 152.62 -49.50
3 M181 16.95 11.38 11.66 51.46 341.47 3 A61 96.04 137.52 84.78 148.16 74.76
4 A38(M) 39.86 0.00 32.05 48.07 49.96 4 A126 0.00 0.00 0.00 130.43 -
5 M602 38.23 25.12 23.49 32.96 40.33 5 A160 41.43 44.83 113.95 112.87 -0.95
6 M606 29.35 35.58 34.70 26.85 -22.62 6 A249 45.16 37.26 35.38 100.62 184.44
7 A3(M) 27.25 24.24 22.56 21.57 -4.40 7 A62 154.71 210.27 293.43 99.99 -65.92
8 M65 26.04 19.65 23.33 20.33 -12.84 8 A585 59.04 68.40 52.35 78.13 49.22
9 M2 17.05 19.18 21.53 19.39 -9.91 9 A458 52.08 52.17 27.04 71.00 162.57
10 A627(M) 53.50 15.46 17.92 19.22 7.24 10 A282 59.43 58.73 62.73 66.80 6.48
11 M23 22.10 16.92 17.24 19.06 10.53 11 A259 78.47 53.25 57.92 66.32 14.52
12 M20 19.40 15.03 21.40 18.57 -13.23 12 A1089 84.67 29.70 51.86 66.26 27.76
13 M621 25.05 19.34 23.86 18.52 -22.37 13 A628 66.15 58.61 82.31 65.36 -20.59
14 M25 22.57 23.60 21.29 17.96 -15.66 14 A631 212.38 195.90 50.02 65.10 30.14
15 M3 16.84 17.51 16.31 17.62 7.99 15 A446 18.05 72.05 57.84 64.20 10.99
16 M180 27.36 10.51 17.96 17.53 -2.39 16 A26 83.40 88.08 69.65 62.59 -10.13
17 M48 9.92 14.65 2.48 17.37 601.44 17 A57 37.35 82.40 22.12 62.31 181.75
18 M26 19.47 11.00 14.23 16.96 19.24 18 A405 17.89 229.09 114.47 59.37 -48.14
19 A404(M) 15.79 14.17 24.52 16.08 -34.40 19 A663 87.58 140.90 53.52 57.32 7.09
20 M6 17.93 15.87 14.47 15.75 8.83 20 A20 76.54 54.81 47.67 56.60 18.73
Notes: (a) Ranked by 2013. (b) Casualty rates on roads with shorter section lengths on the SRN potentially can be skewed by small changes in number of casualties and traffic levels.
Notes: (a) Ranked by 2013. (b) Casualty rates on roads with shorter section lengths on the SRN potentially can be skewed by small changes in number of casualties and traffic levels.

HA Publication PR67/14 App 51
Table D-5 Casualty per 100 MVM by road classification, severity and year
Road Classification Casualty Severity 2010 2011 2012 2013
2013 per cent change from
2012
Motorway Killed 0.20 0.16 0.14 0.16 10.38
Seriously Injured 1.31 1.18 1.04 1.06 2.22
KSI 1.51 1.35 1.18 1.22 3.19
Slightly Injured 15.65 14.48 13.61 12.75 -6.30
Total 17.16 15.83 14.79 13.97 -5.54
A-road Dual Carriageway Killed 0.40 0.44 0.35 0.38 6.73
Seriously Injured 2.72 2.63 2.54 2.25 -11.45
KSI 3.11 3.06 2.89 2.63 -9.23
Slightly Injured 23.82 24.96 22.92 22.52 -1.77
Total 26.94 28.02 25.81 25.14 -2.61
Single Carriageway Killed 0.84 1.03 1.01 1.23 21.54
Seriously Injured 5.19 5.39 5.52 6.11 10.79
KSI 6.03 6.42 6.53 7.34 12.46
Slightly Injured 36.69 35.23 36.45 34.18 -6.23
Total 42.72 41.65 42.98 41.53 -3.39
Notes: (a) Six casualties were located on sections of the reference network that have been downgraded in class (to B or below) since 2010 and hence have been excluded from this table.

HA Publication PR67/14 App 52
Table D-6 KSI casualties per 100 MVM by top 40 trafficked road names and year
No. Road Name 2010 2011 2012 2013
2013 per cent change from
2012
2013 KSI casualty rate
ranking No. Road Name 2010 2011 2012 2013
2013 per cent change from
2012
2013 KSI casualty rate
ranking
1 M1 1.79 1.23 1.14 1.06 -7.69 94 21 A30 3.29 2.91 3.47 3.65 5.37 40
2 M6 1.56 1.70 1.24 1.05 -15.54 95 22 A19 2.61 2.20 2.44 2.54 4.26 55
3 M25 1.64 1.34 1.23 1.35 10.26 86 23 A27 4.61 5.33 3.89 4.56 17.32 29
4 M5 1.38 0.94 1.07 0.93 -13.48 101 24 A46 2.12 3.40 3.34 3.68 10.00 39
5 M4 1.61 1.20 1.17 1.18 0.35 91 25 A5 4.91 5.23 6.71 4.64 -30.89 28
6 A1(M) 1.13 1.20 0.93 1.72 83.89 74 26 A3 3.53 4.20 2.75 2.63 -4.48 53
7 M62 1.01 1.33 1.28 1.77 37.99 73 27 A47 6.06 6.20 3.30 4.47 35.21 30
8 M40 1.92 1.82 1.78 1.29 -27.57 88 28 A303 6.22 4.92 4.29 3.83 -10.71 37
9 A1 3.07 2.74 2.34 3.21 37.00 47 29 A2 3.17 1.84 0.92 4.88 431.11 26
10 A14 2.24 2.22 2.40 1.79 -25.20 71 30 A50 2.01 2.25 1.21 2.06 69.69 66
11 M3 1.52 1.86 1.85 1.91 3.57 69 31 M61 1.54 0.99 1.56 1.52 -2.33 80
12 M60 0.83 1.14 0.56 0.51 -10.21 106 32 M2 1.74 1.22 2.29 1.04 -54.40 97
13 A38 2.26 2.11 3.68 2.28 -38.01 61 33 M18 1.78 0.53 0.16 0.64 290.81 105
14 M42 0.72 0.58 0.52 0.91 72.93 102 34 A66 6.77 5.69 5.67 5.67 0.04 22
15 M11 1.18 1.53 1.36 1.52 11.87 81 35 A11 4.79 3.56 4.35 3.95 -9.09 36
16 A12 3.79 3.78 2.19 2.25 2.51 62 36 M23 2.14 2.29 1.74 1.25 -28.41 89
17 M56 1.04 1.09 0.55 1.41 153.80 84 37 A45 3.91 3.80 3.90 3.32 -14.82 46
18 A34 1.85 1.79 2.12 2.97 39.86 49 38 A64 4.92 4.57 4.91 4.29 -12.76 32
19 M20 1.82 0.93 1.00 1.68 68.17 77 39 M53 0.66 1.29 0.66 0.44 -34.25 107
20 M27 2.08 2.02 1.42 1.01 -28.44 99 40 M65 1.86 2.71 2.31 1.09 -52.67 93
Notes: (a) Ranked by Table D-1 traffic levels to ensure most trafficked roads reported. (b) 2013 KSI casualty rate ranking reports the overall ranking of the specified road name in comparison to all 142 road names by the 2013 KSI casualty rate. For example, the M1 KSI casualty rate was the 94
th highest out of 142 roads in
2013.

HA Publication PR67/14 App 53
Table D-7 KSI casualties per 100 MVM by top 20 motorways and year
Table D-8 KSI casualties per 100 MVM by top 20 A-Roads and year
No. Road Name 2010 2011 2012 2013
2013 per cent change from
2012 No. Road Name 2010 2011 2012 2013
2013 per cent change from
2012
1 M181 0.00 0.00 0.00 11.43 - 1 A59 0.00 0.00 28.50 28.21 -1.04
2 M271 7.24 6.83 2.30 9.01 291.26 2 A446 0.00 0.00 0.00 19.26 -
3 M48 4.96 0.00 0.00 4.96 - 3 A26 12.83 6.29 6.33 18.78 196.57
4 M180 1.00 0.66 1.24 2.42 95.21 4 A57 14.94 0.00 0.00 15.58 -
5 A194(M) 2.30 0.00 0.00 2.24 - 5 A160 8.29 14.94 22.79 15.05 -33.96
6 A3(M) 0.00 1.67 0.78 2.23 186.81 6 A458 6.13 6.14 0.00 14.79 -
7 M26 2.63 0.48 0.98 2.00 103.42 7 A41 12.01 11.97 24.18 12.72 -47.40
8 M3 1.52 1.86 1.85 1.91 3.57 8 A1033 2.36 2.38 0.00 11.89 -
9 M606 0.00 0.00 0.00 1.79 - 9 A21 7.29 9.55 5.15 10.20 98.26
10 M62 1.01 1.33 1.28 1.77 37.99 10 A35 6.15 5.41 7.01 9.19 31.16
11 A1(M) 1.13 1.20 0.93 1.72 83.89 11 A5111 0.00 0.00 0.00 9.01 -
12 M20 1.82 0.93 1.00 1.68 68.17 12 A452 0.00 28.24 0.00 8.93 -
13 M58 1.70 2.34 0.58 1.67 188.29 13 A453 6.99 7.06 13.41 8.92 -33.51
14 M61 1.54 0.99 1.56 1.52 -2.33 14 A249 2.71 2.60 0.86 8.67 905.34
15 M11 1.18 1.53 1.36 1.52 11.87 15 A259 6.61 7.37 10.07 8.40 -16.65
16 M69 0.91 1.20 0.90 1.47 63.52 16 A585 5.27 11.40 3.08 8.12 163.56
17 M56 1.04 1.09 0.55 1.41 153.80 17 A31 4.54 2.89 7.12 7.34 3.10
18 M25 1.64 1.34 1.23 1.35 10.26 18 A36 4.28 7.44 6.76 7.01 3.70
19 M57 4.30 1.34 0.44 1.30 198.07 19 A419 3.22 4.16 0.82 6.33 672.30
20 M40 1.92 1.82 1.78 1.29 -27.57 20 A66 6.77 5.69 5.67 5.67 0.04
Notes: (a) Ranked by 2013. (b) KSI casualty rates on roads with shorter section lengths on the SRN potentially can be skewed by small changes in number of casualties and traffic levels.
Notes: (a) Ranked by 2013. (b) KSI casualty rates on roads with shorter section lengths on the SRN potentially can be skewed by small changes in number of casualties and traffic levels.

HA Publication PR67/14 App 54
Appendix E: Vehicle Statistics Table E-1 and Table E-2 provide breakdowns of the number of vehicles involved in collisions by severity, vehicle type and year. This also
includes KSI casualties by vehicle interaction and year.
Table E-1i. Number of vehicles by vehicle type, collision severity and year
Vehicle type Collision Severity
2005-2009 BSL
average 2005 2006 2007 2008 2009 2010 2011 2012 2013
2013 per cent change from BSL
average
2013 per cent change from
2012
Bus / Coach Fatal 4.4 5 3 6 4 4 4 4 3 2 - -
Serious 14.6 12 21 16 10 14 8 7 15 11 - -33.3
KSI 19.0 17 24 22 14 18 12 11 18 13 -31.6 -29.4
Slight 114.0 132 116 121 110 91 84 96 60 77 -32.5 12.9
Total 133.0 149 140 143 124 109 96 107 78 90 -32.3 8.1
Cars Fatal 440.2 501 494 478 427 301 299 349 249 283 -35.7 6.8
Serious 2,133.8 2,319 2,211 2,189 1,980 1,970 1,871 1,731 1,659 1,744 -18.3 3.7
KSI 2,574.0 2,820 2,705 2,667 2,407 2,271 2,170 2,080 1,908 2,027 -21.3 4.2
Slight 20,474.8 22,798 21,960 20,788 18,803 18,025 16,713 16,060 15,626 14,919 -27.1 -3.1
Total 23,048.8 25,618 24,665 23,455 21,210 20,296 18,883 18,140 17,534 16,946 -26.5 -2.3
Goods vehicle Fatal 43.6 38 40 61 40 39 42 39 32 27 -38.1 -13.2
Serious 199.4 250 221 178 163 185 163 148 157 172 -13.7 6.0
KSI 243.0 288 261 239 203 224 205 187 189 199 -18.1 3.5
Slight 1,628.8 1,738 1,762 1,622 1,585 1,437 1,313 1,337 1,248 1,281 -21.4 1.9
Total 1,871.8 2,026 2,023 1,861 1,788 1,661 1,518 1,524 1,437 1,480 -20.9 2.1
HGV Fatal 153.0 197 172 168 135 93 118 94 110 105 -31.4 -2.5
Serious 441.0 553 468 464 393 327 324 264 284 317 -28.1 6.0
KSI 594.0 750 640 632 528 420 442 358 394 422 -29.0 3.7
Slight 2,786.0 3,261 3,117 3,010 2,479 2,063 2,144 2,036 1,847 1,852 -33.5 0.2
Total 3,380.0 4,011 3,757 3,642 3,007 2,483 2,586 2,394 2,241 2,274 -32.7 0.8
Pedal Cycles Fatal 8.6 13 9 5 7 9 12 5 8 6 - -
Serious 34.4 46 31 33 30 32 43 38 46 30 -12.8 -34.8
KSI 43.0 59 40 38 37 41 55 43 54 36 -16.3 -30.5
Slight 112.8 124 126 106 109 99 103 136 119 119 5.5 0.0
Total 155.8 183 166 144 146 140 158 179 173 155 -0.5 -9.8
PTW Fatal 47.8 58 48 45 57 31 37 28 24 37 -22.6 22.4
Serious 332.6 350 345 354 308 306 272 314 277 270 -18.8 -2.0
KSI 380.4 408 393 399 365 337 309 342 301 307 -19.3 1.5
Slight 630.6 677 617 690 600 569 538 588 499 508 -19.4 1.3
Total 1,011.0 1,085 1,010 1,089 965 906 847 930 800 815 -19.4 1.4
Notes: (a) This table reports the number of vehicles by vehicle type and collision severity.

HA Publication PR67/14 App 55
Table E-1ii. Number of vehicles by vehicle type, collision severity and year (Contd.)
Road user type Collision Severity
2005-2009 BSL
average 2005 2006 2007 2008 2009 2010 2011 2012 2013
2013 per cent change from BSL
average
2013 per cent change from
2012
Other/Unknown Fatal 8.0 5 11 5 10 9 7 7 2 10 - -
Serious 33.4 33 38 29 39 28 27 23 23 32 -4.2 27.3
KSI 41.4 38 49 34 49 37 34 30 25 42 1.4 44.7
Slight 215.6 221 186 247 207 217 161 157 149 115 -46.7 -15.4
Total 257.0 259 235 281 256 254 195 187 174 157 -38.9 -6.6
Total vehicles Fatal 705.6 817 777 768 680 486 519 526 428 470 -33.4 5.1
Serious 3,189.2 3,563 3,335 3,263 2,923 2,862 2,708 2,525 2,461 2,576 -19.2 3.2
KSI 3,894.8 4,380 4,112 4,031 3,603 3,348 3,227 3,051 2,889 3,046 -21.8 3.6
Slight 25,962.6 28,951 27,884 26,584 23,893 22,501 21,056 20,410 19,548 18,871 -27.3 -2.3
Total 29,857.4 33,331 31,996 30,615 27,496 25,849 24,283 23,461 22,437 21,917 -26.6 -1.6
Notes: (a) This table reports the number of vehicles by vehicle type and collision severity.

HA Publication PR67/14 App 56
Table E-2i. KSI casualties by vehicle interaction and year C
olli
sio
n
Typ
e
Combination and number of vehicle types involved in each collision type Number of KSI casualties involved in each collision type
Ca
r
HG
V
PT
W
Oth
er
Oth
er
GV
Pe
da
l
Cycle
2005-2009 BSL
average 2005 2006 2007 2008 2009 2010 2011 2012 2013
2013 per cent change from BSL
average
2013 per cent change
from2012
A 1,281 0 0 0 0 0 1,165.4 1,312 1,200 1,195 1,071 1,049 951 938 839 803 -31.1 -4.3
B 271 215 0 0 0 0 303.6 402 341 309 253 213 236 203 209 224 -26.2 7.2
C 130 0 0 0 89 0 113.8 130 135 111 97 96 107 113 107 97 -14.8 -9.3
D 187 0 155 0 0 0 202.4 224 208 230 179 171 162 175 147 158 -21.9 7.5
E 19 0 0 15 0 0 34.6 37 33 29 43 31 33 26 25 20 -42.2 -20.0
F 0 0 93 0 0 0 122.2 136 122 112 132 109 99 127 108 98 -19.8 -9.3
G 0 101 0 0 0 0 113.4 136 137 131 95 68 76 58 64 77 -32.1 20.3
H 23 22 0 0 14 0 44.6 62 36 43 35 47 27 35 32 17 -61.9 -46.9
I 0 0 0 0 22 0 40.0 57 46 38 28 31 36 16 22 19 -52.5 -13.6
J 0 30 0 0 25 0 35.4 48 29 31 41 28 25 27 21 29 -18.1 38.1
K 21 0 0 0 0 21 26.4 29 23 24 27 29 36 26 35 21 -20.5 -40.0
L 0 13 0 10 0 0 7.6 8 10 12 7 1 6 12 7 38 - -
M 0 15 15 0 0 0 16.6 23 15 16 20 9 14 13 16 16 -3.6 0.0
N 0 0 0 8 0 0 15.8 4 11 51 7 6 11 5 4 15 -5.1 -
O 0 0 14 0 16 0 15.4 14 18 13 15 17 17 14 12 14 -9.1 -
P 5 5 0 5 0 0 6.8 6 5 3 3 17 12 7 3 4 - -
Q 0 4 0 0 0 5 8.2 17 7 6 5 6 4 5 12 5 - -
R 12 12 14 0 0 0 13.0 13 12 17 14 9 3 0 6 14 - -
S 8 0 5 0 5 0 7.2 7 10 8 4 7 5 7 6 5 - -
Notes: (a) Table outlines the vehicle interaction together with the total number of vehicles involved in the collision type in 2013 along with the total KSI casualties by year. For example there were 224 KSI casualties in collisions involving only cars (271) and HGVs (215) in 2013.

HA Publication PR67/14 App 57
Table E-2ii. KSI casualties by vehicle interaction and year (Contd.) C
olli
sio
n
Typ
e
Combination and number of vehicle types involved in each collision type in 2013 Number of KSI casualties involved in each collision type
Ca
r
HG
V
PT
W
Oth
er
Oth
er
GV
Pe
da
l C
ycle
2005-2009 BSL
average 2005 2006 2007 2008 2009 2010 2011 2012 2013
2013 per cent change from BSL
average
2013 per cent change
from2012
T 0 0 0 0 5 5 3.6 6 3 4 3 2 2 6 4 5 - -
U 16 0 0 4 3 0 6.0 5 13 2 7 3 3 0 2 3 - -
V 0 0 0 3 3 0 2.6 0 4 0 1 8 2 4 1 3 - -
W 49 1 2 0 15 0 1.0 0 2 3 0 0 0 0 4 9 - -
X 0 0 0 0 0 2 1.8 3 3 0 1 2 5 4 2 1 - -
Y 0 0 0 1 0 1 1.0 2 1 2 0 0 2 1 2 1 - -
Z 1 2 0 1 1 0 3.2 1 3 6 5 1 0 1 1 3 - -
AA 0 0 4 5 0 0 3.8 5 6 3 3 2 2 2 0 5 - -
AB 0 0 0 0 0 0 0.4 1 1 0 0 0 1 0 0 0 - -
AC 3 0 2 2 0 0 1.6 1 4 0 2 1 3 0 3 2 - -
AD 0 0 1 0 0 1 0.0 0 0 0 0 0 0 2 0 1 - -
AE 0 0 0 0 0 0 0.8 1 0 2 0 1 1 1 1 0 - -
AF 0 0 0 0 0 0 0.8 0 0 1 0 3 0 0 0 0 - -
AG 0 0 0 0 0 0 0.6 0 0 1 2 0 3 1 1 0 - -
AH 0 1 1 0 0 1 0.2 0 0 1 0 0 0 0 0 1 - -
AI 0 0 0 0 0 0 0.4 1 1 0 0 0 0 0 0 0 - -
AJ 0 0 0 0 0 0 0.4 0 1 0 1 0 0 0 0 0 - -
AK 0 0 0 0 0 0 0.0 0 0 0 0 0 1 0 0 0 - -
AL 0 0 0 0 0 0 0.4 0 0 0 2 0 0 0 0 0 - -
AM 1 1 1 1 1 0 0.0 0 0 0 0 0 0 0 0 1 - -
AN 0 0 0 0 0 0 0.2 0 0 1 0 0 1 0 0 0 - -
Notes: (a) Table outlines the vehicle interaction together with the total number of vehicles involved in the collision type in 2013 along with the total KSI casualties by year. For example there were 224 KSI casualties in collisions involving only cars (271) and HGVs (215) in 2013.

HA Publication PR67/14 App 58
Table E-3 Casualties by vehicle interaction and severity in 2013 C
olli
sio
n
Typ
e
Combination of vehicle types involved in each collision type
Total casualties involved in the collision type
Co
llisio
n
Typ
e
Combination of vehicle types involved in each collision type
Total casualties involved in the collision type
Ca
r
HG
V
PT
W
Oth
er
Oth
er
GV
Pe
da
l C
ycle
Killed Seriously
Injured Slightly Injured Total
Ca
r
HG
V
PT
W
Oth
er
Oth
er
GV
Pe
da
l C
ycle
Killed Seriously
Injured Slightly Injured Total
A 12,447 0 0 0 0 0 99 704 9,176 9,979 V 0 0 0 18 18 0 1 2 21 24
B 1,945 1,550 0 0 0 0 44 180 1,963 2,187 W 49 1 2 0 15 0 0 9 61 70
C 1,420 0 0 0 942 0 14 83 1,412 1,509 X 0 0 0 0 0 7 0 1 5 6
D 558 0 475 0 0 0 15 143 393 551 Y 0 0 0 4 0 4 0 1 4 5
E 180 0 0 124 0 0 4 16 203 223 Z 5 4 0 3 4 0 0 3 4 7
F 0 0 213 0 0 0 12 86 134 232 AA 0 0 6 7 0 0 2 3 3 8
G 0 349 0 0 0 0 21 56 192 269 AB 0 0 0 0 0 0 0 0 0 0
H 135 110 0 0 103 0 2 15 155 172 AC 5 0 4 4 0 0 0 2 3 5
I 0 0 0 0 172 0 4 15 156 175 AD 0 0 3 0 0 3 0 1 5 6
J 0 144 0 0 141 0 7 22 147 176 AE 0 1 0 1 1 0 0 0 4 4
K 115 0 0 0 0 112 2 19 93 114 AF 0 0 0 0 0 0 0 0 0 0
L 0 32 0 24 0 0 3 35 79 117 AG 0 0 0 0 0 0 0 0 0 0
M 0 38 38 0 0 0 6 10 27 43 AH 0 1 1 0 0 1 0 1 0 1
N 0 0 0 31 0 0 2 13 27 42 AI 0 1 1 1 0 0 0 0 1 1
O 0 0 40 0 43 0 0 14 28 42 AJ 0 0 0 0 0 0 0 0 0 0
P 20 15 0 15 0 0 0 4 22 26 AK 0 0 0 0 0 0 0 0 0 0
Q 0 6 0 0 0 7 4 1 3 8 AL 0 0 0 0 0 0 0 0 0 0
R 24 20 22 0 0 0 2 12 13 27 AM 1 1 1 1 1 0 0 1 0 1
S 12 0 9 0 9 0 0 5 10 15 AN 1 1 0 0 0 2 0 0 1 1
T 0 0 0 0 18 18 0 5 13 18 AO 1 0 0 1 0 1 0 0 1 1
U 28 0 0 13 13 0 0 3 26 29

HA Publication PR67/14 App 59
Appendix F: Contributory Factor Statistics Appendix F tabulates statistics on all 78 contributory factors and their groupings.
Table F-1i. Contributory factor group classification and codes CF Group I: Road environment contributed
101 Poor or defective road surface 106 Traffic calming (e.g. speed cushions, road humps, chicanes)
102 Deposit on road (e.g. oil, mud, chippings) 107 Temporary road layout (e.g. contraflow)
103 Slippery road (due to weather) 108 Road layout (e.g. bend, hill, narrow carriageway)
104 Inadequate or masked signs or road markings 109 Animal or object in carriageway
105 Defective traffic signals 110 Slippery inspection cover or road marking
CF Group II: Vehicle defect
201 Tyres illegal, defective or under inflated 204 Defective steering or suspension
202 Defective lights or indicators 205 Defective or missing mirrors
203 Defective brakes 206 Overloaded or poorly loaded vehicle or trailer
CF Group III: Injudicious action
301 Disobeyed automatic traffic signal 306 Exceeding speed limit
302 Disobeyed 'Give Way' or 'Stop' sign or markings 307 Travelling too fast for conditions
303 Disobeyed double white lines 308 Following too close
304 Disobeyed pedestrian crossing facility 309 Vehicle travelling along pavement
305 Illegal turn or direction of travel 310 Cyclist entering road from pavement
CF Group IV: Driver/Rider error or reaction
401 Junction overshoot 406 Failed to judge other person’s path or speed
402 Junction restart (moving off at junction) 407 Too close to cyclist, horse rider or pedestrian
403 Poor turn or manoeuvre 408 Sudden braking
404 Failed to signal or misleading signal 409 Swerved
405 Failed to look properly 410 Loss of control
CF Group V: Impairment or distraction
501 Impaired by alcohol 506 Not displaying lights at night or in poor visibility
502 Impaired by drugs (illicit or medicinal) 507 Rider wearing dark clothing
503 Fatigue 508 Driver using mobile phone
504 Uncorrected, defective eyesight 509 Distraction in vehicle
505 Illness or disability, mental or physical 510 Distraction outside vehicle
CF Group VI: Behaviour or inexperience
601 Aggressive driving 605 Learner or inexperienced driver/rider
602 Careless, reckless or in a hurry 606 Inexperience of driving on the left
603 Nervous, uncertain or panic 607 Unfamiliar with model of vehicle
604 Driving too slow for conditions or slow veh (e.g. tractor)
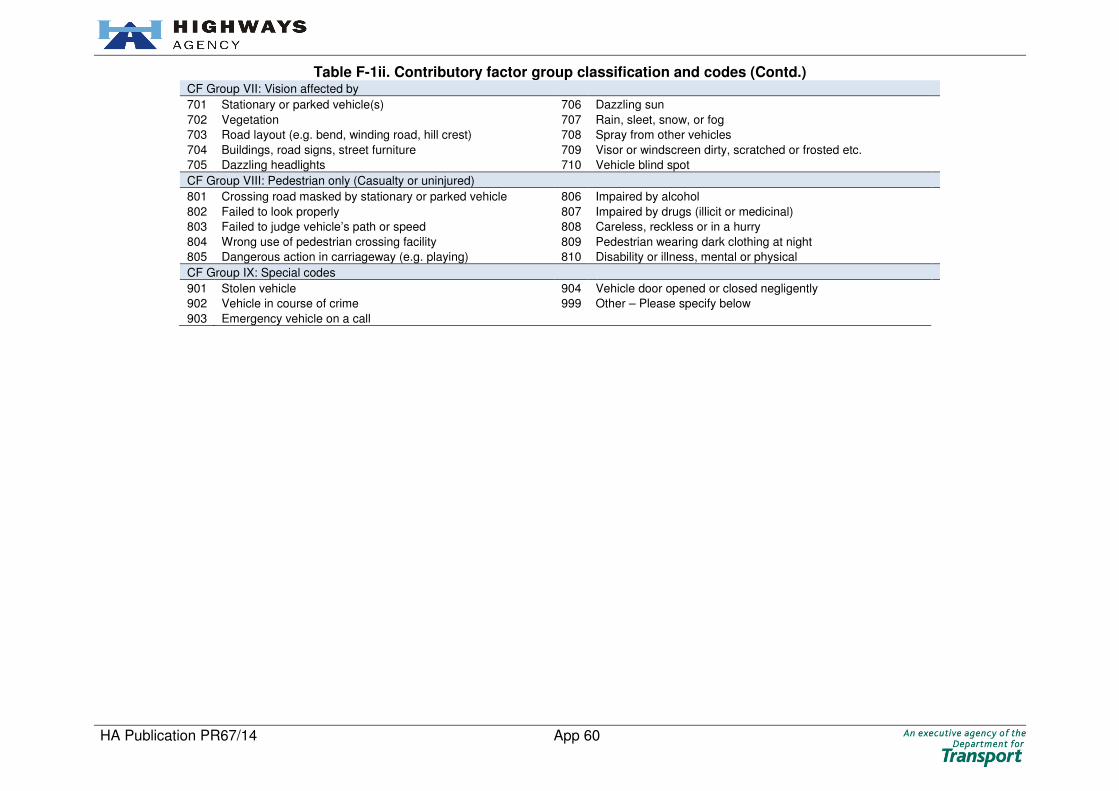
HA Publication PR67/14 App 60
Table F-1ii. Contributory factor group classification and codes (Contd.) CF Group VII: Vision affected by
701 Stationary or parked vehicle(s) 706 Dazzling sun
702 Vegetation 707 Rain, sleet, snow, or fog
703 Road layout (e.g. bend, winding road, hill crest) 708 Spray from other vehicles
704 Buildings, road signs, street furniture 709 Visor or windscreen dirty, scratched or frosted etc.
705 Dazzling headlights 710 Vehicle blind spot
CF Group VIII: Pedestrian only (Casualty or uninjured)
801 Crossing road masked by stationary or parked vehicle 806 Impaired by alcohol
802 Failed to look properly 807 Impaired by drugs (illicit or medicinal)
803 Failed to judge vehicle’s path or speed 808 Careless, reckless or in a hurry
804 Wrong use of pedestrian crossing facility 809 Pedestrian wearing dark clothing at night
805 Dangerous action in carriageway (e.g. playing) 810 Disability or illness, mental or physical
CF Group IX: Special codes
901 Stolen vehicle 904 Vehicle door opened or closed negligently
902 Vehicle in course of crime 999 Other – Please specify below
903 Emergency vehicle on a call
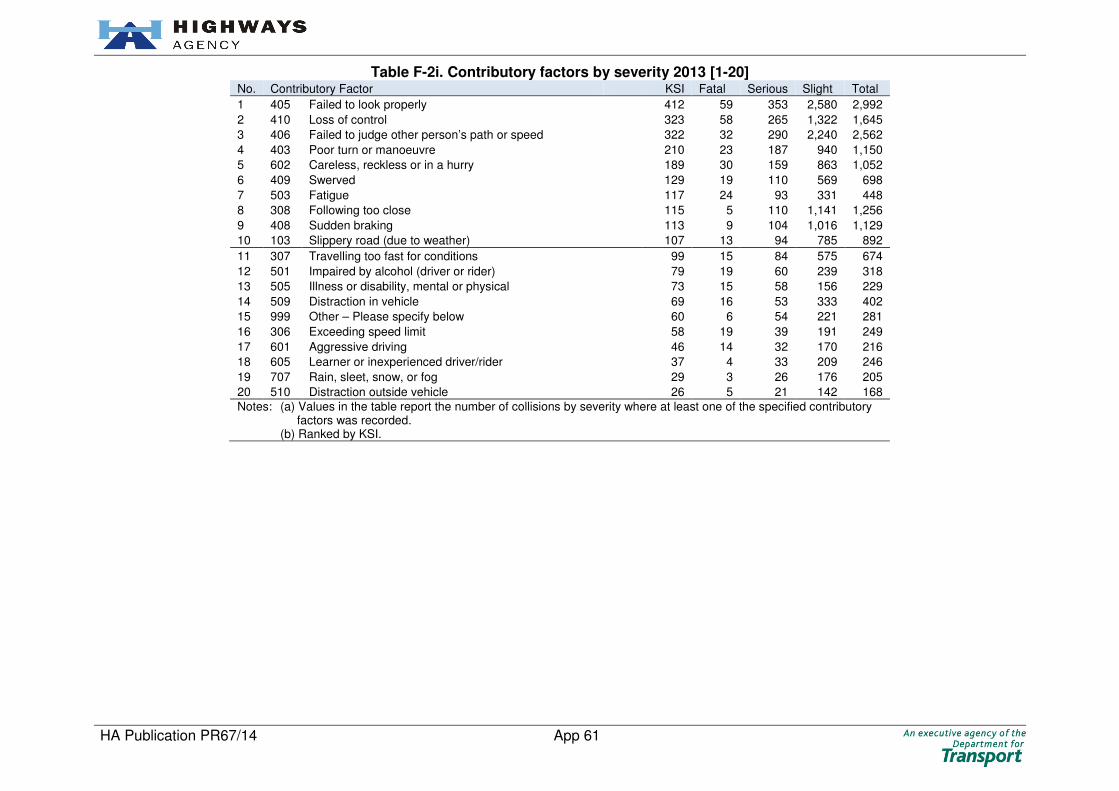
HA Publication PR67/14 App 61
Table F-2i. Contributory factors by severity 2013 [1-20] No. Contributory Factor KSI Fatal Serious Slight Total
1 405 Failed to look properly 412 59 353 2,580 2,992
2 410 Loss of control 323 58 265 1,322 1,645
3 406 Failed to judge other person’s path or speed 322 32 290 2,240 2,562
4 403 Poor turn or manoeuvre 210 23 187 940 1,150
5 602 Careless, reckless or in a hurry 189 30 159 863 1,052
6 409 Swerved 129 19 110 569 698
7 503 Fatigue 117 24 93 331 448
8 308 Following too close 115 5 110 1,141 1,256
9 408 Sudden braking 113 9 104 1,016 1,129
10 103 Slippery road (due to weather) 107 13 94 785 892
11 307 Travelling too fast for conditions 99 15 84 575 674
12 501 Impaired by alcohol (driver or rider) 79 19 60 239 318
13 505 Illness or disability, mental or physical 73 15 58 156 229
14 509 Distraction in vehicle 69 16 53 333 402
15 999 Other – Please specify below 60 6 54 221 281
16 306 Exceeding speed limit 58 19 39 191 249
17 601 Aggressive driving 46 14 32 170 216
18 605 Learner or inexperienced driver/rider 37 4 33 209 246
19 707 Rain, sleet, snow, or fog 29 3 26 176 205
20 510 Distraction outside vehicle 26 5 21 142 168
Notes: (a) Values in the table report the number of collisions by severity where at least one of the specified contributory factors was recorded.
(b) Ranked by KSI.

HA Publication PR67/14 App 62
Table F-2ii. Contributory factors by severity 2013 [21-50] (Contd.) No. Contributory Factor KSI Fatal Serious Slight Total
21 201 Tyres illegal, defective or under inflated 26 2 24 132 158
22 706 Dazzling sun 23 4 19 122 145
23 404 Failed to signal or misleading signal 23 0 23 115 138
24 603 Nervous, uncertain or panic 21 3 18 148 169
25 401 Junction overshoot 20 3 17 82 102
26 802 Failed to look properly 19 9 10 17 36
27 508 Driver using mobile phone 19 7 12 50 69
28 806 Impaired by alcohol (pedestrian) 18 12 6 4 22
29 607 Unfamiliar with model of vehicle 18 5 13 52 70
30 810 Disability or illness, mental or physical 17 10 7 4 21
31 803 Failed to judge vehicle’s path or speed 17 9 8 9 26
32 108 Road layout (e.g. bend, hill, narrow carriageway) 17 2 15 91 108
33 809 Pedestrian wearing dark clothing at night 16 10 6 3 19
34 805 Dangerous action in carriageway (e.g. playing) 16 8 8 4 20
35 102 Deposit on road (e.g. oil, mud, chippings) 15 3 12 44 59
36 502 Impaired by drugs (illicit or medicinal) 14 4 10 25 39
37 109 Animal or object in carriageway 14 1 13 110 124
38 101 Poor or defective road surface 12 0 12 18 30
39 701 Stationary or parked vehicle(s) 11 7 4 36 47
40 302 Disobeyed 'Give Way' or 'Stop' sign or markings 10 1 9 39 49
41 710 Vehicle blind spot 10 0 10 252 262
42 206 Overloaded or poorly loaded vehicle or trailer 10 0 10 51 61
43 808 Careless, reckless or in a hurry 9 4 5 8 17
44 708 Spray from other vehicles 9 0 9 74 83
45 703 Road layout (e.g. bend, winding road, hill crest) 9 0 9 24 33
46 807 Impaired by drugs (illicit or medicinal) 7 3 4 0 7
47 107 Temporary road layout (e.g. contraflow) 7 1 6 39 46
48 901 Stolen vehicle 7 1 6 16 23
49 305 Illegal turn or direction of travel 6 3 3 50 56
50 301 Disobeyed automatic traffic signal 6 1 5 51 57
Notes: (a) Values in the table report the number of collisions by severity where at least one of the specified contributory factors was recorded.
(b) Ranked by KSI.

HA Publication PR67/14 App 63
Table F-2iii. Contributory factors by severity 2013 [51-78] (Contd.) No. Contributory Factor KSI Fatal Serious Slight Total
51 203 Defective brakes 6 0 6 47 53
52 604 Driving too slow for conditions or slow veh (e.g. tractor) 6 0 6 11 17
53 303 Disobeyed double white lines 5 2 3 19 24
54 504 Uncorrected, defective eyesight 5 2 3 13 18
55 204 Defective steering or suspension 5 1 4 41 46
56 506 Not displaying lights at night or in poor visibility 5 1 4 9 14
57 402 Junction restart (moving off at junction) 5 0 5 64 69
58 801 Crossing road masked by stationary or parked vehicle 5 0 5 4 9
59 606 Inexperience of driving on the left 4 1 3 64 68
60 507 Rider wearing dark clothing 4 1 3 4 8
61 407 Too close to cyclist, horse rider or pedestrian 3 2 1 26 29
62 902 Vehicle in course of crime 3 0 3 20 23
63 903 Emergency vehicle on a call 2 1 1 23 25
64 704 Buildings, road signs, street furniture 2 1 1 2 4
65 104 Inadequate or masked signs or road markings 2 0 2 14 16
66 904 Vehicle door opened or closed negligently 2 0 2 2 4
67 804 Wrong use of pedestrian crossing facility 2 0 2 1 3
68 705 Dazzling headlights 1 0 1 11 12
69 202 Defective lights or indicators 1 0 1 6 7
70 105 Defective traffic signals 1 0 1 5 6
71 310 Cyclist entering road from pavement 1 0 1 4 5
72 309 Vehicle travelling along pavement 1 0 1 3 4
73 106 Traffic calming (e.g. speed cushions, road humps, chicanes) 1 0 1 2 3
74 702 Vegetation 1 0 1 2 3
75 304 Disobeyed pedestrian crossing facility 1 0 1 1 2
76 709 Visor or windscreen dirty, scratched or frosted etc. 0 0 0 4 4
77 205 Defective or missing mirrors 0 0 0 0 0
78 110 Slippery inspection cover or road marking 0 0 0 0 0
- No factor recorded 113 25 88 1,249 1,362
Notes: (a) Values in the table report the number of collisions by severity where at least one of the specified contributory factors was recorded.
(b) Ranked by KSI.

HA Publication PR67/14 App 64
Table F-3i. Top 20 contributory factors by severity and year [1-8]
No. Contributory Factor Severity
2005-2009 BSL
average 2005 2006 2007 2008 2009 2010 2011 2012 2013
2013 per cent change from BSL average
2013 per cent change
from 2012
1 405 Failed to look properly Fatal 52.8 65 48 50 53 48 59 40 48 59 11.7 22.9
Serious 370.0 349 402 378 350 371 321 349 334 353 -4.6 5.7
Slight 2,881.8 2,641 3,147 3,076 2,912 2,633 2,859 2,906 3,093 2,580 -10.5 -16.6
Total 3,304.6 3,055 3,597 3,504 3,315 3,052 3,239 3,295 3,475 2,992 -9.5 -13.9
2 410 Loss of control Fatal 91.0 108 113 77 89 68 57 74 50 58 -36.3 16.0
Serious 399.4 476 420 417 346 338 371 309 313 265 -33.7 -15.3
Slight 1,926.0 2,004 2,069 1,968 1,824 1,765 1,661 1,478 1,543 1,322 -31.4 -14.3
Total 2,416.4 2,588 2,602 2,462 2,259 2,171 2,089 1,861 1,906 1,645 -31.9 -13.7
3 406 Failed to judge other person’s path or speed
Fatal 46.0 48 46 50 55 31 35 29 28 32 -30.4 14.3
Serious 304.6 316 341 316 278 272 281 249 258 290 -4.8 12.4
Slight 2,616.2 2,696 2,828 2,748 2,507 2,302 2,390 2,303 2,525 2,240 -14.4 -11.3
Total 2,966.8 3,060 3,215 3,114 2,840 2,605 2,706 2,581 2,811 2,562 -13.6 -8.9
4 602 Careless, reckless or in a hurry Fatal 32.2 40 31 35 31 24 33 18 24 30 -6.8 25.0
Serious 192.2 212 223 211 151 164 181 173 163 159 -17.3 -2.5
Slight 1,139.6 1,202 1,241 1,254 1,062 939 900 974 972 863 -24.3 -11.2
Total 1,364.0 1,454 1,495 1,500 1,244 1,127 1,114 1,165 1,159 1,052 -22.9 -9.2
5 503 Fatigue Fatal 32.6 39 38 31 27 28 28 28 22 24 -26.4 9.1
Serious 122.6 134 128 122 113 116 105 79 100 93 -24.1 -7.0
Slight 452.8 471 505 483 402 403 401 373 370 331 -26.9 -10.5
Total 608.0 644 671 636 542 547 534 480 492 448 -26.3 -8.9
6 403 Poor turn or manoeuvre Fatal 30.4 42 36 26 25 23 27 16 25 23 -24.3 -8.0
Serious 205.6 236 226 212 156 198 162 172 150 187 -9.0 24.7
Slight 1,216.2 1,331 1,336 1,245 1,131 1,038 968 968 1,029 940 -22.7 -8.6
Total 1,452.2 1,609 1,598 1,483 1,312 1,259 1,157 1,156 1,204 1,150 -20.8 -4.5
7 409 Swerved Fatal 27.2 31 31 31 26 17 17 17 21 19 -30.1 -9.5
Serious 132.0 152 126 143 119 120 126 99 112 110 -16.7 -1.8
Slight 772.4 845 826 783 696 712 708 639 614 569 -26.3 -7.3
Total 931.6 1,028 983 957 841 849 851 755 747 698 -25.1 -6.6
8 501 Impaired by alcohol (driver or rider) Fatal 23.0 22 27 20 24 22 13 8 9 19 -17.4 -
Serious 94.8 109 95 98 80 92 87 78 74 60 -36.7 -18.9
Slight 353.2 356 389 385 320 316 262 283 287 239 -32.3 -16.7
Total 471.0 487 511 503 424 430 362 369 370 318 -32.5 -14.1
Notes: (a) Values in the table report the number of collisions by severity where at least one of the specified contributory factors was recorded. (b) Ranked by 2013 fatal.

HA Publication PR67/14 App 65
Table F-3ii. Top 20 contributory factors by severity and year [9-16]
No. Contributory Factor Severity
2005-2009 BSL
average 2005 2006 2007 2008 2009 2010 2011 2012 2013
2013 per cent change from BSL average
2013 per cent change
from 2012
9 306 Exceeding speed limit Fatal 31.6 48 33 26 33 18 17 16 8 19 -39.9 -
Serious 73.8 81 81 82 54 71 67 51 50 39 -47.2 -22.0
Slight 273.4 293 292 296 252 234 213 219 187 191 -30.1 2.1
Total 378.8 422 406 404 339 323 297 286 245 249 -34.3 1.6
10 509 Distraction in vehicle Fatal 12.4 10 14 14 12 12 18 18 9 16 - -
Serious 52.6 52 61 60 47 43 45 54 62 53 0.8 -14.5
Slight 299.0 359 285 301 275 275 270 291 329 333 11.4 1.2
Total 364.0 421 360 375 334 330 333 363 400 402 10.4 0.5
11 505 Illness or disability, mental or physical Fatal 17.2 17 13 28 16 12 10 12 20 15 -12.8 -25.0
Serious 39.8 39 40 33 47 40 41 50 44 58 45.7 31.8
Slight 139.2 125 156 140 133 142 133 160 141 156 12.1 10.6
Total 196.2 181 209 201 196 194 184 222 205 229 16.7 11.7
12 307 Travelling too fast for conditions Fatal 31.6 42 43 29 25 19 20 15 19 15 -52.5 -21.1
Serious 160.0 190 161 164 164 121 126 107 121 84 -47.5 -30.6
Slight 1,099.4 1,281 1,210 1,134 944 928 787 676 776 575 -47.7 -25.9
Total 1,291.0 1,513 1,414 1,327 1,133 1,068 933 798 916 674 -47.8 -26.4
13 601 Aggressive driving Fatal 14.2 19 13 12 20 7 9 6 4 14 - -
Serious 50.4 48 65 51 39 49 42 43 41 32 -36.5 -22.0
Slight 243.0 253 241 255 223 243 188 192 222 170 -30.0 -23.4
Total 307.6 320 319 318 282 299 239 241 267 216 -29.8 -19.1
14 103 Slippery road (due to weather) Fatal 15.4 15 14 14 16 18 12 8 13 13 -15.6 -
Serious 112.8 115 96 116 117 120 141 86 104 94 -16.7 -9.6
Slight 1,021.6 1,025 969 998 1,026 1,090 1,046 664 973 785 -23.2 -19.3
Total 1,149.8 1,155 1,079 1,128 1,159 1,228 1,199 758 1,090 892 -22.4 -18.2
15 806 Impaired by alcohol (pedestrian) Fatal 12.8 6 19 18 13 8 9 8 8 12 - -
Serious 15.0 17 15 12 16 15 10 8 11 6 -60.0 -
Slight 15.2 18 11 16 17 14 16 12 7 4 -73.7 -
Total 43.0 41 45 46 46 37 35 28 26 22 -48.8 -15.4
16 809 Pedestrian wearing dark clothing at night
Fatal 11.0 10 14 15 10 6 8 9 13 10 - -
Serious 9.0 12 7 9 10 7 5 10 6 6 - -
Slight 6.2 7 3 10 4 7 7 5 7 3 - -
Total 26.2 29 24 34 24 20 20 24 26 19 -27.5 -26.9
Notes: (a) Values in the table report the number of collisions by severity where at least one of the specified contributory factors was recorded. (b) Ranked by 2013 fatal.
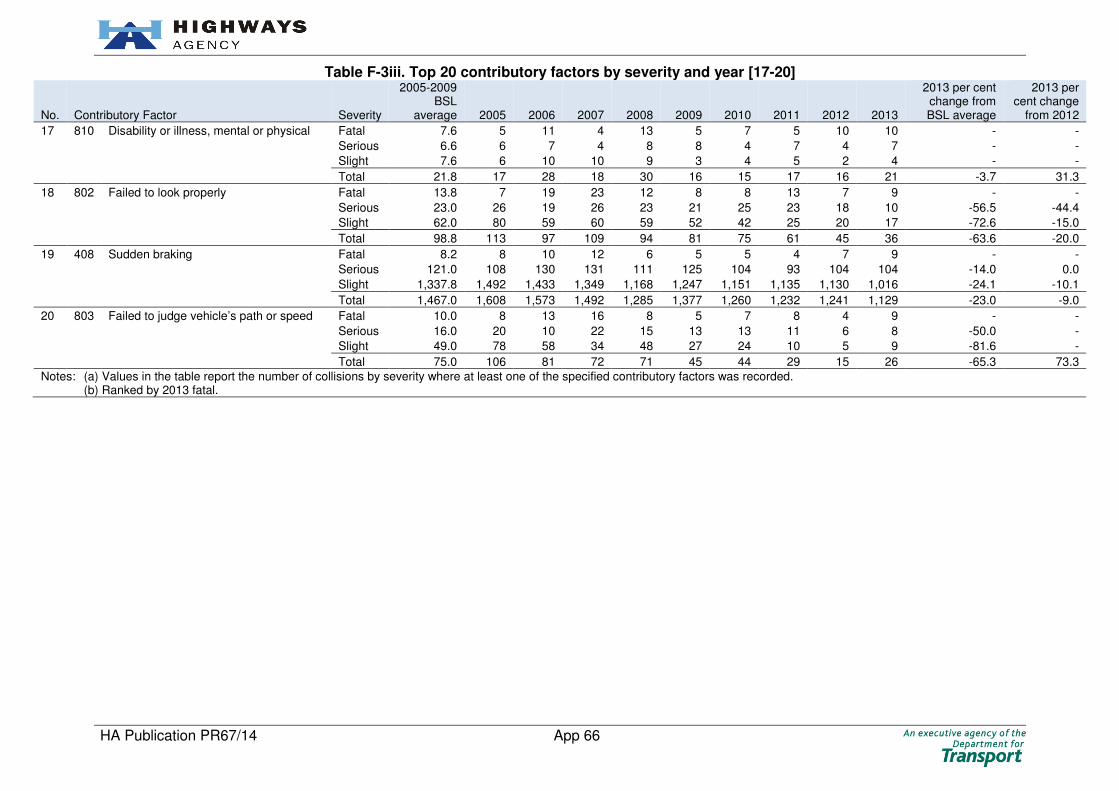
HA Publication PR67/14 App 66
Table F-3iii. Top 20 contributory factors by severity and year [17-20]
No. Contributory Factor Severity
2005-2009 BSL
average 2005 2006 2007 2008 2009 2010 2011 2012 2013
2013 per cent change from BSL average
2013 per cent change
from 2012
17 810 Disability or illness, mental or physical Fatal 7.6 5 11 4 13 5 7 5 10 10 - -
Serious 6.6 6 7 4 8 8 4 7 4 7 - -
Slight 7.6 6 10 10 9 3 4 5 2 4 - -
Total 21.8 17 28 18 30 16 15 17 16 21 -3.7 31.3
18 802 Failed to look properly Fatal 13.8 7 19 23 12 8 8 13 7 9 - -
Serious 23.0 26 19 26 23 21 25 23 18 10 -56.5 -44.4
Slight 62.0 80 59 60 59 52 42 25 20 17 -72.6 -15.0
Total 98.8 113 97 109 94 81 75 61 45 36 -63.6 -20.0
19 408 Sudden braking Fatal 8.2 8 10 12 6 5 5 4 7 9 - -
Serious 121.0 108 130 131 111 125 104 93 104 104 -14.0 0.0
Slight 1,337.8 1,492 1,433 1,349 1,168 1,247 1,151 1,135 1,130 1,016 -24.1 -10.1
Total 1,467.0 1,608 1,573 1,492 1,285 1,377 1,260 1,232 1,241 1,129 -23.0 -9.0
20 803 Failed to judge vehicle’s path or speed Fatal 10.0 8 13 16 8 5 7 8 4 9 - -
Serious 16.0 20 10 22 15 13 13 11 6 8 -50.0 -
Slight 49.0 78 58 34 48 27 24 10 5 9 -81.6 -
Total 75.0 106 81 72 71 45 44 29 15 26 -65.3 73.3
Notes: (a) Values in the table report the number of collisions by severity where at least one of the specified contributory factors was recorded. (b) Ranked by 2013 fatal.

HA Publication PR67/14 App 67
Table F-4 Casualties involving drivers or riders impaired by alcohol and/or drugs by road classification, severity and year
Road Classification Collision Severity
2005-2009 BSL
average 2005 2006 2007 2008 2009 2010 2011 2012 2013
2013 per cent change from BSL
average
2013 per cent change from
2012
Motorway - Killed 13.2 16 18 10 11 11 7 2 6 7 - -
Seriously Injured 56.6 52 62 51 55 63 57 37 38 41 -27.6 7.9
KSI 69.8 68 80 61 66 74 64 39 44 48 -31.2 9.1
Slightly Injured 319.0 314 372 376 264 269 232 225 288 193 -39.5 -33.0
Total 388.8 382 452 437 330 343 296 264 332 241 -38.0 -27.4
A-road Dual Carriageway
Built-up Killed 1.0 1 0 0 2 2 0 0 0 0 - -
Seriously Injured 6.4 4 2 2 10 14 1 3 5 0 - -
KSI 7.4 5 2 2 12 16 1 3 5 0 - -
Slightly Injured 21.6 29 16 22 19 22 24 24 18 14 -35.2 -22.2
Total 29.0 34 18 24 31 38 25 27 23 14 -51.7 -39.1
Non Built-up Killed 11.2 11 11 13 15 6 6 5 4 10 - -
Seriously Injured 53.4 73 57 53 52 32 53 38 33 28 -47.6 -15.2
KSI 64.6 84 68 66 67 38 59 43 37 38 -41.2 2.7
Slightly Injured 195.6 224 202 212 182 158 147 152 161 151 -22.8 -6.2
Total 260.2 308 270 278 249 196 206 195 198 189 -27.4 -4.5
A-road Single Carriageway
Built-up Killed 1.6 0 3 1 3 1 0 0 1 0 - -
Seriously Injured 4.2 6 7 1 2 5 1 3 1 2 - -
KSI 5.8 6 10 2 5 6 1 3 2 2 - -
Slightly Injured 20.8 20 32 11 20 21 17 25 10 14 -32.7 -
Total 26.6 26 42 13 25 27 18 28 12 16 -39.8 -
Non Built-up Killed 7.0 6 5 10 4 10 5 6 1 6 - -
Seriously Injured 19.8 26 21 20 16 16 18 20 18 11 -44.4 -38.9
KSI 26.8 32 26 30 20 26 23 26 19 17 -36.6 -10.5
Slightly Injured 69.4 62 82 77 59 67 55 51 42 38 -45.2 -9.5
Total 96.2 94 108 107 79 93 78 77 61 55 -42.8 -9.8

HA Publication PR67/14 App 68
Table F-5 Collision involving drivers or riders impaired by alcohol and/or drugs by road classification, severity and year
Road Classification Collision Severity
2005-2009 BSL
average 2005 2006 2007 2008 2009 2010 2011 2012 2013
2013 per cent change from BSL
average
2013 per cent change from
2012
Motorway - Fatal 11.0 15 15 9 8 8 7 2 5 7 - -
Serious 44.0 36 49 44 42 49 51 37 33 33 -25.0 0.0
KSI 55.0 51 64 53 50 57 58 39 38 40 -27.3 5.3
Slight 188.8 187 213 204 169 171 139 138 154 115 -39.1 -25.3
Total 243.8 238 277 257 219 228 197 177 192 155 -36.4 -19.3
A-road Dual Carriageway
Built-up Fatal 0.8 1 0 0 1 2 0 0 0 0 - -
Serious 3.8 2 2 2 6 7 1 3 4 0 - -
KSI 4.6 3 2 2 7 9 1 3 4 0 - -
Slight 14.4 18 13 16 11 14 18 13 13 12 - -
Total 19.0 21 15 18 18 23 19 16 17 12 -36.8 -29.4
Non Built-up Fatal 8.6 7 10 8 12 6 6 5 4 8 - -
Serious 41.4 60 37 45 35 30 39 32 26 24 -42.0 -7.7
KSI 50.0 67 47 53 47 36 45 37 30 32 -36.0 6.7
Slight 124.2 126 137 142 109 107 85 105 108 97 -21.9 -10.2
Total 174.2 193 184 195 156 143 130 142 138 129 -25.9 -6.5
A-road Single Carriageway
Built-up Fatal 1.2 0 1 1 3 1 0 0 1 0 - -
Serious 3.4 5 5 1 1 5 1 3 1 2 - -
KSI 4.6 5 6 2 4 6 1 3 2 2 - -
Slight 11.0 9 14 8 14 10 10 12 6 6 - -
Total 15.6 14 20 10 18 16 11 15 8 8 -48.7 -
Non Built-up Fatal 6.6 5 5 9 4 10 4 5 1 5 - -
Serious 11.0 13 12 13 9 8 11 10 14 7 - -
KSI 17.6 18 17 22 13 18 15 15 15 12 -31.8 -20.0
Slight 35.6 33 37 41 35 32 28 28 21 24 -32.6 14.3
Total 53.2 51 54 63 48 50 43 43 36 36 -32.3 0.0

HA Publication PR67/14 App 69
Table F-6 Collisions involving drivers or riders impaired by alcohol and/or drugs by top 20 road names and year
No. Road name
2005-2009 BSL
average 2005 2006 2007 2008 2009 2010 2011 2012 2013
2013 per cent change from BSL
average
2013 per cent change from
2012
1 M6 30.0 26 43 29 28 24 19 19 19 19 -36.7 0.0
2 M1 28.8 41 33 23 26 21 35 24 20 18 -37.5 -10.0
3 M4 17.8 12 17 24 18 18 12 15 17 16 -10.1 -5.9
4 M25 26.4 33 23 25 26 25 26 23 27 14 -47.0 -48.1
5 A1 22.2 34 20 22 14 21 16 17 7 14 -36.9 -
6 M5 15.2 23 17 20 11 5 16 5 14 13 -14.5 -
7 A1(M) 8.6 9 10 12 8 4 7 7 8 12 - -
8 A5 10.8 12 14 8 11 9 14 10 9 11 - -
9 A2 8.2 11 10 9 5 6 11 7 5 11 - -
10 A12 12.6 14 19 13 8 9 8 2 13 10 - -
11 M62 14.6 14 14 16 18 11 5 6 11 10 - -
12 A47 10.0 9 11 15 9 6 3 10 8 10 - -
13 A21 4.4 4 3 2 9 4 2 5 5 10 - -
14 A38 11.6 12 6 12 12 16 8 15 13 9 - -
15 M3 12.6 14 14 11 9 15 13 6 9 9 - -
16 M40 12.0 9 15 14 6 16 13 13 12 8 - -
17 A30 7.0 8 6 10 6 5 5 6 10 6 - -
18 A27 12.4 16 16 10 7 13 7 13 8 6 - -
19 A46 10.2 11 14 10 7 9 6 9 7 6 - -
20 A34 6.8 2 8 8 6 10 4 5 8 5 - -
Notes: (a) Ranked by 2013.

HA Publication PR67/14 App 70
Table F-7 Casualties involving drivers or riders fatigued by road classification, severity and year
Road Classification Collision Severity
2005-2009 BSL
average 2005 2006 2007 2008 2009 2010 2011 2012 2013
2013 per cent change from BSL
average
2013 per cent change from
2012
Motorway - Killed 24.4 31 30 23 19 19 15 9 7 13 -46.7 -
Seriously Injured 97.4 105 96 108 87 91 81 63 55 58 -40.5 5.5
KSI 121.8 136 126 131 106 110 96 72 62 71 -41.7 14.5
Slightly Injured 490.4 510 509 508 479 446 412 363 420 323 -34.1 -23.1
Total 612.2 646 635 639 585 556 508 435 482 394 -35.6 -18.3
A-road Dual Carriageway
Built-up Killed 0.2 0 1 0 0 0 0 0 0 0 - -
Seriously Injured 0.6 0 0 0 2 1 3 1 1 0 - -
KSI 0.8 0 1 0 2 1 3 1 1 0 - -
Slightly Injured 6.2 13 1 8 7 2 10 4 7 8 - -
Total 7.0 13 2 8 9 3 13 5 8 8 - -
Non Built-up Killed 8.8 14 11 12 6 1 14 12 8 8 - -
Seriously Injured 43.0 57 49 41 36 32 37 35 41 31 -27.9 -24.4
KSI 51.8 71 60 53 42 33 51 47 49 39 -24.7 -20.4
Slightly Injured 187.6 201 214 189 167 167 161 149 139 141 -24.8 1.4
Total 239.4 272 274 242 209 200 212 196 188 180 -24.8 -4.3
A-road Single Carriageway
Built-up Killed 0.4 0 0 0 1 1 0 0 2 0 - -
Seriously Injured 2.8 2 6 0 5 1 1 1 4 4 - -
KSI 3.2 2 6 0 6 2 1 1 6 4 - -
Slightly Injured 13.2 13 15 11 10 17 14 16 15 27 - 80.0
Total 16.4 15 21 11 16 19 15 17 21 31 89.0 47.6
Non Built-up Killed 4.8 4 4 3 5 8 0 8 8 5 - -
Seriously Injured 18.6 22 10 11 21 29 21 16 31 30 61.3 -3.2
KSI 23.4 26 14 14 26 37 21 24 39 35 49.6 -10.3
Slightly Injured 70.6 99 50 73 50 81 70 61 75 53 -24.9 -29.3
Total 94.0 125 64 87 76 118 91 85 114 88 -6.4 -22.8

HA Publication PR67/14 App 71
Table F-8 Collisions involving drivers or riders fatigued by road classification, severity and year
Road Classification Collision Severity
2005-2009 BSL
average 2005 2006 2007 2008 2009 2010 2011 2012 2013
2013 per cent change from BSL
average
2013 per cent change from
2012
Motorway - Fatal 19.6 23 23 19 15 18 15 9 6 13 -33.7 -
Serious 73.2 73 72 84 67 70 60 51 45 46 -37.2 2.2
KSI 92.8 96 95 103 82 88 75 60 51 59 -36.4 15.7
Slight 280.8 288 315 289 267 245 250 230 240 203 -27.7 -15.4
Total 373.6 384 410 392 349 333 325 290 291 262 -29.9 -10.0
A-road Dual Carriageway
Built-up Fatal 0.2 0 1 0 0 0 0 0 0 0 - -
Serious 0.4 0 0 0 1 1 3 1 1 0 - -
KSI 0.6 0 1 0 1 1 3 1 1 0 - -
Slight 4.2 8 1 6 4 2 4 4 6 6 - -
Total 4.8 8 2 6 5 3 7 5 7 6 - -
Non Built-up Fatal 7.6 12 10 9 6 1 13 12 7 6 - -
Serious 35.6 44 43 31 32 28 28 22 30 27 -24.2 -10.0
KSI 43.2 56 53 40 38 29 41 34 37 33 -23.6 -10.8
Slight 124.2 120 147 138 104 112 104 101 89 88 -29.1 -1.1
Total 167.4 176 200 178 142 141 145 135 126 121 -27.7 -4.0
A-road Single Carriageway
Built-up Fatal 0.4 0 0 0 1 1 0 0 1 0 - -
Serious 1.8 2 4 0 2 1 1 1 3 4 - -
KSI 2.2 2 4 0 3 2 1 1 4 4 - -
Slight 6.8 6 9 7 3 9 10 8 5 9 - -
Total 9.0 8 13 7 6 11 11 9 9 13 - -
Non Built-up Fatal 4.8 4 4 3 5 8 0 7 8 5 - -
Serious 11.6 15 9 7 11 16 13 4 21 16 - -23.8
KSI 16.4 19 13 10 16 24 13 11 29 21 28.0 -27.6
Slight 36.8 49 33 43 24 35 33 30 30 25 -32.1 -16.7
Total 53.2 68 46 53 40 59 46 41 59 46 -13.5 -22.0

HA Publication PR67/14 App 72
Table F-9 Collisions involving drivers or riders fatigued by top 20 road names and year
No. Road name
2005-2009 BSL
average 2005 2006 2007 2008 2009 2010 2011 2012 2013
2013 per cent change from BSL
average
2013 per cent change from
2012
1 M6 54.8 44 67 54 62 47 46 50 46 36 -34.3 -21.7
2 M1 58.0 58 75 62 51 44 54 38 31 34 -41.4 9.7
3 M4 42.0 42 36 51 41 40 37 39 28 33 -21.4 17.9
4 A1(M) 17.4 14 19 16 18 20 15 15 19 27 55.2 42.1
5 M40 33.8 41 34 40 23 31 29 29 28 26 -23.1 -7.1
6 M5 31.2 41 23 28 29 35 22 17 25 23 -26.3 -8.0
7 M25 42.8 46 59 38 36 35 43 27 55 21 -50.9 -61.8
8 M3 18.4 27 16 22 18 9 13 13 8 18 -2.2 -
9 A30 7.2 11 3 7 7 8 11 11 11 15 - -
10 A1 27.4 22 39 27 25 24 22 17 23 12 -56.2 -47.8
11 A14 17.8 22 24 22 13 8 9 20 11 12 -32.6 -
12 A34 12.8 17 15 13 9 10 6 5 8 11 - -
13 A38 8.2 10 6 11 6 8 17 10 7 11 - -
14 A12 10.0 10 9 11 10 10 5 5 8 10 - -
15 M42 3.4 4 5 4 1 3 6 7 3 9 - -
16 A303 12.6 16 14 11 12 10 13 5 11 8 - -
17 A27 7.0 7 5 9 4 10 9 5 6 7 - -
18 A11 3.6 6 2 3 4 3 5 2 4 6 - -
19 A35 2.4 1 3 2 4 2 2 3 2 6 - -
20 A46 7.0 9 7 6 5 8 3 3 6 5 - -
Notes: (a) Ranked by 2013.

HA Publication PR67/14 App 73
Table F-10 Casualties involving drivers or riders exceeding the speed limit by road classification, severity and year
Road Classification Collision Severity
2005-2009 BSL
average 2005 2006 2007 2008 2009 2010 2011 2012 2013
2013 per cent change from BSL
average
2013 per cent change from
2012
Motorway - Killed 13.2 24 13 10 10 9 5 12 5 9 - -
Seriously Injured 39.6 43 44 32 39 40 32 26 23 19 -52.0 -17.4
KSI 52.8 67 57 42 49 49 37 38 28 28 -47.0 0.0
Slightly Injured 223.6 233 301 225 194 165 223 202 119 192 -14.1 61.3
Total 276.4 300 358 267 243 214 260 240 147 220 -20.4 49.7
A-road Dual Carriageway
Built-up Killed 1.0 2 2 0 0 1 0 2 0 0 - -
Seriously Injured 5.6 5 5 4 9 5 2 1 3 1 - -
KSI 6.6 7 7 4 9 6 2 3 3 1 - -
Slightly Injured 24.0 31 24 26 25 14 14 29 19 13 -45.8 -31.6
Total 30.6 38 31 30 34 20 16 32 22 14 -54.2 -36.4
Non Built-up Killed 15.0 22 17 9 22 5 7 2 4 8 -46.7 -
Seriously Injured 32.6 37 41 39 25 21 36 24 18 13 -60.1 -27.8
KSI 47.6 59 58 48 47 26 43 26 22 21 -55.9 -4.5
Slightly Injured 163.2 185 150 189 141 151 104 124 133 114 -30.1 -14.3
Total 210.8 244 208 237 188 177 147 150 155 135 -36.0 -12.9
A-road Single Carriageway
Built-up Killed 1.0 1 3 0 1 0 1 0 0 0 - -
Seriously Injured 5.6 4 3 8 8 5 4 4 2 3 - -
KSI 6.6 5 6 8 9 5 5 4 2 3 - -
Slightly Injured 19.2 27 16 20 10 23 22 27 22 20 4.2 -9.1
Total 25.8 32 22 28 19 28 27 31 24 23 -10.9 -4.2
Non Built-up Killed 8.4 13 3 10 8 8 5 3 0 5 - -
Seriously Injured 21.8 29 20 20 22 18 21 15 15 9 -58.7 -40.0
KSI 30.2 42 23 30 30 26 26 18 15 14 -53.6 -6.7
Slightly Injured 66.4 73 65 61 74 59 55 56 36 21 -68.4 -41.7
Total 96.6 115 88 91 104 85 81 74 51 35 -63.8 -31.4

HA Publication PR67/14 App 74
Table F-11 Collisions involving drivers or riders exceeding the speed limit by road classification, severity and year
Road Classification Collision Severity
2005-2009 BSL
average 2005 2006 2007 2008 2009 2010 2011 2012 2013
2013 per cent change from BSL
average
2013 per cent change from
2012
Motorway - Fatal 11.0 18 13 10 7 7 5 10 4 9 - -
Serious 28.4 28 34 28 21 31 24 18 15 16 -43.7 6.7
KSI 39.4 46 47 38 28 38 29 28 19 25 -36.5 31.6
Slight 120.8 114 146 132 116 96 117 95 69 91 -24.7 31.9
Total 160.2 160 193 170 144 134 146 123 88 116 -27.6 31.8
A-road Dual Carriageway
Built-up Fatal 1.0 2 2 0 0 1 0 1 0 0 - -
Serious 4.2 5 4 3 7 2 2 0 3 1 - -
KSI 5.2 7 6 3 7 3 2 1 3 1 - -
Slight 15.2 17 18 18 14 9 8 13 11 12 -21.1 -
Total 20.4 24 24 21 21 12 10 14 14 13 -36.3 -
Non Built-up Fatal 13.2 18 15 9 19 5 7 2 4 6 - -
Serious 23.0 28 29 29 9 20 26 19 16 12 -47.8 -25.0
KSI 36.2 46 44 38 28 25 33 21 20 18 -50.3 -10.0
Slight 95.0 109 87 109 81 89 55 72 80 64 -32.6 -20.0
Total 131.2 155 131 147 109 114 88 93 100 82 -37.5 -18.0
A-road Single Carriageway
Built-up Fatal 0.6 1 1 0 1 0 1 0 0 0 - -
Serious 4.0 3 2 5 6 4 4 4 2 3 - -
KSI 4.6 4 3 5 7 4 5 4 2 3 - -
Slight 12.2 21 10 11 6 13 9 14 8 11 - -
Total 16.8 25 13 16 13 17 14 18 10 14 -16.7 -
Non Built-up Fatal 5.8 9 2 7 6 5 4 3 0 4 - -
Serious 14.2 17 12 17 11 14 11 10 14 7 - -
KSI 20.0 26 14 24 17 19 15 13 14 11 -45.0 -
Slight 30.2 32 31 26 35 27 24 25 19 13 -57.0 -31.6
Total 50.2 58 45 50 52 46 39 38 33 24 -52.2 -27.3

HA Publication PR67/14 App 75
Table F-12 Collisions involving drivers or riders exceeding the speed limit by top 20 road names and year
No. Road Name
2005-2009 BSL
average 2005 2006 2007 2008 2009 2010 2011 2012 2013
2013 per cent change from BSL
average
2013 per cent change from
2012
1 M1 19.0 23 25 20 11 16 19 19 11 22 15.8 -
2 A38 11.4 24 7 12 4 10 10 8 17 16 - -5.9
3 M6 22.2 18 34 21 28 10 11 12 11 15 -32.4 -
4 M4 16.6 12 16 18 20 17 24 18 6 11 -33.7 -
5 A50 4.6 5 8 7 2 1 2 3 4 11 - -
6 A1(M) 6.6 4 6 10 6 7 5 4 4 10 - -
7 A1 16.4 19 16 16 12 19 5 8 7 9 -45.1 -
8 M40 7.6 4 11 11 7 5 7 6 7 9 - -
9 A5 15.0 17 15 15 17 11 14 11 14 8 -46.7 -
10 M5 12.2 15 12 15 10 9 9 7 4 7 - -
11 M11 5.4 7 9 4 3 4 2 1 0 7 - -
12 M25 16.0 21 20 14 18 7 21 13 15 6 -62.5 -60.0
13 A30 8.8 10 5 10 11 8 5 6 5 6 - -
14 A47 5.4 9 4 8 4 2 4 2 2 6 - -
15 A66 4.6 6 3 6 4 4 2 5 3 5 - -
16 A46 7.4 8 13 7 5 4 10 5 8 4 - -
17 M3 4.4 1 9 6 2 4 4 6 4 4 - -
18 A11 3.4 1 5 7 1 3 4 2 4 4 - -
19 A45 3.4 4 4 5 3 1 0 0 0 4 - -
20 A3 9.6 6 11 12 12 7 5 9 8 3 - -
Notes: (a) Ranked by 2013.

HA Publication PR67/14 App 76
Table F-13 Casualties involving drivers or riders distracted by road classification, severity and year
Road Classification Collision Severity
2005-2009 BSL
average 2005 2006 2007 2008 2009 2010 2011 2012 2013
2013 per cent change from BSL
average
2013 per cent change from
2012
Motorway - Killed 7.8 9 15 6 4 5 4 0 2 4 - -
Seriously Injured 77.4 88 87 73 76 63 54 49 67 64 -17.3 -4.5
KSI 85.2 97 102 79 80 68 58 49 69 68 -20.2 -1.4
Slightly Injured 1,799.8 2,167 1,985 1,743 1,635 1,469 1,560 1,437 1,390 1,223 -32.0 -12.0
Total 1,885.0 2,264 2,087 1,822 1,715 1,537 1,618 1,486 1,459 1,291 -31.5 -11.5
A-road Dual Carriageway
Built-up Killed 0.2 0 0 1 0 0 0 0 0 0 - -
Seriously Injured 2.8 2 1 2 4 5 2 1 2 1 - -
KSI 3.0 2 1 3 4 5 2 1 2 1 - -
Slightly Injured 69.4 89 65 79 58 56 64 66 104 71 2.3 -31.7
Total 72.4 91 66 82 62 61 66 67 106 72 -0.6 -32.1
Non Built-up Killed 2.4 2 1 2 4 3 2 0 1 1 - -
Seriously Injured 39.2 34 47 34 40 41 34 42 32 37 -5.6 15.6
KSI 41.6 36 48 36 44 44 36 42 33 38 -8.7 15.2
Slightly Injured 787.8 893 807 794 691 754 625 658 660 569 -27.8 -13.8
Total 829.4 929 855 830 735 798 661 700 693 607 -26.8 -12.4
A-road Single Carriageway
Built-up Killed 0.0 0 0 0 0 0 0 0 0 0 - -
Seriously Injured 2.8 3 1 1 3 6 4 5 2 3 - -
KSI 2.8 3 1 1 3 6 4 5 2 3 - -
Slightly Injured 74.4 82 94 68 73 55 45 52 78 76 2.2 -2.6
Total 77.2 85 95 69 76 61 49 57 80 79 2.3 -1.3
Non Built-up Killed 1.2 2 2 1 0 1 1 1 2 1 - -
Seriously Injured 19.6 23 23 14 12 26 11 12 10 15 -23.5 -
KSI 20.8 25 25 15 12 27 12 13 12 16 -23.1 -
Slightly Injured 278.4 332 298 257 209 296 213 190 176 192 -31.0 9.1
Total 299.2 357 323 272 221 323 225 203 188 208 -30.5 10.6
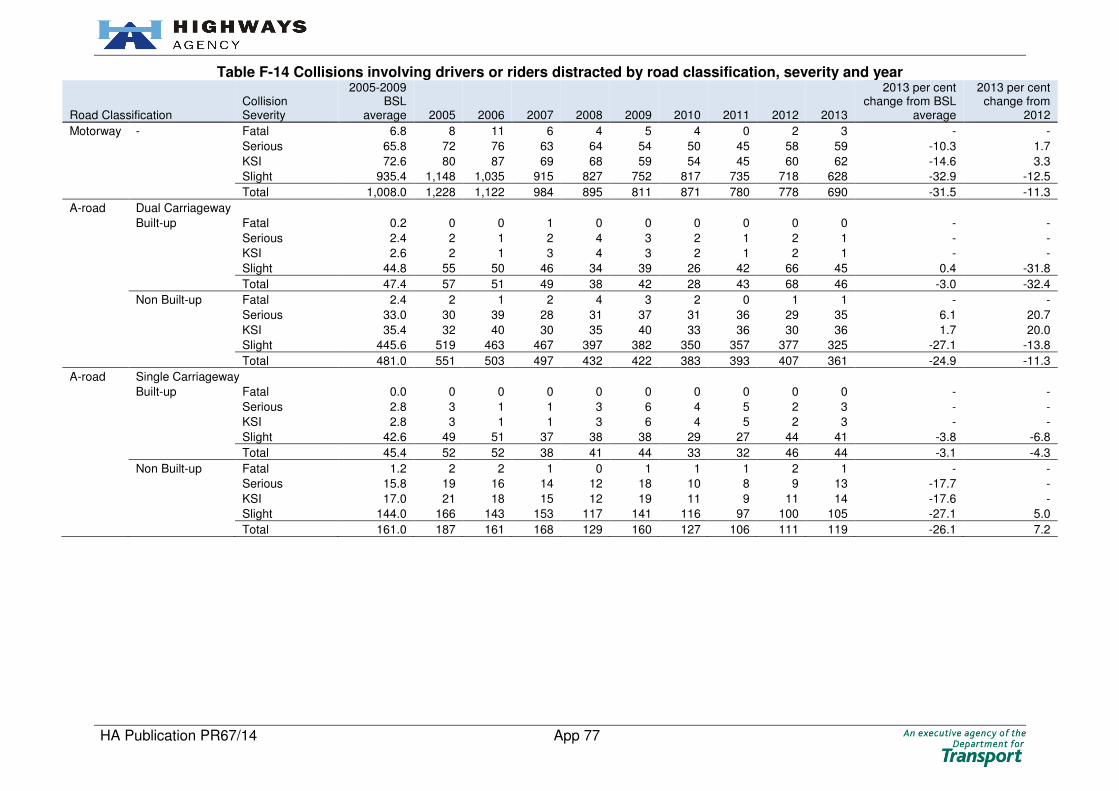
HA Publication PR67/14 App 77
Table F-14 Collisions involving drivers or riders distracted by road classification, severity and year
Road Classification Collision Severity
2005-2009 BSL
average 2005 2006 2007 2008 2009 2010 2011 2012 2013
2013 per cent change from BSL
average
2013 per cent change from
2012
Motorway - Fatal 6.8 8 11 6 4 5 4 0 2 3 - -
Serious 65.8 72 76 63 64 54 50 45 58 59 -10.3 1.7
KSI 72.6 80 87 69 68 59 54 45 60 62 -14.6 3.3
Slight 935.4 1,148 1,035 915 827 752 817 735 718 628 -32.9 -12.5
Total 1,008.0 1,228 1,122 984 895 811 871 780 778 690 -31.5 -11.3
A-road Dual Carriageway
Built-up Fatal 0.2 0 0 1 0 0 0 0 0 0 - -
Serious 2.4 2 1 2 4 3 2 1 2 1 - -
KSI 2.6 2 1 3 4 3 2 1 2 1 - -
Slight 44.8 55 50 46 34 39 26 42 66 45 0.4 -31.8
Total 47.4 57 51 49 38 42 28 43 68 46 -3.0 -32.4
Non Built-up Fatal 2.4 2 1 2 4 3 2 0 1 1 - -
Serious 33.0 30 39 28 31 37 31 36 29 35 6.1 20.7
KSI 35.4 32 40 30 35 40 33 36 30 36 1.7 20.0
Slight 445.6 519 463 467 397 382 350 357 377 325 -27.1 -13.8
Total 481.0 551 503 497 432 422 383 393 407 361 -24.9 -11.3
A-road Single Carriageway
Built-up Fatal 0.0 0 0 0 0 0 0 0 0 0 - -
Serious 2.8 3 1 1 3 6 4 5 2 3 - -
KSI 2.8 3 1 1 3 6 4 5 2 3 - -
Slight 42.6 49 51 37 38 38 29 27 44 41 -3.8 -6.8
Total 45.4 52 52 38 41 44 33 32 46 44 -3.1 -4.3
Non Built-up Fatal 1.2 2 2 1 0 1 1 1 2 1 - -
Serious 15.8 19 16 14 12 18 10 8 9 13 -17.7 -
KSI 17.0 21 18 15 12 19 11 9 11 14 -17.6 -
Slight 144.0 166 143 153 117 141 116 97 100 105 -27.1 5.0
Total 161.0 187 161 168 129 160 127 106 111 119 -26.1 7.2

HA Publication PR67/14 App 78
Table F-15 Collisions involving distracted drivers or riders by top 20 road names and year
No. Road name
2005-2009 BSL
average 2005 2006 2007 2008 2009 2010 2011 2012 2013
2013 per cent change from BSL
average
2013 per cent change from
2012
1 M6 146.6 159 160 133 151 130 161 126 111 130 -11.3 17.1
2 M1 190.0 305 200 192 144 109 118 100 125 90 -52.6 -28.0
3 M4 86.2 81 106 89 85 70 94 66 76 85 -1.4 11.8
4 M25 150.8 236 173 124 116 105 135 129 131 79 -47.6 -39.7
5 A1 80.4 98 84 79 66 75 56 53 35 56 -30.3 60.0
6 M5 59.0 80 64 49 50 52 44 36 44 41 -30.5 -6.8
7 A1(M) 40.6 22 49 48 38 46 50 41 45 38 -6.4 -15.6
8 A46 29.2 31 29 23 31 32 25 27 24 38 30.1 58.3
9 A14 42.6 51 43 47 40 32 42 37 41 34 -20.2 -17.1
10 M3 42.4 41 54 43 35 39 42 42 46 26 -38.7 -43.5
11 A34 30.6 23 37 36 24 33 21 32 37 26 -15.0 -29.7
12 A38 38.0 42 31 42 39 36 22 34 49 25 -34.2 -49.0
13 M62 61.2 61 70 65 58 52 39 52 23 25 -59.2 8.7
14 M56 19.0 16 18 17 26 18 13 14 13 25 31.6 -
15 M42 19.6 23 12 26 24 13 9 21 15 23 17.3 53.3
16 A5 29.6 39 29 30 24 26 22 26 28 20 -32.4 -28.6
17 A19 25.8 33 30 26 22 18 17 12 26 20 -22.5 -23.1
18 A30 19.6 23 13 24 18 20 15 18 24 20 2.0 -16.7
19 A27 52.8 56 63 48 50 47 39 20 22 18 -65.9 -18.2
20 A50 13.0 10 16 17 11 11 17 7 13 18 - -
Notes: (a) Ranked by 2013.

HA Publication PR67/14 App 79
Table F-16 Contributory factor recording statistics by year
Number of contributory factors per collision
Year 0 1 2 3 4 5 6 Total
collisions
Percentage of collisions with at
least one CF
Average number of CFs per
collision
Standard deviation from
mean
2005 2,441 4,070 4,396 2,524 1,149 416 357 15,353 84.1 1.91 1.40
2006 2,039 3,959 4,504 2,366 1,130 497 340 14,835 86.3 1.96 1.40
2007 2,015 3,719 4,301 2,324 1,089 483 334 14,265 85.9 1.97 1.40
2008 1,776 3,294 3,882 2,167 996 406 306 12,827 86.2 1.98 1.40
2009 1,706 2,997 3,632 2,019 992 400 330 12,076 85.9 2.01 1.43
2010 1,539 2,784 3,353 2,016 1,041 395 286 11,414 86.5 2.05 1.43
2011 1,517 2,710 3,230 1,922 933 362 273 10,947 86.1 2.02 1.42
2012 541 2,889 3,409 2,015 976 398 292 10,520 94.9 2.22 1.33
2013 1,362 2,551 2,940 1,839 891 308 254 10,145 86.6 2.03 1.41
Notes: (a) Table reports number of collisions by the frequency of contributory factors recorded (0 to 6 factors) per collision. (b) standard deviation calculated with no correction for bias.

HA Publication PR67/14 App 80
Appendix G: Comparison to Great Britain Statistics A comparison of collisions and casualties on all roads in Great Britain and those on the Highways Agency’s 2010 network is shown below. The
points presented are in line with those reported in the Department for Transportation’s ‘Reported Road Casualties in Great Britain: Main Results
2013’. Note percentages are reported with no decimal places.
Table G-1 Comparison to Great Britain statistics
All roads in GB Highways Agency’s 2010 network
In 2013, there were 183,670 reported casualties on all roads in
Great Britain, i.e. all major and minor roads in England, Wales and
Scotland.
In 2013, there were 16,094 reported casualties on the Highways
Agency’s 2010 network.
Compared with 2012: Compared with 2012:
• This represents 6 per cent fewer casualties;
• 1,713 people were killed, 2 per cent lower;
• 23,370 people were killed or seriously injured, 6 per cent lower;
• 160,300 people were slightly injured, 6 per cent fewer;
• 1,980 children were killed or seriously injured, 13 per cent fewer;
• 15,756 child casualties were reported, 9 per cent fewer.
• This represents 3 per cent fewer casualties;
• 244 people were killed, 12 per cent higher;
• 1,709 people were killed or seriously injured, 1 per cent higher;
• 14,385 people were slightly injured, 4 per cent fewer;
• 38 children were killed or seriously injured, 37 per cent fewer;
• 813 child casualties were reported, 6 per cent lower.
Compared with the 2005 to 2009 baseline values: Compared with the 2005 to 2009 baseline values:
• The number of people killed or seriously injured was 22 per cent lower;
• The total number of casualties was 25 per cent lower;
• Fatalities were 39 per cent lower;
• The number of children killed or seriously injured was 35 per cent lower;
• The total number of child casualties was 34 per cent lower;
• The number of child fatalities was 62 per cent lower;
• There were 138,660 reported road injury collisions, 23 per cent fewer;
• Killed or seriously injured was the outcome of 21,232 injury collisions, down 20 per cent.
• The number of people killed or seriously injured was 26 per cent lower;
• The total number of casualties was 26 per cent lower;
• Fatalities were 32 per cent lower;
• The number of children killed or seriously injured was 54 per cent lower;
• The total number of child casualties was 29 per cent lower;
• The number of child fatalities was 58 per cent lower;
• There were 10,145 reported road injury collisions, 27 per cent fewer;
• Killed or seriously injured was the outcome of 1,435 injury collisions, down 24 per cent.
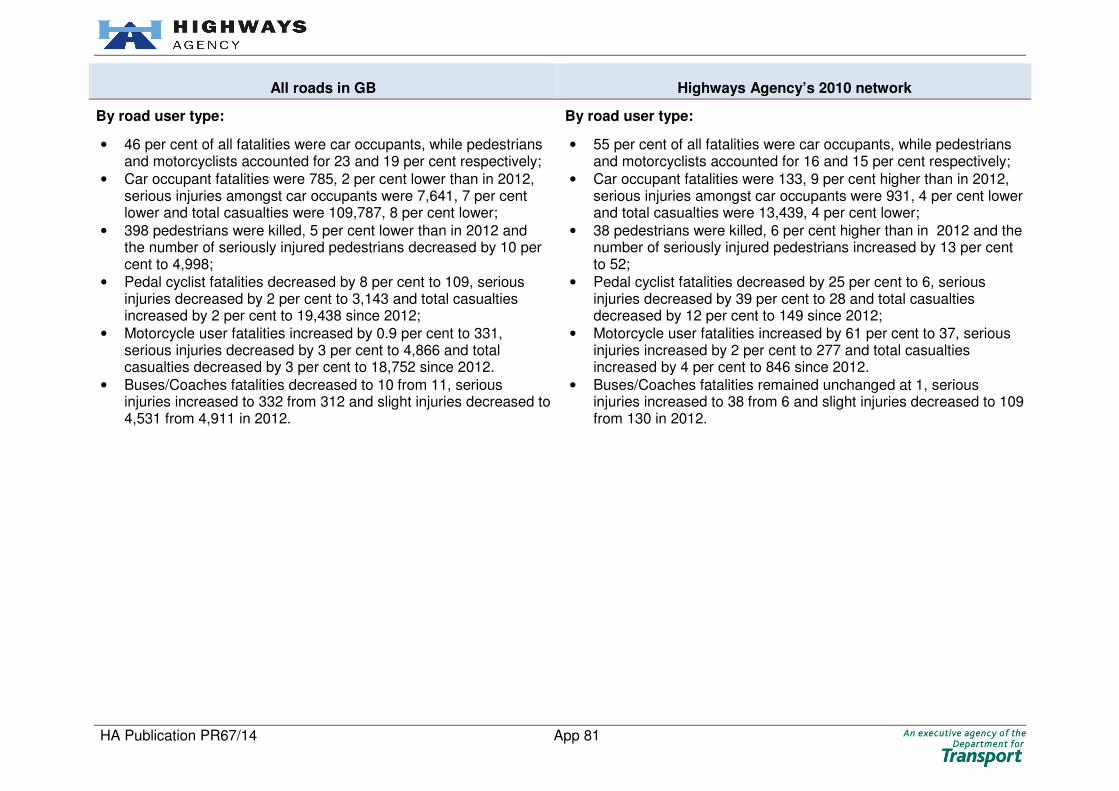
HA Publication PR67/14 App 81
All roads in GB Highways Agency’s 2010 network
By road user type: By road user type:
• 46 per cent of all fatalities were car occupants, while pedestrians and motorcyclists accounted for 23 and 19 per cent respectively;
• Car occupant fatalities were 785, 2 per cent lower than in 2012, serious injuries amongst car occupants were 7,641, 7 per cent lower and total casualties were 109,787, 8 per cent lower;
• 398 pedestrians were killed, 5 per cent lower than in 2012 and the number of seriously injured pedestrians decreased by 10 per cent to 4,998;
• Pedal cyclist fatalities decreased by 8 per cent to 109, serious injuries decreased by 2 per cent to 3,143 and total casualties increased by 2 per cent to 19,438 since 2012;
• Motorcycle user fatalities increased by 0.9 per cent to 331, serious injuries decreased by 3 per cent to 4,866 and total casualties decreased by 3 per cent to 18,752 since 2012.
• Buses/Coaches fatalities decreased to 10 from 11, serious injuries increased to 332 from 312 and slight injuries decreased to 4,531 from 4,911 in 2012.
• 55 per cent of all fatalities were car occupants, while pedestrians and motorcyclists accounted for 16 and 15 per cent respectively;
• Car occupant fatalities were 133, 9 per cent higher than in 2012, serious injuries amongst car occupants were 931, 4 per cent lower and total casualties were 13,439, 4 per cent lower;
• 38 pedestrians were killed, 6 per cent higher than in 2012 and the number of seriously injured pedestrians increased by 13 per cent to 52;
• Pedal cyclist fatalities decreased by 25 per cent to 6, serious injuries decreased by 39 per cent to 28 and total casualties decreased by 12 per cent to 149 since 2012;
• Motorcycle user fatalities increased by 61 per cent to 37, serious injuries increased by 2 per cent to 277 and total casualties increased by 4 per cent to 846 since 2012.
• Buses/Coaches fatalities remained unchanged at 1, serious injuries increased to 38 from 6 and slight injuries decreased to 109 from 130 in 2012.
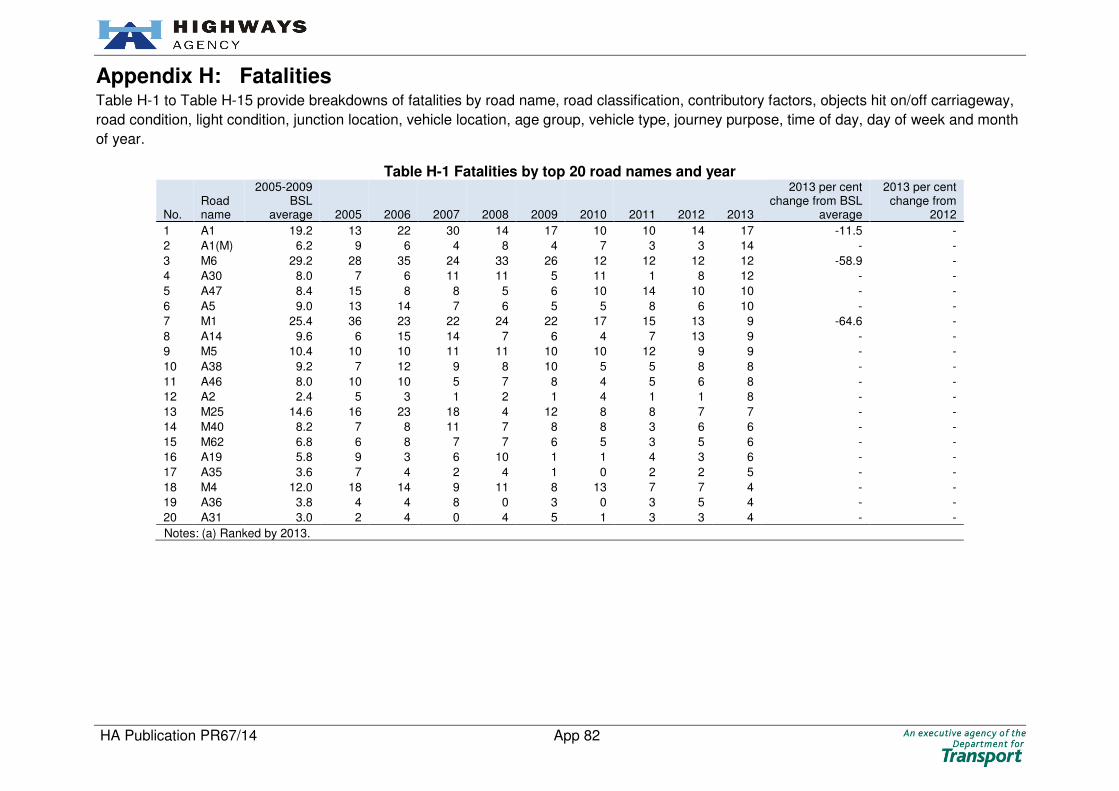
HA Publication PR67/14 App 82
Appendix H: Fatalities Table H-1 to Table H-15 provide breakdowns of fatalities by road name, road classification, contributory factors, objects hit on/off carriageway,
road condition, light condition, junction location, vehicle location, age group, vehicle type, journey purpose, time of day, day of week and month
of year.
Table H-1 Fatalities by top 20 road names and year
No. Road name
2005-2009 BSL
average 2005 2006 2007 2008 2009 2010 2011 2012 2013
2013 per cent change from BSL
average
2013 per cent change from
2012
1 A1 19.2 13 22 30 14 17 10 10 14 17 -11.5 -
2 A1(M) 6.2 9 6 4 8 4 7 3 3 14 - -
3 M6 29.2 28 35 24 33 26 12 12 12 12 -58.9 -
4 A30 8.0 7 6 11 11 5 11 1 8 12 - -
5 A47 8.4 15 8 8 5 6 10 14 10 10 - -
6 A5 9.0 13 14 7 6 5 5 8 6 10 - -
7 M1 25.4 36 23 22 24 22 17 15 13 9 -64.6 -
8 A14 9.6 6 15 14 7 6 4 7 13 9 - -
9 M5 10.4 10 10 11 11 10 10 12 9 9 - -
10 A38 9.2 7 12 9 8 10 5 5 8 8 - -
11 A46 8.0 10 10 5 7 8 4 5 6 8 - -
12 A2 2.4 5 3 1 2 1 4 1 1 8 - -
13 M25 14.6 16 23 18 4 12 8 8 7 7 - -
14 M40 8.2 7 8 11 7 8 8 3 6 6 - -
15 M62 6.8 6 8 7 7 6 5 3 5 6 - -
16 A19 5.8 9 3 6 10 1 1 4 3 6 - -
17 A35 3.6 7 4 2 4 1 0 2 2 5 - -
18 M4 12.0 18 14 9 11 8 13 7 7 4 - -
19 A36 3.8 4 4 8 0 3 0 3 5 4 - -
20 A31 3.0 2 4 0 4 5 1 3 3 4 - -
Notes: (a) Ranked by 2013.

HA Publication PR67/14 App 83
Table H-2 Fatalities by road classification and year
Road classification
2005-2009 BSL
average 2005 2006 2007 2008 2009 2010 2011 2012 2013
2013 per cent change from BSL
average
2013 per cent change from
2012
Motorway - 153.6 184 169 156 143 116 110 90 78 87 -43.4 11.5
A-road Dual Carriageway
Built-up 5.6 8 5 6 4 5 1 6 4 2 - -
Non Built-up 127.2 145 136 138 137 80 91 97 80 88 -30.8 10.0
A-road Single Carriageway
Built-up 6.0 6 6 6 9 3 5 8 8 11 - -
Non Built-up 64.8 79 73 64 57 51 42 50 47 56 -13.6 19.1
Table H-3 Top 20 contributory factors involving fatal collisions by year
No. Contributory Factor
2005-2009 BSL
average 2005 2006 2007 2008 2009 2010 2011 2012 2013
2013 per cent change from BSL
average
2013 per cent change from
2012
1 405 Failed to look properly 52.8 65 48 50 53 48 59 40 48 59 11.7 22.9
2 410 Loss of control 91.0 108 113 77 89 68 57 74 50 58 -36.3 16.0
3 406 Failed to judge other person’s path or speed 46.0 48 46 50 55 31 35 29 28 32 -30.4 14.3
4 602 Careless, reckless or in a hurry 32.2 40 31 35 31 24 33 18 24 30 -6.8 25.0
5 503 Fatigue 32.6 39 38 31 27 28 28 28 22 24 -26.4 9.1
6 403 Poor turn or manoeuvre 30.4 42 36 26 25 23 27 16 25 23 -24.3 -8.0
7 409 Swerved 27.2 31 31 31 26 17 17 17 21 19 -30.1 -9.5
8 501 Impaired by alcohol 23.0 22 27 20 24 22 13 8 9 19 -17.4 -
9 306 Exceeding speed limit 31.6 48 33 26 33 18 17 16 8 19 -39.9 -
10 509 Distraction in vehicle 12.4 10 14 14 12 12 18 18 9 16 - -
11 505 Illness or disability, mental or physical 17.2 17 13 28 16 12 10 12 20 15 -12.8 -25.0
12 307 Travelling too fast for conditions 31.6 42 43 29 25 19 20 15 19 15 -52.5 -21.1
13 601 Aggressive driving 14.2 19 13 12 20 7 9 6 4 14 - -
14 103 Slippery road (due to weather) 15.4 15 14 14 16 18 12 8 13 13 -15.6 -
15 806 Impaired by alcohol 12.8 6 19 18 13 8 9 8 8 12 - -
16 809 Pedestrian wearing dark clothing at night 11.0 10 14 15 10 6 8 9 13 10 - -
17 810 Disability or illness, mental or physical 7.6 5 11 4 13 5 7 5 10 10 - -
18 802 Failed to look properly 13.8 7 19 23 12 8 8 13 7 9 - -
19 408 Sudden braking 8.2 8 10 12 6 5 5 4 7 9 - -
20 803 Failed to judge vehicle’s path or speed 10.0 8 13 16 8 5 7 8 4 9 - -
Notes: (a) Values in the table report the number of fatal collisions where at least one of the specified contributory factors was recorded. (b) Up to six contributory factors can be recorded per collision. (c) The table is ranked by the year 2013.

HA Publication PR67/14 App 84
Table H-4 Fatalities by objects hit on carriageway and year
Object hit on carriageway
2005-2009 BSL
average 2005 2006 2007 2008 2009 2010 2011 2012 2013
2013 per cent change from BSL
average
2013 per cent change from
2012
Any animal (except ridden horse) 1.4 3 0 3 1 0 0 1 1 0 - -
Bollard or refuge 2.8 4 1 3 4 2 0 4 2 0 - -
Bridge (roof) 0.0 0 0 0 0 0 1 0 0 0 - -
Bridge (side) 2.6 5 3 2 3 0 2 2 2 0 - -
Central island of roundabout 0.8 1 0 0 3 0 0 1 1 0 - -
Data missing or out of range 0.2 1 0 0 0 0 0 0 0 0 - -
Kerb 9.4 9 8 6 13 11 2 9 3 4 - -
Parked vehicle 6.6 9 9 3 3 9 8 10 2 10 - -
Previous accident 1.2 2 0 1 1 2 1 1 0 2 - -
Road works 1.8 2 1 1 3 2 2 2 1 1 - -
Other object 4.8 7 2 3 6 6 3 1 2 2 - -
Total 31.6 43 24 22 37 32 19 31 14 19 -39.9 -
None 325.6 379 365 348 313 223 230 220 203 225 -30.9 10.8
Table H-5 Fatalities by objects hit off carriageway and year
Object hit off carriageway
2005-2009 BSL
average 2005 2006 2007 2008 2009 2010 2011 2012 2013
2013 per cent change from BSL
average
2013 per cent change from
2012
Bus stop or bus shelter 0.2 0 1 0 0 0 0 0 0 0 - -
Central crash barrier 36.4 48 32 32 41 29 27 22 17 16 -56.0 -5.9
Entered ditch 12.6 13 12 15 16 7 8 12 3 2 - -
Lamp post 9.2 14 5 10 12 5 4 3 1 4 - -
Near/Offside crash barrier 28.2 41 30 19 32 19 18 23 17 29 2.8 70.6
Road sign or traffic signal 13.8 17 14 12 15 11 4 6 7 4 - -
Submerged in water 0.2 1 0 0 0 0 0 0 0 0 - -
Telegraph or electricity pole 0.4 1 1 0 0 0 0 0 1 0 - -
Tree 33.2 33 38 35 34 26 24 32 19 21 -36.7 10.5
Wall or fence 0.0 0 0 0 0 0 0 1 1 3 - -
Other permanent object 20.4 24 22 22 19 15 20 10 10 10 -51.0 -
Total 154.6 192 155 145 169 112 105 109 76 89 -42.4 17.1
None 202.6 230 234 225 181 143 144 142 141 155 -23.5 9.9

HA Publication PR67/14 App 85
Table H-6 Fatalities by road condition, skidding and year
Road condition Skidding
2005-2009 BSL
average 2005 2006 2007 2008 2009 2010 2011 2012 2013
2013 per cent change from BSL
average
2013 per cent change from
2012
Dry Jack-knifed 2.0 3 4 0 1 2 0 0 1 1 - -
Jack-knifed and overturned 1.0 3 0 1 1 0 0 1 0 3 - -
Overturned 20.2 21 30 23 21 6 7 15 12 13 -35.6 -
Skidded 48.4 53 47 66 37 39 35 40 27 26 -46.3 -3.7
Skidded and overturned 25.4 38 24 29 20 16 19 22 9 5 -80.3 -
Total 97.0 118 105 119 80 63 61 78 49 48 -50.5 -2.0
None 151.0 190 163 136 162 104 112 109 93 114 -24.5 22.6
Snow Jack-knifed 0.0 0 0 0 0 0 1 0 0 0 - -
Jack-knifed and overturned 0.0 0 0 0 0 0 0 0 0 0 - -
Overturned 0.0 0 0 0 0 0 0 0 0 1 - -
Skidded 0.0 0 0 0 0 0 0 0 1 0 - -
Skidded and overturned 0.8 1 0 0 0 3 0 0 0 1 - -
Total 0.8 1 0 0 0 3 1 0 1 2 - -
None 0.8 1 2 1 0 0 4 0 0 1 - -
Wet or damp Jack-knifed 0.0 0 0 0 0 0 0 0 0 0 - -
Jack-knifed and overturned 0.4 1 0 0 1 0 0 0 1 0 - -
Overturned 10.4 9 12 12 8 11 3 3 3 4 - -
Skidded 26.8 29 31 35 17 22 19 16 12 21 -21.6 -
Skidded and overturned 12.8 18 15 10 15 6 3 6 8 6 - -
Total 50.4 57 58 57 41 39 25 25 24 31 -38.5 29.2
None 52.4 49 58 55 63 37 41 36 47 44 -16.0 -6.4
Frost or ice Jack-knifed 0.0 0 0 0 0 0 0 0 0 0 - -
Jack-knifed and overturned 0.0 0 0 0 0 0 0 0 0 0 - -
Overturned 0.0 0 0 0 0 0 0 0 0 0 - -
Skidded 1.2 1 0 0 3 2 2 1 1 1 - -
Skidded and overturned 1.2 1 0 1 1 3 0 0 0 0 - -
Total 2.4 2 0 1 4 5 2 1 1 1 - -
None 1.0 1 1 0 0 3 2 2 2 1 - -
Flood over 3cm. deep Jack-knifed 0.0 0 0 0 0 0 0 0 0 0 - -
Jack-knifed and overturned 0.0 0 0 0 0 0 0 0 0 0 - -
Overturned 0.0 0 0 0 0 0 0 0 0 1 - -
Skidded 0.8 2 0 1 0 1 1 0 0 0 - -
Skidded and overturned 0.4 0 2 0 0 0 0 0 0 0 - -
Total 1.2 2 2 1 0 1 1 0 0 1 - -
None 0.0 0 0 0 0 0 0 0 0 0 - -
Data missing or out of range Total 0.2 1 0 0 0 0 0 0 0 1 - -

HA Publication PR67/14 App 86
Table H-7 Fatalities by light conditions, road classification and year
Road Class Light Condition
2005-2009 BSL
average 2005 2006 2007 2008 2009 2010 2011 2012 2013
2013 per cent change from BSL
average
2013 per cent change from
2012
A-road Darkness - lights lit 23.6 23 22 24 31 18 11 12 7 15 -36.4 -
Darkness - lights unlit 1.6 0 3 2 3 0 0 1 0 2 - -
Darkness - no lighting 67.0 84 76 65 64 46 43 53 50 51 -23.9 2.0
Darkness - lighting unknown 0.6 2 1 0 0 0 1 2 5 1 - -
Total Darkness 92.8 109 102 91 98 64 55 68 62 69 -25.6 11.3
Daylight 110.8 129 118 123 109 75 84 93 77 88 -20.6 14.3
Motorway Darkness - lights lit 31.2 43 31 28 21 33 18 15 18 10 -67.9 -44.4
Darkness - lights unlit 0.4 0 0 0 2 0 1 2 0 2 - -
Darkness - no lighting 49.0 57 57 53 49 29 30 20 23 28 -42.9 21.7
Darkness - lighting unknown 1.2 4 0 1 1 0 0 2 2 1 - -
Total Darkness 81.8 104 88 82 73 62 49 39 43 41 -49.9 -4.7
Daylight 71.8 80 81 74 70 54 61 51 35 46 -35.9 31.4
Table H-8 Fatalities by junction detail and year
Junction detail
2005-2009 BSL
average 2005 2006 2007 2008 2009 2010 2011 2012 2013
2013 per cent change from BSL
average
2013 per cent change from
2012
Crossroads 4.6 6 0 6 7 4 3 7 0 1 - - Junction - more than 4 arms (not roundabout) 1.8 1 2 0 4 2 1 0 2 0 - -
Mini-roundabout 0.2 1 0 0 0 0 0 0 0 0 - -
Other junction 7.2 9 7 11 7 2 1 3 8 3 - -
Private drive or entrance 2.6 7 2 4 0 0 1 1 3 3 - -
Roundabout 5.8 8 2 3 11 5 1 10 3 5 - -
Slip road 26.2 34 34 25 23 15 18 18 13 12 -54.2 -
T or staggered junction 23.2 29 21 30 21 15 14 16 15 18 -22.4 20.0
Total 71.6 95 68 79 73 43 39 55 44 42 -41.3 -4.5
Not at junction or within 20 metres 285.6 327 321 291 277 212 210 196 173 202 -29.3 16.8
Table H-9 Fatalities involving hard shoulders or laybys by vehicle location and year
Vehicle Location
2005-2009 BSL
average 2005 2006 2007 2008 2009 2010 2011 2012 2013
2013 per cent change from BSL
average
2013 per cent change from
2012
Entering lay-by or hard shoulder 4.8 7 6 5 4 2 5 3 4 4 - -
Leaving lay-by or hard shoulder 2.6 0 3 6 2 2 1 1 2 0 - -
On lay-by or hard shoulder 18.0 23 18 17 19 13 22 16 11 14 -22.2 -
Notes: (a) Values in the table report the number of fatalities where at least one of the vehicles involved was reported with the specified vehicle location.

HA Publication PR67/14 App 87
Table H-10 Fatalities by driver age group involved and year
Driver type Driver age group
2005-2009 BSL
average 2005 2006 2007 2008 2009 2010 2011 2012 2013
2013 per cent change from BSL
average
2013 per cent change from
2012
Motorist Underage Motorist (0-16) 0.6 0 0 2 1 0 0 0 0 0 - -
Young Motorist (17-24) 85.2 117 82 84 81 62 60 70 31 45 -47.2 45.2
Other Motorist (25-59) 281.4 327 314 296 269 201 196 198 187 186 -33.9 -0.5
Older Motorist (60-69) 51.0 48 54 60 58 35 33 48 39 43 -15.7 10.3
Elderly Motorist (70+) 33.8 38 29 34 41 27 25 38 32 31 -8.3 -3.1
Rider Young Rider (16-19) 2.4 2 3 2 3 2 0 1 0 3 - -
Other Rider (20-59) 39.4 50 42 34 50 21 27 18 22 32 -18.8 45.5
Older Rider (60-69) 2.4 1 1 4 2 4 5 3 0 2 - -
Elderly Rider (70+) 1.6 3 2 2 0 1 0 3 1 1 - -
Unknown Unknown 37.0 54 43 30 35 23 31 21 16 16 -56.8 0.0
Notes: (a) Values in the table report the number of fatalities where at least one driver involved was reported with the specified driver age group.
Table H-11 Fatalities by vehicle type involved and year
Vehicle type
2005-2009 BSL
average 2005 2006 2007 2008 2009 2010 2011 2012 2013
2013 per cent change from BSL
average
2013 per cent change from
2012
Agricultural vehicle 2.6 2 3 2 2 4 2 4 1 4 - -
Bus or coach 5.2 6 3 7 6 4 6 4 4 2 - -
Car 297.0 354 326 300 289 216 190 216 164 182 -38.7 11.0
Goods Vehicle 43.2 45 39 56 44 32 42 37 30 28 -35.2 -6.7
HGV 127.4 157 143 143 117 77 86 82 87 89 -30.1 2.3
Motorcycle 45.4 56 48 40 55 28 31 25 23 37 -18.5 60.9
Pedal cycle 8.0 12 8 5 7 8 12 5 8 6 - -
Other 5.6 5 6 3 8 6 4 4 1 6 - -
Notes: (a) Values in the table report the number of fatalities where at least one vehicle involved was reported with the specified vehicle type.
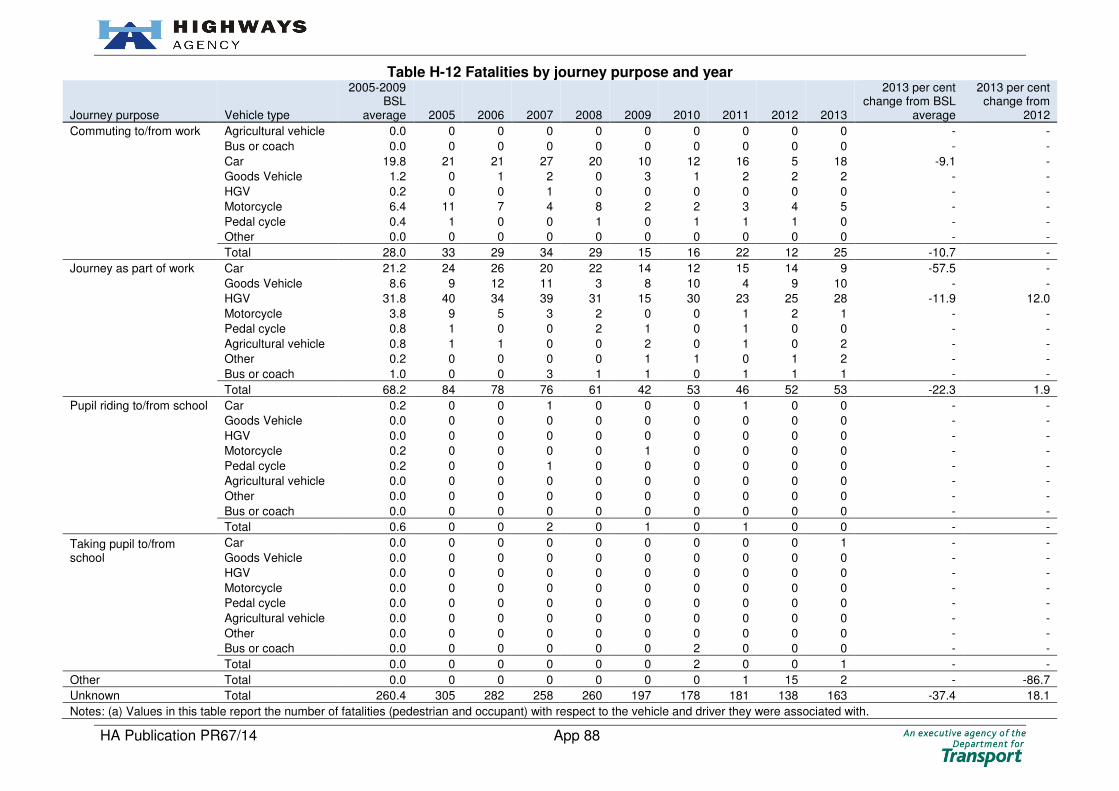
HA Publication PR67/14 App 88
Table H-12 Fatalities by journey purpose and year
Journey purpose Vehicle type
2005-2009 BSL
average 2005 2006 2007 2008 2009 2010 2011 2012 2013
2013 per cent change from BSL
average
2013 per cent change from
2012
Commuting to/from work Agricultural vehicle 0.0 0 0 0 0 0 0 0 0 0 - -
Bus or coach 0.0 0 0 0 0 0 0 0 0 0 - -
Car 19.8 21 21 27 20 10 12 16 5 18 -9.1 -
Goods Vehicle 1.2 0 1 2 0 3 1 2 2 2 - -
HGV 0.2 0 0 1 0 0 0 0 0 0 - -
Motorcycle 6.4 11 7 4 8 2 2 3 4 5 - -
Pedal cycle 0.4 1 0 0 1 0 1 1 1 0 - -
Other 0.0 0 0 0 0 0 0 0 0 0 - -
Total 28.0 33 29 34 29 15 16 22 12 25 -10.7 -
Journey as part of work Car 21.2 24 26 20 22 14 12 15 14 9 -57.5 -
Goods Vehicle 8.6 9 12 11 3 8 10 4 9 10 - -
HGV 31.8 40 34 39 31 15 30 23 25 28 -11.9 12.0
Motorcycle 3.8 9 5 3 2 0 0 1 2 1 - -
Pedal cycle 0.8 1 0 0 2 1 0 1 0 0 - -
Agricultural vehicle 0.8 1 1 0 0 2 0 1 0 2 - -
Other 0.2 0 0 0 0 1 1 0 1 2 - -
Bus or coach 1.0 0 0 3 1 1 0 1 1 1 - -
Total 68.2 84 78 76 61 42 53 46 52 53 -22.3 1.9
Pupil riding to/from school Car 0.2 0 0 1 0 0 0 1 0 0 - -
Goods Vehicle 0.0 0 0 0 0 0 0 0 0 0 - -
HGV 0.0 0 0 0 0 0 0 0 0 0 - -
Motorcycle 0.2 0 0 0 0 1 0 0 0 0 - -
Pedal cycle 0.2 0 0 1 0 0 0 0 0 0 - -
Agricultural vehicle 0.0 0 0 0 0 0 0 0 0 0 - -
Other 0.0 0 0 0 0 0 0 0 0 0 - -
Bus or coach 0.0 0 0 0 0 0 0 0 0 0 - -
Total 0.6 0 0 2 0 1 0 1 0 0 - -
Taking pupil to/from school
Car 0.0 0 0 0 0 0 0 0 0 1 - -
Goods Vehicle 0.0 0 0 0 0 0 0 0 0 0 - -
HGV 0.0 0 0 0 0 0 0 0 0 0 - -
Motorcycle 0.0 0 0 0 0 0 0 0 0 0 - -
Pedal cycle 0.0 0 0 0 0 0 0 0 0 0 - -
Agricultural vehicle 0.0 0 0 0 0 0 0 0 0 0 - -
Other 0.0 0 0 0 0 0 0 0 0 0 - -
Bus or coach 0.0 0 0 0 0 0 2 0 0 0 - -
Total 0.0 0 0 0 0 0 2 0 0 1 - -
Other Total 0.0 0 0 0 0 0 0 1 15 2 - -86.7
Unknown Total 260.4 305 282 258 260 197 178 181 138 163 -37.4 18.1
Notes: (a) Values in this table report the number of fatalities (pedestrian and occupant) with respect to the vehicle and driver they were associated with.
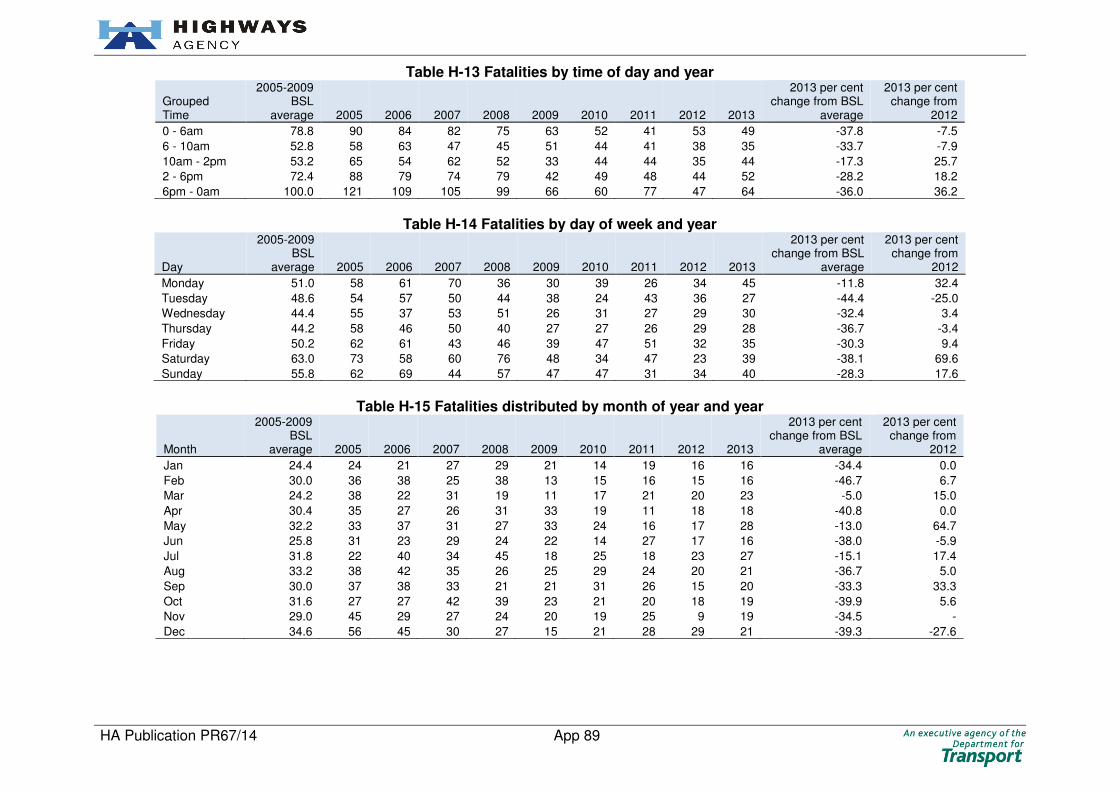
HA Publication PR67/14 App 89
Table H-13 Fatalities by time of day and year
Grouped Time
2005-2009 BSL
average 2005 2006 2007 2008 2009 2010 2011 2012 2013
2013 per cent change from BSL
average
2013 per cent change from
2012
0 - 6am 78.8 90 84 82 75 63 52 41 53 49 -37.8 -7.5
6 - 10am 52.8 58 63 47 45 51 44 41 38 35 -33.7 -7.9
10am - 2pm 53.2 65 54 62 52 33 44 44 35 44 -17.3 25.7
2 - 6pm 72.4 88 79 74 79 42 49 48 44 52 -28.2 18.2
6pm - 0am 100.0 121 109 105 99 66 60 77 47 64 -36.0 36.2
Table H-14 Fatalities by day of week and year
Day
2005-2009 BSL
average 2005 2006 2007 2008 2009 2010 2011 2012 2013
2013 per cent change from BSL
average
2013 per cent change from
2012
Monday 51.0 58 61 70 36 30 39 26 34 45 -11.8 32.4
Tuesday 48.6 54 57 50 44 38 24 43 36 27 -44.4 -25.0
Wednesday 44.4 55 37 53 51 26 31 27 29 30 -32.4 3.4
Thursday 44.2 58 46 50 40 27 27 26 29 28 -36.7 -3.4
Friday 50.2 62 61 43 46 39 47 51 32 35 -30.3 9.4
Saturday 63.0 73 58 60 76 48 34 47 23 39 -38.1 69.6
Sunday 55.8 62 69 44 57 47 47 31 34 40 -28.3 17.6
Table H-15 Fatalities distributed by month of year and year
Month
2005-2009 BSL
average 2005 2006 2007 2008 2009 2010 2011 2012 2013
2013 per cent change from BSL
average
2013 per cent change from
2012
Jan 24.4 24 21 27 29 21 14 19 16 16 -34.4 0.0
Feb 30.0 36 38 25 38 13 15 16 15 16 -46.7 6.7
Mar 24.2 38 22 31 19 11 17 21 20 23 -5.0 15.0
Apr 30.4 35 27 26 31 33 19 11 18 18 -40.8 0.0
May 32.2 33 37 31 27 33 24 16 17 28 -13.0 64.7
Jun 25.8 31 23 29 24 22 14 27 17 16 -38.0 -5.9
Jul 31.8 22 40 34 45 18 25 18 23 27 -15.1 17.4
Aug 33.2 38 42 35 26 25 29 24 20 21 -36.7 5.0
Sep 30.0 37 38 33 21 21 31 26 15 20 -33.3 33.3
Oct 31.6 27 27 42 39 23 21 20 18 19 -39.9 5.6
Nov 29.0 45 29 27 24 20 19 25 9 19 -34.5 -
Dec 34.6 56 45 30 27 15 21 28 29 21 -39.3 -27.6

HA Publication PR67/14 App 90
Appendix I: Seriously Injured Casualties Table I-1 to Table I-15 provide breakdowns of seriously injured casualties by road name, road classification, contributory factors, objects hit
on/off carriageway, road condition, light condition, junction location, vehicle location, age group, vehicle type, journey purpose, time of day, day
of week and month of year.
Table I-1 Seriously injured casualties by road name and year
No. Road name
2005-2009 BSL
average 2005 2006 2007 2008 2009 2010 2011 2012 2013
2013 per cent change from BSL
average
2013 per cent change from
2012
1 M1 118.8 139 114 124 102 115 114 74 72 72 -39.4 0.0
2 M25 101.6 111 116 113 71 97 83 67 64 71 -30.1 10.9
3 M6 130.8 146 132 128 146 102 102 114 80 66 -49.5 -17.5
4 A1 91.2 113 103 68 79 93 75 68 51 64 -29.8 25.5
5 A27 47.0 43 49 47 44 52 46 47 40 47 0.0 17.5
6 M62 47.0 71 51 33 44 36 26 38 33 47 0.0 42.4
7 M4 67.2 54 75 111 55 41 51 42 40 43 -36.0 7.5
8 A5 50.4 70 45 46 41 50 45 46 63 38 -24.6 -39.7
9 M5 48.2 60 39 52 36 54 58 35 44 38 -21.2 -13.6
10 A1(M) 41.0 28 42 51 41 43 26 33 25 38 -7.3 52.0
11 M3 32.4 33 32 36 24 37 29 35 33 35 8.0 6.1
12 A34 19.6 12 28 19 18 21 19 20 23 33 68.4 43.5
13 A14 56.6 86 49 46 50 52 46 43 41 32 -43.5 -22.0
14 A46 46.8 48 49 50 47 40 21 36 31 32 -31.6 3.2
15 M40 48.2 60 43 57 50 31 45 47 45 31 -35.7 -31.1
16 A30 29.6 33 28 36 33 18 28 34 33 31 4.7 -6.1
17 A66 26.6 31 28 28 22 24 33 24 30 31 16.5 3.3
18 A303 36.4 33 47 40 37 25 46 37 31 30 -17.6 -3.2
19 A47 42.8 50 48 42 35 39 43 40 19 29 -32.2 52.6
20 A21 26.2 23 27 28 27 26 23 25 14 29 10.7 -
Notes: (a) The table is ranked by the year 2013.

HA Publication PR67/14 App 91
Table I-2 Seriously injured casualties by road classification and year
Road Classification
2005-2009 BSL
average 2005 2006 2007 2008 2009 2010 2011 2012 2013
2013 per cent change from BSL
average
2013 per cent change from
2012
Motorway - 859.4 938 876 945 783 755 716 654 577 596 -30.6 3.3
A-road Dual Carriageway
Built-up 60.0 63 54 64 58 61 48 56 52 42 -30.0 -19.2
Non Built-up 659.6 819 718 628 591 542 584 566 551 494 -25.1 -10.3
A-road Single Carriageway
Built-up 63.6 71 52 76 48 71 55 68 54 49 -23.0 -9.3
Non Built-up 321.4 378 351 322 273 283 234 234 245 283 -11.9 15.5
Other - 0.0 0 0 0 0 0 0 0 0 1 - -
Notes: (a) Where the road classification is denoted as “Other”, these collisions were located on sections of the reference network that have been downgraded in class (to B or below) since 2010.
Table I-3 Serious collisions by contributory factors and year
No. Contributory Factors
2005-2009 BSL
average 2005 2006 2007 2008 2009 2010 2011 2012 2013
2013 per cent change from BSL
average
2013 per cent change from
2012
1 405 Failed to look properly 386.0 368 417 395 367 383 333 359 350 369 -4.4 5.4
2 406 Failed to judge other person’s path or speed 318.2 332 352 332 293 282 290 261 268 299 -6.0 11.6
3 410 Loss of control 429.0 506 461 444 374 360 382 333 326 274 -36.1 -16.0
4 403 Poor turn or manoeuvre 215.4 250 241 217 165 204 168 181 158 190 -11.8 20.3
5 602 Careless, reckless or in a hurry 204.2 228 232 225 162 174 191 180 170 164 -19.7 -3.5
6 409 Swerved 141.0 160 136 154 131 124 132 104 117 112 -20.6 -4.3
7 308 Following too close 122.2 130 134 111 117 119 98 95 101 112 -8.3 10.9
8 408 Sudden braking 123.0 110 133 134 113 125 105 93 106 106 -13.8 0.0
9 503 Fatigue 133.4 146 139 133 122 127 110 94 111 100 -25.0 -9.9
10 103 Slippery road (due to weather) 118.0 120 101 123 120 126 144 88 107 97 -17.8 -9.3
11 307 Travelling too fast for conditions 169.4 200 173 175 172 127 129 113 128 89 -47.5 -30.5
12 501 Impaired by alcohol 103.0 115 107 102 92 99 88 80 77 65 -36.9 -15.6
13 505 Illness or disability, mental or physical 45.0 42 44 41 53 45 43 54 48 60 33.3 25.0
14 509 Distraction in vehicle 57.2 57 68 63 51 47 50 60 67 59 3.1 -11.9
15 306 Exceeding speed limit 83.8 96 89 87 71 76 70 56 51 40 -52.3 -21.6
16 601 Aggressive driving 56.8 55 71 56 50 52 43 46 42 33 -41.9 -21.4
17 605 Learner or inexperienced driver/rider 56.4 60 61 70 45 46 31 48 38 33 -41.5 -13.2
18 707 Rain, sleet, snow, or fog 35.2 39 43 36 35 23 33 24 31 26 -26.1 -16.1
19 201 Tyres illegal, defective or under inflated 41.6 57 44 43 35 29 32 35 32 24 -42.3 -25.0
20 404 Failed to signal or misleading signal 21.2 31 15 21 17 22 14 14 17 23 8.5 35.3
Notes: (a) Values in the table report the number of collisions with at least one seriously injured casualty where at least one of the specified contributory factors was recorded. (b) Up to six contributory factors can be recorded per collision. (c) The table is ranked by the year 2013.

HA Publication PR67/14 App 92
Table I-4 Seriously injured casualties by objects hit on carriageway and year
Object hit on carriageway
2005-2009 BSL
average 2005 2006 2007 2008 2009 2010 2011 2012 2013
2013 per cent
change from BSL
average
2013 per cent
change from
2012
Any animal (except ridden horse) 6.0 6 4 7 4 9 4 4 8 4 - -
Bollard or refuge 21.2 27 22 17 19 21 18 22 23 15 -29.2 -34.8
Bridge (roof) 0.4 0 2 0 0 0 3 0 0 1 - -
Bridge (side) 3.8 3 3 6 5 2 3 3 5 5 - -
Central island of roundabout 8.0 9 6 8 8 9 7 5 5 3 - -
Data missing or out of range 0.0 0 0 0 0 0 0 0 0 0 - -
Kerb 55.8 66 63 63 47 40 34 41 30 38 -31.9 26.7
Open door of vehicle 0.4 2 0 0 0 0 0 0 0 0 - -
Parked vehicle 28.8 33 31 31 30 19 14 9 19 16 -44.4 -15.8
Previous accident 8.4 9 7 9 10 7 6 2 4 4 - -
Road works 6.6 7 8 4 5 9 8 1 1 6 - -
Other object 14.2 14 15 12 18 12 7 14 7 6 - -
Total 153.6 176 161 157 146 128 104 101 102 98 -36.2 -3.9
None 1,810.4 2,093 1,890 1,878 1,607 1,584 1,533 1,477 1,377 1,367 -24.5 -0.7
Table I-5 Seriously injured casualties by objects hit off carriageway and year
Object hit off carriageway
2005-2009 BSL
average 2005 2006 2007 2008 2009 2010 2011 2012 2013
2013 per cent change from BSL
average
2013 per cent change from
2012
Bus stop or bus shelter 0.0 0 0 0 0 0 0 0 1 0 - -
Central crash barrier 189.6 222 193 193 176 164 169 126 145 126 -33.5 -13.1
Entered ditch 76.4 85 80 84 69 64 47 37 40 29 -62.0 -27.5
Lamp post 37.6 42 51 42 25 28 30 15 24 15 -60.1 -37.5
Near/Offside crash barrier 166.2 192 165 195 125 154 141 139 128 108 -35.0 -15.6
Road sign or traffic signal 56.8 73 63 53 46 49 32 41 34 27 -52.5 -20.6
Submerged in water 1.4 3 0 2 0 2 0 0 0 1 - -
Telegraph or electricity pole 4.4 7 6 5 3 1 2 2 3 2 - -
Tree 126.0 157 125 120 124 104 90 110 89 88 -30.2 -1.1
Wall or fence 0.0 0 0 0 0 0 0 3 6 25 - -
Other permanent object 108.2 140 122 116 94 69 85 89 68 54 -50.1 -20.6
Total 766.6 921 805 810 662 635 596 562 538 475 -38.0 -11.7
None 1,197.4 1,348 1,246 1,225 1,091 1,077 1,041 1,016 941 990 -17.3 5.2

HA Publication PR67/14 App 93
Table I-6 Seriously injured casualties by road condition, skidding and year
Road Condition Skidding
2005-2009 BSL
average 2005 2006 2007 2008 2009 2010 2011 2012 2013
2013 per cent change from BSL
average
2013 per cent change from
2012
Dry Jackknifed 6.0 5 5 8 6 6 2 4 2 4 - -
Jackknifed and overturned 6.6 7 3 10 9 4 3 4 4 5 - -
Overturned 115.6 145 115 137 101 80 90 97 77 112 -3.1 45.5
Skidded 302.2 372 325 313 231 270 238 236 183 191 -36.8 4.4
Skidded and overturned 181.2 230 184 216 153 123 163 131 112 114 -37.1 1.8
Total 611.6 759 632 684 500 483 496 472 378 426 -30.3 12.7
None 750.4 830 783 735 692 712 624 721 572 630 -16.0 10.1
Snow Jackknifed 0.0 0 0 0 0 0 1 0 0 0 - -
Jackknifed and overturned 0.2 0 0 0 0 1 0 0 0 0 - -
Overturned 0.2 0 0 0 0 1 1 0 1 1 - -
Skidded 5.6 12 0 2 6 8 18 3 4 10 - -
Skidded and overturned 1.8 4 0 1 2 2 8 0 2 1 - -
Total 7.8 16 0 3 8 12 28 3 7 12 - -
None 3.8 6 9 1 0 3 9 1 3 7 - -
Wet or damp Jackknifed 3.0 7 2 4 1 1 1 0 0 0 - -
Jackknifed and overturned 1.8 2 2 1 4 0 0 1 1 0 - -
Overturned 37.6 38 49 36 36 29 26 19 30 26 -30.9 -13.3
Skidded 153.0 196 156 137 137 139 102 107 115 90 -41.2 -21.7
Skidded and overturned 80.6 73 73 144 57 56 53 46 61 37 -54.1 -39.3
Total 276.0 316 282 322 235 225 182 173 207 153 -44.6 -26.1
None 283.4 323 328 267 271 228 227 189 277 198 -30.1 -28.5
Frost or ice Jackknifed 0.2 0 0 0 1 0 2 0 0 0 - -
Jackknifed and overturned 0.0 0 0 0 0 0 0 0 0 0 - -
Overturned 2.4 0 2 2 5 3 8 0 0 1 - -
Skidded 10.4 5 9 4 13 21 19 9 6 14 - -
Skidded and overturned 3.6 2 0 1 8 7 13 4 6 4 - -
Total 16.6 7 11 7 27 31 42 13 12 19 14.5 -
None 6.4 6 2 2 11 11 20 5 10 10 - -
Flood over 3cm. deep Jackknifed 0.0 0 0 0 0 0 0 0 0 0 - -
Jackknifed and overturned 0.0 0 0 0 0 0 0 0 0 0 - -
Overturned 0.4 0 0 1 0 1 0 0 2 2 - -
Skidded 3.0 2 1 6 5 1 4 0 3 1 - -
Skidded and overturned 1.2 0 0 3 2 1 4 1 1 2 - -
Total 4.6 2 1 10 7 3 8 1 6 5 - -
None 2.6 2 3 3 2 3 1 0 3 3 - -
Data missing or out of range Total 0.8 2 0 1 0 1 0 0 4 2 - -
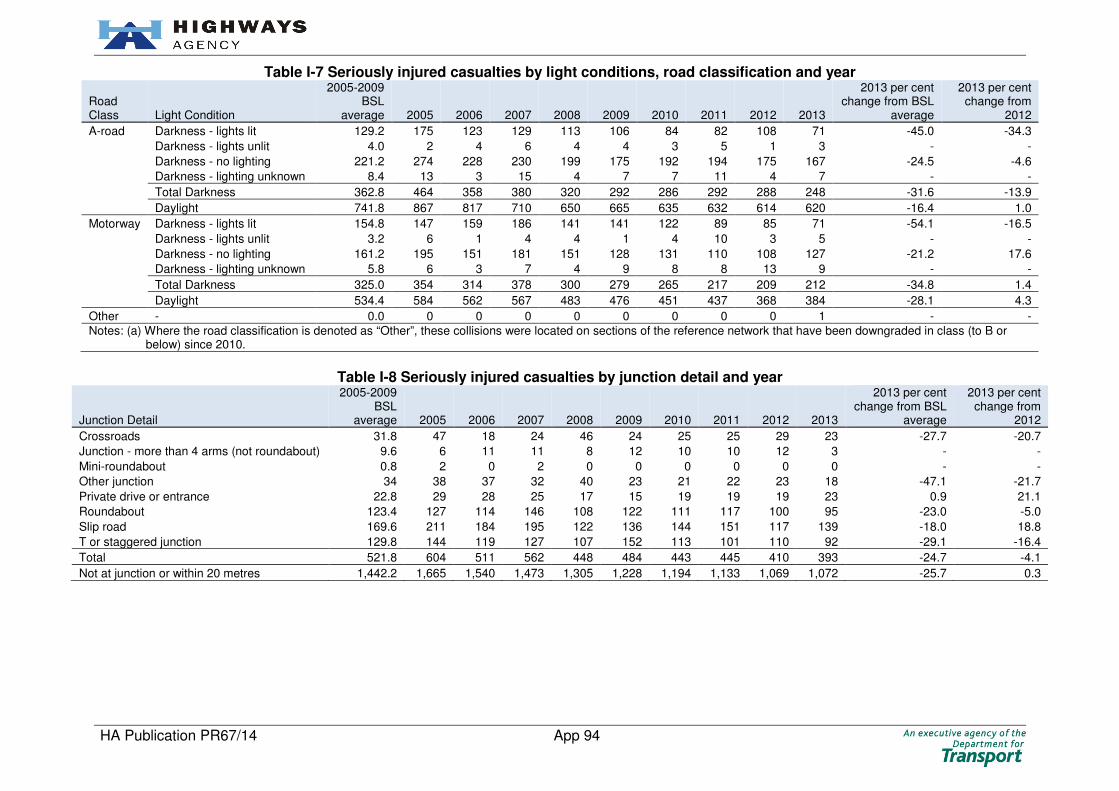
HA Publication PR67/14 App 94
Table I-7 Seriously injured casualties by light conditions, road classification and year
Road Class Light Condition
2005-2009 BSL
average 2005 2006 2007 2008 2009 2010 2011 2012 2013
2013 per cent change from BSL
average
2013 per cent change from
2012
A-road Darkness - lights lit 129.2 175 123 129 113 106 84 82 108 71 -45.0 -34.3
Darkness - lights unlit 4.0 2 4 6 4 4 3 5 1 3 - -
Darkness - no lighting 221.2 274 228 230 199 175 192 194 175 167 -24.5 -4.6
Darkness - lighting unknown 8.4 13 3 15 4 7 7 11 4 7 - -
Total Darkness 362.8 464 358 380 320 292 286 292 288 248 -31.6 -13.9
Daylight 741.8 867 817 710 650 665 635 632 614 620 -16.4 1.0
Motorway Darkness - lights lit 154.8 147 159 186 141 141 122 89 85 71 -54.1 -16.5
Darkness - lights unlit 3.2 6 1 4 4 1 4 10 3 5 - -
Darkness - no lighting 161.2 195 151 181 151 128 131 110 108 127 -21.2 17.6
Darkness - lighting unknown 5.8 6 3 7 4 9 8 8 13 9 - -
Total Darkness 325.0 354 314 378 300 279 265 217 209 212 -34.8 1.4
Daylight 534.4 584 562 567 483 476 451 437 368 384 -28.1 4.3
Other - 0.0 0 0 0 0 0 0 0 0 1 - -
Notes: (a) Where the road classification is denoted as “Other”, these collisions were located on sections of the reference network that have been downgraded in class (to B or below) since 2010.
Table I-8 Seriously injured casualties by junction detail and year
Junction Detail
2005-2009 BSL
average 2005 2006 2007 2008 2009 2010 2011 2012 2013
2013 per cent change from BSL
average
2013 per cent change from
2012
Crossroads 31.8 47 18 24 46 24 25 25 29 23 -27.7 -20.7
Junction - more than 4 arms (not roundabout) 9.6 6 11 11 8 12 10 10 12 3 - -
Mini-roundabout 0.8 2 0 2 0 0 0 0 0 0 - -
Other junction 34 38 37 32 40 23 21 22 23 18 -47.1 -21.7
Private drive or entrance 22.8 29 28 25 17 15 19 19 19 23 0.9 21.1
Roundabout 123.4 127 114 146 108 122 111 117 100 95 -23.0 -5.0
Slip road 169.6 211 184 195 122 136 144 151 117 139 -18.0 18.8
T or staggered junction 129.8 144 119 127 107 152 113 101 110 92 -29.1 -16.4
Total 521.8 604 511 562 448 484 443 445 410 393 -24.7 -4.1
Not at junction or within 20 metres 1,442.2 1,665 1,540 1,473 1,305 1,228 1,194 1,133 1,069 1,072 -25.7 0.3

HA Publication PR67/14 App 95
Table I-9 Seriously injured casualties involving hard shoulders or laybys by vehicle location and year
Vehicle Location
2005-2009 BSL
average 2005 2006 2007 2008 2009 2010 2011 2012 2013
2013 per cent change from BSL
average
2013 per cent change from
2012
Entering lay-by or hard shoulder 11 13 11 9 17 5 11 12 4 8 - -
Leaving lay-by or hard shoulder 9.4 9 14 4 12 8 5 10 5 12 - -
On lay-by or hard shoulder 51.8 58 54 48 55 44 45 30 32 23 -55.6 -28.1
Notes: (a) Values in the table report the number of seriously injured casualties where at least one of the vehicles involved was reported with the specified vehicle location.
Table I-10 Seriously injured casualties by driver age group involved and year
Driver type Driver age group
2005-2009 BSL
average 2005 2006 2007 2008 2009 2010 2011 2012 2013
2013 per cent change from BSL
average
2013 per cent change from
2012
Motorist Underage Motorist (0-16) 2.4 2 3 3 4 0 0 1 0 1 - -
Young Motorist (17-24) 514.2 610 522 548 472 419 408 377 309 282 -45.2 -8.7
Other Motorist (25-59) 1486.4 1726 1568 1542 1301 1295 1210 1119 1126 1117 -24.9 -0.8
Older Motorist (60-69) 259.6 271 256 282 247 242 256 267 254 273 5.2 7.5
Elderly Motorist (70+) 144.8 150 163 132 125 154 138 176 123 174 20.2 41.5
Rider Underage Rider (0-15) 0.2 1 0 0 0 0 0 0 0 0 - -
Young Rider (16-19) 22 27 26 24 21 12 12 29 11 20 -9.1 -
Other Rider (20-59) 300.4 325 308 326 277 266 240 261 244 242 -19.4 -0.8
Older Rider (60-69) 17 11 13 19 16 26 24 21 22 23 35.3 4.5
Elderly Rider (70+) 4.2 5 2 6 6 2 2 4 4 3 - -
Unknown Unknown 225.4 273 247 217 198 192 170 176 152 158 -29.9 3.9
Notes: (a) Values in the table report the number of seriously injured casualties where at least one driver involved was reported with the specified driver age group.
Table I-11 Seriously injured casualties by vehicle type involved and year
Vehicle type
2005-2009 BSL
average 2005 2006 2007 2008 2009 2010 2011 2012 2013
2013 per cent change from BSL
average
2013 per cent change from
2012
Agricultural vehicle 11.8 13 18 11 8 9 14 11 8 13 - -
Bus or coach 29 15 28 68 18 16 31 14 21 44 51.7 109.5
Car 1634 1,876 1,701 1,681 1,454 1,458 1,391 1,315 1,255 1,199 -26.6 -4.5
Goods Vehicle 232.6 287 262 207 195 212 188 188 184 177 -23.9 -3.8
HGV 428.6 561 455 439 365 323 323 281 290 349 -18.6 20.3
Motorcycle 340.6 368 351 365 319 300 277 316 280 287 -15.7 2.5
Pedal cycle 33.8 46 30 33 29 31 40 39 47 29 -14.2 -38.3
Other 33.2 31 34 24 41 36 18 24 15 30 -9.6 100.0
Notes: (a) Values in the table report the number of seriously injured casualties where at least one vehicle involved was reported with the specified vehicle type.

HA Publication PR67/14 App 96
Table I-12 Seriously injured casualties by journey purpose and year
Journey purpose Vehicle type
2005-2009 BSL
average 2005 2006 2007 2008 2009 2010 2011 2012 2013
2013 per cent change from BSL
average
2013 per cent change from
2012
Commuting to/from work Agricultural vehicle 0 0 0 0 0 0 0 0 0 0 - -
Bus or coach 0 0 0 0 0 0 0 0 0 0 - -
Car 114.2 135 124 104 115 93 107 104 79 82 -28.2 3.8
Goods Vehicle 6.2 10 8 5 2 6 2 10 12 5 - -
HGV 0.2 1 0 0 0 0 0 0 3 0 - -
Motorcycle 56.8 64 60 58 50 52 43 68 43 55 -3.2 27.9
Pedal cycle 5.4 6 3 7 3 8 5 5 11 4 - -
Other 0.2 1 0 0 0 0 1 0 0 0 - -
Total 183 217 195 174 170 159 158 187 148 146 -20.2 -1.4
Journey as part of work Car 130.2 174 117 122 118 120 98 91 100 85 -34.7 -15.0
Goods Vehicle 62.4 67 76 60 63 46 44 45 43 39 -37.5 -9.3
HGV 119.6 147 130 134 113 74 77 68 58 78 -34.8 34.5
Motorcycle 27.6 33 27 32 28 18 24 33 21 19 -31.2 -9.5
Pedal cycle 2.0 1 5 1 2 1 3 4 1 2 - -
Agricultural vehicle 2.6 3 4 2 3 1 1 3 3 2 - -
Other 5.0 9 4 6 3 3 2 2 1 2 - -
Bus or coach 15.0 2 12 47 8 6 11 10 5 37 146.7 -
Total 364.4 436 375 404 338 269 260 256 232 264 -27.6 13.8
Pupil riding to/from school Car 2.0 2 1 3 2 2 3 3 1 1 - -
Goods Vehicle 0.0 0 0 0 0 0 0 0 0 0 - -
HGV 0.0 0 0 0 0 0 0 0 0 0 - -
Motorcycle 0.0 0 0 0 0 0 0 0 0 0 - -
Pedal cycle 0.4 1 0 1 0 0 1 1 0 0 - -
Agricultural vehicle 0.0 0 0 0 0 0 0 0 0 0 - -
Other 0.0 0 0 0 0 0 0 0 0 0 - -
Bus or coach 0.0 0 0 0 0 0 0 0 0 0 - -
Total 2.4 3 1 4 2 2 4 4 1 1 - -
Taking pupil to/from school
Car 2.8 8 2 3 1 0 5 0 1 3 - -
Goods Vehicle 0 0 0 0 0 0 0 1 0 0 - -
HGV 0 0 0 0 0 0 0 0 0 0 - -
Motorcycle 0 0 0 0 0 0 0 0 0 0 - -
Pedal cycle 0 0 0 0 0 0 0 0 0 0 - -
Agricultural vehicle 0 0 0 0 0 0 0 0 0 0 - -
Other 0 0 0 0 0 0 0 0 0 0 - -
Bus or coach 0.2 1 0 0 0 0 17 0 0 0 - -
Total 3 9 2 3 1 0 22 1 1 3 - -
Other Total 0 0 0 0 0 0 0 8 170 13 - -92.4
Unknown Total 1411.2 1604 1478 1450 1242 1282 1193 1122 927 1038 -26.4 12.0
Notes: (a) Values in this table report the number of fatalities (pedestrian and occupant) with respect to the vehicle and driver they were associated with.

HA Publication PR67/14 App 97
Table I-13 Seriously injured casualties distributed by time of day and year
Grouped Time
2005-2009 BSL
average 2005 2006 2007 2008 2009 2010 2011 2012 2013
2013 per cent change from BSL
average
2013 per cent change from
2012
0 - 6am 270.2 329 279 295 231 217 218 192 169 150 -44.5 -11.2
6 - 10am 327.4 366 339 344 288 300 276 269 272 270 -17.5 -0.7
10am - 2pm 390.8 465 410 374 344 361 325 352 332 334 -14.5 0.6
2 - 6pm 500.6 546 570 508 430 449 465 438 395 402 -19.7 1.8
6pm - 0am 474.8 562 453 514 460 385 353 327 311 309 -34.9 -0.6
Notes: (a) One collision in 2005 was excluded due to no time being recorded.
Table I-14 Seriously injured casualties by day of week and year
Day
2005-2009 BSL
average 2005 2006 2007 2008 2009 2010 2011 2012 2013
2013 per cent change from BSL
average
2013 per cent change from
2012
Monday 265.8 303 254 312 222 238 243 228 211 192 -27.8 -9.0
Tuesday 249 288 246 258 231 222 191 189 171 230 -7.6 34.5
Wednesday 255.8 286 300 279 214 200 206 185 179 177 -30.8 -1.1
Thursday 259.8 291 284 261 247 216 217 188 184 203 -21.9 10.3
Friday 302.0 362 306 292 285 265 296 257 242 261 -13.6 7.9
Saturday 304.4 361 302 313 260 286 244 229 242 207 -32.0 -14.5
Sunday 327.2 378 359 320 294 285 240 302 250 195 -40.4 -22.0
Table I-15 Seriously injured casualties distributed by month of year and year
Month
2005-2009 BSL
average 2005 2006 2007 2008 2009 2010 2011 2012 2013
2013 per cent change from BSL
average
2013 per cent change from
2012
Jan 160.6 189 137 198 121 158 92 114 100 89 -44.6 -11.0
Feb 134.6 174 131 124 146 98 107 100 113 91 -32.4 -19.5
Mar 148.2 163 145 147 162 124 110 112 114 93 -37.2 -18.4
Apr 166.2 160 174 191 171 135 163 132 129 111 -33.2 -14.0
May 158.4 180 168 147 123 174 144 149 129 123 -22.3 -4.7
Jun 173.2 203 177 167 149 170 129 125 112 113 -34.8 0.9
Jul 189.8 239 223 189 174 124 175 147 125 159 -16.2 27.2
Aug 192.0 211 197 192 194 166 176 165 156 163 -15.1 4.5
Sep 167.2 196 161 179 138 162 154 157 118 142 -15.1 20.3
Oct 151.2 194 156 161 117 128 132 119 129 148 -2.1 14.7
Nov 161.6 185 182 177 132 132 128 144 131 113 -30.1 -13.7
Dec 161.0 175 200 163 126 141 127 114 123 120 -25.5 -2.4

HA Publication PR67/14 App 98
Appendix J: Young Motorists Table J-1 to Table J-10 provide breakdowns of collisions and casualties involving young motorist by road name, road classification, contributory
factors, severity, age group, time of day and month of year.
Table J-1 Collisions involving young motorists by road classification, severity and year
Road Classification Collision Severity
2005-2009
BSL average 2005 2006 2007 2008 2009 2010 2011 2012 2013
2013 per cent
change from BSL
average
2013 per cent
change from
2012
Motorway - Fatal 31.8 40 38 32 30 19 23 20 10 12 -62.3 -
Serious 163.0 172 159 188 160 136 149 118 97 106 -35.0 9.3
Fatal + Serious 194.8 212 197 220 190 155 172 138 107 118 -39.4 10.3
Slight 1,800.8 1,985 1,869 1,862 1,648 1,640 1,479 1,282 1,141 1,094 -39.2 -4.1
Total 1,995.6 2,197 2,066 2,082 1,838 1,795 1,651 1,420 1,248 1,212 -39.3 -2.9
A-road Dual Carriageway
Built-up Fatal 1.0 1 1 0 2 1 0 1 1 0 - -
Serious 10.2 10 8 11 9 13 9 7 10 6 - -
Fatal + Serious 11.2 11 9 11 11 14 9 8 11 6 - -
Slight 160.8 161 157 170 174 142 116 145 130 111 -31.0 -14.6
Total 172.0 172 166 181 185 156 125 153 141 117 -32.0 -17.0
Non Built-up Fatal 25.4 29 22 31 23 22 20 24 11 21 -17.3 -
Serious 131.8 158 144 127 119 111 104 109 92 65 -50.7 -29.3
Fatal + Serious 157.2 187 166 158 142 133 124 133 103 86 -45.3 -16.5
Slight 1,162.8 1,244 1,281 1,182 1,056 1,051 933 957 882 803 -30.9 -9.0
Total 1,320.0 1,431 1,447 1,340 1,198 1,184 1,057 1,090 985 889 -32.7 -9.7
A-road Single Carriageway
Built-up Fatal 1.0 1 1 1 1 1 4 1 0 0 - -
Serious 12.6 16 8 17 8 14 11 15 8 11 - -
Fatal + Serious 13.6 17 9 18 9 15 15 16 8 11 - -
Slight 115.6 125 109 121 114 109 79 87 86 89 -23.0 3.5
Total 129.2 142 118 139 123 124 94 103 94 100 -22.6 6.4
Non Built-up Fatal 11.4 22 11 7 12 5 8 11 7 7 - -
Serious 63.4 67 70 69 56 55 47 37 39 38 -40.1 -2.6
Fatal + Serious 74.8 89 81 76 68 60 55 48 46 45 -39.8 -2.2
Slight 343.6 389 379 366 275 309 267 218 216 200 -41.8 -7.4
Total 418.4 478 460 442 343 369 322 266 262 245 -41.4 -6.5
Other - Total 0.0 0 0 0 0 0 0 0 0 1 - -
Notes: (a) Values in the table report the number of collisions where at least one of the drivers was recorded as a young motorist. (b) Where the road classification is denoted as “Other”, these collisions were located on sections of the reference network that have been downgraded in class (to B or below)
since 2010.
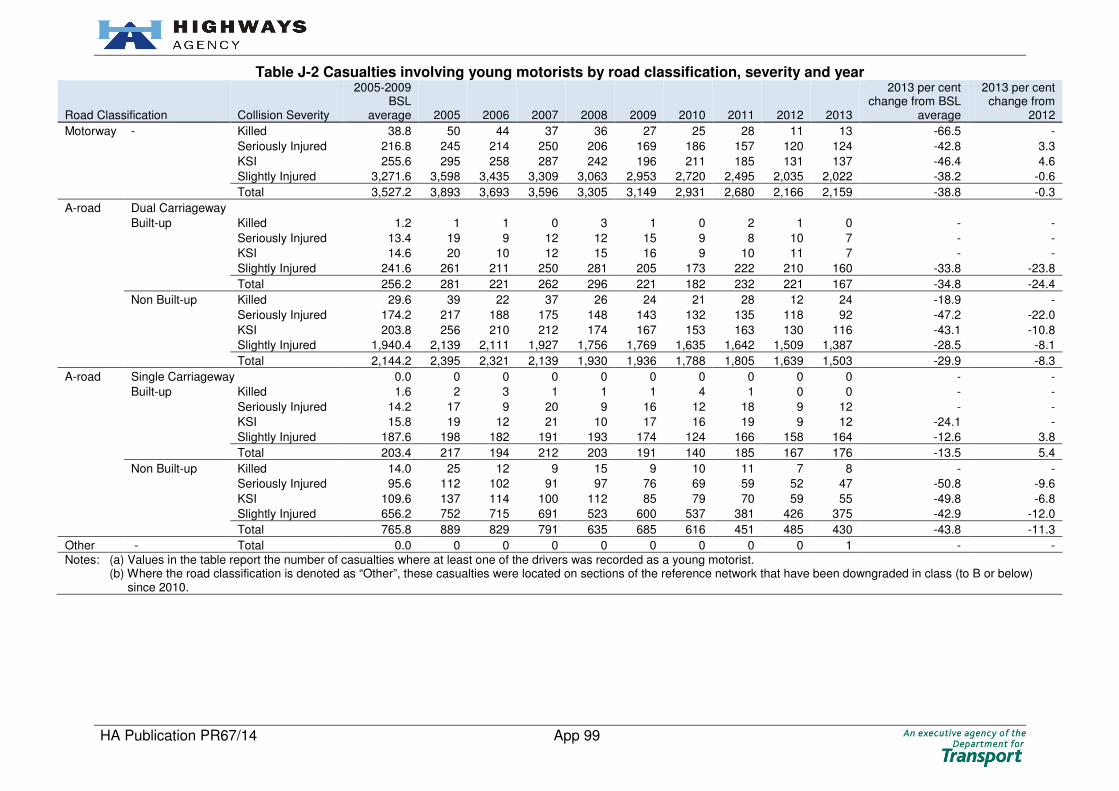
HA Publication PR67/14 App 99
Table J-2 Casualties involving young motorists by road classification, severity and year
Road Classification Collision Severity
2005-2009 BSL
average 2005 2006 2007 2008 2009 2010 2011 2012 2013
2013 per cent change from BSL
average
2013 per cent change from
2012
Motorway - Killed 38.8 50 44 37 36 27 25 28 11 13 -66.5 -
Seriously Injured 216.8 245 214 250 206 169 186 157 120 124 -42.8 3.3
KSI 255.6 295 258 287 242 196 211 185 131 137 -46.4 4.6
Slightly Injured 3,271.6 3,598 3,435 3,309 3,063 2,953 2,720 2,495 2,035 2,022 -38.2 -0.6
Total 3,527.2 3,893 3,693 3,596 3,305 3,149 2,931 2,680 2,166 2,159 -38.8 -0.3
A-road Dual Carriageway
Built-up Killed 1.2 1 1 0 3 1 0 2 1 0 - -
Seriously Injured 13.4 19 9 12 12 15 9 8 10 7 - -
KSI 14.6 20 10 12 15 16 9 10 11 7 - -
Slightly Injured 241.6 261 211 250 281 205 173 222 210 160 -33.8 -23.8
Total 256.2 281 221 262 296 221 182 232 221 167 -34.8 -24.4
Non Built-up Killed 29.6 39 22 37 26 24 21 28 12 24 -18.9 -
Seriously Injured 174.2 217 188 175 148 143 132 135 118 92 -47.2 -22.0
KSI 203.8 256 210 212 174 167 153 163 130 116 -43.1 -10.8
Slightly Injured 1,940.4 2,139 2,111 1,927 1,756 1,769 1,635 1,642 1,509 1,387 -28.5 -8.1
Total 2,144.2 2,395 2,321 2,139 1,930 1,936 1,788 1,805 1,639 1,503 -29.9 -8.3
A-road Single Carriageway 0.0 0 0 0 0 0 0 0 0 0 - -
Built-up Killed 1.6 2 3 1 1 1 4 1 0 0 - -
Seriously Injured 14.2 17 9 20 9 16 12 18 9 12 - -
KSI 15.8 19 12 21 10 17 16 19 9 12 -24.1 -
Slightly Injured 187.6 198 182 191 193 174 124 166 158 164 -12.6 3.8
Total 203.4 217 194 212 203 191 140 185 167 176 -13.5 5.4
Non Built-up Killed 14.0 25 12 9 15 9 10 11 7 8 - -
Seriously Injured 95.6 112 102 91 97 76 69 59 52 47 -50.8 -9.6
KSI 109.6 137 114 100 112 85 79 70 59 55 -49.8 -6.8
Slightly Injured 656.2 752 715 691 523 600 537 381 426 375 -42.9 -12.0
Total 765.8 889 829 791 635 685 616 451 485 430 -43.8 -11.3
Other - Total 0.0 0 0 0 0 0 0 0 0 1 - -
Notes: (a) Values in the table report the number of casualties where at least one of the drivers was recorded as a young motorist. (b) Where the road classification is denoted as “Other”, these casualties were located on sections of the reference network that have been downgraded in class (to B or below)
since 2010.

HA Publication PR67/14 App 100
Table J-3 Collisions involving young motorists by severity and year
Collision Severity
2005-2009 BSL
average 2005 2006 2007 2008 2009 2010 2011 2012 2013
2013 per cent change from BSL
average
2013 per cent change from
2012
Fatal 70.6 93 73 71 68 48 55 57 29 40 -43.3 37.9
Serious 381.0 423 389 412 352 329 320 286 246 226 -40.7 -8.1
Fatal + Serious 451.6 516 462 483 420 377 375 343 275 266 -41.1 -3.3
Slight 3,583.6 3,904 3,795 3,701 3,267 3,251 2,874 2,689 2,455 2,298 -35.9 -6.4
Total 4,035.2 4,420 4,257 4,184 3,687 3,628 3,249 3,032 2,730 2,564 -36.5 -6.1
Notes: (a) Values in the table report the number of collisions where at least one of the drivers was recorded as a young motorist.
Table J-4i. Casualties involving young motorists by age group, severity and year
Casualty Age Group Casualty Severity
2005-2009 BSL
average 2005 2006 2007 2008 2009 2010 2011 2012 2013
2013 per cent change from BSL
average
2013 per cent change from
2012
Children (0-15) Killed 2.8 3 0 3 4 4 0 0 0 1 - -
Seriously Injured 18.2 18 22 19 22 10 12 15 11 2 -89.0 -
KSI 21.0 21 22 22 26 14 12 15 11 3 -85.7 -
Slightly Injured 251.2 305 285 216 225 225 196 175 180 195 -22.4 8.3
Total 272.2 326 307 238 251 239 208 190 191 198 -27.3 3.7
Young (16-19) Killed 16.2 24 13 20 12 12 8 15 2 10 -38.3 -
Seriously Injured 123.6 169 129 120 95 105 80 67 47 46 -62.8 -2.1
KSI 139.8 193 142 140 107 117 88 82 49 56 -59.9 14.3
Slightly Injured 1,208.8 1,287 1,254 1,263 1,168 1,072 975 807 688 625 -48.3 -9.2
Total 1,348.6 1,480 1,396 1,403 1,275 1,189 1,063 889 737 681 -49.5 -7.6
Other (20-59) Killed 59.0 83 58 57 58 39 45 45 26 30 -49.2 15.4
Seriously Injured 335.0 377 335 380 316 267 277 263 213 211 -37.0 -0.9
KSI 394.0 460 393 437 374 306 322 308 239 241 -38.8 0.8
Slightly Injured 4,491.0 4,987 4,745 4,549 4,094 4,080 3,759 3,647 3,212 3,018 -32.8 -6.0
Total 4,885.0 5,447 5,138 4,986 4,468 4,386 4,081 3,955 3,451 3,259 -33.3 -5.6
Older (60-69) Killed 3.2 2 5 1 4 4 3 3 1 2 - -
Seriously Injured 19.0 27 14 17 22 15 23 18 18 15 -21.1 -16.7
KSI 22.2 29 19 18 26 19 26 21 19 17 -23.4 -10.5
Slightly Injured 174.6 163 195 173 183 159 147 169 133 147 -15.8 10.5
Total 196.8 192 214 191 209 178 173 190 152 164 -16.7 7.9
Elderly (70+) Killed 4.0 5 6 3 3 3 4 7 2 2 - -
Seriously Injured 14.6 12 20 8 13 20 14 13 18 7 - -61.1
KSI 18.6 17 26 11 16 23 18 20 20 9 -51.6 -55.0
Slightly Injured 101.0 101 80 94 105 125 82 69 87 74 -26.7 -14.9
Total 119.6 118 106 105 121 148 100 89 107 83 -30.6 -22.4
Notes: (a) Values in the table report the number of casualties where at least one of the drivers was recorded as a young motorist.

HA Publication PR67/14 App 101
Table J-4ii. Casualties involving young motorists by age group, severity and year (Contd.)
Casualty Age Group Casualty Severity
2005-2009 BSL
average 2005 2006 2007 2008 2009 2010 2011 2012 2013
2013 per cent change from BSL
average
2013 per cent change from
2012
Unknown Killed 0.0 0 0 0 0 0 0 0 0 0 - -
Seriously Injured 3.8 7 2 4 4 2 2 1 2 1 - -
KSI 3.8 7 2 4 4 2 2 1 2 1 - -
Slightly Injured 70.8 105 95 73 41 40 30 39 38 50 -29.4 31.6
Total 74.6 112 97 77 45 42 32 40 40 51 -31.6 27.5
Notes: (a) Values in the table report the number of casualties where at least one of the drivers was recorded as a young motorist.
Table J-5 Killed casualties involving young motorists by top 20 road names and year
No. Road Name
2005-2009 BSL
average 2005 2006 2007 2008 2009 2010 2011 2012 2013
2013 per cent change from BSL
average
2013 per cent change from
2012
1 A1 3.0 3 3 6 1 2 1 2 1 7 - -
2 A14 1.6 0 1 5 0 2 1 2 2 4 - -
3 A30 1.8 3 0 2 3 1 2 0 1 3 - -
4 A419 0.2 0 0 1 0 0 0 0 0 3 - -
5 A46 1.6 3 1 0 2 2 2 1 2 2 - -
6 A36 1.2 1 2 1 0 2 0 1 1 2 - -
7 M40 2.6 1 2 5 4 1 1 0 1 2 - -
8 M6 6.4 6 11 4 7 4 2 3 0 2 - -
9 A47 2.6 7 2 3 1 0 3 2 0 2 - -
10 A1(M) 2.0 5 1 1 3 0 2 1 0 2 - -
11 A19 1.2 1 1 1 2 1 0 1 0 2 - -
12 M1 9.0 10 10 9 5 11 4 6 5 1 - -
13 A5 2.4 5 2 3 2 0 2 0 3 1 - -
14 M4 3.2 6 4 3 0 3 3 2 2 1 - -
15 M5 2.8 4 1 2 5 2 7 8 0 1 - -
16 A12 1.0 2 1 1 0 1 2 3 0 1 - -
17 A590 0.0 0 0 0 0 0 0 2 0 1 - -
18 A500 1.2 1 0 1 2 2 1 1 0 1 - -
19 M25 2.0 1 6 0 0 3 1 1 0 1 - -
20 A1304 0.0 0 0 0 0 0 0 0 0 1 - -
Notes: (a) Values in the table report the number of killed casualties where at least one of the drivers was recorded as a young motorist. (b) Ranked by 2013.
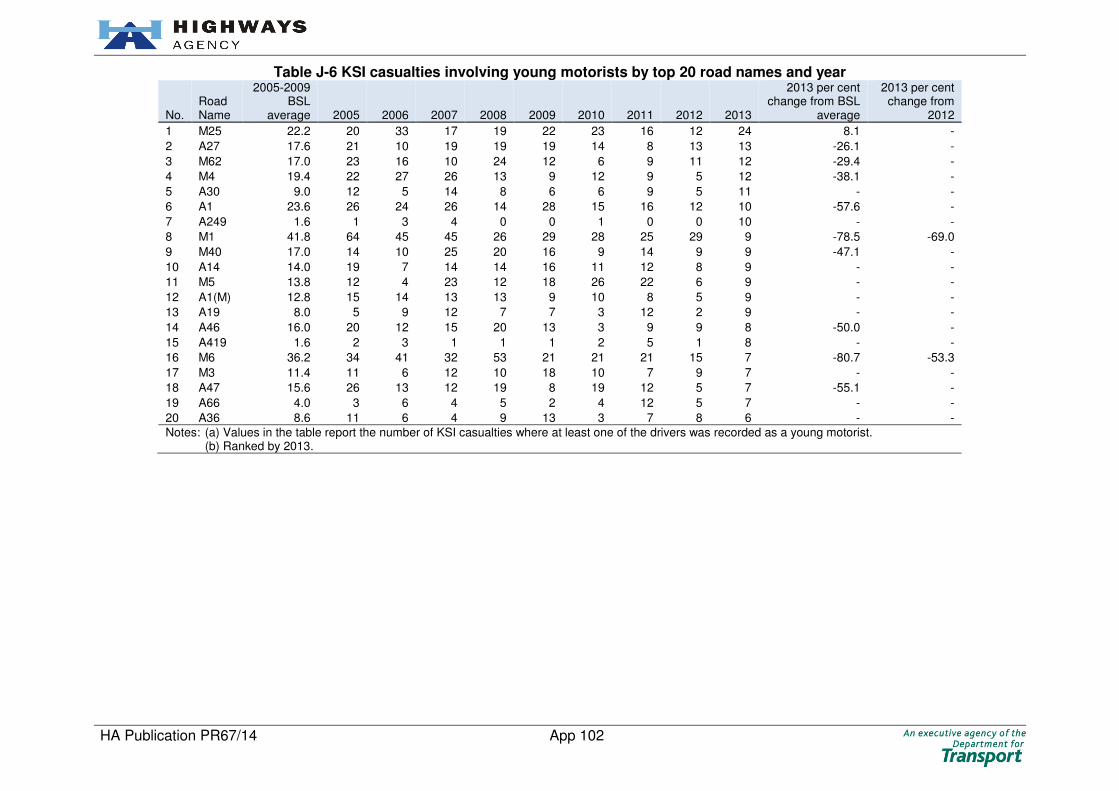
HA Publication PR67/14 App 102
Table J-6 KSI casualties involving young motorists by top 20 road names and year
No. Road Name
2005-2009 BSL
average 2005 2006 2007 2008 2009 2010 2011 2012 2013
2013 per cent change from BSL
average
2013 per cent change from
2012
1 M25 22.2 20 33 17 19 22 23 16 12 24 8.1 -
2 A27 17.6 21 10 19 19 19 14 8 13 13 -26.1 -
3 M62 17.0 23 16 10 24 12 6 9 11 12 -29.4 -
4 M4 19.4 22 27 26 13 9 12 9 5 12 -38.1 -
5 A30 9.0 12 5 14 8 6 6 9 5 11 - -
6 A1 23.6 26 24 26 14 28 15 16 12 10 -57.6 -
7 A249 1.6 1 3 4 0 0 1 0 0 10 - -
8 M1 41.8 64 45 45 26 29 28 25 29 9 -78.5 -69.0
9 M40 17.0 14 10 25 20 16 9 14 9 9 -47.1 -
10 A14 14.0 19 7 14 14 16 11 12 8 9 - -
11 M5 13.8 12 4 23 12 18 26 22 6 9 - -
12 A1(M) 12.8 15 14 13 13 9 10 8 5 9 - -
13 A19 8.0 5 9 12 7 7 3 12 2 9 - -
14 A46 16.0 20 12 15 20 13 3 9 9 8 -50.0 -
15 A419 1.6 2 3 1 1 1 2 5 1 8 - -
16 M6 36.2 34 41 32 53 21 21 21 15 7 -80.7 -53.3
17 M3 11.4 11 6 12 10 18 10 7 9 7 - -
18 A47 15.6 26 13 12 19 8 19 12 5 7 -55.1 -
19 A66 4.0 3 6 4 5 2 4 12 5 7 - -
20 A36 8.6 11 6 4 9 13 3 7 8 6 - -
Notes: (a) Values in the table report the number of KSI casualties where at least one of the drivers was recorded as a young motorist. (b) Ranked by 2013.

HA Publication PR67/14 App 103
Table J-7 Top 20 contributory factors in collisions involving young motorists
No. CF Contributory Factors
2005-2009 BSL
average 2005 2006 2007 2008 2009 2010 2011 2012 2013
2013 per cent change from BSL
average
2013 per cent change from
2012
1 405 Failed to look properly 915.8 801 970 985 928 895 865 847 854 756 -17.4 -11.5
2 406 Failed to judge other person’s path or speed 931.8 923 1,009 977 905 845 807 751 778 747 -19.8 -4.0
3 308 Following too close 606.4 717 665 587 512 551 463 466 442 412 -32.1 -6.8
4 410 Loss of control 761.4 794 813 829 679 692 653 559 520 402 -47.2 -22.7
5 408 Sudden braking 540.0 537 629 555 454 525 427 429 340 372 -31.1 9.4
6 602 Careless, reckless or in a hurry 471.4 515 488 545 400 409 342 363 321 272 -42.3 -15.3
7 403 Poor turn or manoeuvre 396.4 434 425 411 361 351 317 293 279 263 -33.7 -5.7
8 103 Slippery road (due to weather) 396.0 403 380 374 389 434 370 241 313 242 -38.9 -22.7
9 307 Travelling too fast for conditions 465.6 510 513 504 401 400 305 266 247 196 -57.9 -20.6
10 409 Swerved 307.4 316 356 321 260 284 286 225 231 192 -37.5 -16.9
11 605 Learner or inexperienced driver/rider 295.0 300 324 329 278 244 224 182 174 166 -43.7 -4.6
12 509 Distraction in vehicle 129.8 169 114 135 106 125 124 130 116 113 -12.9 -2.6
13 503 Fatigue 163.4 156 193 161 156 151 136 127 117 97 -40.6 -17.1
14 306 Exceeding speed limit 148.0 165 166 166 128 115 109 117 88 80 -45.9 -9.1
15 501 Impaired by alcohol 142.8 132 169 144 135 134 108 106 106 74 -48.2 -30.2
16 601 Aggressive driving 112.4 121 120 117 101 103 95 83 77 66 -41.3 -14.3
17 707 Rain, sleet, snow, or fog 93.0 102 99 83 102 79 81 51 80 57 -38.7 -28.8
18 603 Nervous, uncertain or panic 80.2 83 84 96 73 65 77 69 61 52 -35.2 -14.8
19 510 Distraction outside vehicle 68.2 68 68 62 73 70 43 49 65 45 -34.0 -30.8
20 710 Vehicle blind spot 68.8 75 76 69 64 60 67 49 48 43 -37.5 -10.4
Notes: (a) Values in the table report the number of collisions where at least one of the drivers was recorded as a young motorist and at least one of the specified contributory factors was recorded.
(b) Ranked by 2013.

HA Publication PR67/14 App 104
Table J-8 Collisions involving young motorist by severity, time of day and year
Grouped Time
Collision Severity
2005-2009 BSL
average 2005 2006 2007 2008 2009 2010 2011 2012 2013
2013 per cent change from BSL
average
2013 per cent change from
2012
0 - 6am Fatal 18.0 23 15 19 20 13 15 13 8 10 -44.4 -
Serious 63.2 66 68 81 54 47 51 42 35 24 -62.0 -31.4
Fatal + Serious 81.2 89 83 100 74 60 66 55 43 34 -58.1 -20.9
Slight 271.8 285 294 263 271 246 193 185 179 154 -43.3 -14.0
Total 353.0 374 377 363 345 306 259 240 222 188 -46.7 -15.3
6 - 10am Fatal 10.6 11 14 7 8 13 8 6 5 8 - -
Serious 61.2 54 58 69 68 57 49 51 43 37 -39.5 -14.0
Fatal + Serious 71.8 65 72 76 76 70 57 57 48 45 -37.3 -6.3
Slight 719.6 730 770 779 672 647 585 548 482 442 -38.6 -8.3
Total 791.4 795 842 855 748 717 642 605 530 487 -38.5 -8.1
10am - 2pm Fatal 8.2 7 10 9 10 5 4 6 2 3 - -
Serious 55.6 67 62 60 50 39 48 52 39 35 -37.1 -10.3
Fatal + Serious 63.8 74 72 69 60 44 52 58 41 38 -40.4 -7.3
Slight 685.8 746 726 734 604 619 549 505 490 430 -37.3 -12.2
Total 749.6 820 798 803 664 663 601 563 531 468 -37.6 -11.9
2 - 6pm Fatal 11.2 19 13 8 12 4 12 8 4 6 - -
Serious 89.2 98 104 84 66 94 84 75 79 58 -35.0 -26.6
Fatal + Serious 100.4 117 117 92 78 98 96 83 83 64 -36.3 -22.9
Slight 1,068.0 1,193 1,112 1,086 973 976 877 797 715 713 -33.2 -0.3
Total 1,168.4 1,310 1,229 1,178 1,051 1,074 973 880 798 777 -33.5 -2.6
6pm - 0am Fatal 22.6 33 21 28 18 13 16 24 10 13 -42.5 -
Serious 111.8 138 97 118 114 92 88 66 50 72 -35.6 44.0
Fatal + Serious 134.4 171 118 146 132 105 104 90 60 85 -36.8 41.7
Slight 838.4 950 893 839 747 763 670 654 589 559 -33.3 -5.1
Total 972.8 1,121 1,011 985 879 868 774 744 649 644 -33.8 -0.8
Notes: (a) Values in the table report the number of collisions where at least one of the drivers was recorded as a young motorist.
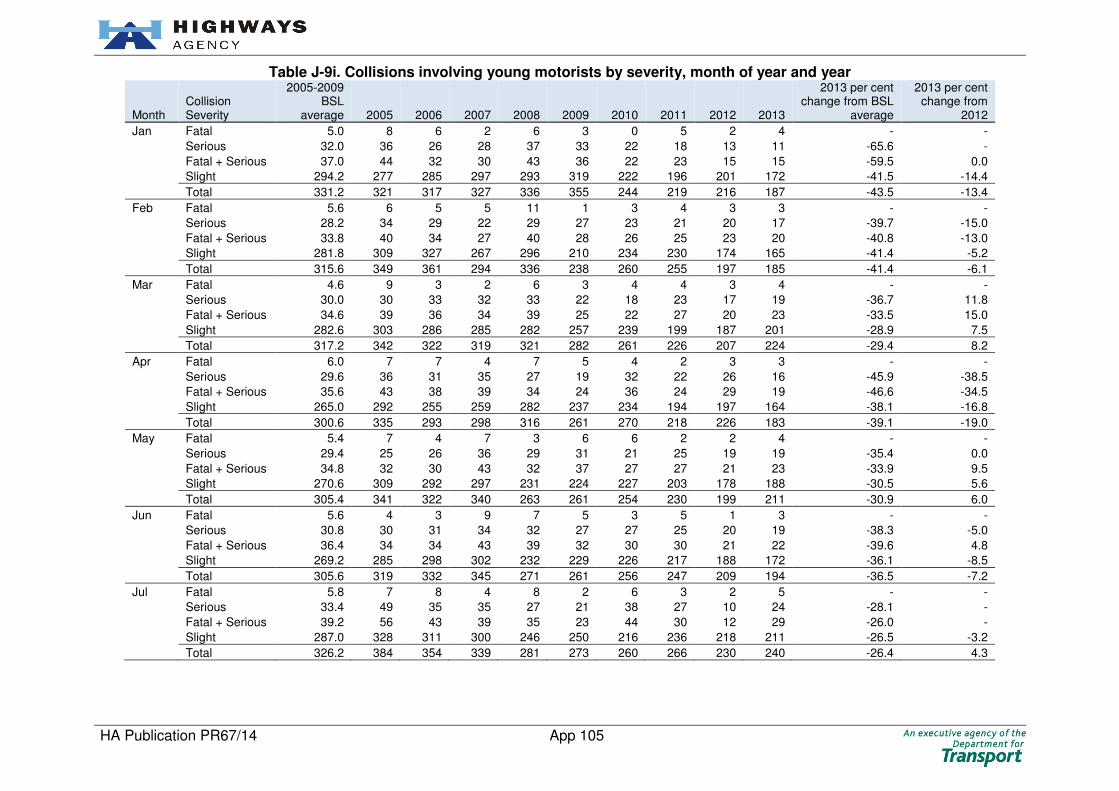
HA Publication PR67/14 App 105
Table J-9i. Collisions involving young motorists by severity, month of year and year
Month Collision Severity
2005-2009 BSL
average 2005 2006 2007 2008 2009 2010 2011 2012 2013
2013 per cent change from BSL
average
2013 per cent change from
2012
Jan Fatal 5.0 8 6 2 6 3 0 5 2 4 - -
Serious 32.0 36 26 28 37 33 22 18 13 11 -65.6 -
Fatal + Serious 37.0 44 32 30 43 36 22 23 15 15 -59.5 0.0
Slight 294.2 277 285 297 293 319 222 196 201 172 -41.5 -14.4
Total 331.2 321 317 327 336 355 244 219 216 187 -43.5 -13.4
Feb Fatal 5.6 6 5 5 11 1 3 4 3 3 - -
Serious 28.2 34 29 22 29 27 23 21 20 17 -39.7 -15.0
Fatal + Serious 33.8 40 34 27 40 28 26 25 23 20 -40.8 -13.0
Slight 281.8 309 327 267 296 210 234 230 174 165 -41.4 -5.2
Total 315.6 349 361 294 336 238 260 255 197 185 -41.4 -6.1
Mar Fatal 4.6 9 3 2 6 3 4 4 3 4 - -
Serious 30.0 30 33 32 33 22 18 23 17 19 -36.7 11.8
Fatal + Serious 34.6 39 36 34 39 25 22 27 20 23 -33.5 15.0
Slight 282.6 303 286 285 282 257 239 199 187 201 -28.9 7.5
Total 317.2 342 322 319 321 282 261 226 207 224 -29.4 8.2
Apr Fatal 6.0 7 7 4 7 5 4 2 3 3 - -
Serious 29.6 36 31 35 27 19 32 22 26 16 -45.9 -38.5
Fatal + Serious 35.6 43 38 39 34 24 36 24 29 19 -46.6 -34.5
Slight 265.0 292 255 259 282 237 234 194 197 164 -38.1 -16.8
Total 300.6 335 293 298 316 261 270 218 226 183 -39.1 -19.0
May Fatal 5.4 7 4 7 3 6 6 2 2 4 - -
Serious 29.4 25 26 36 29 31 21 25 19 19 -35.4 0.0
Fatal + Serious 34.8 32 30 43 32 37 27 27 21 23 -33.9 9.5
Slight 270.6 309 292 297 231 224 227 203 178 188 -30.5 5.6
Total 305.4 341 322 340 263 261 254 230 199 211 -30.9 6.0
Jun Fatal 5.6 4 3 9 7 5 3 5 1 3 - -
Serious 30.8 30 31 34 32 27 27 25 20 19 -38.3 -5.0
Fatal + Serious 36.4 34 34 43 39 32 30 30 21 22 -39.6 4.8
Slight 269.2 285 298 302 232 229 226 217 188 172 -36.1 -8.5
Total 305.6 319 332 345 271 261 256 247 209 194 -36.5 -7.2
Jul Fatal 5.8 7 8 4 8 2 6 3 2 5 - -
Serious 33.4 49 35 35 27 21 38 27 10 24 -28.1 -
Fatal + Serious 39.2 56 43 39 35 23 44 30 12 29 -26.0 -
Slight 287.0 328 311 300 246 250 216 236 218 211 -26.5 -3.2
Total 326.2 384 354 339 281 273 260 266 230 240 -26.4 4.3

HA Publication PR67/14 App 106
Table J-9ii. Collisions involving young motorists by severity, month of year and year
Month Collision Severity
2005-2009 BSL
average 2005 2006 2007 2008 2009 2010 2011 2012 2013
2013 per cent change from BSL
average
2013 per cent change from
2012
Aug Fatal 6.4 8 5 7 6 6 10 7 1 3 - -
Serious 33.6 33 35 39 32 29 19 22 26 22 -34.5 -15.4
Fatal + Serious 40.0 41 40 46 38 35 29 29 27 25 -37.5 -7.4
Slight 309.2 366 294 337 264 285 215 222 225 205 -33.7 -8.9
Total 349.2 407 334 383 302 320 244 251 252 230 -34.1 -8.7
Sep Fatal 6.0 9 8 6 2 5 6 6 2 2 - -
Serious 31.2 33 28 37 27 31 27 34 17 23 -26.3 35.3
Fatal + Serious 37.2 42 36 43 29 36 33 40 19 25 -32.8 31.6
Slight 295.0 292 358 321 245 259 253 209 197 189 -35.9 -4.1
Total 332.2 334 394 364 274 295 286 249 216 214 -35.6 -0.9
Oct Fatal 5.2 6 4 10 4 2 6 4 5 0 - -
Serious 33.0 49 32 36 22 26 29 24 29 22 -33.3 -24.1
Fatal + Serious 38.2 55 36 46 26 28 35 28 34 22 -42.4 -35.3
Slight 329.6 392 355 334 291 276 278 265 182 222 -32.6 22.0
Total 367.8 447 391 380 317 304 313 293 216 244 -33.7 13.0
Nov Fatal 5.6 7 8 6 2 5 3 7 1 4 - -
Serious 35.6 37 39 38 30 34 35 22 29 17 -52.2 -41.4
Fatal + Serious 41.2 44 47 44 32 39 38 29 30 21 -49.0 -30.0
Slight 367.0 399 382 344 338 372 307 251 270 217 -40.9 -19.6
Total 408.2 443 429 388 370 411 345 280 300 238 -41.7 -20.7
Dec Fatal 9.4 15 12 9 6 5 4 8 4 5 - -
Serious 34.2 31 44 40 27 29 29 23 20 17 -50.3 -15.0
Fatal + Serious 43.6 46 56 49 33 34 33 31 24 22 -49.5 -8.3
Slight 332.4 352 352 358 267 333 223 267 238 192 -42.2 -19.3
Total 376.0 398 408 407 300 367 256 298 262 214 -43.1 -18.3

HA Publication PR67/14 App 107
Table J-10 Casualties by young motorist involvement in contributory factors, severity and year
CF Involvement Casualty Severity
2005-2009 BSL
average 2005 2006 2007 2008 2009 2010 2011 2012 2013
2013 per cent change from BSL
average
2013 per cent change from
2012
Full Killed 45.4 63 45 32 43 44 24 30 9 26 -42.7 -
Seriously Injured 292.4 344 321 292 272 233 226 230 168 149 -49.0 -11.3
KSI 337.8 407 366 324 315 277 250 260 177 175 -48.2 -1.1
Slightly Injured 2,981.8 3,196 3,094 3,140 2,761 2,718 2,383 2,198 2,065 1,737 -41.7 -15.9
Total 3,319.6 3,603 3,460 3,464 3,076 2,995 2,633 2,458 2,242 1,912 -42.4 -14.7
Partially Killed 11.8 16 8 13 14 8 7 9 6 4 - -
Seriously Injured 81.8 93 78 91 82 65 53 41 50 50 -38.9 0.0
KSI 93.6 109 86 104 96 73 60 50 56 54 -42.3 -3.6
Slightly Injured 1,113.2 1,160 1,257 1,028 1,129 992 1,004 1,027 884 733 -34.2 -17.1
Total 1,206.8 1,269 1,343 1,132 1,225 1,065 1,064 1,077 940 787 -34.8 -16.3
None Killed 31.2 42 32 45 26 11 31 32 20 19 -39.1 -5.0
Seriously Injured 172.2 215 149 191 155 151 150 123 103 95 -44.8 -7.8
KSI 203.4 257 181 236 181 162 181 155 123 114 -44.0 -7.3
Slightly Injured 2,706.8 3,111 2,835 2,706 2,424 2,458 2,147 2,075 1,614 1,882 -30.5 16.6
Total 2,910.2 3,368 3,016 2,942 2,605 2,620 2,328 2,230 1,737 1,996 -31.4 14.9
Notes: (a) Values in the table report the number of casualties by severity where at least one young motorist was recorded as being involved and had the corresponding contributory factor involvement.

HA Publication PR67/14 App 108
Appendix K: Smart Motorways This section reports on each smart motorway scheme by casualty
severity, HATRIS links, casualty rates and contributory factors. The
notes on this page should be referred to when considering any of the
diagrams or tables within this section.
Important Notes: (a) All collisions and casualties are located on the main carriageway
of the given scheme, any collisions involving roundabouts or
collisions located on slip roads have been excluded.
(b) The limits of each scheme are to the centre of the junctions that
define the scheme ends.
(c) “Road link ref.” is the HATRIS link that the collision and
associated casualties are located on, and is from the centre of a
junction to the centre of the adjacent junction.
(d) Values in the contributory factors table reports the codes of the
top ten contributory factors by year (a list of codes and their
decriptions can be found in Appendix F Table F-1). It is ranked
based on collisions where at least one of the specified
contributory factors was recorded within that year.
(e) Casualty rates indicate the number of casualties by traffic. The
yearly traffic for each scheme has been estimated by combining
the traffic and length in the DFT count points relevant for the
scheme.
(f) The date indicated as the “open to traffic date” is only an
approximation.
(g) The diagram provided for each scheme are to aid the locations
of HATRIS links and are a simplified respresentation of the road.
Different types of smart motorway include: [Adapted from Highways Agency Smart Motorway information
website. Accessed at:
http://www.highways.gov.uk/our-road-network/managing-our-
roads/improving-our-network/smart-motorways/]
Controlled motorway: Controlled motorways have three or more
lanes with variable speed limits. The hard shoulder is only used in
emergencies.
All lane running (ALR): There is no hard shoulder on these sec-
tions of motorway. Road users must obey variable speed limits and
not stop on the motorway. In an emergency, road users will need to
use an emergency refuge area, motorway service area or leave at
the next junction.
Hard shoulder running (HSR): The hard shoulder is operational
during busy periods; the speed limit is reduced. Road users cannot
use the hard shoulder unless overhead signs indicate they are open.
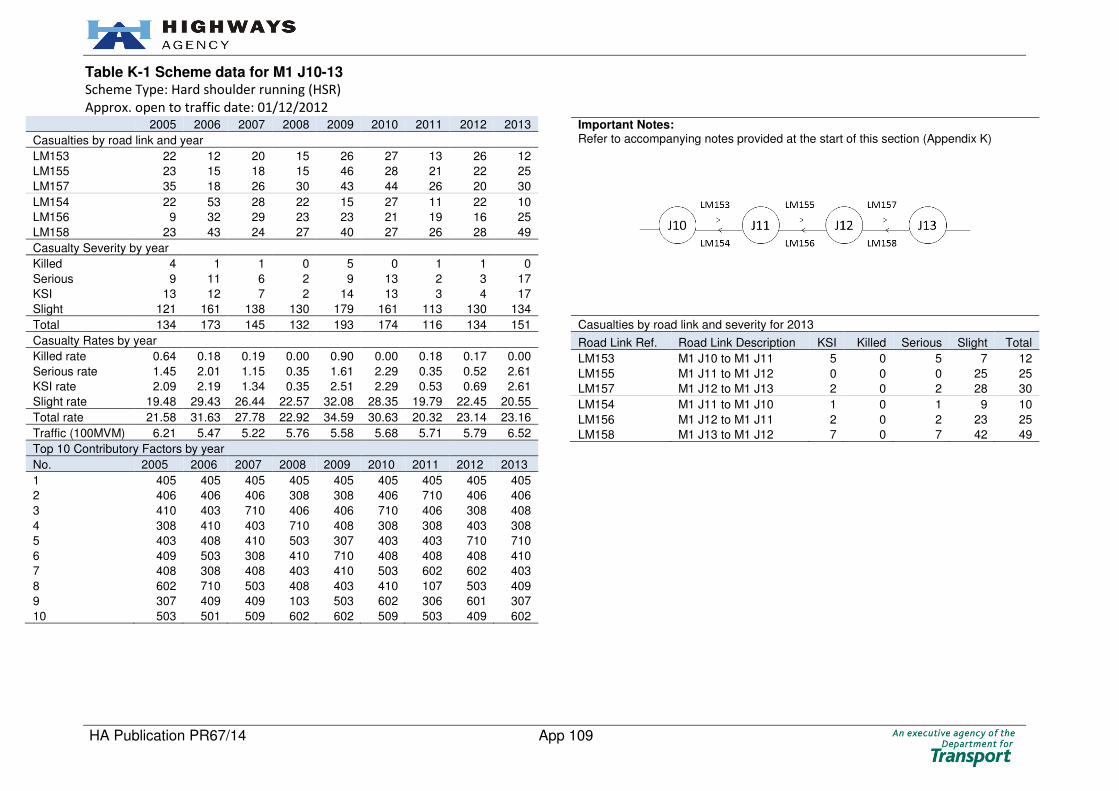
HA Publication PR67/14 App 109
Table K-1 Scheme data for M1 J10-13 Scheme Type: Hard shoulder running (HSR)
Approx. open to traffic date: 01/12/2012
2005 2006 2007 2008 2009 2010 2011 2012 2013
Casualties by road link and year
LM153 22 12 20 15 26 27 13 26 12
LM155 23 15 18 15 46 28 21 22 25
LM157 35 18 26 30 43 44 26 20 30
LM154 22 53 28 22 15 27 11 22 10
LM156 9 32 29 23 23 21 19 16 25
LM158 23 43 24 27 40 27 26 28 49
Casualty Severity by year
Killed 4 1 1 0 5 0 1 1 0
Serious 9 11 6 2 9 13 2 3 17
KSI 13 12 7 2 14 13 3 4 17
Slight 121 161 138 130 179 161 113 130 134
Total 134 173 145 132 193 174 116 134 151
Casualty Rates by year
Killed rate 0.64 0.18 0.19 0.00 0.90 0.00 0.18 0.17 0.00
Serious rate 1.45 2.01 1.15 0.35 1.61 2.29 0.35 0.52 2.61
KSI rate 2.09 2.19 1.34 0.35 2.51 2.29 0.53 0.69 2.61
Slight rate 19.48 29.43 26.44 22.57 32.08 28.35 19.79 22.45 20.55
Total rate 21.58 31.63 27.78 22.92 34.59 30.63 20.32 23.14 23.16
Traffic (100MVM) 6.21 5.47 5.22 5.76 5.58 5.68 5.71 5.79 6.52
Top 10 Contributory Factors by year
No. 2005 2006 2007 2008 2009 2010 2011 2012 2013
1 405 405 405 405 405 405 405 405 405
2 406 406 406 308 308 406 710 406 406
3 410 403 710 406 406 710 406 308 408
4 308 410 403 710 408 308 308 403 308
5 403 408 410 503 307 403 403 710 710
6 409 503 308 410 710 408 408 408 410
7 408 308 408 403 410 503 602 602 403
8 602 710 503 408 403 410 107 503 409
9 307 409 409 103 503 602 306 601 307
10 503 501 509 602 602 509 503 409 602
Important Notes: Refer to accompanying notes provided at the start of this section (Appendix K)
Casualties by road link and severity for 2013
Road Link Ref. Road Link Description KSI Killed Serious Slight Total
LM153 M1 J10 to M1 J11 5 0 5 7 12
LM155 M1 J11 to M1 J12 0 0 0 25 25
LM157 M1 J12 to M1 J13 2 0 2 28 30
LM154 M1 J11 to M1 J10 1 0 1 9 10
LM156 M1 J12 to M1 J11 2 0 2 23 25
LM158 M1 J13 to M1 J12 7 0 7 42 49

HA Publication PR67/14 App 110
2005 2006 2007 2008 2009 2010 2011 2012 2013
Casualties by road link and year
LM209 9 18 16 19 12 11 15 3 5
LM211 20 16 8 9 13 25 8 14 11
LM213 0 2 1 0 2 0 0 2 1
LM215 12 8 9 9 11 0 9 4 8
LM217 3 2 2 3 1 4 3 3 8
LM210 7 11 22 15 5 8 6 10 6
LM212 22 23 7 16 6 10 4 9 6
LM214 3 4 0 0 1 2 0 0 1
LM216 7 28 24 14 10 12 9 4 9
LM218 1 8 5 4 0 2 4 6 1
Casualty Severity by year
Killed 0 4 3 0 1 1 0 1 0
Serious 3 9 7 4 6 3 4 2 2
KSI 3 13 10 4 7 4 4 3 2
Slight 81 107 84 85 54 70 54 52 54
Total 84 120 94 89 61 74 58 55 56
Casualty Rates by year
Killed rate 0.00 0.98 0.74 0.00 0.25 0.25 0.00 0.26 0.00
Serious rate 0.75 2.20 1.72 1.02 1.49 0.76 1.00 0.53 0.51
KSI rate 0.75 3.17 2.46 1.02 1.73 1.01 1.00 0.79 0.51
Slight rate 20.25 26.10 20.64 21.57 13.37 17.72 13.50 13.68 13.71
Total rate 21.00 29.27 23.10 22.59 15.10 18.73 14.50 14.47 14.21
Traffic (100MVM) 4.00 4.10 4.07 3.94 4.04 3.95 4.00 3.80 3.94
Top 10 Contributory Factors by year
No. 2005 2006 2007 2008 2009 2010 2011 2012 2013
1 406 410 406 406 406 406 406 406 405
2 308 406 405 405 405 408 405 405 406
3 410 405 410 410 410 405 408 410 308
4 405 408 308 307 409 410 410 308 408
5 408 409 408 403 408 710 308 408 710
6 710 308 307 409 308 308 409 307 403
7 307 710 403 103 307 409 103 409 410
8 509 602 409 408 103 103 710 602 307
9 409 307 710 308 403 403 403 103 509
10 602 103 605 501 602 501 605 710 409
Important Notes: Refer to accompanying notes provided at the start of this section (Appendix K)
Casualties by road link and severity for 2013
Road Link Ref. Road Link Description KSI Killed Serious Slight Total
LM209 M1 J32 to M1 J33 0 0 0 5 5
LM211 M1 J33 to M1 J34S 2 0 2 9 11
LM213 M1 J34S to M1 J34N 0 0 0 1 1
LM215 M1 J34N to M1 J35 0 0 0 8 8
LM217 M1 J35 to M1 J35a 0 0 0 8 8
LM210 M1 J33 to M1 J32 0 0 0 6 6
LM212 M1 J34S to M1 J33 0 0 0 6 6
LM214 M1 J34N to M1 J34S 0 0 0 1 1
LM216 M1 J35 to M1 J34N 0 0 0 9 9
LM218 M1 J35a to M1 J35 0 0 0 1 1
Table K-2 Scheme data for M1 J32-35A Scheme Type: All lane running (ALR)
Approx. open to traffic date: Currently not opened, scheduled to open summer 2015.

HA Publication PR67/14 App 111
2005 2006 2007 2008 2009 2010 2011 2012 2013
Casualties by road link and year
LM197 69 76 24 67 33 23 25 42 34
LM1060 37 29 31 24 17 17 21 30 19
LM199A 30 41 11 7 8 4 15 11 12
LM205 14 24 49 7 11 9 8 6 8
LM198 59 61 48 39 33 22 31 14 31
LM1061 16 21 24 7 17 9 25 12 12
LM200A 41 8 15 29 28 25 15 31 13
LM206 23 18 2 4 15 19 14 13 12
Casualty Severity by year
Killed 1 4 2 2 2 0 2 1 0
Serious 6 6 12 12 9 7 8 6 3
KSI 7 10 14 14 11 7 10 7 3
Slight 282 268 190 170 151 121 144 152 138
Total 289 278 204 184 162 128 154 159 141
Casualty Rates by year
Killed rate 0.13 0.52 0.26 0.26 0.26 0.00 0.25 0.13 0.00
Serious rate 0.78 0.79 1.58 1.55 1.18 0.90 1.01 0.77 0.38
KSI rate 0.91 1.31 1.84 1.81 1.44 0.90 1.26 0.90 0.38
Slight rate 36.62 35.12 25.00 21.99 19.74 15.63 18.09 19.46 17.47
Total rate 37.53 36.44 26.84 23.80 21.18 16.54 19.35 20.36 17.85
Traffic (100MVM) 7.70 7.63 7.60 7.73 7.65 7.74 7.96 7.81 7.90
Top 10 Contributory Factors by year
No. 2005 2006 2007 2008 2009 2010 2011 2012 2013
1 406 308 308 406 406 410 308 308 406
2 308 406 406 405 405 406 405 405 308
3 408 307 405 408 308 408 406 307 405
4 405 405 408 308 410 308 410 410 408
5 410 408 410 410 408 405 307 406 410
6 307 410 403 602 710 307 602 408 103
7 403 602 307 307 307 409 509 103 307
8 409 403 602 403 602 103 408 710 403
9 602 503 503 503 403 710 103 503 710
10 103 103 103 605 409 602 306 403 503
Important Notes: Refer to accompanying notes provided at the start of this section (Appendix K)
Casualties by road link and severity for 2013
Road Link Ref. Road Link Description KSI Killed Serious Slight Total
LM197 M1 J28 to M1 J29 2 0 2 32 34
LM1060 M1 J29 to M1 J29a 0 0 0 19 19
LM199A M1 J29a to M1 J30 0 0 0 12 12
LM205 M1 J30 to M1 J31 0 0 0 8 8
LM198 M1 J29 to M1 J28 0 0 0 31 31
LM1061 M1 J29a to M1 J29 1 0 1 11 12
LM200A M1 J30 to M1 J29a 0 0 0 13 13
LM206 M1 J31 to M1 J30 0 0 0 12 12
Table K-3 Scheme data for M1 J28-31 Scheme Type: All lane running (ALR)
Approx. open to traffic date: Currently not opened, scheduled to open summer 2015.

HA Publication PR67/14 App 112
2005 2006 2007 2008 2009 2010 2011 2012 2013
Casualties by road link and year
LM227 8 4 9 14 1 1 7 3 6
LM229 4 5 3 7 4 6 3 2 4
LM231 11 8 16 8 4 5 3 10 6
LM228 6 2 3 3 3 7 1 4 2
LM230 10 4 7 6 9 3 4 5 2
LM232 5 7 6 3 6 3 6 0 4
Casualty Severity by year
Killed 0 1 0 0 1 1 0 0 1
Serious 1 1 2 5 2 1 1 1 4
KSI 1 2 2 5 3 2 1 1 5
Slight 43 28 42 36 24 23 23 23 19
Total 44 30 44 41 27 25 24 24 24
Casualty Rates by year
Killed rate 0.00 0.35 0.00 0.00 0.38 0.38 0.00 0.00 0.39
Serious rate 0.35 0.35 0.73 1.75 0.77 0.38 0.37 0.38 1.56
KSI rate 0.35 0.70 0.73 1.75 1.15 0.75 0.37 0.38 1.95
Slight rate 15.19 9.86 15.27 12.63 9.23 8.68 8.61 8.75 7.42
Total rate 15.55 10.56 16.00 14.39 10.38 9.43 8.99 9.13 9.38
Traffic (100MVM) 2.83 2.84 2.75 2.85 2.60 2.65 2.67 2.63 2.56
Top 10 Contributory Factors by year
No. 2005 2006 2007 2008 2009 2010 2011 2012 2013
1 405 405 406 406 308 405 405 405 405
2 406 410 405 410 405 410 406 406 406
3 409 307 308 405 410 308 410 408 410
4 308 409 410 408 403 408 308 410 408
5 410 406 710 308 406 307 408 409 409
6 307 308 403 602 103 403 103 306 107
7 602 602 503 109 602 406 107 308 501
8 510 509 605 307 109 103 206 103 306
9 509 710 306 409 204 710 605 401 308
10 710 503 408 103 503 607 710 505 402
Important Notes: Refer to accompanying notes provided at the start of this section (Appendix K)
Casualties by road link and severity for 2013
Road Link Ref. Road Link Description KSI Killed Serious Slight Total
LM227 M1 J39 to M1 J40 1 0 1 5 6
LM229 M1 J40 to M1 J41 1 0 1 3 4
LM231 M1 J41 to M1 J42 2 1 1 4 6
LM228 M1 J40 to M1 J39 1 0 1 1 2
LM230 M1 J41 to M1 J40 0 0 0 2 2
LM232 M1 J42 to M1 J41 0 0 0 4 4
Table K-4 Scheme data for M1 J39-42 Scheme Type: All lane running (ALR)
Approx. open to traffic date: Currently not opened, scheduled to open summer 2015.

HA Publication PR67/14 App 113
Table K-5 Scheme data for M1 J6a-10 Scheme Type: Controlled motorway – 4 lanes
Approx. open to traffic date: 01/12/2008
2005 2006 2007 2008 2009 2010 2011 2012 2013
Casualties by road link and year
LM251 32 31 33 34 22 11 10 27 14
LM253 7 13 8 6 9 10 3 11 7
LM257 200 53 85 42 35 43 30 31 29
LM255 45 12 22 10 24 22 9 21 8
LM252 59 10 29 23 19 16 20 8 24
LM254 8 9 6 3 2 2 2 5 1
LM258 109 63 48 85 22 21 11 8 7
LM256 102 88 41 24 4 16 3 10 7
Casualty Severity by year
Killed 7 0 0 0 0 1 0 1 1
Serious 30 11 10 16 10 13 3 6 7
KSI 37 11 10 16 10 14 3 7 8
Slight 525 268 262 211 127 127 85 114 89
Total 562 279 272 227 137 141 88 121 97
Casualty Rates by year
Killed rate 0.99 0.00 0.00 0.00 0.00 0.14 0.00 0.12 0.12
Serious rate 4.25 1.55 1.53 2.51 1.29 1.83 0.40 0.75 0.85
KSI rate 5.24 1.55 1.53 2.51 1.29 1.97 0.40 0.87 0.97
Slight rate 74.36 37.69 40.12 33.12 16.39 17.86 11.27 14.16 10.76
Total rate 79.60 39.24 41.65 35.64 17.68 19.83 11.67 15.03 11.73
Traffic (100MVM) 7.06 7.11 6.53 6.37 7.75 7.11 7.54 8.05 8.27
Top 10 Contributory Factors by year
No. 2005 2006 2007 2008 2009 2010 2011 2012 2013
1 308 308 405 405 405 405 405 405 405
2 406 405 308 406 410 406 410 103 406
3 408 406 406 308 408 410 406 410 308
4 405 602 602 408 406 408 408 307 410
5 307 307 307 403 409 308 307 406 408
6 602 408 408 602 307 307 710 408 409
7 410 710 107 710 403 409 308 308 103
8 710 403 403 107 602 602 403 602 307
9 403 410 710 307 103 710 103 409 501
10 409 103 103 409 308 103 509 306 602
Important Notes: Refer to accompanying notes provided at the start of this section (Appendix K)
Casualties by road link and severity for 2013
Road Link Ref. Road Link Description KSI Killed Serious Slight Total
LM251 M1 J6A to M1 J7 4 0 4 10 14
LM253 M1 J7 to M1 J8 0 0 0 7 7
LM257 M1 J8 to M1 J9 1 0 1 28 29
LM255 M1 J9 to M1 J10 0 0 0 8 8
LM252 M1 J7 to M1 J6A 1 0 1 23 24
LM254 M1 J8 to M1 J7 0 0 0 1 1
LM258 M1 J9 to M1 J8 1 0 1 6 7
LM256 M1 J10 to M1 J9 1 1 0 6 7
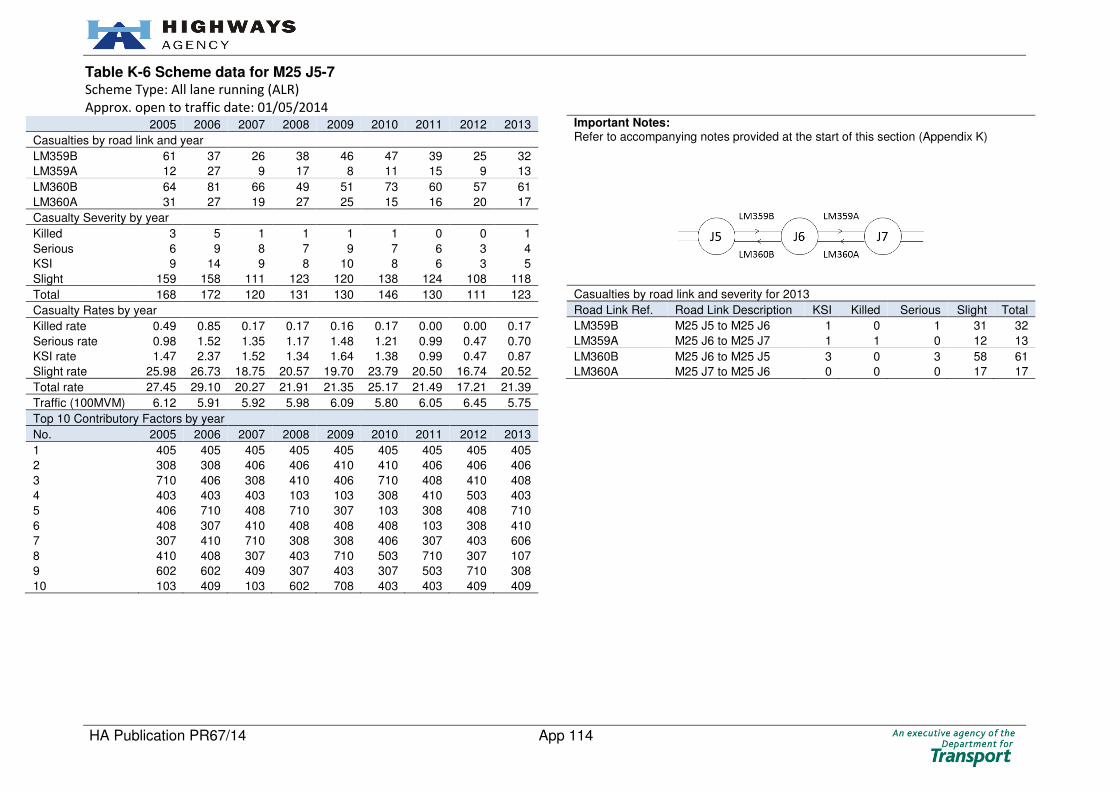
HA Publication PR67/14 App 114
Table K-6 Scheme data for M25 J5-7 Scheme Type: All lane running (ALR)
Approx. open to traffic date: 01/05/2014
2005 2006 2007 2008 2009 2010 2011 2012 2013
Casualties by road link and year
LM359B 61 37 26 38 46 47 39 25 32
LM359A 12 27 9 17 8 11 15 9 13
LM360B 64 81 66 49 51 73 60 57 61
LM360A 31 27 19 27 25 15 16 20 17
Casualty Severity by year
Killed 3 5 1 1 1 1 0 0 1
Serious 6 9 8 7 9 7 6 3 4
KSI 9 14 9 8 10 8 6 3 5
Slight 159 158 111 123 120 138 124 108 118
Total 168 172 120 131 130 146 130 111 123
Casualty Rates by year
Killed rate 0.49 0.85 0.17 0.17 0.16 0.17 0.00 0.00 0.17
Serious rate 0.98 1.52 1.35 1.17 1.48 1.21 0.99 0.47 0.70
KSI rate 1.47 2.37 1.52 1.34 1.64 1.38 0.99 0.47 0.87
Slight rate 25.98 26.73 18.75 20.57 19.70 23.79 20.50 16.74 20.52
Total rate 27.45 29.10 20.27 21.91 21.35 25.17 21.49 17.21 21.39
Traffic (100MVM) 6.12 5.91 5.92 5.98 6.09 5.80 6.05 6.45 5.75
Top 10 Contributory Factors by year
No. 2005 2006 2007 2008 2009 2010 2011 2012 2013
1 405 405 405 405 405 405 405 405 405
2 308 308 406 406 410 410 406 406 406
3 710 406 308 410 406 710 408 410 408
4 403 403 403 103 103 308 410 503 403
5 406 710 408 710 307 103 308 408 710
6 408 307 410 408 408 408 103 308 410
7 307 410 710 308 308 406 307 403 606
8 410 408 307 403 710 503 710 307 107
9 602 602 409 307 403 307 503 710 308
10 103 409 103 602 708 403 403 409 409
Important Notes: Refer to accompanying notes provided at the start of this section (Appendix K)
Casualties by road link and severity for 2013
Road Link Ref. Road Link Description KSI Killed Serious Slight Total
LM359B M25 J5 to M25 J6 1 0 1 31 32
LM359A M25 J6 to M25 J7 1 1 0 12 13
LM360B M25 J6 to M25 J5 3 0 3 58 61
LM360A M25 J7 to M25 J6 0 0 0 17 17

HA Publication PR67/14 App 115
Table K-7 Scheme data for M25 J23-27 Scheme Type: All lane running (ALR)
Approx. open to traffic date: 01/12/2014
2005 2006 2007 2008 2009 2010 2011 2012 2013
Casualties by road link and year
LM331 20 16 26 9 17 10 10 13 9
LM333 68 50 38 17 29 19 27 19 15
LM335 15 15 13 13 11 13 19 2 10
LM337 15 14 12 17 16 21 12 10 16
LM332 22 13 24 21 20 17 24 16 3
LM334 23 33 24 19 10 17 19 25 17
LM336 31 25 78 21 13 17 16 28 17
LM338 2 14 10 9 7 9 10 16 10
Casualty Severity by year
Killed 1 4 5 1 2 1 2 1 1
Serious 18 20 14 9 11 11 11 10 9
KSI 19 24 19 10 13 12 13 11 10
Slight 177 156 206 116 110 111 124 118 87
Total 196 180 225 126 123 123 137 129 97
Casualty Rates by year
Killed rate 0.15 0.47 0.57 0.00 0.14 0.14 0.29 0.14 0.15
Serious rate 1.95 1.40 1.01 0.75 1.00 1.29 0.88 1.08 0.73
KSI rate 2.11 1.86 1.58 0.75 1.15 1.43 1.17 1.22 0.87
Slight rate 17.89 15.22 14.66 9.10 9.74 7.57 10.57 8.67 5.54
Total rate 20.00 17.08 16.24 9.85 10.89 9.00 11.75 9.89 6.41
Traffic (100MVM) 6.65 6.44 6.96 6.70 6.98 7.00 6.81 7.38 6.86
Top 10 Contributory Factors by year
No. 2005 2006 2007 2008 2009 2010 2011 2012 2013
1 405 405 405 405 405 405 405 405 405
2 308 602 602 308 307 406 308 308 602
3 307 307 308 602 308 410 406 406 406
4 406 406 307 410 406 308 408 410 308
5 403 308 410 406 408 408 410 602 408
6 410 410 406 307 602 602 602 408 403
7 602 408 408 408 410 710 307 307 410
8 710 403 403 403 710 307 403 409 307
9 408 503 103 409 403 403 409 403 509
10 409 409 503 603 103 501 710 103 103
Important Notes: Refer to accompanying notes provided at the start of this section (Appendix K)
Casualties by road link and severity for 2013
Road Link Ref. Road Link Description KSI Killed Serious Slight Total
LM331 M25 J23 to M25 J24 2 0 2 7 9
LM333 M25 J24 to M25 J25 1 1 0 14 15
LM335 M25 J25 to M25 J26 0 0 0 10 10
LM337 M25 J26 to M25 J27 1 0 1 15 16
LM332 M25 J24 to M25 J23 0 0 0 3 3
LM334 M25 J25 to M25 J24 3 0 3 14 17
LM336 M25 J26 to M25 J26 2 0 2 15 17
LM338 M25 J27 to M25 J26 1 0 1 9 10

HA Publication PR67/14 App 116
Table K-8 Scheme data for M25 J16-23 Scheme Type: Controlled motorways – 4 lanes
Approx. open to traffic date: 01/04/2012
2005 2006 2007 2008 2009 2010 2011 2012 2013
Casualties by road link and year
LM311 62 38 41 23 27 47 12 16 4
LM313 10 12 9 11 13 7 0 7 1
LM315 26 19 24 18 10 11 14 6 12
LM321 8 6 8 5 6 6 4 5 2
LM323 32 16 6 22 8 23 26 14 4
LM325 10 2 10 2 2 4 2 1 0
LM327 36 29 28 25 15 20 11 16 11
LM329 30 23 23 10 27 22 17 18 26
LM312 38 43 65 17 29 5 24 27 19
LM314 10 16 8 7 15 1 10 4 3
LM316 17 11 19 5 15 7 11 10 3
LM322 8 12 14 6 13 7 8 4 2
LM324 36 18 28 12 15 17 1 4 8
LM326 4 5 1 2 0 6 7 2 1
LM328 18 18 36 25 15 21 11 11 5
LM330 37 44 26 46 26 26 8 12 14
Casualty Severity by year
Killed 5 5 1 1 3 2 1 3 1
Serious 17 17 28 5 19 10 6 14 11
KSI 22 22 29 6 22 12 7 17 12
Slight 360 290 317 230 214 218 159 140 103
Total 382 312 346 236 236 230 166 157 115
Casualty Rates by year
Killed rate 0.50 0.49 0.10 0.10 0.31 0.21 0.10 0.27 0.09
Serious rate 1.69 1.65 2.81 0.50 1.95 1.06 0.58 1.28 0.96
KSI rate 2.19 2.14 2.91 0.60 2.25 1.27 0.68 1.55 1.05
Slight rate 35.82 28.18 31.80 22.93 21.93 23.02 15.41 12.77 9.02
Total rate 38.01 30.32 34.70 23.53 24.18 24.29 16.09 14.32 10.07
Traffic (100MVM) 10.05 10.29 9.97 10.03 9.76 9.47 10.32 10.96 11.42
Top 10 Contributory Factors by year
No. 2005 2006 2007 2008 2009 2010 2011 2012 2013
1 308 406 405 405 405 405 405 405 405
2 406 405 406 406 308 406 308 406 406
3 405 308 308 308 406 308 408 410 308
4 408 410 408 408 408 408 406 602 410
5 410 408 602 410 602 307 403 308 403
6 403 307 410 403 403 602 410 503 602
7 602 403 403 307 410 710 710 403 710
8 103 103 503 602 409 410 409 307 408
9 409 710 710 710 307 503 307 103 409
10 710 602 307 103 103 103 602 710 103 Important Notes: Refer to accompanying notes provided at the start of this section (Appendix K)
Casualties by road link and severity for 2013
Road Link Ref. Road Link Description KSI Killed Serious Slight Total
LM311 M25 J16 to M25 J17 2 1 1 2 4
LM313 M25 J17 to M25 J18 0 0 0 1 1
LM315 M25 J18 to M25 J19 1 0 1 11 12
LM321 M25 J19 to M25 J20 0 0 0 2 2
LM323 M25 J20 to M25 J21 1 0 1 3 4
LM325 M25 J21 to M25 J21A 0 0 0 0 0
LM327 M25 J21A to M25 J22 1 0 1 10 11
LM329 M25 J22 to M25 J23 3 0 3 23 26
LM312 M25 J17 to M25 J16 1 0 1 18 19
LM314 M25 J18 to M25 J17 0 0 0 3 3
LM316 M25 J19 to M25 J18 0 0 0 3 3
LM322 M25 J20 to M25 J19 0 0 0 2 2
LM324 M25 J21 to M25 J20 1 0 1 7 8
LM326 M25 J21A to M25 J21 0 0 0 1 1
LM328 M25 J22 to M25 J21A 0 0 0 5 5
LM330 M25 J23 to M25 J22 2 0 2 12 14
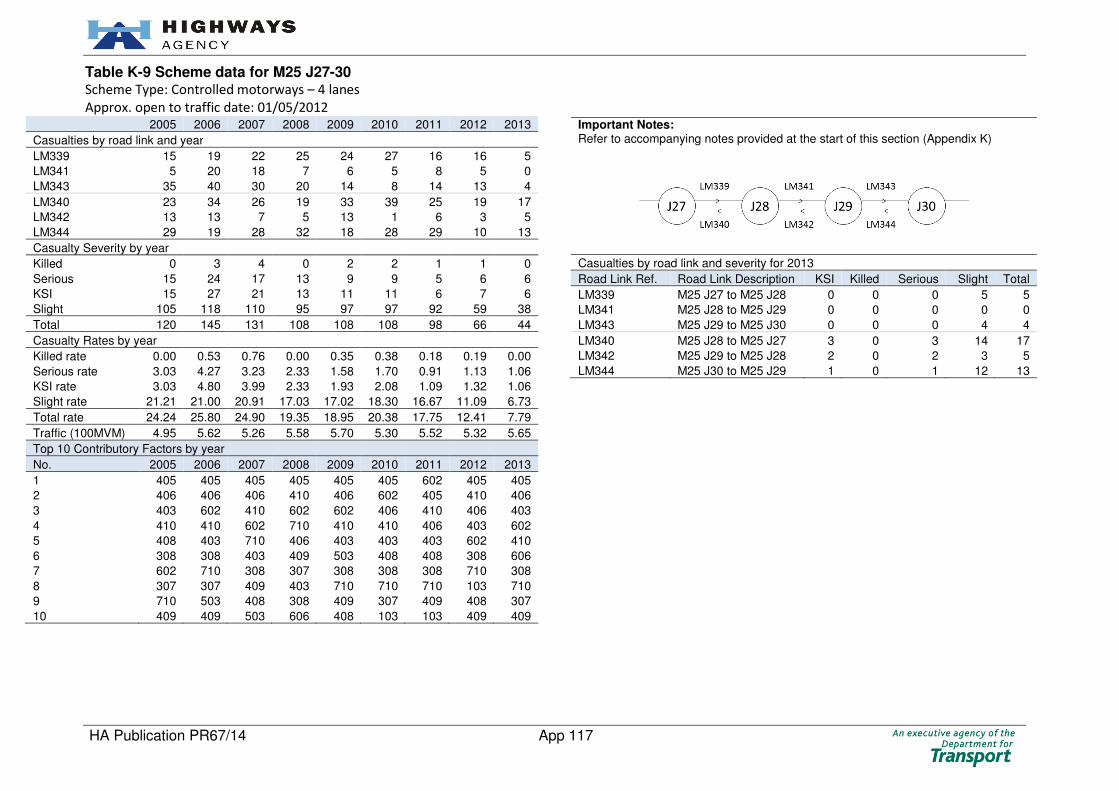
HA Publication PR67/14 App 117
Table K-9 Scheme data for M25 J27-30 Scheme Type: Controlled motorways – 4 lanes
Approx. open to traffic date: 01/05/2012
2005 2006 2007 2008 2009 2010 2011 2012 2013
Casualties by road link and year
LM339 15 19 22 25 24 27 16 16 5
LM341 5 20 18 7 6 5 8 5 0
LM343 35 40 30 20 14 8 14 13 4
LM340 23 34 26 19 33 39 25 19 17
LM342 13 13 7 5 13 1 6 3 5
LM344 29 19 28 32 18 28 29 10 13
Casualty Severity by year
Killed 0 3 4 0 2 2 1 1 0
Serious 15 24 17 13 9 9 5 6 6
KSI 15 27 21 13 11 11 6 7 6
Slight 105 118 110 95 97 97 92 59 38
Total 120 145 131 108 108 108 98 66 44
Casualty Rates by year
Killed rate 0.00 0.53 0.76 0.00 0.35 0.38 0.18 0.19 0.00
Serious rate 3.03 4.27 3.23 2.33 1.58 1.70 0.91 1.13 1.06
KSI rate 3.03 4.80 3.99 2.33 1.93 2.08 1.09 1.32 1.06
Slight rate 21.21 21.00 20.91 17.03 17.02 18.30 16.67 11.09 6.73
Total rate 24.24 25.80 24.90 19.35 18.95 20.38 17.75 12.41 7.79
Traffic (100MVM) 4.95 5.62 5.26 5.58 5.70 5.30 5.52 5.32 5.65
Top 10 Contributory Factors by year
No. 2005 2006 2007 2008 2009 2010 2011 2012 2013
1 405 405 405 405 405 405 602 405 405
2 406 406 406 410 406 602 405 410 406
3 403 602 410 602 602 406 410 406 403
4 410 410 602 710 410 410 406 403 602
5 408 403 710 406 403 403 403 602 410
6 308 308 403 409 503 408 408 308 606
7 602 710 308 307 308 308 308 710 308
8 307 307 409 403 710 710 710 103 710
9 710 503 408 308 409 307 409 408 307
10 409 409 503 606 408 103 103 409 409
Important Notes: Refer to accompanying notes provided at the start of this section (Appendix K)
Casualties by road link and severity for 2013
Road Link Ref. Road Link Description KSI Killed Serious Slight Total
LM339 M25 J27 to M25 J28 0 0 0 5 5
LM341 M25 J28 to M25 J29 0 0 0 0 0
LM343 M25 J29 to M25 J30 0 0 0 4 4
LM340 M25 J28 to M25 J27 3 0 3 14 17
LM342 M25 J29 to M25 J28 2 0 2 3 5
LM344 M25 J30 to M25 J29 1 0 1 12 13
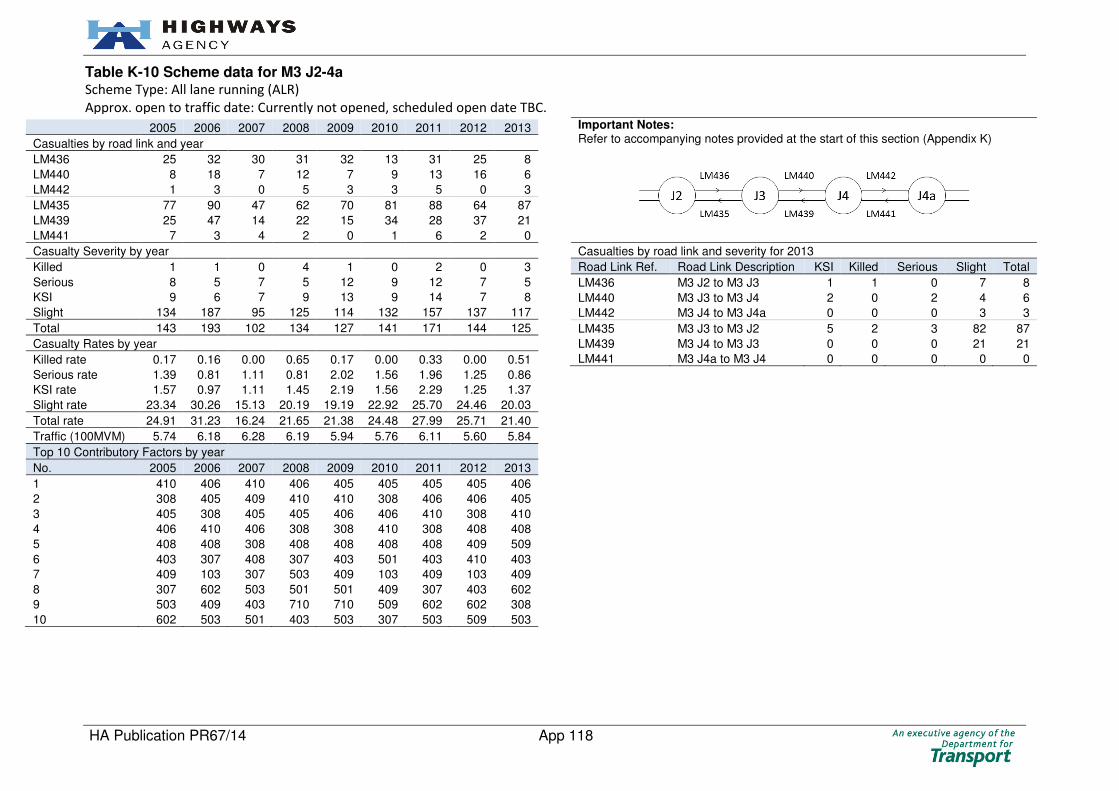
HA Publication PR67/14 App 118
2005 2006 2007 2008 2009 2010 2011 2012 2013
Casualties by road link and year
LM436 25 32 30 31 32 13 31 25 8
LM440 8 18 7 12 7 9 13 16 6
LM442 1 3 0 5 3 3 5 0 3
LM435 77 90 47 62 70 81 88 64 87
LM439 25 47 14 22 15 34 28 37 21
LM441 7 3 4 2 0 1 6 2 0
Casualty Severity by year
Killed 1 1 0 4 1 0 2 0 3
Serious 8 5 7 5 12 9 12 7 5
KSI 9 6 7 9 13 9 14 7 8
Slight 134 187 95 125 114 132 157 137 117
Total 143 193 102 134 127 141 171 144 125
Casualty Rates by year
Killed rate 0.17 0.16 0.00 0.65 0.17 0.00 0.33 0.00 0.51
Serious rate 1.39 0.81 1.11 0.81 2.02 1.56 1.96 1.25 0.86
KSI rate 1.57 0.97 1.11 1.45 2.19 1.56 2.29 1.25 1.37
Slight rate 23.34 30.26 15.13 20.19 19.19 22.92 25.70 24.46 20.03
Total rate 24.91 31.23 16.24 21.65 21.38 24.48 27.99 25.71 21.40
Traffic (100MVM) 5.74 6.18 6.28 6.19 5.94 5.76 6.11 5.60 5.84
Top 10 Contributory Factors by year
No. 2005 2006 2007 2008 2009 2010 2011 2012 2013
1 410 406 410 406 405 405 405 405 406
2 308 405 409 410 410 308 406 406 405
3 405 308 405 405 406 406 410 308 410
4 406 410 406 308 308 410 308 408 408
5 408 408 308 408 408 408 408 409 509
6 403 307 408 307 403 501 403 410 403
7 409 103 307 503 409 103 409 103 409
8 307 602 503 501 501 409 307 403 602
9 503 409 403 710 710 509 602 602 308
10 602 503 501 403 503 307 503 509 503
Important Notes: Refer to accompanying notes provided at the start of this section (Appendix K)
Casualties by road link and severity for 2013
Road Link Ref. Road Link Description KSI Killed Serious Slight Total
LM436 M3 J2 to M3 J3 1 1 0 7 8
LM440 M3 J3 to M3 J4 2 0 2 4 6
LM442 M3 J4 to M3 J4a 0 0 0 3 3
LM435 M3 J3 to M3 J2 5 2 3 82 87
LM439 M3 J4 to M3 J3 0 0 0 21 21
LM441 M3 J4a to M3 J4 0 0 0 0 0
Table K-10 Scheme data for M3 J2-4a Scheme Type: All lane running (ALR)
Approx. open to traffic date: Currently not opened, scheduled open date TBC.
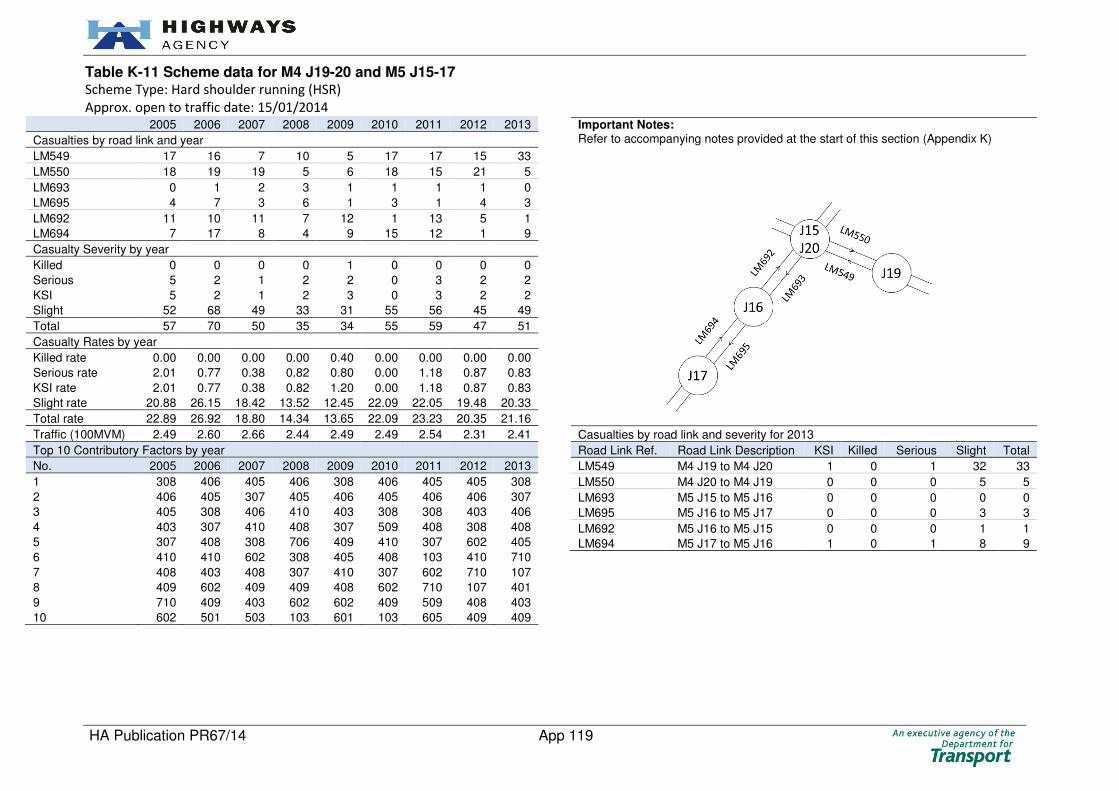
HA Publication PR67/14 App 119
Table K-11 Scheme data for M4 J19-20 and M5 J15-17 Scheme Type: Hard shoulder running (HSR)
Approx. open to traffic date: 15/01/2014
2005 2006 2007 2008 2009 2010 2011 2012 2013
Casualties by road link and year
LM549 17 16 7 10 5 17 17 15 33
LM550 18 19 19 5 6 18 15 21 5
LM693 0 1 2 3 1 1 1 1 0
LM695 4 7 3 6 1 3 1 4 3
LM692 11 10 11 7 12 1 13 5 1
LM694 7 17 8 4 9 15 12 1 9
Casualty Severity by year
Killed 0 0 0 0 1 0 0 0 0
Serious 5 2 1 2 2 0 3 2 2
KSI 5 2 1 2 3 0 3 2 2
Slight 52 68 49 33 31 55 56 45 49
Total 57 70 50 35 34 55 59 47 51
Casualty Rates by year
Killed rate 0.00 0.00 0.00 0.00 0.40 0.00 0.00 0.00 0.00
Serious rate 2.01 0.77 0.38 0.82 0.80 0.00 1.18 0.87 0.83
KSI rate 2.01 0.77 0.38 0.82 1.20 0.00 1.18 0.87 0.83
Slight rate 20.88 26.15 18.42 13.52 12.45 22.09 22.05 19.48 20.33
Total rate 22.89 26.92 18.80 14.34 13.65 22.09 23.23 20.35 21.16
Traffic (100MVM) 2.49 2.60 2.66 2.44 2.49 2.49 2.54 2.31 2.41
Top 10 Contributory Factors by year
No. 2005 2006 2007 2008 2009 2010 2011 2012 2013
1 308 406 405 406 308 406 405 405 308
2 406 405 307 405 406 405 406 406 307
3 405 308 406 410 403 308 308 403 406
4 403 307 410 408 307 509 408 308 408
5 307 408 308 706 409 410 307 602 405
6 410 410 602 308 405 408 103 410 710
7 408 403 408 307 410 307 602 710 107
8 409 602 409 409 408 602 710 107 401
9 710 409 403 602 602 409 509 408 403
10 602 501 503 103 601 103 605 409 409
Important Notes: Refer to accompanying notes provided at the start of this section (Appendix K)
Casualties by road link and severity for 2013
Road Link Ref. Road Link Description KSI Killed Serious Slight Total
LM549 M4 J19 to M4 J20 1 0 1 32 33
LM550 M4 J20 to M4 J19 0 0 0 5 5
LM693 M5 J15 to M5 J16 0 0 0 0 0
LM695 M5 J16 to M5 J17 0 0 0 3 3
LM692 M5 J16 to M5 J15 0 0 0 1 1
LM694 M5 J17 to M5 J16 1 0 1 8 9

HA Publication PR67/14 App 120
Table K-12 Scheme data for M42 J3a-7 Scheme Type: Hard shoulder running (HSR)
Approx. open to traffic date: 01/10/2006
2005 2006 2007 2008 2009 2010 2011 2012 2013
Casualties by road link and year
LM500 4 0 0 4 3 2 2 0 4
LM506 7 4 7 6 6 2 6 0 3
LM508 21 31 16 12 19 12 6 7 5
LM510 9 5 4 1 2 4 8 7 5
LM499 15 2 0 1 0 3 4 2 1
LM505 6 5 8 3 1 1 11 4 7
LM507 7 9 2 2 7 6 3 0 2
LM509 9 2 2 5 5 4 2 2 7
Casualty Severity by year
Killed 0 0 0 0 0 0 0 1 0
Serious 5 6 4 1 1 2 2 2 1
KSI 5 6 4 1 1 2 2 3 1
Slight 73 52 35 33 42 32 40 19 33
Total 78 58 39 34 43 34 42 22 34
Casualty Rates by year
Killed rate 0.00 0.00 0.00 0.00 0.00 0.00 0.00 0.20 0.00
Serious rate 1.10 1.34 0.84 0.21 0.22 0.43 0.39 0.40 0.20
KSI rate 1.10 1.34 0.84 0.21 0.22 0.43 0.39 0.59 0.20
Slight rate 16.04 11.58 7.35 6.86 9.07 6.84 7.81 3.75 6.57
Total rate 17.14 12.92 8.19 7.07 9.29 7.26 8.20 4.35 6.77
Traffic (100MVM) 4.55 4.49 4.76 4.81 4.63 4.68 5.12 5.06 5.02
Top 10 Contributory Factors by year
No. 2005 2006 2007 2008 2009 2010 2011 2012 2013
1 406 405 405 405 405 406 405 405 405
2 308 308 406 403 403 405 406 406 403
3 405 403 308 406 710 403 410 403 406
4 408 410 403 710 308 307 602 408 408
5 403 307 410 508 406 408 408 710 710
6 410 409 602 408 408 308 308 308 307
7 307 710 307 410 410 103 103 410 410
8 602 406 408 602 602 505 403 602 602
9 103 602 605 103 103 601 708 501 308
10 409 408 708 605 505 410 707 509 409
Important Notes: Refer to accompanying notes provided at the start of this section (Appendix K)
Casualties by road link and severity for 2013
Road Link Ref. Road Link Description KSI Killed Serious Slight Total
LM500 M42 J3A to M42 J4 0 0 0 4 4
LM506 M42 J4 to M42 J5 0 0 0 3 3
LM508 M42 J5 to M42 J6 0 0 0 5 5
LM510 M42 J6 to M42 J7 0 0 0 5 5
LM499 M42 J4 to M42 J3A 0 0 0 1 1
LM505 M42 J5 to M42 J4 0 0 0 7 7
LM507 M42 J6 to M42 J5 0 0 0 2 2
LM509 M42 J7 to M42 J6 1 0 1 6 7

HA Publication PR67/14 App 121
Table K-13 Scheme data for M42 J7-9 Scheme Type: Controlled motorways – 3 lanes
Approx. open to traffic date: 01/11/09
2005 2006 2007 2008 2009 2010 2011 2012 2013
Casualties by road link and year
LM514 0 0 0 0 0 2 0 0 0
LM513A 0 0 1 1 1 0 3 0 0
LM512A 8 1 2 1 0 3 5 0 6
LM1512 0 1 0 4 0 0 6 0 1
LM518A 2 8 1 6 1 3 8 4 3
LM1518 0 0 4 2 0 2 0 1 1
LM511A 5 3 3 3 0 1 1 12 5
LM1511 1 4 1 0 0 3 9 2 1
LM517 4 11 2 1 1 3 0 2 9
Casualty Severity by year
Killed 0 0 0 0 0 1 0 0 0
Serious 2 1 0 1 0 2 0 1 1
KSI 2 1 0 1 0 3 0 1 1
Slight 18 27 14 17 3 14 32 20 25
Total 20 28 14 18 3 17 32 21 26
Casualty Rates by year
Killed rate 0.00 0.00 0.00 0.00 0.00 0.36 0.00 0.00 0.00
Serious rate 0.71 0.36 0.00 0.36 0.00 0.73 0.00 0.40 0.40
KSI rate 0.71 0.36 0.00 0.36 0.00 1.09 0.00 0.40 0.40
Slight rate 6.36 9.71 5.15 6.07 1.13 5.09 12.75 8.03 10.08
Total rate 7.07 10.07 5.15 6.43 1.13 6.18 12.75 8.43 10.48
Traffic (100MVM) 2.83 2.78 2.72 2.80 2.65 2.75 2.51 2.49 2.48
Top 10 Contributory Factors by year
No. 2005 2006 2007 2008 2009 2010 2011 2012 2013
1 406 405 308 405 405 405 405 405 308
2 405 308 405 308 602 602 406 406 602
3 308 410 410 403 403 410 403 103 405
4 410 403 406 103 103 406 308 307 406
5 403 406 307 406 501 403 710 308 503
6 409 307 403 505 707 505 602 710 103
7 509 103 103 409 - 710 410 403 307
8 605 602 409 408 - 503 409 602 509
9 - 408 408 602 - 103 503 201 710
10 - 306 710 410 - 509 303 410 201
Important Notes: Refer to accompanying notes provided at the start of this section (Appendix K)
Casualties by road link and severity for 2013
Road Link Ref. Road Link Description KSI Killed Serious Slight Total
LM514 M42 J8 to M6 J4a 0 0 0 0 0
LM513A M6 J4a to M42 J8 0 0 0 0 0
LM512A M42 J7 to M42 J7a 0 0 0 6 6
LM1512 M42 J7a to M42 J8 0 0 0 1 1
LM518A M42 J8 to M42 J9S 1 0 1 2 3
LM1518 M42 J9S to M42 J9 0 0 0 1 1
LM511A M42 J7a to M42 J7 0 0 0 5 5
LM1511 M42 J8 to M42 J7a 0 0 0 1 1
LM517 M42 J9 to M42 J8 0 0 0 9 9

HA Publication PR67/14 App 122
Table K-14 Scheme data for M42 J3a – M40 J16
Scheme Type: Controlled motorways – 3 lanes
Approx. open to traffic date: 01/11/09
2005 2006 2007 2008 2009 2010 2011 2012 2013
Casualties by road link and year
LM468 2 0 11 5 4 2 1 1 1
LM467 1 3 2 1 4 8 4 4 1
Casualty Severity by year
Killed 0 0 0 0 0 1 0 0 0
Serious 2 2 0 1 0 1 1 1 0
KSI 2 2 0 1 0 2 1 1 0
Slight 1 1 13 5 8 8 4 4 2
Total 3 3 13 6 8 10 5 5 2
Casualty Rates by year
Killed rate 0.00 0.00 0.00 0.00 0.00 2.00 0.00 0.00 0.00
Serious rate 4.08 4.08 0.00 1.96 0.00 2.00 2.00 1.82 0.00
KSI rate 4.08 4.08 0.00 1.96 0.00 4.00 2.00 1.82 0.00
Slight rate 2.04 2.04 25.00 9.80 16.33 16.00 8.00 7.27 3.45
Total rate 6.12 6.12 25.00 11.76 16.33 20.00 10.00 9.09 3.45
Traffic (100MVM) 0.49 0.49 0.52 0.51 0.49 0.50 0.50 0.55 0.58
Top 10 Contributory Factors by year
No. 2005 2006 2007 2008 2009 2010 2011 2012 2013
1 410 503 406 406 308 410 308 405 103
2 406 501 308 308 405 308 405 410 410
3 308 410 405 405 103 405 410 307 510
4 405 307 603 602 602 103 307 509 602
5 607 201 410 509 408 503 602 606 603
6 605 502 503 601 406 307 406 - 707
7 - - - 607 509 602 409 - -
8 - - - - 603 408 - - -
9 - - - - 501 - - - -
10 - - - - - - - - -
Important Notes: Refer to accompanying notes provided at the start of this section (Appendix K)
Casualties by road link and severity for 2013
Road Link Ref. Road Link Description KSI Killed Serious Slight Total
LM468 M42 J3A to M40 J16 0 0 0 1 1
LM467 M40 J16 to M42 J3A 0 0 0 1 1

HA Publication PR67/14 App 123
2005 2006 2007 2008 2009 2010 2011 2012 2013
Casualties by road link and year
LM731 21 7 19 18 10 14 16 12 16
LM737 14 16 11 12 16 17 8 8 5
LM730 10 13 6 10 15 4 17 5 3
LM736 17 11 26 4 19 18 9 5 6
Casualty Severity by year
Killed 1 1 0 0 1 2 0 0 1
Serious 4 3 1 1 6 10 2 1 1
KSI 5 4 1 1 7 12 2 1 2
Slight 57 43 61 43 53 41 48 29 28
Total 62 47 62 44 60 53 50 30 30
Casualty Rates by year
Killed rate 0.24 0.25 0.00 0.00 0.25 0.51 0.00 0.00 0.23
Serious rate 0.98 0.74 0.24 0.25 1.51 2.54 0.47 0.24 0.23
KSI rate 1.22 0.99 0.24 0.25 1.76 3.05 0.47 0.24 0.47
Slight rate 13.94 10.67 14.70 10.54 13.35 10.41 11.29 7.02 6.51
Total rate 15.16 11.66 14.94 10.78 15.11 13.45 11.76 7.26 6.98
Traffic (100MVM) 4.09 4.03 4.15 4.08 3.97 3.94 4.25 4.13 4.30
Top 10 Contributory Factors by year
No. 2005 2006 2007 2008 2009 2010 2011 2012 2013
1 410 406 410 406 410 406 406 406 405
2 308 410 406 410 406 410 405 405 406
3 406 308 308 308 405 405 308 308 410
4 602 408 405 103 308 602 410 410 403
5 405 602 307 405 103 308 408 403 409
6 403 503 602 403 408 103 602 409 103
7 408 306 408 602 503 409 103 103 201
8 409 405 103 307 409 403 201 201 308
9 509 307 403 708 403 307 306 408 407
10 601 501 409 710 307 408 403 503 408
Important Notes: Refer to accompanying notes provided at the start of this section (Appendix K)
Casualties by road link and severity for 2013
Road Link Ref. Road Link Description KSI Killed Serious Slight Total
LM731 M5 J4a to M5 J5 0 0 0 16 16
LM737 M5 J5 to M5 J6 1 1 0 4 5
LM730 M5 J5 to M5 J4a 1 0 1 2 3
LM736 M5 J6 to M5 J5 0 0 0 6 6
Table K-15 Scheme data for M5 J4a-6 Scheme Type: All lane running (ALR)
Approx. open to traffic date: Currently not opened, scheduled open date TBC.
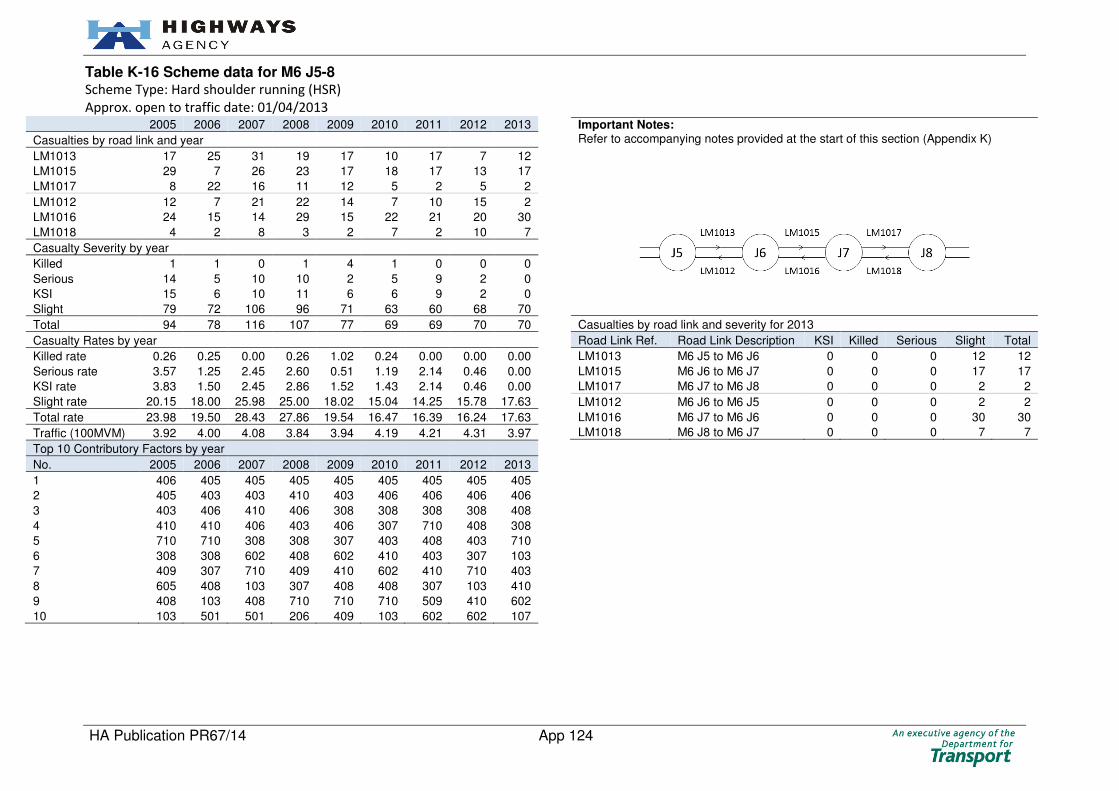
HA Publication PR67/14 App 124
Table K-16 Scheme data for M6 J5-8 Scheme Type: Hard shoulder running (HSR)
Approx. open to traffic date: 01/04/2013
2005 2006 2007 2008 2009 2010 2011 2012 2013
Casualties by road link and year
LM1013 17 25 31 19 17 10 17 7 12
LM1015 29 7 26 23 17 18 17 13 17
LM1017 8 22 16 11 12 5 2 5 2
LM1012 12 7 21 22 14 7 10 15 2
LM1016 24 15 14 29 15 22 21 20 30
LM1018 4 2 8 3 2 7 2 10 7
Casualty Severity by year
Killed 1 1 0 1 4 1 0 0 0
Serious 14 5 10 10 2 5 9 2 0
KSI 15 6 10 11 6 6 9 2 0
Slight 79 72 106 96 71 63 60 68 70
Total 94 78 116 107 77 69 69 70 70
Casualty Rates by year
Killed rate 0.26 0.25 0.00 0.26 1.02 0.24 0.00 0.00 0.00
Serious rate 3.57 1.25 2.45 2.60 0.51 1.19 2.14 0.46 0.00
KSI rate 3.83 1.50 2.45 2.86 1.52 1.43 2.14 0.46 0.00
Slight rate 20.15 18.00 25.98 25.00 18.02 15.04 14.25 15.78 17.63
Total rate 23.98 19.50 28.43 27.86 19.54 16.47 16.39 16.24 17.63
Traffic (100MVM) 3.92 4.00 4.08 3.84 3.94 4.19 4.21 4.31 3.97
Top 10 Contributory Factors by year
No. 2005 2006 2007 2008 2009 2010 2011 2012 2013
1 406 405 405 405 405 405 405 405 405
2 405 403 403 410 403 406 406 406 406
3 403 406 410 406 308 308 308 308 408
4 410 410 406 403 406 307 710 408 308
5 710 710 308 308 307 403 408 403 710
6 308 308 602 408 602 410 403 307 103
7 409 307 710 409 410 602 410 710 403
8 605 408 103 307 408 408 307 103 410
9 408 103 408 710 710 710 509 410 602
10 103 501 501 206 409 103 602 602 107
Important Notes: Refer to accompanying notes provided at the start of this section (Appendix K)
Casualties by road link and severity for 2013
Road Link Ref. Road Link Description KSI Killed Serious Slight Total
LM1013 M6 J5 to M6 J6 0 0 0 12 12
LM1015 M6 J6 to M6 J7 0 0 0 17 17
LM1017 M6 J7 to M6 J8 0 0 0 2 2
LM1012 M6 J6 to M6 J5 0 0 0 2 2
LM1016 M6 J7 to M6 J6 0 0 0 30 30
LM1018 M6 J8 to M6 J7 0 0 0 7 7

HA Publication PR67/14 App 125
Table K-17 Scheme data for M6 J4-5 Scheme Type: Hard shoulder running (HSR)
Approx. open to traffic date: 01/11/09
2005 2006 2007 2008 2009 2010 2011 2012 2013
Casualties by road link and year
LM1008A 6 4 3 10 8 7 3 4 2
LM1010 11 11 12 16 14 16 4 8 8
LM1009A 2 6 1 2 1 0 0 1 5
LM1011 12 15 12 4 7 11 4 7 5
Casualty Severity by year
Killed 1 2 0 0 0 0 0 0 0
Serious 5 4 3 1 1 1 1 3 1
KSI 6 6 3 1 1 1 1 3 1
Slight 25 30 25 31 29 33 10 17 19
Total 31 36 28 32 30 34 11 20 20
Casualty Rates by year
Killed rate 0.62 1.21 0.00 0.00 0.00 0.00 0.00 0.00 0.00
Serious rate 3.09 2.42 1.63 0.61 0.60 0.58 0.57 1.65 0.56
KSI rate 3.70 3.64 1.63 0.61 0.60 0.58 0.57 1.65 0.56
Slight rate 15.43 18.18 13.59 18.90 17.26 19.30 5.75 9.34 10.56
Total rate 19.14 21.82 15.22 19.51 17.86 19.88 6.32 10.99 11.11
Traffic (100MVM) 1.62 1.65 1.84 1.64 1.68 1.71 1.74 1.82 1.80
Top 10 Contributory Factors by year
No. 2005 2006 2007 2008 2009 2010 2011 2012 2013
1 405 405 405 405 405 405 406 406 405
2 403 308 410 406 403 410 405 405 406
3 710 406 403 403 308 308 408 408 308
4 406 403 308 308 710 406 710 503 403
5 410 710 710 602 602 408 410 308 408
6 408 503 509 107 406 403 404 403 409
7 308 410 406 410 107 710 606 409 602
8 601 602 602 408 410 307 109 602 103
9 404 404 103 103 408 404 - 103 307
10 509 107 307 307 201 503 - 710 410
Important Notes: Refer to accompanying notes provided at the start of this section (Appendix K)
Casualties by road link and severity for 2013
Road Link Ref. Road Link Description KSI Killed Serious Slight Total
LM1008A M6 J4 to M6 J4A 0 0 0 2 2
LM1010 M6 J4A to M6 J5 0 0 0 8 8
LM1009A M6 J4A to M6 J4 0 0 0 5 5
LM1011 M6 J5 to M6 J4A 1 0 1 4 5

HA Publication PR67/14 App 126
Table K-18 Scheme data for M6 J8-10a Scheme Type: Hard shoulder running (HSR)
Approx. open to traffic date: 01/03/2014
2005 2006 2007 2008 2009 2010 2011 2012 2013
Casualties by road link and year
LM1019 13 9 9 10 10 21 14 16 14
LM1021 5 12 11 12 16 16 9 3 6
LM926 8 20 17 15 3 11 8 6 5
LM1020 5 17 14 4 4 7 6 4 12
LM1022 14 18 21 9 19 10 11 14 32
LM927 13 9 16 6 10 31 7 17 22
Casualty Severity by year
Killed 0 2 0 0 2 0 0 0 0
Serious 5 7 3 5 5 1 2 0 2
KSI 5 9 3 5 7 1 2 0 2
Slight 53 76 85 51 55 95 53 60 89
Total 58 85 88 56 62 96 55 60 91
Casualty Rates by year
Killed rate 0.00 0.65 0.00 0.00 0.76 0.00 0.00 0.00 0.00
Serious rate 1.60 2.29 1.05 1.87 1.89 0.36 0.70 0.00 0.68
KSI rate 1.60 2.94 1.05 1.87 2.65 0.36 0.70 0.00 0.68
Slight rate 16.99 24.84 29.72 19.03 20.83 34.05 18.66 20.98 30.17
Total rate 18.59 27.78 30.77 20.90 23.48 34.41 19.37 20.98 30.85
Traffic (100MVM) 3.12 3.06 2.86 2.68 2.64 2.79 2.84 2.86 2.95
Top 10 Contributory Factors by year
No. 2005 2006 2007 2008 2009 2010 2011 2012 2013
1 405 405 405 405 405 405 405 405 405
2 710 308 406 410 406 406 406 406 406
3 403 406 403 403 403 308 308 710 710
4 308 403 602 308 602 403 403 308 308
5 406 408 308 307 408 408 408 408 403
6 410 410 408 406 308 602 410 403 408
7 408 501 710 602 710 307 710 410 410
8 602 602 410 408 410 710 409 602 602
9 409 710 107 710 409 410 509 409 103
10 503 307 706 409 404 409 307 307 601
Important Notes: Refer to accompanying notes provided at the start of this section (Appendix K)
Casualties by road link and severity for 2013
Road Link Ref. Road Link Description KSI Killed Serious Slight Total
LM1019 M6 J8 to M6 J9 0 0 0 14 14
LM1021 M6 J9 to M6 J10 1 0 1 5 6
LM926 M6 J10 to M6 J10A 0 0 0 5 5
LM1020 M6 J9 to M6 J8 0 0 0 12 12
LM1022 M6 J10 to M6 J9 0 0 0 32 32
LM927 M6 J10A to M6 J10 1 0 1 21 22

HA Publication PR67/14 App 127
2005 2006 2007 2008 2009 2010 2011 2012 2013
Casualties by road link and year
LM924 5 6 5 4 4 10 2 3 4
LM928C 4 22 4 5 5 6 4 2 1
LM928B 4 6 8 2 3 8 9 3 0
LM930 70 20 34 19 13 29 24 21 19
LM925 9 8 6 8 8 5 2 1 19
LM929C 9 0 1 3 1 2 2 3 0
LM929B 10 13 9 6 2 9 4 6 4
LM931 26 25 15 12 21 16 15 9 10
Casualty Severity by year
Killed 1 5 0 2 1 0 2 0 1
Serious 2 10 6 2 4 0 1 0 1
KSI 3 15 6 4 5 0 3 0 2
Slight 134 85 76 55 52 85 59 48 55
Total 137 100 82 59 57 85 62 48 57
Casualty Rates by year
Killed rate 0.27 1.31 0.00 0.50 0.26 0.00 0.51 0.00 0.25
Serious rate 0.54 2.62 1.50 0.50 1.05 0.00 0.26 0.00 0.25
KSI rate 0.81 3.93 1.50 1.00 1.31 0.00 0.77 0.00 0.50
Slight rate 36.22 22.25 18.95 13.75 13.65 22.55 15.17 12.18 13.72
Total rate 37.03 26.18 20.45 14.75 14.96 22.55 15.94 12.18 14.21
Traffic (100MVM) 3.70 3.82 4.01 4.00 3.81 3.77 3.89 3.94 4.01
Top 10 Contributory Factors by year
No. 2005 2006 2007 2008 2009 2010 2011 2012 2013
1 410 406 406 406 308 308 308 405 405
2 308 308 405 405 408 405 408 406 408
3 405 405 308 408 406 406 405 410 308
4 408 307 410 308 410 408 410 408 406
5 406 410 408 307 307 410 406 308 602
6 403 403 307 410 602 307 409 710 410
7 602 408 103 403 405 409 307 307 307
8 307 409 501 602 409 602 602 602 403
9 710 501 403 103 503 503 306 403 505
10 409 601 710 503 710 710 710 306 509
Important Notes: Refer to accompanying notes provided at the start of this section (Appendix K)
Casualties by road link and severity for 2013
Road Link Ref. Road Link Description KSI Killed Serious Slight Total
LM924 M6 J10a to M6 J11 1 0 1 3 4
LM928C M6 J11 to M6 J11a 0 0 0 1 1
LM928B M6 J11a to M6 J12 0 0 0 0 0
LM930 M6 J12 to M6 J13 0 0 0 19 19
LM925 M6 J11 to M6 J10A 1 1 0 18 19
LM929C M6 J11a to M6 J11 0 0 0 0 0
LM929B M6 J12 to M6 J11a 0 0 0 4 4
LM931 M6 J13 to M6 J12 0 0 0 10 10
Table K-19 Scheme data for M6 J10a-13 Scheme Type: All lane running (ALR)
Approx. open to traffic date: Currently not opened, scheduled to open spring 2015.

HA Publication PR67/14 App 128
2005 2006 2007 2008 2009 2010 2011 2012 2013
Casualties by road link and year
LM938 42 40 17 36 37 49 45 39 31
LM940 27 39 50 31 21 43 11 15 14
LM942 35 32 44 68 23 41 52 56 49
LM939 32 28 24 25 31 31 21 33 20
LM941 9 11 7 13 5 2 5 4 6
LM943 32 49 35 71 42 39 36 41 45
Casualty Severity by year
Killed 2 2 1 8 0 4 1 2 1
Serious 10 11 6 20 4 12 11 19 7
KSI 12 13 7 28 4 16 12 21 8
Slight 165 186 170 216 155 189 158 167 157
Total 177 199 177 244 159 205 170 188 165
Casualty Rates by year
Killed rate 0.27 0.26 0.13 1.03 0.00 0.53 0.13 0.26 0.13
Serious rate 1.33 1.42 0.76 2.58 0.50 1.60 1.42 2.48 0.92
KSI rate 1.59 1.67 0.88 3.62 0.50 2.13 1.55 2.74 1.05
Slight rate 21.91 23.94 21.44 27.91 19.30 25.20 20.36 21.80 20.69
Total rate 23.51 25.61 22.32 31.52 19.80 27.33 21.91 24.54 21.74
Traffic (100MVM) 7.53 7.77 7.93 7.74 8.03 7.50 7.76 7.66 7.59
Top 10 Contributory Factors by year
No. 2005 2006 2007 2008 2009 2010 2011 2012 2013
1 308 308 406 406 308 308 308 308 308
2 406 405 308 308 406 406 405 405 406
3 405 406 405 405 408 405 406 406 405
4 403 408 408 410 405 408 408 408 307
5 307 410 403 307 410 410 307 410 408
6 408 403 410 408 307 307 410 103 710
7 410 307 307 403 710 409 409 403 410
8 409 409 409 509 403 403 103 307 403
9 710 710 710 710 409 710 503 503 103
10 708 505 503 409 509 503 201 409 409
Important Notes: Refer to accompanying notes provided at the start of this section (Appendix K)
Casualties by road link and severity for 2013
Road Link Ref. Road Link Description KSI Killed Serious Slight Total
LM938 M6 J16 to M6 J17 1 0 1 30 31
LM940 M6 J17 to M6 J18 1 0 1 13 14
LM942 M6 J18 to M6 J19 2 0 2 47 49
LM939 M6 J17 to M6 J16 1 0 1 19 20
LM941 M6 J18 to M6 J17 0 0 0 6 6
LM943 M6 J19 to M6 J18 3 1 2 42 45
Table K-20 Scheme data for M6 J16-19 Scheme Type: All lane running (ALR)
Approx. open to traffic date: Currently not opened, scheduled open date TBC.

HA Publication PR67/14 App 129
2005 2006 2007 2008 2009 2010 2011 2012 2013
Casualties by road link and year
LM932 31 28 27 25 16 16 17 7 10
LM934 43 52 50 26 26 42 27 35 22
LM933 18 17 16 25 29 27 10 19 16
LM935 50 53 36 47 36 53 38 28 27
Casualty Severity by year
Killed 2 2 2 2 1 1 2 3 1
Serious 6 4 7 10 4 3 4 4 1
KSI 8 6 9 12 5 4 6 7 2
Slight 134 144 120 111 102 134 86 82 73
Total 142 150 129 123 107 138 92 89 75
Casualty Rates by year
Killed rate 0.30 0.30 0.30 0.29 0.15 0.15 0.29 0.41 0.14
Serious rate 0.90 0.60 1.05 1.45 0.58 0.46 0.58 0.54 0.14
KSI rate 1.21 0.91 1.35 1.73 0.73 0.62 0.87 0.95 0.29
Slight rate 20.21 21.75 18.02 16.04 14.80 20.65 12.45 11.17 10.55
Total rate 21.42 22.66 19.37 17.77 15.53 21.26 13.31 12.13 10.84
Traffic (100MVM) 6.63 6.62 6.66 6.92 6.89 6.49 6.91 7.34 6.92
Top 10 Contributory Factors by year
No. 2005 2006 2007 2008 2009 2010 2011 2012 2013
1 410 406 405 410 410 405 408 406 308
2 406 308 308 308 308 410 405 405 410
3 710 410 406 406 405 710 410 410 405
4 405 405 307 405 408 408 406 408 406
5 308 408 410 408 403 406 308 308 408
6 403 409 408 503 710 308 409 409 307
7 408 710 409 307 409 409 403 307 503
8 602 307 602 403 602 602 602 503 409
9 307 503 710 602 406 307 503 602 403
10 409 602 103 603 503 503 307 103 509
Important Notes: Refer to accompanying notes provided at the start of this section (Appendix K)
Casualties by road link and severity for 2013
Road Link Ref. Road Link Description KSI Killed Serious Slight Total
LM932 M6 J13 to M6 J14 0 0 0 10 10
LM934 M6 J14 to M6 J15 0 0 0 22 22
LM933 M6 J14 to M6 J13 0 0 0 16 16
LM935 M6 J15 to M6 J14 2 1 1 25 27
Table K-21 Scheme data for M6 J13-15 Scheme Type: All lane running (ALR)
Approx. open to traffic date: Currently not opened, scheduled open date TBC.

HA Publication PR67/14 App 130
Table K-22 Scheme data for M60 J8-18 Scheme Type: Controlled motorway – 4 lanes
Approx. open to traffic date: Currently not opened, scheduled to open
autumn 2017.
2005 2006 2007 2008 2009 2010 2011 2012 2013
Casualties by road link and year
LM808 4 4 4 0 3 3 1 2 8
LM758 1 9 9 3 2 1 0 1 3
LM756 12 11 22 13 6 7 1 4 5
LM760 5 5 10 5 14 2 3 11 3
LM762 3 4 7 9 3 3 0 5 2
LM764 0 6 9 11 5 9 2 1 0
LM766 5 3 2 3 5 2 2 0 0
LM768 2 3 4 4 10 4 6 4 0
LM770 10 4 7 8 6 5 7 0 1
LM772 6 13 11 9 11 5 1 16 8
LM809 8 2 7 0 2 5 0 2 3
LM759 0 4 4 6 0 2 0 3 1
LM757 15 17 42 26 4 29 32 7 13
LM761 4 11 2 5 9 2 1 6 4
LM763 10 14 11 14 26 9 16 0 4
LM765 10 17 14 15 11 5 9 6 7
LM767 11 8 2 1 4 1 8 5 5
LM769 1 7 17 10 7 9 7 3 2
LM771 17 10 9 6 33 1 6 1 0
LM773 12 11 8 6 13 3 6 2 1
Casualty Severity by year
Killed 0 1 2 1 0 0 0 0 1
Serious 8 3 8 7 12 4 5 2 2
KSI 8 4 10 8 12 4 5 2 3
Slight 128 159 191 146 162 103 103 77 67
Total 136 163 201 154 174 107 108 79 70
Casualty Rates by year
Killed rate 0.00 0.17 0.32 0.17 0.00 0.00 0.00 0.00 0.15
Serious rate 1.34 0.50 1.28 1.16 1.91 0.63 0.77 0.30 0.31
KSI rate 1.34 0.66 1.61 1.33 1.91 0.63 0.77 0.30 0.46
Slight rate 21.40 26.24 30.66 24.21 25.76 16.32 15.77 11.70 10.32
Total rate 22.74 26.90 32.26 25.54 27.66 16.96 16.54 12.01 10.79
Traffic (100MVM) 5.98 6.06 6.23 6.03 6.29 6.31 6.53 6.58 6.49
Top 10 Contributory Factors by year
No. 2005 2006 2007 2008 2009 2010 2011 2012 2013
1 406 406 405 405 403 405 406 406 405 2 408 403 406 406 405 406 405 405 406 3 308 308 308 408 406 308 308 403 308 4 405 405 408 308 408 408 403 308 410 5 403 307 410 410 410 307 602 103 403 6 410 408 403 403 308 409 410 410 408 7 103 103 307 602 307 710 710 408 409 8 307 710 602 103 409 403 408 602 602 9 710 410 103 307 501 501 103 501 509 10 409 602 710 601 103 602 708 307 605 Important Notes: Refer to accompanying notes provided at the start of this section (Appendix K)
Casualties by road link and severity for 2013
Road Link Ref. Road Link Description KSI Killed Serious Slight Total
LM808 M60 J8 to M60 J9 1 0 1 7 8 LM758 M60 J9 to M60 J10 0 0 0 3 3 LM756 M60 J10 to M60 J11 0 0 0 5 5 LM760 M60 J11 to M60 J12 0 0 0 3 3 LM762 M60 J12 to M60 J13 0 0 0 2 2 LM764 M60 J13 to M60 J14 0 0 0 0 0 LM766 M60 J14 to M60 J15 0 0 0 0 0 LM768 M60 J15 to M60 J16 0 0 0 0 0 LM770 M60 J16 to M60 J17 0 0 0 1 1 LM772 M60 J17 to M60 J18 0 0 0 8 8
LM809 M60 J9 to M60 J8 1 0 1 2 3 LM759 M60 J10 to M60 J9 0 0 0 1 1 LM757 M60 J11 to M60 J10 0 0 0 13 13 LM761 M60 J12 to M60 J11 0 0 0 4 4 LM763 M60 J13 to M60 J12 0 0 0 4 4 LM765 M60 J14 to M60 J13 0 0 0 7 7 LM767 M60 J15 to M60 J14 0 0 0 5 5 LM769 M60 J16 to M60 J15 0 0 0 2 2 LM771 M60 J17 to M60 J16 0 0 0 0 0 LM773 M60 J18 to M60 J17 1 1 0 0 1
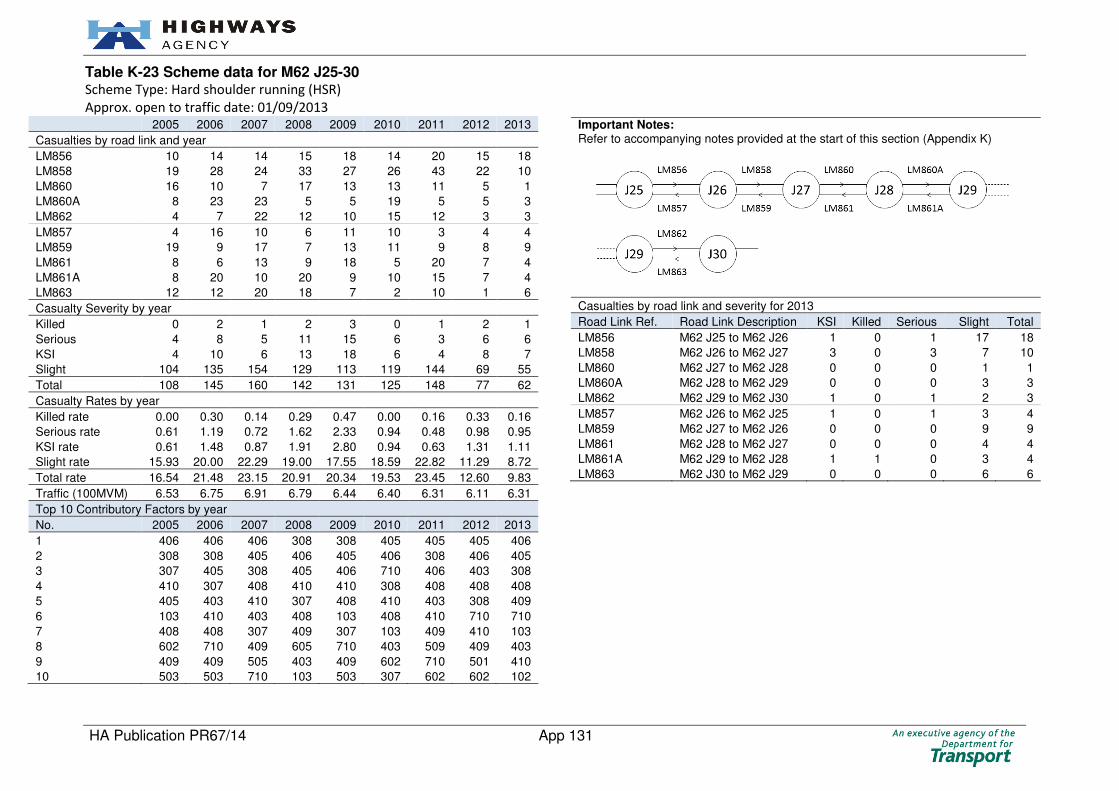
HA Publication PR67/14 App 131
Table K-23 Scheme data for M62 J25-30 Scheme Type: Hard shoulder running (HSR)
Approx. open to traffic date: 01/09/2013
2005 2006 2007 2008 2009 2010 2011 2012 2013
Casualties by road link and year
LM856 10 14 14 15 18 14 20 15 18
LM858 19 28 24 33 27 26 43 22 10
LM860 16 10 7 17 13 13 11 5 1
LM860A 8 23 23 5 5 19 5 5 3
LM862 4 7 22 12 10 15 12 3 3
LM857 4 16 10 6 11 10 3 4 4
LM859 19 9 17 7 13 11 9 8 9
LM861 8 6 13 9 18 5 20 7 4
LM861A 8 20 10 20 9 10 15 7 4
LM863 12 12 20 18 7 2 10 1 6
Casualty Severity by year
Killed 0 2 1 2 3 0 1 2 1
Serious 4 8 5 11 15 6 3 6 6
KSI 4 10 6 13 18 6 4 8 7
Slight 104 135 154 129 113 119 144 69 55
Total 108 145 160 142 131 125 148 77 62
Casualty Rates by year
Killed rate 0.00 0.30 0.14 0.29 0.47 0.00 0.16 0.33 0.16
Serious rate 0.61 1.19 0.72 1.62 2.33 0.94 0.48 0.98 0.95
KSI rate 0.61 1.48 0.87 1.91 2.80 0.94 0.63 1.31 1.11
Slight rate 15.93 20.00 22.29 19.00 17.55 18.59 22.82 11.29 8.72
Total rate 16.54 21.48 23.15 20.91 20.34 19.53 23.45 12.60 9.83
Traffic (100MVM) 6.53 6.75 6.91 6.79 6.44 6.40 6.31 6.11 6.31
Top 10 Contributory Factors by year
No. 2005 2006 2007 2008 2009 2010 2011 2012 2013
1 406 406 406 308 308 405 405 405 406
2 308 308 405 406 405 406 308 406 405
3 307 405 308 405 406 710 406 403 308
4 410 307 408 410 410 308 408 408 408
5 405 403 410 307 408 410 403 308 409
6 103 410 403 408 103 408 410 710 710
7 408 408 307 409 307 103 409 410 103
8 602 710 409 605 710 403 509 409 403
9 409 409 505 403 409 602 710 501 410
10 503 503 710 103 503 307 602 602 102
Important Notes: Refer to accompanying notes provided at the start of this section (Appendix K)
Casualties by road link and severity for 2013
Road Link Ref. Road Link Description KSI Killed Serious Slight Total
LM856 M62 J25 to M62 J26 1 0 1 17 18
LM858 M62 J26 to M62 J27 3 0 3 7 10
LM860 M62 J27 to M62 J28 0 0 0 1 1
LM860A M62 J28 to M62 J29 0 0 0 3 3
LM862 M62 J29 to M62 J30 1 0 1 2 3
LM857 M62 J26 to M62 J25 1 0 1 3 4
LM859 M62 J27 to M62 J26 0 0 0 9 9
LM861 M62 J28 to M62 J27 0 0 0 4 4
LM861A M62 J29 to M62 J28 1 1 0 3 4
LM863 M62 J30 to M62 J29 0 0 0 6 6

HA Publication PR67/14 App 132
2005 2006 2007 2008 2009 2010 2011 2012 2013
Casualties by road link and year
LM844 16 30 19 10 14 17 8 5 1
LM844A 6 5 11 15 6 4 5 7 1
LM846 1 13 5 5 13 4 4 1 7
LM845 14 11 8 30 16 6 4 17 15
LM845A 17 13 12 17 8 17 15 9 5
LM847 11 3 16 9 13 5 5 8 12
Casualty Severity by year
Killed 0 0 0 2 0 0 1 1 0
Serious 3 4 0 5 1 1 1 2 1
KSI 3 4 0 7 1 1 2 3 1
Slight 62 71 71 79 69 52 39 44 40
Total 65 75 71 86 70 53 41 47 41
Casualty Rates by year
Killed rate 0.00 0.00 0.00 0.61 0.00 0.00 0.33 0.33 0.00
Serious rate 0.86 1.19 0.00 1.53 0.31 0.30 0.33 0.66 0.32
KSI rate 0.86 1.19 0.00 2.14 0.31 0.30 0.66 0.99 0.32
Slight rate 17.71 21.07 20.34 24.16 21.10 15.52 12.79 14.57 12.62
Total rate 18.57 22.26 20.34 26.30 21.41 15.82 13.44 15.56 12.93
Traffic (100MVM) 3.50 3.37 3.49 3.27 3.27 3.35 3.05 3.02 3.17
Top 10 Contributory Factors by year
No. 2005 2006 2007 2008 2009 2010 2011 2012 2013
1 406 406 406 406 405 405 405 405 406
2 405 403 308 405 406 406 406 406 405
3 403 405 405 410 408 308 308 410 103
4 410 308 408 403 308 307 602 408 307
5 308 408 602 408 602 602 408 602 308
6 103 410 403 103 307 408 403 103 408
7 307 602 103 501 410 410 307 308 410
8 409 103 307 308 403 103 409 403 710
9 710 307 410 409 708 409 510 307 601
10 708 605 505 602 103 510 410 601 602
Important Notes: Refer to accompanying notes provided at the start of this section (Appendix K)
Casualties by road link and severity for 2013
Road Link Ref. Road Link Description KSI Killed Serious Slight Total
LM844 M62 J18 to M62 J19 0 0 0 1 1
LM844A M62 J19 to M62 J20 0 0 0 1 1
LM846 M62 J20 to M62 J21 1 0 1 6 7
LM845 M62 J19 to M62 J18 0 0 0 15 15
LM845A M62 J20 to M62 J19 0 0 0 5 5
LM847 M62 J21 to M62 J20 0 0 0 12 12
Table K-24 Scheme data for M62 J18-21 Scheme Type: All lane running (ALR)
Approx. open to traffic date: Currently not opened, scheduled open date TBC.

HA Publication PR67/14 App 133
2005 2006 2007 2008 2009 2010 2011 2012 2013
Casualties by road link and year
LM841 13 21 11 18 6 22 10 19 16
LM843 54 37 37 38 23 14 114 11 22
LM840 3 6 3 4 6 2 8 3 0
LM842 27 21 21 28 12 10 21 12 11
Casualty Severity by year
Killed 1 0 0 2 0 0 0 0 1
Serious 12 4 3 5 2 3 8 5 1
KSI 13 4 3 7 2 3 8 5 2
Slight 84 81 69 81 45 45 145 40 47
Total 97 85 72 88 47 48 153 45 49
Casualty Rates by year
Killed rate 0.28 0.00 0.00 0.51 0.00 0.00 0.00 0.00 0.26
Serious rate 3.31 1.03 0.79 1.26 0.50 0.73 2.08 1.34 0.26
KSI rate 3.59 1.03 0.79 1.77 0.50 0.73 2.08 1.34 0.51
Slight rate 23.20 20.93 18.06 20.45 11.31 10.90 37.76 10.75 12.05
Total rate 26.80 21.96 18.85 22.22 11.81 11.62 39.84 12.10 12.56
Traffic (100MVM) 3.62 3.87 3.82 3.96 3.98 4.13 3.84 3.72 3.90
Top 10 Contributory Factors by year
No. 2005 2006 2007 2008 2009 2010 2011 2012 2013
1 406 406 406 406 308 406 406 406 406
2 308 408 405 405 405 405 408 405 308
3 410 308 308 308 410 308 308 410 408
4 408 103 410 410 406 410 405 308 405
5 103 410 408 103 409 408 410 710 103
6 405 409 103 408 408 103 403 602 410
7 307 307 307 501 307 409 103 403 601
8 403 405 501 602 501 307 409 408 602
9 602 501 602 403 602 710 710 103 710
10 409 403 403 307 508 602 307 307 108
Important Notes: Refer to accompanying notes provided at the start of this section (Appendix K)
Casualties by road link and severity for 2013
Road Link Ref. Road Link Description KSI Killed Serious Slight Total
LM841 M62 J10 to M62 J11 2 1 1 14 16
LM843 M62 J11 to M62 J12 0 0 0 22 22
LM840 M62 J11 to M62 J10 0 0 0 0 0
LM842 M62 J12 to M62 J11 0 0 0 11 11
Table K-25 Scheme data for M62 J10-12 Scheme Type: All lane running (ALR)
Approx. open to traffic date: Currently not opened, scheduled open date TBC.
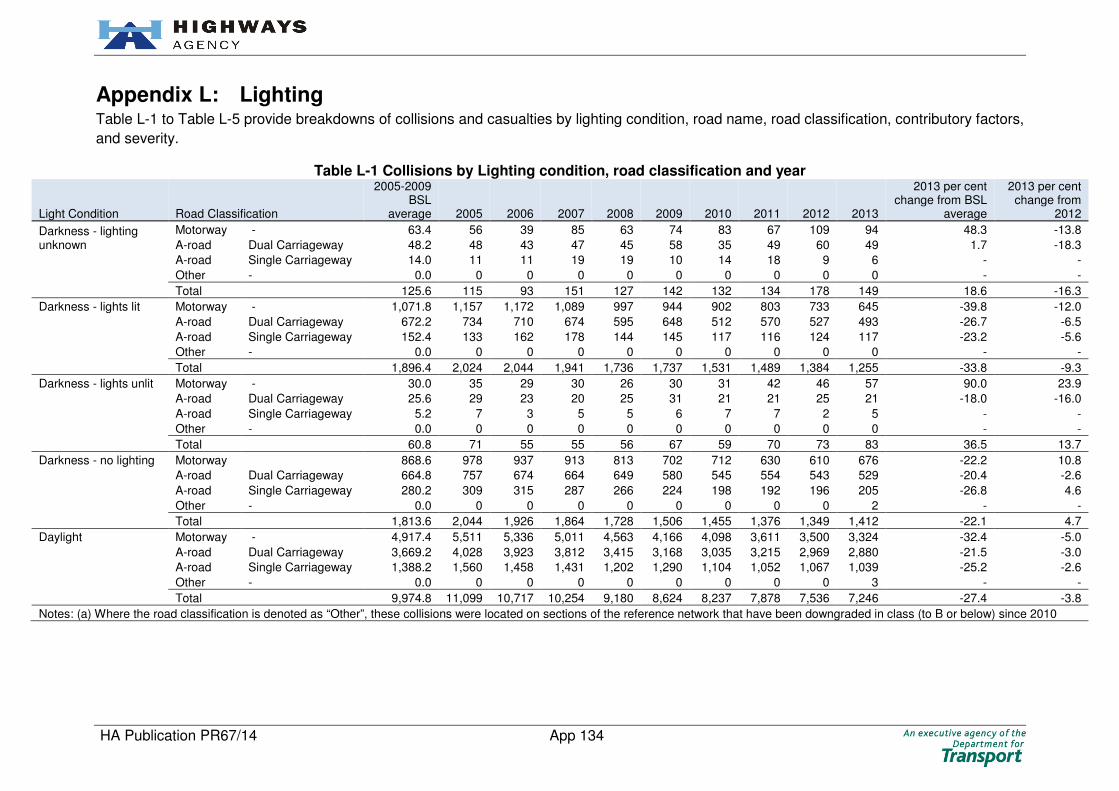
HA Publication PR67/14 App 134
Appendix L: Lighting Table L-1 to Table L-5 provide breakdowns of collisions and casualties by lighting condition, road name, road classification, contributory factors,
and severity.
Table L-1 Collisions by Lighting condition, road classification and year
Light Condition Road Classification
2005-2009 BSL
average 2005 2006 2007 2008 2009 2010 2011 2012 2013
2013 per cent change from BSL
average
2013 per cent change from
2012
Darkness - lighting unknown
Motorway - 63.4 56 39 85 63 74 83 67 109 94 48.3 -13.8
A-road Dual Carriageway 48.2 48 43 47 45 58 35 49 60 49 1.7 -18.3
A-road Single Carriageway 14.0 11 11 19 19 10 14 18 9 6 - -
Other - 0.0 0 0 0 0 0 0 0 0 0 - -
Total 125.6 115 93 151 127 142 132 134 178 149 18.6 -16.3
Darkness - lights lit Motorway - 1,071.8 1,157 1,172 1,089 997 944 902 803 733 645 -39.8 -12.0
A-road Dual Carriageway 672.2 734 710 674 595 648 512 570 527 493 -26.7 -6.5
A-road Single Carriageway 152.4 133 162 178 144 145 117 116 124 117 -23.2 -5.6
Other - 0.0 0 0 0 0 0 0 0 0 0 - -
Total 1,896.4 2,024 2,044 1,941 1,736 1,737 1,531 1,489 1,384 1,255 -33.8 -9.3
Darkness - lights unlit Motorway - 30.0 35 29 30 26 30 31 42 46 57 90.0 23.9
A-road Dual Carriageway 25.6 29 23 20 25 31 21 21 25 21 -18.0 -16.0
A-road Single Carriageway 5.2 7 3 5 5 6 7 7 2 5 - -
Other - 0.0 0 0 0 0 0 0 0 0 0 - -
Total 60.8 71 55 55 56 67 59 70 73 83 36.5 13.7
Darkness - no lighting Motorway 868.6 978 937 913 813 702 712 630 610 676 -22.2 10.8
A-road Dual Carriageway 664.8 757 674 664 649 580 545 554 543 529 -20.4 -2.6
A-road Single Carriageway 280.2 309 315 287 266 224 198 192 196 205 -26.8 4.6
Other - 0.0 0 0 0 0 0 0 0 0 2 - -
Total 1,813.6 2,044 1,926 1,864 1,728 1,506 1,455 1,376 1,349 1,412 -22.1 4.7
Daylight Motorway - 4,917.4 5,511 5,336 5,011 4,563 4,166 4,098 3,611 3,500 3,324 -32.4 -5.0
A-road Dual Carriageway 3,669.2 4,028 3,923 3,812 3,415 3,168 3,035 3,215 2,969 2,880 -21.5 -3.0
A-road Single Carriageway 1,388.2 1,560 1,458 1,431 1,202 1,290 1,104 1,052 1,067 1,039 -25.2 -2.6
Other - 0.0 0 0 0 0 0 0 0 0 3 - -
Total 9,974.8 11,099 10,717 10,254 9,180 8,624 8,237 7,878 7,536 7,246 -27.4 -3.8
Notes: (a) Where the road classification is denoted as “Other”, these collisions were located on sections of the reference network that have been downgraded in class (to B or below) since 2010

HA Publication PR67/14 App 135
Table L-2 Casualties by lighting condition, road type and year
Light Condition Road Classification
2005-2009 BSL
average 2005 2006 2007 2008 2009 2010 2011 2012 2013
2013 per cent change from BSL
average
2013 per cent change from
2012
Darkness - lighting unknown
Motorway - 91.6 81 59 122 94 102 118 109 171 127 38.6 -25.7
A-road Dual Carriageway 65.8 65 54 69 58 83 53 66 86 59 -10.3 -31.4
A-road Single Carriageway 20.4 16 18 27 22 19 17 29 11 8 -60.8 -
Other - 0.0 0 0 0 0 0 0 0 0 0 - -
Total 177.8 162 131 218 174 204 188 204 268 194 9.1 -27.6
Darkness - lights lit Motorway - 1,746.8 1,891 1,844 1,851 1,610 1,538 1,492 1,348 1,184 1,046 -40.1 -11.7
A-road Dual Carriageway 990.6 1,123 1,039 970 857 964 764 850 755 693 -30.0 -8.2
A-road Single Carriageway 224.8 211 231 267 202 213 167 188 195 192 -14.6 -1.5
Other - 0.0 0 0 0 0 0 0 0 0 0 - -
Total 2,962.2 3,225 3,114 3,088 2,669 2,715 2,423 2,386 2,134 1,931 -34.8 -9.5
Darkness - lights unlit Motorway - 46.8 50 48 52 41 43 39 75 80 106 126.5 32.5
A-road Dual Carriageway 34.8 37 29 30 37 41 39 25 44 29 -16.7 -34.1
A-road Single Carriageway 7.8 11 4 9 7 8 15 10 3 9 - -
Other - 0.0 0 0 0 0 0 0 0 0 0 - -
Total 89.4 98 81 91 85 92 93 110 127 144 61.1 13.4
Darkness - no lighting Motorway - 1,474.4 1,687 1,614 1,559 1,356 1,156 1,176 1,103 1,007 1,146 -22.3 13.8
A-road Dual Carriageway 1,031.8 1,200 1,032 983 1,008 936 849 854 821 855 -17.1 4.1
A-road Single Carriageway 469.4 539 514 488 441 365 339 324 344 335 -28.6 -2.6
Other - 0.0 0 0 0 0 0 0 0 0 3 - -
Total 2,975.6 3,426 3,160 3,030 2,805 2,457 2,364 2,281 2,172 2,339 -21.4 7.7
Daylight Motorway - 7,840.0 8,773 8,498 7,943 7,216 6,770 6,553 6,117 5,769 5,412 -31.0 -6.2
A-road Dual Carriageway 5,380.8 5,959 5,754 5,525 4,996 4,670 4,558 4,838 4,426 4,359 -19.0 -1.5
A-road Single Carriageway 2,277.0 2,541 2,458 2,296 1,958 2,132 1,843 1,784 1,777 1,712 -24.8 -3.7
Other - 0.0 0 0 0 0 0 0 0 0 3 - -
Total 15,497.8 17,273 16,710 15,764 14,170 13,572 12,954 12,739 11,972 11,486 -25.9 -4.1
Notes: (a) Where the road classification is denoted as “Other”, these casualties were located on sections of the reference network that have been downgraded in class (to B or below) since 2010

HA Publication PR67/14 App 136
Table L-3 Casualties by lighting condition, severity and year
Light Condition Casualty Severity
2005-2009 BSL
average 2005 2006 2007 2008 2009 2010 2011 2012 2013
2013 per cent change from BSL
average
2013 per cent change from
2012
Darkness - lighting unknown
Killed 1.8 6 1 1 1 0 1 4 7 2 - -
Seriously Injured 14.2 19 6 22 8 16 15 19 17 16 - -5.9
KSI 16.0 25 7 23 9 16 16 23 24 18 12.5 -25.0
Slightly Injured 161.8 137 124 195 165 188 172 181 244 176 8.8 -27.9
Total 177.8 162 131 218 174 204 188 204 268 194 9.1 -27.6
Darkness - lights lit Killed 54.8 66 53 52 52 51 29 27 25 25 -54.4 0.0
Seriously Injured 284.0 322 282 315 254 247 206 171 193 142 -50.0 -26.4
KSI 338.8 388 335 367 306 298 235 198 218 167 -50.7 -23.4
Slightly Injured 2,623.4 2,837 2,779 2,721 2,363 2,417 2,188 2,188 1,916 1,764 -32.8 -7.9
Total 2,962.2 3,225 3,114 3,088 2,669 2,715 2,423 2,386 2,134 1,931 -34.8 -9.5
Darkness - lights unlit Killed 2.0 0 3 2 5 0 1 3 0 4 - -
Seriously Injured 7.2 8 5 10 8 5 7 15 4 8 - -
KSI 9.2 8 8 12 13 5 8 18 4 12 - -
Slightly Injured 80.2 90 73 79 72 87 85 92 123 132 64.6 7.3
Total 89.4 98 81 91 85 92 93 110 127 144 61.1 13.4
Darkness - no lighting Killed 116.0 141 133 118 113 75 73 73 73 79 -31.9 8.2
Seriously Injured 382.4 469 379 411 350 303 323 304 283 295 -22.9 4.2
KSI 498.4 610 512 529 463 378 396 377 356 374 -25.0 5.1
Slightly Injured 2,477.2 2,816 2,648 2,501 2,342 2,079 1,968 1,904 1,816 1,965 -20.7 8.2
Total 2,975.6 3,426 3,160 3,030 2,805 2,457 2,364 2,281 2,172 2,339 -21.4 7.7
Daylight Killed 182.6 209 199 197 179 129 145 144 112 134 -26.6 19.6
Seriously Injured 1,276.2 1,451 1,379 1,277 1,133 1,141 1,086 1,069 982 1,004 -21.3 2.2
KSI 1,458.8 1,660 1,578 1,474 1,312 1,270 1,231 1,213 1,094 1,138 -22.0 4.0
Slightly Injured 14,039.0 15,613 15,132 14,290 12,858 12,302 11,723 11,526 10,878 10,348 -26.3 -4.9
Total 15,497.8 17,273 16,710 15,764 14,170 13,572 12,954 12,739 11,972 11,486 -25.9 -4.1

HA Publication PR67/14 App 137
Table L-4 Top 20 contributory factors in collisions during darkness by year
No. CF Contributory Factors
2005-2009 BSL
average 2005 2006 2007 2008 2009 2010 2011 2012 2013
2013 per cent change from BSL
average
2013 per cent change from
2012
1 405 Failed to look properly 768.4 697 820 862 784 679 762 761 806 759 -1.2 -5.8
2 406 Failed to judge other person’s path or speed 710.6 744 781 744 685 599 639 573 682 637 -10.4 -6.6
3 410 Loss of control 843.0 895 904 858 772 786 729 617 636 571 -32.3 -10.2
4 103 Slippery road (due to weather) 433.2 414 398 392 422 540 519 320 429 390 -10.0 -9.1
5 602 Careless, reckless or in a hurry 395.6 419 433 437 362 327 321 348 332 315 -20.4 -5.1
6 403 Poor turn or manoeuvre 375.4 407 412 403 319 336 325 259 287 301 -19.8 4.9
7 308 Following too close 363.0 439 383 343 342 308 281 296 303 272 -25.1 -10.2
8 408 Sudden braking 314.2 314 334 326 273 324 259 293 293 266 -15.3 -9.2
9 307 Travelling too fast for conditions 408.6 445 439 424 364 371 308 274 319 230 -43.7 -27.9
10 409 Swerved 294.8 331 305 297 276 265 235 235 247 230 -22.0 -6.9
11 501 Impaired by alcohol 310.4 321 334 341 285 271 240 244 230 212 -31.7 -7.8
12 503 Fatigue 298.8 317 349 307 262 259 246 239 223 204 -31.7 -8.5
13 306 Exceeding speed limit 159.8 181 176 158 140 144 114 130 93 106 -33.7 14.0
14 707 Rain, sleet, snow, or fog 125.2 124 138 109 125 130 115 85 138 99 -20.9 -28.3
15 509 Distraction in vehicle 97.6 108 92 118 97 73 90 115 95 88 -9.8 -7.4
16 601 Aggressive driving 96.4 101 105 90 91 95 80 70 86 77 -20.1 -10.5
17 605 Learner or inexperienced driver/rider 146.6 148 164 159 136 126 99 95 89 74 -49.5 -16.9
18 710 Vehicle blind spot 99.4 130 104 95 73 95 109 75 62 71 -28.6 14.5
19 109 Animal or object in carriageway 105.8 113 111 111 96 98 68 75 76 65 -38.6 -14.5
20 505 Illness or disability, mental or physical 40.2 37 38 39 37 50 39 54 40 55 36.8 37.5
Notes: (a) Values in the table report the number of collisions where at least one of the specified contributory factors was recorded. (b) Ranked by 2013.
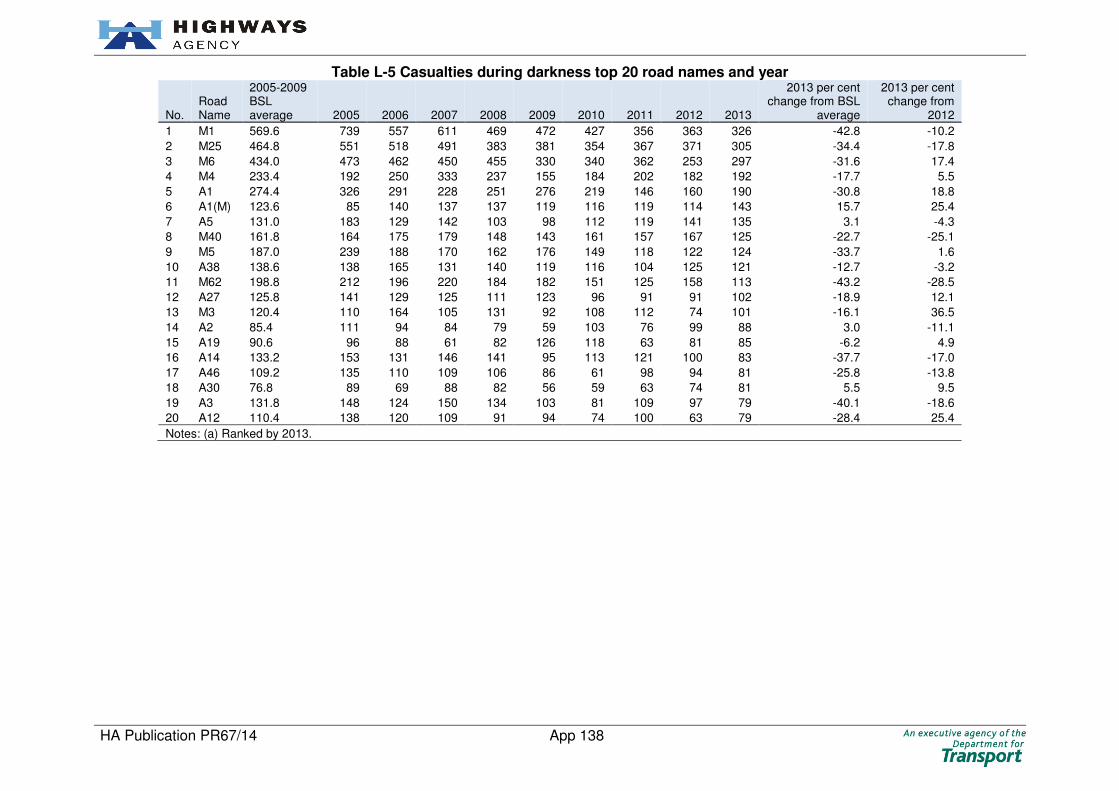
HA Publication PR67/14 App 138
Table L-5 Casualties during darkness top 20 road names and year
No. Road Name
2005-2009 BSL average 2005 2006 2007 2008 2009 2010 2011 2012 2013
2013 per cent change from BSL
average
2013 per cent change from
2012
1 M1 569.6 739 557 611 469 472 427 356 363 326 -42.8 -10.2
2 M25 464.8 551 518 491 383 381 354 367 371 305 -34.4 -17.8
3 M6 434.0 473 462 450 455 330 340 362 253 297 -31.6 17.4
4 M4 233.4 192 250 333 237 155 184 202 182 192 -17.7 5.5
5 A1 274.4 326 291 228 251 276 219 146 160 190 -30.8 18.8
6 A1(M) 123.6 85 140 137 137 119 116 119 114 143 15.7 25.4
7 A5 131.0 183 129 142 103 98 112 119 141 135 3.1 -4.3
8 M40 161.8 164 175 179 148 143 161 157 167 125 -22.7 -25.1
9 M5 187.0 239 188 170 162 176 149 118 122 124 -33.7 1.6
10 A38 138.6 138 165 131 140 119 116 104 125 121 -12.7 -3.2
11 M62 198.8 212 196 220 184 182 151 125 158 113 -43.2 -28.5
12 A27 125.8 141 129 125 111 123 96 91 91 102 -18.9 12.1
13 M3 120.4 110 164 105 131 92 108 112 74 101 -16.1 36.5
14 A2 85.4 111 94 84 79 59 103 76 99 88 3.0 -11.1
15 A19 90.6 96 88 61 82 126 118 63 81 85 -6.2 4.9
16 A14 133.2 153 131 146 141 95 113 121 100 83 -37.7 -17.0
17 A46 109.2 135 110 109 106 86 61 98 94 81 -25.8 -13.8
18 A30 76.8 89 69 88 82 56 59 63 74 81 5.5 9.5
19 A3 131.8 148 124 150 134 103 81 109 97 79 -40.1 -18.6
20 A12 110.4 138 120 109 91 94 74 100 63 79 -28.4 25.4
Notes: (a) Ranked by 2013.
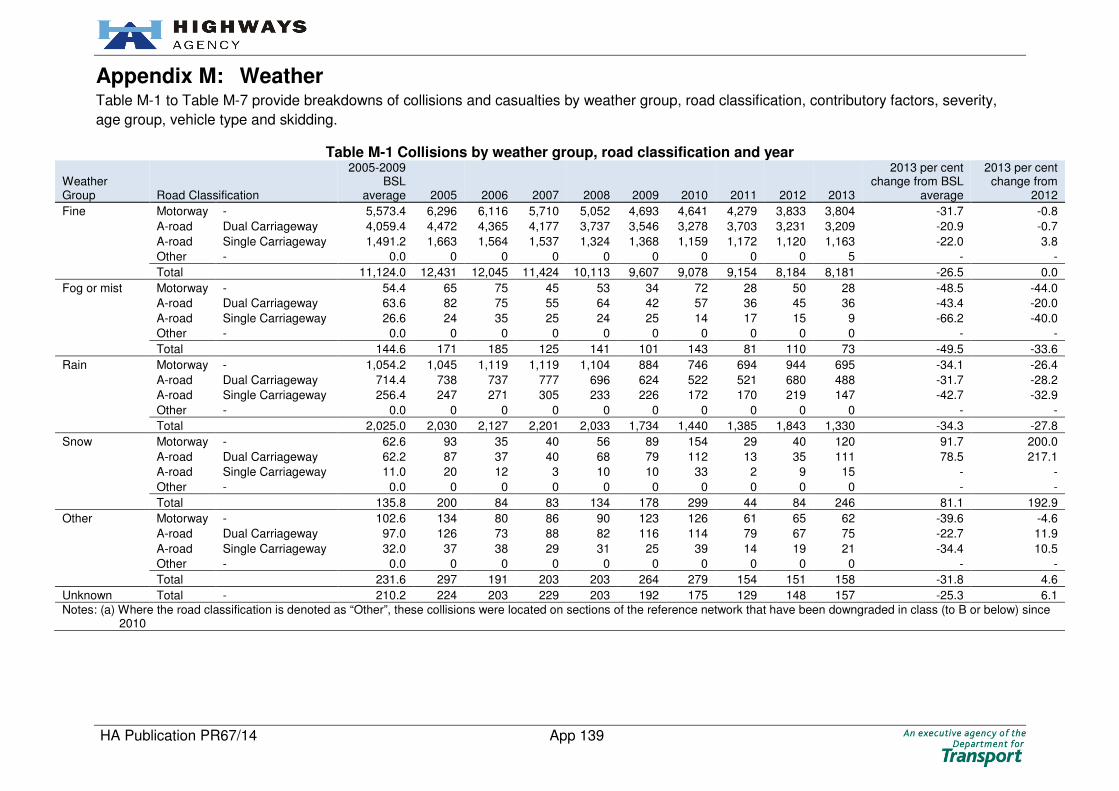
HA Publication PR67/14 App 139
Appendix M: Weather Table M-1 to Table M-7 provide breakdowns of collisions and casualties by weather group, road classification, contributory factors, severity,
age group, vehicle type and skidding.
Table M-1 Collisions by weather group, road classification and year
Weather Group Road Classification
2005-2009 BSL
average 2005 2006 2007 2008 2009 2010 2011 2012 2013
2013 per cent change from BSL
average
2013 per cent change from
2012
Fine Motorway - 5,573.4 6,296 6,116 5,710 5,052 4,693 4,641 4,279 3,833 3,804 -31.7 -0.8
A-road Dual Carriageway 4,059.4 4,472 4,365 4,177 3,737 3,546 3,278 3,703 3,231 3,209 -20.9 -0.7
A-road Single Carriageway 1,491.2 1,663 1,564 1,537 1,324 1,368 1,159 1,172 1,120 1,163 -22.0 3.8
Other - 0.0 0 0 0 0 0 0 0 0 5 - -
Total 11,124.0 12,431 12,045 11,424 10,113 9,607 9,078 9,154 8,184 8,181 -26.5 0.0
Fog or mist Motorway - 54.4 65 75 45 53 34 72 28 50 28 -48.5 -44.0
A-road Dual Carriageway 63.6 82 75 55 64 42 57 36 45 36 -43.4 -20.0
A-road Single Carriageway 26.6 24 35 25 24 25 14 17 15 9 -66.2 -40.0
Other - 0.0 0 0 0 0 0 0 0 0 0 - -
Total 144.6 171 185 125 141 101 143 81 110 73 -49.5 -33.6
Rain Motorway - 1,054.2 1,045 1,119 1,119 1,104 884 746 694 944 695 -34.1 -26.4
A-road Dual Carriageway 714.4 738 737 777 696 624 522 521 680 488 -31.7 -28.2
A-road Single Carriageway 256.4 247 271 305 233 226 172 170 219 147 -42.7 -32.9
Other - 0.0 0 0 0 0 0 0 0 0 0 - -
Total 2,025.0 2,030 2,127 2,201 2,033 1,734 1,440 1,385 1,843 1,330 -34.3 -27.8
Snow Motorway - 62.6 93 35 40 56 89 154 29 40 120 91.7 200.0
A-road Dual Carriageway 62.2 87 37 40 68 79 112 13 35 111 78.5 217.1
A-road Single Carriageway 11.0 20 12 3 10 10 33 2 9 15 - -
Other - 0.0 0 0 0 0 0 0 0 0 0 - -
Total 135.8 200 84 83 134 178 299 44 84 246 81.1 192.9
Other Motorway - 102.6 134 80 86 90 123 126 61 65 62 -39.6 -4.6
A-road Dual Carriageway 97.0 126 73 88 82 116 114 79 67 75 -22.7 11.9
A-road Single Carriageway 32.0 37 38 29 31 25 39 14 19 21 -34.4 10.5
Other - 0.0 0 0 0 0 0 0 0 0 0 - -
Total 231.6 297 191 203 203 264 279 154 151 158 -31.8 4.6
Unknown Total - 210.2 224 203 229 203 192 175 129 148 157 -25.3 6.1
Notes: (a) Where the road classification is denoted as “Other”, these collisions were located on sections of the reference network that have been downgraded in class (to B or below) since 2010

HA Publication PR67/14 App 140
Table M-2 Casualties by weather group, road classification and year
Weather Group Road Classification
2005-2009 BSL
average 2005 2006 2007 2008 2009 2010 2011 2012 2013
2013 per cent change from BSL
average
2013 per cent change from
2012
Fine Motorway - 8,996.4 10,183 9,837 9,207 8,093 7,662 7,495 7,219 6,260 6,308 -29.9 0.8
A-road Dual Carriageway 5,992.8 6,695 6,440 6,046 5,498 5,285 4,989 5,580 4,857 4,797 -20.0 -1.2
A-road Single Carriageway 2,430.6 2,734 2,568 2,453 2,141 2,257 1,958 1,976 1,884 1,926 -20.8 2.2
Other - 0.0 0 0 0 0 0 0 0 0 6 - -
Total 17,419.8 19,612 18,845 17,706 15,732 15,204 14,442 14,775 13,001 13,037 -25.2 0.3
Fog or mist Motorway - 103.6 119 121 124 97 57 127 40 118 46 -55.6 -61.0
A-road Dual Carriageway 100.0 124 105 95 97 79 83 63 73 134 34.0 83.6
A-road Single Carriageway 43.2 45 53 43 41 34 20 24 20 17 -60.6 -15.0
Other - 0.0 0 0 0 0 0 0 0 0 0 - -
Total 246.8 288 279 262 235 170 230 127 211 197 -20.2 -6.6
Rain Motorway - 1,694.6 1,675 1,774 1,813 1,747 1,464 1,217 1,215 1,571 1,079 -36.3 -31.3
A-road Dual Carriageway 1,064.8 1,105 1,108 1,137 1,032 942 787 791 974 740 -30.5 -24.0
A-road Single Carriageway 424.8 415 487 506 363 353 271 300 355 243 -42.8 -31.5
Other - 0.0 0 0 0 0 0 0 0 0 0 - -
Total 3,184.2 3,195 3,369 3,456 3,142 2,759 2,275 2,306 2,900 2,062 -35.2 -28.9
Snow Motorway - 96.6 139 58 59 97 130 225 44 67 180 86.3 168.7
A-road Dual Carriageway 88.2 128 52 49 100 112 143 16 49 144 63.3 193.9
A-road Single Carriageway 16.0 28 23 3 15 11 41 2 13 24 50.0 -
Other - 0.0 0 0 0 0 0 0 0 0 0 - -
Total 200.8 295 133 111 212 253 409 62 129 348 73.3 169.8
Other Motorway - 161.8 213 151 143 133 169 184 97 102 107 -33.9 4.9
A-road Dual Carriageway 145.2 201 101 125 124 175 160 109 94 109 -24.9 16.0
A-road Single Carriageway 52.6 57 55 54 55 42 57 21 31 28 -46.8 -9.7
Other - 0.0 0 0 0 0 0 0 0 0 0 - -
Total 359.6 471 307 322 312 386 401 227 227 244 -32.1 7.5
Unknown Total - 291.6 323 263 334 270 268 265 223 205 206 -29.4 0.5
Notes: (a) Where the road classification is denoted as “Other”, these casualties were located on sections of the reference network that have been downgraded in class (to B or below) since 2010.

HA Publication PR67/14 App 141
Table M-3 Casualties by weather group, severity and year
Weather Group Casualty Severity
2005-2009 BSL
average 2005 2006 2007 2008 2009 2010 2011 2012 2013
2013 per cent change from BSL
average
2013 per cent change from
2012
Fine Killed 300.2 363 329 312 294 203 206 218 167 204 -32.0 22.2
Seriously Injured 1,627.4 1,939 1,698 1,634 1,432 1,434 1,345 1,331 1,152 1,237 -24.0 7.4
KSI 1,927.6 2,302 2,027 1,946 1,726 1,637 1,551 1,549 1,319 1,441 -25.2 9.2
Slightly Injured 15,492.2 17,310 16,818 15,760 14,006 13,567 12,891 13,226 11,682 11,596 -25.1 -0.7
Total 17,419.8 19,612 18,845 17,706 15,732 15,204 14,442 14,775 13,001 13,037 -25.2 0.3
Fog or mist Killed 5.4 3 8 9 6 1 3 1 7 1 - -
Seriously Injured 28.4 30 33 32 25 22 19 19 17 24 -15.5 41.2
KSI 33.8 33 41 41 31 23 22 20 24 25 -26.0 4.2
Slightly Injured 213.0 255 238 221 204 147 208 107 187 172 -19.2 -8.0
Total 246.8 288 279 262 235 170 230 127 211 197 -20.2 -6.6
Rain Killed 39.2 34 39 44 39 40 24 21 41 23 -41.3 -43.9
Seriously Injured 244.8 224 259 307 236 198 180 183 268 159 -35.0 -40.7
KSI 284.0 258 298 351 275 238 204 204 309 182 -35.9 -41.1
Slightly Injured 2,900.2 2,937 3,071 3,105 2,867 2,521 2,071 2,102 2,591 1,880 -35.2 -27.4
Total 3,184.2 3,195 3,369 3,456 3,142 2,759 2,275 2,306 2,900 2,062 -35.2 -28.9
Snow Killed 2.0 4 1 0 2 3 7 1 0 9 - -
Seriously Injured 17.6 31 13 11 15 18 37 6 11 20 13.6 -
KSI 19.6 35 14 11 17 21 44 7 11 29 48.0 -
Slightly Injured 181.2 260 119 100 195 232 365 55 118 319 76.0 170.3
Total 200.8 295 133 111 212 253 409 62 129 348 73.3 169.8
Other Killed 5.2 3 8 3 7 5 3 3 1 3 - -
Seriously Injured 29.6 28 32 31 30 27 33 18 18 17 -42.6 -5.6
KSI 34.8 31 40 34 37 32 36 21 19 20 -42.5 5.3
Slightly Injured 324.8 440 267 288 275 354 365 206 208 224 -31.0 7.7
Total 359.6 471 307 322 312 386 401 227 227 244 -32.1 7.5
Unknown Total 291.6 323 263 334 270 268 265 223 205 206 -29.4 0.5

HA Publication PR67/14 App 142
Table M-4 Casualties by weather group, severity and vehicle type, 2013
Weather Group Casualty Severity
Vehicle Type
Agricultural vehicle
Bus or coach Car
Goods Vehicle HGV Motorcycle
Pedal cycle Other
Fine Killed 2 1 123 14 23 34 6 1
Seriously Injured 2 27 796 48 74 249 24 17
KSI 4 28 919 62 97 283 30 18
Slightly Injured 12 76 10,013 581 312 454 106 42
Total 16 104 10,932 643 409 737 136 60
Fog or mist Killed 0 0 1 0 0 0 0 0
Seriously Injured 1 0 19 0 1 3 0 0
KSI 1 0 20 0 1 3 0 0
Slightly Injured 1 0 137 23 6 5 0 0
Total 2 0 157 23 7 8 0 0
Rain Killed 0 0 15 1 4 3 0 0
Seriously Injured 0 11 115 5 7 17 3 1
KSI 0 11 130 6 11 20 3 1
Slightly Injured 0 35 1,636 88 50 59 7 5
Total 0 46 1,766 94 61 79 10 6
Snow Killed 0 0 8 0 0 0 0 1
Seriously Injured 0 0 16 0 1 3 0 0
KSI 0 0 24 0 1 3 0 1
Slightly Injured 0 0 282 15 19 3 0 0
Total 0 0 306 15 20 6 0 1
Other Killed 0 0 2 0 1 0 0 0
Seriously Injured 0 0 13 1 1 2 0 0
KSI 0 0 15 1 2 2 0 0
Slightly Injured 0 0 199 12 2 9 1 1
Total 0 0 214 13 4 11 1 1
Unknown Total 0 1 181 11 4 7 2 0

HA Publication PR67/14 App 143
Table M-5 Collisions by weather group and skidding category
Weather Group Skidding Category
2005-2009 BSL
average 2005 2006 2007 2008 2009 2010 2011 2012 2013
2013 per cent change from BSL
average
2013 per cent change from
2012
Fine Jackknifed 58.4 74 73 50 50 45 34 42 33 31 -46.9 -6.1
Jackknifed and overturned 46.2 63 49 58 36 25 24 27 24 29 -37.2 20.8
Overturned 583.4 647 623 634 550 463 416 408 380 372 -36.2 -2.1
Skidded 3,101.6 3,699 3,364 3,123 2,688 2,634 2,395 2,168 1,905 1,825 -41.2 -4.2
Skidded and overturned 924.6 1,080 1,018 977 839 709 690 648 548 519 -43.9 -5.3
None/Unknown 9,279.8 10,307 10,045 9,543 8,479 8,025 7,590 7,763 7,012 7,097 -23.5 1.2
Total 13,994.0 15,870 15,172 14,385 12,642 11,901 11,149 11,056 9,902 9,873 -29.4 -0.3
Fog or mist Jackknifed 1.0 1 2 2 0 0 2 1 1 0 - -
Jackknifed and overturned 0.4 1 1 0 0 0 0 0 1 0 - -
Overturned 7.4 8 7 10 10 2 4 9 8 3 - -
Skidded 56.2 69 71 46 54 41 51 25 35 16 -71.5 -54.3
Skidded and overturned 11.2 12 20 7 10 7 15 10 9 6 - -
None/Unknown 117.6 146 147 100 117 78 110 56 90 61 -48.1 -32.2
Total 193.8 237 248 165 191 128 182 101 144 86 -55.6 -40.3
Rain Jackknifed 10.2 9 10 12 14 6 8 8 7 4 - -
Jackknifed and overturned 4.8 5 5 2 8 4 4 2 2 3 - -
Overturned 75.0 71 73 102 67 62 44 42 81 64 -14.7 -21.0
Skidded 851.0 811 930 930 869 715 581 556 690 477 -43.9 -30.9
Skidded and overturned 173.6 158 168 229 175 138 106 123 156 105 -39.5 -32.7
None/Unknown 1,522.8 1,587 1,626 1,613 1,501 1,287 1,069 1,027 1,327 983 -35.4 -25.9
Total 2,637.4 2,641 2,812 2,888 2,634 2,212 1,812 1,758 2,263 1,636 -38.0 -27.7
Snow Jackknifed 1.6 2 3 0 0 3 11 0 1 7 - -
Jackknifed and overturned 0.8 2 0 1 0 1 0 0 0 1 - -
Overturned 3.6 8 1 3 2 4 6 2 2 6 - -
Skidded 73.4 92 40 36 78 121 180 28 55 136 85.3 147.3
Skidded and overturned 19.6 26 13 20 19 20 30 8 14 37 88.8 -
None/Unknown 78.2 131 57 37 76 90 170 19 39 132 68.8 238.5
Total 177.2 261 114 97 175 239 397 57 111 319 80.0 187.4
Other Jackknifed 1.2 2 1 2 1 0 2 1 1 0 - -
Jackknifed and overturned 0.8 2 0 2 0 0 1 0 0 0 - -
Overturned 10.2 10 13 9 10 9 13 6 7 6 - -
Skidded 94.2 114 72 83 83 119 119 60 60 66 -29.9 10.0
Skidded and overturned 22.2 17 16 26 25 27 28 13 15 15 -32.4 0.0
None/Unknown 172.8 241 147 149 145 182 195 104 103 109 -36.9 5.8
Total 301.4 386 249 271 264 337 358 184 186 196 -35.0 5.4
Unknown Total 229.6 254 218 252 215 209 187 141 165 178 -22.5 7.9
Notes: (a) Values in the table report the number of collisions by weather group where at least one of the vehicles involved was recorded with the specified skidding category.

HA Publication PR67/14 App 144
Table M-6 Collisions with weather contributory factors
Contributory Factors
2005-2009 BSL
average 2005 2006 2007 2008 2009 2010 2011 2012 2013
2013 per cent change from BSL
average
2013 per cent change from
2012
103 Slippery road (due to weather) 1,149.8 1,155 1,079 1,128 1,159 1,228 1,199 758 1,090 892 -22.4 -18.2
307 Travelling too fast for conditions 1,291.0 1,513 1,414 1,327 1,133 1,068 933 798 916 674 -47.8 -26.4
706 Dazzling sun 181.6 200 187 188 173 160 145 121 167 145 -20.2 -13.2
707 Rain, sleet, snow, or fog 291.8 315 308 276 304 256 229 181 292 205 -29.7 -29.8
708 Spray from other vehicles 132.0 137 135 129 139 120 87 84 130 83 -37.1 -36.2
Notes: (a) Values in the table report the number of collisions by year where at least one of the specified contributory factors was recorded.
Table M-7 Casualties with weather contributory factors by severity and year
Contributory Factors Casualty Severity
2005-2009 BSL
average 2005 2006 2007 2008 2009 2010 2011 2012 2013
2013 per cent change from BSL average
2013 per cent change
from 2012
103 Slippery road (due to weather) Killed 17.8 16 14 16 17 26 13 8 14 16 -10.1 -
Seriously Injured 144.8 147 123 180 132 142 161 104 126 103 -28.9 -18.3
KSI 162.6 163 137 196 149 168 174 112 140 119 -26.8 -15.0
Slightly Injured 1,621.8 1,657 1,557 1,581 1,626 1,688 1,618 1,038 1,512 1,196 -26.3 -20.9
Total 1,784.4 1,820 1,694 1,777 1,775 1,856 1,792 1,150 1,652 1,315 -26.3 -20.4
307 Travelling too fast for conditions Killed 36.2 45 49 33 26 28 21 16 24 16 -55.8 -33.3
Seriously Injured 211.6 241 219 248 200 150 153 145 156 108 -49.0 -30.8
KSI 247.8 286 268 281 226 178 174 161 180 124 -50.0 -31.1
Slightly Injured 2,001.2 2,356 2,207 2,111 1,706 1,626 1,477 1,235 1,437 1,045 -47.8 -27.3
Total 2,249.0 2,642 2,475 2,392 1,932 1,804 1,651 1,396 1,617 1,169 -48.0 -27.7
706 Dazzling sun Killed 2.6 5 3 1 4 0 1 2 1 5 - -
Seriously Injured 18.8 27 18 25 12 12 19 12 20 23 22.3 15.0
KSI 21.4 32 21 26 16 12 20 14 21 28 30.8 33.3
Slightly Injured 279.6 293 294 263 273 275 257 204 246 208 -25.6 -15.4
Total 301.0 325 315 289 289 287 277 218 267 236 -21.6 -11.6
707 Rain, sleet, snow, or fog Killed 7.0 7 7 8 8 5 4 3 6 3 - -
Seriously Injured 40.8 45 49 41 41 28 41 25 37 38 -6.9 2.7
KSI 47.8 52 56 49 49 33 45 28 43 41 -14.2 -4.7
Slightly Injured 425.2 468 442 411 441 364 325 281 459 352 -17.2 -23.3
Total 473.0 520 498 460 490 397 370 309 502 393 -16.9 -21.7
708 Spray from other vehicles Killed 1.2 0 3 1 1 1 2 1 2 0 - -
Seriously Injured 16.0 11 18 16 16 19 16 11 16 9 -43.8 -43.8
KSI 17.2 11 21 17 17 20 18 12 18 9 -47.7 -50.0
Slightly Injured 198.0 213 190 199 187 201 135 145 191 118 -40.4 -38.2
Total 215.2 224 211 216 204 221 153 157 209 127 -41.0 -39.2
Notes: (a) Values in the table report the number of casualties by severity where at least one of the specified contributory factors was recorded.

HA Publication PR67/14 App 145
Appendix N: Roadworks Table N-1 to Table N-9 provide breakdowns of collisions and casualties involving roadworks1 by road classification, junction detail, vehicle type,
driver age, pedestrian involvement, contributory factors, severity and severity ratios.
Table N-1 Casualties during roadworks by road classification, severity and year
Road Classification Casualty Severity
2005-2009 BSL
average 2005 2006 2007 2008 2009 2010 2011 2012 2013
2013 per cent change from BSL
average
2013 per cent change from
2012
Motorway - Killed 8.0 13 3 6 13 5 4 3 5 2 - -
Seriously Injured 33.4 32 33 18 49 35 30 15 14 23 -31.1 -
KSI 41.4 45 36 24 62 40 34 18 19 25 -39.6 31.6
Slightly Injured 522.4 532 533 535 533 479 596 402 323 338 -35.3 4.6
Total 563.8 577 569 559 595 519 630 420 342 363 -35.6 6.1
A-road Dual Carriageway 0.0 0 0 0 0 0 0 0 0 0 - -
Built-up Killed 0.6 1 1 0 0 1 0 0 1 1 - -
Seriously Injured 3.6 5 4 5 2 2 3 0 0 2 - -
KSI 4.2 6 5 5 2 3 3 0 1 3 - -
Slightly Injured 42.8 70 38 49 37 20 21 52 22 13 -69.6 -40.9
Total 47.0 76 43 54 39 23 24 52 23 16 -66.0 -30.4
Non Built-up Killed 2.4 3 5 2 1 1 2 0 0 1 - -
Seriously Injured 11.6 19 13 13 7 6 9 8 1 9 - -
KSI 14.0 22 18 15 8 7 11 8 1 10 - -
Slightly Injured 168.2 184 195 185 151 126 174 81 71 62 -63.1 -12.7
Total 182.2 206 213 200 159 133 185 89 72 72 -60.5 0.0
A-road Single Carriageway 0.0 0 0 0 0 0 0 0 0 0 - -
Built-up Killed 0.2 0 0 1 0 0 0 0 0 0 - -
Seriously Injured 3.2 5 1 7 3 0 0 1 0 2 - -
KSI 3.4 5 1 8 3 0 0 1 0 2 - -
Slightly Injured 24.4 18 22 34 34 14 12 7 13 9 -63.1 -
Total 27.8 23 23 42 37 14 12 8 13 11 -60.4 -
Non Built-up Killed 0.4 0 1 0 0 1 0 1 0 0 - -
Seriously Injured 5.4 3 12 2 6 4 4 2 1 5 - -
KSI 5.8 3 13 2 6 5 4 3 1 5 - -
Slightly Injured 42.4 50 50 45 34 33 45 26 23 25 -41.0 8.7
Total 48.2 53 63 47 40 38 49 29 24 30 -37.8 25.0
1 Collisions and casualties involving roadworks are where ‘special conditions at site’ equals roadworks on the STATS19 record.

HA Publication PR67/14 App 146
Table N-2 Casualties during roadworks by junction detail, severity and year
Junction Detail Casualty Severity
2005-2009 BSL
average 2005 2006 2007 2008 2009 2010 2011 2012 2013
2013 per cent change from BSL
average
2013 per cent change from
2012
Crossroads Killed 0.0 0 0 0 0 0 0 0 0 0 - -
Seriously Injured 0.4 1 1 0 0 0 2 0 0 0 - -
KSI 0.4 1 1 0 0 0 2 0 0 0 - -
Slightly Injured 4.6 6 7 0 6 4 8 1 7 2 - -
Total 5.0 7 8 0 6 4 10 1 7 2 - -
Junction - more than 4 arms (not roundabout)
Killed 0.0 0 0 0 0 0 0 0 0 0 - -
Seriously Injured 0.0 0 0 0 0 0 0 0 0 0 - -
KSI 0.0 0 0 0 0 0 0 0 0 0 - -
Slightly Injured 4.2 5 5 5 2 4 0 2 3 1 - -
Total 4.2 5 5 5 2 4 0 2 3 1 - -
Private drive or entrance Killed 0.0 0 0 0 0 0 0 0 0 0 - -
Seriously Injured 0.0 0 0 0 0 0 1 1 0 0 - -
KSI 0.0 0 0 0 0 0 1 1 0 0 - -
Slightly Injured 1.0 1 0 2 2 0 0 0 0 0 - -
Total 1.0 1 0 2 2 0 1 1 0 0 - -
Roundabout Killed 0.2 0 0 0 0 1 0 0 0 0 - -
Seriously Injured 2.4 2 2 3 4 1 0 1 1 1 - -
KSI 2.6 2 2 3 4 2 0 1 1 1 - -
Slightly Injured 42.8 43 48 55 39 29 28 45 22 11 -74.3 -50.0
Total 45.4 45 50 58 43 31 28 46 23 12 -73.6 -47.8
Slip road Killed 0.6 1 1 0 1 0 0 0 0 0 - -
Seriously Injured 5.8 3 6 4 9 7 4 2 3 5 - -
KSI 6.4 4 7 4 10 7 4 2 3 5 - -
Slightly Injured 97.2 119 87 99 106 75 82 71 66 71 -27.0 7.6
Total 103.6 123 94 103 116 82 86 73 69 76 -26.6 10.1
T or staggered junction Killed 0.0 0 0 0 0 0 0 0 0 0 - -
Seriously Injured 0.6 2 0 0 0 1 3 0 0 1 - -
KSI 0.6 2 0 0 0 1 3 0 0 1 - -
Slightly Injured 13.0 14 14 11 11 15 16 10 9 3 - -
Total 13.6 16 14 11 11 16 19 10 9 4 - -
Other junction Total 9.8 11 11 11 11 5 4 5 4 4 - -
Not at junction or within 20 metres Total 686.4 727 729 712 679 585 752 460 359 393 -42.7 9.5

HA Publication PR67/14 App 147
Table N-3 Casualties during roadworks by time of day, severity and year
Grouped Time Casualty Severity
2005-2009 BSL
average 2005 2006 2007 2008 2009 2010 2011 2012 2013
2013 per cent change from BSL
average
2013 per cent change from
2012
0 - 6am Killed 4.2 7 2 4 6 2 1 1 3 1 - -
Seriously Injured 11.4 16 12 4 15 10 10 1 2 5 - -
KSI 15.6 23 14 8 21 12 11 2 5 6 -61.5 -
Slightly Injured 68.8 57 75 60 89 63 80 43 33 33 -52.0 0.0
Total 84.4 80 89 68 110 75 91 45 38 39 -53.8 2.6
6 - 10am Killed 1.6 4 1 1 1 1 0 1 0 0 - -
Seriously Injured 8.6 5 12 10 10 6 11 7 2 11 - -
KSI 10.2 9 13 11 11 7 11 8 2 11 - -
Slightly Injured 115.6 137 109 115 117 100 121 81 84 89 -23.0 6.0
Total 125.8 146 122 126 128 107 132 89 86 100 -20.5 16.3
10am - 2pm Killed 0.8 0 3 0 0 1 2 1 0 2 - -
Seriously Injured 11.8 17 12 8 14 8 2 4 4 6 - -
KSI 12.6 17 15 8 14 9 4 5 4 8 - -
Slightly Injured 229.4 258 272 261 200 156 195 166 86 95 -58.6 10.5
Total 242.0 275 287 269 214 165 199 171 90 103 -57.4 14.4
2 - 6pm Killed 0.2 0 0 0 0 1 1 1 1 1 - -
Seriously Injured 10.6 13 9 12 11 8 8 3 1 8 - -
KSI 10.8 13 9 12 11 9 9 4 2 9 - -
Slightly Injured 188.0 191 191 192 184 182 229 140 105 95 -49.5 -9.5
Total 198.8 204 200 204 195 191 238 144 107 104 -47.7 -2.8
6pm - 0am Killed 4.8 6 4 4 7 3 2 0 2 0 - -
Seriously Injured 14.8 13 18 11 17 15 15 11 7 11 - -
KSI 19.6 19 22 15 24 18 17 11 9 11 -43.9 -
Slightly Injured 198.4 211 191 220 199 171 223 138 144 135 -32.0 -6.3
Total 218.0 230 213 235 223 189 240 149 153 146 -33.0 -4.6

HA Publication PR67/14 App 148
Table N-4i. Casualties during roadworks by months of the year, severity and year
Month Casualty Severity
2005-2009 BSL
average 2005 2006 2007 2008 2009 2010 2011 2012 2013
2013 per cent change from BSL
average
2013 per cent change from
2012
Jan Killed 0.6 0 1 1 1 0 0 0 0 0 - - Seriously Injured 5.0 5 6 5 5 4 5 3 1 1 - - KSI 5.6 5 7 6 6 4 5 3 1 1 - - Slightly Injured 50.2 47 61 52 49 42 64 52 32 16 -68.1 -50.0
Total 55.8 52 68 58 55 46 69 55 33 17 -69.5 -48.5
Feb Killed 1.8 1 2 1 3 2 1 1 0 0 - - Seriously Injured 5.2 7 4 5 5 5 2 3 1 2 - - KSI 7.0 8 6 6 8 7 3 4 1 2 - - Slightly Injured 66.2 67 84 76 72 32 101 54 48 25 -62.2 -47.9
Total 73.2 75 90 82 80 39 104 58 49 27 -63.1 -44.9
Mar Killed 0.6 0 1 1 0 1 1 1 0 0 - - Seriously Injured 4.2 1 4 4 8 4 9 3 3 2 - - KSI 4.8 1 5 5 8 5 10 4 3 2 - - Slightly Injured 65.2 63 74 58 75 56 96 65 60 32 -50.9 -46.7
Total 70.0 64 79 63 83 61 106 69 63 34 -51.4 -46.0
Apr Killed 0.6 2 0 0 1 0 1 0 1 0 - - Seriously Injured 2.6 3 4 1 5 0 4 2 1 5 - - KSI 3.2 5 4 1 6 0 5 2 2 5 - - Slightly Injured 50.6 53 68 53 56 23 109 28 51 46 -9.1 -9.8
Total 53.8 58 72 54 62 23 114 30 53 51 -5.2 -3.8
May Killed 1.2 4 0 1 1 0 0 0 2 0 - - Seriously Injured 4.6 7 6 1 6 3 4 1 2 6 - - KSI 5.8 11 6 2 7 3 4 1 4 6 - - Slightly Injured 54.6 64 42 90 44 33 72 48 32 44 -19.4 37.5
Total 60.4 75 48 92 51 36 76 49 36 50 -17.2 38.9
Jun Killed 0.4 1 0 0 1 0 1 0 0 0 - - Seriously Injured 5.2 4 7 4 7 4 2 1 2 3 - - KSI 5.6 5 7 4 8 4 3 1 2 3 - - Slightly Injured 61.6 81 52 69 61 45 57 25 35 41 -33.4 17.1
Total 67.2 86 59 73 69 49 60 26 37 44 -34.5 18.9
Jul Killed 0.8 0 3 0 0 1 1 0 2 1 - - Seriously Injured 5.8 3 10 5 7 4 9 4 0 6 - - KSI 6.6 3 13 5 7 5 10 4 2 7 - - Slightly Injured 75.8 76 70 91 83 59 55 50 33 40 -47.2 21.2
Total 82.4 79 83 96 90 64 65 54 35 47 -43.0 34.3
Aug Killed 1.2 1 0 2 0 3 1 1 0 0 - - Seriously Injured 4.2 4 2 6 8 1 2 1 0 3 - - KSI 5.4 5 2 8 8 4 3 2 0 3 - - Slightly Injured 74.8 93 33 84 97 67 76 40 48 44 -41.2 -8.3
Total 80.2 98 35 92 105 71 79 42 48 47 -41.4 -2.1

HA Publication PR67/14 App 149
Table N-4ii. Casualties during roadworks by months of the year, severity and year
Month Casualty Severity
2005-2009 BSL
average 2005 2006 2007 2008 2009 2010 2011 2012 2013
2013 per cent change from BSL
average
2013 per cent change from
2012
Sep Killed 0.4 2 0 0 0 0 0 0 1 0 - -
Seriously Injured 6.8 11 6 4 3 10 4 1 1 6 - -
KSI 7.2 13 6 4 3 10 4 1 2 6 - -
Slightly Injured 70.8 80 69 78 47 80 53 45 38 47 -33.6 23.7
Total 78.0 93 75 82 50 90 57 46 40 53 -32.1 32.5
Oct Killed 2.2 0 2 3 6 0 0 1 0 3 - -
Seriously Injured 4.0 4 6 3 5 2 2 2 2 1 - -
KSI 6.2 4 8 6 11 2 2 3 2 4 - -
Slightly Injured 85.8 80 115 83 67 84 80 60 26 43 -49.9 65.4
Total 92.0 84 123 89 78 86 82 63 28 47 -48.9 67.9
Nov Killed 0.6 0 1 0 1 1 0 0 0 0 - -
Seriously Injured 6.2 7 6 5 7 6 2 0 2 5 - -
KSI 6.8 7 7 5 8 7 2 0 2 5 - -
Slightly Injured 86.4 80 105 67 97 83 60 59 24 40 -53.7 66.7
Total 93.2 87 112 72 105 90 62 59 26 45 -51.7 73.1
Dec Killed 1.2 6 0 0 0 0 0 0 0 0 - -
Seriously Injured 3.4 8 2 2 1 4 1 5 1 1 - -
KSI 4.6 14 2 2 1 4 1 5 1 1 - -
Slightly Injured 58.2 70 65 47 41 68 25 42 25 29 -50.2 16.0
Total 62.8 84 67 49 42 72 26 47 26 30 -52.2 15.4

HA Publication PR67/14 App 150
Table N-5 Casualties during roadworks by vehicle type, severity and year
Vehicle Type Casualty Severity
2005-2009 BSL
average 2005 2006 2007 2008 2009 2010 2011 2012 2013
2013 per cent change from BSL
average
2013 per cent change from
2012
Bus or coach Killed 0.0 0 0 0 0 0 0 0 0 0 - -
Seriously Injured 0.0 0 0 0 0 0 0 0 0 0 - -
KSI 0.0 0 0 0 0 0 0 0 0 0 - -
Slightly Injured 8.6 8 1 27 2 5 1 2 3 0 - -
Total 8.6 8 1 27 2 5 1 2 3 0 - -
Car Killed 8.4 11 6 8 12 5 3 2 2 2 - -
Seriously Injured 37.2 47 43 27 42 27 24 18 11 17 -54.3 -
KSI 45.6 58 49 35 54 32 27 20 13 19 -58.3 -
Slightly Injured 675.8 696 732 673 694 584 757 493 381 388 -42.6 1.8
Total 721.4 754 781 708 748 616 784 513 394 407 -43.6 3.3
Goods Vehicle Killed 0.0 0 0 0 0 0 2 1 1 0 - -
Seriously Injured 2.6 1 5 1 1 5 2 0 2 4 - -
KSI 2.6 1 5 1 1 5 4 1 3 4 - -
Slightly Injured 40.4 49 38 45 34 36 36 24 35 17 -57.9 -51.4
Total 43.0 50 43 46 35 41 40 25 38 21 -51.2 -44.7
HGV Killed 2.0 4 3 1 1 1 1 1 2 1 - -
Seriously Injured 6.4 8 7 5 8 4 8 3 0 7 - -
KSI 8.4 12 10 6 9 5 9 4 2 8 - -
Slightly Injured 47.4 66 47 62 34 28 28 27 20 22 -53.6 10.0
Total 55.8 78 57 68 43 33 37 31 22 30 -46.2 36.4
Motorcycle Killed 1.2 2 1 0 1 2 0 0 1 1 - -
Seriously Injured 9.8 8 6 12 13 10 10 5 3 9 - -
KSI 11.0 10 7 12 14 12 10 5 4 10 - -
Slightly Injured 23.2 31 18 30 22 15 19 15 8 17 -26.7 -
Total 34.2 41 25 42 36 27 29 20 12 27 -21.1 -
Pedal cycle Killed 0.0 0 0 0 0 0 0 0 0 0 - -
Seriously Injured 0.6 0 1 0 1 1 0 0 0 0 - -
KSI 0.6 0 1 0 1 1 0 0 0 0 - -
Slightly Injured 1.8 2 1 5 0 1 3 6 0 2 - -
Total 2.4 2 2 5 1 2 3 6 0 2 - -
Other Killed 0.0 0 0 0 0 0 0 0 0 0 - -
Seriously Injured 0.6 0 1 0 2 0 2 0 0 4 - -
KSI 0.6 0 1 0 2 0 2 0 0 4 - -
Slightly Injured 3.0 2 1 6 3 3 4 1 5 1 - -
Total 3.6 2 2 6 5 3 6 1 5 5 - -

HA Publication PR67/14 App 151
Table N-6i. Casualties during roadworks by driver age involved, severity and year
Driver age band Casualty Severity
2005-2009 BSL
average 2005 2006 2007 2008 2009 2010 2011 2012 2013
2013 per cent change from BSL
average
2013 per cent change from
2012
Underage Motorist (0-16) Killed 0.2 0 0 0 1 0 0 0 0 0 - -
Seriously Injured 0.4 0 0 0 2 0 0 0 0 0 - -
KSI 0.6 0 0 0 3 0 0 0 0 0 - -
Slightly Injured 0.2 1 0 0 0 0 0 0 0 0 - -
Total 0.8 1 0 0 3 0 0 0 0 0 - -
Young Motorist (17-24) Killed 2.8 6 4 0 4 0 1 0 0 0 - -
Seriously Injured 14.2 17 13 14 18 9 13 5 3 6 - -
KSI 17.0 23 17 14 22 9 14 5 3 6 -64.7 -
Slightly Injured 246.4 305 260 217 236 214 251 156 113 129 -47.6 14.2
Total 263.4 328 277 231 258 223 265 161 116 135 -48.7 16.4
Other Motorist (25-59) Killed 10.6 15 8 9 13 8 5 4 6 3 - -
Seriously Injured 44.6 56 53 35 43 36 31 21 13 33 -26.0 -
KSI 55.2 71 61 44 56 44 36 25 19 36 -34.8 89.5
Slightly Injured 714.0 761 747 748 705 609 759 502 414 397 -44.4 -4.1
Total 769.2 832 808 792 761 653 795 527 433 433 -43.7 0.0
Older Motorist (60-69) Killed 2.2 1 1 1 6 2 1 1 3 2 - -
Seriously Injured 11.0 14 9 11 16 5 8 6 3 5 - -
KSI 13.2 15 10 12 22 7 9 7 6 7 - -
Slightly Injured 141.0 147 128 169 144 117 155 81 102 66 -53.2 -35.3
Total 154.2 162 138 181 166 124 164 88 108 73 -52.7 -32.4
Elderly Motorist (70+) Killed 0.0 0 0 0 0 0 0 0 0 0 - -
Seriously Injured 3.0 3 7 0 3 2 2 1 0 2 - -
KSI 3.0 3 7 0 3 2 2 1 0 2 - -
Slightly Injured 44.2 75 42 17 54 33 55 36 33 40 -9.5 21.2
Total 47.2 78 49 17 57 35 57 37 33 42 -11.0 27.3
Young Rider (16-19) Killed 0.2 0 0 0 1 0 0 0 0 0 - -
Seriously Injured 0.6 2 0 0 1 0 1 1 0 2 - -
KSI 0.8 2 0 0 2 0 1 1 0 2 - -
Slightly Injured 1.8 1 2 3 2 1 1 3 1 1 - -
Total 2.6 3 2 3 4 1 2 4 1 3 - -
Other Rider (20-59) Killed 0.8 2 0 0 0 2 0 0 1 1 - -
Seriously Injured 8.4 4 6 11 11 10 8 3 3 6 - -
KSI 9.2 6 6 11 11 12 8 3 4 7 - -
Slightly Injured 22.8 31 17 30 20 16 18 11 7 16 -29.8 -
Total 32.0 37 23 41 31 28 26 14 11 23 -28.1 -
Notes: (a) This table reports the number of casualties during roadworks where at least one of the drivers involved falls within the reported driver age band.

HA Publication PR67/14 App 152
Table N-6ii. Casualties during roadworks by driver age, severity and year
Driver age band Casualty Severity
2005-2009 BSL
average 2005 2006 2007 2008 2009 2010 2011 2012 2013
2013 per cent change from BSL
average
2013 per cent change from
2012
Older Rider (60-69) Killed 0.0 0 0 0 0 0 0 0 0 0 - -
Seriously Injured 0.8 2 0 1 1 0 1 1 0 1 - -
KSI 0.8 2 0 1 1 0 1 1 0 1 - -
Slightly Injured 0.8 1 0 1 1 1 2 1 1 1 - -
Total 1.6 3 0 2 2 1 3 2 1 2 - -
Elderly Rider (70+) Killed 0.2 0 1 0 0 0 0 0 0 0 - -
Seriously Injured 0.4 1 0 1 0 0 0 0 0 0 - -
KSI 0.6 1 1 1 0 0 0 0 0 0 - -
Slightly Injured 0.4 1 1 0 0 0 0 0 0 0 - -
Total 1.0 2 2 1 0 0 0 0 0 0 - -
Unknown Total 0.0 0 0 0 0 0 0 0 0 0 - -
Notes: (a) This table reports the number of casualties during roadworks where at least one of the drivers involved falls within the reported driver age band.
Table N-7 Casualties during roadworks by casualty class, severity and year
Casualty Class Casualty Severity
2005-2009 BSL
average 2005 2006 2007 2008 2009 2010 2011 2012 2013
2013 per cent change from BSL
average
2013 per cent change from
2012
Driver or rider Killed 6.6 11 7 6 7 2 2 3 4 3 - -
Seriously Injured 40.6 40 45 34 44 40 28 18 16 24 -40.9 50.0
KSI 47.2 51 52 40 51 42 30 21 20 27 -42.8 35.0
Slightly Injured 526.0 585 529 559 515 442 548 362 312 296 -43.7 -5.1
Total 573.2 636 581 599 566 484 578 383 332 323 -43.6 -2.7
Passenger Killed 3.2 3 2 1 7 3 2 0 2 0 - -
Seriously Injured 14.0 24 16 9 18 3 14 7 0 9 - -
KSI 17.2 27 18 10 25 6 16 7 2 9 -47.7 -
Slightly Injured 267.2 262 302 282 263 227 297 202 135 143 -46.5 5.9
Total 284.4 289 320 292 288 233 313 209 137 152 -46.6 10.9
Pedestrian Killed 1.8 3 1 2 0 3 2 1 0 1 - -
Seriously Injured 2.6 0 2 2 5 4 4 1 0 8 - -
KSI 4.4 3 3 4 5 7 6 2 0 9 - -
Slightly Injured 7.0 7 7 7 11 3 3 4 5 8 - -
Total 11.4 10 10 11 16 10 9 6 5 17 - -
Notes: (a) There is no direct link to pedestrians being road workers although five pedestrians were recorded as being road workers in 2013, two of which were seriously injured and three slightly injured.

HA Publication PR67/14 App 153
Table N-8 Top 20 contributory factors for collisions involving roadworks by year
No. Contributory Factors
2005-2009 BSL
average 2005 2006 2007 2008 2009 2010 2011 2012 2013
2013 per cent change from BSL
average
2013 per cent change from
2012
1 405 Failed to look properly 149.8 127 154 173 164 131 204 129 109 137 -8.5 25.7
2 406 Failed to judge other person’s path or speed 134.8 136 137 151 142 108 162 79 91 104 -22.8 14.3
3 308 Following too close 98.4 121 95 114 86 76 106 58 53 55 -44.1 3.8
4 408 Sudden braking 71.6 75 81 75 69 58 77 49 34 55 -23.2 61.8
5 602 Careless, reckless or in a hurry 48.8 47 61 55 45 36 57 35 29 40 -18.0 37.9
6 107 Temporary road layout (eg. contraflow) 80.2 94 77 73 75 82 60 44 38 37 -53.9 -2.6
7 403 Poor turn or manoeuvre 50.0 46 56 48 59 41 66 41 41 30 -40.0 -26.8
8 410 Loss of control 39.8 38 42 32 48 39 50 20 22 27 -32.2 22.7
9 307 Travelling too fast for conditions 52.0 70 59 65 38 28 38 22 17 23 -55.8 35.3
10 103 Slippery road (due to weather) 29.2 32 24 34 29 27 17 8 13 17 -41.8 -
11 710 Vehicle blind spot 25.6 25 22 26 29 26 56 36 20 14 -45.3 -30.0
12 409 Swerved 22.2 21 28 14 22 26 21 15 9 13 -41.4 -
13 509 Distraction in vehicle 11.4 12 10 11 13 11 17 10 5 13 - -
14 501 Impaired by alcohol 20.4 18 20 21 23 20 20 19 10 10 -51.0 -
15 601 Aggressive driving 9.8 9 7 12 11 10 14 9 10 9 - -
16 503 Fatigue 15.8 15 16 14 20 14 28 14 9 8 -49.4 -
17 306 Exceeding speed limit 15.8 19 23 6 18 13 10 15 4 8 -49.4 -
18 605 Learner or inexperienced driver/rider 11.4 10 14 14 8 11 11 8 9 7 - -
19 510 Distraction outside vehicle 7.0 10 8 5 5 7 10 3 3 6 - -
20 508 Driver using mobile phone 1.4 1 1 1 1 3 1 2 0 6 - -
Notes: (a) Values in the table report the number of collisions by severity where at least one of the specified contributory factors was recorded.
Table N-9 Severity per cent for collision at roadworks and not at roadworks by year
Collision Location Collision Severity
Severity per cent
2005-2009 BSL
average 2005 2006 2007 2008 2009 2010 2011 2012 2013
At Roadworks Fatal 1.6 2.3 1.6 1.3 1.3 1.5 1.1 1.1 1.3 1.2
Serious 8.7 7.1 9.9 6.7 10.4 9.7 7.1 6.7 5.0 10.5
Fatal + Serious 10.3 9.3 11.5 8.0 11.6 11.2 8.2 7.9 6.4 11.7
Slight 89.7 90.7 88.5 92.0 88.4 88.8 91.8 92.1 93.6 88.3
Not At Roadworks Fatal 2.3 2.4 2.3 2.3 2.5 1.9 2.1 2.1 1.9 2.3
Serious 11.4 11.7 11.0 11.6 11.1 11.7 12.0 11.8 11.9 12.0
Fatal + Serious 13.7 14.1 13.4 13.9 13.6 13.6 14.1 13.9 13.8 14.2
Slight 86.3 85.9 86.6 86.1 86.4 86.4 85.9 86.1 86.2 85.8
Notes: (a) The severity per cent is the percentage of collisions that the given severity makes up of the total collisions for the given collision location. For example if there were 100 collisions at roadworks and 3 of these were fatal in 2013, then the severity per cent for this situation would be 3.0.

HA Publication PR67/14 App 154
Appendix O: Object Hit on and Off Carriageway Table O-1 to Table O-6 provide breakdowns of collisions and casualties involving objects hit on and off carriageways by objects hit, road
classification, contributory factors and severity.
Table O-1i. Casualties by objects hit on carriageway, severity and year
Object hit on carriageway Casualty Severity
2005-2009 BSL
average 2005 2006 2007 2008 2009 2010 2011 2012 2013
2013 per cent change from BSL
average
2013 per cent change from
2012
Any animal (except ridden horse)
Killed 1.4 3 0 3 1 0 0 1 1 0 - -
Seriously Injured 6.0 6 4 7 4 9 4 4 8 4 - -
KSI 7.4 9 4 10 5 9 4 5 9 4 - -
Slightly Injured 41.4 31 53 50 27 46 37 31 20 33 -20.3 65.0
Total 48.8 40 57 60 32 55 41 36 29 37 -24.2 27.6
Bollard or refuge Killed 2.8 4 1 3 4 2 0 4 2 0 - -
Seriously Injured 21.2 27 22 17 19 21 18 22 23 15 -29.2 -34.8
KSI 24.0 31 23 20 23 23 18 26 25 15 -37.5 -40.0
Slightly Injured 166.2 155 138 177 182 179 149 150 120 133 -20.0 10.8
Total 190.2 186 161 197 205 202 167 176 145 148 -22.2 2.1
Bridge (Side & Roof) Killed 2.6 5 3 2 3 0 3 2 2 0 - -
Seriously Injured 4.2 3 5 6 5 2 6 3 5 6 - -
KSI 6.8 8 8 8 8 2 9 5 7 6 - -
Slightly Injured 20.6 23 26 17 16 21 18 14 14 19 -7.8 -
Total 27.4 31 34 25 24 23 27 19 21 25 -8.8 19.0
Central island of roundabout Killed 0.8 1 0 0 3 0 0 1 1 0 - -
Seriously Injured 8.0 9 6 8 8 9 7 5 5 3 - -
KSI 8.8 10 6 8 11 9 7 6 6 3 - -
Slightly Injured 41.8 52 53 45 26 33 20 32 24 19 -54.5 -20.8
Total 50.6 62 59 53 37 42 27 38 30 22 -56.5 -26.7
Kerb Killed 9.4 9 8 6 13 11 2 9 3 4 - -
Seriously Injured 55.8 66 63 63 47 40 34 41 30 38 -31.9 26.7
KSI 65.2 75 71 69 60 51 36 50 33 42 -35.6 27.3
Slightly Injured 302.0 331 347 299 280 253 208 212 162 222 -26.5 37.0
Total 367.2 406 418 368 340 304 244 262 195 264 -28.1 35.4
Open door of vehicle Killed 0.0 0 0 0 0 0 0 0 0 0 - -
Seriously Injured 0.4 2 0 0 0 0 0 0 0 0 - -
KSI 0.4 2 0 0 0 0 0 0 0 0 - -
Slightly Injured 3.2 4 2 6 2 2 2 3 0 0 - -
Total 3.6 6 2 6 2 2 2 3 0 0 - -
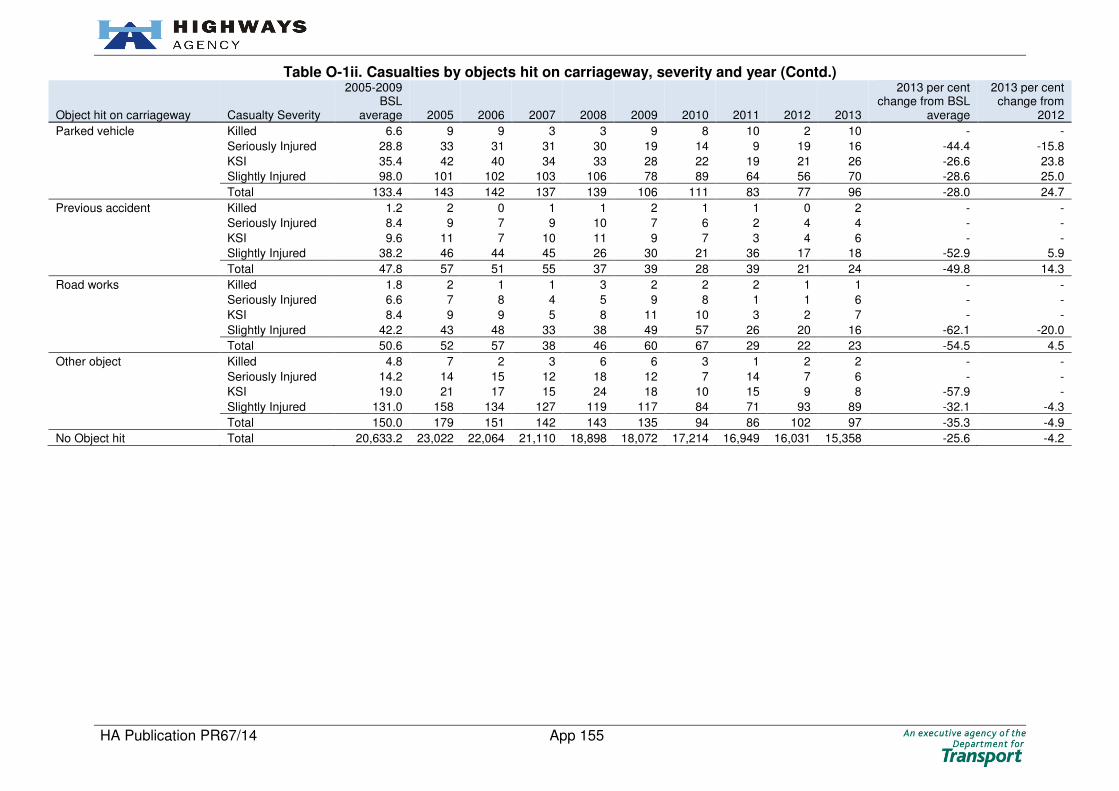
HA Publication PR67/14 App 155
Table O-1ii. Casualties by objects hit on carriageway, severity and year (Contd.)
Object hit on carriageway Casualty Severity
2005-2009 BSL
average 2005 2006 2007 2008 2009 2010 2011 2012 2013
2013 per cent change from BSL
average
2013 per cent change from
2012
Parked vehicle Killed 6.6 9 9 3 3 9 8 10 2 10 - -
Seriously Injured 28.8 33 31 31 30 19 14 9 19 16 -44.4 -15.8
KSI 35.4 42 40 34 33 28 22 19 21 26 -26.6 23.8
Slightly Injured 98.0 101 102 103 106 78 89 64 56 70 -28.6 25.0
Total 133.4 143 142 137 139 106 111 83 77 96 -28.0 24.7
Previous accident Killed 1.2 2 0 1 1 2 1 1 0 2 - -
Seriously Injured 8.4 9 7 9 10 7 6 2 4 4 - -
KSI 9.6 11 7 10 11 9 7 3 4 6 - -
Slightly Injured 38.2 46 44 45 26 30 21 36 17 18 -52.9 5.9
Total 47.8 57 51 55 37 39 28 39 21 24 -49.8 14.3
Road works Killed 1.8 2 1 1 3 2 2 2 1 1 - -
Seriously Injured 6.6 7 8 4 5 9 8 1 1 6 - -
KSI 8.4 9 9 5 8 11 10 3 2 7 - -
Slightly Injured 42.2 43 48 33 38 49 57 26 20 16 -62.1 -20.0
Total 50.6 52 57 38 46 60 67 29 22 23 -54.5 4.5
Other object Killed 4.8 7 2 3 6 6 3 1 2 2 - -
Seriously Injured 14.2 14 15 12 18 12 7 14 7 6 - -
KSI 19.0 21 17 15 24 18 10 15 9 8 -57.9 -
Slightly Injured 131.0 158 134 127 119 117 84 71 93 89 -32.1 -4.3
Total 150.0 179 151 142 143 135 94 86 102 97 -35.3 -4.9
No Object hit Total 20,633.2 23,022 22,064 21,110 18,898 18,072 17,214 16,949 16,031 15,358 -25.6 -4.2

HA Publication PR67/14 App 156
Table O-2 Casualties by objects hit on carriageway by road classification and year
Road Classification Casualty Severity
2005-2009 BSL
average 2005 2006 2007 2008 2009 2010 2011 2012 2013
2013 per cent change from BSL
average
2013 per cent change from
2012
Motorway - Killed 12.0 20 11 7 10 12 7 10 7 5 - -
Seriously Injured 55.6 65 55 55 60 43 33 32 41 40 -28.1 -2.4
KSI 67.6 85 66 62 70 55 40 42 48 45 -33.4 -6.3
Slightly Injured 386.6 415 417 390 362 349 303 257 217 236 -39.0 8.8
Total 454.2 500 483 452 432 404 343 299 265 281 -38.1 6.0
A-road Dual Carriageway
Built-up Killed 1.0 0 2 1 1 1 0 2 1 1 - -
Seriously Injured 7.6 8 7 6 10 7 4 8 4 6 - -
KSI 8.6 8 9 7 11 8 4 10 5 7 - -
Slightly Injured 37.8 52 31 35 33 38 29 39 21 31 -18.0 47.6
Total 46.4 60 40 42 44 46 33 49 26 38 -18.1 46.2
Non Built-up Killed 16.0 19 7 14 23 17 9 15 5 12 -25.0 -
Seriously Injured 69.6 80 79 72 59 58 61 47 43 38 -45.4 -11.6
KSI 85.6 99 86 86 82 75 70 62 48 50 -41.6 4.2
Slightly Injured 366.6 378 397 385 337 336 291 293 231 281 -23.3 21.6
Total 452.2 477 483 471 419 411 361 355 279 331 -26.8 18.6
A-road Single Carriageway
Built-up Killed 0.8 1 1 0 2 0 1 2 1 0 - -
Seriously Injured 4.0 4 3 6 2 5 2 3 3 4 - -
KSI 4.8 5 4 6 4 5 3 5 4 4 - -
Slightly Injured 21.8 16 20 20 27 26 12 16 10 8 -63.3 -
Total 26.6 21 24 26 31 31 15 21 14 12 -54.9 -
Non Built-up Killed 1.6 2 3 0 1 2 2 2 0 1 - -
Seriously Injured 16.8 19 17 18 15 15 4 11 11 10 -40.5 -
KSI 18.4 21 20 18 16 17 6 13 11 11 -40.2 -
Slightly Injured 71.8 83 82 72 63 59 50 34 47 62 -13.6 31.9
Total 90.2 104 102 90 79 76 56 47 58 73 -19.1 25.9
Other Total 0.0 0 0 0 0 0 0 0 0 1 - -
Notes: (a) Where the road classification is denoted as “Other”, these casualties were located on sections of the reference network that have been downgraded in class (to B or below) since 2010.

HA Publication PR67/14 App 157
Table O-3i.Casualties by objects hit off carriageway by severity and year
Object hit off carriageway Casualty Severity
2005-2009 BSL
average 2005 2006 2007 2008 2009 2010 2011 2012 2013
2013 per cent change from BSL
average
2013 per cent change from
2012
Bus stop or bus shelter Killed 0.2 0 1 0 0 0 0 0 0 0 - -
Seriously Injured 0.0 0 0 0 0 0 0 0 1 0 - -
KSI 0.2 0 1 0 0 0 0 0 1 0 - -
Slightly Injured 3.0 5 2 5 1 2 4 4 2 3 - -
Total 3.2 5 3 5 1 2 4 4 3 3 - -
Central crash barrier Killed 36.4 48 32 32 41 29 27 22 17 16 -56.0 -5.9
Seriously Injured 189.6 222 193 193 176 164 169 126 145 126 -33.5 -13.1
KSI 226.0 270 225 225 217 193 196 148 162 142 -37.2 -12.3
Slightly Injured 1,805.8 1,988 1,880 1,824 1,701 1,636 1,518 1,378 1,404 1,319 -27.0 -6.1
Total 2,031.8 2,258 2,105 2,049 1,918 1,829 1,714 1,526 1,566 1,461 -28.1 -6.7
Entered ditch Killed 12.6 13 12 15 16 7 8 12 3 2 - -
Seriously Injured 76.4 85 80 84 69 64 47 37 40 29 -62.0 -27.5
KSI 89.0 98 92 99 85 71 55 49 43 31 -65.2 -27.9
Slightly Injured 380.8 471 419 385 342 287 322 246 251 193 -49.3 -23.1
Total 469.8 569 511 484 427 358 377 295 294 224 -52.3 -23.8
Lamp post Killed 9.2 14 5 10 12 5 4 3 1 4 - -
Seriously Injured 37.6 42 51 42 25 28 30 15 24 15 -60.1 -37.5
KSI 46.8 56 56 52 37 33 34 18 25 19 -59.4 -24.0
Slightly Injured 176.2 214 184 174 145 164 119 121 103 107 -39.3 3.9
Total 223.0 270 240 226 182 197 153 139 128 126 -43.5 -1.6
Near/Offside crash barrier Killed 28.2 41 30 19 32 19 18 23 17 29 2.8 70.6
Seriously Injured 166.2 192 165 195 125 154 141 139 128 108 -35.0 -15.6
KSI 194.4 233 195 214 157 173 159 162 145 137 -29.5 -5.5
Slightly Injured 1,285.4 1,390 1,376 1,271 1,183 1,207 1,091 1,026 984 855 -33.5 -13.1
Total 1,479.8 1,623 1,571 1,485 1,340 1,380 1,250 1,188 1,129 992 -33.0 -12.1
Road sign or traffic signal Killed 13.8 17 14 12 15 11 4 6 7 4 - -
Seriously Injured 56.8 73 63 53 46 49 32 41 34 27 -52.5 -20.6
KSI 70.6 90 77 65 61 60 36 47 41 31 -56.1 -24.4
Slightly Injured 319.8 373 348 311 255 312 213 227 208 214 -33.1 2.9
Total 390.4 463 425 376 316 372 249 274 249 245 -37.2 -1.6
Submerged in water Killed 0.2 1 0 0 0 0 0 0 0 0 - -
Seriously Injured 1.4 3 0 2 0 2 0 0 0 1 - -
KSI 1.6 4 0 2 0 2 0 0 0 1 - -
Slightly Injured 1.4 0 0 6 1 0 2 3 1 3 - -
Total 3.0 4 0 8 1 2 2 3 1 4 - -

HA Publication PR67/14 App 158
Table O-3ii.Casualties by objects hit off carriageway by severity and year
Object hit off carriageway Casualty Severity
2005-2009 BSL
average 2005 2006 2007 2008 2009 2010 2011 2012 2013
2013 per cent change from BSL
average
2013 per cent change from
2012
Telegraph or electricity pole Killed 0.4 1 1 0 0 0 0 0 1 0 - -
Seriously Injured 4.4 7 6 5 3 1 2 2 3 2 - -
KSI 4.8 8 7 5 3 1 2 2 4 2 - -
Slightly Injured 21.8 24 20 20 20 25 8 20 17 9 -58.7 -47.1
Total 26.6 32 27 25 23 26 10 22 21 11 -58.6 -47.6
Tree Killed 33.2 33 38 35 34 26 24 32 19 21 -36.7 10.5
Seriously Injured 126.0 157 125 120 124 104 90 110 89 88 -30.2 -1.1
KSI 159.2 190 163 155 158 130 114 142 108 109 -31.5 0.9
Slightly Injured 493.2 515 535 497 448 471 420 406 401 352 -28.6 -12.2
Total 652.4 705 698 652 606 601 534 548 509 461 -29.3 -9.4
Wall or fence Killed 0.0 0 0 0 0 0 0 1 1 3 - -
Seriously Injured 0.0 0 0 0 0 0 0 3 6 25 - -
KSI 0.0 0 0 0 0 0 0 4 7 28 - -
Slightly Injured 0.0 0 0 0 0 0 0 5 31 90 - 190.3
Total 0.0 0 0 0 0 0 0 9 38 118 - 210.5
Other permanent object Killed 20.4 24 22 22 19 15 20 10 10 10 -51.0 -
Seriously Injured 108.2 140 122 116 94 69 85 89 68 54 -50.1 -20.6
KSI 128.6 164 144 138 113 84 105 99 78 64 -50.2 -17.9
Slightly Injured 573.4 677 584 634 508 464 456 413 332 271 -52.7 -18.4
Total 702.0 841 728 772 621 548 561 512 410 335 -52.3 -18.3
None Total 15,720.8 17,414 16,888 16,109 14,468 13,725 13,168 13,200 12,325 12,114 -22.9 -1.7

HA Publication PR67/14 App 159
Table O-4 Casualties by objects hit off carriageway by road type and year
Road Classification Casualty Severity
2005-2009 BSL
average 2005 2006 2007 2008 2009 2010 2011 2012 2013
2013 per cent change from BSL
average
2013 per cent change from
2012
Motorway - Killed 79.2 98 81 75 77 65 51 45 28 48 -39.4 71.4
Seriously Injured 406.0 430 404 470 356 370 306 278 253 245 -39.7 -3.2
KSI 485.2 528 485 545 433 435 357 323 281 293 -39.6 4.3
Slightly Injured 2,980.2 3,302 3,184 2,994 2,715 2,706 2,417 2,136 2,163 1,889 -36.6 -12.7
Total 3,465.4 3,830 3,669 3,539 3,148 3,141 2,774 2,459 2,444 2,182 -37.0 -10.7
A-road Dual Carriageway
Built-up Killed 1.8 0 2 2 4 1 0 4 1 1 - -
Seriously Injured 14.0 11 16 11 14 18 10 9 8 7 - -
KSI 15.8 11 18 13 18 19 10 13 9 8 -49.4 -
Slightly Injured 96.0 110 86 85 96 103 62 82 71 68 -29.2 -4.2
Total 111.8 121 104 98 114 122 72 95 80 76 -32.0 -5.0
Non Built-up Killed 56.2 69 54 57 64 37 41 46 36 32 -43.1 -11.1
Seriously Injured 276.8 387 304 256 231 206 230 210 215 170 -38.6 -20.9
KSI 333.0 456 358 313 295 243 271 256 251 202 -39.3 -19.5
Slightly Injured 1,647.0 1,842 1,726 1,686 1,510 1,471 1,422 1,356 1,252 1,243 -24.5 -0.7
Total 1,980.0 2,298 2,084 1,999 1,805 1,714 1,693 1,612 1,503 1,445 -27.0 -3.9
A-road Single Carriageway
Built-up Killed 1.6 1 1 0 5 1 1 0 2 0 - -
Seriously Injured 8.4 10 6 15 6 5 6 15 7 6 - -
KSI 10.0 11 7 15 11 6 7 15 9 6 - -
Slightly Injured 45.4 44 47 43 51 42 33 43 28 44 -3.1 57.1
Total 55.4 55 54 58 62 48 40 58 37 50 -9.7 35.1
Non Built-up Killed 15.8 24 17 11 19 8 12 14 9 8 -49.4 -
Seriously Injured 61.4 83 75 58 55 36 44 50 55 47 -23.5 -14.5
KSI 77.2 107 92 69 74 44 56 64 64 55 -28.8 -14.1
Slightly Injured 292.2 359 305 319 232 246 219 232 220 171 -41.5 -22.3
Total 369.4 466 397 388 306 290 275 296 284 226 -38.8 -20.4
Other Total 0.0 0 0 0 0 0 0 0 0 1 - -

HA Publication PR67/14 App 160
Table O-5 Top 20 contributory factors for collisions involving objects hit on carriageway by year
No. Contributory Factors
2005-2009 BSL
average 2005 2006 2007 2008 2009 2010 2011 2012 2013
2013 per cent change from BSL
average
2013 per cent change from
2012
1 410 Loss of control 268.2 295 298 245 285 218 202 201 172 192 -28.4 11.6
2 405 Failed to look properly 154.4 140 170 167 146 149 155 142 116 144 -6.7 24.1
3 602 Careless, reckless or in a hurry 96.0 102 104 112 84 78 76 79 69 91 -5.2 31.9
4 103 Slippery road (due to weather) 97.4 105 86 99 99 98 94 52 72 78 -19.9 8.3
5 403 Poor turn or manoeuvre 93.8 102 97 84 82 104 75 65 63 71 -24.3 12.7
6 409 Swerved 110.6 126 127 110 99 91 87 76 72 68 -38.5 -5.6
7 406 Failed to judge other person’s path or speed 98.2 97 128 101 93 72 74 67 56 67 -31.8 19.6
8 109 Animal or object in carriageway 97.2 116 99 95 88 88 68 67 57 49 -49.6 -14.0
9 307 Travelling too fast for conditions 98.6 116 109 108 90 70 55 48 51 49 -50.3 -3.9
10 408 Sudden braking 71.8 75 85 79 59 61 50 49 36 40 -44.3 11.1
11 501 Impaired by alcohol 55.4 69 60 50 46 52 39 47 41 38 -31.4 -7.3
12 503 Fatigue 55.8 68 61 53 50 47 44 39 33 33 -40.9 0.0
13 509 Distraction in vehicle 30.8 32 35 25 32 30 27 23 31 31 0.6 0.0
14 308 Following too close 42.0 54 47 37 42 30 25 20 12 29 -31.0 -
15 601 Aggressive driving 25.0 17 34 25 27 22 20 19 10 27 8.0 -
16 306 Exceeding speed limit 46.0 59 40 49 44 38 18 32 20 24 -47.8 20.0
17 707 Rain, sleet, snow, or fog 29.8 37 33 26 31 22 12 18 17 24 -19.5 41.2
18 605 Learner or inexperienced driver/rider 35.6 38 32 41 31 36 18 24 15 18 -49.4 20.0
19 603 Nervous, uncertain or panic 20.2 28 23 20 14 16 15 15 17 16 -20.8 -5.9
20 505 Illness or disability, mental or physical 17.6 17 17 15 15 24 16 27 15 16 -9.1 6.7
Notes: (a) Values in the table report the number of collisions by severity where at least one of the specified contributory factors was recorded.

HA Publication PR67/14 App 161
Table O-6 Top 20 contributory factors for collisions involving objects hit off carriageway by year
No. Contributory Factors
2005-2009 BSL
average 2005 2006 2007 2008 2009 2010 2011 2012 2013
2013 per cent change from BSL
average
2013 per cent change from
2012
1 410 Loss of control 1,617.8 1,753 1,724 1,639 1,506 1,467 1,394 1,254 1,253 1,084 -33.0 -13.5
2 405 Failed to look properly 765.8 780 854 759 729 707 752 677 670 654 -14.6 -2.4
3 103 Slippery road (due to weather) 575.6 512 523 552 610 681 640 419 601 522 -9.3 -13.1
4 406 Failed to judge other person’s path or speed 587.2 653 621 591 549 522 532 441 474 457 -22.2 -3.6
5 403 Poor turn or manoeuvre 576.2 706 633 574 484 484 471 401 432 441 -23.5 2.1
6 409 Swerved 582.8 669 610 597 528 510 543 480 457 426 -26.9 -6.8
7 602 Careless, reckless or in a hurry 458.2 499 511 499 390 392 382 379 347 356 -22.3 2.6
8 307 Travelling too fast for conditions 502.2 537 530 520 457 467 356 335 410 283 -43.6 -31.0
9 503 Fatigue 368.8 379 406 398 329 332 294 291 265 268 -27.3 1.1
10 408 Sudden braking 328.6 366 355 335 288 299 280 229 244 187 -43.1 -23.4
11 501 Impaired by alcohol 270.4 274 295 286 252 245 203 214 222 172 -36.4 -22.5
12 509 Distraction in vehicle 167.4 205 172 176 147 137 143 147 152 153 -8.6 0.7
13 308 Following too close 194.8 243 206 175 189 161 157 132 150 129 -33.8 -14.0
14 505 Illness or disability, mental or physical 121.6 115 130 120 122 121 112 139 133 122 0.3 -8.3
15 306 Exceeding speed limit 206.4 240 222 213 175 182 162 156 141 121 -41.4 -14.2
16 201 Tyres illegal, defective or under inflated 171.8 191 181 178 154 155 128 131 130 115 -33.1 -11.5
17 707 Rain, sleet, snow, or fog 121.2 122 111 127 133 113 99 84 118 107 -11.7 -9.3
18 601 Aggressive driving 150.2 164 153 151 145 138 118 109 90 107 -28.8 18.9
19 710 Vehicle blind spot 189.4 238 205 162 174 168 161 111 129 99 -47.7 -23.3
20 605 Learner or inexperienced driver/rider 172.6 172 186 193 158 154 118 122 88 92 -46.7 4.5
Notes: (a) Values in the table report the number of collisions by severity where at least one of the specified contributory factors was recorded.

HA Publication PR67/14 App 162
Appendix P: Junction Type Table P-1 to Table P-7 provide breakdowns of collisions and casualties by junction detail, junction control, road name, road classification,
vehicle type, driver age, contributory factors and severity.
Table P-1i. Collisions by junction detail, junction control and year
Junction Detail Junction Control
2005-2009 BSL
average 2005 2006 2007 2008 2009 2010 2011 2012 2013
2013 per cent change from BSL
average
2013 per cent change from
2012
Crossroads Auto traffic signal 89.6 82 95 83 103 85 70 71 51 61 -31.9 19.6
Stop sign 3.2 6 3 4 1 2 2 1 5 1 - -
Give way or uncontrolled 82.8 102 83 80 87 62 79 54 76 54 -34.8 -28.9
Other 0.4 1 0 0 1 0 0 0 0 0 - -
Total 176.0 191 181 167 192 149 151 126 132 116 -34.1 -12.1
Junction - more than 4 arms (not roundabout)
Auto traffic signal 28.8 27 27 29 30 31 17 33 40 6 -79.2 -85.0
Stop sign 1.0 1 1 2 0 1 0 0 0 0 - -
Give way or uncontrolled 34.8 34 35 34 34 37 29 32 32 18 -48.3 -43.8
Other 0.4 1 0 0 1 0 0 0 0 0 - -
Total 65.0 63 63 65 65 69 46 65 72 24 -63.1 -66.7
Mini-roundabout Auto traffic signal 0.8 0 0 4 0 0 0 0 0 1 - -
Stop sign 0.2 0 1 0 0 0 0 0 0 0 - -
Give way or uncontrolled 5.6 7 3 7 2 9 8 0 3 1 - -
Other 0.0 0 0 0 0 0 0 0 0 0 - -
Total 6.6 7 4 11 2 9 8 0 3 2 - -
Private drive or entrance Auto traffic signal 0.2 1 0 0 0 0 0 0 0 0 - -
Stop sign 0.0 0 0 0 0 0 0 0 0 1 - -
Give way or uncontrolled 107.2 125 104 120 105 82 98 100 83 104 -3.0 25.3
Other 5.0 12 2 3 4 4 7 0 0 2 - -
Total 112.4 138 106 123 109 86 105 100 83 107 -4.8 28.9
Roundabout Auto traffic signal 293.6 290 272 306 278 322 245 389 349 313 6.6 -10.3
Stop sign 9.0 11 6 10 10 8 7 2 6 4 - -
Give way or uncontrolled 1,313.4 1,468 1,405 1,328 1,218 1,148 1,036 1,115 993 897 -31.7 -9.7
Other 5.2 7 4 6 3 6 4 4 0 5 - -
Total 1,621.2 1,776 1,687 1,650 1,509 1,484 1,292 1,510 1,348 1,219 -24.8 -9.6
Slip road Auto traffic signal 44.4 60 53 41 41 27 43 31 44 24 -45.9 -45.5
Stop sign 3.4 2 6 4 2 3 3 0 2 1 - -
Give way or uncontrolled 1,194.4 1,349 1,334 1,172 1,061 1,056 960 1,033 1,014 899 -24.7 -11.3
Other 5.4 6 8 4 4 5 3 3 5 4 - -
Total 1,247.6 1,417 1,401 1,221 1,108 1,091 1,009 1,067 1,065 928 -25.6 -12.9

HA Publication PR67/14 App 163
Table P-1ii. Collisions by junction detail, junction control and year (Contd.)
Junction Detail Junction Control
2005-2009 BSL
average 2005 2006 2007 2008 2009 2010 2011 2012 2013
2013 per cent change from BSL
average
2013 per cent change from
2012
T or staggered junction Auto traffic signal 47.6 44 46 48 41 59 43 47 45 29 -39.1 -35.6
Stop sign 12.0 10 16 11 11 12 4 7 11 5 - -
Give way or uncontrolled 627.0 672 630 679 577 577 525 512 498 481 -23.3 -3.4
Other 0.8 1 0 0 2 1 0 1 4 0 - -
Total 687.4 727 692 738 631 649 572 567 558 515 -25.1 -7.7
Other junction Total 210.0 213 192 218 226 201 144 141 128 120 -42.9 -6.3
Not at junction or within 20 metres Total 9,745.0 10,821 10,509 10,072 8,985 8,338 8,087 7,371 7,131 7,114 -27.0 -0.2
Table P-2 Collisions at junctions by top 20 road names and junction detail, 2013
No. Road Name Crossroads
Junction - more than 4 arms (not roundabout) Mini-roundabout
Private drive or
entrance Roundabout Slip road
T or staggered
junction Other
junction Total
1 A5 14 0 0 19 59 8 55 1 156
2 A27 14 2 0 6 68 9 25 0 124
3 A1 0 0 0 7 21 49 28 17 122
4 M1 0 2 0 2 25 76 1 0 106
5 A38 0 0 0 1 36 40 22 4 103
6 A46 1 0 0 1 64 10 14 1 91
7 M25 0 1 0 0 24 60 0 3 88
8 M6 0 0 0 0 18 58 6 4 86
9 A30 6 2 0 0 36 17 11 6 78
10 A2 3 1 0 0 23 45 4 1 77
11 A19 1 1 0 2 34 29 8 1 76
12 A47 5 1 0 6 30 6 23 2 73
13 A12 0 0 0 0 22 28 12 5 67
14 A52 3 0 0 6 27 8 16 2 62
15 A50 0 0 0 0 30 24 7 0 61
16 A14 0 1 0 1 24 16 8 8 58
17 A34 4 0 0 0 30 21 2 0 57
18 A1(M) 0 0 0 0 20 26 2 2 50
19 A36 2 0 0 6 11 2 24 1 46
20 A49 6 0 0 0 3 1 21 12 43
Notes: (a) Ranked by Total.

HA Publication PR67/14 App 164
Table P-3 Casualties by junction detail, severity and year
Junction Detail Casualty Severity
2005-2009 BSL
average 2005 2006 2007 2008 2009 2010 2011 2012 2013
2013 per cent change from BSL
average
2013 per cent change from
2012
Crossroads Killed 4.6 6 0 6 7 4 3 7 0 1 - -
Seriously Injured 31.8 47 18 24 46 24 25 25 29 23 -27.7 -20.7
KSI 36.4 53 18 30 53 28 28 32 29 24 -34.1 -17.2
Slightly Injured 246.8 275 241 249 256 213 219 198 199 171 -30.7 -14.1
Total 283.2 328 259 279 309 241 247 230 228 195 -31.1 -14.5
Junction - more than 4 arms (not roundabout)
Killed 1.8 1 2 0 4 2 1 0 2 0 - -
Seriously Injured 9.6 6 11 11 8 12 10 10 12 3 - -
KSI 11.4 7 13 11 12 14 11 10 14 3 - -
Slightly Injured 93.6 91 88 93 89 107 65 110 126 39 -58.3 -69.0
Total 105.0 98 101 104 101 121 76 120 140 42 -60.0 -70.0
Mini-roundabout Killed 0.2 1 0 0 0 0 0 0 0 0 - -
Seriously Injured 0.8 2 0 2 0 0 0 0 0 0 - -
KSI 1.0 3 0 2 0 0 0 0 0 0 - -
Slightly Injured 8.4 6 6 15 2 13 12 0 3 6 - -
Total 9.4 9 6 17 2 13 12 0 3 6 - -
Private drive or entrance Killed 2.6 7 2 4 0 0 1 1 3 3 - -
Seriously Injured 22.8 29 28 25 17 15 19 19 19 23 0.9 21.1
KSI 25.4 36 30 29 17 15 20 20 22 26 2.4 18.2
Slightly Injured 167.0 206 152 162 180 135 154 133 103 142 -15.0 37.9
Total 192.4 242 182 191 197 150 174 153 125 168 -12.7 34.4
Roundabout Killed 5.8 8 2 3 11 5 1 10 3 5 - -
Seriously Injured 123.4 127 114 146 108 122 111 117 100 95 -23.0 -5.0
KSI 129.2 135 116 149 119 127 112 127 103 100 -22.6 -2.9
Slightly Injured 2,007.8 2,200 2,055 2,049 1,894 1,841 1,611 1,937 1,735 1,566 -22.0 -9.7
Total 2,137.0 2,335 2,171 2,198 2,013 1,968 1,723 2,064 1,838 1,666 -22.0 -9.4
Slip road Killed 26.2 34 34 25 23 15 18 18 13 12 -54.2 -
Seriously Injured 169.6 211 184 195 122 136 144 151 117 139 -18.0 18.8
KSI 195.8 245 218 220 145 151 162 169 130 151 -22.9 16.2
Slightly Injured 1,700.4 1,947 1,883 1,689 1,450 1,533 1,407 1,511 1,482 1,287 -24.3 -13.2
Total 1,896.2 2,192 2,101 1,909 1,595 1,684 1,569 1,680 1,612 1,438 -24.2 -10.8
T or staggered junction Killed 23.2 29 21 30 21 15 14 16 15 18 -22.4 20.0
Seriously Injured 129.8 144 119 127 107 152 113 101 110 92 -29.1 -16.4
KSI 153.0 173 140 157 128 167 127 117 125 110 -28.1 -12.0
Slightly Injured 931.4 986 976 1,003 846 846 768 853 769 731 -21.5 -4.9
Total 1,084.4 1,159 1,116 1,160 974 1,013 895 970 894 841 -22.4 -5.9
Other junction Total 336.8 359 321 331 345 328 220 219 226 182 -46.0 -19.5
Not at junction or within 20 metres Total 15,658.4 17,462 16,939 16,002 14,367 13,522 13,106 12,284 11,607 11,556 -26.2 -0.4

HA Publication PR67/14 App 165
Table P-4 Casualties at junctions by vehicle type and year
Vehicle Type
2005-2009 BSL
average 2005 2006 2007 2008 2009 2010 2011 2012 2013
2013 per cent change from BSL
average
2013 per cent change from
2012
Agricultural vehicle 2.4 3 4 3 2 0 6 4 2 3 - -
Bus or coach 54.2 32 41 117 45 36 43 41 45 66 21.8 46.7
Car 4,997.2 5,593 5,185 5,015 4,549 4,643 4,082 4,488 4,197 3,692 -26.1 -12.0
Other goods vehicle 230.6 260 262 219 239 173 181 205 199 183 -20.6 -8.0
HGV 183.8 207 196 207 161 148 121 110 111 108 -41.2 -2.7
Motorcycle 452.2 495 442 505 420 399 373 451 373 366 -19.1 -1.9
Pedal cycle 101.2 114 105 101 91 95 86 115 118 102 0.8 -13.6
Other 23.0 18 22 22 29 24 24 22 21 18 -21.7 -14.3
Total 6,044.6 6,722 6,257 6,190 5,536 5,518 4,916 5,436 5,066 4,538 -24.9 -10.4
Table P-5i. Casualties at junctions by driver age, severity and year
Driver Age Band Casualty Severity
2005-2009 BSL
average 2005 2006 2007 2008 2009 2010 2011 2012 2013
2013 per cent change from BSL
average
2013 per cent change from
2012
Underage Motorist (0-16)
Killed 0.0 0 0 0 0 0 0 0 0 0 - -
Seriously Injured 0.2 1 0 0 0 0 0 0 0 0 - -
KSI 0.2 1 0 0 0 0 0 0 0 0 - -
Slightly Injured 2.4 3 4 1 3 1 1 0 0 2 - -
Total 2.6 4 4 1 3 1 1 0 0 2 - -
Young Motorist (17-24) Killed 9.6 16 10 11 9 2 4 11 4 7 - -
Seriously Injured 77.8 101 91 73 55 69 52 63 49 33 -57.6 -32.7
KSI 87.4 117 101 84 64 71 56 74 53 40 -54.2 -24.5
Slightly Injured 1,007.8 1,073 1,061 1,001 955 949 805 856 737 654 -35.1 -11.3
Total 1,095.2 1,190 1,162 1,085 1,019 1,020 861 930 790 694 -36.6 -12.2
Other Motorist (25-59) Killed 27.0 33 31 30 22 19 15 20 15 12 -55.6 -20.0
Seriously Injured 220.2 258 196 260 192 195 199 172 147 152 -31.0 3.4
KSI 247.2 291 227 290 214 214 214 192 162 164 -33.7 1.2
Slightly Injured 3,426.8 3,841 3,587 3,473 3,122 3,111 2,798 3,056 2,963 2,577 -24.8 -13.0
Total 3,674.0 4,132 3,814 3,763 3,336 3,325 3,012 3,248 3,125 2,741 -25.4 -12.3
Older Motorist (60-69) Killed 5.6 5 6 8 7 2 2 0 2 5 - -
Seriously Injured 29.6 39 21 25 34 29 26 28 26 42 41.9 61.5
KSI 35.2 44 27 33 41 31 28 28 28 47 33.5 67.9
Slightly Injured 333.8 350 344 333 316 326 279 351 315 281 -15.8 -10.8
Total 369.0 394 371 366 357 357 307 379 343 328 -11.1 -4.4
Elderly Motorist (70+) Killed 13.2 16 11 15 13 11 8 11 9 7 - -
Seriously Injured 35.0 36 40 33 27 39 29 32 34 34 -2.9 0.0
KSI 48.2 52 51 48 40 50 37 43 43 41 -14.9 -4.7
Slightly Injured 208.6 240 202 224 183 194 167 204 209 203 -2.7 -2.9
Total 256.8 292 253 272 223 244 204 247 252 244 -5.0 -3.2

HA Publication PR67/14 App 166
Table P-5ii. Casualties at junctions by driver age, severity and year (Contd.)
Driver Age Band Casualty Severity
2005-2009 BSL
average 2005 2006 2007 2008 2009 2010 2011 2012 2013
2013 per cent change from BSL
average
2013 per cent change from
2012
Underage Rider (0-15) Killed 0.0 0 0 0 0 0 0 0 0 0 - -
Seriously Injured 0.2 1 0 0 0 0 0 0 0 0 - -
KSI 0.2 1 0 0 0 0 0 0 0 0 - -
Slightly Injured 0.0 0 0 0 0 0 0 0 0 0 - -
Total 0.2 1 0 0 0 0 0 0 0 0 - -
Young Rider (16-19) Killed 1.0 1 1 1 1 1 0 1 0 1 - -
Seriously Injured 8.8 9 13 12 7 3 4 13 8 4 - -
KSI 9.8 10 14 13 8 4 4 14 8 5 - -
Slightly Injured 40.6 46 45 47 35 30 17 56 35 32 -21.2 -8.6
Total 50.4 56 59 60 43 34 21 70 43 37 -26.6 -14.0
Other Rider (20-59) Killed 10.4 12 6 12 18 4 5 5 12 8 - -
Seriously Injured 110.8 109 116 119 96 114 99 105 105 92 -17.0 -12.4
KSI 121.2 121 122 131 114 118 104 110 117 100 -17.5 -14.5
Slightly Injured 254.4 290 239 283 239 221 209 234 182 195 -23.3 7.1
Total 375.6 411 361 414 353 339 313 344 299 295 -21.5 -1.3
Older Rider (60-69) Killed 0.6 0 0 1 1 1 1 1 0 1 - -
Seriously Injured 6.0 5 6 7 5 7 8 8 10 9 - -
KSI 6.6 5 6 8 6 8 9 9 10 10 - -
Slightly Injured 9.0 5 7 14 8 11 21 17 13 12 - -
Total 15.6 10 13 22 14 19 30 26 23 22 41.0 -4.3
Elderly Rider (70+) Killed 0.8 3 0 0 0 1 0 3 1 0 - -
Seriously Injured 2.8 2 2 3 5 2 2 1 1 3 - -
KSI 3.6 5 2 3 5 3 2 4 2 3 - -
Slightly Injured 2.0 2 3 3 1 1 2 4 3 7 - -
Total 5.6 7 5 6 6 4 4 8 5 10 - -
Unknown - 199.4 225 215 200 182 175 163 184 186 165 -17.3 -11.3

HA Publication PR67/14 App 167
Table P-6 Top 20 contributory factors for collisions at junctions by year
No Contributory Factors
2005-2009 BSL
average 2005 2006 2007 2008 2009 2010 2011 2012 2013
2013 per cent change from BSL
average
2013 per cent change from
2012
1 405 Failed to look properly 1,278.0 1,189 1,339 1,349 1,267 1,246 1,163 1,323 1,521 1,142 -10.6 -24.9
2 406 Failed to judge other person’s path or speed 967.4 985 1,017 1,005 921 909 879 938 1,030 879 -9.1 -14.7
3 403 Poor turn or manoeuvre 549.8 582 577 571 518 501 495 523 555 464 -15.6 -16.4
4 602 Careless, reckless or in a hurry 433.2 473 441 486 405 361 358 403 456 332 -23.4 -27.2
5 408 Sudden braking 333.2 349 353 355 259 350 248 344 320 295 -11.5 -7.8
6 308 Following too close 364.8 413 397 337 331 346 292 318 362 272 -25.4 -24.9
7 410 Loss of control 428.8 487 487 448 381 341 353 329 343 260 -39.4 -24.2
8 307 Travelling too fast for conditions 328.4 388 360 351 275 268 223 221 245 164 -50.1 -33.1
9 103 Slippery road (due to weather) 273.0 295 261 285 255 269 249 165 248 159 -41.8 -35.9
10 409 Swerved 152.8 166 181 149 127 141 139 143 124 114 -25.4 -8.1
11 501 Impaired by alcohol 114.8 125 118 127 101 103 77 102 98 84 -26.8 -14.3
12 401 Junction overshoot 126.4 161 142 125 110 94 105 106 114 79 -37.5 -30.7
13 605 Learner or inexperienced driver/rider 131.2 133 144 135 134 110 88 101 92 77 -41.3 -16.3
14 509 Distraction in vehicle 56.4 62 55 58 43 64 55 84 98 70 24.1 -28.6
15 404 Failed to signal or misleading signal 83.0 78 87 92 70 88 60 68 80 70 -15.7 -12.5
16 306 Exceeding speed limit 99.6 113 89 110 93 93 77 74 80 68 -31.7 -15.0
17 603 Nervous, uncertain or panic 80.4 86 89 87 75 65 72 75 93 65 -19.2 -30.1
18 402 Junction restart (moving off at junction) 134.0 171 137 130 120 112 93 103 91 64 -52.2 -29.7
19 706 Dazzling sun 63.2 68 64 71 64 49 47 41 68 60 -5.1 -11.8
20 601 Aggressive driving 79.0 77 86 83 71 78 64 74 87 58 -26.6 -33.3
Notes: (a) Values in the table report the number of collisions at junctions where at least one of the specified contributory factors was recorded.
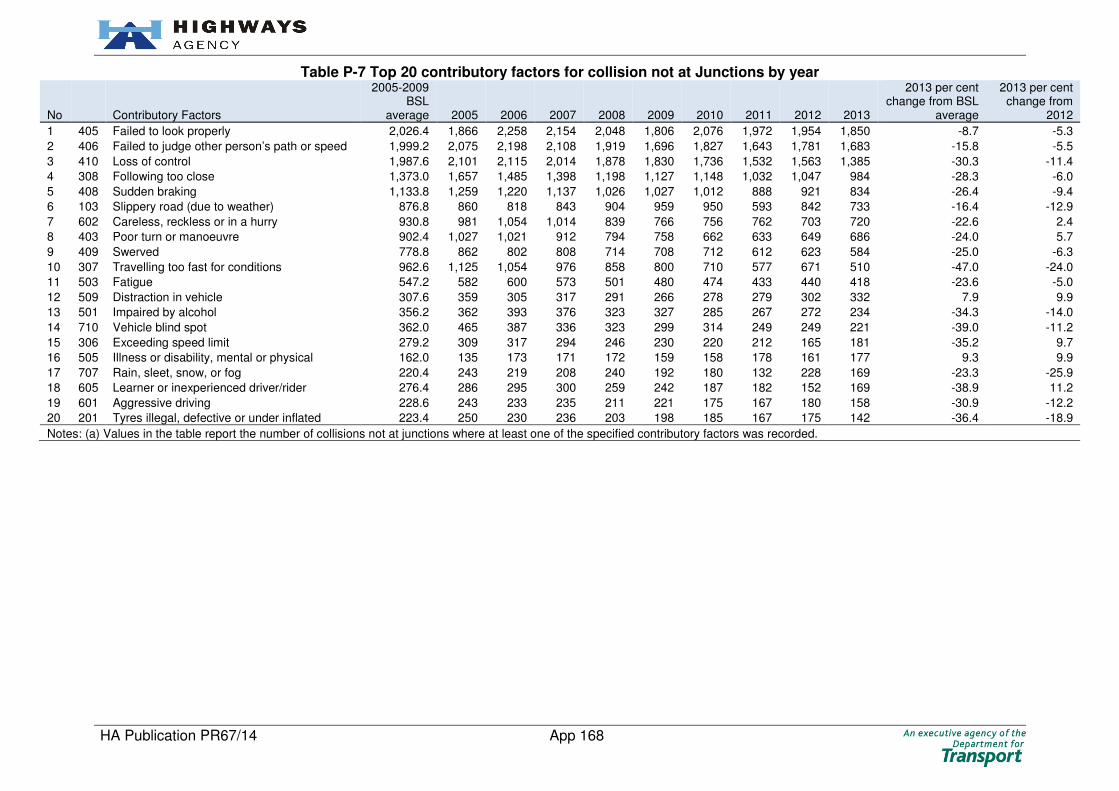
HA Publication PR67/14 App 168
Table P-7 Top 20 contributory factors for collision not at Junctions by year
No Contributory Factors
2005-2009 BSL
average 2005 2006 2007 2008 2009 2010 2011 2012 2013
2013 per cent change from BSL
average
2013 per cent change from
2012
1 405 Failed to look properly 2,026.4 1,866 2,258 2,154 2,048 1,806 2,076 1,972 1,954 1,850 -8.7 -5.3
2 406 Failed to judge other person’s path or speed 1,999.2 2,075 2,198 2,108 1,919 1,696 1,827 1,643 1,781 1,683 -15.8 -5.5
3 410 Loss of control 1,987.6 2,101 2,115 2,014 1,878 1,830 1,736 1,532 1,563 1,385 -30.3 -11.4
4 308 Following too close 1,373.0 1,657 1,485 1,398 1,198 1,127 1,148 1,032 1,047 984 -28.3 -6.0
5 408 Sudden braking 1,133.8 1,259 1,220 1,137 1,026 1,027 1,012 888 921 834 -26.4 -9.4
6 103 Slippery road (due to weather) 876.8 860 818 843 904 959 950 593 842 733 -16.4 -12.9
7 602 Careless, reckless or in a hurry 930.8 981 1,054 1,014 839 766 756 762 703 720 -22.6 2.4
8 403 Poor turn or manoeuvre 902.4 1,027 1,021 912 794 758 662 633 649 686 -24.0 5.7
9 409 Swerved 778.8 862 802 808 714 708 712 612 623 584 -25.0 -6.3
10 307 Travelling too fast for conditions 962.6 1,125 1,054 976 858 800 710 577 671 510 -47.0 -24.0
11 503 Fatigue 547.2 582 600 573 501 480 474 433 440 418 -23.6 -5.0
12 509 Distraction in vehicle 307.6 359 305 317 291 266 278 279 302 332 7.9 9.9
13 501 Impaired by alcohol 356.2 362 393 376 323 327 285 267 272 234 -34.3 -14.0
14 710 Vehicle blind spot 362.0 465 387 336 323 299 314 249 249 221 -39.0 -11.2
15 306 Exceeding speed limit 279.2 309 317 294 246 230 220 212 165 181 -35.2 9.7
16 505 Illness or disability, mental or physical 162.0 135 173 171 172 159 158 178 161 177 9.3 9.9
17 707 Rain, sleet, snow, or fog 220.4 243 219 208 240 192 180 132 228 169 -23.3 -25.9
18 605 Learner or inexperienced driver/rider 276.4 286 295 300 259 242 187 182 152 169 -38.9 11.2
19 601 Aggressive driving 228.6 243 233 235 211 221 175 167 180 158 -30.9 -12.2
20 201 Tyres illegal, defective or under inflated 223.4 250 230 236 203 198 185 167 175 142 -36.4 -18.9
Notes: (a) Values in the table report the number of collisions not at junctions where at least one of the specified contributory factors was recorded.

HA Publication PR67/14 App 169
Appendix Q: Tyres Table Q-1 to Table Q-4 provide breakdowns of collisions and casualties involving illegal, defective or under inflated tyres by road name, road
surface condition, weather condition, casualty type contributory factors and severity.
Table Q-1 Casualties involving illegal defective or under inflated tyres by severity and year
Casualty Severity
2005-2009 BSL
average 2005 2006 2007 2008 2009 2010 2011 2012 2013
2013 per cent change from BSL
average
2013 per cent change from
2012
Killed 9.8 9 11 12 9 8 2 9 4 2 - -
Seriously Injured 50.6 76 50 48 42 37 37 45 37 27 -46.6 -27.0
KSI 60.4 85 61 60 51 45 39 54 41 29 -52.0 -29.3
Slightly Injured 354.4 402 351 383 311 325 335 258 290 196 -44.7 -32.4
Total 414.8 487 412 443 362 370 374 312 331 225 -45.8 -32.0
Table Q-2 Collisions involving illegal, defective or under inflated tyres by top 20 road names and year
No. Road Name
2005-2009 BSL
average 2005 2006 2007 2008 2009 2010 2011 2012 2013
2013 per cent change from BSL
average
2013 per cent change from
2012
1 M6 26.2 30 33 25 22 21 14 22 11 15 -42.7 -
2 M25 14.4 15 13 16 15 13 11 13 15 10 - -33.3
3 M4 14.0 14 16 13 16 11 8 9 11 9 - -
4 M40 19.2 16 20 21 15 24 12 14 10 8 -58.3 -
5 M1 22.8 32 29 17 18 18 15 6 19 7 -69.3 -63.2
6 A1(M) 6.2 6 5 9 6 5 5 2 4 6 - -
7 M5 8.2 9 10 8 3 11 8 9 6 5 - -
8 M3 5.6 6 12 4 4 2 10 4 4 5 - -
9 M11 2.4 2 4 2 3 1 2 2 3 5 - -
10 A2 2.8 5 0 4 1 4 2 1 0 5 - -
11 A38 5.8 5 5 8 7 4 7 5 8 4 - -
12 A34 4.0 3 3 5 5 4 1 3 8 4 - -
13 M2 1.6 3 1 2 2 0 2 2 3 4 - -
14 A1 14.6 22 15 17 13 6 10 12 0 4 - -
15 A64 2.4 1 1 2 4 4 2 2 0 4 - -
16 M20 4.6 3 4 3 7 6 5 3 9 3 - -
17 A12 2.8 6 2 4 2 0 2 0 7 3 - -
18 A3 2.4 5 2 2 1 2 3 7 3 3 - -
19 M42 2.2 2 3 1 4 1 2 0 3 3 - -
20 A11 3.2 1 5 3 3 4 3 2 2 3 - -
Notes: (a) Ranked by 2013.

HA Publication PR67/14 App 170
Table Q-3 Collisions involving illegal, defective or under inflated tyres by road surface conditions, weather conditions and year
Road surface condition Weather
2005-2009 BSL
average 2005 2006 2007 2008 2009 2010 2011 2012 2013
2013 per cent change from BSL
average
2013 per cent change from
2012
Dry Fine 183.4 218 182 195 161 161 144 142 121 110 -40.0 -9.1
Fog or mist 0.2 1 0 0 0 0 0 0 1 0 - -
Rain 0.0 0 0 0 0 0 0 0 2 0 - -
Snow 0.0 0 0 0 0 0 0 0 0 0 - -
Other/unknown 0.6 1 1 0 1 0 2 3 2 2 - -
Frost or ice or snow Fine 1.0 0 1 1 1 2 4 1 2 0 - -
Fog or mist 0.0 0 0 0 0 0 0 0 0 0 - -
Rain 0.0 0 0 0 0 0 0 0 0 1 - -
Snow 0.6 0 0 0 0 3 1 0 0 0 - -
Other/unknown 0.2 0 1 0 0 0 1 0 1 1 - -
Wet or damp Fine 30.4 33 41 29 27 22 26 16 26 23 -24.3 -11.5
Fog or mist 1.0 0 2 1 1 1 3 2 0 0 - -
Rain 30.4 25 33 29 36 29 19 23 35 17 -44.1 -51.4
Snow 0.4 1 0 0 1 0 0 0 2 1 - -
Other/unknown 2.2 3 2 2 3 1 4 1 2 1 - -
Other Summation of other codes 0.8 0 1 1 2 0 0 1 0 2 - -

HA Publication PR67/14 App 171
Table Q-4 Casualties involving illegal, defective or under inflated tyres by casualty type, severity and year
Casualty type Casualty severity
2005-2009 BSL
average 2005 2006 2007 2008 2009 2010 2011 2012 2013
2013 per cent change from BSL
average
2013 per cent change from
2012
Car occupants Killed 7.2 8 8 8 8 4 0 7 4 2 - -
Seriously Injured 36.4 61 34 33 25 29 24 36 29 18 -50.5 -37.9
KSI 43.6 69 42 41 33 33 24 43 33 20 -54.1 -39.4
Slightly Injured 304.6 342 304 339 254 284 283 221 246 162 -46.8 -34.1
Total 348.2 411 346 380 287 317 307 264 279 182 -47.7 -34.8
PTW users Killed 1.2 0 1 2 1 2 1 1 0 0 - -
Seriously Injured 6.0 5 7 3 9 6 9 5 6 8 - -
KSI 7.2 5 8 5 10 8 10 6 6 8 - -
Slightly Injured 9.8 13 6 4 14 12 9 5 3 9 - -
Total 17.0 18 14 9 24 20 19 11 9 17 0.0 -
HGV occupant Killed 0.2 0 0 1 0 0 1 0 0 0 - -
Seriously Injured 1.4 0 1 5 1 0 0 2 0 1 - -
KSI 1.6 0 1 6 1 0 1 2 0 1 - -
Slightly Injured 7.0 6 10 8 7 4 5 3 8 7 - -
Total 8.6 6 11 14 8 4 6 5 8 8 - -
Goods vehicle occupant
Killed 0.6 1 2 0 0 0 0 0 0 0 - -
Seriously Injured 5.6 7 7 6 7 1 3 2 1 0 - -
KSI 6.2 8 9 6 7 1 3 2 1 0 - -
Slightly Injured 27.6 35 26 30 27 20 33 28 31 15 -45.7 -51.6
Total 33.8 43 35 36 34 21 36 30 32 15 -55.6 -53.1
Any other casualty type
Killed 0.6 0 0 1 0 2 0 1 0 0 - -
Seriously Injured 1.2 3 1 1 0 1 1 0 1 0 - -
KSI 1.8 3 1 2 0 3 1 1 1 0 - -
Slightly Injured 5.4 6 5 2 9 5 5 1 2 3 - -
Total 7.2 9 6 4 9 8 6 2 3 3 - -

HA Publication PR67/14 App 172
Table Q-5 Top 20 contributory factors involving illegal, defective or under inflated tyres by year
No. Contributory Factors
2005-2009 BSL
average 2005 2006 2007 2008 2009 2010 2011 2012 2013
2013 per cent change from BSL
average
2013 per cent change from
2012
1 201 Tyres illegal, defective or under inflated 252.2 284 266 258 233 220 204 189 195 158 -37.4 -19.0
2 410 Loss of control 97.2 95 99 97 100 95 84 71 65 62 -36.2 -4.6
3 103 Slippery road (due to weather) 22.0 17 25 23 26 19 29 14 30 14 -36.4 -53.3
4 306 Exceeding speed limit 9.0 15 4 11 6 9 5 6 5 9 - -
5 403 Poor turn or manoeuvre 5.8 10 7 7 2 3 5 4 5 9 - -
6 602 Careless, reckless or in a hurry 12.8 17 14 18 9 6 15 14 11 8 - -
7 409 Swerved 13.2 8 10 20 12 16 10 23 9 8 - -
8 405 Failed to look properly 9.2 11 9 7 10 9 10 7 8 8 - -
9 406 Failed to judge other person’s path or speed 8.6 5 10 9 10 9 9 5 13 7 - -
10 503 Fatigue 7.6 11 9 8 6 4 7 4 4 7 - -
11 206 Overloaded or poorly loaded vehicle or trailer 4.8 7 3 4 9 1 6 5 4 6 - -
12 307 Travelling too fast for conditions 18.8 24 15 21 23 11 10 5 19 5 -73.4 -73.7
13 308 Following too close 7.0 8 9 5 4 9 11 5 9 5 - -
14 408 Sudden braking 9.0 10 8 6 14 7 17 13 7 5 - -
15 501 Impaired by alcohol 7.4 12 5 5 9 6 3 2 3 5 - -
16 204 Defective steering or suspension 6.8 5 8 9 7 5 3 3 6 3 - -
17 603 Nervous, uncertain or panic 2.8 2 4 2 3 3 8 3 4 3 - -
18 203 Defective brakes 3.0 7 2 1 2 3 0 1 1 3 - -
19 707 Rain, sleet, snow, or fog 2.8 3 2 4 3 2 3 3 6 2 - -
20 401 Junction overshoot 1.4 2 0 1 1 3 0 2 1 2 - -
Notes: (a) Values in the table report the number of collisions by severity where at least one of the specified contributory factors was recorded.

HA Publication PR67/14 App 173
Appendix R: Goods Vehicles: LGVs (Other GV) and HGVs Table R-1 to Table R-7 provide breakdowns of collisions and casualties involving LGVs (other GVs) and HGVs by road name, casualty age,
contributory factors and severity.
Table R-1 Casualties involving LGVs (other GV) and HGVs by severity and year
Vehicle Type Casualty Severity
2005-2009 BSL
average 2005 2006 2007 2008 2009 2010 2011 2012 2013
2013 per cent change from BSL
average
2013 per cent change from
2012
HGV Killed 127.4 157 143 143 117 77 86 82 87 89 -30.1 2.3
Seriously Injured 428.6 561 455 439 365 323 323 281 290 349 -18.6 20.3
KSI 556.0 718 598 582 482 400 409 363 377 438 -21.2 16.2
Slightly Injured 3,831.6 4,414 4,204 4,156 3,512 2,872 2,913 2,878 2,626 2,672 -30.3 1.8
Total 4,387.6 5,132 4,802 4,738 3,994 3,272 3,322 3,241 3,003 3,110 -29.1 3.6
LGV (Other GV) Killed 43.2 45 39 56 44 32 42 37 30 28 -35.2 -6.7
Seriously Injured 232.6 287 262 207 195 212 188 188 184 177 -23.9 -3.8
KSI 275.8 332 301 263 239 244 230 225 214 205 -25.7 -4.2
Slightly Injured 2,536.2 2,785 2,737 2,490 2,393 2,276 2,117 2,259 2,019 2,037 -19.7 0.9
Total 2,812.0 3,117 3,038 2,753 2,632 2,520 2,347 2,484 2,233 2,242 -20.3 0.4
Notes: (a) Values in the table report the number of casualties where at least one of the specified vehicles was recorded as being involved.

HA Publication PR67/14 App 174
Table R-2 Casualties involving LGV (other GV) by top 20 road names and year
No. Road Name
2005-2009 BSL
average 2005 2006 2007 2008 2009 2010 2011 2012 2013
2013 per cent change from BSL
average
2013 per cent change from
2012
1 M1 275.4 340 264 291 250 232 183 192 216 169 -38.6 -21.8
2 M6 244.4 242 277 275 253 175 190 216 162 157 -35.8 -3.1
3 M25 192.2 248 207 179 187 140 155 202 185 143 -25.6 -22.7
4 M4 87.0 76 100 100 77 82 84 94 73 92 5.7 26.0
5 A1 149.8 191 172 117 135 134 101 107 79 90 -39.9 13.9
6 A27 66.6 81 69 69 57 57 64 64 51 85 27.6 66.7
7 A249 4.4 8 8 5 0 1 3 2 3 74 - -
8 A1(M) 66.4 45 60 100 67 60 76 57 62 71 6.9 14.5
9 A38 45.2 50 40 52 44 40 43 39 57 65 43.8 14.0
10 A5 49.6 48 56 54 39 51 53 71 52 63 27.0 21.2
11 M62 113.4 140 121 113 109 84 88 194 90 53 -53.3 -41.1
12 A14 78.6 114 61 59 80 79 65 49 67 49 -37.7 -26.9
13 M40 64.8 66 62 77 70 49 49 47 34 47 -27.5 38.2
14 A34 29.6 21 32 37 33 25 18 32 35 44 48.6 25.7
15 A3 37.2 58 38 35 26 29 48 34 53 40 7.5 -24.5
16 M5 81.4 85 83 86 72 81 62 128 49 40 -50.9 -18.4
17 M3 49.6 50 61 44 36 57 51 41 55 39 -21.4 -29.1
18 A12 49.0 72 44 37 40 52 36 29 20 37 -24.5 85.0
19 A46 62.8 68 81 67 53 45 34 40 38 36 -42.7 -5.3
20 M42 22.8 25 7 17 30 35 10 34 21 35 53.5 66.7
Notes: (a) Values in the table report the number of casualties where at least one LGV (other GV) was recorded as being involved.

HA Publication PR67/14 App 175
Table R-3 Casualties involving HGVs by top 20 road names and year
No. Road Name
2005-2009 BSL
average 2005 2006 2007 2008 2009 2010 2011 2012 2013
2013 per cent change from BSL
average
2013 per cent change from
2012
1 M25 522.4 679 562 596 454 321 351 377 331 376 -28.0 13.6
2 M6 468.6 566 541 490 408 338 382 323 321 334 -28.7 4.0
3 M1 494.8 633 500 582 421 338 358 292 315 292 -41.0 -7.3
4 A1 205.0 274 205 209 176 161 146 151 118 152 -25.9 28.8
5 M62 151.2 177 179 150 160 90 170 110 117 103 -31.9 -12.0
6 A14 174.6 209 186 190 160 128 144 118 98 86 -50.7 -12.2
7 M4 119.4 146 138 133 112 68 112 94 100 85 -28.8 -15.0
8 M20 103.6 107 95 144 105 67 47 52 88 80 -22.8 -9.1
9 A249 8.0 16 5 1 13 5 6 6 1 78 - -
10 M40 132.4 144 144 145 123 106 105 83 60 77 -41.8 28.3
11 A50 40.6 29 48 41 40 45 32 34 27 70 72.4 159.3
12 A1(M) 90.0 76 97 101 65 111 78 71 67 66 -26.7 -1.5
13 M5 136.8 165 167 142 109 101 89 151 124 57 -58.3 -54.0
14 A5 70.2 65 82 90 72 42 61 56 64 56 -20.2 -12.5
15 A38 72.4 81 89 87 55 50 55 49 63 55 -24.0 -12.7
16 A34 55.8 52 73 47 56 51 18 35 36 46 -17.6 27.8
17 A19 57.2 80 80 46 39 41 44 21 44 40 -30.1 -9.1
18 A30 22.6 20 23 35 18 17 14 24 28 38 68.1 35.7
19 M42 56.0 53 52 28 101 46 29 45 20 38 -32.1 90.0
20 M3 56.4 63 63 58 57 41 38 51 36 37 -34.4 2.8
Notes: (a) Values in the table report the number of casualties where at least one HGV was recorded as being involved.

HA Publication PR67/14 App 176
Table R-4 Casualties involving HGVs by casualty age, severity and year
Casualty Age Group Casualty Severity
2005-2009 BSL
average 2005 2006 2007 2008 2009 2010 2011 2012 2013
2013 per cent change from BSL
average
2013 per cent change from
2012
Children (0-15) Killed 5.0 5 6 5 5 4 4 0 2 1 - -
Seriously Injured 10.0 9 18 8 8 7 14 7 5 5 - -
KSI 15.0 14 24 13 13 11 18 7 7 6 -60.0 -
Slightly Injured 150.0 182 155 149 145 119 117 111 84 105 -30.0 25.0
Total 165.0 196 179 162 158 130 135 118 91 111 -32.7 22.0
Young (16-19) Killed 6.0 7 8 5 5 5 5 5 3 7 - -
Seriously Injured 23.8 37 24 19 21 18 11 12 12 16 -32.8 -
KSI 29.8 44 32 24 26 23 16 17 15 23 -22.8 53.3
Slightly Injured 197.8 205 203 252 177 152 123 120 119 102 -48.4 -14.3
Total 227.6 249 235 276 203 175 139 137 134 125 -45.1 -6.7
Other (20-59) Killed 100.6 126 116 114 93 54 63 58 58 60 -40.4 3.4
Seriously Injured 337.2 441 350 357 287 251 251 211 219 267 -20.8 21.9
KSI 437.8 567 466 471 380 305 314 269 277 327 -25.3 18.1
Slightly Injured 2,997.0 3,499 3,368 3,210 2,701 2,207 2,317 2,208 2,057 2,071 -30.9 0.7
Total 3,434.8 4,066 3,834 3,681 3,081 2,512 2,631 2,477 2,334 2,398 -30.2 2.7
Older (60-69) Killed 8.6 9 6 11 8 9 8 8 10 9 - -
Seriously Injured 32.8 38 28 33 31 34 30 27 38 22 -32.9 -42.1
KSI 41.4 47 34 44 39 43 38 35 48 31 -25.1 -35.4
Slightly Injured 286.2 297 281 313 292 248 227 268 235 228 -20.3 -3.0
Total 327.6 344 315 357 331 291 265 303 283 259 -20.9 -8.5
Elderly (70+) Killed 6.8 10 6 7 6 5 6 11 14 12 - -
Seriously Injured 19.4 30 28 14 14 11 15 23 15 36 85.6 140.0
KSI 26.2 40 34 21 20 16 21 34 29 48 83.2 65.5
Slightly Injured 151.4 159 149 156 171 122 108 137 112 130 -14.1 16.1
Total 177.6 199 183 177 191 138 129 171 141 178 0.2 26.2
Unknown Total 55.0 78 56 85 30 26 23 35 20 39 -29.1 95.0
Notes: (a) Values in the table report the number of casualties by casualty age group where at least one HGV was recorded as being involved.

HA Publication PR67/14 App 177
Table R-5 Casualties involving LGVs (other GV) by casualty age, severity and year
Casualty Age Group Casualty Severity
2005-2009 BSL
average 2005 2006 2007 2008 2009 2010 2011 2012 2013
2013 per cent change from BSL
average
2013 per cent change from
2012
Children (0-15) Killed 1.4 0 1 2 3 1 3 1 0 1 - -
Seriously Injured 7.2 12 5 6 8 5 4 5 5 2 - -
KSI 8.6 12 6 8 11 6 7 6 5 3 - -
Slightly Injured 83.8 94 97 85 79 64 86 151 59 73 -12.9 23.7
Total 92.4 106 103 93 90 70 93 157 64 76 -17.7 18.8
Young (16-19) Killed 2.6 4 2 2 2 3 1 3 0 0 - -
Seriously Injured 12.4 22 13 12 5 10 8 13 5 5 - -
KSI 15.0 26 15 14 7 13 9 16 5 5 -66.7 -
Slightly Injured 138.4 142 150 140 140 120 107 112 86 85 -38.6 -1.2
Total 153.4 168 165 154 147 133 116 128 91 90 -41.3 -1.1
Other (20-59) Killed 33.6 38 31 43 32 24 34 26 25 17 -49.4 -32.0
Seriously Injured 182.2 202 205 170 159 175 150 139 147 137 -24.8 -6.8
KSI 215.8 240 236 213 191 199 184 165 172 154 -28.6 -10.5
Slightly Injured 2,079.4 2,288 2,248 2,029 1,953 1,879 1,718 1,787 1,665 1,677 -19.4 0.7
Total 2,295.2 2,528 2,484 2,242 2,144 2,078 1,902 1,952 1,837 1,831 -20.2 -0.3
Older (60-69) Killed 3.6 1 3 7 5 2 2 3 3 4 - -
Seriously Injured 18.0 30 24 11 13 12 20 20 18 18 0.0 0.0
KSI 21.6 31 27 18 18 14 22 23 21 22 1.9 4.8
Slightly Injured 135.0 148 138 135 134 120 135 111 137 128 -5.2 -6.6
Total 156.6 179 165 153 152 134 157 134 158 150 -4.2 -5.1
Elderly (70+) Killed 1.8 1 2 2 2 2 2 4 2 6 - -
Seriously Injured 10.2 19 10 5 9 8 6 11 7 14 - -
KSI 12.0 20 12 7 11 10 8 15 9 20 - -
Slightly Injured 66.0 84 54 53 66 73 50 78 49 47 -28.8 -4.1
Total 78.0 104 66 60 77 83 58 93 58 67 -14.1 15.5
Unknown Total 36.4 32 55 51 22 22 21 20 25 28 -23.1 12.0
Notes: (a) Values in the table report the number of casualties by casualty age group where at least one LGV (other GV) was recorded as being involved.

HA Publication PR67/14 App 178
Table R-6 Top 20 contributory factors for casualties involving LGV (other GV) by year
No. Contributory Factors
2005-2009 BSL
average 2005 2006 2007 2008 2009 2010 2011 2012 2013
2013 per cent change from BSL
average
2013 per cent change from
2012
1 405 Failed to look properly 716.0 571 803 704 773 729 666 793 766 716 0.0 -6.5
2 406 Failed to judge other person’s path or speed 753.6 748 845 752 766 657 693 774 769 651 -13.6 -15.3
3 308 Following too close 592.2 735 590 535 567 534 487 523 473 422 -28.7 -10.8
4 408 Sudden braking 417.8 498 468 358 398 367 331 504 372 308 -26.3 -17.2
5 602 Careless, reckless or in a hurry 349.4 405 385 324 357 276 252 311 301 264 -24.4 -12.3
6 307 Travelling too fast for conditions 352.2 464 354 375 292 276 208 219 240 226 -35.8 -5.8
7 410 Loss of control 339.6 396 406 317 290 289 305 216 250 217 -36.1 -13.2
8 403 Poor turn or manoeuvre 237.2 235 253 265 236 197 213 199 189 204 -14.0 7.9
9 409 Swerved 187.4 204 193 205 189 146 154 153 116 157 -16.2 35.3
10 103 Slippery road (due to weather) 208.0 252 193 187 207 201 237 129 175 127 -38.9 -27.4
11 707 Rain, sleet, snow, or fog 82.8 77 90 108 84 55 44 39 54 114 37.7 111.1
12 509 Distraction in vehicle 74.4 88 76 98 47 63 70 100 84 107 43.8 27.4
13 503 Fatigue 134.0 139 137 148 109 137 105 91 122 100 -25.4 -18.0
14 505 Illness or disability, mental or physical 38.6 15 35 58 32 53 25 51 42 57 47.7 35.7
15 601 Aggressive driving 65.0 48 87 74 55 61 38 57 62 50 -23.1 -19.4
16 501 Impaired by alcohol 70.8 81 57 75 71 70 46 52 57 40 -43.5 -29.8
17 510 Distraction outside vehicle 47.8 51 61 40 54 33 60 36 39 40 -16.3 2.6
18 306 Exceeding speed limit 60.8 63 50 54 71 66 50 64 38 37 -39.1 -2.6
19 404 Failed to signal or misleading signal 31.6 32 22 32 32 40 26 30 28 35 10.8 25.0
20 108 Road layout (eg. bend, hill, narrow carriageway) 17.6 21 20 8 24 15 9 19 12 33 87.5 -
Notes: (a) Values in the table report the number of casualties involving at least one LGV (other GV) where at least one of the specified contributory factors was recorded. (b) Ranked by 2013.

HA Publication PR67/14 App 179
Table R-7 Top 20 contributory factors for casualties involving HGVs by year
No. Contributory Factors
2005-2009 BSL
average 2005 2006 2007 2008 2009 2010 2011 2012 2013
2013 per cent change from BSL
average
2013 per cent change from
2012
1 405 Failed to look properly 1,433.2 1,493 1,566 1,583 1,394 1,130 1,278 1,272 1,238 1,143 -20.2 -7.7
2 406 Failed to judge other person’s path or speed 1,057.2 1,146 1,218 1,083 1,023 816 879 809 891 907 -14.2 1.8
3 403 Poor turn or manoeuvre 666.2 764 725 691 649 502 452 464 458 461 -30.8 0.7
4 410 Loss of control 503.4 570 595 515 455 382 377 375 308 350 -30.5 13.6
5 602 Careless, reckless or in a hurry 439.8 581 503 454 367 294 400 352 315 335 -23.8 6.3
6 308 Following too close 516.8 568 593 579 452 392 319 301 295 318 -38.5 7.8
7 710 Vehicle blind spot 492.2 610 488 475 474 414 420 321 317 302 -38.6 -4.7
8 307 Travelling too fast for conditions 322.0 385 399 405 236 185 196 158 215 218 -32.3 1.4
9 408 Sudden braking 385.4 426 447 446 335 273 285 258 280 208 -46.0 -25.7
10 503 Fatigue 300.6 345 343 291 280 244 220 182 214 199 -33.8 -7.0
11 409 Swerved 261.4 323 284 261 243 196 250 172 187 177 -32.3 -5.3
12 509 Distraction in vehicle 120.0 137 124 134 101 104 109 112 112 130 8.3 16.1
13 707 Rain, sleet, snow, or fog 98.6 122 95 117 86 73 64 64 102 111 12.6 8.8
14 103 Slippery road (due to weather) 202.2 225 181 221 189 195 197 106 156 109 -46.1 -30.1
15 505 Illness or disability, mental or physical 66.8 66 72 74 71 51 49 57 57 71 6.3 24.6
16 501 Impaired by alcohol 83.8 92 93 80 72 82 59 67 86 62 -26.0 -27.9
17 606 Inexperience of driving on the left 83.4 109 104 89 70 45 59 44 56 62 -25.7 10.7
18 306 Exceeding speed limit 86.2 90 109 85 106 41 51 51 42 47 -45.5 11.9
19 706 Dazzling sun 47.4 55 47 50 38 47 41 33 43 46 -3.0 7.0
20 601 Aggressive driving 65.6 81 55 56 77 59 56 53 52 44 -32.9 -15.4
Notes: (a) Values in the table report the number of casualties involving at least one HGV where at least one of the specified contributory factors was recorded. (b) Ranked by 2013.

HA Publication PR67/14 App 180
Appendix S: Motorcycles Table S-1 to Table S-5 provide breakdowns of collisions and casualties involving motorcycles by road name, casualty age, contributory factors
and severity.
Table S-1 Casualties involving motorcycles by severity and year
Casualty Severity
2005-2009 BSL
average 2005 2006 2007 2008 2009 2010 2011 2012 2013
2013 per cent change from BSL
average
2013 per cent change from
2012
Killed 45.4 56 48 40 55 28 31 25 23 37 -18.5 60.9
Seriously Injured 340.6 368 351 365 319 300 277 316 280 287 -15.7 2.5
KSI 386.0 424 399 405 374 328 308 341 303 324 -16.1 6.9
Slightly Injured 775.4 832 747 860 716 722 652 696 584 678 -12.6 16.1
Total 1,161.4 1,256 1,146 1,265 1,090 1,050 960 1,037 887 1,002 -13.7 13.0
Notes: (a) Values in the table report the number of casualties where at least one motorcycle was recorded as being involved.
Table S-2 Casualties involving motorcycles by top 20 road names and year
No. Road Name
2005-2009 BSL
average 2005 2006 2007 2008 2009 2010 2011 2012 2013
2013 per cent change from BSL
average
2013 per cent change from
2012
1 A249 6.8 7 6 7 9 5 2 5 2 72 - -
2 A5 57.2 68 67 57 46 48 53 63 44 54 -5.6 22.7
3 A27 44.0 43 37 47 57 36 38 46 28 51 15.9 82.1
4 M25 68.6 73 71 87 50 62 62 73 45 35 -49.0 -22.2
5 A47 30.2 33 27 30 28 33 25 28 28 33 9.3 17.9
6 A38 33.6 39 30 40 25 34 27 35 45 30 -10.7 -33.3
7 A1 42.2 46 38 44 41 42 29 29 27 28 -33.6 3.7
8 M4 36.8 41 39 34 41 29 27 36 27 27 -26.6 0.0
9 A3 19.0 20 31 15 15 14 18 27 15 27 42.1 80.0
10 A2 21.8 28 19 14 30 18 18 21 23 24 10.1 4.3
11 M1 54.2 52 50 90 36 43 49 21 24 23 -57.6 -4.2
12 A30 24.8 26 25 29 24 20 15 16 26 21 -15.3 -19.2
13 A12 33.6 33 26 29 48 32 23 27 14 21 -37.5 -
14 M6 41.8 53 36 48 35 37 31 21 13 21 -49.8 -
15 A64 15.6 15 20 16 12 15 19 10 16 20 28.2 25.0
16 A46 31.4 39 28 34 26 30 22 21 24 18 -42.7 -25.0
17 A14 19.2 29 17 12 14 24 19 20 16 18 -6.3 12.5
18 A31 17.2 25 14 15 23 9 18 15 22 17 -1.2 -22.7
19 A35 13.6 18 9 12 16 13 11 10 18 17 - -5.6
20 M27 14.2 12 16 15 19 9 24 14 17 16 - -5.9
Notes: (a) Values in the table report the number of casualties where at least one motorcycle was recorded as being involved. (b) A249 showing large increase due to a single multiple vehicle collision.
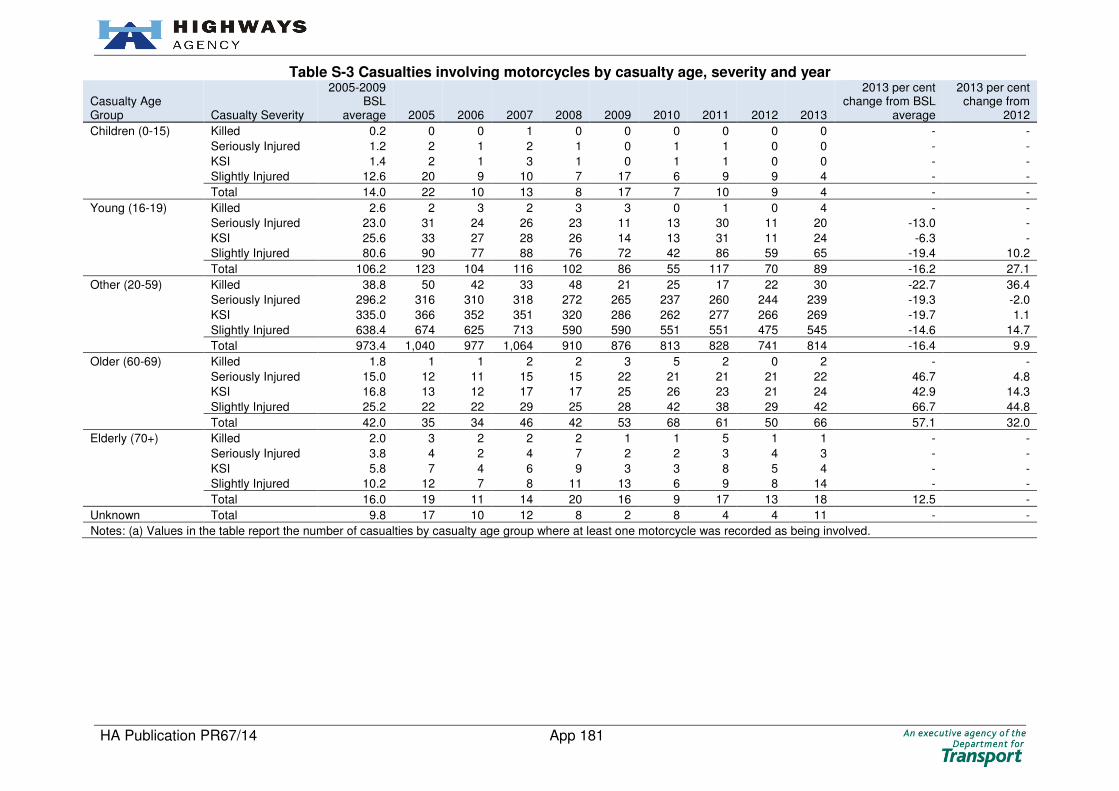
HA Publication PR67/14 App 181
Table S-3 Casualties involving motorcycles by casualty age, severity and year
Casualty Age Group Casualty Severity
2005-2009 BSL
average 2005 2006 2007 2008 2009 2010 2011 2012 2013
2013 per cent change from BSL
average
2013 per cent change from
2012
Children (0-15) Killed 0.2 0 0 1 0 0 0 0 0 0 - -
Seriously Injured 1.2 2 1 2 1 0 1 1 0 0 - -
KSI 1.4 2 1 3 1 0 1 1 0 0 - -
Slightly Injured 12.6 20 9 10 7 17 6 9 9 4 - -
Total 14.0 22 10 13 8 17 7 10 9 4 - -
Young (16-19) Killed 2.6 2 3 2 3 3 0 1 0 4 - -
Seriously Injured 23.0 31 24 26 23 11 13 30 11 20 -13.0 -
KSI 25.6 33 27 28 26 14 13 31 11 24 -6.3 -
Slightly Injured 80.6 90 77 88 76 72 42 86 59 65 -19.4 10.2
Total 106.2 123 104 116 102 86 55 117 70 89 -16.2 27.1
Other (20-59) Killed 38.8 50 42 33 48 21 25 17 22 30 -22.7 36.4
Seriously Injured 296.2 316 310 318 272 265 237 260 244 239 -19.3 -2.0
KSI 335.0 366 352 351 320 286 262 277 266 269 -19.7 1.1
Slightly Injured 638.4 674 625 713 590 590 551 551 475 545 -14.6 14.7
Total 973.4 1,040 977 1,064 910 876 813 828 741 814 -16.4 9.9
Older (60-69) Killed 1.8 1 1 2 2 3 5 2 0 2 - -
Seriously Injured 15.0 12 11 15 15 22 21 21 21 22 46.7 4.8
KSI 16.8 13 12 17 17 25 26 23 21 24 42.9 14.3
Slightly Injured 25.2 22 22 29 25 28 42 38 29 42 66.7 44.8
Total 42.0 35 34 46 42 53 68 61 50 66 57.1 32.0
Elderly (70+) Killed 2.0 3 2 2 2 1 1 5 1 1 - -
Seriously Injured 3.8 4 2 4 7 2 2 3 4 3 - -
KSI 5.8 7 4 6 9 3 3 8 5 4 - -
Slightly Injured 10.2 12 7 8 11 13 6 9 8 14 - -
Total 16.0 19 11 14 20 16 9 17 13 18 12.5 -
Unknown Total 9.8 17 10 12 8 2 8 4 4 11 - -
Notes: (a) Values in the table report the number of casualties by casualty age group where at least one motorcycle was recorded as being involved.

HA Publication PR67/14 App 182
Table S-4 Casualties involving motorcycles by road classification, severity and year
Road Classification Casualty Severity
2005-2009 BSL
average 2005 2006 2007 2008 2009 2010 2011 2012 2013
2013 per cent change from BSL
average
2013 per cent change from
2012
Motorway - Killed 15.2 17 21 14 13 11 12 6 2 13 -14.5 -
Seriously Injured 115.8 120 123 128 113 95 106 107 84 72 -37.8 -14.3
KSI 131.0 137 144 142 126 106 118 113 86 85 -35.1 -1.2
Slightly Injured 256.2 264 259 316 221 221 221 212 164 163 -36.4 -0.6
Total 387.2 401 403 458 347 327 339 325 250 248 -36.0 -0.8
A-road Dual Carriageway
Built-up Killed 2.0 4 1 2 1 2 0 0 3 2 - -
Seriously Injured 20.0 25 20 20 19 16 9 15 13 15 -25.0 -
KSI 22.0 29 21 22 20 18 9 15 16 17 -22.7 6.3
Slightly Injured 72.4 77 70 80 73 62 48 75 58 44 -39.2 -24.1
Total 94.4 106 91 102 93 80 57 90 74 61 -35.4 -17.6
Non Built-up Killed 15.0 20 15 11 23 6 10 10 6 11 -26.7 -
Seriously Injured 121.6 138 126 126 118 100 106 128 119 113 -7.1 -5.0
KSI 136.6 158 141 137 141 106 116 138 125 124 -9.2 -0.8
Slightly Injured 279.8 298 255 282 278 286 241 277 225 327 16.9 45.3
Total 416.4 456 396 419 419 392 357 415 350 451 8.3 28.9
A-road Single Carriageway
Built-up Killed 1.8 2 2 0 4 1 1 1 1 1 - -
Seriously Injured 20.6 25 20 19 13 26 12 19 15 14 -32.0 -6.7
KSI 22.4 27 22 19 17 27 13 20 16 15 -33.0 -6.3
Slightly Injured 57.6 56 62 58 51 61 49 52 48 47 -18.4 -2.1
Total 80.0 83 84 77 68 88 62 72 64 62 -22.5 -3.1
Non Built-up Killed 11.4 13 9 13 14 8 8 8 11 10 - -
Seriously Injured 62.6 60 62 72 56 63 44 47 49 73 16.6 49.0
KSI 74.0 73 71 85 70 71 52 55 60 83 12.2 38.3
Slightly Injured 109.4 137 101 124 93 92 93 80 89 97 -11.3 9.0
Total 183.4 210 172 209 163 163 145 135 149 180 -1.9 20.8

HA Publication PR67/14 App 183
Table S-5 Top 20 contributory factors for casualties involving motorcycles by year
No. Contributory Factors
2005-2009 BSL
average 2005 2006 2007 2008 2009 2010 2011 2012 2013
2013 per cent change from BSL
average
2013 per cent change from
2012
1 405 Failed to look properly 385.0 370 405 422 372 356 346 352 366 320 -16.9 -12.6
2 406 Failed to judge other person’s path or speed 274.6 271 268 321 262 251 288 254 234 233 -15.1 -0.4
3 410 Loss of control 197.2 204 211 207 198 166 185 181 160 164 -16.8 2.5
4 403 Poor turn or manoeuvre 215.8 228 228 209 206 208 181 189 177 163 -24.5 -7.9
5 408 Sudden braking 124.6 142 101 132 114 134 110 94 111 109 -12.5 -1.8
6 307 Travelling too fast for conditions 89.0 113 94 98 85 55 67 79 60 106 19.1 76.7
7 602 Careless, reckless or in a hurry 120.4 130 124 137 120 91 105 98 95 103 -14.5 8.4
8 707 Rain, sleet, snow, or fog 21.0 21 22 13 21 28 8 13 20 80 281.0 300.0
9 308 Following too close 103.4 100 105 108 93 111 100 85 76 79 -23.6 3.9
10 103 Slippery road (due to weather) 72.6 73 68 89 72 61 49 70 62 63 -13.2 1.6
11 409 Swerved 48.4 44 40 54 50 54 41 43 36 47 -2.9 30.6
12 605 Learner or inexperienced driver/rider 63.8 60 64 68 70 57 26 64 44 42 -34.2 -4.5
13 404 Failed to signal or misleading signal 36.4 47 31 24 39 41 29 30 37 32 -12.1 -13.5
14 306 Exceeding speed limit 46.0 60 47 44 38 41 36 29 25 32 -30.4 28.0
15 601 Aggressive driving 29.0 32 40 29 27 17 24 32 33 28 -3.4 -15.2
16 102 Deposit on road (eg. oil, mud, chippings) 42.0 41 36 54 44 35 32 29 31 25 -40.5 -19.4
17 607 Unfamiliar with model of vehicle 17.4 17 16 19 14 21 10 14 9 18 3.4 -
18 201 Tyres illegal, defective or under inflated 17.4 18 14 10 25 20 23 11 9 17 -2.3 -
19 603 Nervous, uncertain or panic 17.4 14 19 16 26 12 9 18 20 15 -13.8 -25.0
20 501 Impaired by alcohol 20.4 25 17 21 18 21 16 25 11 15 -26.5 -
Notes: (a) Values in the table report the number of casualties involving at least one motorcycle where at least one of the specified contributory factors was recorded. (b) Ranked by 2013.

HA Publication PR67/14 App 184
Appendix T: Hard Shoulders and laybys Table T-1 to Table L-5 provide breakdowns of collisions and casualties involving hard shoulders and laybys by road name, road classification,
casualty age, contributory factors and severity. In the majority of cases it is assumed that if the road classification was recorded as “motorway”
and the vehicle location was reported as “On lay-by or hard shoulder” then the vehicle was located on a motorway hardshoulder at the time of
the collision. In contrast, if the road classification was denoted as “A-road” and the vehicle location was reported as “On lay-by or hard
shoulder”, then the vehicle was located on an A-road lay-by.
Table T-1 Casualties involving hard shoulders or laybys by severity and year
Casualty Severity
2005-2009 BSL
average 2005 2006 2007 2008 2009 2010 2011 2012 2013
2013 per cent change from BSL
average
2013 per cent change from
2012
Killed 20.6 24 21 24 19 15 22 17 14 14 -32.0 -
Seriously Injured 63.6 69 69 54 72 54 50 46 38 38 -40.3 0.0
KSI 84.2 93 90 78 91 69 72 63 52 52 -38.2 0.0
Slightly Injured 288.4 307 267 301 311 256 264 285 191 211 -26.8 10.5
Total 372.6 400 357 379 402 325 336 348 243 263 -29.4 8.2
Notes: (a) Values in the table report the number of casualties where at least one vehicle involved was recorded as being located on/entering/leaving a layby or hard shoulder.
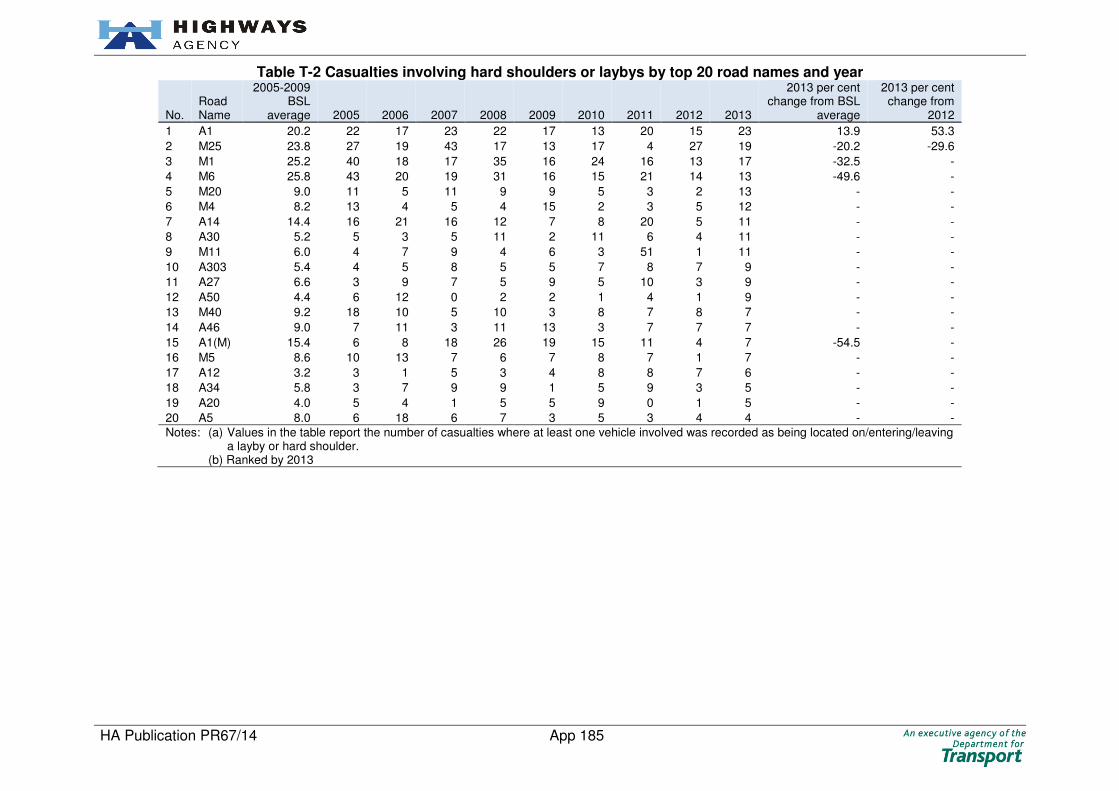
HA Publication PR67/14 App 185
Table T-2 Casualties involving hard shoulders or laybys by top 20 road names and year
No. Road Name
2005-2009 BSL
average 2005 2006 2007 2008 2009 2010 2011 2012 2013
2013 per cent change from BSL
average
2013 per cent change from
2012
1 A1 20.2 22 17 23 22 17 13 20 15 23 13.9 53.3
2 M25 23.8 27 19 43 17 13 17 4 27 19 -20.2 -29.6
3 M1 25.2 40 18 17 35 16 24 16 13 17 -32.5 -
4 M6 25.8 43 20 19 31 16 15 21 14 13 -49.6 -
5 M20 9.0 11 5 11 9 9 5 3 2 13 - -
6 M4 8.2 13 4 5 4 15 2 3 5 12 - -
7 A14 14.4 16 21 16 12 7 8 20 5 11 - -
8 A30 5.2 5 3 5 11 2 11 6 4 11 - -
9 M11 6.0 4 7 9 4 6 3 51 1 11 - -
10 A303 5.4 4 5 8 5 5 7 8 7 9 - -
11 A27 6.6 3 9 7 5 9 5 10 3 9 - -
12 A50 4.4 6 12 0 2 2 1 4 1 9 - -
13 M40 9.2 18 10 5 10 3 8 7 8 7 - -
14 A46 9.0 7 11 3 11 13 3 7 7 7 - -
15 A1(M) 15.4 6 8 18 26 19 15 11 4 7 -54.5 -
16 M5 8.6 10 13 7 6 7 8 7 1 7 - -
17 A12 3.2 3 1 5 3 4 8 8 7 6 - -
18 A34 5.8 3 7 9 9 1 5 9 3 5 - -
19 A20 4.0 5 4 1 5 5 9 0 1 5 - -
20 A5 8.0 6 18 6 7 3 5 3 4 4 - -
Notes: (a) Values in the table report the number of casualties where at least one vehicle involved was recorded as being located on/entering/leaving a layby or hard shoulder.
(b) Ranked by 2013

HA Publication PR67/14 App 186
Table T-3 Casualties involving hard shoulders or laybys by road classification, severity and year
Road Classification Casualty Severity
2005-2009 BSL
average 2005 2006 2007 2008 2009 2010 2011 2012 2013
2013 per cent change from BSL
average
2013 per cent change from
2012
Motorway - Killed 11.6 15 13 13 10 7 10 8 8 7 - -
Seriously Injured 34.0 42 27 31 37 33 25 17 19 19 -44.1 0.0
KSI 45.6 57 40 44 47 40 35 25 27 26 -43.0 -3.7
Slightly Injured 139.2 161 99 140 160 136 129 140 85 95 -31.8 11.8
Total 184.8 218 139 184 207 176 164 165 112 121 -34.5 8.0
A-road Dual Carriageway 0.0 0 0 0 0 0 0 0 0 0 - -
Built-up Killed 0.0 0 0 0 0 0 0 0 0 0 - -
Seriously Injured 0.2 1 0 0 0 0 1 0 0 0 - -
KSI 0.2 1 0 0 0 0 1 0 0 0 - -
Slightly Injured 2.0 1 2 2 3 2 3 4 1 0 - -
Total 2.2 2 2 2 3 2 4 4 1 0 - -
Non Built-up Killed 8.2 8 8 9 9 7 11 8 5 7 - -
Seriously Injured 22.2 18 31 18 29 15 20 20 16 17 -23.4 6.3
KSI 30.4 26 39 27 38 22 31 28 21 24 -21.1 14.3
Slightly Injured 113.0 121 122 116 116 90 101 102 80 81 -28.3 1.3
Total 143.4 147 161 143 154 112 132 130 101 105 -26.8 4.0
A-road Single Carriageway 0.0 0 0 0 0 0 0 0 0 0 - -
Built-up Killed 0.0 0 0 0 0 0 0 0 0 0 - -
Seriously Injured 0.0 0 0 0 0 0 0 1 0 0 - -
KSI 0.0 0 0 0 0 0 0 1 0 0 - -
Slightly Injured 3.0 1 4 7 2 1 0 0 2 1 - -
Total 3.0 1 4 7 2 1 0 1 2 1 - -
Non Built-up Killed 0.8 1 0 2 0 1 1 1 1 0 - -
Seriously Injured 7.2 8 11 5 6 6 4 8 3 2 - -
KSI 8.0 9 11 7 6 7 5 9 4 2 - -
Slightly Injured 31.2 23 40 36 30 27 31 39 23 34 9.0 47.8
Total 39.2 32 51 43 36 34 36 48 27 36 -8.2 33.3
Notes: (a) Values in the table report the number of casualties where at least one vehicle involved was recorded as being located on/entering/leaving a layby or hard shoulder.

HA Publication PR67/14 App 187
Table T-4 Casualties involving hard shoulders or laybys by casualty age, severity and year
Casualty Age Group Casualty Severity
2005-2009 BSL
average 2005 2006 2007 2008 2009 2010 2011 2012 2013
2013 per cent change from BSL
average
2013 per cent change from
2012
Children (0-15) Killed 0.6 0 2 0 1 0 2 0 0 0 - -
Seriously Injured 2.6 3 4 1 3 2 1 1 2 0 - -
KSI 3.2 3 6 1 4 2 3 1 2 0 - -
Slightly Injured 14.0 15 12 7 17 19 4 12 17 10 - -41.2
Total 17.2 18 18 8 21 21 7 13 19 10 -41.9 -47.4
Young (16-19) Killed 0.8 1 1 0 0 2 1 1 1 1 - -
Seriously Injured 3.2 0 5 2 7 2 5 6 2 2 - -
KSI 4.0 1 6 2 7 4 6 7 3 3 - -
Slightly Injured 20.6 22 22 19 22 18 11 14 11 7 -66.0 -
Total 24.6 23 28 21 29 22 17 21 14 10 -59.3 -
Other (20-59) Killed 15.2 20 14 18 15 9 18 13 9 12 -21.1 -
Seriously Injured 49.0 54 53 45 52 41 34 30 23 28 -42.9 21.7
KSI 64.2 74 67 63 67 50 52 43 32 40 -37.7 25.0
Slightly Injured 220.2 231 200 241 237 192 207 196 138 144 -34.6 4.3
Total 284.4 305 267 304 304 242 259 239 170 184 -35.3 8.2
Older (60-69) Killed 2.4 1 1 4 3 3 1 1 3 1 - -
Seriously Injured 5.2 7 4 4 5 6 6 6 8 2 - -
KSI 7.6 8 5 8 8 9 7 7 11 3 - -
Slightly Injured 18.8 16 18 19 26 15 23 42 11 26 38.3 -
Total 26.4 24 23 27 34 24 30 49 22 29 9.8 31.8
Elderly (70+) Killed 1.4 1 3 2 0 1 0 2 1 0 - -
Seriously Injured 2.4 3 2 2 2 3 4 3 3 6 - -
KSI 3.8 4 5 4 2 4 4 5 4 6 - -
Slightly Injured 11.2 15 11 11 9 10 15 21 10 24 - -
Total 15.0 19 16 15 11 14 19 26 14 30 100.0 -
Unknown Total 5.0 11 5 4 3 2 4 0 4 0 - -
Notes: (a) Values in the table report the number of casualties where at least one vehicle involved was recorded as being located on/entering/leaving a layby or hard shoulder.

HA Publication PR67/14 App 188
Table T-5 Top 20 contributory factors for casualties involving hard shoulders or laybys by year
No. Contributory Factors
2005-2009 BSL
average 2005 2006 2007 2008 2009 2010 2011 2012 2013
2013 per cent change from BSL
average
2013 per cent change from
2012
1 405 Failed to look properly 102.6 100 94 113 116 90 94 110 88 84 -18.1 -4.5
2 406 Failed to judge other person’s path or speed 60.6 67 58 68 71 39 72 61 55 52 -14.2 -5.5
3 410 Loss of control 66.2 76 61 67 78 49 80 62 33 40 -39.6 21.2
4 403 Poor turn or manoeuvre 59.2 57 57 71 73 38 47 62 48 37 -37.5 -22.9
5 602 Careless, reckless or in a hurry 46.0 55 44 52 37 42 39 38 43 36 -21.7 -16.3
6 103 Slippery road (due to weather) 31.4 36 19 38 25 39 47 16 30 33 5.1 10.0
7 409 Swerved 33.2 41 29 32 34 30 40 23 12 32 -3.6 -
8 503 Fatigue 50.0 69 61 40 37 43 29 20 26 30 -40.0 15.4
9 307 Travelling too fast for conditions 27.4 22 24 36 34 21 27 9 20 22 -19.7 10.0
10 308 Following too close 18.2 17 24 26 11 13 23 17 9 22 20.9 -
11 509 Distraction in vehicle 15.8 20 17 15 12 15 12 11 10 19 20.3 -
12 408 Sudden braking 31.6 22 21 32 64 19 26 26 19 18 -43.0 -5.3
13 109 Animal or object in carriageway 5.2 10 3 3 3 7 6 4 4 15 - -
14 501 Impaired by alcohol 20.8 20 40 14 8 22 6 13 9 13 -37.5 -
15 710 Vehicle blind spot 6.8 16 3 5 6 4 7 8 7 11 - -
16 707 Rain, sleet, snow, or fog 14.8 18 8 16 15 17 15 8 12 9 - -
17 505 Illness or disability, mental or physical 14.2 14 11 16 19 11 20 11 16 8 - -50.0
18 306 Exceeding speed limit 11.2 9 17 14 14 2 1 8 10 7 - -
19 605 Learner or inexperienced driver/rider 10.4 14 9 10 12 7 3 9 9 5 - -
20 204 Defective steering or suspension 2.2 6 0 2 3 0 4 1 3 4 - -
Notes: (a) Values in the table report the number of casualties where at least one vehicle involved was recorded as being located on/entering/leaving a layby or hard shoulder. (b) Ranked by 2013.
Related Documents