TA No. 4756-CAM TONLE SAP LOWLAND STABILIZATION PROJECT CAMBODIA Report on Water Availability Receiver: Asian Development Bank September 2006 In cooperation with: TA No. 4756-CAM TONLE SAP LOWLAND STABILIZATION PROJECT CAMBODIA Report on Water Availability Receiver: Asian Development Bank September 2006 In cooperation with:

Welcome message from author
This document is posted to help you gain knowledge. Please leave a comment to let me know what you think about it! Share it to your friends and learn new things together.
Transcript
TA No. 4756-CAM TONLE SAP LOWLAND STABILIZATION PROJECT
CAMBODIA
Report on Water Availability
Receiver:
Asian Development Bank
September 2006
In cooperation with:
TA No. 4756-CAM TONLE SAP LOWLAND STABILIZATION PROJECT
CAMBODIA
Report on Water Availability
Receiver:
Asian Development Bank
September 2006
In cooperation with:
CONTENTS GLOSSARY IV
0 SUMMARY 1
1 INTRODUCTION 6
2 OTHER SOURCES OF INFORMATION 6
3 RIVER FLOW INFORMATION IN THE PROJECT AREA 7
3.1 Sources of data and data analysis 7 3.2 Long-term trends in river flow 13 3.3 Seasonal patterns in river flow 13 3.4 Volumetric water availability 15 3.5 Specific discharges 17 3.6 Flood flows 22 4 INUNDATION AROUND GREAT LAKE 25
4.1 Significance for water availability 25 4.2 Sources of data on lake levels 25 4.3 Long-term pattern of lake level 26 4.4 Seasonal pattern of lake level 26 5 RAINFALL INFORMATION IN THE PROJECT AREA 27
5.1 Sources of data and data analysis 27 5.2 Long-term trends in Rainfall 33 5.3 Geographical patterns in rainfall 35 5.4 Seasonal rainfall distribution 42 5.5 Number of raindays 43 5.6 Annual maximum one-day rainfall 45 6 EVAPORATION 45
6.1 Significance for water availability 45 6.2 Seasonal variations in evaporation 46 6.3 Relationship between evaporation and rainfall 48 7 ONSET OF RAIN AND LENGTH OF DRY SPELLS 51
8 GROUNDWATER 55
9 WATER USE 58
10 OVERVIEW OF WATER AVAILABILITY 59
ANNEX 1. TOTAL MONTHLY VOLUMETRIC DISCHARGES 62
ii

ANNEX 2. SPECIFIC MONTHLY VOLUMETRIC DISCHARGES 80
ANNEX 3. ANNUAL MAXIMUM DAILY DISCHARGES 100
ANNEX 4. MEAN MONTHLY AND ANNUAL RAINFALLS 104
ANNEX 5. MEAN MONTHLY AND ANNUAL RAINDAYS 108
ANNEX 6. ANNUAL MAXIMUM ONE-DAY RAINFALLS 112
ANNEX 7. EVAPORATION ESTIMATES 116
ANNEX 8. SELECTED INFORMATION SOURCES 122
ANNEX 9. RIVER BASIN MAPS 126
iii

G L O S S A R Y ADB Asian Development Bank AEI Annual Exceedance Interval ARI Annual Recurrence Interval BCM Billion cubic metres DoH&RW Department of Hydrology and River Works, MOWRAM DoM Department of Meteorology, MOWRAM HYMOS Database management system in use at DoH&RW MAF Mean annual flood MCM Million cubic metres MOWRAM Ministry of Water Resources and Meteorology MRC Mekong River Commission TSLS (P) Tonle Sap Lowland Stabilisation (Project)
iv

0 S U M M A R Y
The purpose of this report is to summarise the available information on water resources in the sub-basins of the Tonle Sap basin. It considers:
River flows – totals, specific discharges, and annual maxima Lake levels, Tonle Sap Great Lake Rainfall – totals, raindays, annual maxima, onset of rain at the start
of the wet season, incidence of dry spells Evapotranspiration and related meteorological variables
Sources of information The principal source of data has been the HYMOS database maintained by the Department of Hydrology & River Works (DoH&RW), MOWRAM. This database contains daily water level observations for over forty monitoring stations around the Great Lake, and daily rainfall observations for over eighty raingauges. An initial step in the work was to prepare two complementary MOWRAM data reports: River flow monitoring stations, Tonle Sap basin and Rainfall monitoring stations, Tonle Sap basin. Other relevant reports have been surveyed. The Northwest Irrigation Sector Project already has provided valuable compilations, and the four river basin and water use studies that are ongoing (September 2006) will provide a sound basis for project selection and design in the basins concerned. The MRC project “Consolidation of hydro-meteorological data and multi-functional roles of Tonle Sap Lake and its vicinities, Phase III” and associated MRC projects also are of relevance, although they provide basin-scale information that is not directly applicable to sub-project design. River flows Hydrological data for 23 river monitoring stations from the DoH&RW database have been analysed. The stations tend to be on the largest rivers, and the data are representative of the distinctive hydrological conditions in the river basins concerned. The data should be of particular relevance to any sub-projects that would draw water from those rivers, but may not be readily extended to other sub-basins. Long-term observations at two stations reveal no significant trends in mean annual flows, but do indicate very substantial variation about the long-term mean – almost a five-fold range for the Stung Sangke at Battambang. Flows are highly seasonal, with low or even zero flows during the dry season (December to May), rising quickly to a peak in the wet season, in September-October. In any one month, there is generally a wide range in mean monthly flow from year to year – from 0.8 m3/s to 44 m3/s during June in Stung Mongkol Borey, for example. The data show graphically that run-of-river flows in Cambodia are quite unreliable, as a basis for confident and economical resource development. Computations of volumetric water availability (in million cubic metres per month or year) show the large volumes of water that flow to the Tonle Sap Great Lake, but again there is great inter-annual variability. Most of the “four years out of five” annual flow volumes are 60-80% of the mean annual volumes for each station. However, flow volumes at the beginning of the
1
wet season, when reliable access to water is most important for farmers, are a small proportion of the annual total (flow volume in June generally is around 5% of total annual volume) and more variable (the “four year out of five” volume in June is in the range of 5-70% of the average for June). Again, then, run-of-river flows do not provide a reliable basis for agriculture, particularly at the start of the wet season. Specific discharges (discharge per unit area of river basin) have been calculated, to remove the effect of drainage area and make data for rivers more comparable. Nevertheless, there are large differences among rivers, because their basins differ in many other respects – geology and soils, vegetation cover, rainfall gradients associated with elevation and proximity to the sea, basin slope, etc. In principal, such factors can be considered in a statistical analysis, but this would be a significant research project that is difficult to justify for present purposes. For project selection and design, the specific discharge data can best be used by transferring data from nearby basins and/or basins that are judged to have similar characteristics. Data for flood flows have been extracted from the HYMOS database, principally in the form of maximum annual flood peaks. Unfortunately, many rating curves are not sufficiently reliable to estimate flood peaks with confidence. For most stations, particularly those with contributing drainage areas greater than 4,000 km2, the discharge-frequency plots indicate that flood peaks with an Annual Recurrence Interval greater than about 2 years are under-estimated. Estimates of Mean Annual Flood indicate that the “Halcrow” equations are crudely acceptable for basin areas <3,000 km2, but the Halcrow Report’s insistence that design work must be based on supplementary local information is strongly supported. Inundation around the Great Lake Seasonal inundation around the Tonle Sap Great Lake is significant for possible sub-projects that would involve temporary storage of flood waters for subsequent release for supplementary irrigation of recession rice. The long-term record of lake levels at Kompong Luong shows that the maximum lake level reached each year is highly variable – a range of almost three meters, with the average maximum level of 11.66 m above sea level. Rainfall Rainfall data are available for over 80 stations, but many have records of less than a handful of years, and less than ten stations have more than 30 years of record (in all cases very discontinuous, with many gaps). Mean annual rainfalls are generally in the range 1,000mm to 1,700 mm. There is a clear pattern of declining rainfall towards the northwest. Stations northwest of the lake have annual totals less than 1,200 mm, declining to below 1,000 mm at the Thai border. To the west and southwest of the lake, towards Pailin, annual totals are in the range 1,200-1,350 mm. Annual totals around the eastern end of the lake are in the range 1,250-1,700 mm, and then appear to decline again further towards the southeast. Northeast of the lake, annual totals are in the range 1,350-1,550 mm. Isohyets have not been drawn because the variability in the data is considered to be too great. In practice, a rainfall estimate at a particular location would best be obtained by inspection of the data for the nearest stations, rather than by reference to an isohyetal map.
2
The “reliable“ annual rainfall that is received at least four in five years on average also has been calculated for each station. Totals are, of course, less than the mean annual totals, and the geographical pattern is somewhat different. Westwards from the lake, “four in five year“ totals decline from about 1,200 mm to around 1,000 mm at Pailin and 900 mm towards the Thai border. At the eastern end of the lake there is a zone with totals of 1,200-1,400 mm; elsewhere, totals are in the range 1,000-1,200 mm, with a possible rain-shadow area to the southwest of Pursat. Again, it is unrealistic to draw isohyets, and anyone needing data for design at a particular location should consult the data for nearby stations. The seasonal rainfall distribution is broadly similar for all stations in the Project area. There is negligible rainfall in December to February, with a rapid increase in March to May. Monthly totals during the core of the wet season, June to October, vary widely, presumably in response to the convectional rainfall that brings unpredictable heavy downpours that cover small areas. For example, June totals at Battambang range from 42 mm to 276 mm – a very unreliable basis for confident agriculture. The number of raindays in each month also shows substantial variability from year to year, particularly during June to October. The largest number of raindays is a very respectable 163 days per year, at Taing Krasaing (Kompong Thom). Mean annual maximum daily rainfalls are in the range 75-100 mm; the “one in ten year” maximum daily rainfall is in the range 110-180 mm; and the “100 year” maximum daily rainfall is approximately 230 mm (estimated for Kompong Chhnang station). Evapotranspiration Evaporation data (measured pan evaporation and estimates of evaporation using the Penman equation) are available for several stations in the Project area. Once again, there is an obvious seasonal cycle, with the highest mean monthly evaporation rates measured in March (averaging 150-220 mm at the various stations), as temperatures are increasing but cloud cover and rainfall have not yet started to increase with the onset of the wet season. The lowest rates are observed in September-October, in the range 50-140 mm per month). Once again, there is substantial year-to-year variability in evaporation rates – at Battambang the mean daily evaporation rate during May ranged from 2.5 mm/day to 6.5 mm/day, for example. Combining the seasonal cycles of rainfall and evaporation, evaporation in general exceeds rainfall during December to April/May. Because of the great inter-annual variability of both rainfall and evaporation, the exact time at which rainfall starts to exceed evaporation at the beginning of the wet season is also highly variable, again introducing great uncertainty for farmers wishing to prepare the ground and plant crops. Onset of rain and length of dry spells The date of the first significant rain (>5 mm) of the wet season generally is in the second half of March, but can be as late as mid-May. However, this date can range, from year to year, over a period of 2 ½ months. The incidence of dry spells (periods with no daily rainfall >0.5 mm) within the wet season also is very variable. Median values generally are 10-15 days, but can be as high as 64 days (at Kompong Chhnang). The “five year dry spell” is about three weeks, except at Siem Reap, where it is five weeks.
3
Once again, this aspect of the Project area’s hydrology shows the great uncertainty that farmers have with regard to water availability at the beginning of the wet season. Groundwater There is limited information on groundwater availability in the TSLSP area, with substantive information principally available for Kompong Chhnang province. The survey of Kompong Chhnang concluded, overall, that “Alluvial and Pleistocene aquifers yield small amounts and inferior water quality, high in iron and salinity. Arsenic is locally contained. Basement rock aquifer has greater yield and good water quality. Exploration is difficult.” The NWISP hydrogeologist was more positive in his assessment of groundwater potential, although he also commented that “deep groundwater is of widespread availability but only occasionally of sufficient yield to be useful for agriculture.” He emphasizes (as did the Kompong Chhnang study) the need for a substantial survey of groundwater availability before development proceeds. For TSLSP purposes, it may be concluded that the available information is not sufficient to establish whether the groundwater resource at a particular location would be sufficient to support agricultural development. In these circumstances, reliance on groundwater for sub-projects (other than for household purposes or water-efficient irrigation of high value crops) would be risky. Water use Consumptive water use is an important component of the water balance in a river basin/aquifer, particularly during critical times of year (i.e. the beginning of the wet season) when demand is greatest and availability is most unpredictable. There are no data on water use in the TSLSP area, but this will be remedied when the four river basin studies being carried out under the NWISP are completed, by the end of 2006. A recent inventory of irrigation systems on the southern side of the Great Lake (to be released in late 2006) also should provide an indication of agricultural use. It will provide information on locations and command areas, and estimation of water use should be possible if estimates of crop water use and seepage are made. It is understood that the inventory will be extended to other sub-basins in the Tonle Sap basin. Overview of water availability The final section of the report draws eight main conclusions that summarise preceding analysis. The underlying emphasis is on the variability and unpredictability of the climate and hydrology of the Tonle Sap basin, as a basis for confident and cost-effective project design. An important conclusion is that, because of this inherent variability, long records of high quality data are required to estimate hydro-meteorological statistics. Few stations presently have adequate lengths of record, and the quality of existing data generally is poor. A sustained programme of hydro-meteorological data collection, to international standards, is essential. The analysis shows that water availability is not a factor that controls whether or not a potential sub-project can be considered, but does influence what type of project is possible. A variety of approaches to water management can be used, in addition to supplementary irrigation using run-of-river abstraction, to make the most effective use of the available water in the Project area.
4

5

1 I N T R O D U C T I O N The purpose of this report is to summarise the available information on water resources in the sub-basins of the Tonle Sap basin. The focus is on those elements of the hydrological cycle that are of particular relevance to planning and designing water management for agriculture, as a component of the Tonle Sap Lowland Stabilisation Project. In particular, it considers:
River flows – totals, specific discharges, and annual maxima Lake levels, Tonle Sap Great Lake Rainfall – totals, raindays, annual maxima, onset of rain at the start
of the wet season, incidence of dry spells Evapotranspiration and related meteorological variables
The principal source of data has been the HYMOS database maintained by the Department of Hydrology & River Works (DoH&RW), MOWRAM. This database contains daily water level observations for over forty monitoring stations around the Great Lake, and daily rainfall observations for over eighty raingauges. This source was chosen because it contains by far the most comprehensive and easily used archive that is available. An initial step in the work was to prepare two complementary data reports, which synthesise and present available data in tabular and graphical form, as appropriate. They have been released as MOWRAM reports:
River flow monitoring stations, Tonle Sap basin. Department of Hydrology & River Works, MOWRAM (August 2006), and
Rainfall monitoring stations, Tonle Sap basin. Department of Meteorology, MOWRAM (August, 2006).
Data processing was carried out principally by the TSLS Water Resources Planner and Mr Preap Sameng of DoH&RW. Data presentation and subsequent analysis were largely the responsibility of the Water Resources Planner. The active support of the Director of DoH&RW and the very effective engagement of his staff are gratefully acknowledged. Rainfall records were checked and supplemented by staff of the Department of Meteorology, and the assistance of the Director of Meteorology and her staff is gratefully acknowledged.
2 O T H E R S O U R C E S O F I N F O R M A T I O N
Data extracted from the DoH&RW database were supplemented by data extracted from consultancy reports, particularly for meteorological variables. A number of projects have assembled information of relevance to the Tonle Sap Lowland Stabilisation Project, and/or present the results of some hydrological analyses, particularly of flood flows. Some key reports are listed and briefly described in Annex 8. The Northwest Irrigation Sector Project already has provided valuable compilations of hydro-meteorological data (NWISP, 2003, 2006c). Its current (2006) phase will add substantially to information on the water resources of the Tonle Sap basin, via the river basin and water use studies
6

being carried out in the Dauntry-Svay Donkeo, Boribo-Thlea Maam-Srang, Mongkol Borei, and Svay Chek river basins (NWISP, 2006a and 2006b). It is anticipated that the outputs from these four studies, which will be available by December 2006, will provide a sound basis for project selection and design in the basins concerned and, to some extent, in neighbouring basins. The e-Atlas compiled under ADB TA 4427-CAM (Establishment of Tonle Sap Basin Management Organisation) deserves particular mention. It provides a fine overview of the hydrology of the Tonle Sap basin, presenting a variety of maps (including a map of the locations of irrigation systems), as well as river discharge hydrographs and simple hydrological statistics. It provides a broad overview of the basin, so the e-Atlas does not provide data usable for sub-project design, but it is valuable for orientation. The hydrographs presented by the e-Atlas were computed for 1998-2003 in the main sub-basins of the Tonle Sap, as part of the Mekong River Commission (MRC) project “Consolidation of hydro-meteorological data and multi-functional roles of Tonle Sap Lake and its vicinities, Phase III” (MRC, 2004). The project used the same data contained in the DoH&RW HYMOS database, and the Final Report comments on rating curves and data quality, as well as presenting five-year hydrographs (reproduced in the e-Atlas). The project is expressly a “basin-wide” study, and its outputs are not directly usable for TSLS Project sub-project selection and design. Further analysis is required to provide data that are more directly applicable for selection and design purposes. An associated major study of the Mekong-Tonle Sap system that also presents basin-scale information (including annual water balances for the Tonle Sap basin) is the MRC-WUP-JICA (2004) “study on hydro-meteorological monitoring for water quantity rules in Mekong River basin”.
3 R I V E R F L O W I N F O R M A T I O N I N T H E P R O J E C T A R E A
3 . 1 S o u r c e s o f d a t a a n d d a t a a n a l y s i s
MOWRAM and its predecessors have collected information on lake levels and river flows since at least 1924. However, no monitoring stations have operated continuously, and a basin-wide monitoring programme has been established only since about 1994. The original data, mostly in the form of daily observations, are held on the HYMOS database that is managed by the Department of Hydrology & River Works (DoH&RW). Hydrological data for the project area have been assembled by a number of consultancies (Annex 8), notably the “Halcrow Report“ (Halcrow, 1994) and the Final Report of the Northwest Irrigation Sector Project (NWISP, 2003). However, they are of restricted value for present purposes, because they use short or incomplete records, or do not present the data in a usable form. The decision was made to thoroughly process the data held on the
7

HYMOS database, taking advantage of the considerable amount of data that have been archived in recent years. The Director of H&RW has given free access to the database, and his staff have worked closely with the TSLSP consultant. A MOWRAM report, River flow monitoring stations, Tonle Sap Basin, has been prepared as a companion to this one, and is a joint output of MOWRAM and the TSLSP. It provides the “raw material“ that is analysed and reported upon herein. River flow data for twenty three stations have been analysed (Table 1; stations in bold type). These include the stations for which discharge data have been filed on the HYMOS database, or for which stage-discharge rating curves1 are available. These enable discharges to be calculated from water level observations. There are other monitoring stations in the basin, for which water level observations have been made, but rating curves have not been filed on the HYMOS database, and therefore discharge cannot be calculated. It should be emphasised that only limited checking of data quality was possible, and there are many possible sources of inaccuracy. This is particularly the case with regard to rating curves, which have not been maintained continuously. The MOWRAM Report presents data primarily in the form of monthly summaries, which should minimise the effects of data inaccuracy at high and low discharges. However, it is probable that computed discharges, particularly in wet-season months, are under-estimates. A future task for the DoH&RW is to carry out a full quality appraisal of the database, and make corrections where possible. River basin boundaries have been digitized by the Project’s GIS Specialist (Annex 9). This has enabled basin areas to be up-dated in Table 1. The river flow stations, particularly those with the longest and most reliable records, tend to be on the largest rivers, for the obvious reason that these provide the greatest potential for development of the water resource. These data for large rivers are representative of the rivers themselves, and of the more or less distinctive hydrological characteristics of their drainage basins2. They should be of particular assistance for planning sub-projects that would draw water from those rivers, but may be of less relevance to sub-projects away from the main rivers. Data for smaller rivers that are located wholly on the lowland area are concentrated in the Pursat basin. Again, therefore, the data might not be readily extended to other basins, for predictive purposes. Discharges at many of the monitoring stations, particularly in the lower reaches of the rivers towards the Great Lake, are affected by abstraction of water further upstream. Measured discharges therefore are less than those that would naturally occur. This effect is greatest when natural flows are lowest, during December through to June. To “normalise“ flows to account for this is a major exercise which is beyond the resources of the Project. 1 A stage-discharge rating curve is a relationship between a series of measurements of
water level (or stage) and discharge (or flow). It is usually presented in the form of a graph, with a mathematical equation calculated to best fit the data. HYMOS provides various options for calculating curves, and applying the curves to a set of water level observations.
2 The major tributaries of the Tonle Sap Great Lake rise in the mountain ranges encircling the Tonle Sap basin, where rainfall may be three or four times greater (but is not measured), and vegetation cover, geology and land surface topography are completely different from the lowlands.
8

9

10
Table 1. Water level and discharge measurement stations. (Stations used in this report are in bold-face).
Period of record Area (km2) Location ID Name River Water level Discharge (MRC) (TSLSP) ID Lat Long Coor_X Coor_Y
20103 Kampong Chhnang Tonle Sap 24-72, 81-86, 88, 94-02 Lake level 20103 12.268 104.682 465810 1355934 20108 Snoc Trou Tonle Sap 62-63 Lake level 20108 12.522 104.448 440434 1383975
201107 Bac Prea Tributary Great Lake 62-63, 99-00 Lake level 201107 13.313 103.403 327465 1472023 520101 Mongkol Borey Mongkol Borey 62-63, 97-04 62-63, 97-04 4,170 4,324 520101 13.544 103.019 286072 1497802 530101 Sisophon Sisophon 62-63, 97-04 62-63, 97-04 4,310 530101 13.583 102.979 281734 1502235 540101 Kralanh Sreng 62-63, 98-05 62-63, 98-05 8,175 7,127 540101 13.544 103.543 342760 1497446 550101 Treng Sangker 63-72, 99-03 63-72, 99-03 2,135 2,225 550101 12.872 103.135 298075 1423398 550102 Battambang Sangker 62-3, 72-3, 81-8, 97-05 62-3, 72-3, 81-8, 97-05 3,230 3,194 550102 13.102 103.200 305290 1448764 550103 Sre Ponleu Sangker 64-6 64-6 566 550103 12.735 102.773 258582 1408534 551101 Mong Russey Dauntry 01-03 01-03 833 1,214 551101 12.768 103.453 332454 1411688 560101 Bot Chhvear/UNTAC Siem Reap 99-04 99-04 670 701 560101 13.366 103.862 377241 1477580 560102 Prasat Keo Siem Reap 99-04 99-04 178 560102 13.449 103.970 388938 1486707 570101 Kompong Kdei Chikreng 62-3, 97-05 62-3, 97-05 1,920 1,901 570101 13.127 104.339 428778 1450955 580101 Pursat Pursat 62-3, 72-4 62-3 4,480 4,495 580101 12.523 103.914 382449 1384336 580102 Taing Leach Pursat 65-9 65-9 2,080 2,011 580102 12.290 103.605 348668 1358715 580103 Bac Trakoun Pursat 95-97, 01-05 95-97, 01-05 4,245 580103 12.380 103.756 365176 1368532 580104 Khum Viel Pursat 95-7, 99-03 95-7, 99-03 4,596 580104 12.561 103.935 384709 1388489 580105 Lo Lok Sar Pursat 94-7, 02 387 580105 12.508 103.908 381808 1382666 580106 Phum Kos Pursat 94-7 580106 12.217 103.760 365503 1350513 580110 Kbal Hong (up) Pursat 94-7, 02 580110 12.548 103.921 383195 1387043 580120 Kbal Hong (down) Pursat 95, 99-02 580120 12.550 103.923 383367 1387307 580201 Peam Tributary of Pursat 01-05 01-05 243 580201 12.154 103.698 358720 1343659 580301 Prey Klong (down) Tributary of Pursat 94-7, 01-05 94-7, 01-05 421 580301 12.074 103.859 376266 1334706 580302 Prey Klong (up) Pursat 94-7 580302 11.987 103.988 390281 1324947 580310 Sanlong (up) Pursat 95-7 580310 12.758 103.813 371572 1410350 580320 Sanlong (down) Pursat 95-7 580320 12.721 103.816 371915 1406206 580330 Svay At Pursat 94-7 580330 12.675 103.823 372569 1401123 581101 Campang Dauntry 95-7 581101 12.666 103.870 377762 1400147

11
Period of record Area (km2) Location ID Name River Water level Discharge (MRC) (TSLSP) ID Lat Long Coor_X Coor_Y
581102 Svay Don Keo Tributary of Pursat 62-3, 65-97, 01-05 62-3, 65-97, 01-05 805 581102 12.673 103.640 352788 1401028 581210 Kroch Seuch (up) Dauntry 94-6 581210 12.716 103.900 381043 1405619 581220 Kroch Seuch (down) Dauntry 95-7 581220 12.732 103.932 384512 1407407 581310 Wat Liep (down) Pursat 95-7 581310 12.698 103.749 364558 1403730 581410 Wat Liep (up) Pursat 95-7 581410 12.688 103.737 363311 1402609 583010 Tlea Maam (1) Pursat 94-7 583010 12.571 104.208 414372 1389452 583020 Tlea Maam (up) Tributary of Pursat 94-6 94-6 322 583020 12.526 103.994 391083 1384565 583101 Banteay Krang Krakor 94-7 138 583101 12.502 104.207 414213 1381888 590101 Boribo Boribo 98-05 98-05 869 803 590101 12.348 104.380 433016 1364795 600101 Kompong Chen Staung 62-3, 97-05 62-3, 97-05 1,895 2,096 600101 12.937 104.583 455190 1429887 610101 Kompong Thom Sen 61-70, 81-03 61-70, 81-03 13,670 13,278 610101 12.715 104.886 488039 1405265 610102 Kompong Putrea Sen 65-9, 99-04 65-9, 99-04 9,080 11,137 610102 13.217 105.261 528731 1460817 610103 Panha Chi Sen 00-02 610103 12.718 104.971 497292 1405656 620101 Kompong Thmar Chinit 62-3, 97-03 62-3, 97-03 4,130 4,393 620101 12.501 105.131 514655 1381639 640104 Srok Sandan Sen 02 2,053 640104 12.858 105.068 507797 1421146
Note: Two figures are given for drainage basin area: that listed on the Mekong River Commission web-site (MRC), and an area calculated from drainage basin boundaries digitized in August 2006 by the GIS Specialist of Tonle Sap Lowland Stabilisation Project (TSLSP). The latter is considered to be more accurate. Note: the location coordinates listed have been calculated by the GIS Specialist of Tonle Sap Lowland Stabilisation Project (TSLSP), in consultation with the Director of DoH&RW to identify the correct position of the stations. Many of the coordinates listed on the Mekong River Commission web-site are incorrect.

12
3 . 2 L o n g - t e r m t r e n d s i n r i v e r f l o w
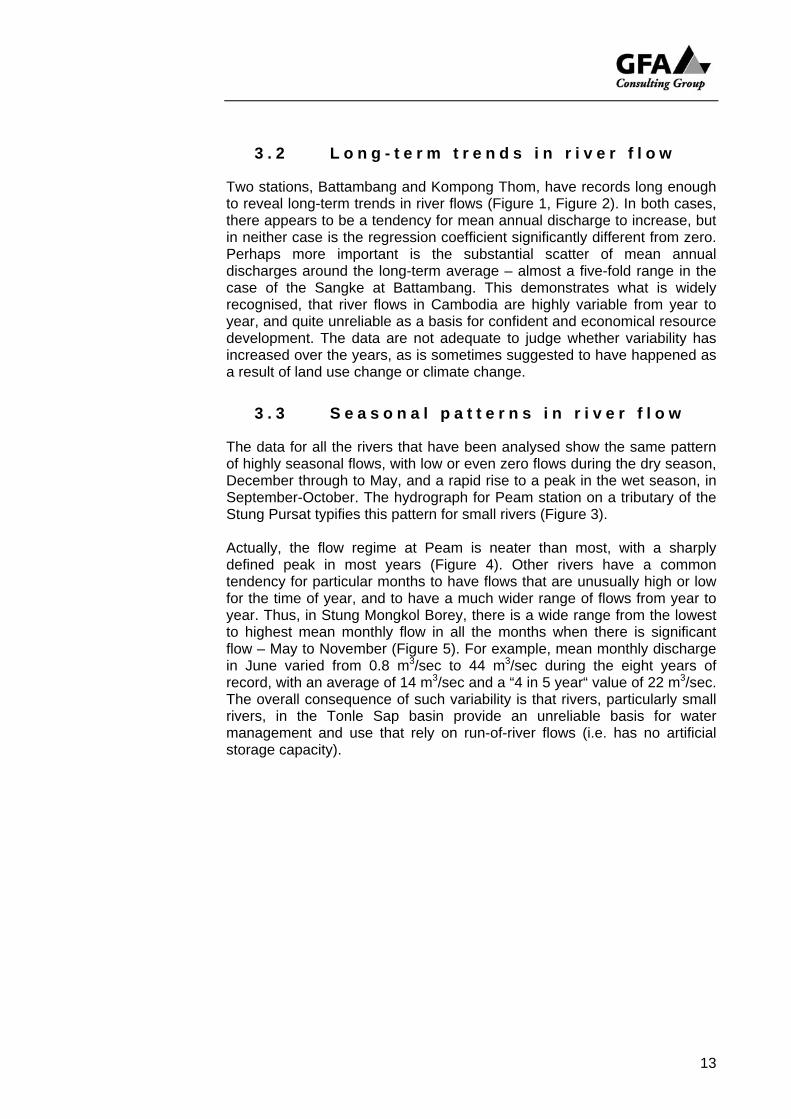
Two stations, Battambang and Kompong Thom, have records long enough to reveal long-term trends in river flows (Figure 1, Figure 2). In both cases, there appears to be a tendency for mean annual discharge to increase, but in neither case is the regression coefficient significantly different from zero. Perhaps more important is the substantial scatter of mean annual discharges around the long-term average – almost a five-fold range in the case of the Sangke at Battambang. This demonstrates what is widely recognised, that river flows in Cambodia are highly variable from year to year, and quite unreliable as a basis for confident and economical resource development. The data are not adequate to judge whether variability has increased over the years, as is sometimes suggested to have happened as a result of land use change or climate change.
3 . 3 S e a s o n a l p a t t e r n s i n r i v e r f l o w
The data for all the rivers that have been analysed show the same pattern of highly seasonal flows, with low or even zero flows during the dry season, December through to May, and a rapid rise to a peak in the wet season, in September-October. The hydrograph for Peam station on a tributary of the Stung Pursat typifies this pattern for small rivers (Figure 3). Actually, the flow regime at Peam is neater than most, with a sharply defined peak in most years (Figure 4). Other rivers have a common tendency for particular months to have flows that are unusually high or low for the time of year, and to have a much wider range of flows from year to year. Thus, in Stung Mongkol Borey, there is a wide range from the lowest to highest mean monthly flow in all the months when there is significant flow – May to November (Figure 5). For example, mean monthly discharge in June varied from 0.8 m3/sec to 44 m3/sec during the eight years of record, with an average of 14 m3/sec and a “4 in 5 year“ value of 22 m3/sec. The overall consequence of such variability is that rivers, particularly small rivers, in the Tonle Sap basin provide an unreliable basis for water management and use that rely on run-of-river flows (i.e. has no artificial storage capacity).
13

Figure 1. Mean annual discharge, Stung Sangke at Battambang.
Stung Sangke at Battambang
y = 0.2888x + 109.69R2 = 0.0098
0
20
40
60
80
100
120
140
160
180
200
0 5 10 15 20 25 30 35 40 45 50Year from 1961
Mea
n m
onth
ly d
isch
arge
, Aug
-Nov
(m
Figure 2. Mean annual discharge, Stung Sen at Kompong Thom.
Sen at Kompong Thom, mean annual discharge
y = 0.913x + 172.45R2 = 0.0673
0
50
100
150
200
250
300
350
0 5 10 15 20 25 30 35 40 45 50
Years from 1961
Dis
char
ge (m
3/se
Figure 3. Hydrograph for Peam station (tributary of Stung Pursat).
14

Figure 4. Mean monthly discharges, Peam station, 2001-2005.
Tributary of Pursat River at Peam
0
20
40
60
80
100
120
JAN FEB MAR APR MAY JUN JUL AUG SEP OCT NOV DEC
Mea
n m
onth
ly d
isch
arge
(m3/
s)
20012002200320042005MEAN
Figure 5. Monthly flow regime for Stung Mongkol Borey.
Mongkol Borey at Mongkol Borey
0
10
20
30
40
50
60
70
80
90
JAN FEB MAR APR MAY JUN JUL AUG SEP OCT NOV DEC
Mea
n m
onth
ly d
isch
arge
(m3/
s)
MAXMIN20 PERCENTILE80 PERCENTILEMEAN
3 . 4 V o l u m e t r i c w a t e r a v a i l a b i l i t y
The study by Carbonnel and Guiscafré (1963?), Grand Lac du Cambodge, Sedimentologie et Hydrologie 1962-63, presented data on total inflows into the Great Lake during a single water year. A total of over 24 BCM (billion cubic metres) was estimated, 85% entering the lake during the four months July-October 1962 (Figure 6). This study is significant because it measured inflows from all major tributaries to the lake. However, it used data for only one year, so it cannot be relied upon to give more than a picture of the hydrologic regime of the Tonle Sap Great Lake.
15
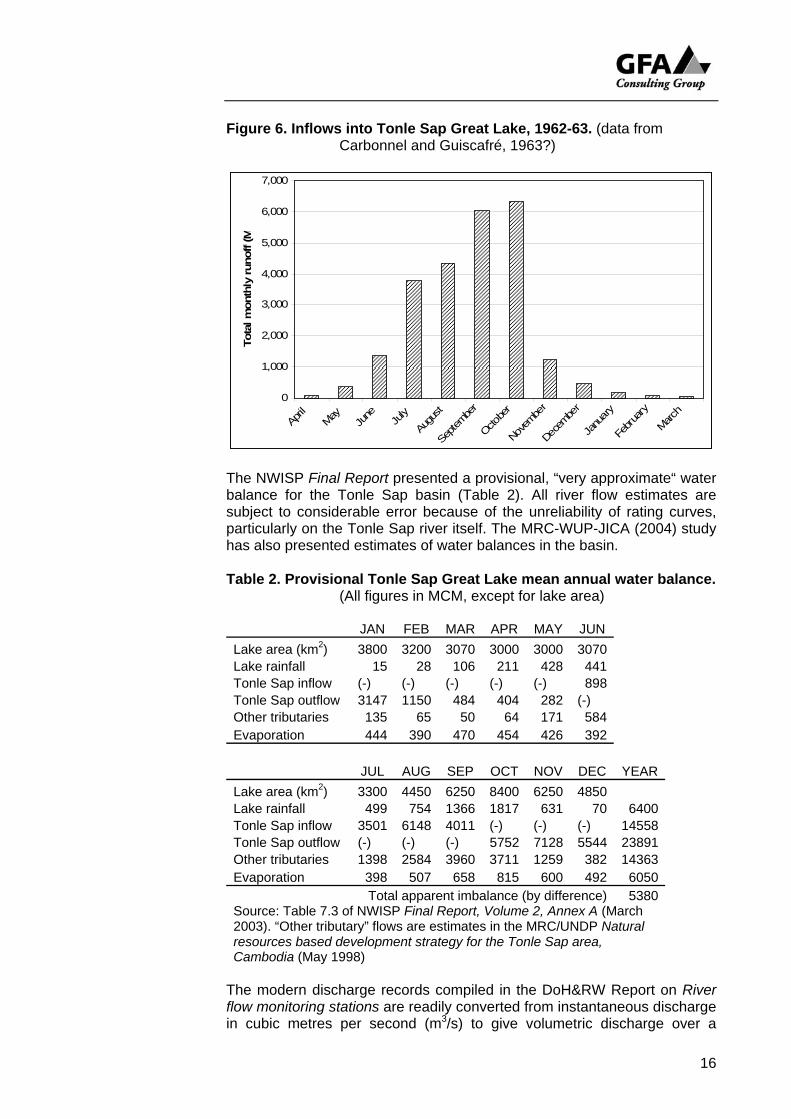
Figure 6. Inflows into Tonle Sap Great Lake, 1962-63. (data from Carbonnel and Guiscafré, 1963?)
0
1,000
2,000
3,000
4,000
5,000
6,000
7,000
April
MayJu
ne July
Augu
st
Septe
mber
Octobe
r
Nove
mber
Dece
mber
Janu
ary
Febru
ary
March
Tota
l mon
thly
runo
ff (M
The NWISP Final Report presented a provisional, “very approximate“ water balance for the Tonle Sap basin (Table 2). All river flow estimates are subject to considerable error because of the unreliability of rating curves, particularly on the Tonle Sap river itself. The MRC-WUP-JICA (2004) study has also presented estimates of water balances in the basin. Table 2. Provisional Tonle Sap Great Lake mean annual water balance.
(All figures in MCM, except for lake area)
JAN FEB MAR APR MAY JUN Lake area (km2) 3800 3200 3070 3000 3000 3070 Lake rainfall 15 28 106 211 428 441 Tonle Sap inflow (-) (-) (-) (-) (-) 898 Tonle Sap outflow 3147 1150 484 404 282 (-) Other tributaries 135 65 50 64 171 584 Evaporation 444 390 470 454 426 392
JUL AUG SEP OCT NOV DEC YEAR Lake area (km2) 3300 4450 6250 8400 6250 4850 Lake rainfall 499 754 1366 1817 631 70 6400Tonle Sap inflow 3501 6148 4011 (-) (-) (-) 14558Tonle Sap outflow (-) (-) (-) 5752 7128 5544 23891Other tributaries 1398 2584 3960 3711 1259 382 14363Evaporation 398 507 658 815 600 492 6050
Total apparent imbalance (by difference) 5380Source: Table 7.3 of NWISP Final Report, Volume 2, Annex A (March 2003). “Other tributary” flows are estimates in the MRC/UNDP Natural resources based development strategy for the Tonle Sap area, Cambodia (May 1998)
The modern discharge records compiled in the DoH&RW Report on River flow monitoring stations are readily converted from instantaneous discharge in cubic metres per second (m3/s) to give volumetric discharge over a
16

month or a year, in million cubic metres (MCM). Summary statistics for annual volumetric discharge are presented in Table 3, and the monthly calculations are presented in Annex 13. The MEAN values (Table 3) show the large volumes of water that on average flow to the Tonle Sap Great Lake each year, and in principle would be available for filling storage. However, the MAX and MIN values confirm that there is great inter-annual variability. Most of the 20 PERCENTILE values (the annual volumetric discharge exceeded 4 years in 5 on average) are in the range 60-80% of the MEAN values for each station. The volume and reliability of water available at the beginning of the wet season, when many farmers are establishing their crops, is of greater significance than annual volume (Table 4). Volumetric discharges in June are only about 5% of the total annual volumes. Further, June discharges are even more variable than annual discharges; 20 PERCENTILE values are in the range 5-70% of the MEAN values. In other words, the volume of water that is available in June, at the beginning of the planting season, is both comparatively small and highly variable from year to year.
3 . 5 S p e c i f i c d i s c h a r g e s
Specific discharge – discharge per unit area, commonly presented in litres/second per square kilometre (l/s/km2) – is an important hydrological parameter because it removes the effect of drainage area on river flow and makes data from different rivers more comparable. The 1962-3 data of Carbonnel and Guiscafré indicate a basin-wide average annual specific discharge of 11.4 l/s/km2, with figures of 12-20 l/s/km2 for the large rivers flowing from the high-rainfall mountains encircling the Tonle Sap basin. Again, the monthly pattern is of more practical significance than annual figures (Table 5, Figure 7). The modern discharge records show the marked seasonal differences in specific discharge that would be expected from the earlier discussion. They also show substantial differences between rivers. Most obvious is the high specific discharges of the Stung Sangke, with its headwaters in the Cardamom Mountains receiving heavy rainfall during the Southwest Monsoon. On the other hand, Stung Chikreng and Stung Sreng, draining from the lower country to the north of the Great Lake, have rather low specific discharges year-round. A seeming anomaly is Stung Mongkol Borey, next to the Sangke but with mean monthly specific discharges only a tenth as great. The presence of limestone in the headwaters, the lower topography, and the more inland location of the basin, in a low-rainfall area, are explanations. On the other hand, the Peam tributary of Stung Pursat has unusually high specific discharges. This river drains from an area of forested hill country in the higher rainfall part of Pursat province. Overall, Figure 7 indicates some difficulty in using even specific discharges to extrapolate from rivers for which there are data to others for which there are not. There are large differences in hydrologic regime, and even though these can be explained qualitatively by differences in drainage basin characteristics, there are insufficient data to permit an analysis that could be confidently applied.
3 It is probable that, owing to the unreliability of rating curves at high stages, the discharges
presented in the Annex and in Table 3 and Table 4 are under-estimates.
17
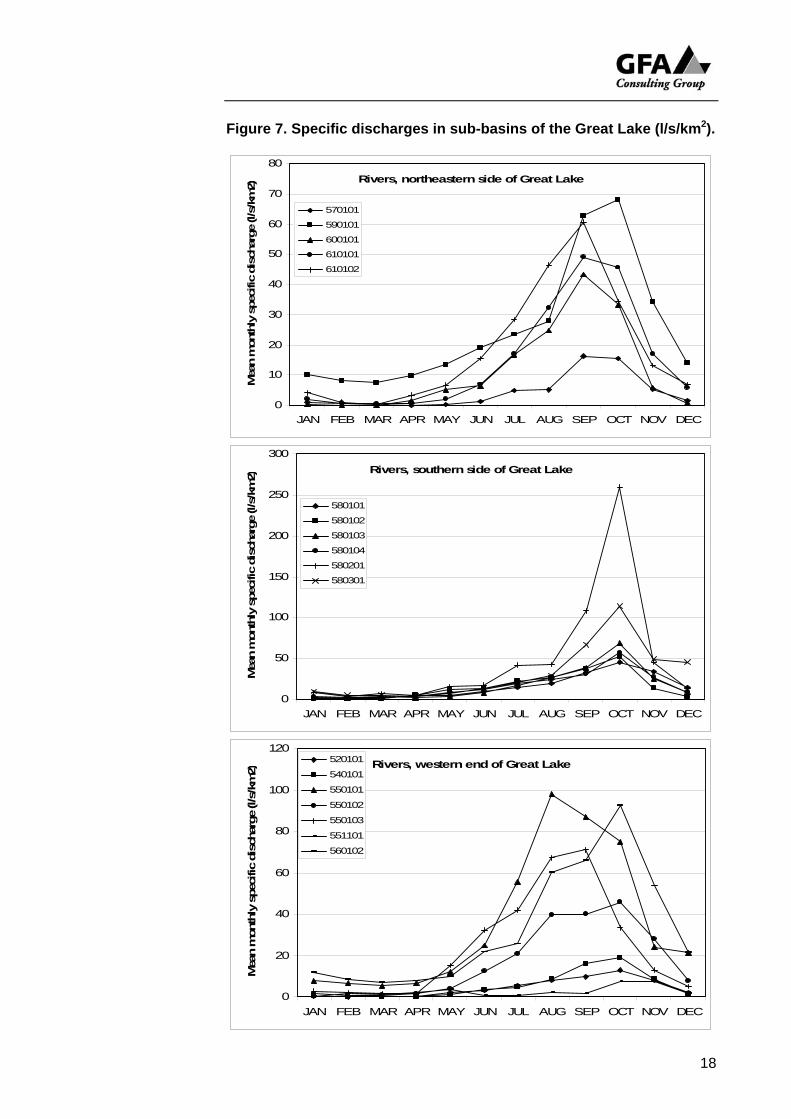
Figure 7. Specific discharges in sub-basins of the Great Lake (l/s/km2).
18
Rivers, northeastern side of Great Lake
0
10
20
30
40
50
60
70
80
Mea
n m
onth
ly s
peci
fic d
isch
arge
(l/s
/km
2
JAN FEB MAR APR MAY JUN JUL AUG SEP OCT NOV DEC
)
570101
590101
600101
610101
610102
Rivers, southern side of Great Lake
0
50
100
150
200
250
300
JAN FEB MAR APR MAY JUN JUL AUG SEP OCT NOV DEC
Mea
n m
onth
ly s
peci
fic d
isch
arge
(l/s
/km
2)
580101
580102
580103
580104
580201
580301
Rivers, we
0
20
40
60
80
100
120
JAN FEB MAR APR MAY JUN JUL AUG SEP OCT NOV DEC
Mea
n m
onth
ly s
peci
fic d
isch
arge
(l/s
/km
2)
560102
551101
550103
550102
550101
540101
520101 stern end of Great Lake

Table 3. Summary statistics for annual volumetric discharges (MCM)
Mongkol
Borey Sisophon Sreng Sangke Sangke Sangke Siem
Reap Siem Reap
Chikreng Pursat
520101 530101 540101 550101 550102 550103 560101 560102 570101 580102 MEAN 577.96 460.32 1033.88 2288.2 1859.43 755.71 202.46 175.97 145.57 983.67MAX 960.90 1470.21 3227.1 2632.63 245.03 221.70 1561.98MIN 211.61 611.17 1275.9 1241.26 63.70 44.47 602.6520 PERCENTILE 435.51 803.41 1485.0 1505.65 139.89 68.43 680.1180 PERCENTILE 787.01 1262.83 2995.0 2153.22 244.28 213.88 1202.22
Pursat Pursat Pursat tributary
Pursat tributary
Pursat tributary
Boribo Staung Sen Sen Chinit
580103 580104 580201 580301 581102 590101 600101 610101 610102 620101 MEAN 2218.95 3076.02 383.08 447.13 300.93 640.05 401.98 6094.2 5250.4 1838.97MAX 3757.20 4621.60 635.45 956.49 362.98 889.00 568.59 9476.9 7859.7 2338.71MIN 1155.48 1951.13 206.88 234.63 215.08 438.35 306.21 3258.9 3219.2 1438.0420 PERCENTILE 1647.63 2133.54 242.07 262.06 475.06 316.18 4763.5 3851.2 1558.8980 PERCENTILE 2695.32 3934.37 508.86 432.67 819.49 473.61 7190.5 6961.6 2099.29
19

Table 4. Summary statistics for June volumetric discharges (MCM)
Mongkol
Borey Sisophon Sreng Sangke Sangke Sangke Siem
Reap Siem Reap
Chikreng Pursat Dauntry
520101 530101 540101 550101 550102 550103 560101 560102 570101 580102 551101 MEAN 36.38 16.98 63.64 147.4 99.96 83.28 11.44 10.11 6.05 68.12 2.02MAX 114.23 58.01 246.58 424.3 287.38 21.00 26.41 24.24 153.01 MIN 2.05 1.37 2.05 17.2 15.71 3.16 1.92 0.16 18.53 20 PERCENTILE 3.43 1.45 3.30 62.7 33.03 7.52 3.89 0.33 29.71 80 PERCENTILE 57.34 30.27 121.70 249.2 143.07 14.84 18.48 10.56 109.36
Pursat Pursat Pursat tributary
Pursat tributary
Pursat tributary
Boribo Staung Sen Sen Chinit Pursat tributary
580103 580104 580201 580301 581102 590101 600101 610101 610102 620101 583020 MEAN 87.52 159.50 9.55 14.63 26.10 39.72 35.03 243.2 448.5 129.33 7.37MAX 313.24 317.21 13.71 52.88 59.10 125.53 135.17 720.9 1156.0 314.72 MIN 25.17 30.12 3.03 3.89 1.48 8.63 0.52 39.4 98.3 19.31 20 PERCENTILE 26.80 44.72 6.60 7.12 8.02 17.94 4.73 88.3 183.3 67.52 80 PERCENTILE 101.19 276.20 12.34 12.63 52.55 46.12 43.53 396.1 668.4 211.75
20

21
Table 5. Mean monthly specific discharges (l/s/km2)
Station Area (km2) JAN FEB MAR APR MAY JUN JUL AUG SEP OCT NOV DEC
520101 Mongkol Borey 4,324 0.36 0.18 0.23 0.58 2.11 3.25 5.27 8.09 9.63 12.89 8.18 2.01540101 Sreng 7,127 0.34 0.17 0.13 0.18 0.99 3.44 4.80 8.70 15.98 19.10 8.45 1.43550101 Sangke 2,225 7.63 6.66 5.49 6.46 11.87 24.66 55.37 97.86 86.82 75.11 23.99 21.29550102 Sangke 3,194 1.50 0.69 0.85 1.38 4.04 12.59 21.16 39.48 39.81 45.78 28.03 7.83550103 Sangke 566 4.61 3.55 2.84 2.73 26.54 56.77 73.78 118.76 125.64 58.86 22.78 9.06551101 Dauntry 1,214 0.22 1.38 1.24 2.08 3.38 0.64 0.63 2.31 1.73 7.24 7.20 1.48560102 Siem Reap 178 11.82 8.74 7.05 7.81 9.68 21.70 25.51 60.02 65.96 92.25 53.43 21.36570101 Chikreng 1,901 0.92 0.40 0.18 0.07 0.38 1.23 4.98 5.19 16.26 15.43 5.38 1.56580101 Pursat 4,495 2.35 1.14 0.70 4.45 5.25 9.30 14.88 19.08 33.25 44.93 33.29 14.88580102 Pursat 2,011 0.94 0.51 0.85 4.84 11.61 13.07 21.83 25.93 37.64 52.37 13.15 3.22580103 Pursat 4,245 3.02 1.94 2.95 1.91 3.78 7.87 17.54 26.60 38.32 68.91 25.37 8.55580104 Pursat 4,596 2.58 1.54 1.62 3.90 8.33 12.35 19.61 24.01 30.56 56.86 27.23 8.71580201 Peam tributary 243 7.99 2.81 6.61 4.93 15.42 17.84 41.47 42.69 108.11 259.40 45.53 13.60580301 Prey Klong tributary 421 9.73 4.92 5.17 4.27 6.60 13.41 20.27 28.70 66.87 114.24 49.41 45.80590101 Boribo 803 10.00 8.33 7.44 9.84 13.49 19.08 23.49 27.88 62.78 68.22 34.39 13.96600101 Staung 2,096 0.19 0.11 0.10 1.48 5.22 6.45 16.80 24.66 43.32 33.17 6.00 0.87610101 Sen 13,278 2.10 0.75 0.46 0.73 2.11 7.06 16.95 32.24 48.99 45.65 17.08 5.96610102 Sen 11,137 4.05 0.93 0.25 3.38 6.76 15.54 28.33 46.52 60.59 34.27 13.12 6.93620101 Chinit 4,393 5.33 2.88 2.83 2.89 5.59 11.36 18.84 25.81 34.48 44.05 16.55 7.54

3 . 6 F l o o d f l o w s
Flood flows are principally of concern when structures are being designed that have a high capital cost or whose failure could adversely affect downstream populations and/or assets. There have been several efforts to estimate flood flows in sub-basins of the Tonle Sap, notably Stung Chinit. The procedure for estimating flood flows that was developed for the Irrigation Rehabilitation Study in Cambodia (Halcrow, 1994) has been widely quoted and used. It is summarised by a set of equations which relate mean annual flood (MAF, that is, the average of the series of annual maximum flows at a station) to basin area (AREA), and relate the 10-year and 100-year floods Q10 and Q100 to the MAF: MAF = AREA0.9; Q10 = 1.53.MAF; Q100 = 2.2.MAF The Halcrow report emphasises that this approach, which relies on minimal Cambodian data and relationships for river basins in Thailand and Malaysia, provides only a rough estimate of flood flows. It must be supported by local records or memories of flood water levels to obtain estimates suitable for design purposes. The streamflow data compiled in the DoH&RW Report on River flow monitoring stations are not sufficiently reliable, even now, to make confident estimates of flood flows. Many rating curves do not extend to high stages and discharges, and significant extrapolation beyond the measured range is necessary. Several stations show signs of being affected by loss of flow to distributaries or overbank (annual high water levels tend to be about the same, suggesting that water is overflowing from the channel). Furthermore, particularly for stations in the lower reaches of the rivers, the water level measurement stations are affected by backwater from the Great Lake, so that discharge calculations are inaccurate4. Subject to the preceding qualifications, annual maximum daily discharges have been extracted from the hydrographs presented in the DoH&RW Report (Annex 3). The annual series for each station has been plotted also as an annual exceedance series (Figure 8, Figure 9). The nearly flat curves of several stations above an ARI of about 2 years indicate the effects of truncation of peak flows by HYMOS at stage heights greater than the range of the rating curve, overbank or distributary flow, or backwater effects. Few of the stations appear to be usable for analysis of extreme events, without a great deal of work on the rating curves, additional research into historical flood levels, estimation of overbank and distributary flows, etc.
4 The studies reported in Mekong River Commission (2004) and MRC-WUP-JICA (2004)
use the same data archived in the DoH&RW HYMOS database to develop rating curves and compute discharges. The present writer considers that some of the extrapolations and assumptions required are questionable, given the nature of the original data. Estimates of high flows can be quite inaccurate, as a result of extrapolation of rating curves beyond the measured range.
22
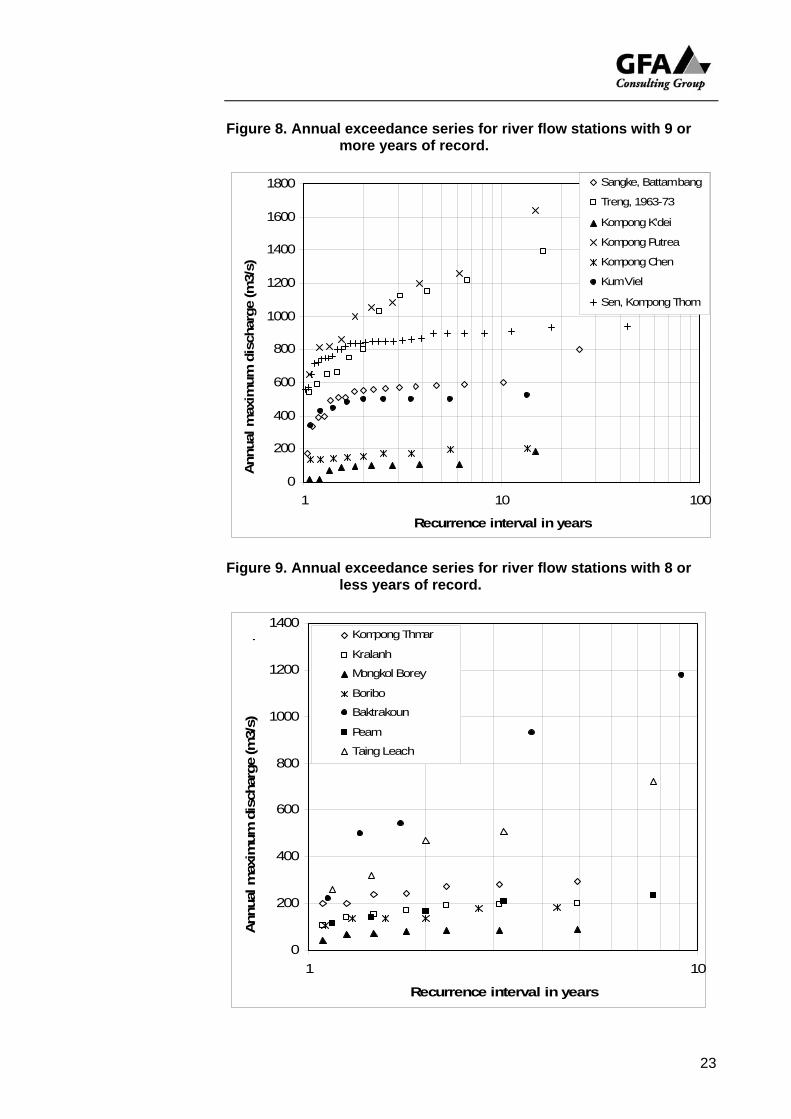
Figure 8. Annual exceedance series for river flow stations with 9 or more years of record.
0
200
400
600
800
1000
1200
1400
1600
1800
1 10
Recurrence interval in years
Annu
al m
axim
um d
isch
arge
(m3/
s)
100
Sangke, Battam bang
Treng, 1963-73
Kompong K'dei
Kompong Putrea
Kompong Chen
Kum Viel
Sen, Kompong Thom
Figure 9. Annual exceedance series for river flow stations with 8 or
less years of record.
0
200
400
600
800
1000
1200
1400
1 1
Recurrence interval in years
Ann
ual m
axim
um d
isch
arge
(m3/
s)
0
. Kompong Thmar
Kralanh
Mongkol Borey
Boribo
Baktrakoun
Peam
Taing Leach
23

The Mean Annual Flood (Q2.33, with an ARI = 2.33 years) has been extracted from the tables in Annex 3, to compare with the Halcrow (1994) equation mentioned above (Table 6, Figure 10). Some of the points scatter around the “Halcrow“ line MAF = Area0.9, but those for stations with basin areas >4,000 km2 lie well off to the right. This is indicative of the problems mentioned above with regard to rating curves, overbank flow, backwater effects etc. Of course, there are at least two “populations“ of stations in the Tonle Sap basin, the principal ones being the large sub-basins that drain from the encircling mountains, and the smaller sub-basins that drain mainly from the lowlands around the lake. These populations of basins can be expected to have quite different hydrological characteristics. Table 6. Estimates of Mean Annual Flood from Annex 3.
ID Name River Area (km2)
Area (km2) from GIS
MAF (m3/s)
520101 Mongkol Borey Mongkol Borey 4,170 4,324 84 530101 Sisophon Sisophon 4,310 540101 Kralanh Sreng 8,175 7,127 190 550101 Treng Sangker 2,135 2,225 980 550102 Battambang Sangker 3,230 3,194 550 550103 Sre Ponleu Sangker 566 551101 Mong Russey Dauntry 833 1,214 560101 Bot
Chhvear/UNTAC Siem Reap 670 701
560102 Prasat Keo Siem Reap 178 55 570101 Kompong Kdei Chikreng 1,920 1,901 103 580101 Pursat Pursat 4,480 4,495 580102 Taing Leach Pursat 2,080 2,011 485 580103 Bac Trakoun Pursat 4,245 850 580104 Khum Viel Pursat 4,596 500 580201 Peam Tributary of Pursat 243 177 580301 Prey Klong (down) Tributary of Pursat 421 137 581102 Svay Don Keo Tributary of Pursat 805 583020 Tlea Maam (up) Tributary of Pursat 322 590101 Boribo Boribo 869 803 160 600101 Kompong Chen Staung 1,895 2,096 166 610101 Kompong Thom Sen 13,670 13,278 850 610102 Kompong Putrea Sen 9,080 11,137 1,050 620101 Kompong Thmar Chinit 4,130 4,393 275
Note: the basin areas computed by the TSLSP GIS specialist have been used in subsequent analysis.
24

Figure 10. Mean annual floods (Q2.33) as a function of basin area. The Halcrow (1994) equation is marked.
0
200
400
600
800
1000
1200
1400
0 2,000 4,000 6,000 8,000 10,000 12,000 14,000
Basin area (km2) .
Mea
n an
nual
floo
d (m
3/s)
4 I N U N D A T I O N A R O U N D G R E A T L A K E
4 . 1 S i g n i f i c a n c e f o r w a t e r a v a i l a b i l i t y
Many communities on the Mekong-Tonle Sap floodplain use the “recession rice cultivation” method, in which they progressively plant rice as flood waters recede. Supplementary irrigation is enabled by the construction of barrages which are submerged during the annual flood, and which impound water as river/lake water levels fall. This impounded water then can be used as required to supply additional water to crops planted downslope from the barrage. The opportunity to use this approach reliably is controlled by the frequency with which flood waters reach particular elevations and locations around the Great Lake. Local communities undoubtedly know the areas that have been inundated in the past, but may not be able to quantify the frequency with which inundation occurs. To justify, for example, the construction or rehabilitation of a barrage for the purpose of supplementary irrigation of recession crops, some confidence is needed that the barrage will be refilled with an acceptable frequency.
4 . 2 S o u r c e s o f d a t a o n l a k e l e v e l s
Several stations provide data on water levels in the Tonle Sap Great Lake, but Kompong Luong, near Kompong Chhnang, provides the longest record, spanning the period 1924-2005. The dataset retrieved from the DoH&RW HYMOS database indicates that there was a step change in datum in 1961, with average water level since 1961 being 2.47 m below that before 1961. To use the full record, post-1961 values have been increased by 2.47 m.
25

4 . 3 L o n g - t e r m p a t t e r n o f l a k e l e v e l
In spite of the adjustment for a change in datum noted above, there appears to be a weak long-term downward trend in lake level. This is particularly so for annual maximum level, for which there is a statistically significant decline of 16.5 mm/year, principally since the 1950s (Figure 11). If this apparent trend is real, it presumably would reflect reduced inflow to the lake from the Mekong and/or the Tonle Sap drainage basin, resulting from lower Mekong and/or Tonle Sap tributary flows, constriction of the Tonle Sap channel/delta, reduced overbank flows across the inundated areas between the Mekong and Tonle Sap, or changes to the local base level set by the river level at Chaktomuk. The maximum lake level cannot decline indefinitely, because it is ultimately fixed by the seasonal rise and fall of river level at Chaktomuk, and there is no reason to expect that maximum levels there will decline in the future.
4 . 4 S e a s o n a l p a t t e r n o f l a k e l e v e l
Tonle Sap Great Lake has a regular annual cycle, in response to seasonal variations in inflow from the Tonle Sap river basin itself and from the Mekong River. There is a great deal of variation from year to year, and water level on a particular day of the year may differ by as much as 4 m between years (Figure 12). For present purposes, maximum lake level in each year is of greatest interest. On average, maximum lake level reaches 11.66 m above sea level, but has ranged from 10.05 m to 12.99 m (Table 7). The 80 percentile maximum level (reached 4 years in 5) is 11.13 m. This means that there is 80% confidence that lake level will reach the 11.13 m contour in a given year. A barrage to retain flood waters would need to have a crest level below this (less a few centimetres for water to flow over the barrage), to ensure that it is inundated with acceptable frequency (assumed here to be four years in five). Figure 11. Long-term trend in water level, Kompong Luong.
Kompong Loung (post-1962 data adjusted by 2.48 m for datum change)
R2 = 0.1344
R2 = 0.0929
R2 = 0.0727
0
2
4
6
8
10
12
14
Yea
r
1925
1927
1929
1931
1933
1935
1937
1939
1941
1943
1945
1947
1949
1951
1953
1955
1957
1959
1961
1963
1965
1997
1999
2001
2003
Wat
er le
vel (
m a
.s
MINIMUMMAXIMUMAVERAGE
26
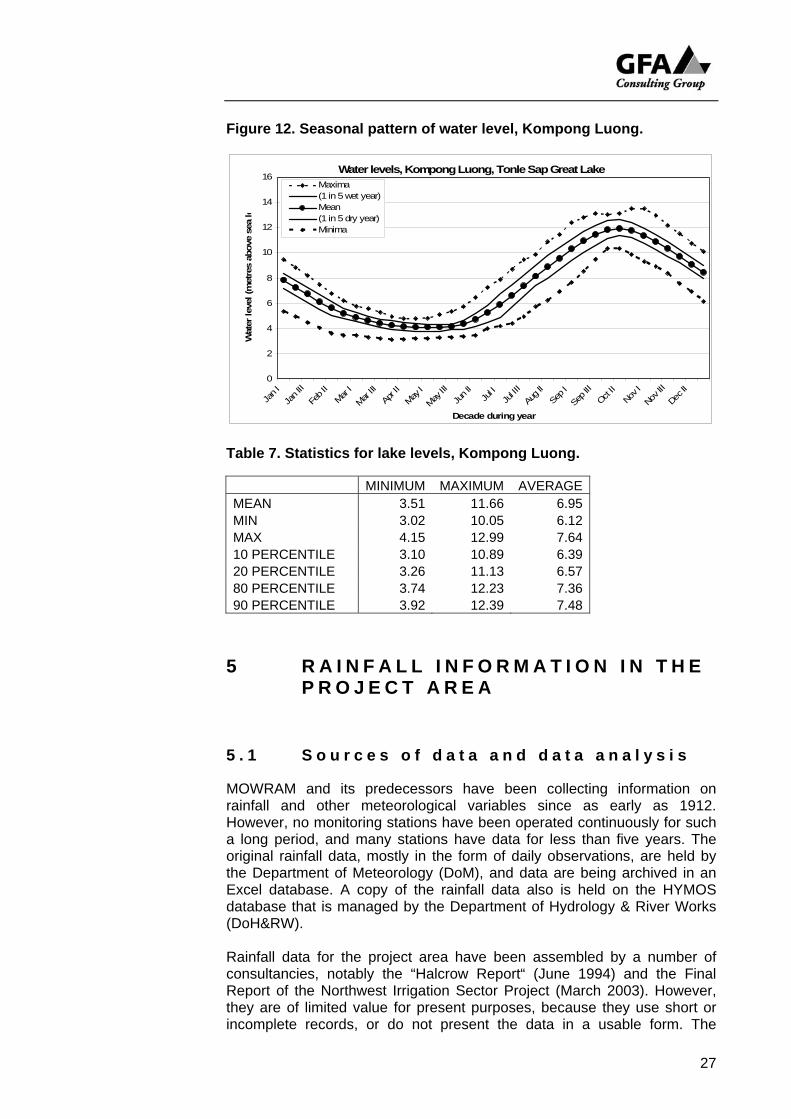
Figure 12. Seasonal pattern of water level, Kompong Luong.
Water levels, Kompong Luong, Tonle Sap Great Lake
0
2
4
6
8
10
12
14
16
Jan I
Jan I
II
Feb I
IMar
I
Mar III
Apr II
May I
May III
Jun I
IJu
l IJu
l III
Aug I
ISe
p I
Sep I
IIOct
IINo
v I
Nov I
II
Dec I
I
Decade during year
Wat
er le
vel (
met
res
abov
e se
a le
Maxima(1 in 5 wet year)Mean(1 in 5 dry year)Minima
Table 7. Statistics for lake levels, Kompong Luong.
MINIMUM MAXIMUM AVERAGE MEAN 3.51 11.66 6.95 MIN 3.02 10.05 6.12 MAX 4.15 12.99 7.64 10 PERCENTILE 3.10 10.89 6.39 20 PERCENTILE 3.26 11.13 6.57 80 PERCENTILE 3.74 12.23 7.36 90 PERCENTILE 3.92 12.39 7.48
5 R A I N F A L L I N F O R M A T I O N I N T H E P R O J E C T A R E A
5 . 1 S o u r c e s o f d a t a a n d d a t a a n a l y s i s
MOWRAM and its predecessors have been collecting information on rainfall and other meteorological variables since as early as 1912. However, no monitoring stations have been operated continuously for such a long period, and many stations have data for less than five years. The original rainfall data, mostly in the form of daily observations, are held by the Department of Meteorology (DoM), and data are being archived in an Excel database. A copy of the rainfall data also is held on the HYMOS database that is managed by the Department of Hydrology & River Works (DoH&RW). Rainfall data for the project area have been assembled by a number of consultancies, notably the “Halcrow Report“ (June 1994) and the Final Report of the Northwest Irrigation Sector Project (March 2003). However, they are of limited value for present purposes, because they use short or incomplete records, or do not present the data in a usable form. The
27
28
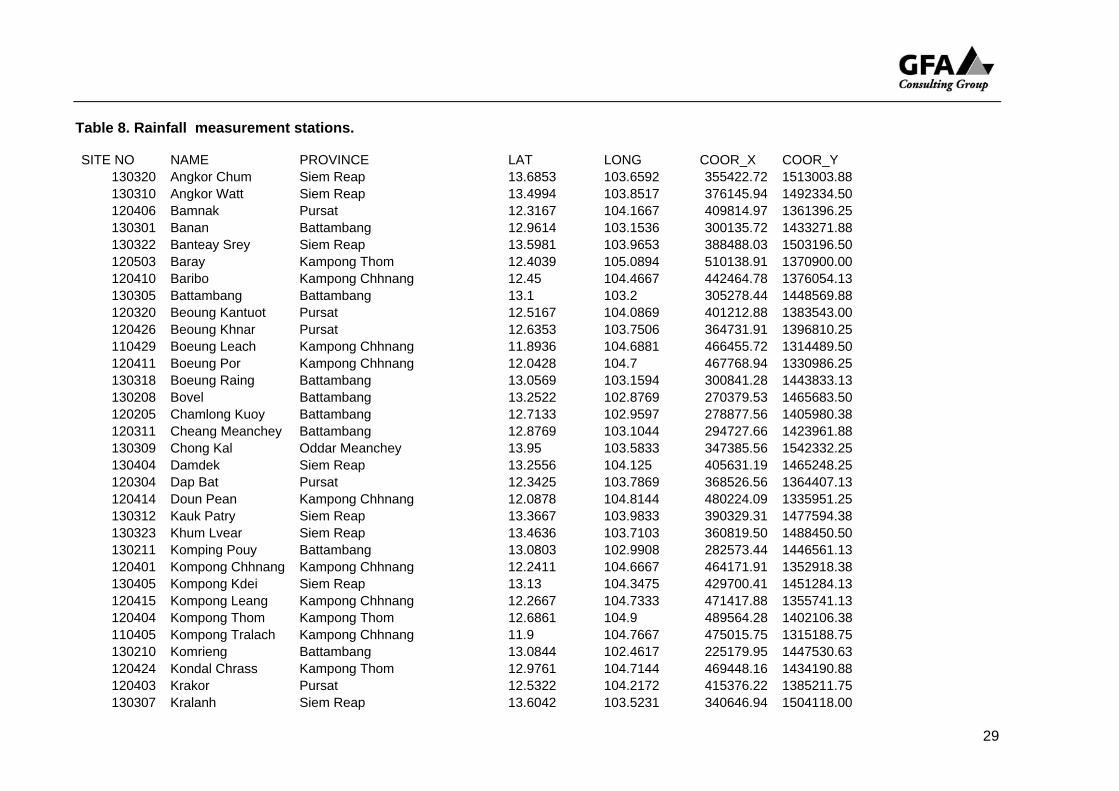
decision was made to thoroughly process the data held on the HYMOS database, taking advantage of the additional data that have been archived in recent years. The Director of H&RW has given free access to the database, and his staff have worked closely with the GFA consultant. A Department of Meteorology Report, Rainfall monitoring stations, Tonle Sap Basin, has been prepared as a companion to this one, and is a joint output of MOWRAM and the TSLSP. It provides the “raw material“ that is analysed and reported upon herein. Data for more than eighty stations have been analysed (Table 8, location map on following page). The data have been retrieved from the HYMOS database, updated for 2003-4 with data supplied by the DoM to the Mekong River Commission. Additional data for some stations were taken from spreadsheets contained in the project completion report of the Northwest Irrigation Sector Project (Final Report, Volume 2, Annex A: Climate, hydrology, hydrogeology and hydrochemistry). These data originally were sourced from the Headquarters and Provincial offices of the DoM. As discussed in the MOWRAM Report, the quality and reliability of rainfall data are suspect, particularly as a result of uncertainties with regard to “zero rainfall observed“ and “no observations made“. In preparing the MOWRAM Report, many adjustments were made to the archived data to amend months in which archived “zero rainfall observed“ was judged to be improbable, and “no observations made“ more likely. Rainfall in Cambodia varies greatly from year to year. Under these circumstances, meteorologists and hydrologists usually consider that periods of observation should be greater than 20 or even 30 years to provide confidence that data truly represent long-term conditions. Less than ten stations in the Project area have such long periods of record.
29
Table 8. Rainfall measurement stations.
SITE NO NAME PROVINCE LAT LONG COOR_X COOR_Y 130320 Angkor Chum Siem Reap 13.6853 103.6592 355422.72 1513003.88130310 Angkor Watt Siem Reap 13.4994 103.8517 376145.94 1492334.50120406 Bamnak Pursat 12.3167 104.1667 409814.97 1361396.25130301 Banan Battambang 12.9614 103.1536 300135.72 1433271.88130322 Banteay Srey Siem Reap 13.5981 103.9653 388488.03 1503196.50120503 Baray Kampong Thom 12.4039 105.0894 510138.91 1370900.00120410 Baribo Kampong Chhnang 12.45 104.4667 442464.78 1376054.13130305 Battambang Battambang 13.1 103.2 305278.44 1448569.88120320 Beoung Kantuot Pursat 12.5167 104.0869 401212.88 1383543.00120426 Beoung Khnar Pursat 12.6353 103.7506 364731.91 1396810.25110429 Boeung Leach Kampong Chhnang 11.8936 104.6881 466455.72 1314489.50120411 Boeung Por Kampong Chhnang 12.0428 104.7 467768.94 1330986.25130318 Boeung Raing Battambang 13.0569 103.1594 300841.28 1443833.13130208 Bovel Battambang 13.2522 102.8769 270379.53 1465683.50120205 Chamlong Kuoy Battambang 12.7133 102.9597 278877.56 1405980.38120311 Cheang Meanchey Battambang 12.8769 103.1044 294727.66 1423961.88130309 Chong Kal Oddar Meanchey 13.95 103.5833 347385.56 1542332.25130404 Damdek Siem Reap 13.2556 104.125 405631.19 1465248.25120304 Dap Bat Pursat 12.3425 103.7869 368526.56 1364407.13120414 Doun Pean Kampong Chhnang 12.0878 104.8144 480224.09 1335951.25130312 Kauk Patry Siem Reap 13.3667 103.9833 390329.31 1477594.38130323 Khum Lvear Siem Reap 13.4636 103.7103 360819.50 1488450.50130211 Komping Pouy Battambang 13.0803 102.9908 282573.44 1446561.13120401 Kompong Chhnang Kampong Chhnang 12.2411 104.6667 464171.91 1352918.38130405 Kompong Kdei Siem Reap 13.13 104.3475 429700.41 1451284.13120415 Kompong Leang Kampong Chhnang 12.2667 104.7333 471417.88 1355741.13120404 Kompong Thom Kampong Thom 12.6861 104.9 489564.28 1402106.38110405 Kompong Tralach Kampong Chhnang 11.9 104.7667 475015.75 1315188.75130210 Komrieng Battambang 13.0844 102.4617 225179.95 1447530.63120424 Kondal Chrass Kampong Thom 12.9761 104.7144 469448.16 1434190.88120403 Krakor Pursat 12.5322 104.2172 415376.22 1385211.75130307 Kralanh Siem Reap 13.6042 103.5231 340646.94 1504118.00

30
SITE NO NAME PROVINCE LAT LONG COOR_X COOR_Y 120419 Krang Tamoung Kampong Chhnang 12.1261 104.5739 454058.38 1340215.63120312 Kravanh Pursat 12.6747 103.6475 353555.16 1401224.00120306 Leach Pursat 12.35 103.7667 366333.53 1365246.75120303 Maung Russey Battambang 12.7706 103.45 332167.38 1411951.63130315 Mongkol Borey Banteay Meanchey 13.5367 103.0231 286478.34 1497032.75130209 O Chrov Banteay Meanchey 13.6428 102.5839 239040.67 1509202.63130304 O Taky Battambang 13.1542 103.1172 296344.41 1454632.00120202 Pailin Pailin 12.8586 102.6181 241915.36 1422376.00120313 Peam Pursat 12.2864 103.7222 361460.94 1358234.88130403 Phnom Koulen Siem Reap 13.58 104.1169 404881.69 1501130.13130324 Phnom Krom Siem Reap 13.2939 103.8172 372302.94 1469621.88130308 Phnom Srok Banteay Meanchey 13.75 103.35 322025.63 1520368.25120418 Pong Ro Kampong Chhnang 12.2744 104.5925 456106.94 1356611.75120417 Ponley Kampong Chhnang 12.4431 104.4711 442941.69 1375290.25130316 Pranet Preah Banteay Meanchey 13.6167 103.1833 303886.19 1505749.63130321 Prasat Bakong Siem Reap 13.3544 103.9908 391135.94 1476230.63120422 Prasat Balang Kampong Thom 12.9808 104.9586 495932.16 1434693.63120516 Prasat Sambo Kampong Thom 12.8856 105.0764 508710.28 1424166.88120425 Prey Pros Kampong Thom 12.7983 104.8289 481852.94 1414517.75120302 Pursat Pursat 12.55 103.9 380919.69 1387303.38120305 Raing Kesey Battambang 12.9667 103.25 310599.34 1433784.50120213 Rattanak Mondol Pailin 12.8167 102.6167 241720.06 1417740.38120416 Rolear Phear Kampong Chhnang 12.2175 104.6744 465006.03 1350307.63130212 Roung Chrey Battambang 13.2683 102.9706 280550.13 1467380.63130503 Rovieng Preah Vihear 13.35 105.1167 513058.53 1475524.75130505 Sadan Kampong Thom 13.1 105.25 527520.81 1447888.50110430 Samaki Meanchey Kampong Chhnang 11.882 104.612 458166.13 1313217.13130215 Samlot Battambang 12.6294 102.8633 268329.25 1396780.75130311 Sasar Sdam Siem Reap 13.5061 103.6169 350734.41 1493206.63120407 Sdoc Ach Romeas Kampong Chhnang 12.0667 104.5333 449629.91 1333654.38130325 Siem Reap Siem Reap 13.3667 103.85 375893.34 1477657.50130306 Siem Reap airport Siem Reap 13.4181 103.8075 371318.50 1483364.63130202 Sisophon Banteay Meanchey 13.6144 102.9703 280833.31 1505677.25130326 Srey Snam Siem Reap 13.8431 103.5231 340808.56 1530546.00120402 Staung Kampong Thom 12.9481 104.5719 453988.28 1431116.00

31
SITE NO NAME PROVINCE LAT LONG COOR_X COOR_Y 120423 Stung Chinit Kampong Thom 12.51 105.1464 516327.88 1382635.25130205 Svay Chek Banteay Meanchey 13.8033 102.9722 281214.28 1526577.88581102 Svay Donkeo Pursat 12.6747 103.6475 353555.16 1401224.00130327 Svay Leu Banteay Meanchey 13.5667 103.25 311064.72 1500164.88120517 Taing Kok Kampong Thom 12.2519 105.1294 514494.81 1354093.63120518 Taing Krasng Kampong Thom 12.5708 105.0569 506602.28 1389354.88120309 Talo Pursat 12.5186 103.6589 354704.94 1383951.63130406 Tbeng (Sdau) Battambang 12.8981 102.9772 280938.78 1426412.88130319 Thmar Kol Battambang 13.2689 103.0303 287021.03 1467395.13130317 Thmar Pouk Banteay Meanchey 13.9492 103.0514 289910.69 1542650.75120206 Treng Battambang 12.8403 102.9203 274710.72 1420066.63120420 Tuk Phos Kampong Chhnang 12.0547 104.5283 449082.94 1332328.38110414 Tuol Khpos Kampong Chhnang 11.95 104.3833 433275.53 1320781.63120301 Tuol Krous Kampong Chhnang 12.3608 104.5261 448902.97 1366177.88130313 Tuol Samraung Battambang 13.3853 103.0303 287123.13 1480274.38130328 Varin Siem Reap 13.7833 103.75 365299.47 1523791.63

32

5 . 2 L o n g - t e r m t r e n d s i n R a i n f a l l
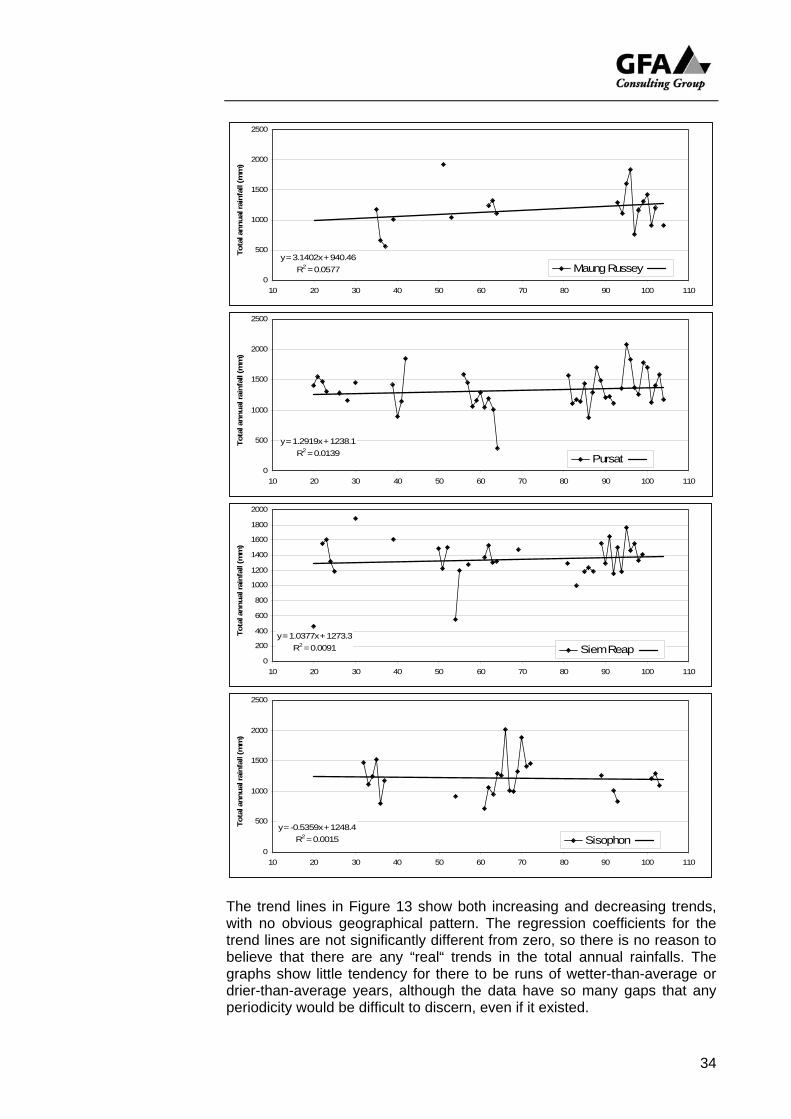
Eight stations in the Project area have rainfall records back to the 1920s and 1930s. There are many gaps in the records, but the data are sufficient to reveal any long-term trends in annual precipitation (Figure 13). Figure 13. Total annual rainfall at long-record stations.
y = -1.3814x + 1422.4R2 = 0.0267
0
200
400
600
800
1000
1200
1400
1600
1800
2000
10 20 30 40 50 60 70 80 90 100 110
Tota
l ann
ual r
ainf
all (
mm
)
Battambang
y = -2.2298x + 1822.4R2 = 0.0275
0
500
1000
1500
2000
2500
3000
10 20 30 40 50 60 70 80 90 100 110
Tota
l ann
ual r
ainf
all (
mm
)
Kompong Chhnang
y = -1.4126x + 1553.5R2 = 0.0212
0
500
1000
1500
2000
2500
10 20 30 40 50 60 70 80 90 100 110
Tota
l ann
ual r
ainf
all (
mm
)
Kompong Thom
y = -3.229x + 1725.3R2 = 0.0994
0
500
1000
1500
2000
2500
10 20 30 40 50 60 70 80 90 100 110
Tota
l ann
ual r
ainf
all (
mm
)
Krakor
33
y = 3.1402x + 940.46R2 = 0.0577
0
500
1000
1500
2000
2500
10 20 30 40 50 60 70 80 90 100 110
Tota
l ann
ual r
ainf
all (
mm
)
Maung Russey
y = 1.2919x + 1238.1R2 = 0.0139
0
500
1000
1500
2000
2500
10 20 30 40 50 60 70 80 90 100 110
Tota
l ann
ual r
ainf
all (
mm
)
Pursat
y = 1.0377x + 1273.3R2 = 0.0091
0
200
400
600
800
1000
1200
1400
1600
1800
2000
10 20 30 40 50 60 70 80 90 100 110
Tota
l ann
ual r
ainf
all (
mm
)
Siem Reap
y = -0.5359x + 1248.4R2 = 0.0015
0
500
1000
1500
2000
2500
10 20 30 40 50 60 70 80 90 100 110
Tota
l ann
ual r
ainf
all (
mm
)
Sisophon
The trend lines in Figure 13 show both increasing and decreasing trends, with no obvious geographical pattern. The regression coefficients for the trend lines are not significantly different from zero, so there is no reason to believe that there are any “real“ trends in the total annual rainfalls. The graphs show little tendency for there to be runs of wetter-than-average or drier-than-average years, although the data have so many gaps that any periodicity would be difficult to discern, even if it existed.
34

35
5 . 3 G e o g r a p h i c a l p a t t e r n s i n r a i n f a l l
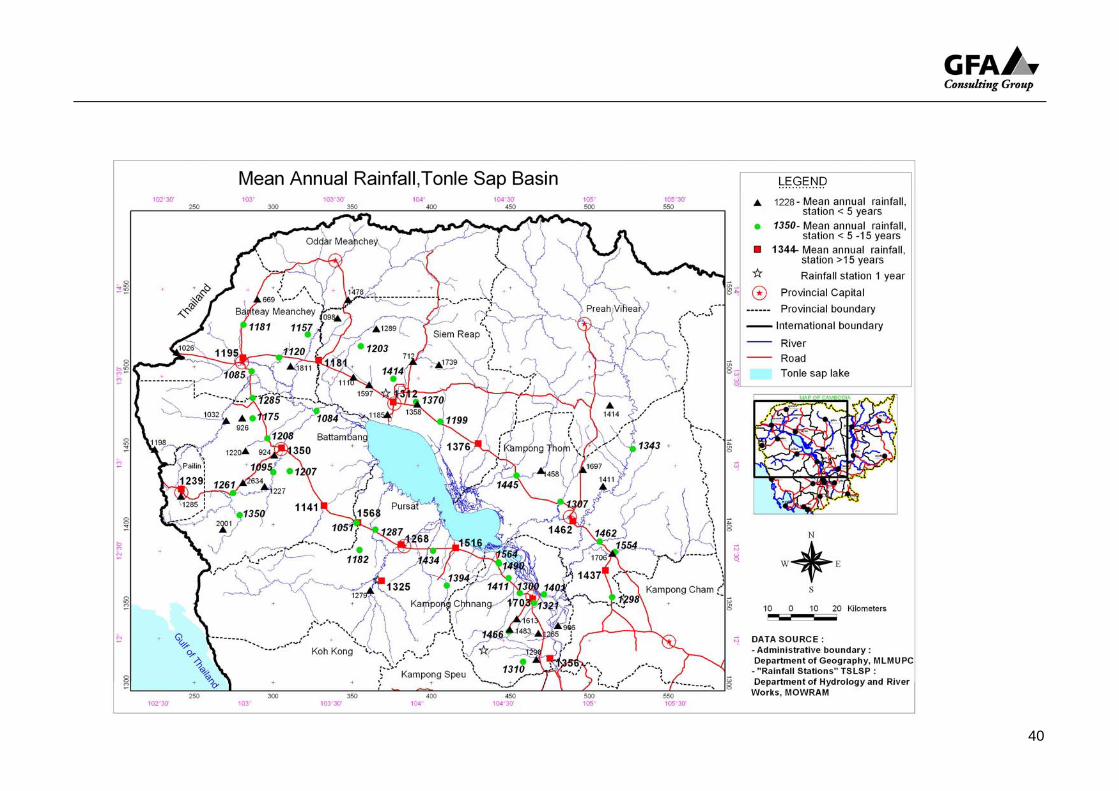
A number of more or less different maps of rainfall distribution in Cambodia have been prepared over the years. The dataset that is now available provides a more reliable basis for considering rainfall distribution in the Tonle Sap basin, although the short records and non-standard periods of record prevent computation of rainfall “normals“ for a common period. As would be expected, the correlations between annual totals at the eight long-record stations declines with their distance apart (Table 9). The short and commonly non-overlapping records of most stations in the Tonle Sap basin hinder a comprehensive analysis of all stations. “Normalisation“ to a common period does not appear to be warranted, given the weak correlations evident in Table 9. Mean annual rainfalls for all the stations in the Tonle Sap basin have been computed (Table 10); monthly data are presented in full in the Department of Meteorology report. Table 10 also shows the period of record for each station. It re-emphasises the point that most stations have lengths of record shorter than is required to estimate reliable rainfall statistics, in a climate characterised by considerable year-to-year variability (see Figure 13). In Figure 14, which shows the basin-wide distribution of mean annual rainfalls, there is a clear pattern of declining rainfall towards the northwest. Stations northwest of the lake have annual totals less than 1,200 mm, declining to below 1,000 mm at the Thai border. To the west and southwest of the lake, towards Pailin, annual totals are in the range 1,200-1,350 mm. Annual totals around the eastern end of the lake are in the range 1,250-1,700 mm, and then appear to decline again further towards the southeast. Northeast of the lake, annual totals are in the range 1,350-1,550 mm. Isohyets have not been drawn on Figure 14, because the variability in the data is considered to be too great. Furthermore, rainfall monitoring stations are concentrated around the lake, and data are not available to define (rather than guess) the presumed rainfall gradients towards the Dangrek and Cardamom mountains to the north and south. In practice, a rainfall estimate at a particular location would best be obtained by inspection of the data for the nearest stations, rather than by reference to an isohyetal map. The “reliable“ annual rainfall that is received at leat four in five years on average has been calculated for each station, using the MS-Excel Function-PERCENTILE capability (Figure 15). Totals are, of course, less than the mean annual totals (Figure 14), and the geographical pattern has changed somewhat. Westwards from the lake, “four in five year“ totals decline from about 1,200 mm to around 1,000 mm at Pailin and 900 mm towards the Thai border. At the eastern end of the lake there is a zone with totals of 1,200-1,400 mm; elsewhere, totals are in the range 1,000-1,200 mm, with a possible rain-shadow area to the southwest of Pursat. Again, it is unrealistic to draw isohyets on Figure 15, and anyone needing data for design at a particular location should consult the data for nearby stations.

Table 9. Correlations between long-record stations. (Correlation coefficients >0.5 are highlighted)
Battam bang
Kampong Chhnang
Kompong Thom
Krakor Maung Russey
Pursat Siem Reap
Sisophon
Battambang 1.00 Kampong Chhnang 0.14 1.00 Kompong Thom 0.33 0.23 1.00 Krakor 0.40 0.72 0.06 1.00 Maung Russey 0.40 0.19 0.47 0.29 1.00 Pursat 0.25 0.07 0.33 0.36 0.60 1.00 Siem Reap 0.05 0.35 -0.09 0.54 -0.10 0.26 1.00 Sisophon 0.72 0.32 0.41 0.48 0.09 0.01 0.27 1.00
36

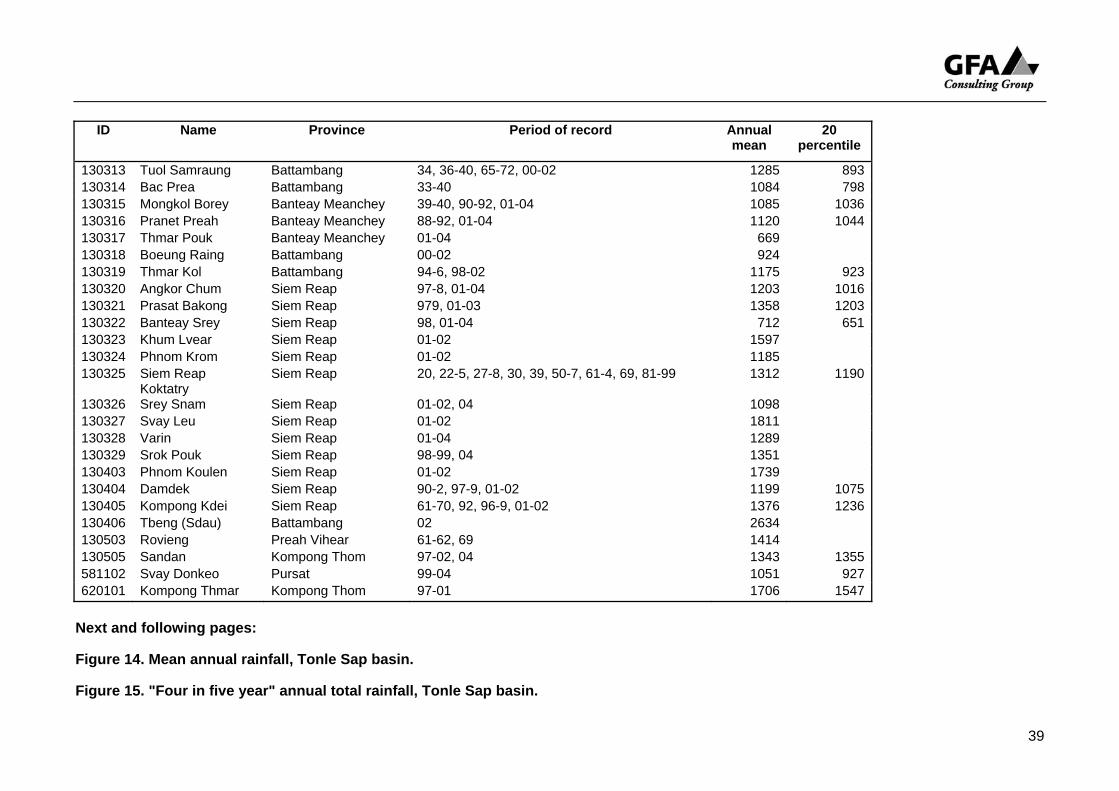
Table 10. Mean and 20-percentile ("4 in 5 year") annual total rainfalls.
ID Name Province Period of record Annual mean
20 percentile
110405 Kompong Tralach Kompong Chhnang 20-25, 27-28, 30, 61-64, 94, 96-02 1356 1152110414 Tuol Khpos Kompong Chhnang 00-01 110429 Boeung Leach Kompong Chhnang 00-04 1298 110430 Samaki Meanchey Kompong Chhnang 96-04 1310 1113120202 Pailin Battambang 60-74, 00-02 1239 1004120205 Chamlong Kuoy Battambang 61-65, 00-02 1350 1183120206 Treng Battambang 61-64, 66, 00-01 1261 1196120213 Rattanak Mondol Battambang 00-02 1285 120301 Tuol Krous Kompong Chhnang 61-65, 01-02 1411 1326120302 Pursat Pursat 12-23, 26, 28, 30, 34-5, 39-42, 52-64, 73, 81-04 1268 1133120303 Maung Russey Battambang 35-40, 51-3, 61-4, 93-02, 04 1141 914120304 Dap Bat Pursat 52-68, 00-02 1325 1122120305 Raing Kesey Battambang 39-40, 60-70 1207 1014120306 Leach Pursat 40-2, 61, 63-4 120309 Talo Pursat 62-64, 99-04 1182 910120311 Cheang Meanchey Battambang 00-02 1227 120312 Kravanh-Leach Pursat 40-42, 61, 63-64, 66, 69, 94-6, 98-04 1568 1234120313 Peam Pursat 00-02 1279 120320 Boeung Kantout Pursat 94-6, 99-04 1434 1193120401 Kompong Chhnang Kompong Chhnang 20, 22-5, 27, 29-39, 52-3, 61-74, 82-94, 96-04 1703 1389120402 Staung Kompong Thom 25, 39-41, 61-4, 97-02 1445 1210120403 Krakor Pursat 30, 39-43, 46-53, 60-72, 94-6, 99-04 1516 1295120404 Kompong Thom Kompong Thom 20, 23-5, 27-43, 54-6, 60-7, 69-70, 81-04 1462 1180120406 Bamnak Pursat 39-42, 61-4, 93, 99-04 1394 1079120407 Sdoc Ach Romeas Kompong Chhnang 61-64 1483 120410 Boribo Kompong Chhnang 61-64, 03-04 1564 120411 Boeung Por Kompong Chhnang 00-04 1265 120414 Doun Pean Kompong Chhnang 00-02 936 120415 Kompong Leang Kompong Chhnang 94, 96-04 1401 1279
37

ID Name Province Period of record Annual mean
20 percentile
120416 Rolear Phear Kompong Chhnang 94, 96-04 1321 1199120417 Ponley Kompong Chhnang 30, 94, 96-8, 01-04 1490 1328120418 Pong Ro Kompong Chhnang 00-04 1300 120419 Kraing Tamoung Kompong Chhnang 00-03 1613 120420 Tuk Phos Kompong Chhnang 94, 96-04 1466 1236120422 Prasat Balaing Kompong Thom 00-02 1697 120423 Stung Chinit Kompong Thom 97-04 1554 1464120424 Kondal Chrass Kompong Thom 00-04 1458 120425 Prey Prous Kompong Thom 97-04 1307 1191120426 Boeung Khnar Pursat 94-6, 01-04 1287 1197120503 Baray Kompong Thom 20, 22, 24-42, 52, 62-4, 97-04 1437 1100120516 Prasat Sambo Kompong Thom 00-02,04 1411 120517 Taing Kok Kompong Thom 97-04 1298 903120518 Taing Krasaing Kompong Thom 99-04 1462 1334130202 Sisophon Banteay Meanchey 32-38, 54, 61-72, 87-96, 00-03 1195 985130205 Svay Chek Banteay Meanchey 61-70, 88-04 1181 908130208 Bovel Battambang 66, 00-02 1032 130209 O Chrov Banteay Meanchey 01-03 1026 130210 Komrieng Battambang 00-02 1198 130211 Komping Pouy Battambang 00-02 1220 130212 Roung Chrey Battambang 00-02 926 130215 Samlot Battambang 00-02 2001 130301 Banan Battambang 62, 81-84, 00-02 1095 954130304 O Taky Battambang 60-64, 00-02 1208 1027130305 Battambang Battambang 20, 22-40, 51-6, 58, 60-74, 81-95, 00-02, 04 1354 1118130306 Siem Reap Airport Siem Reap 01 130307 Kralanh Siem Reap 20, 22, 24-5, 27-8, 39, 61-4, 96-04 1181 982130308 Phnom Srok Banteay Meanchey 38-40, 61-4, 67-68, 99-04 1157 965130309 Chong Kal Siem Reap 98, 00 1478 130310 Angkor Wat Siem Reap 63-69, 01-02 1414 1237130311 Sasar Sdam Siem Reap 66-68, 01-02 1110 991130312 Kauk Patry Siem Reap 81-87, 89-99 1370 1187
38
ID Name Province Period of record Annual mean
20 percentile
130313 Tuol Samraung Battambang 34, 36-40, 65-72, 00-02 1285 893130314 Bac Prea Battambang 33-40 1084 798130315 Mongkol Borey Banteay Meanchey 39-40, 90-92, 01-04 1085 1036130316 Pranet Preah Banteay Meanchey 88-92, 01-04 1120 1044130317 Thmar Pouk Banteay Meanchey 01-04 669 130318 Boeung Raing Battambang 00-02 924 130319 Thmar Kol Battambang 94-6, 98-02 1175 923130320 Angkor Chum Siem Reap 97-8, 01-04 1203 1016130321 Prasat Bakong Siem Reap 979, 01-03 1358 1203130322 Banteay Srey Siem Reap 98, 01-04 712 651130323 Khum Lvear Siem Reap 01-02 1597 130324 Phnom Krom Siem Reap 01-02 1185 130325 Siem Reap
Koktatry Siem Reap 20, 22-5, 27-8, 30, 39, 50-7, 61-4, 69, 81-99 1312 1190
130326 Srey Snam Siem Reap 01-02, 04 1098 130327 Svay Leu Siem Reap 01-02 1811 130328 Varin Siem Reap 01-04 1289 130329 Srok Pouk Siem Reap 98-99, 04 1351 130403 Phnom Koulen Siem Reap 01-02 1739 130404 Damdek Siem Reap 90-2, 97-9, 01-02 1199 1075130405 Kompong Kdei Siem Reap 61-70, 92, 96-9, 01-02 1376 1236130406 Tbeng (Sdau) Battambang 02 2634 130503 Rovieng Preah Vihear 61-62, 69 1414 130505 Sandan Kompong Thom 97-02, 04 1343 1355581102 Svay Donkeo Pursat 99-04 1051 927620101 Kompong Thmar Kompong Thom 97-01 1706 1547
Next and following pages:
Figure 14. Mean annual rainfall, Tonle Sap basin.
Figure 15. "Four in five year" annual total rainfall, Tonle Sap basin.
39
40

41

5 . 4 S e a s o n a l r a i n f a l l d i s t r i b u t i o n
The climate of the Tonle Sap basin is strongly seasonal. There is a pronounced wet season during the southwest monsoon of May-October, when moisture-laden winds blow in from the Gulf of Thailand, and a cooler dry season during the northeast monsoon of November-April, when winds are blowing from the continental interior. Rainfall during the wet season tends to be convectional, as heating of the ground surface during the day causes strong up-currents of air, the build-up of cumulo-nimbus clouds, and intense downpours of rain from these convectional cells. Rainfall during the wet season also can be associated with large scale weather systems, such as those that brought widespread heavy rainfall during August 2006. The seasonal distribution of rainfall is broadly similar for all the stations in the Tonle Sap basin (Figure 16). There is negligible rain in December to February, then a rapid increase in March through to May. It is noteworthy that monthly totals during the core of the wet season, June to October, appear to vary much more among stations than during the lower rainfall months of November to May. This, presumably, reflects the unpredictability of convectional rainfall, and the need for very long periods of record to “dampen out“ the effects of year-to-year variations in the occurrence of heavy rainfall events. Figure 16. Mean monthly rainfall totals for stations with >15 years
record.
0
50
100
150
200
250
300
350
JAN FEB MAR APR MAY JUN JUL AUG SEP OCT NOV DEC
Mea
n m
onth
ly r
ainf
all (
mm
)
Bamnak rainfall(120406)Dap Bat rainfall(120304)Kralanh rainfall(130302)Kompong Tralachrainfall (110405)Maung Russey rainfall(120303)Baray rainfall (120503)
Sisophon rainfall(130202)Krakor rainfall (120403)
Siem Reap Koktatryrainfall (130325)Kompong Chhnangrainfall (120401)Kompong Thom rainfall(120404)Pursat rainfall (120302)
Battambang rainfall(130305)
The year-to-year variability in rainfall in a given month is typified by the data for Kompong Chhnang (Figure 17). In each month on the graph in Figure 17, the monthly totals for all the years are shown in sequence from 1953 to 2004. The variation in the month of July is particularly notable – from 89 mm in 2001 to 808 mm in 1991. Perhaps more significant than the year-to-year variability of total rainfall is that at critical times of the year, particularly in June when land preparation, production of rice seedlings and initial broadcasting is in full swing. The
42

record of total rainfalls in June at Battambang typifies the unpredictability and unreliability of rainfall in this month (Figure 18). The monthly totals range from 42 mm to 276 mm, with an average of 142 mm. There is a declining, but not statistically significant, trend in June totals over the period. Other stations can show even more marked variabilty, particularly in the drier areas around the lake. For the purpose of project design at a particular location, data for nearby stations should be consulted, in the MOWRAM Report Rainfall monitoring stations, Tonle Sap Basin. Figure 17. Total monthly rainfalls at Kompong Chhnang (years during
1953-2004 with continuous records)
Kompong Chhnang
0
100
200
300
400
500
600
700
800
900
Jan Feb Mar Apr May Jun Jul Aug Sep Oct Nov Dec
Tota
l mon
thly
rain
fall
(mm
)
Figure 18. Total June rainfalls, Battambang. Linear trend line
(equation at top right) is shown.
y = -0.5294x + 150.13R2 = 0.0372
0
50
100
150
200
250
300
1920
1924
1928
1932
1936
1940
1944
1948
1952
1956
1960
1964
1968
1972
1976
1980
1984
1988
1992
1996
2000
2004
Tota
l Jun
e ra
infa
ll (m
m)
5 . 5 N u m b e r o f r a i n d a y s
There is a strong correlation between the number of raindays in each month and the total rainfall in each month, as a comparison of Figure 19 and Figure 13 shows (the complete dataset is in Annex 5). As with monthly
43

total rainfalls, the differences between stations are greatest during the wet season – perhaps even more so. Of the long-record stations, Battambang and Kompong Chhnang have the greatest number of raindays during the wet season, Maung Russey and Kralanh the smallest. Of all stations, Komrieng (on the Thai border) has the smallest number, an average 43 raindays per year (but only 2.5 years record); Taing Krasaing (Kompong Thom) has the largest, 163 raindays per year (with 6 years of record). Again, there is considerable variability in any one month at each station – from 4 to 24 raindays in May at Kompong Chhnang, for example (Figure 20; zero raindays are shown in May 1920, but this seems questionable and may be a case of “no observations made“). Figure 19. Mean monthly raindays for stations with >15 years record.
0
2
4
6
8
10
12
14
16
18
20
JAN FEB MAR APR MAY JUN JUL AUG SEP OCT NOV DEC
Mea
n m
onth
ly ra
inda
ys
Bamnak rainfall(120406)Dap Bat rainfall(120304)Kralanh rainfall(130302)Kompong Tralachrainfall (110405)Maung Russey rainfall(120303)Baray rainfall (120503)
Sisophon rainfall(130202)Krakor rainfall (120403)
Siem Reap Koktatryrainfall (130325)Kompong Chhnangrainfall (120401)Kompong Thom rainfall(120404)Pursat rainfall (120302)
Battambang rainfall(130305)
Figure 20. Total monthly raindays at Kompong Chhnang (years during
1953-2004 with continuous records).
Kompong Chhnang
0
5
10
15
20
25
30
Jan Feb Mar Apr May Jun Jul Aug Sep Oct Nov Dec
Mea
n an
nual
rai
nfal
l (m
m)
44
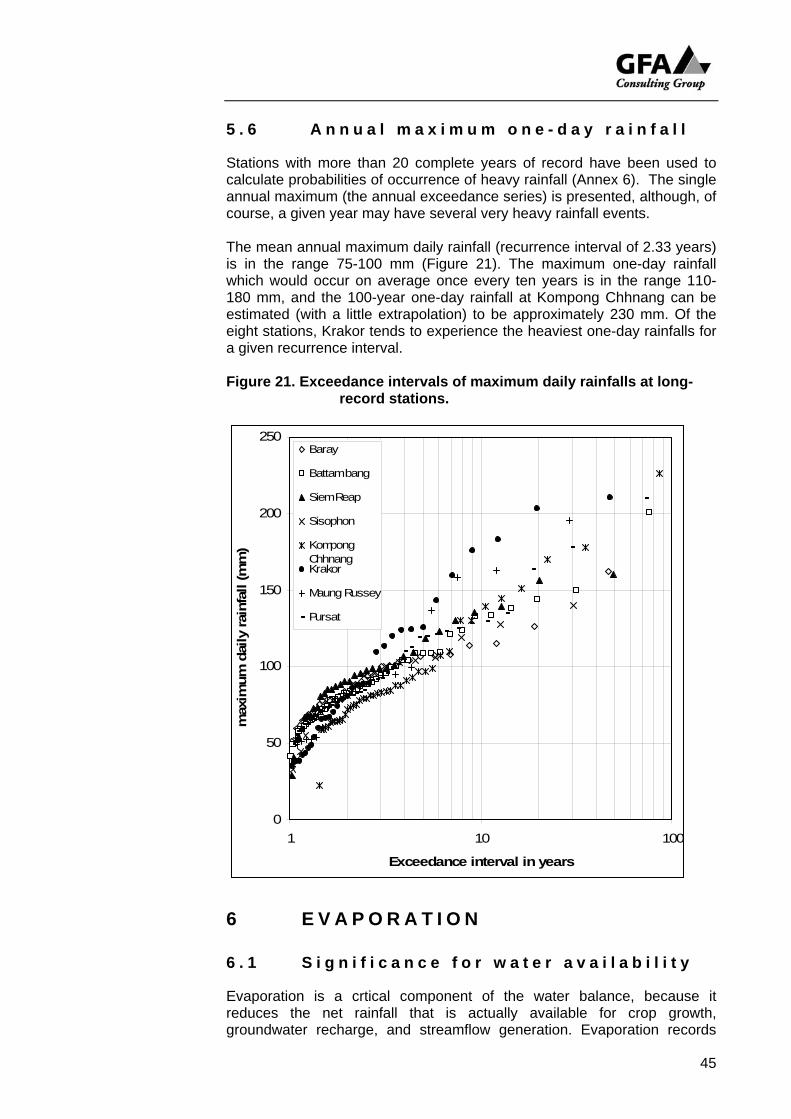
5 . 6 A n n u a l m a x i m u m o n e - d a y r a i n f a l l
Stations with more than 20 complete years of record have been used to calculate probabilities of occurrence of heavy rainfall (Annex 6). The single annual maximum (the annual exceedance series) is presented, although, of course, a given year may have several very heavy rainfall events. The mean annual maximum daily rainfall (recurrence interval of 2.33 years) is in the range 75-100 mm (Figure 21). The maximum one-day rainfall which would occur on average once every ten years is in the range 110-180 mm, and the 100-year one-day rainfall at Kompong Chhnang can be estimated (with a little extrapolation) to be approximately 230 mm. Of the eight stations, Krakor tends to experience the heaviest one-day rainfalls for a given recurrence interval. Figure 21. Exceedance intervals of maximum daily rainfalls at long-
record stations.
0
50
100
150
200
250
1 10
Exceedance interval in years
max
imum
dai
ly ra
infa
ll (m
m)
100
Baray
Battam bang
Siem Reap
Sisophon
KompongChhnangKrakor
Maung Russey
Pursat
6 E V A P O R A T I O N
6 . 1 S i g n i f i c a n c e f o r w a t e r a v a i l a b i l i t y
Evaporation is a crtical component of the water balance, because it reduces the net rainfall that is actually available for crop growth, groundwater recharge, and streamflow generation. Evaporation records
45

exist for several stations in the Tonle Sap basin; apart from Battambang and Krakor, records generally are short and/or discontinuous, but provide a useful basis for estimating evaporation at different places in the basin. Fortunately, evaporation is a relatively conservative meteorological measurement, and estimates provided by short periods of observation are more reliable than rainfall totals estimated from short periods of record. The evaporation data presented herein have been taken from a number of consultancy reports (Annex 7; the most thorough study has been that presented in NWISP Final Report Volume 2 Annex A (March 2003).
6 . 2 S e a s o n a l v a r i a t i o n s i n e v a p o r a t i o n
There is a consistent annual cycle of evaporation throughout the Tonle Sap basin, with highest monthly values in March-April, as air temperatures are increasing and insolation remains high, under clear skies (Table 11, Figure 22). As the southwest monsoon establishes, with increasing cloud cover, more frequent rainfall, and increasing relative humidity, evaporation rates decline, reaching their lowest values in October/November, at the height of the wet season. Table 11. Mean monthly total evaporation (mm), Tonle Sap basin.
JAN FEB MAR APR MAY JUN Battambang, monthly evaporation 130 134 158 159 146 132 Battambang, monthly Eto 120 125 161 154 151 131 Siem Reap, monthly Eto 133 129 158 162 158 144 Siem Reap, monthly evaporation 127 125 159 153 159 142 Stung Chinit, monthly Eto 130 126 155 153 143 123 Krakor, monthly evaporation 105 131 152 132 99 93 Pochentong, monthly Eto 162 174 216 206 191 167 Pochentong, monthly evaporation 120 129 152 155 129 126 Pursat monthly evaporation 147 159 185 210 179 127
JUL AUG SEP OCT NOV DEC YEARBattambang, monthly evaporation 124 115 96 96 96 115 1501Battambang, monthly Eto 140 124 117 122 113 111 1569Siem Reap, monthly Eto 140 136 120 124 120 124 1648Siem Reap, monthly evaporation 148 144 129 123 113 129 1651Stung Chinit, monthly Eto 124 124 111 118 114 124 1545Krakor, monthly evaporation 84 71 54 62 69 81 1133Pochentong, monthly Eto 153 159 140 133 146 156 2003Pochentong, monthly evaporation 134 114 112 112 120 121 1522Pursat monthly evaporation 125 127 90.8 83 101 123 1657
Source: Nippon Koei (March 2002); NWISP (October, 2002); NWISP (July, 2006); Cargill Technical Services (December 1997); BRL/Action Nord-Sud/GRET (March 2002); OADA (March 2005)
46

Of course, there are considerable year-to-year variations in the meteorological conditions that influence evaporation, so the mean values in Table 11 and Figure 22 hide variations in evaporation itself. The record of evaporation measurements at Battambang is sufficiently long, twelve years, to indicate year-to-year variability at a single station (Figure 23, Table 12). The at-a-station (year-to-year) variability evident in Figure 23 approaches the between-station (place-to-place) variability in Figure 22. Figure 22. Mean monthly total evaporation, Tonle Sap basin.
0
50
100
150
200
250
JAN FEB MAR APR MAY JUN JUL AUG SEP OCT NOV DEC
Mea
n m
onth
ly e
vapo
ratio
n/ET
o (m
m)
Battambang, monthly evaporationBattambang, monthly EtoSiem Reap, monthly EtoStung Chinit, monthly EtoKrakor, monthly evaporationPochentong, monthly EtoPursat monthly evaporation Pochentong, monthly evaporation Siem Reap, monthly evaporation
Figure 23. Mean monthly evaporation, Battambang (data from OADA,
2005).
0
1
2
3
4
5
6
7
8
9
JAN FEB MAR APR MAY JUN JUL AUG SEP OCT NOV DEC
Mon
thly
mea
n ev
apor
atio
n (m
m/d
ay)
1982 19831984 19851986 19871988 19891990 19911992 19931995 19961997 19981999 MEAN
47
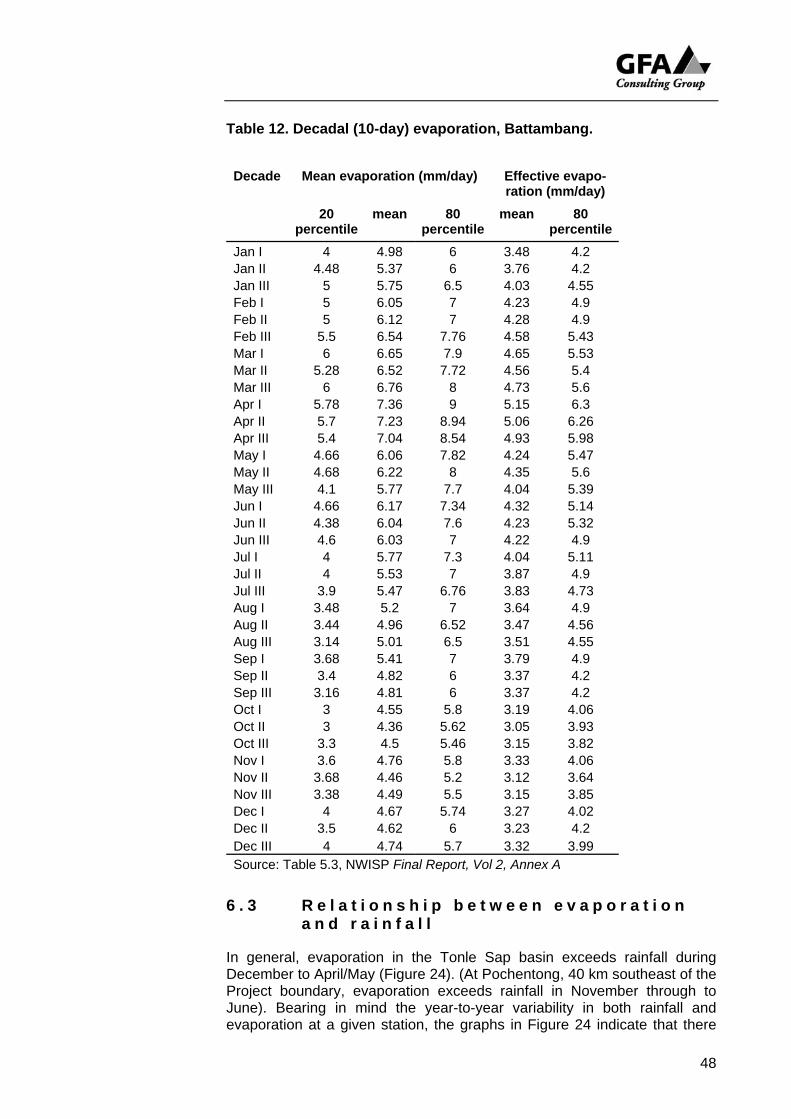
Table 12. Decadal (10-day) evaporation, Battambang.
Dec de Mean evap (mm y) ive e o-
pe lem
percentile per
a oration /da Effectration
vap(mm/day)
20 rcenti
ean 80 mean 80 centile
Jan I 4 4.98 6 3.48 4.2 Jan II 4.48
6.5
7.9 7
8.54
4.38 4.6
6 6.5
3.4 3
3.68 5.5
4.2 Dec III 4 4.74 5.7 3.32 3.99
5.37 6 3.76 4.2 Jan III 5 5.75 4.03 4.55 Feb I 5 6.05 7 4.23 4.9 Feb II 5 6.12 7 4.28 4.9 Feb III 5.5 6.54 7.76 4.58 5.43 Mar I 6 6.65 4.65 5.53 Mar II 5.28 6.52 .72 4.56 5.4 Mar III 6 6.76 8 4.73 5.6 Apr I 5.78 7.36 9 5.15 6.3 Apr II 5.7 7.23 8.94 5.06 6.26 Apr III 5.4 7.04 4.93 5.98 May I 4.66 6.06 7.82 4.24 5.47 May II 4.68 6.22 8 4.35 5.6 May III 4.1 5.77 7.7 4.04 5.39 Jun I 4.66 6.17 7.34 4.32 5.14 Jun II 6.04 7.6 4.23 5.32 Jun III 6.03 7 4.22 4.9 Jul I 4 5.77 7.3 4.04 5.11 Jul II 4 5.53 7 3.87 4.9 Jul III 3.9 5.47 6.76 3.83 4.73 Aug I 3.48 5.2 7 3.64 4.9 Aug II 3.44 4.96 .52 3.47 4.56 Aug III 3.14 5.01 3.51 4.55 Sep I 3.68 5.41 7 3.79 4.9 Sep II 4.82 6 3.37 4.2 Sep III .16 4.81 6 3.37 4.2 Oct I 3 4.55 5.8 3.19 4.06 Oct II 3 4.36 5.62 3.05 3.93 Oct III 3.3 4.5 5.46 3.15 3.82 Nov I 3.6 4.76 5.8 3.33 4.06 Nov II 4.46 5.2 3.12 3.64 Nov III 3.38 4.49 3.15 3.85 Dec I 4 4.67 5.74 3.27 4.02 Dec II 3.5 4.62 6 3.23
Source: Table 5.3, NWISP Final Report, Vol 2, Annex A
6 . 3 e e n e v a p o r a t i o n
evaporation at a given station, the graphs in Figure 24 indicate that there
R e l a t i o n s h i p b e t wa n d r a i n f a l l
In general, evaporation in the Tonle Sap basin exceeds rainfall during December to April/May (Figure 24). (At Pochentong, 40 km southeast of the Project boundary, evaporation exceeds rainfall in November through to June). Bearing in mind the year-to-year variability in both rainfall and
48

will be considerable uncertainty in any given year regarding exactly when rainfall will start to exceed evaporation, thus enabling soil moisture to
crease, ground preparation to start, and nurseries to be established.
Figure 24. Mean monthly evaporation and rainfall, Tonle Sap basin.
in
Battambang
0
50
100
150
200
250
300
Jan Feb Mar Apr May Jun Jul Aug Sep Oct Nov Dec
Mea
n m
onth
ly ra
infa
ll an
d ev
apor
atio
n (m
m) Mean monthly rainfall (mm)
Mean monthly evaporation (mm)
Monthly Eto (mm)
West Baray, Siem Reap
0
50
100
150
200
250
300
Jan Feb Mar Apr May Jun Jul Aug Sep Oct Nov Dec
Mea
n m
onth
ly ra
infa
ll an
d ev
apor
atio
n (m
m) Mean monthly rainfall (mm)
Monthly Eto (mm)
Mean monthly evaporation (mm)
49

Figure 24. Mean monthly evaporation and rainfall, Tonle Sap basin. (continued).
Stung Chinit
0
50
100
150
200
250
300
Jan Feb Mar Apr May Jun Jul Aug Sep Oct Nov Dec
Mea
n m
onth
ly ra
infa
ll an
d ev
apor
atio
n (m
m)
Mean monthly rainfall (mm)Mean monthly pan evaporation (mm)Monthly Eto (mm)Mean monthly evaporation (mm - factor 0.7)
Krakor
0
50
100
150
200
250
300
Jan Feb Mar Apr May Jun Jul Aug Sep Oct Nov Dec
Mea
n m
onth
ly ra
infa
ll an
d ev
apor
atio
n (m
m) Mean monthly rainfall (mm)
Mean monthly evaporation (mm)
Pochentong
0
50
100
150
200
250
Jan Feb Mar Apr May Jun Jul Aug Sep Oct Nov Dec
Mea
n m
onth
ly ra
infa
ll an
d ev
apor
atio
n (m
m)
Mean monthly rainfall (mm)Monthly Eto (mm)
Mean monthly evaporation (mm/day)
50

7 O N S E T O F R A I N A N D L E N G T H O F D R Y S P E L L S
The onset of rain at the beginning of the wet season is of great significance to farmers. So too is the (possibly disastrous) occurrence of dry spells at the beginning of the season, when seedlings do not have a sufficiently well-developed rooting system to survive if soil moisture declines. The meteorological stations with the longest records provide a good database with which to review these two aspects of water availability. The date of the first rainfall greater than5 5 mm has been extracted from the record of daily rainfalls for Battambang, Kompong Chhnang, Krakor, Pursat, Siem Reap and Kompong Thom (Figure 25). The beginning of the year was taken to be 1 March; in some years there is significant rain before then, but farmers will not be able or willing to start farming operations. There are striking variations at each station in the date of first significant rainfall, with a range at each station of two to two and a half months. The median (50 percentile) date is generally in the second half of March, and in the second week of April at Kompong Chhnang (Table 13). However, the first significant rain can be as late as mid-May at all stations except Battambang. It is difficult to select a useful index of the incidence of dry spells that might affect farmers, because the impact depends on duration, stage of crop development, antecedent rainfall, and other weather conditions. A simple index is the total duration of a period during which daily rainfall is less than 0.5 mm. The median values are 10-15 days, with Siem Reap as high as 19, but dry spells can last as long as 64 days at Kompong Chhnang (this value may be spurious – durations that include a complete calendar month of no rain are suspect, because of the “zero rainfall“ – “no recording made“ uncertainty). The “five-year dry spell“ is about three weeks, except at Siem Reap, where it is closer to five weeks (Figure 26). As with other attributes of rainfall, the data on onset of first rain and length of dry spells emphasise, above all, the substantial variability with which farmers in the Project area must cope. With regard to spatial differences, the most obvious one is that Siem Reap tends to have longer dry spells than the other four stations.
5 Rainfall greater than 5 mm is selected because that is approximately the daily evaporation
rate.
51

Table 13. Summary statistics for date of first rain and dry spell
duration.
Siem Reap
Date of first rain >5 mm
First rainfall (mm)
Longest dry
spell (days)
MIN 1-Mar 520%ILE 12-Mar 7.1 13MEDIAN 22-Mar 12.9 1980%ILE 17-Apr 21.4 32MAX 11-May 62.0 41 Pursat MIN 2-Mar 520%ILE 11-Mar 8.4 10MEDIAN 25-Mar 16.6 1380%ILE 6-Apr 28.2 20MAX 10-May 84.5 29 Kompong Thom MIN 2-Mar 420%ILE 16-Mar 9.7 10MEDIAN 27-Mar 18.0 1480%ILE 13-Apr 49.9 20MAX 17-May 295.0 49 Kompong Chhnang MIN 5-Mar 520%ILE 23-Mar 8.5 8MEDIAN 10-Apr 15.9 1180%ILE 22-Apr 36.4 22MAX 14-May 103.0 64 Battam bang MIN 1-Mar 620%ILE 6-Mar 7.7 10MEDIAN 15-Mar 12.2 1580%ILE 28-Mar 26.8 22MAX 1-May 52.2 51
Krakor MIN 3-Mar 420%ILE 15-Mar 6.3 8MEDIAN 26-Mar 12.9 1180%ILE 17-Apr 32.5 18.2MAX 10-May 86.9 33
52

Figure 25. Date of first rain >5 mm, long-record stations.
Battambang
1-Mar
11-Mar
21-Mar
31-Mar
10-Apr
20-Apr
30-Apr
10-May
20-May
30-May
1920 1930 1940 1950 1960 1970 1980 1990 2000
Dat
e of
firs
t rai
n >5
mm
Kompong Chhnang
1-Mar
11-Mar
21-Mar
31-Mar
10-Apr
20-Apr
30-Apr
10-May
20-May
30-May
1920 1930 1940 1950 1960 1970 1980 1990 2000
Date
of f
irst r
ain
>5 m
m
Kompong Thom
1-Mar
11-Mar
21-Mar
31-Mar
10-Apr
20-Apr
30-Apr
10-May
20-May
30-May
1920 1930 1940 1950 1960 1970 1980 1990 2000
Dat
e of
firs
t rai
n >5
mm
53
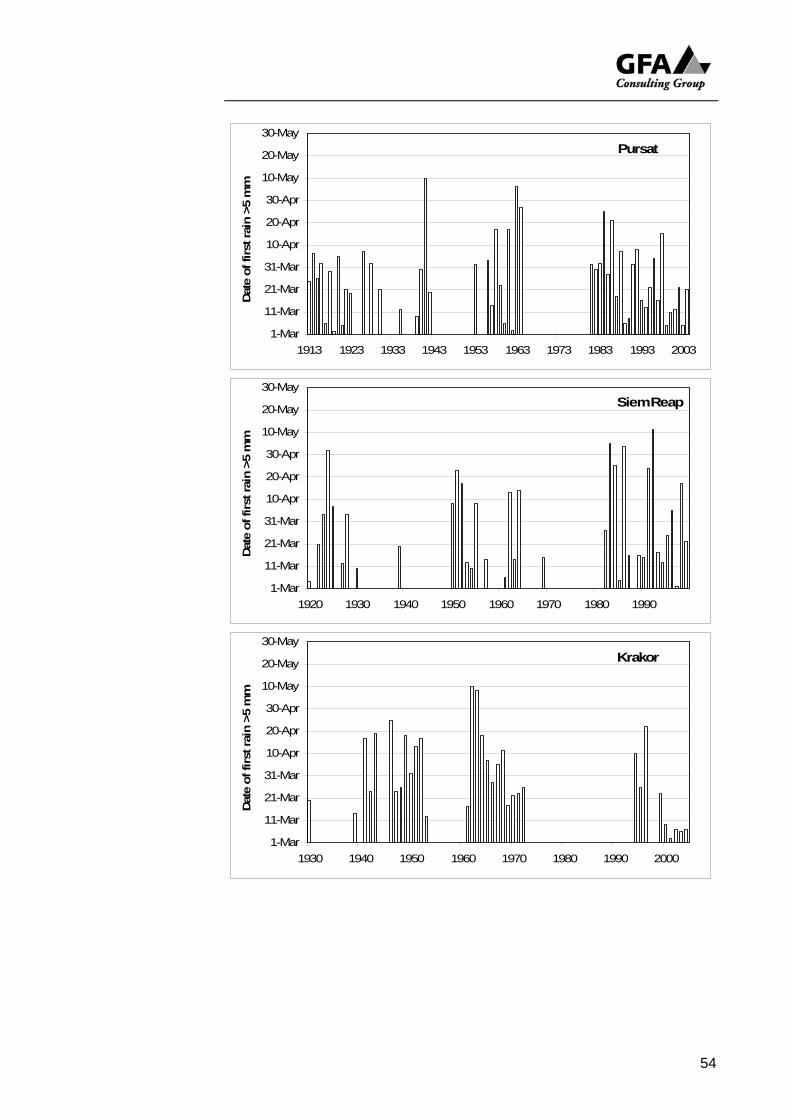
Pursat
1-Mar
11-Mar
21-Mar
31-Mar
10-Apr
20-Apr
30-Apr
10-May
20-May
30-May
1913 1923 1933 1943 1953 1963 1973 1983 1993 2003
Dat
e of
firs
t rai
n >5
mm
Siem Reap
1-Mar
11-Mar
21-Mar
31-Mar
10-Apr
20-Apr
30-Apr
10-May
20-May
30-May
1920 1930 1940 1950 1960 1970 1980 1990
Dat
e of
firs
t rai
n >5
mm
Krakor
1-Mar
11-Mar
21-Mar
31-Mar
10-Apr
20-Apr
30-Apr
10-May
20-May
30-May
1930 1940 1950 1960 1970 1980 1990 2000
Dat
e of
firs
t rai
n >5
mm
54

Figure 26. Frequency of the durations of longest dry spells.
0
10
20
30
40
50
60
70
1 10 100
Recurrence interval in years
Dur
atio
n of
long
est d
ry s
pell
(day
s)
.
Siem ReapPursatKompong ThomKompong ChhnangBattam bangKrakor
8 G R O U N D W A T E R MOWRAM has a substantial database of groundwater wells, but it does not contain information on water availability – well yields, etc. The Ministry of Rural Development, Department of Rural Water Supply, also has a substantial database of water wells; the information that it contains on water levels and well yields has not been updated in recent years (personal communication from Dr Mao Saray, Director of DoRWS). The ongoing Tonle Sap Rural Water Supply Project has a component to survey groundwater availability in the provinces around the Great Lake; this component should be implemented during 2007. However, it is expected to include the drilling of only two deep wells per province, so will not provide comprehensive information on water availability. Otherwise, the only authoritative information on groundwater availability in the TSLSP area is for Kompong Chhnang province alone, by the JICA-supported Study on groundwater development in Central Cambodia (Kokusai Kogyo Co. Ltd., February 2002). It concluded: ... groundwater potential is low and the water quality is inferior in the alluvial lowland along the Mekong River and Tonle Sap river of Kg. Cham and Kg. Chhnang provinces. In the basement rocks of Kg. Chhnang province, groundwater potential varies from place to place. It is necessary to conduct a detailed geological and geophysical surveys to evaluate groundwater potential of the target village. It summarised groundwater potential as follows (Table 7.1, Kokusai Kogyo Co. Ltd., February 2002)
55

Region Geology Main aquifer Groundwater potential Kompong Chhnang province
Hill, gentle slope and lowland composed of basement rocks, Pleistocene and alluvial sediments
Fissures and weathered zone of the basement rocks.
Alluvial and Pleistocene aquifers yield small amounts and inferior water quality, high in iron and salinity. Arsenic is locally contained. Basement rock aquifer has greater yield and good water quality. Exploration is difficult.
The report indicates that to explore and develop groundwater, comprehensive surveys, including drilling and pumping tests, are needed. The NWISP Final Report Volume 2 Annex A provided a comprehensive review of geology, hydrogeology, and groundwater availability in much of the area around Tonle Sap Great Lake (NWISP, 2003, section 8). Of the TSLSP area, only the eastern part of Kompong Thom province is not included. There is little purpose in repeating the NWISP hydrogeologist’s analysis, which was rather clear in its conclusions. As far as TSLSP requirements are concerned, his appraisal can be summarised in the following quotations: There are no reports of artesian aquifers within the project area, but there have been so few deep wells drilled that there is a distinct possibility of significant alluvial artesian aquifers still to be discovered. Yields from existing near-surface wells and boreholes within the project area are most typically between 0.3 and 0.6 litres per second (one to two cubic metres per hour). The average failure rate, that is the incidence of dry wells, is about 20%, whilst only about 1% of wells have yields in the order of 10 m3 per hour, as shown in the distribution nomogram of the Figure below. This distribution is based upon a combined sample of 368 wells from Battambang and Siem Reap provinces. Having been swayed by similar data, the consensus of opinion from several reports is that deep groundwater is of widespread availability but only occasionally of sufficient yield to be useful for agriculture. However, the same sources also admit to this conclusion being provisional pending more comprehensive investigation. Most available groundwater data is from boreholes close to the main roads north and south of the Tonle Sap. This area is sufficiently far ‘downstream’ for sediments to be dominated by clay-rich lithologies of poor aquifer potential, and hence some hydro-geological conclusions based upon their results may be unduly pessimistic. ... it is certainly premature to dismiss the groundwater potential over large parts of the agricultural areas. In fact, the lower aquifer material of this projects’ test drilling, the geological distribution of older alluvium, and the possibility of karstic hard rock aquifers in the west of the project area, all present quite favourable targets for further hydrogeological investigations.
Of all the factors influencing the long-term sustainable use of groundwater, the ratio of recharge to extraction is the most critical. No recharge measurements, and few theoretical estimates of recharge are available...
56

0
5
10
15
20
25
30
zero
1-100
0
1001
-2000
2001
-3000
3001
-4000
4001
-5000
5001
-6000
6001
-7000
7001
-8000
8001
-9000
9001
-1000
0
1000
1-110
00
1100
1-120
00
1200
1-130
00
Yield Range (litres per hour)
Perc
ent
In summary, the chloride mass balance indicates mean annual groundwater recharge in the order of 100 to 150 mm, whilst the water balance indicates recharge in the order of 315 to 650 mm. These could be regarded as lower and upper estimates, but caution is required in their interpretation in that the water balance indicates recharge down to the water table, whereas the chloride mass balance is based upon recharge to deeper levels within the aquifer. Thus both estimates could be approximately correct, with the proportion of recharge decreasing with depth. The degree of hydraulic continuity between shallow and deep aquifers is unknown.
Overall, there is certainly a potential for the existence of deep aquifers with active recharge, and perhaps even of high yielding artesian aquifers, but until and unless geophysical and drilling exploration proceeds it is impossible to make much further progress in assessing groundwater resources in the northwest provinces.
Neither shallow nor deep aquifers can be assessed adequately from surface features alone. For example, the distribution of successful and failed wells in Koah Kralor, ..., follows no discernable pattern of drainage, vegetation or topographic control. Subsurface geological conditions alone seem to be the controlling variable. Following the above comments, the NWISP hydrogeologist discusses the information required to support groundwater exploitation. Essentially, he considers that there is little usable information on aquifer dimensions and properties, and minimal capacity to obtain it – thus: The necessary data does not yet exist, nor will it become available until and unless the necessary hydrogeological infrastructure has successfully operated for a minimum of several years. Large quantities of data, which are currently being collected and entered into MOWRAM’s groundwater database, may have application in other directions, but are superficial, and irrelevant to both computer modeling and hydro-geological resource
57

assessment. There is a prevailing expectation that this database information, as it currently stands, forms the basis for overall groundwater assessment and management. This is not the case. Rather, it will require considerable sustained effort and a committed ground-water investigation program over several years to provide the hard data necessary for anything more than a superficial groundwater assessment.
In summary, for TSLSP purposes, the available information is not sufficient to establish whether the groundwater resource at a particular location would be sufficient to support agricultural development. The NWISP hydrogeologist emphasised that to obtain sufficient data on groundwater for project planning and design purposes would require a sustained, long-term effort. Even when the groundwater survey planned for the Tonle Sap Rural Water Supply Project is completed, the potential for groundwater use will need to be assessed on a case-by-case basis. Given this level of uncertainty, it appears that any reliance on groundwater use for agricultural purposes6 would be unwise. Many other countries have over-exploited groundwater resources with severe consequences, and a conservative approach is advisable in the Tonle Sap lowlands, until there is adequate information on actual groundwater availability.
9 W A T E R U S E An important component of the water balance in a river basin is water abstraction for consumptive use. There are no data to quantify the total volume that is abstracted from the rivers and aquifers of the Tonle Sap basin. The National Water Sector Profile estimated that 700 MCM of water are used for irrigated agriculture each year, nation-wide, a small fraction of the estimated 500 BCM of water available. However, such “global” figures are of little value for sub-project selection and planning. The key issue is whether there is sufficient water in a particular sub-basin/aquifer system to meet existing plus proposed demands at critical times of year, without harming other uses of the water resource. The critical times are, of course, not the periods during the wet season when there is abundant water, but times during the farming calendar, particularly at the beginning of the wet season, when access to water is essential for crop growth but water availability is most unreliable. Recent and planned future work, supported by Mekong River Commission, to provide a comprehensive inventory of irrigation systems provides information on the locations and command areas of irrigation systems on the southern side of the Tonle Sap Great Lake (personal communication from the Director of the Department of Water Resources Management and Conservation). Several river basins included in the TSLSP area are included. The inventory will not, when it is published, provide information on the actual quantities of water abstracted (or returned) by these systems (many of which are not fully functional). However, command areas could, with some assumptions on rates of seepage and evapotranspiration, be used to estimate likely consumptive use. At the stage of assessing sub-
6 Groundwater use for domestic purposes, including cultivation of vegetables and high value
crops using water-efficient technology such as drip irrigation, is a different matter.
58

project feasibility and carrying out design, this inventory may prove helpful in deciding whether competition for water with existing users may present difficulties for a proposed sub-project. The four basin studies being carried out under the Northwest Irrigation Sector Project (see Section 2) will provide the first authoritative information on water use and basin water balance in Cambodia. The results will be available by December 2006, and should be of great value to the TSLSP.
1 0 O V E R V I E W O F W A T E R A V A I L A B I L I T Y
It is commonly stated that Cambodia is a “water wealthy“ country, and at the national scale, year-round, this may be true. However, even along the Mekong River, water is abundant only for part of the year, during the wet season. For a significant portion of the year, however, many parts of Cambodia are water-short, and even the small volumes needed for domestic water supply are difficult to supply. This is, of course, the reason for a Project in the Tonle Sap basin that aims inter alia to enhance water management for agricultural purposes. The analysis in this report leads to several basic conclusions:
1. Mean annual rainfall in the project area is generally in the range 1,000-1,700 mm, but with considerable year-to-year variability. Rainfall tends to be greatest at the eastern end of the Great Lake and to decline towards the northwest. Rainfall is highly seasonal in nature, with negligible rain in December to February, a rapid increase in March through to May, and the bulk of rainfall during June to October. Again, there is substantial variability from year-to-year at a given location, largely because rain tends to fall from convectional cells that cover only small areas. The date of the first significant rain in the farming year tends to be in the second half of March, but in can be at any time during March through to mid-May. For a given project location, reference to neighbouring rainfall stations should provide the most reliable indication of the rainfall regime.
2. Evaporation generally exceeds rainfall during December to April/May. As with rainfall, there is considerable year-to-year variability at a given station, in response to variations in cloudiness, temperature, etc. The considerable variability in rainfall and evaporation, taken together, mean that there is great uncertainty regarding the exact time at which rainfall starts to exceed evaporation, at the beginning of the wet season. Evaporation data are available at several locations around the Great Lake, and provide a basis for estimating evaporation at a given location. Meteorological data are in principle available from the Department of Meteorology, and might be obtainable from there if calculation of potential evapotranspiration is required.
3. River flows similarly are highly seasonal, with a peak generally in September-October. They show a great deal of variability from year to year, particularly at the beginning of the wet season, where average monthly flow during June can range over two orders of
59
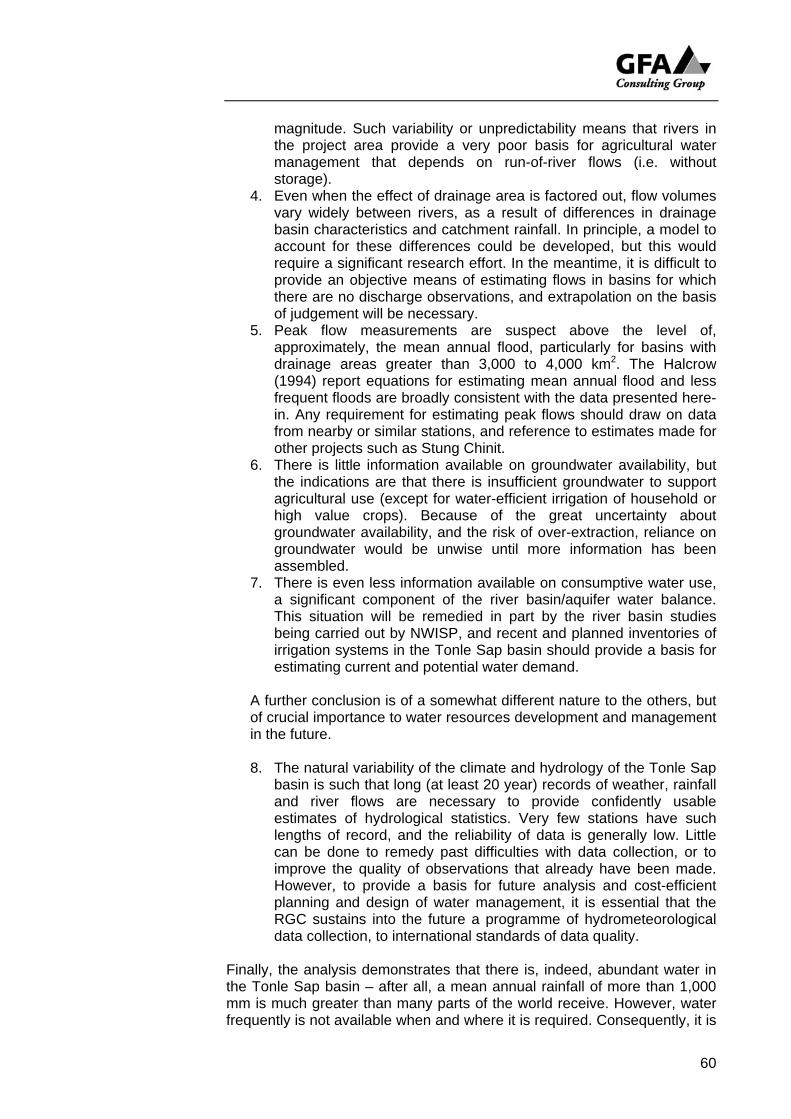
magnitude. Such variability or unpredictability means that rivers in the project area provide a very poor basis for agricultural water management that depends on run-of-river flows (i.e. without storage).
4. Even when the effect of drainage area is factored out, flow volumes vary widely between rivers, as a result of differences in drainage basin characteristics and catchment rainfall. In principle, a model to account for these differences could be developed, but this would require a significant research effort. In the meantime, it is difficult to provide an objective means of estimating flows in basins for which there are no discharge observations, and extrapolation on the basis of judgement will be necessary.
5. Peak flow measurements are suspect above the level of, approximately, the mean annual flood, particularly for basins with drainage areas greater than 3,000 to 4,000 km2. The Halcrow (1994) report equations for estimating mean annual flood and less frequent floods are broadly consistent with the data presented here-in. Any requirement for estimating peak flows should draw on data from nearby or similar stations, and reference to estimates made for other projects such as Stung Chinit.
6. There is little information available on groundwater availability, but the indications are that there is insufficient groundwater to support agricultural use (except for water-efficient irrigation of household or high value crops). Because of the great uncertainty about groundwater availability, and the risk of over-extraction, reliance on groundwater would be unwise until more information has been assembled.
7. There is even less information available on consumptive water use, a significant component of the river basin/aquifer water balance. This situation will be remedied in part by the river basin studies being carried out by NWISP, and recent and planned inventories of irrigation systems in the Tonle Sap basin should provide a basis for estimating current and potential water demand.
A further conclusion is of a somewhat different nature to the others, but of crucial importance to water resources development and management in the future. 8. The natural variability of the climate and hydrology of the Tonle Sap
basin is such that long (at least 20 year) records of weather, rainfall and river flows are necessary to provide confidently usable estimates of hydrological statistics. Very few stations have such lengths of record, and the reliability of data is generally low. Little can be done to remedy past difficulties with data collection, or to improve the quality of observations that already have been made. However, to provide a basis for future analysis and cost-efficient planning and design of water management, it is essential that the RGC sustains into the future a programme of hydrometeorological data collection, to international standards of data quality.
Finally, the analysis demonstrates that there is, indeed, abundant water in the Tonle Sap basin – after all, a mean annual rainfall of more than 1,000 mm is much greater than many parts of the world receive. However, water frequently is not available when and where it is required. Consequently, it is
60

considered that water availability is not a factor that controls whether or not a potential sub-project can be considered, but does influence what type of project is possible. Some points to consider include:
Commonly, water management for agriculture is assumed, in Cambodia, to mean the abstraction of water from a river to provide supplementary irrigation of nearby paddy fields, on a run-of-river basis. However, the variability – and unreliability – of river flows indicates that reliance on run-of-river abstraction provides a very uncertain basis for agriculture. River hydrographs show numerous peaks throughout the wet season, in response to rainfall events. An abstraction system that included a temporary storage area between the off-take and the command area would provide the capacity to harvest such peak flows, for subsequent use. The storage capacity would need to be sufficient only to hold water from one peak flow to the next – that is, it would not need to be large.
The analysis emphasizes how variable – and unreliable – is the rainfall (and river flows) at the beginning of the wet season, when farmers are establishing crops. A key aim of water management should be to reduce the uncertainty and risk of crop loss due to delays in significant rainfall or the incidence of dry spells just when crops are established. It is difficult to avoid the conclusion that water storage is needed, if farmers are to have confidence that crops, once planted, will grow to maturity. The volume of water need not be great – just sufficient to enable continued crop growth through such adverse events.
Rainfall in the Tonle Sap basin is, in total and on average, more than sufficient for productive rain-fed agriculture. Again, however, variability and unpredictability are a severe hindrance to farmers, particularly because the bulk of rain tends to fall in intense downpours and runs off rather than entering the soil. There is great scope for harvesting and storing runoff, and for slowing the rate of runoff so that the water can soak into the soil or recharge aquifers. Simple, appropriate technology apparently has been in common use in Cambodia’s history, and is in widespread use in other countries.
Groundwater does not appear to be available in the quantities required for even supplementary irrigation of rice, but it may well be available in sufficient quantities for irrigation of household or high value crops (vegetables, fruit trees, etc.), using water-efficient techniques such as drip lines. The technology for this is available in Cambodia, and would be suited to the TSLSP area.
The above points are not comprehensive, but emphasise that a variety of approaches to agricultural water management are possible. A combination of approaches, different from place to place depending on local conditions, has the potential to make effective use of the available water in the Project area.
61

62
A N N E X 1 . T O T A L M O N T H L Y V O L U M E T R I C D I S C H A R G E S
(Based on data presented in Department of Hydrology & River Works Report, River Flow monitoring stations, Tonle Sap Basin, August 2006, MOWRAM)
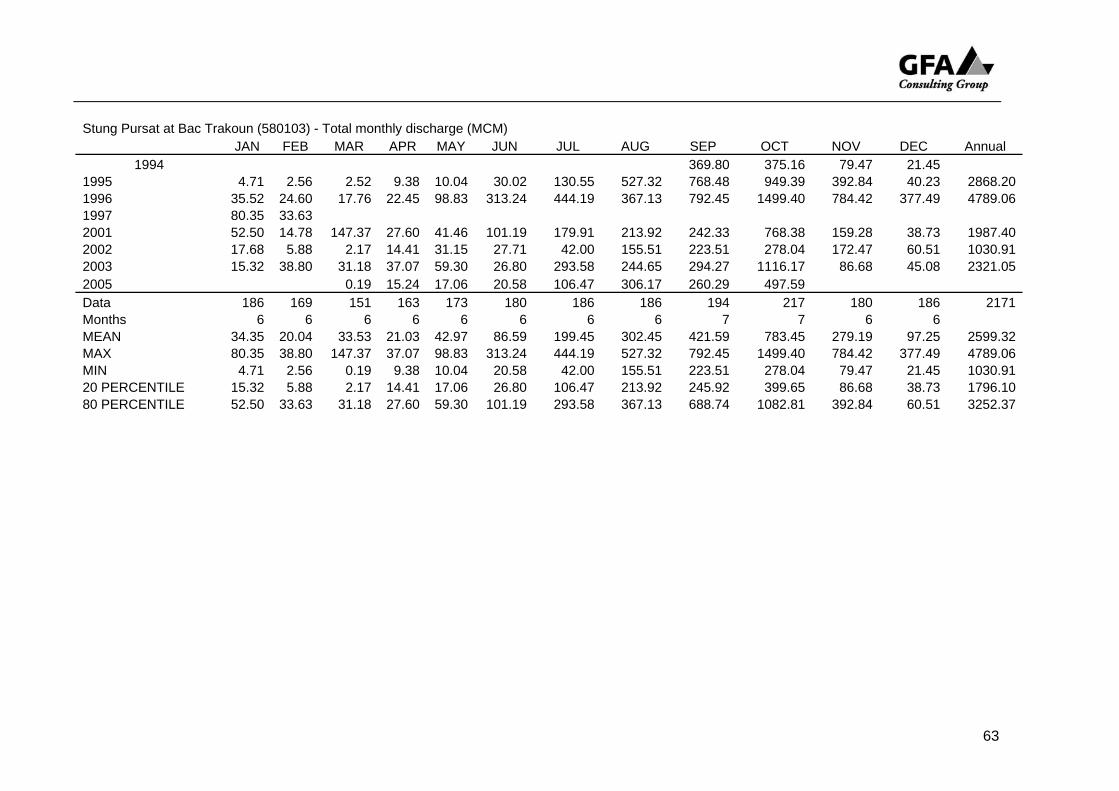
63
Stung Pursat at Bac Trakoun (580103) - Total monthly discharge (MCM)
JAN FEB MAR APR MAY JUN JUL AUG SEP OCT NOV DEC Annual 1994 369.80 375.16 79.47 21.45
1995 4.71 2.56 2.52 9.38 10.04 30.02 130.55 527.32 768.48 949.39 392.84 40.23 2868.20 1996 35.52 24.60 17.76 22.45 98.83 313.24 444.19 367.13 792.45 1499.40 784.42 377.49 4789.06 1997 80.35 33.63 2001 52.50 14.78 147.37 27.60 41.46 101.19 179.91 213.92 242.33 768.38 159.28 38.73 1987.40 2002 17.68 5.88 2.17 14.41 31.15 27.71 42.00 155.51 223.51 278.04 172.47 60.51 1030.91 2003 15.32 38.80 31.18 37.07 59.30 26.80 293.58 244.65 294.27 1116.17 86.68 45.08 2321.05 2005 0.19 15.24 17.06 20.58 106.47 306.17 260.29 497.59 Data 186 169 151 163 173 180 186 186 194 217 180 186 2171 Months 6 6 6 6 6 6 6 6 7 7 6 6 MEAN 34.35 20.04 33.53 21.03 42.97 86.59 199.45 302.45 421.59 783.45 279.19 97.25 2599.32 MAX 80.35 38.80 147.37 37.07 98.83 313.24 444.19 527.32 792.45 1499.40 784.42 377.49 4789.06 MIN 4.71 2.56 0.19 9.38 10.04 20.58 42.00 155.51 223.51 278.04 79.47 21.45 1030.91 20 PERCENTILE 15.32 5.88 2.17 14.41 17.06 26.80 106.47 213.92 245.92 399.65 86.68 38.73 1796.10 80 PERCENTILE 52.50 33.63 31.18 27.60 59.30 101.19 293.58 367.13 688.74 1082.81 392.84 60.51 3252.37

64
Stung Sangke at Battambang (550102) - Total monthly discharge (MCM)
Year JAN FEB MAR APR MAY JUN JUL AUG SEP OCT NOV DEC Annual 1962 9.54 35.25 135.90 362.55 497.06 355.18 238.65 193.10 82.23 1963 12.48 6.46 9.16 1972 20.17 7.26 36.62 100.90 279.76 342.22 346.69 343.93 140.48 1973 2.92 2.72 8.44 170.99 213.15 317.69 208.50 481.02 1981 110.75 208.24 138.18 328.21 341.63 260.50 174.91 1982 8.90 12.53 14.49 14.06 38.93 155.45 294.70 255.99 269.85 144.79 39.93 1983 9.70 6.12 5.54 4.41 6.32 21.10 66.77 384.08 265.06 743.63 402.69 83.49 1924.011984 20.33 7.55 6.13 7.67 9.32 153.84 91.65 330.38 364.23 425.92 172.55 47.01 1631.671985 9.08 4.98 5.09 8.74 27.08 287.38 209.75 326.74 329.52 496.98 176.41 48.21 1928.431986 13.47 6.51 320.20 397.28 317.28 133.62 33.56 1987 4.50 1.50 2.20 2.31 2.71 31.18 241.00 235.64 159.04 247.43 79.63 1988 4.45 2.00 1.96 2.10 28.63 73.25 56.25 1997 7.18 9.56 17.95 75.63 429.11 480.02 417.57 430.31 217.24 44.06 1998 11.41 5.18 4.45 4.20 5.95 15.71 33.91 50.92 183.85 161.21 44.74 1999 6.45 3.99 4.47 40.25 141.63 276.80 225.98 331.93 209.12 381.99 401.19 103.31 2117.642000 27.08 8.44 7.29 39.50 73.39 83.88 337.75 302.20 613.16 728.52 357.18 109.47 2763.182001 26.28 6.80 30.05 9.56 53.27 113.40 284.58 455.44 436.23 558.53 299.87 89.35 2363.312002 20.54 5.15 4.90 10.26 38.03 39.53 100.52 325.13 490.07 495.26 209.95 60.24 1799.442003 13.39 4.69 11.78 8.74 18.70 34.27 196.11 426.67 313.17 335.23 84.24 24.75 1469.262004 8.57 4.54 4.21 6.04 52.76 162.88 76.84 308.47 239.66 308.77 92.79 18.45 1280.362005 4.63 2.71 3.11 5.42 4.37 20.79 179.48 417.19 263.45 Data 465 452 484 532 583 550 526 552 561 517 516 440 6178Months 15 16 17 18 19 19 18 19 19 17 18 15 MEAN 12.82 5.35 7.23 11.43 34.52 104.23 181.05 337.78 329.55 391.67 232.09 66.94 1919.70MAX 27.08 8.90 30.05 40.25 141.63 287.38 429.11 497.06 613.16 743.63 481.02 140.48 2763.18MIN 4.45 1.50 1.96 2.10 2.71 15.71 33.91 50.92 183.85 159.04 44.74 18.45 1280.3620 PERCENTILE 6.09 3.99 3.33 4.28 6.88 33.03 82.77 299.20 238.05 262.37 138.09 38.66 1566.7180 PERCENTILE 20.37 6.80 8.79 12.80 52.97 166.13 261.14 420.98 405.39 496.63 351.88 92.14 2215.91

65
Stung Boribo at Boribo (590101) - Total monthly discharges (MCM)
Year JAN FEB MAR APR MAY JUN JUL AUG SEP OCT NOV DEC Annual 1962 1.43 10.04 20.55 39.32 56.76 147.90 161.51 42.04 15.88 1963 5.17 1.23 2.01 1998 8.63 18.21 51.56 145.26 112.36 104.35 1999 11.60 16.06 5.65 9.41 122.62 125.53 77.91 56.76 154.48 146.91 172.58 74.73 974.152000 21.16 16.34 6.86 15.94 14.89 66.15 143.99 133.52 83.33 231.31 87.30 21.16 839.492001 25.79 9.63 18.72 14.77 7.53 32.76 21.29 59.97 162.75 146.32 53.16 12.88 565.762002 17.78 29.95 30.24 21.07 30.11 27.79 25.15 70.01 148.13 115.76 59.23 18.72 594.142003 34.36 33.41 37.34 32.69 12.56 14.02 27.27 17.97 79.99 134.88 33.51 39.61 497.642004 36.61 10.62 14.09 15.94 12.51 31.34 33.94 64.55 123.53 124.81 20.45 27.19 514.042005 19.55 13.16 13.12 52.64 21.94 30.69 67.55 28.50 Data 248 226 248 240 247 270 277 277 229 235 233 217 2947Months 8 8 8 8 8 9 9 9 8 8 8 8 MEAN 21.50 16.30 16.00 20.49 29.02 39.72 50.51 59.95 130.67 146.73 71.58 30.02 664.20MAX 36.61 33.41 37.34 52.64 122.62 125.53 143.99 133.52 162.75 231.31 172.58 74.73 974.15MIN 5.17 1.23 2.01 1.43 7.53 8.63 18.21 17.97 79.99 112.36 20.45 12.88 497.6420 PERCENTILE 14.07 10.03 6.13 11.56 11.03 17.94 23.61 42.33 99.41 119.38 36.93 16.45 514.0480 PERCENTILE 30.94 24.50 25.63 28.04 26.84 46.12 71.70 66.74 151.94 155.67 97.53 37.13 839.49
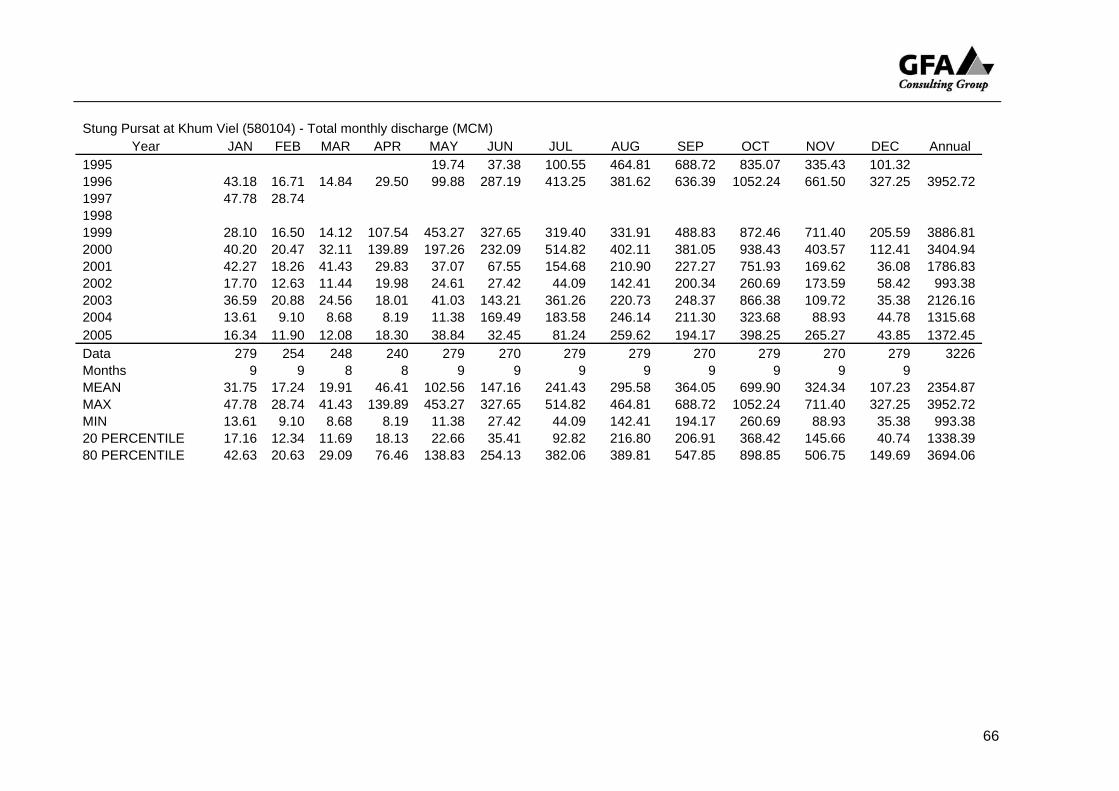
66
Stung Pursat at Khum Viel (580104) - Total monthly discharge (MCM)
Year JAN FEB MAR APR MAY JUN JUL AUG SEP OCT NOV DEC Annual 1995 19.74 37.38 100.55 464.81 688.72 835.07 335.43 101.32 1996 43.18 16.71 14.84 29.50 99.88 287.19 413.25 381.62 636.39 1052.24 661.50 327.25 3952.721997 47.78 28.74 1998 1999 28.10 16.50 14.12 107.54 453.27 327.65 319.40 331.91 488.83 872.46 711.40 205.59 3886.812000 40.20 20.47 32.11 139.89 197.26 232.09 514.82 402.11 381.05 938.43 403.57 112.41 3404.942001 42.27 18.26 41.43 29.83 37.07 67.55 154.68 210.90 227.27 751.93 169.62 36.08 1786.832002 17.70 12.63 11.44 19.98 24.61 27.42 44.09 142.41 200.34 260.69 173.59 58.42 993.382003 36.59 20.88 24.56 18.01 41.03 143.21 361.26 220.73 248.37 866.38 109.72 35.38 2126.162004 13.61 9.10 8.68 8.19 11.38 169.49 183.58 246.14 211.30 323.68 88.93 44.78 1315.682005 16.34 11.90 12.08 18.30 38.84 32.45 81.24 259.62 194.17 398.25 265.27 43.85 1372.45Data 279 254 248 240 279 270 279 279 270 279 270 279 3226Months 9 9 8 8 9 9 9 9 9 9 9 9 MEAN 31.75 17.24 19.91 46.41 102.56 147.16 241.43 295.58 364.05 699.90 324.34 107.23 2354.87MAX 47.78 28.74 41.43 139.89 453.27 327.65 514.82 464.81 688.72 1052.24 711.40 327.25 3952.72MIN 13.61 9.10 8.68 8.19 11.38 27.42 44.09 142.41 194.17 260.69 88.93 35.38 993.3820 PERCENTILE 17.16 12.34 11.69 18.13 22.66 35.41 92.82 216.80 206.91 368.42 145.66 40.74 1338.3980 PERCENTILE 42.63 20.63 29.09 76.46 138.83 254.13 382.06 389.81 547.85 898.85 506.75 149.69 3694.06
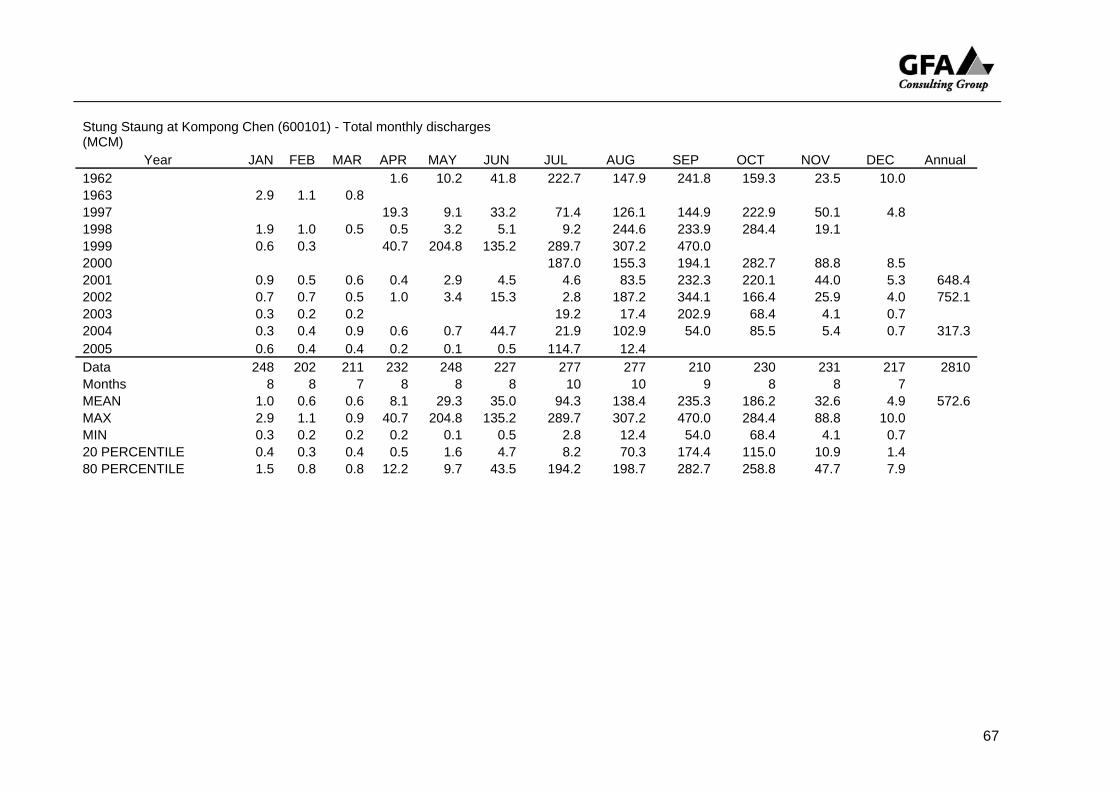
67
Stung Staung at Kompong Chen (600101) - Total monthly discharges (MCM)
Year JAN FEB MAR APR MAY JUN JUL AUG SEP OCT NOV DEC Annual 1962 1.6 10.2 41.8 222.7 147.9 241.8 159.3 23.5 10.0 1963 2.9 1.1 0.8 1997 19.3 9.1 33.2 71.4 126.1 144.9 222.9 50.1 4.8 1998 1.9 1.0 0.5 0.5 3.2 5.1 9.2 244.6 233.9 284.4 19.1 1999 0.6 0.3 40.7 204.8 135.2 289.7 307.2 470.0 2000 187.0 155.3 194.1 282.7 88.8 8.5 2001 0.9 0.5 0.6 0.4 2.9 4.5 4.6 83.5 232.3 220.1 44.0 5.3 648.42002 0.7 0.7 0.5 1.0 3.4 15.3 2.8 187.2 344.1 166.4 25.9 4.0 752.12003 0.3 0.2 0.2 19.2 17.4 202.9 68.4 4.1 0.7 2004 0.3 0.4 0.9 0.6 0.7 44.7 21.9 102.9 54.0 85.5 5.4 0.7 317.32005 0.6 0.4 0.4 0.2 0.1 0.5 114.7 12.4 Data 248 202 211 232 248 227 277 277 210 230 231 217 2810Months 8 8 7 8 8 8 10 10 9 8 8 7 MEAN 1.0 0.6 0.6 8.1 29.3 35.0 94.3 138.4 235.3 186.2 32.6 4.9 572.6MAX 2.9 1.1 0.9 40.7 204.8 135.2 289.7 307.2 470.0 284.4 88.8 10.0 MIN 0.3 0.2 0.2 0.2 0.1 0.5 2.8 12.4 54.0 68.4 4.1 0.7 20 PERCENTILE 0.4 0.3 0.4 0.5 1.6 4.7 8.2 70.3 174.4 115.0 10.9 1.4 80 PERCENTILE 1.5 0.8 0.8 12.2 9.7 43.5 194.2 198.7 282.7 258.8 47.7 7.9

68
Stung Chikreng at Kompong K'dei (570101) - Total monthly discharges (MCM)
Year JAN FEB MAR APR MAY JUN JUL AUG SEP OCT NOV DEC Annual 1962 0.3 2.1 24.2 199.5 129.3 321.8 196.3 50.0 10.4 1963 2.2 0.9 1.6 1997 20.0 15.5 43.1 31.9 81.1 15.2 7.4 1998 4.6 1.6 0.3 0.1 0.0 0.2 1.1 2.1 28.1 44.1 7.3 1999 5.6 2.7 3.0 1.1 19.8 64.0 102.2 7.3 2000 5.4 2.4 0.3 0.2 11.5 4.3 7.4 30.7 89.4 121.3 15.1 2001 6.8 3.4 1.3 0.3 0.3 0.3 0.4 15.1 58.7 101.3 27.0 7.8 221.72002 5.5 1.6 0.3 0.2 0.3 0.4 0.4 10.7 154.3 80.2 17.9 8.5 211.92003 5.8 1.8 0.5 0.4 0.3 0.3 0.5 0.4 4.9 15.2 8.4 5.9 44.52004 1.8 0.2 0.1 0.0 0.0 3.5 0.5 5.0 20.1 28.5 8.3 6.6 74.42005 4.4 2.2 0.4 0.7 1.3 2.6 1.4 72.1 53.9 13.8 9.6 Data 275 254 248 256 248 270 275 276 282 294 298 248 3224Months 9 9 8 9 8 9 9 9 10 10 10 8 MEAN 4.7 1.9 0.9 0.3 1.9 6.1 25.3 26.4 80.1 78.6 26.5 7.9 138.1MAX 6.8 3.4 3.0 1.1 11.5 24.2 199.5 129.3 321.8 196.3 102.2 10.4 MIN 1.8 0.2 0.1 0.0 0.0 0.2 0.4 0.4 4.9 15.2 7.3 5.9 20 PERCENTILE 3.5 1.3 0.3 0.1 0.1 0.3 0.5 1.8 20.1 41.0 8.4 6.9 80 PERCENTILE 5.7 2.5 1.5 0.4 1.5 10.6 10.6 35.7 102.4 105.3 31.6 9.1

69
Stung Sen at Kompong Putrea (610102) - total monthly discharge (MCM) Year JAN FEB MAR APR MAY JUN JUL AUG SEP OCT NOV DEC Annual 1965 5.9 3.7 3.1 4.7 77.6 187.0 432.2 585.8 1326.0 561.3 22.4 9.8 3219.21966 7.3 4.9 27.3 40.1 372.0 98.3 1063.8 3185.0 2531.2 465.1 44.8 19.8 7859.71967 13.2 6.4 5.0 255.8 101.5 219.3 169.1 1053.0 1839.2 862.6 30.7 10.2 4565.81968 6.8 4.7 3.6 3.8 53.4 168.4 215.0 1055.0 1564.9 760.4 16.8 8.8 3851.21969 6.1 4.3 3.2 19.5 28.0 302.4 867.6 589.9 1611.8 1406.0 199.4 6.6 5044.81999 211.9 500.3 1156.0 472.2 552.8 796.8 1383.0 704.3 119.5 2000 2.8 1.4 371.6 544.9 1053.5 2327.7 1790.1 2031.0 1312.6 1194.2 905.5 2001 670.7 6.9 162.8 572.1 1312.5 2237.1 2002 65.7 0.8 13.7 128.9 409.4 560.6 1485.3 2499.3 1454.6 458.5 208.0 2003 30.4 11.9 2.7 46.8 45.9 318.6 1029.4 1343.6 1540.5 995.0 738.8 572.1 6961.62004 399.1 194.2 Data 306 214 182 246 299 300 304 301 249 274 270 279 3224Months 10 9 6 10 10 10 10 10 9 9 9 9 MEAN 120.8 25.8 7.5 97.5 201.5 448.5 845.0 1387.8 1749.0 1022.3 378.9 206.7 5250.4MAX 670.7 194.2 27.3 371.6 544.9 1156.0 2327.7 3185.0 2531.2 1454.6 1194.2 905.5 7859.7MIN 2.8 0.8 2.7 3.8 28.0 98.3 169.1 552.8 796.8 465.1 16.8 6.6 3219.220 PERCENTILE 6.1 2.7 3.1 6.4 51.9 183.3 388.7 589.1 1454.7 680.7 27.4 9.4 3851.280 PERCENTILE 132.4 8.6 5.0 220.7 397.7 668.4 1113.6 1879.5 2218.3 1392.2 718.1 353.6 6961.6
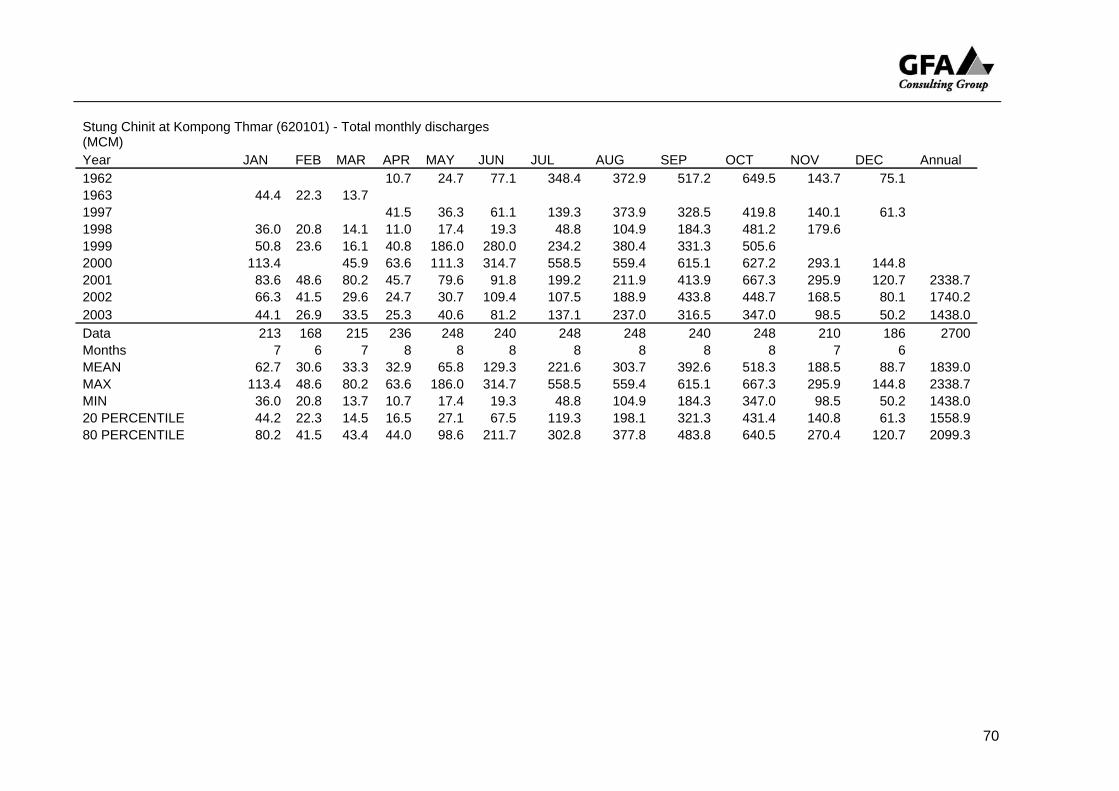
70
Stung Chinit at Kompong Thmar (620101) - Total monthly discharges (MCM) Year JAN FEB MAR APR MAY JUN JUL AUG SEP OCT NOV DEC Annual 1962 10.7 24.7 77.1 348.4 372.9 517.2 649.5 143.7 75.1 1963 44.4 22.3 13.7 1997 41.5 36.3 61.1 139.3 373.9 328.5 419.8 140.1 61.3 1998 36.0 20.8 14.1 11.0 17.4 19.3 48.8 104.9 184.3 481.2 179.6 1999 50.8 23.6 16.1 40.8 186.0 280.0 234.2 380.4 331.3 505.6 2000 113.4 45.9 63.6 111.3 314.7 558.5 559.4 615.1 627.2 293.1 144.8 2001 83.6 48.6 80.2 45.7 79.6 91.8 199.2 211.9 413.9 667.3 295.9 120.7 2338.72002 66.3 41.5 29.6 24.7 30.7 109.4 107.5 188.9 433.8 448.7 168.5 80.1 1740.22003 44.1 26.9 33.5 25.3 40.6 81.2 137.1 237.0 316.5 347.0 98.5 50.2 1438.0Data 213 168 215 236 248 240 248 248 240 248 210 186 2700Months 7 6 7 8 8 8 8 8 8 8 7 6 MEAN 62.7 30.6 33.3 32.9 65.8 129.3 221.6 303.7 392.6 518.3 188.5 88.7 1839.0MAX 113.4 48.6 80.2 63.6 186.0 314.7 558.5 559.4 615.1 667.3 295.9 144.8 2338.7MIN 36.0 20.8 13.7 10.7 17.4 19.3 48.8 104.9 184.3 347.0 98.5 50.2 1438.020 PERCENTILE 44.2 22.3 14.5 16.5 27.1 67.5 119.3 198.1 321.3 431.4 140.8 61.3 1558.980 PERCENTILE 80.2 41.5 43.4 44.0 98.6 211.7 302.8 377.8 483.8 640.5 270.4 120.7 2099.3

71
Sen River at Kompong Thom (610101) - Total monthly discharges (MCM)
Year JAN FEB MAR APR MAY JUN JUL AUG SEP OCT NOV DEC Annual 1961 210.4 544.8 1232.3 1882.6 2117.8 1730.9 351.5 103.4 1962 44.7 20.4 19.7 16.8 88.6 720.9 1526.6 1848.2 1503.2 1819.7 188.0 110.1 7906.71963 62.4 22.4 9.9 15.7 17.9 80.9 478.3 1159.6 1824.2 1125.7 139.0 77.7 5013.61964 37.7 17.6 13.7 13.3 222.7 524.8 466.7 1021.2 1158.1 289.1 163.0 85.9 3258.91965 44.1 18.9 13.9 13.1 51.5 225.7 707.5 1023.2 1667.7 653.0 100.6 59.6 4579.01966 18.9 18.5 28.1 49.0 416.4 165.4 895.4 2219.1 2175.4 1009.2 101.7 28.6 7125.61967 13.5 18.5 18.1 190.0 161.5 306.0 354.0 1028.2 1884.6 1310.6 77.2 14.2 5376.31968 20.7 20.6 17.7 17.0 74.9 350.4 373.9 1219.8 1663.1 857.9 39.7 22.1 4665.11969 22.3 16.3 15.9 13.8 65.2 311.6 1031.8 997.2 1471.8 1751.4 215.0 36.4 5948.61970 48.0 20.0 15.3 14.2 1981 32.4 256.4 414.9 1106.4 1321.5 1515.1 650.8 264.3 1982 85.2 21.3 12.6 74.3 29.6 100.9 1076.6 555.1 2013.6 1756.5 604.5 246.1 6576.51983 68.2 21.4 15.7 11.7 15.6 89.4 922.8 1626.4 1449.9 2189.7 1177.8 401.0 7989.61984 128.0 34.3 16.8 14.5 62.8 397.0 303.3 953.6 2152.3 1952.6 799.0 264.8 7059.61985 81.3 21.3 14.4 17.4 180.2 398.7 505.9 1059.0 1293.8 1464.0 584.7 248.2 5868.81986 84.9 21.3 13.0 10.8 29.6 245.0 442.5 1494.2 2081.5 1796.2 570.1 233.3 7022.41987 63.4 18.2 13.8 12.0 17.7 55.7 259.6 131.3 1622.7 1436.7 497.9 182.3 4317.31988 51.6 15.5 10.5 21.4 26.1 183.0 283.2 778.3 650.8 1782.0 599.4 132.2 4706.41989 35.5 13.5 12.5 12.5 25.6 49.7 267.5 933.8 1673.1 1380.9 428.1 158.8 4991.81990 42.8 15.2 18.7 15.0 15.3 518.8 384.6 1657.0 1754.7 2050.6 955.3 331.9 7779.61991 103.1 26.9 15.0 12.5 12.1 104.4 146.4 696.5 1918.5 2148.4 893.1 303.3 6393.01992 97.1 28.5 17.3 14.4 21.7 92.9 58.3 971.9 2022.8 1479.8 303.7 109.7 5203.81993 32.5 15.3 16.2 17.6 25.7 147.6 1150.0 626.0 1353.2 1288.1 400.9 146.5 5233.41994 43.0 16.1 15.4 19.9 28.5 182.1 492.9 826.9 1942.6 1869.4 648.5 231.1 6316.71995 72.5 19.6 13.3 12.0 16.6 39.4 101.2 732.6 1795.4 2182.1 967.2 344.1 6296.21996 110.3 28.8 12.8 11.9 94.9 395.5 199.3 731.9 1326.1 2110.2 1787.9 641.1 7430.51997 224.2 65.4 21.8 18.5 25.2 86.5 594.4 1818.3 1661.9 2171.6 640.2 229.5 7205.01998 68.4 19.0 13.0 10.8 15.5 1999 32.3 13.7 12.5 44.5 248.5 409.1 1026.0 2000 163.0 45.5 1980.8 1960.5 2223.4 2294.9 1345.1 483.4 2001 164.9 46.4 29.8 19.8 41.0 218.3 1285.4 1798.6 2098.6 2120.1 1233.3 420.7 9476.92002 142.0 40.4 19.6 16.0 28.4 191.5 247.0 1181.3 2066.9 2069.7 807.6 321.9 7132.2
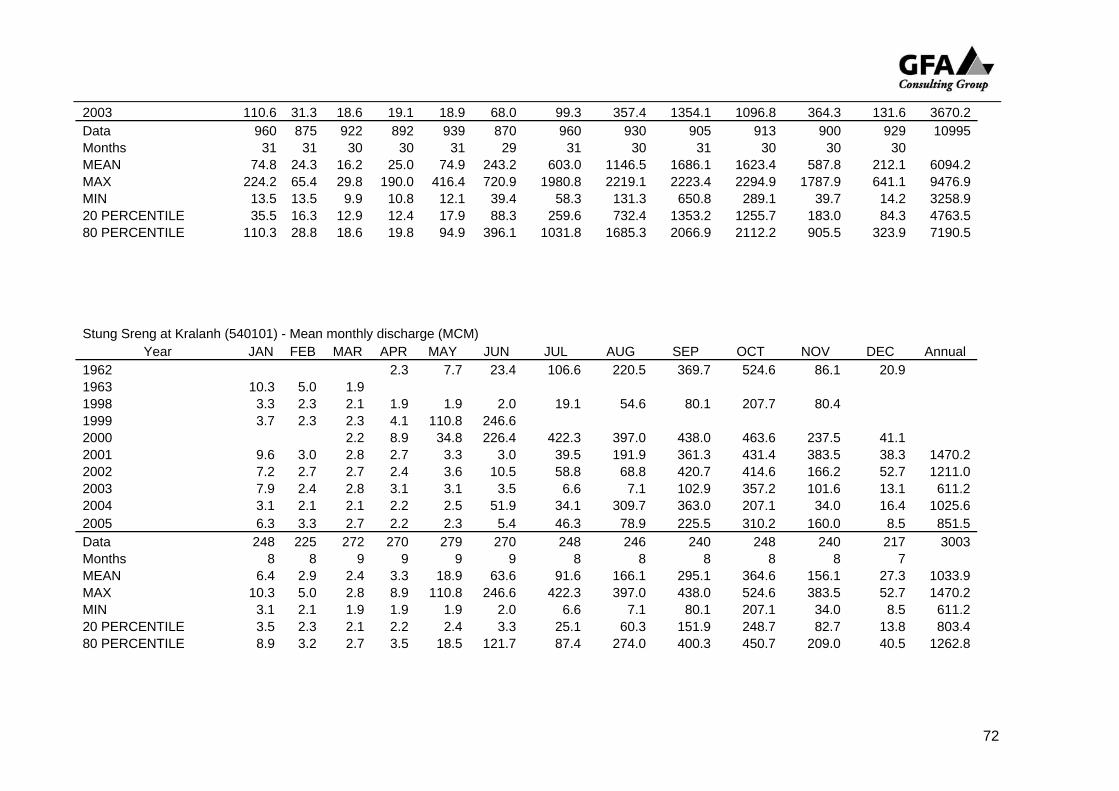
72
2003 110.6 31.3 18.6 19.1 18.9 68.0 99.3 357.4 1354.1 1096.8 364.3 131.6 3670.2Data 960 875 922 892 939 870 960 930 905 913 900 929 10995Months 31 31 30 30 31 29 31 30 31 30 30 30 MEAN 74.8 24.3 16.2 25.0 74.9 243.2 603.0 1146.5 1686.1 1623.4 587.8 212.1 6094.2MAX 224.2 65.4 29.8 190.0 416.4 720.9 1980.8 2219.1 2223.4 2294.9 1787.9 641.1 9476.9MIN 13.5 13.5 9.9 10.8 12.1 39.4 58.3 131.3 650.8 289.1 39.7 14.2 3258.920 PERCENTILE 35.5 16.3 12.9 12.4 17.9 88.3 259.6 732.4 1353.2 1255.7 183.0 84.3 4763.580 PERCENTILE 110.3 28.8 18.6 19.8 94.9 396.1 1031.8 1685.3 2066.9 2112.2 905.5 323.9 7190.5
Stung Sreng at Kralanh (540101) - Mean monthly discharge (MCM)
Year JAN FEB MAR APR MAY JUN JUL AUG SEP OCT NOV DEC Annual 1962 2.3 7.7 23.4 106.6 220.5 369.7 524.6 86.1 20.9 1963 10.3 5.0 1.9 1998 3.3 2.3 2.1 1.9 1.9 2.0 19.1 54.6 80.1 207.7 80.4 1999 3.7 2.3 2.3 4.1 110.8 246.6 2000 2.2 8.9 34.8 226.4 422.3 397.0 438.0 463.6 237.5 41.1 2001 9.6 3.0 2.8 2.7 3.3 3.0 39.5 191.9 361.3 431.4 383.5 38.3 1470.22002 7.2 2.7 2.7 2.4 3.6 10.5 58.8 68.8 420.7 414.6 166.2 52.7 1211.02003 7.9 2.4 2.8 3.1 3.1 3.5 6.6 7.1 102.9 357.2 101.6 13.1 611.22004 3.1 2.1 2.1 2.2 2.5 51.9 34.1 309.7 363.0 207.1 34.0 16.4 1025.62005 6.3 3.3 2.7 2.2 2.3 5.4 46.3 78.9 225.5 310.2 160.0 8.5 851.5Data 248 225 272 270 279 270 248 246 240 248 240 217 3003Months 8 8 9 9 9 9 8 8 8 8 8 7 MEAN 6.4 2.9 2.4 3.3 18.9 63.6 91.6 166.1 295.1 364.6 156.1 27.3 1033.9MAX 10.3 5.0 2.8 8.9 110.8 246.6 422.3 397.0 438.0 524.6 383.5 52.7 1470.2MIN 3.1 2.1 1.9 1.9 1.9 2.0 6.6 7.1 80.1 207.1 34.0 8.5 611.220 PERCENTILE 3.5 2.3 2.1 2.2 2.4 3.3 25.1 60.3 151.9 248.7 82.7 13.8 803.480 PERCENTILE 8.9 3.2 2.7 3.5 18.5 121.7 87.4 274.0 400.3 450.7 209.0 40.5 1262.8
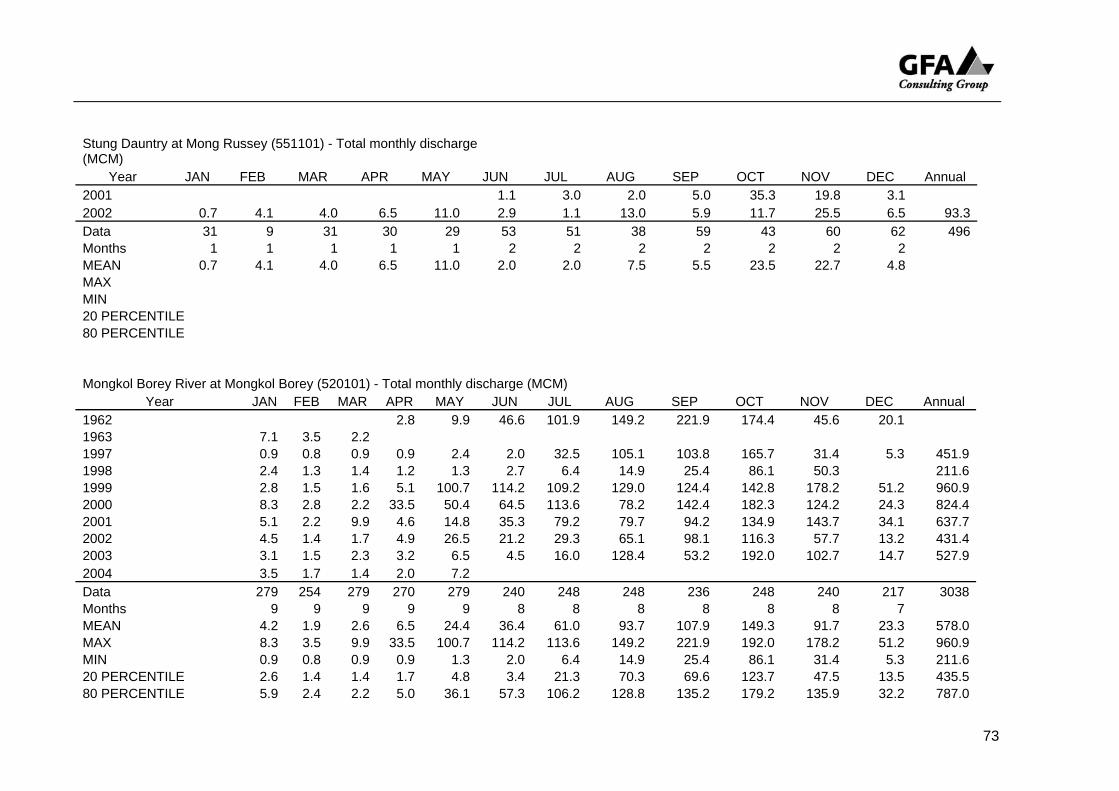
73
Stung Dauntry at Mong Russey (551101) - Total monthly discharge (MCM)
Year JAN FEB MAR APR MAY JUN JUL AUG SEP OCT NOV DEC Annual 2001 1.1 3.0 2.0 5.0 35.3 19.8 3.1 2002 0.7 4.1 4.0 6.5 11.0 2.9 1.1 13.0 5.9 11.7 25.5 6.5 93.3Data 31 9 31 30 29 53 51 38 59 43 60 62 496Months 1 1 1 1 1 2 2 2 2 2 2 2 MEAN M
0.7 4.1 4.0 6.5 11.0 2.0 2.0 7.5 5.5 23.5 22.7 4.8 AX
MIN
20 PERCENTILE 80 PERCENTILE
Mongkol Borey River at Mongkol Borey (520101) - Total monthly discharge (MCM)
Year JAN FEB MAR APR MAY JUN JUL AUG SEP OCT NOV DEC Annual 1962 2.8 9.9 46.6 101.9 149.2 221.9 174.4 45.6 20.1 1963 7.1 3.5 2.2 1997 0.9 0.8 0.9 0.9 2.4 2.0 32.5 105.1 103.8 165.7 31.4 5.3 451.91998 2.4 1.3 1.4 1.2 1.3 2.7 6.4 14.9 25.4 86.1 50.3 211.61999 2.8 1.5 1.6 5.1 100.7 114.2 109.2 129.0 124.4 142.8 178.2 51.2 960.92000 8.3 2.8 2.2 33.5 50.4 64.5 113.6 78.2 142.4 182.3 124.2 24.3 824.42001 5.1 2.2 9.9 4.6 14.8 35.3 79.2 79.7 94.2 134.9 143.7 34.1 637.72002 4.5 1.4 1.7 4.9 26.5 21.2 29.3 65.1 98.1 116.3 57.7 13.2 431.42003 3.1 1.5 2.3 3.2 6.5 4.5 16.0 128.4 53.2 192.0 102.7 14.7 527.92004 3.5 1.7 1.4 2.0 7.2 Data 279 254 279 270 279 240 248 248 236 248 240 217 3038Months 9 9 9 9 9 8 8 8 8 8 8 7 MEAN 4.2 1.9 2.6 6.5 24.4 36.4 61.0 93.7 107.9 149.3 91.7 23.3 578.0MAX 8.3 3.5 9.9 33.5 100.7 114.2 113.6 149.2 221.9 192.0 178.2 51.2 960.9MIN 0.9 0.8 0.9 0.9 1.3 2.0 6.4 14.9 25.4 86.1 31.4 5.3 211.620 PERCENTILE 2.6 1.4 1.4 1.7 4.8 3.4 21.3 70.3 69.6 123.7 47.5 13.5 435.580 PERCENTILE 5.9 2.4 2.2 5.0 36.1 57.3 106.2 128.8 135.2 179.2 135.9 32.2 787.0
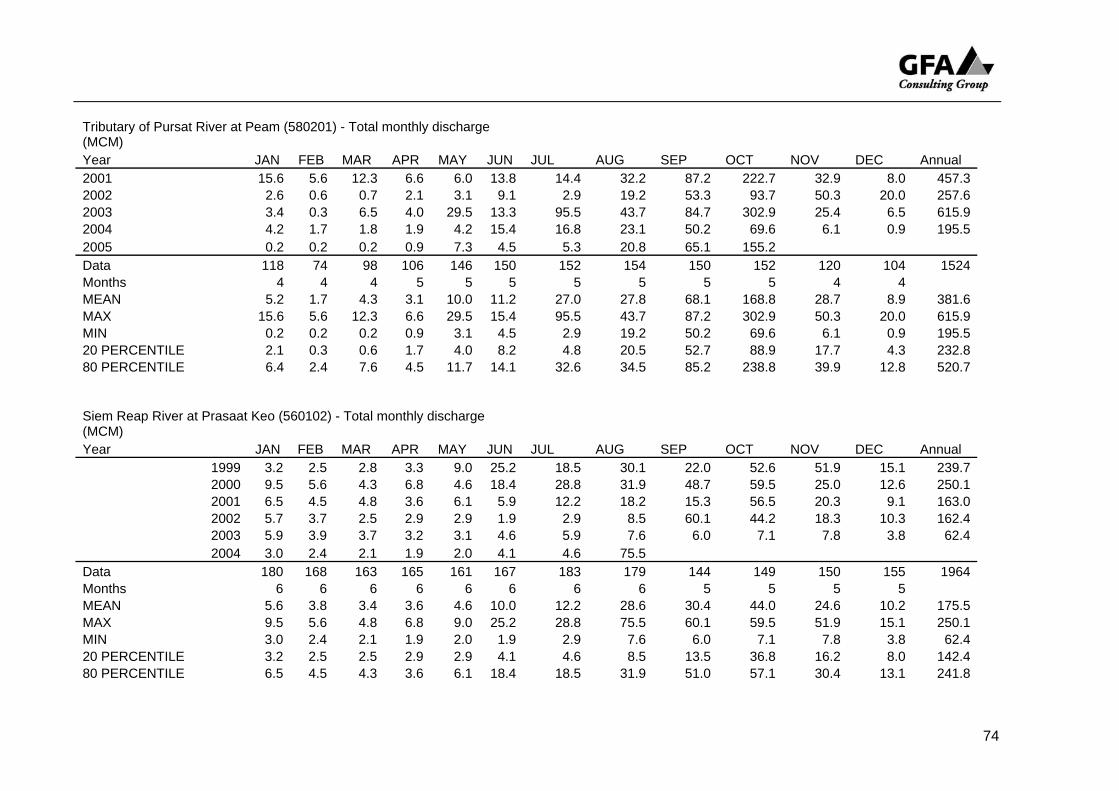
74
Tributary of Pursat River at Peam (580201) - Total monthly discharge (MCM) Year JAN FEB MAR APR MAY JUN JUL AUG SEP OCT NOV DEC Annual 2001 15.6 5.6 12.3 6.6 6.0 13.8 14.4 32.2 87.2 222.7 32.9 8.0 457.32002 2.6 0.6 0.7 2.1 3.1 9.1 2.9 19.2 53.3 93.7 50.3 20.0 257.62003 3.4 0.3 6.5 4.0 29.5 13.3 95.5 43.7 84.7 302.9 25.4 6.5 615.92004 4.2 1.7 1.8 1.9 4.2 15.4 16.8 23.1 50.2 69.6 6.1 0.9 195.52005 0.2 0.2 0.2 0.9 7.3 4.5 5.3 20.8 65.1 155.2 Data 118 74 98 106 146 150 152 154 150 152 120 104 1524Months 4 4 4 5 5 5 5 5 5 5 4 4 MEAN 5.2 1.7 4.3 3.1 10.0 11.2 27.0 27.8 68.1 168.8 28.7 8.9 381.6MAX 15.6 5.6 12.3 6.6 29.5 15.4 95.5 43.7 87.2 302.9 50.3 20.0 615.9MIN 0.2 0.2 0.2 0.9 3.1 4.5 2.9 19.2 50.2 69.6 6.1 0.9 195.520 PERCENTILE 2.1 0.3 0.6 1.7 4.0 8.2 4.8 20.5 52.7 88.9 17.7 4.3 232.880 PERCENTILE 6.4 2.4 7.6 4.5 11.7 14.1 32.6 34.5 85.2 238.8 39.9 12.8 520.7
Siem Reap River at Prasaat Keo (560102) - Total monthly discharge (MCM) Year JAN FEB MAR APR MAY JUN JUL AUG SEP OCT NOV DEC Annual
1999 3.2 2.5 2.8 3.3 9.0 25.2 18.5 30.1 22.0 52.6 51.9 15.1 239.72000 9.5 5.6 4.3 6.8 4.6 18.4 28.8 31.9 48.7 59.5 25.0 12.6 250.12001 6.5 4.5 4.8 3.6 6.1 5.9 12.2 18.2 15.3 56.5 20.3 9.1 163.02002 5.7 3.7 2.5 2.9 2.9 1.9 2.9 8.5 60.1 44.2 18.3 10.3 162.42003 5.9 3.9 3.7 3.2 3.1 4.6 5.9 7.6 6.0 7.1 7.8 3.8 62.42004 3.0 2.4 2.1 1.9 2.0 4.1 4.6 75.5
Data 180 168 163 165 161 167 183 179 144 149 150 155 1964Months 6 6 6 6 6 6 6 6 5 5 5 5 MEAN 5.6 3.8 3.4 3.6 4.6 10.0 12.2 28.6 30.4 44.0 24.6 10.2 175.5MAX 9.5 5.6 4.8 6.8 9.0 25.2 28.8 75.5 60.1 59.5 51.9 15.1 250.1MIN 3.0 2.4 2.1 1.9 2.0 1.9 2.9 7.6 6.0 7.1 7.8 3.8 62.420 PERCENTILE 3.2 2.5 2.5 2.9 2.9 4.1 4.6 8.5 13.5 36.8 16.2 8.0 142.480 PERCENTILE 6.5 4.5 4.3 3.6 6.1 18.4 18.5 31.9 51.0 57.1 30.4 13.1 241.8

75
Tributary of Pursat River at Prek Klong (downstream: 580301) - Total monthly discharge (MCM)
Year JAN FEB MAR APR MAY JUN JUL AUG SEP OCT NOV DEC Annual 1994 1.9 4.0 3.9 2.7 23.9 66.7 65.1 16.4 4.9 1995 1.8 1.1 0.6 1.1 2.1 6.6 16.0 66.8 118.3 178.8 54.2 17.5 432.71996 9.5 2.8 1.4 3.7 11.8 52.9 96.3 60.2 117.6 200.0 203.2 259.0 956.51997 26.9 7.3 2001 14.2 8.7 17.8 11.4 11.2 11.2 10.3 48.6 87.2 139.5 37.1 14.1 411.22002 10.0 5.5 3.3 3.2 6.7 10.7 12.5 17.9 55.5 60.9 23.5 52.3 262.12003 16.4 8.4 10.2 10.4 13.0 13.6 27.1 17.1 46.6 191.5 33.1 8.4 385.72004 6.5 4.9 5.9 3.9 4.4 10.4 9.1 14.1 36.1 124.8 9.7 5.3 234.62005 2.5 1.3 1.7 1.8 6.3 7.9 8.9 10.3 55.7 69.9 Data 248 226 217 240 248 240 248 248 240 228 210 214 2807Months 8 8 7 8 8 8 8 8 8 8 7 7 MEAN 11.0 5.0 5.8 4.7 7.4 14.6 22.9 32.4 73.0 128.8 53.9 51.6 447.1MAX 26.9 8.7 17.8 11.4 13.0 52.9 96.3 66.8 118.3 200.0 203.2 259.0 956.5MIN 1.8 1.1 0.6 1.1 2.1 3.9 2.7 10.3 36.1 60.9 9.7 4.9 234.620 PERCENTILE 4.1 1.9 1.5 1.8 4.2 7.1 9.0 15.3 50.2 67.0 17.8 5.9 262.180 PERCENTILE 15.5 8.0 9.3 7.8 11.5 12.6 22.7 55.6 105.4 186.4 50.8 45.3 432.7
Stung Pursat at Pursat station (580101) - Total monthly discharge (MCM)
Year JAN FEB MAR APR MAY JUN JUL AUG SEP OCT NOV DEC Annual 1962 17.2 48.6 74.4 253.5 273.1 394.6 631.0 84.8 18.1 1963 3.6 0.4 5.0 1972 129.9 70.2 119.8 111.9 106.5 324.2 470.4 582.2 411.1 1973 43.2 17.3 6.3 8.3 71.0 130.8 172.0 309.5 443.3 521.5 496.7 108.1 2193.61974 38.1 19.5 14.0 Data 93 84 71 90 93 90 93 93 88 90 82 93 1060Months 3 3 3 3 3 3 3 3 3 3 3 3 MEAN 28.3 12.4 8.4 51.8 63.2 108.3 179.1 229.7 387.3 541.0 387.9 179.1 MAX 43.2 19.5 14.0 129.9 71.0 130.8 253.5 309.5 443.3 631.0 582.2 411.1 MIN 3.6 0.4 5.0 8.3 48.6 74.4 111.9 106.5 324.2 470.4 84.8 18.1 20 PERCENTILE 17.4 7.2 5.5 11.9 57.2 92.5 135.9 173.2 352.3 490.9 249.6 54.1 80 PERCENTILE 41.2 18.6 10.9 84.8 70.7 126.4 220.9 294.9 423.8 587.2 548.0 289.9

76
Sisophon River at Sisophon (530101) - Total monthly discharge (MCM) Year JAN FEB MAR APR MAY JUN JUL AUG SEP OCT NOV DEC Annual
1962 5.0 5.2 137.9 102.6 619.4 388.4 22.5 7.1 1963 2.5 0.9 0.4 1997 1998 1999 2000 2001 2002 2003 2004
Data 31 28 31 30 31 31 31 30 31 30 31 335Months
E1 1 1 1 1 1 1 1 1 1 1 11
M AN Stung Sangke at Sre Ponleu (550103) - Total monthly discharge (MCM)
Year JAN FEB MAR APR MAY JUN JUL AUG SEP OCT NOV DEC Annual 1964 7.2 4.4 3.5 4.0 46.6 39.1 72.0 211.4 144.1 96.3 44.3 14.8 685.91965 7.7 5.7 5.5 3.9 43.1 173.6 130.3 130.1 184.7 105.6 24.8 10.9 825.91966 6.1 4.5 3.9 4.1 31.0 37.2 133.2 198.6 224.2 65.8 31.2 15.5 755.3Data 93 85 93 90 93 90 93 93 90 93 90 93 1096Months 3 3 3 3 3 3 3 3 3 3 3 3 MEAN M
7.0 4.9 4.3 4.0 40.2 83.3 111.8 180.0 184.3 89.2 33.4 13.7 755.7AX
MIN
20 PERCENTILE 80 PERCENTILE
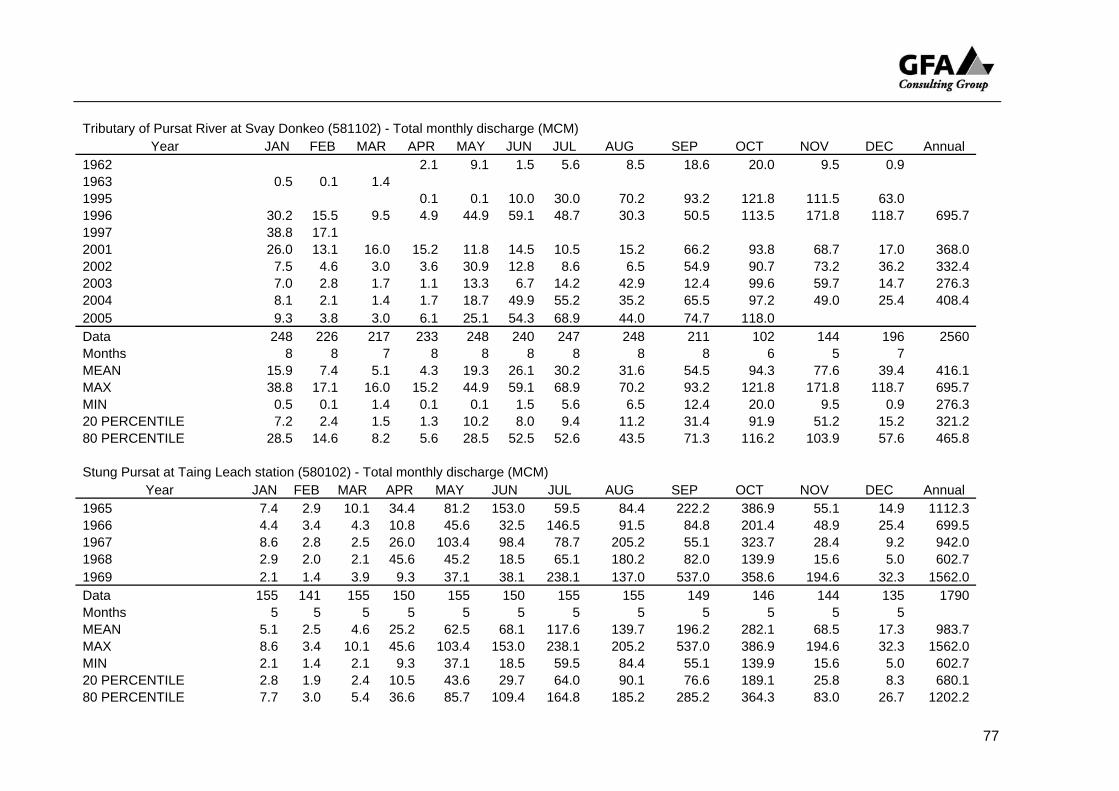
77
Tributary of Pursat River at Svay Donkeo (581102) - Total monthly discharge (MCM)
Year JAN FEB MAR APR MAY JUN JUL AUG SEP OCT NOV DEC Annual 1962 2.1 9.1 1.5 5.6 8.5 18.6 20.0 9.5 0.9 1963 0.5 0.1 1.4 1995 0.1 0.1 10.0 30.0 70.2 93.2 121.8 111.5 63.0 1996 30.2 15.5 9.5 4.9 44.9 59.1 48.7 30.3 50.5 113.5 171.8 118.7 695.71997 38.8 17.1 2001 26.0 13.1 16.0 15.2 11.8 14.5 10.5 15.2 66.2 93.8 68.7 17.0 368.02002 7.5 4.6 3.0 3.6 30.9 12.8 8.6 6.5 54.9 90.7 73.2 36.2 332.42003 7.0 2.8 1.7 1.1 13.3 6.7 14.2 42.9 12.4 99.6 59.7 14.7 276.32004 8.1 2.1 1.4 1.7 18.7 49.9 55.2 35.2 65.5 97.2 49.0 25.4 408.42005 9.3 3.8 3.0 6.1 25.1 54.3 68.9 44.0 74.7 118.0 Data 248 226 217 233 248 240 247 248 211 102 144 196 2560Months 8 8 7 8 8 8 8 8 8 6 5 7 MEAN 15.9 7.4 5.1 4.3 19.3 26.1 30.2 31.6 54.5 94.3 77.6 39.4 416.1MAX 38.8 17.1 16.0 15.2 44.9 59.1 68.9 70.2 93.2 121.8 171.8 118.7 695.7MIN 0.5 0.1 1.4 0.1 0.1 1.5 5.6 6.5 12.4 20.0 9.5 0.9 276.320 PERCENTILE 7.2 2.4 1.5 1.3 10.2 8.0 9.4 11.2 31.4 91.9 51.2 15.2 321.280 PERCENTILE 28.5 14.6 8.2 5.6 28.5 52.5 52.6 43.5 71.3 116.2 103.9 57.6 465.8
Stung Pursat at Taing Leach station (580102) - Total monthly discharge (MCM)
Year JAN FEB MAR APR MAY JUN JUL AUG SEP OCT NOV DEC Annual 1965 7.4 2.9 10.1 34.4 81.2 153.0 59.5 84.4 222.2 386.9 55.1 14.9 1112.31966 4.4 3.4 4.3 10.8 45.6 32.5 146.5 91.5 84.8 201.4 48.9 25.4 699.51967 8.6 2.8 2.5 26.0 103.4 98.4 78.7 205.2 55.1 323.7 28.4 9.2 942.01968 2.9 2.0 2.1 45.6 45.2 18.5 65.1 180.2 82.0 139.9 15.6 5.0 602.71969 2.1 1.4 3.9 9.3 37.1 38.1 238.1 137.0 537.0 358.6 194.6 32.3 1562.0Data 155 141 155 150 155 150 155 155 149 146 144 135 1790Months 5 5 5 5 5 5 5 5 5 5 5 5 MEAN 5.1 2.5 4.6 25.2 62.5 68.1 117.6 139.7 196.2 282.1 68.5 17.3 983.7MAX 8.6 3.4 10.1 45.6 103.4 153.0 238.1 205.2 537.0 386.9 194.6 32.3 1562.0MIN 2.1 1.4 2.1 9.3 37.1 18.5 59.5 84.4 55.1 139.9 15.6 5.0 602.720 PERCENTILE 2.8 1.9 2.4 10.5 43.6 29.7 64.0 90.1 76.6 189.1 25.8 8.3 680.180 PERCENTILE 7.7 3.0 5.4 36.6 85.7 109.4 164.8 185.2 285.2 364.3 83.0 26.7 1202.2

78
Tributary of Stung Pursat at Thlea Maam (downstream: 583020) - Total monthly discharge (MCM)
Year JAN FEB MAR APR MAY JUN JUL AUG SEP OCT NOV DEC Annual 1994 0.93 1.18 2.05 1.34 6.37 57.02 39.56 3.84 0.80 1995 0.88 0.60 0.19 0.21 0.29 0.75 8.79 15.94 49.27 105.66 27.27 1.26 211.291996 0.21 0.23 0.11 0.57 9.21 19.31 39.77 31.39 46.29 111.90 54.82 10.63 323.56Data 62 57 62 90 93 90 93 93 90 93 90 93 1006Months 2 2 2 3 3 3 3 3 3 3 3 3 MEAN 0.55 0.42 0.15 0.57 3.56 7.37 16.63 17.90 50.86 85.71 28.64 4.23 MAX MIN 20 PERCENTILE 80 PERCENTILE
Siem Reap River at UNTAC bridge (560101) - Total monthly discharge (MCM)
Year JAN FEB MAR APR MAY JUN JUL AUG SEP OCT NOV DEC Annual 1998 1999
2000 Discharges are not calculated because ratings are not adequate
2001 2002 2004 D ata Months
E
M M
ANAX
MIN
20 PERCENTILE 80 PERCENTILE

79
Sangke River at Treng (550101) - Total monthly discharge (MCM) JAN FEB MAR APR MAY JUN JUL AUG SEP OCT NOV DEC Annual 1963 27.1 22.4 24.5 22.7 24.5 35.5 156.3 264.1 285.1 269.1 81.5 36.2 1249.11964 29.3 22.6 21.6 21.7 128.7 56.7 99.5 386.6 254.1 214.4 145.2 42.3 1378.11965 32.7 26.9 27.1 27.5 78.2 297.1 260.5 253.0 337.3 322.1 63.9 36.4 1737.01966 27.7 23.5 24.6 32.0 67.4 63.2 242.3 270.9 387.7 174.7 55.9 44.7 1414.41967 29.1 23.6 23.2 41.7 43.4 81.0 227.7 1242.8 365.9 531.7 57.2 39.7 2707.11968 41.2 31.9 23.9 47.2 38.0 30.5 204.9 917.5 410.0 457.8 54.7 42.3 2298.71969 31.9 26.9 26.7 28.0 31.4 90.5 650.5 649.6 991.8 363.2 57.5 37.4 2985.51970 31.9 26.9 26.7 32.1 35.1 135.3 398.6 423.6 491.3 217.2 190.0 559.2 2568.01971 186.6 66.2 29.8 30.0 40.4 264.3 428.7 280.7 323.4 342.2 56.4 48.5 2097.11972 37.8 49.6 39.0 65.4 51.9 120.2 99.1 404.3 581.4 346.0 672.1 569.3 3027.81999 96.9 60.8 72.7 90.6 134.8 525.3 2000 424.3 563.9 688.2 210.4 1181.7 2001 56.4 175.7 99.8 450.5 392.5 1509.9 1354.4 2002 34.6 38.0 62.0 40.8 112.8 227.0 572.1 1407.4 211.8 378.4 191.5 33.2 3227.12003 37.8 63.3 63.5 39.1 92.4 65.9 265.2 649.9 114.0 34.7 33.2 Data 403 367 372 390 403 415 429 401 417 413 349 391 4750Months 13 13 12 13 13 14 14 13 14 14 12 13 MEAN 45.6 39.9 34.9 37.3 70.9 138.8 317.0 579.0 500.7 447.6 138.4 126.9 2244.5MAX 186.6 96.9 63.5 65.4 175.7 424.3 650.5 1407.4 1509.9 1354.4 672.1 569.3 3227.1MIN 27.1 22.4 21.6 21.7 24.5 30.5 99.1 253.0 210.4 114.0 34.7 33.2 1249.120 PERCENTILE 29.1 23.5 24.1 27.7 36.8 61.9 152.0 276.8 272.7 216.1 56.0 36.3 1414.480 PERCENTILE 37.8 57.8 52.1 45.0 100.6 234.5 473.2 779.9 608.8 487.4 181.1 47.7 2985.5

80
A N N E X 2 . S P E C I F I C M O N T H L Y V O L U M E T R I C D I S C H A R G E S
(Based on data presented in Department of Hydrology & River Works Report, River Flow monitoring stations, Tonle Sap Basin, August 2006, MOWRAM)
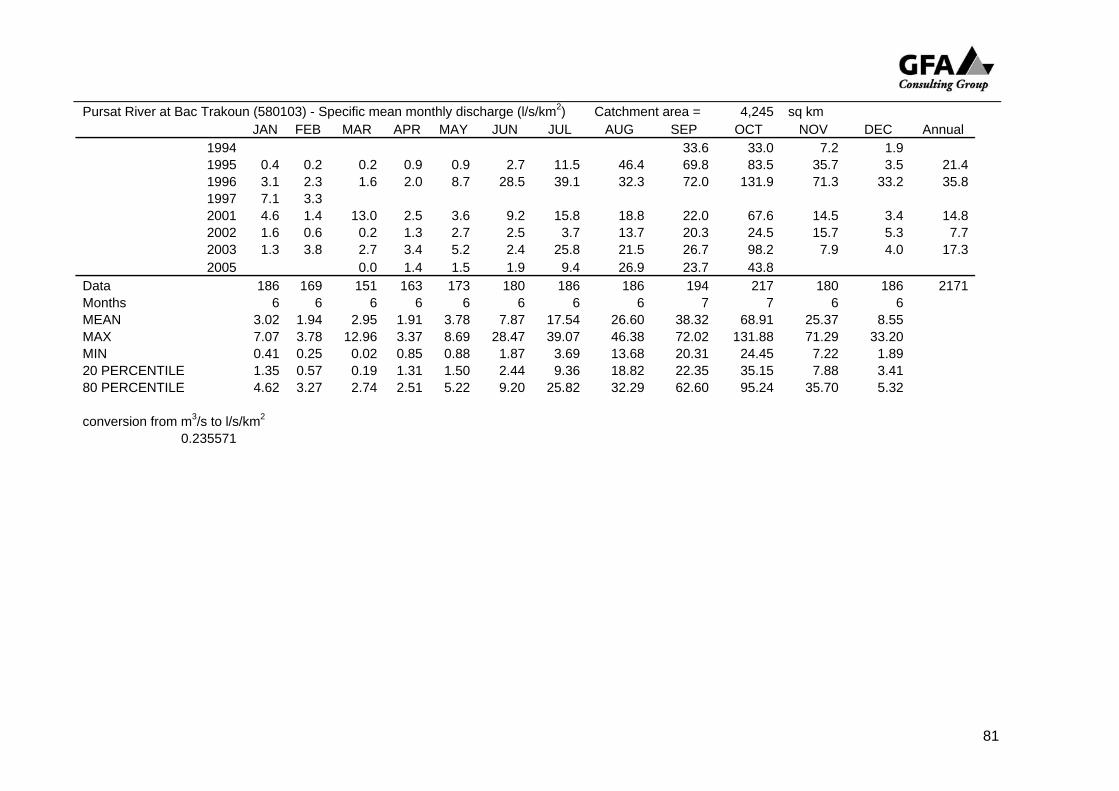
81
Pursat River at Bac Trakoun (580103) - Specific mean monthly discharge (l/s/km2) Catchment area = 4,245 sq km JAN FEB MAR APR MAY JUN JUL AUG SEP OCT NOV DEC Annual
1994 33.6 33.0 7.2 1.9 1995 0.4 0.2 0.2 0.9 0.9 2.7 11.5 46.4 69.8 83.5 35.7 3.5 21.41996 3.1 2.3 1.6 2.0 8.7 28.5 39.1 32.3 72.0 131.9 71.3 33.2 35.81997 7.1 3.3 2001 4.6 1.4 13.0 2.5 3.6 9.2 15.8 18.8 22.0 67.6 14.5 3.4 14.82002 1.6 0.6 0.2 1.3 2.7 2.5 3.7 13.7 20.3 24.5 15.7 5.3 7.72003 1.3 3.8 2.7 3.4 5.2 2.4 25.8 21.5 26.7 98.2 7.9 4.0 17.32005 0.0 1.4 1.5 1.9 9.4 26.9 23.7 43.8
Data 186 169 151 163 173 180 186 186 194 217 180 186 2171Mo nths 6 6 6 6 6 7 7 6 66 6 6 MEAN 3.02 1.94 2.95 1.91 3.78 7.87 17.54 26.60 38.32 68.91 25.37 8.55 MAX 7.07 3.78 12.96 3.37 8.69 28.47 39.07 46.38 72.02 131.88 71.29 33.20 MIN 0.41 0.25 0.02 0.85 0.88 1.87 3.69 13.68 20.31 24.45 7.22 1.89 20 PERCENTILE 1.35 0.57 0.19 1.31 1.50 2.44 9.36 18.82 22.35 35.15 7.88 3.41 80 PERCENTILE 4.62 3.27 2.74 2.51 5.22 9.20 25.82 32.29 62.60 95.24 35.70 5.32 conversion from m3/s to l/s/km2
0.235571

82
Stung Sangke at Battambang (550102) - Specific mean monthly discharge (l/sec/km2) Catchment area = 3,194 sq km
Year JAN FEB MAR APR MAY JUN JUL AUG SEP OCT NOV DEC Annual 1962 1.2 4.1 16.4 42.4 58.1 42.9 27.9 23.3 9.6 1963 1.5 0.8 1.1 1972 2.4 0.8 4.4 11.8 32.7 41.3 40.5 41.5 16.4 1973 0.3 0.3 1.0 20.7 24.9 37.1 25.2 58.1 1981 12.9 25.2 16.2 38.4 41.3 30.5 21.1 1982 1.2 1.5 1.8 1.6 4.7 18.2 34.4 30.9 31.5 17.5 4.7 1983 1.1 0.8 0.6 0.5 0.7 2.5 7.8 44.9 32.0 86.9 48.6 9.8 19.11984 2.4 1.0 0.7 0.9 1.1 18.6 10.7 38.6 44.0 49.8 20.8 5.5 16.21985 1.1 0.6 0.6 1.1 3.2 34.7 24.5 38.2 39.8 58.1 21.3 5.6 19.11986 1.6 0.8 37.4 48.0 37.1 16.1 3.9 1987 0.5 0.2 0.3 0.3 0.3 3.8 28.2 28.5 18.6 29.9 9.3 1988 0.5 0.3 0.2 0.3 3.3 8.8 6.6 1997 0.8 1.2 2.1 9.1 50.2 56.1 50.4 50.3 26.2 5.2 1998 1.3 0.7 0.5 0.5 0.7 1.9 4.0 6.0 22.2 18.8 5.4 1999 0.8 0.5 0.5 4.9 16.6 33.4 26.4 38.8 25.3 44.7 48.5 12.1 21.02000 3.2 1.1 0.9 4.8 8.6 10.1 39.5 35.3 74.1 85.2 43.1 12.8 27.42001 3.1 0.9 3.5 1.2 6.2 13.7 33.3 53.2 52.7 65.3 36.2 10.4 23.52002 2.4 0.7 0.6 1.2 4.4 4.8 11.8 38.0 59.2 57.9 25.4 7.0 17.92003 1.6 0.6 1.4 1.1 2.2 4.1 22.9 49.9 37.8 39.2 10.2 2.9 14.62004 1.0 0.6 0.5 0.7 6.2 19.7 9.0 36.1 28.9 36.1 11.2 2.2 12.72005 0.5 0.4 0.4 0.7 0.5 2.5 21.0 48.8 31.8 Data 465 452 484 532 583 552 530 568 564 519 525 440 6214Months 15 16 17 18 19 19 18 19 19 17 18 15 MEAN 1.50 0.69 0.85 1.38 4.04 12.59 21.16 39.48 39.81 45.78 28.03 7.83 19.06MAX 3.17 1.15 3.51 4.86 16.56 34.71 50.16 58.10 74.06 86.93 58.10 16.42 27.43MIN 0.52 0.19 0.23 0.25 0.32 1.90 3.96 5.95 22.21 18.59 5.40 2.16 12.7120 PERCENTILE 0.71 0.52 0.39 0.52 0.80 3.99 9.68 34.97 28.75 30.67 16.68 4.52 15.5580 PERCENTILE 2.38 0.88 1.03 1.55 6.19 20.07 30.53 49.21 48.97 58.05 42.50 10.77 22.00 conversion from m3/s to l/s/km2
0.313087

83
Stung Boribo at Boribo (590101) - Mean monthly discharges (l/sec/km2) Drainage area = 803 sq km
Year JAN FEB MAR APR MAY JUN JUL AUG SEP OCT NOV DEC Annual 1962 0.7 4.7 9.9 18.3 26.4 71.1 75.1 20.2 7.4 1963 2.4 0.6 0.9 1998 4.1 8.5 24.0 69.8 52.2 50.1 1999 5.4 8.3 2.6 4.5 57.0 60.3 36.2 26.4 74.2 68.3 82.9 34.7 38.52000 9.8 8.1 3.2 7.7 6.9 31.8 66.9 62.1 40.0 107.5 41.9 9.8 33.22001 12.0 5.0 8.7 7.1 3.5 15.7 9.9 27.9 78.2 68.0 25.5 6.0 22.32002 8.3 15.4 14.1 10.1 14.0 13.3 11.7 32.6 71.2 53.8 28.5 8.7 23.52003 16.0 17.2 17.4 15.7 5.8 6.7 12.7 8.4 38.4 62.7 16.1 18.4 19.72004 17.0 5.3 6.6 7.7 5.8 15.1 15.8 30.0 59.4 58.0 9.8 12.6 20.32005 9.1 6.8 6.1 25.3 10.2 14.7 31.4 13.3 Data 248 226 248 240 247 270 277 277 229 235 233 217 2947Months 8 8 8 8 8 9 9 9 8 8 8 8 MEAN 10.00 8.33 7.44 9.84 13.49 19.08 23.49 27.88 62.78 68.22 34.39 13.96 MAX 17.02 17.20 17.36 25.29 57.01 60.31 66.95 62.08 78.19 107.55 82.91 34.74 MIN 2.40 0.64 0.93 0.68 3.50 4.15 8.47 8.36 38.43 52.24 9.83 5.99 20 PERCENTILE 6.54 5.09 2.85 5.55 5.13 8.62 10.98 19.68 47.76 55.51 17.74 7.65 80 PERCENTILE 14.38 12.56 11.92 13.47 12.48 22.16 33.33 31.03 73.00 72.38 46.86 17.26 conversion from m3/s to l/s/km2
1.24533

84
Pursat River at Khum Viel (580104) - Specific mean monthly discharge (l/s/km2) Catchment area = 4,596 sq km Year JAN FEB MAR APR MAY JUN JUL AUG SEP OCT NOV DEC Annual 1995 1.6 3.1 8.2 37.8 57.8 67.8 28.2 8.2 1996 3.5 1.5 1.2 2.5 8.1 24.1 33.6 31.0 53.4 85.5 55.5 26.6 27.31997 3.9 2.6 1998 1999 2.3 1.5 1.1 9.0 36.8 27.5 25.9 27.0 41.0 70.9 59.7 16.7 26.82000 3.3 1.8 2.6 11.7 16.0 19.5 41.8 32.7 32.0 76.2 33.9 9.1 23.52001 3.4 1.6 3.4 2.5 3.0 5.7 12.6 17.1 19.1 61.1 14.2 2.9 12.32002 1.4 1.1 0.9 1.7 2.0 2.3 3.6 11.6 16.8 21.2 14.6 4.7 6.92003 3.0 1.9 2.0 1.5 3.3 12.0 29.3 17.9 20.8 70.4 9.2 2.9 14.72004 1.1 0.8 0.7 0.7 0.9 14.2 14.9 20.0 17.7 26.3 7.5 3.6 9.12005 1.3 1.1 1.0 1.5 3.2 2.7 6.6 21.1 16.3 32.4 22.3 3.6 9.5Data 279 254 248 240 279 270 279 279 270 279 270 279 3226Mo nths 9 9 9 9 9 9 99 8 8 9 9 MEAN 2.6 1.5 1.6 3.9 8.3 12.4 19.6 24.0 30.6 56.9 27.2 8.7 16.2MAX 3.9 2.6 3.4 11.7 36.8 27.5 41.8 37.8 57.8 85.5 59.7 26.6 27.3MIN 1.1 0.8 0.7 0.7 0.9 2.3 3.6 11.6 16.3 21.2 7.5 2.9 6.920 PERCENTILE 1.4 1.1 0.9 1.5 1.8 3.0 7.5 17.6 17.4 29.9 12.2 3.3 9.280 PERCENTILE 3.5 1.8 2.4 6.4 11.3 21.3 31.0 31.7 46.0 73.0 42.5 12.2 25.5 conversion from m3/s to l/s/km2
0.217581

85
Stung Staung at Kompong Chen (600101) - Mean monthly discharges (l/sec/km2) Catchment area = 2,096 sq km
Year JAN FEB MAR APR MAY JUN JUL AUG SEP OCT NOV DEC Annual 1962 0.29 1.81 7.70 39.68 26.35 44.50 28.38 4.32 1.78 1963 0.52 0.22 0.15 1997 3.56 1.62 6.11 12.72 22.46 26.67 39.71 9.22 0.86 1998 0.34 0.19 0.10 0.10 0.57 0.94 1.63 43.58 43.04 50.66 3.51 1999 0.10 0.06 7.50 36.48 24.88 51.61 54.71 86.51 2000 33.31 27.66 35.73 50.36 16.35 1.51 2001 0.16 0.09 0.10 0.08 0.51 0.82 0.81 14.88 42.76 39.21 8.10 0.94 9.812002 0.13 0.13 0.10 0.19 0.61 2.81 0.49 33.35 63.34 29.64 4.77 0.72 11.382003 0.06 0.04 0.03 3.43 3.10 37.35 12.19 0.76 0.13 2004 0.06 0.07 0.16 0.12 0.13 8.22 3.89 18.33 9.95 15.23 1.00 0.13 4.802005 0.10 0.08 0.07 0.03 0.01 0.10 20.43 2.20 Data 217 174 180 202 217 197 260 266 222 217 204 186 2542Mo nths 7 7 7 9 9 8 7 7 67 7 6 MEAN 0.19 0.11 0.10 1.48 5.22 6.45 16.80 24.66 43.32 33.17 6.00 0.87 MAX 0.52 0.22 0.16 7.50 36.48 24.88 51.61 54.71 86.51 50.66 16.35 1.78 MIN 0.06 0.04 0.03 0.03 0.01 0.10 0.49 2.20 9.95 12.19 0.76 0.13 20 PERCENTILE 0.08 0.06 0.07 0.08 0.28 0.87 1.47 12.52 32.11 20.49 2.01 0.25 80 PERCENTILE 0.27 0.17 0.14 2.25 1.74 8.01 34.58 35.40 52.04 46.10 8.77 1.40 conversion from m3/s to l/s/km2
0.477099
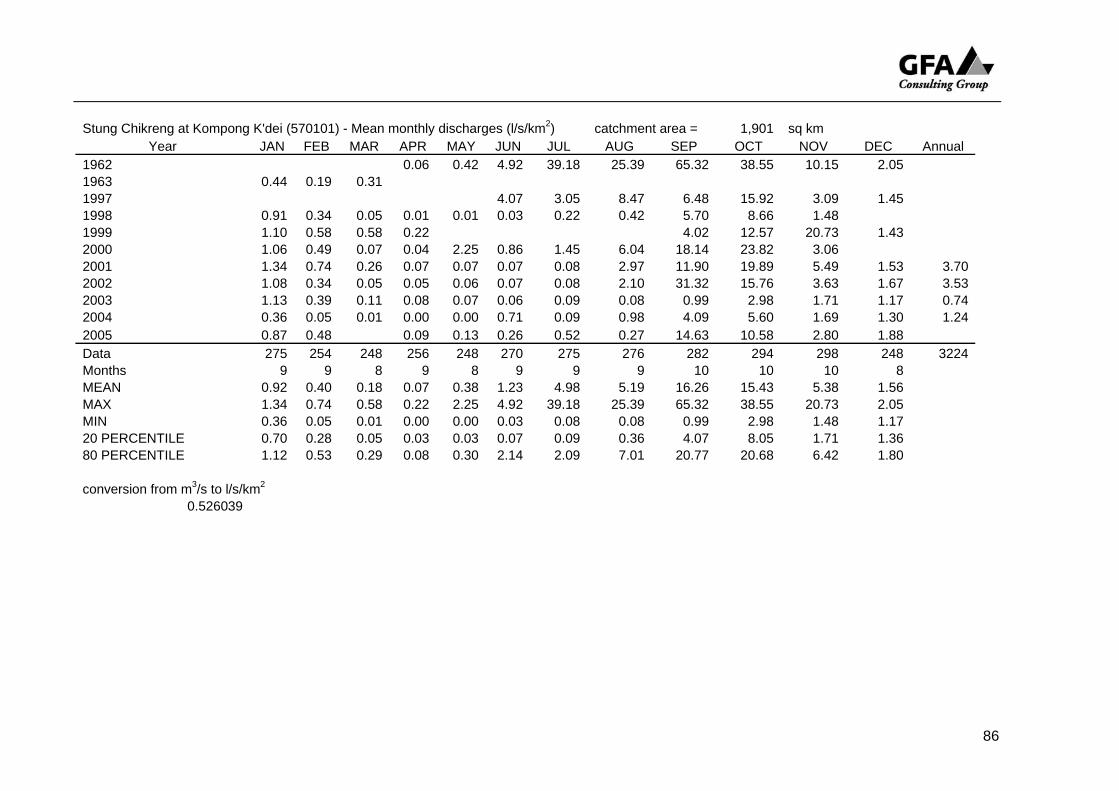
86
Stung Chikreng at Kompong K'dei (570101) - Mean monthly discharges (l/s/km2) catchment area = 1,901 sq km
Year JAN FEB MAR APR MAY JUN JUL AUG SEP OCT NOV DEC Annual 1962 0.06 0.42 4.92 39.18 25.39 65.32 38.55 10.15 2.05 1963 0.44 0.19 0.31 1997 4.07 3.05 8.47 6.48 15.92 3.09 1.45 1998 0.91 0.34 0.05 0.01 0.01 0.03 0.22 0.42 5.70 8.66 1.48 1999 1.10 0.58 0.58 0.22 4.02 12.57 20.73 1.43 2000 1.06 0.49 0.07 0.04 2.25 0.86 1.45 6.04 18.14 23.82 3.06 2001 1.34 0.74 0.26 0.07 0.07 0.07 0.08 2.97 11.90 19.89 5.49 1.53 3.702002 1.08 0.34 0.05 0.05 0.06 0.07 0.08 2.10 31.32 15.76 3.63 1.67 3.532003 1.13 0.39 0.11 0.08 0.07 0.06 0.09 0.08 0.99 2.98 1.71 1.17 0.742004 0.36 0.05 0.01 0.00 0.00 0.71 0.09 0.98 4.09 5.60 1.69 1.30 1.242005 0.87 0.48 0.09 0.13 0.26 0.52 0.27 14.63 10.58 2.80 1.88 Data 275 254 248 256 248 270 275 276 282 294 298 248 3224Months 9 9 8 9 8 9 9 9 10 10 10 8 MEAN 0.92 0.40 0.18 0.07 0.38 1.23 4.98 5.19 16.26 15.43 5.38 1.56 MAX 1.34 0.74 0.58 0.22 2.25 4.92 39.18 25.39 65.32 38.55 20.73 2.05 MIN 0.36 0.05 0.01 0.00 0.00 0.03 0.08 0.08 0.99 2.98 1.48 1.17 20 PERCENTILE 0.70 0.28 0.05 0.03 0.03 0.07 0.09 0.36 4.07 8.05 1.71 1.36 80 PERCENTILE 1.12 0.53 0.29 0.08 0.30 2.14 2.09 7.01 20.77 20.68 6.42 1.80 conversion from m3/s to l/s/km2
0.526039

87
Stung Sen at Kompong Putrea (610102) - Specific mean monthly discharge (l/sec/km2) Catchment area = 11,137 sq km Year JAN FEB MAR APR MAY JUN JUL AUG SEP OCT NOV DEC Annual 1965 0.2 0.1 0.1 0.2 2.6 6.5 14.5 19.6 45.9 18.8 0.8 0.3 9.21966 0.2 0.2 0.9 1.4 12.5 3.4 35.7 106.8 87.7 15.6 1.6 0.7 22.41967 0.4 0.2 0.2 8.9 3.4 7.6 5.7 35.3 63.7 28.9 1.1 0.3 13.01968 0.2 0.2 0.1 0.1 1.8 5.8 7.2 35.4 54.2 25.5 0.6 0.3 11.01969 0.2 0.2 0.1 0.7 0.9 10.5 29.1 19.8 55.8 47.1 6.9 0.2 14.41999 7.3 16.8 40.0 15.8 18.5 27.6 46.4 24.4 4.0 2000 0.1 0.0 12.9 18.3 36.5 78.0 60.0 70.4 44.0 41.4 30.4 2001 22.5 0.2 5.5 19.8 44.0 75.0 2002 2.2 0.0 0.5 4.3 14.2 18.8 49.8 86.6 48.8 15.9 7.0 2003 1.0 0.4 0.1 1.6 1.5 11.0 34.5 45.0 53.4 33.4 25.6 19.2 19.82004 13.4 7.0 Data 306 214 182 246 299 300 310 307 270 279 270 279 3262Mo nths 1 9 10 1 1 10 10 9 9 9 90 6 0 0 MEAN 4.0 0.9 0.2 3.4 6.8 15.5 28.3 46.5 60.6 34.3 13.1 6.9 MAX 22.5 7.0 0.9 12.9 18.3 40.0 78.0 106.8 87.7 48.8 41.4 30.4 MIN 0.1 0.0 0.1 0.1 0.9 3.4 5.7 18.5 27.6 15.6 0.6 0.2 20 PERCENTILE 0.2 0.1 0.1 0.2 1.7 6.3 13.0 19.7 50.4 22.8 0.9 0.3 80 PERCENTILE 4.4 0.3 0.2 7.6 13.3 23.2 37.3 63.0 76.8 46.7 24.9 11.9 conversion from m3/s to l/s/km2
0.089791

88
Stung Chinit at Kompong Thmar (620101) - Mean monthly discharges (l/s/km2) Catchment area = 4,393 sq km Year JAN FEB MAR APR MAY JUN JUL AUG SEP OCT NOV DEC Annual 1962 0.94 2.10 6.77 29.61 31.69 45.42 55.20 12.62 6.38 1963 3.77 2.09 1.17 1997 3.64 3.08 5.37 11.83 31.78 28.85 35.68 12.30 5.21 1998 3.06 1.96 1.20 0.97 1.48 1.70 4.15 8.91 16.19 40.90 15.77 1999 4.32 2.22 1.37 3.58 15.81 24.59 19.91 32.33 29.10 42.97 2000 9.64 3.90 5.59 9.46 27.64 47.47 47.54 54.02 53.30 25.74 12.31 2001 7.11 4.58 6.82 4.02 6.76 8.06 16.93 18.01 36.35 56.71 25.99 10.26 16.882002 5.64 3.90 2.51 2.17 2.61 9.61 9.13 16.06 38.09 38.13 14.79 6.81 12.562003 3.75 2.53 2.85 2.22 3.45 7.13 11.65 20.15 27.80 29.49 8.65 4.27 10.38Data 213 168 215 236 248 240 248 248 240 248 210 186 2700Months 7 6 7 8 8 8 8 8 8 8 7 6 MEAN 5.33 2.88 2.83 2.89 5.59 11.36 18.84 25.81 34.48 44.05 16.55 7.54 MAX 9.64 4.58 6.82 5.59 15.81 27.64 47.47 47.54 54.02 56.71 25.99 12.31 MIN 3.06 1.96 1.17 0.94 1.48 1.70 4.15 8.91 16.19 29.49 8.65 4.27 20 PERCENTILE 3.75 2.09 1.23 1.45 2.30 5.93 10.14 16.84 28.22 36.66 12.37 5.21 80 PERCENTILE 6.81 3.90 3.69 3.87 8.38 18.60 25.73 32.11 42.49 54.44 23.75 10.26 conversion from m3/s to l/s/km2
0.227635
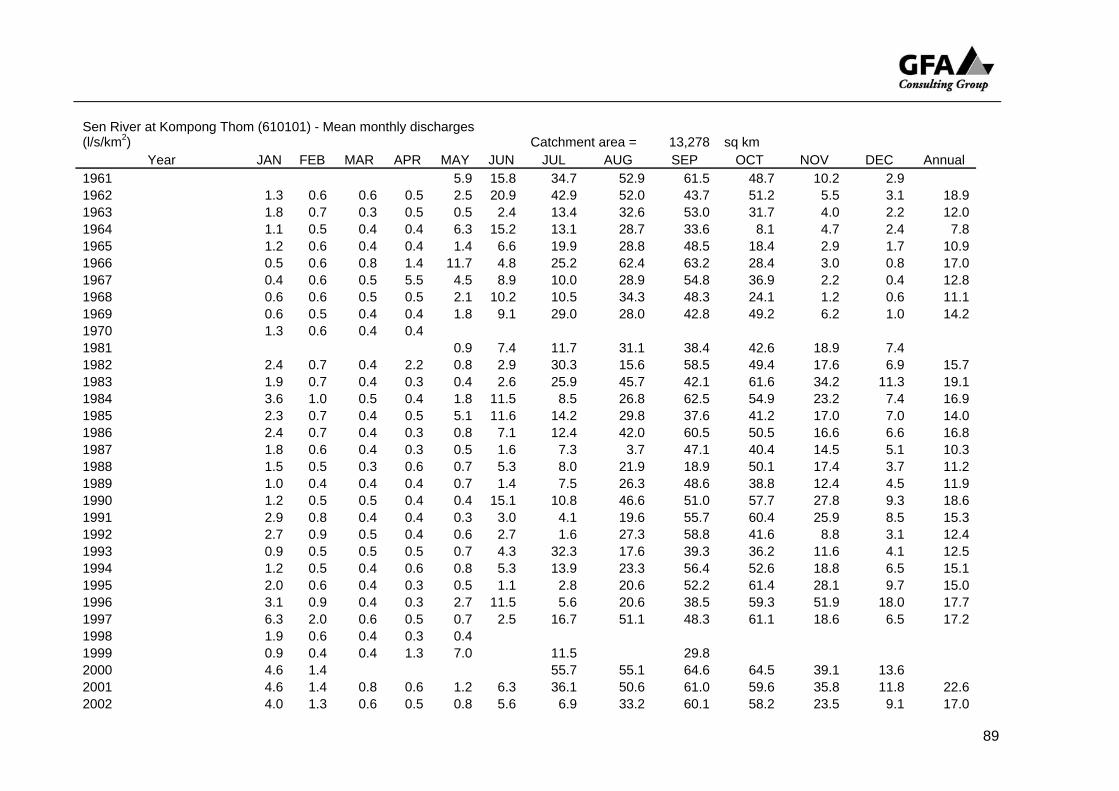
89
Sen River at Kompong Thom (610101) - Mean monthly discharges (l/s/km2) Catchment area = 13,278 sq km
Year JAN FEB MAR APR MAY JUN JUL AUG SEP OCT NOV DEC Annual 1961 5.9 15.8 34.7 52.9 61.5 48.7 10.2 2.9 1962 1.3 0.6 0.6 0.5 2.5 20.9 42.9 52.0 43.7 51.2 5.5 3.1 18.91963 1.8 0.7 0.3 0.5 0.5 2.4 13.4 32.6 53.0 31.7 4.0 2.2 12.01964 1.1 0.5 0.4 0.4 6.3 15.2 13.1 28.7 33.6 8.1 4.7 2.4 7.81965 1.2 0.6 0.4 0.4 1.4 6.6 19.9 28.8 48.5 18.4 2.9 1.7 10.91966 0.5 0.6 0.8 1.4 11.7 4.8 25.2 62.4 63.2 28.4 3.0 0.8 17.01967 0.4 0.6 0.5 5.5 4.5 8.9 10.0 28.9 54.8 36.9 2.2 0.4 12.81968 0.6 0.6 0.5 0.5 2.1 10.2 10.5 34.3 48.3 24.1 1.2 0.6 11.11969 0.6 0.5 0.4 0.4 1.8 9.1 29.0 28.0 42.8 49.2 6.2 1.0 14.21970 1.3 0.6 0.4 0.4 1981 0.9 7.4 11.7 31.1 38.4 42.6 18.9 7.4 1982 2.4 0.7 0.4 2.2 0.8 2.9 30.3 15.6 58.5 49.4 17.6 6.9 15.71983 1.9 0.7 0.4 0.3 0.4 2.6 25.9 45.7 42.1 61.6 34.2 11.3 19.11984 3.6 1.0 0.5 0.4 1.8 11.5 8.5 26.8 62.5 54.9 23.2 7.4 16.91985 2.3 0.7 0.4 0.5 5.1 11.6 14.2 29.8 37.6 41.2 17.0 7.0 14.01986 2.4 0.7 0.4 0.3 0.8 7.1 12.4 42.0 60.5 50.5 16.6 6.6 16.81987 1.8 0.6 0.4 0.3 0.5 1.6 7.3 3.7 47.1 40.4 14.5 5.1 10.31988 1.5 0.5 0.3 0.6 0.7 5.3 8.0 21.9 18.9 50.1 17.4 3.7 11.21989 1.0 0.4 0.4 0.4 0.7 1.4 7.5 26.3 48.6 38.8 12.4 4.5 11.91990 1.2 0.5 0.5 0.4 0.4 15.1 10.8 46.6 51.0 57.7 27.8 9.3 18.61991 2.9 0.8 0.4 0.4 0.3 3.0 4.1 19.6 55.7 60.4 25.9 8.5 15.31992 2.7 0.9 0.5 0.4 0.6 2.7 1.6 27.3 58.8 41.6 8.8 3.1 12.41993 0.9 0.5 0.5 0.5 0.7 4.3 32.3 17.6 39.3 36.2 11.6 4.1 12.51994 1.2 0.5 0.4 0.6 0.8 5.3 13.9 23.3 56.4 52.6 18.8 6.5 15.11995 2.0 0.6 0.4 0.3 0.5 1.1 2.8 20.6 52.2 61.4 28.1 9.7 15.01996 3.1 0.9 0.4 0.3 2.7 11.5 5.6 20.6 38.5 59.3 51.9 18.0 17.71997 6.3 2.0 0.6 0.5 0.7 2.5 16.7 51.1 48.3 61.1 18.6 6.5 17.21998 1.9 0.6 0.4 0.3 0.4 1999 0.9 0.4 0.4 1.3 7.0 11.5 29.8 2000 4.6 1.4 55.7 55.1 64.6 64.5 39.1 13.6 2001 4.6 1.4 0.8 0.6 1.2 6.3 36.1 50.6 61.0 59.6 35.8 11.8 22.62002 4.0 1.3 0.6 0.5 0.8 5.6 6.9 33.2 60.1 58.2 23.5 9.1 17.0
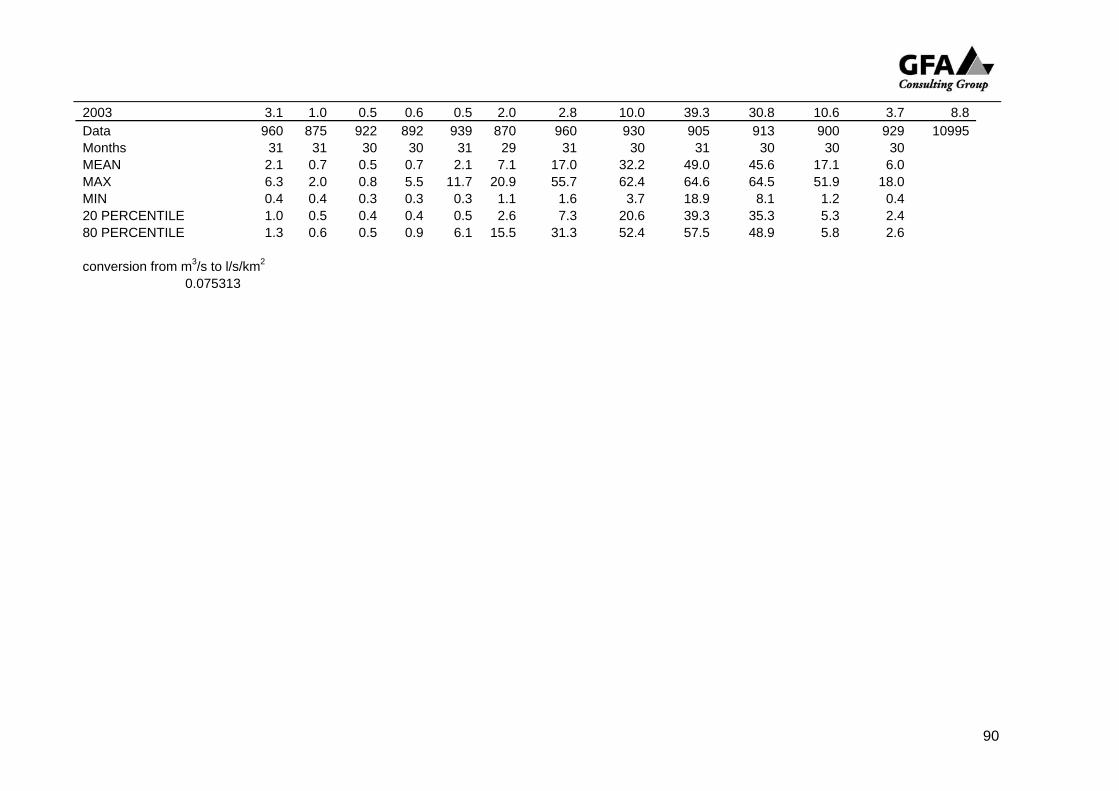
90
2003 3.1 1.0 0.5 0.6 0.5 2.0 2.8 10.0 39.3 30.8 10.6 3.7 8.8Data 960 875 922 892 939 870 960 930 905 913 900 929 10995Months 31 31 30 30 31 29 31 30 31 30 30 30 MEAN 2.1 0.7 0.5 0.7 2.1 7.1 17.0 32.2 49.0 45.6 17.1 6.0 MAX 6.3 2.0 0.8 5.5 11.7 20.9 55.7 62.4 64.6 64.5 51.9 18.0 MIN 0.4 0.4 0.3 0.3 0.3 1.1 1.6 3.7 18.9 8.1 1.2 0.4 20 PERCENTILE 1.0 0.5 0.4 0.4 0.5 2.6 7.3 20.6 39.3 35.3 5.3 2.4 80 PERCENTILE 1.3 0.6 0.5 0.9 6.1 15.5 31.3 52.4 57.5 48.9 5.8 2.6 conversion from m3/s to l/s/km2
0.075313

91
Stung Sreng at Kralanh (540101) - Mean monthly discharge (l/sec/km2) Catchment area = 7,127 sq km
Year JAN FEB MAR APR MAY JUN JUL AUG SEP OCT NOV DEC Annual 1962 0.12 0.40 1.27 5.58 11.55 20.01 27.48 4.66 1.09 1963 0.54 0.29 0.10 1998 0.17 0.13 0.11 0.10 0.10 0.11 1.00 2.86 4.34 10.88 4.35 1999 0.19 0.13 0.12 0.22 5.80 13.35 2000 0.12 0.48 1.82 12.25 22.12 20.80 23.71 24.28 12.86 2.15 2001 0.50 0.17 0.15 0.15 0.17 0.16 2.07 10.05 19.56 22.60 20.76 2.01 6.542002 0.38 0.16 0.14 0.13 0.19 0.57 3.08 3.61 22.77 21.72 9.00 2.76 5.392003 0.42 0.14 0.15 0.17 0.16 0.19 0.35 0.37 5.57 18.71 5.50 0.69 2.722004 0.16 0.12 0.11 0.12 0.13 2.81 1.78 16.22 19.65 10.85 1.84 0.86 4.562005 0.33 0.19 0.14 0.12 0.12 0.29 2.42 4.13 12.21 16.25 8.66 0.44 3.79Data 248 225 272 270 279 270 248 246 240 248 240 217 3003Months 8 8 9 9 9 9 8 8 8 8 8 7 MEAN 0.34 0.17 0.13 0.18 0.99 3.44 4.80 8.70 15.98 19.10 8.45 1.43 MAX 0.54 0.29 0.15 0.48 5.80 13.35 22.12 20.80 23.71 27.48 20.76 2.76 MIN 0.16 0.12 0.10 0.10 0.10 0.11 0.35 0.37 4.34 10.85 1.84 0.44 20 PERCENTILE 0.18 0.13 0.11 0.12 0.13 0.18 1.31 3.16 8.22 13.03 4.48 0.72 80 PERCENTILE 0.47 0.19 0.14 0.19 0.97 6.59 4.58 14.35 21.67 23.61 11.31 2.12 conversion from m3/s to l/s/km2
0.140311

92
Mongkol Borey River at Mongkol Borey (520101) - Mean monthly discharge (l/s/km2) Catchment area = 4,324 sq km
Year JAN FEB MAR APR MAY JUN JUL AUG SEP OCT NOV DEC Annual 1962 0.25 0.86 4.16 8.80 12.88 19.80 15.06 4.07 1.73 1963 0.61 0.33 0.19 1997 0.08 0.08 0.08 0.08 0.20 0.18 2.81 9.08 9.26 14.31 2.80 0.46 3.311998 0.20 0.12 0.12 0.11 0.11 0.25 0.56 1.28 2.27 7.43 4.49 1999 0.25 0.15 0.14 0.46 8.70 10.19 9.43 11.14 11.10 12.33 15.90 4.42 7.052000 0.71 0.27 0.19 2.99 4.35 5.75 9.81 6.75 12.70 15.74 11.08 2.10 6.052001 0.44 0.21 0.86 0.41 1.27 3.15 6.84 6.88 8.41 11.65 12.82 2.95 4.682002 0.39 0.13 0.15 0.44 2.29 1.89 2.53 5.62 8.76 10.04 5.15 1.14 3.162003 0.26 0.14 0.20 0.29 0.56 0.40 1.39 11.09 4.75 16.57 9.16 1.27 3.872004 0.30 0.16 0.12 0.18 0.62 Data 279 254 279 270 279 240 248 248 236 248 240 217 3038Months 9 9 9 9 9 8 8 8 8 8 8 7 MEAN 0.36 0.18 0.23 0.58 2.11 3.25 5.27 8.09 9.63 12.89 8.18 2.01 MAX 0.71 0.33 0.86 2.99 8.70 10.19 9.81 12.88 19.80 16.57 15.90 4.42 MIN 0.08 0.08 0.08 0.08 0.11 0.18 0.56 1.28 2.27 7.43 2.80 0.46 20 PERCENTILE 0.23 0.13 0.12 0.15 0.42 0.31 1.84 6.07 6.21 10.68 4.24 1.16 80 PERCENTILE 0.51 0.23 0.19 0.45 3.11 5.12 9.17 11.12 12.06 15.47 12.12 2.78 conversion from m3/s to l/s/km2
0.231267
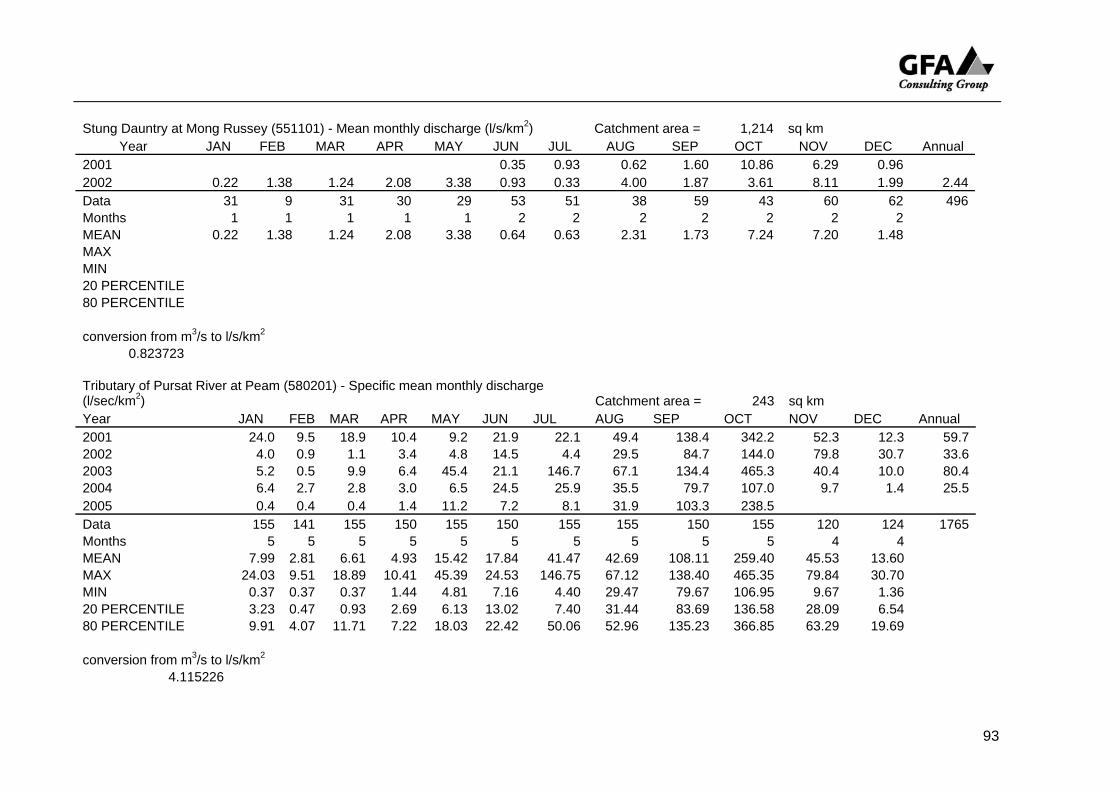
93
Stung Dauntry at Mong Russey (551101) - Mean monthly discharge (l/s/km2) Catchment area = 1,214 sq km
Year JAN FEB MAR APR MAY JUN JUL AUG SEP OCT NOV DEC Annual 2001 0.35 0.93 0.62 1.60 10.86 6.29 0.96 2002 0.22 1.38 1.24 2.08 3.38 0.93 0.33 4.00 1.87 3.61 8.11 1.99 2.44Data 31 9 31 30 29 53 51 38 59 43 60 62 496Mo nths 1 1 1 1 1 2 2 2 2 2 2 2 MEAN 0.22 1.38 1.24 2.08 3.38 0.64 0.63 2.31 1.73 7.24 7.20 1.48 MAX MIN 20 PERCENTILE 80 PERCENTILE conversion from m3/s to l/s/km2
0.823723 Tributary of Pursat River at Peam (580201) - Specific mean monthly discharge (l/sec/km2) Catchment area = 243 sq km Year JAN FEB MAR APR MAY JUN JUL AUG SEP OCT NOV DEC Annual 2001 24.0 9.5 18.9 10.4 9.2 21.9 22.1 49.4 138.4 342.2 52.3 12.3 59.72002 4.0 0.9 1.1 3.4 4.8 14.5 4.4 29.5 84.7 144.0 79.8 30.7 33.62003 5.2 0.5 9.9 6.4 45.4 21.1 146.7 67.1 134.4 465.3 40.4 10.0 80.42004 6.4 2.7 2.8 3.0 6.5 24.5 25.9 35.5 79.7 107.0 9.7 1.4 25.52005 0.4 0.4 0.4 1.4 11.2 7.2 8.1 31.9 103.3 238.5 Data 155 141 155 150 155 150 155 155 150 155 120 124 1765Months 5 5 5 5 5 5 5 5 5 5 4 4 MEAN 7.99 2.81 6.61 4.93 15.42 17.84 41.47 42.69 108.11 259.40 45.53 13.60 MAX 24.03 9.51 18.89 10.41 45.39 24.53 146.75 67.12 138.40 465.35 79.84 30.70 MIN 0.37 0.37 0.37 1.44 4.81 7.16 4.40 29.47 79.67 106.95 9.67 1.36 20 PERCENTILE 3.23 0.47 0.93 2.69 6.13 13.02 7.40 31.44 83.69 136.58 28.09 6.54 80 PERCENTILE 9.91 4.07 11.71 7.22 18.03 22.42 50.06 52.96 135.23 366.85 63.29 19.69 conversion from m3/s to l/s/km2
4.115226

94
Siem Reap River at Prasaat Keo (560102) - Specific mean monthly discharge (l/s/km2) Catchment area = 178 sq km Year JAN FEB MAR APR MAY JUN JUL AUG SEP OCT NOV DEC Annual 1999 6.8 5.8 5.8 7.2 18.9 54.7 38.9 63.1 47.7 110.3 112.4 31.6 42.72000 19.9 13.1 8.9 14.7 9.6 39.8 60.5 66.9 105.6 124.8 54.2 26.5 44.62001 13.5 10.3 10.2 7.8 12.7 12.8 25.6 38.1 33.3 118.5 44.0 19.0 29.02002 12.0 8.6 5.2 6.2 6.2 4.1 6.0 17.8 130.3 92.8 39.7 21.7 28.92003 12.5 9.0 7.7 6.9 6.6 9.9 12.4 16.0 12.9 14.9 16.8 8.0 11.12004 6.2 5.6 4.5 4.1 4.2 9.0 9.7 158.3 Data 180 170 186 180 186 180 186 185 149 151 150 155 2058Mo nths 6 6 6 6 6 6 6 6 5 5 5 5 6 MEAN 11.82 8.74 7.05 7.81 9.68 21.70 25.51 60.02 65.96 92.25 53.43 21.36 MAX 19.89 13.09 10.17 14.66 18.88 54.72 60.51 158.26 130.28 124.83 112.42 31.63 MIN 6.24 5.56 4.49 4.10 4.21 4.10 6.01 16.01 12.92 14.89 16.80 7.98 20 PERCENTILE 6.80 5.79 5.17 6.24 6.18 8.99 9.66 17.75 29.19 77.18 35.09 16.79 80 PERCENTILE 13.54 10.34 8.93 7.75 12.70 39.78 38.88 66.85 110.55 119.75 65.85 27.54 conversion from m3/s to l/s/km2
5.617978
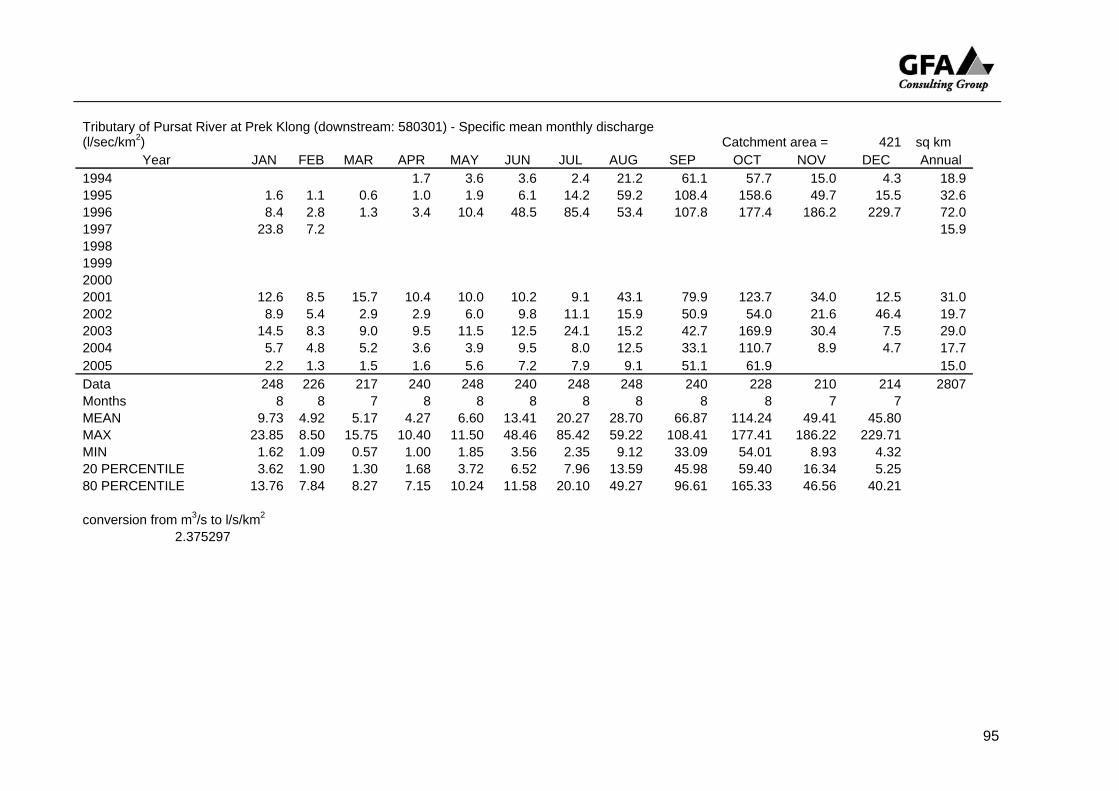
95
Tributary of Pursat River at Prek Klong (downstream: 580301) - Specific mean monthly discharge (l/sec/km2) Catchment area = 421 sq km
Year JAN FEB MAR APR MAY JUN JUL AUG SEP OCT NOV DEC Annual 1994 1.7 3.6 3.6 2.4 21.2 61.1 57.7 15.0 4.3 18.91995 1.6 1.1 0.6 1.0 1.9 6.1 14.2 59.2 108.4 158.6 49.7 15.5 32.61996 8.4 2.8 1.3 3.4 10.4 48.5 85.4 53.4 107.8 177.4 186.2 229.7 72.01997 23.8 7.2 15.91998 1999 2000 2001 12.6 8.5 15.7 10.4 10.0 10.2 9.1 43.1 79.9 123.7 34.0 12.5 31.02002 8.9 5.4 2.9 2.9 6.0 9.8 11.1 15.9 50.9 54.0 21.6 46.4 19.72003 14.5 8.3 9.0 9.5 11.5 12.5 24.1 15.2 42.7 169.9 30.4 7.5 29.02004 5.7 4.8 5.2 3.6 3.9 9.5 8.0 12.5 33.1 110.7 8.9 4.7 17.72005 2.2 1.3 1.5 1.6 5.6 7.2 7.9 9.1 51.1 61.9 15.0Data 248 226 217 240 248 240 248 248 240 228 210 214 2807Mon ths 8 7 8 8 8 8 8 8 8 78 7 MEAN 9.73 4.92 5.17 4.27 6.60 13.41 20.27 28.70 66.87 114.24 49.41 45.80 MAX 23.85 8.50 15.75 10.40 11.50 48.46 85.42 59.22 108.41 177.41 186.22 229.71 MIN 1.62 1.09 0.57 1.00 1.85 3.56 2.35 9.12 33.09 54.01 8.93 4.32 20 PERCENTILE 3.62 1.90 1.30 1.68 3.72 6.52 7.96 13.59 45.98 59.40 16.34 5.25 80 PERCENTILE 13.76 7.84 8.27 7.15 10.24 11.58 20.10 49.27 96.61 165.33 46.56 40.21 conversion from m3/s to l/s/km2
2.375297

96
Stung Pursat at Pursat station (580101) - Specific mean monthly discharge (l/sec/km2) Catchment area = 4,495 sq km
Year JAN FEB MAR APR MAY JUN JUL AUG SEP OCT NOV DEC Annual 1962 1.5 4.0 6.4 21.1 22.7 33.9 52.4 7.3 1.5 16.81963 0.3 0.0 0.4 0.21972 11.2 5.8 10.3 9.3 8.8 27.8 39.1 50.0 34.1 21.81973 3.6 1.6 0.5 0.7 5.9 11.2 14.3 25.7 38.0 43.3 42.6 9.0 15.51974 3.2 1.8 1.2 2.0Data 93 84 71 90 93 90 93 93 88 90 82 93 1060Mo nths 3 3 3 3 3 3 3 3 3 3 3 3 MEAN 2.4 1.1 0.7 4.4 5.3 9.3 14.9 19.1 33.2 44.9 33.3 14.9 MAX 3.6 1.8 1.2 11.2 5.9 11.2 21.1 25.7 38.0 52.4 50.0 34.1 MIN 0.3 0.0 0.4 0.7 4.0 6.4 9.3 8.8 27.8 39.1 7.3 1.5 20 PERCENTILE 1.4 0.7 0.5 1.0 4.8 7.9 11.3 14.4 30.2 40.8 21.4 4.5 80 PERCENTILE 3.4 1.7 0.9 7.3 5.9 10.8 18.3 24.5 36.4 48.8 47.0 24.1 conversion from m3/s to l/s/km2
0.222469 Stung Sangke at Sre Ponleu (550103) - Specific mean monthly discharge (l/sec/km2) Catchment area = 566 sq km
Year JAN FEB MAR APR MAY JUN JUL AUG SEP OCT NOV DEC Annual 1964 4.7 3.2 2.3 2.7 30.7 26.6 47.5 139.5 98.2 63.6 30.2 9.8 38.41965 5.1 4.2 3.6 2.6 28.4 118.3 86.0 85.8 125.9 69.6 16.9 7.2 46.31966 4.0 3.3 2.6 2.8 20.5 25.4 87.8 131.0 152.8 43.4 21.3 10.2 42.3Data 93 85 93 90 93 90 93 93 90 93 90 93 1096Mo nths 3 3 3 3 3 3 3 3 3 3 3 3 MEAN 4.6 3.5 2.8 2.7 26.5 56.8 73.8 118.8 125.6 58.9 22.8 9.1 MAX MIN 20 PERCENTILE 80 PERCENTILE conversion from m3/s to l/s/km2
1.766784

97
Stung Pursat at Taing Leach station (580102) - Specific mean monthly discharge (l/sec/km2) Catchment area = 2,011 sq km
Year JAN FEB MAR APR MAY JUN JUL AUG SEP OCT NOV DEC Annual 1965 1.4 0.6 1.9 6.6 15.1 29.4 11.1 15.7 42.6 71.8 10.6 2.8 17.51966 0.8 0.7 0.8 2.1 8.5 6.2 27.2 17.0 16.3 37.4 9.4 4.7 11.01967 1.6 0.6 0.5 5.0 19.2 18.9 14.6 38.1 10.6 60.1 5.4 1.7 14.91968 0.5 0.4 0.4 8.8 8.4 3.6 12.1 33.5 15.7 26.0 3.0 0.9 9.51969 0.4 0.3 0.7 1.8 6.9 7.3 44.2 25.4 103.0 66.6 37.3 6.0 24.6Data 155 141 155 150 155 150 155 155 149 146 144 135 1790Months 5 5 5 5 5 5 5 5 5 5 5 5 MEAN 0.94 0.51 0.85 4.84 11.61 13.07 21.83 25.93 37.64 52.37 13.15 3.22 MAX 1.60 0.69 1.87 8.76 19.20 29.35 44.21 38.10 103.03 71.84 37.33 5.99 MIN 0.39 0.29 0.38 1.79 6.90 3.56 11.05 15.68 10.56 25.97 3.00 0.92 20 PERCENTILE 0.51 0.38 0.45 2.01 8.09 5.70 11.87 16.73 14.70 35.11 4.96 1.55 80 PERCENTILE 1.43 0.61 1.01 7.03 15.90 20.98 30.59 34.38 54.71 67.63 15.92 4.97 conversion from m3/s to l/s/km2
0.497265
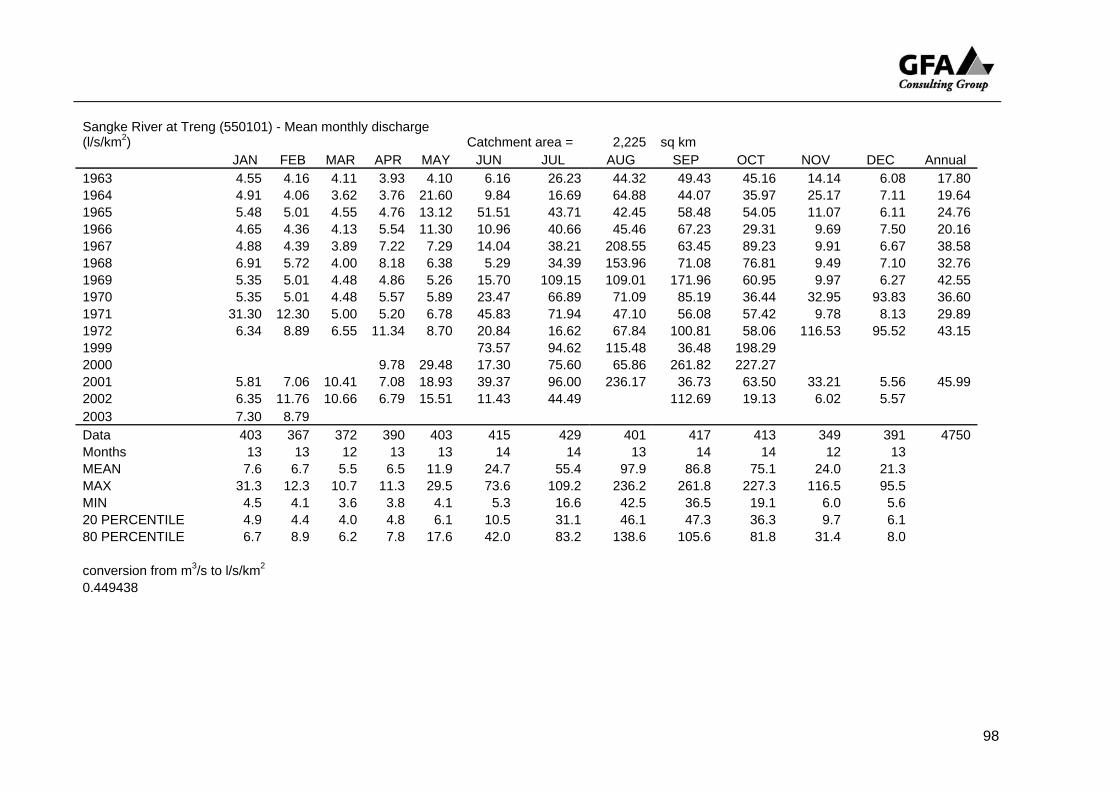
98
Sangke River at Treng (550101) - Mean monthly discharge (l/s/km2) Catchment area = 2,225 sq km JAN FEB MAR APR MAY JUN JUL AUG SEP OCT NOV DEC Annual 1963 4.55 4.16 4.11 3.93 4.10 6.16 26.23 44.32 49.43 45.16 14.14 6.08 17.801964 4.91 4.06 3.62 3.76 21.60 9.84 16.69 64.88 44.07 35.97 25.17 7.11 19.641965 5.48 5.01 4.55 4.76 13.12 51.51 43.71 42.45 58.48 54.05 11.07 6.11 24.761966 4.65 4.36 4.13 5.54 11.30 10.96 40.66 45.46 67.23 29.31 9.69 7.50 20.161967 4.88 4.39 3.89 7.22 7.29 14.04 38.21 208.55 63.45 89.23 9.91 6.67 38.581968 6.91 5.72 4.00 8.18 6.38 5.29 34.39 153.96 71.08 76.81 9.49 7.10 32.761969 5.35 5.01 4.48 4.86 5.26 15.70 109.15 109.01 171.96 60.95 9.97 6.27 42.551970 5.35 5.01 4.48 5.57 5.89 23.47 66.89 71.09 85.19 36.44 32.95 93.83 36.601971 31.30 12.30 5.00 5.20 6.78 45.83 71.94 47.10 56.08 57.42 9.78 8.13 29.891972 6.34 8.89 6.55 11.34 8.70 20.84 16.62 67.84 100.81 58.06 116.53 95.52 43.151999 73.57 94.62 115.48 36.48 198.29 2000 9.78 29.48 17.30 75.60 65.86 261.82 227.27 2001 5.81 7.06 10.41 7.08 18.93 39.37 96.00 236.17 36.73 63.50 33.21 5.56 45.992002 6.35 11.76 10.66 6.79 15.51 11.43 44.49 112.69 19.13 6.02 5.57 2003 7.30 8.79 Data 403 367 372 390 403 415 429 401 417 413 349 391 4750Months 13 13 12 13 13 14 14 13 14 14 12 13 MEAN 7.6 6.7 5.5 6.5 11.9 24.7 55.4 97.9 86.8 75.1 24.0 21.3 MAX 31.3 12.3 10.7 11.3 29.5 73.6 109.2 236.2 261.8 227.3 116.5 95.5 MIN 4.5 4.1 3.6 3.8 4.1 5.3 16.6 42.5 36.5 19.1 6.0 5.6 20 PERCENTILE 4.9 4.4 4.0 4.8 6.1 10.5 31.1 46.1 47.3 36.3 9.7 6.1 80 PERCENTILE 6.7 8.9 6.2 7.8 17.6 42.0 83.2 138.6 105.6 81.8 31.4 8.0 conversion from m3/s to l/s/km2 0.449438

99

A N N E X 3 . A N N U A L M A X I M U M D A I L Y D I S C H A R G E S
(Based on data presented in Department of Hydrology & River Works Report, River flow monitoring stations, Tonle Sap Basin, August 2006, MOWRAM). Note: stations with the discharges shaded in the tables are considered to be affected by backwater, overbank flow, and unreliable rating curves, and annual maximum discharges with an AEI greater than about 2 years therefore are regarded as under-estimates.
100

610101 550102 550101 Rank Sen,
Kompong Thom
% AEI Sangke, Battam bang
P AEI Treng, 1963-
73
% AEI
1 940 2.3 43.4 800 4.0 24.9 1390 6.1 16.32 930 5.6 17.9 600 9.8 10.2 1220 14.9 6.713 910 8.9 11.3 590 15.5 6.44 1150 23.7 4.224 900 12.2 8.22 580 21.3 4.70 1120 32.5 3.085 900 15.5 6.47 575 27.0 3.70 1030 41.2 2.436 900 18.8 5.33 570 32.8 3.05 800 50.0 2.007 895 22.0 4.54 565 38.5 2.60 750 58.8 1.708 870 25.3 3.95 560 44.3 2.26 660 67.5 1.489 860 28.6 3.49 550 50.0 2.00 650 76.3 1.31
10 855 31.9 3.13 545 55.7 1.79 590 85.1 1.1811 850 35.2 2.84 510 61.5 1.63 540 93.9 1.0712 850 38.5 2.60 510 67.2 1.49 11 13 850 41.8 2.39 495 73.0 1.37 14 850 45.1 2.22 400 78.7 1.27 peak 15 845 48.4 2.07 390 84.5 1.18 flows 16 840 51.6 1.94 330 90.2 1.11 truncated 17 835 54.9 1.82 175 96.0 1.04 18 835 58.2 1.72 17 19 820 61.5 1.63 20 800 64.8 1.54 peak 21 800 68.1 1.47 flows 22 760 71.4 1.40 truncated 23 750 74.7 1.34 24 750 78.0 1.28 25 740 81.3 1.23 26 720 84.5 1.18 27 710 87.8 1.14 28 650 91.1 1.10 29 570 94.4 1.06 30 560 97.7 1.02
30 probable
over-bank
flow at high stage
101
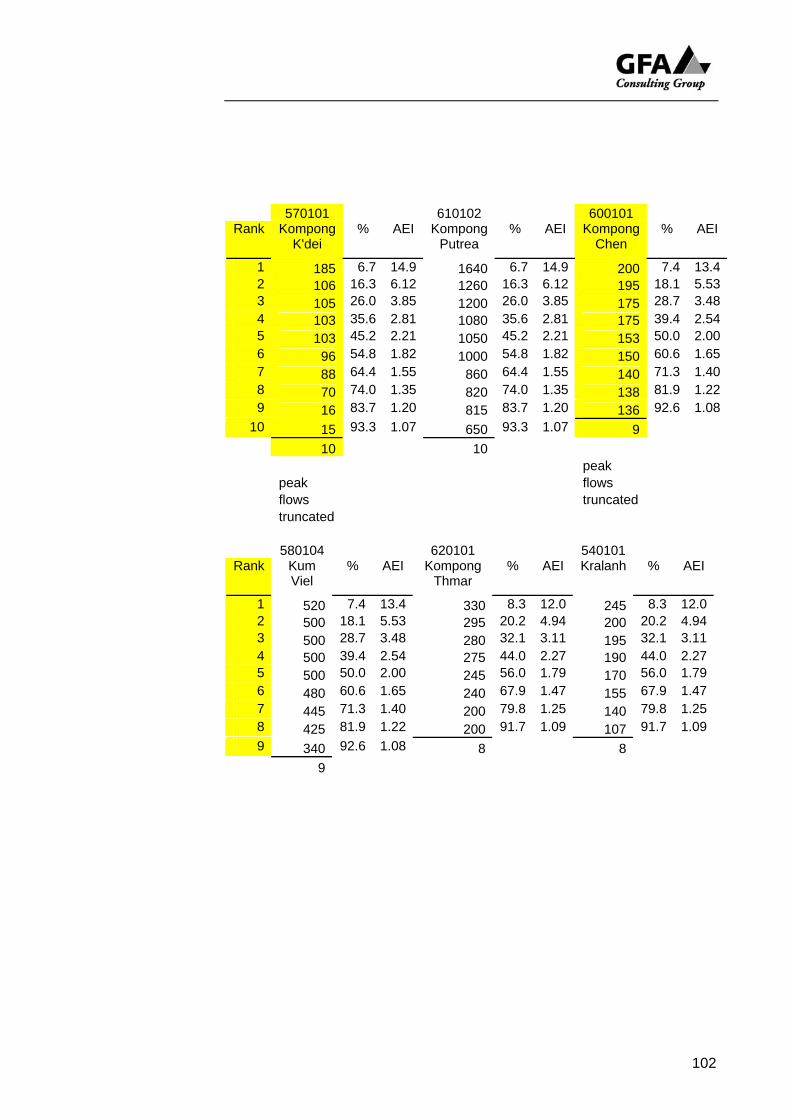
570101 610102 600101 Rank Kompong
K'dei % AEI Kompong
Putrea % AEI Kompong
Chen % AEI
1 185 6.7 14.9 1640 6.7 14.9 200 7.4 13.42 106 16.3 6.12 1260 16.3 6.12 195 18.1 5.533 105 26.0 3.85 1200 26.0 3.85 175 28.7 3.484 103 35.6 2.81 1080 35.6 2.81 175 39.4 2.545 103 45.2 2.21 1050 45.2 2.21 153 50.0 2.006 96 54.8 1.82 1000 54.8 1.82 150 60.6 1.657 88 64.4 1.55 860 64.4 1.55 140 71.3 1.408 70 74.0 1.35 820 74.0 1.35 138 81.9 1.229 16 83.7 1.20 815 83.7 1.20 136 92.6 1.08
10 15 93.3 1.07 650 93.3 1.07 9 10 10 peak peak flows flows truncated truncated
580104 620101 540101
Rank Kum Viel
% AEI Kompong Thmar
% AEI Kralanh % AEI
1 520 7.4 13.4 330 8.3 12.0 245 8.3 12.02 500 18.1 5.53 295 20.2 4.94 200 20.2 4.943 500 28.7 3.48 280 32.1 3.11 195 32.1 3.114 500 39.4 2.54 275 44.0 2.27 190 44.0 2.275 50.0 2.00 245 56.0 1.79 170 56.0 1.79500 6 480 60.6 1.65 240 67.9 1.47 155 67.9 1.477 445 71.3 1.40 200 79.8 1.25 140 79.8 1.258 425 81.9 1.22 200 91.7 1.09 107 91.7 1.099 340 92.6 1.08 8 8
9
102

520101 580301 590101
Rank Mongkol Borey
% AEI Prey Klong (downstream)
% AEI Boribo % AEI
1 150 8.3 12.0 190 8.3 12.0 186 9.5 10.62 90 20.2 4.94 160 20.2 4.94 185 23.0 4.353 85 32.1 3.11 160 32.1 3.11 178 36.5 2.744 84 44.0 2.27 135 44.0 2.27 138 50.0 2.005 82 56.0 1.79 125 56.0 1.79 136 63.5 1.576 72 67.9 1.47 95 67.9 1.47 136 77.0 1.307 68 79.8 1.25 80 79.8 1.25 108 90.5 1.108 42 91.7 1.09 55 91.7 1.09 7
8 8 peak flows truncated
580103 560102 580201
Rank Baktrakoun % AEI Prasat Keo
% AEI Peam % AEI
1 1180 10.9 9.1 58 10.9 9.1 235 13.0 7.72 930 26.6 3.76 57 26.6 3.76 210 31.5 3.183 870 42.2 2.37 55 42.2 2.37 165 50.0 2.004 540 57.8 1.73 53 57.8 1.73 140 68.5 1.465 500 73.4 1.36 45 73.4 1.36 115 87.0 1.156 220 89.1 1.12 7 89.1 1.12 5
6 6 peak flows truncated
580102 Rank Taing
Leach % AEI
1 720 13.0 7.72 510 31.5 3.183 470 50.0 2.004 320 68.5 1.465 260 87.0 1.15
5
103

104
A N N E X 4 . M E A N M O N T H L Y A N D A N N U A L R A I N F A L L S
(Based on data presented in Department of Meteorology Report, Rainfall monitoring stations, Tonle Sap Basin, August 2006, MOWRAM)
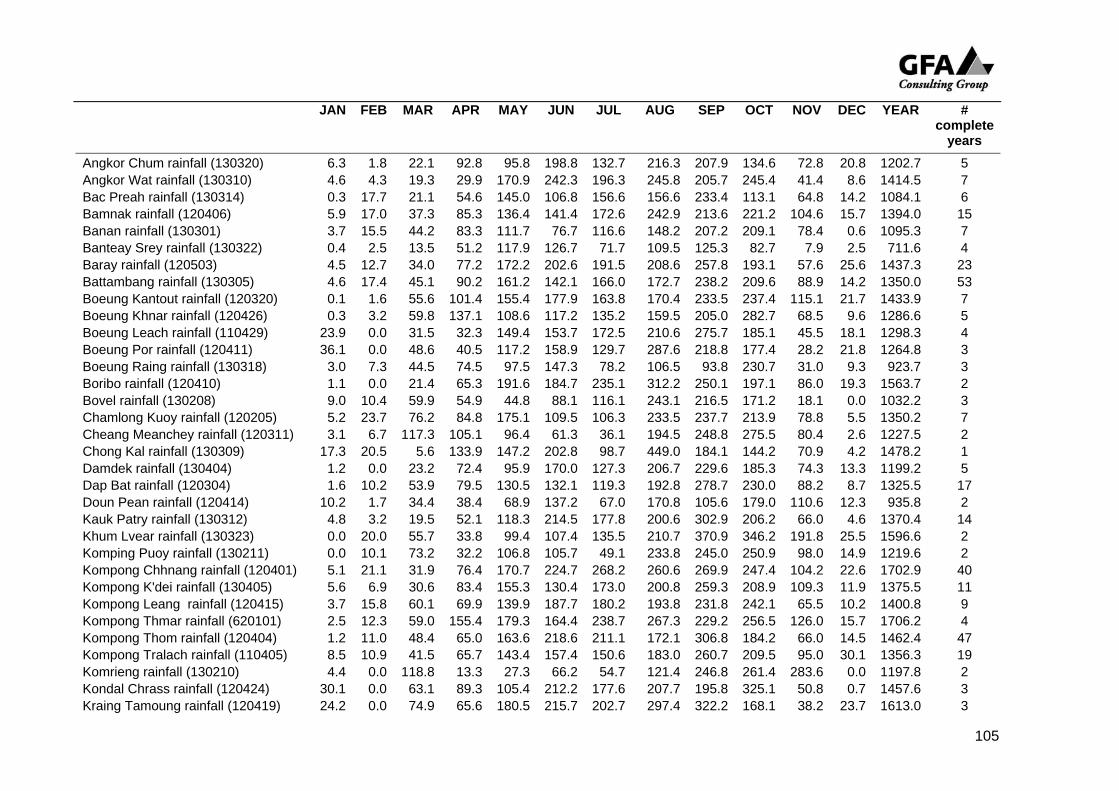
105
JAN FEB MAR APR MAY JUN JUL AUG SEP OCT NOV DEC YEAR # complete
years Angkor Chum rainfall (130320) 6.3 1.8 22.1 92.8 95.8 198.8 132.7 216.3 207.9 134.6 72.8 20.8 1202.7 5 Angkor Wat rainfall (130310) 4.6 4.3 19.3 29.9 170.9 242.3 196.3 245.8 205.7 245.4 41.4 8.6 1414.5 7 Bac Preah rainfall (130314) 0.3 17.7 21.1 54.6 145.0 106.8 156.6 156.6 233.4 113.1 64.8 14.2 1084.1 6 Bamnak rainfall (120406) 5.9 17.0 37.3 85.3 136.4 141.4 172.6 242.9 213.6 221.2 104.6 15.7 1394.0 15 Banan rainfall (130301) 3.7 15.5 44.2 83.3 111.7 76.7 116.6 148.2 207.2 209.1 78.4 0.6 1095.3 7 Banteay Srey rainfall (130322) 0.4 2.5 13.5 51.2 117.9 126.7 71.7 109.5 125.3 82.7 7.9 2.5 711.6 4 Baray rainfall (120503) 4.5 12.7 34.0 77.2 172.2 202.6 191.5 208.6 257.8 193.1 57.6 25.6 1437.3 23 Battambang rainfall (130305) 4.6 17.4 45.1 90.2 161.2 142.1 166.0 172.7 238.2 209.6 88.9 14.2 1350.0 53 Boeung Kantout rainfall (120320) 0.1 1.6 55.6 101.4 155.4 177.9 163.8 170.4 233.5 237.4 115.1 21.7 1433.9 7 Boeung Khnar rainfall (120426) 0.3 3.2 59.8 137.1 108.6 117.2 135.2 159.5 205.0 282.7 68.5 9.6 1286.6 5 Boeung Leach rainfall (110429) 23.9 0.0 31.5 32.3 149.4 153.7 172.5 210.6 275.7 185.1 45.5 18.1 1298.3 4 Boeung Por rainfall (120411) 36.1 0.0 48.6 40.5 117.2 158.9 129.7 287.6 218.8 177.4 28.2 21.8 1264.8 3 Boeung Raing rainfall (130318) 3.0 7.3 44.5 74.5 97.5 147.3 78.2 106.5 93.8 230.7 31.0 9.3 923.7 3 Boribo rainfall (120410) 1.1 0.0 21.4 65.3 191.6 184.7 235.1 312.2 250.1 197.1 86.0 19.3 1563.7 2 Bovel rainfall (130208) 9.0 10.4 59.9 54.9 44.8 88.1 116.1 243.1 216.5 171.2 18.1 0.0 1032.2 3 Chamlong Kuoy rainfall (120205) 5.2 23.7 76.2 84.8 175.1 109.5 106.3 233.5 237.7 213.9 78.8 5.5 1350.2 7 Cheang Meanchey rainfall (120311) 3.1 6.7 117.3 105.1 96.4 61.3 36.1 194.5 248.8 275.5 80.4 2.6 1227.5 2 Chong Kal rainfall (130309) 17.3 20.5 5.6 133.9 147.2 202.8 98.7 449.0 184.1 144.2 70.9 4.2 1478.2 1 Damdek rainfall (130404) 1.2 0.0 23.2 72.4 95.9 170.0 127.3 206.7 229.6 185.3 74.3 13.3 1199.2 5 Dap Bat rainfall (120304) 1.6 10.2 53.9 79.5 130.5 132.1 119.3 192.8 278.7 230.0 88.2 8.7 1325.5 17 Doun Pean rainfall (120414) 10.2 1.7 34.4 38.4 68.9 137.2 67.0 170.8 105.6 179.0 110.6 12.3 935.8 2 Kauk Patry rainfall (130312) 4.8 3.2 19.5 52.1 118.3 214.5 177.8 200.6 302.9 206.2 66.0 4.6 1370.4 14 Khum Lvear rainfall (130323) 0.0 20.0 55.7 33.8 99.4 107.4 135.5 210.7 370.9 346.2 191.8 25.5 1596.6 2 Komping Puoy rainfall (130211) 0.0 10.1 73.2 32.2 106.8 105.7 49.1 233.8 245.0 250.9 98.0 14.9 1219.6 2 Kompong Chhnang rainfall (120401) 5.1 21.1 31.9 76.4 170.7 224.7 268.2 260.6 269.9 247.4 104.2 22.6 1702.9 40 Kompong K'dei rainfall (130405) 5.6 6.9 30.6 83.4 155.3 130.4 173.0 200.8 259.3 208.9 109.3 11.9 1375.5 11 Kompong Leang rainfall (120415) 3.7 15.8 60.1 69.9 139.9 187.7 180.2 193.8 231.8 242.1 65.5 10.2 1400.8 9 Kompong Thmar rainfall (620101) 2.5 12.3 59.0 155.4 179.3 164.4 238.7 267.3 229.2 256.5 126.0 15.7 1706.2 4 Kompong Thom rainfall (120404) 1.2 11.0 48.4 65.0 163.6 218.6 211.1 172.1 306.8 184.2 66.0 14.5 1462.4 47 Kompong Tralach rainfall (110405) 8.5 10.9 41.5 65.7 143.4 157.4 150.6 183.0 260.7 209.5 95.0 30.1 1356.3 19 Komrieng rainfall (130210) 4.4 0.0 118.8 13.3 27.3 66.2 54.7 121.4 246.8 261.4 283.6 0.0 1197.8 2 Kondal Chrass rainfall (120424) 30.1 0.0 63.1 89.3 105.4 212.2 177.6 207.7 195.8 325.1 50.8 0.7 1457.6 3 Kraing Tamoung rainfall (120419) 24.2 0.0 74.9 65.6 180.5 215.7 202.7 297.4 322.2 168.1 38.2 23.7 1613.0 3

106
JAN FEB MAR APR MAY JUN JUL AUG SEP OCT NOV DEC YEAR # complete
years Krakor rainfall (120403) 6.9 7.6 31.0 67.2 190.2 188.3 184.1 205.7 233.5 275.3 101.6 24.1 1515.6 33 Kralanh rainfall (130302) 3.5 4.0 31.5 101.8 129.5 145.8 142.3 158.5 232.9 165.1 59.1 6.8 1180.8 17 Kravanh-Leach rainfall (120306) 7.6 28.1 62.5 120.5 156.7 145.0 153.6 186.6 235.5 321.5 113.2 37.5 1568.3 13 Maung Russey rainfall (120303) 2.2 8.8 44.0 87.7 132.6 114.4 118.2 101.6 180.5 216.2 123.3 11.2 1140.7 20 Mongkol Borey rainfall (130315) 2.4 15.2 58.2 60.5 123.4 125.9 123.8 178.6 157.5 197.1 39.7 2.5 1084.8 7 O Chrov rainfall (130209) 1.3 21.5 45.9 26.8 128.2 79.6 148.2 191.8 188.1 176.8 17.6 0.0 1025.9 2 O Taky rainfall (130304) 26.2 3.9 43.9 57.1 134.1 185.6 119.7 197.2 192.7 156.3 91.0 0.6 1208.0 5 Pailin rainfall (120202) 15.2 28.1 88.7 105.6 147.7 94.3 127.9 137.2 203.1 183.3 84.3 24.1 1239.5 10 Peam rainfall (120313) 14.5 0.0 98.1 45.5 209.0 57.0 75.2 166.9 186.2 343.0 59.9 23.7 1278.9 2 Phnom Koulen rainfall (130403) 8.5 4.6 34.3 135.3 177.4 235.1 224.4 309.4 443.3 151.3 12.9 2.3 1738.9 3 Phnom Krom rainfall (130324) 0.0 0.0 63.4 22.9 166.4 180.5 97.8 307.3 178.3 138.4 15.6 14.3 1184.7 2 Phnom Srok rainfall (130308) 4.0 5.0 25.5 56.8 144.9 143.0 123.4 173.5 255.8 174.7 42.8 8.0 1157.3 12 Pong Ros rainfall (120418) 3.4 0.2 71.2 46.9 101.5 154.3 191.1 228.2 284.2 152.4 59.3 7.2 1299.7 4 Ponley rainfall (120417) 0.0 5.3 44.8 33.8 183.0 261.9 174.3 270.2 243.1 190.5 72.3 10.4 1489.6 8 Pranet Preah rainfall (130316) 3.5 10.8 34.5 55.6 153.6 153.7 103.0 171.9 215.4 185.8 20.7 11.9 1120.3 6 Prasat Bakong rainfall (130321) 0.0 0.0 43.7 27.9 143.9 149.0 208.2 241.6 228.1 204.2 95.2 15.9 1357.6 5 Prasat Balaing rainfall (120422) 0.0 0.0 75.8 193.9 235.6 256.5 238.8 209.2 308.1 165.5 13.7 0.0 1697.0 2 Prasat Sambo rainfall (120516) 0.0 0.0 71.1 75.4 114.2 272.0 191.7 273.6 239.7 161.3 12.2 0.0 1411.2 3 Prey Prous rainfall (120425) 3.6 1.6 44.6 101.1 141.4 160.0 147.8 171.9 274.7 149.3 99.3 12.1 1307.3 7 Pursat rainfall (120302) 2.4 5.6 35.4 77.5 146.3 130.1 127.4 172.6 240.4 214.5 101.9 23.5 1277.6 48 Raing Kesey rainfall (120305) 5.6 7.7 39.0 75.9 142.4 124.4 145.2 172.7 242.4 151.7 83.8 16.4 1207.2 12 Rattanak Mondol rainfall (120213) 4.0 25.5 86.6 120.7 112.4 36.8 17.9 271.2 296.2 234.4 52.6 26.5 1284.7 2 Rolear Phear rainfall (120416) 10.6 5.0 42.4 57.7 144.7 170.3 211.4 227.4 198.6 192.1 50.0 10.4 1320.5 7 Roung Chrey rainfall (130212) 0.0 14.6 45.6 44.4 133.4 51.6 66.3 173.7 184.1 181.6 28.0 2.8 926.0 2 Rovieng rainfall (130503) 0.0 0.0 26.4 70.3 191.6 166.7 354.9 233.7 302.7 39.9 25.6 2.1 1413.9 2 Samaki Meanchey rainfall (110430) 13.9 0.0 37.8 63.4 127.8 146.2 121.0 217.7 265.4 224.6 75.2 16.8 1309.7 7 Samlot rainfall (130215) 10.8 4.3 183.9 176.3 173.8 114.4 209.2 386.9 305.1 295.8 125.6 15.3 2001.3 2 Sandan rainfall (130505) 1.3 0.3 39.9 97.9 187.2 180.2 243.9 206.4 204.7 94.8 71.3 15.4 1343.1 5 Sasar Sdam rainfall (130311) 1.1 4.5 30.1 50.1 102.8 118.4 122.3 156.6 253.1 199.2 50.6 21.5 1110.2 5 Sdoc Ach Romeas rainfall (120407) 2.4 0.7 16.9 38.8 186.8 138.2 219.2 228.3 348.4 203.9 84.9 14.4 1483.0 3 Siem Reap Koktatry rainfall (130325) 4.6 3.6 25.1 53.3 120.8 176.0 175.0 196.0 272.1 216.5 81.1 4.3 1328.2 36 Sisophon rainfall (130202) 3.7 12.8 34.7 57.3 155.6 141.0 144.3 161.7 256.8 172.3 38.6 16.0 1194.7 25 Srey Snam rainfall (130326) 0.0 14.5 18.6 41.1 159.7 135.3 118.0 212.3 223.7 157.6 12.8 4.4 1098.1 3
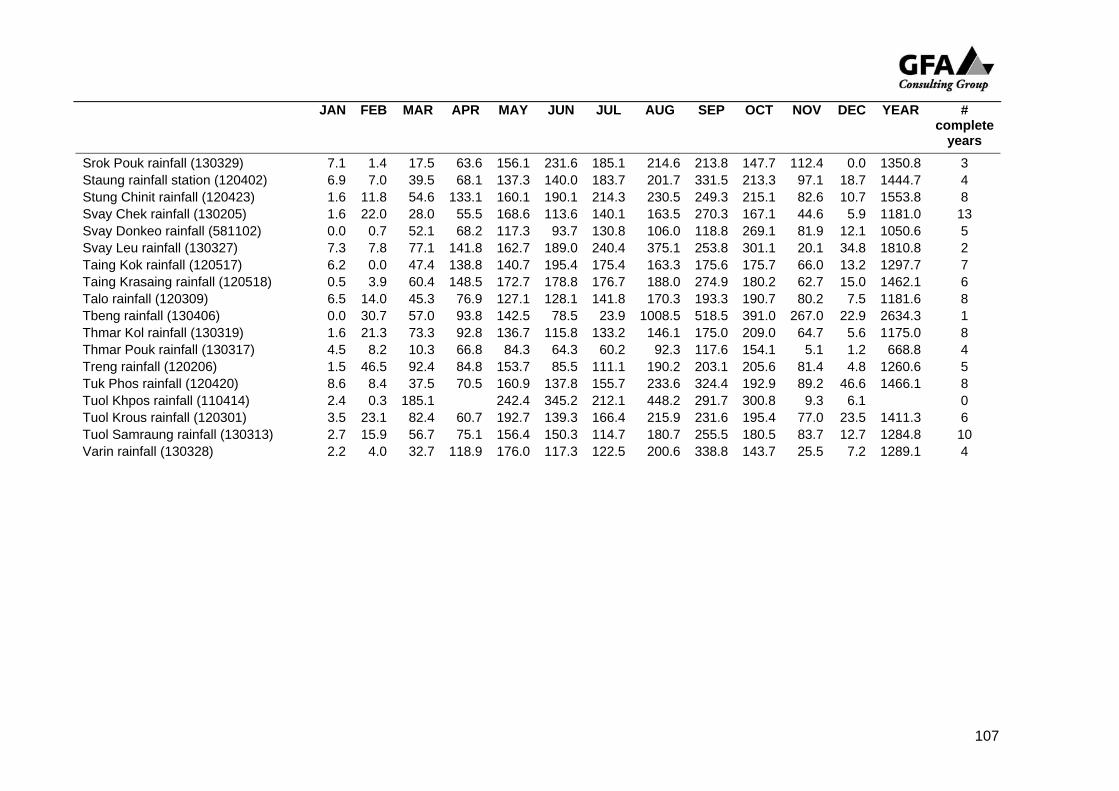
107
JAN FEB MAR APR MAY JUN JUL AUG SEP OCT NOV DEC YEAR # complete
years Srok Pouk rainfall (130329) 7.1 1.4 17.5 63.6 156.1 231.6 185.1 214.6 213.8 147.7 112.4 0.0 1350.8 3 Staung rainfall station (120402) 6.9 7.0 39.5 68.1 137.3 140.0 183.7 201.7 331.5 213.3 97.1 18.7 1444.7 4 Stung Chinit rainfall (120423) 1.6 11.8 54.6 133.1 160.1 190.1 214.3 230.5 249.3 215.1 82.6 10.7 1553.8 8 Svay Chek rainfall (130205) 1.6 22.0 28.0 55.5 168.6 113.6 140.1 163.5 270.3 167.1 44.6 5.9 1181.0 13 Svay Donkeo rainfall (581102) 0.0 0.7 52.1 68.2 117.3 93.7 130.8 106.0 118.8 269.1 81.9 12.1 1050.6 5 Svay Leu rainfall (130327) 7.3 7.8 77.1 141.8 162.7 189.0 240.4 375.1 253.8 301.1 20.1 34.8 1810.8 2 Taing Kok rainfall (120517) 6.2 0.0 47.4 138.8 140.7 195.4 175.4 163.3 175.6 175.7 66.0 13.2 1297.7 7 Taing Krasaing rainfall (120518) 0.5 3.9 60.4 148.5 172.7 178.8 176.7 188.0 274.9 180.2 62.7 15.0 1462.1 6 Talo rainfall (120309) 6.5 14.0 45.3 76.9 127.1 128.1 141.8 170.3 193.3 190.7 80.2 7.5 1181.6 8 Tbeng rainfall (130406) 0.0 30.7 57.0 93.8 142.5 78.5 23.9 1008.5 518.5 391.0 267.0 22.9 2634.3 1 Thmar Kol rainfall (130319) 1.6 21.3 73.3 92.8 136.7 115.8 133.2 146.1 175.0 209.0 64.7 5.6 1175.0 8 Thmar Pouk rainfall (130317) 4.5 8.2 10.3 66.8 84.3 64.3 60.2 92.3 117.6 154.1 5.1 1.2 668.8 4 Treng rainfall (120206) 1.5 46.5 92.4 84.8 153.7 85.5 111.1 190.2 203.1 205.6 81.4 4.8 1260.6 5 Tuk Phos rainfall (120420) 8.6 8.4 37.5 70.5 160.9 137.8 155.7 233.6 324.4 192.9 89.2 46.6 1466.1 8 Tuol Khpos rainfall (110414) 2.4 0.3 185.1 242.4 345.2 212.1 448.2 291.7 300.8 9.3 6.1 0 Tuol Krous rainfall (120301) 3.5 23.1 82.4 60.7 192.7 139.3 166.4 215.9 231.6 195.4 77.0 23.5 1411.3 6 Tuol Samraung rainfall (130313) 2.7 15.9 56.7 75.1 156.4 150.3 114.7 180.7 255.5 180.5 83.7 12.7 1284.8 10 Varin rainfall (130328) 2.2 4.0 32.7 118.9 176.0 117.3 122.5 200.6 338.8 143.7 25.5 7.2 1289.1 4
108
A N N E X 5 . M E A N M O N T H L Y A N D A N N U A L R A I N D A Y S
(Based on data presented in Department of Meteorology Report, Rainfall monitoring stations, Tonle Sap Basin, August 2006, MOWRAM)

109
JAN FEB MAR APR MAY JUN JUL AUG SEP OCT NOV DEC YEAR # complete
years Angkor Chum rainfall (130320) 0.4 0.6 1.6 3.8 6.8 9.0 7.5 10.0 11.3 8.3 4.3 0.8 64.6 5 Angkor Wat rainfall (130310) 0.5 1.5 5.0 5.5 13.5 17.5 15.5 15.0 20.5 24.0 11.0 4.5 134.0 7 Bac Preah rainfall (130314) 0.1 1.4 1.4 4.7 10.7 11.4 13.3 11.0 11.7 8.6 3.1 1.1 78.7 6 Bamnak rainfall (120406) 0.8 1.1 3.8 5.3 10.6 11.6 13.0 13.7 16.1 14.3 9.3 1.4 101.0 15 Banan rainfall (130301) 0.5 1.5 3.5 4.5 4.5 3.0 6.0 9.7 8.7 8.0 2.7 0.3 52.8 7 Banteay Srey rainfall (130322) 0.3 0.3 2.0 4.0 8.2 12.8 8.0 11.8 13.0 9.4 1.3 0.3 71.2 4 Baray rainfall (120503) 0.3 1.0 2.3 4.8 9.6 11.4 13.6 12.8 13.8 11.5 4.2 1.2 86.4 23 Battambang rainfall (130305) 0.8 2.0 4.2 7.5 12.8 14.3 17.2 17.4 18.1 14.5 6.9 2.2 117.8 53 Boeung Kantout rainfall (120320) 0.1 0.3 2.7 4.4 9.1 9.1 11.3 11.3 12.9 11.2 6.3 1.4 80.2 7 Boeung Khnar rainfall (120426) 0.7 0.7 4.3 6.1 9.6 10.9 13.5 15.0 16.7 15.3 7.0 1.8 101.6 5 Boeung Leach rainfall (110429) 1.5 0.0 1.8 3.5 9.3 9.0 8.4 12.4 14.0 10.2 2.8 1.4 74.2 4 Boeung Por rainfall (120411) 2.0 0.0 2.3 2.7 7.0 12.0 9.0 17.8 14.3 10.0 3.3 1.5 81.8 3 Boeung Raing rainfall (130318) 0.7 1.0 3.7 5.0 6.0 5.7 8.0 8.0 6.7 8.7 4.0 1.0 58.3 3 Boribo rainfall (120410) 1.0 0.0 2.0 3.8 11.4 11.2 14.0 17.8 16.8 13.7 5.2 1.2 98.0 2 Bovel rainfall (130208) 1.0 1.5 3.0 4.0 5.0 6.0 7.7 13.0 10.3 8.7 1.3 0.0 61.5 3 Chamlong Kuoy rainfall (120205) 1.5 2.0 3.5 7.0 7.0 6.5 5.0 12.3 12.7 12.3 5.7 0.7 76.2 7 Cheang Meanchey rainfall (120311) 1.0 1.5 6.5 5.5 7.0 5.5 4.7 10.0 9.7 12.0 5.0 0.3 68.7 2 Chong Kal rainfall (130309) 0.5 2.5 0.5 4.5 6.5 9.5 10.5 11.0 10.0 10.0 4.0 1.0 70.5 1 Damdek rainfall (130404) 0.3 0.0 2.1 3.6 5.1 9.0 9.4 10.8 11.7 10.5 5.2 2.0 69.7 5 Dap Bat rainfall (120304) 0.4 0.7 3.6 5.3 10.3 8.8 11.2 13.9 17.4 13.9 6.4 1.8 93.4 17 Doun Pean rainfall (120414) 1.5 0.5 5.0 3.0 5.0 7.0 3.5 11.3 6.0 8.3 5.3 1.0 57.5 2 Kauk Patry rainfall (130312) 0.5 0.7 2.4 4.3 10.8 16.4 15.6 15.7 17.9 14.8 6.7 1.1 106.9 14 Khum Lvear rainfall (130323) 0.0 2.0 5.0 3.5 7.0 9.0 10.0 9.5 15.5 18.0 10.0 1.0 90.5 2 Komping Puoy rainfall (130211) 0.0 1.5 7.0 4.5 14.5 13.5 7.3 14.3 14.0 15.7 5.3 1.0 98.7 2 Kompong Chhnang rainfall (120401) 0.6 1.4 1.6 4.4 13.4 15.7 18.5 17.6 18.7 16.2 7.1 2.3 117.3 40 Kompong K'dei rainfall (130405) 0.6 1.0 2.2 5.2 10.5 10.7 12.7 13.0 15.1 14.1 5.3 1.6 92.1 11 Kompong Leang rainfall (120415) 0.4 0.6 2.7 4.3 10.3 11.9 12.9 14.3 12.6 12.0 4.7 0.7 87.4 9 Kompong Thmar rainfall (620101) 0.8 2.4 4.4 8.2 12.4 13.5 15.6 16.8 14.2 16.6 8.2 1.8 114.9 4 Kompong Thom rainfall (120404) 0.3 0.8 2.5 5.1 11.9 15.0 14.2 12.8 16.6 13.0 5.6 1.5 99.2 46 Kompong Tralach rainfall (110405) 0.6 0.8 1.6 4.4 9.2 10.7 11.0 12.4 15.5 13.7 6.0 1.8 87.4 19 Komrieng rainfall (130210) 1.0 0.0 5.0 2.0 4.0 3.5 2.3 4.0 8.3 6.3 6.3 0.0 42.8 2

110
JAN FEB MAR APR MAY JUN JUL AUG SEP OCT NOV DEC YEAR # complete
years Kondal Chrass rainfall (120424) 2.5 0.0 3.3 4.0 5.5 7.8 10.6 12.6 9.3 12.5 3.3 1.0 72.3 3 Kraing Tamoung rainfall (120419) 1.0 0.0 4.7 4.3 13.7 14.7 14.8 20.0 18.5 12.0 4.3 1.8 109.6 3 Krakor rainfall (120403) 0.9 0.7 1.8 5.5 13.4 15.6 15.6 16.7 16.8 14.8 7.7 2.6 112.1 33 Kralanh rainfall (130302) 0.1 0.7 2.3 4.3 8.6 8.4 8.9 9.7 11.5 8.8 3.9 0.6 67.8 17 Kravanh-Leach rainfall (120306) 0.8 1.4 3.2 5.3 8.9 9.1 7.6 9.9 10.8 11.9 6.8 1.9 77.6 13 Maung Russey rainfall (120303) 0.3 0.6 3.0 4.4 7.3 6.5 7.0 7.2 10.0 9.7 6.1 1.0 63.0 20 Mongkol Borey rainfall (130315) 0.3 1.3 6.8 5.5 10.7 10.7 14.2 13.3 14.7 10.5 2.8 0.7 91.5 7 O Chrov rainfall (130209) 0.3 2.0 3.7 3.0 8.7 5.3 9.7 12.0 11.0 11.3 3.0 0.0 70.0 2 O Taky rainfall (130304) 1.0 0.5 3.0 3.5 5.0 6.0 5.3 8.3 7.3 7.0 2.7 0.0 49.7 5 Pailin rainfall (120202) 1.7 3.6 8.4 9.8 15.4 12.9 14.6 14.9 16.7 13.5 8.1 2.4 122.0 10 Peam rainfall (120313) 2.5 0.0 9.0 5.5 11.5 8.0 9.3 15.0 12.0 18.0 5.7 2.7 99.2 2 Phnom Koulen rainfall (130403) 2.0 2.0 5.5 8.0 14.0 15.0 15.0 17.0 19.0 14.5 2.5 0.5 115.0 3 Phnom Krom rainfall (130324) 0.0 0.0 3.5 2.5 10.0 16.5 15.5 17.5 14.0 10.0 4.0 2.0 95.5 2 Phnom Srok rainfall (130308) 0.1 0.6 1.8 2.2 7.3 6.9 7.5 8.6 11.2 8.5 3.8 0.5 59.0 12 Pong Ros rainfall (120418) 0.8 0.3 3.5 2.5 8.5 8.8 11.4 15.4 14.0 9.6 4.0 1.0 79.7 4 Ponley rainfall (120417) 0.0 0.5 1.8 2.0 8.4 11.1 9.9 13.6 12.3 10.0 4.6 0.8 74.8 8 Pranet Preah rainfall (130316) 0.3 0.8 3.3 4.8 7.3 8.3 7.5 8.8 10.5 10.5 1.3 0.8 63.8 6 Prasat Bakong rainfall (130321) 0.0 0.0 3.0 3.7 8.8 11.5 14.2 13.0 15.6 10.2 7.2 1.2 88.3 5 Prasat Balaing rainfall (120422) 0.0 0.0 5.0 4.5 9.5 10.5 10.7 13.3 11.7 9.7 1.3 0.0 76.2 2 Prasat Sambo rainfall (120516) 0.0 0.0 3.3 4.0 7.7 14.7 11.8 14.0 12.5 9.0 1.0 0.0 77.9 3 Prey Prous rainfall (120425) 1.1 0.5 2.5 5.4 8.4 10.3 11.1 13.3 13.1 10.4 5.3 1.4 82.7 7 Pursat rainfall (120302) 0.4 0.8 3.1 5.9 11.1 9.8 10.2 13.0 15.3 11.9 7.5 2.5 91.3 50 Raing Kesey rainfall (120305) 0.4 0.6 3.1 3.9 11.4 9.4 12.0 12.4 16.3 8.6 6.6 0.4 85.1 12 Rattanak Mondol rainfall (120213) 0.5 1.5 4.0 6.5 8.0 4.0 2.0 9.7 14.0 12.7 4.3 1.3 68.5 2 Rolear Phear rainfall (120416) 0.3 0.4 2.4 4.3 10.3 12.1 13.4 13.9 13.4 12.7 3.4 0.8 87.5 7 Roung Chrey rainfall (130212) 0.0 1.5 3.5 2.0 9.0 4.0 5.0 13.3 10.0 8.7 2.0 0.3 59.3 2 Rovieng rainfall (130503) 0.0 0.0 2.7 4.3 11.7 10.0 12.0 13.5 15.0 3.0 1.0 0.5 73.7 2 Samaki Meanchey rainfall (110430) 0.6 0.0 1.8 2.8 6.8 7.4 6.1 9.1 10.6 10.5 3.1 0.8 59.4 7 Samlot rainfall (130215) 0.5 0.5 7.0 8.5 13.0 12.0 12.3 17.3 11.7 15.7 4.7 1.0 104.2 2 Sandan rainfall (130505) 0.3 0.2 3.0 4.8 11.8 10.2 13.5 14.3 14.2 9.2 4.0 0.8 86.3 5 Sasar Sdam rainfall (130311) 0.5 0.0 4.0 3.0 11.0 8.5 7.5 11.5 16.0 11.5 5.5 2.5 81.5 5 Sdoc Ach Romeas rainfall (120407) 0.7 0.3 1.0 4.0 12.7 11.0 12.7 17.0 19.5 15.3 7.5 0.8 102.3 3 Siem Reap Koktatry rainfall (130325) 0.6 0.6 2.3 4.5 10.0 14.7 15.8 16.0 18.1 15.1 7.2 0.8 105.7 34

111
JAN FEB MAR APR MAY JUN JUL AUG SEP OCT NOV DEC YEAR # complete
years Sisophon rainfall (130202) 0.4 1.6 3.0 5.6 13.5 11.9 15.1 15.0 16.7 12.7 4.5 1.8 101.5 25 Srey Snam rainfall (130326) 0.0 0.3 0.7 2.3 5.7 5.7 5.0 12.7 10.3 6.0 1.3 0.3 50.3 3 Srok Pouk rainfall (130329) 1.0 0.3 1.0 5.0 8.3 11.0 12.3 12.3 15.3 9.3 6.7 0.0 82.7 3 Staung rainfall station (120402) 1.0 1.6 3.7 4.4 9.0 9.7 11.2 13.1 14.9 11.7 7.8 3.6 91.6 4 Stung Chinit rainfall (120423) 1.5 1.6 3.8 7.6 11.9 12.0 14.8 15.6 14.3 13.6 5.9 1.6 104.1 8 Svay Chek rainfall (130205) 0.0 0.8 3.3 3.8 6.0 5.8 9.6 9.8 11.8 7.4 1.4 0.5 60.0 13 Svay Donkeo rainfall (581102) 0.0 0.2 4.4 5.2 8.8 8.8 12.8 10.5 9.8 12.0 7.2 1.7 81.4 5 Svay Leu rainfall (130327) 1.5 1.5 6.0 6.0 8.0 12.0 11.0 12.5 11.5 10.5 4.5 4.5 89.5 2 Taing Kok rainfall (120517) 1.1 0.1 2.4 6.3 8.3 11.0 12.5 13.1 10.3 11.1 4.5 1.4 82.2 7 Taing Krasaing rainfall station (120518) 0.8 1.2 5.7 10.0 22.5 23.5 22.5 26.7 23.7 17.8 7.0 1.3 162.7 6 Talo rainfall (120309) 0.0 0.4 4.2 3.0 6.0 9.0 10.5 10.0 11.0 11.5 4.3 0.8 70.8 8 Tbeng rainfall (130406) 0.0 1.0 3.0 8.0 8.0 7.0 4.0 13.0 10.0 8.0 6.0 2.0 70.0 1 Thmar Kol rainfall (130319) 0.1 1.1 2.9 4.3 6.8 6.9 8.5 8.5 9.6 7.5 2.5 0.6 59.3 8 Thmar Pouk rainfall (130317) 0.5 1.5 1.8 4.0 4.8 5.0 4.5 6.5 10.3 8.3 0.8 0.3 48.0 4 Treng rainfall (120206) 0.0 2.5 8.0 6.5 12.5 8.5 11.3 15.0 18.8 18.3 9.8 2.3 113.3 5 Tuk Phos rainfall (120420) 1.6 0.6 2.3 3.6 8.8 7.9 9.3 11.6 12.4 10.2 3.8 2.2 74.2 8 Tuol Khpos rainfall (110414) 3.0 1.0 10.0 16.0 17.0 16.5 20.0 19.5 18.5 3.5 0.5 0 Tuol Krous rainfall (120301) 1.8 2.2 5.3 6.0 16.2 13.9 16.4 19.0 20.9 18.7 9.9 2.0 132.2 6 Tuol Samraung rainfall (130313) 0.7 1.8 5.8 6.7 14.0 13.8 14.8 16.0 16.7 9.7 5.5 1.6 107.1 10 Varin rainfall (130328) 0.5 1.0 3.0 4.8 8.5 5.8 6.8 10.0 10.8 6.8 2.8 1.0 61.5 4

A N N E X 6 . A N N U A L M A X I M U M O N E - D A Y R A I N F A L L S
(Based on data presented in Department of Meteorology Report, Rainfall monitoring stations, Tonle Sap Basin, August 2006, MOWRAM)
112

rank Battam
bang % AEI Pursat % AEI Kompong
Chhnang % AEI
1 200.80 1.31 76.29 209.90 1.39 72.00 226.00 1.17 85.572 149.80 3.18 31.41 177.70 3.37 29.65 178.00 2.84 35.243 144.00 5.06 19.78 163.70 5.36 18.67 170.00 4.51 22.194 138.20 6.93 14.43 134.80 7.34 13.62 151.00 6.18 16.195 133.40 8.80 11.36 129.40 9.33 10.72 144.50 7.85 12.746 132.70 10.67 9.37 128.50 11.31 8.84 139.00 9.52 10.517 123.70 12.55 7.97 125.30 13.29 7.52 130.00 11.19 8.948 121.20 14.42 6.94 123.00 15.28 6.55 130.00 12.85 7.789 109.50 16.29 6.14 121.00 17.26 5.79 110.00 14.52 6.89
10 109.00 18.16 5.51 120.00 19.25 5.20 107.50 16.19 6.1811 108.70 20.04 4.99 119.30 21.23 4.71 98.80 17.86 5.6012 108.60 21.91 4.56 112.60 23.21 4.31 96.70 19.53 5.1213 104.20 23.78 4.20 109.80 25.20 3.97 96.70 21.20 4.7214 104.10 25.66 3.90 101.40 27.18 3.68 93.00 22.87 4.3715 100.00 27.53 3.63 99.50 29.17 3.43 91.10 24.54 4.0716 99.60 29.40 3.40 96.00 31.15 3.21 87.90 26.21 3.8217 95.50 31.27 3.20 92.30 33.13 3.02 87.70 27.88 3.5918 94.10 33.15 3.02 92.10 35.12 2.85 84.50 29.55 3.3819 91.80 35.02 2.86 90.90 37.10 2.70 84.20 31.22 3.2020 89.70 36.89 2.71 90.00 39.09 2.56 83.20 32.89 3.0421 88.80 38.76 2.58 84.50 41.07 2.43 83.00 34.56 2.8922 88.60 40.64 2.46 83.60 43.06 2.32 81.70 36.23 2.7623 87.50 42.51 2.35 82.70 45.04 2.22 81.50 37.90 2.6424 85.60 44.38 2.25 81.50 47.02 2.13 79.70 39.57 2.5325 85.60 46.25 2.16 81.10 49.01 2.04 79.20 41.24 2.4326 84.30 48.13 2.08 81.00 50.99 1.96 78.00 42.90 2.3327 83.00 50.00 2.00 78.60 52.98 1.89 75.20 44.57 2.2428 82.70 51.87 1.93 78.30 54.96 1.82 74.60 46.24 2.1629 80.70 53.75 1.86 77.00 56.94 1.76 73.50 47.91 2.0930 80.40 55.62 1.80 77.00 58.93 1.70 72.10 49.58 2.0231 79.00 57.49 1.74 75.00 60.91 1.64 69.00 51.25 1.9532 78.50 59.36 1.68 73.90 62.90 1.59 66.00 52.92 1.8933 78.40 61.24 1.63 73.50 64.88 1.54 65.20 54.59 1.8334 73.90 63.11 1.58 72.80 66.87 1.50 64.70 56.26 1.7835 72.00 64.98 1.54 71.00 68.85 1.45 64.30 57.93 1.7336 72.00 66.85 1.50 70.50 70.83 1.41 64.20 59.60 1.6837 70.20 68.73 1.46 68.00 72.82 1.37 63.50 61.27 1.6338 70.20 70.60 1.42 66.00 74.80 1.34 61.00 62.94 1.5939 67.10 72.47 1.38 65.80 76.79 1.30 60.30 64.61 1.5540 66.70 74.34 1.35 65.20 78.77 1.27 59.50 66.28 1.5141 65.80 76.22 1.31 63.20 80.75 1.24 59.10 67.95 1.4742 65.30 78.09 1.28 62.50 82.74 1.21 22.50 69.62 1.4443 63.60 79.96 1.25 62.20 84.72 1.18 42.00 44 62.50 81.84 1.22 58.90 86.71 1.15 45 60.90 83.71 1.19 58.60 88.69 1.13 46 59.00 85.58 1.17 57.70 90.67 1.10 47 59.00 87.45 1.14 56.30 92.66 1.08 48 58.20 89.33 1.12 53.20 94.64 1.06 49 53.70 91.20 1.10 49.50 96.63 1.03 50 50.00 93.07 1.07 39.50 98.61 1.01
113

rank Battam bang
% AEI Pursat % AEI Kompong Chhnang
% AEI
51 49.80 94.94 1.05 50.00 52 49.30 96.82 1.03 53 41.70 98.69 1.01
53.00 rank Maung
Russey % AEI Sisophon % AEI
1 195.10 3.43 29.14 139.90 3.27 30.57 2 163.00 8.33 12.00 127.70 7.94 12.59 3 157.90 13.24 7.56 119.20 12.62 7.93 4 136.80 18.14 5.51 106.40 17.29 5.78 5 99.40 23.04 4.34 104.20 21.96 4.55 6 95.00 27.94 3.58 102.90 26.64 3.75 7 94.40 32.84 3.04 100.00 31.31 3.19 8 92.80 37.75 2.65 96.00 35.98 2.78 9 87.10 42.65 2.34 94.40 40.65 2.46
10 83.70 47.55 2.10 87.70 45.33 2.21 11 83.00 52.45 1.91 81.30 50.00 2.00 12 79.30 57.35 1.74 79.00 54.67 1.83 13 73.30 62.25 1.61 78.00 59.35 1.69 14 60.50 67.16 1.49 77.20 64.02 1.56 15 54.00 72.06 1.39 71.00 68.69 1.46 16 53.00 76.96 1.30 68.20 73.36 1.36 17 52.50 81.86 1.22 65.50 78.04 1.28 18 51.50 86.76 1.15 55.50 82.71 1.21 19 49.30 91.67 1.09 45.00 87.38 1.14 20 35.20 96.57 1.04 39.40 92.06 1.09 21 20.00 33.00 96.73 1.03
21.00
114

rank Baray P AEI Siem
Reap % AEI Krakor % AEI
1 162.00 2.16 46.29 160.40 2.03 49.14 210.00 2.10 47.712 126.00 5.25 19.06 156.50 4.94 20.24 202.90 5.09 19.653 115.50 8.33 12.00 139.00 7.85 12.74 183.00 8.08 12.374 114.00 11.42 8.76 135.50 10.76 9.30 175.50 11.08 9.035 108.00 14.51 6.89 130.50 13.66 7.32 159.40 14.07 7.116 107.70 17.59 5.68 123.00 16.57 6.04 143.30 17.07 5.867 107.00 20.68 4.84 118.30 19.48 5.13 125.50 20.06 4.998 104.00 23.77 4.21 109.40 22.38 4.47 124.40 23.05 4.349 102.70 26.85 3.72 106.50 25.29 3.95 124.00 26.05 3.84
10 101.00 29.94 3.34 100.60 28.20 3.55 120.00 29.04 3.4411 100.10 33.02 3.03 99.10 31.10 3.21 113.00 32.04 3.1212 95.20 36.11 2.77 99.00 34.01 2.94 109.20 35.03 2.8513 94.00 39.20 2.55 98.90 36.92 2.71 89.20 38.02 2.6314 90.20 42.28 2.36 97.80 39.83 2.51 88.40 41.02 2.4415 88.50 45.37 2.20 96.00 42.73 2.34 88.10 44.01 2.2716 84.20 48.46 2.06 94.60 45.64 2.19 86.20 47.01 2.1317 84.00 51.54 1.94 90.80 48.55 2.06 80.60 50.00 2.0018 79.50 54.63 1.83 90.70 51.45 1.94 79.10 52.99 1.8919 79.00 57.72 1.73 88.60 54.36 1.84 74.00 55.99 1.7920 78.00 60.80 1.64 87.50 57.27 1.75 70.30 58.98 1.7021 78.00 63.89 1.57 85.60 60.17 1.66 67.00 61.98 1.6122 78.00 66.98 1.49 85.20 63.08 1.59 66.40 64.97 1.5423 75.50 70.06 1.43 82.50 65.99 1.52 65.50 67.96 1.4724 71.90 73.15 1.37 80.60 68.90 1.45 59.80 70.96 1.4125 70.30 76.23 1.31 73.40 71.80 1.39 54.00 73.95 1.3526 69.20 79.32 1.26 72.80 74.71 1.34 49.00 76.95 1.3027 65.50 82.41 1.21 68.60 77.62 1.29 47.20 79.94 1.2528 65.20 85.49 1.17 68.20 80.52 1.24 43.60 82.93 1.2129 62.10 88.58 1.13 67.00 83.43 1.20 42.10 85.93 1.1630 60.00 91.67 1.09 60.00 86.34 1.16 38.20 88.92 1.1231 52.10 94.75 1.06 54.10 89.24 1.12 38.10 91.92 1.0932 51.60 97.84 1.02 52.50 92.15 1.09 37.10 94.91 1.0533 32.00 40.90 95.06 1.05 35.30 97.90 1.02
29.20 97.97 1.02 33.00 34.00
115

116
A N N E X 7 . E V A P O R A T I O N E S T I M A T E S

117
Pochentong, Kandal Jan Feb Mar Apr May Jun Jul Aug Sep Oct Nov Dec Total/Ave Record
Mean monthly rainfall (mm) 5.8 3.8 16.6 78.8 109.2 112.1 132.9 155.8 187.9 208.5 123.6 35.4 1170.4 91-00 Mean monthly evaporation (mm/day) 91-00 Mean monthly relative humidity (%) 72.9 70.5 70.6 71.4 76.4 78.8 82.3 82.9 85.5 86 79.6 75.2 78 91-00 Mean monthly temperature (°C) 26.3 27.6 29.3 30.1 29.9 28.9 28.2 28.2 27.9 27.2 26.5 25.9 28.0 91-00 Mean monthly maximum temperature (°C) 31.1 32.7 34.5 34.9 34.3 33 31.9 31.9 31.7 30.8 30.6 30.4 91-00 Mean monthly minimum temperature (°C) 21.4 22.5 24.1 25.3 25.4 24.8 24.6 24.6 24 23.7 22.4 21.4 91-00 Monthly mean wind velocity (m/sec) 3.1 3.9 4.1 3.8 4.1 4.6 3.9 5 4.3 2.7 3.6 3.7 3.9 91-00 Mean monthly sunshine hours (h/day) 8.7 8.6 8.6 8.3 7.3 6.1 5.8 5.9 5.6 5.8 7.4 8.4 7.2 91-00 Monthly Eto (mm) 162 174 216 206 191 167 153 159 140 133 146 156 2003 Source: Table B-1, The study on the rehabilitation and reconstruction of agricultural production systm in the Slakou River Basin, Kingdom of Cambodia. Nippon Koei (March 2002). Original data from MOWRAM. Eto calculated using modified Penman method (FAO Irrigation & Drainage Paper 24)
West Baray, Siem Reap
Jan Feb Mar Apr May Jun Jul Aug Sep Oct Nov Dec Total/AveMean monthly rainfall (mm) 4.7 3.7 25.4 51.0 115.5 168.6 174.6 196.0 272.1 218.4 77.7 4.3 1311.9Mean monthly evaporation (mm/day) Mean monthly relative humidity (%)
C)68.8 67 65 67.2 74 77.5 78.8 79 82.2 80.8 75.3 73 74.0
Mean monthly temperature (° Mean monthly maximum temperature (°C) 32.3 33.8 35 35.7 34.9 33.6 33.1 32.2 31.8 31.6 31.1 30.7 33.0Mean monthly minimum temperature (°C) 20.7 23 24 25.4 25.4 25 24.9 25.1 24.5 24.1 22.4 20.7 23.8Monthly mean wind velocity (m/sec) 1.83 1.75 1.67 2.07 2.17 2.38 2.00 2.33 2.00 2.00 1.83 2.17 2.01Mean monthly sunshine hours (h/day) 7.5 7.1 6.6 6.4 5.9 5.8 5.7 5 4.7 5.7 6.9 6.8 6.2Monthly Eto (mm) 133 129 158 162 158 144 140 136 120 124 120 124 1648Source: Table 4.8, Rehabilitation of West Baray Irrigation Project in Siem Reap Province, Cambodia, Draft Project Report (October 2004). Mean monthly rainfall totals from DoM (August 2006)
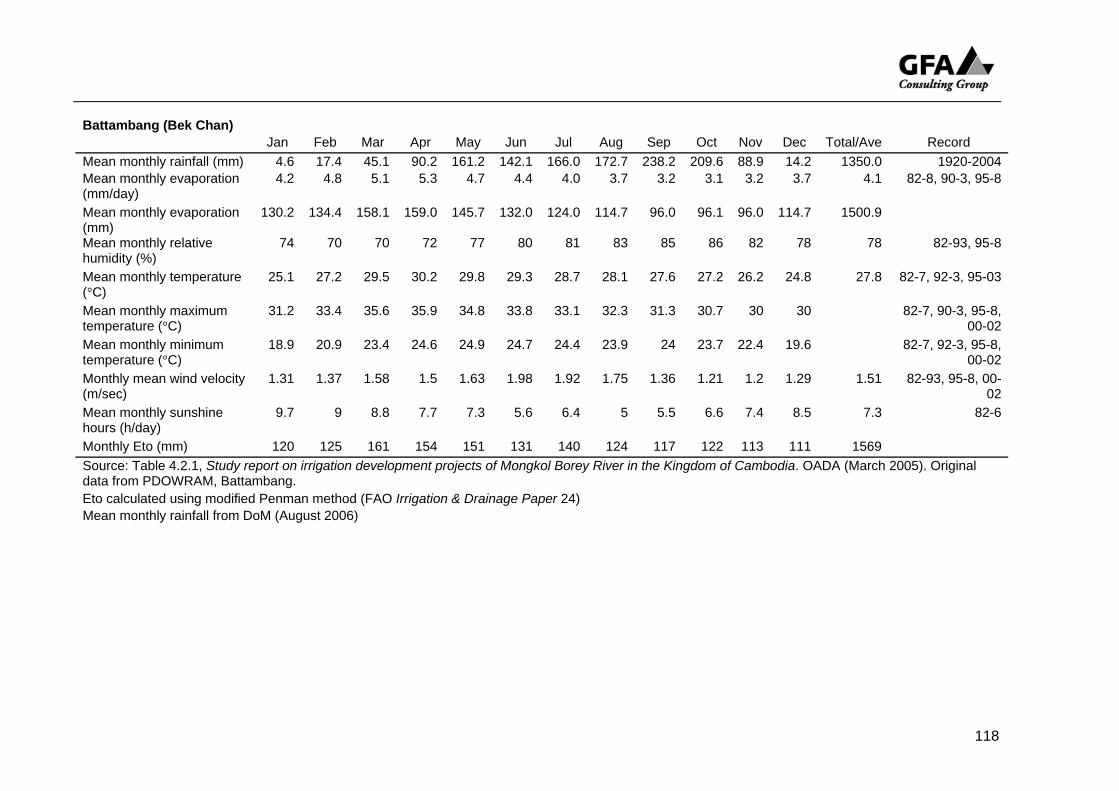
118
Battambang (Bek Chan)
Jan Feb Mar Apr May Jun Jul Aug Sep Oct Nov Dec Total/Ave Record Mean monthly rainfall (mm) 4.6 17.4 45.1 90.2 161.2 142.1 166.0 172.7 238.2 209.6 88.9 14.2 1350.0 1920-2004 Mean monthly evaporation (mm/day)
4.2 4.8 5.1 5.3 4.7 4.4 4.0 3.7 3.2 3.1 3.2 3.7 4.1 82-8, 90-3, 95-8
Mean monthly evaporation (mm)
130.2 134.4 158.1 159.0 145.7 132.0 124.0 114.7 96.0 96.1 96.0 114.7 1500.9
Mean monthly relative humidity (%)
74 70 70 72 77 80 81 83 85 86 82 78 78 82-93, 95-8
Mean monthly temperature (°C)
25.1 27.2 29.5 30.2 29.8 29.3 28.7 28.1 27.6 27.2 26.2 24.8 27.8 82-7, 92-3, 95-03
Mean monthly maximum temperature (°C)
31.2 33.4 35.6 35.9 34.8 33.8 33.1 32.3 31.3 30.7 30 30 82-7, 90-3, 95-8, 00-02
Mean monthly minimum temperature (°C)
18.9 20.9 23.4 24.6 24.9 24.7 24.4 23.9 24 23.7 22.4 19.6 82-7, 92-3, 95-8, 00-02
Monthly mean wind velocity (m/sec)
1.31 1.37 1.58 1.5 1.63 1.98 1.92 1.75 1.36 1.21 1.2 1.29 1.51 82-93, 95-8, 00-02
Mean monthly sunshine hours (h/day)
9.7 9 8.8 7.7 7.3 5.6 6.4 5 5.5 6.6 7.4 8.5 7.3 82-6
Monthly Eto (mm) 120 125 161 154 151 131 140 124 117 122 113 111 1569 Source: Table 4.2.1, Study report on irrigation development projects of Mongkol Borey River in the Kingdom of Cambodia. OADA (March 2005). Original data from PDOWRAM, Battambang. Eto calculated using modified Penman method (FAO Irrigation & Drainage Paper 24) Mean monthly rainfall from DoM (August 2006)
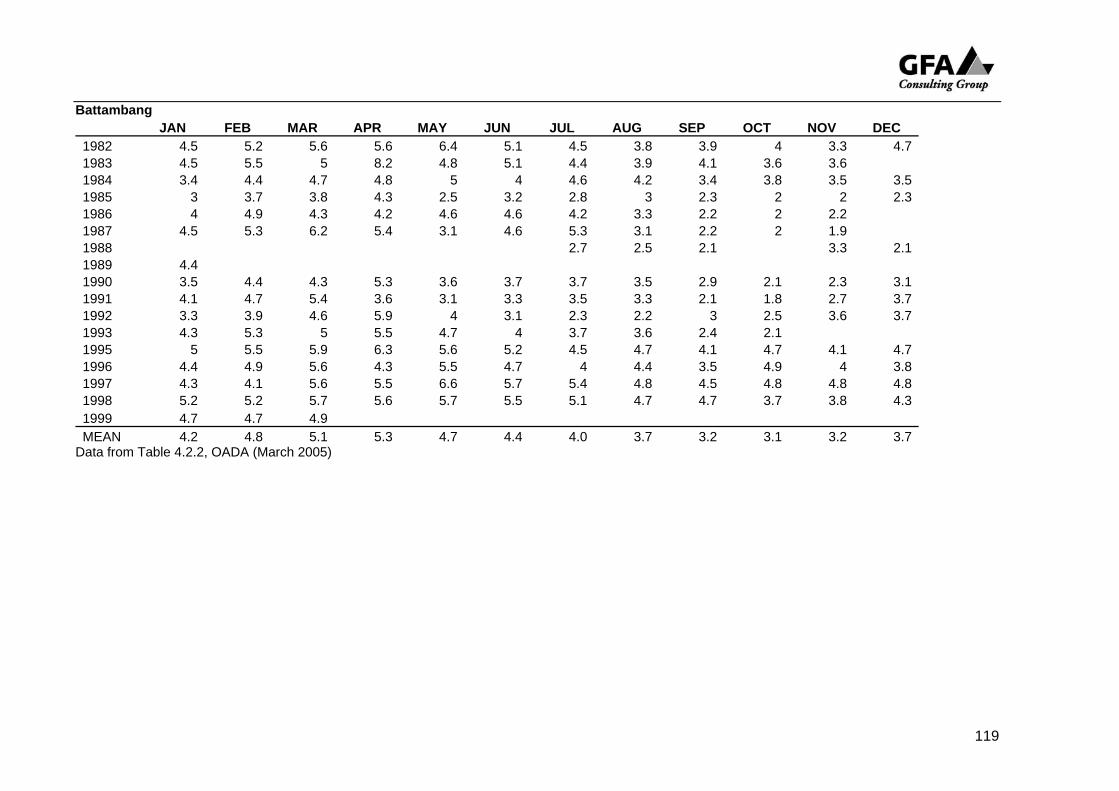
119
Battambang JAN FEB MAR APR MAY JUN JUL AUG SEP OCT NOV DEC
1982 4.5 5.2 5.6 5.6 6.4 5.1 4.5 3.8 3.9 4 3.3 4.71983 4.5 5.5 5 8.2 4.8 5.1 4.4 3.9 4.1 3.6 3.6 1984 3.4 4.4 4.7 4.8 5 4 4.6 4.2 3.4 3.8 3.5 3.51985 3 3.7 3.8 4.3 2.5 3.2 2.8 3 2.3 2 2 2.31986 4 4.9 4.3 4.2 4.6 4.6 4.2 3.3 2.2 2 2.2 1987 4.5 5.3 6.2 5.4 3.1 4.6 5.3 3.1 2.2 2 1.9 1988 2.7 2.5 2.1 3.3 2.11989 4.4 1990 3.5 4.4 4.3 5.3 3.6 3.7 3.7 3.5 2.9 2.1 2.3 3.11991 4.1 4.7 5.4 3.6 3.1 3.3 3.5 3.3 2.1 1.8 2.7 3.71992 3.3 3.9 4.6 5.9 4 3.1 2.3 2.2 3 2.5 3.6 3.71993 4.3 5.3 5 5.5 4.7 4 3.7 3.6 2.4 2.1 1995 5 5.5 5.9 6.3 5.6 5.2 4.5 4.7 4.1 4.7 4.1 4.71996 4.4 4.9 5.6 4.3 5.5 4.7 4 4.4 3.5 4.9 4 3.81997 4.3 4.1 5.6 5.5 6.6 5.7 5.4 4.8 4.5 4.8 4.8 4.81998 5.2 5.2 5.7 5.6 5.7 5.5 5.1 4.7 4.7 3.7 3.8 4.31999 4.7 4.7 4.9 MEAN 4.2 4.8 5.1 5.3 4.7 4.4 4.0 3.7 3.2 3.1 3.2 3.7
Data from Table 4.2.2, OADA (March 2005)

120
Stung Chinit, Kompong Thom
Jan Feb Mar Apr May Jun Jul Aug Sep Oct Nov Dec Total/Ave Mean monthly rainfall (mm) 4.5 12.7 34.0 77.2 172.2 202.6 191.5 208.6 257.8 193.1 57.6 25.6 1437 Mean monthly pan evaporation (mm) 197.0 209.0 254.0 222.0 187.0 174.0 168.0 166.0 139.0 145.0 161.0 184.0 2206 Mean monthly evaporation (mm - factor 0.7) 137.9 146.3 177.8 155.4 130.9 121.8 117.6 116.2 97.3 101.5 112.7 128.8 1544 Mean monthly relative humidity (%) 70 70 66 72 78 82 82 82 84 82 77 71 76 Mean monthly temperature (°C) Mean monthly maximum temperature (°C) 31.6 32.9 34 34.6 33.4 32.2 31.4 31.5 31.2 31 30.9 30.7 32.1 Mean monthly minimum temperature (°C) 21 21.9 25.5 24.9 24.7 24.1 23.9 24 23.8 23.6 22.8 21.6 23.5 Monthly mean wind velocity (m/sec) 1.20 0.90 1.00 0.90 1.00 0.69 1.00 0.90 0.90 0.69 1.00 1.20 0.95 Mean monthly sunshine hours (h/day) 9.1 9.1 8.5 8.2 7.2 6.4 5.8 5.7 5.2 6.5 7.7 8.6 7.3 Monthly Eto (mm) 130 126 155 153 143 123 124 124 111 118 114 124 1545 Source: Table 2.1, Stung Chinit Water Resources Development Project Final Report, Volume I: Main Report (Cargill Technical Services, December 1997) Mean monthly rainfall from Baray station (from DoM, August 2006)
Thlea Maam, Battambang
Jan Feb Mar Apr May Jun Jul Aug Sep Oct Nov Dec Total/Ave Record Mean monthly rainfall (mm) 6.9 7.6 31.0 67.2 190.2 188.3 184.1 205.7 233.5 275.3 101.6 24.1 1516 (Krakor) Effective mean monthly evaporation (mm/day) 3.8 4.4 4.7 5.1 4.2 4.3 3.9 3.5 3.5 3.1 3.2 3.3 1425 (Battambang) Mean monthly relative humidity (%) 75 70 70 71 74 76 82 83 84 83 83 80 78 (Battambang) Mean monthly temperature (°C) Mean monthly maximum temperature (°C) 31.2 33.5 35.4 35.4 35.1 33.8 33 32.6 31.7 30.3 29.7 29.4 (Pursat) Mean monthly minimum temperature (°C) 20.8 22.5 23.6 25.3 25.7 25.2 24.9 24.7 24.6 24 23.1 21.5 (Pursat) Monthly mean wind velocity (m/sec) 0.27 0.24 0.27 0.23 0.22 0.27 0.26 0.27 0.19 0.19 0.20 0.22 (Sisophon) Mean monthly sunshine hours (h/day) 8.4 8.8 8.6 7.8 6.9 6.3 5.7 5.3 5.2 6.5 7.9 8.5 (Krakor) Monthly Eto (mm) Source: Table 3.1, Northwest Irrigation Sector Project, Phase II: Feasibility Report, Annex A: Thlea Maom Sub-project (October 2002) Mean monthly rainfall from DoM (August 2006)

121

A N N E X 8 . S E L E C T E D I N F O R M A T I O N S O U R C E S
A number of consultancy reports have compiled hydrometeorological information and have derived estimates of various parameters, for design purposes. This Annex summarises the most useful of these. Asian Development Bank, 2005. e-ATLAS of Tonle Sap Basin. ADB Technical Assistance Project TA 4427-CAM: Establishment of Tonle Sap Basin Management Organisation. This „e-ATLAS“, available in CD-ROM format, presents maps of the key characteristics (land use, topography, drainage systems, etc.) of the major sub-basins around the Tonle Sap Great Lake. It also provides summary hydrological information in the form of five-year hydrographs and simple statistics for the major sub-basins. BRL-Action Nord-Sud-GRET, undated. Project de rehabilitation du perimetre irrigue de Stung Chi Kraeng. Phase 1. Among other things, the report provides information on the climate and hydrology of the project area, using data from Kompong K’dei, Siem Reap and other stations. It attempts to synthesize a lengthened record, estimates water requirements and specific discharges, and also makes estimates of extreme rainfall events and floods in Stung Chikreng. Carbonnel, J. P., and Guiscafre, J., 1963?. Grand Lac du Cambodge, sedimentologie et hydrologie, 1962-1963. Ministry of Foregn Affairs, France. This scientific report presents a wealth of information on the surface water hydrology of the Great Lake, for the 1962-3 water year. The study was responsible for the highest quality data available for the Tonle Sap basin, unfortunately for only a single year which was not necessarily representative. The report presents, inter alia, data on lake inflows and water balance, as well as data on sediment loads etc. Cargill Technical Services Ltd, December 1997. Stung Chinit Water resources development project (TA 2592-CAM) Final Report, Volume 1: Main Report and report Hydrology Consultancy, Asian Development Bank. The Main Report summarises climate and hydrology, and the engineering analysis of hydrology and flood routing, for design of structures. The Hydrology Consultancy report provides full details of the analysis of maximum rainfall events and flood flows, as well as reviewing seven earlier studies considered to be useful. Halcrow, June 1994. Irrigation rehabilitation study in Cambodia. Final Report, Annex A – Hydrology. Mekong Secretariat/UNDP. The report is one of a set that comprehensively considers opportunities for rehabilitating irrigation systems. It compiles the climate, rainfall, evapotranspiration, and river level/flow data that were available in 1994, and presents recommendations for estimating hydrological parameters, particularly with regard to design floods.
122

JICA, February 2002. The study on groundwater development in Central Cambodia. Draft Final Report. Summary report. Kokusai Kogyo Co. Ltd. The report includes reference to extensive groundwater investigations in Kompong Chhnang, although with an orientation towards groundwater for rural water supply rather than for agriculture. It reviews hydrogeological conditions, test well drilling and yields, groundwater levels, and groundwater quality. Overall, it concludes that potential is low in Kompong Chhnang province. Le Van Sanh, June 2002. Mission report: Analyses of hydrological data at stations around the Great Lake and on Mekong, Bassac Rivers in 1960’s and from 1998 to 2001. No publisher: presumed to be Mekong River Commission. The report provides an excellent compilation of information on gauging stations, with an emphasis on rating curves and station descriptions. Levesque, Paul, August 1995. Water resources development in the Province of Pursat: A watershed-based study (3 volumes). The annexes present hydro-meteorological data for the Pursat river basin; the data are now available from the DoH&RW archive. Mekong River Commission, August 2001. Water Utilization Program – modelling of the flow regime and water quality of the Tonle Sap. Data report. Mekong River Commission Secretariat. The report reviews data availability in the Tonle Sap basin, for rainfall, evaporation, synoptic meteorological observations, water levels and flows. It presents inter alia estimates for mean flow 1962-1996, although how these were computed is not mentioned. Data are also presented on suspended sediment and water quality. Mekong River Commission, May 2004. Final Report: Consolidation of hydro-meteorological data and multi-functional hydrologic roles of Tonle Sap Lake and its vicinities. Phase III (Basinwide). CTI Engineering International and DHI Water and Environment. The report describes the process and results of a comprehensive analysis, including extensive hydrologic-hydraulic modelling, of the Tonle Sap system. In particular, it includes commentary and analysis of hydrological data for the major sub-basins of the Tonle Sap. Mekong River Commission and Cambodia National Mekong Committee, July 2002. Stueng Siem Reap Basin: case study and project ideas. Mekong River Commission and Cambodia National Mekong Committee. This brief report presents simple information on water resources (rainfall and river flow) and irrigated areas. MOWRAM, January 2004. Project proposal: rehabilitation of the Takoy Reservoir sub-project, Kampong Chhnang Province. Cambodia Flood Emergency Rehabilitation Project, MOWRAM/World Bank. This is a typical FERP sub-project proposal/report, which includes a hydrological analysis of Takoy reservoir – flood estimation and hydraulic design – for a supplementary irrigation system in the seasonally flooded area around Tonle Sap Great Lake.
123
MRC-WUP-JICA, March 2004. The study on hydro-meteorological monitoring for water quantity rules in Mekong River basin. Final report, Volume 1. Main report. CTI Engineering International and Nippon Koei. The study reports a comprehensive modeling analysis of flows and water balance in the Mekong-Tonle Sap system. It includes, inter alia, details on river flows from sub-basins of the Tonle Sap Great Lake and water balances for wet and dry years in the Tonle Sap basin. Nippon Koei, March 2002. The study on the rehabilitation and reconstruction of agricultural production system in the Slakou River basin, the Kingdom of Cambodia. MOWRAM. Appendix B provides extensive detail on rainfall and runoff the the Slakou River system (Kompong Speu province), including extensive analysis to estimate runoff, flood discharges, irrigation water requirements, and water balance. There are extensive data tabulations. NWISP (Northwest Irrigation Sector Project), October 2002. Phase II: Feasibility Report, Annex A: Thlea Maom sub-project. Asian Development Bank/MOWRAM. This is one of several sub-project feasibility reports. Among other things, it presents information on climate, hydrology, water requirements/availability, and detailed computations of crop water requirements for various production scenarios. NWISP (Northwest Irrigation Sector Project), March 2003. Final Report, Volume 2, Annex A: climate, hydrology, hydrogeology and hydrochemistry. Asian Development Bank/MOWRAM. Annex A presents an extensive review of meteorology, rainfall, evaporation, and surface water hydrology (including Tonle Sap Great Lake) in the northwestern provinces. It provides thorough analysis and commentary on data quality, and presents extensive tabulations and graphs of rating curves, stage and discharge hydrographs, etc. Rainfall information is available in spreadsheet form, although it has now been superseded by the DoM August 2006 report. The Annex provides a strong coverage of groundwater resources. NWISP (Northwest Irrigation Sector Project), June 2006a. Inception Report, River basin and water use studies: Mongkol Borei river basin and Svay Chek river basin (Package 1). CADTIS-Consultant Co. Ltd. NWISP (Northwest Irrigation Sector Project), August 2006b. Inception Report, River basin and water use studies, Package 2: Daun Try-Svay Don Keo and Boribo-Thlea Maam-Srang sub-basins. PRD Water and Environment and DHI Water and Environment. The above two reports present the outline of the four river basin studies being carried out under NWISP. They present a certain amount of hydrological information – rainfall, evaporation, river flow – of relevance to TSLS Project, but as inception reports do not provide comprehensive results. NWISP (Northwest Irrigation Sector Project), July 2006c. River basin and water use studies, Package 2: Daun Try-Svay Don Keo and
124

Boribo-Thlea Maam-Srang sub-basins. Working paper: hydro-meteorological data collection. PRD Water and Environment and DHI Water and Environment. This report provides a valuable summary of hydro-meteorological data in the two sub-basins. OADA (Overseas Agricultural Development Association), March 2005. Study report on irrigation development projects of Mongkol Borey River in the Kingdom of Cambodia. The report presents data on meteorology and hydrology of the project area (drawing largely on Battambang station data, which are tabulated comprehensively), including estimates of the water balance of Komping Puoy reservoir and irrigable area. River discharge data for Stung Mongkol Borey are generated for half-month intervals during the period 1981-2002, using the Tank model. OADA (Overseas Agricultural Development Association), March 2003. Study report on Komping Pouy irrigation scheme rehabilitation and upgrading project in Battambang Province, the Kingdom of Cambodia. The report summarises climate data appropriate for the project area (Battambang, Bek Chan station), including maximum daily and 3-day rainfall, as well as discharges at Stung Mongkol Borei. Observed water levels and rating curves for Stung Mongkol Borey are presented. Water and Power Consultancy Services (India) Ltd and MOWRAM, October 2004. Rehabilitation of West Baray Irrigation Project in Siem Reap Province, Cambodia. The report includes material on evapotranspiration and crop water requirements, irrigation scheduling, and hydrologic modeling. Inflows into West Baray are simulated using a rainfall-runoff model; simulated flows at Prasat Keo are tabulated. Irrigation demand is simulated, based on a full crop water balance.
125

A N N E X 9 . R I V E R B A S I N M A P S
The river basin boundaries presented herein were digitized by the GIS Specialist of the Tonle Sap Lowland Stabilisation Project during August 2006.
126
Related Documents