W ATER A VAILABILITY A SSESSMENT R EPORT August 2010 W ATER A VAILABILITY A SSESSMENT R EPORT DNR Ecological & Water Resources 2010

Welcome message from author
This document is posted to help you gain knowledge. Please leave a comment to let me know what you think about it! Share it to your friends and learn new things together.
Transcript
WATER AVAILABILITY ASSESSMENT REPORT
August 2010
WATER AVAILABILITYASSESSMENT REPORT
DNR Ecological & Water Resources
2010
WATER AVAILABILITY ASSESSMENT REPORT
August 2010
Web Address: mndnr.gov/waters
DNR Ecological and Water Resources500 Lafayette RoadSt. Paul, MN 55155-4032(651) 259-5700
© 2010 State of Minnesota, Department of Natural Resources
DNR Information Center
Twin Cities: (651) 296-6157Minnesota Toll Free: 1-888-646-6367 (or 888-MINNDNR)Telecommunication Device for the Deaf: (TDD): (651) 296-5484TDD Toll Free: 1-800-657-3929
This information is available in an alternate format on request.
Equal opportunity to participate in and benefit from programs of the Minnesota Department of Natural Resources is available regardless of race, color, national origin, sex, sexual orientation, marital status, status with regard to public assis-tance, age, or disability. Discrimination inquiries should be sent to Minnesota DNR, 500 Lafayette Road, St. Paul, MN 55155-4049; or the Equal Opportunity Office, Department of the Interior, Washington, DC 20240.
The cost of preparing this report was $9360.
WATER AVAILABILITY ASSESSMENT REPORT
August 2010
WATER AVAILABILITYASSESSMENT REPORT
2010
“Healthy Watersheds across Minnesota”
Minnesota DepartmentofNaturalResources Ecological&WaterResources
byDNREcological&WaterResourcesHydrogeologistsandHydrologists
St.Paul,Minnesota
August2010

WATER AVAILABILITY ASSESSMENT REPORT
August 2010
WATER AVAILABILITY ASSESSMENT REPORT
August 2010 1
Waters that become impaired by contaminants are still available for use, however the cost of removing contami-nants may be so expensive that they become undesirable and not considered as waters that are available for use.
1
Introduction
The availability of water to meet the state’s needs is determined by three basic factors; climate and global weather patterns, human changes to flow pathways and water use, and human changes to water quality . In Minnesota, we have little ability to affect climate and global weather pat-terns, but we have great ability to affect how we change flow pathways and water use, and our land use choices that can affect water quality.
In order to address the long-term sustainability and availability of our water and natural resources, the Department of Natural Resources (DNR) must necessarily engage in long-term thinking and planning efforts. Minnesota Statutes, 103G.265 requires the DNR to provide for an assurance of water supply as follows: “The commissioner shall develop and manage water resources to assure an adequate supply to meet long-range seasonal requirements for domestic, municipal, industrial, agricultural, fish and wildlife, recreational, power, navigation, and quality control purposes from waters of the state.”
The greatest threat to having sufficient water to assure our many and varied needs comes from how we have manipulated the landscape without due consideration of its impacts on our water quantity, water quality and the ecosystem. The ecosystem functions of natural plant communities that slow water down and remove nutrients and other compounds can reduce the problems we create if we better plan for and make landscape management choices that retain these essential functions. Looking forward, we must become much wiser about how we are managing the lands and waters of Minnesota if we hope to have the desired availability and quality of water to provide the quality of life we desire.
This report provides a review of the current state of our water resources relative to the quanti-ties and trends of our water supplies. The necessary background for reading and understanding this report lies in a DNR Information Paper entitled “Minnesota’s Water Supply: Natural Conditions and Human Impacts”. Its reference is found in the Appendix to this report and is available on our web page in the following location: mndnr.gov/waters
Minnesota’s Water Budget and Human Impacts
The following charts, maps, diagrams and narratives provide information to evaluate the trends of our climate, surface waters, groundwater systems and water use over the last ten years as well as in relation to long-term historic trends.
1
WATER AVAILABILITY ASSESSMENT REPORT
August 20102
Precipitation (2000-2009)
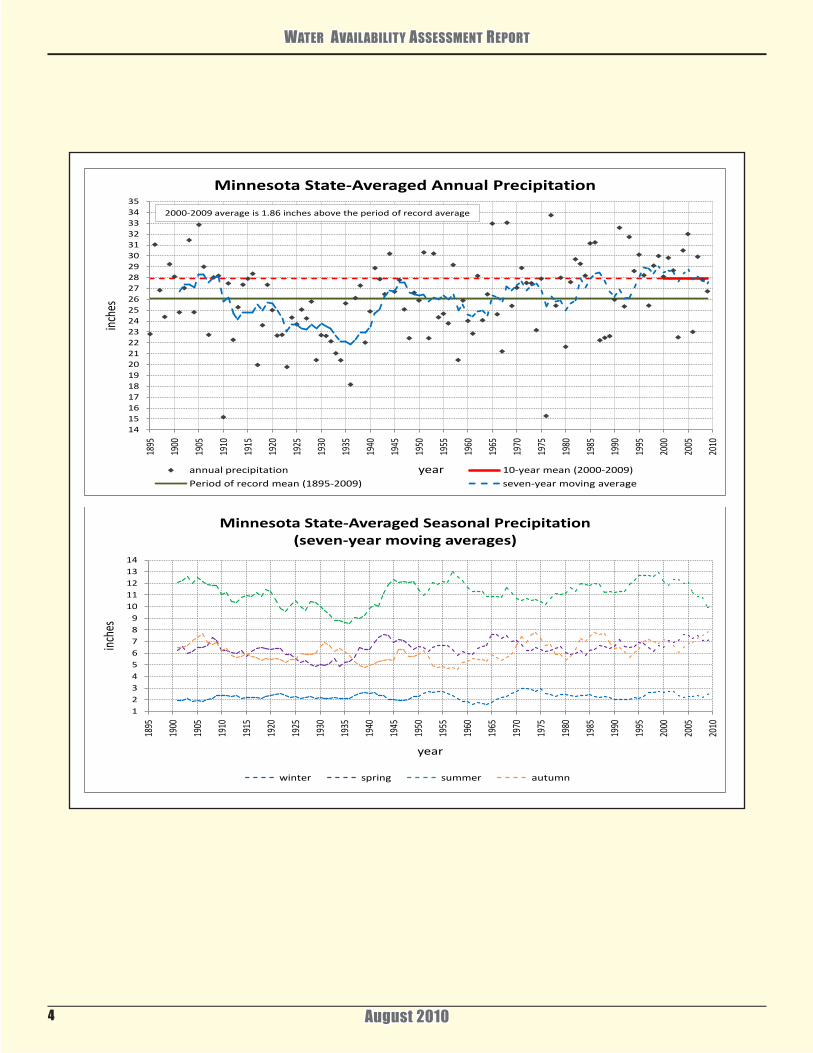
Caution must be used when making generalized statements concerning climate trends for a state the size of Minnesota. Large spatial variations can and do occur from one end of the state to another. Nonetheless, it can be informative to look at the state climate data set as a collective. The figure titled “Minnesota State-Averaged Annual Precipitation” offers a precipitation time-series using data from across Minnesota. Items of note from this graphic: • Precipitation trends in Minnesota reached a plateau during the past decade, halting the upward push evident during the end of the 20th century. However, the 2000-2009 decadal precipitation average remained high relative to the full period of record.
• The past decade produced two years that ranked in the drier range of the historical distribution (2003, 2006). This comes on the heels of the 1990s when dry years were nonexistent and drought was seldom an issue. Although the annual precipitation trend leveled off during the first decade of the 21st century, this was NOT the case for seasonal precipitation. As shown in the graphic titled “Minnesota State-Averaged Seasonal Precipitation”, summer precipitation totals showed an appreciable dip over the past 10 years. The summer dryness was offset by increases in autumn precipitation, and to a lesser extent, spring precipitation.
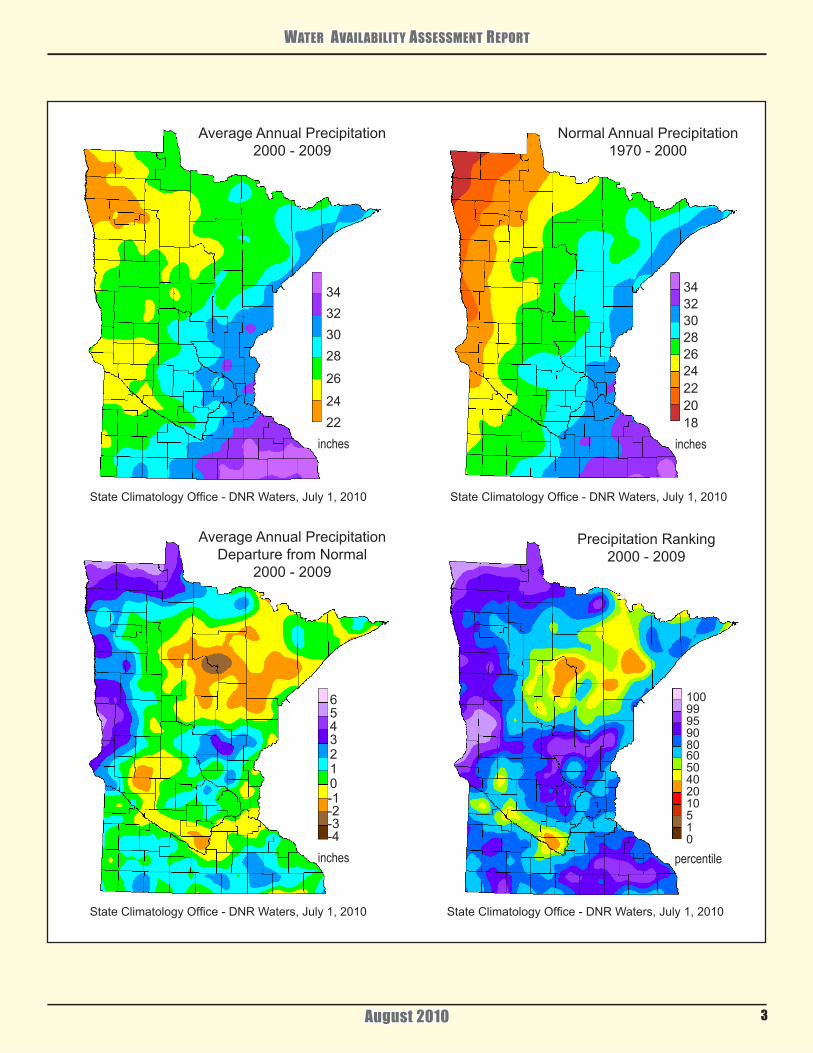
The decadal precipitation departure from normal and precipitation ranking maps demonstrate the ongoing precipitation anomaly impacting hydrology and agriculture in west central and northwestern Minnesota. This extraordinary wet spell dates back to 1991 and is responsible for high water level problems experienced in the those counties as well as the Devils Lake crisis in neighboring North Dakota. The suggestion of relative dryness depicted in north central and northeastern Minnesota may have impacted forest health issues such as drought-stress and pest infestations.
The Ten Year Water Availability Trends for Planning Purposes
The following information is provided for general trend evaluation purposes. The reader must recognize that the historical period of record for each of the indicator resources examined is not the same and the average conditions for each of these resources is a reflection of these dissimilar time periods. However, for examining general trends and changes over time these data provide a reasonable assessment of the resourc-es.
A ten year average for water levels, flows and precipitation from 2000-2010 was calculated using data from indicator sites in the state’s monitoring networks. These indicator locations are those presented in the DNR’s monthly Hydrologic Conditions Report (web link) and represent a cross section of monitoring sites throughout the state. At a minimum these sites have at least 20 years data.
WATER AVAILABILITY ASSESSMENT REPORT
August 2010
34323028
26
2422
inches
343230282624222018
inches
6543210-1-2-3-4
inches
100999590806050402010510
StateClimatologyOffice-DNRWaters,July1,2010
StateClimatologyOffice-DNRWaters,July1,2010StateClimatologyOffice-DNRWaters,July1,2010
StateClimatologyOffice-DNRWaters,July1,2010
percentile
AverageAnnualPrecipitation2000-2009
PrecipitationRanking2000-2009
AverageAnnualPrecipitationDeparturefromNormal
2000-2009
NormalAnnualPrecipitation1970-2000
3
WATER AVAILABILITY ASSESSMENT REPORT
August 20104
14151617181920212223242526272829303132333435
1895
1900
1905
1910
1915
1920
1925
1930
1935
1940
1945
1950
1955
1960
1965
1970
1975
1980
1985
1990
1995
2000
2005
2010
inch
es
year
Minnesota State-Averaged Annual Precipitation
annual precipitation 10-year mean (2000-2009)
Period of record mean (1895-2009) seven-year moving average
2000-2009 average is 1.86 inches above the period of record average
123456789
1011121314
1895
1900
1905
1910
1915
1920
1925
1930
1935
1940
1945
1950
1955
1960
1965
1970
1975
1980
1985
1990
1995
2000
2005
2010
inch
es
year
Minnesota State-Averaged Seasonal Precipitation(seven-year moving averages)
winter spring summer autumn
WATER AVAILABILITY ASSESSMENT REPORT
August 2010 5
Stream Flows (2000-2009)
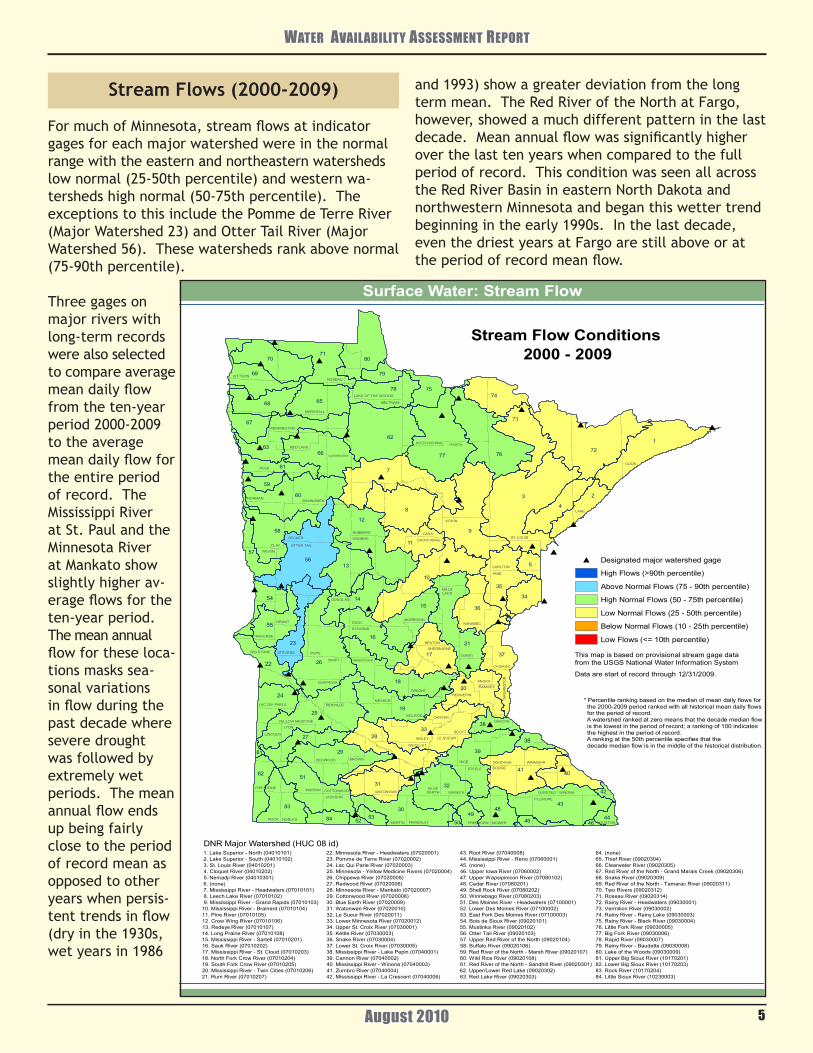
For much of Minnesota, stream flows at indicator gages for each major watershed were in the normal range with the eastern and northeastern watersheds low normal (25-50th percentile) and western wa-tersheds high normal (50-75th percentile). The exceptions to this include the Pomme de Terre River (Major Watershed 23) and Otter Tail River (Major Watershed 56). These watersheds rank above normal (75-90th percentile).
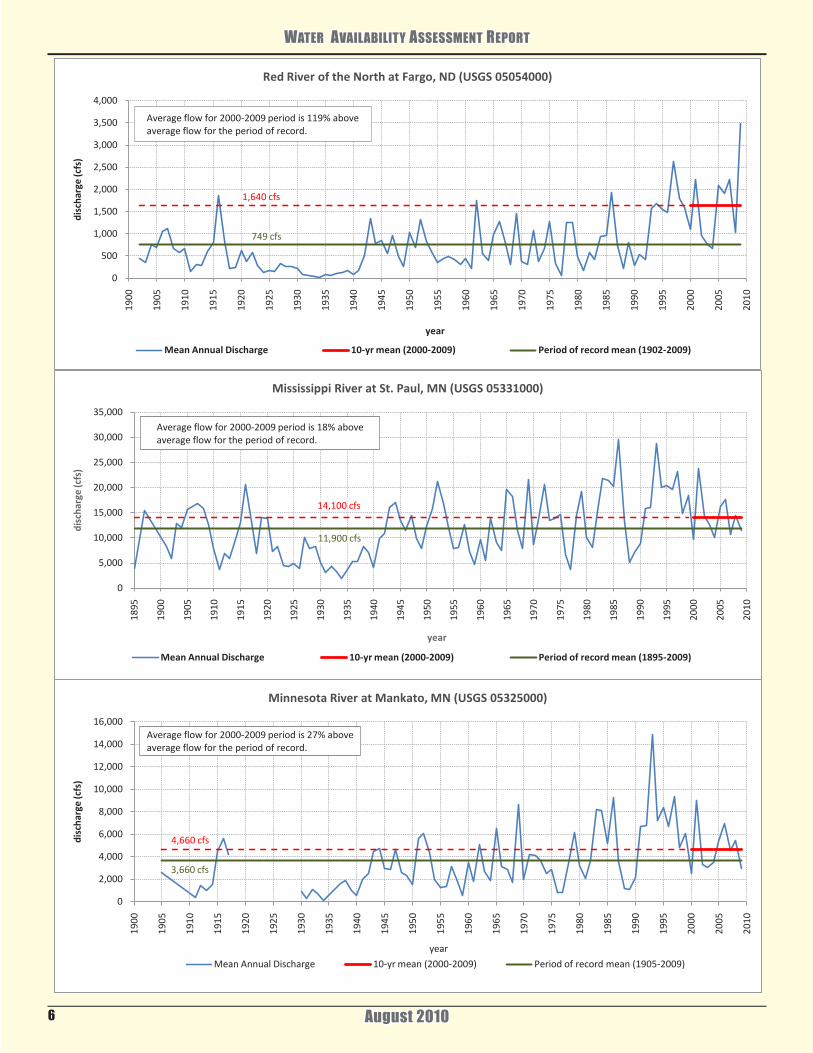
Three gages on major rivers with long-term records were also selected to compare average mean daily flow from the ten-year period 2000-2009 to the average mean daily flow for the entire period of record. The Mississippi River at St. Paul and the Minnesota River at Mankato show slightly higher av-erage flows for the ten-year period. The mean annual flow for these loca-tions masks sea-sonal variations in flow during the past decade where severe drought was followed by extremely wet periods. The mean annual flow ends up being fairly close to the period of record mean as opposed to other years when persis-tent trends in flow (dry in the 1930s, wet years in 1986
and 1993) show a greater deviation from the long term mean. The Red River of the North at Fargo, however, showed a much different pattern in the last decade. Mean annual flow was significantly higher over the last ten years when compared to the full period of record. This condition was seen all across the Red River Basin in eastern North Dakota and northwestern Minnesota and began this wetter trend beginning in the early 1990s. In the last decade, even the driest years at Fargo are still above or at the period of record mean flow.
#
#
##
#
#
#
#
#
#
#
#
#
# #
#
#
#
#
#
#
#
#
#
#
#
#
#
#
#
##
##
#
#
#
###
#
##
#
##
#
#
##
#
#
#
38
24
22
55
54
47 464652 5084 53 4449
4843
42
3083
31 3251
82 4041
2981 39
27 28
3833
1925
2018
3717
34
16
26
15
34
23
36
14
21
5
35
10
13
11
57
58
12
56
8
2
4
60
59
9
7
3
61
66
163
73
62
72
67
77 76
68 6574
78 75
79
7170
69
80
LAKE OF THE WOODS
KITTSONROSEAU
KOOCHICHING
MARSHALL
ST. LOUIS
BELTRAMI
POLK
PENNINGTON
COOK
LAKE
CLEARWATER
RED LAKEITASCA
NORMANMAHNOMEN
CASSHUBBARD
CLAY
BECKER
AITKIN
WADENA CROW WING
CARLTON
OTTER TAIL
WILKIN
PINE
TODDMORRISON
MILLELACS
KANABECGRANT
DOUGLAS
TRAVERSE
BENTON
STEVENS
STEARNS
POPEISANTI
CHISAGO
BIG STONESHERBURNE
SWIFT KANDIYOHI
WRIGHT
ANOKA
MEEKERLAC QUI PARLE
WAS
HIN
GTO
N
HENNEPIN
CHIPPEWARAMSEY
MCLEOD CARVERYELLOW MEDICINE DAKOTA
RENVILLE
SCOTT
SIBLEY
REDWOODGOODHUE
LINCOLN
LYON
LE SUEUR
RICEBROWN
NICOLLET
WABASHA
BLUEEARTH
PIPESTONE MURRAY COTTONWOOD WINONAWASECA
STEELE DODGE
OLMSTEDWATONWAN
ROCK NOBLES
JACKSON
MARTIN HOUSTONFARIBAULT
FILLMORE
FREEBORN MOWER
# Designated major watershed gage
High Flows (>90th percentile)
Above Normal Flows (75 - 90th percentile)
High Normal Flows (50 - 75th percentile)
Low Normal Flows (25 - 50th percentile)
Below Normal Flows (10 - 25th percentile)
Low Flows (<= 10th percentile)
Surface Water: Stream Flow
This map is based on provisional stream gage datafrom the USGS National Water Information System
2000 - 2009Stream Flow Conditions
DNRWaters
* Percentile ranking based on the median of mean daily flows for the 2000-2009 period ranked with all historical mean daily flows for the period of record. A watershed ranked at zero means that the decade median flow is the lowest in the period of record; a ranking of 100 indicates the highest in the period of record. A ranking at the 50th percentile specifies that the decade median flow is in the middle of the historical distribution.
Data are start of record through 12/31/2009.
64. (none)65. Thief River (09020304)66. Clearwater River (09020305)67. Red River of the North - Grand Marais Creek (09020306)68. Snake River (09020309)69. Red River of the North - Tamarac River (09020311)70. Two Rivers (09020312)71. Roseau River (09020314)72. Rainy River - Headwaters (09030001)73. Vermilion River (09030002)74. Rainy River - Rainy Lake (09030003)75. Rainy River - Black River (09030004)76. Little Fork River (09030005)77. Big Fork River (09030006)78. Rapid River (09030007)79. Rainy River - Baudette (09030008)80. Lake of the Woods (09030009)81. Upper Big Sioux River (10170201)82. Lower Big Sioux River (10170203)83. Rock River (10170204)84. Little Sioux River (10230003)
1. Lake Superior - North (04010101) 22. Minnesota River - Headwaters (07020001) 43. Root River (07040008) 2. Lake Superior - South (04010102) 23. Pomme de Terre River (07020002) 44. Mississippi River - Reno (07060001) 3. St. Louis River (04010201) 24. Lac Qui Parle River (07020003) 45. (none) 4. Cloquet River (04010202) 25. Minnesota - Yellow Medicine Rivers (07020004) 46. Upper Iowa River (07060002) 5. Nemadji River (04010301) 26. Chippewa River (07020005) 47. Upper Wapsipinicon River (07080102) 6. (none) 27. Redwood River (07020006) 48. Cedar River (07080201) 7. Mississippi River - Headwaters (07010101) 28. Minnesota River - Mankato (07020007) 49. Shell Rock River (07080202) 8. Leech Lake River (07010102) 29. Cottonwood River (07020008) 50. Winnebago River (07080203) 9. Mississippi River - Grand Rapids (07010103) 30. Blue Earth River (07020009) 51. Des Moines River - Headwaters (07100001)10. Mississippi River - Brainerd (07010104) 31. Watonwan River (07020010) 52. Lower Des Moines River (07100002)11. Pine River (07010105) 32. Le Sueur River (07020011) 53. East Fork Des Moines River (07100003)12. Crow Wing River (07010106) 33. Lower Minnesota River (07020012) 54. Bois de Sioux River (09020101)13. Redeye River (07010107) 34. Upper St. Croix River (07030001) 55. Mustinka River (09020102)14. Long Prairie River (07010108) 35. Kettle River (07030003) 56. Otter Tail River (09020103)15. Mississippi River - Sartell (07010201) 36. Snake River (07030004) 57. Upper Red River of the North (09020104)16. Sauk River (07010202) 37. Lower St. Croix River (07030005) 58. Buffalo River (09020106)17. Mississippi River - St. Cloud (07010203) 38. Mississippi River - Lake Pepin (07040001) 59. Red River of the North - Marsh River (09020107)18. North Fork Crow River (07010204) 39. Cannon River (07040002) 60. Wild Rice River (09020108)19. South Fork Crow River (07010205) 40. Mississippi River - Winona (07040003) 61. Red River of the North - Sandhill River (09020301)20. Mississippi River - Twin Cities (07010206) 41. Zumbro River (07040004) 62. Upper/Lower Red Lake (09020302)21. Rum River (07010207) 42. Mississippi River - La Crescent (07040006) 63. Red Lake River (09020303)
DNR Major Watershed (HUC 08 id)
WATER AVAILABILITY ASSESSMENT REPORT
August 20106
0
500
1,000
1,500
2,000
2,500
3,000
3,500
4,000
1900
1905
1910
1915
1920
1925
1930
1935
1940
1945
1950
1955
1960
1965
1970
1975
1980
1985
1990
1995
2000
2005
2010
disc
harg
e (c
fs)
year
Red River of the North at Fargo, ND (USGS 05054000)
Mean Annual Discharge 10-yr mean (2000-2009) Period of record mean (1902-2009)
Average flow for 2000-2009 period is 119% above average flow for the period of record.
1,640 cfs
749 cfs
0
5,000
10,000
15,000
20,000
25,000
30,000
35,000
1895
1900
1905
1910
1915
1920
1925
1930
1935
1940
1945
1950
1955
1960
1965
1970
1975
1980
1985
1990
1995
2000
2005
2010
disc
harg
e (c
fs)
year
Mississippi River at St. Paul, MN (USGS 05331000)
Mean Annual Discharge 10-yr mean (2000-2009) Period of record mean (1895-2009)
14,100 cfs
11,900 cfs
Average flow for 2000-2009 period is 18% above average flow for the period of record.
0
2,000
4,000
6,000
8,000
10,000
12,000
14,000
16,000
1900
1905
1910
1915
1920
1925
1930
1935
1940
1945
1950
1955
1960
1965
1970
1975
1980
1985
1990
1995
2000
2005
2010
disc
harg
e (c
fs)
year
Minnesota River at Mankato, MN (USGS 05325000)
Mean Annual Discharge 10-yr mean (2000-2009) Period of record mean (1905-2009)
4,660 cfs
3,660 cfs
Average flow for 2000-2009 period is 27% above average flow for the period of record.
WATER AVAILABILITY ASSESSMENT REPORT
August 2010
!(
!(
!(
!(
!(
!(
LAKE OF THE WOODS
KITTSONROSEAU
KOOCHICHING
MARSHALL
ST. LOUIS
BELTRAMI
POLK
PENNINGTON
COOK
LAKE
CLEARWATER
RED LAKEITASCA
NORMANMAHNOMEN
CASSHUBBARD
CLAY
BECKER
AITKIN
WADENA CROW WING
CARLTON
OTTER TAIL
WILKIN
PINE
TODDMORRISON
MILLELACS
KANABECGRANT
DOUGLAS
TRAVERSE
BENTON
STEVENS STEARNSPOPE
ISANTI
CHISAGO
BIG STONESHERBURNE
SWIFT KANDIYOHI
WRIGHT
ANOKA
MEEKERLAC QUI PARLE W
ASH
ING
TON
HENNEPIN
CHIPPEWARAMSEY
MCLEOD CARVERYELLOW MEDICINE DAKOTA
RENVILLE
SCOTT
SIBLEY
REDWOOD GOODHUE
LINCOLN
LYON
LE SUEUR
RICEBROWN
NICOLLET
WABASHA
BLUEEARTH
PIPESTONE MURRAY COTTONWOOD WINONAWASECA
STEELE DODGE
OLMSTEDWATONWAN
ROCK NOBLES
JACKSON
MARTIN HOUSTONFARIBAULT
FILLMORE
FREEBORN MOWER
Minnetonka(104 years of record)
Mille Lacs(79 years of record)
Shetek(84 years of record)
Otter Tail(91 years of record)
Vermilion(60 years of record)
White Bear(86 years of record)
Source data from: MN DNR Waters Lake Level Minnesota Monitoring Program
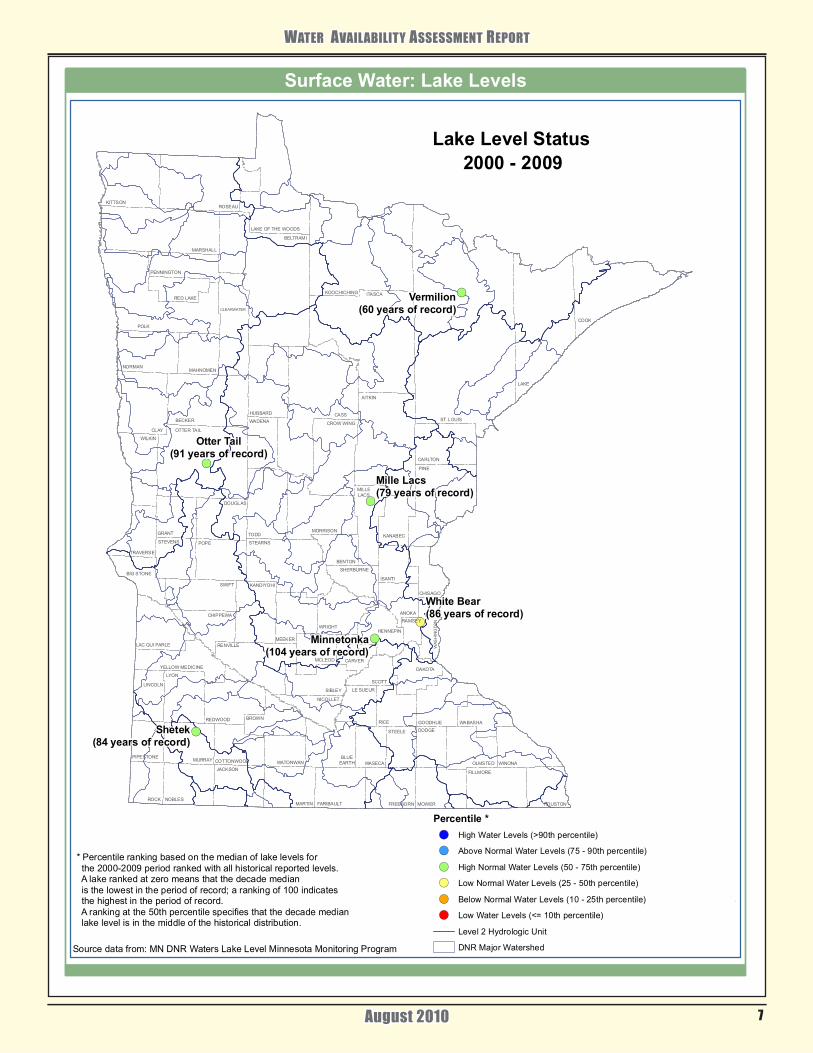
2000 - 2009Lake Level Status
Surface Water: Lake Levels
DNRWaters
* Percentile ranking based on the median of lake levels for the 2000-2009 period ranked with all historical reported levels. A lake ranked at zero means that the decade median is the lowest in the period of record; a ranking of 100 indicates the highest in the period of record. A ranking at the 50th percentile specifies that the decade median lake level is in the middle of the historical distribution.
Percentile *!( High Water Levels (>90th percentile)
!( Above Normal Water Levels (75 - 90th percentile)
!( High Normal Water Levels (50 - 75th percentile)
!( Low Normal Water Levels (25 - 50th percentile)
!( Below Normal Water Levels (10 - 25th percentile)
!( Low Water Levels (<= 10th percentile)
Level 2 Hydrologic Unit
DNR Major Watershed
7
WATER AVAILABILITY ASSESSMENT REPORT
August 2010
Lake Levels (2000-2009)
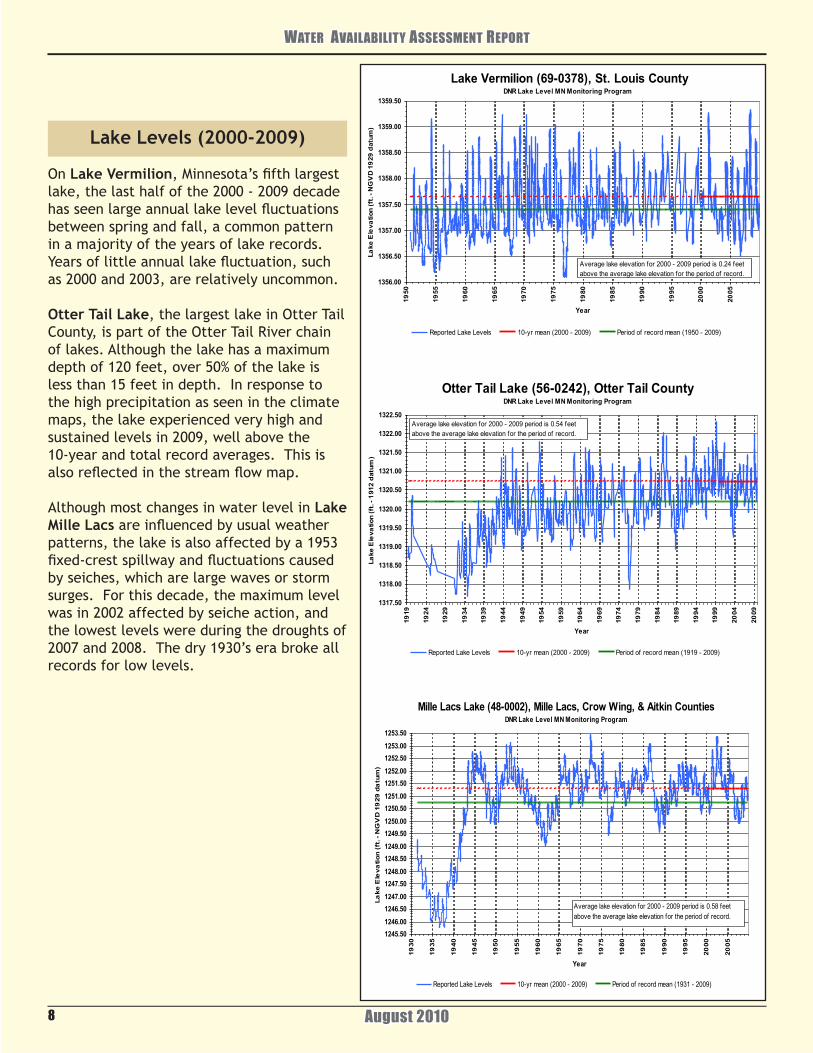
On Lake Vermilion, Minnesota’s fifth largest lake, the last half of the 2000 - 2009 decade has seen large annual lake level fluctuations between spring and fall, a common pattern in a majority of the years of lake records. Years of little annual lake fluctuation, such as 2000 and 2003, are relatively uncommon.
Otter Tail Lake, the largest lake in Otter Tail County, is part of the Otter Tail River chain of lakes. Although the lake has a maximum depth of 120 feet, over 50% of the lake is less than 15 feet in depth. In response to the high precipitation as seen in the climate maps, the lake experienced very high and sustained levels in 2009, well above the 10-year and total record averages. This is also reflected in the stream flow map.
Although most changes in water level in Lake Mille Lacs are influenced by usual weather patterns, the lake is also affected by a 1953 fixed-crest spillway and fluctuations caused by seiches, which are large waves or storm surges. For this decade, the maximum level was in 2002 affected by seiche action, and the lowest levels were during the droughts of 2007 and 2008. The dry 1930’s era broke all records for low levels.
Lake Vermilion (69-0378), St. Louis County DNR Lake Level MN Monitoring Program
1356.00
1356.50
1357.00
1357.50
1358.00
1358.50
1359.00
1359.50
1950
1955
1960
1965
1970
1975
1980
1985
1990
1995
2000
2005
Year
Lake
Ele
vatio
n (f
t. - N
GV
D 1
929
datu
m)
Reported Lake Levels 10-yr mean (2000 - 2009) Period of record mean (1950 - 2009)
Average lake elevation for 2000 - 2009 period is 0.24 feet above the average lake elevation for the period of record.
Otter Tail Lake (56-0242), Otter Tail County DNR Lake Level MN Monitoring Program
1317.50
1318.00
1318.50
1319.00
1319.50
1320.00
1320.50
1321.00
1321.50
1322.00
1322.5019
19
1924
1929
1934
1939
1944
1949
1954
1959
1964
1969
1974
1979
1984
1989
1994
1999
2004
2009
Year
Lake
Ele
vatio
n (f
t. - 1
912
datu
m)
Reported Lake Levels 10-yr mean (2000 - 2009) Period of record mean (1919 - 2009)
Average lake elevation for 2000 - 2009 period is 0.54 feet above the average lake elevation for the period of record.
8
Mille Lacs Lake (48-0002), Mille Lacs, Crow Wing, & Aitkin Counties DNR Lake Level MN Monitoring Program
1245.501246.001246.501247.001247.501248.001248.501249.001249.501250.001250.501251.001251.501252.001252.501253.001253.50
1930
1935
1940
1945
1950
1955
1960
1965
1970
1975
1980
1985
1990
1995
2000
2005
Year
Lake
Ele
vatio
n (f
t. - N
GV
D 1
929
da
tum
)
Reported Lake Levels 10-yr mean (2000 - 2009) Period of record mean (1931 - 2009)
Average lake elevation for 2000 - 2009 period is 0.58 feet above the average lake elevation for the period of record.
Lake Minnetonka (27-0133), Hennepin County DNR Lake Level MN Monitoring Program
921.50922.00922.50923.00923.50924.00924.50925.00925.50926.00926.50927.00927.50928.00928.50929.00929.50930.00930.50931.00
1905
1910
1915
1920
1925
1930
1935
1940
1945
1950
1955
1960
1965
1970
1975
1980
1985
1990
1995
2000
2005
Year
Lake
Ele
vatio
n (f
t. - N
GV
D 1
929
da
tum
)
Reported Lake Levels 10-yr mean (2000 - 2009) Period of record mean (1906 - 2009)
Average lake elevation for 2000 - 2009 period is 0.68 feet above the average lake elevation for the period of reocrd.
WATER AVAILABILITY ASSESSMENT REPORT
August 2010
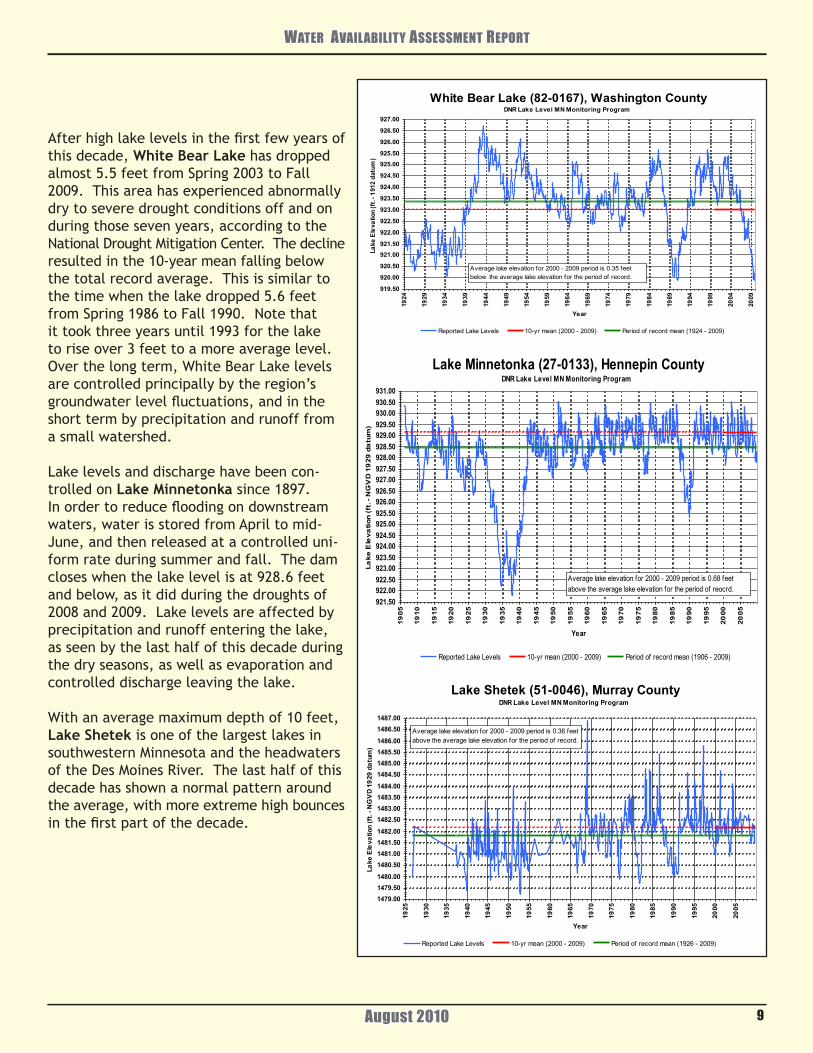
After high lake levels in the first few years of this decade, White Bear Lake has dropped almost 5.5 feet from Spring 2003 to Fall 2009. This area has experienced abnormally dry to severe drought conditions off and on during those seven years, according to the National Drought Mitigation Center. The decline resulted in the 10-year mean falling below the total record average. This is similar to the time when the lake dropped 5.6 feet from Spring 1986 to Fall 1990. Note that it took three years until 1993 for the lake to rise over 3 feet to a more average level. Over the long term, White Bear Lake levels are controlled principally by the region’s groundwater level fluctuations, and in the short term by precipitation and runoff from a small watershed. Lake levels and discharge have been con-trolled on Lake Minnetonka since 1897. In order to reduce flooding on downstream waters, water is stored from April to mid-June, and then released at a controlled uni-form rate during summer and fall. The dam closes when the lake level is at 928.6 feet and below, as it did during the droughts of 2008 and 2009. Lake levels are affected by precipitation and runoff entering the lake, as seen by the last half of this decade during the dry seasons, as well as evaporation and controlled discharge leaving the lake.
With an average maximum depth of 10 feet, Lake Shetek is one of the largest lakes in southwestern Minnesota and the headwaters of the Des Moines River. The last half of this decade has shown a normal pattern around the average, with more extreme high bounces in the first part of the decade.
9
White Bear Lake (82-0167), Washington County DNR Lake Level MN Monitoring Program
919.50
920.00
920.50
921.00921.50
922.00
922.50
923.00
923.50
924.00
924.50
925.00925.50
926.00
926.50
927.00
1924
1929
1934
1939
1944
1949
1954
1959
1964
1969
1974
1979
1984
1989
1994
1999
2004
2009
Year
Lake
Ele
vatio
n (f
t. - 1
912
datu
m)
Reported Lake Levels 10-yr mean (2000 - 2009) Period of record mean (1924 - 2009)
Average lake elevation for 2000 - 2009 period is 0.35 feet below the average lake elevation for the period of record.
Lake Shetek (51-0046), Murray County DNR Lake Level MN Monitoring Program
1479.001479.501480.001480.501481.001481.501482.001482.501483.001483.501484.001484.501485.001485.501486.001486.501487.00
1925
1930
1935
1940
1945
1950
1955
1960
1965
1970
1975
1980
1985
1990
1995
2000
2005
Year
Lake
Ele
vatio
n (f
t. - N
GV
D 19
29 d
atum
)
Reported Lake Levels 10-yr mean (2000 - 2009) Period of record mean (1926 - 2009)
Average lake elevation for 2000 - 2009 period is 0.36 feet above the average lake elevation for the period of record.
White Bear Lake (82-0167), Washington County DNR Lake Level MN Monitoring Program
919.50
920.00
920.50
921.00921.50
922.00
922.50
923.00
923.50
924.00
924.50
925.00925.50
926.00
926.50
927.0019
24
1929
1934
1939
1944
1949
1954
1959
1964
1969
1974
1979
1984
1989
1994
1999
2004
2009
Year
Lake
Ele
vatio
n (f
t. - 1
912
datu
m)
Reported Lake Levels 10-yr mean (2000 - 2009) Period of record mean (1924 - 2009)
Average lake elevation for 2000 - 2009 period is 0.35 feet below the average lake elevation for the period of record.
Lake Shetek (51-0046), Murray County DNR Lake Level MN Monitoring Program
1479.001479.501480.001480.501481.001481.501482.001482.501483.001483.501484.001484.501485.001485.501486.001486.501487.00
1925
1930
1935
1940
1945
1950
1955
1960
1965
1970
1975
1980
1985
1990
1995
2000
2005
Year
Lake
Ele
vatio
n (f
t. - N
GV
D 19
29 d
atum
)
Reported Lake Levels 10-yr mean (2000 - 2009) Period of record mean (1926 - 2009)
Average lake elevation for 2000 - 2009 period is 0.36 feet above the average lake elevation for the period of record.
Mille Lacs Lake (48-0002), Mille Lacs, Crow Wing, & Aitkin Counties DNR Lake Level MN Monitoring Program
1245.501246.001246.501247.001247.501248.001248.501249.001249.501250.001250.501251.001251.501252.001252.501253.001253.50
1930
1935
1940
1945
1950
1955
1960
1965
1970
1975
1980
1985
1990
1995
2000
2005
Year
Lake
Ele
vatio
n (f
t. - N
GV
D 1
929
da
tum
)
Reported Lake Levels 10-yr mean (2000 - 2009) Period of record mean (1931 - 2009)
Average lake elevation for 2000 - 2009 period is 0.58 feet above the average lake elevation for the period of record.
Lake Minnetonka (27-0133), Hennepin County DNR Lake Level MN Monitoring Program
921.50922.00922.50923.00923.50924.00924.50925.00925.50926.00926.50927.00927.50928.00928.50929.00929.50930.00930.50931.00
1905
1910
1915
1920
1925
1930
1935
1940
1945
1950
1955
1960
1965
1970
1975
1980
1985
1990
1995
2000
2005
Year
Lake
Ele
vatio
n (f
t. - N
GV
D 1
929
da
tum
)
Reported Lake Levels 10-yr mean (2000 - 2009) Period of record mean (1906 - 2009)
Average lake elevation for 2000 - 2009 period is 0.68 feet above the average lake elevation for the period of reocrd.
WATER AVAILABILITY ASSESSMENT REPORT
August 201010
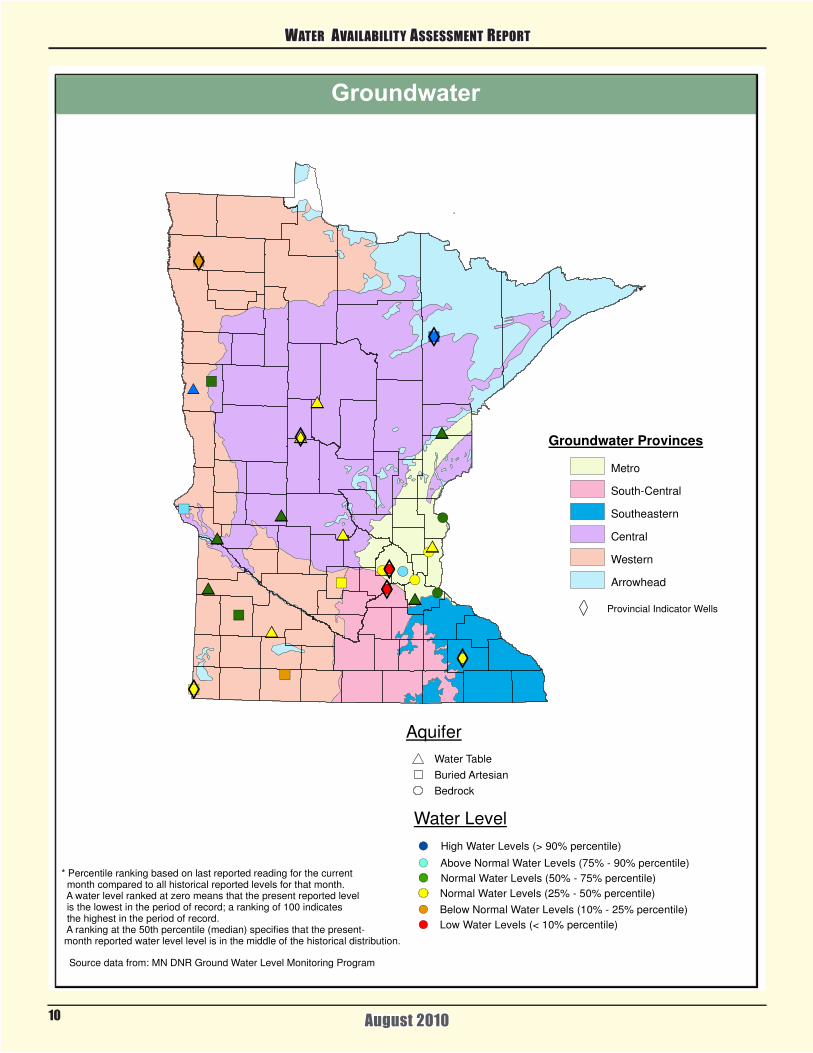
Aquifer
Water Table
Buried Artesian
Bedrock
Ground Water
Water Level
Low Water Levels (< 10% percentile)
Below Normal Water Levels (10% - 25% percentile)
Above Normal Water Levels (75% - 90% percentile)
Normal Water Levels (50% - 75% percentile)
High Water Levels (> 90% percentile)
Normal Water Levels (25% - 50% percentile)
Groundwater Provinces
Metro
South-Central
Southeastern
Central
Western
Arrowhead
Provincial Indicator Wells
DNR
Waters
* Percentile ranking based on last reported reading for the current month compared to all historical reported levels for that month. A water level ranked at zero means that the present reported level is the lowest in the period of record; a ranking of 100 indicates the highest in the period of record. A ranking at the 50th percentile (median) specifies that the present- month reported water level level is in the middle of the historical distribution.
Source data from: MN DNR Ground Water Level Monitoring Program
WATER AVAILABILITY ASSESSMENT REPORT
Groundwater
August 2010
WATER AVAILABILITY ASSESSMENT REPORT
August 2010 11
WATER AVAILABILITY ASSESSMENT REPORT
Province 2 – South-Central ProvinceThe indicator well in the Mount Simon, typically the deepest aquifer in the state and a water supply aqui-fer for a number of communities shows a continued decline in the water levels. The size of the seasonal cyclic changes in water levels continues to increase between summer and winter water levels.
Groundwater Levels (2000-2009)
The ten year average water level was compared to the entire length of record for the well. A high value indicates that the average water level compared to the highest 90% of water levels measured in the well. A low value indicated that the average water level compared to the lowest 10% of water levels measured in the well. A map showing the wells and their water levels is presented in Figure X. Most of the wells show that the ten year average falls within normal water levels for the well which are levels between 25% and 75% of all of the water levels mea-sured in the well.
Seven of the wells were selected as representa-tives of the six groundwater provinces in the state and hydrographs were produced for each well. The groundwater provinces are defined by the bedrock and glacial geology which control the availability of groundwater in each of the areas. These provinces are presented on the Figure below.
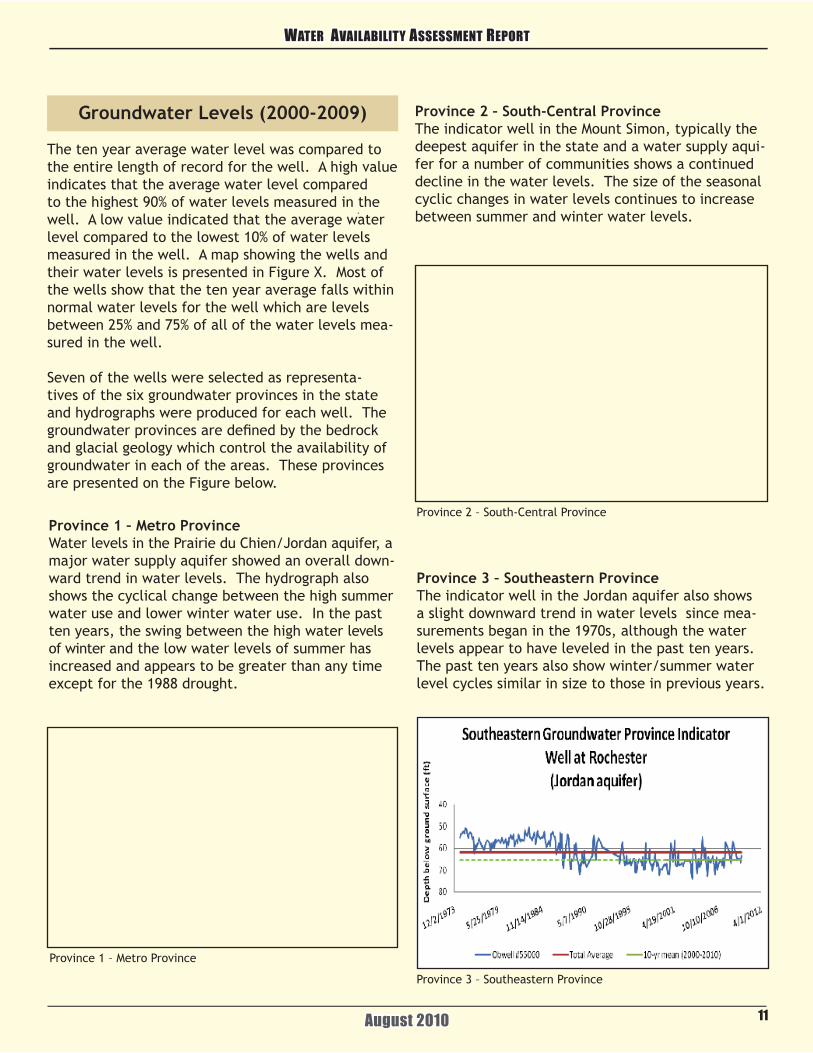
Province 3 – Southeastern ProvinceThe indicator well in the Jordan aquifer also shows a slight downward trend in water levels since mea-surements began in the 1970s, although the water levels appear to have leveled in the past ten years. The past ten years also show winter/summer water level cycles similar in size to those in previous years.
Province 1 – Metro Province
Province 2 – South-Central Province
August 2010
Province 1 – Metro ProvinceWater levels in the Prairie du Chien/Jordan aquifer, a major water supply aquifer showed an overall down-ward trend in water levels. The hydrograph also shows the cyclical change between the high summer water use and lower winter water use. In the past ten years, the swing between the high water levels of winter and the low water levels of summer has increased and appears to be greater than any time except for the 1988 drought.
Province 3 – Southeastern Province
WATER AVAILABILITY ASSESSMENT REPORT
August 2010
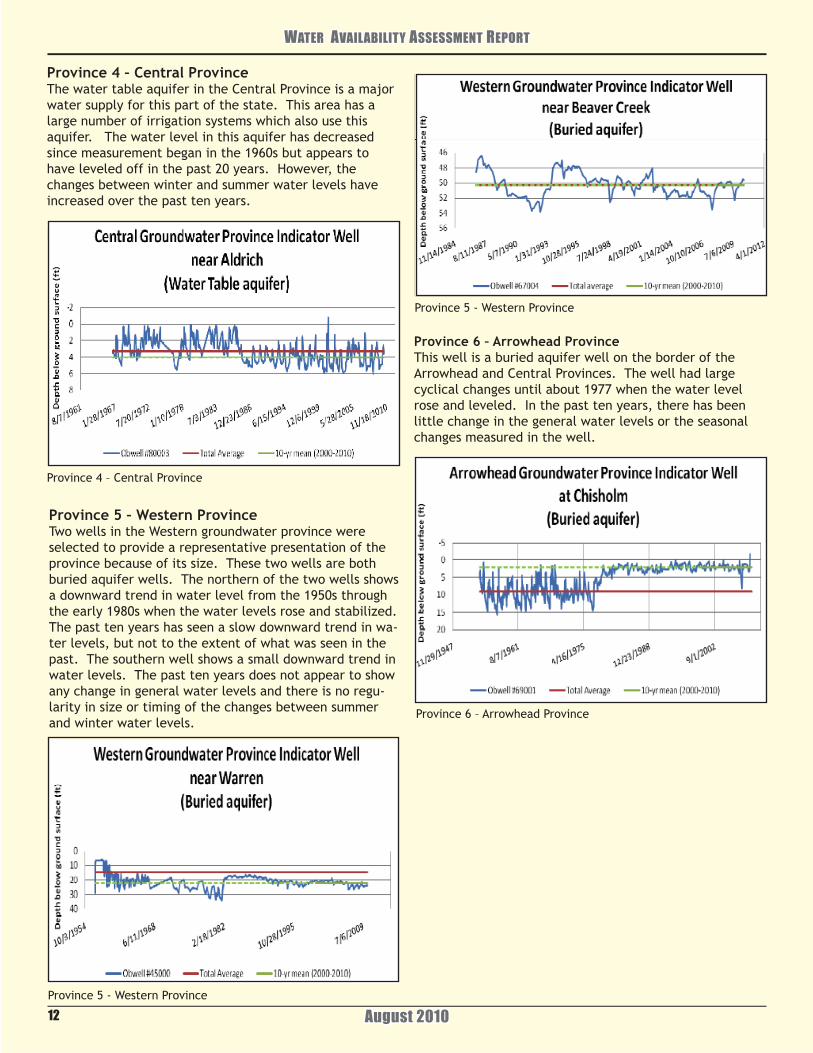
Province 4 – Central ProvinceThe water table aquifer in the Central Province is a major water supply for this part of the state. This area has a large number of irrigation systems which also use this aquifer. The water level in this aquifer has decreased since measurement began in the 1960s but appears to have leveled off in the past 20 years. However, the changes between winter and summer water levels have increased over the past ten years.
Province 5 - Western Province
12
Province 5 – Western Province Two wells in the Western groundwater province were selected to provide a representative presentation of the province because of its size. These two wells are both buried aquifer wells. The northern of the two wells shows a downward trend in water level from the 1950s through the early 1980s when the water levels rose and stabilized. The past ten years has seen a slow downward trend in wa-ter levels, but not to the extent of what was seen in the past. The southern well shows a small downward trend in water levels. The past ten years does not appear to show any change in general water levels and there is no regu-larity in size or timing of the changes between summer and winter water levels.
Province 6 – Arrowhead ProvinceThis well is a buried aquifer well on the border of the Arrowhead and Central Provinces. The well had large cyclical changes until about 1977 when the water level rose and leveled. In the past ten years, there has been little change in the general water levels or the seasonal changes measured in the well.
Province 4 – Central Province
Province 5 - Western Province
Province 5 - Western Province
Province 6 – Arrowhead Province
WATER AVAILABILITY ASSESSMENT REPORT
August 2010
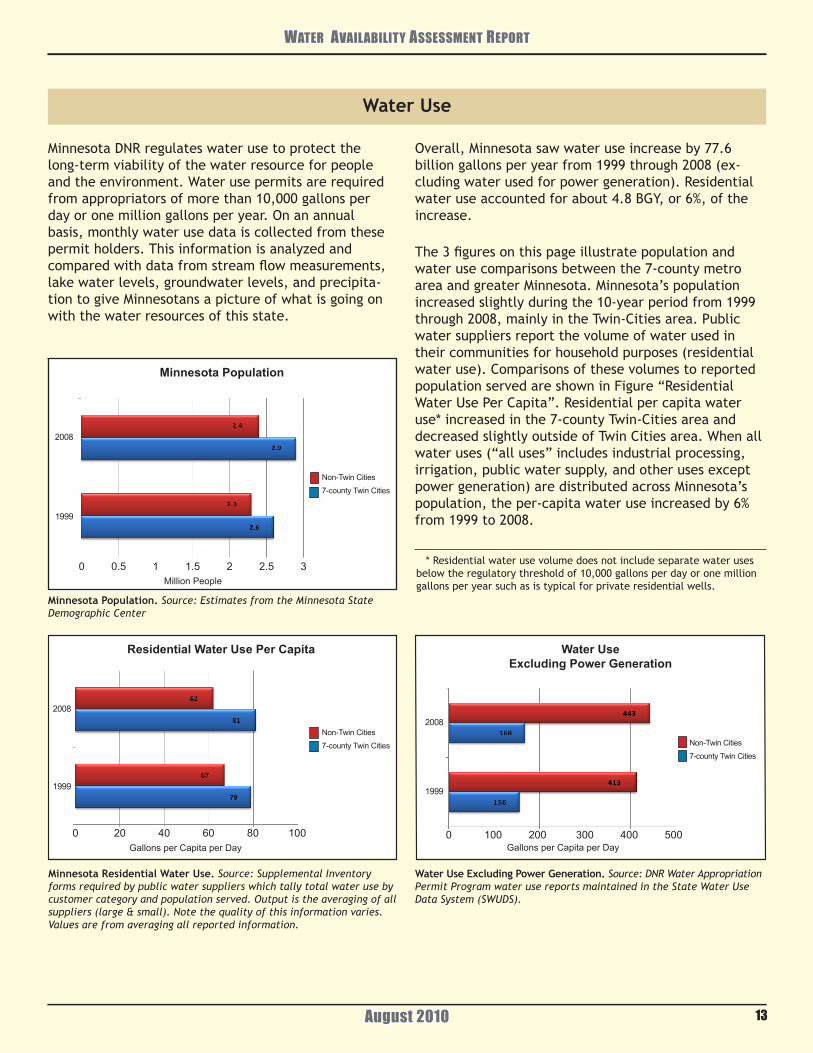
Minnesota Population. Source: Estimates from the Minnesota State Demographic Center
Minnesota Residential Water Use. Source: Supplemental Inventory forms required by public water suppliers which tally total water use by customer category and population served. Output is the averaging of all suppliers (large & small). Note the quality of this information varies. Values are from averaging all reported information.
Water Use Excluding Power Generation. Source: DNR Water Appropriation Permit Program water use reports maintained in the State Water Use Data System (SWUDS).
13
Minnesota DNR regulates water use to protect the long-term viability of the water resource for people and the environment. Water use permits are required from appropriators of more than 10,000 gallons per day or one million gallons per year. On an annual basis, monthly water use data is collected from these permit holders. This information is analyzed and compared with data from stream flow measurements, lake water levels, groundwater levels, and precipita-tion to give Minnesotans a picture of what is going on with the water resources of this state.
The 3 figures on this page illustrate population and water use comparisons between the 7-county metro area and greater Minnesota. Minnesota’s population increased slightly during the 10-year period from 1999 through 2008, mainly in the Twin-Cities area. Public water suppliers report the volume of water used in their communities for household purposes (residential water use). Comparisons of these volumes to reported population served are shown in Figure “Residential Water Use Per Capita”. Residential per capita water use* increased in the 7-county Twin-Cities area and decreased slightly outside of Twin Cities area. When all water uses (“all uses” includes industrial processing, irrigation, public water supply, and other uses except power generation) are distributed across Minnesota’s population, the per-capita water use increased by 6% from 1999 to 2008.
Water Use
Overall, Minnesota saw water use increase by 77.6 billion gallons per year from 1999 through 2008 (ex-cluding water used for power generation). Residential water use accounted for about 4.8 BGY, or 6%, of the increase.
Residential Water Use Per Capita
Minnesota Population
Water UseExcluding Power Generation
00.511.522.53
Non-TwinCities
7-countyTwinCities
Non-TwinCities
7-countyTwinCities Non-TwinCities
7-countyTwinCities
1999
2008
1999
2008
2008
1999
020406080100
MillionPeople
GallonsperCapitaperDay GallonsperCapitaperDay0100200300400500
* Residential water use volume does not include separate water uses below the regulatory threshold of 10,000 gallons per day or one million gallons per year such as is typical for private residential wells.
WATER AVAILABILITY ASSESSMENT REPORT
August 201014
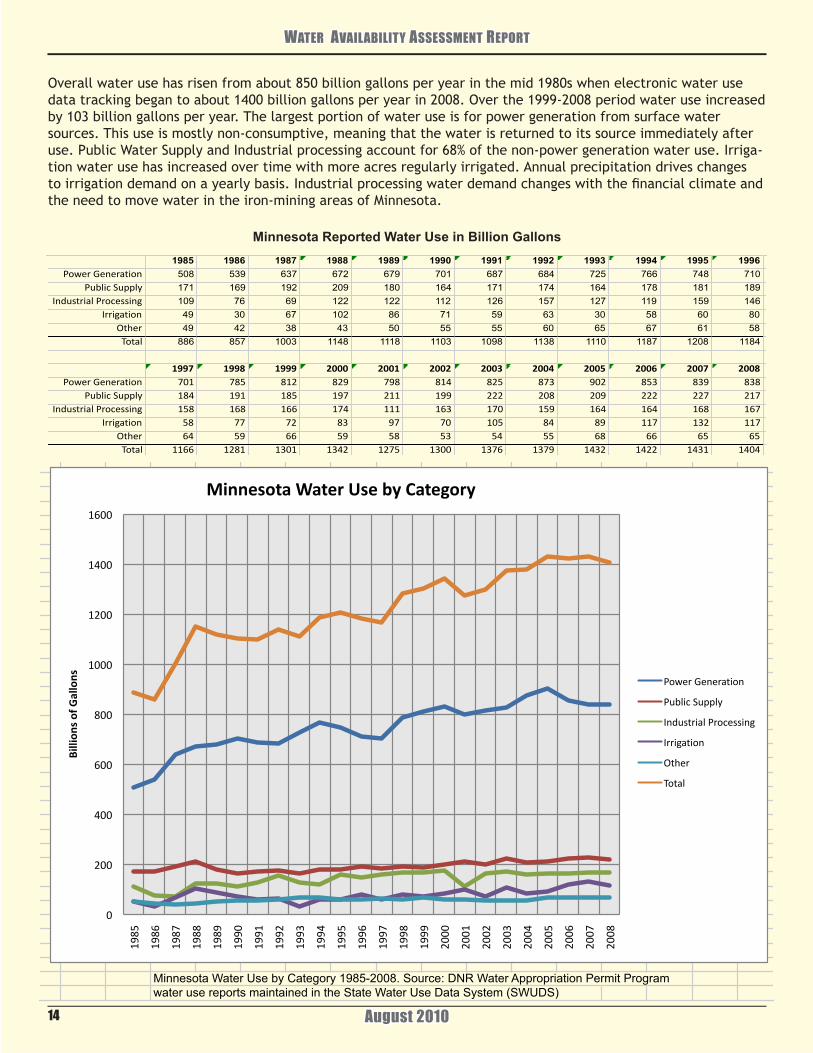
Overall water use has risen from about 850 billion gallons per year in the mid 1980s when electronic water use data tracking began to about 1400 billion gallons per year in 2008. Over the 1999-2008 period water use increased by 103 billion gallons per year. The largest portion of water use is for power generation from surface water sources. This use is mostly non-consumptive, meaning that the water is returned to its source immediately after use. Public Water Supply and Industrial processing account for 68% of the non-power generation water use. Irriga-tion water use has increased over time with more acres regularly irrigated. Annual precipitation drives changes to irrigation demand on a yearly basis. Industrial processing water demand changes with the financial climate and the need to move water in the iron-mining areas of Minnesota.
1985 1986 1987 1988 1989 1990 1991 1992 1993 1994 1995 1996 1997 1998 1999 2000 2001 2002 2003 2004 2005 2006 2007 2008
508 539 637 672 679 701 687 684 725 766 748 710 701 785 812 829 798 814 825 873 902 853 839 838
171 169 192 209 180 164 171 174 164 178 181 189 184 191 185 197 211 199 222 208 209 222 227 217
109 76 69 122 122 112 126 157 127 119 159 146 158 168 166 174 111 163 170 159 164 164 168 167
49 30 67 102 86 71 59 63 30 58 60 80 58 77 72 83 97 70 105 84 89 117 132 117
49 42 38 43 50 55 55 60 65 67 61 58 64 59 66 59 58 53 54 55 68 66 65 65
886 857 1003 1148 1118 1103 1098 1138 1110 1187 1208 1184 1166 1281 1301 1342 1275 1300 1376 1379 1432 1422 1431 1404
Minnesota Water Use by Category 1985-2008. Source: DNR Water Appropriation Permit Program
water use reports maintained in the State Water Use Data System (SWUDS)
Minnesota Reported Water Use in Billion Gallons
0
200
400
600
800
1000
1200
1400
1600
1985
1986
1987
1988
1989
1990
1991
1992
1993
1994
1995
1996
1997
1998
1999
2000
2001
2002
2003
2004
2005
2006
2007
2008
BillionsofGallons
MinnesotaWaterUsebyCategory
PowerGeneration
PublicSupply
IndustrialProcessing
Irrigation
Other
Total
1985 1986 1987 1988 1989 1990 1991 1992 1993 1994 1995 1996
PowerGeneration 508 539 637 672 679 701 687 684 725 766 748 710
PublicSupply 171 169 192 209 180 164 171 174 164 178 181 189
IndustrialProcessing 109 76 69 122 122 112 126 157 127 119 159 146
Irrigation 49 30 67 102 86 71 59 63 30 58 60 80
Other 49 42 38 43 50 55 55 60 65 67 61 58
Total 886 857 1003 1148 1118 1103 1098 1138 1110 1187 1208 1184
1997 1998 1999 2000 2001 2002 2003 2004 2005 2006 2007 2008
PowerGeneration 701 785 812 829 798 814 825 873 902 853 839 838
PublicSupply 184 191 185 197 211 199 222 208 209 222 227 217
IndustrialProcessing 158 168 166 174 111 163 170 159 164 164 168 167
Irrigation 58 77 72 83 97 70 105 84 89 117 132 117
Other 64 59 66 59 58 53 54 55 68 66 65 65
Total 1166 1281 1301 1342 1275 1300 1376 1379 1432 1422 1431 1404
Minnesota Reported Water Use in Billion Gallons
WATER AVAILABILITY ASSESSMENT REPORT
August 2010
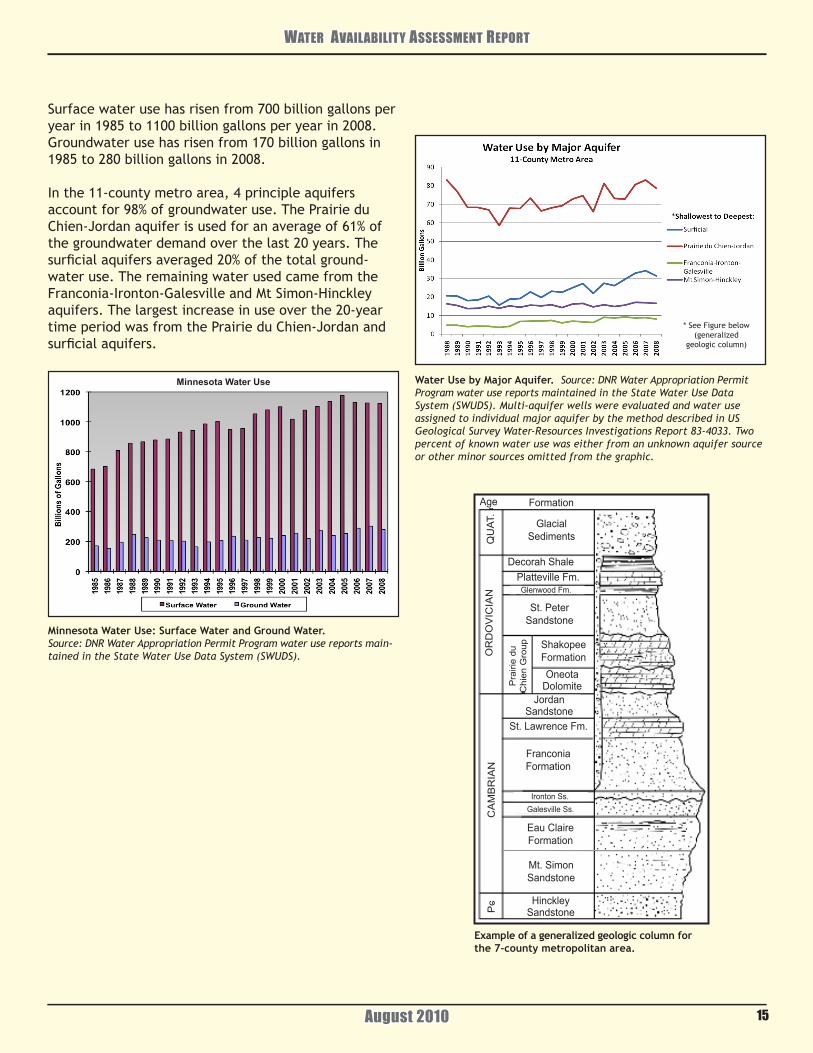
Surface water use has risen from 700 billion gallons per year in 1985 to 1100 billion gallons per year in 2008. Groundwater use has risen from 170 billion gallons in 1985 to 280 billion gallons in 2008.
In the 11-county metro area, 4 principle aquifers account for 98% of groundwater use. The Prairie du Chien-Jordan aquifer is used for an average of 61% of the groundwater demand over the last 20 years. The surficial aquifers averaged 20% of the total ground-water use. The remaining water used came from the Franconia-Ironton-Galesville and Mt Simon-Hinckley aquifers. The largest increase in use over the 20-year time period was from the Prairie du Chien-Jordan and surficial aquifers.
Minnesota Water Use: Surface Water and Ground Water. Source: DNR Water Appropriation Permit Program water use reports main-tained in the State Water Use Data System (SWUDS).
15
Minnesota Water Use Water Use by Major Aquifer. Source: DNR Water Appropriation Permit Program water use reports maintained in the State Water Use Data System (SWUDS). Multi-aquifer wells were evaluated and water use assigned to individual major aquifer by the method described in US Geological Survey Water-Resources Investigations Report 83-4033. Two percent of known water use was either from an unknown aquifer source or other minor sources omitted from the graphic.
Example of a generalized geologic column for the 7-county metropolitan area.
* See Figure below (generalized
geologic column)
FormationAge
GlacialSedimentsQ
UAT.
DecorahShale
GlenwoodFm.
FranconiaFormation
ORDOVICIAN
PlattevilleFm.
St.PeterSandstone
CAMBRIAN
Pc -
St.LawrenceFm.
JordanSandstone
OneotaDolomiteP
rairiedu
ChienGroup Shakopee
Formation
IrontonSs.GalesvilleSs.
HinckleySandstone
Mt.SimonSandstone
EauClaireFormation

WATER AVAILABILITY ASSESSMENT REPORT
August 2010
Water Resource Summary
• Over all the average precipitation was higher over the last ten years when compared to the historical average and markedly higher in areas of the northwest part of the state. • Generally, indicator lakes and rivers responded to climatic conditions and reflect those conditions over the past ten years. • Stream flows were higher than the historical average in the western half of the state and slightly below average in the east. • Indicator lakes across the state were slightly higher than the historical average with the exception of White Bear Lake, a groundwater influenced lake. • Generally groundwater levels in water table and buried artesian indicator wells are in the normal range when compared to historical average. • Seasonal fluctuations in some indicator wells were greater in recent years when compared to historical fluctuations indicating seasonal use of the resource is increasing.
• Deeper aquifers in metropolitan areas used for water supply continue to decline over time.
• In some areas the reliability of deep aquifers for water supply in the future may be limited if the declining trend continues.
16
WATER AVAILABILITY ASSESSMENT REPORT
August 2010 17
Previous Reports & Strategies for Water Management
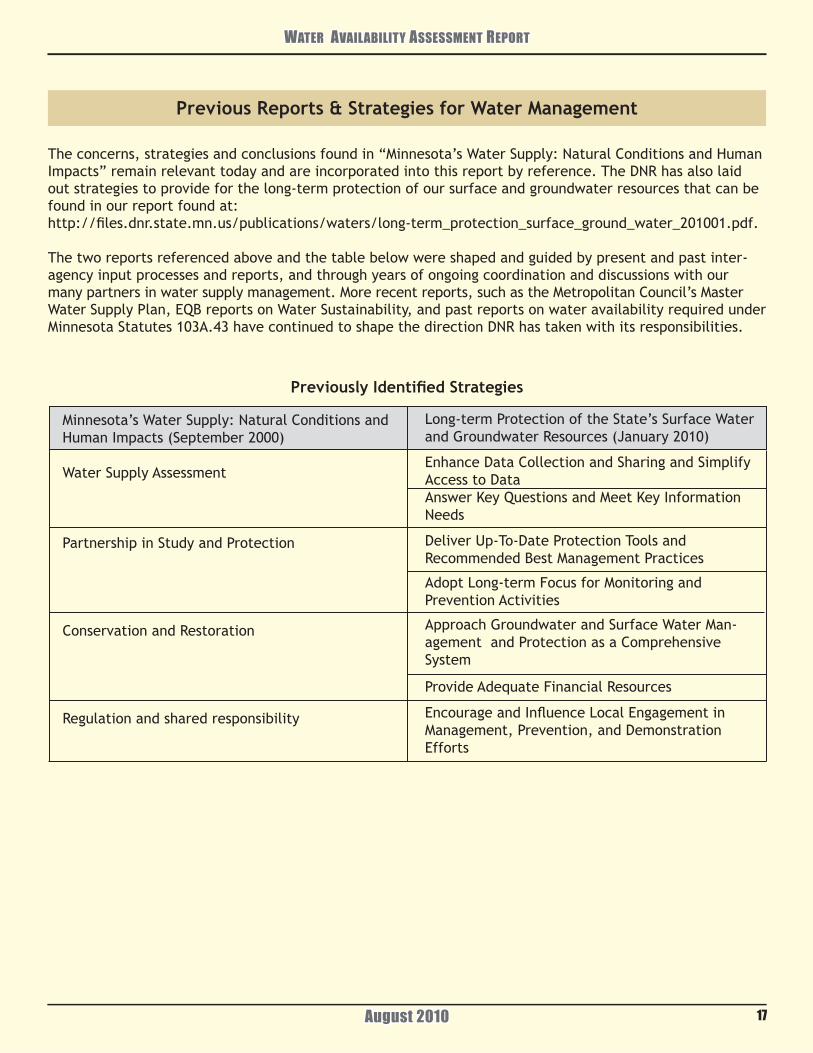
The concerns, strategies and conclusions found in “Minnesota’s Water Supply: Natural Conditions and Human Impacts” remain relevant today and are incorporated into this report by reference. The DNR has also laid out strategies to provide for the long-term protection of our surface and groundwater resources that can be found in our report found at: http://files.dnr.state.mn.us/publications/waters/long-term_protection_surface_ground_water_201001.pdf.
The two reports referenced above and the table below were shaped and guided by present and past inter-agency input processes and reports, and through years of ongoing coordination and discussions with our many partners in water supply management. More recent reports, such as the Metropolitan Council’s Master Water Supply Plan, EQB reports on Water Sustainability, and past reports on water availability required under Minnesota Statutes 103A.43 have continued to shape the direction DNR has taken with its responsibilities.
Previously Identified Strategies
Minnesota’s Water Supply: Natural Conditions and Human Impacts (September 2000)
Water Supply Assessment
Partnership in Study and Protection
Conservation and Restoration
Regulation and shared responsibility
Long-term Protection of the State’s Surface Water and Groundwater Resources (January 2010)
Enhance Data Collection and Sharing and Simplify Access to DataAnswer Key Questions and Meet Key Information Needs
Deliver Up-To-Date Protection Tools and Recommended Best Management Practices
Approach Groundwater and Surface Water Man-agement and Protection as a Comprehensive System
Adopt Long-term Focus for Monitoring and Prevention Activities
Provide Adequate Financial Resources
Encourage and Influence Local Engagement in Management, Prevention, and Demonstration Efforts
WATER AVAILABILITY ASSESSMENT REPORT
August 2010
An increasing number of places in Minnesota are experiencing water supply problems related to inadequate supplies, unacceptable quality or both. Our past management systems were designed around managing the impacts of an individual project to prevent it from creating unacceptable impacts to our natural resource systems. We have been largely suc-cessful in this endeavor. The challenge for all levels of government, as we move forward, will be adapting to understand and manage the impacts from the collective actions of all land use and water supply management decisions on the public, economic and environmental health.
In some places we are seeing water availability problems. We are using water faster than it can be replenished by diverting water from natural discharge zones or lowering water levels in aquifers. In some areas our land use choices are contaminating our water supplies, and we have so greatly changed the natural landscape that the ecosystem that remains is no longer able to provide its essential cleansing and recharge functions.
Minnesota’s climate, on average, provides us with an ample supply of water. We are improving our net-works for understanding precipitation patterns, lake levels, and stream flow that enable us to manage surface water systems. We know far less about our groundwater system, and since approximately 75% of Minnesotans depend on groundwater systems and de-pendence is increasing, we will need to know more about these systems in the future. Additionally, we will need to have a better understanding of the surface and groundwater relationships to the health of our ecosystems. To begin to eliminate current problems and avoid future water availability problems, we must improve our understanding and the quality of management decisions in the following areas:
1) We need to significantly increase our under-standing of how water moves into, through and out of the earth beneath us. 2) We need to learn to reduce our withdrawal of water and promote the understanding that water
captured by pumping has been diverted from discharge areas (springs, streams, lakes and wetlands) and taken from storage as evidenced by declining groundwater levels. We need to learn how much humans can take away from discharge areas without impairing eco-system function and we also need to learn how to manage pumping water levels to reduce competition and conflict among water users.
3) We will need to manage land uses to ensure that water recharging our groundwater systems has had sufficient time or treatment to remove contaminants before entering subsurface flow pathways.
4) And finally, we will need to learn more about how our surface waters are dependent on ground-water systems for supply throughout the year so we can prevent undesirable impacts in lakes and wetlands, rivers and streams, and in natural and rare plant communities that all provide important functions toward the quality of life we have enjoyed in Min-nesota.
In summary, industry, agriculture, housing, manufac-turing, power generation, and well-managed public water supply systems are all necessary elements to nurture and sustain communities. To maintain all the natural resource features that contribute to Min-nesota’s attractive quality of life, including fish and wildlife habitat and recreational opportunities, each growth and development decision needs to include consideration of its effect on the water supply and associated water resources. Careful consideration of the effect each use may have on the available water supply is essential for the sustainability of the water supply and the water supply’s ability to be recharged for future growth, development, and enjoyment. In order to ensure the future of our water supply, thoughtful water supply management, including con-servation, restoration, study, and protection must be practiced. Only in this manner will Minnesotans con-tinue to wisely control their water resource destiny.
Conclusions and Recommendations
18
Related Documents