Welcome message from author
This document is posted to help you gain knowledge. Please leave a comment to let me know what you think about it! Share it to your friends and learn new things together.
Transcript
Report of the
Comptroller and Auditor General of India
on
GENERAL AND SOCIAL SECTORS
for the year ended 31 March 2016
Government of Madhya Pradesh
Report No. 3 of the year 2017

i
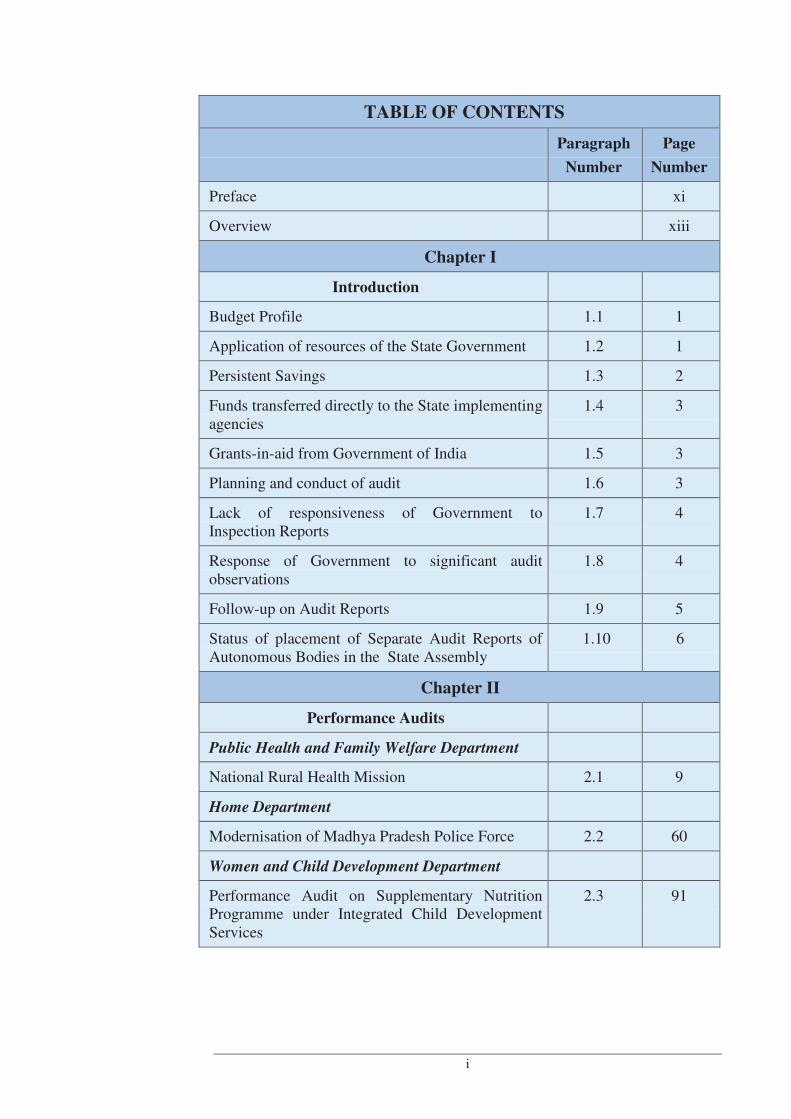
TABLE OF CONTENTS
Paragraph
Number
Page
Number
Preface xi
Overview xiii
Chapter I
Introduction
Budget Profile 1.1 1
Application of resources of the State Government 1.2 1
Persistent Savings 1.3 2
Funds transferred directly to the State implementing agencies
1.4 3
Grants-in-aid from Government of India 1.5 3
Planning and conduct of audit 1.6 3
Lack of responsiveness of Government to Inspection Reports
1.7 4
Response of Government to significant audit observations
1.8 4
Follow-up on Audit Reports 1.9 5
Status of placement of Separate Audit Reports of Autonomous Bodies in the State Assembly
1.10 6
Chapter II
Performance Audits
Public Health and Family Welfare Department
National Rural Health Mission 2.1 9
Home Department
Modernisation of Madhya Pradesh Police Force 2.2 60
Women and Child Development Department
Performance Audit on Supplementary Nutrition Programme under Integrated Child Development Services
2.3 91
Audit Report on General and Social Sectors for the year ended 31 March 2016
ii
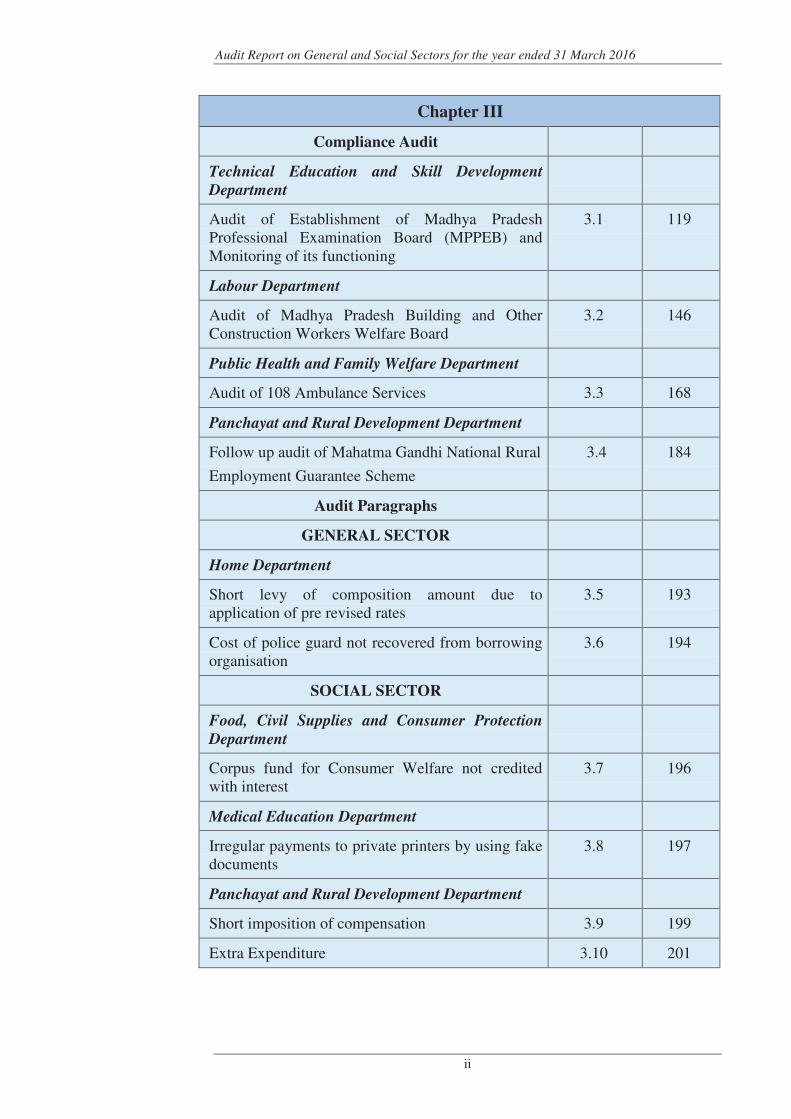
Chapter III
Compliance Audit
Technical Education and Skill Development
Department
Audit of Establishment of Madhya Pradesh Professional Examination Board (MPPEB) and Monitoring of its functioning
3.1 119
Labour Department
Audit of Madhya Pradesh Building and Other Construction Workers Welfare Board
3.2 146
Public Health and Family Welfare Department
Audit of 108 Ambulance Services 3.3 168
Panchayat and Rural Development Department
Follow up audit of Mahatma Gandhi National Rural
Employment Guarantee Scheme
3.4 184
Audit Paragraphs
GENERAL SECTOR
Home Department
Short levy of composition amount due to application of pre revised rates
3.5 193
Cost of police guard not recovered from borrowing organisation
3.6 194
SOCIAL SECTOR
Food, Civil Supplies and Consumer Protection
Department
Corpus fund for Consumer Welfare not credited with interest
3.7 196
Medical Education Department
Irregular payments to private printers by using fake documents
3.8 197
Panchayat and Rural Development Department
Short imposition of compensation 3.9 199
Extra Expenditure 3.10 201
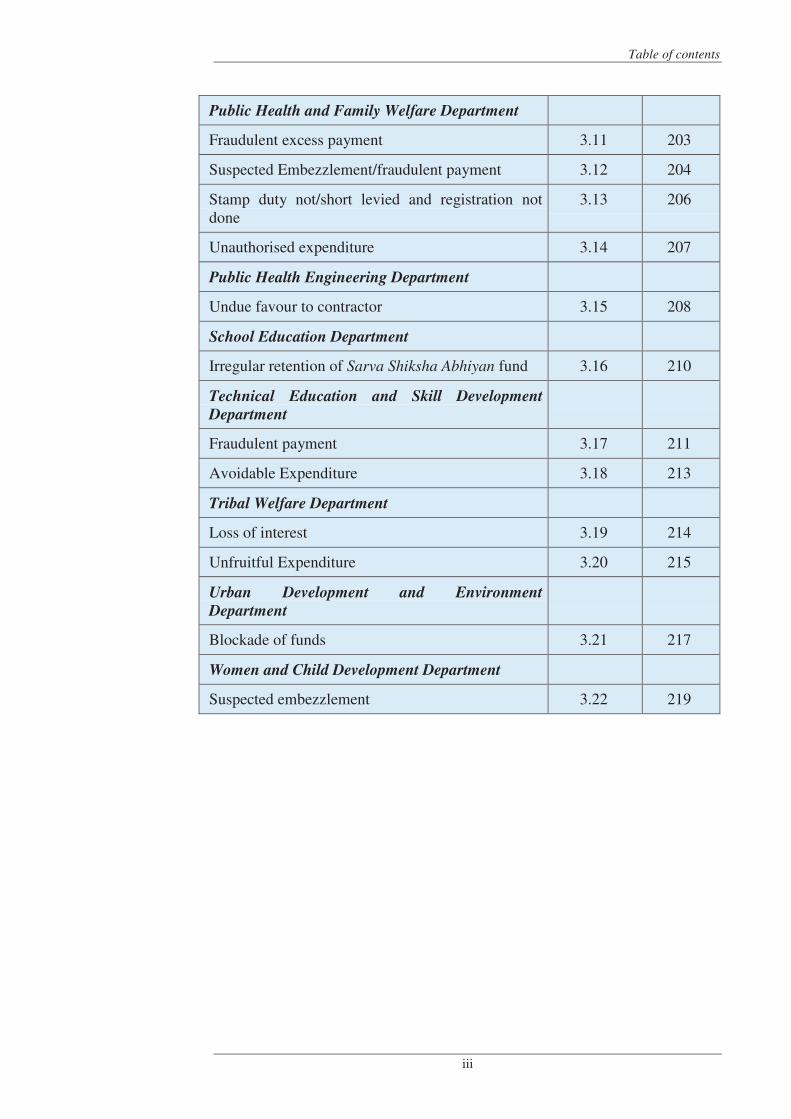
Table of contents
iii
Public Health and Family Welfare Department
Fraudulent excess payment 3.11 203
Suspected Embezzlement/fraudulent payment 3.12 204
Stamp duty not/short levied and registration not done
3.13 206
Unauthorised expenditure 3.14 207
Public Health Engineering Department
Undue favour to contractor 3.15 208
School Education Department
Irregular retention of Sarva Shiksha Abhiyan fund 3.16 210
Technical Education and Skill Development
Department
Fraudulent payment 3.17 211
Avoidable Expenditure 3.18 213
Tribal Welfare Department
Loss of interest 3.19 214
Unfruitful Expenditure 3.20 215
Urban Development and Environment
Department
Blockade of funds 3.21 217
Women and Child Development Department
Suspected embezzlement 3.22 219
Audit Report on General and Social Sectors for the year ended 31 March 2016
iv
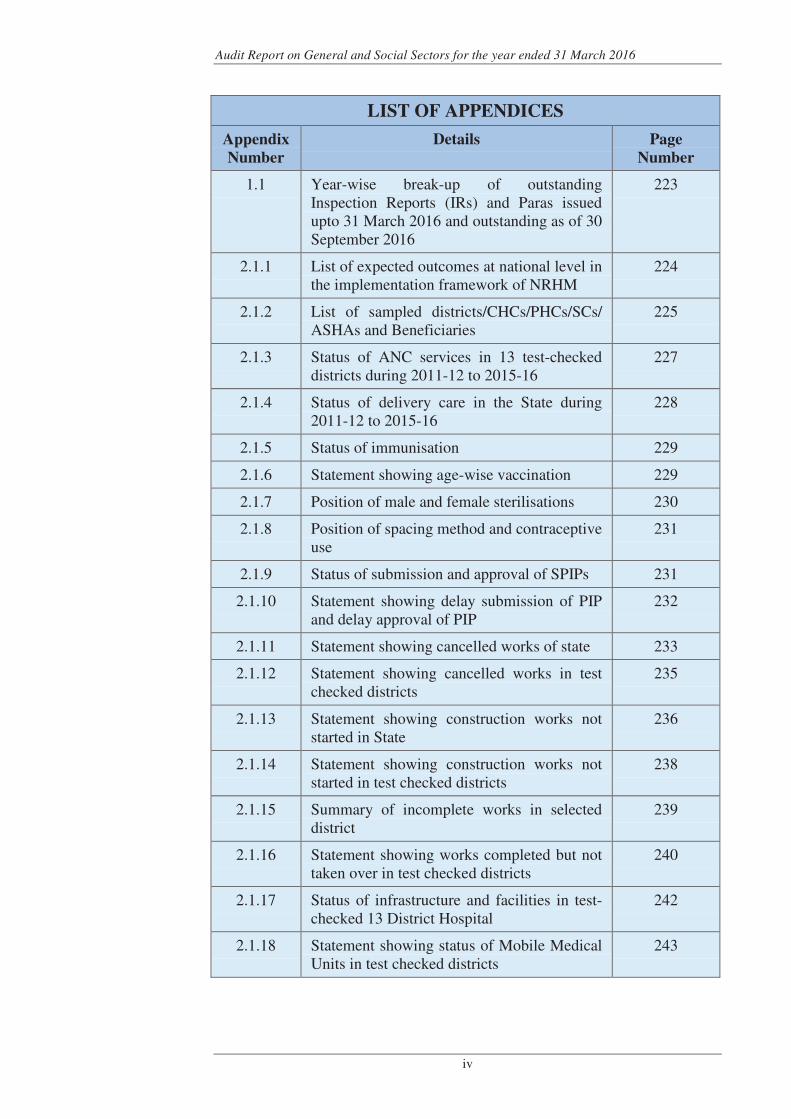
LIST OF APPENDICES
Appendix
Number Details Page
Number
1.1 Year-wise break-up of outstanding Inspection Reports (IRs) and Paras issued upto 31 March 2016 and outstanding as of 30 September 2016
223
2.1.1 List of expected outcomes at national level in the implementation framework of NRHM
224
2.1.2 List of sampled districts/CHCs/PHCs/SCs/ ASHAs and Beneficiaries
225
2.1.3 Status of ANC services in 13 test-checked districts during 2011-12 to 2015-16
227
2.1.4 Status of delivery care in the State during 2011-12 to 2015-16
228
2.1.5 Status of immunisation 229
2.1.6 Statement showing age-wise vaccination 229
2.1.7 Position of male and female sterilisations 230
2.1.8 Position of spacing method and contraceptive use
231
2.1.9 Status of submission and approval of SPIPs 231
2.1.10 Statement showing delay submission of PIP and delay approval of PIP
232
2.1.11 Statement showing cancelled works of state 233
2.1.12 Statement showing cancelled works in test checked districts
235
2.1.13 Statement showing construction works not started in State
236
2.1.14 Statement showing construction works not started in test checked districts
238
2.1.15 Summary of incomplete works in selected district
239
2.1.16 Statement showing works completed but not taken over in test checked districts
240
2.1.17 Status of infrastructure and facilities in test-checked 13 District Hospital
242
2.1.18 Statement showing status of Mobile Medical Units in test checked districts
243
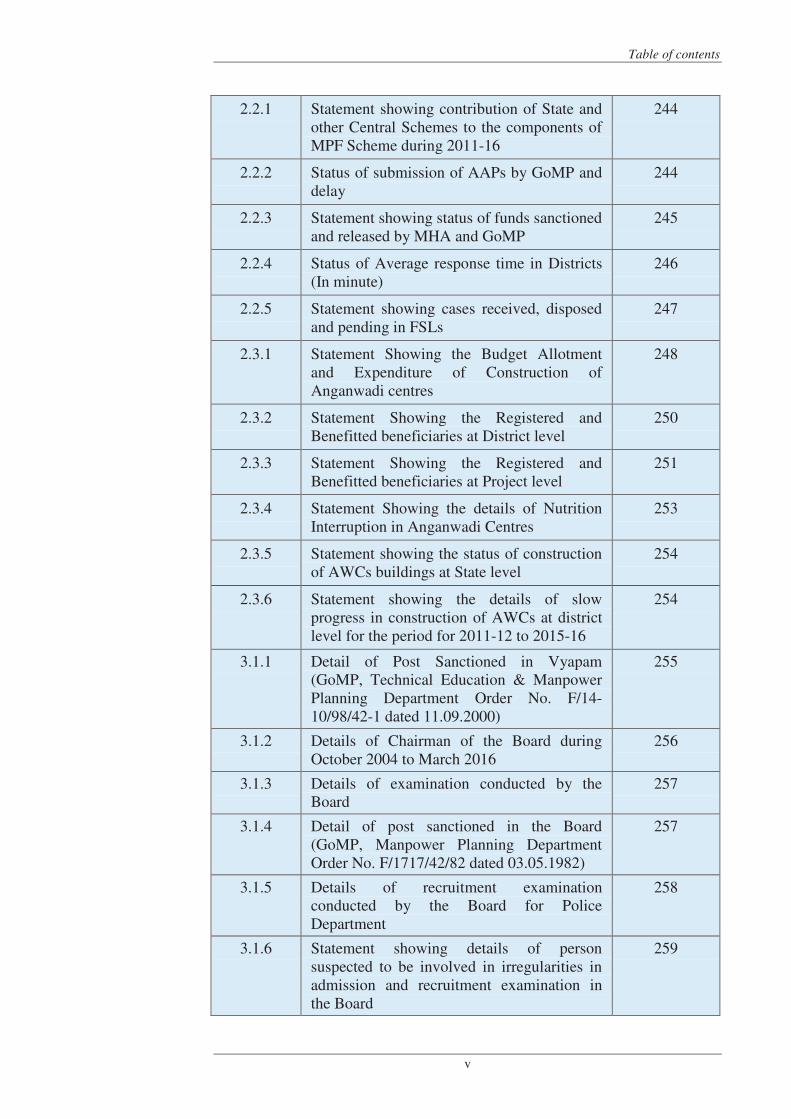
Table of contents
v
2.2.1 Statement showing contribution of State and other Central Schemes to the components of MPF Scheme during 2011-16
244
2.2.2 Status of submission of AAPs by GoMP and delay
244
2.2.3 Statement showing status of funds sanctioned and released by MHA and GoMP
245
2.2.4 Status of Average response time in Districts (In minute)
246
2.2.5 Statement showing cases received, disposed and pending in FSLs
247
2.3.1 Statement Showing the Budget Allotment and Expenditure of Construction of Anganwadi centres
248
2.3.2 Statement Showing the Registered and Benefitted beneficiaries at District level
250
2.3.3 Statement Showing the Registered and Benefitted beneficiaries at Project level
251
2.3.4 Statement Showing the details of Nutrition Interruption in Anganwadi Centres
253
2.3.5 Statement showing the status of construction of AWCs buildings at State level
254
2.3.6 Statement showing the details of slow progress in construction of AWCs at district level for the period for 2011-12 to 2015-16
254
3.1.1 Detail of Post Sanctioned in Vyapam (GoMP, Technical Education & Manpower Planning Department Order No. F/14-10/98/42-1 dated 11.09.2000)
255
3.1.2 Details of Chairman of the Board during October 2004 to March 2016
256
3.1.3 Details of examination conducted by the Board
257
3.1.4 Detail of post sanctioned in the Board (GoMP, Manpower Planning Department Order No. F/1717/42/82 dated 03.05.1982)
257
3.1.5 Details of recruitment examination conducted by the Board for Police Department
258
3.1.6 Statement showing details of person suspected to be involved in irregularities in admission and recruitment examination in the Board
259
Audit Report on General and Social Sectors for the year ended 31 March 2016
vi
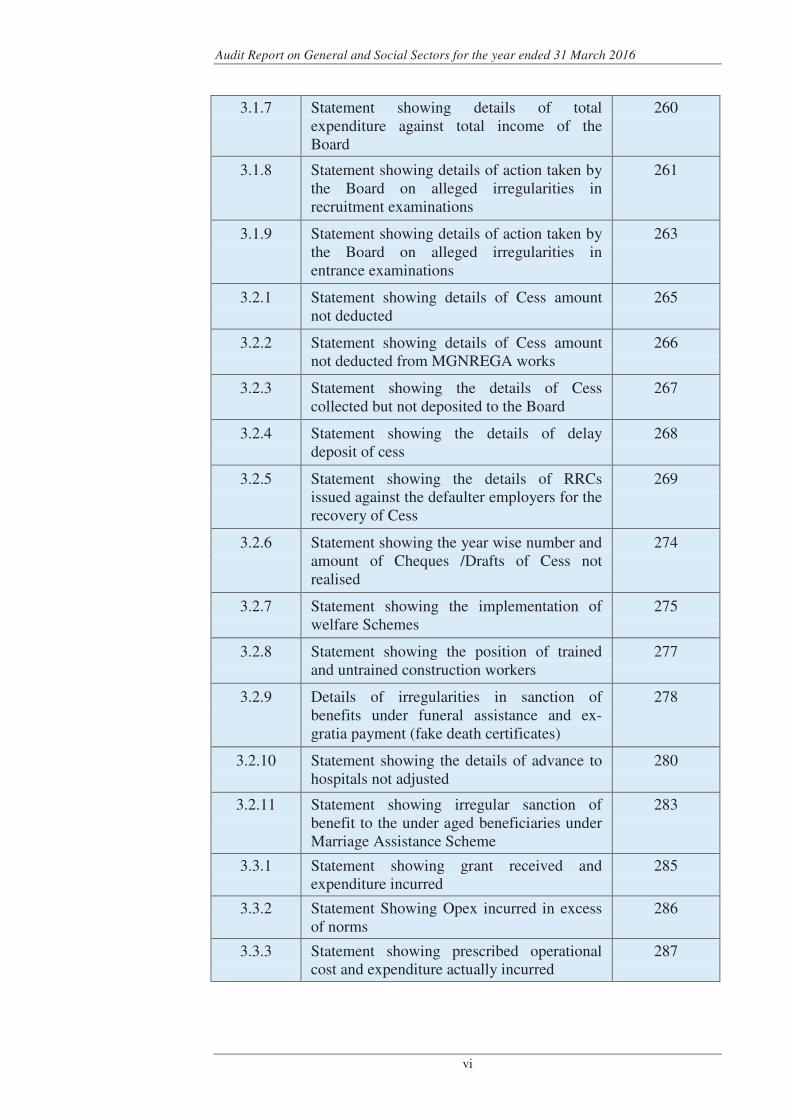
3.1.7 Statement showing details of total expenditure against total income of the Board
260
3.1.8 Statement showing details of action taken by the Board on alleged irregularities in recruitment examinations
261
3.1.9 Statement showing details of action taken by the Board on alleged irregularities in entrance examinations
263
3.2.1 Statement showing details of Cess amount not deducted
265
3.2.2 Statement showing details of Cess amount not deducted from MGNREGA works
266
3.2.3 Statement showing the details of Cess collected but not deposited to the Board
267
3.2.4 Statement showing the details of delay deposit of cess
268
3.2.5 Statement showing the details of RRCs issued against the defaulter employers for the recovery of Cess
269
3.2.6 Statement showing the year wise number and amount of Cheques /Drafts of Cess not realised
274
3.2.7 Statement showing the implementation of welfare Schemes
275
3.2.8 Statement showing the position of trained and untrained construction workers
277
3.2.9 Details of irregularities in sanction of benefits under funeral assistance and ex-gratia payment (fake death certificates)
278
3.2.10 Statement showing the details of advance to hospitals not adjusted
280
3.2.11 Statement showing irregular sanction of benefit to the under aged beneficiaries under Marriage Assistance Scheme
283
3.3.1 Statement showing grant received and expenditure incurred
285
3.3.2 Statement Showing Opex incurred in excess of norms
286
3.3.3 Statement showing prescribed operational cost and expenditure actually incurred
287
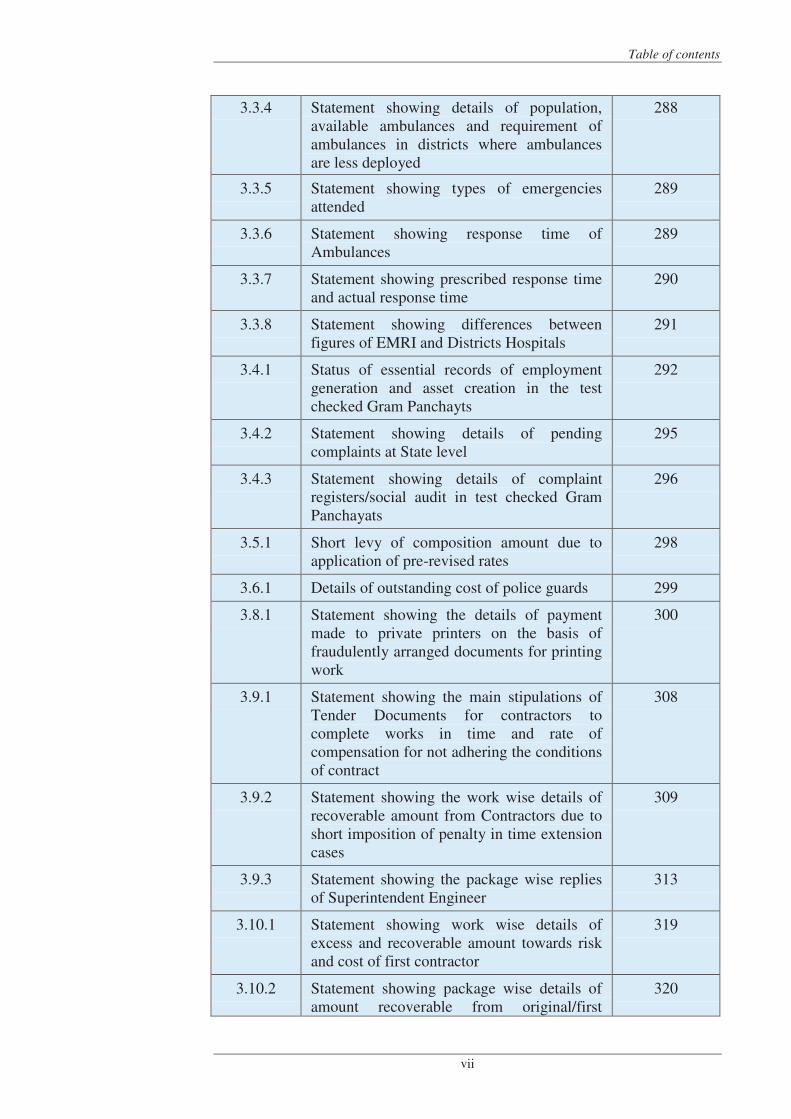
Table of contents
vii
3.3.4 Statement showing details of population, available ambulances and requirement of ambulances in districts where ambulances are less deployed
288
3.3.5 Statement showing types of emergencies attended
289
3.3.6 Statement showing response time of Ambulances
289
3.3.7 Statement showing prescribed response time and actual response time
290
3.3.8 Statement showing differences between figures of EMRI and Districts Hospitals
291
3.4.1 Status of essential records of employment generation and asset creation in the test checked Gram Panchayts
292
3.4.2 Statement showing details of pending complaints at State level
295
3.4.3 Statement showing details of complaint registers/social audit in test checked Gram Panchayats
296
3.5.1 Short levy of composition amount due to application of pre-revised rates
298
3.6.1 Details of outstanding cost of police guards 299
3.8.1 Statement showing the details of payment made to private printers on the basis of fraudulently arranged documents for printing work
300
3.9.1 Statement showing the main stipulations of Tender Documents for contractors to complete works in time and rate of compensation for not adhering the conditions of contract
308
3.9.2 Statement showing the work wise details of recoverable amount from Contractors due to short imposition of penalty in time extension cases
309
3.9.3 Statement showing the package wise replies of Superintendent Engineer
313
3.10.1 Statement showing work wise details of excess and recoverable amount towards risk and cost of first contractor
319
3.10.2 Statement showing package wise details of amount recoverable from original/first
320
Audit Report on General and Social Sectors for the year ended 31 March 2016
viii
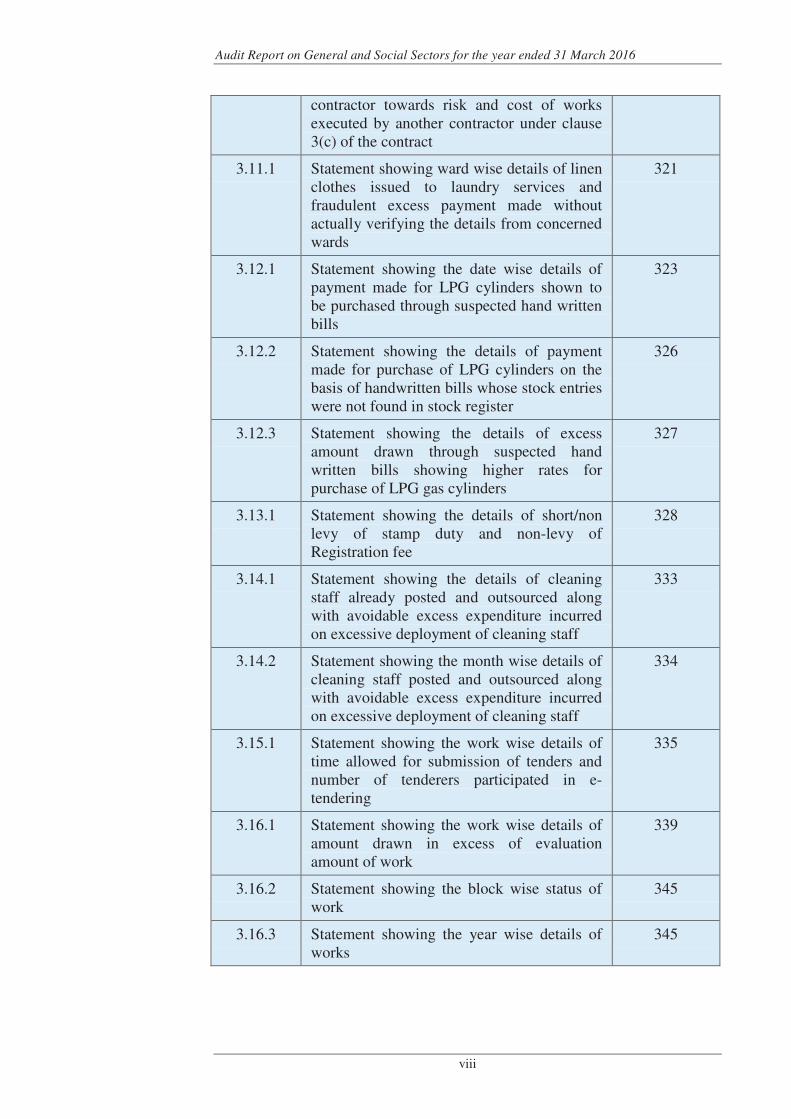
contractor towards risk and cost of works executed by another contractor under clause 3(c) of the contract
3.11.1 Statement showing ward wise details of linen clothes issued to laundry services and fraudulent excess payment made without actually verifying the details from concerned wards
321
3.12.1 Statement showing the date wise details of payment made for LPG cylinders shown to be purchased through suspected hand written bills
323
3.12.2 Statement showing the details of payment made for purchase of LPG cylinders on the basis of handwritten bills whose stock entries were not found in stock register
326
3.12.3 Statement showing the details of excess amount drawn through suspected hand written bills showing higher rates for purchase of LPG gas cylinders
327
3.13.1 Statement showing the details of short/non levy of stamp duty and non-levy of Registration fee
328
3.14.1 Statement showing the details of cleaning staff already posted and outsourced along with avoidable excess expenditure incurred on excessive deployment of cleaning staff
333
3.14.2 Statement showing the month wise details of cleaning staff posted and outsourced along with avoidable excess expenditure incurred on excessive deployment of cleaning staff
334
3.15.1 Statement showing the work wise details of time allowed for submission of tenders and number of tenderers participated in e-tendering
335
3.16.1 Statement showing the work wise details of amount drawn in excess of evaluation amount of work
339
3.16.2 Statement showing the block wise status of work
345
3.16.3 Statement showing the year wise details of works
345
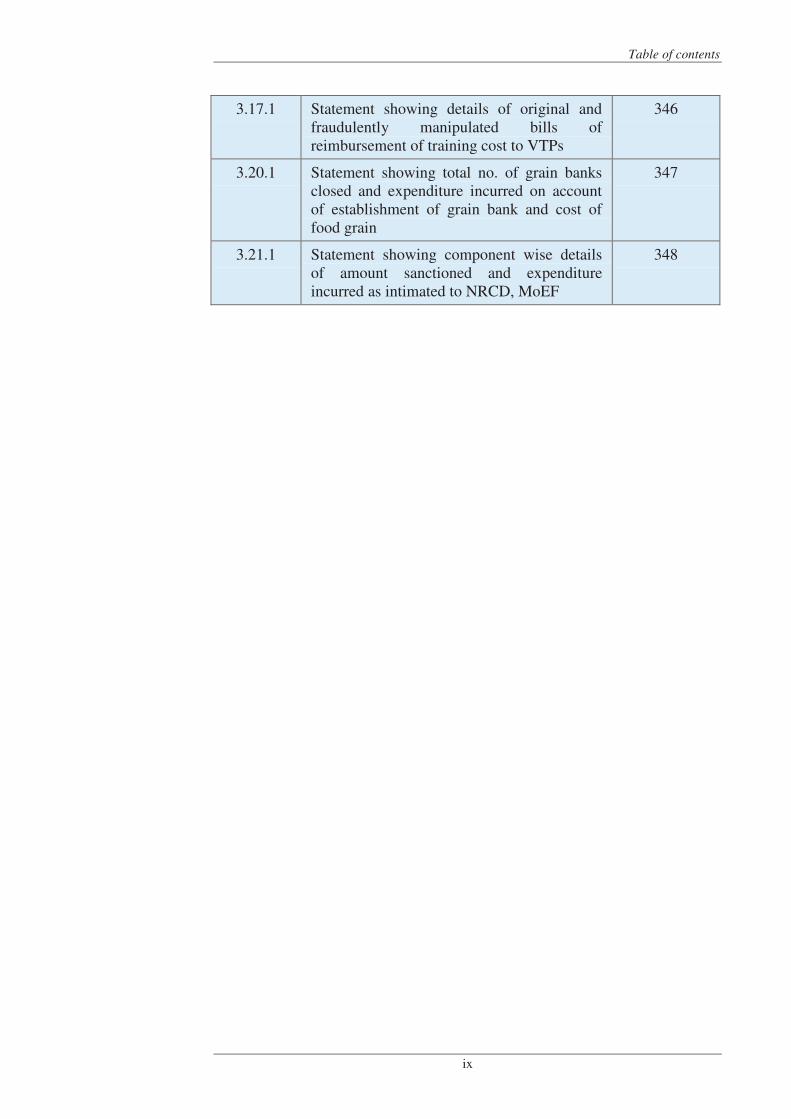
Table of contents
ix
3.17.1 Statement showing details of original and fraudulently manipulated bills of reimbursement of training cost to VTPs
346
3.20.1 Statement showing total no. of grain banks closed and expenditure incurred on account of establishment of grain bank and cost of food grain
347
3.21.1 Statement showing component wise details of amount sanctioned and expenditure incurred as intimated to NRCD, MoEF
348

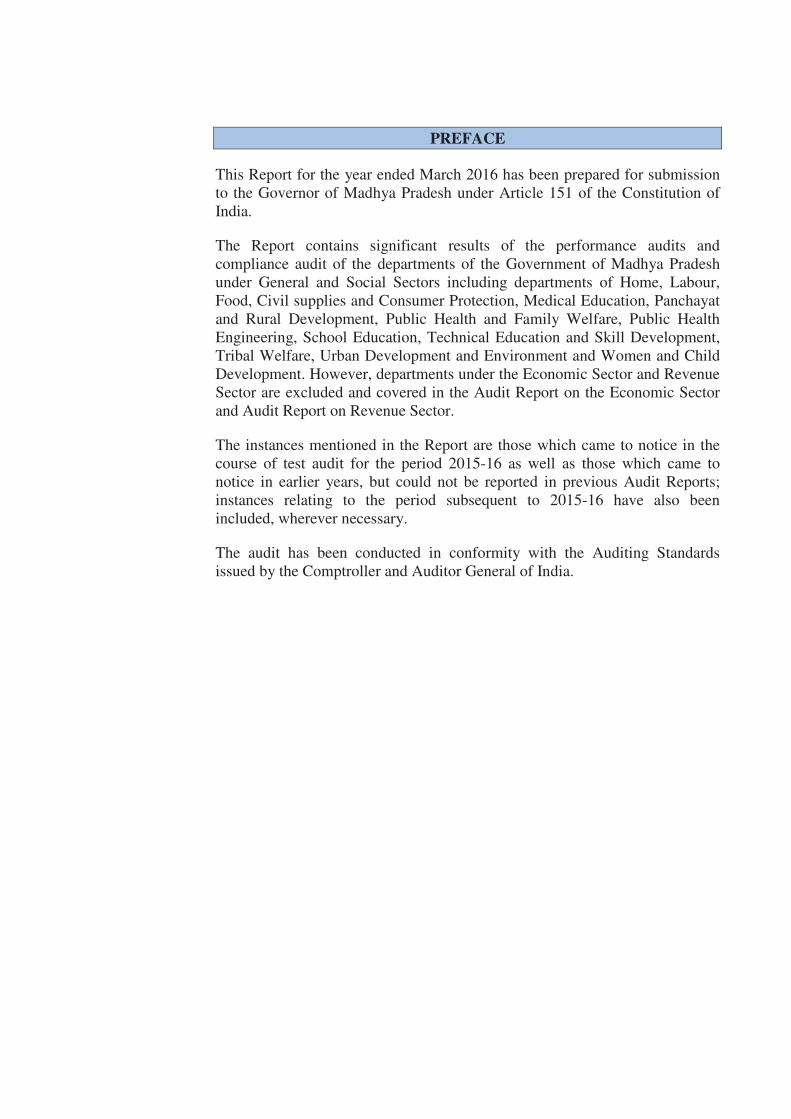
PREFACE
This Report for the year ended March 2016 has been prepared for submission to the Governor of Madhya Pradesh under Article 151 of the Constitution of India.
The Report contains significant results of the performance audits and compliance audit of the departments of the Government of Madhya Pradesh under General and Social Sectors including departments of Home, Labour, Food, Civil supplies and Consumer Protection, Medical Education, Panchayat and Rural Development, Public Health and Family Welfare, Public Health Engineering, School Education, Technical Education and Skill Development, Tribal Welfare, Urban Development and Environment and Women and Child Development. However, departments under the Economic Sector and Revenue Sector are excluded and covered in the Audit Report on the Economic Sector and Audit Report on Revenue Sector.
The instances mentioned in the Report are those which came to notice in the course of test audit for the period 2015-16 as well as those which came to notice in earlier years, but could not be reported in previous Audit Reports; instances relating to the period subsequent to 2015-16 have also been included, wherever necessary.
The audit has been conducted in conformity with the Auditing Standards issued by the Comptroller and Auditor General of India.


xiii
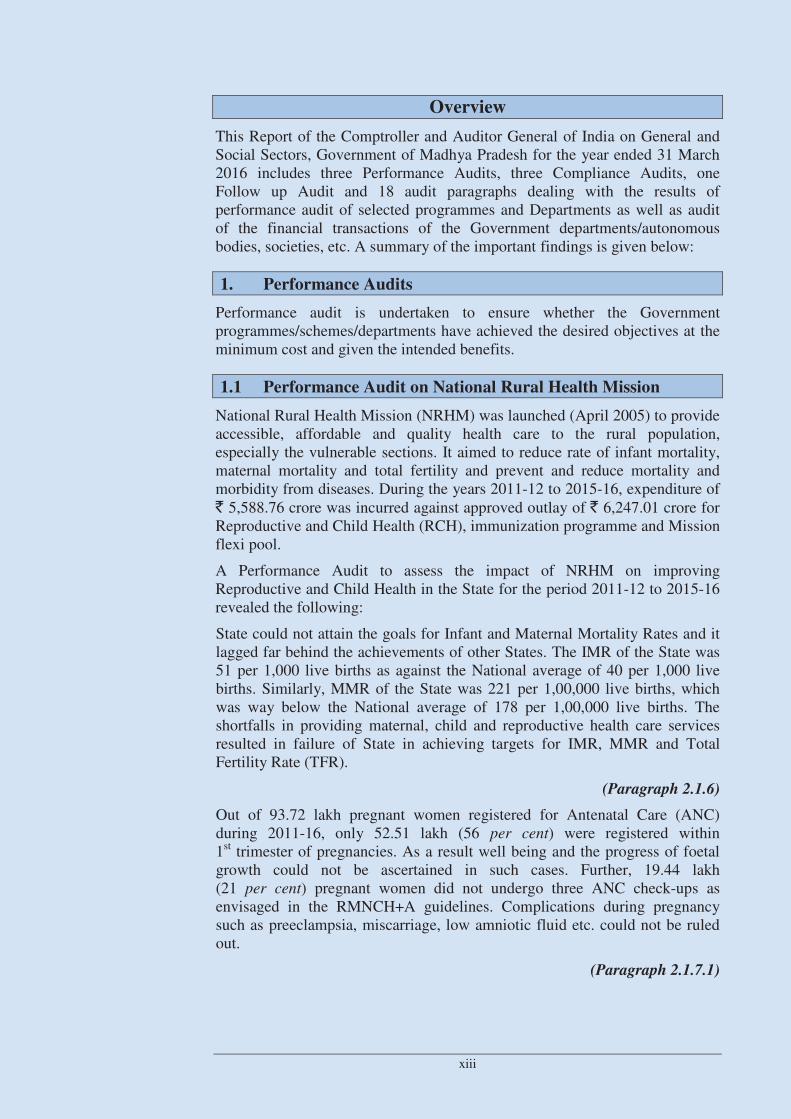
Overview
This Report of the Comptroller and Auditor General of India on General and Social Sectors, Government of Madhya Pradesh for the year ended 31 March 2016 includes three Performance Audits, three Compliance Audits, one Follow up Audit and 18 audit paragraphs dealing with the results of performance audit of selected programmes and Departments as well as audit of the financial transactions of the Government departments/autonomous bodies, societies, etc. A summary of the important findings is given below:
1. Performance Audits
Performance audit is undertaken to ensure whether the Government programmes/schemes/departments have achieved the desired objectives at the minimum cost and given the intended benefits.
1.1 Performance Audit on National Rural Health Mission
National Rural Health Mission (NRHM) was launched (April 2005) to provide accessible, affordable and quality health care to the rural population, especially the vulnerable sections. It aimed to reduce rate of infant mortality, maternal mortality and total fertility and prevent and reduce mortality and morbidity from diseases. During the years 2011-12 to 2015-16, expenditure of ` 5,588.76 crore was incurred against approved outlay of ` 6,247.01 crore for Reproductive and Child Health (RCH), immunization programme and Mission flexi pool.
A Performance Audit to assess the impact of NRHM on improving Reproductive and Child Health in the State for the period 2011-12 to 2015-16 revealed the following:
State could not attain the goals for Infant and Maternal Mortality Rates and it lagged far behind the achievements of other States. The IMR of the State was 51 per 1,000 live births as against the National average of 40 per 1,000 live births. Similarly, MMR of the State was 221 per 1,00,000 live births, which was way below the National average of 178 per 1,00,000 live births. The shortfalls in providing maternal, child and reproductive health care services resulted in failure of State in achieving targets for IMR, MMR and Total Fertility Rate (TFR).
(Paragraph 2.1.6)
Out of 93.72 lakh pregnant women registered for Antenatal Care (ANC) during 2011-16, only 52.51 lakh (56 per cent) were registered within 1st trimester of pregnancies. As a result well being and the progress of foetal growth could not be ascertained in such cases. Further, 19.44 lakh (21 per cent) pregnant women did not undergo three ANC check-ups as envisaged in the RMNCH+A guidelines. Complications during pregnancy such as preeclampsia, miscarriage, low amniotic fluid etc. could not be ruled out.
(Paragraph 2.1.7.1)
Audit Report on General and Social Sectors for the year ended 31 March 2016
xiv
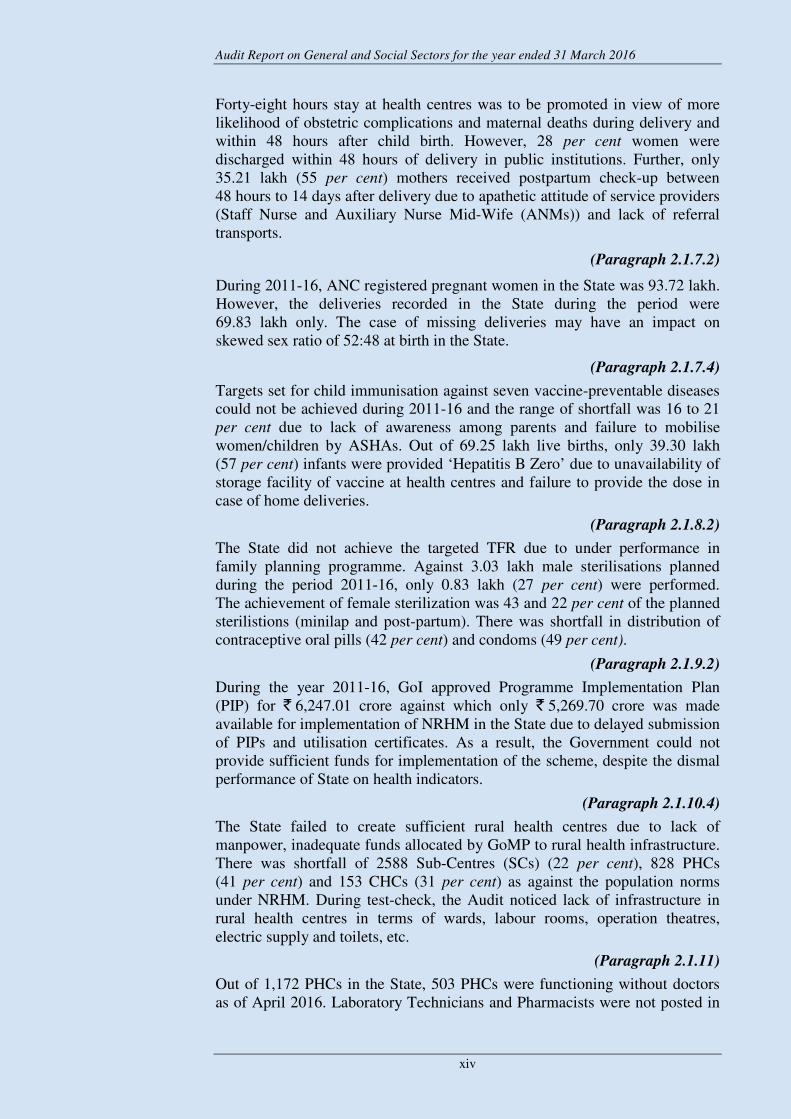
Forty-eight hours stay at health centres was to be promoted in view of more
likelihood of obstetric complications and maternal deaths during delivery and
within 48 hours after child birth. However, 28 per cent women were
discharged within 48 hours of delivery in public institutions. Further, only
35.21 lakh (55 per cent) mothers received postpartum check-up between
48 hours to 14 days after delivery due to apathetic attitude of service providers
(Staff Nurse and Auxiliary Nurse Mid-Wife (ANMs)) and lack of referral
transports.
(Paragraph 2.1.7.2)
During 2011-16, ANC registered pregnant women in the State was 93.72 lakh.
However, the deliveries recorded in the State during the period were
69.83 lakh only. The case of missing deliveries may have an impact on
skewed sex ratio of 52:48 at birth in the State.
(Paragraph 2.1.7.4)
Targets set for child immunisation against seven vaccine-preventable diseases
could not be achieved during 2011-16 and the range of shortfall was 16 to 21
per cent due to lack of awareness among parents and failure to mobilise
women/children by ASHAs. Out of 69.25 lakh live births, only 39.30 lakh
(57 per cent) infants were provided ‘Hepatitis B Zero’ due to unavailability of
storage facility of vaccine at health centres and failure to provide the dose in
case of home deliveries.
(Paragraph 2.1.8.2)
The State did not achieve the targeted TFR due to under performance in
family planning programme. Against 3.03 lakh male sterilisations planned
during the period 2011-16, only 0.83 lakh (27 per cent) were performed.
The achievement of female sterilization was 43 and 22 per cent of the planned
sterilistions (minilap and post-partum). There was shortfall in distribution of
contraceptive oral pills (42 per cent) and condoms (49 per cent).
(Paragraph 2.1.9.2)
During the year 2011-16, GoI approved Programme Implementation Plan
(PIP) for ` 6,247.01 crore against which only ` 5,269.70 crore was made
available for implementation of NRHM in the State due to delayed submission
of PIPs and utilisation certificates. As a result, the Government could not
provide sufficient funds for implementation of the scheme, despite the dismal
performance of State on health indicators.
(Paragraph 2.1.10.4)
The State failed to create sufficient rural health centres due to lack of
manpower, inadequate funds allocated by GoMP to rural health infrastructure.
There was shortfall of 2588 Sub-Centres (SCs) (22 per cent), 828 PHCs
(41 per cent) and 153 CHCs (31 per cent) as against the population norms
under NRHM. During test-check, the Audit noticed lack of infrastructure in
rural health centres in terms of wards, labour rooms, operation theatres,
electric supply and toilets, etc.
(Paragraph 2.1.11)
Out of 1,172 PHCs in the State, 503 PHCs were functioning without doctors
as of April 2016. Laboratory Technicians and Pharmacists were not posted in
Overview
xv
525 and 312 PHCs respectively. In 96 CHCs of sampled districts, only 13
specialists were available against sanctioned 346 specialists. Further, 58,730
Accredited Social Health Activists (ASHAs) were engaged in the State as of
April 2016 against the requirement of 62,206 ASHAs.
(Paragraph 2.1.12)
Under Madhya Pradesh Swasthya Seva Guarantee Yojana, Government was
committed to provide minimum essential drugs and laboratory services for all
types of health facility centres. However, none of the test-checked health
facilities had all the listed drugs and laboratory services categorised under
Madhya Pradesh Swasthya Seva Guarantee Yojana.
(Paragraphs 2.1.13 and 2.1.15)
State quality assurance committee and district quality assurance committees
did not meet at prescribed intervals. Patient satisfaction survey was not
conducted in 10 out of 13 test checked District Hospitals (DHs). Quality
assurance programme was not implemented at CHC and PHC levels.
(Paragraph 2.1.18)
1.2 Modernisation of Madhya Pradesh Police Force
'Police' is a State subject and it is primarily the responsibility of the State to
modernise and adequately equip the police forces. The Modernisation of
Police Forces (MPF) scheme was launched by Ministry of Home Affairs
(MHA), Government of India (GoI) to effectively face the emerging
challenges to internal security. A Performance Audit of 'Modernisation of
Madhya Pradesh Police Force' for the period 2011-12 to 2015-16 revealed the
following:
As on March 2016, there was 35 per cent shortage of police building,
68 per cent shortage of police houses in the State as the budget for
construction activities was low. More than two thirds of subordinate police
personnel could not be provided government accommodation, as there was a
shortfall of 69,978 houses for them. Due to inadequate housing in selected
13 districts, police personnel occupied 683 condemned and 582 dilapidated
houses. Basic amenities such as toilet and rest rooms for women personnel
were lacking in Police Stations/Outposts.
(Paragraph 2.2.10)
There was large shortage of vehicles, especially motorcycle, in the
Department. In selected 39 Police Stations (PSs)/Outposts (OPs), there were
no motorcycle in six PSs and two OPs. Further, 102 cars valuing ` 5.88 crore
were procured, which were prohibited for procurement under MPF. Audit
noticed that there was shortage of 23,955 modern weapons as of December
2016. Thus, the department was dependent on old weapons affecting the
striking capacity of police force.
(Paragraphs 2.2.11 and 2.2.12)
There was overall vacancy of 16,751 personnel in police force as of June
2016. Posts of Scientific Officers and Lab Technician were lying vacant in
Forensic Science Laboratories (FSLs) leading to large pendency in forensic
Audit Report on General and Social Sectors for the year ended 31 March 2016
xvi
examinations. Training of police personnel was affected due to short availability of trained teachers.
(Paragraphs 2.2.13.1 and 2.2.17)
The progress of expenditure against available funds was slow and improved largely during 2015-16 in which ` 163.65 crore (52 per cent of total ` 316.47 crore) was incurred. Slow progress of expenditure led to short release of ` 92.79 crore of Central share for implementation of MPF in the State. For the period 2015-16, Central share of ` 23.42 crore released by MHA to GoMP as well as the State Share of ` 17.87 crore was not released to the Department even till the end of March 2016.
(Paragraph 2.2.8)
1.3 Performance Audit on Supplementary Nutrition Programme
under Integrated Child Development Services
Supplementary Nutrition Programme (SNP) under ICDS is primarily designed to bridge the gap between the recommendatory dietary allowance and average daily intake. Every beneficiary of SNP is provided Supplementary Nutrition for 300 days in a year, which is supplied by the Anganwadi Centres (AWCs) in the form of cooked meals and Take Home Ration. In Madhya Pradesh, ` 5012.17 crore was incurred on implementation of SNP during 2011-12 to 2015-16. A performance audit of the implementation of ICDS (Supplementary Nutrition Programme) in Madhya Pradesh during the period 2011-16 revealed the following:
As per population norms laid down by Government of India, there was shortage of 18604 AWCs and 3400 Mini-AWCs in the State as of March 2016. Out of 61,755 villages in the State, 11156 villages covering a population of 53.84 lakh were without AWCs.
State Government did not open 4305 AWCs, though these were sanctioned by GoI in November 2014.
(Paragraph 2.3.10)
During 2011-16, 20.94 lakh registered children in the age group of six months to three years, 57.02 lakh registered children in age group of three years to six years and 7.99 lakh registered pregnant and lactating mothers did not avail Supplementary Nutrition due to inadequate infrastructure at AWCs, preparation of less quantity of Supplementary Nutrition or at times no supply of Supplementary Nutrition and long distances of AWCs, which acted as disincentives to enrolled beneficiaries affecting their attendance at AWCs.
(Paragraph 2.3.7.2)
As per National Family Health Survey (2015-16), there were 9.2 per cent of severely malnourished children in the State. Thus, the State could not achieve target for reducing severely malnourished children from 12.6 per cent to 5 per cent.
(Paragraph 2.3.11)

Overview
xvii
In 14 test checked Project Offices, Supplementary Nutrition was not supplied during different months (ranged from one day to 120 days) during 2011-12 to 2015-16 in 983 AWCs having 37079 registered beneficiaries. While distributing wheat and rice to Self Help Groups by the District Programme Officers, there was a shortage of 24432.05 MT wheat and 3592.06 MT rice. This affected the distribution of cooked meal to beneficiaries.
(Paragraphs 2.3.9.1 and 2.3.9.2)
Meeting of State Level Monitoring and Review Committee was not held. Monitoring and Review Committee was not constituted at District and Block level for proper monitoring and supervision.
(Paragraphs 2.3.12.3 and 2.3.12.4)
2. Compliance Audit
Audit has reported on several significant deficiencies in critical areas which impact the effective functioning of the Government departments/organisations.
2.1 Audit of 'Establishment of Madhya Pradesh Professional
Examination Board and Monitoring of its functioning
Government of Madhya Pradesh established ‘Professional Examination Board’ (Vyavsayik Pariksha Mandal), commonly known as ‘VYAPAM’ in the year 1982 for conducting entrance tests for admissions in the Medical, Engineering, Agriculture and Poly-technique colleges of the State. In April 2003, the Board was entrusted the responsibilities to conduct recruitment to those State level posts (except for posts of Police and Law Departments), which were not filled by the Madhya Pradesh Public Service Commission.
Madhya Pradesh State Legislature in August 2007 passed Madhya Pradesh
Vyavsayik Pariksha Mandal Adhiniyam, 2007 (MPPEB Act 2007) with a view of conducting examinations in professional courses and matters connected therewith. The significant findings are as follows.
Duality in Government approach on status of Board
The Board was constituted with confusion over its status, as the State Government declared that it would not be responsible for any act of commission or omission by VYAPAM. However, the status of Board as a Government Department was accepted during various inter-departmental deliberations thereafter, which was also confirmed by legal opinions of its Law Department and Judicial pronouncements. State Government was also in full control of the Board for all practical purposes as the posts of Chairman, Director and Controller in the Board were filled by transfer of State Government officers. Despite this, Government did not frame any rules/regulations regarding conduct of business of Board, conduct of examination, collection and deposit of fees, financial procedures to be followed, systems to be put in place for conduct of examinations and auxiliary activities in a free and fair manner, ensuring transparency and accountability and prevention of malpractices.
Audit Report on General and Social Sectors for the year ended 31 March 2016
xviii
The confusion over the status of VYAPAM was allowed to continue and the arrangement between State Government and Board remained flexible. State Government ostensibly distanced itself from the activities of Board, while still maintaining administrative control over the apex management. This shadowy control, without well laid out processes for verification and assessment of the functions of the Board was a clear case of exercise of power without assumption of responsibility. This eventually led to a situation where there was severe erosion in credibility of examinations conducted by Board, which led to widespread public dissatisfaction as reported in the media and as acknowledged by the Department as well as investigation of irregularities by ED/CBI/EOW and setting aside of the candidature of MBBS students by the APEX Court.
(Paragraph 3.1.2)
Delay in constitution of Statutory Board
Government established the statutory Board under this Act only in March 2016, i.e., with a delay of more than eight years. The delay in establishment of statutory Board defeated the purpose to provide greater authority and more credibility to the Professional Examination Board in Madhya Pradesh.
(Paragraph 3.1.3)
Transfer of recruitment function to Board
The recruitment examinations for State level posts were transferred to the Board in April 2003 without corresponding increase in its manpower that affected the conduct of examination by Board. The necessity for entrusting recruitment process to VYAPAM bypassing Staff Selection Commission was without any stated objectives/advantages to the Government and was a departure from the well-established procedure all around the country.
Government did also not ensure development of robust selection procedure/rules for conduct of recruitment examination by the Board to achieve impartiality, objectivity and suitability. Thus, a primary function of the Government to ensure free and fair recruitment to its own services, which was till now being conducted by Public Service Commission/Government Departments, was jettisoned in favour of an institution which was neither statutory nor independent, nor functioned under well laid out regulations.
(Paragraph 3.1.4)
Appointments by State Government in the Board
The appointments of Director and Controller in the Board were made by systemic subversion of rules resulting into undue favour to officers. Dr. Yogesh Uprit and Dr. Pankaj Trivedi were appointed Director and Controller respectively directly on orders of the then Minister in contraventions to rules. Dr. Pankaj Trivedi was subsequently posted as Director alongwith his posting as Controller. Similarly, Shri Ajay Sen, Senior System Analyst and Shri Nitin Mohindra, System Analyst were given undue favour by upgrading their pay scales without approval of Board or
Overview
xix
Government. These officers were later suspected to be involved in the alleged irregularities in examinations conducted by the Board.
(Paragraph 3.1.5)
Oversight of the Board by State Government
The State Government did not take any remedial measures by framing rules/regulations to prevent the irregularities even after VYAPAM reported some cases of irregularities in conduct of examination. There was no evidence that the State Government ensured the integrity of IT based system used in the examination conducted by the Board.
(Paragraph 3.1.7)
Financial accountability of the Board
The fund of Board was kept outside Government Account and it was not subjected to budgetary control of State Legislature, which led to dilution in its financial accountability. The Board as well as State Government misutilised Board fund as per their convenience and transferred ` 13.75 crore of Board Fund to other organisations for activities not connected with VYAPAM.
(Paragraph 3.1.6)
2.2 Audit of Madhya Pradesh Building and Other Construction
Workers' Welfare Board
State Government constituted (10 April 2003) the Madhya Pradesh Building and Other Construction Workers' Welfare Board (Board) to undertake welfare measures for the benefit of the building and other construction workers. The Board registered 24.82 lakh building workers up to March 2016 and 22 welfare schemes are being operated by the Board for providing the benefits to the registered building workers. Audit of Board in the State for the period 2011-16 revealed the following:
In six Urban Local Bodies (ULBs), 2,922 buildings construction permissions were issued during 2011-16. However, establishments related to 2,881 building permissions were not registered with respective Registering Officers (ROs). Cess amounting to ` 1.83 crore was not deducted from 35,679 MGNREGS construction works pertaining to period 2011-16. Collected cess amounting to ` 3.13 crore was not transferred to the Board by ULBs, PRIs and other construction agencies.
(Paragraphs 3.2.2.1, 3.2.2.2 (b) and 3.2.2.3)
The District Labour Offices (DLOs) had 1,121 cases for assessment of cess pertaining to the period 2011-16 (excluding the cases of last six months). However, assessment of cess was done only in 539 cases due to shortage of staff.
(Paragraph 3.2.2.5 (i))
Annual statement of Accounts for the financial year 2012-13, 2013-14, 2014-15 and 2015-16 were not prepared. The cheques or drafts for depositing the
Audit Report on General and Social Sectors for the year ended 31 March 2016
xx
cess amounting to ` 12.93 crore were returned to the drawers and which remained unrealised due to lack of monitoring by the Board.
(Paragraphs 3.2.3.3 and 3.2.3.4)
The Board had neither established field offices nor recruited against the sanctioned 310 field staffs for the efficient discharge of Board's functions.
(Paragraph 3.2.4.2)
The Board fixed financial targets for the 22 schemes, but there was a shortfall in implementation of schemes ranging from 16 to 100 per cent during 2011-16 due to shortage of staff.
(Paragraph 3.2.4.3)
2.3 Audit on '108 Ambulance Services'
Emergency Medical Service (EMS) is an essential part of the overall healthcare system as it saves lives by providing emergency care immediately. For this purpose, Public Health and Family Welfare Department, Government of Madhya Pradesh entered into a Memorandum of Understanding (MoU) with Emergency Management & Research Institute (EMRI) to develop and operationalise emergency response units in the State. An audit of ‘108 Ambulance Services’ conducted covering the period 2007-08 to 2015-16 revealed the following:
Due to poor planning and delay in procurement process, project could not be extended across the entire State within the prescribed period. As a result, 17 per cent of the population remained uncovered by ambulance facility. Less number of ‘108 Ambulances’ were deployed in many districts against the prescribed norms despite excessive response time in these districts.
(Paragraphs 3.3.2 and 3.3.4.3)
Funds were released to the GVK EMRI on ad-hoc basis without assessing the actual requirement. The savings on salary amounting to ` 23.42 crore was utilised on meeting excess expenditure on other activities/components viz. fuel cost, repair and maintenance etc. under Operational Expenditure (Opex). Further, per ambulance Opex was more than the prescribed limit of ` 0.98 lakh resulting in excess payment of ` 5.02 crore to the operating agency during 2012-13 to 2014-15.
(Paragraphs 3.3.3.1 and 3.3.3.2)
Response time of ‘108 Ambulances’ was found to be unsatisfactory in many districts. Ambulances in many districts could not achieve the prescribed norms attending to emergencies. However, proportionate deduction of ` 58.14 lakh against this shortfall was not made from payments to the operating agency.
(Paragraphs 3.3.5.2 and 3.3.5.4)
Against the required posts, the shortfall in deployment by EMRI ranged from four to 11 per cent as on July 2015. At call centre, 50 per cent shortage was seen in Emergency Response Centre Physician (ERCP)-care. Due to this, line

Overview
xxi
of ERCP was found mostly busy and beneficiaries were deprived of getting ERCP advices during the emergency transportation.
(Paragraph 3.3.5.5)
The MoU provided to constitute a District Level Committee under the chairmanship of District Collector to coordinate actions required for efficient implementation and operation of ‘108 Ambulance Services’. However, the District Level Committee was not constituted in any district.
(Paragraph 3.3.6.2)
2.4 Follow up audit of the Performance Audit on “Mahatma
Gandhi National Rural Employment Guarantee Scheme”
The implementation of the Scheme in the State was last reviewed covering the period 2007-12 and the findings were included in Para No. 2.2 of the Audit Report on General and Social (Non-PSUs) Sectors for the Year ended 31 March 2012. In the course of follow up audit, audit assessed the action taken by the Government on the accepted recommendations included in Para No. 2.2 of Audit Report on General and Social (Non-PSUs) Sectors for the Year ended 31 March 2012 (Report No 4 of 2013). The follow up audit revealed the following:
Out of six accepted recommendations, three recommendations relating to issue of job cards, convergence of MGNREGS funds with other schemes for generation of additional employment and strengthening of grievance redressal mechanism were only partially implemented by the Department, while following three recommendations were not implemented by the Department:
Conducting regular meetings of General Body of State Employment Guranttee Council (SEGC) and its Empowered Committee.
Obtaining application for work and issue of dated receipt to beneficiaries to enable them to get unemployment allowance in case of not getting the employment within 15 days.
Ensuring maintenance of essential records of employment generation and asset creation.
(Paragraph 3.4)
Audit Paragraphs
M.Y. Hospital Indore and J. A. Group of Hospitals, Gwalior made irregular payment of ` 79.50 lakh to private printers by using fake bill verification letters, certification seal and signature of Government printing press.
(Paragraph 3.8)
Six Divisions of Rural Engineering Services short levied compensation of ` 1.26 crore on contractors for delays in construction of rural road works under Mukhya Mantri Gram Sadak Yojana.
(Paragraph 3.9)
J.P. Hospital, Bhopal made fraudulent excess payment of ` 48.67 lakh to Laundry Services for washing of linen clothes on the basis of incorrect
Audit Report on General and Social Sectors for the year ended 31 March 2016
xxii
verification of Secretary, Rogi Kalyan Samiti without actually verifying the details of linen clothes issued for washing by the concerned wards.
(Paragraph 3.11)
Codal provisions for preparation of bills, receipt, verification and issue of stock were not followed/ensured by Civil Surgeon-cum-Hospital Superintendent, Betul which facilitated payment of ` 7.69 lakh on fake/fraudulently fabricated bills for supply of LPG cylinders.
(Paragraph 3.12)
Unauthorised expenditure of ` 1.39 crore was incurred by Civil Surgeon-cum-Hospital Superintendents Barwani and Sagar and Civil Surgeon, Jai Prakash Hospital, Bhopal on outsourcing of excess cleaning staff in violation of prescribed norms.
(Paragraph 3.14)
The minimum time limit prescribed for submission of tenders through e-tenders was not adhered to by office of Executive Engineer, Public Health Engineering, Shivpuri, in awarding departmental works of estimated cost of ` 2.61 crore which led to undue favour to participating contractors.
(Paragraph 3.15)
District Project Co-ordinator, Zila Shiksha Kendra, Vidisha released subsequent instalments for construction works in schools under Sarva Shiksha
Abhiyan, without ensuring evaluation of work done by previous installment which led to irregular retention of ` 1.59 crore by construction agencies.
(Paragraph 3.16)
Fraudulent double payment amounting to ` 2.25 lakh was made to Vocational Training Providers for the same training courses by the Chief Executive Officer, Madhya Pradesh Council for Vocational Education and Training, Bhopal.
(Paragraph 3.17)
Government Polytechnic College, Hoshangabad incurred unwarranted expenditure of ` 92.42 lakh on construction of a new girls’ hostel building though the existing 50-seated girls’ hostel was vacant since the completion of its construction at a cost of ` 91.74 lakh in April 2008.
(Paragraph 3.18)
Due to abnormal delay in execution of works of core components, the project “Abatement of Pollution and Environmental Improvement of Sagar lake”, had been abandoned and an amount of ` 7.70 crore remained blocked for more than nine years.
(Paragraph 3.21)

Chapter I: Introduction
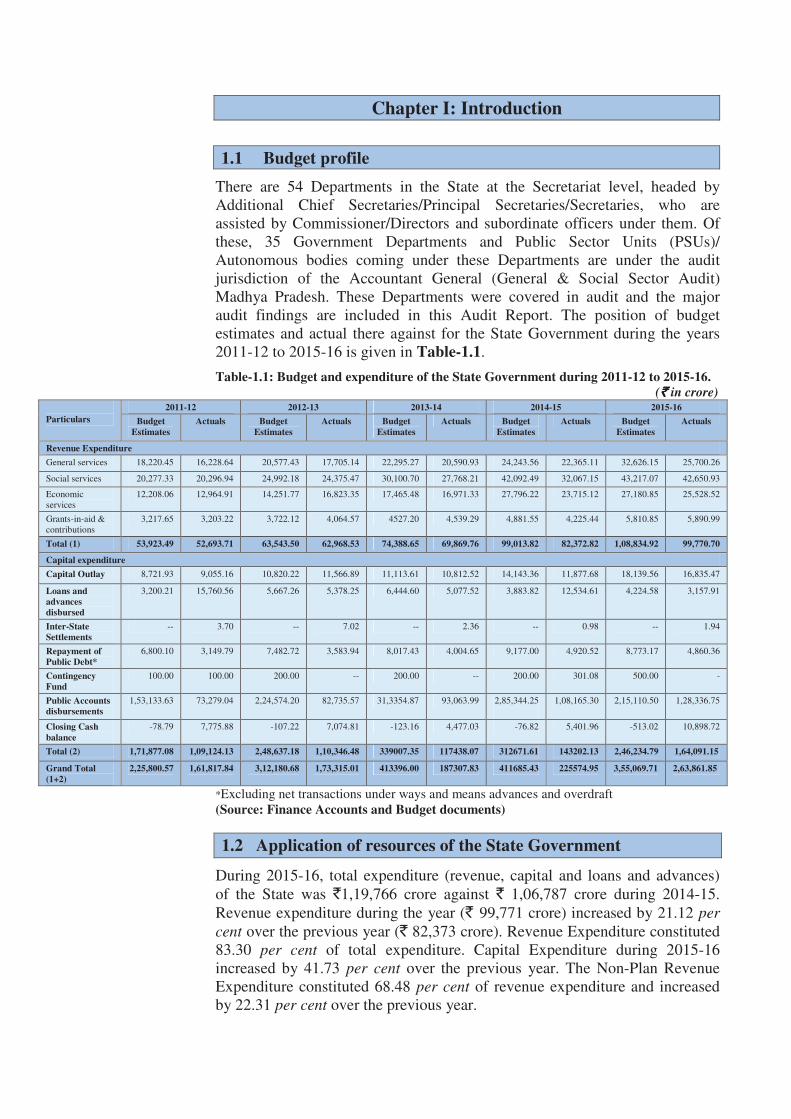
1.1 Budget profile
There are 54 Departments in the State at the Secretariat level, headed by Additional Chief Secretaries/Principal Secretaries/Secretaries, who are assisted by Commissioner/Directors and subordinate officers under them. Of these, 35 Government Departments and Public Sector Units (PSUs)/ Autonomous bodies coming under these Departments are under the audit jurisdiction of the Accountant General (General & Social Sector Audit) Madhya Pradesh. These Departments were covered in audit and the major audit findings are included in this Audit Report. The position of budget estimates and actual there against for the State Government during the years 2011-12 to 2015-16 is given in Table-1.1.
Table-1.1: Budget and expenditure of the State Government during 2011-12 to 2015-16.
(` ` ` ` in crore)
Particulars
2011-12 2012-13 2013-14 2014-15 2015-16
Budget
Estimates
Actuals Budget
Estimates
Actuals Budget
Estimates
Actuals Budget
Estimates
Actuals Budget
Estimates
Actuals
Revenue Expenditure
General services 18,220.45 16,228.64 20,577.43 17,705.14 22,295.27 20,590.93 24,243.56 22,365.11 32,626.15 25,700.26
Social services 20,277.33 20,296.94 24,992.18 24,375.47 30,100.70 27,768.21 42,092.49 32,067.15 43,217.07 42,650.93
Economic services
12,208.06 12,964.91 14,251.77 16,823.35 17,465.48 16,971.33 27,796.22 23,715.12 27,180.85 25,528.52
Grants-in-aid & contributions
3,217.65 3,203.22 3,722.12 4,064.57 4527.20 4,539.29 4,881.55 4,225.44 5,810.85 5,890.99
Total (1) 53,923.49 52,693.71 63,543.50 62,968.53 74,388.65 69,869.76 99,013.82 82,372.82 1,08,834.92 99,770.70
Capital expenditure
Capital Outlay 8,721.93 9,055.16 10,820.22 11,566.89 11,113.61 10,812.52 14,143.36 11,877.68 18,139.56 16,835.47
Loans and
advances
disbursed
3,200.21 15,760.56 5,667.26 5,378.25 6,444.60 5,077.52 3,883.82 12,534.61 4,224.58 3,157.91
Inter-State
Settlements
-- 3.70 -- 7.02 -- 2.36 -- 0.98 -- 1.94
Repayment of
Public Debt*
6,800.10 3,149.79 7,482.72 3,583.94 8,017.43 4,004.65 9,177.00 4,920.52 8,773.17 4,860.36
Contingency
Fund
100.00 100.00 200.00 -- 200.00 -- 200.00 301.08 500.00 -
Public Accounts
disbursements
1,53,133.63 73,279.04 2,24,574.20 82,735.57 31,3354.87 93,063.99 2,85,344.25
1,08,165.30 2,15,110.50 1,28,336.75
Closing Cash
balance
-78.79 7,775.88 -107.22 7,074.81 -123.16 4,477.03 -76.82 5,401.96 -513.02 10,898.72
Total (2) 1,71,877.08 1,09,124.13 2,48,637.18 1,10,346.48 339007.35 117438.07 312671.61 143202.13 2,46,234.79 1,64,091.15
Grand Total
(1+2)
2,25,800.57 1,61,817.84 3,12,180.68 1,73,315.01 413396.00 187307.83 411685.43 225574.95 3,55,069.71 2,63,861.85
*Excluding net transactions under ways and means advances and overdraft (Source: Finance Accounts and Budget documents)
1.2 Application of resources of the State Government
During 2015-16, total expenditure (revenue, capital and loans and advances) of the State was `1,19,766 crore against ` 1,06,787 crore during 2014-15. Revenue expenditure during the year (` 99,771 crore) increased by 21.12 per
cent over the previous year (` 82,373 crore). Revenue Expenditure constituted 83.30 per cent of total expenditure. Capital Expenditure during 2015-16 increased by 41.73 per cent over the previous year. The Non-Plan Revenue Expenditure constituted 68.48 per cent of revenue expenditure and increased by 22.31 per cent over the previous year.
Audit Report on General and Social Sectors for the year ended 31 March 2016
2
While total expenditure of the State during the period 2011-12 to 2015-16 increased at an annual average rate of 11 per cent, the revenue receipts grew at an annual average growth rate of 14 per cent during 2011-12 to 2015-16.
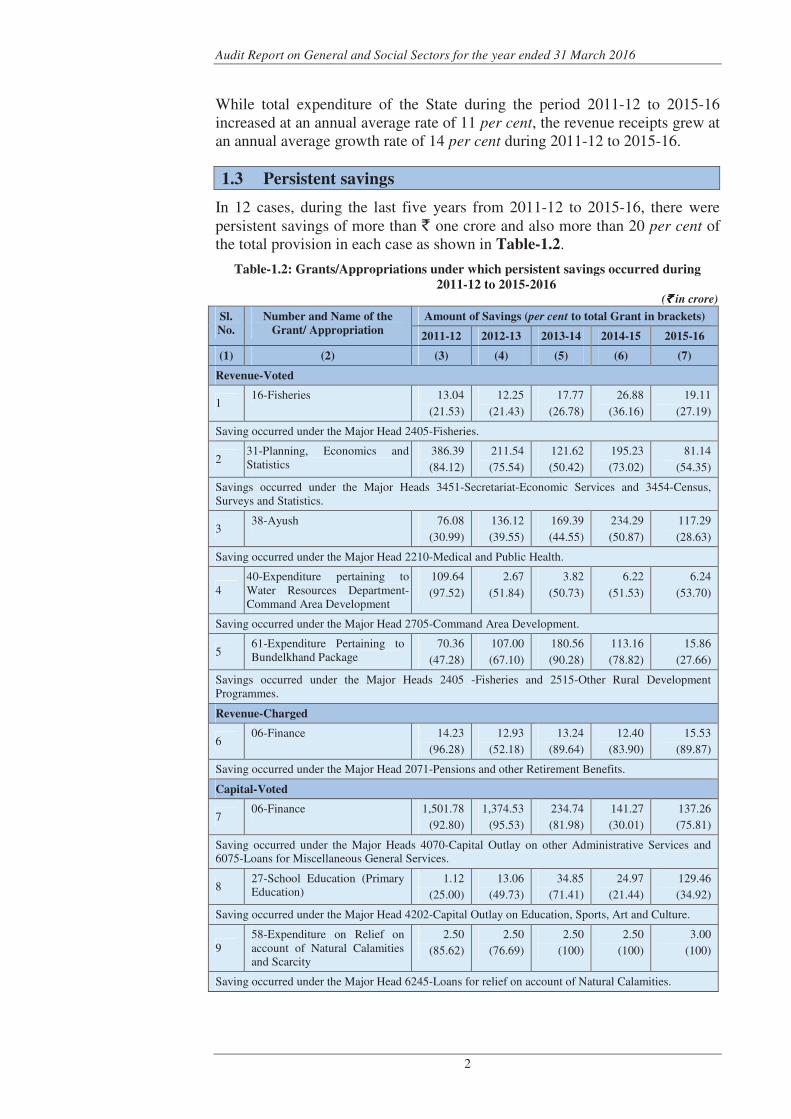
1.3 Persistent savings
In 12 cases, during the last five years from 2011-12 to 2015-16, there were persistent savings of more than ` one crore and also more than 20 per cent of the total provision in each case as shown in Table-1.2.
Table-1.2: Grants/Appropriations under which persistent savings occurred during
2011-12 to 2015-2016 (`̀̀̀ in crore)
Sl.
No.
Number and Name of the
Grant/ Appropriation
Amount of Savings (per cent to total Grant in brackets)
2011-12 2012-13 2013-14 2014-15 2015-16
(1) (2) (3) (4) (5) (6) (7)
Revenue-Voted
1 16-Fisheries 13.04
(21.53)
12.25
(21.43)
17.77
(26.78)
26.88
(36.16)
19.11
(27.19)
Saving occurred under the Major Head 2405-Fisheries.
2 31-Planning, Economics and Statistics
386.39
(84.12)
211.54
(75.54)
121.62
(50.42)
195.23
(73.02)
81.14
(54.35)
Savings occurred under the Major Heads 3451-Secretariat-Economic Services and 3454-Census, Surveys and Statistics.
3 38-Ayush 76.08
(30.99)
136.12
(39.55)
169.39
(44.55)
234.29
(50.87)
117.29
(28.63)
Saving occurred under the Major Head 2210-Medical and Public Health.
4 40-Expenditure pertaining to Water Resources Department-Command Area Development
109.64
(97.52)
2.67
(51.84)
3.82
(50.73)
6.22
(51.53)
6.24
(53.70)
Saving occurred under the Major Head 2705-Command Area Development.
5 61-Expenditure Pertaining to Bundelkhand Package
70.36
(47.28)
107.00
(67.10)
180.56
(90.28)
113.16
(78.82)
15.86
(27.66)
Savings occurred under the Major Heads 2405 -Fisheries and 2515-Other Rural Development Programmes.
Revenue-Charged
6 06-Finance 14.23
(96.28)
12.93
(52.18)
13.24
(89.64)
12.40
(83.90)
15.53
(89.87)
Saving occurred under the Major Head 2071-Pensions and other Retirement Benefits.
Capital-Voted
7 06-Finance 1,501.78
(92.80)
1,374.53
(95.53)
234.74
(81.98)
141.27
(30.01)
137.26
(75.81)
Saving occurred under the Major Heads 4070-Capital Outlay on other Administrative Services and 6075-Loans for Miscellaneous General Services.
8 27-School Education (Primary Education)
1.12
(25.00)
13.06
(49.73)
34.85
(71.41)
24.97
(21.44)
129.46
(34.92)
Saving occurred under the Major Head 4202-Capital Outlay on Education, Sports, Art and Culture.
9 58-Expenditure on Relief on account of Natural Calamities and Scarcity
2.50
(85.62)
2.50
(76.69)
2.50
(100)
2.50
(100)
3.00
(100)
Saving occurred under the Major Head 6245-Loans for relief on account of Natural Calamities.
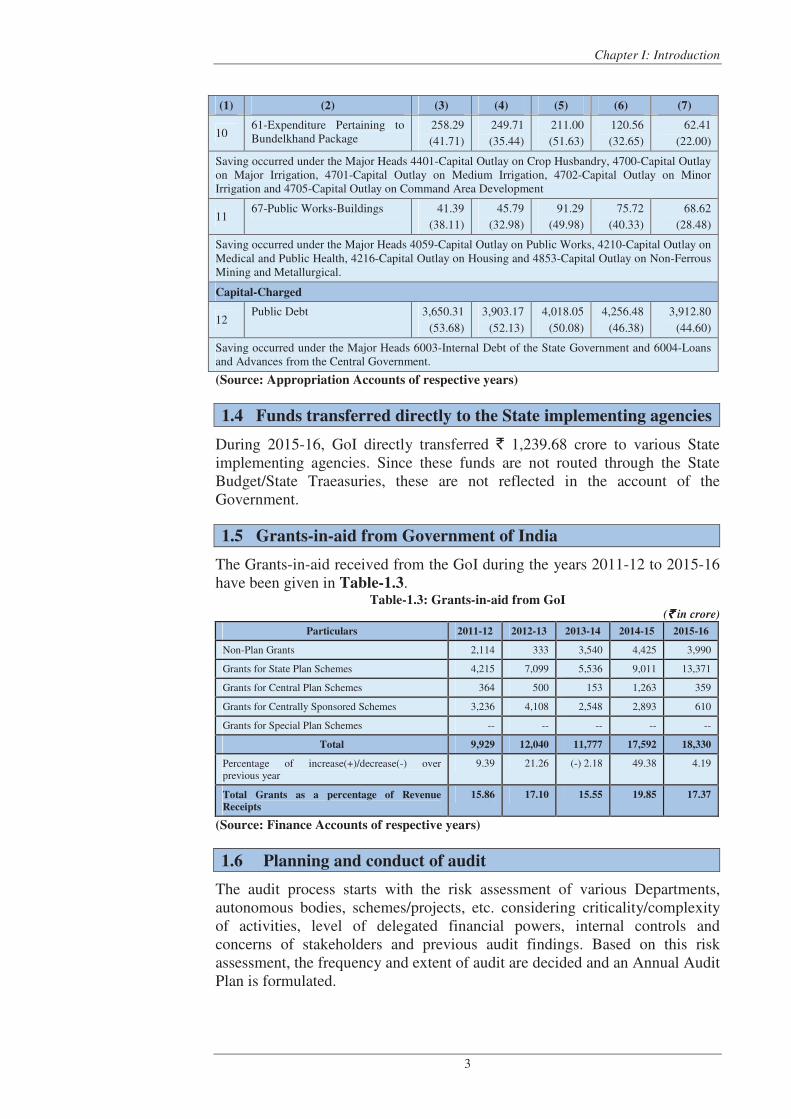
Chapter I: Introduction
3
(1) (2) (3) (4) (5) (6) (7)
10 61-Expenditure Pertaining to Bundelkhand Package
258.29
(41.71)
249.71
(35.44)
211.00
(51.63)
120.56
(32.65)
62.41
(22.00)
Saving occurred under the Major Heads 4401-Capital Outlay on Crop Husbandry, 4700-Capital Outlay on Major Irrigation, 4701-Capital Outlay on Medium Irrigation, 4702-Capital Outlay on Minor Irrigation and 4705-Capital Outlay on Command Area Development
11 67-Public Works-Buildings 41.39
(38.11)
45.79
(32.98)
91.29
(49.98)
75.72
(40.33)
68.62
(28.48)
Saving occurred under the Major Heads 4059-Capital Outlay on Public Works, 4210-Capital Outlay on Medical and Public Health, 4216-Capital Outlay on Housing and 4853-Capital Outlay on Non-Ferrous Mining and Metallurgical.
Capital-Charged
12 Public Debt 3,650.31
(53.68)
3,903.17
(52.13)
4,018.05
(50.08)
4,256.48
(46.38)
3,912.80
(44.60)
Saving occurred under the Major Heads 6003-Internal Debt of the State Government and 6004-Loans and Advances from the Central Government.
(Source: Appropriation Accounts of respective years)
1.4 Funds transferred directly to the State implementing agencies
During 2015-16, GoI directly transferred ` 1,239.68 crore to various State implementing agencies. Since these funds are not routed through the State Budget/State Traeasuries, these are not reflected in the account of the Government.
1.5 Grants-in-aid from Government of India
The Grants-in-aid received from the GoI during the years 2011-12 to 2015-16 have been given in Table-1.3.
Table-1.3: Grants-in-aid from GoI (`̀̀̀ in crore)
Particulars 2011-12 2012-13 2013-14 2014-15 2015-16
Non-Plan Grants 2,114 333 3,540 4,425 3,990
Grants for State Plan Schemes 4,215 7,099 5,536 9,011 13,371
Grants for Central Plan Schemes 364 500 153 1,263 359
Grants for Centrally Sponsored Schemes 3,236 4,108 2,548 2,893 610
Grants for Special Plan Schemes -- -- -- -- --
Total 9,929 12,040 11,777 17,592 18,330
Percentage of increase(+)/decrease(-) over previous year
9.39 21.26 (-) 2.18 49.38 4.19
Total Grants as a percentage of Revenue
Receipts
15.86 17.10 15.55 19.85 17.37
(Source: Finance Accounts of respective years)
1.6 Planning and conduct of audit
The audit process starts with the risk assessment of various Departments, autonomous bodies, schemes/projects, etc. considering criticality/complexity of activities, level of delegated financial powers, internal controls and concerns of stakeholders and previous audit findings. Based on this risk assessment, the frequency and extent of audit are decided and an Annual Audit Plan is formulated.
Audit Report on General and Social Sectors for the year ended 31 March 2016
4
After completion of audit, Inspection Report containing audit findings is issued to the head of the office with request to furnish replies within one month. Whenever replies are received, audit findings are either settled or further action for compliance is advised. The important audit observations pointed out in these Inspection Reports are processed for inclusion in the Audit Reports of the Comptroller and Auditor General of India, which are submitted to the Governor of Madhya Pradesh under Article 151 of the Constitution of India.
During 2015-16, compliance audit of 1019 Drawing and Disbursing Officers of the State and 92 autonomous bodies (excluding Local bodies) were conducted by the office of the Accountant General (General and Social Sector Audit) Madhya Pradesh, Gwalior. Besides, three Performance Audits, three Compliance Audits and one Follow up Audit were also conducted.
1.7 Lack of responsiveness of Government to Inspection Reports
The Accountant General (General and Social Sectors Audit) Madhya Pradesh conducts periodical inspection of Government Departments by test-check of transactions and verify the maintenance of important accounting and other records as per the prescribed rules and procedures. These inspections are followed by issue of Audit Inspection Report (IRs). When important irregularities, etc. detected during audit inspection are not settled on the spot, these IRs are issued to the heads of offices inspected, with a copy to the next higher authorities.
The heads of offices and next higher authorities are required to report their compliance to the Accountant General (AG) within four weeks of receipt of IRs. Serious irregularities are also brought to the notice of the Heads of the Departments by the office of the Accountant General, Madhya Pradesh regularly.
We observed that 7,378 IRs (23,555 paragraphs) in respect of Social Sector Departments and 1,662 IRs (4,619 paragraphs) in respect of General Sector Departments issued up to March 2016 remained pending for settlement as on 30 September 2016. The year-wise position of these outstanding IRs and paragraphs are detailed in Appendix 1.1.
During 2015-16, six meetings of the Departmental Audit Committees were held in which 140 IRs and 893 paragraphs were settled.
It is recommended that the Government may look into the matter to ensure prompt and proper response to audit observations.
1.8 Response of Government to significant audit observations
In the last few years, Audit has reported on several significant deficiencies in implementation of various programmes/activities as well as on the quality of internal controls in selected Departments, which have negative impact on the success of programmes and functioning of the Departments. The focus was on auditing the specific programmes/schemes and to offer suitable recommendations to the executive for taking corrective action and improving service delivery to the citizens.
Chapter I: Introduction
5
As per the provision of Comptroller and Auditor General of India's Regulations on Audit and Accounts, 2007, the Departments are required to send their responses to draft performance audit reports/draft paragraphs proposed for inclusion in the Comptroller and Auditor General of India's Audit Reports within six weeks. It was brought to their notice that in view of likely inclusion of such paragraphs in the Report of the Comptroller and Auditor General of India, to be placed before the State Legislature, it would be desirable to include their comments in the matter. They were also advised to have meeting with the Accountant General to discuss the draft reports of Performance Audits. These draft reports and paragraphs proposed for inclusion in the Report were also forwarded to the Additional Chief Secretaries/Principal Secretaries/Secretaries concerned for seeking their replies. For the present Audit Report, draft reports on seven Performance Audits/Compliance Audits/Follow up Audit and 18 draft paragraphs were forwarded to the concerned Administrative Secretaries. Replies of the Government have been received in all seven Performance Audits/Compliance Audits/Follow up Audit and 13 paragraphs.
1.9 Follow-up on Audit Reports
According to the Rules of procedure for the internal working of the Public Accounts Committee(PAC), the Administrative Departments were to initiate, suomotu action on audit paragraphs and reviews featuring in the Comptroller and Auditor General’s Audit Reports (ARs) regardless of whether these are taken up for examination by the PAC or not. They were also to furnish detailed notes, duly vetted by Audit indicating the remedial action taken or proposed to be taken by them within three months of the presentation of the ARs to the State Legislature.
Out of total 44 paragraphs pertaining to General and Social (Non-PSUs) Sectors in the Audit Reports for the years 2013-14 and 2014-15, departmental replies in respect of 30 paragraphs were not received (December 2016) as detailed in Table-1.4.
Table-1.4: Position regarding receipt of Departmental Replies on the paragraphs
included in the Audit Reports on General and Social (Non-PSUs) Sectors
Year Department(s) Departmental
Replies pending
as of 31
December 2016
Date of
presentation
in the State
Legislature
Due date for
receipt of
Departmental
Replies
(1) (2) (3) (4) (5)
2013-14 Food, Civil supplies and Consumer Protection Department
01 22-07-2015 22-10-2015
Women and Child Development Department, Tribal Development and Scheduled Caste Development Department
01
Women and Child Development Department
01
Urban Development and Environment Department
01
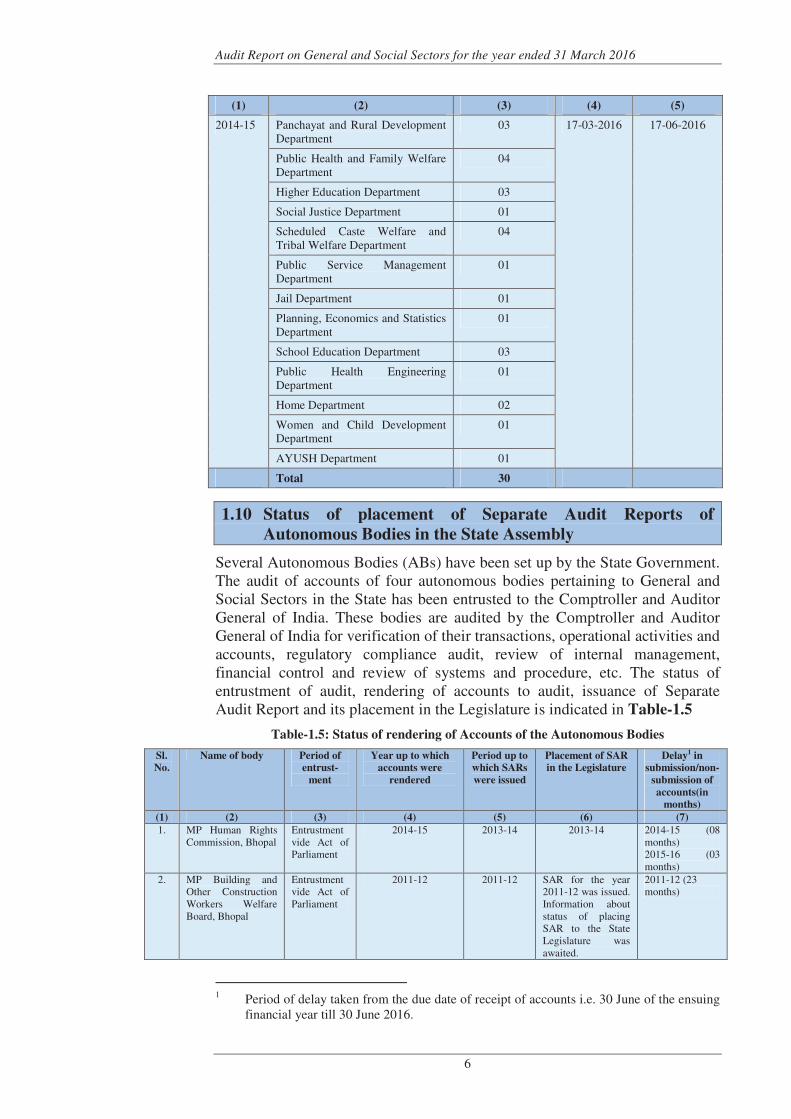
Audit Report on General and Social Sectors for the year ended 31 March 2016
6
(1) (2) (3) (4) (5)
2014-15 Panchayat and Rural Development Department
03 17-03-2016 17-06-2016
Public Health and Family Welfare Department
04
Higher Education Department 03
Social Justice Department 01
Scheduled Caste Welfare and Tribal Welfare Department
04
Public Service Management Department
01
Jail Department 01
Planning, Economics and Statistics Department
01
School Education Department 03
Public Health Engineering Department
01
Home Department 02
Women and Child Development Department
01
AYUSH Department 01
Total 30
1.10 Status of placement of Separate Audit Reports of
Autonomous Bodies in the State Assembly
Several Autonomous Bodies (ABs) have been set up by the State Government. The audit of accounts of four autonomous bodies pertaining to General and Social Sectors in the State has been entrusted to the Comptroller and Auditor General of India. These bodies are audited by the Comptroller and Auditor General of India for verification of their transactions, operational activities and accounts, regulatory compliance audit, review of internal management, financial control and review of systems and procedure, etc. The status of entrustment of audit, rendering of accounts to audit, issuance of Separate Audit Report and its placement in the Legislature is indicated in Table-1.5
Table-1.5: Status of rendering of Accounts of the Autonomous Bodies
Sl.
No.
Name of body Period of
entrust-
ment
Year up to which
accounts were
rendered
Period up to
which SARs
were issued
Placement of SAR
in the Legislature
Delay1 in
submission/non-
submission of
accounts(in
months)
(1) (2) (3) (4) (5) (6) (7)
1. MP Human Rights Commission, Bhopal
Entrustment vide Act of Parliament
2014-15 2013-14 2013-14 2014-15 (08 months) 2015-16 (03 months)
2. MP Building and Other Construction Workers Welfare Board, Bhopal
Entrustment vide Act of Parliament
2011-12 2011-12 SAR for the year 2011-12 was issued. Information about status of placing SAR to the State Legislature was awaited.
2011-12 (23 months)
1 Period of delay taken from the due date of receipt of accounts i.e. 30 June of the ensuing
financial year till 30 June 2016.
Chapter I: Introduction
7
(1) (2) (3) (4) (5) (6) (7)
3. MP State Legal Services Authority, Jabalpur
Entrustment vide Act of Parliament
2012-13 -
-
1997-98 (205 months) to 2012-13 (25 months)
4. MP Housing and Infrastructure Development Board, Bhopal
2012-13 to 2016-17
2015-16 2014-15 25.07.2016 2014-15 (04 months)
As seen from the Table 1.5, there were significant delays of up to 205 months in submission of accounts by MPSLSA and accounts for the year 1997-98 to 2012-13 were received from the entity in August 2015.
Inordinate delays in submission of accounts and presentation of the SARs to the State Legislature resulted in delays in scrutiny of the functioning of these bodies, where Government investments are made, beside delays in initiating necessary remedial action on financial irregularities in the ABs.


Chapter II: Performance Audit
PUBLIC HEALTH AND FAMILY WELFARE DEPARTMENT
2.1 Performance Audit on National Rural Health Mission
Executive Summary
Introduction
National Rural Health Mission (NRHM) was launched on 12 April 2005 to provide accessible, affordable and quality health care to the rural population, especially the vulnerable sections. It aimed to reduce infant mortality, maternal mortality and total fertility rates and prevent and reduce mortality and morbidity from communicable and non-communicable diseases. In this process, NRHM was expected to help achieve goals set under the Millennium Development Goals (MDG) 2015 of reducing Infant Mortality Rate (IMR) to 27/1,000 live births and Maternal Mortality Rate (MMR) to 109/1,00,000 live births.
The resource for the programme was shared between Centre and State Governments. During the years 2011-12 to 2015-16, ` 5,588.76 crore was incurred against approved outlay of ` 6,247.01 crore for Reproductive and Child Health (RCH), immunisation programme and Mission flexi pool. A Performance Audit to assess the impact of NRHM on improving Reproductive and Child Health in the State for the period 2011-12 to 2015-16 revealed the following:
Achievement of NRHM in attaining demographic goals
• State could not attain the goals for IMR, MMR and Total Fertility Rate (TFR) and it was lagging far behind the achievements of other States. The IMR of the State was 51 per 1,000 live births as against the target of 27 per 1,000 live births under MDG. Madhya Pradesh stands at 27th place out of 28 States in IMR. Similarly, the State could reduce MMR to 221 per 1,00,000 live births against the MDG target of 109 per 1,00,000 live births. In MMR, the State was at 13th place out of 18 States.
• The status of TFR improved since 2012, as it reduced from 2.9 (March 2012) to 2.3 (March 2016). However, State could not achieve the target fixed under NRHM Framework of Implementation (2012-17) to reduce TFR to 2.1. The shortfalls in providing maternal, child and reproductive health care services resulted in failure of State in achieving targets for IMR, MMR and TFR.
(Paragraph 2.1.6)
Status of Maternal, Child and Reproductive Health Care Services
• Out of 93.72 lakh pregnant women registered for Antenatal Care (ANC) during 2011-16, only 52.51 lakh (56 per cent) could be registered within 1st trimester of pregnancies and 19.44 lakh (21 per cent) could not
Audit Report on General and Social Sectors for the year ended 31 March 2016
10
receive three ANC check-ups. Human Immuno-deficiency Virus (HIV) testing of 47.27 lakh and Venereal Disease Research Laboratory (VDRL) testing of 60.34 lakh pregnant women were not conducted.
(Paragraph 2.1.7.1)
• Institutional delivery was 87 per cent of the total deliveries in the State during 2011-16. Forty-eight hours stay at health centres was to be promoted in view of more likelihood of obstetric complications and maternal deaths during delivery and within 48 hours after child birth. However, 28 per
cent women were discharged within 48 hours of delivery in public institutions. Further, only 35.21 lakh (55 per cent) mothers received postpartum check-up between 48 hours to 14 days after delivery due to apathetic attitude of service providers (Staff Nurse and Auxiliary Nurse Mid-Wife (ANMs)) and lack of referral transports.
(Paragraph 2.1.7.2)
• There was large difference of 23.89 lakh between total ANC registered (93.72 lakh) and total delivery (69.83 lakh) during 2011-16. The case of missing delivery may have impact on skewed sex ratio of 52:48 at birth.
(Paragraph 2.1.7.4)
• Targets set for child immunization against seven vaccine preventable disease could not be achieved during 2011-16 and the range of shortfall was 16 to 21 per cent. Besides a dose ‘Hepatitis B Zero’ was to be provided up to 48 hours of birth. However, Out of 69.25 lakh live births, only 39.30 lakh (57 per cent) infants were provided ‘Hepatitis B Zero’ due to unavailability of storage facility of vaccine at health centres, besides failure to provide the dose in case of home deliveries.
(Paragraph 2.1.8.2)
• Eight per cent maternal deaths in India are attributed to unsafe abortions. However, Medical Termination of Pregnancy (MTP) services were not provided in 25 sub-district level Hospital (out of 63), 136 Community Health Centres (CHCs) (out of 334) and 380 (out of 531) 24x7 Primary Health Centres (PHCs).
(Paragraph 2.1.9.1)
• TFR could not be reduced due to low performance in family planning programme. Against 3.03 lakh vasectomy planned during the year 2011-16, only 0.83 lakh (27 per cent) male sterilization could be performed. The achievement of female sterilization was 43 and 22 per cent against planned for minilap and post-partum sterilization respectively. There was shortfall of 42 per cent and 49 per cent in distribution of contraceptive oral pills and condoms, respectively.
(Paragraph 2.1.9.2)
Planning and Budgeting
• District Health Action Plans (DHAPs) were not prepared after aggregating Block Health Action Plans (BHAPs). Inter-sectoral convergence
Chapter II: Performance Audit
11
with the line departments was not included in annual Programme Implementation Plan (PIP) and DHAPs. Further, State PIPs were submitted to GoI with a delay ranging from 69 to 196 days during 2011-12 to 2015-16. Consequently, the approval of PIPs from GoI was received with a delay ranging from 72 to 223 days.
(Paragraphs 2.1.10.1, 2.1.10.2 and 2.1.10.3)
• During the year 2011-16, GoI approved PIP for ` 6,247.01 crore against which only ` 5,269.70 crore was made available for implementation of NRHM in the State. Thus, Government could not ensure sufficient fund for implementation of the scheme, despite the dismal performance of State on health indicators.
(Paragraph 2.1.10.4)
Shortage of Rural Health Centres
• The State had failed critically in creating sufficient rural health centres. There was shortfall of 2588 Sub-Centres (SCs) (22 per cent), 828 PHCs (41 per cent) and 153 CHCs (31 per cent) as against the population norms under NRHM. Out of total 9,192 SCs in the State, only 241 were providing delivery services. Upgradation of PHCs as 24x7 was one of the goals of NRHM. However, only 638 out of 1,172 PHCs were functioning 24x7. First Referral Unit (FRU) services were being provided at only 30 out of 334 CHCs in the State. Audit noticed lack of infrastructure in terms of wards, labour rooms, operation theatres, electric supply and toilets, etc.
(Paragraph 2.1.11)
• Shortage of Health Care Professionals
Out of 1,172 PHCs in the State, 503 PHCs were functioning without doctors as of April 2016. Further, Laboratory Technician and Pharmacist were not posted in 525 and 312 PHCs respectively. In 96 CHCs of sampled districts, only 13 specialists were available against sanctioned 346 specialists. Further, 58,730 Accredited Social Health Activists (ASHAs) were engaged in the State as of April 2016 against the requirement of 62,206 ASHAs.
(Paragraph 2.1.12)
• Availability of essential drugs and laboratory services
Under Madhya Pradesh Swasthya Seva Guarantee Yojana, Government was committed to provide minimum essential drugs and laboratory services for all types of health facility centres. However, none of the test-checked health facilities had all the listed drugs and laboratory services categorised under Madhya Pradesh Swasthya Seva Guarantee Yojana.
(Paragraphs 2.1.13 and 2.1.15)
Quality Assurance
• State quality assurance committee and district quality assurance committees did not meet at prescribed intervals. Patient satisfaction survey
Audit Report on General and Social Sectors for the year ended 31 March 2016
12
was not conducted in 10 out of 13 test checked District Hospitals (DHs). Quality assurance programme was not implemented at CHC and PHC levels.
(Paragraph 2.1.18)
Data collection, management and reporting
• There were gaps in capturing of data related to ANC, child care and immunization services provided in private health institutions. Further, entire data of delivery of pregnant women conducted in private health institutions and at home were also not reflected in Health Management Information System (HMIS).
(Paragraph 2.1.20)
2.1.1 Introduction
2.1.1.1 Background
National Rural Health Mission (NRHM) was launched by Government of India in April 2005 to provide accessible, affordable and quality health care to the rural population. A special focus was on 18 States, including Madhya Pradesh, having weak public health indicators and/or weak infrastructure. It aimed to reduce infant mortality, maternal mortality and total fertility rate1 (TFR) for population stabilisation, and prevent and reduce mortality and morbidity from communicable and non-communicable diseases. The expected outcomes of implementation of NRHM were as detailed in Appendix-2.1.1. In this process, NRHM was expected to help achieve goals set under the Millennium Development Goals 2015 of reducing Infant Mortality Rate (IMR) to 27/1,000 live births and Maternal Mortality Rate (MMR) to 109/1,00,000 live births.
2.1.1.2 Organisational structure
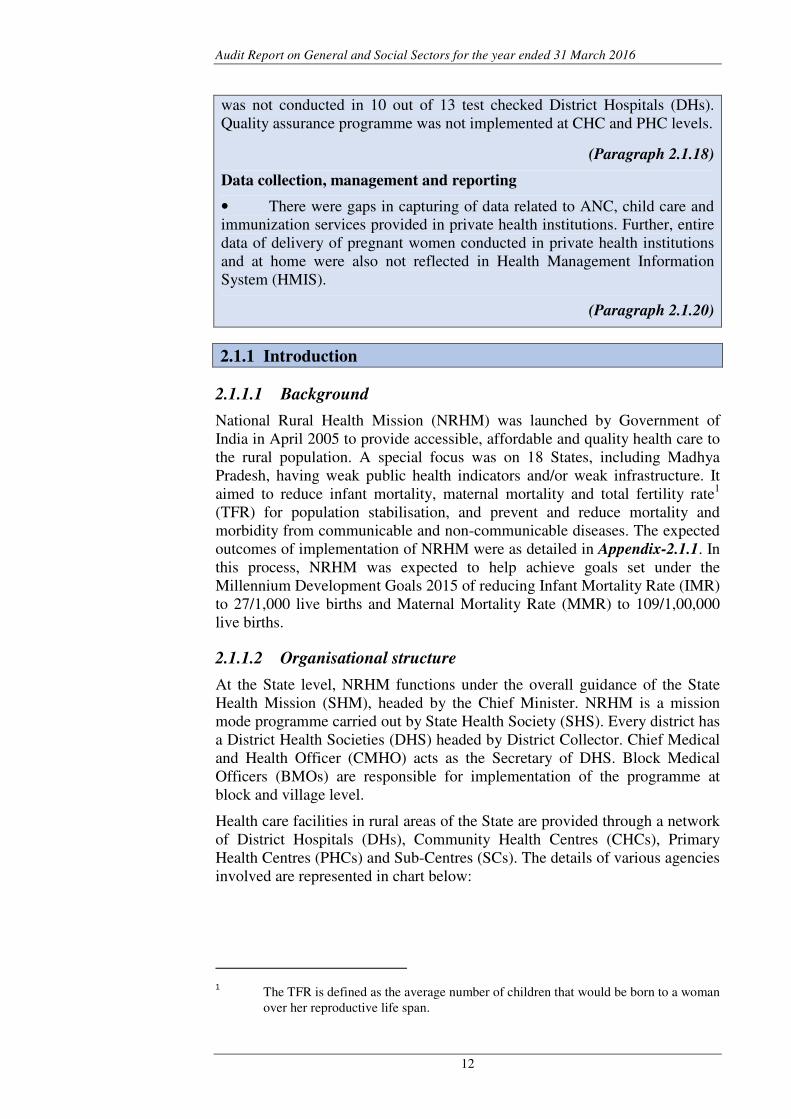
At the State level, NRHM functions under the overall guidance of the State Health Mission (SHM), headed by the Chief Minister. NRHM is a mission mode programme carried out by State Health Society (SHS). Every district has a District Health Societies (DHS) headed by District Collector. Chief Medical and Health Officer (CMHO) acts as the Secretary of DHS. Block Medical Officers (BMOs) are responsible for implementation of the programme at block and village level.
Health care facilities in rural areas of the State are provided through a network of District Hospitals (DHs), Community Health Centres (CHCs), Primary Health Centres (PHCs) and Sub-Centres (SCs). The details of various agencies involved are represented in chart below:
1 The TFR is defined as the average number of children that would be born to a woman
over her reproductive life span.
Chapter II: Performance Audit
13
Chart 2.1.1: Various agencies involved in providing rural health care facilities
* Auxiliary Nurse Mid-wife (ANM) is a female health worker posted at Sub-Centre
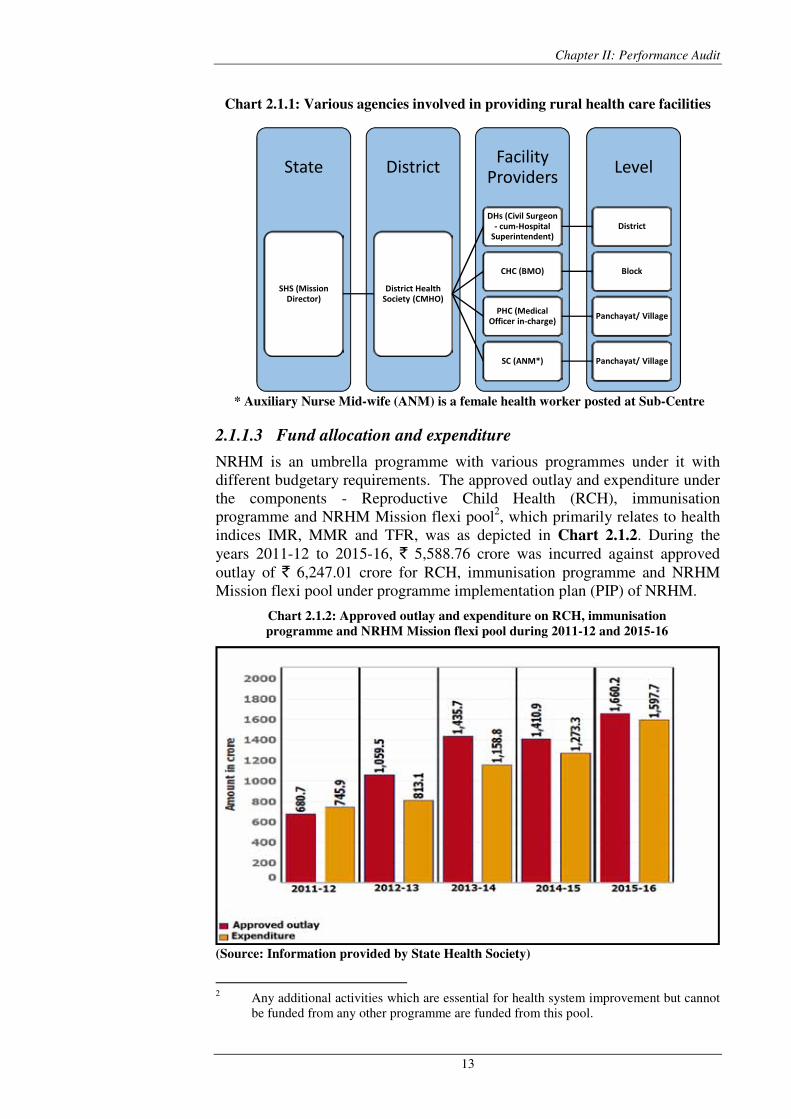
2.1.1.3 Fund allocation and expenditure
NRHM is an umbrella programme with various programmes under it with different budgetary requirements. The approved outlay and expenditure under the components - Reproductive Child Health (RCH), immunisation programme and NRHM Mission flexi pool2, which primarily relates to health indices IMR, MMR and TFR, was as depicted in Chart 2.1.2. During the years 2011-12 to 2015-16, ` 5,588.76 crore was incurred against approved outlay of ` 6,247.01 crore for RCH, immunisation programme and NRHM Mission flexi pool under programme implementation plan (PIP) of NRHM.
Chart 2.1.2: Approved outlay and expenditure on RCH, immunisation
programme and NRHM Mission flexi pool during 2011-12 and 2015-16
(Source: Information provided by State Health Society)
2 Any additional activities which are essential for health system improvement but cannot
be funded from any other programme are funded from this pool.
Level Facility
Providers District State
SHS (Mission Director)
District Health Society (CMHO)
DHs (Civil Surgeon - cum-Hospital
Superintendent) District
CHC (BMO) Block
PHC (Medical Officer in-charge)
Panchayat/ Village
SC (ANM*) Panchayat/ Village
Audit Report on General and Social Sectors for the year ended 31 March 2016
14
2.1.2 Audit objectives
The audit objectives of the performance audit were to:
• assess the impact of NRHM on improving Reproductive and Child Health in the State by test check of the:
� extent of availability of physical infrastructure;
� extent of availability of health care professionals; and,
� quality of health care provided
• assess the mechanism of data collection, management and reporting which serves as indicators of performance.
2.1.3 Scope and methodology of the Performance Audit
The performance audit was conducted during March 2016 to July 2016 covering the period from 2011-12 to 2015-16. Since NRHM has an intense rural orientation, 43 districts (with predominantly rural population) out of 51 districts of the State were stratified into three categories, viz., low, medium and high performing based on their ranking on a Health Index3. Four low performing districts (Anuppur, Dhar, Dindori and Tikamgarh), five medium performing districts (Betul, Khandwa, Mandla, Panna and Ratlam) and four high performing districts (Khargone, Neemuch, Raisen and Rajgarh) were selected for the performance audit using simple random sampling without replacement (SRSWOR) method.
Within these sampled 13 districts, 27 CHCs, 52 PHCs and 149 SCs were selected (Appendix-2.1.2) by SRSWOR method. The records of State Health Society, District Health Societies and District Hospitals of sampled districts and sampled CHCs/PHCs/SCs were scrutinised. The response to a questionnaire from 1,386 Janani Suraksha Yojana beneficiaries and 416 Accredited Social Health Activists4 (ASHAs) of the sampled SCs were also collected.
An entry conference was held on 11 March 2016 to discuss the audit objectives and methodologies with the Commissioner Health, Public Health and Family Welfare Department. The draft report of the performance audit was issued to State Government in August 2016. The reply of the Government was received in October 2016. The audit findings were also discussed in an exit conference held with the Principal Secretary, Public Health and Family Welfare Department on 14 October 2016. The replies of State Government and views expressed during the exit conference have been suitably incorporated in the report.
3 Stratification of districts was based on four health indices – infrastructure, health
personnel, health services and data reporting.
4 ASHAs are interface between the community and the public health system
to promote health care at household level, who works on incentive basis.
Chapter II: Performance Audit
15
2.1.4 Audit criteria
The following are the sources of audit criteria:
• NRHM Framework for Implementation (2005-12 and 2012-17);
• NRHM Operational Guidelines for Financial Management;
• Indian Public Health Standards (IPHS) – Guidelines (Revised 2012);
• Operational guidelines for Quality Assurance in public health facilities 2013.
2.1.5 Previous audit findings on implementation of the scheme
Performance audit of NRHM for the period 2005-06 to 2008-09 was conducted earlier between April to November 2009 and the audit findings were reported to State Legislature (July 2010) in Audit Report (Civil) for the year ended 31 March 2009. Major shortcomings and the replies submitted by the Government to the Public Account Committee (PAC) are given in Table 2.1.1:
Table 2.1.1: Major shortcomings pointed out in previous Audit Report and
replies submitted by the Government to the PAC
Sl.
No.
Shortcomings pointed out in
previous audit report
Government’s reply to PAC
(1) (2) (3)
1. Shortage of rural health centres Due to limited financial resources, the required health centres could not be established. However, the status had been improved and the Government was committed to establish new health centres.
2. Delays in construction of CHC/PHC/SC buildings
The incomplete works had been completed and the possession of completed buildings had been taken over.
3. CHC and PHC declared as 24x7 and FRUs were not functional.
The situation had been improved with reference to 24x7 health centres and FRUs.
4. Shortage of basic infrastructure and health facilities in test checked CHCs and PHCs.
Required services could not be provided due to shortage of Medical Officers and Staff Nurse. However, laboratory and Operation Theatre services had been established in all the CHCs and blood storage units were also established in 53 CHCs.
5. Huge shortage of medical and para-medical staff
Even after constant efforts to fill the posts of specialists and medical officers, the required manpower could not be filled. However, there was increase in availability of manpower during the last five to six years.
6. Alarmingly high post-delivery mortality
Reasons of MMR were being flagged out and necessary steps were being taken at State and district level.
Audit Report on General and Social Sectors for the year ended 31 March 2016
16
(1) (2) (3)
7. Failure to achieve targets for IMR and immunisation of vaccine preventable diseases
Due to combined efforts and rigorous monitoring Polio has been eradicated in the State. Further, complete immunisation of infants was included in the Health Guarantee Scheme in the State.
8. Monitoring committees were not functional
The quality assurance committees have been formed at district and block level.
Performance Audit of NRHM for the period 2011-12 to 2015-16 revealed that most of the deficiencies as pointed out in earlier CAG’s Audit Report were still persisting, as discussed in succeeding paragraphs.
Audit findings
2.1.6 Attainment of demographic goals
Improving maternal and child health and their survival are central to the achievement of national health goals. Poor maternal health results in low birth weight and delivery of pre-mature babies. NRHM aimed to reduce infant mortality rate (IMR), maternal mortality rate (MMR) and total fertility rate (TFR). In this process, NRHM was expected to help achieve related goals set under the Millennium Development Goals (MDG) 2015. The status of attainment of these performance indicators was as indicated in Table 2.1.2.
Table 2.1.2: Status of target and achievement of IMR, MMR and TFR
Performance
Indicators
NRHM Framework of
Implementation
(2005-12)
NRHM Framework of
Implementation
(2012-17)
Millennium Development
Goals (2015)
Target Achievement
by 2012
Target Status at
the end of
March 2016
Target Achievement at
the end of
March 2016
IMR (Infant Mortality Rate)
30 per 1,000 live births
56 25 per 1,000 live births
51 27 per 1,000 live births
51
MMR (Maternal Mortality Rate)
100 per 1,00,000 live births
230 100 per 1,00,000 live births
221 109 per 1,00,000 live births
221
TFR (Total Fertility Rate)
Reduce to 2.1
2.9 Reduce to 2.1
2.3 No target for TFR were fixed under MDG.
(Source: State Health Society)
The status of IMR, MMR and TFR was improved since the year 2012. However, the performance of State was still not close to the targets fixed for these performance indicators under NRHM frameworks for implementation and MDG. Further, rural areas had higher IMR (54) and TFR (2.5) in the year 2016 as compared to State average of IMR (51) and TFR (2.3).
State could not
attain the goals for
IMR, MMR and
TFR due to scheme
implementation
weaknesses.
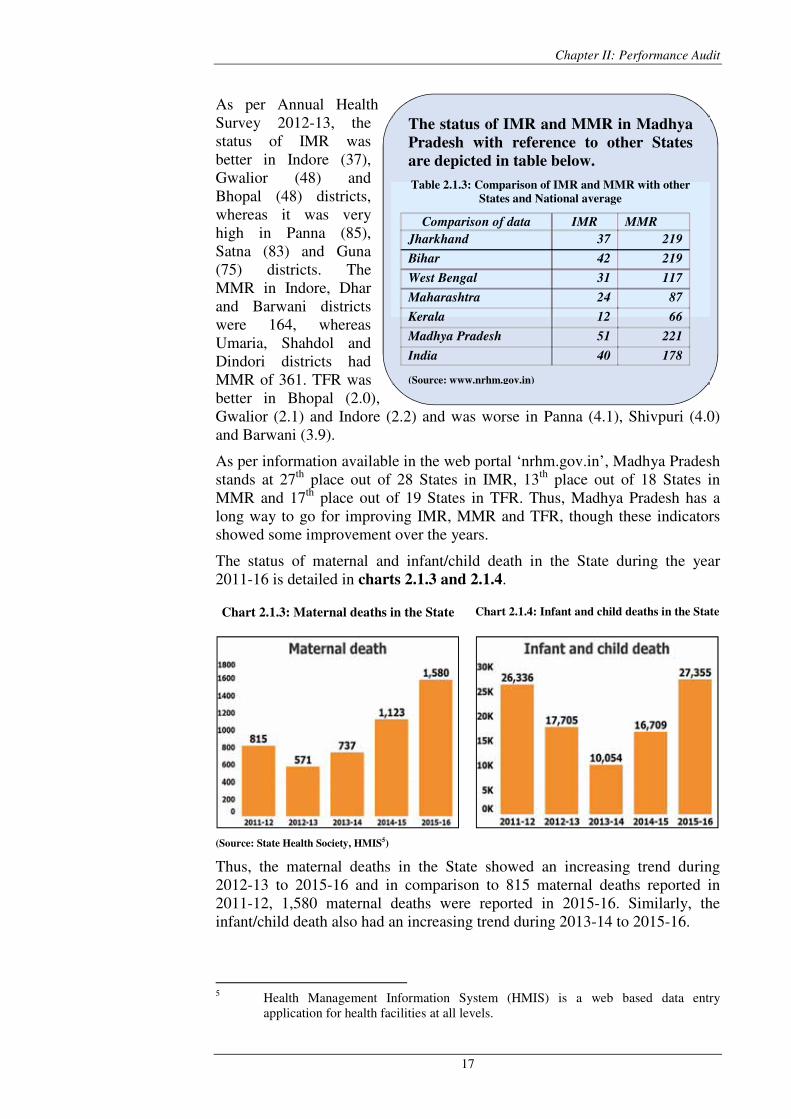
Chapter II: Performance Audit
17
The status of IMR and MMR in Madhya
Pradesh with reference to other States
are depicted in table below.
Table 2.1.3: Comparison of IMR and MMR with other
States and National average
Comparison of data IMR MMR
Jharkhand 37 219
Bihar 42 219
West Bengal 31 117
Maharashtra 24 87
Kerala 12 66
Madhya Pradesh 51 221
India 40 178
(Source: www.nrhm.gov.in)
As per Annual Health Survey 2012-13, the status of IMR was better in Indore (37), Gwalior (48) and Bhopal (48) districts, whereas it was very high in Panna (85), Satna (83) and Guna (75) districts. The MMR in Indore, Dhar and Barwani districts were 164, whereas Umaria, Shahdol and Dindori districts had MMR of 361. TFR was better in Bhopal (2.0), Gwalior (2.1) and Indore (2.2) and was worse in Panna (4.1), Shivpuri (4.0) and Barwani (3.9).
As per information available in the web portal ‘nrhm.gov.in’, Madhya Pradesh stands at 27th place out of 28 States in IMR, 13th place out of 18 States in MMR and 17th place out of 19 States in TFR. Thus, Madhya Pradesh has a long way to go for improving IMR, MMR and TFR, though these indicators showed some improvement over the years.
The status of maternal and infant/child death in the State during the year 2011-16 is detailed in charts 2.1.3 and 2.1.4.
Chart 2.1.3: Maternal deaths in the State Chart 2.1.4: Infant and child deaths in the State
(Source: State Health Society, HMIS5)
Thus, the maternal deaths in the State showed an increasing trend during 2012-13 to 2015-16 and in comparison to 815 maternal deaths reported in 2011-12, 1,580 maternal deaths were reported in 2015-16. Similarly, the infant/child death also had an increasing trend during 2013-14 to 2015-16.
5 Health Management Information System (HMIS) is a web based data entry
application for health facilities at all levels.
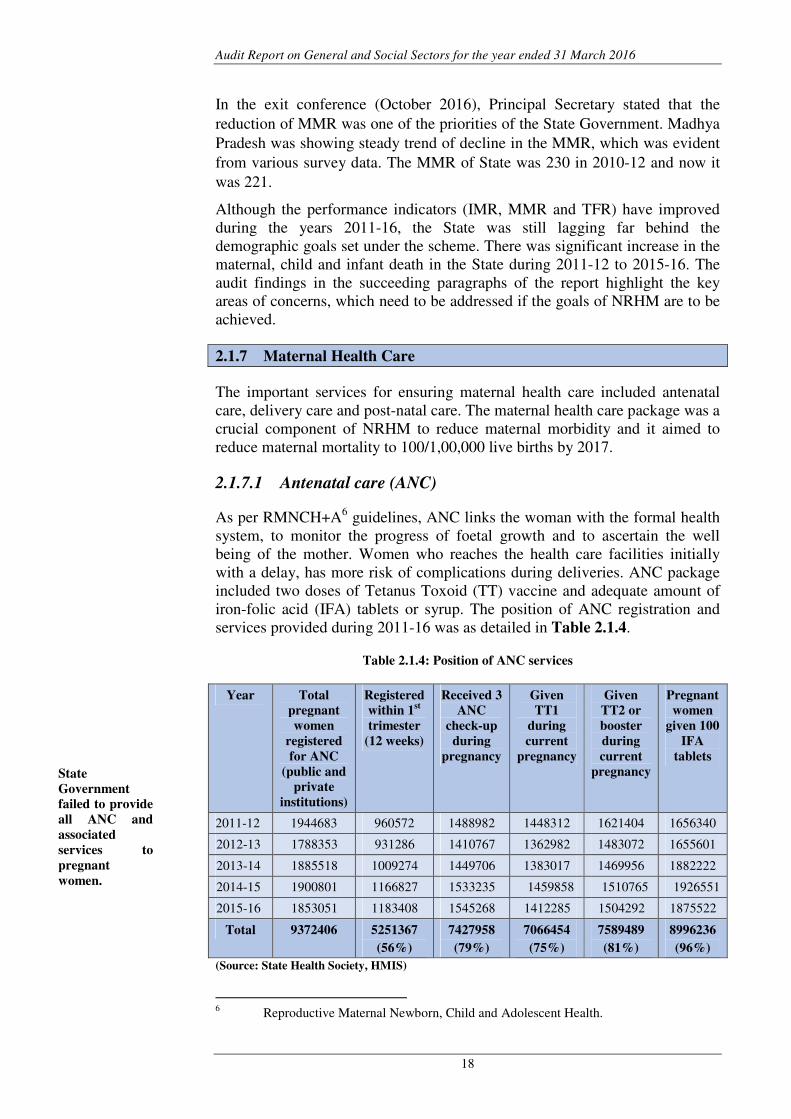
Audit Report on General and Social Sectors for the year ended 31 March 2016
18
In the exit conference (October 2016), Principal Secretary stated that the reduction of MMR was one of the priorities of the State Government. Madhya Pradesh was showing steady trend of decline in the MMR, which was evident from various survey data. The MMR of State was 230 in 2010-12 and now it was 221.
Although the performance indicators (IMR, MMR and TFR) have improved during the years 2011-16, the State was still lagging far behind the demographic goals set under the scheme. There was significant increase in the maternal, child and infant death in the State during 2011-12 to 2015-16. The audit findings in the succeeding paragraphs of the report highlight the key areas of concerns, which need to be addressed if the goals of NRHM are to be achieved.
2.1.7 Maternal Health Care
The important services for ensuring maternal health care included antenatal care, delivery care and post-natal care. The maternal health care package was a crucial component of NRHM to reduce maternal morbidity and it aimed to reduce maternal mortality to 100/1,00,000 live births by 2017.
2.1.7.1 Antenatal care (ANC)
As per RMNCH+A6 guidelines, ANC links the woman with the formal health system, to monitor the progress of foetal growth and to ascertain the well being of the mother. Women who reaches the health care facilities initially with a delay, has more risk of complications during deliveries. ANC package included two doses of Tetanus Toxoid (TT) vaccine and adequate amount of iron-folic acid (IFA) tablets or syrup. The position of ANC registration and services provided during 2011-16 was as detailed in Table 2.1.4.
Table 2.1.4: Position of ANC services
Year Total
pregnant
women
registered
for ANC
(public and
private
institutions)
Registered
within 1st
trimester
(12 weeks)
Received 3
ANC
check-up
during
pregnancy
Given
TT1
during
current
pregnancy
Given
TT2 or
booster
during
current
pregnancy
Pregnant
women
given 100
IFA
tablets
2011-12 1944683 960572 1488982 1448312 1621404 1656340
2012-13 1788353 931286 1410767 1362982 1483072 1655601
2013-14 1885518 1009274 1449706 1383017 1469956 1882222
2014-15 1900801 1166827 1533235 1459858 1510765 1926551
2015-16 1853051 1183408 1545268 1412285 1504292 1875522
Total 9372406 5251367
(56%)
7427958
(79%)
7066454
(75%)
7589489
(81%)
8996236
(96%)
(Source: State Health Society, HMIS)
6 Reproductive Maternal Newborn, Child and Adolescent Health.
State
Government
failed to provide
all ANC and
associated
services to
pregnant
women.
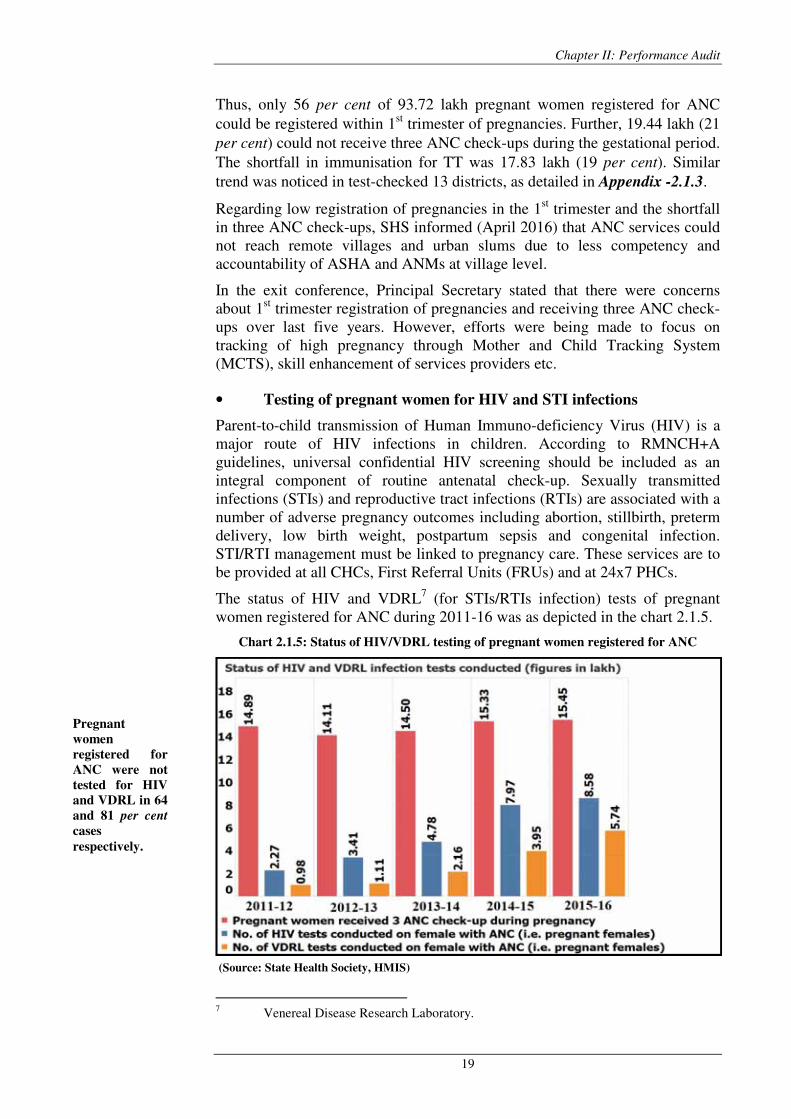
Chapter II: Performance Audit
19
Thus, only 56 per cent of 93.72 lakh pregnant women registered for ANC could be registered within 1st trimester of pregnancies. Further, 19.44 lakh (21 per cent) could not receive three ANC check-ups during the gestational period. The shortfall in immunisation for TT was 17.83 lakh (19 per cent). Similar trend was noticed in test-checked 13 districts, as detailed in Appendix -2.1.3.
Regarding low registration of pregnancies in the 1st trimester and the shortfall in three ANC check-ups, SHS informed (April 2016) that ANC services could not reach remote villages and urban slums due to less competency and accountability of ASHA and ANMs at village level.
In the exit conference, Principal Secretary stated that there were concerns about 1st trimester registration of pregnancies and receiving three ANC check-ups over last five years. However, efforts were being made to focus on tracking of high pregnancy through Mother and Child Tracking System (MCTS), skill enhancement of services providers etc.
• Testing of pregnant women for HIV and STI infections
Parent-to-child transmission of Human Immuno-deficiency Virus (HIV) is a major route of HIV infections in children. According to RMNCH+A guidelines, universal confidential HIV screening should be included as an integral component of routine antenatal check-up. Sexually transmitted infections (STIs) and reproductive tract infections (RTIs) are associated with a number of adverse pregnancy outcomes including abortion, stillbirth, preterm delivery, low birth weight, postpartum sepsis and congenital infection. STI/RTI management must be linked to pregnancy care. These services are to be provided at all CHCs, First Referral Units (FRUs) and at 24x7 PHCs.
The status of HIV and VDRL7 (for STIs/RTIs infection) tests of pregnant women registered for ANC during 2011-16 was as depicted in the chart 2.1.5.
Chart 2.1.5: Status of HIV/VDRL testing of pregnant women registered for ANC
(Source: State Health Society, HMIS)
7 Venereal Disease Research Laboratory.
Pregnant
women
registered for
ANC were not
tested for HIV
and VDRL in 64
and 81 per cent
cases
respectively.
Audit Report on General and Social Sectors for the year ended 31 March 2016
20
Thus, out of total 74.28 lakh pregnant women received three ANC check-ups, HIV testing of 47.27 lakh (64 per cent) women and VDRL testing of 60.34 lakh (81 per cent) pregnant women were not conducted for management of adverse pregnancy outcomes in case of infected mothers.
Further, there was discrepancy in the figures related to HIV tests conducted. The services of HIV testing were provided in Integrated Counselling and Testing Centres situated at DH and CHC level under National AIDS Control Programme. As reported by Madhya Pradesh State AIDS Control Society (MPSACS), 16.69 lakh pregnant women were tested for HIV during 2011-12 to 2014-15. However, the report of HMIS furnished by SHS indicated HIV tests of 18.43 lakh during the same period. Thus, there was excess reporting of achievement of HIV test in HMIS.
In the exit conference, Principal Secretary stated that HIV/Syphilis testing of ANCs increased exponentially. However, the gap was still big. To overcome the gaps, process for rate contract of ‘point of care rapid testing kit’ was in progress, so that testing services might be provided to the health institutes where laboratory technicians were unavailable.
Thus, antenatal care under NRHM suffered due to low registration in the first trimester, huge shortfalls in providing three ANC check-ups and immunisation for TT during gestational period and testing of significantly less number of pregnant women for HIV and STI, which increased the risk of delivery complications.
2.1.7.2 Delivery Care
Janani Suraksha Yojana (JSY), a centrally sponsored scheme, is a safe motherhood intervention under NRHM. The scheme was launched in April 2005 with the objective of reducing maternal and infant mortality by promoting institutional delivery among pregnant women. The status of institutional and home deliveries during 2011-12 to 2015-16 under NRHM was as detailed in Appendix-2.1.4, which revealed the following:
• Shortfall in institutional delivery: Out of 69.83 lakh total deliveries in the State during 2011-16, 60.87 lakh (87 per cent) were institutional deliveries, comprising of 55.38 lakh deliveries in public institutions and 5.49 lakh deliveries in private institutions. The number of home deliveries in the State reduced from 2.07 lakh during 2011-12 to 1.43 lakh during 2015-16. However, the objective of promoting institutional delivery suffered due to failure of local health workers (ASHAs and ANMs) to motivate pregnant women to give birth in a health facility and lack of referral transport on time.
• Shortfall in providing JSY incentive: Under JSY, pregnant women were entitled for cash assistance (` 1,400 in rural and ` 1,000 in urban areas) for giving birth in a government institution through e-transfer to their bank accounts. However, out of total 55.38 lakh deliveries in public institutions in the State, JSY incentive was paid to only 49.72 lakh beneficiaries. The shortfall in providing JSY incentive was attributed to unavailability of bank accounts of beneficiaries and paucity of funds.
• Home based deliveries not attended by trained health professional: In case of women residing in hard to reach areas or not interested to deliver at
Chapter II: Performance Audit
21
health centres, home based deliveries under hygienic conditions and under the supervision of Skilled Birth Attendant (SBA) trained health professionals (ANMs/Nurse) was to be provided in order to reduce maternal and infant mortality. However, out of 8.96 lakh home deliveries in the State during the period 2011-16, 6.65 lakh (74 per cent) were not attended by SBA trained health professionals and 3.16 lakh (35 per cent) newborns were not visited by health professionals within 24 hours of delivery. Thus, the safe and hygienic condition for home deliveries was not ensured.
• Deficient postpartum care: As obstetric complications and maternal deaths occur during delivery and in 48 hours after child birth, 48-hour stay at the health facility was to be promoted in cases of institutional delivery. However, out of 55.38 lakh deliveries in public institutions during 2011-16, 15.26 lakh (28 per cent) mothers were discharged within 48 hours of delivery. Further, the postpartum visits were to be made by health care workers, irrespective of the place of delivery. However, only 35.21 lakh (55 per cent) mothers received postpartum check-up between 48 hours to 14 days after delivery.
In the exit conference, Principal Secretary stated that Janani Suraksha Yojana and Janani evam Shishu Swasthya Karyakram (JSSK) were implemented for promoting institutional deliveries and ensuring safe delivery at home. The districts with high home delivery were identified and SCs with high home deliveries were being developed as delivery point. For ensuring 48 hours stay in hospital after delivery, cleanliness and security was being ensured, along with free drugs, diet, diagnostics and transport facilities under JSSK.
Principal Secretary further stated that lack of referral transport, poor connectivity of roads, apathetic attitude of service providers (Staff Nurse, ANMs etc.) and not staying of service providers at facilities were main constraints in providing postnatal check-up. However, efforts were being made for reducing out of pocket expenditure, mentoring of service provider on behavioural change and improvement in free transport services through implementation of JSSK.
The fact remains that the health workers/doctors could not advocate the benefits of post-natal care to mothers and their attendants. Further, the benefits of JSY could have been appropriately linked to 48-hour stay in hospital to incentivise the longer hospital stay.
2.1.7.3 Referral services
Free assured transportation from home to health facility, inter facility transfer in case of referral and drop back was an entitlement under Janani Shishu
Suraksha Karyakram (JSSK). Janani Express (JE) ambulance services operated by private service providers were available in all the districts of the State. Call centres were established at district hospitals to receive calls and provide ambulance services to pregnant women and neonatal. Commissioner, Health Service issued instructions (June 2012) that 90 per cent pick-up and 70 per cent drop-back of total institutional deliveries should be ensured by JE services.
Out of total
home deliveries
74 per cent were
not attended by
SBA trained
health
professional.
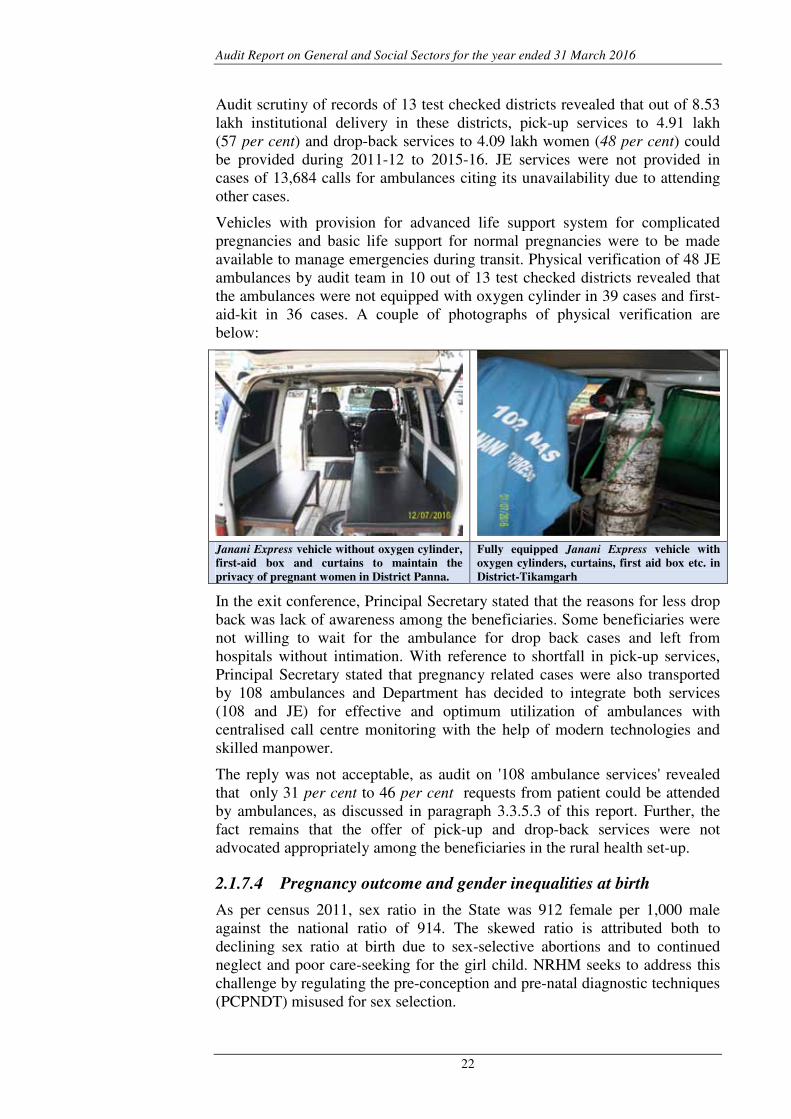
Audit Report on General and Social Sectors for the year ended 31 March 2016
22
Audit scrutiny of records of 13 test checked districts revealed that out of 8.53 lakh institutional delivery in these districts, pick-up services to 4.91 lakh (57 per cent) and drop-back services to 4.09 lakh women (48 per cent) could be provided during 2011-12 to 2015-16. JE services were not provided in cases of 13,684 calls for ambulances citing its unavailability due to attending other cases.
Vehicles with provision for advanced life support system for complicated pregnancies and basic life support for normal pregnancies were to be made available to manage emergencies during transit. Physical verification of 48 JE ambulances by audit team in 10 out of 13 test checked districts revealed that the ambulances were not equipped with oxygen cylinder in 39 cases and first-aid-kit in 36 cases. A couple of photographs of physical verification are below:
Janani Express vehicle without oxygen cylinder,
first-aid box and curtains to maintain the
privacy of pregnant women in District Panna.
Fully equipped Janani Express vehicle with
oxygen cylinders, curtains, first aid box etc. in
District-Tikamgarh
In the exit conference, Principal Secretary stated that the reasons for less drop back was lack of awareness among the beneficiaries. Some beneficiaries were not willing to wait for the ambulance for drop back cases and left from hospitals without intimation. With reference to shortfall in pick-up services, Principal Secretary stated that pregnancy related cases were also transported by 108 ambulances and Department has decided to integrate both services (108 and JE) for effective and optimum utilization of ambulances with centralised call centre monitoring with the help of modern technologies and skilled manpower.
The reply was not acceptable, as audit on '108 ambulance services' revealed that only 31 per cent to 46 per cent requests from patient could be attended by ambulances, as discussed in paragraph 3.3.5.3 of this report. Further, the fact remains that the offer of pick-up and drop-back services were not advocated appropriately among the beneficiaries in the rural health set-up.
2.1.7.4 Pregnancy outcome and gender inequalities at birth
As per census 2011, sex ratio in the State was 912 female per 1,000 male against the national ratio of 914. The skewed ratio is attributed both to declining sex ratio at birth due to sex-selective abortions and to continued neglect and poor care-seeking for the girl child. NRHM seeks to address this challenge by regulating the pre-conception and pre-natal diagnostic techniques (PCPNDT) misused for sex selection.
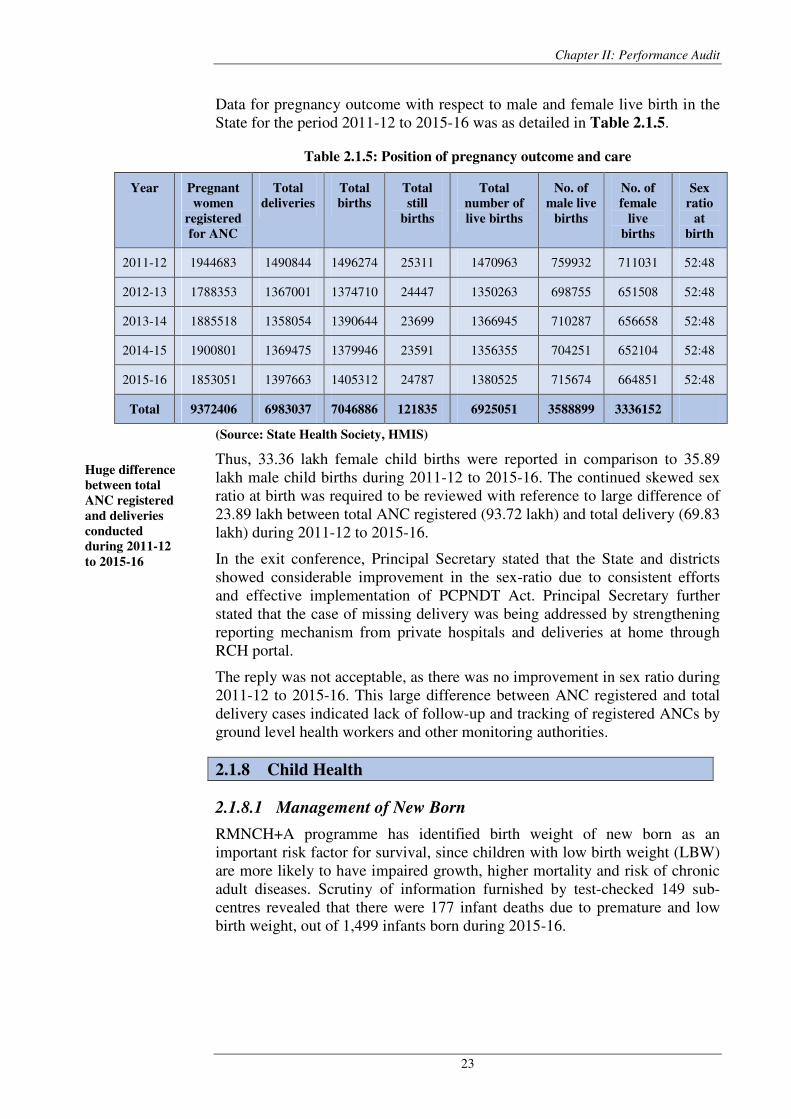
Chapter II: Performance Audit
23
Data for pregnancy outcome with respect to male and female live birth in the State for the period 2011-12 to 2015-16 was as detailed in Table 2.1.5.
Table 2.1.5: Position of pregnancy outcome and care
Year Pregnant
women
registered
for ANC
Total
deliveries
Total
births
Total
still
births
Total
number of
live births
No. of
male live
births
No. of
female
live
births
Sex
ratio
at
birth
2011-12 1944683 1490844 1496274 25311 1470963 759932 711031 52:48
2012-13 1788353 1367001 1374710 24447 1350263 698755 651508 52:48
2013-14 1885518 1358054 1390644 23699 1366945 710287 656658 52:48
2014-15 1900801 1369475 1379946 23591 1356355 704251 652104 52:48
2015-16 1853051 1397663 1405312 24787 1380525 715674 664851 52:48
Total 9372406 6983037 7046886 121835 6925051 3588899 3336152
(Source: State Health Society, HMIS)
Thus, 33.36 lakh female child births were reported in comparison to 35.89 lakh male child births during 2011-12 to 2015-16. The continued skewed sex ratio at birth was required to be reviewed with reference to large difference of 23.89 lakh between total ANC registered (93.72 lakh) and total delivery (69.83 lakh) during 2011-12 to 2015-16.
In the exit conference, Principal Secretary stated that the State and districts showed considerable improvement in the sex-ratio due to consistent efforts and effective implementation of PCPNDT Act. Principal Secretary further stated that the case of missing delivery was being addressed by strengthening reporting mechanism from private hospitals and deliveries at home through RCH portal.
The reply was not acceptable, as there was no improvement in sex ratio during 2011-12 to 2015-16. This large difference between ANC registered and total delivery cases indicated lack of follow-up and tracking of registered ANCs by ground level health workers and other monitoring authorities.
2.1.8 Child Health
2.1.8.1 Management of New Born
RMNCH+A programme has identified birth weight of new born as an important risk factor for survival, since children with low birth weight (LBW) are more likely to have impaired growth, higher mortality and risk of chronic adult diseases. Scrutiny of information furnished by test-checked 149 sub-centres revealed that there were 177 infant deaths due to premature and low birth weight, out of 1,499 infants born during 2015-16.
Huge difference
between total
ANC registered
and deliveries
conducted
during 2011-12
to 2015-16
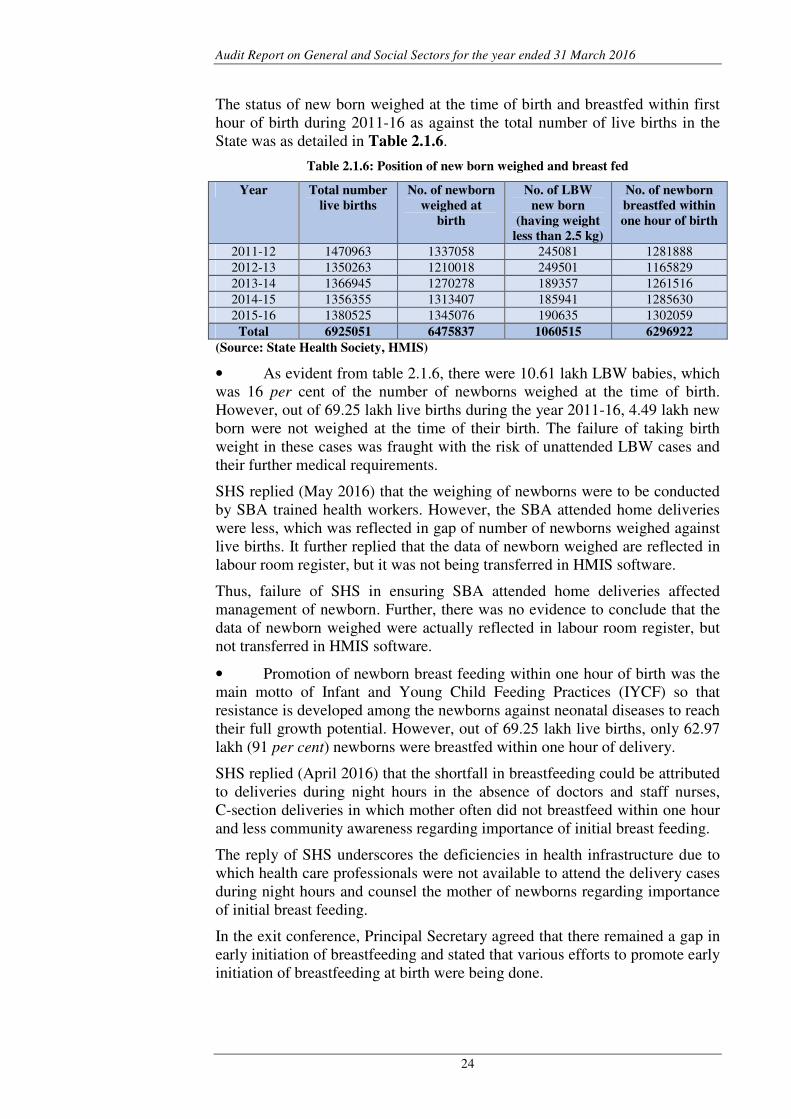
Audit Report on General and Social Sectors for the year ended 31 March 2016
24
The status of new born weighed at the time of birth and breastfed within first hour of birth during 2011-16 as against the total number of live births in the State was as detailed in Table 2.1.6.
Table 2.1.6: Position of new born weighed and breast fed
Year Total number
live births
No. of newborn
weighed at
birth
No. of LBW
new born
(having weight
less than 2.5 kg)
No. of newborn
breastfed within
one hour of birth
2011-12 1470963 1337058 245081 1281888 2012-13 1350263 1210018 249501 1165829 2013-14 1366945 1270278 189357 1261516 2014-15 1356355 1313407 185941 1285630 2015-16 1380525 1345076 190635 1302059
Total 6925051 6475837 1060515 6296922
(Source: State Health Society, HMIS)
• As evident from table 2.1.6, there were 10.61 lakh LBW babies, which was 16 per cent of the number of newborns weighed at the time of birth. However, out of 69.25 lakh live births during the year 2011-16, 4.49 lakh new born were not weighed at the time of their birth. The failure of taking birth weight in these cases was fraught with the risk of unattended LBW cases and their further medical requirements.
SHS replied (May 2016) that the weighing of newborns were to be conducted by SBA trained health workers. However, the SBA attended home deliveries were less, which was reflected in gap of number of newborns weighed against live births. It further replied that the data of newborn weighed are reflected in labour room register, but it was not being transferred in HMIS software.
Thus, failure of SHS in ensuring SBA attended home deliveries affected management of newborn. Further, there was no evidence to conclude that the data of newborn weighed were actually reflected in labour room register, but not transferred in HMIS software.
• Promotion of newborn breast feeding within one hour of birth was the main motto of Infant and Young Child Feeding Practices (IYCF) so that resistance is developed among the newborns against neonatal diseases to reach their full growth potential. However, out of 69.25 lakh live births, only 62.97 lakh (91 per cent) newborns were breastfed within one hour of delivery.
SHS replied (April 2016) that the shortfall in breastfeeding could be attributed to deliveries during night hours in the absence of doctors and staff nurses, C-section deliveries in which mother often did not breastfeed within one hour and less community awareness regarding importance of initial breast feeding.
The reply of SHS underscores the deficiencies in health infrastructure due to which health care professionals were not available to attend the delivery cases during night hours and counsel the mother of newborns regarding importance of initial breast feeding.
In the exit conference, Principal Secretary agreed that there remained a gap in early initiation of breastfeeding and stated that various efforts to promote early initiation of breastfeeding at birth were being done.
Chapter II: Performance Audit
25
2.1.8.2 Child immunisation
Universal Immunisation Programme (UIP) includes vaccines to prevent seven vaccine preventable diseases (Tuberculosis, Polio, Diphtheria, Pertussis, Tetanus, Measles, Hepatitis B). The targets for child immunization were fixed in the State by extrapolating census population data using decadal growth rate for each district and applying birth rate and IMR for each of the district. The status of target set for seven vaccine preventable diseases during the year 2011-16 and achievement against these was as detailed in Appendix-2.1.5, which revealed the following:
• Targets set for child immunization against seven vaccine preventable disease could not be achieved during 2011-16 and the range of shortfall was 16 to 21 per cent in the State. Audit noticed that Alirajpur (94 to 114 per cent), Bhopal (92 to 105 per cent) and Gwalior (91 to 104 per cent) were good performing districts; while Seoni (63 to 67 per cent), Katni (63 to 68 per cent) and Mandla (64 to 68 per cent) were under performing districts during 2011-16.
• Targets were also set for age wise immunization of children categorising targets for immunization up to one year of age, one and half year of age and above five year of age. However, the shortfall in category wise immunisation ranged from 17 to 50 per cent as detailed in Appendix-2.1.6.
• Under the UIP, Hepatitis-B Zero dose was to be provided to the infants up to 48 hours of age. In this regard, it was noticed that against 69.25 lakh live births only 39.30 lakh (57 per cent) infants could be vaccinated for Hepatitis B Zero dose.
• During the period 2011-12 to 2015-16, 618 cases of Diphtheria, 90 cases of Pertussis, 1,0098 cases of Tetanus and 14,777 cases of Measles were reported. Under the Adverse Event Following Immunization (AEFI), 33 cases of death, 5,972 cases of abscess and 22,281 cases of complications were reported during 2011-12 to 2015-16.
• Village Health and Nutrition Day (VHND) was to be organised once every month at the Anganwadi centre (AWC) for providing identified services such as immunisation, antenatal care, postnatal care, family planning etc. Audit scrutiny revealed that 39.07 lakh VHNDs could be organised against 40.05 lakh planned. However, ASHAs were not present in 7.71 lakh VHNDs held during 2011-12 to 2015-16, though ASHAs were responsible for mobilising the villagers, especially women and children, to assemble at the nearest AWCs.
In the exit conference, Principal Secretary stated that ‘Mission Indradhanush’ was conducted in high and medium priority districts to close the immunisation gaps during 2015-16 and 2016-17. With reference to less vaccination of Hepatitis-B Zero dose, it was stated that vaccination dose was to be given within 24 hours of birth, which was to be given only in case of institutional deliveries at DH, CH, CHC and PHC which have the facility to store the vaccines, while SCs did not have vaccine storage facility. Vaccination of
8 Tetanus Neonatarum and other than Neonatarum.
Target set for
child
immunisation
against vaccine
preventable
diseases were
not achieved.
Audit Report on General and Social Sectors for the year ended 31 March 2016
26
infants which were delivered at private institutions was not included in HMIS reports.
Reply confirms the fact that infants delivered at SCs or homes were deprived of Hepatitis B Zero vaccination. Further, deficiency in HMIS report regarding non-inclusion of data of vaccination at private institutions indicated lack of monitoring mechanism for UIP.
2.1.9 Reproductive Health Care
2.1.9.1 Comprehensive Abortion Care
According to RMNCH+A guidelines, eight per cent of maternal deaths in India are attributed to unsafe abortions. Besides this, women who survive unsafe abortion are likely to suffer long-term health complications. Therefore, safe and comprehensive abortion care is an essential component of overall pregnancy care.
Under NRHM, 24x7 PHCs were to provide abortion by Manual Vacuum Aspiration (MVA) facilities and medical methods, whereas comprehensive Medical Termination of Pregnancy (MTP) services were to be available at all District Hospitals and Sub-district level hospitals with priority given to ‘delivery points’, i.e., CHCs. NRHM seeks to up-gradate CHCs as First Referral Units, which would include facility for MTP.
However, audit scrutiny of information provided by SHS revealed that MTP services were not provided in 25 sub-district level Hospital (out of 63) and 136 CHCs (out of 334). Out of 531 24x7 PHCs, MVA facilities were not available in 380 24x7 PHCs. Thus, the objective to reduce maternal death by providing safe abortion to women was defeated.
In the exit conference, Principal Secretary stated that efforts were being made to provide quality abortion care by posting of skilled manpower, capacity building of medical officers, procurement of MVA kits and strengthening of IEC activities.
2.1.9.2 Family planning programme
One of the key indicators of good reproductive health of the community is the Total Fertility Rate (TFR). The TFR is defined as the average number of children that would be born to a woman over her reproductive life span. As TFR decreases, maternal mortality rate also declines. Further, low TFR impacts child survival by bringing optimum spacing between successive pregnancies. NRHM framework has targeted to reduce TFR to 2.1.
• Limiting methods: Limiting methods of family planning consist of vasectomy for male and tubectomy for female. Total target of 30.25 lakh by the State for male and female sterilisation against which achievement was 22.11 lakh during 2011-16, as detailed in Appendix-2.1.7. As against 3.03 lakh vasectomy planned during the year 2011-16, only 0.83 lakh (27 per cent) male sterilization could be performed. The achievement of female sterilizations was 43 and 22 per cent against planned for minilap and post-partum sterilization respectively. However, 15.89 lakh laproscopic
Shortfall in
service for
sterilisation and
spacing methods
was noticed.
Chapter II: Performance Audit
27
female sterilisations were carried out during 2011-12 to 2015-16, which was 105 per cent of target.
In case of tubectomy, 69 deaths and 8,860 failure cases were reported during the year 2011-12 to 2015-16 and compensation of ` 2.09 crore in 2014-15 and ` 2.87 crore in 2015-16 was made.
• Contraceptives and spacing methods: SHS fixed targets for insertion of 25 lakh IUCD9, eight lakh PPIUCD10, and distribution of 43 lakh oral pills and 74 lakh condoms during 2011-16. However, there was shortfall in achievement of 36 per cent IUCD, 56 per cent PPIUCD, 42 per cent oral pills and 49 per cent condoms as detailed in Appendix 2.1.8.
In the exit conference, Principal Secretary stated that there were two primary reasons for poor achievement - (i) the family welfare programme was not effectively managed with co-ordination of other department, (ii) the many-faceted population programme which was impacted by women’s literacy, status, empowerment, age at marriage, etc. was not implemented and monitored effectively, due to lack of inter-departmental co-operation. Principal Secretary further stated efforts were being made to reach TFR of 2.1.
The fact remains that the targets of TFR could not be achieved due to low performance in family planning programme.
2.1.10 Planning and Budgeting
Under NRHM, a detailed planning and budgeting exercise was to be taken up every year to fix the annual targets for programme implementation and required budget for them. Each implementing agency was required to prepare an annual plan of action, which would indicate the physical targets and budgetary estimates in accordance with the approved pattern of assistance under NRHM.
2.1.10.1 Preparation of State Programme Implementation Plan
As per the NRHM operational guidelines for financial management, bottom up approach for planning and budgeting was to be followed. The process envisaged to begin at the block level by preparing the “Block Health Action Plan” (BHAP) based on inputs/discussions with the implementing units (CHCs, PHCs and Sub-centres). The BHAPs would then aggregate to form a District Health Action Plan (DHAP), which would be sent to the SHS for approval. State Programme Implementation Plan (SPIP) was then to be prepared by aggregating the DHAPs.
SHS informed (May 2016) that bottom up approach was adopted at district level for preparation of DHAPs. However, out of 13 test checked DHSs, seven DHS11 informed that they have not adopted bottom up approach. Though six other DHSs informed that they were adopting bottom up approach in the planning process, no supporting records were produced during audit.
9 Intra Uterine Contraceptive Device.
10 Post-Partum Intra Uterine Contraceptive Device.
11 Anuppur, Betul, Mandla, Neemuch, Panna, Rajgarh and Ratlam.
Bottom-up
approach was
not adopted at
district level
during planning
process.
Audit Report on General and Social Sectors for the year ended 31 March 2016
28
In the exit conference, Principal Secretary stated that the DHAPs in the districts were prepared after integration of the BHAPs of all the blocks of the districts. However, documentation of block plans had been poor. Instructions had been issued (September 2016) to the districts to properly document the block and village plans.
The reply was not acceptable, as seven DHSs had accepted that bottom-up approach was not followed.
2.1.10.2 Delays in preparation of PIPs
NRHM Operational Guidelines for Financial Management provides that the State PIP has to be submitted to GoI by 31st December, which will approve the same by 28th February. Similarly, DHAPs are to be submitted to SHS before 31st October and approved before 15th of March every year by the SHS.
Audit noticed that State PIPs were submitted to GoI with a delay ranging from 69 to 196 days during 2011-12 to 2015-16. Consequently, the approval of PIPs from GoI was received with a delay ranging from 72 to 223 days (Appendix-
2.1.9). Similarly, there were delays in submission of DHAP by 13 test-checked DHSs, which ranged from two to seven months (Appendix-2.1.10).
In the exit conference, Principal Secretary stated that there was some delay in submission and approval of the State PIP. GoI had developed a software application for the planning process, the State was using the application to expedite the planning process.
Thus, delays in planning process at all levels resulted in delayed release of funds to districts, rush of expenditure at the end of financial years and shortfall in achievement of targets under various programmes/ activities.
2.1.10.3 Inter-sectoral convergence
The guideline for preparation of State PIPs and DHAPs provides for the inter-sectoral convergence with other line departments. However, scrutiny of records revealed that State PIPs and DHAPs were prepared without including activities of inter-sectoral convergence with the line departments. Further, only eight out of 13 test-checked districts informed participation of other line departments in the planning process of DHAPs. In the absence of any plan for inter-sectoral convergence, its achievement during programme implementation could not be ascertained in audit.
In the exit conference, Principal Secretary stated that intersectoral convergence with line departments were organised at the district level before finalising the DHAP. However, instructions had been issued (September 2016) to the districts to invite the line departments in the planning workshops. At the State level, the State PIP was approved by the SHS prior to submission to GoI by organising a meeting of the Governing Body for the purpose and were attended by the Principal Secretaries of concerned line departments.
Reply was not acceptable, as there was absence of any documented inter-sectoral convergence plan under NRHM at State level as well as at test-checked district levels. Further, five test checked districts intimated that officials from line departments did not participate in the planning process.
Delay in
finalization of
PIPs resulted
into delay in
release of funds
at all level.
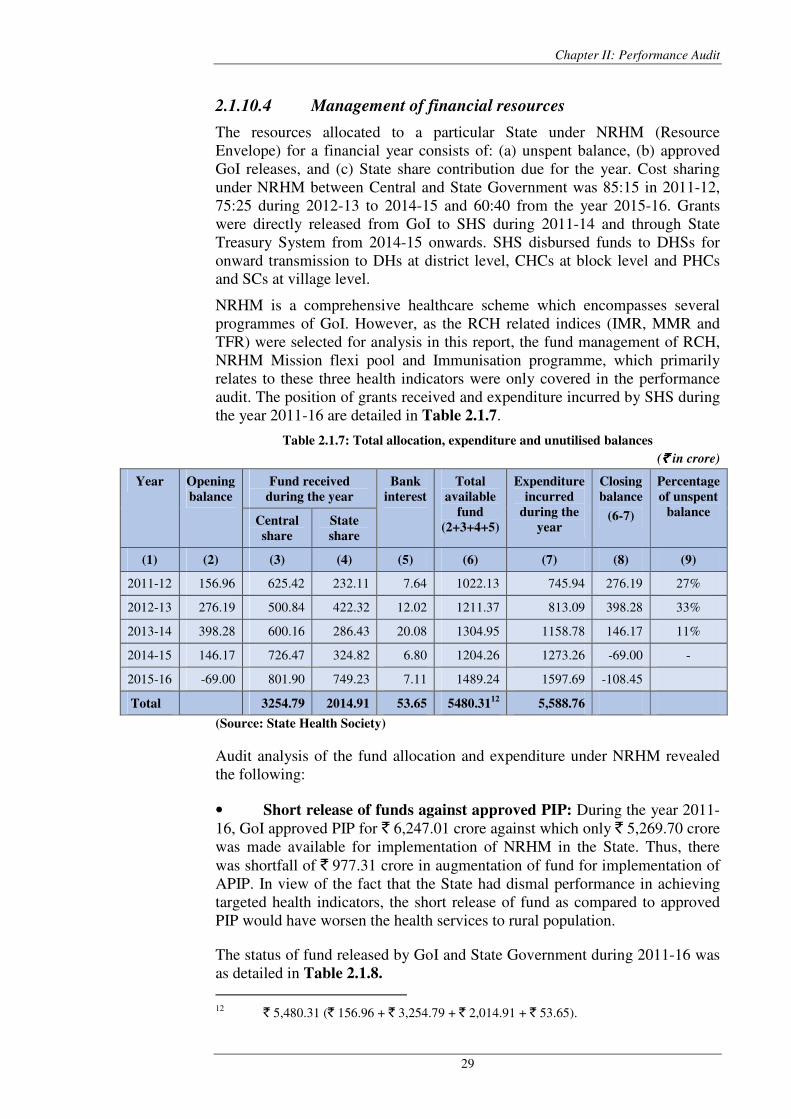
Chapter II: Performance Audit
29
2.1.10.4 Management of financial resources
The resources allocated to a particular State under NRHM (Resource Envelope) for a financial year consists of: (a) unspent balance, (b) approved GoI releases, and (c) State share contribution due for the year. Cost sharing under NRHM between Central and State Government was 85:15 in 2011-12, 75:25 during 2012-13 to 2014-15 and 60:40 from the year 2015-16. Grants were directly released from GoI to SHS during 2011-14 and through State Treasury System from 2014-15 onwards. SHS disbursed funds to DHSs for onward transmission to DHs at district level, CHCs at block level and PHCs and SCs at village level.
NRHM is a comprehensive healthcare scheme which encompasses several programmes of GoI. However, as the RCH related indices (IMR, MMR and TFR) were selected for analysis in this report, the fund management of RCH, NRHM Mission flexi pool and Immunisation programme, which primarily relates to these three health indicators were only covered in the performance audit. The position of grants received and expenditure incurred by SHS during the year 2011-16 are detailed in Table 2.1.7.
Table 2.1.7: Total allocation, expenditure and unutilised balances
(` ` ` ` in crore)
Year Opening
balance
Fund received
during the year
Bank
interest
Total
available
fund
(2+3+4+5)
Expenditure
incurred
during the
year
Closing
balance
(6-7)
Percentage
of unspent
balance Central
share
State
share
(1) (2) (3) (4) (5) (6) (7) (8) (9)
2011-12 156.96 625.42 232.11 7.64 1022.13 745.94 276.19 27%
2012-13 276.19 500.84 422.32 12.02 1211.37 813.09 398.28 33%
2013-14 398.28 600.16 286.43 20.08 1304.95 1158.78 146.17 11%
2014-15 146.17 726.47 324.82 6.80 1204.26 1273.26 -69.00 -
2015-16 -69.00 801.90 749.23 7.11 1489.24 1597.69 -108.45
Total 3254.79 2014.91 53.65 5480.3112
5,588.76
(Source: State Health Society)
Audit analysis of the fund allocation and expenditure under NRHM revealed the following:
• Short release of funds against approved PIP: During the year 2011-16, GoI approved PIP for ` 6,247.01 crore against which only ` 5,269.70 crore was made available for implementation of NRHM in the State. Thus, there was shortfall of ` 977.31 crore in augmentation of fund for implementation of APIP. In view of the fact that the State had dismal performance in achieving targeted health indicators, the short release of fund as compared to approved PIP would have worsen the health services to rural population.
The status of fund released by GoI and State Government during 2011-16 was as detailed in Table 2.1.8.
12 ` 5,480.31 (` 156.96 + ` 3,254.79 + ` 2,014.91 + ` 53.65).
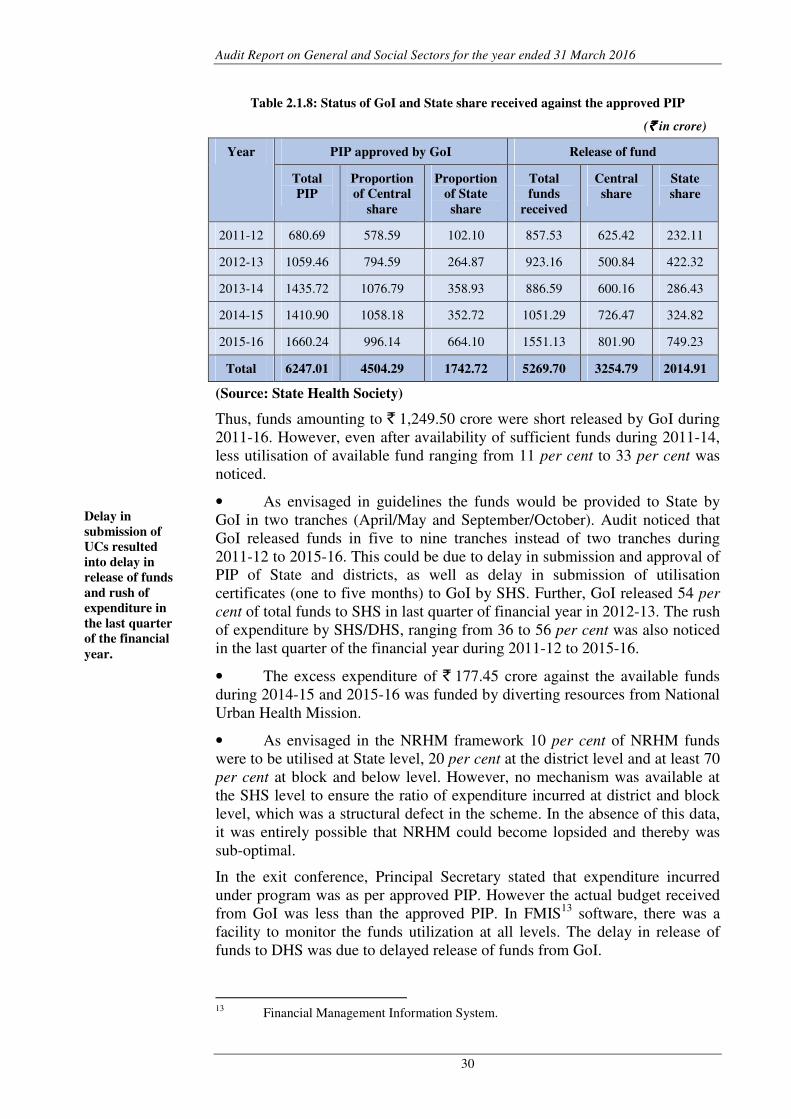
Audit Report on General and Social Sectors for the year ended 31 March 2016
30
Table 2.1.8: Status of GoI and State share received against the approved PIP
(` ` ` ` in crore)
Year PIP approved by GoI Release of fund
Total
PIP
Proportion
of Central
share
Proportion
of State
share
Total
funds
received
Central
share
State
share
2011-12 680.69 578.59 102.10 857.53 625.42 232.11
2012-13 1059.46 794.59 264.87 923.16 500.84 422.32
2013-14 1435.72 1076.79 358.93 886.59 600.16 286.43
2014-15 1410.90 1058.18 352.72 1051.29 726.47 324.82
2015-16 1660.24 996.14 664.10 1551.13 801.90 749.23
Total 6247.01 4504.29 1742.72 5269.70 3254.79 2014.91
(Source: State Health Society)
Thus, funds amounting to ` 1,249.50 crore were short released by GoI during 2011-16. However, even after availability of sufficient funds during 2011-14, less utilisation of available fund ranging from 11 per cent to 33 per cent was noticed.
• As envisaged in guidelines the funds would be provided to State by GoI in two tranches (April/May and September/October). Audit noticed that GoI released funds in five to nine tranches instead of two tranches during 2011-12 to 2015-16. This could be due to delay in submission and approval of PIP of State and districts, as well as delay in submission of utilisation certificates (one to five months) to GoI by SHS. Further, GoI released 54 per
cent of total funds to SHS in last quarter of financial year in 2012-13. The rush of expenditure by SHS/DHS, ranging from 36 to 56 per cent was also noticed in the last quarter of the financial year during 2011-12 to 2015-16.
• The excess expenditure of ` 177.45 crore against the available funds during 2014-15 and 2015-16 was funded by diverting resources from National Urban Health Mission.
• As envisaged in the NRHM framework 10 per cent of NRHM funds were to be utilised at State level, 20 per cent at the district level and at least 70 per cent at block and below level. However, no mechanism was available at the SHS level to ensure the ratio of expenditure incurred at district and block level, which was a structural defect in the scheme. In the absence of this data, it was entirely possible that NRHM could become lopsided and thereby was sub-optimal.
In the exit conference, Principal Secretary stated that expenditure incurred under program was as per approved PIP. However the actual budget received from GoI was less than the approved PIP. In FMIS13 software, there was a facility to monitor the funds utilization at all levels. The delay in release of funds to DHS was due to delayed release of funds from GoI.
13 Financial Management Information System.
Delay in
submission of
UCs resulted
into delay in
release of funds
and rush of
expenditure in
the last quarter
of the financial
year.
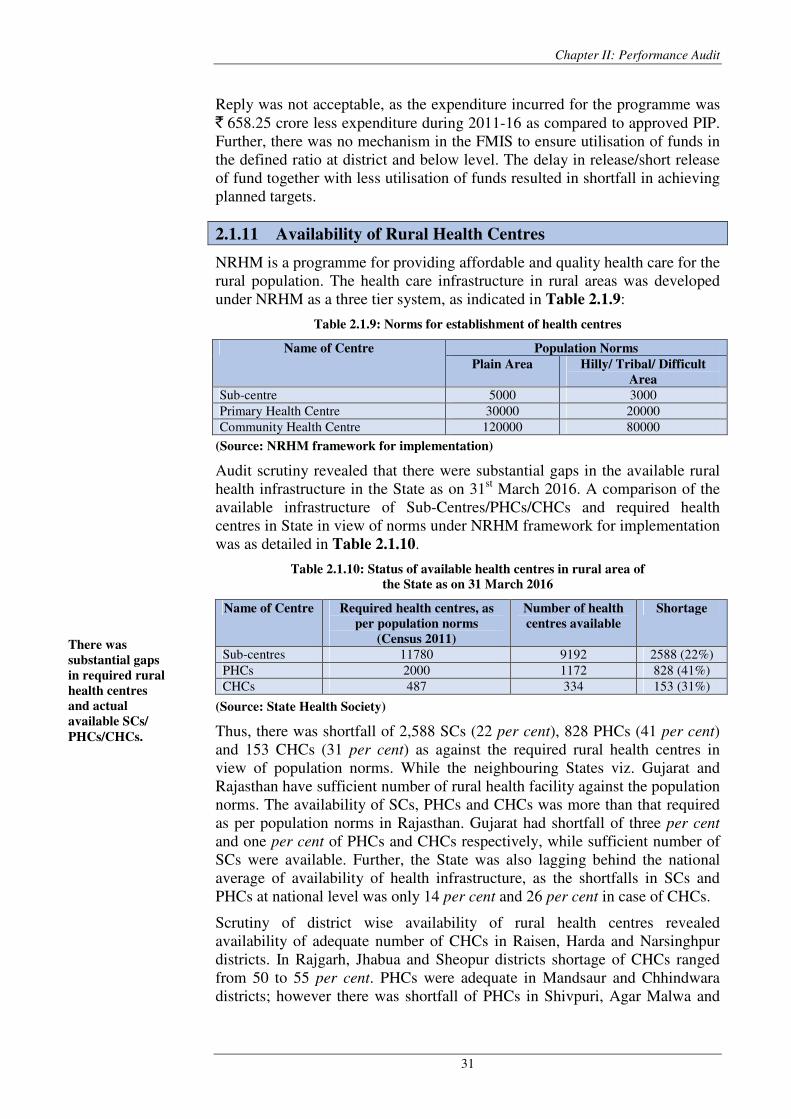
Chapter II: Performance Audit
31
Reply was not acceptable, as the expenditure incurred for the programme was ` 658.25 crore less expenditure during 2011-16 as compared to approved PIP. Further, there was no mechanism in the FMIS to ensure utilisation of funds in the defined ratio at district and below level. The delay in release/short release of fund together with less utilisation of funds resulted in shortfall in achieving planned targets.
2.1.11 Availability of Rural Health Centres
NRHM is a programme for providing affordable and quality health care for the rural population. The health care infrastructure in rural areas was developed under NRHM as a three tier system, as indicated in Table 2.1.9:
Table 2.1.9: Norms for establishment of health centres
Name of Centre Population Norms
Plain Area Hilly/ Tribal/ Difficult
Area
Sub-centre 5000 3000 Primary Health Centre 30000 20000 Community Health Centre 120000 80000
(Source: NRHM framework for implementation)
Audit scrutiny revealed that there were substantial gaps in the available rural health infrastructure in the State as on 31st March 2016. A comparison of the available infrastructure of Sub-Centres/PHCs/CHCs and required health centres in State in view of norms under NRHM framework for implementation was as detailed in Table 2.1.10.
Table 2.1.10: Status of available health centres in rural area of
the State as on 31 March 2016
Name of Centre Required health centres, as
per population norms
(Census 2011)
Number of health
centres available
Shortage
Sub-centres 11780 9192 2588 (22%) PHCs 2000 1172 828 (41%) CHCs 487 334 153 (31%)
(Source: State Health Society)
Thus, there was shortfall of 2,588 SCs (22 per cent), 828 PHCs (41 per cent) and 153 CHCs (31 per cent) as against the required rural health centres in view of population norms. While the neighbouring States viz. Gujarat and Rajasthan have sufficient number of rural health facility against the population norms. The availability of SCs, PHCs and CHCs was more than that required as per population norms in Rajasthan. Gujarat had shortfall of three per cent and one per cent of PHCs and CHCs respectively, while sufficient number of SCs were available. Further, the State was also lagging behind the national average of availability of health infrastructure, as the shortfalls in SCs and PHCs at national level was only 14 per cent and 26 per cent in case of CHCs.
Scrutiny of district wise availability of rural health centres revealed availability of adequate number of CHCs in Raisen, Harda and Narsinghpur districts. In Rajgarh, Jhabua and Sheopur districts shortage of CHCs ranged from 50 to 55 per cent. PHCs were adequate in Mandsaur and Chhindwara districts; however there was shortfall of PHCs in Shivpuri, Agar Malwa and
There was
substantial gaps
in required rural
health centres
and actual
available SCs/
PHCs/CHCs.
Audit Report on General and Social Sectors for the year ended 31 March 2016
32
Morena districts which ranged from 65 to 73 per cent. Further, only Raisen district had adequate number of SCs, whereas shortage of SCs ranging from 35 to 40 per cent were noticed in Khargone, Guna and Rajgarh districts.
Despite substantial shortages of SCs/PHCs/CHCs in most of the districts, SHS did not allocate adequate funds for establishment of rural health centres. NRHM Framework (2012-17) provided for utilisation of up to 33 per cent of total resource envelops14 on construction of new buildings and renovations of health centres. However, the allocation of fund for construction/renovation works was ` 397.98 crore during 2011-12 to 2015-16, which was only five per
cent of total resource envelops of ` 7,604.98 crore during this period. SHS could utilise ` 364.88 crore on construction/renovation works during 2011-16.
In the exit conference, Principal Secretary stated that although there was a provision of planning of funds to the tune of 33 per cent of resource envelope, but considering the huge gap in human resource, the infrastructure development was synchronised with functionality of facility. In 2015-16, creation of 2000 new SCs has been planned and the gap of CHC and PHC would be addressed in coming years in a phased manner.
The reply was not acceptable, as State Government had not prepared any perspective plan to bridge the gap in availability of rural health centres. Further, despite Madhya Pradesh being high focus State under NRHM, State Government did not give adequate priority to Health sector as the expenditure on Health sector was less as compared to General Category States’ Average during 2011-15, which were reported under paragraph 1.7.1 of CAG’s Audit Reports on State Finances for the year ended March 2014 and March 2015 respectively.
2.1.11.1 Construction of health infrastructure
As envisaged in the RMNCH+A guidelines, the new construction of up to the CHC level should be completed in a maximum of two years and of a District Hospital should be completed in a maximum period of three years. Renovation/repair initiated for any health facility should be completed within a year.
In the State, State Health Society carried out construction works through its Civil Wing at SHS level and DHS level. The major works were entrusted to Public Works Department as deposit works. During the period 2011-16, SHS incurred an expenditure of ` 242.58 crore on construction activities. The status of construction works proposed during 2011-12 to 2015-16 was as detailed in Table 2.1.11.
14 The resources allocated to a particular state for any given financial year is termed as the
“Resource Envelope”. The resource envelope for a Financial Year consists of Uncommitted Unspent Balance, GoI releases proposed for the year and State Share Contribution due for the year.
Adequate funds
for establishment
of health centres
were not
allocated, despite
substantial gaps
in rural health.
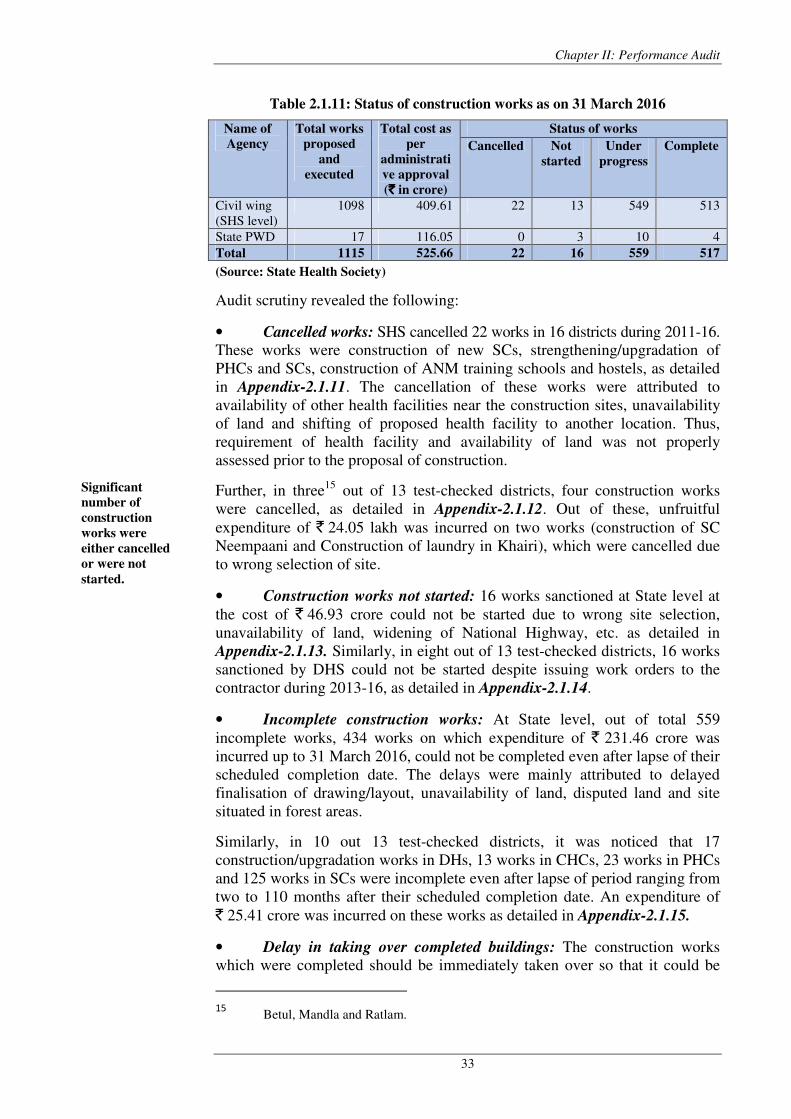
Chapter II: Performance Audit
33
Table 2.1.11: Status of construction works as on 31 March 2016
Name of
Agency
Total works
proposed
and
executed
Total cost as
per
administrati
ve approval
(`̀̀̀ in crore)
Status of works
Cancelled Not
started
Under
progress
Complete
Civil wing (SHS level)
1098 409.61 22 13 549 513
State PWD 17 116.05 0 3 10 4 Total 1115 525.66 22 16 559 517
(Source: State Health Society)
Audit scrutiny revealed the following:
• Cancelled works: SHS cancelled 22 works in 16 districts during 2011-16. These works were construction of new SCs, strengthening/upgradation of PHCs and SCs, construction of ANM training schools and hostels, as detailed in Appendix-2.1.11. The cancellation of these works were attributed to availability of other health facilities near the construction sites, unavailability of land and shifting of proposed health facility to another location. Thus, requirement of health facility and availability of land was not properly assessed prior to the proposal of construction.
Further, in three15 out of 13 test-checked districts, four construction works were cancelled, as detailed in Appendix-2.1.12. Out of these, unfruitful expenditure of ` 24.05 lakh was incurred on two works (construction of SC Neempaani and Construction of laundry in Khairi), which were cancelled due to wrong selection of site.
• Construction works not started: 16 works sanctioned at State level at the cost of ` 46.93 crore could not be started due to wrong site selection, unavailability of land, widening of National Highway, etc. as detailed in Appendix-2.1.13. Similarly, in eight out of 13 test-checked districts, 16 works sanctioned by DHS could not be started despite issuing work orders to the contractor during 2013-16, as detailed in Appendix-2.1.14.
• Incomplete construction works: At State level, out of total 559 incomplete works, 434 works on which expenditure of ` 231.46 crore was incurred up to 31 March 2016, could not be completed even after lapse of their scheduled completion date. The delays were mainly attributed to delayed finalisation of drawing/layout, unavailability of land, disputed land and site situated in forest areas.
Similarly, in 10 out 13 test-checked districts, it was noticed that 17 construction/upgradation works in DHs, 13 works in CHCs, 23 works in PHCs and 125 works in SCs were incomplete even after lapse of period ranging from two to 110 months after their scheduled completion date. An expenditure of ` 25.41 crore was incurred on these works as detailed in Appendix-2.1.15.
• Delay in taking over completed buildings: The construction works which were completed should be immediately taken over so that it could be
15 Betul, Mandla and Ratlam.
Significant
number of
construction
works were
either cancelled
or were not
started.

Audit Report on General and Social Sectors for the year ended 31 March 2016
34
utilized for the purpose for which they were built. Audit scrutiny revealed that 33 completed construction/upgradation works of DHs, CHCs, PHCs and SCs were not taken over by the concerned health institutions even after lapse of 12 to 16 months after their completion at cost of ` 3.36 crore, as detailed in
Appendix-2.1.16. Two construction works, SC Gopalpur in Dindori district and laundry building in Rajgarh district, were completed (cost of ` 0.48 crore) and taken over, but were lying unutilised.
SHS replied (May 2016) that the department was taking concrete steps in fulfilling the gaps of health institutions within the limits of available human resource and perspective strategies for enhancing the human resource at rural areas. However, no timelines or concrete plan of action were furnished to Audit.
2.1.11.2 Upgradation of health infrastructure
As envisaged under NRHM, the public health institutions in rural areas were to be upgraded from its present level to ‘Indian Public Health Standards’ (IPHS). The IPHS were the benchmark for quality expected from various components of public healthcare institutions and may be used for assessing performance of health delivery system.
SHS informed (July 2016) that State was not providing human resource and infrastructure to the health facilities as per IPHS norms. It further stated that budget was also not provided by the GoI according to IPHS norms. State had implemented National Quality Assurance Standards (NQAS) in 2014 and facilities are being upgraded as per NQAS.
2.1.11.3 Quality of health infrastructure at Sub-Centres
Sub-centres are vital peripheral institutions and first point of contact between the primary health care system and the community. Sub-centres were categorised into two types. Type-A SCs provide all recommended services except delivery services. Type-B SCs are declared as delivery points.
Out of total 9,192 SCs in the State, 337 (four per cent) were declared as delivery points (Type-B). Thus, the proportion of SCs providing delivery services was negligible. Moreover, only 241 Type-B SCs out of 337 declared Type-B SCs were actually providing delivery services. The remaining 96 SCs could not be upgraded as Type-B SCs due to lack of manpower and required infrastructure.
During visit to 149 SCs (four Type-B and 145 Type-A), Audit noticed 49 SCs were covering population of more than 5,500 and 33 SCs were not visited by a doctor even once in a month. Further, 13 SCs were functioning either in PHC building or building adjoining to PHC, thereby, making their usefulness redundant. Other major deficiency in infrastructure are summarised in Table 2.1.12.
Number of SCs
declared as
delivery points in
the State was
negligible
(four per cent).
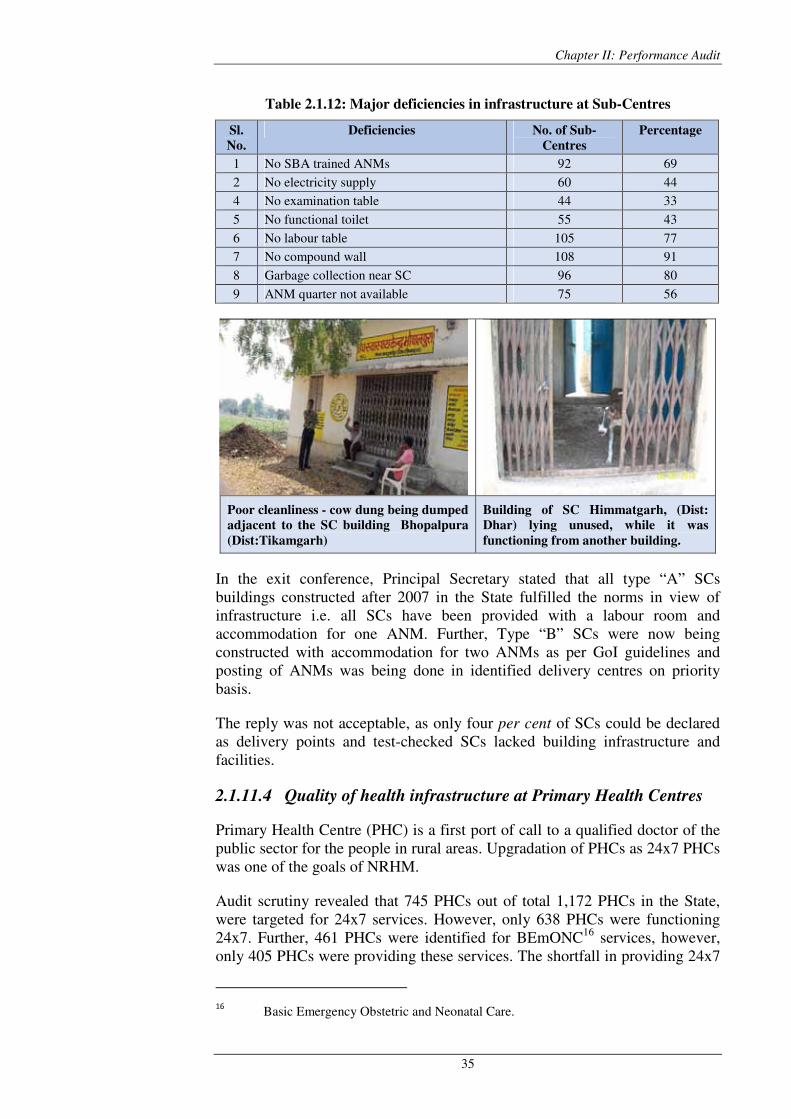
Chapter II: Performance Audit
35
Table 2.1.12: Major deficiencies in infrastructure at Sub-Centres
Sl.
No.
Deficiencies No. of Sub-
Centres
Percentage
1 No SBA trained ANMs 92 69
2 No electricity supply 60 44
4 No examination table 44 33
5 No functional toilet 55 43
6 No labour table 105 77
7 No compound wall 108 91
8 Garbage collection near SC 96 80
9 ANM quarter not available 75 56
Poor cleanliness - cow dung being dumped
adjacent to the SC building Bhopalpura
(Dist:Tikamgarh)
Building of SC Himmatgarh, (Dist:
Dhar) lying unused, while it was
functioning from another building.
In the exit conference, Principal Secretary stated that all type “A” SCs buildings constructed after 2007 in the State fulfilled the norms in view of infrastructure i.e. all SCs have been provided with a labour room and accommodation for one ANM. Further, Type “B” SCs were now being constructed with accommodation for two ANMs as per GoI guidelines and posting of ANMs was being done in identified delivery centres on priority basis.
The reply was not acceptable, as only four per cent of SCs could be declared as delivery points and test-checked SCs lacked building infrastructure and facilities.
2.1.11.4 Quality of health infrastructure at Primary Health Centres
Primary Health Centre (PHC) is a first port of call to a qualified doctor of the public sector for the people in rural areas. Upgradation of PHCs as 24x7 PHCs was one of the goals of NRHM.
Audit scrutiny revealed that 745 PHCs out of total 1,172 PHCs in the State, were targeted for 24x7 services. However, only 638 PHCs were functioning 24x7. Further, 461 PHCs were identified for BEmONC16 services, however, only 405 PHCs were providing these services. The shortfall in providing 24x7
16 Basic Emergency Obstetric and Neonatal Care.
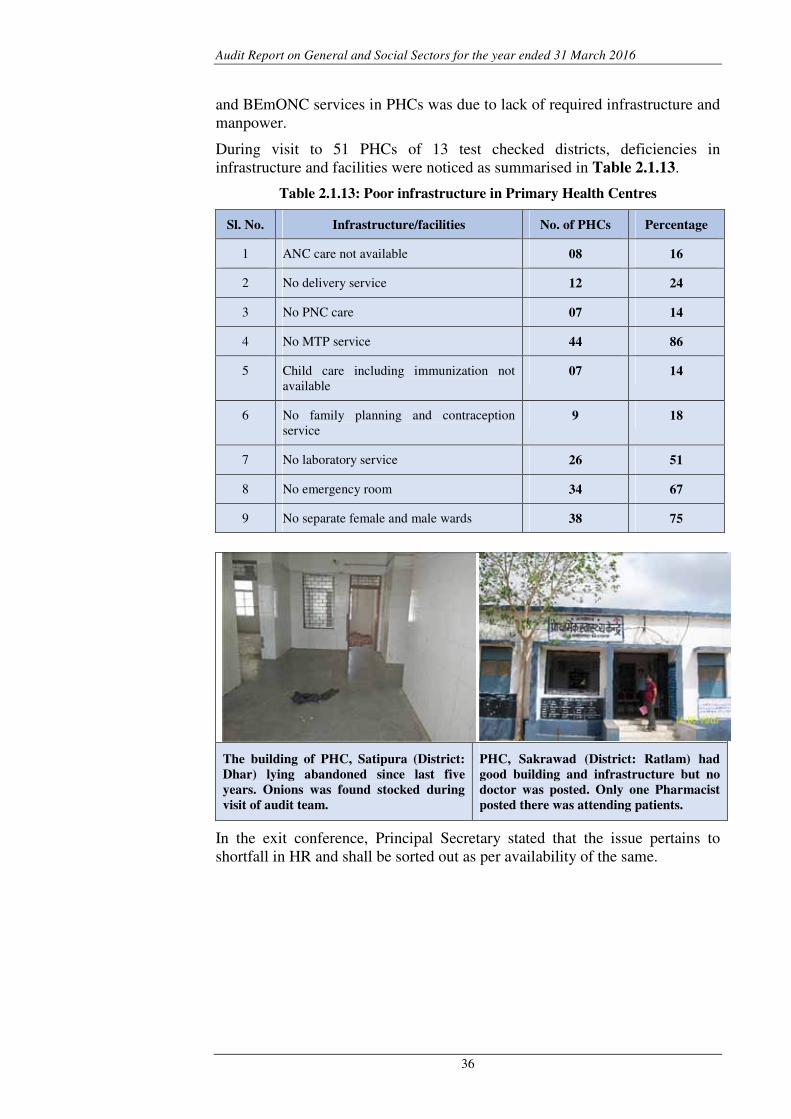
Audit Report on General and Social Sectors for the year ended 31 March 2016
36
and BEmONC services in PHCs was due to lack of required infrastructure and manpower.
During visit to 51 PHCs of 13 test checked districts, deficiencies in infrastructure and facilities were noticed as summarised in Table 2.1.13.
Table 2.1.13: Poor infrastructure in Primary Health Centres
Sl. No. Infrastructure/facilities No. of PHCs Percentage
1 ANC care not available 08 16
2 No delivery service 12 24
3 No PNC care 07 14
4 No MTP service 44 86
5 Child care including immunization not available
07 14
6 No family planning and contraception service
9 18
7 No laboratory service 26 51
8 No emergency room 34 67
9 No separate female and male wards 38 75
The building of PHC, Satipura (District:
Dhar) lying abandoned since last five
years. Onions was found stocked during
visit of audit team.
PHC, Sakrawad (District: Ratlam) had
good building and infrastructure but no
doctor was posted. Only one Pharmacist
posted there was attending patients.
In the exit conference, Principal Secretary stated that the issue pertains to shortfall in HR and shall be sorted out as per availability of the same.
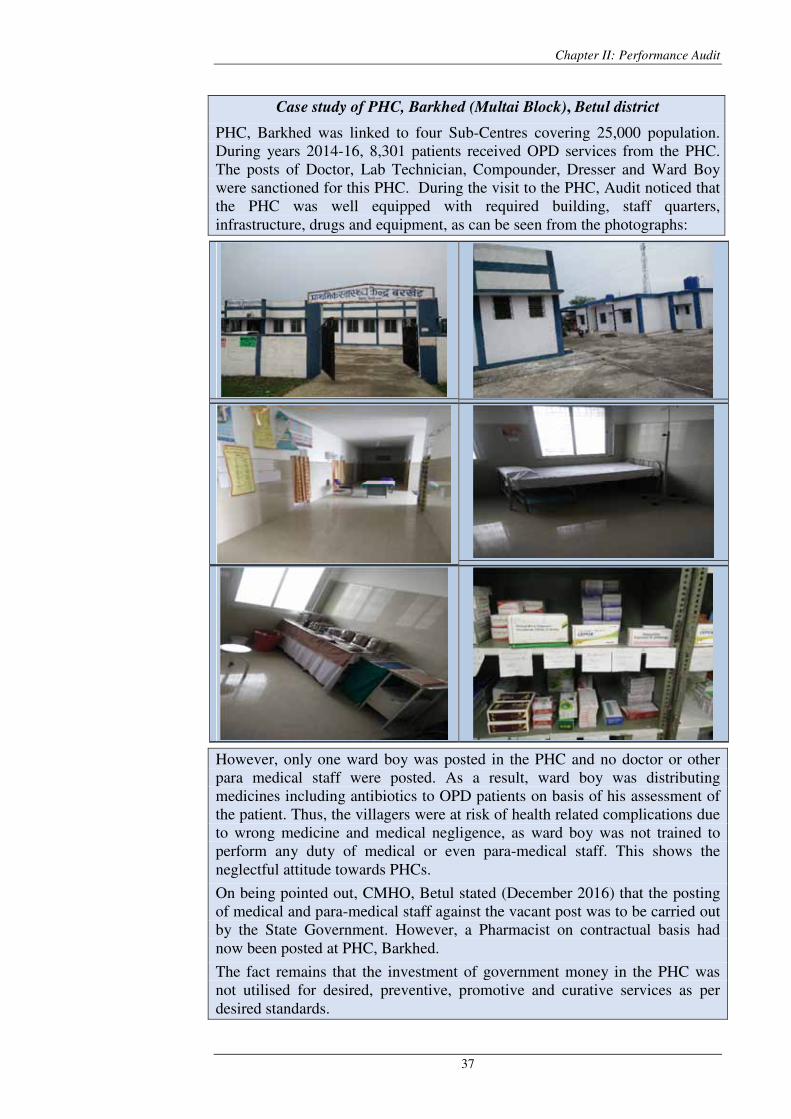
Chapter II: Performance Audit
37
Case study of PHC, Barkhed (Multai Block), Betul district
PHC, Barkhed was linked to four Sub-Centres covering 25,000 population. During years 2014-16, 8,301 patients received OPD services from the PHC. The posts of Doctor, Lab Technician, Compounder, Dresser and Ward Boy were sanctioned for this PHC. During the visit to the PHC, Audit noticed that the PHC was well equipped with required building, staff quarters, infrastructure, drugs and equipment, as can be seen from the photographs:
However, only one ward boy was posted in the PHC and no doctor or other para medical staff were posted. As a result, ward boy was distributing medicines including antibiotics to OPD patients on basis of his assessment of the patient. Thus, the villagers were at risk of health related complications due to wrong medicine and medical negligence, as ward boy was not trained to perform any duty of medical or even para-medical staff. This shows the neglectful attitude towards PHCs.
On being pointed out, CMHO, Betul stated (December 2016) that the posting of medical and para-medical staff against the vacant post was to be carried out by the State Government. However, a Pharmacist on contractual basis had now been posted at PHC, Barkhed.
The fact remains that the investment of government money in the PHC was not utilised for desired, preventive, promotive and curative services as per desired standards.
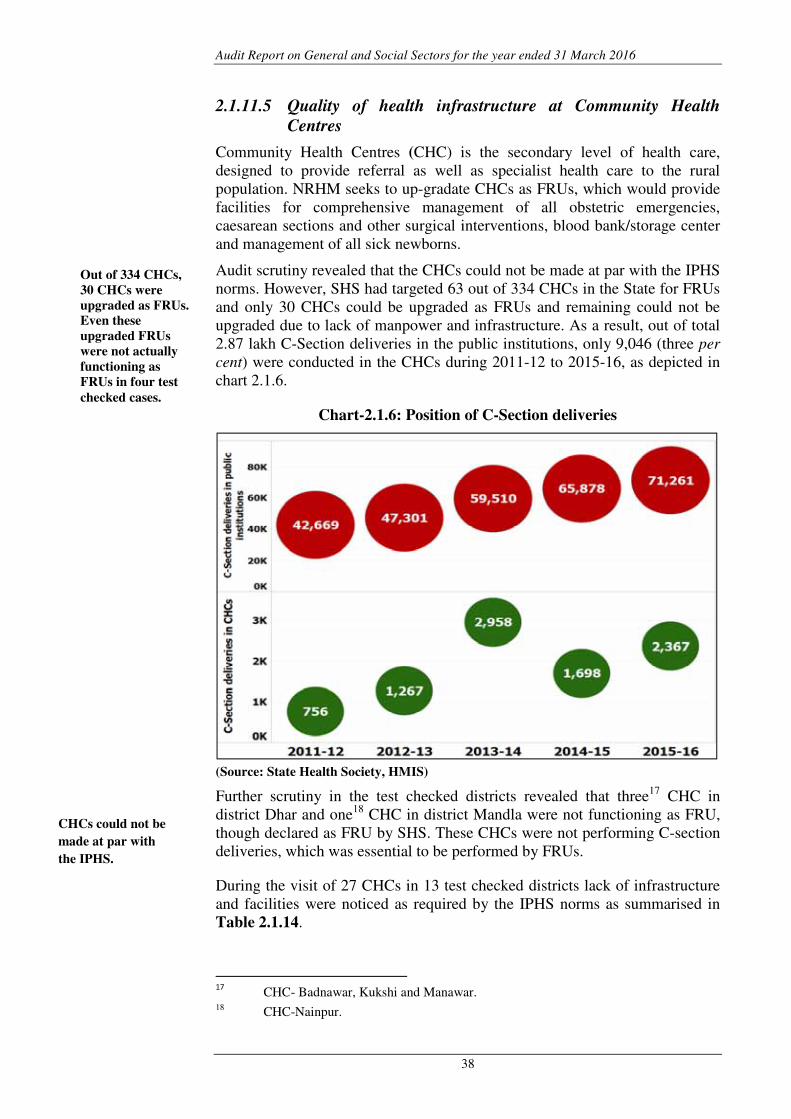
Audit Report on General and Social Sectors for the year ended 31 March 2016
38
2.1.11.5 Quality of health infrastructure at Community Health
Centres
Community Health Centres (CHC) is the secondary level of health care, designed to provide referral as well as specialist health care to the rural population. NRHM seeks to up-gradate CHCs as FRUs, which would provide facilities for comprehensive management of all obstetric emergencies, caesarean sections and other surgical interventions, blood bank/storage center and management of all sick newborns.
Audit scrutiny revealed that the CHCs could not be made at par with the IPHS norms. However, SHS had targeted 63 out of 334 CHCs in the State for FRUs and only 30 CHCs could be upgraded as FRUs and remaining could not be upgraded due to lack of manpower and infrastructure. As a result, out of total 2.87 lakh C-Section deliveries in the public institutions, only 9,046 (three per
cent) were conducted in the CHCs during 2011-12 to 2015-16, as depicted in chart 2.1.6.
Chart-2.1.6: Position of C-Section deliveries
(Source: State Health Society, HMIS)
Further scrutiny in the test checked districts revealed that three17 CHC in district Dhar and one18 CHC in district Mandla were not functioning as FRU, though declared as FRU by SHS. These CHCs were not performing C-section deliveries, which was essential to be performed by FRUs.
During the visit of 27 CHCs in 13 test checked districts lack of infrastructure and facilities were noticed as required by the IPHS norms as summarised in Table 2.1.14.
17
CHC- Badnawar, Kukshi and Manawar. 18 CHC-Nainpur.
Out of 334 CHCs,
30 CHCs were
upgraded as FRUs.
Even these
upgraded FRUs
were not actually
functioning as
FRUs in four test
checked cases.
CHCs could not be
made at par with
the IPHS.
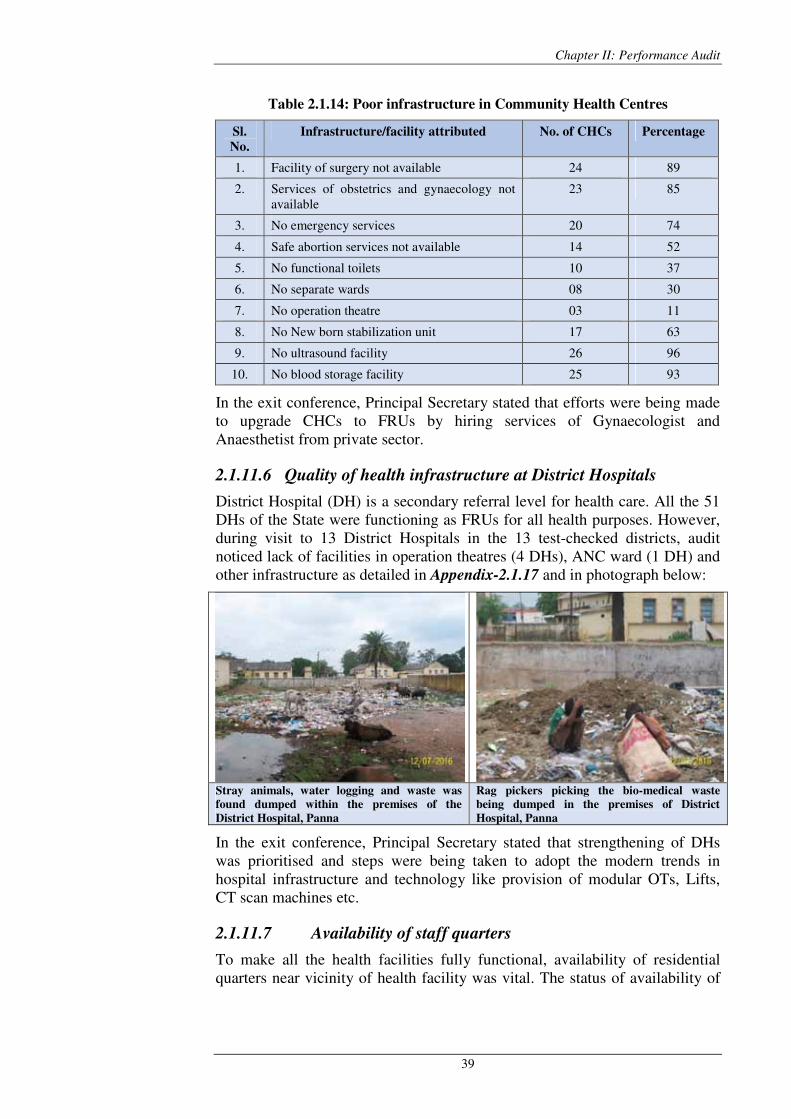
Chapter II: Performance Audit
39
Table 2.1.14: Poor infrastructure in Community Health Centres
Sl.
No.
Infrastructure/facility attributed No. of CHCs Percentage
1. Facility of surgery not available 24 89
2. Services of obstetrics and gynaecology not available
23 85
3. No emergency services 20 74
4. Safe abortion services not available 14 52
5. No functional toilets 10 37
6. No separate wards 08 30
7. No operation theatre 03 11
8. No New born stabilization unit 17 63
9. No ultrasound facility 26 96
10. No blood storage facility 25 93
In the exit conference, Principal Secretary stated that efforts were being made to upgrade CHCs to FRUs by hiring services of Gynaecologist and Anaesthetist from private sector.
2.1.11.6 Quality of health infrastructure at District Hospitals
District Hospital (DH) is a secondary referral level for health care. All the 51 DHs of the State were functioning as FRUs for all health purposes. However, during visit to 13 District Hospitals in the 13 test-checked districts, audit noticed lack of facilities in operation theatres (4 DHs), ANC ward (1 DH) and other infrastructure as detailed in Appendix-2.1.17 and in photograph below:
Stray animals, water logging and waste was
found dumped within the premises of the
District Hospital, Panna
Rag pickers picking the bio-medical waste
being dumped in the premises of District
Hospital, Panna
In the exit conference, Principal Secretary stated that strengthening of DHs was prioritised and steps were being taken to adopt the modern trends in hospital infrastructure and technology like provision of modular OTs, Lifts, CT scan machines etc.
2.1.11.7 Availability of staff quarters
To make all the health facilities fully functional, availability of residential quarters near vicinity of health facility was vital. The status of availability of
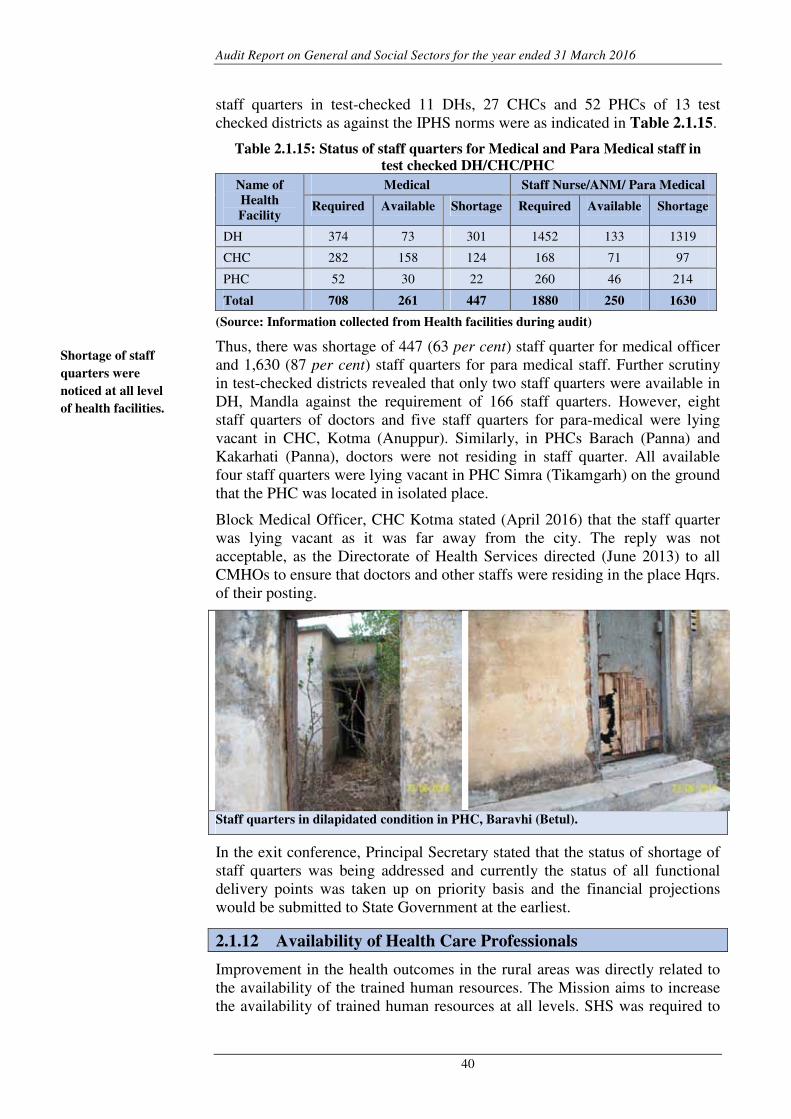
Audit Report on General and Social Sectors for the year ended 31 March 2016
40
staff quarters in test-checked 11 DHs, 27 CHCs and 52 PHCs of 13 test checked districts as against the IPHS norms were as indicated in Table 2.1.15.
Table 2.1.15: Status of staff quarters for Medical and Para Medical staff in
test checked DH/CHC/PHC
Name of
Health
Facility
Medical Staff Nurse/ANM/ Para Medical
Required Available Shortage Required Available Shortage
DH 374 73 301 1452 133 1319
CHC 282 158 124 168 71 97
PHC 52 30 22 260 46 214
Total 708 261 447 1880 250 1630
(Source: Information collected from Health facilities during audit)
Thus, there was shortage of 447 (63 per cent) staff quarter for medical officer and 1,630 (87 per cent) staff quarters for para medical staff. Further scrutiny in test-checked districts revealed that only two staff quarters were available in DH, Mandla against the requirement of 166 staff quarters. However, eight staff quarters of doctors and five staff quarters for para-medical were lying vacant in CHC, Kotma (Anuppur). Similarly, in PHCs Barach (Panna) and Kakarhati (Panna), doctors were not residing in staff quarter. All available four staff quarters were lying vacant in PHC Simra (Tikamgarh) on the ground that the PHC was located in isolated place.
Block Medical Officer, CHC Kotma stated (April 2016) that the staff quarter was lying vacant as it was far away from the city. The reply was not acceptable, as the Directorate of Health Services directed (June 2013) to all CMHOs to ensure that doctors and other staffs were residing in the place Hqrs. of their posting.
Staff quarters in dilapidated condition in PHC, Baravhi (Betul).
In the exit conference, Principal Secretary stated that the status of shortage of staff quarters was being addressed and currently the status of all functional delivery points was taken up on priority basis and the financial projections would be submitted to State Government at the earliest.
2.1.12 Availability of Health Care Professionals
Improvement in the health outcomes in the rural areas was directly related to the availability of the trained human resources. The Mission aims to increase the availability of trained human resources at all levels. SHS was required to
Shortage of staff
quarters were
noticed at all level
of health facilities.
Chapter II: Performance Audit
41
maintain the data on status of existing human resource at health centres for identification of existing gaps. State Government was responsible to provide the human resources at the rural health centres. NRHM provided for contractual appointment to a facility for filling short term gaps.
Scrutiny of records revealed that SHS had only overall data of human resources in rural health facilities of the State. The status of available human resource, both regular and contractual, at individual facility level was not available. As a result, SHS was not in a position to identify the existing gaps at a particular health facility.
2.1.12.1 Sub-Centre
As per IPHS and State Government norms there was provision of one ANM and one MPW (male) each at the SCs. As against this, ANMs were posted in all 9,192 sub-centres in the State. However, only 5,302 MPW (male) were posted in the State, hence there was shortage of 3,890 MPW (male). The status of deployment of ANM and MPW (Male) in 2,571 SCs of 13 test checked districts was as in Table 2.1.16.
Table 2.1.16: Status of manpower at SCs of sampled districts as of 31 March 2016
Name of posts Required as
per State and
IPHS norms
Sanctioned
Strength
Persons-
in-
position
Vacant as per
sanctioned
posts
Shortage as
per norms
ANM and MPW (Male)
5142 4360 3593 767 1549
(Source-District Health Societies)
Thus, the sanctioned strength of ANM and MPW (Male) in 2,571 SCs of 13 sampled districts were less by 15 per cent than the IPHS norms for deployment of these personnel in SCs. Further, there was 767 vacant posts (18 per cent) of ANM and MPW (Male) against the sanctioned posts. The shortage had adverse effect on delivery of health services to rural population, as ANMs and MPWs (Male) were crucial service providers at the grass root level.
2.1.12.2 Primary Health Centre
As per IPHS and State Government norms one Doctor was to be posted at the PHC. As per information provided by SHS, out of 1,172 PHCs in the State, 503 PHCs were functioning without doctors as of April 2016. Further, Laboratory Technician and Pharmacist were not posted in 525 and 312 PHCs respectively.
The status of deployment of MOs and Para-Medical staff in 359 PHCs of 13 sampled districts was as detailed in Table 2.1.17.
Table 2.1.17: Status of manpower at PHCs of sampled districts
Name of posts Essential as
per IPHS
norms
Sanctioned
strength
Persons-
in-
position
Vacant as
per
sanctioned
posts
Shortage as
per IPHS
norms
Medical Officer 359 472 215 257 144
Para-Medical 2872 1504 975 529 1897
Total 3231 1976 1190 786 2041
(Source-District Health Societies)
Scarcity of man
power at all level of
health facilities was
noticed.
Audit Report on General and Social Sectors for the year ended 31 March 2016
42
Thus, there was shortfall of 257 doctors in 359 PHCs against the sanctioned strength. Further, 168 PHCs out of 359 were functioning without doctors, though as per deployment norms one doctor was to be posted in each PHC. Three19 PHCs which were declared as Basic Emergency Obstetric and Neonatal Care (BEmONC) institution were functioning without doctors.
2.1.12.3 Community Health Centre
Availability of specialist, medical officer and para-medical staff in 96 CHCs of 13 sampled districts was as in Table 2.1.18.
Table 2.1.18: Status of manpower at CHCs of sampled districts
Name of posts Essential as
per IPHS
norms
Sanctioned as
per State
Government
norms
Men-
in-
position
Vacant as
per
sanctioned
posts
Shortage as
per IPHS
norms
Specialist 480 346 13 333 467
Medical Officer (MO)
384 254 215 39 169
Para-Medical 2016 1639 1229 410 787
Total 2880 2239 1457 782 1423
(Source-District Health Societies)
Thus, there was shortage of Specialists, Medical Officers and Para-Medical staff in all CHCs against the sanctioned strength as well as IPHS norms. Except for seven20 CHCs, no Specialists (Surgeon, Gynaecologist, Paediatrician and Anaesthetic) were posted in remaining 89 CHCs. Further in comparison to IPHS norms, fewer Medical and Para-Medical Staffs were sanctioned by the State Government.
2.1.12.4 District Hospital
In 13 test-checked district hospitals, the status of Specialists, Medical Officer and para-medical staff was as in Table 2.1.19.
Table No.2.1.19: Status of manpower at DHs of sampled districts
Name of posts Essential as
per IPHS
norms
Sanctioned
as per State
Government
norms
Men-in-
position
Vacant as
per
sanctioned
posts
Shortage as
per IPHS
norms
Specialist 330 375 145 230 185
Medical Officer 240 288 258 30 -18
Para-Medical 2271 1684 1273 411 998
Total 2841 2347 1676 671 1165
(Source-District Health Societies)
19 PHCs-Kamkomohaniya (Dindori), Kandia and Ringnod (Ratlam). 20
One surgeon in CHC-Dhamnod, one Gynaecologist each in CHC-Kukshi (Dhar), CHC-Maheshwar (Khargone) and CHC-Mandideep (Raisen), one anaesthetic in CHC-Bajna (Ratlam), one paediatric each in CHC- Kukshi (Dhar), CHC-Khalwa (Khandwa), CHC-Bajna (Ratlam) and CHC-Niwari (Tikamgarh).
Chapter II: Performance Audit
43
Thus, the availability of specialist and para-medical staff was not ensured in DHs as per IPHS as well as State Government norms. Further, in three DHs (Anuppur, Dhar, Khandwa), the post of surgeon was lying vacant and in two DHs (Dhar and Tikamgarh) posts of Obstetric and Gynaecologist were lying vacant. The Paediatric was not posted in DHs, Dindori and Rajgarh and the post of Anaesthetic was lying vacant in Betul and Dhar.
In the exit conference, Principal Secretary stated that advertisement had been issued for filling of the posts of Medical Officers through Madhya Pradesh Public Service Commission and counselling of contract doctors was under process.
2.1.12.5 Accredited Social Health Activist (ASHAs)
ASHA works as an interface between the community and the public health system to promote health care at household level. ASHAs would reinforce community action for universal immunisation, safe delivery, newborn care and prevention of waterborne and other communicable diseases. ASHAs would also provide immediate and easy access for the rural population to essential health supplies like, ORS, contraceptives and a set of ten basic drugs for villagers.
Audit scrutiny revealed that 58,730 ASHAs were engaged in the State as of April 2016 against the requirement of 62,206 ASHAs. Hence, there was shortfall of 3,476 ASHAs.
As per information provided by SHS, drug kits were distributed to all the 58,730 ASHAs. However, verification of drug kits of 129 ASHAs in 13 test checked districts revealed that only six ASHAs had fully equipped kits containing all 16 drugs/items in the kit. The availability of drugs/items in remaining 123 ASHAs ranged from seven to 15. Significant items/drugs which were not found in the kit were thermometer, contraceptive pills, disposal delivery kit, etc. The important results of survey of 416 ASHAs revealed the following:
• Training: Under JSY, ASHAs were to be trained for normal delivery in case of emergency situations. However, 304 ASHAs surveyed were not trained for emergencies and did not have necessary equipment to conduct a normal delivery. This constrained them from effectively delivering the health care service.
• Usage of kits: 365 ASHAs did not have disposable delivery kits. Out of 41 ASHAs possessing the disposal delivery kits, eight did not know how to use it. Further, 268 ASHAs had blood pressure monitor, out of which 96 did not know how to use it. Likewise, 21, 7 and 30 ASHAs did not possess paracetamol tablets, iron pills and deworming pills respectively. This reduced the effectiveness of ASHA in delivering the mandated health services.
• Receipt of incentives: Under JSY, ASHAs should be paid incentives for each activity such as ANC, institutional delivery, PNC etc. Audit survey revealed that 113 ASHAs were paid incentives on time, 135 ASHAs got incentives usually in time, 97 ASHAs got incentives some times, five ASHAs got incentives rarely and four ASHAs never got incentives. 62 ASHAs did not
Audit Report on General and Social Sectors for the year ended 31 March 2016
44
give any specific response in this regard. This may demotivate the ASHAs in performing their duties diligently.
In the exit conference Principal Secretary stated that selection and training of ASHAs was a continuous process. The process of selection and recommendation of ASHAs begins at the level of Gram Panchayat, which meets only four times in a year, hence required ASHAs could not be selected.
The reply was not acceptable, as there was ASHAs who were not adequately trained to take reading of thermometer, blood pressure monitor and conduct normal delivery in case of emergencies.
2.1.13 Availability of essential drugs in health centres
Realizing the need to improve the availability of drugs in the Government health facilities, the Sardar Vallabh Bhai Patel Nishulk Aushadhi Vitaran
Yojana (Free Drug for All scheme) was launched in the State in November 2012. The main objective of the scheme was to guarantee the availability of minimum essential drugs free of cost to all patients across all the public health facilities of the state. During 2013-14 to 2015-16, an amount of ` 280.92 crore was allocated for procurement of drugs after inception of scheme ‘Free Drug for All scheme’ under NRHM, against which ` 244.28 crore was utilized.
IPHS has defined essential drugs list for each level of health facility. State Government has also issued its own essential drugs’ list for SCs, PHCs, CHCs and DHs under Madhya Pradesh Swasthya Sewa Guarantee Yojana. The status of availability of drugs in test checked 25 CHCs, 51 PHCs, 134 SCs and 13 DHs of 13 sampled districts was as summarised in Table 2.1.20.
Table 2.1.20: Status of drugs available as per IPHS and State Government norms
Name of
health
centre
facility
Essential drugs as per IPHS norms Essential drugs as per State Government
norms
Required Available
(Min./Max.)
Not
Available
(Min./Max.)
Required Available
(Min./Max.)
Not Available
(Min./Max.)
SC 43 11/39 04/32 24 02/20 04/22
PHC 148 24/128 20/124 71 15/70 01/56
CHC 176 54/162 14/122 107 42/104 3/65
DH 493 160/351 142/333 147 82/135 12/65
(Source-Test check of sampled health facilities)
Thus, essential drugs were not available in test checked health centres. Some of the essential drugs which were not found available in the test checked health facilities as per IPHS and State Government norms were Inj. Adrenaline, Inj. Ampicillin, Tab. Aminophylline, Tab. Cetrizine, Tab. Calcium etc.
During visit to health facilities, improper disposal of drugs were also noticed as depicted in the photographs below:
Essential drugs
were not
available
according to
prescribed
norms.
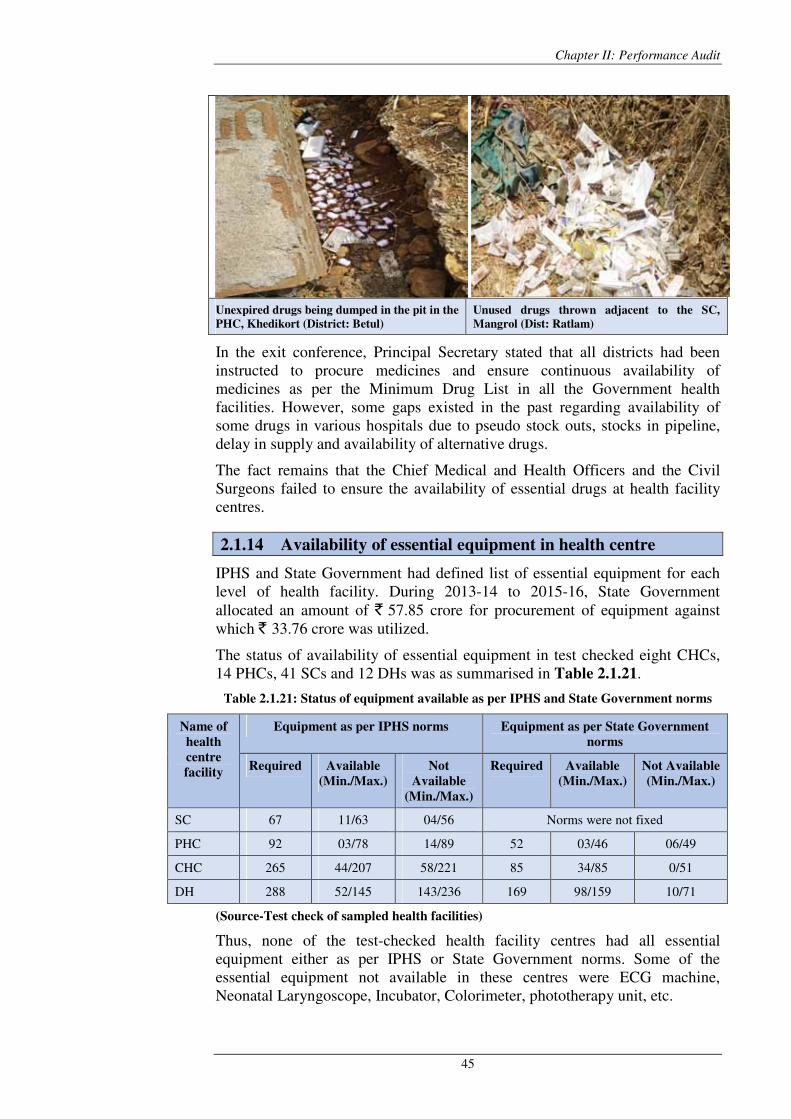
Chapter II: Performance Audit
45
Unexpired drugs being dumped in the pit in the
PHC, Khedikort (District: Betul)
Unused drugs thrown adjacent to the SC,
Mangrol (Dist: Ratlam)
In the exit conference, Principal Secretary stated that all districts had been instructed to procure medicines and ensure continuous availability of medicines as per the Minimum Drug List in all the Government health facilities. However, some gaps existed in the past regarding availability of some drugs in various hospitals due to pseudo stock outs, stocks in pipeline, delay in supply and availability of alternative drugs.
The fact remains that the Chief Medical and Health Officers and the Civil Surgeons failed to ensure the availability of essential drugs at health facility centres.
2.1.14 Availability of essential equipment in health centre
IPHS and State Government had defined list of essential equipment for each level of health facility. During 2013-14 to 2015-16, State Government allocated an amount of ` 57.85 crore for procurement of equipment against which ` 33.76 crore was utilized.
The status of availability of essential equipment in test checked eight CHCs, 14 PHCs, 41 SCs and 12 DHs was as summarised in Table 2.1.21.
Table 2.1.21: Status of equipment available as per IPHS and State Government norms
Name of
health
centre
facility
Equipment as per IPHS norms Equipment as per State Government
norms
Required Available
(Min./Max.)
Not
Available
(Min./Max.)
Required Available
(Min./Max.)
Not Available
(Min./Max.)
SC 67 11/63 04/56 Norms were not fixed
PHC 92 03/78 14/89 52 03/46 06/49
CHC 265 44/207 58/221 85 34/85 0/51
DH 288 52/145 143/236 169 98/159 10/71
(Source-Test check of sampled health facilities)
Thus, none of the test-checked health facility centres had all essential equipment either as per IPHS or State Government norms. Some of the essential equipment not available in these centres were ECG machine, Neonatal Laryngoscope, Incubator, Colorimeter, phototherapy unit, etc.
Audit Report on General and Social Sectors for the year ended 31 March 2016
46
In the exit conference Principal Secretary stated that State Government had prepared vital, essential and desirable equipment lists and efforts were being made to ensure availability of all vital equipment at all health facilities.
However, State Government had not fixed timelines for providing the vital and essential equipments in the health facility centres.
2.1.15 Availability of laboratory services in health centres
IPHS has defined laboratory services for each level of health centres. Further State Government has also issued its own list of laboratory services for SC, PHC, CHC and DH under Madhya Pradesh Swasthya Sewa Guarantee
Yojana. These services were to be available at these centres all the time.
The status of laboratory services in 13 DHs, 24 CHCs, 52 PHCs and 149 SCs test checked health centres were as detailed in Table 2.1.22.
Table 2.1.22: Position of laboratory services available as per IPHS and
State Government norms
Name of
health
centre
facility
Laboratory services as per IPHS norms Laboratory services as per
State Government norms
Required Available
(Min./Max)
Not
Available
(Min./Max.)
Required Available
(Min./Max)
Not
Available
(Min./Max)
SC 04 01/04 0/3 05 3/5 0/2
PHC 21 01/21 0/20 16 0/16 0/16
CHC 36 12/31 05/24 28 16/28 0/12
DH 97 37/66 31/60 48 31/46 2/17
(Source-Test check of sampled health facilities)
Thus, any of the test-checked health facility centres were not providing all laboratory services either as per IPHS norms or as per State norms. Further scrutiny of 52 test-checked PHCs revealed that eight21 PHCs were not providing any laboratory services.
In the exit conference, Principal Secretary stated that efforts were being made for all laboratory testing at the health centres. Diagnostic test counts in the districts were being monitored, which were under active surveillance.
2.1.16 Mobile Medical Units
The objective of Mobile Medical Units (MMUs) was to take health care to the door step of the public in the underserved, rural and hard to reach areas. MMUs were operated through service providers selected by SHS as per mutually agreed terms and conditions.
During the year 2011-12 to 2015-16, against the allocated funds of ` 103.65 crore funds for operation of MMU, only ` 57.03 crore could be utilized due to which MMU services could not be provided in all identified
21 PHC-Khandanbujurg, Satipura, (Dhar), Barud (Khandwa), Bisalwaskala,
Bordiyakala (Neemuch), Barach (Panna), Goghatpur and Sonwaria (Rajgarh).
Services of MMUs
could not be
provided up to the
targeted level.
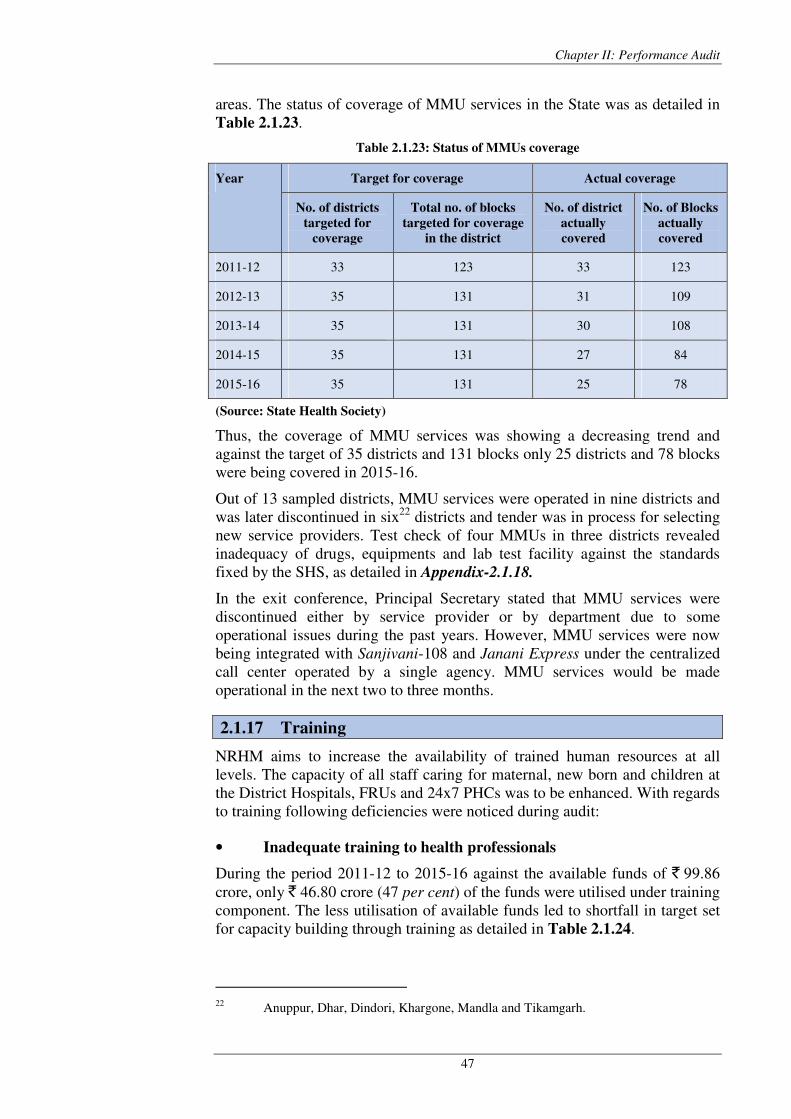
Chapter II: Performance Audit
47
areas. The status of coverage of MMU services in the State was as detailed in Table 2.1.23.
Table 2.1.23: Status of MMUs coverage
Year Target for coverage Actual coverage
No. of districts
targeted for
coverage
Total no. of blocks
targeted for coverage
in the district
No. of district
actually
covered
No. of Blocks
actually
covered
2011-12 33 123 33 123
2012-13 35 131 31 109
2013-14 35 131 30 108
2014-15 35 131 27 84
2015-16 35 131 25 78
(Source: State Health Society)
Thus, the coverage of MMU services was showing a decreasing trend and against the target of 35 districts and 131 blocks only 25 districts and 78 blocks were being covered in 2015-16.
Out of 13 sampled districts, MMU services were operated in nine districts and was later discontinued in six22 districts and tender was in process for selecting new service providers. Test check of four MMUs in three districts revealed inadequacy of drugs, equipments and lab test facility against the standards fixed by the SHS, as detailed in Appendix-2.1.18.
In the exit conference, Principal Secretary stated that MMU services were discontinued either by service provider or by department due to some operational issues during the past years. However, MMU services were now being integrated with Sanjivani-108 and Janani Express under the centralized call center operated by a single agency. MMU services would be made operational in the next two to three months.
2.1.17 Training
NRHM aims to increase the availability of trained human resources at all levels. The capacity of all staff caring for maternal, new born and children at the District Hospitals, FRUs and 24x7 PHCs was to be enhanced. With regards to training following deficiencies were noticed during audit:
• Inadequate training to health professionals
During the period 2011-12 to 2015-16 against the available funds of ` 99.86 crore, only ` 46.80 crore (47 per cent) of the funds were utilised under training component. The less utilisation of available funds led to shortfall in target set for capacity building through training as detailed in Table 2.1.24.
22 Anuppur, Dhar, Dindori, Khargone, Mandla and Tikamgarh.
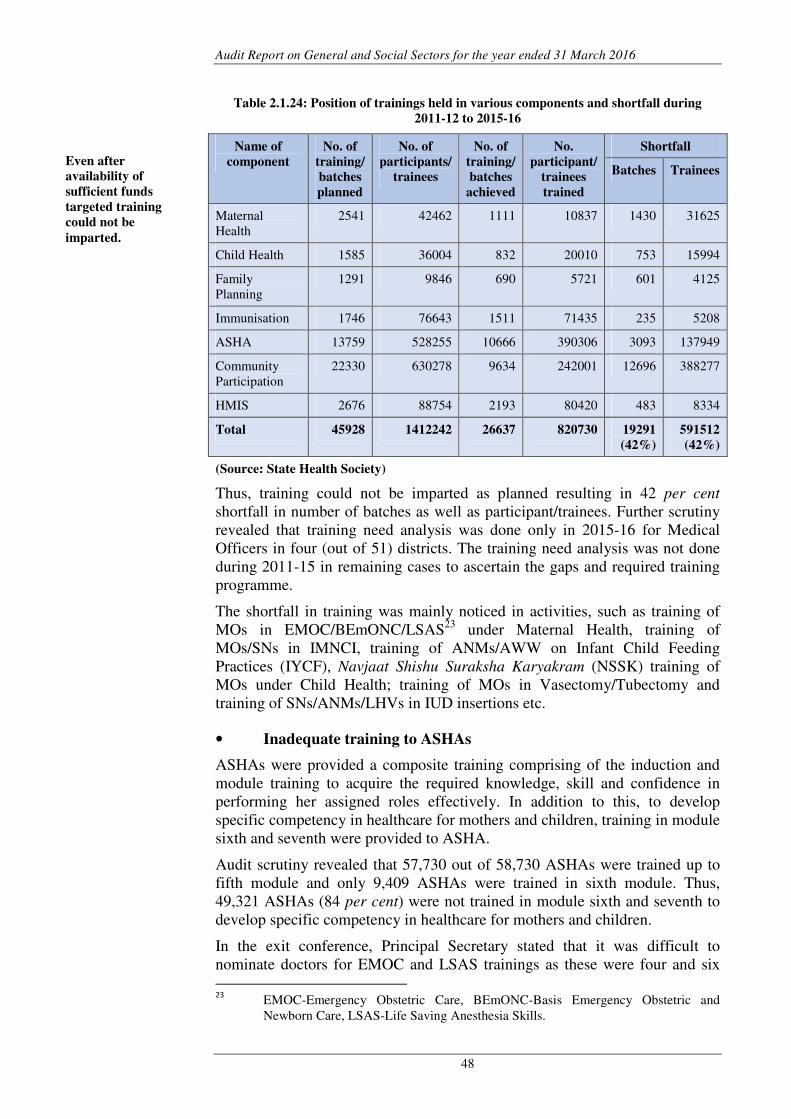
Audit Report on General and Social Sectors for the year ended 31 March 2016
48
Table 2.1.24: Position of trainings held in various components and shortfall during
2011-12 to 2015-16
Name of
component
No. of
training/
batches
planned
No. of
participants/
trainees
No. of
training/
batches
achieved
No.
participant/
trainees
trained
Shortfall
Batches Trainees
Maternal Health
2541 42462 1111 10837 1430 31625
Child Health 1585 36004 832 20010 753 15994
Family Planning
1291 9846 690 5721 601 4125
Immunisation 1746 76643 1511 71435 235 5208
ASHA 13759 528255 10666 390306 3093 137949
Community Participation
22330 630278 9634 242001 12696 388277
HMIS 2676 88754 2193 80420 483 8334
Total 45928 1412242 26637 820730 19291
(42%)
591512
(42%)
(Source: State Health Society)
Thus, training could not be imparted as planned resulting in 42 per cent shortfall in number of batches as well as participant/trainees. Further scrutiny revealed that training need analysis was done only in 2015-16 for Medical Officers in four (out of 51) districts. The training need analysis was not done during 2011-15 in remaining cases to ascertain the gaps and required training programme.
The shortfall in training was mainly noticed in activities, such as training of MOs in EMOC/BEmONC/LSAS23 under Maternal Health, training of MOs/SNs in IMNCI, training of ANMs/AWW on Infant Child Feeding Practices (IYCF), Navjaat Shishu Suraksha Karyakram (NSSK) training of MOs under Child Health; training of MOs in Vasectomy/Tubectomy and training of SNs/ANMs/LHVs in IUD insertions etc.
• Inadequate training to ASHAs
ASHAs were provided a composite training comprising of the induction and module training to acquire the required knowledge, skill and confidence in performing her assigned roles effectively. In addition to this, to develop specific competency in healthcare for mothers and children, training in module sixth and seventh were provided to ASHA.
Audit scrutiny revealed that 57,730 out of 58,730 ASHAs were trained up to fifth module and only 9,409 ASHAs were trained in sixth module. Thus, 49,321 ASHAs (84 per cent) were not trained in module sixth and seventh to develop specific competency in healthcare for mothers and children.
In the exit conference, Principal Secretary stated that it was difficult to nominate doctors for EMOC and LSAS trainings as these were four and six 23
EMOC-Emergency Obstetric Care, BEmONC-Basis Emergency Obstetric and Newborn Care, LSAS-Life Saving Anesthesia Skills.
Even after
availability of
sufficient funds
targeted training
could not be
imparted.
Chapter II: Performance Audit
49
months duration trainings. Refresher training for ANMs commenced late during 2015-16 as there was issue regarding budget distribution per batch. Further, there was difficulty in collection and compilation of training data, hence, there was need of training MIS.
Thus, the capacity building of medical and para-medical staff could not be done through training and orientation programme to enhance the service delivery at health facility level, even after availability of adequate funds.
2.1.18 Quality Assurance
Quality Assurance (QA) standards under NRHM are prescribed in Operational Guidelines for Quality Assurance in Public Health Facilities 2013. As per the guidelines for strengthening the QA activities, organisation arrangements are to be ensured through State Quality Assurance Committee (SQAC), District Quality Assurance Committee (DQAC) and District Quality Team (DQT) at respective levels with defined roles and responsibilities.
SHS intimated that in the light of Guidelines for Quality Assurance received from GoI, MoHFW in September 2014, SQAC, DQAC and DQT were re-constituted in September 2014. During 2013-14 to 2015-16, against allocated funds of ` 6.85 crore for QA activities, only ` 0.60 crore (nine per cent) was utilised. Audit noticed that less utilisation of funds resulted in poor implementation of QA as discussed below:
• As per guidelines, the SQAC and DQAC would meet at least once in six months and three months respectively. During the year 2014-15, only one meeting and in 2015-16 two meetings of SQAC were held. Further, in 13 test-checked districts, against required 52 DQAC meetings in each year, only 26, 40 and 48 meetings were reported to be held in 2013-14, 2014-15 and 2015-16 respectively. However, copies of minutes of meetings were not furnished to audit.
• To ensure QA at field level, no criteria were prescribed for the field visits by SQAC. However, 41 field visits were conducted in 2015-16. Similarly, regular field visits by DQAC were conducted in eight districts only during 2013-16.
During 2013-14 and 2014-15, no orientation/training programme was planned or conducted in 13 test-checked districts, except Tikamgarh and Raisen. Further, in 2015-16 these were conducted in Anuppur, Raisen, Rajgarh, Ratlam and Tikamgarh districts only.
• Guidelines prescribed reporting and review of key performance indicators24 (KPI) to assess overall quality care performed by various departments of the health facility. However, only eight DHs in 2014-15 and 26 DHs in 2015-16 were reporting the data on key performance. The negligible reporting of KPIs indicates that quality assurance programme could not be implemented at all level.
24 Critical data for assessment and monitoring of performance indicators of all the
departments in the health facility.
Quality Assurance
could not be
implemented in the
State as prescribed
in the guidelines.
Audit Report on General and Social Sectors for the year ended 31 March 2016
50
SHS intimated that no public health care facility in the State qualified for State and National level certification in terms of quality assurance. However, audit noticed that DH Khandwa has been awarded State (Kayakalp) and National level certification for promoting cleanliness, hygiene and infection control in 2015-16.
In the exit conference, Principal Secretary stated that the SQAC and DQAC were reconstituted in September 2014, hence less number of meetings was held. Further, staff of hospitals needs to be trained in KPI reporting.
2.1.18.1 Quality Assurance in District Hospital (DH)
Quality Assurance has 70 standards categorized into eight broad areas of concern i.e. Service Provision, Patient Rights, Input, Support Services, Clinical Care, Infection Control, Quality Management and Outcome. Audit scrutiny in 13 DHs revealed the following shortcomings:
• Internal Quality Team (IQT) was formed during December 2015 to July 2016 in all 13 DHs except Dhar. However, Standard Operating Procedure (SOPs) and QA guidelines was not available in DH, Anuppur, Dhar, Neemuch and Khargone. Orientation/training of staff for quality standards/SOPs was not conducted in DH, Anuppur, Dhar, Khargone and Tikamgarh.
• DQT should meet once every month. However, no meeting was conducted in 2013-14 and 2014-15, except in DH-Ratlam. Further, against required 156 meetings of DQT in 13 test-checked DHs in 2015-16, only 27 meetings were held.
• Internal assessment of DH was not conducted in 2013-14. In 2014-15, only two internal assessments were conducted, one at DH, Rajgarh and one at DH, Ratlam. In the year 2015-16, DH, Dhar, Panna and Tikamgarh did not conduct any internal assessment. Remaining 10 DHs conducted 24 internal assessments of which reports of only 20 were available.
• Patient satisfaction survey was not conducted in any test checked DH during 2013-14 and 2014-15. In 2015-16, patient satisfaction survey was conducted only in DHs Anuppur, Dindori and Neemuch.
• KPI were not prepared in DH Anuppur, Dhar and Dindori. In remaining 10 DHs, preparation and reporting of KPIs to SQAC/DQAC started from December 2015 to April 2016.
• Periodic assessment of DHs by DQAC and SQAC was not conducted in 2013-14 and 2014-15 in any of the 13 DHs test checked. In 2015-16, DQAC assessed five25 DHs and SQAC assessed five26 DHs.
In the exit conference, Principal Secretary stated that instructions had been issued to all districts for constitution of DQT. SOPs had been sent to the districts and instructed the districts to impart training on SOP for its implementation.
25 Khandwa, Neemuch, Panna, Rajgarh and Ratlam. 26 Khandwa, Panna, Rajgarh, Ratlam and Tikamgarh.
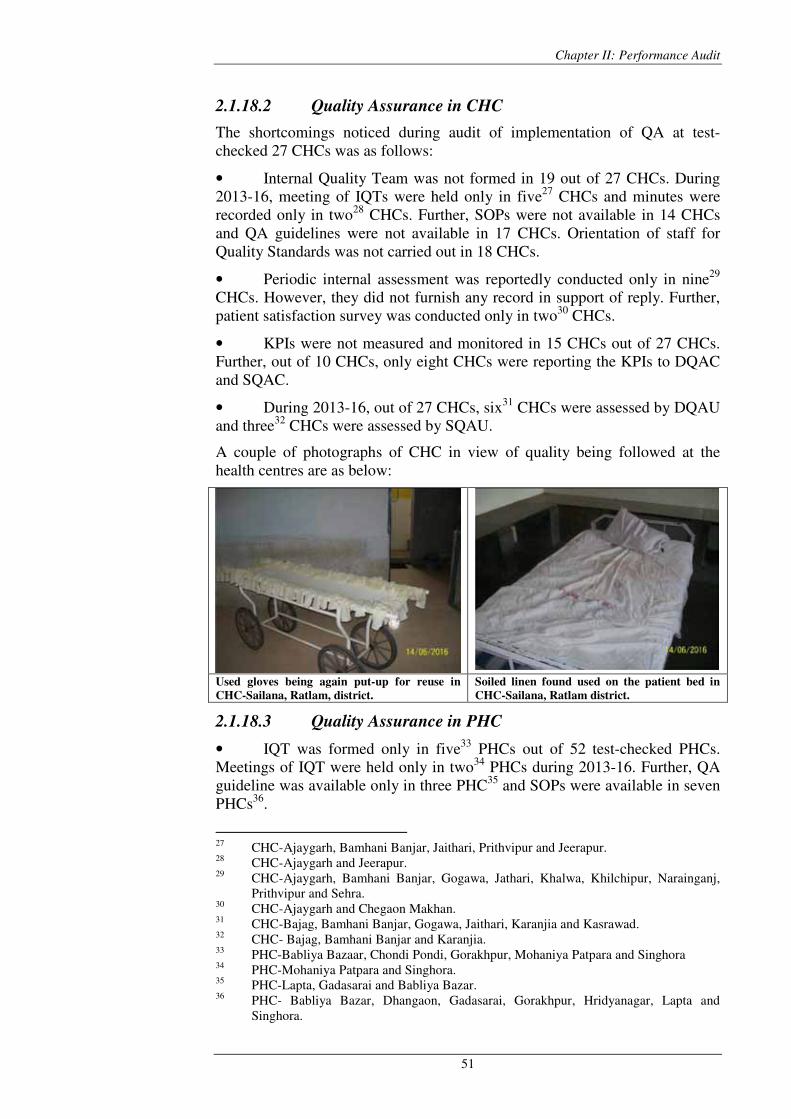
Chapter II: Performance Audit
51
2.1.18.2 Quality Assurance in CHC
The shortcomings noticed during audit of implementation of QA at test-checked 27 CHCs was as follows:
• Internal Quality Team was not formed in 19 out of 27 CHCs. During 2013-16, meeting of IQTs were held only in five27 CHCs and minutes were recorded only in two28 CHCs. Further, SOPs were not available in 14 CHCs and QA guidelines were not available in 17 CHCs. Orientation of staff for Quality Standards was not carried out in 18 CHCs.
• Periodic internal assessment was reportedly conducted only in nine29 CHCs. However, they did not furnish any record in support of reply. Further, patient satisfaction survey was conducted only in two30 CHCs.
• KPIs were not measured and monitored in 15 CHCs out of 27 CHCs. Further, out of 10 CHCs, only eight CHCs were reporting the KPIs to DQAC and SQAC.
• During 2013-16, out of 27 CHCs, six31 CHCs were assessed by DQAU and three32 CHCs were assessed by SQAU.
A couple of photographs of CHC in view of quality being followed at the health centres are as below:
Used gloves being again put-up for reuse in
CHC-Sailana, Ratlam, district.
Soiled linen found used on the patient bed in
CHC-Sailana, Ratlam district.
2.1.18.3 Quality Assurance in PHC
• IQT was formed only in five33 PHCs out of 52 test-checked PHCs. Meetings of IQT were held only in two34 PHCs during 2013-16. Further, QA guideline was available only in three PHC35 and SOPs were available in seven PHCs36.
27 CHC-Ajaygarh, Bamhani Banjar, Jaithari, Prithvipur and Jeerapur. 28 CHC-Ajaygarh and Jeerapur. 29 CHC-Ajaygarh, Bamhani Banjar, Gogawa, Jathari, Khalwa, Khilchipur, Narainganj,
Prithvipur and Sehra. 30 CHC-Ajaygarh and Chegaon Makhan. 31 CHC-Bajag, Bamhani Banjar, Gogawa, Jaithari, Karanjia and Kasrawad. 32 CHC- Bajag, Bamhani Banjar and Karanjia. 33 PHC-Babliya Bazaar, Chondi Pondi, Gorakhpur, Mohaniya Patpara and Singhora 34 PHC-Mohaniya Patpara and Singhora. 35 PHC-Lapta, Gadasarai and Babliya Bazar. 36 PHC- Babliya Bazar, Dhangaon, Gadasarai, Gorakhpur, Hridyanagar, Lapta and
Singhora.
Audit Report on General and Social Sectors for the year ended 31 March 2016
52
• Periodic internal assessment was reportedly conducted in two37 PHCs. However, no records were available in support of the same. Further, patient satisfaction survey was not conducted in any of the 52 test-checked PHCs.
• KPIs were measured only in three38 PHCs and reported only in one PHC-Sendhwal, out 52 test-checked PHCs. However, no records were furnished in this regard.
In the exit conference, Principal Secretary stated that guidebook for quality assurance for DH and CHC/PHC was released by GoI in the year 2014 and 2015 respectively. State QA cell instructed the districts to conduct periodic assessment. Implementation of QA Programme at CHC and PHC level would be done in year 2017-18. Reporting of KPIs was an integral part of QA programme, therefore, KPIs from CHC and PHC would be captured only after the training of service providers.
2.1.19 Beneficiary Survey
In 13 test checked districts out of 1,386 beneficiaries surveyed audit noticed:
• Registration of pregnancy: Of the 1,386 beneficiaries surveyed, 1,314 (95 per cent) were registered in time, 51 (4 per cent) beneficiaries were registered between four to six months of their pregnancies and 14 (1 per cent) were registered between six to nine months and seven beneficiaries did not know about registration of their pregnancies.
• Knowledge about due date: 1,271 beneficiaries knew about due date of their delivery, whereas 115 (8 per cent) beneficiaries did not know about their due date of delivery.
• Ante-Natal Care (ANC): Pregnant women are required to visit the facilities at least four time for ANCs. In the beneficiary survey audit found that seven beneficiaries visited health centre or hospital just once, 73 (5 per cent) beneficiaries visited the health centre or hospital twice and 345 (25 per cent) beneficiaries visited the health centre or hospital thrice and 956 beneficiaries visited health centre or hospital four times or more. Five beneficiaries did not visit any health centre or hospital.
• Under the scheme guidelines, ASHAs are required to visit beneficiary homes at least thrice during pregnancy period. ASHAs visits to beneficiary homes in the sample, during pregnancy period was once for three pregnant women, twice for 48 (3 per cent) pregnant women, thrice for 132 (10 per cent) pregnant women and four and above times for 1,163 (84 per cent) pregnant women. 40 beneficiaries were not aware whether ASHAs visited them. Thus, the required visits were not ensured.
• NRHM is being implemented with the objective of reducing maternal and neo-natal mortality by promoting institutional delivery among the poor pregnant women. 1,259 (91 per cent) beneficiaries delivered at health facilities (DH-444 beneficiaries, CHC-309 beneficiaries, PHC-479 beneficiaries, SC-27 beneficiaries), 47 beneficiaries delivered at private hospitals, 77 beneficiaries
37 PHC- Chanda and Singhora. 38 PHC- Chanda, Kukdeshwar and Sendhwal.
Chapter II: Performance Audit
53
delivered at home and three delivered in transit. Beneficiaries, who did not deliver in the institution stated that the family did not allow and some stated that they were not interested/not necessary to deliver at institution. Thus, the ANMs/ASHAs failed to advocate the benefits of institutional deliveries in the rural areas.
• Ambulance availability: As per Janani Express Yojana, referral transport facility should be made available free of cost to pregnant women. It was noticed that out of 1,386 beneficiaries, 1,065 (77 per cent) beneficiaries called the ambulances, whereas 321 (23 per cent) beneficiaries did not call the ambulance. Further, ambulances arrived in time in 1,026 (96 per cent) cases and did not arrive in time in 39 (4 per cent) cases.
• Stay in health facility: As per Janani Suraksha Yojana, beneficiaries are to stay in the hospital facility for at least 48 hours after delivery. Audit survey revealed that out of 1,386 beneficiaries, 1,309 were institutional deliveries, wherein 43 (3 per cent) beneficiaries stayed in the health facility after delivery up to 12 hours, 246 (19 per cent) beneficiaries stayed in the health institutions after delivery for 12-24 hours, 194 (15 per cent) beneficiaries stayed in the health institution after delivery for 24-48 hours and 820 (63 per cent) beneficiaries stayed more than 48 hours after delivery. Six beneficiaries did not remember/did know how long they stayed at the health facility. Thus, provision of the guidelines were not adhered to in 483 cases (37 per cent) cases.
• 1,112 beneficiaries were provided food in health institutions free of cost, whereas nine beneficiaries had to pay for the food provided and no food was provided to 59 (4 per cent) beneficiaries. 21 beneficiaries did not remember whether they got food for free or they paid for it. 108 beneficiaries did not give any specific response in this regard.
• JSY cash incentive: Under JSY, every women is entitled for cash incentive of ` 1,400 in rural areas and ` 1,000 in urban areas immediately after her institutional delivery. Audit survey revealed that 1,017 beneficiaries were paid incentives, while 369 beneficiaries were not paid incentives under JSY. Out of 1,017 beneficiaries, 748 women received JSY benefits with delay of one to 30 days, 269 women received with delay of 30 to 90 days.
• Post natal care (PNC): Under the guidelines, new mothers are required to visit health facilities at least four times within 42 days of delivery for PNCs. Audit survey revealed that 88 beneficiaries visited the medical facilities only once for PNC, 246 beneficiaries visited the medical facilities twice, 527 beneficiaries visited the medical facilities three times and 501 visited the health facilities for four or more times. 24 beneficiaries did not visit any health facilities for PNC. Thus, Medical Officers, ANMs and ASHAs failed to promote and mobilise the beneficiaries of the benefits of post natal care.
• Under the guidelines, health workers are to visit beneficiary’s home at least twice within seven days from the date of delivery. In 1,233 cases health worker visited beneficiaries home within two-seven days, in 144 (10 per cent) cases health worker did not visit the beneficiaries home within seven days to
Audit Report on General and Social Sectors for the year ended 31 March 2016
54
check the mother and baby and in nine cases beneficiaries did know about the visit requirement of health workers.
• 1,362 beneficiaries received Vitamin-A dose, 16 beneficiaries did not receive Vitamin-A dose and eight beneficiaries were not aware of this service.
• Gender balance was one of objectives of the Mission. However, gender inequalities were seen, where in view of pregnancy outcome, against birth of 771 male children, 595 female births were noticed among the surveyed beneficiaries.
• Though the target was to minimise the TFR rate up to 2.1, however, it was noticed that 332 women were having three or more children and 37 women were having more than five children among the surveyed beneficiaries.
• 378 women gave birth by normal delivery at District Hospitals, ignoring the PHC/CHC which existed in the vicinity of their residence, which shows that the PHCs and CHCs could not instil the confidence of the quality of the health care services being provided by them.
In the exit conference, Principal Secretary stated that number of deliveries in DHs was more as compared to rural health institutions, as DHs had full comprehensive obstetric and neonatal care facility. Close monitoring of deliveries at sub district level delivery points was being ensured and gaps in terms of human resources, civil works, equipment and capacity building were being addressed.
2.1.20 Data collection, management and reporting
2.1.20.1 Health Management Information System
The HMIS is a web based data entry application designed by Ministry of Health and Family Welfare for capturing of data, which helps in gathering, aggregating, analysing and then using the information for taking actions to improve performance of health systems at all levels.
As per HMIS operational manual SC, PHC and CHC would report their data on monthly basis to the Block in the format prescribed for their facility on 5th of following month at the Block level, further the Block would consolidate these data to prepare the 'Block Consolidated Report' and the same would be submitted to the district.
Two copies of the data set would be prepared by health facilities, one copy should be transmitted and the one would be filed in the facility records after being duly signed by the authority. At the Block or District level where the facility data sets are received, it should be ensured that these are duly signed and verified, before the data entry for these are undertaken. A paper copy of the generated report must be verified (signed and stamped) and maintained at the district level and other copy should be sent to the State.
SHS informed (July 2016) that each health facility prepared HMIS data in two copies in the prescribed format and reported timely, one copy was transmitted to the Block Programme Management Unit (BPMU) and one was kept in the
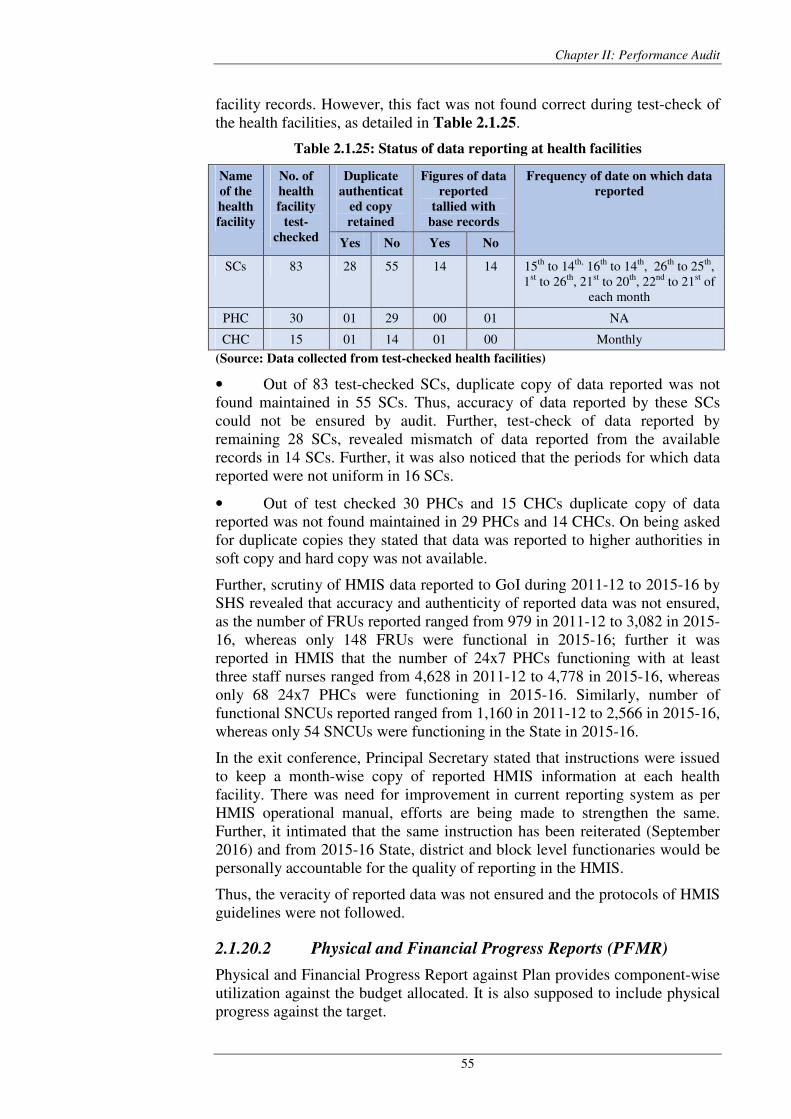
Chapter II: Performance Audit
55
facility records. However, this fact was not found correct during test-check of the health facilities, as detailed in Table 2.1.25.
Table 2.1.25: Status of data reporting at health facilities
Name
of the
health
facility
No. of
health
facility
test-
checked
Duplicate
authenticat
ed copy
retained
Figures of data
reported
tallied with
base records
Frequency of date on which data
reported
Yes No Yes No
SCs 83 28 55 14 14 15th to 14th, 16th to 14th, 26th to 25th, 1st to 26th, 21st to 20th, 22nd to 21st of
each month
PHC 30 01 29 00 01 NA
CHC 15 01 14 01 00 Monthly
(Source: Data collected from test-checked health facilities)
• Out of 83 test-checked SCs, duplicate copy of data reported was not found maintained in 55 SCs. Thus, accuracy of data reported by these SCs could not be ensured by audit. Further, test-check of data reported by remaining 28 SCs, revealed mismatch of data reported from the available records in 14 SCs. Further, it was also noticed that the periods for which data reported were not uniform in 16 SCs.
• Out of test checked 30 PHCs and 15 CHCs duplicate copy of data reported was not found maintained in 29 PHCs and 14 CHCs. On being asked for duplicate copies they stated that data was reported to higher authorities in soft copy and hard copy was not available.
Further, scrutiny of HMIS data reported to GoI during 2011-12 to 2015-16 by SHS revealed that accuracy and authenticity of reported data was not ensured, as the number of FRUs reported ranged from 979 in 2011-12 to 3,082 in 2015-16, whereas only 148 FRUs were functional in 2015-16; further it was reported in HMIS that the number of 24x7 PHCs functioning with at least three staff nurses ranged from 4,628 in 2011-12 to 4,778 in 2015-16, whereas only 68 24x7 PHCs were functioning in 2015-16. Similarly, number of functional SNCUs reported ranged from 1,160 in 2011-12 to 2,566 in 2015-16, whereas only 54 SNCUs were functioning in the State in 2015-16.
In the exit conference, Principal Secretary stated that instructions were issued to keep a month-wise copy of reported HMIS information at each health facility. There was need for improvement in current reporting system as per HMIS operational manual, efforts are being made to strengthen the same. Further, it intimated that the same instruction has been reiterated (September 2016) and from 2015-16 State, district and block level functionaries would be personally accountable for the quality of reporting in the HMIS.
Thus, the veracity of reported data was not ensured and the protocols of HMIS guidelines were not followed.
2.1.20.2 Physical and Financial Progress Reports (PFMR)
Physical and Financial Progress Report against Plan provides component-wise utilization against the budget allocated. It is also supposed to include physical progress against the target.
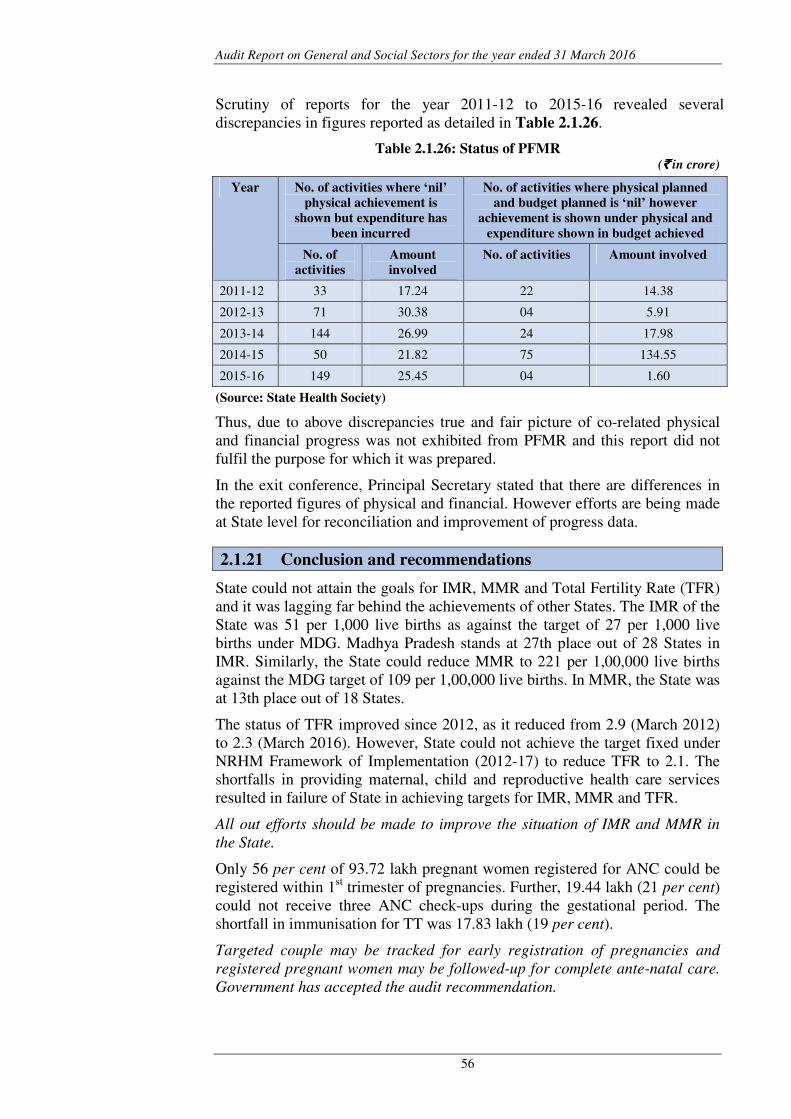
Audit Report on General and Social Sectors for the year ended 31 March 2016
56
Scrutiny of reports for the year 2011-12 to 2015-16 revealed several discrepancies in figures reported as detailed in Table 2.1.26.
Table 2.1.26: Status of PFMR (`̀̀̀ in crore)
Year No. of activities where ‘nil’
physical achievement is
shown but expenditure has
been incurred
No. of activities where physical planned
and budget planned is ‘nil’ however
achievement is shown under physical and
expenditure shown in budget achieved
No. of
activities
Amount
involved
No. of activities Amount involved
2011-12 33 17.24 22 14.38
2012-13 71 30.38 04 5.91
2013-14 144 26.99 24 17.98
2014-15 50 21.82 75 134.55
2015-16 149 25.45 04 1.60
(Source: State Health Society)
Thus, due to above discrepancies true and fair picture of co-related physical and financial progress was not exhibited from PFMR and this report did not fulfil the purpose for which it was prepared.
In the exit conference, Principal Secretary stated that there are differences in the reported figures of physical and financial. However efforts are being made at State level for reconciliation and improvement of progress data.
2.1.21 Conclusion and recommendations
State could not attain the goals for IMR, MMR and Total Fertility Rate (TFR) and it was lagging far behind the achievements of other States. The IMR of the State was 51 per 1,000 live births as against the target of 27 per 1,000 live births under MDG. Madhya Pradesh stands at 27th place out of 28 States in IMR. Similarly, the State could reduce MMR to 221 per 1,00,000 live births against the MDG target of 109 per 1,00,000 live births. In MMR, the State was at 13th place out of 18 States.
The status of TFR improved since 2012, as it reduced from 2.9 (March 2012) to 2.3 (March 2016). However, State could not achieve the target fixed under NRHM Framework of Implementation (2012-17) to reduce TFR to 2.1. The shortfalls in providing maternal, child and reproductive health care services resulted in failure of State in achieving targets for IMR, MMR and TFR.
All out efforts should be made to improve the situation of IMR and MMR in
the State.
Only 56 per cent of 93.72 lakh pregnant women registered for ANC could be registered within 1st trimester of pregnancies. Further, 19.44 lakh (21 per cent) could not receive three ANC check-ups during the gestational period. The shortfall in immunisation for TT was 17.83 lakh (19 per cent).
Targeted couple may be tracked for early registration of pregnancies and
registered pregnant women may be followed-up for complete ante-natal care.
Government has accepted the audit recommendation.
Chapter II: Performance Audit
57
Out of total 74.28 lakh pregnant women received three ANC check-ups, HIV testing of 47.27 lakh (64 per cent) women and VDRL testing of 60.34 lakh (81 per cent) pregnant women were not conducted for management of adverse pregnancy outcomes in case of infected mothers.
Screening of pregnant women for HIV and VDRL tests may be enhanced at
point of care. Government has accepted the audit recommendation.
Institutional delivery was 87 per cent of the total deliveries in the State during 2011-16. However, only 49.72 lakh beneficiaries out of 55.38 lakh deliveries in public institutions were paid JSY incentive. Further, 8.96 lakh were total home deliveries in the State during 2011-16, out of which 6.65 lakh (74 per
cent) were not attended by SBA trained health professionals. Out of 55.38 lakh deliveries in public institutions during 2011-16, 15.26 lakh (28 per cent) were discharged within 48 hours of delivery and only 35.21 lakh (55 per cent) mothers received postpartum check-up between 48 hours to 14 days after delivery.
Districts and blocks with high home delivery and less institutional delivery
may be earmarked for promotion of institutional delivery through awareness
programme, social mobilization and assured referral transport services.
In the 13 test checked districts, it was noticed that out of 8.53 lakh institutional delivery in these districts, pick-up services to 4.91 lakh (57 per cent) and drop-back services to 4.09 lakh women (48 per cent) could be provided during 2011-12 to 2015-16.
The offer of free pick-up and drop-back may be given wide publicity, so that
the facilities are utilised by the rural population.
Female sex ratio at birth still needs improvement, wherein 33.36 lakh female births were reported in comparison to 35.89 lakh male birth during 2011-16. Moreover, the proportion of missing cases of deliveries was very high wherein 69.83 lakh total deliveries were reported against the total 93.72 lakh ANC registered.
System of follow-up and tracking of registered ANCs both in public and
private health institutions may be strengthened. Government has accepted the
audit recommendation.
Out of total 69.25 lakh live births in the State, 10.61 lakh babies were reported as low birth weight. However, 4.49 lakh babies were not weighed at the time of birth during 2011-16. Further, only 62.97 lakh newborns were breast fed within one hour of delivery.
All live births may be weighed after birth so that in case of LBW necessary
steps could be taken in view of health requirement. Government has accepted
the audit recommendation.
Targets set for child immunization against seven vaccine preventable disease could not be achieved during 2011-16 and the range of shortfall was 16 to 21 per cent in the State. Besides, Hepatitis-B Zero dose was to be provided to the infants up to 48 hours of age. However, against 69.25 lakh live births, only 39.30 lakh (57 per cent) infants could be vaccinated for Hepatitis B Zero dose.
Audit Report on General and Social Sectors for the year ended 31 March 2016
58
Gaps of immunization may be identified and full immunization of all infants
and children may be ensured.
Under comprehensive abortion care, MTP services were not provided in 25 sub-district level Hospital (out of 63) and 136 CHCs (out of 334). Out of 531 24x7 PHCs, MVA facilities were not available in 380 24x7 PHCs. Against 3.03 lakh vasectomy planned during the year 2011-16, only 0.83 lakh (27 per cent) male sterilization could be performed. Further, the achievement of female sterilization was 43 and 22 per cent against planned for minilap and post-partum sterilization respectively.
PHCs and CHCs may be strengthened to provide comprehensive abortion
care and the proportion of male sterilisation should be enhanced through
awarensss programme and social mobilisation. Government has accepted the
audit recommendation.
During the period 2011-16, bottom-up approach was not adopted in preparation of DHAPs. State PIPs and DHAPs were prepared without including activities of inter-sectoral convergence with the line department. State PIPs to GoI and DHAPs to SHS were neither submitted nor approved within the prescribed time limit.
Timely submission and approval of PIPs and DHAPs may be ensured by
including activities of inter-sectoral convergence. Government has accepted
the audit recommendation.
District Health Action Plans (DHAPs) was not prepared after aggregating Block Health Action Plans (BHAPs). Inter-sectoral convergence with the line department was not included in annual Programme Implementation Plan (PIP). Further, State PIPs were submitted to GoI with a delay ranging from 69 to 196 days during 2011-12 to 2015-16. Consequently, the approval of PIPs from GoI was received with a delay ranging from 72 to 223 days.
During the year 2011-16, GoI approved PIP for ` 6,247.01 crore against which only ` 5,269.70 crore was made available for implementation of NRHM in the State. Thus, Government could not ensure sufficient fund for implementation of the scheme, despite the dismal performance of State on health indicators.
Efforts should be made to receive the entire amount of PIPs approved by GoI
and optimum utilisation of funds should be ensured and funds may be released
in time so that all the activities planned in the PIP could be completed within
stipulated time. Government has accepted the audit recommendation.
The State had failed critically in creating sufficient rural health centres. There was shortfall of 2588 Sub-Centres (SCs) (22 per cent), 828 PHCs (41 per cent) and 153 CHCs (31 per cent) as against the population norms under NRHM. Out of total 9,192 SCs in the State, only 241 were providing delivery services. Upgradation of PHCs as 24x7 was one of the goals of NRHM. However, only 638 out of 1,172 PHCs were functioning 24x7. First Referral Unit (FRU) services were being provided at only 30 out of 334 CHCs in the State. Audit noticed lack of infrastructure in terms of wards, labour rooms, operation theatres, electric supply and toilets, etc.
Concerted efforts may be made to upgrade CHCs to FRUs and gaps in
availability of health facility infrastructure may be filled in accordance with
Chapter II: Performance Audit
59
population norms, with co-relation to availability of human resource in a
phased manner. Government has accepted the audit recommendation.
Out of 1,172 PHCs in the State, 503 PHCs were functioning without doctors as of April 2016. Further, Laboratory Technician and Pharmacist were not posted in 525 and 312 PHCs respectively. In 96 CHCs of sampled districts, only 13 specialists were available against sanctioned 346 specialists. Further, 58,730 Accredited Social Health Activists (ASHAs) were engaged in the State as of April 2016 against the requirement of 62,206 ASHAs.
Priority in engagement of health personnel may be ensured, so that manpower
could be made available at all level of health facilities. Government has
accepted the audit recommendation.
Under Madhya Pradesh Swasthya Seva Guarantee Yojana, Government was committed to provide minimum essential drugs and laboratory services for all types of health facility centres. However, none of the test-checked health facilities had all the listed drugs and laboratory services categorised under Madhya Pradesh Swasthya Seva Guarantee Yojana.
Minimum essential drugs and all prescribed laboratory services may be
ensured at all types of health centres.
The coverage of Mobile Medical Unit services was showing a decreasing trend and against the target of 35 districts and 131 blocks, only 25 districts and 78 blocks were being covered in 2015-16.
MMUs may be made fully functional in all the targeted districts as per
requirement utilising the available funds.
NRHM aims to increase the availability of trained human resources at all level. However, training could not be imparted as planned resulting in 42 per
cent shortfall in number of batches as well as trainees during 2011-16. Further, 57,730 out of 58,730 ASHAs were trained up to fifth module and only 9,409 ASHAs were trained in sixth module. Thus, 49,321 ASHAs (84 per cent) were not trained in module sixth and seventh to develop specific competency in healthcare for mothers and children.
Training programme as planned in the PIP may be imparted in order to make
health personnel capable enough to deliver all the required health services.
Quality assurance programme could not be implemented up to satisfactory level. State quality assurance committee and district quality assurance committees did not meet at prescribed intervals. Patient satisfaction survey was not conducted in 10 out of 13 test checked District Hospitals (DHs). Quality assurance programme was not implemented at CHC and PHC levels.
Quality assurance activities may be implemented at all levels of health
facilities.
There were gaps in capturing of data related to ANC, child care and immunization services provided in private health institutions. Further, entire data of delivery of pregnant women conducted in private health institutions and at home were also not reflected in HMIS.
HMIS should be strengthened in order to capture data of all health services
done at all levels in the State.
Audit Report on General and Social Sectors for the year ended 31 March 2016
60
Home Department
2.2 Modernisation of Madhya Pradesh Police Force
Executive Summary
'Police' is a State subject and it is primarily the responsibility of the State to modernise and adequately equip the police forces. The Modernisation of Police Forces (MPF) scheme was launched by Ministry of Home Affairs (MHA), Government of India (GoI) in 1969 to effectively face the emerging challenges to internal security. The scheme was revised during 2000-01 and extended for a period of five years from 2012-13. The major components covered in the scheme are: police housing and building, mobility, weaponry, forensic science, communication and other infrastructure.
A Performance Audit of 'Modernisation of Madhya Pradesh Police Force' for the period 2011-12 to 2015-16 revealed the following:
Planning
The scheme guidelines provided for identification of resource envelop for the State and include joint resource planning to avoid duplication of efforts. During 2011-16, other Central and State schemes contributed ` 999.93 crore for infrastructure development of the State police. However, Annual Action Plan (AAP) of the State did not include joint resource planning to optimise utilisation of fund. Further, there were inordinate delays ranging from 55 to 102 days in submission of AAPs to the MHA during 2011-16, which resulted in consequential delays in approval of AAPs. Thus, there was little time left to implement the scheme as per plan and utilise the funds during the same year.
(Paragraph 2.2.7)
Financial Management
During 2011-16, expenditure in the State on MPF was ` 316.47 crore against total available fund of ` 349.53 crore. However, the progress of expenditure against available funds was slow and improved largely during 2015-16 in which ` 163.65 crore (52 per cent of total ` 316.47 crore) was incurred. Slow progress of expenditure led to short release of ` 92.79 crore of Central share for implementation of MPF in the State. For the period 2015-16, Central share of ` 23.42 crore released by MHA to GoMP as well as the State Share of ` 17.87 crore was not released to the Department even till the end of March 2016.
(Paragraph 2.2.8)
Impact of the scheme in filling up identified gaps
Bureau of Police Research and Development (BPRD) Study Report on 'Modernisation and upgradation of Police Infrastructure: A Five Year Projection' published in March 2000 highlighted the gap for various police infrastructure in each State and projected item wise requirement of funds for five years. Audit scrutiny of present status of the required and available police infrastructure in Madhya Pradesh showed that there was still substantial shortfall in police buildings, rest rooms/toilets for women police, houses, vehicles and weaponry.
(Paragraph 2.2.9)

Chapter II: Performance Audit
61
Police housing and building
Construction of well secured police station buildings and houses for police personnel closer to the police stations is one of the thrust areas of the scheme. Out of ` 160.10 crore released under this component during 2011-16, the expenditure of ` 75.85 crore were incurred. Due to delays in construction, availability of police housing and buildings was lagging far behind the actual requirement. More than two thirds of subordinate police personnel could not be provided government accommodation, as there was a shortfall of 69,978 houses for police personnel. In selected 13 districts, police personnel had occupied 683 condemned and 582 dilapidated houses. Similarly, there was shortage of 718 buildings, including police station, outposts, district police office, district police line, control rooms. Basic amenities such as toilet and rest rooms for women personnel were lacking in Police Stations/Outposts. During interview, 122 out of 150 police personnel, who were working in dilapidated buildings, cited problem of seepage of water, lack of space, inconvenience and danger to life of person. Thus, police force’s own security was in jeopardy.
(Paragraph 2.2.10)
Mobility
There was large shortage of vehicles, especially motorcycle, in the Department. In selected 39 Police Stations (PSs)/Outposts (OPs), there were no motorcycle in six PSs and two OPs. Further, 102 cars valuing ` 5.88 crore were procured, which were prohibited for procurement under MPF.
(Paragraph 2.2.11)
Weaponry
The scheme offers to replace out dated and unserviceable weapons with sophisticated weapons. Audit noticed that there was a gap of 23,955 modern weapons as of December 2016. Thus, the department was dependent on old weapons affecting the striking capacity of police force.
(Paragraph 2.2.12)
Procurement of equipment
Inordinate delays noticed in procurement of equipment related to Forensic Science Laboratories (FSLs), Telecommunication, Intelligence and CID wing, which affected the modernisation programme of police forces.
(Paragraphs 2.2.13, 2.2.14, 2.2.15 and 2.2.16)
Human Resource Management
There was overall vacancy of 16,751 personnel in police force as of June 2016. Posts of Scientific Officers and Lab Technician were lying vacant in FSLs leading to large pendency in forensic examinations. Training of police personnel affected due to short availability of trained teachers. In interview of 150 police personnel in selected districts, only 26 per cent were satisfied with available resources and 45 per cent were satisfied with career progression.
(Paragraphs 2.2.13.1 and 2.2.17)
Audit Report on General and Social Sectors for the year ended 31 March 2016
62
Crime Scenario
During 2011-15, the number of Indian Penal Code crimes in State increased gradually from 2.17 lakh to 2.69 lakh and pendency of investigations also increased from 12,582 to 23,380. Therefore, effective steps were required for strengthening of police force with adequate manpower, improvement in living condition of personnel, enhanced mobility, weaponry and other related infrastructure.
(Paragraph 2.2.19)
2.2.1 Introduction
'Police' and 'law and order' is a State subject and it is primarily the responsibility of the State Government to modernise and adequately equip their police forces for meeting the challenges to 'law and order' and 'internal security'. The Modernisation of Police Forces (MPF) scheme was launched by the Ministry of Home Affairs (MHA), Government of India (GoI) in 1969 for modernizing the police forces to effectively face the emerging challenges to internal security. The scheme was revised during 2000-01 and extended for a period of ten years, to make good the deficiencies in basic police infrastructure as identified by the Bureau of Police Research and Development (BPRD). The major components covered in the scheme are: police housing and building, mobility, weaponry, forensic science, communication and other infrastructure. The Scheme was first extended for two years i.e. 2010-11 to 2011-12 and further for five years from 2012-13.
2.2.2 Organisational Structure
The Additional Chief Secretary (Home) (ACS) assisted by Secretary (Home) is the Head of the Department at Government level. Director General of Police (DGP) is Head of the Police Force. The State Level Empowered Committee (SLEC) headed by the Chief Secretary and comprising of four other members, viz., ACS (Home), Director General of Police (DGP), Secretary (Finance) and Additional Secretary (Home) is the apex body for implementation of the scheme.
The Additional DGP (Provisioning) is the Nodal Officer for implementation of the Scheme, who is assisted by Inspector General of Police (Provisioning). The Scheme is implemented by Police Headquarters (PHQ) in consultation with Superintendents of Police (SP) of districts. The housing activities were executed through Madhya Pradesh Police Housing Corporation (MPPHC).There are 11 police zones, 15 ranges, 51 district SPs, 1061 police stations and 576 out posts in the State.
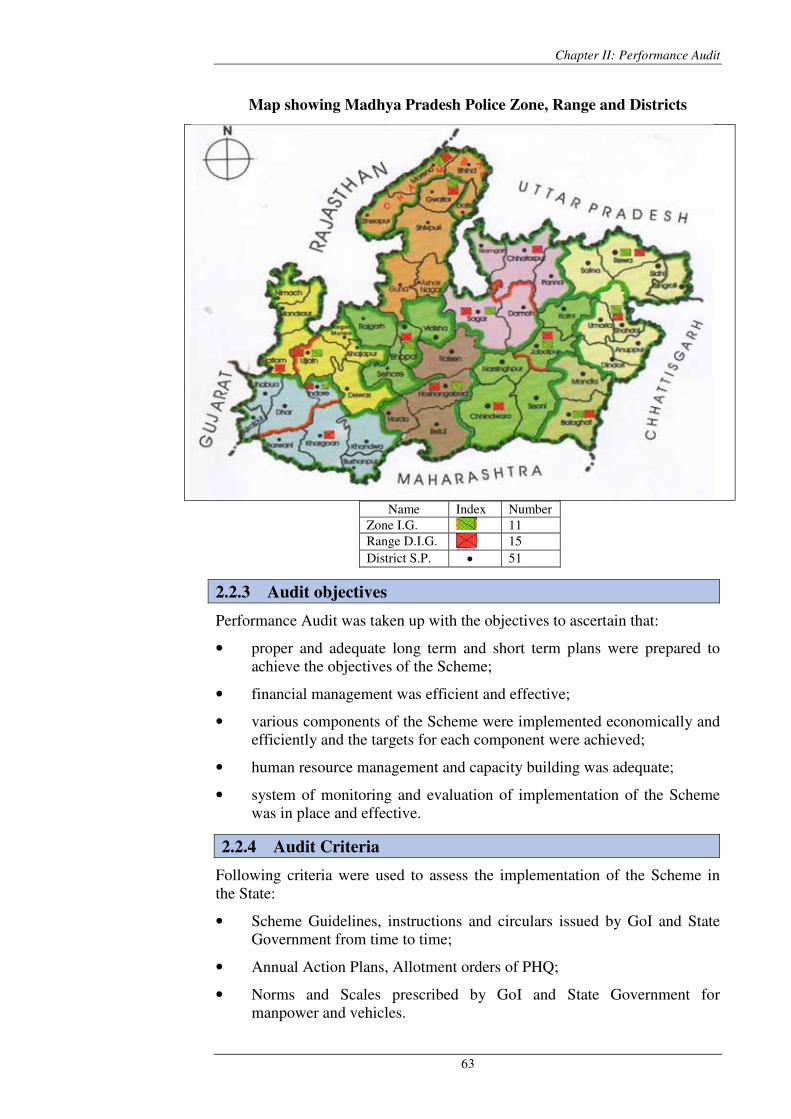
Chapter II: Performance Audit
63
Map showing Madhya Pradesh Police Zone, Range and Districts
Name Index Number Zone I.G.
11 Range D.I.G.
15
District S.P. • 51
2.2.3 Audit objectives
Performance Audit was taken up with the objectives to ascertain that:
• proper and adequate long term and short term plans were prepared to achieve the objectives of the Scheme;
• financial management was efficient and effective;
• various components of the Scheme were implemented economically and efficiently and the targets for each component were achieved;
• human resource management and capacity building was adequate;
• system of monitoring and evaluation of implementation of the Scheme was in place and effective.
2.2.4 Audit Criteria
Following criteria were used to assess the implementation of the Scheme in the State:
• Scheme Guidelines, instructions and circulars issued by GoI and State Government from time to time;
• Annual Action Plans, Allotment orders of PHQ;
• Norms and Scales prescribed by GoI and State Government for manpower and vehicles.
Audit Report on General and Social Sectors for the year ended 31 March 2016
64
2.2.5 Scope and methodology
The performance audit was conducted during March 2016 to July 2016 covering the period 2011-16. Audit covered PHQ, 1039 State level offices and 1340 (25 per cent) out of 51 police districts of the State. The districts were selected on the basis of Simple Random Sampling without Replacement method and suggestions made by the Department during the entry conference. 30 Police Stations (PSs) and nine Outposts (OPs) were selected (three PSs/OPs from each District) on random basis. Information on status of modernisation of Central Arms Repair Workshop, Bhopal was also collected through ADG (Provisioning). Audit methodologies adopted were test check of records, collection of information through questionnaires, interview of Police personnel, joint physical inspections with departmental officers and photographs of assets.
The Entry Conference was held with ACS (Home) and DGP on 15 February 2016 to discuss the audit methodology, scope, objectives and criteria. The exit conference was held on 8 November 2016 with the ACS and DGP to discuss the Audit findings. The replies of the department have been suitably incorporated.
2.2.6 Lessons learnt and sensitivity to error signals
Performance Audit of the implementation of Modernisation of Police Force Scheme in the State during the period 2000-01 to 2005-06 was conducted earlier and the audit findings were reported in para 3.5 of Comptroller and Auditor General’s Report for the year 2005-06 (Civil). The para-wise replies of Home Department were furnished to the Public Accounts Committee (PAC) in October 2010. The performance audit report was discussed by PAC in July 2011. Recommendations of the PAC were awaited (November 2016).
The present Performance Audit of the scheme for the period 2011-12 to 2015-16 revealed that the deficiencies pointed out in earlier CAG’s report, such as shortfall in utilisation of funds, delays in construction of buildings, insufficient number of drivers, delayed response time and pendency in analysis of samples by Forensic Laboratories, were still persisting, as discussed in succeeding paragraphs.
Audit findings
2.2.7 Planning
2.2.7.1 Preparation of Strategic Plan
MPF Guidelines envisages preparation and submission of a Strategic Plan to GoI incorporating an equipment acquisition perspective plan for five years
39
ADG (Planning), ADG (Provisioning), SpDG (Intelligence), ADG (Criminal Investigation Department), ADG (State Crime Record Bureau), ADG (Telecommunication), SpDG (Training), State Forensic Science Laboratory, Sagar, DG (Home Guard) and Madhya Pradesh Police Housing Corporation.
40 Balaghat, Betul, Bhopal, Chhatarpur, Chhindwara, Dindori, Gwalior, Indore, Jabalpur, Khargone, Panna, Rewa and Sagar.
Chapter II: Performance Audit
65
identifying and analysing the gaps in various components under MPF and in conjunction with the BPRD norms to arrive at a requirement for the State. MHA directed (December 2010) to submit the Strategic Plan for the period 2011-16 by 27 December 2010.
Audit scrutiny revealed that Strategic Plan for the period 2011-16 was submitted to MHA on 18 July 2011. However, the strategic plan was not prepared in the prescribed template and it did not include SWOT41 analysis, situation analysis, strategies, activities and evaluation.
In the exit conference (November 2016), ACS stated proper preparation of strategic plan was not possible as the Department was not conversant with the funds allotted in the Plan years and the Plans were prepared to fill the gap of priority items. However, a perspective plan was now being prepared for future requirements.
2.2.7.2 Preparation of Annual Action Plans
According to MPF Guidelines, Annual Action Plan (AAP) were to provide the description of program actions or activities necessary to achieve strategic goals and objectives and evaluation criteria for determining success in achieving goals and the difference made by the activities. Audit scrutiny revealed the following:
• AAPs for the period 2011-16 were prepared without indicating pre-documented goals and objectives as these were not identified in the Strategic Plan 2011-16. Gap analysis for various Police equipment such as Intelligence, Training, Telecommunications, Railway, CID and FSL was not found to be done, hence the yearly action plan was a wish list of items for procurement to that extent.
In the exit conference (November 2016), ACS stated that the Department was aware of its requirements, items of immediate priority were proposed in AAPs in accordance to change in respect of social, economic, political scenario of the State, law and order and crime pattern.
Fact remains that Department did not conduct gap analysis for procurement of various police equipment.
• The funds provided by GoI under the Scheme were intended to supplement the resources of the State for modernisation of police. Therefore, AAPs was to include joint resource planning indicating component wise requirements of funds and source wise availability of the required funds in a prescribed format. During 2011-16, other Central and State schemes contributed ` 999.93 crore (Appendix 2.2.1) for training, housing, forensic science, vehicles, equipment and weapons, out of which ` 712.48 (71 per cent) crore was incurred. However, AAPs of the MPF did not include joint resource planning to optimise utilisation of fund out of available resource envelope42.
In the exit conference (November 2016), ACS stated that as gap between requirement and availability was wide, funds received from various sources
41
Strength, weakness, opportunities and threats. 42 Funds available in the State from various sources for the modernisation of police force.
AAPs did not
include joint
resource
planning to
optimise
available funds
from other
Schemes.
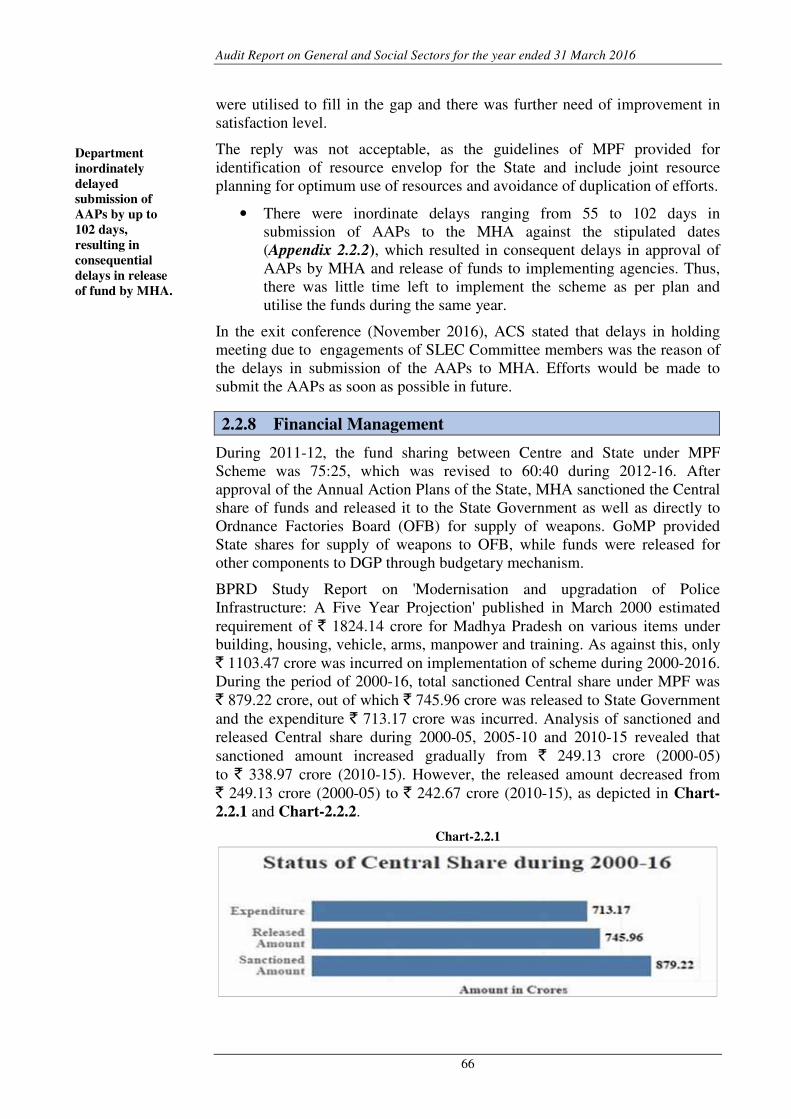
Audit Report on General and Social Sectors for the year ended 31 March 2016
66
were utilised to fill in the gap and there was further need of improvement in satisfaction level.
The reply was not acceptable, as the guidelines of MPF provided for identification of resource envelop for the State and include joint resource planning for optimum use of resources and avoidance of duplication of efforts.
• There were inordinate delays ranging from 55 to 102 days in submission of AAPs to the MHA against the stipulated dates (Appendix 2.2.2), which resulted in consequent delays in approval of AAPs by MHA and release of funds to implementing agencies. Thus, there was little time left to implement the scheme as per plan and utilise the funds during the same year.
In the exit conference (November 2016), ACS stated that delays in holding meeting due to engagements of SLEC Committee members was the reason of the delays in submission of the AAPs to MHA. Efforts would be made to submit the AAPs as soon as possible in future.
2.2.8 Financial Management
During 2011-12, the fund sharing between Centre and State under MPF Scheme was 75:25, which was revised to 60:40 during 2012-16. After approval of the Annual Action Plans of the State, MHA sanctioned the Central share of funds and released it to the State Government as well as directly to Ordnance Factories Board (OFB) for supply of weapons. GoMP provided State shares for supply of weapons to OFB, while funds were released for other components to DGP through budgetary mechanism.
BPRD Study Report on 'Modernisation and upgradation of Police Infrastructure: A Five Year Projection' published in March 2000 estimated requirement of ` 1824.14 crore for Madhya Pradesh on various items under building, housing, vehicle, arms, manpower and training. As against this, only ` 1103.47 crore was incurred on implementation of scheme during 2000-2016. During the period of 2000-16, total sanctioned Central share under MPF was ` 879.22 crore, out of which ` 745.96 crore was released to State Government and the expenditure ` 713.17 crore was incurred. Analysis of sanctioned and released Central share during 2000-05, 2005-10 and 2010-15 revealed that sanctioned amount increased gradually from ` 249.13 crore (2000-05) to ` 338.97 crore (2010-15). However, the released amount decreased from ` 249.13 crore (2000-05) to ` 242.67 crore (2010-15), as depicted in Chart-
2.2.1 and Chart-2.2.2.
Chart-2.2.1
Department
inordinately
delayed
submission of
AAPs by up to
102 days,
resulting in
consequential
delays in release
of fund by MHA.

Chapter II: Performance Audit
67
Chart-2.2.2
(Source: Information furnished by the Nodal Officer)
Further scrutiny of records for the period 2011-16 revealed the following:
2.2.8.1 Availability and utilisation of funds
MHA from time to time highlighted the position of unspent balances and stated that the release against sanctioned amount would depend on position of unspent balances and the balance amount would be deducted from the future releases.
Status of unspent balances, release and expenditure under Central and State Shares as per Utilisation Certificates (UCs) for the period 2011-16 was as detailed in Table-2.2.1.
Table 2.2.1: Release and expenditure of Central and State Shares
under MPF
(`̀̀̀ in crore)
Sl.
No.
Year Central Share State Share
Previous
Balance
Amount
released
Total Expen-
diture
Closing
Balance
Previous
Balance
Amount
released
Total Expen-
diture
Closing
Balance
1 2011-12 56.62 37.54 94.16 56.80 37.36 24.94 12.31 37.25 9.71 27.54
2 2012-13 37.36 13.78 51.14 28.72 22.42 27.54 9.19 36.73 23.17 13.56
3 2013-14 22.42 61.37 83.79 13.04 70.75 13.56 38.26 51.82 7.44 44.38
4 2014-15 70.75 57.57 128.32 7.28 121.04 44.38 11.15 55.53 6.66 48.87
5 2015-16 121.04 26.80 147.84 117.54 30.30 48.87 0.00 48.87 46.11 2.76
Total 197.06 223.38 70.91 93.09
(Source: Sanctions of MHA and GoMP and Utilisation Certificates submitted by
Department)
It was evident from the above table that during 2011-16, expenditure was ` 316.4743 crore against total available fund of ` 349.5344 crore. Progress of expenditure against available funds was slow and improved largely during 2015-16 in which ` 163.65 crore (52 per cent of total ` 316.47 crore) was
43
Central Share expenditure ` 223.38 crore + State Share expenditure ` 93.09 crore. 44 Previous balances (`56.62 crore + ` 24.94 crore) and releases (` 197.06 crore + ` 70.91
crore).
Slow progress of
expenditure led
to short release of
`̀̀̀ 92.79 crore of
Central Share
Audit Report on General and Social Sectors for the year ended 31 March 2016
68
incurred. Further, ` 33.06 crore (Central and State Share) was still unutilised as on March 2016.
Audit noticed that unutilised fund even pertained to 2010-11. Failure to spend the funds even after six years indicated poor financial and procurement management by the department and resulted in decrease in release of Central Share by MHA. Central assistance of ` 197.06 crore was released out of sanctioned assistance of ` 289.85 crore. Thus, the scheme of modernising the Police Force was deprived of funds to the tune of ` 92.79 crore as well as proportionate State share.
In the exit conference (November 2016), ACS stated that short utilisation of funds was due to delays in release of funds, tendering and procurement process. Action would be taken after taking this into consideration in future.
2.2.8.2 Delays and shortfall in amount released by GoMP
Status of demand, Central Share sanctioned and subsequent release by MHA and GoMP are shown in Appendix 2.2.3. Audit observed that during 2011-15, GoMP released State share with delays ranging from one to 27 months from the date of release by MHA. Further, State share of ` 29.88 crore were not released during 2011-15. For the period 2015-16, Central share of ` 23.42 crore released by MHA to GoMP as well as the State Share of ` 17.87 crore was not released to the Department (March 2016).
In the exit conference (November 2016), ACS stated that action would be taken after taking this into consideration in future.
2.2.8.3 Incorrect financial reporting due to submission of inaccurate
utilisation certificate
Audit observed from the UC (as on March 2016) that the Department reported utilisation of ` 228.83 crore to MHA against the allotment of ` 244.56 crore during 2011-16. However, the examination of records revealed that only ` 144.00 crore was spent. Thus, the UCs furnished by the Nodal Officer was inflated by ` 84.83 crore.
Further scrutiny revealed that ` 84.25 crore were lying unspent (March 2016) with MPPHC against total release of ` 160.10 crore. During 2011-16, MPPHC did not furnish UC to the Nodal Officer and the Department furnished UCs to MHA on the basis of amount released/paid to the MPPHC. This inaccurate capture of utilised amount at the level of the Department was indicative of the poor accounting controls.
In the exit conference (November 2016), ACS stated that the amount provided in advance to OFB/ MPPHC were shown as utilised as per practice adopted earlier by Department. However, the audit observation would be taken in consideration in future.
2.2.8.4 Utilisation of Interest earned from Bank account for MPF
funds
According to para 7.11 of MPF Guidelines, funds released to MPPHC shall be kept in an exclusive saving bank account and the interest accrued from the
GoMP did not
release `̀̀̀ 23.42
crore of Central
Share and `̀̀̀ 47.75
crore of State
Share to Home
Department.
Chapter II: Performance Audit
69
account be used for the furtherance of objectives of the Scheme after approval by the SLEC.
Audit observed that ` 160.10 crore in six instances were paid to MPPHC during 2011-16. MPPHC opened exclusive savings account for ` 19.39 crore, ` 6.48 crore and ` 6.40 crore released by MHA during 2011-12 to 2013-14 and remaining ` 127.83 crore were deposited in other prevailing accounts. However, funds received from other schemes/sources were also deposited in the exclusive bank accounts for MPF. As a result, the interest earned/accrued from the funds received under MPF was not worked out correctly.
In reply, MPPHC intimated interest of ` 1.10 crore on the basis of outstanding balance as on March 2016. However, the interest accrued from time to time was neither reported to MHA/Nodal Officer nor was it utilised for the purpose of furtherance of the objectives.
In the exit conference (November 2016), ACS stated that MPPHC was furnishing the details to MHA team, who visit half yearly basis for audit as well as to Planning branch of PHQ. Interest earned/accrued upto 2008-09 had already been intimated. The scheme wise interest was being worked out and utilisation of the interest earned/accrued during the period of audit would be done with the approval of SLEC. Scheme wise separate account would be maintained in future.
2.2.9 Achievement in filling the gaps highlighted in BPRD Study
Report
Bureau of Police Research and Development (BPRD) Study Report on 'Modernisation and upgradation of Police Infrastructure: A Five Year Projection' published in March 2000 highlighted the gap for various police infrastructure in each State and projected item wise requirement of funds for five years. Scrutiny of present status of the required and available police infrastructure showed that there was still substantial shortfall in PS/OP buildings, rest rooms/toilets for women police, houses, vehicles and arms. Deficiencies noticed in implementation of major components of MPF in the State are discussed in succeeding paragraphs.
2.2.10 Police housing and building
Construction of well secured police station buildings and houses for police personnel closer to the police stations is one of the thrust areas of the scheme. Audit noticed that there was more than 50 per cent of the allocation during 2011-16 for this component of the Scheme. MPPHC, a limited company of GoMP, was executing agency for construction of residential and administrative buildings under MPF. During 2011-16, MPPHC incurred ` 75.85 crore out of ` 160.10 crore released to it by MHA and GoMP.
Audit scrutiny revealed that the availability of housing and administrative buildings was lagging far behind the actual requirement. The gap under housing and administrative buildings was as mentioned in Table 2.2.2.
Interest of `̀̀̀ 1.10
crore earned on
outstanding fund
with MPPHC not
utilised for
furtherance of
scheme objective.
Audit Report on General and Social Sectors for the year ended 31 March 2016
70
More than two-
thirds of
subordinate
police personnel
could not be
provided
government
accommodation.
Table-2.2.2: Comparative status of requirement of houses and buildings
Item Gap as on
January 1998
(Units required)
Gap as reported by PHQ
in December 2016 (Units
required)
(1) (2) (3)
Police Station Buildings 121 254
Out Post buildings 124 199
Extension of old PSs 644 805
District Police lines 16 19
Control Rooms 43 17
Official buildings: SP's Office 16 26
Official buildings: Range DIG 0 3
Official buildings: Zonal IG 1 3
Official buildings: SDOPs Office 118 61
Rest Rooms/Toilets for Women Police 1457 805
Housing: Lower Subordinate 44243 55455
Housing: Upper Subordinate 7496 14523
(Source: BPRD study report 2000 and ADG (Planning))
Thus, there was substantial gap in requirement and availability of housing and administrative building even after implementation of MPF since last 16 years.
2.2.10.1 Shortage of staff quarter
National Police Commission had recommended 100 per cent accommodation for all police personnel. Home Department provides housing for Lower (Constable and Head Constable) subordinates and Upper (Inspector, sub-Inspector and Assistant Sub Inspector) subordinates.
Available houses were categorised as good45, dilapidated and condemned. The availability of houses during the period 2011-16 is given in Table - 2.2.3.
Table - 2.2.3: Availability of houses and deficiency
Sl.
No.
Year Required Houses available Deficiency Houses per 100
personnel Good Condemned
1. 2011-12 85473 28968 3828 56505 34
2. 2012-13 93897 34209 6275 59688 36
3. 2013-14 99642 36723 6331 62919 37
4. 2014-15 99642 29880 7936 69762 30
5. 2015-16 102772 32794 8076 69978 32
(Source: Information provided by ADG (Planning))
Thus, more than two thirds of subordinate police personnel could not be provided government accommodation. The availability of good houses had
45
Houses which were considered suitable for residential purpose.
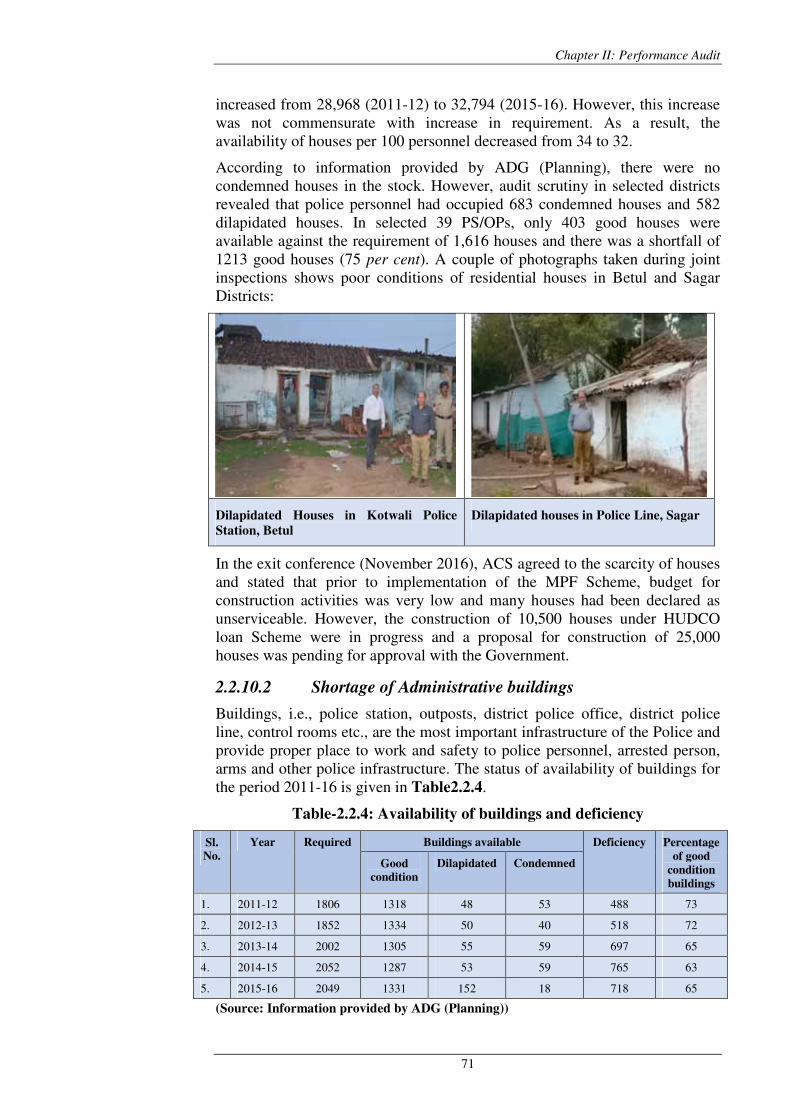
Chapter II: Performance Audit
71
increased from 28,968 (2011-12) to 32,794 (2015-16). However, this increase was not commensurate with increase in requirement. As a result, the availability of houses per 100 personnel decreased from 34 to 32.
According to information provided by ADG (Planning), there were no condemned houses in the stock. However, audit scrutiny in selected districts revealed that police personnel had occupied 683 condemned houses and 582 dilapidated houses. In selected 39 PS/OPs, only 403 good houses were available against the requirement of 1,616 houses and there was a shortfall of 1213 good houses (75 per cent). A couple of photographs taken during joint inspections shows poor conditions of residential houses in Betul and Sagar Districts:
Dilapidated Houses in Kotwali Police
Station, Betul
Dilapidated houses in Police Line, Sagar
In the exit conference (November 2016), ACS agreed to the scarcity of houses and stated that prior to implementation of the MPF Scheme, budget for construction activities was very low and many houses had been declared as unserviceable. However, the construction of 10,500 houses under HUDCO loan Scheme were in progress and a proposal for construction of 25,000 houses was pending for approval with the Government.
2.2.10.2 Shortage of Administrative buildings
Buildings, i.e., police station, outposts, district police office, district police line, control rooms etc., are the most important infrastructure of the Police and provide proper place to work and safety to police personnel, arrested person, arms and other police infrastructure. The status of availability of buildings for the period 2011-16 is given in Table2.2.4.
Table-2.2.4: Availability of buildings and deficiency
Sl.
No.
Year Required Buildings available Deficiency Percentage
of good
condition
buildings
Good
condition
Dilapidated Condemned
1. 2011-12 1806 1318 48 53 488 73
2. 2012-13 1852 1334 50 40 518 72
3. 2013-14 2002 1305 55 59 697 65
4. 2014-15 2052 1287 53 59 765 63
5. 2015-16 2049 1331 152 18 718 65
(Source: Information provided by ADG (Planning))
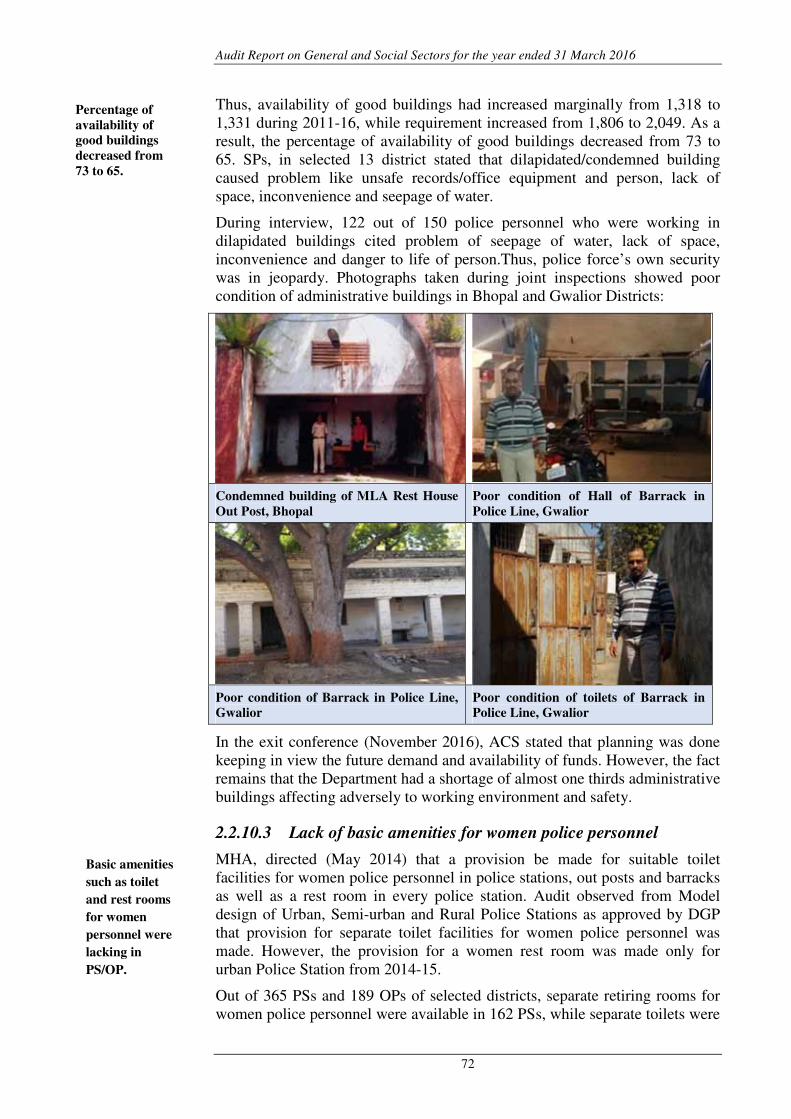
Audit Report on General and Social Sectors for the year ended 31 March 2016
72
Thus, availability of good buildings had increased marginally from 1,318 to 1,331 during 2011-16, while requirement increased from 1,806 to 2,049. As a result, the percentage of availability of good buildings decreased from 73 to 65. SPs, in selected 13 district stated that dilapidated/condemned building caused problem like unsafe records/office equipment and person, lack of space, inconvenience and seepage of water.
During interview, 122 out of 150 police personnel who were working in dilapidated buildings cited problem of seepage of water, lack of space, inconvenience and danger to life of person.Thus, police force’s own security was in jeopardy. Photographs taken during joint inspections showed poor condition of administrative buildings in Bhopal and Gwalior Districts:
Condemned building of MLA Rest House
Out Post, Bhopal
Poor condition of Hall of Barrack in
Police Line, Gwalior
Poor condition of Barrack in Police Line,
Gwalior
Poor condition of toilets of Barrack in
Police Line, Gwalior
In the exit conference (November 2016), ACS stated that planning was done keeping in view the future demand and availability of funds. However, the fact remains that the Department had a shortage of almost one thirds administrative buildings affecting adversely to working environment and safety.
2.2.10.3 Lack of basic amenities for women police personnel
MHA, directed (May 2014) that a provision be made for suitable toilet facilities for women police personnel in police stations, out posts and barracks as well as a rest room in every police station. Audit observed from Model design of Urban, Semi-urban and Rural Police Stations as approved by DGP that provision for separate toilet facilities for women police personnel was made. However, the provision for a women rest room was made only for urban Police Station from 2014-15.
Out of 365 PSs and 189 OPs of selected districts, separate retiring rooms for women police personnel were available in 162 PSs, while separate toilets were
Basic amenities
such as toilet
and rest rooms
for women
personnel were
lacking in
PS/OP.
Percentage of
availability of
good buildings
decreased from
73 to 65.
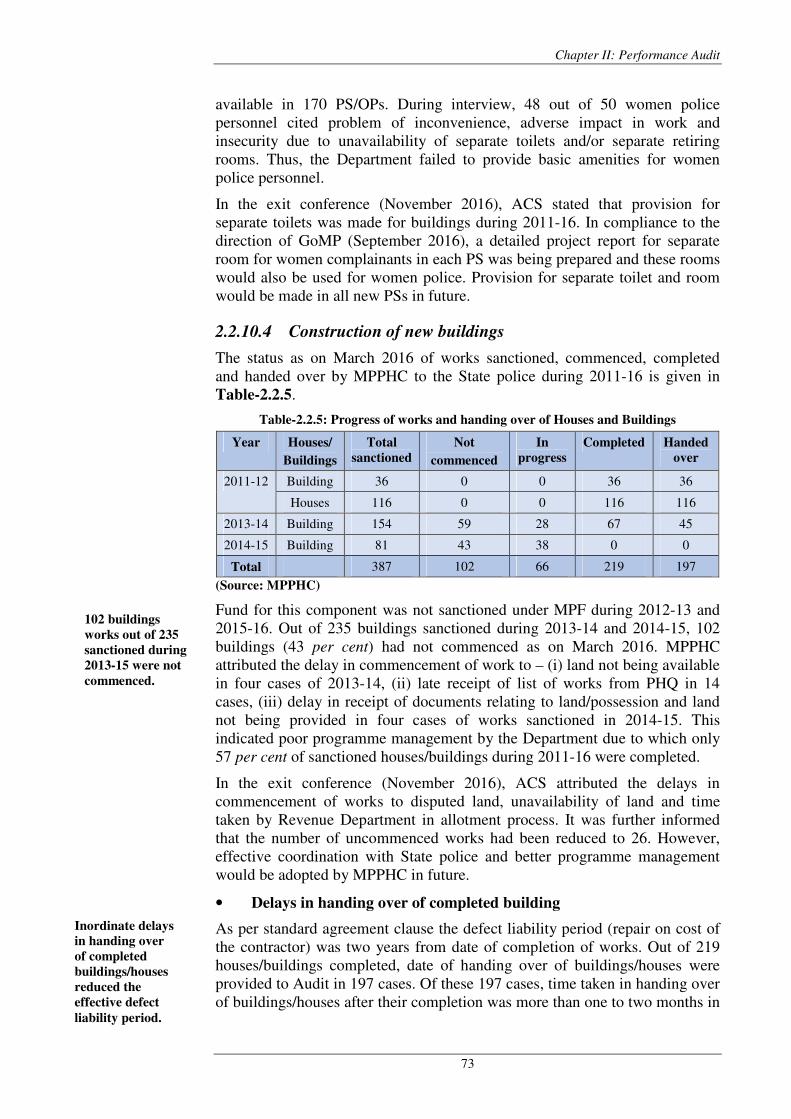
Chapter II: Performance Audit
73
available in 170 PS/OPs. During interview, 48 out of 50 women police personnel cited problem of inconvenience, adverse impact in work and insecurity due to unavailability of separate toilets and/or separate retiring rooms. Thus, the Department failed to provide basic amenities for women police personnel.
In the exit conference (November 2016), ACS stated that provision for separate toilets was made for buildings during 2011-16. In compliance to the direction of GoMP (September 2016), a detailed project report for separate room for women complainants in each PS was being prepared and these rooms would also be used for women police. Provision for separate toilet and room would be made in all new PSs in future.
2.2.10.4 Construction of new buildings
The status as on March 2016 of works sanctioned, commenced, completed and handed over by MPPHC to the State police during 2011-16 is given in Table-2.2.5.
Table-2.2.5: Progress of works and handing over of Houses and Buildings
Year Houses/
Buildings
Total
sanctioned
Not
commenced
In
progress
Completed Handed
over
2011-12 Building 36 0 0 36 36
Houses 116 0 0 116 116
2013-14 Building 154 59 28 67 45
2014-15 Building 81 43 38 0 0
Total 387 102 66 219 197
(Source: MPPHC)
Fund for this component was not sanctioned under MPF during 2012-13 and 2015-16. Out of 235 buildings sanctioned during 2013-14 and 2014-15, 102 buildings (43 per cent) had not commenced as on March 2016. MPPHC attributed the delay in commencement of work to – (i) land not being available in four cases of 2013-14, (ii) late receipt of list of works from PHQ in 14 cases, (iii) delay in receipt of documents relating to land/possession and land not being provided in four cases of works sanctioned in 2014-15. This indicated poor programme management by the Department due to which only 57 per cent of sanctioned houses/buildings during 2011-16 were completed.
In the exit conference (November 2016), ACS attributed the delays in commencement of works to disputed land, unavailability of land and time taken by Revenue Department in allotment process. It was further informed that the number of uncommenced works had been reduced to 26. However, effective coordination with State police and better programme management would be adopted by MPPHC in future.
• Delays in handing over of completed building
As per standard agreement clause the defect liability period (repair on cost of the contractor) was two years from date of completion of works. Out of 219 houses/buildings completed, date of handing over of buildings/houses were provided to Audit in 197 cases. Of these 197 cases, time taken in handing over of buildings/houses after their completion was more than one to two months in
102 buildings
works out of 235
sanctioned during
2013-15 were not
commenced.
Inordinate delays
in handing over
of completed
buildings/houses
reduced the
effective defect
liability period.
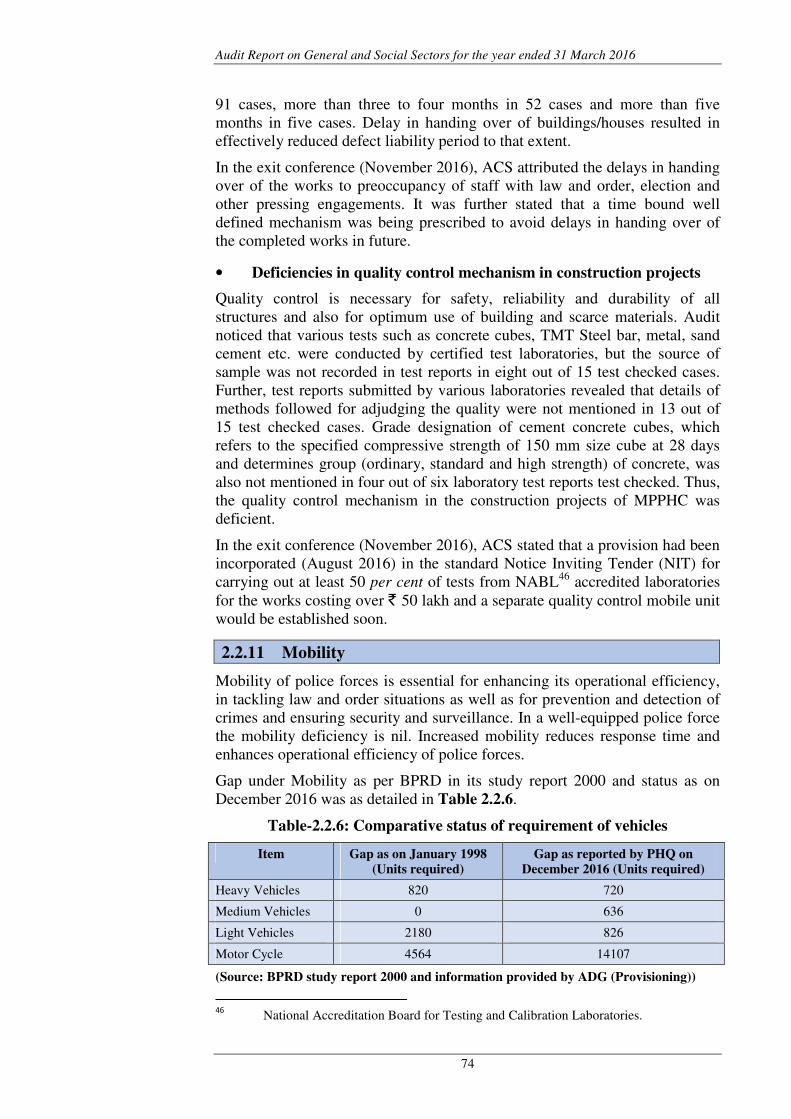
Audit Report on General and Social Sectors for the year ended 31 March 2016
74
91 cases, more than three to four months in 52 cases and more than five months in five cases. Delay in handing over of buildings/houses resulted in effectively reduced defect liability period to that extent.
In the exit conference (November 2016), ACS attributed the delays in handing over of the works to preoccupancy of staff with law and order, election and other pressing engagements. It was further stated that a time bound well defined mechanism was being prescribed to avoid delays in handing over of the completed works in future.
• Deficiencies in quality control mechanism in construction projects
Quality control is necessary for safety, reliability and durability of all structures and also for optimum use of building and scarce materials. Audit noticed that various tests such as concrete cubes, TMT Steel bar, metal, sand cement etc. were conducted by certified test laboratories, but the source of sample was not recorded in test reports in eight out of 15 test checked cases. Further, test reports submitted by various laboratories revealed that details of methods followed for adjudging the quality were not mentioned in 13 out of 15 test checked cases. Grade designation of cement concrete cubes, which refers to the specified compressive strength of 150 mm size cube at 28 days and determines group (ordinary, standard and high strength) of concrete, was also not mentioned in four out of six laboratory test reports test checked. Thus, the quality control mechanism in the construction projects of MPPHC was deficient.
In the exit conference (November 2016), ACS stated that a provision had been incorporated (August 2016) in the standard Notice Inviting Tender (NIT) for carrying out at least 50 per cent of tests from NABL46 accredited laboratories for the works costing over ` 50 lakh and a separate quality control mobile unit would be established soon.
2.2.11 Mobility
Mobility of police forces is essential for enhancing its operational efficiency, in tackling law and order situations as well as for prevention and detection of crimes and ensuring security and surveillance. In a well-equipped police force the mobility deficiency is nil. Increased mobility reduces response time and enhances operational efficiency of police forces.
Gap under Mobility as per BPRD in its study report 2000 and status as on December 2016 was as detailed in Table 2.2.6.
Table-2.2.6: Comparative status of requirement of vehicles
Item Gap as on January 1998
(Units required)
Gap as reported by PHQ on
December 2016 (Units required)
Heavy Vehicles 820 720
Medium Vehicles 0 636
Light Vehicles 2180 826
Motor Cycle 4564 14107
(Source: BPRD study report 2000 and information provided by ADG (Provisioning))
46
National Accreditation Board for Testing and Calibration Laboratories.
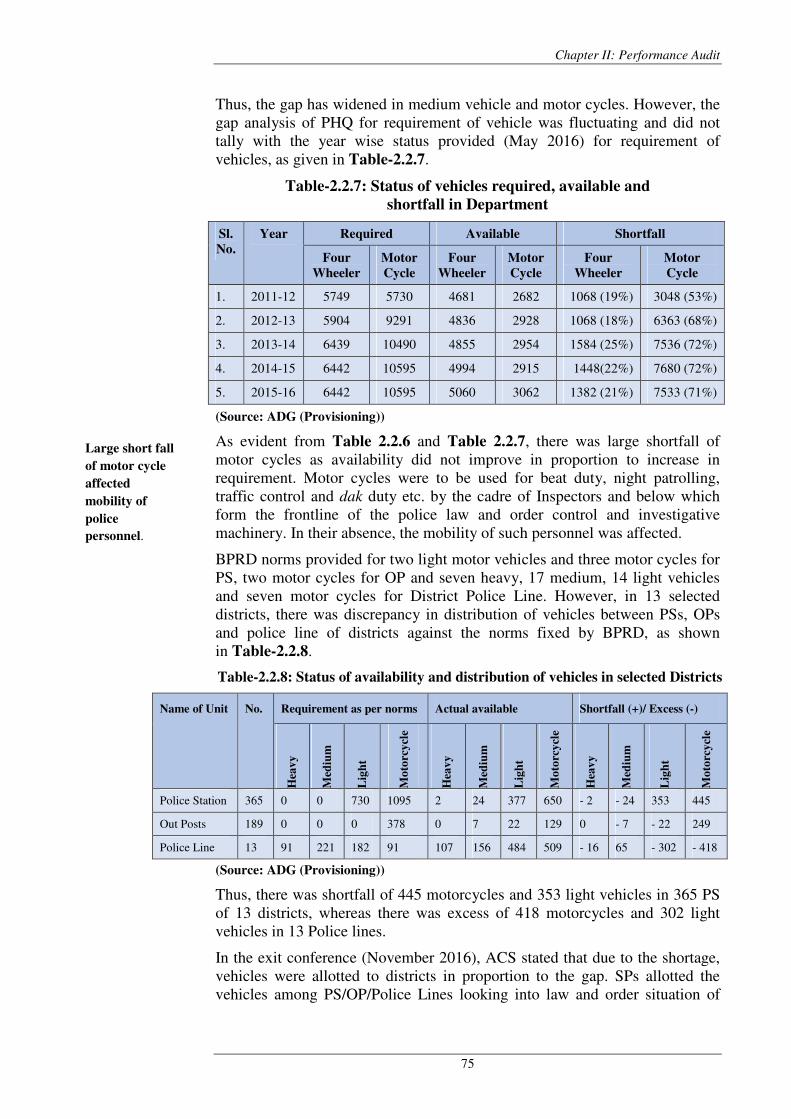
Chapter II: Performance Audit
75
Thus, the gap has widened in medium vehicle and motor cycles. However, the gap analysis of PHQ for requirement of vehicle was fluctuating and did not tally with the year wise status provided (May 2016) for requirement of vehicles, as given in Table-2.2.7.
Table-2.2.7: Status of vehicles required, available and
shortfall in Department
Sl.
No.
Year Required Available Shortfall
Four
Wheeler
Motor
Cycle
Four
Wheeler
Motor
Cycle
Four
Wheeler
Motor
Cycle
1. 2011-12 5749 5730 4681 2682 1068 (19%) 3048 (53%)
2. 2012-13 5904 9291 4836 2928 1068 (18%) 6363 (68%)
3. 2013-14 6439 10490 4855 2954 1584 (25%) 7536 (72%)
4. 2014-15 6442 10595 4994 2915 1448(22%) 7680 (72%)
5. 2015-16 6442 10595 5060 3062 1382 (21%) 7533 (71%)
(Source: ADG (Provisioning))
As evident from Table 2.2.6 and Table 2.2.7, there was large shortfall of motor cycles as availability did not improve in proportion to increase in requirement. Motor cycles were to be used for beat duty, night patrolling, traffic control and dak duty etc. by the cadre of Inspectors and below which form the frontline of the police law and order control and investigative machinery. In their absence, the mobility of such personnel was affected.
BPRD norms provided for two light motor vehicles and three motor cycles for PS, two motor cycles for OP and seven heavy, 17 medium, 14 light vehicles and seven motor cycles for District Police Line. However, in 13 selected districts, there was discrepancy in distribution of vehicles between PSs, OPs and police line of districts against the norms fixed by BPRD, as shown in Table-2.2.8.
Table-2.2.8: Status of availability and distribution of vehicles in selected Districts
Name of Unit No. Requirement as per norms Actual available Shortfall (+)/ Excess (-)
Hea
vy
Med
ium
Lig
ht
Mo
torc
ycl
e
Hea
vy
Med
ium
Lig
ht
Mo
torc
ycl
e
Hea
vy
Med
ium
Lig
ht
Mo
torc
ycl
e
Police Station 365 0 0 730 1095 2 24 377 650 - 2 - 24 353 445
Out Posts 189 0 0 0 378 0 7 22 129 0 - 7 - 22 249
Police Line 13 91 221 182 91 107 156 484 509 - 16 65 - 302 - 418
(Source: ADG (Provisioning))
Thus, there was shortfall of 445 motorcycles and 353 light vehicles in 365 PS of 13 districts, whereas there was excess of 418 motorcycles and 302 light vehicles in 13 Police lines.
In the exit conference (November 2016), ACS stated that due to the shortage, vehicles were allotted to districts in proportion to the gap. SPs allotted the vehicles among PS/OP/Police Lines looking into law and order situation of
Large short fall
of motor cycle
affected
mobility of
police
personnel.
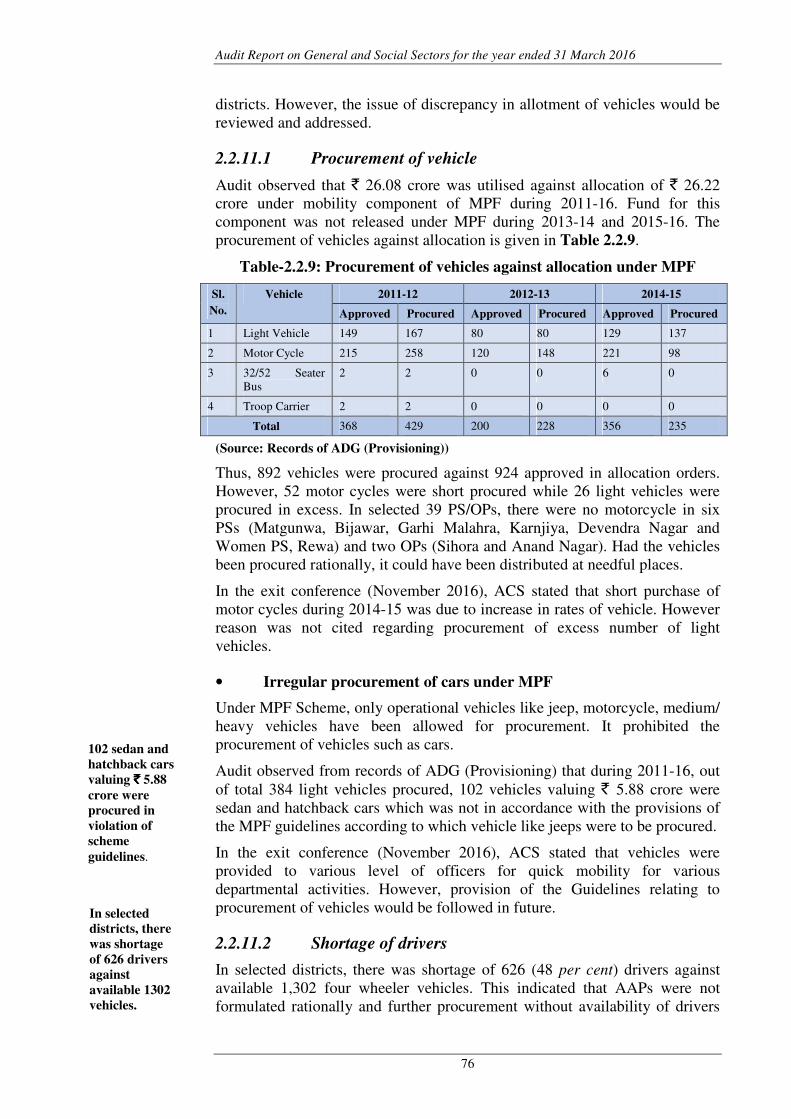
Audit Report on General and Social Sectors for the year ended 31 March 2016
76
districts. However, the issue of discrepancy in allotment of vehicles would be reviewed and addressed.
2.2.11.1 Procurement of vehicle
Audit observed that ` 26.08 crore was utilised against allocation of ` 26.22 crore under mobility component of MPF during 2011-16. Fund for this component was not released under MPF during 2013-14 and 2015-16. The procurement of vehicles against allocation is given in Table 2.2.9.
Table-2.2.9: Procurement of vehicles against allocation under MPF
Sl.
No.
Vehicle 2011-12 2012-13 2014-15
Approved Procured Approved Procured Approved Procured
1 Light Vehicle 149 167 80 80 129 137
2 Motor Cycle 215 258 120 148 221 98
3 32/52 Seater Bus
2 2 0 0 6 0
4 Troop Carrier 2 2 0 0 0 0
Total 368 429 200 228 356 235
(Source: Records of ADG (Provisioning))
Thus, 892 vehicles were procured against 924 approved in allocation orders. However, 52 motor cycles were short procured while 26 light vehicles were procured in excess. In selected 39 PS/OPs, there were no motorcycle in six PSs (Matgunwa, Bijawar, Garhi Malahra, Karnjiya, Devendra Nagar and Women PS, Rewa) and two OPs (Sihora and Anand Nagar). Had the vehicles been procured rationally, it could have been distributed at needful places.
In the exit conference (November 2016), ACS stated that short purchase of motor cycles during 2014-15 was due to increase in rates of vehicle. However reason was not cited regarding procurement of excess number of light vehicles.
• Irregular procurement of cars under MPF
Under MPF Scheme, only operational vehicles like jeep, motorcycle, medium/ heavy vehicles have been allowed for procurement. It prohibited the procurement of vehicles such as cars.
Audit observed from records of ADG (Provisioning) that during 2011-16, out of total 384 light vehicles procured, 102 vehicles valuing ` 5.88 crore were sedan and hatchback cars which was not in accordance with the provisions of the MPF guidelines according to which vehicle like jeeps were to be procured.
In the exit conference (November 2016), ACS stated that vehicles were provided to various level of officers for quick mobility for various departmental activities. However, provision of the Guidelines relating to procurement of vehicles would be followed in future.
2.2.11.2 Shortage of drivers
In selected districts, there was shortage of 626 (48 per cent) drivers against available 1,302 four wheeler vehicles. This indicated that AAPs were not formulated rationally and further procurement without availability of drivers
In selected
districts, there
was shortage
of 626 drivers
against
available 1302
vehicles.
102 sedan and
hatchback cars
valuing `̀̀̀ 5.88
crore were
procured in
violation of
scheme
guidelines.
Chapter II: Performance Audit
77
would lead to idle vehicles. This was a constraint in achieving optimum mobility.
In the exit conference (November 2016), ACS agreed to the facts and stated that efforts were being made to address the shortage of drivers and new constables were being imparted driving training in Police Training Schools to reduce the shortfall of drivers in future. The department further stated (January 2017) that 1,371 drivers were recruited between 2011 and 2013 and recruitment of 992 drivers was in progress.
2.2.11.3 Response time
Quick response to crime and law and order not only helps to preserve the lives of people but also ensures that guilty is brought to justice. PHQ directed (July 2009, October 2009 and January 2013) that response time for arrival of police/vehicle in urban and rural Police Stations should be monitored through a register. Each month Zonal Inspector General would review the response time and intimate the average response time of Zone and name of PS with highest and lowest average response time to PHQ.
Audit noticed that average response time was not monitored in PHQ. Due to lack of flow of response time data to PHQ, good and poor performance could not be analysed at State level. Scrutiny of response time in test checked districts revealed that SPs Rewa, Betuland Chhindwaradid not monitor response time of PS. SP, Rewa and Betul stated that instructions had not been received from PHQ while SP, Chhindwara stated that the information would be received from the PSs. SP, Dindori could furnish data for 2015-16 only.
Further scrutiny of response time in selected districts (Appendix 2.2.4) during 2011-16 revealed that response time decreased in five47 districts, increased in Balaghat, remained same in two48 districts. In Gwalior district, it decreased in rural PSs and increased in urban PSs. In selected 30 PSs of 13 districts, registers for response time were maintained only in 10 PSs of six49 districts.
In the exit conference (November 2016), ACS stated that looking to number of vehicles in the State, SPs and Zonal IGs were monitoring the response time. Response time of Police has improved in the State due to important Scheme of ‘Dial 100’.
The reply was not acceptable, as inadequate record maintenance at PSs and monitoring of response time at district level do not substantiate the reply.
2.2.12 Weaponry
To meet the challenges of terrorists and criminals, equipped with high tech and latest weapons, upgradation of weaponry was of paramount importance for the police force. Against allocation of ` 26.76 crore during 2011-16, ` 23.38 crore was utilised (March 2016). State Police received 3,631 Rifles and 1,150 Pistols from OFB during 2011-15.
47
Chhatarpur, Indore (two years data; 2014-15 and 2015-16 furnished), Jabalpur, Khargone and Sagar.
48 Bhopal (up to 2014-15) and Panna. 49 Bhopal, Panna, Khargone, Gwalior, Balaghat and Indore.
Response time
was not
monitored
adequately.
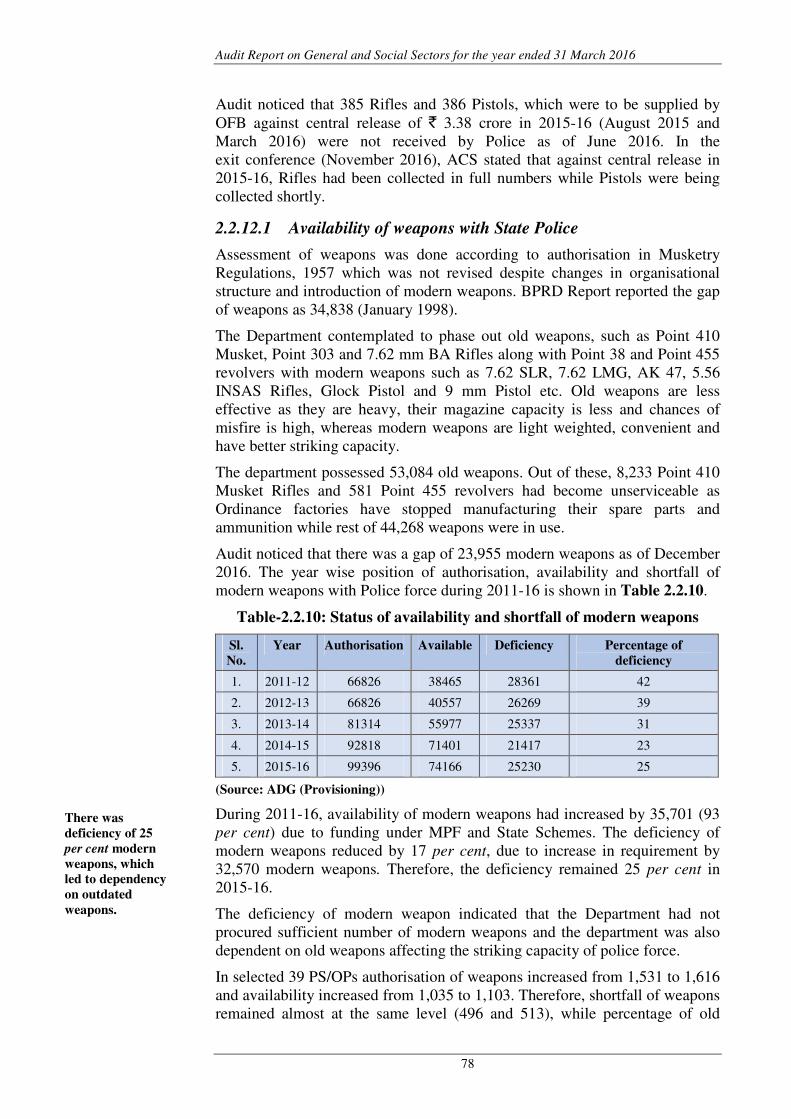
Audit Report on General and Social Sectors for the year ended 31 March 2016
78
Audit noticed that 385 Rifles and 386 Pistols, which were to be supplied by OFB against central release of ` 3.38 crore in 2015-16 (August 2015 and March 2016) were not received by Police as of June 2016. In the exit conference (November 2016), ACS stated that against central release in 2015-16, Rifles had been collected in full numbers while Pistols were being collected shortly.
2.2.12.1 Availability of weapons with State Police
Assessment of weapons was done according to authorisation in Musketry Regulations, 1957 which was not revised despite changes in organisational structure and introduction of modern weapons. BPRD Report reported the gap of weapons as 34,838 (January 1998).
The Department contemplated to phase out old weapons, such as Point 410 Musket, Point 303 and 7.62 mm BA Rifles along with Point 38 and Point 455 revolvers with modern weapons such as 7.62 SLR, 7.62 LMG, AK 47, 5.56 INSAS Rifles, Glock Pistol and 9 mm Pistol etc. Old weapons are less effective as they are heavy, their magazine capacity is less and chances of misfire is high, whereas modern weapons are light weighted, convenient and have better striking capacity.
The department possessed 53,084 old weapons. Out of these, 8,233 Point 410 Musket Rifles and 581 Point 455 revolvers had become unserviceable as Ordinance factories have stopped manufacturing their spare parts and ammunition while rest of 44,268 weapons were in use.
Audit noticed that there was a gap of 23,955 modern weapons as of December 2016. The year wise position of authorisation, availability and shortfall of modern weapons with Police force during 2011-16 is shown in Table 2.2.10.
Table-2.2.10: Status of availability and shortfall of modern weapons
Sl.
No.
Year Authorisation Available Deficiency Percentage of
deficiency
1. 2011-12 66826 38465 28361 42
2. 2012-13 66826 40557 26269 39
3. 2013-14 81314 55977 25337 31
4. 2014-15 92818 71401 21417 23
5. 2015-16 99396 74166 25230 25
(Source: ADG (Provisioning))
During 2011-16, availability of modern weapons had increased by 35,701 (93
per cent) due to funding under MPF and State Schemes. The deficiency of modern weapons reduced by 17 per cent, due to increase in requirement by 32,570 modern weapons. Therefore, the deficiency remained 25 per cent in 2015-16.
The deficiency of modern weapon indicated that the Department had not procured sufficient number of modern weapons and the department was also dependent on old weapons affecting the striking capacity of police force.
In selected 39 PS/OPs authorisation of weapons increased from 1,531 to 1,616 and availability increased from 1,035 to 1,103. Therefore, shortfall of weapons remained almost at the same level (496 and 513), while percentage of old
There was
deficiency of 25
per cent modern
weapons, which
led to dependency
on outdated
weapons.

Chapter II: Performance Audit
79
weapons was 49 per cent. Further, it was also noticed that weapons were not provided to women PS Rewa.
In the exit conference (November 2016), ACS stated that availability of arms had improved but due to increase in manpower satisfaction level had decreased. Regarding weapons to Women PS, it was stated that most women PSs were situated near other PSs of cities, support including weapons were provided from these PSs.
Fact remains that one of the main objectives of MPF scheme of equipping police with modern weapons for bringing improvement in preparedness and striking capability of force was largely not achieved.
2.2.12.2 Repair of weapons
Adequate and timely repair and maintenance of weapon is as important as its possession. Audit observed that the machines used in Arms Workshop, Bhopal such as welding transformer, power hammer, lathe, shaper, drill etc. were purchased between 1965 and 1987. ADG (Provisioning) informed (April 2016) that these machines had lost quality as well as accuracy and were not fit to repair modern weapons.
Audit observed in 12 selected districts that during 2011-16, 1,457 weapons were sent to the Arms workshop, Bhopal for repair. These were returned after one to 15 months. The delays indicated that weapon repair management was not adequate and the workshop required upgradation.
In the exit conference (November 2016), ACS stated that weapons were being repaired from existing machines, especial attention would be given for corrective action.
2.2.13 Forensic Science Laboratories
State had one State Forensic Laboratory (FSL), four Regional Forensic Science Laboratories (RFSL) and 50 District Scene of Crime Units (March 2016) for forensic analysis. FSL works under the Administrative control of ADG (CID).
The details of allotment for Forensic Science component under the MPF and status of expenditure during 2011-16 are given in Table 2.2.11. Fund for this component was not released under MPF during 2013-14 and 2015-16
Table-2.2.11: Allotment and expenditure under Forensic Science
Laboratory
(` ` ` ` in crore)
Year Allocation Expenditure
No. of equipments Amount No. of equipments Amount
2011-12 4 0.55 5 0.55
2012-13 11 1.16 5 0.30
2014-15 28 3.69 0 0
Total 43 5.40 10 0.85
(Source: Director (FSL))
FSLs could
not procure
equipment
despite
availability of
fund.
Machines used in
Arms Workshop
for repair of
weapons were
outdated and
were not fit for
repair of modern
weapons.
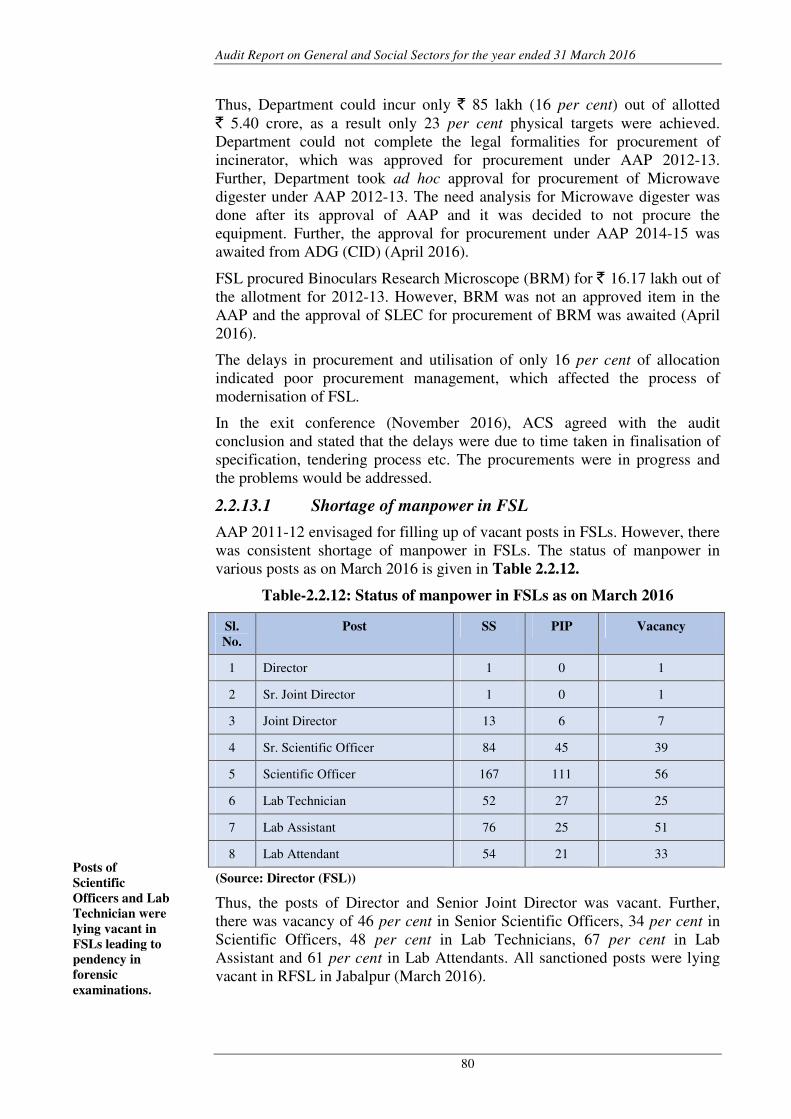
Audit Report on General and Social Sectors for the year ended 31 March 2016
80
Thus, Department could incur only ` 85 lakh (16 per cent) out of allotted ` 5.40 crore, as a result only 23 per cent physical targets were achieved. Department could not complete the legal formalities for procurement of incinerator, which was approved for procurement under AAP 2012-13. Further, Department took ad hoc approval for procurement of Microwave digester under AAP 2012-13. The need analysis for Microwave digester was done after its approval of AAP and it was decided to not procure the equipment. Further, the approval for procurement under AAP 2014-15 was awaited from ADG (CID) (April 2016).
FSL procured Binoculars Research Microscope (BRM) for ` 16.17 lakh out of the allotment for 2012-13. However, BRM was not an approved item in the AAP and the approval of SLEC for procurement of BRM was awaited (April 2016).
The delays in procurement and utilisation of only 16 per cent of allocation indicated poor procurement management, which affected the process of modernisation of FSL.
In the exit conference (November 2016), ACS agreed with the audit conclusion and stated that the delays were due to time taken in finalisation of specification, tendering process etc. The procurements were in progress and the problems would be addressed.
2.2.13.1 Shortage of manpower in FSL
AAP 2011-12 envisaged for filling up of vacant posts in FSLs. However, there was consistent shortage of manpower in FSLs. The status of manpower in various posts as on March 2016 is given in Table 2.2.12.
Table-2.2.12: Status of manpower in FSLs as on March 2016
Sl.
No.
Post SS PIP Vacancy
1 Director 1 0 1
2 Sr. Joint Director 1 0 1
3 Joint Director 13 6 7
4 Sr. Scientific Officer 84 45 39
5 Scientific Officer 167 111 56
6 Lab Technician 52 27 25
7 Lab Assistant 76 25 51
8 Lab Attendant 54 21 33
(Source: Director (FSL))
Thus, the posts of Director and Senior Joint Director was vacant. Further, there was vacancy of 46 per cent in Senior Scientific Officers, 34 per cent in Scientific Officers, 48 per cent in Lab Technicians, 67 per cent in Lab Assistant and 61 per cent in Lab Attendants. All sanctioned posts were lying vacant in RFSL in Jabalpur (March 2016).
Posts of
Scientific
Officers and Lab
Technician were
lying vacant in
FSLs leading to
pendency in
forensic
examinations.
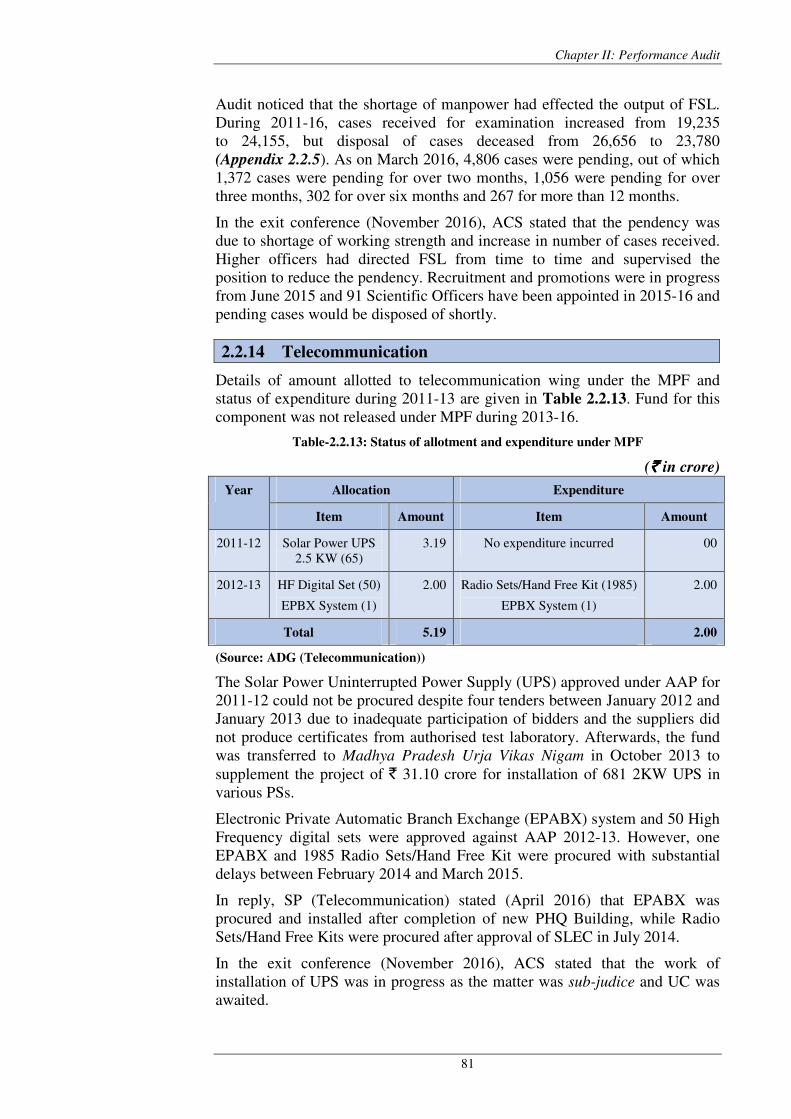
Chapter II: Performance Audit
81
Audit noticed that the shortage of manpower had effected the output of FSL. During 2011-16, cases received for examination increased from 19,235 to 24,155, but disposal of cases deceased from 26,656 to 23,780 (Appendix 2.2.5). As on March 2016, 4,806 cases were pending, out of which 1,372 cases were pending for over two months, 1,056 were pending for over three months, 302 for over six months and 267 for more than 12 months.
In the exit conference (November 2016), ACS stated that the pendency was due to shortage of working strength and increase in number of cases received. Higher officers had directed FSL from time to time and supervised the position to reduce the pendency. Recruitment and promotions were in progress from June 2015 and 91 Scientific Officers have been appointed in 2015-16 and pending cases would be disposed of shortly.
2.2.14 Telecommunication
Details of amount allotted to telecommunication wing under the MPF and status of expenditure during 2011-13 are given in Table 2.2.13. Fund for this component was not released under MPF during 2013-16.
Table-2.2.13: Status of allotment and expenditure under MPF
(` ` ` ` in crore)
Year Allocation Expenditure
Item Amount Item Amount
2011-12 Solar Power UPS 2.5 KW (65)
3.19 No expenditure incurred 00
2012-13 HF Digital Set (50)
EPBX System (1)
2.00 Radio Sets/Hand Free Kit (1985)
EPBX System (1)
2.00
Total 5.19 2.00
(Source: ADG (Telecommunication))
The Solar Power Uninterrupted Power Supply (UPS) approved under AAP for 2011-12 could not be procured despite four tenders between January 2012 and January 2013 due to inadequate participation of bidders and the suppliers did not produce certificates from authorised test laboratory. Afterwards, the fund was transferred to Madhya Pradesh Urja Vikas Nigam in October 2013 to supplement the project of ` 31.10 crore for installation of 681 2KW UPS in various PSs.
Electronic Private Automatic Branch Exchange (EPABX) system and 50 High Frequency digital sets were approved against AAP 2012-13. However, one EPABX and 1985 Radio Sets/Hand Free Kit were procured with substantial delays between February 2014 and March 2015.
In reply, SP (Telecommunication) stated (April 2016) that EPABX was procured and installed after completion of new PHQ Building, while Radio Sets/Hand Free Kits were procured after approval of SLEC in July 2014.
In the exit conference (November 2016), ACS stated that the work of installation of UPS was in progress as the matter was sub-judice and UC was awaited.
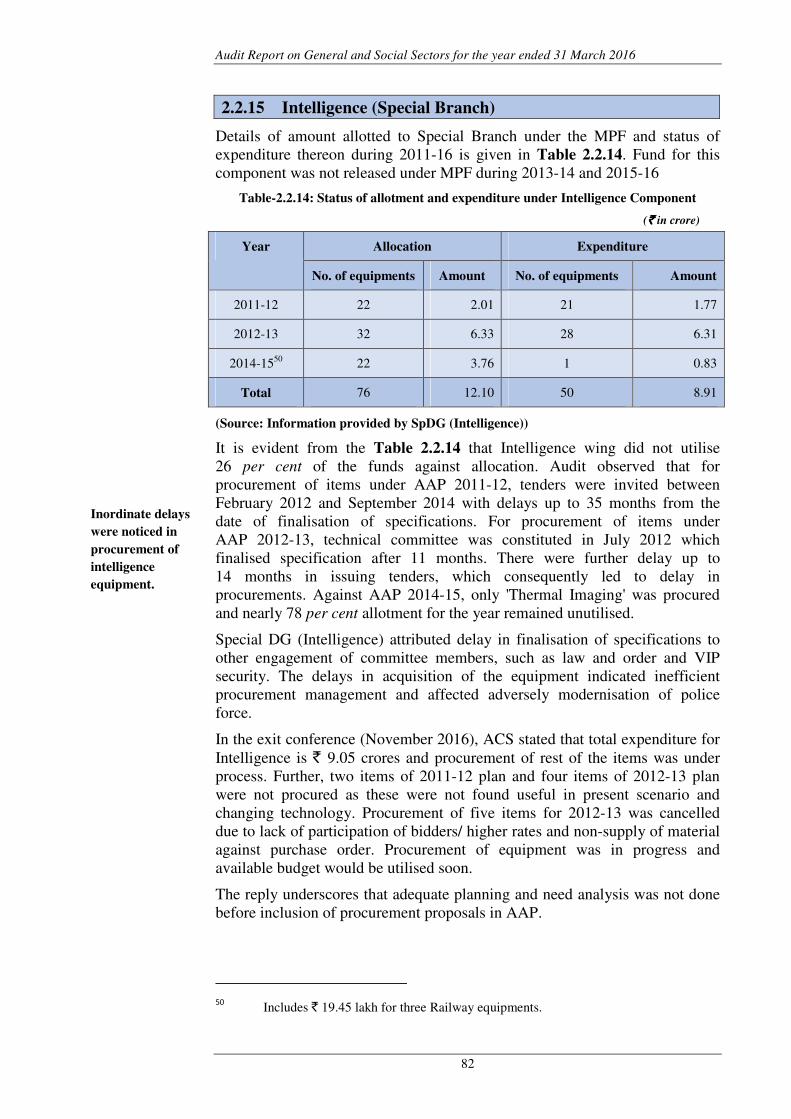
Audit Report on General and Social Sectors for the year ended 31 March 2016
82
2.2.15 Intelligence (Special Branch)
Details of amount allotted to Special Branch under the MPF and status of expenditure thereon during 2011-16 is given in Table 2.2.14. Fund for this component was not released under MPF during 2013-14 and 2015-16
Table-2.2.14: Status of allotment and expenditure under Intelligence Component
(`̀̀̀ in crore)
Year Allocation Expenditure
No. of equipments Amount No. of equipments Amount
2011-12 22 2.01 21 1.77
2012-13 32 6.33 28 6.31
2014-1550 22 3.76 1 0.83
Total 76 12.10 50 8.91
(Source: Information provided by SpDG (Intelligence))
It is evident from the Table 2.2.14 that Intelligence wing did not utilise 26 per cent of the funds against allocation. Audit observed that for procurement of items under AAP 2011-12, tenders were invited between February 2012 and September 2014 with delays up to 35 months from the date of finalisation of specifications. For procurement of items under AAP 2012-13, technical committee was constituted in July 2012 which finalised specification after 11 months. There were further delay up to 14 months in issuing tenders, which consequently led to delay in procurements. Against AAP 2014-15, only 'Thermal Imaging' was procured and nearly 78 per cent allotment for the year remained unutilised.
Special DG (Intelligence) attributed delay in finalisation of specifications to other engagement of committee members, such as law and order and VIP security. The delays in acquisition of the equipment indicated inefficient procurement management and affected adversely modernisation of police force.
In the exit conference (November 2016), ACS stated that total expenditure for Intelligence is ` 9.05 crores and procurement of rest of the items was under process. Further, two items of 2011-12 plan and four items of 2012-13 plan were not procured as these were not found useful in present scenario and changing technology. Procurement of five items for 2012-13 was cancelled due to lack of participation of bidders/ higher rates and non-supply of material against purchase order. Procurement of equipment was in progress and available budget would be utilised soon.
The reply underscores that adequate planning and need analysis was not done before inclusion of procurement proposals in AAP.
50 Includes ` 19.45 lakh for three Railway equipments.
Inordinate delays
were noticed in
procurement of
intelligence
equipment.
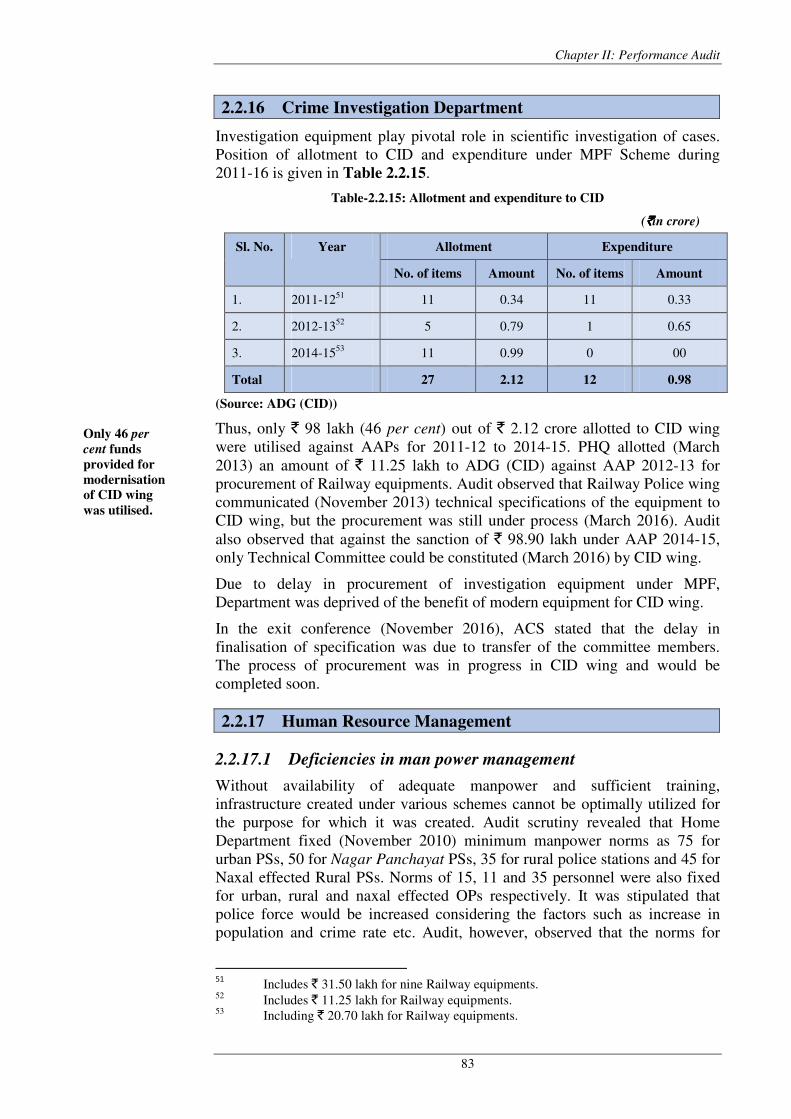
Chapter II: Performance Audit
83
2.2.16 Crime Investigation Department
Investigation equipment play pivotal role in scientific investigation of cases. Position of allotment to CID and expenditure under MPF Scheme during 2011-16 is given in Table 2.2.15.
Table-2.2.15: Allotment and expenditure to CID
(`̀̀̀in crore)
Sl. No. Year Allotment Expenditure
No. of items Amount No. of items Amount
1. 2011-1251 11 0.34 11 0.33
2. 2012-1352 5 0.79 1 0.65
3. 2014-1553 11 0.99 0 00
Total 27 2.12 12 0.98
(Source: ADG (CID))
Thus, only ` 98 lakh (46 per cent) out of ` 2.12 crore allotted to CID wing were utilised against AAPs for 2011-12 to 2014-15. PHQ allotted (March 2013) an amount of ` 11.25 lakh to ADG (CID) against AAP 2012-13 for procurement of Railway equipments. Audit observed that Railway Police wing communicated (November 2013) technical specifications of the equipment to CID wing, but the procurement was still under process (March 2016). Audit also observed that against the sanction of ` 98.90 lakh under AAP 2014-15, only Technical Committee could be constituted (March 2016) by CID wing.
Due to delay in procurement of investigation equipment under MPF, Department was deprived of the benefit of modern equipment for CID wing.
In the exit conference (November 2016), ACS stated that the delay in finalisation of specification was due to transfer of the committee members. The process of procurement was in progress in CID wing and would be completed soon.
2.2.17 Human Resource Management
2.2.17.1 Deficiencies in man power management
Without availability of adequate manpower and sufficient training, infrastructure created under various schemes cannot be optimally utilized for the purpose for which it was created. Audit scrutiny revealed that Home Department fixed (November 2010) minimum manpower norms as 75 for urban PSs, 50 for Nagar Panchayat PSs, 35 for rural police stations and 45 for Naxal effected Rural PSs. Norms of 15, 11 and 35 personnel were also fixed for urban, rural and naxal effected OPs respectively. It was stipulated that police force would be increased considering the factors such as increase in population and crime rate etc. Audit, however, observed that the norms for
51
Includes ` 31.50 lakh for nine Railway equipments. 52 Includes ` 11.25 lakh for Railway equipments. 53 Including ` 20.70 lakh for Railway equipments.
Only 46 per
cent funds
provided for
modernisation
of CID wing
was utilised.
Audit Report on General and Social Sectors for the year ended 31 March 2016
84
other constituents of Police Force, such as, District Reserve Police, Special Armed Force and Traffic Police, were not fixed.
During 2011-16, sanctioned strength of total police force increased from 87,291 to 1,12,027. However, there was overall vacancy of 16,751 personnel in police force as of June 2016.
Audit noticed that total sanctioned strength of police force in the selected districts increased from 24,436 to 29,564 during the years 2011-16. While available manpower increased from 21,602 to 25,004, the shortfall of personnel also increased from 2,834 to 4,560. As of March 2016, 34 per cent
post of Inspector/Reserve Inspector, 27 per cent post of Sub-Inspector/Subedar, 17 per cent post of Constable and 29 per cent Ministerial post were vacant. In interview of 150 police personnel in selected districts, only 5 per cent were satisfied with availability of police force.
Thus, there was significant shortage of manpower in the police force, which was crucial in view of rising crime and pendency in investigation, as discussed in paragraph 2.2.19.
In reply, ADG (Planning) stated (June 2016) that filling up of vacancies through recruitment and promotion was in process. In the exit conference (November 2016), ACS accepted the observations and stated that man power position had improved but further improvement was required. Further, GoMP had accorded in-principle sanction of 6000 new posts, the order would be issued soon.
Facts remains that there remained substantial shortfall in police personnel in all cadres, which had increased over the years in test checked districts. Thus, the Department was required to fill up of the vacancy in all cadres in a planned manner.
2.2.17.2 Deficiencies in training programmes
Following deficiencies were noticed in management of training programmes:
• Audit noticed that training calendars were not prepared for training which indicated that phased planning of training was not done. Only basic foundation courses were offered in six Police Training Schools54 (PTS) and two55 Academies during 2011-16. Further, 17,785 personnel were imparted in basic course in the PTSs and pass percentage of the trainees reduced from 84 per cent in 2011-12 to 69 per cent in 2015-16. Pass percentage of trainees had decreased due to short availability of trained teachers. The PTSs had 495 vacant posts (29 per
cent) and the vacancy in Academies were 141 (32 per cent) as of March 2016.
• In selected districts, training was imparted to only 136 personnel in modern weapons, 248 personnel in safety equipment, 137 personnel in cyber, 565 personnel in use of databank and 74 personnel in forensic
54
Indore, Sagar, Pachmadhi, Rewa, Tigra (Gwalior) and Umaria. 55 Jawahar Lal Nehru Police Academy, Sagar and Madhya Pradesh Police Academy,
Bhauri.
There was
deficiency in
providing in-
service training
in modern
weaponry.
Chapter II: Performance Audit
85
during 2011-16. Thus, there was lack of sufficient training for police personnel to raise the overall proficiency.
In the exit conference (November 2016), ACS stated that from 2010 police personnel were recruited in high numbers, as five thousand to six thousand new posts were sanctioned every year. Due to this, in-service courses were stopped to provide basic courses to new recruits so that they may be posted for field duties. However, in-service courses were conducted in supervision of Range IGs. Training to police personnel on modern weapons, data analysis and Cyber-crime were provided through 35-40 courses during the period in Rustam Ji Arms Police Training Collage, Indore, special units (such as ATS and Hawk Force etc.) and Police Radio Training School, Indore respectively. It was further stated that more attention would be paid towards training.
The Department, however, did not provide the number of personnel imparted in-service training courses. Further, the number of personnel imparted training in the Districts during 2011-16 indicated that the number of in-service training was minuscule and training courses was required to be enhanced substantially, especially in view of procurement of modern weapons under MPF.
2.2.17.3 Other Human Resource Management aspects
Human Resource aspect, such as, improvement in career advancement, improvement in living conditions, rewards systems, kind of training imparted in the improved/new training institutions including gender sensitization, custodial sensitivities, stress management, team building apart from weapon training, forensic and cyber training for specialised branches, use of data bank etc. would largely improve efficiency of police force.
Audit observed that the scheme guidelines for MPF did not provide for these aspects. However, there was a provision for preparation of strategic five year plan under the scheme, which was an opportunity to strategize such human resource aspects in larger goal of enhancing efficiency of police force. However, Audit noticed that strategic plan for the period 2011-16 did not cover aforesaid human resource aspects.
In interview of 150 police personnel in selected districts, only 26 per cent were satisfied with available resources and 45 per cent were satisfied with career progression. However, 85 per cent personnel stated that they are motivated to meet the challenges of various departmental tasks and 81 per cent were satisfied with the reward system.
In the exit conference (November 2016), ACS stated that training need analysis based courses, including the subjects of gender sensitisation, stress management, arms, law and cyber, had been prepared for posts of Constable to Deputy SP. Further, 55 officers had been imparted training in ‘Quality of Training’, 8995 Officers in ‘PS management’, 77 in ‘Best Practice and Innovative’ and 53 Officers in ‘Leadership Programme’ in various Institutes. In future, police officers would also be imparted training in new fields to make them professionally efficient.
The fact remains that the satisfaction level of police personnel about human resource aspect was not very affirmative and concerted efforts were required to address it.
Audit Report on General and Social Sectors for the year ended 31 March 2016
86
2.2.18 Monitoring and internal control
2.2.18.1 Inadequate monitoring
GoI directed (February 2001) to constitute a State Level Empowered Committee (SLEC) under the chairmanship of Chief Secretary of State to monitor the implementation of the project. GoMP constituted (June 2001) SLEC comprising of the Chief Secretary, Principal Secretary/Home, DGP, Secretary (Finance) and Additional Secretary (Home) for monitoring of the Scheme.
Audit observed that meetings of SLEC were held for approval of AAPs and there was no evidence on whether monitoring of the implementation of the project was done by SLEC or not. The department did not provide information on total number of meetings held by SLEC during 2011-16.
In the exit conference (November 2016), ACS stated that proposal of the Department was approved by the committee after being fully satisfied and utilisation of funds was being monitored by PHQ from time to time.
Reply was not acceptable, as Department SLEC was mandated for monitoring at the top level, whereas SLEC did not monitor the implementation of scheme after approving AAP.
2.2.18.2 Inadequate internal control over assets created under the
Scheme
According to MPF guidelines, annual verification of assets would be carried out by a team of designated officers of the Police Directorate and necessary entry made in the assets registers. The procedure for physical verification included generating a list of assets from assets register, physical verification of the fixed assets at its location, enquiry of discrepancies noticed, etc.
Audit noticed that Officers were not designated by PHQ during 2011-16 to carry out the annual verification of assets. In selected 13 districts, registers of assets were maintained for Arms and Vehicle. However, no register was maintained for equipment. Further, registers of assets for Houses and Buildings were maintained by only two SPs (Sagar and Chhatarpur). This indicated poor inventory management and lack of internal control over assets created under the scheme.
In the exit conference (November 2016), ACS stated that a Computerised Inventory Management System would be initiated for adequate control over assets.
2.2.18.3 Impact Assessment of Modernisation of Police Force
The Scheme was being implemented from 2000 in the State. Impact assessment of the funds utilised for Modernisation of the Police Force was vital to assess the success and midterm corrections.
Audit noticed that department assessed the impact of Mobility, Arms and Housing/ Buildings on the basis of requirement and availability but there was no evidence to suggest that any exercise to assess the overall impact of funds utilised for Modernisation was carried out by the Department itself or through third party.
Exercise to
assess the
overall impact of
funds utilised
for
Modernisation
was not carried
out.
Department did
not conduct the
annual
verification of
assets created
out of MPF
scheme.
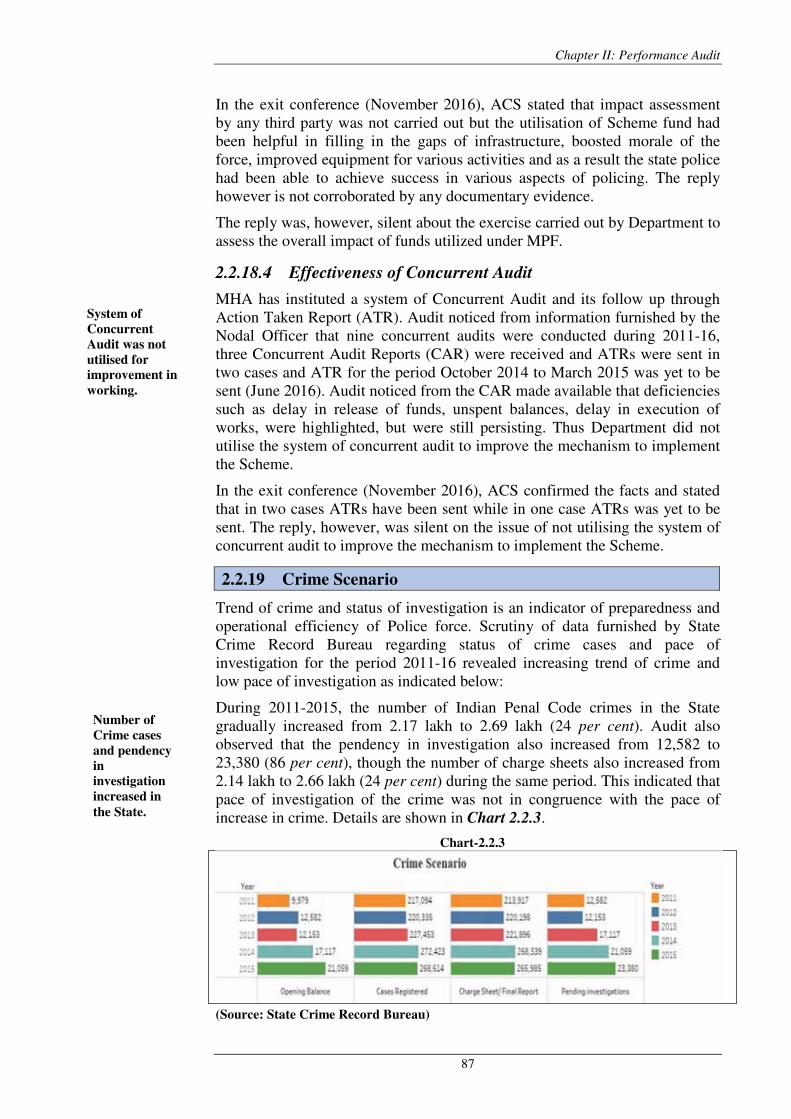
Chapter II: Performance Audit
87
In the exit conference (November 2016), ACS stated that impact assessment by any third party was not carried out but the utilisation of Scheme fund had been helpful in filling in the gaps of infrastructure, boosted morale of the force, improved equipment for various activities and as a result the state police had been able to achieve success in various aspects of policing. The reply however is not corroborated by any documentary evidence.
The reply was, however, silent about the exercise carried out by Department to assess the overall impact of funds utilized under MPF.
2.2.18.4 Effectiveness of Concurrent Audit
MHA has instituted a system of Concurrent Audit and its follow up through Action Taken Report (ATR). Audit noticed from information furnished by the Nodal Officer that nine concurrent audits were conducted during 2011-16, three Concurrent Audit Reports (CAR) were received and ATRs were sent in two cases and ATR for the period October 2014 to March 2015 was yet to be sent (June 2016). Audit noticed from the CAR made available that deficiencies such as delay in release of funds, unspent balances, delay in execution of works, were highlighted, but were still persisting. Thus Department did not utilise the system of concurrent audit to improve the mechanism to implement the Scheme.
In the exit conference (November 2016), ACS confirmed the facts and stated that in two cases ATRs have been sent while in one case ATRs was yet to be sent. The reply, however, was silent on the issue of not utilising the system of concurrent audit to improve the mechanism to implement the Scheme.
2.2.19 Crime Scenario
Trend of crime and status of investigation is an indicator of preparedness and operational efficiency of Police force. Scrutiny of data furnished by State Crime Record Bureau regarding status of crime cases and pace of investigation for the period 2011-16 revealed increasing trend of crime and low pace of investigation as indicated below:
During 2011-2015, the number of Indian Penal Code crimes in the State gradually increased from 2.17 lakh to 2.69 lakh (24 per cent). Audit also observed that the pendency in investigation also increased from 12,582 to 23,380 (86 per cent), though the number of charge sheets also increased from 2.14 lakh to 2.66 lakh (24 per cent) during the same period. This indicated that pace of investigation of the crime was not in congruence with the pace of increase in crime. Details are shown in Chart 2.2.3.
Chart-2.2.3
(Source: State Crime Record Bureau)
Number of
Crime cases
and pendency
in
investigation
increased in
the State.
System of
Concurrent
Audit was not
utilised for
improvement in
working.
Audit Report on General and Social Sectors for the year ended 31 March 2016
88
Increase in criminal cases and pendency in investigation revealed that the improvement in the efficiency of State police force was not discernible, despite increase in availability of resources such as vehicles, arms and equipments.
The SPs of selected districts attributed the increase in crime and pendency in investigation to population increase, engagement of police in other duties such as VVIPs security and court proceedings, changing economic and social scenario, increasing public awareness, etc. It was also stated that there was shortfall of police force in comparison to increase in population and crime.
Department informed (January 2017) that efforts were made for motivating the police force, which comprised:
• Training module included dimensions of personality development, such as self-development, stress management and motivational techniques.
• Various schemes such as 15 per cent reservation for Constables with excellent service record in appointment to Sub-Inspectors and rewards.
• Welfare activities such as scholarship for studying children, co-operative stores, Scheme for cashless treatment.
In the exit conference (November 2016), ACS stated that out of total increase of 24 per cent in registration during 2011-16, almost 10 per cent cases have increased because FIRs were mandatory to be lodged in cases of missing child under instruction of Honorable Supreme Court (May 2013). Police force had not increased in comparison to increase in registered crime. Investigation of cases also suffered due to engagements of the force in election and VVIPs duties, etc. It was also stated that year wise analysis of registered and disposed of cases showed that pendency has decreased from 3,177 to 2,629 for the years from 2011 to 2015.
The reply was not acceptable, as pendency in the number of investigation increased during 2011 to 2016. Therefore, effective steps was required to be taken for strengthening of police force with adequate manpower, enhanced mobility, weaponry, improvement in living condition and other related infrastructure, as discussed in the preceding paragraphs of the performance audit.
2.2.20 Conclusion
• Strategic planning was done without vision, mission, goals, objectives and evaluation plan. Gap analysis for various police equipment relating to intelligence, training, telecommunications, railway, CID and FSL was not done in AAPs. There were inordinate delays in submission of AAPs to the MHA during 2011-16, which resulted in consequential delays in approval of AAPs. Thus, there was little time left to implement the scheme as per plan and utilise the funds during the same year. Further, AAP were not prepared after including joint resource planning to optimise utilisation of fund available to the State from MPF and other related schemes.
Chapter II: Performance Audit
89
• The progress of expenditure against available funds was slow, which improved largely during 2015-16 in which ` 163.65 crore (52 per cent of total ` 316.47 crore) was incurred. Slow progress of expenditure led to short release of ` 92.79 crore of Central share for implementation of MPF in the State. For the period 2015-16, Central share of ` 23.42 crore released by MHA to GoMP as well as the State Share of ` 17.87 crore was not released to the Department. Inaccurate utilization certificate were furnished to GoI. MPPHC did not work out interest in outstanding fund of the scheme, therefore it could not be utilised for furtherance of the objectives of the Scheme.
• Due to delays in construction, availability of police housing and buildings was lagging far behind the actual requirement. Substantial number of buildings works did not commence and completed works were handed over with delay to Department by MPPHC. Inconsistency was noticed in application of quality control norms for building works. There was lack of coordination between MPPHC and the Department.
• Availability of buildings as well as houses per 100 personnel decreased. More than two thirds of subordinate police personnel could not be provided government accommodation, as there was a shortfall of 69978 houses for police personnel. Similarly, there was shortage of 718 buildings, including police station, outposts, district police office, district police line, control rooms. Basic amenities such as toilet and rest rooms for women personnel were lacking in PS/OP. Police personnel were residing and working in condemned and dilapidated houses/buildings. Thus, police force’s own security was in jeopardy.
• Response time was not monitored adequately. There was deficiency of vehicles, especially motorcycle, in the Department. There was shortage of modern weapons and Arm Workshop required upgradation. There were delays in completing procurement process. Number of Indian Penal Code crimes in State increased gradually and pace of investigation was not in congruence with the pace of increase in crime.
• There was large vacancy in Police Force. Posts of Scientific Officers and Technical Officers were lying vacant in FSL leading to pendency in sending test reports. Imparting of Training for modern and sophisticated weapons and equipment to Police Force was not adequate.
• Monitoring of implementation of scheme was not adequate. Internal control over assets created under the scheme was inadequate. Exercise to assess the overall impact of funds utilised for Modernisation was not carried out and system of Concurrent Audit was not utilised for improvement in working.
2.2.21 Recommendations
• Strategic Plan for Modernisation of Police Force may be prepared
after proper assessment of deficiencies under each component,
adherence to provisions of the Guidelines and time limit should be
ensured in submission of AAPs.
Audit Report on General and Social Sectors for the year ended 31 March 2016
90
• GoMP should ensure timely release of all due funds under MPF and
interest amount should be utilised for furtherance of the objectives of
the MPF scheme.
• Reasons for bottlenecks in implementation of various components of
MPF may be identified and rectified. There is a need for further
financial support for Modernisation of Police Force in view of
increasing manpower of Police Force.
• Shortage of manpower at various level should be addressed in phase
wise manner and overall skill development, training including use of
modern weapons and equipments should be accorded top priority.
• Periodical and regular monitoring and impact assessment mechanism
may be evolved at Government level for timely implementation of
programmes and midterm corrections.
The Department accepted the recommendations.
Chapter II: Performance Audit
91
WOMAN AND CHILD DEVELOPMENT DEPARTMENT
2.3 Performance Audit on Supplementary Nutrition
Programme under Integrated Child Development Services
Executive Summery
Integrated Child Development Services (ICDS) is India’s response to the challenge of breaking a vicious cycle of malnutrition, impaired development, morbidity and mortality in young children. Supplementary Nutrition Programme (SNP) under ICDS is primarily designed to bridge the gap between the recommendatory dietary allowance and average daily intake. Every beneficiary of SNP is provided supplementary nutrition (SN) for 300 days in a year, which is supplied by the Anganwadi Centres (AWCs) in the form of cooked meals and Take Home Ration (THR).
In Madhya Pradesh, ` 5012.17 crore was incurred on implementation of SNP during 2011-12 to 2015-16. A performance audit of the implementation of ICDS (Supplementary Nutrition Programme) in Madhya Pradesh during the period 2011-16 revealed the following:
Financial Management
State Government provided allocated food grains to District Programme Officers (DPOs) through Madhya Pradesh State Civil Supplies Corporation (MPSCSC) for release under SNP. Audit scrutiny revealed that DPOs did not adhere to Central Issue Price (CIP) of wheat and rice and payments were made to MPSCSC at higher rates. This resulted in excess payment of ` 40.87 crore to MPSCSC during 2012-13 to 2014-15. Further, unreconciled advance of ` 13.81 crore was lying with MPSCSC on account of short lifted food grains by DPOs.
(Paragraphs 2.3.6.1 and 2.3.6.3) Madhya Pradesh State Agro Industrial Development Corporation Ltd. (MP Agro), which was the agency for supply of THR packets, utilised excess wheat and rice as compared to quantity of food grains required for THR packets actually supplied by it. Department did not reconcile the reasons for excess utilised food grains, which resulted in undue financial benefits of ` 15.57 crore to MP Agro.
(Paragraph 2.3.6.2)
Short coverage of beneficiary
ICDS was to be extended to all children upto the age of six years and all pregnant and lactating mothers. During 2011-16, 20.94 lakh registered children in the age group of six months to three years, 57.02 lakh registered children in age group of three years to six years and 7.99 lakh registered pregnant and lactating mothers were not provided SN. The shortfall was due to deficient infrastructure at AWCs, preparation of less quantity of SN or at times no supply of SN and long distances of AWCs, which acted as disincentives to enrolled beneficiaries affecting their attendance at AWCs.
(Paragraph 2.3.7.2)
Audit Report on General and Social Sectors for the year ended 31 March 2016
92
Disruption in delivery of services
In 14 test-checked Project Offices, SN was not supplied during various months (ranged from one day to 120 days) during 2011-12 to 2015-16 in 983 AWCs having 37,079 registered beneficiaries.
(Paragraph 2.3.9.1)
Distribution of cooked meal
There was a shortfall of 24432.05 MT wheat and 3592.06 MT rice in distribution to Self Help Groups (SHGs) engaged in preparation of cooked meal during year 2011-16, which affected the distribution of cooked meal to beneficiaries.
(Paragraph 2.3.9.2)
Shortage of AWCs in the State
There was shortage of 18604 AWCs and 3400 Mini-AWCs in the State as of March 2016 as per population norms laid down by Government of India. Out of total 61755 villages/wards in the State, 11156 villages/wards covering 53.84 lakh population were without AWCs. GOI sanctioned 4305 (November 2014), however, these AWCs were not opened.
(Paragraph 2.3.10)
Growth monitoring and nutritional status of children
As per National Family Health Survey (2015-16), there were 9.2 per cent of severely malnourished children in the State. Thus, State could not achieve target for reducing severely malnourished children from 12.6 per cent to 5 per cent. Similarly, State was lagging behind the targets set for reducing percentage of underweight children and under-5 mortality rate.
(Paragraph 2.3.11)
Monitoring of the scheme
Meeting of State Level Monitoring and Review Committee was not held. Monitoring and Review Committee was not constituted at District and Block level for proper monitoring and supervision.
(Paragraphs 2.3.12.3 and 2.3.12.4)
2.3.1 Introduction
The Integrated Child Development Services (ICDS) scheme was launched in October 1975 by Government of India as a Centrally Sponsored Scheme. The Scheme aims at holistic development of children in the age group of zero to six years, pregnant and lactating mothers. The ICDS scheme is a package of six services, viz., Supplementary Nutrition Programme, Immunization, Health check-up, Referral Services, Pre School Education (PSE) and Nutrition and Health Education.
The Supplementary Nutrition Programme (SNP) is primarily designed to bridge the gap between the Recommended Dietary Allowance (RDA) and the Average Daily Intake (ADI). Every beneficiary under SNP is to be provided supplementary nutrition for 300 days of a year, which is delivered by the Anganwadi Centres (AWCs) at village level. The types of SN provided in Madhya Pradesh are shown in the Table 2.3.1.
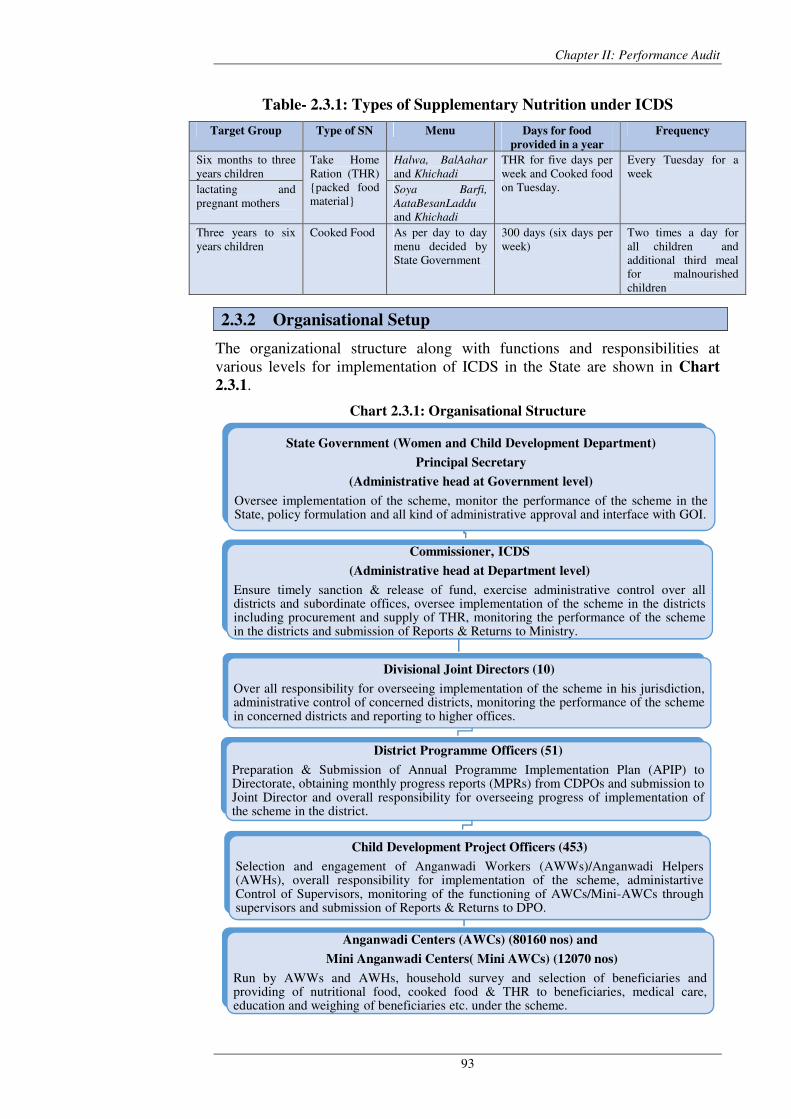
Chapter II: Performance Audit
93
Table- 2.3.1: Types of Supplementary Nutrition under ICDS
Target Group Type of SN Menu Days for food
provided in a year
Frequency
Six months to three years children
Take Home Ration (THR) {packed food material}
Halwa, BalAahar and Khichadi
THR for five days per week and Cooked food on Tuesday.
Every Tuesday for a week
lactating and pregnant mothers
Soya Barfi,
AataBesanLaddu and Khichadi
Three years to six years children
Cooked Food As per day to day menu decided by State Government
300 days (six days per week)
Two times a day for all children and additional third meal for malnourished children
2.3.2 Organisational Setup
The organizational structure along with functions and responsibilities at various levels for implementation of ICDS in the State are shown in Chart
2.3.1.
Chart 2.3.1: Organisational Structure
State Government (Women and Child Development Department)
Principal Secretary
(Administrative head at Government level)
Oversee implementation of the scheme, monitor the performance of the scheme in the State, policy formulation and all kind of administrative approval and interface with GOI.
Commissioner, ICDS
(Administrative head at Department level)
Ensure timely sanction & release of fund, exercise administrative control over all districts and subordinate offices, oversee implementation of the scheme in the districts including procurement and supply of THR, monitoring the performance of the scheme in the districts and submission of Reports & Returns to Ministry.
Divisional Joint Directors (10)
Over all responsibility for overseeing implementation of the scheme in his jurisdiction, administrative control of concerned districts, monitoring the performance of the scheme in concerned districts and reporting to higher offices.
District Programme Officers (51)
Preparation & Submission of Annual Programme Implementation Plan (APIP) to Directorate, obtaining monthly progress reports (MPRs) from CDPOs and submission to Joint Director and overall responsibility for overseeing progress of implementation of the scheme in the district.
Child Development Project Officers (453)
Selection and engagement of Anganwadi Workers (AWWs)/Anganwadi Helpers (AWHs), overall responsibility for implementation of the scheme, administartive Control of Supervisors, monitoring of the functioning of AWCs/Mini-AWCs through supervisors and submission of Reports & Returns to DPO.
Anganwadi Centers (AWCs) (80160 nos) and
Mini Anganwadi Centers( Mini AWCs) (12070 nos)
Run by AWWs and AWHs, household survey and selection of beneficiaries and providing of nutritional food, cooked food & THR to beneficiaries, medical care, education and weighing of beneficiaries etc. under the scheme.
Audit Report on General and Social Sectors for the year ended 31 March 2016
94
2.3.3 Audit Objectives
The audit objectives of the Performance Audit were to ascertain whether:
• funds provided by the Central and State Government for supplementary nutrition under the ICDS were utilised efficiently and economically;
• the services of the ICDS (SNP) were being implemented effectively so as to achieve its objective of improving the nutritional status of beneficiaries.
• required infrastructure facilities were adequate in AWCs for efficient and smooth delivery of ICDS (SNP); and
• monitoring system was adequate to ensure effective implementation of the ICDS (SNP).
2.3.4 Audit Criteria
The Audit criteria for the Performance Audit were drawn from:
• Scheme guidelines of ICDS (SNP) of GOI and State Government. • Instructions issued by the GOI and State Government. • Prescribed monitoring and evaluation mechanism.
2.3.5 Scope of Audit and Audit Methodology
The Performance Audit covers implementation of Supplementary Nutrition Programme under ICDS during 2011-12 to 2015-16. For the performance audit, 14 Districts56 and three Project Offices in each of these districts have been selected on the basis of Simple Random Sampling without Replacement (SRSWOR) method. Ten AWCs in each selected Project Office were selected on random basis.
The implementation of ICDS (Supplementary Nutrition Programme) was reviewed through a test check of the records of the Commissioner, ICDS at State level, 14 sampled district level offices of District Programme Officers (DPOs), 42 sampled Project level offices of Child Development Project Officers (CDPOs) and 420 sampled AWCs. Records of Madhya Pradesh State Agro Industrial Development Corporation Ltd. (MP Agro) relating to supply of THR and Madhya Pradesh State Civil Supplies Corporation (MPSCSC) relating to supply of food grains for ICDS were also test checked.
Joint physical inspection of 210 AWCs and 57 SHGs and joint beneficiary survey of 2080 beneficiaries, including parents (either mother or father) of children in the age group of six month to six years, and pregnant and lactating mothers were carried out with departmental officers.
An entry conference was held on 11 March 2016 with the Principal Secretary of Department of Women and Child Development (WCD) to discuss the audit objectives and audit criteria. The draft report was issued to WCD in August 2016. The audit findings were also discussed in an exit conference with the Commissioner on behalf of Principal Secretary, WCD held on 14 October
56
Alirajpur, Balaghat, Bhopal, Chhindwara, Dhar, Indore, Khandwa, Khargone, Panna, Rajgarh, Ratlam, Satna, Seoni and Vidisha.
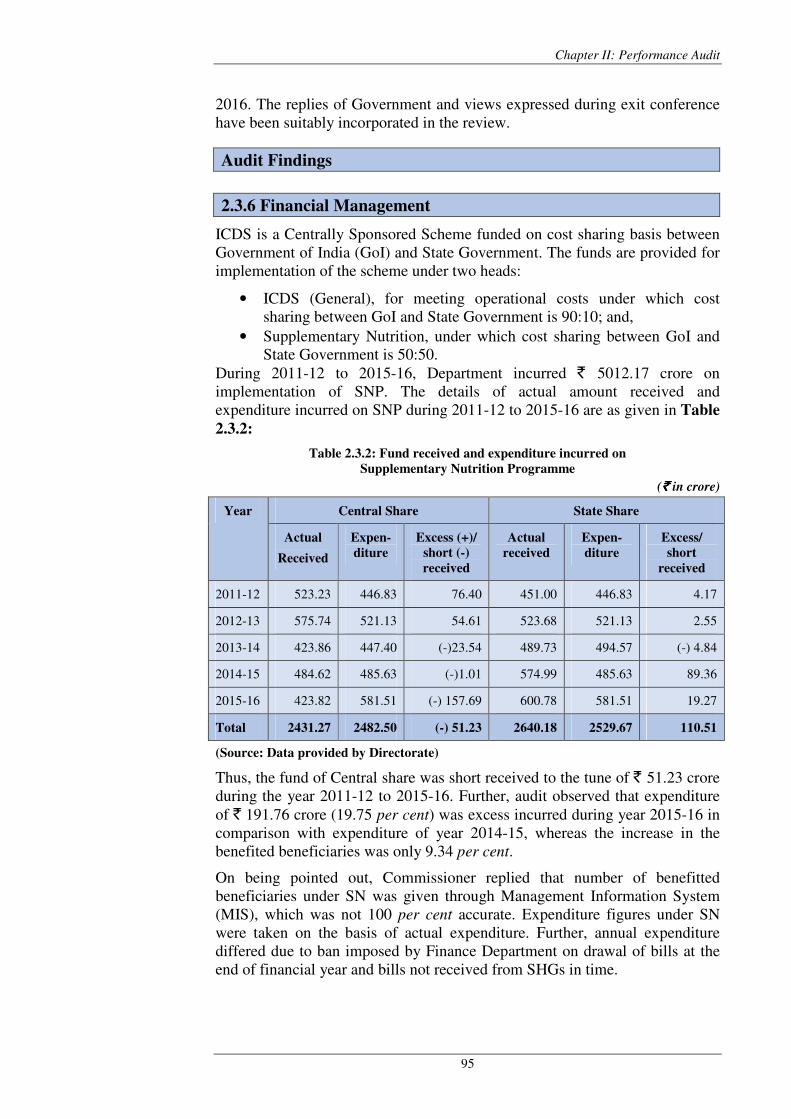
Chapter II: Performance Audit
95
2016. The replies of Government and views expressed during exit conference have been suitably incorporated in the review.
Audit Findings
2.3.6 Financial Management
ICDS is a Centrally Sponsored Scheme funded on cost sharing basis between Government of India (GoI) and State Government. The funds are provided for implementation of the scheme under two heads:
• ICDS (General), for meeting operational costs under which cost sharing between GoI and State Government is 90:10; and,
• Supplementary Nutrition, under which cost sharing between GoI and State Government is 50:50.
During 2011-12 to 2015-16, Department incurred ` 5012.17 crore on implementation of SNP. The details of actual amount received and expenditure incurred on SNP during 2011-12 to 2015-16 are as given in Table
2.3.2:
Table 2.3.2: Fund received and expenditure incurred on
Supplementary Nutrition Programme
(` ` ` ` in crore)
Year Central Share State Share
Actual
Received
Expen-
diture
Excess (+)/
short (-)
received
Actual
received
Expen-
diture
Excess/
short
received
2011-12 523.23 446.83 76.40 451.00 446.83 4.17
2012-13 575.74 521.13 54.61 523.68 521.13 2.55
2013-14 423.86 447.40 (-)23.54 489.73 494.57 (-) 4.84
2014-15 484.62 485.63 (-)1.01 574.99 485.63 89.36
2015-16 423.82 581.51 (-) 157.69 600.78 581.51 19.27
Total 2431.27 2482.50 (-) 51.23 2640.18 2529.67 110.51
(Source: Data provided by Directorate)
Thus, the fund of Central share was short received to the tune of ` 51.23 crore during the year 2011-12 to 2015-16. Further, audit observed that expenditure of ` 191.76 crore (19.75 per cent) was excess incurred during year 2015-16 in comparison with expenditure of year 2014-15, whereas the increase in the benefited beneficiaries was only 9.34 per cent.
On being pointed out, Commissioner replied that number of benefitted beneficiaries under SN was given through Management Information System (MIS), which was not 100 per cent accurate. Expenditure figures under SN were taken on the basis of actual expenditure. Further, annual expenditure differed due to ban imposed by Finance Department on drawal of bills at the end of financial year and bills not received from SHGs in time.
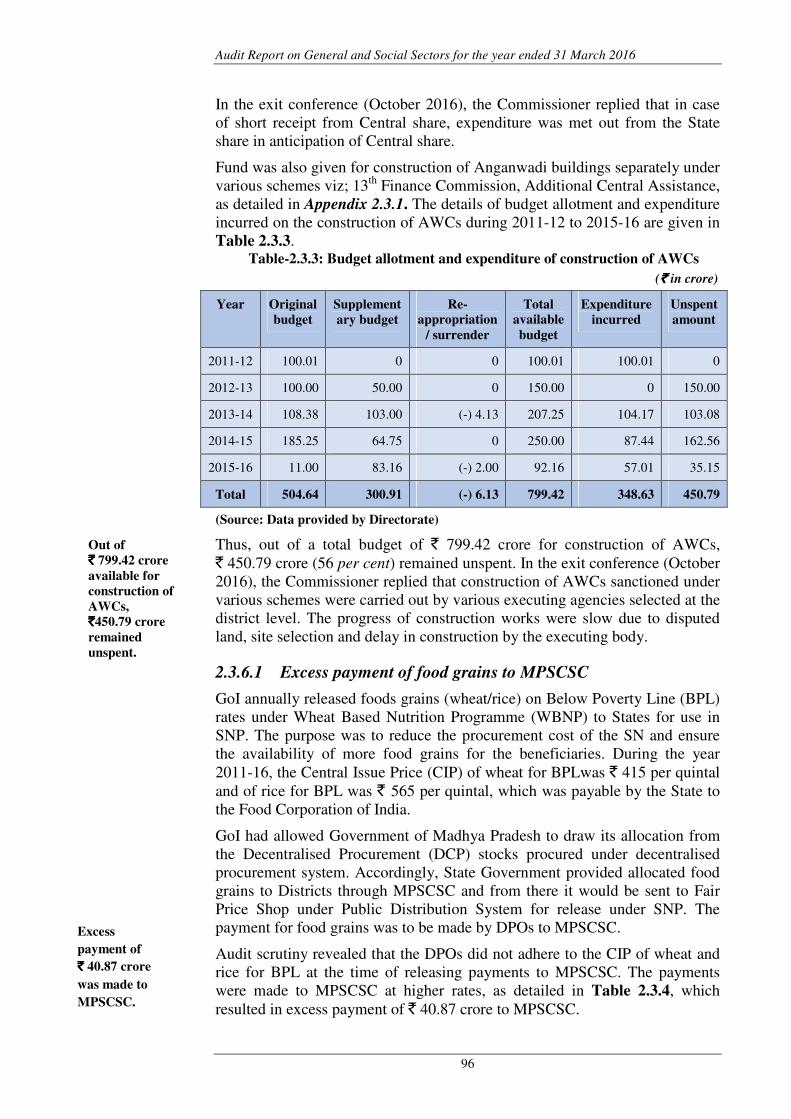
Audit Report on General and Social Sectors for the year ended 31 March 2016
96
In the exit conference (October 2016), the Commissioner replied that in case of short receipt from Central share, expenditure was met out from the State share in anticipation of Central share.
Fund was also given for construction of Anganwadi buildings separately under various schemes viz; 13th Finance Commission, Additional Central Assistance, as detailed in Appendix 2.3.1. The details of budget allotment and expenditure incurred on the construction of AWCs during 2011-12 to 2015-16 are given in Table 2.3.3.
Table-2.3.3: Budget allotment and expenditure of construction of AWCs
(` ` ` ` in crore)
Year Original
budget
Supplement
ary budget
Re-
appropriation
/ surrender
Total
available
budget
Expenditure
incurred
Unspent
amount
2011-12 100.01 0 0 100.01 100.01 0
2012-13 100.00 50.00 0 150.00 0 150.00
2013-14 108.38 103.00 (-) 4.13 207.25 104.17 103.08
2014-15 185.25 64.75 0 250.00 87.44 162.56
2015-16 11.00 83.16 (-) 2.00 92.16 57.01 35.15
Total 504.64 300.91 (-) 6.13 799.42 348.63 450.79
(Source: Data provided by Directorate)
Thus, out of a total budget of ` 799.42 crore for construction of AWCs, ` 450.79 crore (56 per cent) remained unspent. In the exit conference (October 2016), the Commissioner replied that construction of AWCs sanctioned under various schemes were carried out by various executing agencies selected at the district level. The progress of construction works were slow due to disputed land, site selection and delay in construction by the executing body.
2.3.6.1 Excess payment of food grains to MPSCSC
GoI annually released foods grains (wheat/rice) on Below Poverty Line (BPL) rates under Wheat Based Nutrition Programme (WBNP) to States for use in SNP. The purpose was to reduce the procurement cost of the SN and ensure the availability of more food grains for the beneficiaries. During the year 2011-16, the Central Issue Price (CIP) of wheat for BPLwas ` 415 per quintal and of rice for BPL was ` 565 per quintal, which was payable by the State to the Food Corporation of India.
GoI had allowed Government of Madhya Pradesh to draw its allocation from the Decentralised Procurement (DCP) stocks procured under decentralised procurement system. Accordingly, State Government provided allocated food grains to Districts through MPSCSC and from there it would be sent to Fair Price Shop under Public Distribution System for release under SNP. The payment for food grains was to be made by DPOs to MPSCSC.
Audit scrutiny revealed that the DPOs did not adhere to the CIP of wheat and rice for BPL at the time of releasing payments to MPSCSC. The payments were made to MPSCSC at higher rates, as detailed in Table 2.3.4, which resulted in excess payment of ` 40.87 crore to MPSCSC.
Excess
payment of
`̀̀̀ 40.87 crore
was made to
MPSCSC.
Out of
`̀̀̀ 799.42 crore
available for
construction of
AWCs,
`̀̀̀450.79 crore
remained
unspent.
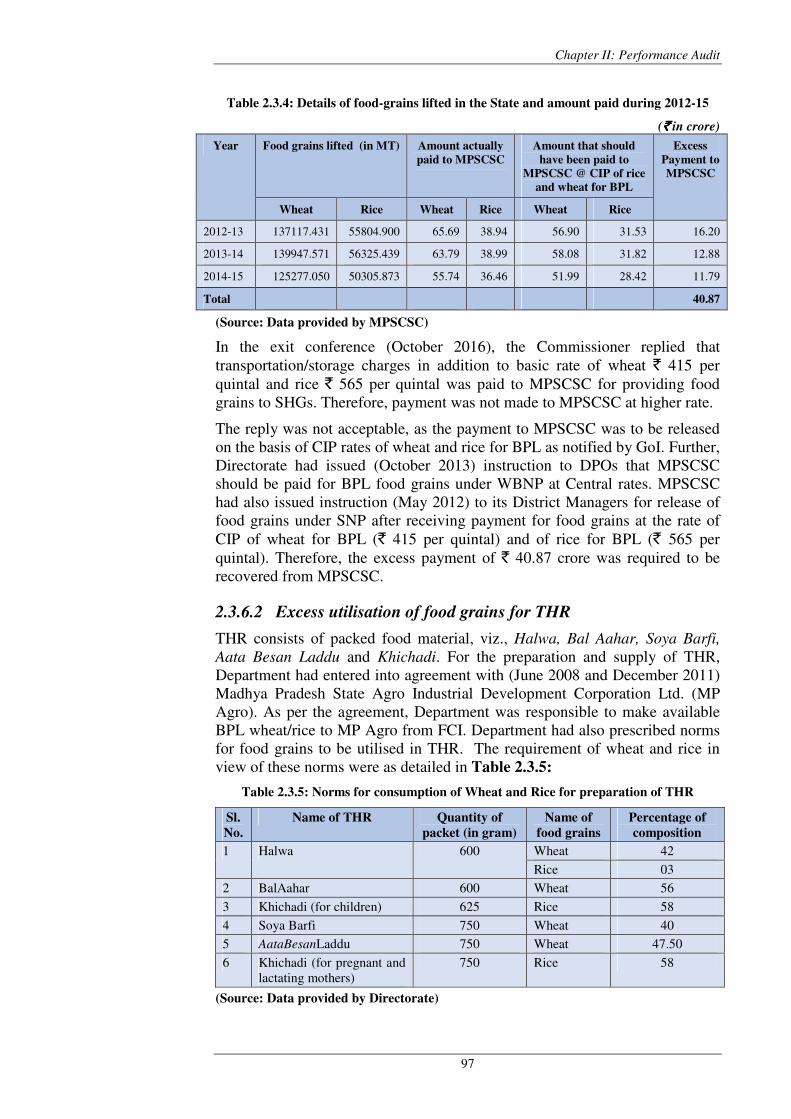
Chapter II: Performance Audit
97
Table 2.3.4: Details of food-grains lifted in the State and amount paid during 2012-15
(`̀̀̀ in crore)
Year Food grains lifted (in MT) Amount actually
paid to MPSCSC
Amount that should
have been paid to
MPSCSC @ CIP of rice
and wheat for BPL
Excess
Payment to
MPSCSC
Wheat Rice Wheat Rice Wheat Rice
2012-13 137117.431 55804.900 65.69 38.94 56.90 31.53 16.20
2013-14 139947.571 56325.439 63.79 38.99 58.08 31.82 12.88
2014-15 125277.050 50305.873 55.74 36.46 51.99 28.42 11.79
Total 40.87
(Source: Data provided by MPSCSC)
In the exit conference (October 2016), the Commissioner replied that transportation/storage charges in addition to basic rate of wheat ` 415 per quintal and rice ` 565 per quintal was paid to MPSCSC for providing food grains to SHGs. Therefore, payment was not made to MPSCSC at higher rate.
The reply was not acceptable, as the payment to MPSCSC was to be released on the basis of CIP rates of wheat and rice for BPL as notified by GoI. Further, Directorate had issued (October 2013) instruction to DPOs that MPSCSC should be paid for BPL food grains under WBNP at Central rates. MPSCSC had also issued instruction (May 2012) to its District Managers for release of food grains under SNP after receiving payment for food grains at the rate of CIP of wheat for BPL (` 415 per quintal) and of rice for BPL (` 565 per quintal). Therefore, the excess payment of ` 40.87 crore was required to be recovered from MPSCSC.
2.3.6.2 Excess utilisation of food grains for THR
THR consists of packed food material, viz., Halwa, Bal Aahar, Soya Barfi,
Aata Besan Laddu and Khichadi. For the preparation and supply of THR, Department had entered into agreement with (June 2008 and December 2011) Madhya Pradesh State Agro Industrial Development Corporation Ltd. (MP Agro). As per the agreement, Department was responsible to make available BPL wheat/rice to MP Agro from FCI. Department had also prescribed norms for food grains to be utilised in THR. The requirement of wheat and rice in view of these norms were as detailed in Table 2.3.5:
Table 2.3.5: Norms for consumption of Wheat and Rice for preparation of THR
Sl.
No.
Name of THR Quantity of
packet (in gram)
Name of
food grains
Percentage of
composition
1 Halwa 600 Wheat 42
Rice 03
2 BalAahar 600 Wheat 56
3 Khichadi (for children) 625 Rice 58
4 Soya Barfi 750 Wheat 40
5 AataBesanLaddu 750 Wheat 47.50
6 Khichadi (for pregnant and lactating mothers)
750 Rice 58
(Source: Data provided by Directorate)
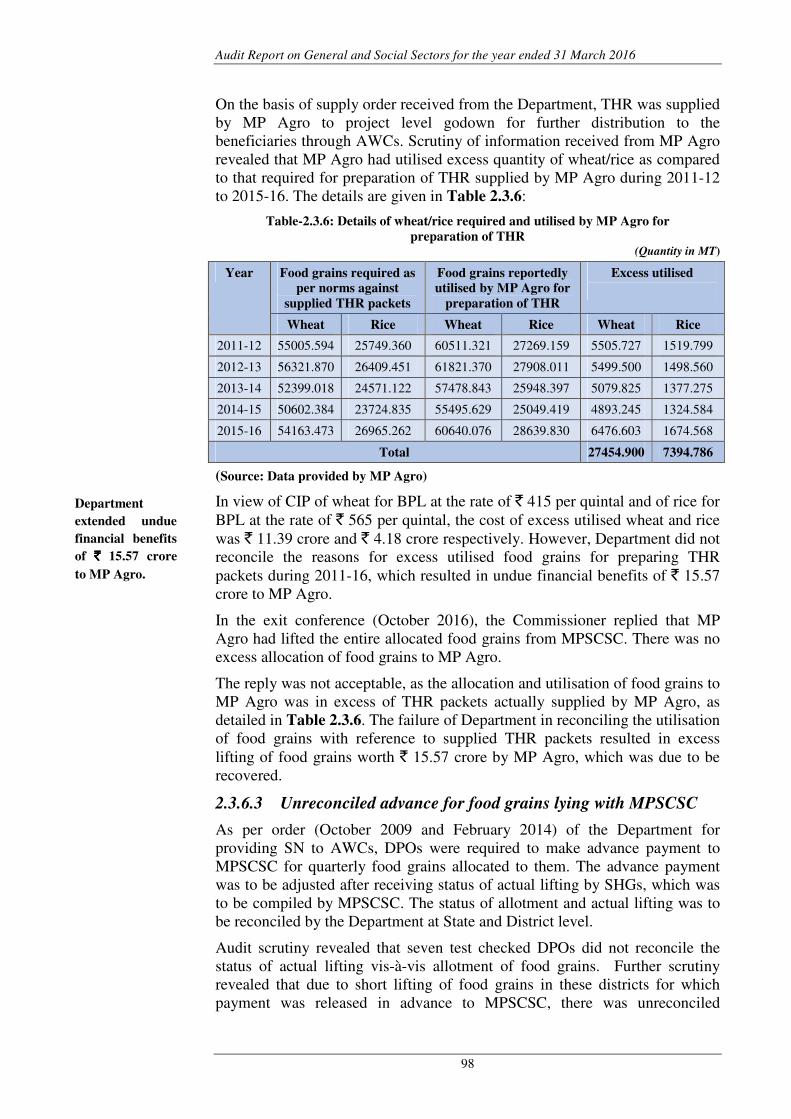
Audit Report on General and Social Sectors for the year ended 31 March 2016
98
On the basis of supply order received from the Department, THR was supplied by MP Agro to project level godown for further distribution to the beneficiaries through AWCs. Scrutiny of information received from MP Agro revealed that MP Agro had utilised excess quantity of wheat/rice as compared to that required for preparation of THR supplied by MP Agro during 2011-12 to 2015-16. The details are given in Table 2.3.6:
Table-2.3.6: Details of wheat/rice required and utilised by MP Agro for
preparation of THR (Quantity in MT)
Year Food grains required as
per norms against
supplied THR packets
Food grains reportedly
utilised by MP Agro for
preparation of THR
Excess utilised
Wheat Rice Wheat Rice Wheat Rice
2011-12 55005.594 25749.360 60511.321 27269.159 5505.727 1519.799
2012-13 56321.870 26409.451 61821.370 27908.011 5499.500 1498.560
2013-14 52399.018 24571.122 57478.843 25948.397 5079.825 1377.275
2014-15 50602.384 23724.835 55495.629 25049.419 4893.245 1324.584
2015-16 54163.473 26965.262 60640.076 28639.830 6476.603 1674.568
Total 27454.900 7394.786
(Source: Data provided by MP Agro)
In view of CIP of wheat for BPL at the rate of ` 415 per quintal and of rice for BPL at the rate of ` 565 per quintal, the cost of excess utilised wheat and rice was ` 11.39 crore and ` 4.18 crore respectively. However, Department did not reconcile the reasons for excess utilised food grains for preparing THR packets during 2011-16, which resulted in undue financial benefits of ` 15.57 crore to MP Agro.
In the exit conference (October 2016), the Commissioner replied that MP Agro had lifted the entire allocated food grains from MPSCSC. There was no excess allocation of food grains to MP Agro.
The reply was not acceptable, as the allocation and utilisation of food grains to MP Agro was in excess of THR packets actually supplied by MP Agro, as detailed in Table 2.3.6. The failure of Department in reconciling the utilisation of food grains with reference to supplied THR packets resulted in excess lifting of food grains worth ` 15.57 crore by MP Agro, which was due to be recovered.
2.3.6.3 Unreconciled advance for food grains lying with MPSCSC
As per order (October 2009 and February 2014) of the Department for providing SN to AWCs, DPOs were required to make advance payment to MPSCSC for quarterly food grains allocated to them. The advance payment was to be adjusted after receiving status of actual lifting by SHGs, which was to be compiled by MPSCSC. The status of allotment and actual lifting was to be reconciled by the Department at State and District level.
Audit scrutiny revealed that seven test checked DPOs did not reconcile the status of actual lifting vis-à-vis allotment of food grains. Further scrutiny revealed that due to short lifting of food grains in these districts for which payment was released in advance to MPSCSC, there was unreconciled
Department
extended undue
financial benefits
of `̀̀̀ 15.57 crore
to MP Agro.
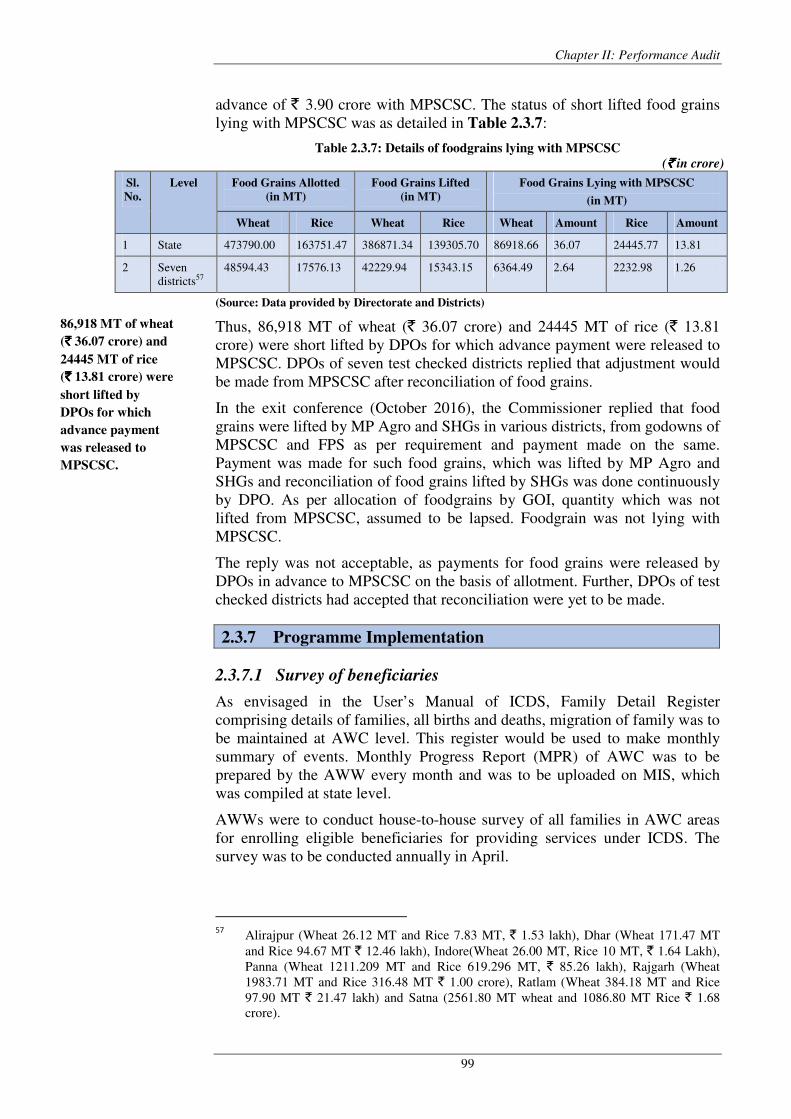
Chapter II: Performance Audit
99
advance of ` 3.90 crore with MPSCSC. The status of short lifted food grains lying with MPSCSC was as detailed in Table 2.3.7:
Table 2.3.7: Details of foodgrains lying with MPSCSC
(`̀̀̀ in crore)
Sl.
No.
Level Food Grains Allotted
(in MT)
Food Grains Lifted
(in MT)
Food Grains Lying with MPSCSC
(in MT)
Wheat Rice Wheat Rice Wheat Amount Rice Amount
1 State 473790.00 163751.47 386871.34 139305.70 86918.66 36.07 24445.77 13.81
2 Seven districts57
48594.43 17576.13 42229.94 15343.15 6364.49 2.64 2232.98 1.26
(Source: Data provided by Directorate and Districts)
Thus, 86,918 MT of wheat (` 36.07 crore) and 24445 MT of rice (` 13.81 crore) were short lifted by DPOs for which advance payment were released to MPSCSC. DPOs of seven test checked districts replied that adjustment would be made from MPSCSC after reconciliation of food grains.
In the exit conference (October 2016), the Commissioner replied that food grains were lifted by MP Agro and SHGs in various districts, from godowns of MPSCSC and FPS as per requirement and payment made on the same. Payment was made for such food grains, which was lifted by MP Agro and SHGs and reconciliation of food grains lifted by SHGs was done continuously by DPO. As per allocation of foodgrains by GOI, quantity which was not lifted from MPSCSC, assumed to be lapsed. Foodgrain was not lying with MPSCSC.
The reply was not acceptable, as payments for food grains were released by DPOs in advance to MPSCSC on the basis of allotment. Further, DPOs of test checked districts had accepted that reconciliation were yet to be made.
2.3.7 Programme Implementation
2.3.7.1 Survey of beneficiaries
As envisaged in the User’s Manual of ICDS, Family Detail Register comprising details of families, all births and deaths, migration of family was to be maintained at AWC level. This register would be used to make monthly summary of events. Monthly Progress Report (MPR) of AWC was to be prepared by the AWW every month and was to be uploaded on MIS, which was compiled at state level.
AWWs were to conduct house-to-house survey of all families in AWC areas for enrolling eligible beneficiaries for providing services under ICDS. The survey was to be conducted annually in April.
57
Alirajpur (Wheat 26.12 MT and Rice 7.83 MT, ` 1.53 lakh), Dhar (Wheat 171.47 MT and Rice 94.67 MT ` 12.46 lakh), Indore(Wheat 26.00 MT, Rice 10 MT, ` 1.64 Lakh), Panna (Wheat 1211.209 MT and Rice 619.296 MT, ` 85.26 lakh), Rajgarh (Wheat 1983.71 MT and Rice 316.48 MT ` 1.00 crore), Ratlam (Wheat 384.18 MT and Rice 97.90 MT ` 21.47 lakh) and Satna (2561.80 MT wheat and 1086.80 MT Rice ` 1.68 crore).
86,918 MT of wheat
(`̀̀̀ 36.07 crore) and
24445 MT of rice
(`̀̀̀ 13.81 crore) were
short lifted by
DPOs for which
advance payment
was released to
MPSCSC.
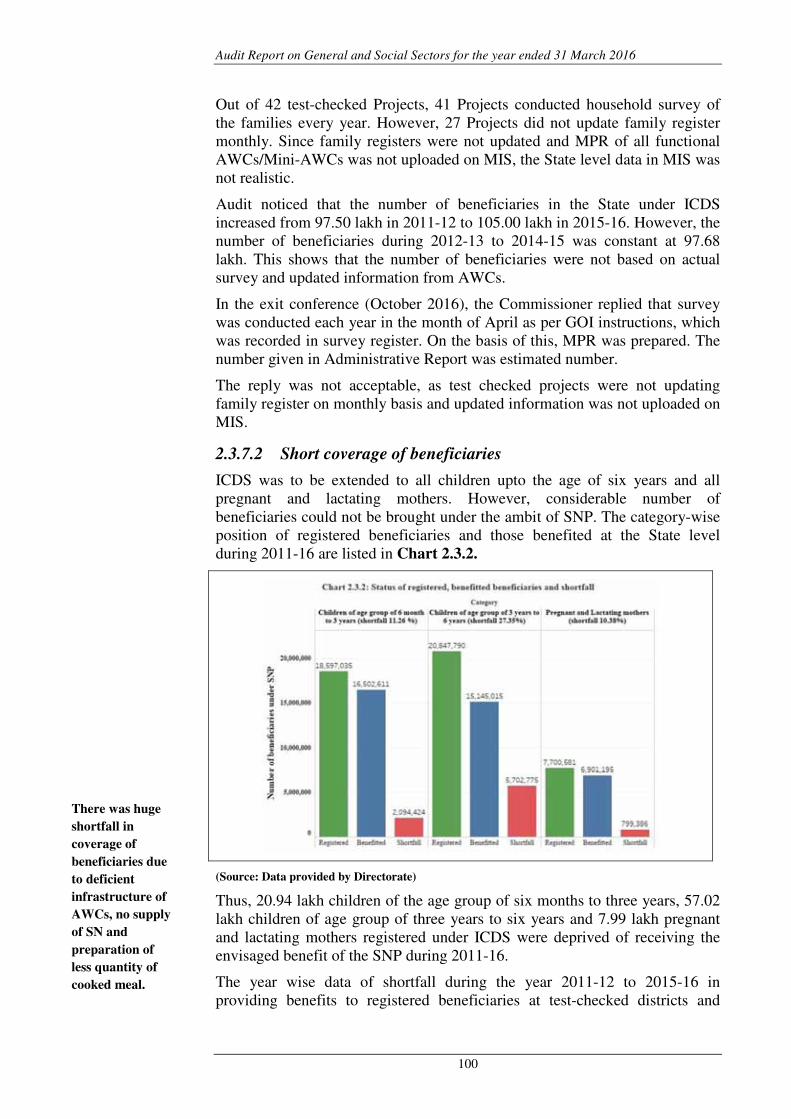
Audit Report on General and Social Sectors for the year ended 31 March 2016
100
Out of 42 test-checked Projects, 41 Projects conducted household survey of the families every year. However, 27 Projects did not update family register monthly. Since family registers were not updated and MPR of all functional AWCs/Mini-AWCs was not uploaded on MIS, the State level data in MIS was not realistic.
Audit noticed that the number of beneficiaries in the State under ICDS increased from 97.50 lakh in 2011-12 to 105.00 lakh in 2015-16. However, the number of beneficiaries during 2012-13 to 2014-15 was constant at 97.68 lakh. This shows that the number of beneficiaries were not based on actual survey and updated information from AWCs.
In the exit conference (October 2016), the Commissioner replied that survey was conducted each year in the month of April as per GOI instructions, which was recorded in survey register. On the basis of this, MPR was prepared. The number given in Administrative Report was estimated number.
The reply was not acceptable, as test checked projects were not updating family register on monthly basis and updated information was not uploaded on MIS.
2.3.7.2 Short coverage of beneficiaries
ICDS was to be extended to all children upto the age of six years and all pregnant and lactating mothers. However, considerable number of beneficiaries could not be brought under the ambit of SNP. The category-wise position of registered beneficiaries and those benefited at the State level during 2011-16 are listed in Chart 2.3.2.
(Source: Data provided by Directorate)
Thus, 20.94 lakh children of the age group of six months to three years, 57.02 lakh children of age group of three years to six years and 7.99 lakh pregnant and lactating mothers registered under ICDS were deprived of receiving the envisaged benefit of the SNP during 2011-16.
The year wise data of shortfall during the year 2011-12 to 2015-16 in providing benefits to registered beneficiaries at test-checked districts and
There was huge
shortfall in
coverage of
beneficiaries due
to deficient
infrastructure of
AWCs, no supply
of SN and
preparation of
less quantity of
cooked meal.
Chapter II: Performance Audit
101
projects are given in Appendix 2.3.2 and Appendix 2.3.3 respectively, which was as summarised in Table 2.3.8:
Table-2.3.8: Details of shortfall of beneficiaries under SN at selected Districts, Projects
and AWCs during 2011-12 to 2015-16.
Sl.
No.
Type of beneficiaries Shortfall at
District level
Shortfall at
Project
level
Shortfall at
AWCs
1 Children in the age group of six months to three years
974245 (15.52 %) 219893 (12.79 %)
15577 (12.13 %)
2 Children in the age group of three years to six years
1749187 (26.46 %) 436447 (24.16 %)
34189 (26.85 %)
3 Pregnant and lactating mothers
271718 (10.92 %) 74972 (10.90 %)
5005 (9.47 %)
(Source: Data provided by Districts, Projects and AWCs)
The shortfall in providing supplementary nutrition was due to poor infrastructure of AWCs, failure of AWCs to distribute SN as per menu, preparation of either less quantity of SN or at times no supply of SN at AWCs and long distances of AWCs, as discussed in succeeding paragraphs. These deficiencies acted as disincentives to enrolled beneficiaries affecting their attendance at AWCs.
In the exit conference (October 2016), the Commissioner replied that efforts were being made constantly against shortfall. Instructions had been issued to enroll the uncovered children and to enhance the regular attendance through Anganwadi Chalo Abhiyan and monthly review to ensure providing 100 per
cent benefits. Due to first registration/enrollment of children in the age of three to six years in school, 100 per cent target could not be achieved. Further, due to migration of parents/guardian to other places and admission of children of three to six years in school, less number of beneficiaries got SN.
The reply was not acceptable because as per the instructions of GOI, all the beneficiaries should be covered under ICDS. The shortfall has been commented with reference to registered beneficiaries and the migrated parents/guardian would not appear in the enrolment of beneficiaries. Further, State Government could have linked enrolled beneficiaries with Aadhar, so that it could be tracked whether there was indeed migration within the State and whether those people were availing of the benefits at the next place.
In its further reply (December 2016), the Commissioner informed that action for registration of all beneficiaries under Aadhar were being taken.
2.3.8 Take Home Ration
Take Home Ration (THR) consisting of six types of packed food material, namely; Halwa, Bal Aahar and Khichadi are provided to the children in the age group of six months to three years and Soya Barfi, Aata Besan Laddu and Khichadi are provided to pregnant and lactating mothers. One packet of THR per beneficiary was distributed on Tuesday for following five days at AWCs. As per the agreement entered into with MP Agro, supply order of THR was given by Directorate to MP Agro. On the basis of supply order, THR was
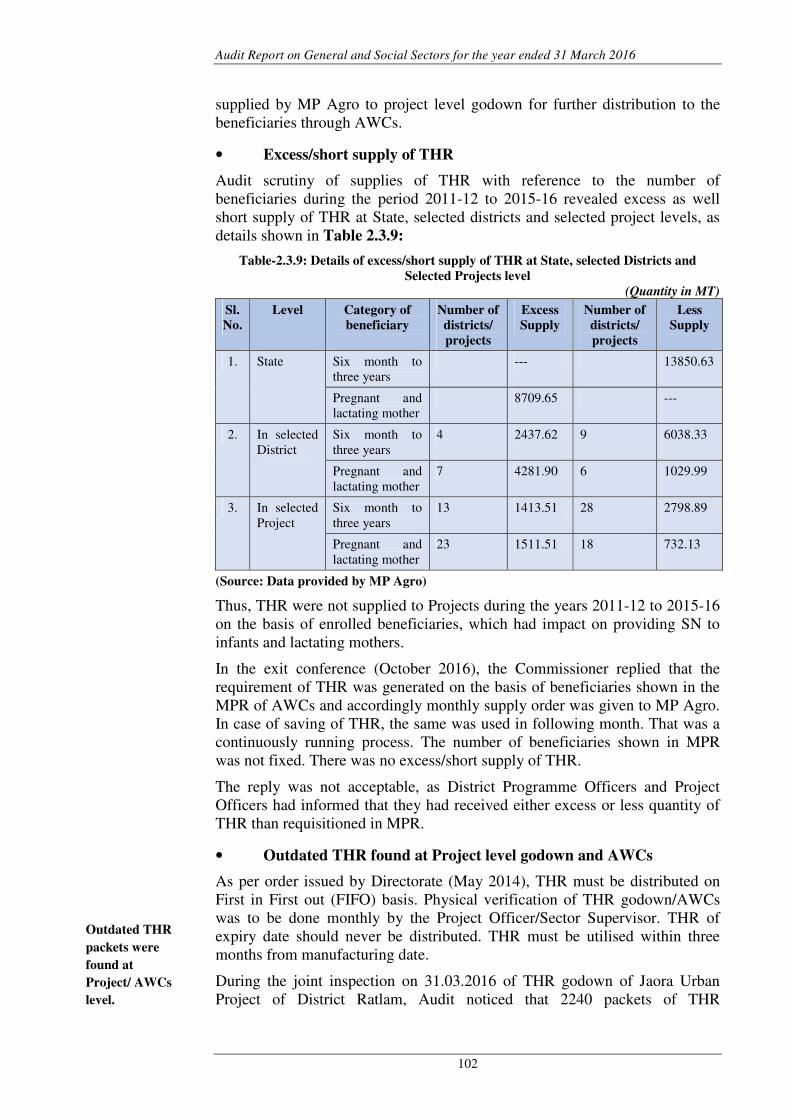
Audit Report on General and Social Sectors for the year ended 31 March 2016
102
supplied by MP Agro to project level godown for further distribution to the beneficiaries through AWCs.
• Excess/short supply of THR
Audit scrutiny of supplies of THR with reference to the number of beneficiaries during the period 2011-12 to 2015-16 revealed excess as well short supply of THR at State, selected districts and selected project levels, as details shown in Table 2.3.9:
Table-2.3.9: Details of excess/short supply of THR at State, selected Districts and
Selected Projects level
(Quantity in MT)
Sl.
No.
Level Category of
beneficiary
Number of
districts/
projects
Excess
Supply
Number of
districts/
projects
Less
Supply
1. State Six month to three years
--- 13850.63
Pregnant and lactating mother
8709.65 ---
2. In selected District
Six month to three years
4 2437.62 9 6038.33
Pregnant and lactating mother
7 4281.90 6 1029.99
3. In selected Project
Six month to three years
13 1413.51 28 2798.89
Pregnant and lactating mother
23 1511.51 18 732.13
(Source: Data provided by MP Agro)
Thus, THR were not supplied to Projects during the years 2011-12 to 2015-16 on the basis of enrolled beneficiaries, which had impact on providing SN to infants and lactating mothers.
In the exit conference (October 2016), the Commissioner replied that the requirement of THR was generated on the basis of beneficiaries shown in the MPR of AWCs and accordingly monthly supply order was given to MP Agro. In case of saving of THR, the same was used in following month. That was a continuously running process. The number of beneficiaries shown in MPR was not fixed. There was no excess/short supply of THR.
The reply was not acceptable, as District Programme Officers and Project Officers had informed that they had received either excess or less quantity of THR than requisitioned in MPR.
• Outdated THR found at Project level godown and AWCs
As per order issued by Directorate (May 2014), THR must be distributed on First in First out (FIFO) basis. Physical verification of THR godown/AWCs was to be done monthly by the Project Officer/Sector Supervisor. THR of expiry date should never be distributed. THR must be utilised within three months from manufacturing date.
During the joint inspection on 31.03.2016 of THR godown of Jaora Urban Project of District Ratlam, Audit noticed that 2240 packets of THR
Outdated THR
packets were
found at
Project/ AWCs
level.
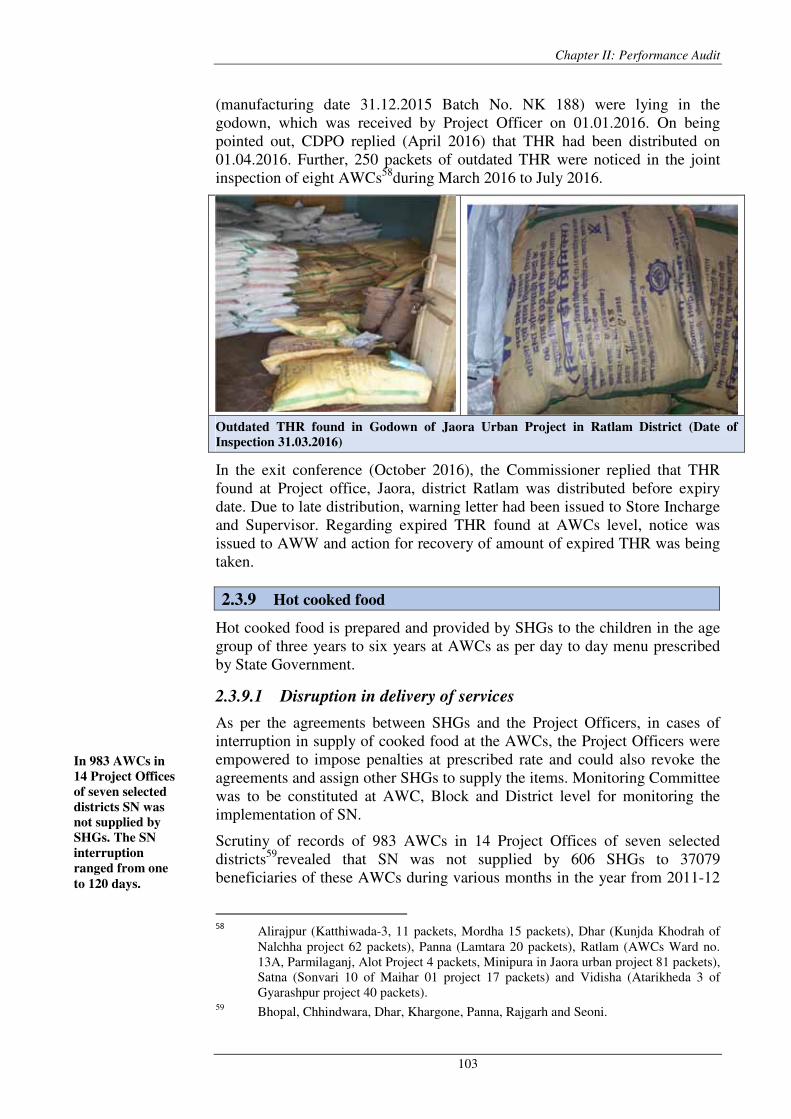
Chapter II: Performance Audit
103
(manufacturing date 31.12.2015 Batch No. NK 188) were lying in the godown, which was received by Project Officer on 01.01.2016. On being pointed out, CDPO replied (April 2016) that THR had been distributed on 01.04.2016. Further, 250 packets of outdated THR were noticed in the joint inspection of eight AWCs58during March 2016 to July 2016.
Outdated THR found in Godown of Jaora Urban Project in Ratlam District (Date of
Inspection 31.03.2016)
In the exit conference (October 2016), the Commissioner replied that THR found at Project office, Jaora, district Ratlam was distributed before expiry date. Due to late distribution, warning letter had been issued to Store Incharge and Supervisor. Regarding expired THR found at AWCs level, notice was issued to AWW and action for recovery of amount of expired THR was being taken.
2.3.9 Hot cooked food
Hot cooked food is prepared and provided by SHGs to the children in the age group of three years to six years at AWCs as per day to day menu prescribed by State Government.
2.3.9.1 Disruption in delivery of services
As per the agreements between SHGs and the Project Officers, in cases of interruption in supply of cooked food at the AWCs, the Project Officers were empowered to impose penalties at prescribed rate and could also revoke the agreements and assign other SHGs to supply the items. Monitoring Committee was to be constituted at AWC, Block and District level for monitoring the implementation of SN.
Scrutiny of records of 983 AWCs in 14 Project Offices of seven selected districts59revealed that SN was not supplied by 606 SHGs to 37079 beneficiaries of these AWCs during various months in the year from 2011-12
58
Alirajpur (Katthiwada-3, 11 packets, Mordha 15 packets), Dhar (Kunjda Khodrah of Nalchha project 62 packets), Panna (Lamtara 20 packets), Ratlam (AWCs Ward no. 13A, Parmilaganj, Alot Project 4 packets, Minipura in Jaora urban project 81 packets), Satna (Sonvari 10 of Maihar 01 project 17 packets) and Vidisha (Atarikheda 3 of Gyarashpur project 40 packets).
59 Bhopal, Chhindwara, Dhar, Khargone, Panna, Rajgarh and Seoni.
In 983 AWCs in
14 Project Offices
of seven selected
districts SN was
not supplied by
SHGs. The SN
interruption
ranged from one
to 120 days.
Audit Report on General and Social Sectors for the year ended 31 March 2016
104
to 2015-16, as detailed in Appendix 2.3.4. The SN interruption ranged from one to 120 days.
In the exit conference (October 2016), the Commissioner replied that inspection of AWCs were being conducted by departmental officers from time to time so that interruption of supplementary nutrition did not happen.
The reply was not acceptable, as respective CDPOs had accepted disruption in delivery of cooked food. Thus, the beneficiaries were deprived of the SN and the intended objective of ICDS was defeated. The following case studies present the cases of nutrition interruption.
Case Study 1: SN was not distributed at AWCs for two years
During inspection (March 2016) of Nevali AWC of Lateri Project in district Vidisha, it was noticed that cooked food was not given to 127 beneficiaries since last two years. In Unheli AWC of Sardarpur 1 Project in district Dhar, breakfast was not given to 96 beneficiaries from 2013-14 to 2015-16.
Audit observed that District Level Monitoring and Review Committee and Block Level Monitoring Committee were not functional in both districts as well as in their projects.
On being pointed out, CDPO, Sardarpur 1 project replied (April 2016) that action would be taken to get rid of discrepancies found at AWCs. In exit conference, the Commissioner replied that that action would be initiated in the case.
Case Study 2: SN was not distributed during summer vacation by
Sanjha Chulha60
in Satna District.
Audit scrutiny of the records/bills for payment of SN to SHGs of sampled Project Maihar-01, District Satna for the months of summer vacation (May of 2013, 2014 and 2015) revealed that SN was not supplied at 269 AWCs (43 per cent) out of 623 rural AWCs by SHGs under Sanjha Chulha during May 2013, May 2014 and May 2015.
DPO replied (May 2016) that notices were being issued to SHGs to ensure distribution of SN at AWCs and beneficiaries were distributed THR packets as an alternative arrangement.
In the exit conference (October 2016), the Commissioner replied that the Collector, Satna had issued a letter (June 2013) regarding regular distribution of supplementary nutrition under Sanjha Chulha in the summer vacation. Show cause notice had been issued to SHGs who did not supply SN at AWCs.
Reply was not acceptable, as no alternative arrangement was made to provide cooked food at AWCs during summer vacation.
2.3.9.2 Short allotment of food grains to SHG
District wise allotment of foodgrains under SNP was given by Directorate after receiving allocation from GOI. Further, project wise re-allocation of
60
Sanjha Chulha is a scheme for serving hot cooked meal by SHGs to beneficiaries under MDM and SNP.
SN was not
distributed
during summer
vacation in
district Satna.
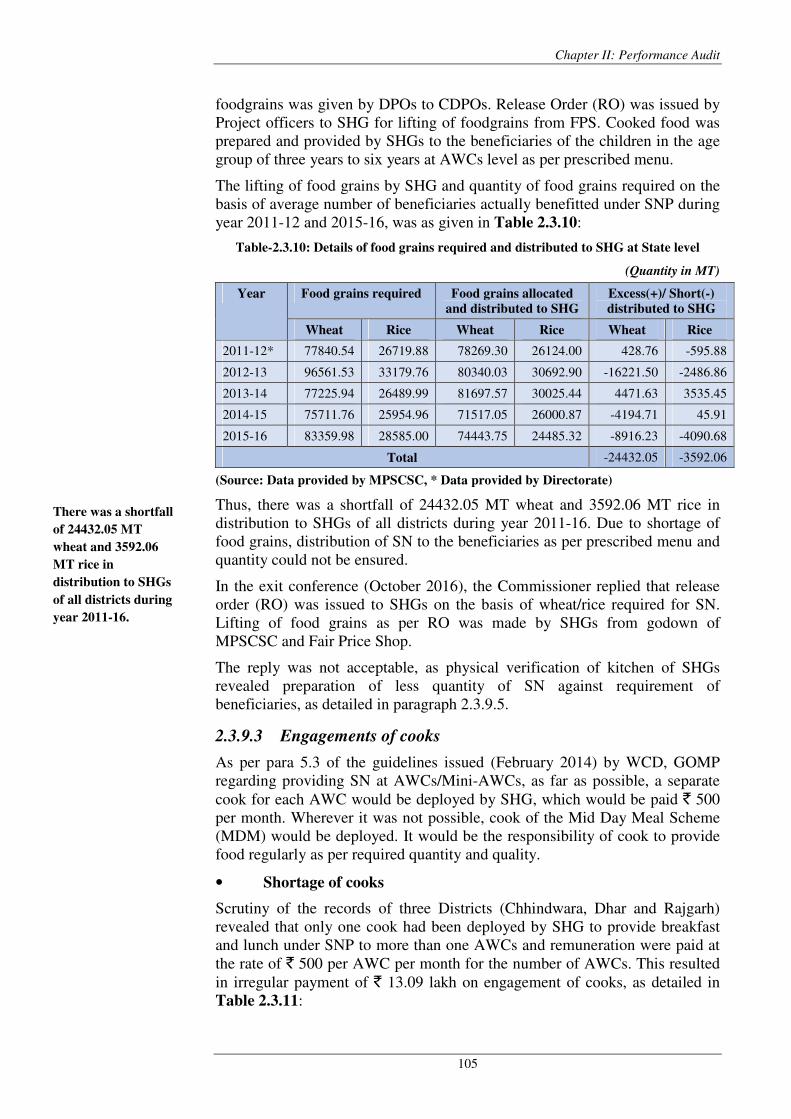
Chapter II: Performance Audit
105
foodgrains was given by DPOs to CDPOs. Release Order (RO) was issued by Project officers to SHG for lifting of foodgrains from FPS. Cooked food was prepared and provided by SHGs to the beneficiaries of the children in the age group of three years to six years at AWCs level as per prescribed menu.
The lifting of food grains by SHG and quantity of food grains required on the basis of average number of beneficiaries actually benefitted under SNP during year 2011-12 and 2015-16, was as given in Table 2.3.10:
Table-2.3.10: Details of food grains required and distributed to SHG at State level
(Quantity in MT)
Year Food grains required Food grains allocated
and distributed to SHG
Excess(+)/ Short(-)
distributed to SHG
Wheat Rice Wheat Rice Wheat Rice
2011-12* 77840.54 26719.88 78269.30 26124.00 428.76 -595.88
2012-13 96561.53 33179.76 80340.03 30692.90 -16221.50 -2486.86
2013-14 77225.94 26489.99 81697.57 30025.44 4471.63 3535.45
2014-15 75711.76 25954.96 71517.05 26000.87 -4194.71 45.91
2015-16 83359.98 28585.00 74443.75 24485.32 -8916.23 -4090.68
Total -24432.05 -3592.06
(Source: Data provided by MPSCSC, * Data provided by Directorate)
Thus, there was a shortfall of 24432.05 MT wheat and 3592.06 MT rice in distribution to SHGs of all districts during year 2011-16. Due to shortage of food grains, distribution of SN to the beneficiaries as per prescribed menu and quantity could not be ensured.
In the exit conference (October 2016), the Commissioner replied that release order (RO) was issued to SHGs on the basis of wheat/rice required for SN. Lifting of food grains as per RO was made by SHGs from godown of MPSCSC and Fair Price Shop.
The reply was not acceptable, as physical verification of kitchen of SHGs revealed preparation of less quantity of SN against requirement of beneficiaries, as detailed in paragraph 2.3.9.5.
2.3.9.3 Engagements of cooks
As per para 5.3 of the guidelines issued (February 2014) by WCD, GOMP regarding providing SN at AWCs/Mini-AWCs, as far as possible, a separate cook for each AWC would be deployed by SHG, which would be paid ` 500 per month. Wherever it was not possible, cook of the Mid Day Meal Scheme (MDM) would be deployed. It would be the responsibility of cook to provide food regularly as per required quantity and quality.
• Shortage of cooks
Scrutiny of the records of three Districts (Chhindwara, Dhar and Rajgarh) revealed that only one cook had been deployed by SHG to provide breakfast and lunch under SNP to more than one AWCs and remuneration were paid at the rate of ` 500 per AWC per month for the number of AWCs. This resulted in irregular payment of ` 13.09 lakh on engagement of cooks, as detailed in Table 2.3.11:
There was a shortfall
of 24432.05 MT
wheat and 3592.06
MT rice in
distribution to SHGs
of all districts during
year 2011-16.
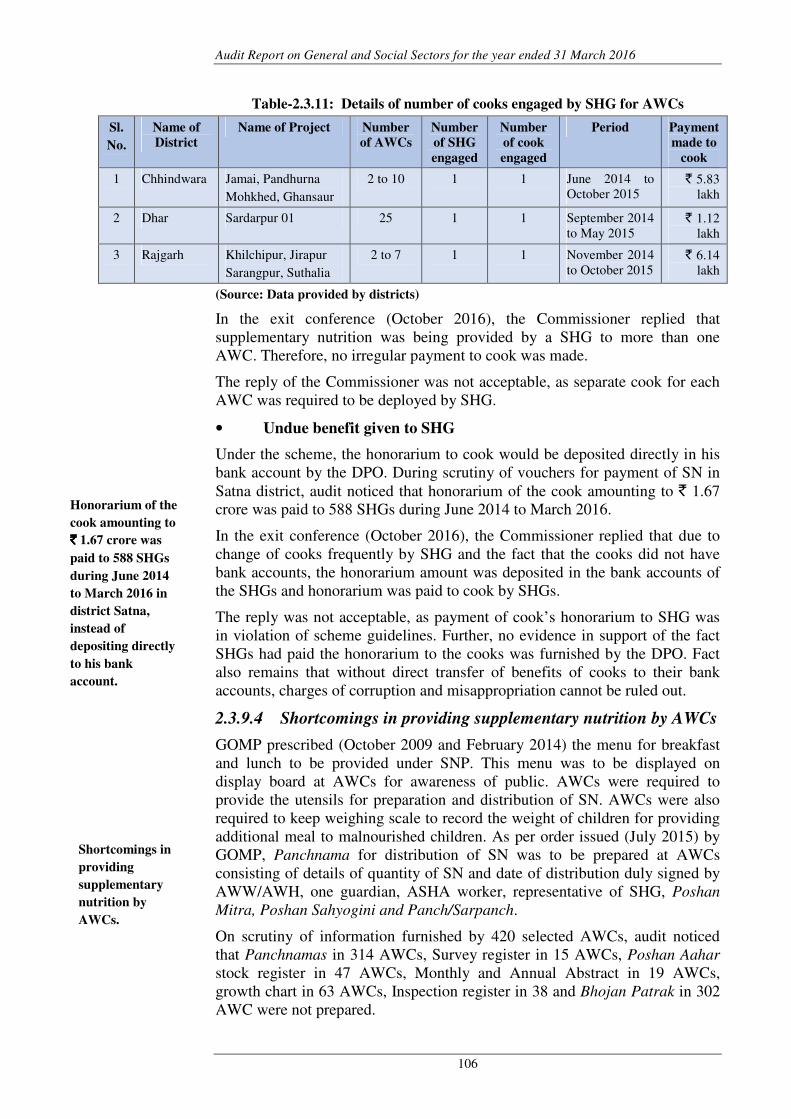
Audit Report on General and Social Sectors for the year ended 31 March 2016
106
Table-2.3.11: Details of number of cooks engaged by SHG for AWCs
Sl.
No.
Name of
District
Name of Project Number
of AWCs
Number
of SHG
engaged
Number
of cook
engaged
Period Payment
made to
cook
1 Chhindwara Jamai, Pandhurna
Mohkhed, Ghansaur
2 to 10 1 1 June 2014 to October 2015
` 5.83 lakh
2 Dhar Sardarpur 01 25 1 1 September 2014 to May 2015
` 1.12 lakh
3 Rajgarh Khilchipur, Jirapur
Sarangpur, Suthalia
2 to 7 1 1 November 2014 to October 2015
` 6.14 lakh
(Source: Data provided by districts)
In the exit conference (October 2016), the Commissioner replied that supplementary nutrition was being provided by a SHG to more than one AWC. Therefore, no irregular payment to cook was made.
The reply of the Commissioner was not acceptable, as separate cook for each AWC was required to be deployed by SHG.
• Undue benefit given to SHG
Under the scheme, the honorarium to cook would be deposited directly in his bank account by the DPO. During scrutiny of vouchers for payment of SN in Satna district, audit noticed that honorarium of the cook amounting to ` 1.67 crore was paid to 588 SHGs during June 2014 to March 2016.
In the exit conference (October 2016), the Commissioner replied that due to change of cooks frequently by SHG and the fact that the cooks did not have bank accounts, the honorarium amount was deposited in the bank accounts of the SHGs and honorarium was paid to cook by SHGs.
The reply was not acceptable, as payment of cook’s honorarium to SHG was in violation of scheme guidelines. Further, no evidence in support of the fact SHGs had paid the honorarium to the cooks was furnished by the DPO. Fact also remains that without direct transfer of benefits of cooks to their bank accounts, charges of corruption and misappropriation cannot be ruled out.
2.3.9.4 Shortcomings in providing supplementary nutrition by AWCs
GOMP prescribed (October 2009 and February 2014) the menu for breakfast and lunch to be provided under SNP. This menu was to be displayed on display board at AWCs for awareness of public. AWCs were required to provide the utensils for preparation and distribution of SN. AWCs were also required to keep weighing scale to record the weight of children for providing additional meal to malnourished children. As per order issued (July 2015) by GOMP, Panchnama for distribution of SN was to be prepared at AWCs consisting of details of quantity of SN and date of distribution duly signed by AWW/AWH, one guardian, ASHA worker, representative of SHG, Poshan
Mitra, Poshan Sahyogini and Panch/Sarpanch.
On scrutiny of information furnished by 420 selected AWCs, audit noticed that Panchnamas in 314 AWCs, Survey register in 15 AWCs, Poshan Aahar stock register in 47 AWCs, Monthly and Annual Abstract in 19 AWCs, growth chart in 63 AWCs, Inspection register in 38 and Bhojan Patrak in 302 AWC were not prepared.
Shortcomings in
providing
supplementary
nutrition by
AWCs.
Honorarium of the
cook amounting to
`̀̀̀ 1.67 crore was
paid to 588 SHGs
during June 2014
to March 2016 in
district Satna,
instead of
depositing directly
to his bank
account.
Chapter II: Performance Audit
107
During inspection of 210 AWCs out of 420 sampled AWCs, audit noticed the following deficiencies:
• On the inspection day, attendance register was not filled in 85 AWCs. Therefore, the number of beneficiaries which attended the AWC on the inspection day vis-à-vis total enrollments could not be ascertained in audit.
• SN was not distributed as per menu in 155 AWCs on the date of inspection. SN was not provided at 11 AWCs on the date of inspection.
• Utensils for distribution of cooked food were not found at 41 AWCs.
• Weighing scale was not found in 10 AWCs. Thus, physical growth/malnutrition of infant/ children could not be measured and recorded.
• Display board for menu in 95 AWCs was not available.
• Two AWCs (Miyapura, Nalchha project, District Dhar and Unida, Berasiya 01 project, District Bhopal) were found closed during the inspection.
In the exit conference (October 2016), the Commissioner replied that instructions had been given to concerned officials from time to time to ensure maintenance of services in prescribed register.
The reply was not acceptable, as the aforementioned shortcomings were noticed despite departmental instructions to Project Officers. Thus, the State Government failed to ensure compliance of its own instruction for providing SN to beneficiaries.
Case Study 3: Acute shortfall in actual beneficiaries on the day of
inspection of AWCs
Attendance of children was found less than registered number at all inspected AWCs. During joint inspection of 210 AWCs, audit noticed that 3536 beneficiaries (40 per cent) were found present on the day of inspection against 8940 registered children in the age group of three years to six years. As informed by AWCs, the main reasons for lesser attendance were migration of parents, admission of children in schools, poor and less quality of SN, inadequate sitting space at AWC, AWC running at long distance and hot weather.
The shortfall of beneficiaries at inspected AWCs was quite large as compared to figures of shortfall provided by Department, District Programme Offices and Project Offices, which were 27.35 per cent of beneficiaries in the age group of three to six years at State level, 26.46 per
cent at District level and 24.16 per cent at Project level during 2011-16.
In the exit conference (October 2016), the Commissioner replied that deficiencies were negligible on the basis of population of State. However, efforts would be made to get rid of shortfall.
The reply was not acceptable, as the data compiled for the number of actual beneficiaries of SNP was higher in test checked cases, which renders the possibility of misreporting and even absent children were being shown as receiving SN.
During joint
inspection of
210 AWCs
attendance of
shortage of 60
per cent
beneficiaries
were found.

Audit Report on General and Social Sectors for the year ended 31 March 2016
108
2.3.9.5 Joint Inspection of SHGs
As per guidelines (February 2014) of GOMP, Bhojan Patrak would be given to each SHG monthly, in which AWW would mention quantity and quality of meal at the time of receiving each meal and put her signature with date. As per para 8 of guidelines (October 2009) of GOMP, stock register of BPL wheat/rice/raw materials, cash book/bill vouchers was to be maintained by SHG. SN was to be prepared in kitchen shed.
During joint inspection of 57 SHGs, following shortcomings were noticed:
• Food was prepared in open space by eight SHGs because separate kitchen was not available at AWCs.
• Firewood was used by 50 SHGs for preparation of food instead of LPG stove on the ground of easy availability of firewood.
• SN food was not prepared as per menu by any of the SHGs.
• 54 SHG did not submit Bhojan Patrak to AWCs for entry of foods distributed by them. Further audit scrutiny revealed that bills of SHGs were accepted and paid without insisting on filled Bhojan Patrak.
• Stock register of food grains, cash book and bill voucher was not maintained by 52, 45 and 49 SHGs respectively.
The Project Officer stated that SHG was a small unit run by rural women, due to which these deficiencies were noticed.
The reply was not acceptable, the deficiencies noticed during the joint inspection were in violation of scheme guidelines and therefore, required to be addressed.
Food preparing by Saraswati SHG,
Nunagar at unhygienic space infront of
toilet room, Sector Shahnagar 1, District
Panna.
SN prepared in temporary open shed by
Ganesh SHG, Badnavar 1 project in
District Dhar
Short preparation of SN against about 300
beneficiaries by Ganesh SHG, Badnavar 1
project in Dhar District
Temporary open Kitchen shed of Jai
MaaVaisnav Devi SHG, Jaswadi, Project
Khandava Rural in Khandawa District
Chapter II: Performance Audit
109
In the exit conference (October 2016), the Commissioner replied that instructions had been issued to district officers and SHGs to address these deficiencies. However, efforts would be made to get rid of shortfall.
2.3.9.6 Registration of SHG under Food Safety and Standards Act
As envisaged under section 31(2) of Food Safety and Standards Act 2006 and as per circular (January 2014) of Food and Drug Administration, Madhya Pradesh, food providing institution was required to obtain registration from Food Department. In this regard, Commissioner, ICDS has also issued (July 2015) instructions to all Collectors of Madhya Pradesh to follow the guidelines.
Scrutiny of information received from 39 sampled projects revealed that 2319 (51 per cent) SHGs out of 4633 SHGs were not registered from the Department of Food and Drug Administration. Thus, Project Offices failed to ensure that SHGs engaged in providing supplementary nutrition at AWCs had mandatory registration under Food Safety and Standards Act 2006.
In the exit conference (October 2016), the Commissioner replied that action for registration of SHGs was completed by all districts.
The reply was not acceptable, as the verification of the reply of Department in DPO, Rewa (November 2016) revealed that only 10 SHGs out of 3343 SHGs was registered under Food Safety and Standards Act 2006.
2.3.9.7 Quality Assurance
As per para 11 of Chapter 2 of the Operational Guidelines for Food Safety and Hygiene regarding food handling and safety measures for hot cooked meals under ICDS issued by GOI (December 2013), sample of food should be sent for laboratory testing at regular intervals. Water used for cooking/drinking should be regularly tested for conforming to drinking water quality standards as prescribed by the Ministry of Drinking Water and Sanitation.
Scrutiny of records in 42 test checked projects and 210 AWCs physically verified revealed that water used for cooking/drinking was not tested regularly for conforming to drinking water quality standards. Regular testing of food was not found at the 201 AWCs and sample of breakfast and lunch were not maintained at 140 AWCs out of 210 tests checked AWCs.
In the exit conference (October 2016), the Commissioner replied that as per norms of WCD, GOI, testing for quality of cooked food from laboratory was not necessary. There was a provision under Sanjha Chulha for testing of quantity and quality of cooked food by members of Gram Sabha Tadartha
Samiti constituted at local level.
The reply was not acceptable, as the guidelines of ICDS specifically provided for testing of sample of cooked food from laboratory at regular intervals. Further, the provision under Sanjha Chulha for testing of quantity and quality of cooked food by members of Gram Sabha Tadartha Samiti constituted at local level was also not adhered to.
Water used for
cooking/drinking
was not tested
regularly for
conforming to
quality standards
and regular testing
of food was not
done.
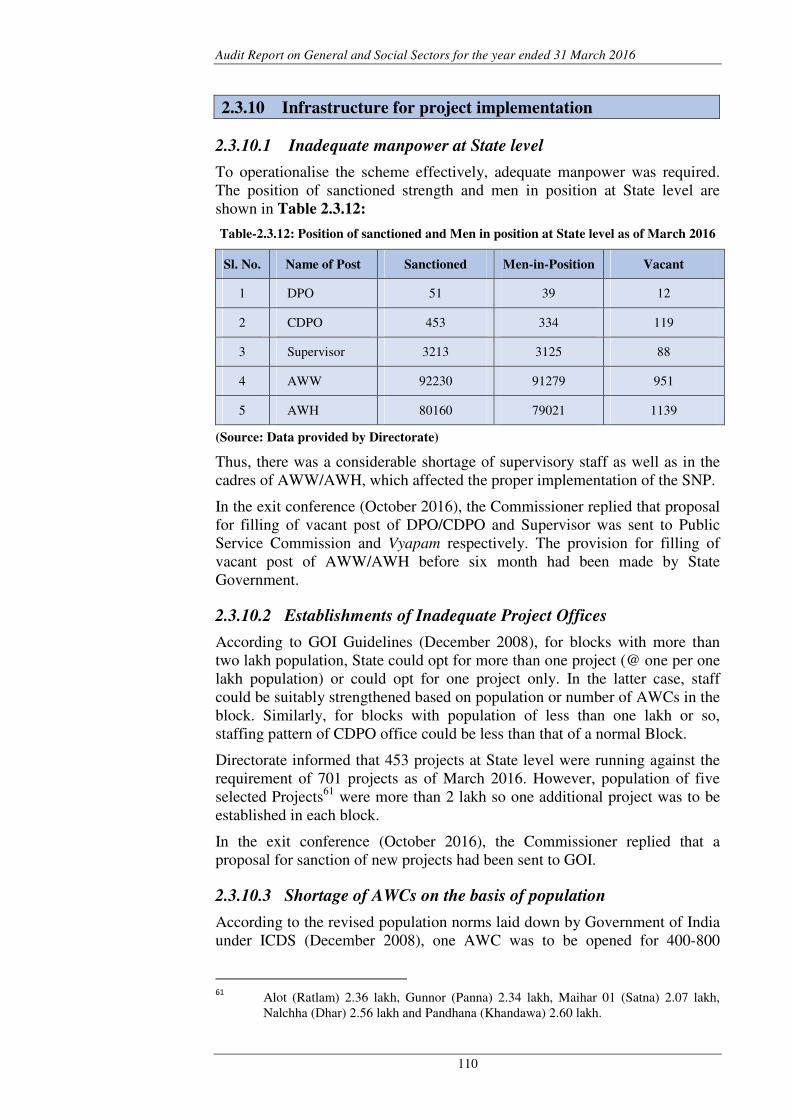
Audit Report on General and Social Sectors for the year ended 31 March 2016
110
2.3.10 Infrastructure for project implementation
2.3.10.1 Inadequate manpower at State level
To operationalise the scheme effectively, adequate manpower was required. The position of sanctioned strength and men in position at State level are shown in Table 2.3.12:
Table-2.3.12: Position of sanctioned and Men in position at State level as of March 2016
Sl. No. Name of Post Sanctioned Men-in-Position Vacant
1 DPO 51 39 12
2 CDPO 453 334 119
3 Supervisor 3213 3125 88
4 AWW 92230 91279 951
5 AWH 80160 79021 1139
(Source: Data provided by Directorate)
Thus, there was a considerable shortage of supervisory staff as well as in the cadres of AWW/AWH, which affected the proper implementation of the SNP.
In the exit conference (October 2016), the Commissioner replied that proposal for filling of vacant post of DPO/CDPO and Supervisor was sent to Public Service Commission and Vyapam respectively. The provision for filling of vacant post of AWW/AWH before six month had been made by State Government.
2.3.10.2 Establishments of Inadequate Project Offices
According to GOI Guidelines (December 2008), for blocks with more than two lakh population, State could opt for more than one project (@ one per one lakh population) or could opt for one project only. In the latter case, staff could be suitably strengthened based on population or number of AWCs in the block. Similarly, for blocks with population of less than one lakh or so, staffing pattern of CDPO office could be less than that of a normal Block.
Directorate informed that 453 projects at State level were running against the requirement of 701 projects as of March 2016. However, population of five selected Projects61 were more than 2 lakh so one additional project was to be established in each block.
In the exit conference (October 2016), the Commissioner replied that a proposal for sanction of new projects had been sent to GOI.
2.3.10.3 Shortage of AWCs on the basis of population
According to the revised population norms laid down by Government of India under ICDS (December 2008), one AWC was to be opened for 400-800
61
Alot (Ratlam) 2.36 lakh, Gunnor (Panna) 2.34 lakh, Maihar 01 (Satna) 2.07 lakh, Nalchha (Dhar) 2.56 lakh and Pandhana (Khandawa) 2.60 lakh.
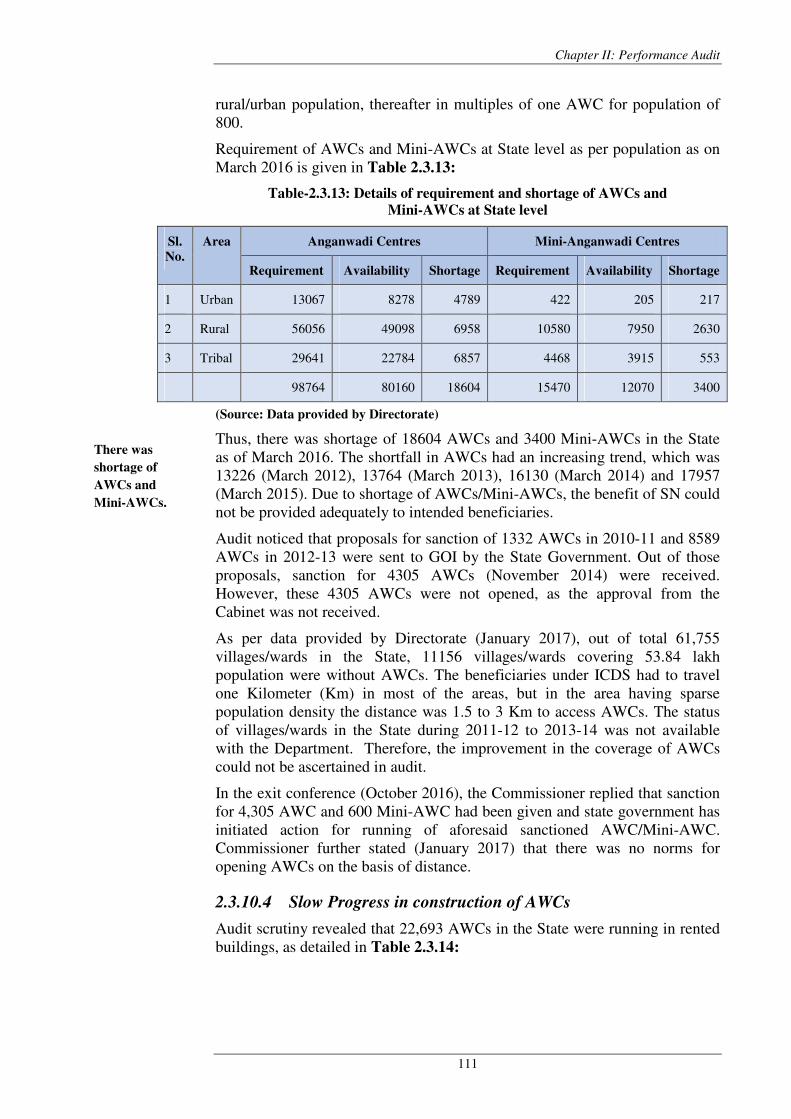
Chapter II: Performance Audit
111
rural/urban population, thereafter in multiples of one AWC for population of 800.
Requirement of AWCs and Mini-AWCs at State level as per population as on March 2016 is given in Table 2.3.13:
Table-2.3.13: Details of requirement and shortage of AWCs and
Mini-AWCs at State level
Sl.
No.
Area Anganwadi Centres Mini-Anganwadi Centres
Requirement Availability Shortage Requirement Availability Shortage
1 Urban 13067 8278 4789 422 205 217
2 Rural 56056 49098 6958 10580 7950 2630
3 Tribal 29641 22784 6857 4468 3915 553
98764 80160 18604 15470 12070 3400
(Source: Data provided by Directorate)
Thus, there was shortage of 18604 AWCs and 3400 Mini-AWCs in the State as of March 2016. The shortfall in AWCs had an increasing trend, which was 13226 (March 2012), 13764 (March 2013), 16130 (March 2014) and 17957 (March 2015). Due to shortage of AWCs/Mini-AWCs, the benefit of SN could not be provided adequately to intended beneficiaries.
Audit noticed that proposals for sanction of 1332 AWCs in 2010-11 and 8589 AWCs in 2012-13 were sent to GOI by the State Government. Out of those proposals, sanction for 4305 AWCs (November 2014) were received. However, these 4305 AWCs were not opened, as the approval from the Cabinet was not received.
As per data provided by Directorate (January 2017), out of total 61,755 villages/wards in the State, 11156 villages/wards covering 53.84 lakh population were without AWCs. The beneficiaries under ICDS had to travel one Kilometer (Km) in most of the areas, but in the area having sparse population density the distance was 1.5 to 3 Km to access AWCs. The status of villages/wards in the State during 2011-12 to 2013-14 was not available with the Department. Therefore, the improvement in the coverage of AWCs could not be ascertained in audit.
In the exit conference (October 2016), the Commissioner replied that sanction for 4,305 AWC and 600 Mini-AWC had been given and state government has initiated action for running of aforesaid sanctioned AWC/Mini-AWC. Commissioner further stated (January 2017) that there was no norms for opening AWCs on the basis of distance.
2.3.10.4 Slow Progress in construction of AWCs
Audit scrutiny revealed that 22,693 AWCs in the State were running in rented buildings, as detailed in Table 2.3.14:
There was
shortage of
AWCs and
Mini-AWCs.
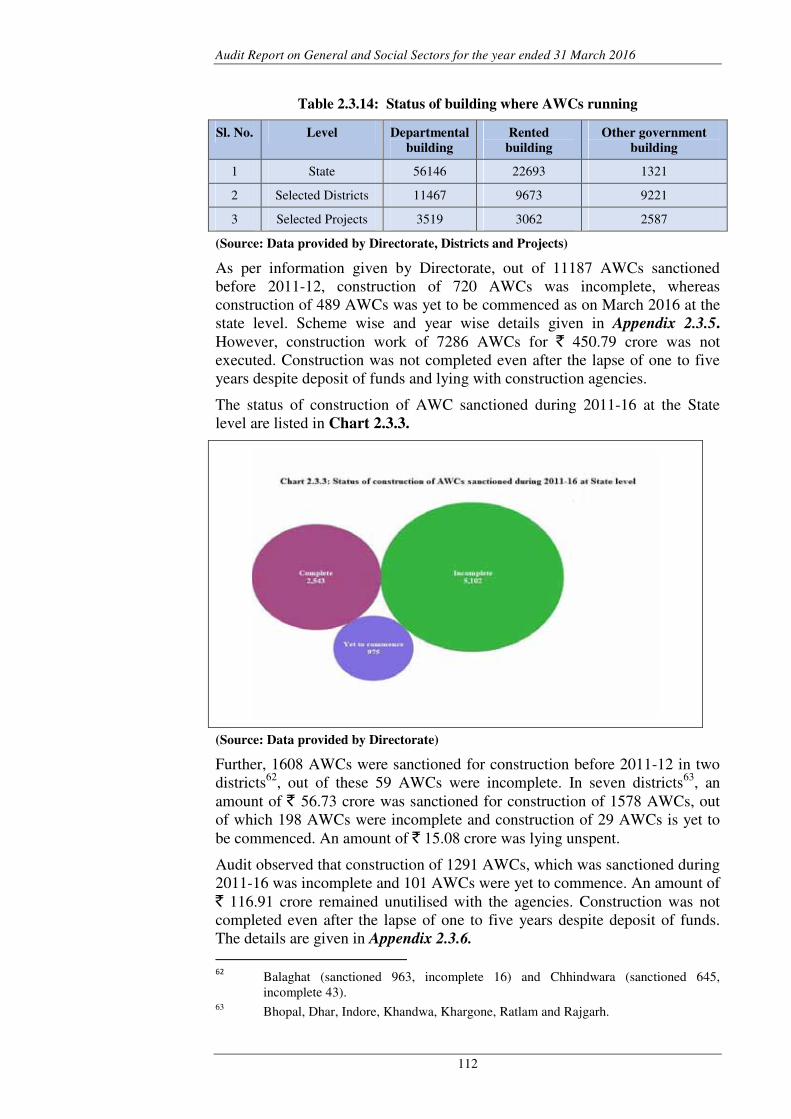
Audit Report on General and Social Sectors for the year ended 31 March 2016
112
Table 2.3.14: Status of building where AWCs running
Sl. No. Level Departmental
building
Rented
building
Other government
building
1 State 56146 22693 1321
2 Selected Districts 11467 9673 9221
3 Selected Projects 3519 3062 2587
(Source: Data provided by Directorate, Districts and Projects)
As per information given by Directorate, out of 11187 AWCs sanctioned before 2011-12, construction of 720 AWCs was incomplete, whereas construction of 489 AWCs was yet to be commenced as on March 2016 at the state level. Scheme wise and year wise details given in Appendix 2.3.5. However, construction work of 7286 AWCs for ` 450.79 crore was not executed. Construction was not completed even after the lapse of one to five years despite deposit of funds and lying with construction agencies.
The status of construction of AWC sanctioned during 2011-16 at the State level are listed in Chart 2.3.3.
(Source: Data provided by Directorate)
Further, 1608 AWCs were sanctioned for construction before 2011-12 in two districts62, out of these 59 AWCs were incomplete. In seven districts63, an amount of ` 56.73 crore was sanctioned for construction of 1578 AWCs, out of which 198 AWCs were incomplete and construction of 29 AWCs is yet to be commenced. An amount of ` 15.08 crore was lying unspent.
Audit observed that construction of 1291 AWCs, which was sanctioned during 2011-16 was incomplete and 101 AWCs were yet to commence. An amount of ` 116.91 crore remained unutilised with the agencies. Construction was not completed even after the lapse of one to five years despite deposit of funds. The details are given in Appendix 2.3.6.
62
Balaghat (sanctioned 963, incomplete 16) and Chhindwara (sanctioned 645, incomplete 43).
63 Bhopal, Dhar, Indore, Khandwa, Khargone, Ratlam and Rajgarh.
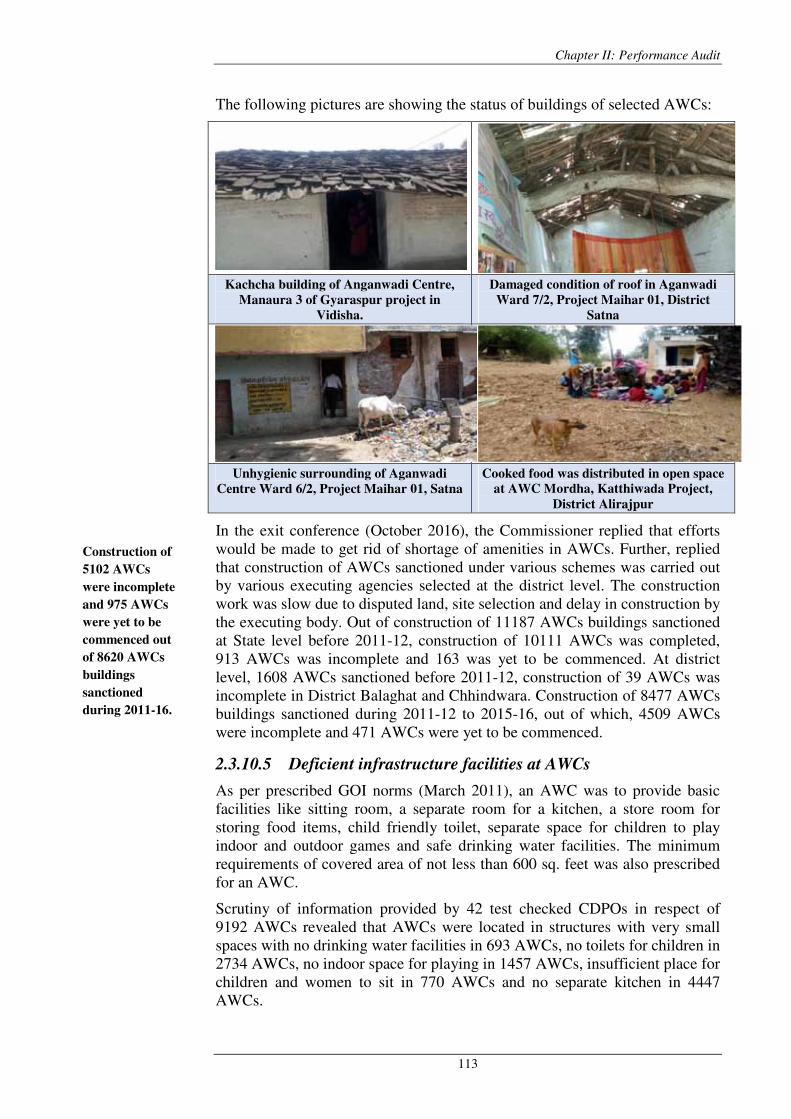
Chapter II: Performance Audit
113
The following pictures are showing the status of buildings of selected AWCs:
Kachcha building of Anganwadi Centre,
Manaura 3 of Gyaraspur project in
Vidisha.
Damaged condition of roof in Aganwadi
Ward 7/2, Project Maihar 01, District
Satna
Unhygienic surrounding of Aganwadi
Centre Ward 6/2, Project Maihar 01, Satna
Cooked food was distributed in open space
at AWC Mordha, Katthiwada Project,
District Alirajpur
In the exit conference (October 2016), the Commissioner replied that efforts would be made to get rid of shortage of amenities in AWCs. Further, replied that construction of AWCs sanctioned under various schemes was carried out by various executing agencies selected at the district level. The construction work was slow due to disputed land, site selection and delay in construction by the executing body. Out of construction of 11187 AWCs buildings sanctioned at State level before 2011-12, construction of 10111 AWCs was completed, 913 AWCs was incomplete and 163 was yet to be commenced. At district level, 1608 AWCs sanctioned before 2011-12, construction of 39 AWCs was incomplete in District Balaghat and Chhindwara. Construction of 8477 AWCs buildings sanctioned during 2011-12 to 2015-16, out of which, 4509 AWCs were incomplete and 471 AWCs were yet to be commenced.
2.3.10.5 Deficient infrastructure facilities at AWCs
As per prescribed GOI norms (March 2011), an AWC was to provide basic facilities like sitting room, a separate room for a kitchen, a store room for storing food items, child friendly toilet, separate space for children to play indoor and outdoor games and safe drinking water facilities. The minimum requirements of covered area of not less than 600 sq. feet was also prescribed for an AWC.
Scrutiny of information provided by 42 test checked CDPOs in respect of 9192 AWCs revealed that AWCs were located in structures with very small spaces with no drinking water facilities in 693 AWCs, no toilets for children in 2734 AWCs, no indoor space for playing in 1457 AWCs, insufficient place for children and women to sit in 770 AWCs and no separate kitchen in 4447 AWCs.
Construction of
5102 AWCs
were incomplete
and 975 AWCs
were yet to be
commenced out
of 8620 AWCs
buildings
sanctioned
during 2011-16.
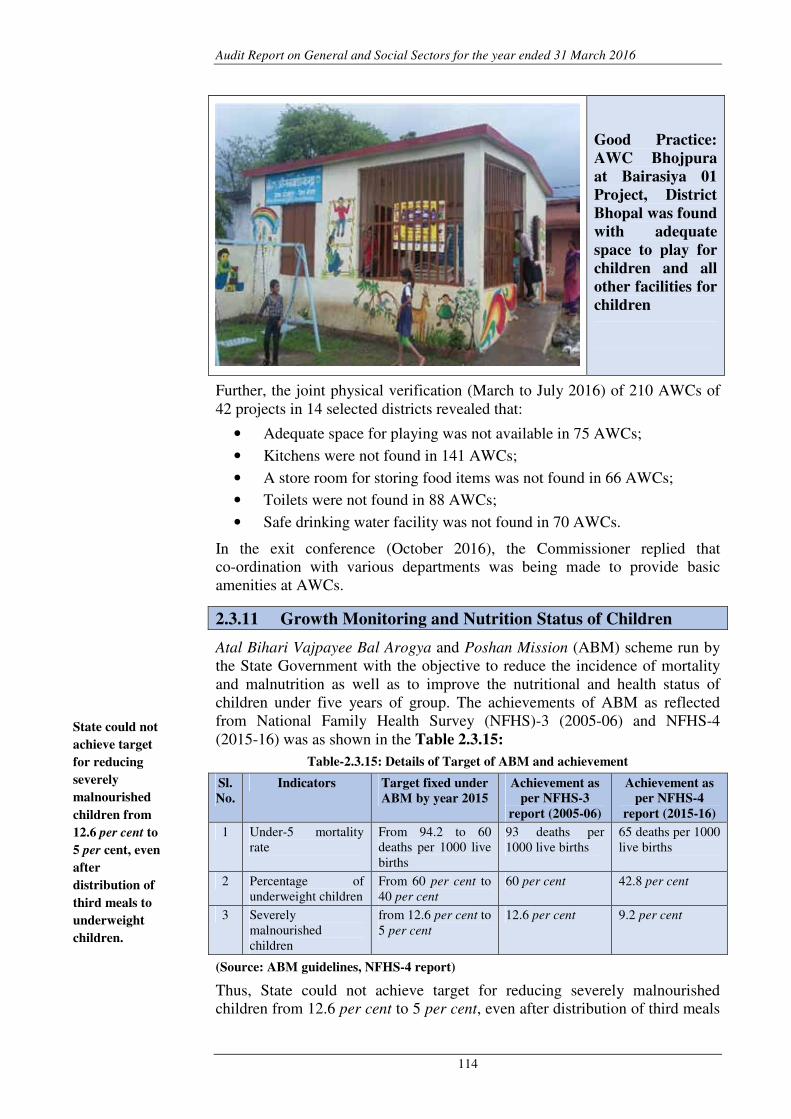
Audit Report on General and Social Sectors for the year ended 31 March 2016
114
Good Practice:
AWC Bhojpura
at Bairasiya 01
Project, District
Bhopal was found
with adequate
space to play for
children and all
other facilities for
children
Further, the joint physical verification (March to July 2016) of 210 AWCs of 42 projects in 14 selected districts revealed that:
• Adequate space for playing was not available in 75 AWCs;
• Kitchens were not found in 141 AWCs;
• A store room for storing food items was not found in 66 AWCs;
• Toilets were not found in 88 AWCs;
• Safe drinking water facility was not found in 70 AWCs.
In the exit conference (October 2016), the Commissioner replied that co-ordination with various departments was being made to provide basic amenities at AWCs.
2.3.11 Growth Monitoring and Nutrition Status of Children
Atal Bihari Vajpayee Bal Arogya and Poshan Mission (ABM) scheme run by the State Government with the objective to reduce the incidence of mortality and malnutrition as well as to improve the nutritional and health status of children under five years of group. The achievements of ABM as reflected from National Family Health Survey (NFHS)-3 (2005-06) and NFHS-4 (2015-16) was as shown in the Table 2.3.15:
Table-2.3.15: Details of Target of ABM and achievement
Sl.
No.
Indicators Target fixed under
ABM by year 2015
Achievement as
per NFHS-3
report (2005-06)
Achievement as
per NFHS-4
report (2015-16)
1 Under-5 mortality rate
From 94.2 to 60 deaths per 1000 live births
93 deaths per 1000 live births
65 deaths per 1000 live births
2 Percentage of underweight children
From 60 per cent to 40 per cent
60 per cent 42.8 per cent
3 Severely malnourished children
from 12.6 per cent to 5 per cent
12.6 per cent 9.2 per cent
(Source: ABM guidelines, NFHS-4 report)
Thus, State could not achieve target for reducing severely malnourished children from 12.6 per cent to 5 per cent, even after distribution of third meals
State could not
achieve target
for reducing
severely
malnourished
children from
12.6 per cent to
5 per cent, even
after
distribution of
third meals to
underweight
children.
Chapter II: Performance Audit
115
to underweight children. Similarly, State was lagging behind the targets set for reducing percentage of underweight children and under-5 mortality rate. The shortfall in achievement may be attributed to shortfall in providing SN and lackadaisical approach of AWCs as they were not monitoring growth of children, as detailed in paragraph 2.3.9.4.
In the exit conference (October 2016), the Commissioner replied that status of malnutrition was improving through ABM and continuous efforts was also being made.
2.3.12 Internal Control Mechanism
2.3.12.1 Integrated Child Development Scheme Mission
As per GOI guidelines, State ICDS Mission headed by the Chief Minister of the concerned State would be responsible for overseeing child development and nutrition system, consideration of policy matters related to child development and nutrition. The State ICDS Mission would meet at least once in every six months. Every district would have a District ICDS Mission headed by the District Collector of the concerned district.
Audit scrutiny revealed that ICDS Mission was not constituted at State level as well as District level.
In the exit conference (October 2016), the Commissioner replied that as per decision taken by State Government, committee constituted previously under ABM was to be re-established in place of constitution of ICDS Mission. The further action was under process.
Reply was not acceptable, as ICDS Mission was yet to be constituted for implementation of ICDS Programme.
2.3.12.2 Social Audit
As per provision given in guidelines of WCD, GOMP (October 2009), Social Audit of the work of SHG for providing SN would be conducted according to the procedure prescribed for MDM by Panchayat and Rural Development Department.
Audit observed that no Social Audit of SHG for SNP was conducted during the period from 2011-12 to 2015-16 in 42 projects of 14 sampled districts.
In the exit conference (October 2016), the Commissioner replied that action for social audit was to be taken by Panchayat and Rural Development Department. A provision for preparation of Panchnama during distribution of supplementary nutrition by SHGs was made.
The reply of the Commissioner leads to the conclusion that in the absence of social audit, the participation of the community could not be ensured. Further, Panchnama was not prepared at 314 AWCs out of 420 test checked AWCs.
2.3.12.3 Monitoring and Supervision
As per GOI circular (October 2010), the monitoring and supervision schedule stipulated in Table 2.3.16 was to be ensured for effectiveness in the delivery of services in ICDS.
Social audit
was not
conducted
during 2011-
16.
ICDS Mission
was not
constituted.
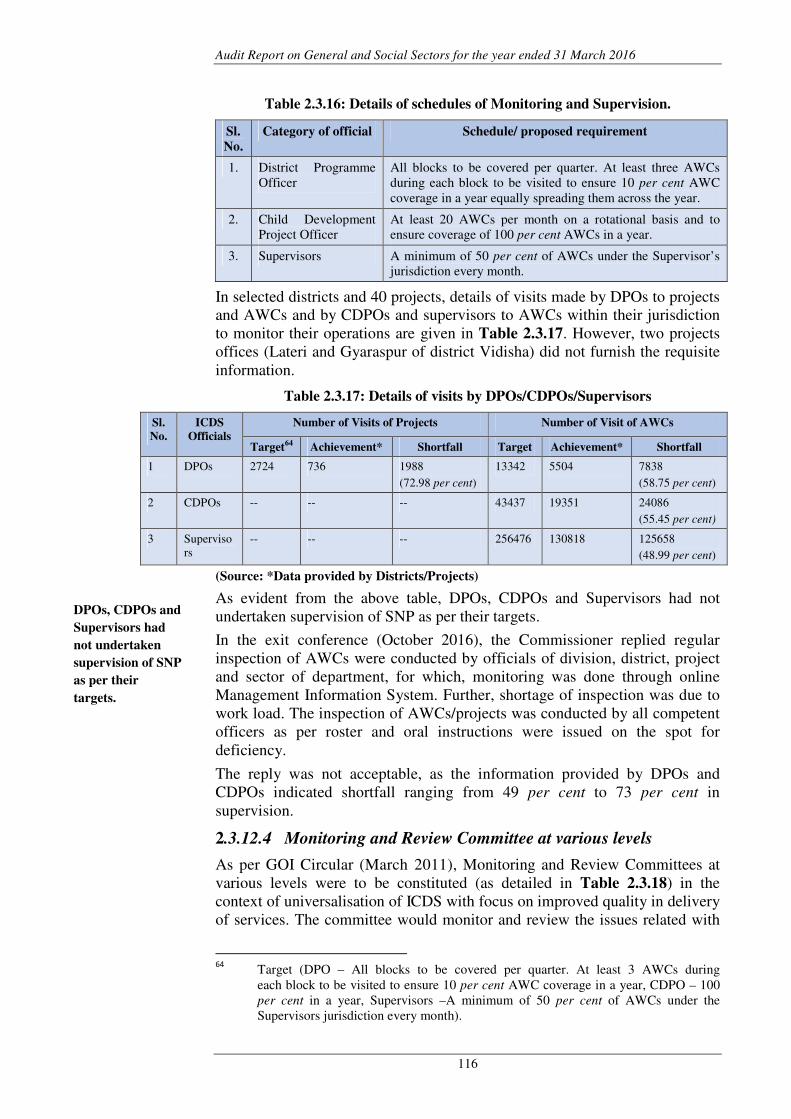
Audit Report on General and Social Sectors for the year ended 31 March 2016
116
Table 2.3.16: Details of schedules of Monitoring and Supervision.
Sl.
No.
Category of official Schedule/ proposed requirement
1. District Programme Officer
All blocks to be covered per quarter. At least three AWCs during each block to be visited to ensure 10 per cent AWC coverage in a year equally spreading them across the year.
2. Child Development Project Officer
At least 20 AWCs per month on a rotational basis and to ensure coverage of 100 per cent AWCs in a year.
3. Supervisors A minimum of 50 per cent of AWCs under the Supervisor’s jurisdiction every month.
In selected districts and 40 projects, details of visits made by DPOs to projects and AWCs and by CDPOs and supervisors to AWCs within their jurisdiction to monitor their operations are given in Table 2.3.17. However, two projects offices (Lateri and Gyaraspur of district Vidisha) did not furnish the requisite information.
Table 2.3.17: Details of visits by DPOs/CDPOs/Supervisors
Sl.
No.
ICDS
Officials
Number of Visits of Projects Number of Visit of AWCs
Target64 Achievement* Shortfall Target Achievement* Shortfall
1 DPOs 2724 736 1988
(72.98 per cent)
13342 5504 7838
(58.75 per cent)
2 CDPOs -- -- -- 43437 19351 24086
(55.45 per cent)
3 Supervisors
-- -- -- 256476 130818 125658
(48.99 per cent)
(Source: *Data provided by Districts/Projects)
As evident from the above table, DPOs, CDPOs and Supervisors had not undertaken supervision of SNP as per their targets.
In the exit conference (October 2016), the Commissioner replied regular inspection of AWCs were conducted by officials of division, district, project and sector of department, for which, monitoring was done through online Management Information System. Further, shortage of inspection was due to work load. The inspection of AWCs/projects was conducted by all competent officers as per roster and oral instructions were issued on the spot for deficiency.
The reply was not acceptable, as the information provided by DPOs and CDPOs indicated shortfall ranging from 49 per cent to 73 per cent in supervision.
2.3.12.4 Monitoring and Review Committee at various levels
As per GOI Circular (March 2011), Monitoring and Review Committees at various levels were to be constituted (as detailed in Table 2.3.18) in the context of universalisation of ICDS with focus on improved quality in delivery of services. The committee would monitor and review the issues related with
64
Target (DPO – All blocks to be covered per quarter. At least 3 AWCs during each block to be visited to ensure 10 per cent AWC coverage in a year, CDPO – 100 per cent in a year, Supervisors –A minimum of 50 per cent of AWCs under the Supervisors jurisdiction every month).
DPOs, CDPOs and
Supervisors had
not undertaken
supervision of SNP
as per their
targets.
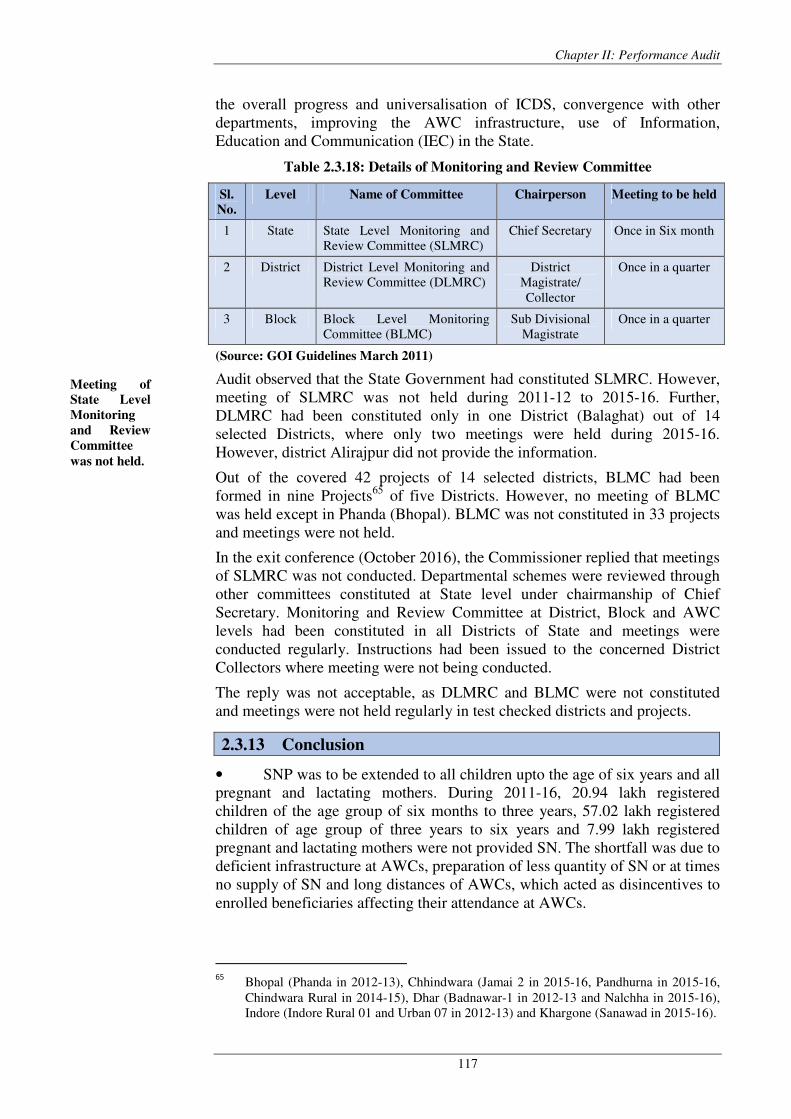
Chapter II: Performance Audit
117
the overall progress and universalisation of ICDS, convergence with other departments, improving the AWC infrastructure, use of Information, Education and Communication (IEC) in the State.
Table 2.3.18: Details of Monitoring and Review Committee
Sl.
No.
Level Name of Committee Chairperson Meeting to be held
1 State State Level Monitoring and Review Committee (SLMRC)
Chief Secretary Once in Six month
2 District District Level Monitoring and Review Committee (DLMRC)
District Magistrate/ Collector
Once in a quarter
3 Block Block Level Monitoring Committee (BLMC)
Sub Divisional Magistrate
Once in a quarter
(Source: GOI Guidelines March 2011)
Audit observed that the State Government had constituted SLMRC. However, meeting of SLMRC was not held during 2011-12 to 2015-16. Further, DLMRC had been constituted only in one District (Balaghat) out of 14 selected Districts, where only two meetings were held during 2015-16. However, district Alirajpur did not provide the information.
Out of the covered 42 projects of 14 selected districts, BLMC had been formed in nine Projects65 of five Districts. However, no meeting of BLMC was held except in Phanda (Bhopal). BLMC was not constituted in 33 projects and meetings were not held.
In the exit conference (October 2016), the Commissioner replied that meetings of SLMRC was not conducted. Departmental schemes were reviewed through other committees constituted at State level under chairmanship of Chief Secretary. Monitoring and Review Committee at District, Block and AWC levels had been constituted in all Districts of State and meetings were conducted regularly. Instructions had been issued to the concerned District Collectors where meeting were not being conducted.
The reply was not acceptable, as DLMRC and BLMC were not constituted and meetings were not held regularly in test checked districts and projects.
2.3.13 Conclusion
• SNP was to be extended to all children upto the age of six years and all pregnant and lactating mothers. During 2011-16, 20.94 lakh registered children of the age group of six months to three years, 57.02 lakh registered children of age group of three years to six years and 7.99 lakh registered pregnant and lactating mothers were not provided SN. The shortfall was due to deficient infrastructure at AWCs, preparation of less quantity of SN or at times no supply of SN and long distances of AWCs, which acted as disincentives to enrolled beneficiaries affecting their attendance at AWCs.
65
Bhopal (Phanda in 2012-13), Chhindwara (Jamai 2 in 2015-16, Pandhurna in 2015-16, Chindwara Rural in 2014-15), Dhar (Badnawar-1 in 2012-13 and Nalchha in 2015-16), Indore (Indore Rural 01 and Urban 07 in 2012-13) and Khargone (Sanawad in 2015-16).
Meeting of
State Level
Monitoring
and Review
Committee
was not held.
Audit Report on General and Social Sectors for the year ended 31 March 2016
118
• There was shortage of 18604 AWCs and 3400 Mini-AWCs in the State as of March 2016 as per population norms laid down by Government of India. Out of total 61755 villages/wards in the State, 11156 villages/wards covering 53.84 lakh population were without AWCs. State Government did not open 4305 AWCs, though these AWCs were sanctioned by GoI in November 2014.
• DPOs did not adhere to Central Issue Price (CIP) of wheat and rice and payments were made to MPSCSC at higher rates. This resulted in excess payment of ` 40.87 crore to MPSCSC during 2012-13 to 2014-15. Further, unreconciled advance of ` 13.81 crore was lying with MPSCSC on account of short lifted food grains by DPOs. Department did not reconcile the reasons for excess utilised food grains by MP Agro, which resulted in undue financial benefits of ` 15.57 crore to MP Agro. DPOs irregularly paid `1.67 crore to SHGs towards honorarium to cooks instead of paying it directly in the accounts of cooks. Without direct transfer of benefits of cooks to their bank accounts, charges of corruption could not be ruled out.
• In 14 test-checked Project Offices, SN was not supplied during various months (ranged from one day to 120 days) during 2011-12 to 2015-16 in 983 AWCs having 37079 registered beneficiaries. There was a shortfall of 24432.05 MT wheat and 3592.06 MT rice in distribution to SHGs engaged in preparation of cooked meal during year 2011-16, which affected the distribution of cooked meal to beneficiaries.
• As per National Family Health Survey (2015-16), there were 9.2 per
cent of severely malnourished children in the State. Thus, State could not achieve target for reducing severely malnourished children from 12.6 per cent
to 5 per cent. Similarly, State was lagging behind the targets set for reducing percentage of underweight children and under-5 mortality rate.
• Meeting of State Level Monitoring and Review Committee was not held. Monitoring and Review Committee was not constituted at District and Block level for proper monitoring and supervision.
2.3.14 Recommendations
• Reconciliation of allotment and lifting of food grains, and its payments
should be made periodically.
• Efforts should be made to cover all beneficiaries under SNP. Link the
beneficiaries with Aadhar Card etc. so that they can be tracked.
• The Government should closely monitor the progress of construction of
AWCs buildings so as to ensure availability of good quality buildings
for the AWCs, fulfilling the prescribed standards for infrastructure and
efforts should be made to provide basic amenities like safe drinking
water, toilets etc., in all AWCs to ensure healthy environment to the
beneficiaries.
• ICDS Mission should be constituted for proper and smooth running of
scheme.
• Inspection of AWCs by DPOs/CDPOs/ Supervisors as prescribed
should be ensured for effective implementation of the scheme.
Government stated that it would endeavor to implement these
recommendations.
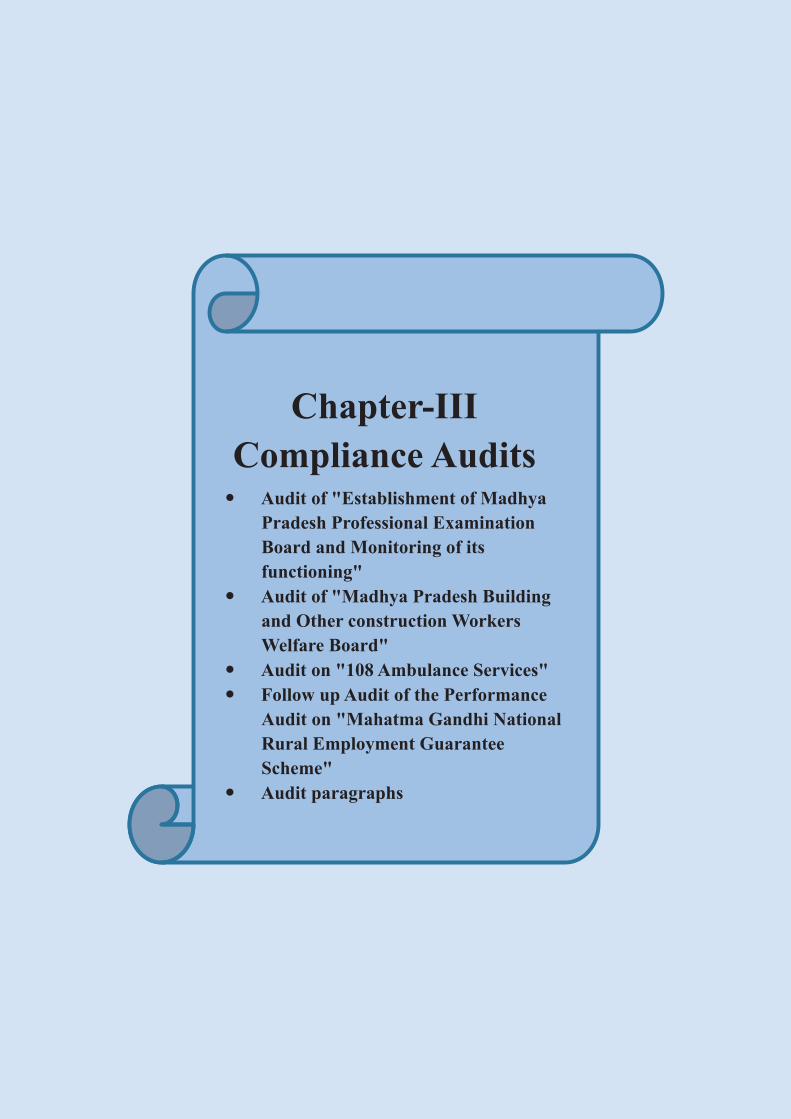

Chapter III: Compliance Audit
Compliance Audit of the Government departments, their field formations as well as that of the autonomous bodies brought out instances of lapses in management of resources and failures in the observance of the norms of regularity, propriety and economy. These have been presented in the succeeding paragraphs.
TECHNICAL EDUCATION AND SKILL DEVELOPMENT
DEPARTMENT
3.1 Audit of ‘Establishment of Madhya Pradesh Professional
Examination Board and Monitoring of its functioning’
3.1.1 Introduction
The Royal Commission on Superior Services in India, 1924 (Lee Commission), which established the Public Service Commission in India had noted that ‘wherever democratic institutions exist, experience has shown that to secure an efficient civil service, it is essential to protect it as far as possible from political or personal influences and give it that position of stability and security which is vital to its successful working as an impartial, efficient instrument to give effect to the policies of Government, whatever be its political complexion.’
The former Chief Justice of India, Justice P.N. Bhagwati in a judicial pronouncement observed ‘that the Public Service Commission occupies the pivotal place of importance in the State and the integrity and efficiency of its administrative apparatus depends considerably on the quality of the selection made by the Public Service Commission’ and went on to say that ‘this can be achieved only if the Chairman and Members of the Public Service Commission are eminent men possessing a high degree of calibre, competence and integrity, who would inspire confidence in the public mind about objectivity and impartiality of selections to be made by them. We would, therefore, like to strongly impress upon every State Government to take care to see that its Public Service Commission is manned by competent, honest and independent persons of outstanding ability and high reputation who command the confidence of people and who would not allow themselves to be deflected by any extraneous consideration from discharging their duty of making selection strictly on merit.’
The debate of the Constituent Assembly at the time of the framing of the Constitution of India reflected the following views of Shri Lakshminarayan Sahu, ‘….. Moreover, I would also like that the members of the subordinate services too should be selected by the Public Service Commission. If the members of the subordinate services are taken through the Public Service Commission, nobody can complain of nepotism. But if the appointments to subordinate services are kept out of the scope of the Public Service Commission, there would always be complaint against one minister or the other of being guilty of nepotism in the appointments made by them. With a view to avoid such criticisms, I want that the subordinate services may also be selected by the Public Service Commission.’
Audit Report on General and Social Sectors for the year ended 31 March 2016
120
Public Service Commissions have been set up under the Constitution and corresponding statutes to conduct examination and other assessment modes for recruitment of persons into Government services. Similarly, Technical Boards, such as Central Board of Secondary Education (CBSE) have been set up by various professional bodies to conduct examinations and recruit students into different professional streams. The purpose of creation of these commissions and Board or other bodies is to ensure transparency and accountability in recruitment to these important posts and disciplines to ensure that the principle of merit and social equity prevail. Against this background, we undertook the appraisal of the procedure in place to ensure the achievement of these lofty ideals, in the recruitment of subordinate staff of State of Madhya Pradesh and conduct of examination for entrance to professional courses, which was the domain of MPPEB otherwise known as VYAPAM.
Government of Madhya Pradesh established a Pre-Medical Test Board in the year 1970 for conducting entrance examination for admission into the Medical Colleges. Later, in the year 1981, a Pre-Engineering Board was set up for conducting entrance examination for admission into engineering colleges. These Boards were amalgamated in the year 1982 to set up Madhya Pradesh Professional Course Entrance Examination Board for conducting entrance tests for admissions in the Medical, Engineering, Agriculture and Polytechnic colleges of the State. The Board was reconstituted and named (July 1997) as ‘Professional Examination Board’ (Vyavsayik Pariksha Mandal), commonly known as VYAPAM. In April 2003, the Board was entrusted the responsibilities to conduct recruitment to those State level posts (except for posts of Police and Law Departments), which were not filled by the Madhya Pradesh Public Service Commission.
With a view to conduct examinations in professional courses and matters connected therewith or incidental thereto, the Madhya Pradesh Vyavsayik
Pariksha Mandal Adhiniyam, 2007 (MPPEB Act 2007) was enacted by the State Legislature. The Act provides for establishing a Board, which would be a body corporate by the name of the Madhya Pradesh Professional Examination Board (MPPEB/MP VYAPAM), having perpetual succession and a common seal with power to acquire and hold property. State Government notified the constitution of the Board under MPPEB Act in March 2016.
3.1.1.1 Audit Objectives
An audit was conducted to examine what were the objectives of Government of Madhya Pradesh (GoMP) in establishing the Board and Government’s relation with the Board including oversight of its activities particularly those related to conduct of various examinations. An entry conference was held with the Principal Secretary, Technical Education and Skill Development Department, GoMP in August 2015 to discuss the audit objectives, criteria and audit coverage. Government specifically wanted us to examine "the inherent weaknesses in the MPPEB Act 2007 and suggest measures for improvement". The draft report was issued to Government on 30 December 2016. The audit observations of the report were also discussed during exit conference held on 14 February 2017 with Principal Secretary, Technical Education and Skill Development Department.
Chapter III: Compliance Audit
121
3.1.1.2 Audit coverage
The audit of ‘Establishment of MPPEB and monitoring of its functioning’ was carried out (from April 2016 to August 2016) at Technical Education and Skill Development Department, Government of Madhya Pradesh. The audit findings are based on scrutiny of records relating to the Board and replies received from the Department in response to audit enquiries/observations.
3.1.1.3 Audit constraints
The report is based on the examination of records in the Technical Education and Skill Development Department, which provided seventeen files related to the Board for audit scrutiny. However, the records held by MPPEB could not be test checked in the audit and Department also did not provide the information related to the Board during audit scrutiny.
3.1.1.4 Acknowledgement
Audit acknowledges the co-operation extended by the Chief Secretary, Government of Madhya Pradesh, on whose initiative, the audit could start from 30 April 2016 (eight months after entry conference).
Audit findings
3.1.2 Duality in Government approach on the status of the Board
Government of Madhya Pradesh notified (April 1982) constitution of Vyavsayik Pathyakram Pravesh Pariksha Mandal (VYAPAM) for conducting entrance examinations for admission into medical, engineering, agriculture and polytechnic colleges. With this notification, erstwhile Pre-Medical Test Board and Pre-Engineering Board ceased to exist and their powers and duties were vested in the Board, which envisaged to be an independent entity with capacity of suing and being sued. The Board was endowed with the right to acquire and hold movable and immovable property.
3.1.2.1 Status of the Board
There was initial confusion over the status of VYAPAM, whether it was a Government Department or not. This was demonstrated by the notification of 1982 wherein the State Government declared that it would not be responsible for the acts of VYAPAM. However, the status of Board as a Government Department was accepted in various other subsequent inter-departmental deliberations of the Government, which was also upheld by judicial pronouncements, as discussed in succeeding paragraphs.
Under the notification of April 1982, the Board was envisaged to work under Manpower Planning Department (now, Technical Education and Skill Development Department). State Government had power to issue instructions from time to time to the Board for its functioning. However, under section 6 of the notification, State Government declared that it was not liable for any act of omission or commission by the Board. This act of abdication of responsibilities by the State Government despite having the powers to issue instructions regarding the Board led to confusion over its status as a Government Department.
Audit Report on General and Social Sectors for the year ended 31 March 2016
122
In a note submitted to Chief Minister (June 1983), Principal Secretary, GoMP, Manpower Planning Department noted that the Board was semi-autonomous body and proposed for its annual audit by the office of the Auditor of Local Funds. The proposal was approved by the Chief Minister.
The Chairman, VYAPAM intimated (August 1994) Principal Secretary, Manpower Planning Department, GoMP regarding continued confusion on the status of the Board. The Chairman requested the Government to take a decision in this matter, as it was neither a registered society nor considered as Department of Government. It was not established by any Act also.
On a reference from the Manpower Planning Department, Department of Law opined (October 1994) that the status of the Board was a part of GoMP and it was not an independent body. In a related meeting of the Committee of Senior Secretaries (February 1997), headed by the Chief Secretary, convened for granting independent status to Board, the Manpower Planning Department informed the Committee that the status of Board was that of a Government Department. The Committee, however, decided that there was no need to change the existing arrangement of Board.
3.1.2.2 Control of the State Government
State Government approved (September 2000) Vyavsayik Pariksha Mandal
Seva Bharti Niyam, 1999 for making appointments of officers/staff for VYAPAM. However, Rules to govern the service conditions of the officers/staff of VYAPAM were not framed by the Government so far. It provided for 126 posts of various cadres in the Board and classified them under Class I, Class II, Class III and Class IV post of the State Government (Appendix-3.1.1). Under this rule, Chairman, Director and Controller in the Board were to be appointed by transfer of State Government officers. However, it was never clarified as to whether this constituted a deputation or transfer to an ex-cadre post. The officers continued to be shown as borne on the regular cadre of the Government Department but were not paid from the Consolidated Fund of the State.
The procedure adopted for appointment of Chairman could not be ascertained from the records/information provided to Audit. On being enquired (May 2016) regarding rules, regulations, notifications and executive orders under which Chairman of the Board was appointed, the Department furnished (August 2016) only the list of Chairmen during September 2007 to March 2016 and no further details were provided. Further scrutiny revealed that officers were appointed to the posts of Director and Controller in the Board treating such posting at times as ex-cadre post as well as Foreign Service. Thus, the Board was manned by the officers of State Government and controlled by the State Government.
The status of the Board was finally settled as a Government Department by Hon’ble High Court in a civil petition1 filed by the Board to challenge imposition of property tax on it by Bhopal Municipal Corporation. The Hon’ble High Court, Jabalpur held (July 2003) that VYAPAM is a department of the Government.
1 No. 1232 of 2002.
Chapter III: Compliance Audit
123
From all the above arguments, it would emerge that evidently, the Board was a Government Department and its activities were to be subjected to the same oversight as applicable to a Government Department. However, State Government adopted a duality in its approach towards the status of Board since its inception and allowed it to function without adequate control, such as scrutiny of its functioning by the administrative department, scrutiny by vigilance authorities, scrutiny by internal audit and scrutiny by C&AG of India. Nor were any procedures identified for selection and appointment of the Chairman and other members of the Board, which would have ensured that qualified persons of eminence and who could function in an independent manner were selected for such posts such as the selection process for various Staff Selection Commissions etc. in the States.
On being enquired as to whether any rules were framed for the functioning of Board under section 4 of the Executive Order of 1982, Department replied (October 2016) that Vyavsayik Pariksha Mandal Seva Bharti Niyam, 1999 was implemented since September 2000 for recruitment to various posts of the Board, including its Chairman. However, Department did not frame any other rules/regulations regarding conduct of the business of Board, financial rules, rules regarding conduct of examination and collection of fees, etc. The examinations were conducted by Board even without finalisation of important regulations by Government, such as regulation for conduct of examination including ensuring safety and security of Question papers, Answer scripts, fair evaluation, confidentiality procedures and imposition of penalties on candidates using unfair means. Thus, State Government did not exercise the required oversight over the activities of the Board.
3.1.2.3 Dichotomy of approach
Despite it being a part of State Government as argued above, the receipts and expenditure of the Board were not included in the Government Accounts and the transactions were outside the Consolidated Fund of the State. Thus, unlike a Government Department, finances of the Board was not subjected to budgetary control of State Legislature. This, despite the fact that the Advocate General clarified (May 2006) on a reference from administrative department that the procedure for receipts of VYAPAM and its drawal and disbursal should be such as in case of Government Departments.
It is pertinent to mention that the expenses of the Union or a State Public Service Commission, including any salaries, allowances and pensions payable to or in respect of the members or staff of the Commission, are charged to the Consolidated Fund of India or, as the case may be, the Consolidated Fund of the State. Further, the receipts of these commissions are credited into the Consolidated Fund. Similarly, the receipts of Staff Selection Commission (SSC), which is an attached office of the Department of Personnel and Training, Government of India, are remitted into the Consolidated Fund of India and budgetary support for the functioning of SSC is given by Government of India.
Contrary to provisions applicable to similarly placed government organisations, the Board was allowed to keep its receipts and expenditure
Audit Report on General and Social Sectors for the year ended 31 March 2016
124
outside the State government accounts. This led to dilution in financial accountability of the Board, as discussed in paragraph 3.1.6.
Government Departments are subject to audit under section 13 of the C&AG’s (Duties, Powers and Conditions of Services) Act, 1971.
The provision for audit was also not reviewed even after judicial pronouncement of Hon’ble High Court in July 2003 that the Board was a Government Department. Thus, unlike any other Government Department, the activities of the Board was kept outside the purview of audit of C&AG.
We further noticed that State Government did not develop any mechanism to follow up the reports of Local Fund Audit on the Board and as informed by the Department, Board has not been providing information on the audited accounts, balance sheet and inspection report relating to Local Fund Audit to Government of Madhya Pradesh. Therefore, the quality of the Audit could not be verified by us.
Thus, State Government adopted duality in the approach on the status of the Board and allowed VYAPAM to function in a nebulous atmosphere, without regulatory controls, scrutiny or responsibility, which reflected poor governance. The fact that the posts of Chairman, Director and Controller were held by State Government officers confirmed that the Board was under the control of government. Further, various inter-department deliberations at Government level revealed that State Government was well aware of its status as a Government Department. Despite this, State Government did not exercise the requisite oversight on the functioning of the Board. The confusion over its status were allowed to continue and the arrangement between the Board and State Government remained flexible. Instead of directing the Board for its acts of omission or commission, State Government ostensibly distanced itself from the activities of the Board through notification of 1982 while still maintaining administrative control over the apex management. This shadowy control, without accompanying measures for verification and assessment of VYAPAM’s functions, was a case of exercise of power without assumption of responsibility. This eventually led to a situation where there was severe erosion in credibility of entrance examinations conducted by the Board.
3.1.3 Implementation of Madhya Pradesh Vyavsayik Pariksha
Mandal Adhiniyam, 2007
The primary objective of the Board was to hold examinations and tests for the purpose of admission to courses of higher professional studies or for public employment. In order to provide statutory recognition to the Board, a bill was drafted by the Law Department in 1983. However, State Government did not introduce the bill in the State Legislature.
On a reference of Manpower Planning Department regarding registration of the Board under Society Registration Act, the Department of Law opined (March 1996) that the authority to be vested with such important functions would be required to function in just, fair and reasonable manner and therefore, it should be created by an Act to enjoy better status than a registered society. It further stated that the bill drafted in 1983 could be suitably amended
Chapter III: Compliance Audit
125
and introduced in the assembly so that it may function as ‘State’ within the meaning of Article 12 of the Constitution of India.
Despite explicit opinion of Department of Law on essentiality of greater authority and more credibility for the Board, State Government did not introduce the bill in the State Legislature. Scrutiny of records revealed that the State Government decided (August 2006) to constitute the Board as a statutory institution only after a writ petition2 was filed in Hon’ble High Court, Jabalpur (July 2005) challenging the powers of State Government to constitute VYAPAM under Article 162 of the Constitution. Thus, State Government took 23 years in initiating process for granting statutory recognition to the Board, since the bill was first drafted to provide the Board a statutory recognition.
3.1.3.1 Establishment of the Board
The Madhya Pradesh Vyavsayik Pariksha Mandal Adhiniyam, 2007 (the Act) was passed by the State Legislature in August 2007 and came into force since 15 October 2007. However, we noticed that the State Government delayed establishment of the statutory Board even after enactment of the Act.
Under section 3(1) of the Act, State Government was required to establish MPPEB by a notification with effect from such date as may be specified in the notification. Section 25 of the Act further provided that the Professional Examination Board, existing immediately before the date specified in section 3(1), shall be merged in the MPPEB. Audit noticed that State Government notified 14 March 2016 as the date on which the MPPEB shall be established under Section 3(1) of the Act. Thus, Statutory Board (MPPEB) could be established only in March 2016, even though State Legislature passed the Act for its establishment in August 2007. The reason due to which State Government took more than eight years to establish MPPEB as a statutory Board could not be ascertained from the records.
Audit noticed that erstwhile VYAPAM started to exercise some of the powers given under the Act to MP VYAPAM, such as regulation making power. However, the authority under which VYAPAM exercised the powers under the Act, was not evident from the records of the Department. Consequently, the duality in the status continued even after enactment of Act in August 2007.
Audit further noticed that the Board still (August 2016) did not have the required full strength to carry out its functions as per the Act, as nominated members were yet to be appointed by the State Government.
A close scrutiny of the provisions of the Act revealed following lacunae in implementation of the Act:
3.1.3.2 Independence of the Board
The Act provided that the Board would consist of the Chairperson, 14 ex-officio members and 11 members nominated by the State Government. An officer of the rank of Chief Secretary was to be appointed as Chairperson and
2 M/s Study Circle Society, Bhopal vs. Secretary to Government, Department of Technical
Education and VYAPAM.
Audit Report on General and Social Sectors for the year ended 31 March 2016
126
the service condition shall be prescribed by the regulations. The tenure and service conditions of the Chairperson was to be such as may be prescribed by the regulations.
Audit scrutiny revealed that no regulations had been framed for prescribing tenure and service condition of the Chairperson. State Government had not initiated any action to frame the regulations prescribing the procedure of appointment of Chairman, its tenure and service conditions. Further, the procedure followed for appointment of Chairman of the Board (Appendix
3.1.2) could not be ascertained from records produced in audit.
Audit further noticed that the Chairman of the Board continued to be recruited under Vyavsayik Pariksha Mandal Seva Bharti Niyam, 1999, which provided for appointment of Chairman by the State Government by transfer of the member of Indian Administrative Services of the rank of Principal Secretary or above. Thus, State Government did not make necessary changes in the recruitment rule for appointment of Chairman in congruity with the provision of the Act. This resulted in the appointment of officers of the rank less than Chief Secretary as Chairman of the Board (Appendix 3.1.2), which was contrary to the provisions made in the Act for independence of the Board. Moreover, provisions relating to fixed tenure of the Chairperson, fixed pay and allowances, security of tenure, debarment from employment post retirement, were not made which undermined the independence of the Chairperson and therefore, of the Board itself. Besides, the post of Chairman was held as additional charge by Additional Chief Secretary to State Government for last one year undermining the independence of the Board.
On being pointed out, Department replied (August 2016) that MPPEB had been directed to frame the regulations regarding tenure and service condition of the Chairperson.
The absence of the specific conditions regarding the mode of selection of the Chairperson, security of tenure, service conditions etc. in the Act itself leaving it to be framed under further regulations and not even fixing a parity with some other established statutory authorities, was a grave lacunae in the Act.
3.1.3.3 Regulations for carrying out activities of the Board
As per section 24 of the Act, the Board may make regulations not inconsistent with the provisions of the Act or the rules made there under for the purpose of carrying into effect the provisions of the Act. First draft of the regulations would be submitted by the Board to the State Government for approval and the State Government shall, within a period of three months from the date of submission of such draft communicate to the Board either its approval or refusal to the draft, or may suggest such modifications therein, as may be deemed necessary in the draft, and if the State Government fails to take any action within the aforesaid period, the final draft submitted by the Board shall be deemed to have been approved by the State Government, and shall be published in the Gazette accordingly.
Section 24 of the Act further provided a list of such regulations, which were related to crucial aspects of conducting examination by the Board, such as, regulation for conduct of entrance examinations and recruitment examinations; fees for admission to examination of Board; imposition of penalties on
Chapter III: Compliance Audit
127
candidates using unfair means or interfering in the examinations conducted by the Board; determination of the standard and expenditure in respect of the examinations and other related activities; and, control, preparation of database in respect of examinations conducted by the Board.
Audit noticed that the Board forwarded 14 regulations to the Department in June 2009. Three more regulations were forwarded in March 2011. However, these regulations were now under the process of amendment at the Board level. We could not ascertain from the records as to whether these regulations were returned to the Board or taken back by it.
Certain significant provisions in these draft regulations, which would have helped in better quality of examination were as follows:
Under provisions of draft Regulation 1 (Madhya Pradesh VYAPAM – Conduct of the examination Regulations, 2011), Confidential Section and Strong Room Section was to be established. The confidential section was responsible for preparing question papers and its printing. Various confidential activities of the examination, such as receipt, storage, packing and checking, despatch, receipt after examination of confidential material was to be conducted in Strong Room. Entry to strong room was to be restricted and could be made only after permission of the officer nominated by the Controller.
Under provisions of draft Regulation 3 (Madhya Pradesh VYAPAM – Publication of the Results of the examinations conducted by the Board Regulations, 2011) prescribed for supervisor to be engaged in computer room/strong room for scanning of OMR answer sheets and other related activities from the data base.
Under provisions of draft Regulation 2 (Madhya Pradesh VYAPAM – Fees for admission to the examination of the Board Regulations, 2011), Fee Fixation Committee was to be constituted under supervision of Chairman to decide the fee of various examinations conducted by the Board.
The draft Regulation 5 (Madhya Pradesh VYAPAM – Imposition of penalties on candidates using unfair means or interfering in the examinations conducted by the Board Regulations, 2011) mentioned about the Unfair Means Committee comprising of Director, Controller and Joint Controller (Examination), which would submit its report to the Chairman of the Board. It also prescribed the penalties to be imposed on the candidates for use of unfair means.
The draft Regulation 17 (Madhya Pradesh VYAPAM – Constitution of Standing Committees of the Board Regulations, 2011) provided for examination committee to make recommendation to the Chairman for appropriate action against persons involved in misconduct during process of examination and mass copying at examination centers, missing of answer sheets, re-examination, complaints against confidentiality of examination etc.
Evidently, these regulations were required to be approved and notified by the State Government to ensure conduct of examination in just, fair and transparent manner. However, the Board continued to conduct examination without approval of these regulations even after enactment of the Act, which
Audit Report on General and Social Sectors for the year ended 31 March 2016
128
undermined the credibility of the Board. Therefore, the Board continued to function in vacuum in what could be construed as an unregulated fashion.
On being pointed out, Department replied (August 2016) that MPPEB had been directed to submit regulations, which would thereafter be approved and published.
3.1.3.4 Rules not made by the State Government
As per Section 23 of the Act, the State Government may, make rules for carrying out all or any of the purposes of this Act which shall be laid on the table of the Legislative Assembly. However, no such rules were made by the State Government and the Board continued to function without any direction from the State Government.
On being pointed out, Department replied (August 2016) that rules would be framed. It further replied that the Board had not submitted the rules for finalisation.
The reply was not acceptable, as it was the State Government and not the Board which was responsible for making rules for onward submission of these to State Legislature. The Government was obviously avoiding responsibility in the matter.
Thus, the delay in establishment of Board under the Act defeated the purpose to provide greater authority and more credibility to the Professional Examination Board in Madhya Pradesh. Even thereafter, the Board was hampered by the lack of rules and regulations which would define and guide its composition, functioning and supervision. As a result, the duality of status continued to exist even after enactment of the Act and the nebulous nature of the Board had not been codified or settled.
3.1.4 Transfer of recruitment function to the Board
The Board was constituted by State Government in April 1982 for conducting entrance examinations for admission into medical, engineering, agriculture and polytechnic colleges. However, General Administrative Department, Government of Madhya Pradesh directed3 (April 2003) all appointing authorities (except for posts of Police and Law Departments) to fill those State level posts through the Board, which were not filled by the M.P. Public Service Commission. It was stated that the decision was taken to reduce the financial burden of State Government on recruitment examination.
The reasons due to which State Government did not opt for conducting recruitment examination through Madhya Pradesh Public Service Commission or considered for creating a Subordinate Service Selection Board for recruitment examination or what were the advantages perceived in transferring recruitment examinations to VYAPAM, were not evident from the records made available to audit. The procedures related to conduct of examinations for medical, engineering colleges etc. are tantamount to grading candidates for admission to professional study courses and are in no way similar to an
3 General Administrative Department order no C-3-11/2003/3-1 Bhopal dated 23.04.2003.
Chapter III: Compliance Audit
129
activity designed for recruitment to Government posts. Recruitment to jobs involve assessment of not only skill and knowledge but also aptitude and physical fitness. Matter such as reservation and quotas have also to be kept in mind. Recruitment procedures include examination of candidates from myriad backgrounds (not only medical and engineering). It involves elimination and selection of a specific number of persons. On the other hand, examination for admission to colleges do not include the objective of grant of livelihoods and only grade the candidates according to performance of a person in a common test. The objective is to standardise the skill levels of persons coming from different educational system who are desirous of acquiring professional knowledge in the State, so that comparisons on a common platform for entrance to professional courses offered in the State are possible. There is no elimination, so competition is less. Therefore, the requirement of the two types of activities i.e. entrance examinations and recruitment methodology are quite different. The skill sets being evaluated are different and, therefore, it is not clear how the two types of examinations can be conducted by the same entity. The provisions of MPPEB Act and Rules made thereunder do not address these difficulties.
Audit scrutiny revealed that out of 20 states4, no State except, Chhattisgarh, (which was formed out of Madhya Pradesh) conducts the activities related to entrance examinations for professional courses to be pursued in colleges alongwith the activity related to recruitment to Government posts, under the same authority nor does the Government of India do anything similar.
Apart from Madhya Pradesh and Chhattisgarh, recruitment activity remained with the Government either departmentally or through creation of Sub-ordinate service selection bodies such as Staff Selection Commission which were Government bodies. Similarly entrance to professional entrance examination were conducted by Academic or Regulatory bodies under supervision of the Government such as CBSE/MCI for Engineering/Medical examinations. Therefore, there is no precedent available for merger of the activities of recruitment with that of grading for entrance to professional courses and entrustment of these to a body over which the Government has no control (as stated in April 1982 notification).
3.1.4.1 Data regarding recruitment examination
On being asked about the details of recruitment examinations conducted by the Board for the State level posts, Department did not provide the information and stated that it pertained to VYAPAM. However, the information available at the website of the Board revealed that it had conducted 90 recruitment examinations in which 86.23 lakh candidates appeared during the years 2005-15 (Appendix-3.1.3). It is a reflection of the disregard that the Government has for its core function i.e. recruiting its employees, that the GoMP does not even maintain data regarding the number of examinations conducted for induction to its services. It shows up the utter opacity in the recruitment activity which is also undesirable.
4 Andhra Pradesh, Telangana, Rajasthan, Tamil Nadu, Karnataka, Uttar Pradesh,
Maharashtra, Bihar, Goa, Haryana, Himachal Pradesh, Odisha, Punjab, Tripura, Meghalaya, Gujarat, Kerala, Mizoram, Chhattisgarh and West Bengal.
Audit Report on General and Social Sectors for the year ended 31 March 2016
130
Audit scrutiny revealed that the adequate strengthening of the Board was not made even after transfer of recruitment function to it, as discussed below:
3.1.4.2 Development of selection procedure for conduct of
recruitment examination
The Board was conducting entrance examinations for admission to medical, engineering, agriculture and polytechnic colleges prior to its appointment as recruitment agency of State Government. Thus, the Board did not have the expertise to conduct recruitment examinations and was required to develop a fair and just selection procedure and curriculum for these recruitment examinations to achieve impartiality, objectivity and suitability.
Ideally, the Board should have consulted Madhya Pradesh Public Service Commission (MPPSC) or any other recruitment agency for developing the selection system for examination under the direction of State Government. In response to an audit query, MPPSC informed (August 2016) that it was not consulted by General Administration Department/ the Board for development of selection system.
We requested (May 2016) the Department to provide information as to whether any regulations/selection system were framed by Board/vetted by Government. However, the Department did not provide the information and replied (August 2016) that the information pertains to MPPEB.
With reference to audit query as to whether any rule was framed by the State Government for recruitment of candidates, Department informed (August 2016) that selection process was governed by MPPEB Act 2007 and Madhya Pradesh Subordinate Services (Combined Eligibility) Examination Rules, 2013. Evidently, Government did not make any rules for examination process prior to 2013, whereas recruitment examinations were being conducted by the Board since 2004.
Thus, a primary function of the Government to ensure free and fair recruitment to its own services, which was till now being conducted by Public Service Commission/Government Departments, was jettisoned in favour of an institution, which was neither statutory nor independent, nor functioned under well laid out regulation.
3.1.4.3 Insufficient Manpower
State Government sanctioned (May 1982) 105 posts for carrying out the business of the Board (Appendix-3.1.4), which was increased to 126 posts after approval (September 2000) of Vyavsayik Pariksha Mandal Seva Bharti
Niyam, 1999 (Appendix-3.1.1). However, State Government did not assess the requirement of additional manpower in the Board after endowing it with the responsibility of recruitment for State level posts in April 2003, which involved handling of large number of applications of job aspirants.
Audit scrutiny revealed that the Board informed (January 2010, February 2014 and March 2014) the State Government for insufficient manpower at the levels of Joint Controllers, Deputy Controllers and Assistant Controllers and its adverse impact on conducting examinations, besides vacancies against the existing posts. However, State Government sanctioned 44 additional posts to

Chapter III: Compliance Audit
131
the Board only in September 2014, i.e., 11 years after making it responsible for recruitment examination.
In reply, Department stated (October 2016) that sanction was given for 44 posts in VYAPAM as per new proposed set up. VYAPAM had started conducting examinations on regular basis since 2008. There was no delay in sanctioning of posts in VYAPAM. As far as possible, officers were posted in VYAPAM on deputation basis time to time.
The reply is not acceptable, VYAPAM was conducting recruitment examinations since 2004 and the strengthening of manpower was made after 11 years of transferring recruitment function to VYAPAM. Further, there was no evidence to conclude that State Government or the Board had ever considered for strengthening the Board with reference to technical expert panel of academicians/question setters/interviewers, etc.
Thus, Government entrusted the recruitment function to the Board without corresponding enhancement of the quality and quantity of its manpower.
3.1.4.4 Recruitment examination for Police Department
As per General Administration Department (GAD) order (April 2003), the examination for the posts of Police and Law Departments was not to be conducted by the Board. Madhya Pradesh Subordinate Services (Combined Eligibility) Examination Rules, 2013, which also provided a list of various examinations to be conducted by the Board, did not include the posts of Police and Law Departments.
While Technical Education and Skill Development Department did not provide the details of recruitment examinations conducted by the Board for the State level posts, the information available on the website of the Board (www.vyapam.nic.in) revealed that it had conducted 11 examinations for recruitment in Police Department in which 12.01 lakh job aspirants appeared during years 2005-2015 (Appendix-3.1.5), which was in violation of GAD orders. The number of vacancies against which these examinations were held was not available on the website.
The reasons due to which recruitment examination for Police was transferred to the Board and under whose authority, despite GAD orders to the contrary, could not be ascertained as all relevant records were not made available to us.
On being pointed out, Department did not furnish the reply and stated that the matter pertained to VYAPAM.
The reply was not acceptable as the Board should not hold recruitment examination without corresponding requisition from the Departments concerned, and if a set procedures as enshrined in a Government Order was to be set aside, it had to be done so after due deliberation, adequate consideration of the advantages or disadvantages and by a decision of the competent authority in the Government. There appeared to be no such action preceding the handing over of the examination for recruitment to police posts to VYAPAM.
Audit Report on General and Social Sectors for the year ended 31 March 2016
132
3.1.5 Appointments by State Government in the Board
3.1.5.1 Appointment of Director, VYAPAM in violation of
recruitment rules
As per Schedule 2 under rule 5 of Vyavsayik Pariksha Mandal Seva Bharti
Niyam, 1999, the post of Director of the Board shall be filled by transfer of Senior Principal of an engineering college or officers of the equivalent rank of other Department, who have sufficient experience of examination related work.
Audit scrutiny revealed that the then Minister, Technical Education and Manpower Planning, GoMP, Shri Raja Pateria ordered for deputation of Dr. Yogesh Uprit to the post of Director, VYAPAM, vide his noting dated 25.10.2002. However, the Deputy Secretary, Technical Education and Manpower Planning Department noted (20.11.2002) that the appointment of Dr. Yogesh Uprit to the post of Director, VYAPAM was not appropriate, as he was a retired officer working on contractual basis in Mahatma Gandhi
Chitrakut Gramodaya Universirty, Satna.
The matter regarding ineligibility of Dr. Yogesh Uprit was brought to the notice of the then Minister and a proposal was submitted to him for the appointment of Dr. Uprit on contractual basis. After approval of the Minister, the proposal was sent to the Chief Minister for approval. However, the proposal sent to the Chief Minister did not mention the ineligibility of Dr. Yogesh Uprit for the post of Director, VYAPAM. The Chief Minister granted approval for contractual appointment of Dr. Yogesh Uprit in the Board and he was appointed as Director, VYAPAM on contractual basis on 14.02.2003.
Evidently, the appointment of Dr. Yogesh Uprit as Director was irregular, the post was required to be filled by transfer of Senior Principal from the engineering college or officers of the equivalent rank of other department, whereas Dr. Uprit was neither a serving employee in another department of any equivalent rank nor was he a Senior Principal of Engineering College. Dr. Yogesh Uprit was later suspected to be involved in financial and examination related irregularities, as detailed in paragraph 3.1.7.1.
On being pointed out, the Department did not offer (October 2016) its comments on the irregular appointment of Dr. Uprit. It, however, informed that Dr. Uprit was removed from the service after the examination related irregularities came to notice.
3.1.5.2 Appointment of Controllers without following due process
As per the Recruitment Rules for the Board, the post of Controller was to be filled by transfer of a Professor of Engineering College or Principal of Polytechnic or equivalent to the rank of other Department who have enough experience of examination work. We noticed that appointments were made to the posts of Controller in the Board without following due process, as discussed in succeeding paragraphs.
Chapter III: Compliance Audit
133
Appointment of Shri Pankaj Trivedi as Controller, VYAPAM
Scrutiny of records revealed that Secretary, Technical Education and Training Department submitted (April 2011) a panel containing names of three officers for the post of Controller, VYAPAM to the then Minister of Technical Education and Skill Development, Shri Laxmikant Sharma. However, the Minister instructed to appoint Dr. Pankaj Trivedi as Controller of examination on deputation, though the name of Dr. Trivedi was not in the proposed panel. Technical Education & Skill Development Department issued order (April 2011) for appointment of Dr. Pankaj Trivedi as Controller for two years from date of his joining on the post and he joined his duty in May 2011.
The appointment of Dr. Pankaj Trivedi to the post of Controller was in violation of General Administration Department’s instruction (February 2008) requiring selection of officers for deputation from a panel of minimum three officers. We further noticed that Dr. Pankaj Trivedi did not possess requisite qualification for appointment on the post of controller as well as he had no experience of examination related work.
Further scrutiny revealed that Dr Pankaj Trivedi held the additional charge of post of Director of the Board for the period 21.06.2011 to 27.07.2012. He was further appointed as Director vide State Government’s order dated 28.07.2012 stating ‘State Government appoints Shri Pankaj Trivedi as Director, Professional Examination Board, while keeping him posted on his current post of Controller’. Dr. Trivedi remained posted on both posts, i.e. Controller as well as Director in MPPEB from 28.07.2012 to 30.07.2013.
On being pointed out, Department informed (October 2016) that the name of Dr. Pankaj Trivedi was not forwarded in the panel. It further informed that the documents related to his qualification and experience were not available at that time and also not examined at Government level. With reference to his appointment as Director, MPPEB, Department replied that the charge of Director was entrusted to Dr. Trivedi due to vacancy against this post.
Thus, the appointment of Dr. Pankaj Trivedi as Controller, VYAPAM was irregular and his possessing the necessary qualification was never vouched by the Government.
Appointment of Shri Sudhir Singh Bhadoria as Controller,
VYAPAM
Scrutiny of records revealed that the then Minister of State (Independent Charge), Technical Education, GoMP Shri Tukojirao Pawar ordered (July 2007) for appointment of Shri Sudhir Singh Bhadoria as Controller in the Board on the ground that he fulfilled the requisite qualification and had examination related experience for the post of Controller and his confidential report was also excellent/very good. We noticed that no panel was prepared for filling the vacancy of Controller, VYAPAM against which Shri Bhadoria was posted.
On being pointed out, Department informed (October 2016) that no advertisement was published for seeking application from other departments.
Audit Report on General and Social Sectors for the year ended 31 March 2016
134
Thus, Dr. Pankaj Trivedi and Shri Sudhir Singh Bhadoria were appointed on deputation to the post of Controller, VYAPAM by the then Ministers without following due process for such deputation. It is pertinent to mention that Dr. Pankaj Trivedi was suspected to be involved in the alleged irregularities in admission/recruitment examinations, which took place in 2012 and 2013 (Appendix-3.1.6). Despite these irregularities, State Government extended his deputation period by two years in March 2013.
3.1.5.3 Undue benefit by suo moto upgradation of pay scales
As per schedule-1(K) under Rule 5 of Vyavsayik Pariksha Mandal Seva
Bharti Niyam, 1999, the post of Sr. System Analyst and System Analyst were of Group “A” and Group “B” cadre with the scale of ` 10000-15200 and 8000-13500 respectively.
Scrutiny of records revealed that existing pay scale of Senior System Analyst and System Analyst of ` 10000-15200 and 8000-275-13500 were upgraded (October 2003) to the pay scale of ` 12000-375-16500 and 10000-325-15200 respectively with the approval of the Chairman, VYAPAM. Further scrutiny revealed that Shri Nitin Mohindra, Senior System Analyst and Shri Ajay Kumar, System Analyst were the incumbents on these posts, who were suspected to be involved in the alleged irregularities in admission/recruitment examinations, as discussed in paragraph 3.1.7.
Further scrutiny revealed that the approval of the State Government was not taken for the upgradation of the pay scale, which was essential as the pay scale for these posts were approved by the State Government under Vyavsayik
Pariksha Mandal Seva Bharti Niyam, 1999. The irregularities in upgradation of pay scale of System Analyst and Sr. System Analyst was also confirmed in the report (dated 25.08.2004) of the Secretary, Technical Education & Training Department to the Additional Chief Secretary, GAD, wherein Dr. A.K. Shrivastava, Controller, VYAPAM and Dr. Yogesh Uprit, Diretor VYAPAM were held responsible for this and the role of the Chairman, VYAPAM in the irregularities was reported to be ascertained separately.
On being pointed, the Department informed (October 2016) that the pay of System Analyst and Senior System Analyst was not amended since notification of Vyavsayik Pariksha Mandal Seva Bharti Niyam, 1999. It further informed that the action was taken to file the case in the matter by Economic Offences Wing.
3.1.6 Financial Accountability of the Board
3.1.6.1 Fund of the Board kept outside Government Account
The accounts of the Board were not available for scrutiny during this audit. However, we noticed from the budget estimates submitted by the Board to the Department and information available on the website of the Board that its income was ` 478.80 crore during 2007-08 to 2013-14 (Appendix-3.1.7),
which included income from sale of application forms, examination fees, interest on bank deposits and other miscellaneous receipts and recoveries. The figures related to 2014-15 and 2015-16 were not made available by the Department. As against this, total expenditure of the Board was ` 389.34 crore
Chapter III: Compliance Audit
135
including transfer to reserves, which resulted in surplus of ` 89.46 crore during the period 2007-14.
Since the Board was a Government Department till the notification of statutory Professional Examination Board in March 2016, the entire receipt and expenditure were to form part of the Government Account. However, the fund of Board was kept outside the Government Account. Besides, the receipts and expenditure of the Board remained out of the legislative controls.
3.1.6.2 Control over the Board funds
In the background of a Writ Petition filed at the Jabalpur Bench of Hon’ble High Court (M/s Study Circle Society vs. Secretary to Government, Department of Technical Education and VYAPAM), State Government decided to accord statutory status to VYAPAM. The substance of the petitioner’s argument was that the creation of VYAPAM by the State Government invoking the powers under Article 162 was incorrect and VYAPAM should be brought under the purview of Article 266 of the Constitution. In this context, Advocate General advised the Department (May 2006) that VYAPAM should be brought under the discipline of Article 266 of the Constitution. In response to this, State Government decided to frame a draft Act for granting statutory status to VYAPAM, which would be identical to Madhya Pradesh Madhyamik Shiksha Mandal Adhiniyam (MPMSM Act), 1965.
The Act provided for constitution of a Board Fund in which all moneys received by or on behalf of the Board shall be deposited. The codal provisions for the Board Fund under the MPPEB Act and MPMSM Act, 1965 were as follows:
‘All moneys at the credit of the Board funds shall be kept in the Government
treasury or at any Bank as the Board may with the approval of the
Government determine: Provided that nothing in this section shall be deemed
to preclude the Board from investing such moneys as are not required for
immediate expenditure in any of the Government securities’ (Section 11 of MPMSM Act, 1965).
‘All moneys credited to the Board fund shall be deposited in such Bank as may
be determined by the Chairperson: Provided that it shall not be deemed to
preclude the Board from investing such moneys as are not required for
immediate expenditure in any of the Government Securities’ (Section 13 of the MPPEB Act, 2007).
Evidently, Government had ceded its control over operations of the Board Fund in case of MPPEB, which was not in case of the Board of Secondary Examination, Madhya Pradesh.
Further, maintaining of Board fund outside the Government Account was contrary to the practice of maintaining accounts of the constitutional and independent authorities like Judiciary, Union Public Service Commission, State Public Service Commissions, Comptroller and Auditor General of India and Election Commission as a part of Government accounts.
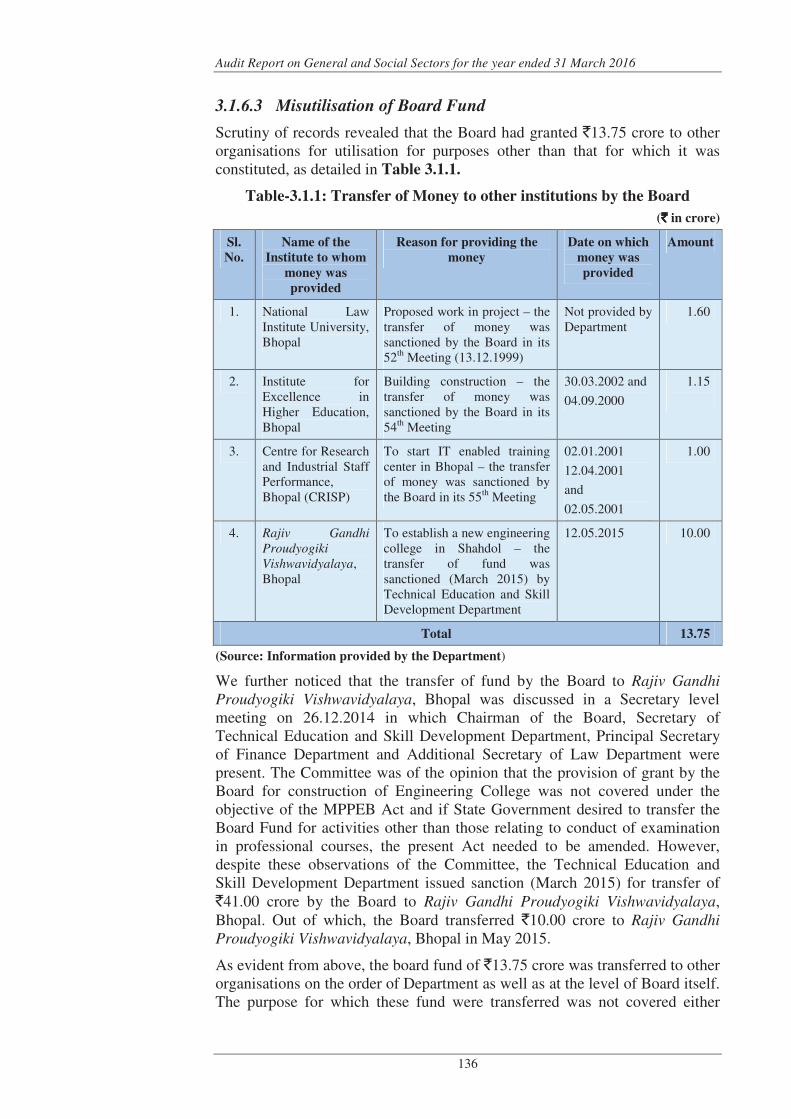
Audit Report on General and Social Sectors for the year ended 31 March 2016
136
3.1.6.3 Misutilisation of Board Fund
Scrutiny of records revealed that the Board had granted `13.75 crore to other organisations for utilisation for purposes other than that for which it was constituted, as detailed in Table 3.1.1.
Table-3.1.1: Transfer of Money to other institutions by the Board
(`̀̀̀ in crore)
Sl.
No.
Name of the
Institute to whom
money was
provided
Reason for providing the
money
Date on which
money was
provided
Amount
1. National Law Institute University, Bhopal
Proposed work in project – the transfer of money was sanctioned by the Board in its 52th Meeting (13.12.1999)
Not provided by Department
1.60
2. Institute for Excellence in Higher Education, Bhopal
Building construction – the transfer of money was sanctioned by the Board in its 54th Meeting
30.03.2002 and
04.09.2000
1.15
3. Centre for Research and Industrial Staff Performance, Bhopal (CRISP)
To start IT enabled training center in Bhopal – the transfer of money was sanctioned by the Board in its 55th Meeting
02.01.2001
12.04.2001
and
02.05.2001
1.00
4. Rajiv Gandhi Proudyogiki Vishwavidyalaya, Bhopal
To establish a new engineering college in Shahdol – the transfer of fund was sanctioned (March 2015) by Technical Education and Skill Development Department
12.05.2015 10.00
Total 13.75
(Source: Information provided by the Department)
We further noticed that the transfer of fund by the Board to Rajiv Gandhi Proudyogiki Vishwavidyalaya, Bhopal was discussed in a Secretary level meeting on 26.12.2014 in which Chairman of the Board, Secretary of Technical Education and Skill Development Department, Principal Secretary of Finance Department and Additional Secretary of Law Department were present. The Committee was of the opinion that the provision of grant by the Board for construction of Engineering College was not covered under the objective of the MPPEB Act and if State Government desired to transfer the Board Fund for activities other than those relating to conduct of examination in professional courses, the present Act needed to be amended. However, despite these observations of the Committee, the Technical Education and Skill Development Department issued sanction (March 2015) for transfer of `41.00 crore by the Board to Rajiv Gandhi Proudyogiki Vishwavidyalaya, Bhopal. Out of which, the Board transferred `10.00 crore to Rajiv Gandhi Proudyogiki Vishwavidyalaya, Bhopal in May 2015.
As evident from above, the board fund of `13.75 crore was transferred to other organisations on the order of Department as well as at the level of Board itself. The purpose for which these fund were transferred was not covered either
Chapter III: Compliance Audit
137
under Executive Order of 1982 for creation of the Board nor under MPPEB Act, 2007.
On being pointed out, the Department replied (October 2016) that the Board was competent to utilize its accumulated funds. It further informed that the transfer of `41.00 crore to Rajiv Gandhi Proudyogiki Vishwavidyalaya, Bhopal was made on the basis of approval from the Cabinet.
The fact remains that the Board Fund of `13.75 crore was transferred to other organisations for purposes other than that for which the Board was created. Thus, the Board as well as Department misutilised accumulated funds lying with the Board as per their convenience. Besides, it indicated the evident control of Government over the proceeds of the receipts of VYAPAM and its allocation, transfer etc, yet State Government distanced itself from the Board by stating that it was not responsible for its functioning.
3.1.6.4 Examination fee
As per Section 24(2) (b) of the Madhya Pradesh Vyavsayik Pariksha Mandal Act 2007, the Board may make regulation providing for the fees for admission to the examinations of the Board. However, no such regulation was finalised by the Board and approved by the State Government.
We noticed that examination fees for various recruitment and entrance examinations were not determined by the Board in consultation with the Government. In this context, it is pertinent to mention that similarly placed organisation viz. Staff Selection Commission determines the fee structure for examination in consultation with Central Government.
On being pointed out in Audit (October 2016), Department informed that the determination of fees was being done by the Board.
The reply is not tenable, as the regulation of the fees for admission to the examinations of the Board was to be approved by the State Government under Section 24(2)(b) read with Section 24(4) of the Act.
3.1.7 Oversight of the Board by State Government
3.1.7.1 Action taken by the State Government against persons found
involved in financial irregularities
As per general order of GAD (No.F/12/2/85/Pra-Sa.Ka/Ek Bhopal, Dated 15-10-1985), the government/semi-government employees shall be suspended with immediate effect without any exception, if challans against them for legal proceedings in connection with corrupt practices is submitted in the Court by the Madhya Pradesh Lok Ayukt or by the State Bureau of Investigation of Economic Offences.
With reference to above general order, it was directed to all departments vide general order (No. F/13/3/88/49-10/Ek Bhopal, Dated 07-11-1988) of Secretary, Department of Personnel, Administrative Reform and Training GoMP, ‘It was brought to the notice that a government officer suspended as per above cited directions against whom case was in progress in the Court, was posted on a sensitive post after revoking his suspension by the department. The Government hereby directs in this regard that relaxation of
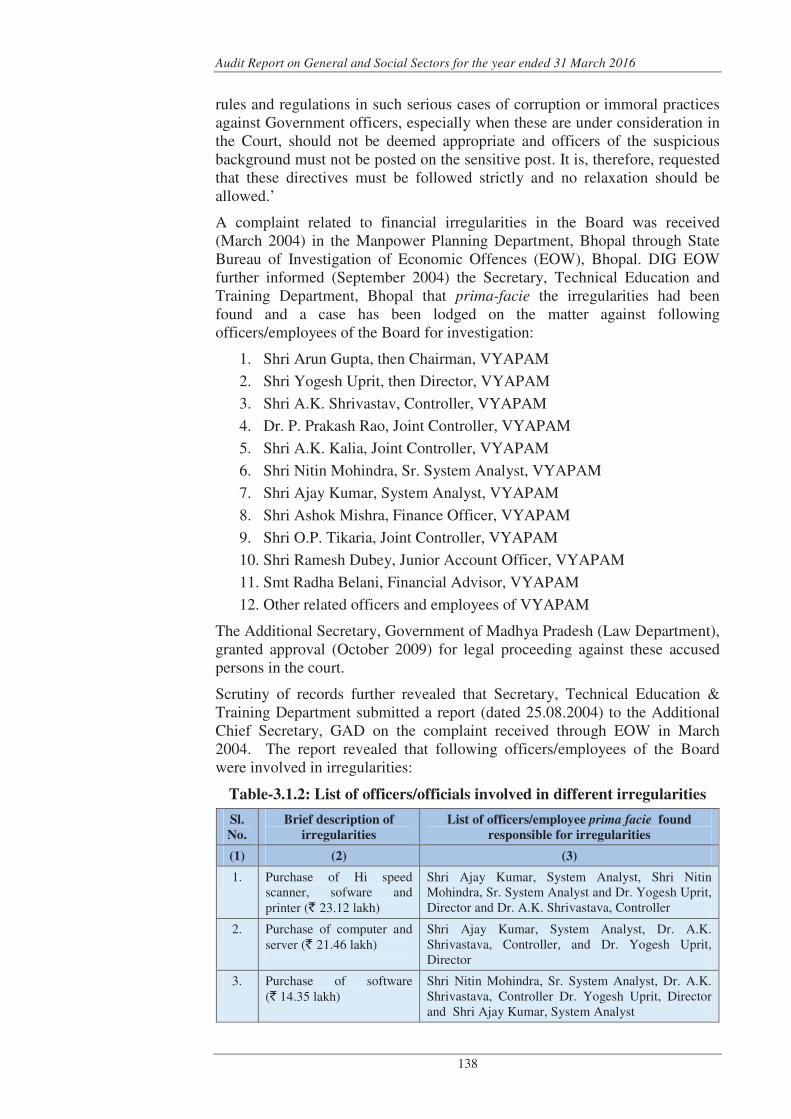
Audit Report on General and Social Sectors for the year ended 31 March 2016
138
rules and regulations in such serious cases of corruption or immoral practices against Government officers, especially when these are under consideration in the Court, should not be deemed appropriate and officers of the suspicious background must not be posted on the sensitive post. It is, therefore, requested that these directives must be followed strictly and no relaxation should be allowed.’
A complaint related to financial irregularities in the Board was received (March 2004) in the Manpower Planning Department, Bhopal through State Bureau of Investigation of Economic Offences (EOW), Bhopal. DIG EOW further informed (September 2004) the Secretary, Technical Education and Training Department, Bhopal that prima-facie the irregularities had been found and a case has been lodged on the matter against following officers/employees of the Board for investigation:
1. Shri Arun Gupta, then Chairman, VYAPAM
2. Shri Yogesh Uprit, then Director, VYAPAM
3. Shri A.K. Shrivastav, Controller, VYAPAM
4. Dr. P. Prakash Rao, Joint Controller, VYAPAM
5. Shri A.K. Kalia, Joint Controller, VYAPAM
6. Shri Nitin Mohindra, Sr. System Analyst, VYAPAM
7. Shri Ajay Kumar, System Analyst, VYAPAM
8. Shri Ashok Mishra, Finance Officer, VYAPAM
9. Shri O.P. Tikaria, Joint Controller, VYAPAM
10. Shri Ramesh Dubey, Junior Account Officer, VYAPAM
11. Smt Radha Belani, Financial Advisor, VYAPAM
12. Other related officers and employees of VYAPAM
The Additional Secretary, Government of Madhya Pradesh (Law Department), granted approval (October 2009) for legal proceeding against these accused persons in the court.
Scrutiny of records further revealed that Secretary, Technical Education & Training Department submitted a report (dated 25.08.2004) to the Additional Chief Secretary, GAD on the complaint received through EOW in March 2004. The report revealed that following officers/employees of the Board were involved in irregularities:
Table-3.1.2: List of officers/officials involved in different irregularities
Sl.
No.
Brief description of
irregularities
List of officers/employee prima facie found
responsible for irregularities
(1) (2) (3)
1. Purchase of Hi speed scanner, sofware and printer (` 23.12 lakh)
Shri Ajay Kumar, System Analyst, Shri Nitin Mohindra, Sr. System Analyst and Dr. Yogesh Uprit, Director and Dr. A.K. Shrivastava, Controller
2. Purchase of computer and server (` 21.46 lakh)
Shri Ajay Kumar, System Analyst, Dr. A.K. Shrivastava, Controller, and Dr. Yogesh Uprit, Director
3. Purchase of software (` 14.35 lakh)
Shri Nitin Mohindra, Sr. System Analyst, Dr. A.K. Shrivastava, Controller Dr. Yogesh Uprit, Director and Shri Ajay Kumar, System Analyst
Chapter III: Compliance Audit
139
(1) (2) (3)
4. Providing of computers and accessories to the Polytechnic and ITI (` 60.18 lakh)
Shri Ajay Kumar, System Analyst, Shri Nitin Mohindra, Sr. System Analyst, Shri Ashok Mishra, Finance Officer, Shri O.P. Tikaria, Joint Controller, Shri A.K. Kalia, Joint Controller, Shri P. Prakash Rao, Joint Controller, Dr. Yogesh Uprit, Director and Dr A.K. Shrivastava, Controller.
5. Providing of medical equipment to the ITI, Indore (` 19.97 lakh)
Shri Ajay Kumar, System Analyst, Shri Nitin Mohindra, Sr. System Analyst, Dr A.K. Shrivastava, Controller and Dr. Yogesh Uprit,Director.
6. Purchase of computerised OMR Application form and answer sheet (` 15.00 lakh)
Shri Ajay Kumar, System Analyst, Shri P. Prakash Rao Joint Controller, Shri A.K. Kalia, Joint Controller, Dr. A.K. Shrivastava Controller and Dr. Yogesh Uprit, Director.
7. Suspicious withdrawal of ` 70,000
Dr. Yogesh Uprit, Director
8. Inclusion of seven ineligible candidates in ITI entrance examinations
Dr. Yogesh Uprit, Director
9. Acceptance of seven application form for pre B. Ed. exams, 2004 after expiring of last date of submission of form
Dr. Yogesh Uprit, Director
(Source: Information collated from records of the Department)
We further noticed that the then Minister (Technical Education & Training Department, Madhya Pradesh) instructed (November 2004) for suspension of all persons involved in the irregularities till completion of the enquiry which would be completed within 60 days and that they should not occupy the important posts. However, the order of Minister was not complied with and the officers were allowed to continue.
Further scrutiny of information available on the website of the Board (www.vyapam.nic.in) revealed that the Board reported various malpractices in admission and recruitment examinations conducted by it during the period January 2012 to June 2013 (Appendix-3.1.6). In these cases, Shri Nitin Mohindra, Sr. System Analyst, Shri Ajay Kumar, System Analyst and others were reported to be involved.
Thus, neither State Government had kept away Shri Nitin Mohindra, Sr. System Analyst and Shri Ajay Kumar, System Analyst from important posts nor instructed the Board to do so, which was in violation of State Governments instructions (October 1985 and November 1988) and the directions of the then Minister.
On being pointed out, the Department informed (October 2016) that EOW had investigated the case. As the case was registered by EOW and investigation was under process, no other action was taken by the State Government. It further informed that State Government had sanctioned prosecution of accused officers of State Government. The Board had sanctioned prosecution in case of Shri Ashok Mishra, Shri Nitin Mohindra and Shri Ajay Kumar, who were the officers of VYAPAM.
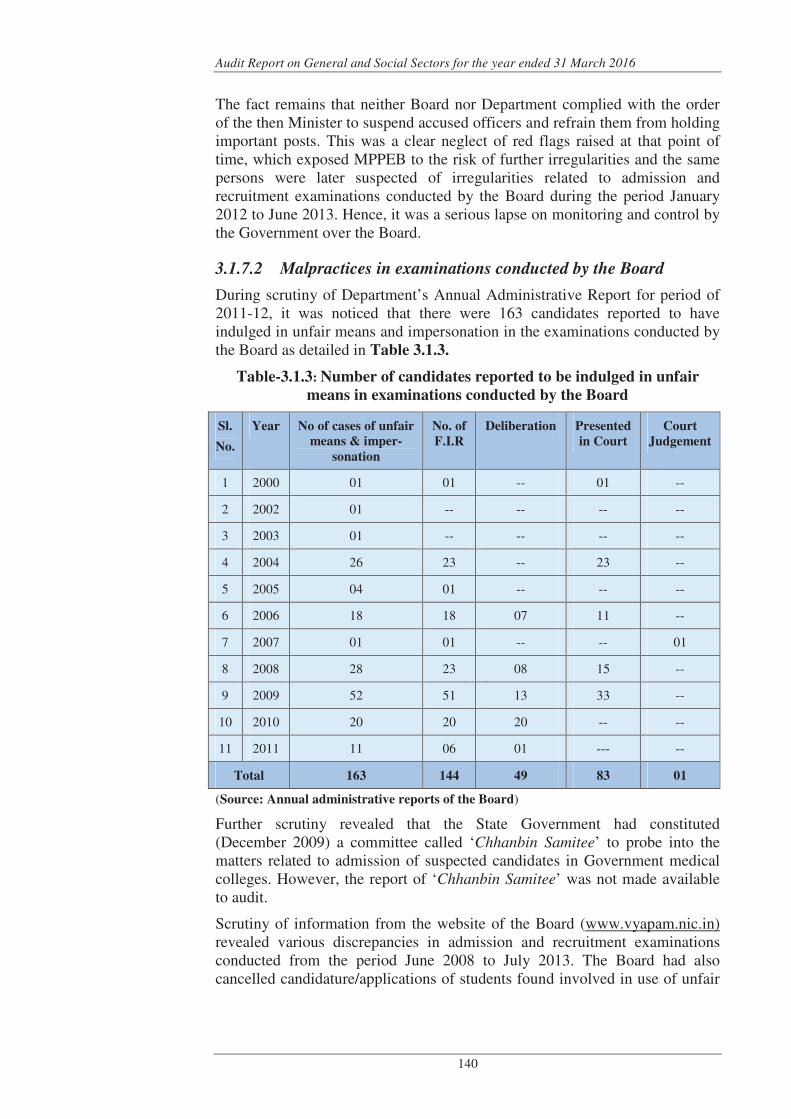
Audit Report on General and Social Sectors for the year ended 31 March 2016
140
The fact remains that neither Board nor Department complied with the order of the then Minister to suspend accused officers and refrain them from holding important posts. This was a clear neglect of red flags raised at that point of time, which exposed MPPEB to the risk of further irregularities and the same persons were later suspected of irregularities related to admission and recruitment examinations conducted by the Board during the period January 2012 to June 2013. Hence, it was a serious lapse on monitoring and control by the Government over the Board.
3.1.7.2 Malpractices in examinations conducted by the Board
During scrutiny of Department’s Annual Administrative Report for period of 2011-12, it was noticed that there were 163 candidates reported to have indulged in unfair means and impersonation in the examinations conducted by the Board as detailed in Table 3.1.3.
Table-3.1.3: Number of candidates reported to be indulged in unfair
means in examinations conducted by the Board
Sl.
No.
Year No of cases of unfair
means & imper-
sonation
No. of
F.I.R
Deliberation Presented
in Court
Court
Judgement
1 2000 01 01 -- 01 --
2 2002 01 -- -- -- --
3 2003 01 -- -- -- --
4 2004 26 23 -- 23 --
5 2005 04 01 -- -- --
6 2006 18 18 07 11 --
7 2007 01 01 -- -- 01
8 2008 28 23 08 15 --
9 2009 52 51 13 33 --
10 2010 20 20 20 -- --
11 2011 11 06 01 --- --
Total 163 144 49 83 01
(Source: Annual administrative reports of the Board)
Further scrutiny revealed that the State Government had constituted (December 2009) a committee called ‘Chhanbin Samitee’ to probe into the matters related to admission of suspected candidates in Government medical colleges. However, the report of ‘Chhanbin Samitee’ was not made available to audit.
Scrutiny of information from the website of the Board (www.vyapam.nic.in) revealed various discrepancies in admission and recruitment examinations conducted from the period June 2008 to July 2013. The Board had also cancelled candidature/applications of students found involved in use of unfair
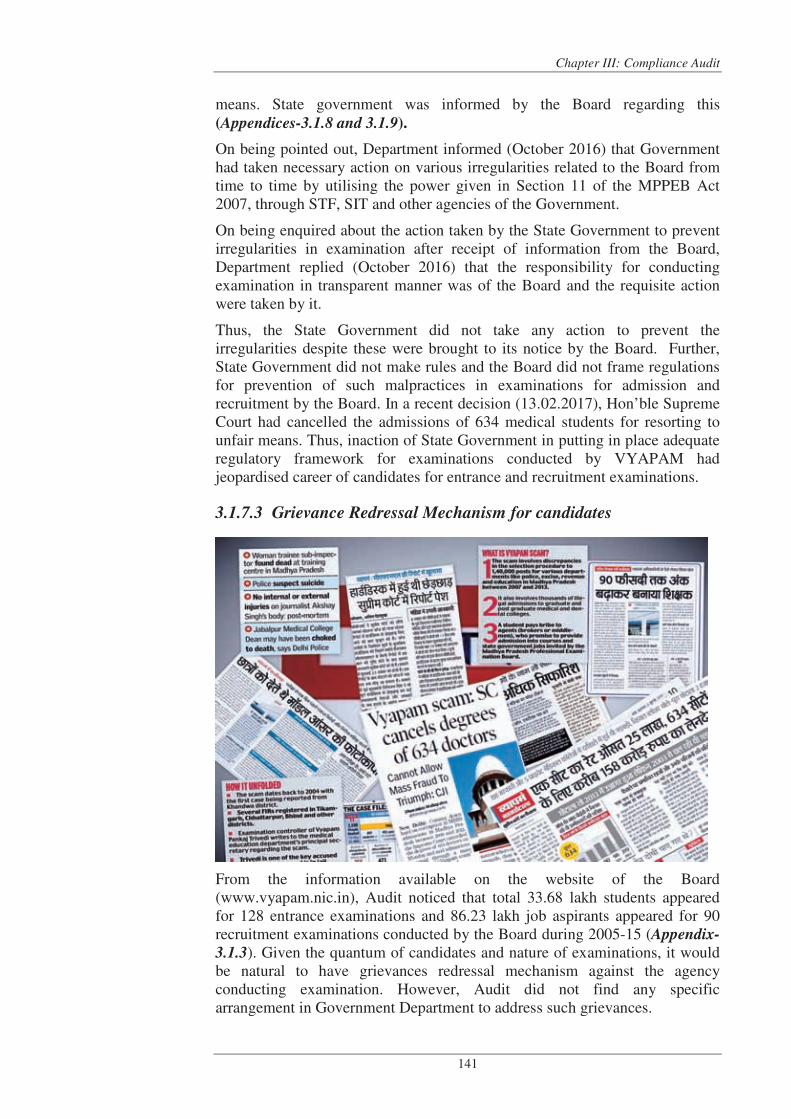
Chapter III: Compliance Audit
141
means. State government was informed by the Board regarding this (Appendices-3.1.8 and 3.1.9).
On being pointed out, Department informed (October 2016) that Government had taken necessary action on various irregularities related to the Board from time to time by utilising the power given in Section 11 of the MPPEB Act 2007, through STF, SIT and other agencies of the Government.
On being enquired about the action taken by the State Government to prevent irregularities in examination after receipt of information from the Board, Department replied (October 2016) that the responsibility for conducting examination in transparent manner was of the Board and the requisite action were taken by it.
Thus, the State Government did not take any action to prevent the irregularities despite these were brought to its notice by the Board. Further, State Government did not make rules and the Board did not frame regulations for prevention of such malpractices in examinations for admission and recruitment by the Board. In a recent decision (13.02.2017), Hon’ble Supreme Court had cancelled the admissions of 634 medical students for resorting to unfair means. Thus, inaction of State Government in putting in place adequate regulatory framework for examinations conducted by VYAPAM had jeopardised career of candidates for entrance and recruitment examinations.
3.1.7.3 Grievance Redressal Mechanism for candidates
From the information available on the website of the Board (www.vyapam.nic.in), Audit noticed that total 33.68 lakh students appeared for 128 entrance examinations and 86.23 lakh job aspirants appeared for 90 recruitment examinations conducted by the Board during 2005-15 (Appendix-
3.1.3). Given the quantum of candidates and nature of examinations, it would be natural to have grievances redressal mechanism against the agency conducting examination. However, Audit did not find any specific arrangement in Government Department to address such grievances.
Audit Report on General and Social Sectors for the year ended 31 March 2016
142
On being pointed out, Department replied (September 2016) that the action was being taken by concerned divisions (such as, EoW, STF, etc.).
3.1.7.4 Assessment of IT based system
In whole examination process, the IT based system played a very critical role. It was used at various stages like random allocation of Roll Numbers, evaluation of OMR sheets etc. Nothing has come to the notice of audit, based on which it can be stated that the State Government ensured the integrity of IT based system used in the examination conducted by the Board.
On being pointed out, Department informed (September 2016) that the action was being taken by the Board.
3.1.8 Independent evaluation of the Board
The Board has been assigned an important task of recruitment to government services and admission to professional courses, which in turn has an effect on job opportunities to students and morale of youth in State at large.
During scrutiny of records it was noticed that Principal Secretary, Government of Madhya Pradesh, Manpower Planning Department submitted a note (June 1983) to the Chief Minister regarding annual audit of the Board, “….it is
equally necessary that an annual audit of the Board’s activities in regard to
earnings and expenditure should be conducted. Since the office of the A.G. is
generally overbusy and individual firms of chartered accountants of repute
are not available in Madhya Pradesh, it is proposed that the annual audit
should be carried out by the office of the Auditor of Local Funds, at least to
begin with.” The proposal was approved by the Chief Minister on 25.06.1983.
Thus, Local Fund Audit (LFA) was assigned audit of the Board in 1983 due to perceived busy schedule of office of the Accountant General and absence of Chartered Accountant of repute in the State. However, there was nothing on record to say that the Accountant General was consulted for audit of the Board in 1982-83 and that the A.G. then denied assumption of responsibilities by citing the busy schedule of his office.
When new Act was being formulated during 2006-07, due attention was not given to arrangement for independent evaluation of functioning of the Board and it was left to the Government to appoint an auditor. Section 15 of the Act provides for accounts of the Board to be annually audited by such agency as prescribed by the State Government.
The Government appointed LFA for this purpose (June 2009). However, audited reports of LFA were not being sent by the Board to the Department. Thus, Department had not kept watch over the irregularities pointed out by LFA.
Regarding audit by C&AG, the State Government informed (January 2015) that MPPEB is not covered under sections 13 to 15 of the Comptroller and Auditor General’s (Duties, Powers and Conditions of Service) Act, 1971. It was further stated that the State Government has not come across any information or findings of any financial irregularities on the part of MPPEB as an organization, which would warrant an audit by C&AG. It was further informed that MPPEB does not receive funds from the Government and hence
Chapter III: Compliance Audit
143
the present system of conducting an audit through State Local Fund Audit team seems sufficient.
It is pertinent to mention that major financial irregularities were there in 2004 itself, which the then audit arrangement using Local Fund Audit could not detect. The irregularities came to the limelight only after a complaint was received. Some other malpractices related to recruitment examinations were also noticed, which though not in nature of financial irregularities pointed to systemic weakness in the Board, which could have been prevented by periodic independent evaluation of the working of the Board.
3.1.9 Conclusion and Recommendations
Summary of Conclusions
The Board was constituted in April 1982 with confusion over its status as a Government Department, which continues until now. State Government acknowledged the Board as its department during various inter-departmental deliberations, which was also confirmed by legal opinion of its Law Department and several judicial pronouncements. State Government was also in full control of the appointments to the Board as the posts of Chairman, Director and Controller in the Board were filled up by transfer of State Government officers. However, the State Government distanced itself from the activities of the Board through a notification of 1982 wherein it disowned any responsibility for the actions of the Board.
This distancing was done without putting in place an elaborate regulatory framework which would have not only ensured independence of the Board but also would have subjected it to multilayered accountability and scrutiny. This would have made the process of recruitment and conduct of examination, transparent, ethical and robust.
Without this framework, there were serious doubts about credibility of examinations conducted by the Board, which led to widespread public dissatisfaction as reported in the media and as acknowledged by the Department, through the institution of probes into the affairs of VYAPAM by ED/CBI/EOW.
At several points of time, the courts had proclaimed that '….. VYAPAM is a department of the Government' (Hon’ble High Court, Jabalpur in a Civil Petition 1232 of 2002); ' …..we may impress upon the State Government to take expeditious steps for establishment of the Board in terms of the provisions of the MPPEB Act, 2007' (Hon’ble High Court, Jabalpur in April 2014); '…..It has no existence apart from Government' (Hon’ble Supreme Court in Civil Appeal No. 1727 of 2016).
Therefore, it can be reasonably concluded that any activity of VYAPAM is to be conducted in consonance with 'an exercise of the executive powers of the State of Madhya Pradesh.' This implies that it is subject to the same kind of scrutiny, control and regulation as applicable to any executive exercise of the Government, such as, budgetary control, regulation of fees, deposits of revenues into the State treasury, expenditure after sanction of competent authority, review of all activities such as conduct of examinations,
Audit Report on General and Social Sectors for the year ended 31 March 2016
144
recruitment, etc. by the competent authority. Prescribed procedures are to be followed for selection of members and chairperson of the Board. Transparency and accountability should have been ensured in conduct of all activities of the Board. However none of these procedures were applied to the functioning of VYAPAM affairs and it was allowed to function independent of Government on many matters.
The most serious lapse of State Government was delay in implementation of Madhya Pradesh Vyavsayik Pariksha Mandal Act 2007, which provided statutory recognition to the Board and if implemented wholly along with subordinate legislation, would have ended the duality of approach as delineated above. Government established the Board under this Act only in March 2016, i.e., with a delay of more than eight years. However, the Act itself was silent on many issues which would have ensured free and fair functioning of the MPPEB. The regulations envisaged under the Act which might have addressed these lacunae regarding independence of the Board, its Chairman and officers, conduct of examination in a just, fair and reasonable manner and oversight of MPPEB were not yet framed.
The Board was initially constituted by State Government for conducting entrance examinations for admission into medical, engineering, agriculture and polytechnic colleges. The recruitment examinations for State level posts were transferred to the Board in April 2003. This was done without improving the human resources component to deal with this new activities of codification and development. Selection procedure for conduct of recruitment examination to achieve impartiality, objectivity and selection of most suitable candidate for the post, keeping in mind the statutory requirement, were not done. Arrangements for oversight, audit and evaluation of the activities of the Board were also not put in place as applicable to Staff Selection Commission or comparable organisations. There was no evidence that the State Government ensured the integrity of IT based system used in the examination conducted by the Board.
The necessity for entrusting recruitment process to VYAPAM bypassing Staff Selection Commission/ Government Department was not only in violation of the norms of ensuring integrity and transparency in public appointments, but was also done without any stated objectives/advantages to the Government and was a departure from the well-established procedure all around the country. In no State apart from Chhattisgarh (which anyway was part of Madhya Pradesh till October 2000) examinations for recruitment to Government posts were conducted by the very same body which conducts the examination for entrance to professional courses for students such as medical or engineering courses.
The appointments of Director and Controllers in the Board were made by systemic subversion of rules resulting into undue favour to some officers.
The fund of Board was kept outside Government Account and it was not subjected to budgetary control of State Legislature, which led to dilution in its financial accountability.
Chapter III: Compliance Audit
145
Lack of oversight and periodic independent evaluation of the Board by government and any other independent agency led to a situation, wherein the general principles of equity and probity in public affairs were overlooked.
State Government did not take remedial actions on red flags raised from time to time by EOW, Minister, Technical Education and Training, GoMP, mentions of doubtful activities in Annual Administrative Reports of the Department and the website of VYAPAM.
Recommendations
Both the functions currently being entrusted to the Board, i.e., recruitment to
government posts and examination for admission to Professional Courses
should be entrusted to separate institutions.
MPPEB should be brought to the level of a Public Service Commission/Staff
Selection Commission. There must be security of tenure of the Chairman and
its Members so that they may be independent and could make selections
properly.
If the State Government persists with the continuance of VYAPAM, then it
should implement the ‘Madhya Pradesh Vyavsayik Pariksha Mandal Act
2007’ after removal of the existing gaps in the Act, by framing and adopting
subordinate regulations to ensure independence of the Board and conduct of
examinations with impartiality, transparency and accountably. All other
regulations prescribed under the Act may be codified at the earliest to end the
duality and ambiguity.
The mechanism of oversight over the Board may be strengthened and
appropriately included in the regulations. The periodic independent
evaluation of activities of the Board may also be provided in these regulations.
The Government has to make adequate arrangements for Audit of MPPEB,
like any other Government Department/ Statutory Authority.
The Vyavsayik Pariksha Mandal Bharti Niyam, 1999 may be reviewed and
suitably amended in the spirit of provisions of Madhya Pradesh Vyavsayik
Pariksha Mandal Act 2007.
The cases of irregularities in appointment of officers of the Board and
upgradation of pay scales of officers, as brought out in this report, may be
investigated and responsibility may be fixed for the irregularities.
The fee structure for entrance and recruitment examinations conducted by the
Board may be determined in consultation with the State Government.
MPPEB collects fees etc. for both recruitment examination to public posts and
admission to professional institutions of Government. The receipts should be
deposited in the Consolidated Fund of the State and the expenditure should be
met out of the same.
In conclusion we recommend that the Government might do well to heed the
directions of the Hon'ble Supreme Court regarding the status of MPPEB and
take all necessary steps to grant and strengthen that status. The
pronouncement of Hon'ble Supreme Court made it clear that "it (MPPEB) has
no existence apart from Government".
Audit Report on General and Social Sectors for the year ended 31 March 2016
146
LABOUR DEPARTMENT
3.2 Audit of "Madhya Pradesh Building and Other Construction
Workers’ Welfare Board"
3.2.1 Introduction
Government of India (GoI) enacted (August 1996) Building and Other Construction Workers (Regulation of Employment and Conditions of Service) Act, 1996 (BOCW Act) and Building and Other Construction Workers' Welfare Cess Act, 1996 with a view to regulate wages, working conditions, safety and health, welfare measures etc. of workers. Under provisions of the Acts, State Governments have to constitute State Welfare Board to frame and implement various welfare schemes. The Government of Madhya Pradesh (GoMP), in exercise of the powers conferred under the BOCW Act notified (1 January 2003) the Madhya Pradesh Building and Other Construction Workers (Regulation of Employment and Conditions of Service) Rules, 2002 (Rules, 2002).
The State Government constituted (10 April 2003) Madhya Pradesh Building and Other Construction Workers' Welfare Board (Board) under Section 18 of the BOCW Act. The major source of fund to the Board is collection of cess at the rate of one per cent of the cost of construction incurred by the employers under Building and Other Construction Workers’ Welfare Cess Act, 1996. At present, 22 schemes are being operated by the Board for welfare of building and other construction workers.
The Board consists of the Labour Minister as ex-officio Chairman; Welfare Commissioner, Jabalpur nominated as member by the Central Government; ten members nominated by the State Government representing building workers and employers (five each) as members of the Board. Four members i.e. Principal Secretary, Labour Department and Principal Secretary or Deputy Secretary level officer nominated by the Principal Secretaries of the Finance Department, Urban Administration and Development Department and Public Works Department are ex-officio members of the Board.
The Labour Commissioner is Chief Inspector for inspection of building and other construction works. The Deputy Labour Commissioner is Secretary of the Board. At district level, Assistant Labour Commissioners (ALCs) and District Labour Officers (DLOs) are designated as Registering Officers (ROs) for registration of establishments. The officers of Labour Department (LD), Urban Local Bodies (ULBs) and Panchayati Raj Institutions (PRIs) are appointed as Cess Collectors for the collection of cess and as Assessment Officers for assessment of cess. The cess collected is remitted to the Board through District Labour Offices. The officers of PRIs and ULBs are appointed for the registration of Building and Other Construction Workers in rural and urban areas respectively. Delegation of powers for sanctioning and providing benefits to the Building and Other Construction Workers under various welfare schemes are provided to the officers of PRIs, ULBs, Health Department and Education Department.
Chapter III: Compliance Audit
147
The audit of Madhya Pradesh Building and Other Construction Workers’ Welfare Board was conducted to ascertain whether assessment, levy and collection of cess were done efficiently, financial management of Board was efficient and economical, welfare measures were planned and implemented effectively and monitoring mechanisms for cess collection and expenses on welfare schemes were in place.
Audit covered the period of five years from 2011-12 to 2015-16. Six5 out of 51 districts (ten per cent) were selected for audit on the basis of Simple Random Sampling without Replacement (SRSWOR) method. Records of Board office in Bhopal and in each selected district and records related to activities of BOCW Act in the Labour Office (LO), one Urban Local Body (ULB)6, one Panchayti Raj Institution (PRI)7, two construction agencies (Rural Engineering Services and Public Works Department) were test checked. Total 12 construction sites consisting of two construction sites in each district were visited for beneficiary survey of building construction workers.
Entry Conference was held on 15 February 2016 with the Principal Secretary of the Labour Department to discuss the audit objectives, scope and methodology. The audit findings were discussed in Exit Conference held on 27 October 2016 with Principal Secretary. The replies of the Department have been suitably incorporated.
Audit findings
3.2.2 Assessment, Levy and Collection of Cess
3.2.2.1 Registration of establishment and construction worker
The BOCW Act applies to any establishment belonging to, or under the control of, Government, any body corporate or firm, an individual or association or other body of individuals which or who employs building workers in any building or other construction works; and includes an establishment belonging to a contractor. However, it does not include an individual who employs such workers in any building or construction work in relation to his own residence the total cost of such construction not being more than ` 10 lakh. The provision of Rule 4 (4) of the Building and Other Construction Workers' Welfare Cess Rules, 1998 provided that every approval of a construction works by a local authority would be accompanied by a cross demand draft in favour of the Board.
Section 3 of the Building and Other Construction Workers’ Welfare Cess Act, 1996 (Cess Act), read with Central Government notification of September 1996, provided for levy and collection of labour welfare cess at the rate of one
5 Anuppur, Betul, Burhanpur, Dewas, Gwalior and Ujjain.
6 Nagar Palika Parishad, Anuppur, Nagar Palika Parishad, Betul, Nagar Palik Nigam, Burhanpur, Nagar Palik Nigam, Dewas, Nagar Palik Nigam, Gwalior and Nagar Palik Nigam, Ujjain.
7 Janpad Panchayat, Jaithari (Anppur), Shahpur (Betul), Burhanpur, Sonkachchh (Dewas), Morar (Gwalior) and Ujjain.
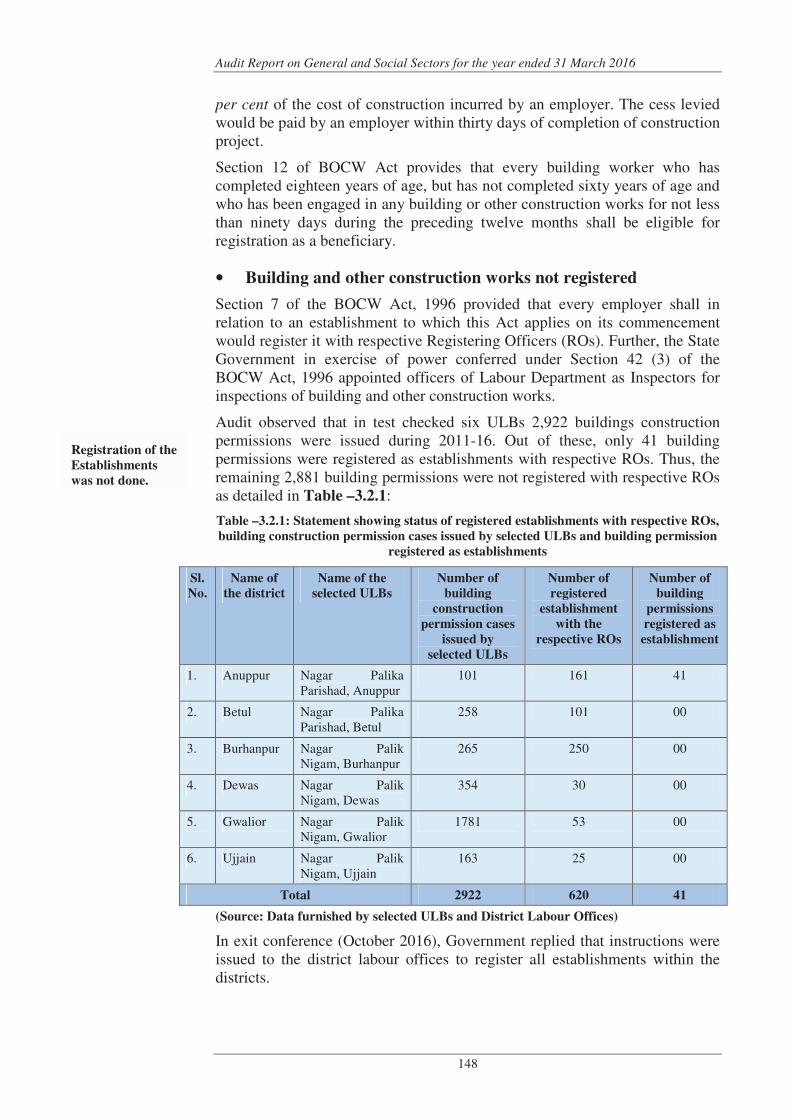
Audit Report on General and Social Sectors for the year ended 31 March 2016
148
per cent of the cost of construction incurred by an employer. The cess levied would be paid by an employer within thirty days of completion of construction project.
Section 12 of BOCW Act provides that every building worker who has completed eighteen years of age, but has not completed sixty years of age and who has been engaged in any building or other construction works for not less than ninety days during the preceding twelve months shall be eligible for registration as a beneficiary.
• Building and other construction works not registered
Section 7 of the BOCW Act, 1996 provided that every employer shall in relation to an establishment to which this Act applies on its commencement would register it with respective Registering Officers (ROs). Further, the State Government in exercise of power conferred under Section 42 (3) of the BOCW Act, 1996 appointed officers of Labour Department as Inspectors for inspections of building and other construction works.
Audit observed that in test checked six ULBs 2,922 buildings construction permissions were issued during 2011-16. Out of these, only 41 building permissions were registered as establishments with respective ROs. Thus, the remaining 2,881 building permissions were not registered with respective ROs as detailed in Table –3.2.1:
Table –3.2.1: Statement showing status of registered establishments with respective ROs,
building construction permission cases issued by selected ULBs and building permission
registered as establishments
Sl.
No.
Name of
the district
Name of the
selected ULBs
Number of
building
construction
permission cases
issued by
selected ULBs
Number of
registered
establishment
with the
respective ROs
Number of
building
permissions
registered as
establishment
1. Anuppur Nagar Palika Parishad, Anuppur
101 161 41
2. Betul Nagar Palika Parishad, Betul
258 101 00
3. Burhanpur Nagar Palik Nigam, Burhanpur
265 250 00
4. Dewas Nagar Palik Nigam, Dewas
354 30 00
5. Gwalior Nagar Palik Nigam, Gwalior
1781 53 00
6. Ujjain Nagar Palik Nigam, Ujjain
163 25 00
Total 2922 620 41
(Source: Data furnished by selected ULBs and District Labour Offices)
In exit conference (October 2016), Government replied that instructions were issued to the district labour offices to register all establishments within the districts.
Registration of the
Establishments
was not done.
Chapter III: Compliance Audit
149
• Joint Physical Inspection and Survey of beneficiaries at
construction sites
During physical inspection of 12 construction sites in selected districts, Audit noticed that nine out of 12 inspected establishments were not registered and employers of these unregistered establishments did not send the information of commencement of building and other construction works to the Labour Officer.
During beneficiary survey at these construction sites, 156 construction workers were found engaged by the employers. However, only 25 construction workers were registered under the BOCW Act. Remaining 131 workers were not found registered. They were also not aware about the benefits under the various welfare schemes implemented by the Board. Thus, respective Labour Inspectors failed to inspect these construction sites violating the provisions of BOCW Act.
Due to failure of respective PRIs/ULBs to register these workers, the potential benefits under various schemes, such as, incentive for education scheme, prasuti sahayta scheme and funeral and ex-gratia payment in case of death scheme, were not provided to these workers.
During interviews, DLOs stated that the registration of all construction workers could not be done due to construction workers hailing from other states, illiteracy of construction workers and lack of interest from the employers.
It revealed that Board did not establish an effective mechanism to proper campaigning for awareness to register the construction workers and establishments.
In exit conference (October 2016), Government stated that all the District Labour Officers would be instructed to get information of the construction workers engaged at construction sites within their jurisdiction and to register them.
3.2.2.2 Cess not deducted
3.2.2.2(a) Cess not deducted from Building and other Construction
Works
Section 3 of the Cess Act provided that cess should be collected from every employer, including deduction at source in relation to a building or other construction work of a Government or of a public sector undertaking or advance collection through a local authority where an approval of such building or other construction work by such local authority was required. The Labour Commissioner, GoMP issued instruction (May 2004) to collect cess from the cost of construction of individuals own residence of which construction cost was more than ` 10 lakh.
Audit observed in Janpad Panchayat, Jaithari (Anuppur), Burhanpur, Morar (Gwalior), Ujjain and Nagar Nigam, Dewas that cess amounting to ` 27.21 lakh was not deducted from1,190 buildings and other construction works carried out during 2011-16. Out of these cases, 43 cases were related to
Cess amounting to
`̀̀̀ 27.21 lakh was
not deducted from
the 1,190 building
and other
construction
works.
Audit Report on General and Social Sectors for the year ended 31 March 2016
150
individual own residence, where construction cost was more than ` 10 lakh. Remaining 1,147 construction works were related to Government works. The details are given in Appendix 3.2.1.
In exit conference (October 2016), Government stated that instructions to the concerned institutions were issued for recovery of cess from every construction works.
3.2.2.2(b) Deduction of cess not done from MGNREGS works
Audit observed in selected PRIs that cess amounting to ` 1.83 crore was not deducted from 35,679 MGNREGS construction works pertaining to period 2011-16. Total construction cost of these works was ` 183.28 crore. The details are shown in Appendix 3.2.2.
In exit conference (October 2016), Government agreed with audit observation and assured that necessary correspondence with concerned would be made.
3.2.2.3 Collected cess not transferred to Board
Rule 5 (3) of the Building and Other Construction Workers' Welfare Cess Rules, 1998 (Cess Rules) provided that the amount of cess collected shall be transferred to the Board within 30 days of its collection.
Scrutiny of records in selected districts revealed that cess amounting ` 3.13 crore collected during 2011-16 was not transferred (as of March 2016) by ULBs, PRIs and other construction agencies to the Board even after lapse of stipulated period of 30 days. The details are given in Appendix 3.2.3.
In exit conference (October 2016), Government stated that necessary instructions were issued to the ULBs, PRIs and other construction agencies in districts for remitting the collected cess to Board within time as per the provision of the BOCW Act.
The reply was not tenable as the collected cess was to be transferred to Board as per the Cess Rules.
3.2.2.4 Delayed deposit of cess
Scrutiny of records in Board and in selected districts revealed that the Cess Collectors deposited cess amounting ` 23.31 crore with a delay ranging from 30 days to 96 months, after the stipulated period of 30 days to deposit the collected amount of cess. The details are shown in Appendix 3.2.4.
In exit conference (October 2016), Government replied that the Board had issued instructions to the concerned institutions for timely deposit of cess many a times. Further, stated that instructions were again issued to all concerned institutions for timely deposit of cess due to the Board.
The reply of the Board is not acceptable as Rule 264 (e) of Madhya Pradesh Building and Other Construction Workers (Regulation of Employment and Conditions of Service) Rules, 2002 provided that the Board shall be responsible for proper and timely recovery of amounts due to the Board.
Cess amounting to
`̀̀̀ 1.83 crore was
not deducted from
the total 35,679
construction
MGNREGS works.
Collected Cess
amount to `̀̀̀ 3.13
crore was not
transferred to
the Board.
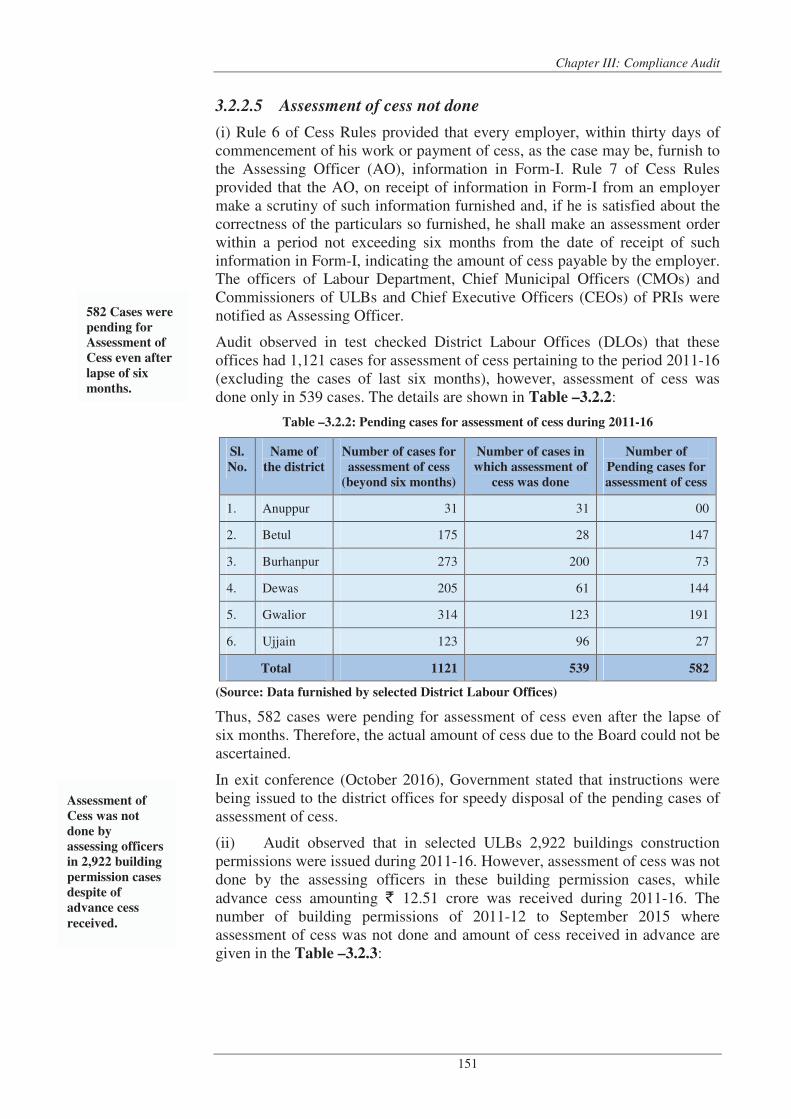
Chapter III: Compliance Audit
151
3.2.2.5 Assessment of cess not done
(i) Rule 6 of Cess Rules provided that every employer, within thirty days of commencement of his work or payment of cess, as the case may be, furnish to the Assessing Officer (AO), information in Form-I. Rule 7 of Cess Rules provided that the AO, on receipt of information in Form-I from an employer make a scrutiny of such information furnished and, if he is satisfied about the correctness of the particulars so furnished, he shall make an assessment order within a period not exceeding six months from the date of receipt of such information in Form-I, indicating the amount of cess payable by the employer. The officers of Labour Department, Chief Municipal Officers (CMOs) and Commissioners of ULBs and Chief Executive Officers (CEOs) of PRIs were notified as Assessing Officer.
Audit observed in test checked District Labour Offices (DLOs) that these offices had 1,121 cases for assessment of cess pertaining to the period 2011-16 (excluding the cases of last six months), however, assessment of cess was done only in 539 cases. The details are shown in Table –3.2.2:
Table –3.2.2: Pending cases for assessment of cess during 2011-16
Sl.
No.
Name of
the district
Number of cases for
assessment of cess
(beyond six months)
Number of cases in
which assessment of
cess was done
Number of
Pending cases for
assessment of cess
1. Anuppur 31 31 00
2. Betul 175 28 147
3. Burhanpur 273 200 73
4. Dewas 205 61 144
5. Gwalior 314 123 191
6. Ujjain 123 96 27
Total 1121 539 582
(Source: Data furnished by selected District Labour Offices)
Thus, 582 cases were pending for assessment of cess even after the lapse of six months. Therefore, the actual amount of cess due to the Board could not be ascertained.
In exit conference (October 2016), Government stated that instructions were being issued to the district offices for speedy disposal of the pending cases of assessment of cess.
(ii) Audit observed that in selected ULBs 2,922 buildings construction permissions were issued during 2011-16. However, assessment of cess was not done by the assessing officers in these building permission cases, while advance cess amounting ` 12.51 crore was received during 2011-16. The number of building permissions of 2011-12 to September 2015 where assessment of cess was not done and amount of cess received in advance are given in the Table –3.2.3:
582 Cases were
pending for
Assessment of
Cess even after
lapse of six
months.
Assessment of
Cess was not
done by
assessing officers
in 2,922 building
permission cases
despite of
advance cess
received.
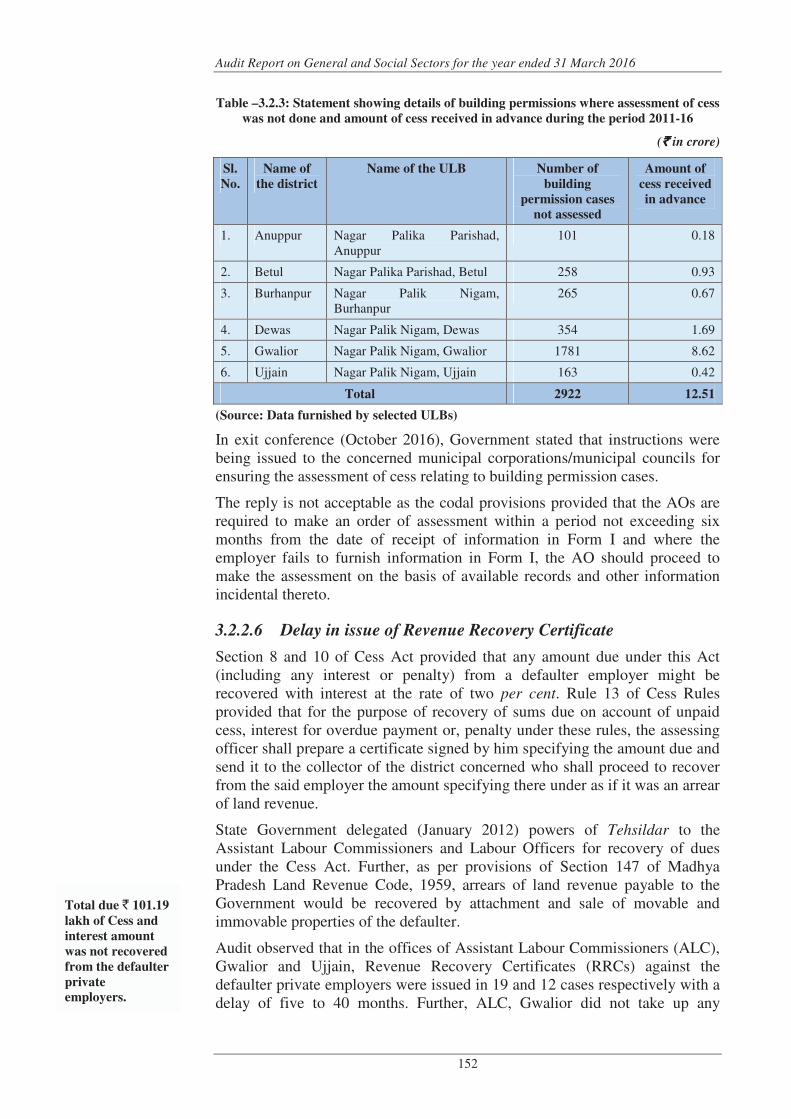
Audit Report on General and Social Sectors for the year ended 31 March 2016
152
Table –3.2.3: Statement showing details of building permissions where assessment of cess
was not done and amount of cess received in advance during the period 2011-16
(` ` ` ` in crore)
Sl.
No.
Name of
the district
Name of the ULB Number of
building
permission cases
not assessed
Amount of
cess received
in advance
1. Anuppur Nagar Palika Parishad, Anuppur
101 0.18
2. Betul Nagar Palika Parishad, Betul 258 0.93
3. Burhanpur Nagar Palik Nigam, Burhanpur
265 0.67
4. Dewas Nagar Palik Nigam, Dewas 354 1.69
5. Gwalior Nagar Palik Nigam, Gwalior 1781 8.62
6. Ujjain Nagar Palik Nigam, Ujjain 163 0.42
Total 2922 12.51
(Source: Data furnished by selected ULBs)
In exit conference (October 2016), Government stated that instructions were being issued to the concerned municipal corporations/municipal councils for ensuring the assessment of cess relating to building permission cases.
The reply is not acceptable as the codal provisions provided that the AOs are required to make an order of assessment within a period not exceeding six months from the date of receipt of information in Form I and where the employer fails to furnish information in Form I, the AO should proceed to make the assessment on the basis of available records and other information incidental thereto.
3.2.2.6 Delay in issue of Revenue Recovery Certificate
Section 8 and 10 of Cess Act provided that any amount due under this Act (including any interest or penalty) from a defaulter employer might be recovered with interest at the rate of two per cent. Rule 13 of Cess Rules provided that for the purpose of recovery of sums due on account of unpaid cess, interest for overdue payment or, penalty under these rules, the assessing officer shall prepare a certificate signed by him specifying the amount due and send it to the collector of the district concerned who shall proceed to recover from the said employer the amount specifying there under as if it was an arrear of land revenue.
State Government delegated (January 2012) powers of Tehsildar to the Assistant Labour Commissioners and Labour Officers for recovery of dues under the Cess Act. Further, as per provisions of Section 147 of Madhya Pradesh Land Revenue Code, 1959, arrears of land revenue payable to the Government would be recovered by attachment and sale of movable and immovable properties of the defaulter.
Audit observed that in the offices of Assistant Labour Commissioners (ALC), Gwalior and Ujjain, Revenue Recovery Certificates (RRCs) against the defaulter private employers were issued in 19 and 12 cases respectively with a delay of five to 40 months. Further, ALC, Gwalior did not take up any
Total due ` 101.19
lakh of Cess and
interest amount
was not recovered
from the defaulter
private
employers.
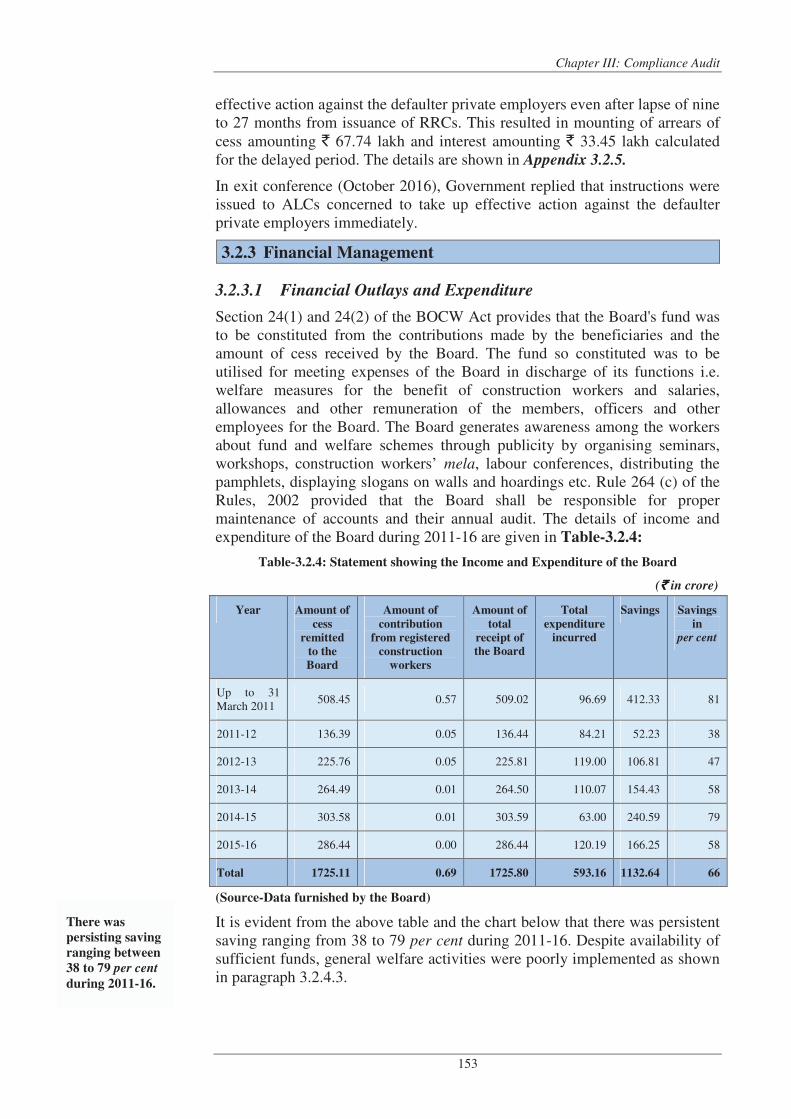
Chapter III: Compliance Audit
153
effective action against the defaulter private employers even after lapse of nine to 27 months from issuance of RRCs. This resulted in mounting of arrears of cess amounting ` 67.74 lakh and interest amounting ` 33.45 lakh calculated for the delayed period. The details are shown in Appendix 3.2.5.
In exit conference (October 2016), Government replied that instructions were issued to ALCs concerned to take up effective action against the defaulter private employers immediately.
3.2.3 Financial Management
3.2.3.1 Financial Outlays and Expenditure
Section 24(1) and 24(2) of the BOCW Act provides that the Board's fund was to be constituted from the contributions made by the beneficiaries and the amount of cess received by the Board. The fund so constituted was to be utilised for meeting expenses of the Board in discharge of its functions i.e. welfare measures for the benefit of construction workers and salaries, allowances and other remuneration of the members, officers and other employees for the Board. The Board generates awareness among the workers about fund and welfare schemes through publicity by organising seminars, workshops, construction workers’ mela, labour conferences, distributing the pamphlets, displaying slogans on walls and hoardings etc. Rule 264 (c) of the Rules, 2002 provided that the Board shall be responsible for proper maintenance of accounts and their annual audit. The details of income and expenditure of the Board during 2011-16 are given in Table-3.2.4:
Table-3.2.4: Statement showing the Income and Expenditure of the Board
(` ` ` ` in crore)
Year Amount of
cess
remitted
to the
Board
Amount of
contribution
from registered
construction
workers
Amount of
total
receipt of
the Board
Total
expenditure
incurred
Savings Savings
in
per cent
Up to 31 March 2011
508.45 0.57 509.02 96.69 412.33 81
2011-12 136.39 0.05 136.44 84.21 52.23 38
2012-13 225.76 0.05 225.81 119.00 106.81 47
2013-14 264.49 0.01 264.50 110.07 154.43 58
2014-15 303.58 0.01 303.59 63.00 240.59 79
2015-16 286.44 0.00 286.44 120.19 166.25 58
Total 1725.11 0.69 1725.80 593.16 1132.64 66
(Source-Data furnished by the Board)
It is evident from the above table and the chart below that there was persistent saving ranging from 38 to 79 per cent during 2011-16. Despite availability of sufficient funds, general welfare activities were poorly implemented as shown in paragraph 3.2.4.3.
There was
persisting saving
ranging between
38 to 79 per cent
during 2011-16.
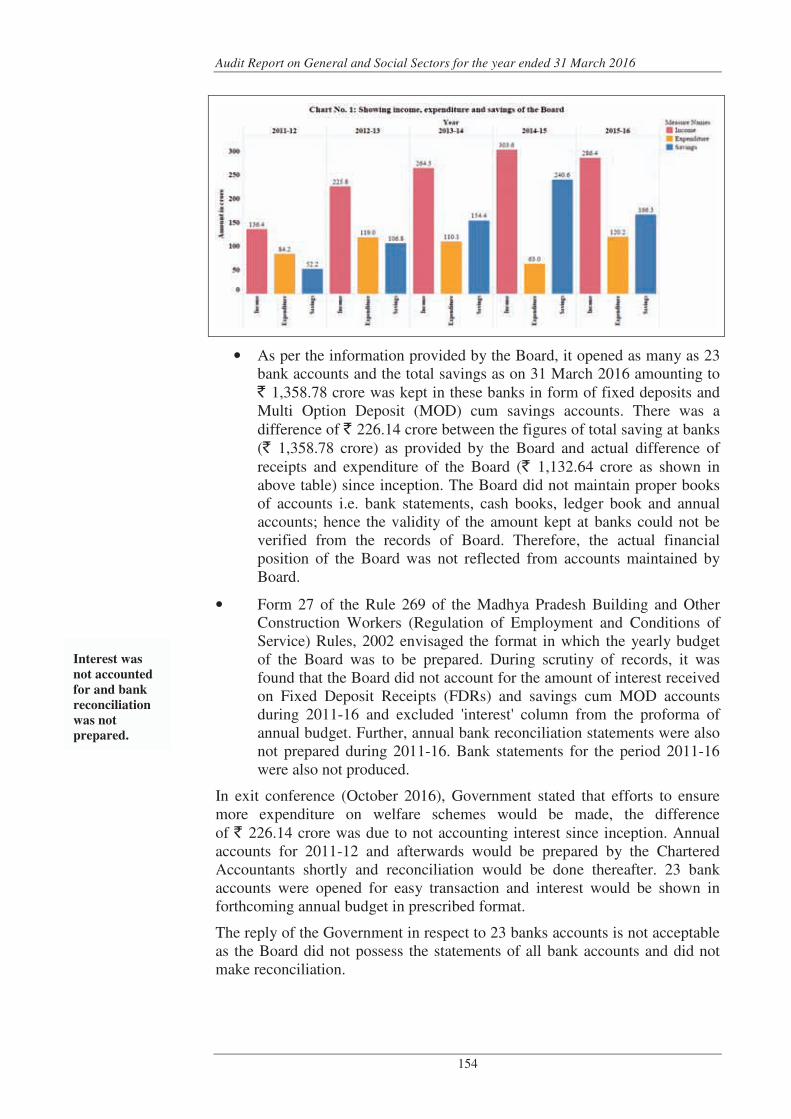
Audit Report on General and Social Sectors for the year ended 31 March 2016
154
• As per the information provided by the Board, it opened as many as 23 bank accounts and the total savings as on 31 March 2016 amounting to ` 1,358.78 crore was kept in these banks in form of fixed deposits and Multi Option Deposit (MOD) cum savings accounts. There was a difference of ` 226.14 crore between the figures of total saving at banks (` 1,358.78 crore) as provided by the Board and actual difference of receipts and expenditure of the Board (` 1,132.64 crore as shown in above table) since inception. The Board did not maintain proper books of accounts i.e. bank statements, cash books, ledger book and annual accounts; hence the validity of the amount kept at banks could not be verified from the records of Board. Therefore, the actual financial position of the Board was not reflected from accounts maintained by Board.
• Form 27 of the Rule 269 of the Madhya Pradesh Building and Other Construction Workers (Regulation of Employment and Conditions of Service) Rules, 2002 envisaged the format in which the yearly budget of the Board was to be prepared. During scrutiny of records, it was found that the Board did not account for the amount of interest received on Fixed Deposit Receipts (FDRs) and savings cum MOD accounts during 2011-16 and excluded 'interest' column from the proforma of annual budget. Further, annual bank reconciliation statements were also not prepared during 2011-16. Bank statements for the period 2011-16 were also not produced.
In exit conference (October 2016), Government stated that efforts to ensure more expenditure on welfare schemes would be made, the difference of ` 226.14 crore was due to not accounting interest since inception. Annual accounts for 2011-12 and afterwards would be prepared by the Chartered Accountants shortly and reconciliation would be done thereafter. 23 bank accounts were opened for easy transaction and interest would be shown in forthcoming annual budget in prescribed format.
The reply of the Government in respect to 23 banks accounts is not acceptable as the Board did not possess the statements of all bank accounts and did not make reconciliation.
Interest was
not accounted
for and bank
reconciliation
was not
prepared.
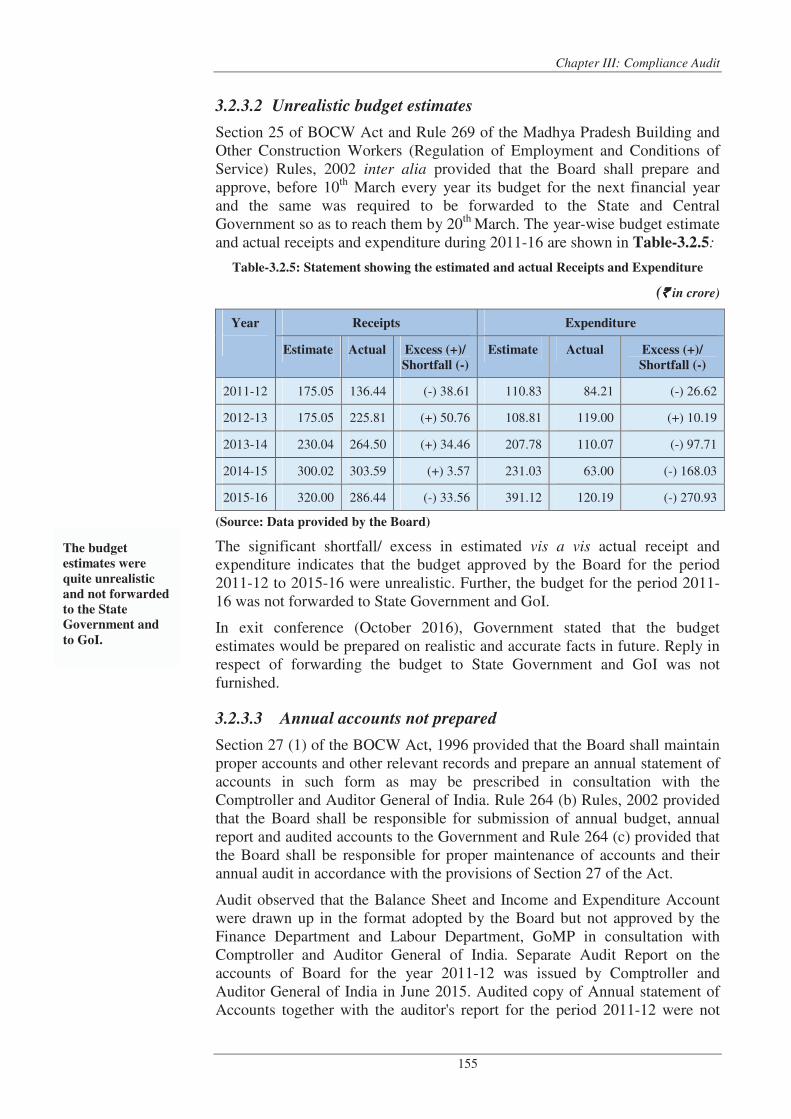
Chapter III: Compliance Audit
155
3.2.3.2 Unrealistic budget estimates
Section 25 of BOCW Act and Rule 269 of the Madhya Pradesh Building and Other Construction Workers (Regulation of Employment and Conditions of Service) Rules, 2002 inter alia provided that the Board shall prepare and approve, before 10th March every year its budget for the next financial year and the same was required to be forwarded to the State and Central Government so as to reach them by 20th March. The year-wise budget estimate and actual receipts and expenditure during 2011-16 are shown in Table-3.2.5:
Table-3.2.5: Statement showing the estimated and actual Receipts and Expenditure
(` ` ` ` in crore)
Year
Receipts Expenditure
Estimate Actual Excess (+)/
Shortfall (-)
Estimate Actual Excess (+)/
Shortfall (-)
2011-12 175.05 136.44 (-) 38.61 110.83 84.21 (-) 26.62
2012-13 175.05 225.81 (+) 50.76 108.81 119.00 (+) 10.19
2013-14 230.04 264.50 (+) 34.46 207.78 110.07 (-) 97.71
2014-15 300.02 303.59 (+) 3.57 231.03 63.00 (-) 168.03
2015-16 320.00 286.44 (-) 33.56 391.12 120.19 (-) 270.93
(Source: Data provided by the Board)
The significant shortfall/ excess in estimated vis a vis actual receipt and expenditure indicates that the budget approved by the Board for the period 2011-12 to 2015-16 were unrealistic. Further, the budget for the period 2011-16 was not forwarded to State Government and GoI.
In exit conference (October 2016), Government stated that the budget estimates would be prepared on realistic and accurate facts in future. Reply in respect of forwarding the budget to State Government and GoI was not furnished.
3.2.3.3 Annual accounts not prepared
Section 27 (1) of the BOCW Act, 1996 provided that the Board shall maintain proper accounts and other relevant records and prepare an annual statement of accounts in such form as may be prescribed in consultation with the Comptroller and Auditor General of India. Rule 264 (b) Rules, 2002 provided that the Board shall be responsible for submission of annual budget, annual report and audited accounts to the Government and Rule 264 (c) provided that the Board shall be responsible for proper maintenance of accounts and their annual audit in accordance with the provisions of Section 27 of the Act.
Audit observed that the Balance Sheet and Income and Expenditure Account were drawn up in the format adopted by the Board but not approved by the Finance Department and Labour Department, GoMP in consultation with Comptroller and Auditor General of India. Separate Audit Report on the accounts of Board for the year 2011-12 was issued by Comptroller and Auditor General of India in June 2015. Audited copy of Annual statement of Accounts together with the auditor's report for the period 2011-12 were not
The budget
estimates were
quite unrealistic
and not forwarded
to the State
Government and
to GoI.
Audit Report on General and Social Sectors for the year ended 31 March 2016
156
laid before the State Legislature. The Annual statement of Accounts for the financial year 2012-13 to 2015-16 were also not prepared. Audit from Chartered Accountant was also not conducted for 2012-13 to 2015-16. In exit conference (October 2016), Government stated that the Separate Audit Report on the accounts for the year 2011-12 was under process for laying down in the State Legislature and annual accounts for the years 2012-13 to 2015-16 were being prepared.
3.2.3.4 Realisation of cess not done
Rule 264 (e) of Madhya Pradesh Building and Other Construction Workers (Regulation of Employment and Conditions of Service) Rules, 2002 provided that the Board would be responsible for proper and timely recovery of amounts due to the Board.
Scrutiny of records of the Board revealed that the cheques or drafts for depositing the cess amounting to ` 12.93 crore8 (` 0.42 crore tappal returns9 and ` 12.51 crore bank returns10) were returned to the drawers due to realisation not made since inception to 2015-16. Fresh cheque or drafts for cess were not received from the drawers as of March 2016 resulting in loss of cess due to lack of monitoring by the Board. The details are shown in Appendix 3.2.6.
In exit conference (October 2016), Government stated that correspondence would be made with offices concerned and action for issuance of RRCs would be taken in cases, where cess was not deposited.
3.2.3.5 Improper expenditure
Section 24 (2) of the BOCW Act provided that funds collected at Board should be applied to meet expenses of the Board and for purposes authorized by the Act.
Audit observed that the Board released ` 1.58 crore to Labour Commissioner (LC), Indore during 2012-13 to 2014-15 for renovation, electrification and civil construction works which were not admissible under purposes authorised by the Act. Thus, the fund released to LC office was improper.
In exit conference (October 2016), Government replied that fund was released on demand of LC office and after approval of the Board's meeting, however, no fund was released after 2014-15. Further, the Board replied (January 2016) that the State Government, in exercise of powers conferred by Section 42 of the BOCW Act, appointed LC as Chief Inspector and the activities envisaged by the BOCW Act i.e. assessment and collection of cess and inspection was done under the supervision and control of the Labour Commissioner.
The reply was not acceptable as it was contrary to the norms laid down in the BOCW Act. Further, at ground level, the activities envisaged by the BOCW
8 ` 12.33 crore (1164 cheques/drafts) of Government departments and ` 0.60 crore
(58 cheques/drafts) of private parties. 9 Where the Board identified the defects and returned the cheques or drafts. 10 Where the bank identified the defects and returned the cheques or drafts to the Board for
onward transmission to the drawers.
Cess amounting to
` 12.93 crore was
not realised from
the employers.
An amount of
`̀̀̀ 1.58 crore was
released to the
LC Office for
inadmissible
purposes not
authorised by the
Act.

Chapter III: Compliance Audit
157
Act were to be done by the District Labour Offices, ULBs, PRIs and other construction agencies, however, the Board did not release fund to other agencies for such purposes.
3.2.3.6 Excess administrative expenditure
Section 24 (3) of the BOCW Act provided that the Board could not incur administrative expenses in excess of five per cent of its total expenses in a financial year.
Audit observed during the test check of records at the Board that during the year 2014-15 and 2015-16 the Board incurred administrative expenditure ` 4.41 crore (7 per cent) and ` 7.04 crore (5.86 per cent) against the admissible expenditure of ` 3.15 crore and ` 6.01 crore respectively. Board had not established field offices as envisaged in paragraph 3.2.4.2, even then, excess administrative expenditure of ` 2.29 crore was incurred.
In exit conference (October 2016), Government stated that excess administrative expenditure had been incurred due to less expenditure under schemes in 2014-15 and 2015-16. Government, further, ensured that it would keep the administrative expenses within the prescribed limit.
3.2.4 Welfare Measures
Under section 22 of the BOCW Act, the Board had launched 25 welfare schemes since inception to March 2016 out of which one scheme Insurance Assistance (Group Insurance Scheme) launched in 2004-05 was closed in 2007-08 and two schemes House Loan Assistance Scheme and Pension Assistance Scheme were also closed in 2013-14. At present, 22 welfare schemes are being operated by the Board for providing the benefits to the registered workers. For implementation of welfare schemes, the Board provides the fund to Labour offices (LOs) and thereafter the fund is provided from LOs to respective implementing offices.
Section 11 and 12 of the BOCW Act inter alia provide that every building worker who had completed eighteen years of age, but not completed sixty years of age would be registered as a beneficiary and entitled to the benefits provided from its fund.
Powers to sanction and providing the benefits to the Building and Other Construction Workers under various welfare schemes were delegated to the officers of PRIs, ULBs, Health Department and Education Department.
The Board registered 24.82 lakh building workers up to March 2016. For the augmentation in the number of registered workers, all district officers were directed to organise special campaign from time to time and conduct publicity campaign through workshop and labour conference etc. Board did not conduct any survey for identification of building and construction workers and, therefore, the Board was not aware about the actual number of building and other construction workers in the State. The chart below represents total number of beneficiaries and number of beneficiaries benefited during 2011-12 to 2015-16:
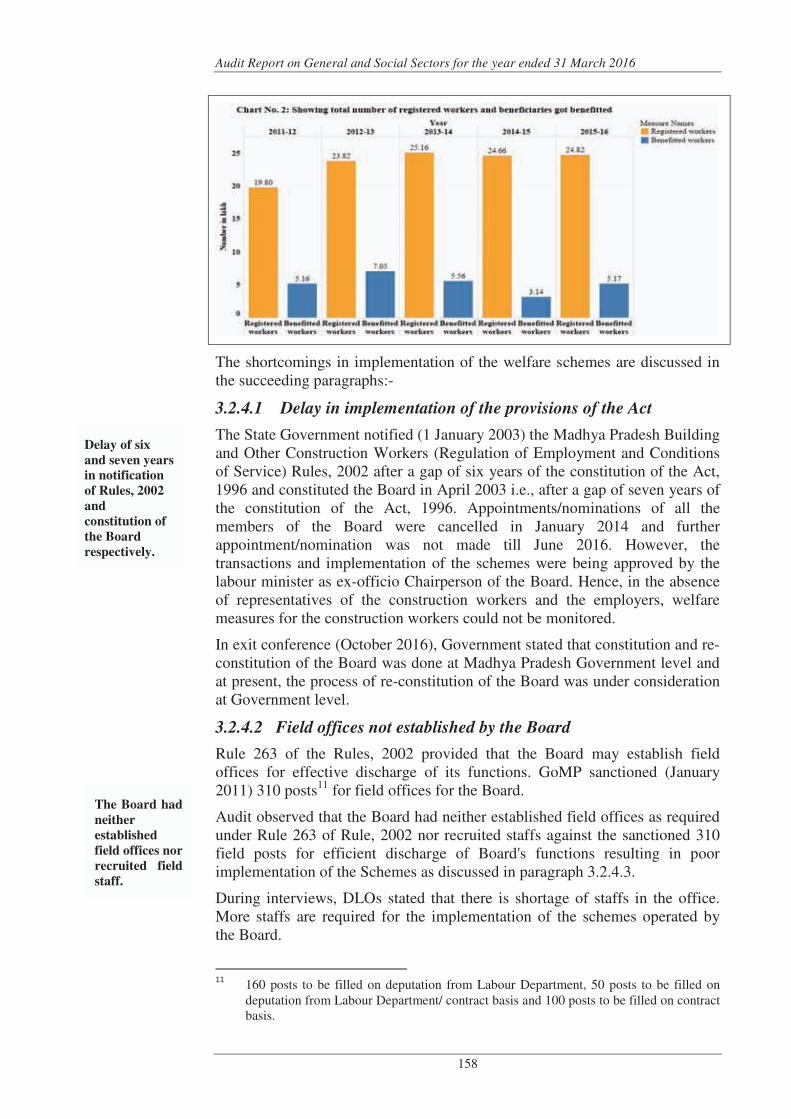
Audit Report on General and Social Sectors for the year ended 31 March 2016
158
The shortcomings in implementation of the welfare schemes are discussed in the succeeding paragraphs:-
3.2.4.1 Delay in implementation of the provisions of the Act
The State Government notified (1 January 2003) the Madhya Pradesh Building and Other Construction Workers (Regulation of Employment and Conditions of Service) Rules, 2002 after a gap of six years of the constitution of the Act, 1996 and constituted the Board in April 2003 i.e., after a gap of seven years of the constitution of the Act, 1996. Appointments/nominations of all the members of the Board were cancelled in January 2014 and further appointment/nomination was not made till June 2016. However, the transactions and implementation of the schemes were being approved by the labour minister as ex-officio Chairperson of the Board. Hence, in the absence of representatives of the construction workers and the employers, welfare measures for the construction workers could not be monitored.
In exit conference (October 2016), Government stated that constitution and re-constitution of the Board was done at Madhya Pradesh Government level and at present, the process of re-constitution of the Board was under consideration at Government level.
3.2.4.2 Field offices not established by the Board
Rule 263 of the Rules, 2002 provided that the Board may establish field offices for effective discharge of its functions. GoMP sanctioned (January 2011) 310 posts11 for field offices for the Board.
Audit observed that the Board had neither established field offices as required under Rule 263 of Rule, 2002 nor recruited staffs against the sanctioned 310 field posts for efficient discharge of Board's functions resulting in poor implementation of the Schemes as discussed in paragraph 3.2.4.3.
During interviews, DLOs stated that there is shortage of staffs in the office. More staffs are required for the implementation of the schemes operated by the Board.
11
160 posts to be filled on deputation from Labour Department, 50 posts to be filled on deputation from Labour Department/ contract basis and 100 posts to be filled on contract basis.
Delay of six
and seven years
in notification
of Rules, 2002
and
constitution of
the Board
respectively.
The Board had
neither
established
field offices nor
recruited field
staff.
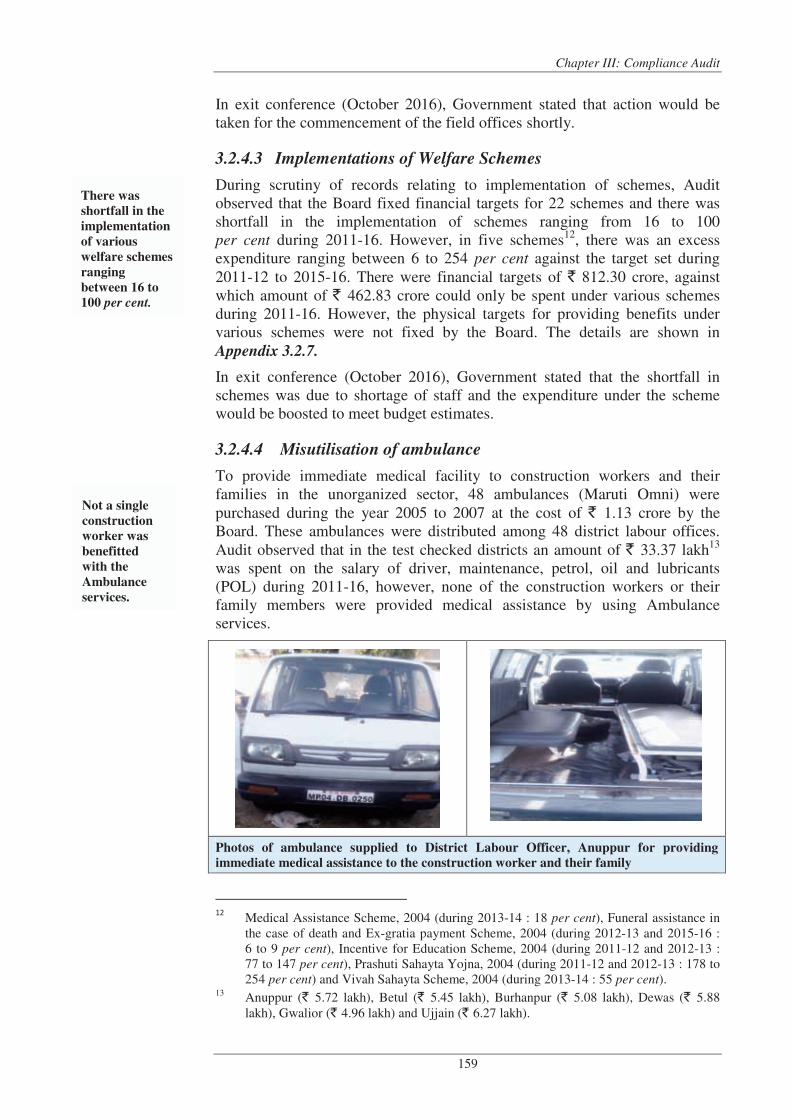
Chapter III: Compliance Audit
159
In exit conference (October 2016), Government stated that action would be taken for the commencement of the field offices shortly.
3.2.4.3 Implementations of Welfare Schemes
During scrutiny of records relating to implementation of schemes, Audit observed that the Board fixed financial targets for 22 schemes and there was shortfall in the implementation of schemes ranging from 16 to 100 per cent during 2011-16. However, in five schemes12, there was an excess expenditure ranging between 6 to 254 per cent against the target set during 2011-12 to 2015-16. There were financial targets of ` 812.30 crore, against which amount of ` 462.83 crore could only be spent under various schemes during 2011-16. However, the physical targets for providing benefits under various schemes were not fixed by the Board. The details are shown in Appendix 3.2.7.
In exit conference (October 2016), Government stated that the shortfall in schemes was due to shortage of staff and the expenditure under the scheme would be boosted to meet budget estimates.
3.2.4.4 Misutilisation of ambulance
To provide immediate medical facility to construction workers and their families in the unorganized sector, 48 ambulances (Maruti Omni) were purchased during the year 2005 to 2007 at the cost of ` 1.13 crore by the Board. These ambulances were distributed among 48 district labour offices. Audit observed that in the test checked districts an amount of ` 33.37 lakh13 was spent on the salary of driver, maintenance, petrol, oil and lubricants (POL) during 2011-16, however, none of the construction workers or their family members were provided medical assistance by using Ambulance services.
Photos of ambulance supplied to District Labour Officer, Anuppur for providing
immediate medical assistance to the construction worker and their family
12 Medical Assistance Scheme, 2004 (during 2013-14 : 18 per cent), Funeral assistance in
the case of death and Ex-gratia payment Scheme, 2004 (during 2012-13 and 2015-16 : 6 to 9 per cent), Incentive for Education Scheme, 2004 (during 2011-12 and 2012-13 : 77 to 147 per cent), Prashuti Sahayta Yojna, 2004 (during 2011-12 and 2012-13 : 178 to 254 per cent) and Vivah Sahayta Scheme, 2004 (during 2013-14 : 55 per cent).
13 Anuppur (` 5.72 lakh), Betul (` 5.45 lakh), Burhanpur (` 5.08 lakh), Dewas (` 5.88 lakh), Gwalior (` 4.96 lakh) and Ujjain (` 6.27 lakh).
There was
shortfall in the
implementation
of various
welfare schemes
ranging
between 16 to
100 per cent.
Not a single
construction
worker was
benefitted
with the
Ambulance
services.
Audit Report on General and Social Sectors for the year ended 31 March 2016
160
In exit conference (October 2016), Government replied that the ambulances were used for publicity and office work and it was under consideration to transfer the ambulances to the health department.
The reply is not acceptable as due to lack of publicity, workers were not aware of ambulance services. Therefore, purpose for which ambulances were purchased could not be fulfilled. It is therefore, suggested to provide a toll free number to workers for availing facility of ambulances.
3.2.4.5 Training under Madhya Pradesh Building and Other
Construction Workers' Skill Training Scheme not delivered
The Board introduced (October 2012) the Madhya Pradesh Building and Other Construction Workers' Skill Training Scheme, 2012 for providing employment by imparting skill training to the building and other construction workers' and their dependents. The training was to be provided by training providers, selected on the basis of technical and financial bid, who were designated as Authorised Training Providers (ATPs) by the National Skill Development Council and Vocational Training Providers by the Technical Education and Skill Development Department. The main objective of the scheme was to provide training to the beneficiaries in a variety of services, business and manufacturing activities as well as in local skills and local crafts, for example, computer fundamental, sales person (retail) and repair and maintenance of cellular phone etc. so that they can set up self-employment ventures or secure salaried employment with enhanced remuneration. The key stakeholders in the scheme were the Board and Labour Department. Activities like identification of potential trainees and their orientation, monitoring and oversight of progress of training etc. were to be carried out by Government department and their agencies and other selected ATPs with the assistance of the Board. Labour Department was responsible for monitoring of training programmes etc. ATPs were expected to carry out different tasks i.e. market survey and assessment, selection of trainees and training etc. As per Scheme guidelines and agreement with training providers, the Board through the local officer of Labour Department was required to make payment of training and other prescribed fees in three stages i.e. 30 per cent of the total payable fee after one month of the admission of the beneficiary, 30 per cent of the total payable fee and certification fee after the successful completion of training by the beneficiary and the balance 40 per cent of the total payable fee was to be paid after the placement of at least 70 per cent of the total admitted beneficiaries for the continuous period of three months.
Audit observed that the Board made agreement with ATPs known as All India Society for Electronics and Computer Technology (AISECT), Skill Ventures Private Limited etc. for providing training to beneficiaries under the scheme. The Board issued work order as targeted to the training providers for 10,200 trainees in selected districts during 2013-16. However, only 1,455 trainees under this period were imparted training and the concerned DLOs paid an amount of ` 21.82 lakh14 (60 per cent of total payable fee and certification fee) for the successful completion of training to the training providers. Further,
14
Anuppur (` 8.23 lakh), Betul (` 2.35 lakh), Burhanpur (` 2.48 lakh), Dewas (` 1.77 lakh), Gwalior (` 2.32 lakh) and Ujjain (` 4.67 lakh).
Vocational
training was not
provided to 8,745
trainees.
Chapter III: Compliance Audit
161
the balance 40 per cent of the total payable fee was not paid to ATPs as the condition of placement of at least 70 per cent of the total admitted beneficiaries for the continuous period of three months could not be fulfilled by the ATPs. Thus, the entire paid amount was unfruitful, as placement for the trainees were not made. Further, 8,745 beneficiaries were not provided training because various functions assigned to the ATPs, were not done by them. The details are shown in Appendix 3.2.8.
In exit conference (October 2016), Government stated that training could not be provided as the recognition of the institutions were revoked by Technical Education and Skill Development Department due to change in trades by Director General of Education and Training. Further, Government stated that officers concerned would be directed to avoid repetition of such incidence.
The reply is not acceptable as it was in notice of the Board that the recognition of the institutions was revoked and the trained beneficiaries could not get employment in the trained trade, still, the Board did not take up effective measures to provide training to the remaining beneficiaries and to provide employment/ self-employment to the trained beneficiaries.
3.2.4.6 Excess payment under Incentive for Education Scheme
Education Assistance (Scholarship) Scheme, 2004 was notified in December 2004 was later renamed as 'Incentive for Education Scheme' as per gazette notification (July 2008). Under the scheme, it was provided that the children or wife, maximum two at a time, of the registered building and other construction worker would apply for incentive, as the student reaches from one class to another, to the principal of the school/college concerned, who would ascertain the amount of incentive to be paid on the basis of prevailing rates15 and prepare list of eligible students after approving the application and send the list to the designated officers of concerned ULBs/PRIs. Further, the designated officers of ULBs/PRIs would re-check the proposal and issue cheques for amount of incentive to the Principal who disburse the amount to the students.
Scrutiny of records of Incentive for Education Scheme revealed that an amount of ` 8.49 lakh was paid to 2,090 students in excess of prevailing rates as notified under the Scheme. It was further noticed that excess payment was made as the amount of incentive was paid at the prevailing rate applied for the class in which the applicant was studying; however, it was to be paid at the rate applied for last passed class.
In exit conference (October 2016), Government accepted that excess amount was paid to the students due to lack of clear instructions with regard to rates. Government, further, replied that district labour officers were instructed to
15 Class 1 to 5 (Boys: ` 500, Girls: ` 750), Class 6 to 8 (Boys: ` 750, Girls ` 1000),
Class 9 to 12 (Boys: ` 1000, Girls: ` 1500), Graduation (Boys: ` 1500, Girls: ` 2000), Post Graduation (Boys: ` 2500, Girls: ` 3000), Graduation level Vocational Courses: (Boys: ` 3000, Girls: ` 4000) and Post Graduation level Vocational Courses or PHD or Research Work after Post Graduation (Boys: ` 4000, Girls: ` 5000) w.e.f. 11.08.2006. However, rates were revised vide Gazette notification dated 13.09.2013 and 01.08.2014.

Audit Report on General and Social Sectors for the year ended 31 March 2016
162
issue instructions to the officers/principals concerned for preventing the same in future.
3.2.4.7 Improper sanction of benefits under Funeral assistance and
Ex-gratia payment in case of death scheme, 2004
The Funeral and Ex-gratia payment in case of death Scheme, 2004, was notified (December 2004) with a view to provide funeral and ex-gratia assistance to the successor of the deceased registered building and construction worker. An amount of ` 3,000/- (w.e.f. July 2014)16 as funeral assistance and amount of ex-gratia was to be paid, on the basis of age of the deceased worker i.e. up to 45 years, ` 75,000/- and from 45 and up to 60 years, ` 25,000/- under the Scheme.
Scrutiny of the records of the Scheme in selected districts revealed that selected offices disbursed ` 3.57 crore during 2011-16 in 1201 claims. Audit test-checked 354 claims of ` 1.15 crore and found irregularities in 61 cases of ` 26.10 lakh. The irregularities found are illustrated below:-
• In 16 cases of Nagar Palika Parishad Sarni (Betul), Labour Office Burhanpur and Nagar Palik Nigam Ujjain, an amount of ` 5.86 lakh were disbursed, however, the death certificates attached with the application were found to be fake on being verified with the issuing authority i.e. Nagar Palika Parishad Sarni (Betul), Nagar Palik Nigam
Burhanpur and Nagar Palik Nigam Ujjain. The details are shown in Appendix 3.2.9.
• In 12 cases of Nagar Palik Nigam Ujjain, records of registration were manipulated to provide undue benefit to the beneficiaries amounting to ` 4.86 lakh.
• In five cases of Nagar Palik Nigam Ujjain, double payment of ` 3.90 lakh was made.
• In 10 cases of Nagar Palik Nigam Ujjain and Janpad Panchayat
Burhanpur, an amount of ` 4.49 lakh17 was disbursed to the deceased who were not registered as building and construction worker with the Board, thus, not entitled to get benefit from the Board's fund.
• In six cases of Nagar Palik Nigam Dewas, Janpad Panchayat
Sonkacch (Dewas) and Nagar Palik Nigam Gwalior, an excess of ` 3.00 lakh18 was disbursed, as the deceased, who were entitled to get ` 25,000, were paid ` 75,000.
• In two cases of Labour Office Burhanpur and Nagar Palik Nigam, Gwalior, an amount of ` 0.53 lakh were disbursed, however, in these cases the deceased were above 60 years of age, therefore, not entitled for benefit.
16
Funeral assistance - `2,000/- and ex-gratia - `25,000/- (18 to 60 years) w.e.f July 2008. 17 Janpad Panchayat, Burhanpur (5 Cases-`2.09 lakh) and Nagar Palik Nigam, Ujjain (5
Cases-`2.40 lakh). 18
Nagar Palik Nigam, Dewas (1 case-` 0.50 lakh), Janpad Panchayat, Sonkacch, Dewas (3 Cases-` 1.50 lakh) and Nagar Palik Nigam, Gwalior (2 Cases-` 1.00 lakh).
Chapter III: Compliance Audit
163
• In three cases of Janpad Panchayat Jaithari, an amount of ` 0.84 lakh was disbursed in cases where the successor of the beneficiary did not submit the application for claim within the stipulated period of three months after the death as envisaged in the Scheme.
• In seven cases of Janpad Panchayat Shahpur (Betul), Labour Office Dewas and Assistant Labour Commissioner Gwalior, an amount of ` 2.62 lakh19 were disbursed to the applicants who did not submit proper documents.
In exit conference (October 2016), Government stated that all DLOs would be instructed not to repeat such errors in future and action as per rule would be initiated.
The reply is not acceptable as the documents produced by the applicant were to be checked by the respective authorities before sanctioning the benefit.
3.2.4.8 Advance not adjusted under Madhya Pradesh Building and
Other Construction Workers' Medical Assistance Scheme
The Madhya Pradesh Building and Other Construction Workers' Medical Assistance Scheme, 2004 was notified in September 2005 to provide medical subsidy for indoor treatment in case of major/critical ailments to the husband/wife and minor children of the registered building and other construction workers. The designated officers for sanctioning of advance may sanction medical advance up to their financial limit20, after obtaining estimated medical expenditure from the hospital and will issue account payee cheque to the respective hospital, while informing this to the registered worker also.
Scrutiny of records of the Scheme in Chief Medical and Health Officer Anuppur and Assistant Labour Commissioner Gwalior revealed that medical advance amounting to ` 32.59 lakh in 41 cases was sanctioned by the appropriate authorities and released to the respective hospitals, however, in 35 cases21 an amount of ` 27.69 lakh was not adjusted even after lapse of three to 56 months. Further, as the offices did not obtain the expenditure vouchers, the utilisation of the amount of advance for the intended purposes could not be ascertained which indicated lack of oversight by the sanctioning authorities. The details are shown in Appendix 3.2.10.
In exit conference (October 2016), Government stated that the concerned officers would be instructed to adjust/recover the unadjusted amount of advance released under the Scheme.
3.2.4.9 Improper Sanction of Marriage Assistance
The Madhya Pradesh Building and Other Construction Workers' (Assistance for Marriage of Daughter of the Beneficiary/ Self Marriage of the Female
19 Janpad Panchayat Shahpur, Betul (3 Cases-` 0.57 lakh), Labour Office, Dewas (2 Cases-
` 1.03 lakh) and Labour Office, Gwalior (2 Cases-` 1.02 lakh) 20 Assistant Labour Commissioner/District Labour Officer up to ` 30,000/-, District
Collector up to ` one lakh, Divisional Commissioner up to ` two lakh and the Secretary of the Board up to ` three lakh.
21 CMHO, Anuppur- 29 cases (` 24.04 lakh), Labour Office, Gwalior – 6 cases (` 3.65 lakh).
Medical
Advance of
` 27.69 lakh in
35 cases was not
adjusted even
after lapse of
three to 56
months.

Audit Report on General and Social Sectors for the year ended 31 March 2016
164
Beneficiary) Scheme, 2004 were notified (September 2005) with a view to provide assistance22for marriage of two daughters of the beneficiary, who had attained 18 years of age at the time of marriage / self-marriage/re-marriage of the female beneficiary. Further, Section 2 (a) of the Prohibition of Child Marriage Act, 2006 provided that child means a person who, if male and female, has not completed 21 and 18 years of age respectively.
During scrutiny of application forms and documents attached having date of birth of bride and bridegroom of sanctioned cases under the Scheme revealed that marriage assistance was paid in 12 cases wherein bride or bridegroom was below the age of 18 or 21 years respectively. Thus, marriage assistance of ` 1.95 lakh was irregularly paid for child marriages as detailed in Appendix 3.2.11.
In exit conference (October 2016), Government stated that all designated offices would be instructed to ensure that the bride and bridegroom must attain 18 and 21 years at the time of marriage.
3.2.4.10 Implementation of Online Portal without standardization
Para 1.5 of Guidelines for Indian Government Websites provides that the Website Quality Certification from Standardization Testing Quality Certification23 (STQC) should be obtained for all the government websites in order to conformity to usable, user-centric and universally accessible websites. The Board issued instructions (September 2013) to all the designated officers that distribution of benefits must be done through the portal of the Board.
During test-check of records, it was observed that portal was hosted in September 2013 without taking the assurance of transparency in operations. The discrepancies as discussed below indicated that the online portal was started without ensuring conformity with enforcement of provisions of schemes/rules and checks to control frauds. The discrepancies found are detailed below:-
• During scrutiny of sanctions issued by the portal under Funeral Assistance in case of Death and Ex-gratia Payment Scheme, 2004, it was found that in three cases, the portal issued sanction of funeral assistance of ` 5,000/- instead of payable amount of ` 3000 under the scheme and in one case the portal issued sanction of ex-gratia ` 75,000, where the deceased was above the age of 45 years and hence entitled for ` 25,000 as per the provisions of the scheme. Thus, the portal was not enabled to check the entitlement of amount to be paid to the beneficiary.
• Test check of records at Nagar Palik Nigam, Gwalior revealed that the portal showed sanction of ` 23,000/- under the Marriage Assistance Scheme while the beneficiary was to be paid ` 25,000.
• Progress report for the month of March 2016 reported the number of registered beneficiaries as 24,81,926 while as per portal number of valid beneficiaries was only 3,62,197 (15 per cent) as the Board had
22 ` 10,000 (w.e.f. May 2011), `15,000 (w.e.f. June 2012) and `25,000 (w.e.f. July 2014). 23 An organization of Department of Information Technology, Government of India.
The Child
marriages were
sanctioned under
Marriage
Assistance
Scheme.
The Board
launched the
portal system for
implementation of
welfare schemes
without necessary
validation checks.
Chapter III: Compliance Audit
165
not prepared online database of all beneficiaries. Therefore, the remaining beneficiaries were not registered in the portal.
• During scrutiny of online sanction it was observed at Janpad
Panchayat, Burhanpur that an online sanction for payment of marriage assistance was issued for 17 years old bride, which indicated absence of validation checks for under aged bride and bride groom.
• Payment in 13 cases of Marriage Assistance in Nagar Palik Nigam, Dewas was pending for three to 14 months because the portal did not release sanction order.
• Due to lack of age validation, registration of a person with 63 years of age, was issued through portal in Janpad Panchayat, Ujjain while as per Section 14 of the Act, 1996 registration of a worker was to be done between 18-60 years. Similarly, in one case, renewal of a registered worker was done for beyond the age of 60 years in Nagar Palik Nigam, Gwalior.
In exit conference (October 2016), Government stated that certificate for online operation of the portal from STQC would shortly be obtained and National Informatics Centre would be informed about the shortcomings and the same would be corrected.
3.2.4.11 Delay in settlement of claims
GoMP Gazette notification (April 2013) provided that benefits under various Schemes i.e. Marriage Assistance, Funeral and Ex-gratia payment in case of death Scheme and Incentive for Education Scheme of the Board was to be provided within the 30 days from the date of application.
Audit observed in Nagar Nigam, Ujjain that 4,064 applications received during 2014-15 and 2015-16 for benefit under Marriage Assistance Scheme, Funeral and Ex-gratia payment in case of Death Scheme, Incentive for Education Scheme and Cash Awards to Meritorious Students Scheme, were pending even after a lapse of two to 16 months. The details are shown in the Table -3.2.6:
Table – 3.2.6: Statement showing the details of pending cases under various schemes
Sl.
No.
Name of the Scheme Period Number of
Pending
Cases
Delay in months
(As of June
2016)
1 Incentive for Education Scheme and Cash Awards to Meritorious Students
2014-15 3657 cases of 16 schools
7 to 15
2 Marriage Assistance 2014-15, 2015-16
376 2 to 16
3 Funeral Assistance 2015-16 31 9 to 12
Total 4064 2 to 16
In exit conference (October 2016), Government stated that instructions to Nagar Nigam, Ujjain had been issued to settle all cases under the different schemes immediately.
4,064
applications of
various welfare
schemes were
pending.

Audit Report on General and Social Sectors for the year ended 31 March 2016
166
3.2.5 Monitoring and evaluation
The State Government in exercise of power conferred under Section 42 (3) of the BOCW Act, 1996 appointed officers of Labour Department as Inspectors for inspection of building and other construction works. Section 46 of BOCW Act provides that an employer shall, at least thirty days before the commencement of any building and other construction works send the written notice to the inspector having jurisdiction in the area. Section 48 of BOCW Act provides for penalty in cases, where an employer fails to give notice of the commencement of building or other construction works. Following shortcomings were observed:
• There were huge shortfall in inspections between 59 to 94 per cent
during 2011-12, 2013-14 and 2014-15 at State level and between 52 to 97 per cent in test checked districts.
In exit conference (October 2016), Government stated that there was shortfall in inspection due to shortage of staff. Inspections would be ensured after preparation of district wise-roster for inspection.
• Labour Commissioner, GoMP issued instructions (August 2013) for collecting information, on monthly basis, of building and construction works from ULBs, PRIs, semi government institutions, government departments, government undertakings and building and other construction works against which the cess was deposited at districts. However, it was found that information on construction works were not collected and, further, the Board had not monitored the instructions of LC to prepare database of construction works. Thus the Board was not aware about the actual number of construction works carried out.
In the exit conference (October 2016), Government stated that the database of construction works would be prepared immediately.
• The amount of cess received by the Board was assessed, collected and remitted to the Board by the Cess Collectors and Assessing Officers of different departments i.e. officers of Labour Department, ULBs, PRIs and construction agencies. Similarly, the welfare schemes for construction workers were implemented through the Labour Department, ULBs and PRIs. It was observed that the Board had no administrative control over these departments, which resulted in short receipt/ realisation of cess and shortcomings or shortfall in implementation of the welfare schemes.
The Secretary of the Board replied (October 2016) that as the Board did not have field offices, therefore, collection of cess/schemes was implemented through offices of different departments. The Board had no administrative control over these offices.
• The Board issued instructions that all cheques/drafts from employers/ Cess Collectors were to be deposited in the District Labour Offices. However, it was observed that Cheques/Drafts were received both at the Board and at the DLOs which leads to lack of monitoring over employers and amount of cess payable and deposited by them.
No mechanism
was evolved for
monitoring and
evaluation
under the
Board's
function and its
activities.
Chapter III: Compliance Audit
167
In exit conference (October 2016), Government stated that effective system for receipt of cheques/drafts would be established.
• Rule 20 and 256 of Madhya Pradesh Building and Other Construction Workers (Regulation of Employment and Conditions of Service) Rules, 2002 provided that the Board should meet once in three months and the State Advisory Committee (SAC) should meet at least once in six months. However, there were shortfall in meetings as only 10 out of 20 meetings of the Board and one out of 10 meetings of SAC took place during 2011-16.
In exit conference (October 2016), Government stated that the Government dissolved all the Boards at the time of election. The Board and State Advisory Committee were still not re-constituted. The meetings would immediately be organized.
• Internal Audit acts as an effective tool in exercising check on expenditure. Internal control systems help in exercising checks on various activities. Thus these are important mechanisms for ensuring smooth working of an organization. Audit scrutiny revealed that the Board had not established internal audit and internal control wing in order to ensure effective control in exercising checks on various activities including finances and monitoring the activities of designated officers for the purpose of collection of cess and expenditure on welfare schemes.
In exit conference (October 2016), Government stated that Internal Audit Wing could not be established due to shortage of staff and action for establishing the same would be taken immediately.
The reply is not acceptable as the inspection work of Madhya Pradesh Buildings and other Construction Works is a mandatory item and for this purpose, the Government should recruit the sufficient staff.
3.2.6 Conclusion and Recommendations
• The Board did not establish mechanism to ensure proper campaign to register the construction workers and establishments.
The Board may consider to liaison with ULBs for registration of establishment
and to have access of their database of building permissions to the respective
DLOs and to facilitate their registration as establishment triggered by grant of
permission. The Board should also prepare an effective mechanism to liaison
with all construction agencies for registration of all establishments to the
respective DLOs and to register the construction workers engaged at the
construction sites.
• The Board did not receive the proceeds of cess. Further, collected cess were delayed transfer to the Board.
The Board should maintain a database of all construction works to watch
proper and timely collection of cess. Cess collectors should be made
accountable for the timely deposit of the cess to the Board.
Internal audit
wing was not
established.
Audit Report on General and Social Sectors for the year ended 31 March 2016
168
• The Cheques/Drafts of cess received from the employers was not realized due to lapse of time validity and bank returns.
The Board should adopt the Electronic Clearing Service (ECS) for proper and
timely collection of cess.
• The Board had operated as many as 23 bank accounts and did not keep statement of transactions. The maintenance of books of accounts and reconciliation was not done.
The Board should keep least number of bank accounts and adopt a proper
accounting and recording system and to ensure that the books of accounts are
reconciled in regular intervals.
• The Board had neither established field offices nor recruited field staff, which resulted in poor implementation of the schemes.
The Board should establish field offices and recruit field staff.
• Payment against the applications for obtaining benefits under Funeral and Ex-gratia Payment in the case of death scheme having fake documents was made.
The applications and enclosures should be verified with the base records and
issuing authorities.
• There was no internal audit wing or mechanism to ensure collection of cess from all the employers.
The Board may establish an internal audit wing to monitor the transactions of
the Board and prescribe returns for cess collectors to ensure collection of cess
from all the employers.
PUBLIC HEALTH AND FAMILY WELFARE
DEPARTMENT
3.3 Audit on ‘108 Ambulance Services’
3.3.1 Introduction
Emergency Medical Service (EMS) is an essential part of the overall healthcare system as it saves lives by providing emergency care immediately.
To develop and operationalise comprehensive emergency services in the State, ‘expression of interest’ was invited in June 2007. Against the advertisement published in newspaper, only Emergency Management and Research Institute (EMRI),
Secunderabad submitted its proposal for establishing ‘Emergency Response System’ in the State. The proposal was sanctioned by the Cabinet and a Memorandum of Understanding (MoU) for ‘108 Ambulance Services’ was
Chapter III: Compliance Audit
169
signed between the State Government and EMRI24in November 2007 which was valid for 10 years. The objectives of this ‘Public Private Partnership’ (PPP) project were:
(i) to develop an integrated emergency management setup to cater all kinds of emergencies in the State and coordinate responses with multiple agencies like Police, Fire and Medical in order to ensure timely, reliable, qualitative and comprehensive emergency management services across the State; and
(ii) to develop the appropriate institutional and infrastructure setup to support these emergency management service initiatives and/or coordinate with the existing setups to effectively ensure the delivery of the services.
The audit objectives were to assess whether the project plans prepared by the Department were executed properly, fund distribution and utilisation of funds were adequate and effective, project was implemented in accordance with the prescribed MoU/guidelines and in an effective manner, process of management of ambulances and performance was effective and internal control was adequate and working effectively.
Eight districts25 (15 per cent of total fifty one districts in the State) were selected by using the ‘Probability Proportional to Size without Replacement Method’ for coverage in audit on ‘108 Ambulance services’. Records of the Mission Director, National Health Mission (NHM) and ‘108 Ambulances’ of eight selected districts were examined and information was collected from ‘108 Ambulances’ (Advance Life Support). The Real Time Data26 received from the GVK EMRI was analysed in order to assess extent of achievement of performance parameters against the norms mentioned in the MoU. The audit was conducted covering the period from inception of the project to 2015-16.
The Entry Conference was held with the Commissioner, Health (Public Health and Family Welfare Department) on 11 March 2016. The Exit Conference was held with the Principal Secretary, Public Health and Family Welfare Department on 14 October 2016. The replies of the Department have been suitably incorporated in the report.
Audit Findings
Under the MoU, State Government’s obligations were:
• to provide ambulances duly insured and equipped as mutually agreed upon;
• to provide funds in advance for capital expenditure (Capex) and operational expenditure (Opex); and
• to allocate land for setting up the Emergency Response Service Centre etc.
24
The name of EMRI was changed to GVK EMRI in May 2009. 25 Ashoknagar, Burhanpur, Dhar, Jabalpur, Morena, Rewa, Sehore and Singrauli. 26 Real Time Data indicating the number of vehicles on road/off road, number of
emergencies attended/transported to hospitals etc. was to be maintained by the GVK EMRI.
Audit Report on General and Social Sectors for the year ended 31 March 2016
170
Whereas GVK EMRI’s obligations were:
• to operate the Emergency Response Services (ERS) and provide emergency response service on a 24 hours per day and 365 days a year basis;
• to maintain all the account books and records for the funds received by it from the State Government under ERS;
• to adhere to the agreed service parameters for providing pre hospital care; and
• to recruit, position and train required human resources to support the ERS and provide the emergency response services etc.
The Government of Madhya Pradesh administers and monitors the ‘108 Ambulance’ project through Mission Director, NHM. A special officer has also been appointed for monitoring ‘108 Ambulance Services’ who works under the overall supervision of Mission Director, NHM. To review the performance/implementation reports of ‘108 Ambulance Services’, an Advisory Council under the chairmanship of the Chief Secretary and to govern all aspects of ‘108 Ambulance Services’, an Executive Committee under the chairmanship of the Principal Secretary, Public Health & Family Welfare has been constituted. Health Services are managed and controlled by Chief Medical & Health Officer at district level and Civil Surgeon (CS) cum Chief Hospital Superintendent at district hospital.
GVK EMRI monitors the programme through Head of Operations appointed for the State. All functional heads of GVK EMRI in the State report to him and work under his overall supervision. Overall control of ‘108 Ambulances Services’ is managed through Call Centre established at Bhopal, which is managed by GVK EMRI. Under the project, two kinds of ambulances ‘Advance Life Support (ALS) Ambulances’ and ‘Basic Life Support (BLS) Ambulances’ were deployed. ALS ambulances were deployed at district headquarters and equipped with medical equipments viz. ventilator, multipara monitor, laryngoscope etc.
3.3.2 Project Planning
Under MoU for the project, State Government agreed to recognise EMRI as the State Level Nodal Agency to provide emergency response services across the State and expand it across the whole State within a period of three years. Audit noticed that ‘108 Ambulance Services’ started in July 2009 with 36 ambulances. Against the planned 700 ambulances, only 55 ambulances could be made operational in four districts27 by the end of March 2010.
Due to failure to adhere to timeline prescribed for expansion of project and delay in procurement process, project could not be expanded across the entire State within the prescribed period, i.e. by the year 2010. ‘108 Ambulance Services’ could cover the entire State only by 2013-14. However, against the
27 Bhopal, Gwalior, Indore and Jabalpur.
Project could
not be expanded
across the entire
State within the
prescribed
period.
Chapter III: Compliance Audit
171
planned 700 ambulances, only a fleet of 606 ambulances were running across 51 districts in the State.
While accepting the facts during the Exit Conference (October 2016), Department stated that the process was delayed due to delay in tendering for procurement of ambulances.
3.3.2.1 Deficiencies in MoU
The Project was sanctioned by Cabinet and MoU was signed between the State Government and EMRI in November 2007. The MoU was revised in December 2012. Following deficiencies were noticed in the MoU:
• MoU did not provide for obtaining ‘Earnest Money Deposit’ and ‘Performance Security’ from the service provider, which was in violation of the norms of General Financial Rules. Further, penalty clause was not included for failure in achieving operational/performance parameters. As a result, there was no deduction from Opex in cases of under achievement of performance indicators, as mentioned in paragraphs 3.3.5.3 and 3.3.5.4.
• As per letter of invitation issued by the Department, the proposal was to be valid for a period of five year from the date of signing of MoU. However, the MoU was signed for 10 years.
• State Government did not allocate 15-20 acres of land for setting up the emergency response services as required under MoU. Therefore, emergency response services (Call Centre) were being provided from rental building, which resulted in intended objective ‘to develop the appropriate institutional and infrastructure setup to support these emergency management services’ not being fulfilled.
Department stated (October 2016) that penalty clause was not included in the MoU for not achieving performance parameters. However, for the coming period, the Department had decided to issue a fresh tender in which several penalty provisions had been added for not achieving performance parameters.
The reply is not acceptable, as failure of Department to include the provisions of earnest money deposit, performance security and penalty clause in the MoU was in violation of Financial Rules.
3.3.3 Funding Pattern and Financial Management
3.3.3.1 Release of fund and expenditure
As per MoU, all directly identifiable Capex relating to Operations would be borne by the State Government. The Capex would be mainly for the purpose of procurement of ambulance, fabrication, medical equipment, computer hardware, licenses, training equipment and ambulance related expenditure. The State Government also agreed to pay Opex, which comprises salaries, fuel, repairs & maintenance, vehicle refurbishments, medical consumables, communication, administration expenses, training expenses etc. Opex released by State Government was to be deposited into the bank account maintained exclusively for the purpose and expenditure was to be made from there. Besides, MoU provided that all account books and records for funds received
Penalty clause
was not
included for
failure in
achieving
operational/per
formance
parameters.
Audit Report on General and Social Sectors for the year ended 31 March 2016
172
from State Government under Emergency Response Services (ERS) were to be maintained by the GVK EMRI and monthly/quarterly/annual statement of receipt and expenditure and Utilisation Certificates (UCs) were also to be submitted by the GVK EMRI.
Audit scrutiny revealed that UCs and statement of expenditure were not submitted timely and the funds were released on ad-hoc basis without assessing the actual requirement. The Department released further funds to operating agency despite availability of funds28 at the close of each year during 2007-08 to 2015-16. The details of year-wise fund distribution, expenditure and unspent balance are given in Appendix 3.3.1.
Despite availability of one bank account (in Axis Bank), GVK EMRI opened another bank account (State Bank of India) in 2009-10. The opening of another bank account was in violation of MoU provision. Further scrutiny revealed that an amount of ` 16.85 lakh (Axis Bank - ` 13.81 lakh and SBI bank - ` 3.04 lakh) was lying unspent in these bank accounts at the end of March 2016.
Department stated (October 2016) that funds were always issued after assessing actual requirement. The Department further stated that unutilised grants were there only in some periods. Moreover, unutilised grant of previous period was carried forward and accounted for in subsequent period.
The reply is not acceptable, as releases to EMRI were not based on quarterly UCs and significant balances upto ` 3.58 crore was available with the operating agency.
3.3.3.2 Irregularities in utilisation of capital and operational funds
As per MoU, the funds in respect of Opex shall be released quarterly in advance. The quantum of release of funds for the next quarter shall depend on the expenditure incurred in the previous to the ongoing quarter and estimates for next quarters (release shall be based on actual and subject to the ceiling mentioned in the MoU) and submission of certified copies of Statement of Expenditure (SOEs) and UCs.
Scrutiny of records revealed that in total ` 16.60 crore (including Capex of ` 6.32 crore) was released during 2007-09, out of which expenditure of ` 11.32 crore was incurred by EMRI. The ‘108 Ambulance Services’ were started from July 2009. Due to delay in starting of ambulance services, operational cost released was used on capital activities viz. computer hardware, software, furniture, fixtures, office equipments, medical equipment, electrical and electronic assets etc.
In first MoU (2007), no norm for operational expenditure per ambulance per month was fixed, which resulted in higher average monthly per ambulance operational expenditure of ` 1.32 lakh and ` 1.23 lakh in the year 2009-10 and 2010-11 respectively. In the revised/modified MoU (2012), maximum operational expenditure per ambulance per month was fixed as ` 0.98 lakh.
28
2007-08 ` 52.47 lakh, 2008-09 ` 1.50 lakh, 2009-10 ` 2.32 crore, 2010-11 ` 74.15 lakh, 2011-12 ` 95.48 lakh, 2012-13 ` 2.02 crore, 2013-14 ` 3.58 crore and 2014-15 ` 1.51 crore.
Chapter III: Compliance Audit
173
Against the prescribed limit ` 0.98 lakh, excess expenditure of ` 0.06 lakh to ` 0.18 lakh (monthly) was incurred during 2012-13 (January to March) to 2014-15. Thus, excess payment of ` 5.02 crore was made to the operating agency as the operational expenditure during 2012-13 to 2014-15. Approval of this excess payment from the executive committee was not found on records. The details are shown in Appendix 3.3.2. The deficiencies found in utilisation of capital and operational funds are discussed below:
• During scrutiny of records, it was noticed that against the total release of ` 16.60 crore (` 4.00 crore in 2007-08 and ` 12.60 crore in 2008-09), operational expenditure of ` 4.65 crore29 was incurred during 2007-09 (June 2009) whereas the firm started its services with 36 ambulances only from July 2009.
On this being pointed out, GVK EMRI replied (April 2015) that tendering process for purchase of ambulances was completed by September 2008 and thereafter recruitment and 52 days training for ambulance staff was imparted. The agency was ready for launch by 6 January 2009 and letter was sent to Government for seeking permission for launch. However, the date was finally decided by the Government as 16 July 2009.
The reasons due to which Government took six months in deciding the date of launch for ambulance services was not available in the records produced to audit. Thus, the expenses of ` 1.23 crore made during the pre-launch period (January 2009 to June 2009) on operational activities was unfruitful.
• In the Schedule-A of the revised/modified MoU (December 2012), maximum operational expenditure per ambulance per month was fixed as ` 0.98 lakh including ` 0.57 lakh on salary (Human Resource Expenses), ` 0.227 lakh on fuel cost and ` 0.026 lakh on repair and maintenance of ambulances. Justification for fixing maximum operational expenditure per ambulance including expenses on human resource was not found on record. Audit observed that against the prescribed expenditure of ` 0.57 lakh per ambulance per month on human resources, actual expenditure ranged from ` 0.44 lakh to ` 0.54 lakh during 2012 to 2015 as there was shortfall in availability of staff against required posts as mentioned in paragraph 3.3.5.5. The savings on salary amounting to ` 23.42 crore was utilised on meeting excess expenditure on other activities/components viz. fuel cost, repair and maintenance etc. during 2013-14 to 2015-16. The details are shown in Appendix 3.3.3.
Department stated (October 2016) that during 2012-13, higher operational expenditure per ambulance incurred mainly due to lower number of ambulances operated during the year, higher fuel prices etc. During 2014-15, actual expenditure exceeded the limit prescribed for that permission of Executive Committee was taken. The Department further stated that till March 2009, some staff was recruited and hence salaries and other initial operational expenditure were incurred during these two years. Also, funds to the tune of ` 3.11 crore were utilised towards Capex.
29
2007-08: ` 1.01 crore, 2008-09: ` 3.13 crore and 2009-10: ` 0.51 crore.
Excess payment
of `̀̀̀ 5.02 crore
was made to the
operating agency
as the
operational
expenditure
during 2012-15.
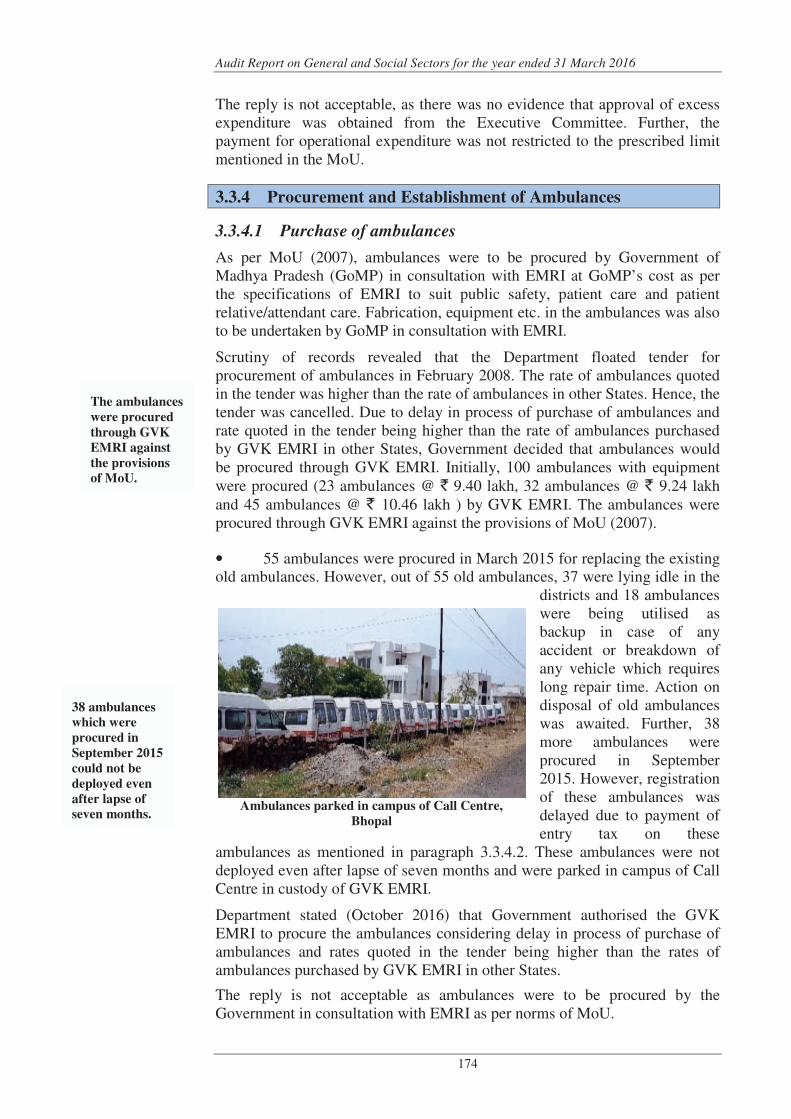
Audit Report on General and Social Sectors for the year ended 31 March 2016
174
The reply is not acceptable, as there was no evidence that approval of excess expenditure was obtained from the Executive Committee. Further, the payment for operational expenditure was not restricted to the prescribed limit mentioned in the MoU.
3.3.4 Procurement and Establishment of Ambulances
3.3.4.1 Purchase of ambulances
As per MoU (2007), ambulances were to be procured by Government of Madhya Pradesh (GoMP) in consultation with EMRI at GoMP’s cost as per the specifications of EMRI to suit public safety, patient care and patient relative/attendant care. Fabrication, equipment etc. in the ambulances was also to be undertaken by GoMP in consultation with EMRI.
Scrutiny of records revealed that the Department floated tender for procurement of ambulances in February 2008. The rate of ambulances quoted in the tender was higher than the rate of ambulances in other States. Hence, the tender was cancelled. Due to delay in process of purchase of ambulances and rate quoted in the tender being higher than the rate of ambulances purchased by GVK EMRI in other States, Government decided that ambulances would be procured through GVK EMRI. Initially, 100 ambulances with equipment were procured (23 ambulances @ ` 9.40 lakh, 32 ambulances @ ` 9.24 lakh and 45 ambulances @ ` 10.46 lakh ) by GVK EMRI. The ambulances were procured through GVK EMRI against the provisions of MoU (2007).
• 55 ambulances were procured in March 2015 for replacing the existing old ambulances. However, out of 55 old ambulances, 37 were lying idle in the
districts and 18 ambulances were being utilised as backup in case of any accident or breakdown of any vehicle which requires long repair time. Action on disposal of old ambulances was awaited. Further, 38 more ambulances were procured in September 2015. However, registration of these ambulances was delayed due to payment of entry tax on these
ambulances as mentioned in paragraph 3.3.4.2. These ambulances were not deployed even after lapse of seven months and were parked in campus of Call Centre in custody of GVK EMRI.
Department stated (October 2016) that Government authorised the GVK EMRI to procure the ambulances considering delay in process of purchase of ambulances and rates quoted in the tender being higher than the rates of ambulances purchased by GVK EMRI in other States.
The reply is not acceptable as ambulances were to be procured by the Government in consultation with EMRI as per norms of MoU.
Ambulances parked in campus of Call Centre,
Bhopal
38 ambulances
which were
procured in
September 2015
could not be
deployed even
after lapse of
seven months.
The ambulances
were procured
through GVK
EMRI against
the provisions
of MoU.
Chapter III: Compliance Audit
175
3.3.4.2 Entry tax on ambulances
As per rule 1976-Sec. 3-A (Sec.3-A inserted by Entry Tax (Amendment) Act, 1999 w.e.f 1.5.99) of Entry Tax on Motor Vehicles, an entry tax was payable on motor vehicle purchased outside the State but was being registered in the State of Madhya Pradesh under the Motor Vehicles Act, 1988.
Scrutiny of records revealed that 150 Tata Winger ambulances were procured in 2013 costing ` 9.61 crore from Tata Motors Limited, Pune by the Department. On the instruction of the Department, GVK EMRI deposited 10 per cent entry tax amounting to ` 96.47 lakh on these vehicles in June 2013 from available fund and booked it as capital expenditure.
Similarly, 38 ambulances were procured from Tata Motors through Directorate General of Supplies & Disposals (DGS&D) in 2015-16. Due to billing from out of State, 10 per cent entry tax was levied. A letter was sent to the Commissioner, Commercial Tax Department (December 2015) for getting exemption from payment of entry tax. However, exemption was denied by the Commercial Tax Department (December 2015). Further, a letter was issued (January 2015) to the supplying agency for providing bills from its office located in Madhya Pradesh. However, the agency denied the request. Afterwards, approval for payment of entry tax was taken and finally entry tax of ` 28.12 lakh was paid in February 2016.
However, prior to this, no entry tax was levied on 55 ambulances which were procured and billed from Tata Motors, Indore in March 2015. Hence, avoidable expenditure of ` 1.25 crore was incurred on purchase of ambulances. Had the ambulances been procured and billed from within the State of Madhya Pradesh, no entry tax would have been leviable.
Department stated (October 2016) that in March 2015, for Purchase of 55 Tata Winger ambulances, order was issued to DGS&D and payment was made to them. DGS&D further endorsed the order to supplier agency and billing was done by the agency from Indore located office of Tata Motors, whereas for purchase of 38 Tata Winger vehicles, same process was adopted by the Department, but billing was done by the supplier agency from Pune. Due to which entry tax of ` 28.12 lakh was paid in February 2016.
The reply is not acceptable, as supply of ambulances could have been taken from agency of Tata Motors in Madhya Pradesh as was done earlier in order to avoid the payment of entry tax.
3.3.4.3 Deployment of Ambulances
As per MoU of 2007, 700 ambulances were planned to be deployed across the State in phased manner but no norms were fixed in the MoU for deployment of ambulances. However, the Department assessed the requirement of ambulances taking into consideration the norm of deploying one ambulance per lakh population. Accordingly, 726 ambulances were required to cover the entire State population (7.26 crore as per census 2011) against which 606 ambulances were deployed by 2014-15. As per population criteria for deploying ambulances, 17 per cent State population was yet to be covered.
Audit Report on General and Social Sectors for the year ended 31 March 2016
176
Audit observed that fewer ambulances were deployed in 16 districts as required against the population norm and despite excessive response time in these districts, additional ambulances were not put into service. The details are shown in Appendix 3.3.4. However, in eight districts30, the number of ambulances functioning were above the prescribed norms. Despite ambulances being deployed over and above population norms, response time was less than optimal in five31 out of these eight districts. Details of response time of ambulances and attending average emergencies per ambulance per day are mentioned in paragraphs 3.3.5.2 and 3.3.5.4 respectively.
Department stated (October 2016) that population norm was not the only indicator for deployment of ambulances. Demand for ambulances by people in that particular area, geographical condition, distance between ambulances, availability of medical facilities and other patient transportation facility etc. were also indicators for deployment of ambulances. In regard to districts having fewer ambulances despite having excessive response time, the Department stated that some districts had hilly terrain, forest areas and poor road conditions which increased response time. Besides, the Department also stated that the response time in these districts was only slightly higher than the permissible limit. In respect of districts having excessive response time despite having excess ambulances, the Department did not submit any specific reply.
The reply does not specify as how response time is going to be brought down to acceptable level in various districts especially in those districts having more ambulances than required against population norms. No analysis appears to have been undertaken to identify the gaps because of which ambulances were not reaching within time. Besides, no document produced in support of reply that deployment of ambulances were done taking into consideration not only population norm but also other factors viz. demand for ambulances by people in that particular area, geographical condition, distance between ambulances, availability of medical facilities etc.
As regards districts having fewer ambulances despite having excessive response time, the reply of the Department is not acceptable as required number of ambulances as per population norm was not deployed in these districts resulting in response time being much more.
3.3.5 Ambulance Service Management
3.3.5.1 Performance of Ambulances
EMRI agreed to operate the ambulances and ensure that ambulance services would be available on a 24 hours per day and 365 days a year basis to all the people of State for providing the emergency health transportation services free of any charges.
During scrutiny of data of total emergencies since launching of the project, audit observed that only 32 per cent services were provided since launching of the project to March 2013 and 68 per cent ambulance services were provided
30
Alirajpur-1, Anuppur-3, Datia-2, Dindori-1, Harda-1, Rewa-9, Sehore-2 and Umaria-3. 31 Anuppur, Datia, Dindori, Rewa and Umaria.
Fewer
ambulances
were deployed
in 16 districts as
required against
the population
norm.
Chapter III: Compliance Audit
177
during 2013-14 to 2015-16. Evidently, primary progress of the project was slow. The ambulances were mostly deployed in attending pregnancy related cases which was up to 49 per cent of total medical emergencies during 2013-16. Hence, intended purpose of ‘108 Ambulance Services’ for providing emergency services within golden hours (within the first hour of injury) was diverted. The details of emergency services provided by the ‘108 Ambulances’ are given in Appendix 3.3.5.
Department stated (October 2016) that ‘108 Ambulance’ service was provided to pregnancy related cases in compliance of objectives mentioned in the MoU.
The reply is not acceptable as ‘Janani Express32’ vehicles are deployed in the districts for carrying pregnant mothers and ‘108 Ambulances’ are to be mainly used for carrying emergency cases. There was no convergence between these two ambulance services provided in the State.
3.3.5.2 Response time of ambulances
The MoU (December 2012) provides average time taken to reach the scene after the call in rural areas (20-30 minutes) and urban areas (15-20 minutes). ‘108 Ambulances’ should respond to call and reach at the required spot within the prescribed time.
During scrutiny of Management Information System (MIS) report, the actual response time was found more than the prescribed time in 33, 21 and 27 districts in the years 2013-14, 2014-15 and 2015-16 respectively. The details are given in Appendix 3.3.6. In district Singrauli, actual response time was up to 40 minutes during 2013-14 and 2014-15 which was much more than the prescribed time while in other districts viz. Ashoknagar, Dindori, Mandsaur, Rewa, Satna, Shivpuri and Sidhi, response time was excess on a regular basis.
As regards average time taken to reach the scene after the call in rural areas and urban areas, real time data (From ‘call received time’ to ‘back to base time’ of ambulances) was provided by the operating agency to audit only for January 2016 to March 2016. During scrutiny of this data, it was found that response time was more than 30 minutes in almost 56 per cent cases33 during this period. In January, February and March 2016, the mean response time was 41:08 minutes, 42:11 minutes and 47:00 minutes respectively. In absence of real time data, patient wise response time could not be ascertained. Excessive response time of test-checked districts are shown in the Appendix 3.3.7.
In reply to excessive response time, EME/EMT/Pilots in sampled districts stated that response time was more than prescribed norms due to poor road conditions, areas being rural and some vehicles being engaged in carrying referred cases.
Department stated (October 2016) that average response time was determined for all ambulances operational in whole State and not for each district. In some
32
940 Janani Express vehicles are being operated in total 313 blocks of the State. 33
January 2016: response time was more than 30 minutes in 46251 cases out of total 83063 cases, February 2016: response time was more than 30 minutes in 44309 cases out of total 78968 cases, March 2016: response time was more than 30 minutes in 48506 cases out of total 85748 cases.
Ambulances
were mostly
deployed in
attending
pregnancy
related work i.e.
up to 49 per cent
of total medical
emergencies
during 2013-16.
Response time of
ambulances was
excess on a
regular basis in
many districts.
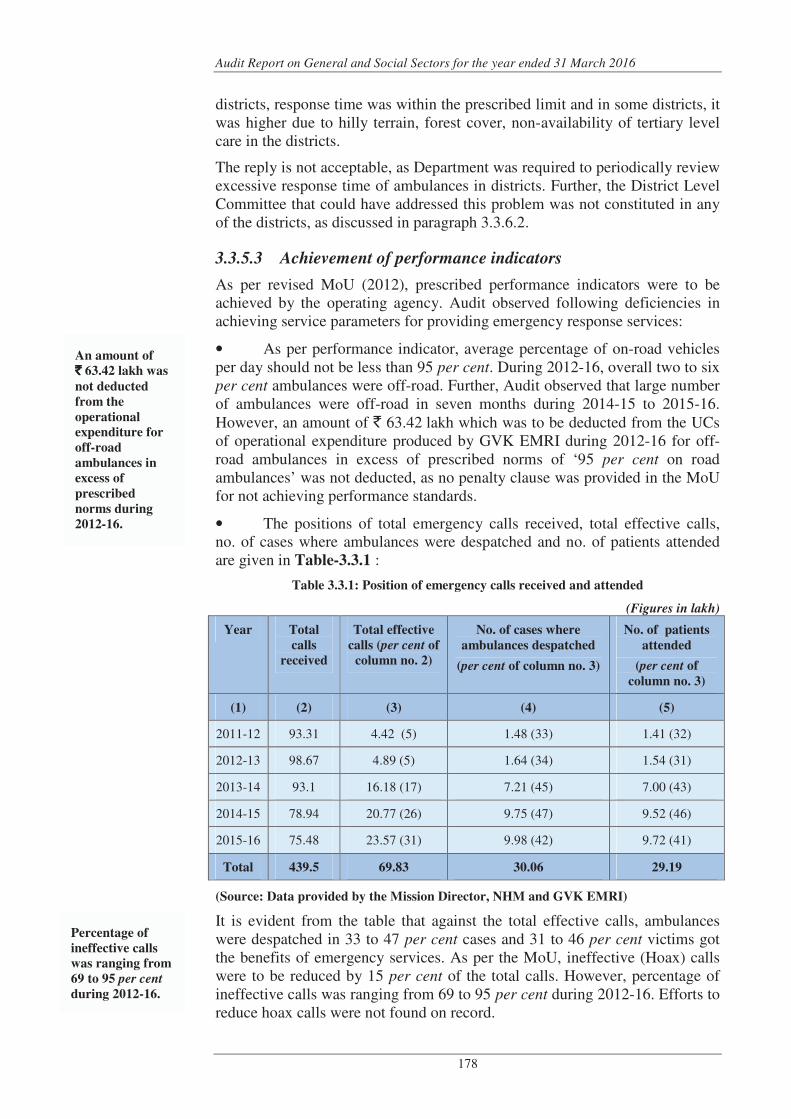
Audit Report on General and Social Sectors for the year ended 31 March 2016
178
districts, response time was within the prescribed limit and in some districts, it was higher due to hilly terrain, forest cover, non-availability of tertiary level care in the districts.
The reply is not acceptable, as Department was required to periodically review excessive response time of ambulances in districts. Further, the District Level Committee that could have addressed this problem was not constituted in any of the districts, as discussed in paragraph 3.3.6.2.
3.3.5.3 Achievement of performance indicators
As per revised MoU (2012), prescribed performance indicators were to be achieved by the operating agency. Audit observed following deficiencies in achieving service parameters for providing emergency response services:
• As per performance indicator, average percentage of on-road vehicles per day should not be less than 95 per cent. During 2012-16, overall two to six per cent ambulances were off-road. Further, Audit observed that large number of ambulances were off-road in seven months during 2014-15 to 2015-16. However, an amount of ` 63.42 lakh which was to be deducted from the UCs of operational expenditure produced by GVK EMRI during 2012-16 for off-road ambulances in excess of prescribed norms of ‘95 per cent on road ambulances’ was not deducted, as no penalty clause was provided in the MoU for not achieving performance standards.
• The positions of total emergency calls received, total effective calls, no. of cases where ambulances were despatched and no. of patients attended are given in Table-3.3.1 :
Table 3.3.1: Position of emergency calls received and attended
(Figures in lakh)
Year Total
calls
received
Total effective
calls (per cent of
column no. 2)
No. of cases where
ambulances despatched
(per cent of column no. 3)
No. of patients
attended
(per cent of
column no. 3)
(1) (2) (3) (4) (5)
2011-12 93.31 4.42 (5) 1.48 (33) 1.41 (32)
2012-13 98.67 4.89 (5) 1.64 (34) 1.54 (31)
2013-14 93.1 16.18 (17) 7.21 (45) 7.00 (43)
2014-15 78.94 20.77 (26) 9.75 (47) 9.52 (46)
2015-16 75.48 23.57 (31) 9.98 (42) 9.72 (41)
Total 439.5 69.83 30.06 29.19
(Source: Data provided by the Mission Director, NHM and GVK EMRI)
It is evident from the table that against the total effective calls, ambulances were despatched in 33 to 47 per cent cases and 31 to 46 per cent victims got the benefits of emergency services. As per the MoU, ineffective (Hoax) calls were to be reduced by 15 per cent of the total calls. However, percentage of ineffective calls was ranging from 69 to 95 per cent during 2012-16. Efforts to reduce hoax calls were not found on record.
An amount of
`̀̀̀ 63.42 lakh was
not deducted
from the
operational
expenditure for
off-road
ambulances in
excess of
prescribed
norms during
2012-16.
Percentage of
ineffective calls
was ranging from
69 to 95 per cent
during 2012-16.
Chapter III: Compliance Audit
179
Before 2013-14, no Automatic Vehicle Location Tracking (AVLT) was installed in ambulances. Out of total 606 ambulances in which AVLT was installed in 2014-15, it was functional in 344 ambulances. Besides, 107 AVLTs were physically damaged, 148 were faulty and seven were stolen. Due to absence of AVLT device, tracking of such ambulances could not be done. Thus, the objective of establishing AVLT was not fulfilled.
Department stated (October 2016) that some ambulances were more than five years old due to which they were off-road for maintenance & repair in seven months during 2014-15 to 2015-16. The Department further stated that ineffective calls were dependent on the callers. However, district level and State level awareness was being created for calling ‘108 Ambulances’. The Department further stated that effective calls included inquiry calls, testing calls, complaints and follow-up calls etc. by beneficiaries that is why the ‘ambulance despatch’ is less in comparison to total effective calls.
The reply is not acceptable as funds should be released on actual running of vehicles. In case of off- road vehicles, more than five per cent vehicles were off road and penalty should have been imposed in those cases. Besides, reply in regard to less ‘ambulance despatch’ was not supported by the figures of inquiry calls, testing calls, complaints and follow-up calls out of total effective calls.
3.3.5.4 Penalty on operating agency
In the revised MoU (2012), a maximum operational expenditure of ` 0.98 lakh was fixed per ambulance per month which was revised as ` 1.03 lakh from the year 2015-16. The penalty clause was not included in the MoU in case of non-achievement of operational/performance parameters.
The details of not achieving performance parameters of attending average number of emergencies per ambulance per day are given in Table 3.3.2.
Table 3.3.2: Emergencies attended per ambulance per day
(` ` ` ` in crore)
Year Average no.
of
ambulances
running
(per month)
Operatio
nal cost
(As per
EMRI)
Targeted no. of
emergencies to
be attended
per ambulance
per day
Achieve
ment
Short
fall
Penalty ( in
proportion of
shortfall)
2012-13 124 17.35 4.2 3.8 0.4 1.65
2013-14 531 56.87 4.2 3.8 0.4 5.42
Total 7.07
(Source: MoU and Performance Indicators)
Audit observed that during the year 2007-08 to 2011-12, no performance indicator was decided. In the revised MoU (2012), benchmarks of performance indicators were included. Against the prescribed parameter of 4.2 ‘average number of emergencies to be attended per ambulance per day’, achievement was found short over the years. In proportion of this shortfall in achievement of parameter, deduction of ` 7.07 crore was not made from UCs of the operating agency before making adjustment.
Against the
shortfall in
attending
emergencies,
deduction of
`̀̀̀ 58.14 lakh was
not made from
UCs of the
operating agency.
Audit Report on General and Social Sectors for the year ended 31 March 2016
180
During test-check of data of availed cases of September to November 2015, it was found that ambulances in 27 districts could not achieve the prescribed norm of attending 4.2 emergencies per ambulance per day. However, proportionate deduction of ` 58.14 lakh against this shortfall was not made from UCs of the operating agency before making adjustment.
Department stated (October 2016) that performance parameter was set on average emergency cases handled by all ambulances and not for each ambulance or each district.
The reply is not acceptable as norms prescribed in the MoU for attending ‘average number of emergencies per ambulance per day’ was not achieved at State level as a whole.
3.3.5.5 Inadequate manpower
MoU provides that operating agency may avail/recruit the staff and provide emergency response services through well trained personnel and ensure that at least one pilot and one Emergency Medical Technician (EMT) is available 24X7 and 365 days in every ambulance to provide pre-hospital care during the emergency transportation.
Audit observed that against the required 1455 posts each in the cadre of EMT and Pilot, 1381 EMTs and 1397 Pilots were deployed in ‘108 Ambulances’ in the State. Against the required posts (field operation and support staff), vacancies were ranging from four to 11 per cent as on July 2015. Updated status of staff was not provided. At call centre, 50 per cent shortage was seen in Emergency Response Centre Physician (ERCP)-care. Due to this, line of ERCP was found mostly busy and beneficiaries were deprived of getting ERCP advices as pre hospital care during the emergency transportation. Audit did not see any documentary efforts to increase ERCP lines.
Department stated (October 2016) that per ambulance available staff34 was 2.28 for EMTs and 2.30 for Pilots. The Department further stated that minimum requirement of per ambulance staff is two each for EMTs and Pilots. Additional 0.3 staff per ambulance is required for weekly off and leave management of each ambulance.
The reply is not acceptable, as staff were not deployed as required.
3.3.5.6 Discrepancies in implementation of ambulance services
In the test checked districts, audit observed the following discrepancies in the implementation of ‘108 Ambulance Services’:
• Some life saver kits, medical equipment, medical supplies and equipment attachments viz. Malleable Splints, Glucometer, Diclofenac Sodium (Injection), Thermometer Attachment etc. were not available/not working in the test-checked ambulances.
• EMTs were posted in ambulances to provide en route pre-hospital care. For the better use of machinery/equipment, refresher training was required to
34
The manpower ratio means total number of Pilots and EMTs posted on the ambulances divided by the total number of ambulances deployed in the State.
Against the
required posts,
vacancies were
ranging from
four to 11
per cent as on
July 2015.
Chapter III: Compliance Audit
181
be provided to EMTs. It was found that en route pre hospital care was not provided on the advice of ERCP in most of the cases in test-checked ambulances. Thus, EMTs worked as only load and go.
• Different types of patients are transported by the ambulance. For the cleanliness of ambulances, only Clean & Sept tablets were used and patients were transported. The deployed staff cleaned the ambulances themselves. For the cleanliness of ambulances, neither the Department nor the firm took any appropriate action. For proper and regular cleaning of ambulances, separate arrangement was not made by ambulance operating agency.
• During test-check of performance reports of ‘108 Ambulance Services’ provided by the Mission Directorate, it was found that 7152 cases were transported by the ‘108 Ambulances’ in eight test-checked districts hospitals in the month of September and October 2015. However, as per district hospital records, only 4643 cases (65 per cent) were registered/found in district hospitals as patients brought by the ‘108 Ambulances’. The differences in these two figures were found to be 12 to 70 per cent which shows that the system of registration of patients in the Government hospitals is poor and also indicated lack of monitoring mechanism. The district-wise figures are shown in Appendix 3.3.8.
Department stated (October 2016) that discrepancies in implementation of ambulance services were discussed with GVK EMRI for further action and necessary improvements. Instructions have been issued for taking corrective measures.
3.3.6 Monitoring and Evaluation
3.3.6.1 Evaluation by External Agency
The revised MoU provided that performance and cost audit of ‘108 Ambulance Services’ was to be done by any expert authorised by the Mission Director, NHM periodically.
During scrutiny of record, Audit found that the firm ‘Deloitte’ was nominated for the performance assessment of ‘108 Ambulance Services’. The Deloitte team assessed the work of GVK EMRI and submitted (September 2013) the report. The report recommended for enhancing IEC activities, clarity on objectives of ‘108 Ambulances’, strengthening of EMT training, improvement in work with hospitals, improvement in inventory management and strengthening monitoring of procurement by EMRI etc. However, follow up of these recommendations was not found on record. Thus, the Department failed to improve the services of ‘108 Ambulances’ even after availability of a third party evaluation report.
Further, in the executive committee meeting (August 2015), it was instructed that quality assessment should be carried out by the outsourced agency to assess the services provided by the firm. However, no quality assessment was carried out till now.
Department stated (October 2016) that instructions were issued from the Department to GVK EMRI to follow the recommendation of ‘Deloitte’ report. However, the reply of Department was not supported by any related evidence.
Follow up of
recommendations
made by
‘Deloitte’ team
who assessed the
work of GVK
EMRI was not
found on record.
Audit Report on General and Social Sectors for the year ended 31 March 2016
182
3.3.6.2 Monitoring system
The MoU (2012) provided to constitute an Advisory Council under the chairmanship of the Chief Secretary which would meet at least once in a year and an Executive Committee under the chairmanship of the Principal Secretary, Public Health & Family Welfare. The Executive Committee meeting was to be held at least once in a quarter or earlier as convened by the Chairman. District Committee was to be constituted under the chairmanship of the district collector. The District Committee at the district level was to meet once in a quarter and coordinate the actions required for efficient implementation and operation. The District Committee was also required to conduct review for operation of ‘108 Ambulance Services’ and related activities.
Audit observed that an Advisory Council was constituted in 2008-09 and only two meeting were organised till date. Similarly, Executive Committee was constituted in 2013-14 and only two meetings were organised during the course of audit period. At the district level, no separate committee was found to be constituted for monitoring the work of ‘108 Ambulance Services’. However, during the meetings of District Health Society, NHM, the work of ‘108 Ambulance Services’ were reviewed.
Department stated (October 2016) that besides meetings of Advisory Council and Executive Committee, several performance review meetings at State and district level were organised on regular basis. The Department further stated that at State level performance of ‘108 Ambulances’ were being monitored in weekly review meetings organised in chairmanship of Principal Secretary.
The reply is not acceptable as no reports/documents in support of above reply produced to audit. Further, meetings of Advisory Council and Executive Committee were not held as per norms of MoU.
3.3.7 Conclusions
• Against the total effective calls, ambulances were despatched in 33 to 47 per cent cases and 31 to 46 per cent victims got the benefits of emergency services.
• Due to delay in procurement process, project could not be rolled out across the entire State within the prescribed period.
• Funds were released to the GVK EMRI on ad-hoc basis without assessing the actual requirement. The savings on salary amounting to ` 23.42 crore was utilised on meeting excess expenditure on other activities/ components viz. fuel cost, repair and maintenance etc. under Opex.
• Per ambulance Opex was more than the prescribed limit of ` 0.98 lakh during 2012-13 to 2014-15 resulting in excess payment of ` 5.02 crore to the operating agency.
• Fewer ambulances were deployed in many districts against the prescribed norms despite the response time to attend to critical patients being excessive in these districts. Even where the number of ambulances were more than the norms, response time was not satisfactory.
District Level
Committee was
not constituted
for monitoring
the work of ‘108
Ambulance
Services’ in any
district.
Chapter III: Compliance Audit
183
• Response time of ambulances was found suboptimal in many districts. Ambulances in many districts could not achieve the prescribed norm of attending average number of emergencies per day. However, proportionate deduction of ` 58.14 lakh against this shortfall was not made from UCs of the operating agency before making adjustment.
• Against the required posts, vacancies were ranging from 4 to 11 per
cent as on July 2015. At call centre, 50 per cent shortage was seen in ERCP-care. Due to this, line of ERCP was found mostly busy and beneficiaries were deprived of getting ERCP advices as pre hospital care during the emergency transportation.
• Some life saver kits, medical equipment, medical supplies and equipment attachments were not available/not working in the test-checked ambulances. Differences were found in figures of number of patients transported by ‘108 Ambulances’ as per MIS report and those registered in the districts hospitals.
• District Level Committee was not constituted for monitoring the work of ‘108 Ambulance Services’ in any district.
3.3.8 Recommendations
• Operational expenditure was approved by the Government in the MoU
showing different components separately. Audit recommends that the
Government should ensure that any diversion from one component to other
should be in consultation with Government.
• Audit recommends that there is need to revisit the criteria for
deployment of ‘108 Ambulances’ as districts having excess ambulances were
also not able to achieve the response time.
• MoU needs to be modified to include penalty clause for not achieving
performance standards. As GVK EMRI is a private service provider, general
norms of General Financial Rules should be adhered to.
• State Government should ensure that GVK EMRI is deploying the man
power as required.
• State machinery at district level should ensure prompt and accurate
recording of data related to patients brought by the ‘108 Ambulances’ and
system should be designed at State level to cross verify the performance report
of GVK EMRI with data provided by district level machinery.
• District Level Committee should be formed and meetings should be
held regularly to assess the performance of ‘108 Ambulances’.
The Government accepted the recommendations.

Audit Report on General and Social Sectors for the year ended 31 March 2016
184
PANCHAYAT AND RURAL DEVELOPMENT
DEPARTMENT
3.4 Follow up Audit of the Performance Audit on “Mahatma
Gandhi National Rural Employment Guarantee Scheme”
3.4.1 Introduction
National Rural Employment Guarantee Act, 2005 (NREGA) guarantees at least 100 days of wage employment in a financial year to every rural household (HH) whose adult members volunteer to do unskilled manual work. The Act provides rural HHs a right to register themselves with the local Gram Panchayats and seek employment. The Act made the Panchayats at each level the principal authorities for planning and implementation of the scheme. The name of the Act was changed to Mahatma Gandhi National Rural Employment Guarantee Act (MGNREGA) in October 2009.
The National Rural Employment Guarantee Act became effective on 2 February 2006 in 18 districts of Madhya Pradesh in the first phase. In the second phase, 13 more districts of the State were included form 1 April 2007 and the remaining 19 districts35 were included from 1 April 2008 in the third phase.
Organisational set-up
Panchayat and Rural Development Department (PRDD) is the nodal Department for execution of the Mahatma Gandhi National Rural Employment Guarantee Scheme (MGNREGS) in the State. The scheme is implemented through Madhya Pradesh State Employment Guarantee Council (SEGC), which is a registered society. Principal Secretary, Government of Madhya Pradesh, PRDD is a member secretary of the Council. SEGC is to advise the State Government on implementation, evaluation and monitoring of the scheme.
The scheme at village level is implemented by Gram Panchayats (GPs). The Programme Officers (POs) are responsible for coordinating the works undertaken by the GPs and other implementing agencies at block level while District Programme Coordinator (DPC) is responsible for overall coordination and implementation of the scheme at district level.
Audit objectives
The objective of this follow up audit was to ascertain whether remedial actions were taken by the Government to implement the recommendations made in the Audit Report on General and Social (Non- PSUs) Sectors for the year ended 31 March 2012 (Report No 4 of 2013).
Audit criteria
The main criteria for the follow up audit were para wise replies of the Department submitted to the State Legislature (December 2014); action plan
35
A new district Agar Malwa formed from district Shajapur on 16 August 2013.
Chapter III: Compliance Audit
185
drawn by Department to implement the accepted recommendations; Mahatma Gandhi National Rural Employment Guarantee Act and Operational Guidelines 2006, 2008 and 2013 issued by the Ministry of Rural Development (MoRD), GoI, regarding MGNREGS and amendments thereto and the circulars issued by MoRD.
3.4.2 Previous Audit findings
The implementation of the Scheme in the State was last reviewed covering the period 2007-12 and the findings were included in Para No. 2.2 of the Audit Report on General and Social (Non-PSUs) Sectors for the Year ended 31 March 2012 (Report No 4 of 2013). Some important findings were as under:-
• Planning and monitoring of the scheme was weak as the prescribed numbers of the meeting of General Body of SEGC and its Empowered Committee were not held at regular intervals.
• All rural HHs were registered under the scheme and issued job cards without obtaining request from the beneficiaries. Dated receipts for job applications were not issued to the applicants.
• Payment of wages was made with delays ranging from 30 days to 360 days.
• The generation of additional employment by the convergence of MGNREGS funds with other funds was not ensured and the converged funds were not utilised within the parameters of MGNREGS.
• Essential records were not maintained by the Gram Panchayats.
• The grievance redressal mechanism was not effective as a large number of complaints were pending at the district and state level. Timeliness in the disposal of complaints was not ensured.
In view of results of audit, we recommended:
• Regular meetings of General Body of SEGC and its Empowered Committee should be conducted.
• For the registration and issue of job cards to the beneficiaries, eligibility of the applicant should be duly verified.
• Request for work should be obtained from the beneficiaries and dated receipt should be issued to them to enable them to get unemployment allowance in case of not getting the employment within 15 days.
• Maintenance of essential records of employment generation and asset creation should be ensured. Fortnightly reports and a copy of Muster Roll of the works executed by the line departments should be forwarded to the GPs for maintaining the data of employment generation.
• Convergence of MGNREGS funds with the funds of other schemes should be done for the generation of additional employment and for providing the benefits of other schemes also to the MGNREGS beneficiaries.
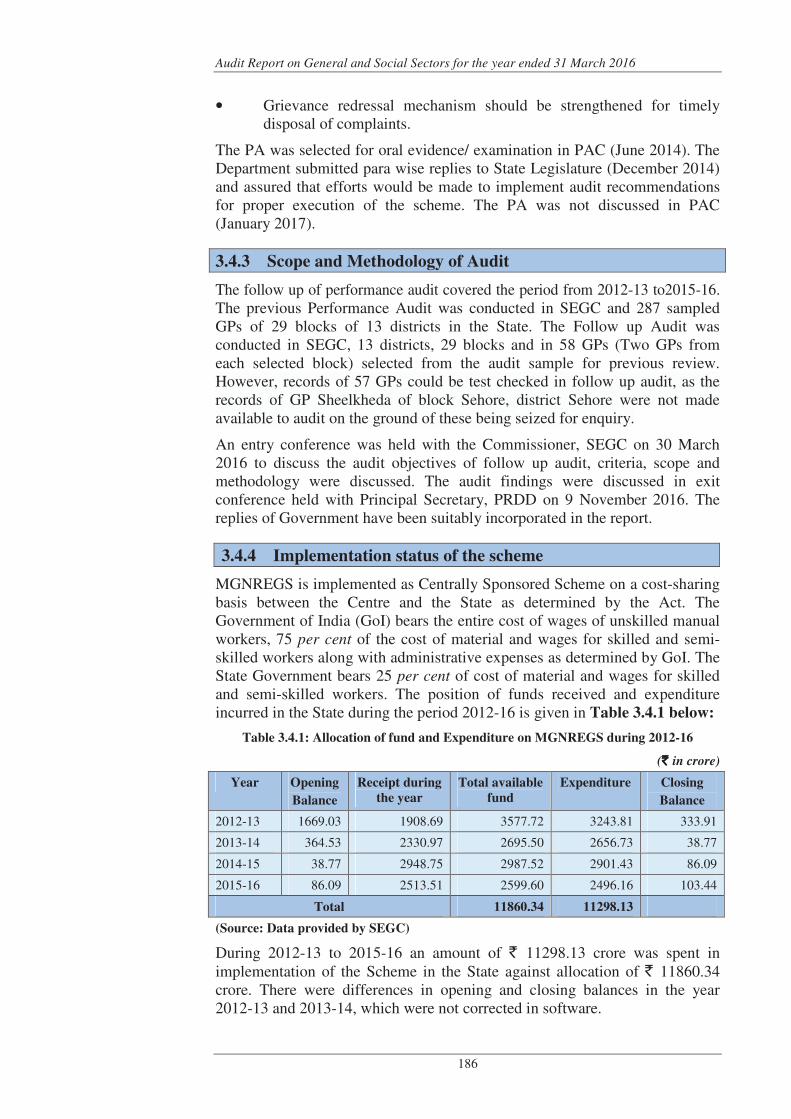
Audit Report on General and Social Sectors for the year ended 31 March 2016
186
• Grievance redressal mechanism should be strengthened for timely disposal of complaints.
The PA was selected for oral evidence/ examination in PAC (June 2014). The Department submitted para wise replies to State Legislature (December 2014) and assured that efforts would be made to implement audit recommendations for proper execution of the scheme. The PA was not discussed in PAC (January 2017).
3.4.3 Scope and Methodology of Audit
The follow up of performance audit covered the period from 2012-13 to2015-16. The previous Performance Audit was conducted in SEGC and 287 sampled GPs of 29 blocks of 13 districts in the State. The Follow up Audit was conducted in SEGC, 13 districts, 29 blocks and in 58 GPs (Two GPs from each selected block) selected from the audit sample for previous review. However, records of 57 GPs could be test checked in follow up audit, as the records of GP Sheelkheda of block Sehore, district Sehore were not made available to audit on the ground of these being seized for enquiry.
An entry conference was held with the Commissioner, SEGC on 30 March 2016 to discuss the audit objectives of follow up audit, criteria, scope and methodology were discussed. The audit findings were discussed in exit conference held with Principal Secretary, PRDD on 9 November 2016. The replies of Government have been suitably incorporated in the report.
3.4.4 Implementation status of the scheme
MGNREGS is implemented as Centrally Sponsored Scheme on a cost-sharing basis between the Centre and the State as determined by the Act. The Government of India (GoI) bears the entire cost of wages of unskilled manual workers, 75 per cent of the cost of material and wages for skilled and semi-skilled workers along with administrative expenses as determined by GoI. The State Government bears 25 per cent of cost of material and wages for skilled and semi-skilled workers. The position of funds received and expenditure incurred in the State during the period 2012-16 is given in Table 3.4.1 below:
Table 3.4.1: Allocation of fund and Expenditure on MGNREGS during 2012-16
(`̀̀̀ in crore)
Year Opening
Balance
Receipt during
the year
Total available
fund
Expenditure Closing
Balance
2012-13 1669.03 1908.69 3577.72 3243.81 333.91
2013-14 364.53 2330.97 2695.50 2656.73 38.77
2014-15 38.77 2948.75 2987.52 2901.43 86.09
2015-16 86.09 2513.51 2599.60 2496.16 103.44
Total 11860.34 11298.13
(Source: Data provided by SEGC)
During 2012-13 to 2015-16 an amount of ` 11298.13 crore was spent in implementation of the Scheme in the State against allocation of ` 11860.34 crore. There were differences in opening and closing balances in the year 2012-13 and 2013-14, which were not corrected in software.
Chapter III: Compliance Audit
187
During exit conference (November 2016), Government stated that difference in Opening Balance and Closing Balance was due to implementation of electronic fund management system (EFMS) in MGNREGS from April 2013, as the figures available at that time were taken as opening balances.
Thus, the difference in Opening and Closing balances were yet to be corrected by the Department even after lapse of three financial years.
3.4.5 Results of follow up Audit
3.4.5.1 Functioning of SEGC
As per MPSEGC Rules, there would be a General Body of MPSEGC, under chairmanship of Chief Minister, to advise State Government for effective implementation of MGNREGA in the State. The meetings of the General Body of SEGC were to be held at least twice in a financial year. There would also be an Empowered Committee of MPSEGC under chairmanship of Chief Secretary of the Government to implement the scheme according to guidelines of GoI. The meetings of the Empowered Committee of SEGC were to be held at least once in a quarter.
Mention was made in paragraph 2.2.7.1 of Audit Report on General and Social (Non-PSUs) Sectors for the year ended 31 March 2012 (Report No 4 of 2013) regarding less number of meetings of General Body of SEGC and its Empowered Committee during 2007-12.
Audit recommended that regular meetings of General Body of SEGC and its Empowered Committee should be conducted. The Department replied to the PAC (December 2014) that decision had been taken in 10th meeting of Empowered Committee (22 January 2014) to conduct General Body meetings under the chairmanship of Minister of PRDD as regular meetings of General Body could not be convened on scheduled intervals.
Follow up Audit revealed that the General Body of SEGC and Empowered Committee did not meet as per prescribed schedules even after the assurance of the Department to the PAC (December 2014). Only one meeting of General Body of SEGC was held on 25 March 2015 against the scheduled three meetings and the Empowered Committee met only two times against scheduled five meetings during December 2014 to March 2016.
During exit conference (November 2016), Government assured that meetings would be held at regular interval in future.
Thus, the Department did not implement the audit recommendation and assurance to PAC.
3.4.5.2 Registration and issue of Job Cards to all rural HHs
As per Schedule-II under Section 5 of the Act, the adult members of every HH who - (i) reside in any rural area, and (ii) are willing to do unskilled manual work, may submit their names, age and the address of the HH to the concerned GP for registration and issue of Job Card (JC). It shall be the duty of the GP to register the HH, after making such enquiry as it deems fit and issue a job card.
Commissioner, SEGC issued instructions (October 2012) to all districts for issue of job cards prescribing formats of application form to be filled by head
Meetings of
general body of
SEGC and its
empowered
committee
were not held
at scheduled
intervals.
Audit Report on General and Social Sectors for the year ended 31 March 2016
188
of the family, verification certificate of Gram Panchayat and acknowledgement of application form.
As per Para 3.1.3 of operational guidelines 2013, the eligibility of applicants was to be verified by GPs on following parameters: - (i) Whether the HH is really an entity as stated in the application; (ii) Whether the applicant HH are local residents in the GP concerned; and (iii) Whether applicants are adult members of the HH.
Mention was made in the paragraph 2.2.10.1 of Audit Report on General and Social (Non-PSUs) Sectors for the year ended 31 March 2012 (Report No 4 of 2013) regarding registration and issue of job cards to 13.35 lakh to 19.74 lakh HHs during 2007-12 who neither submitted application for registration nor were BPL.
Audit recommended that the eligibility of the applicant should be duly verified for the registration and issue of job cards to the beneficiaries. In its reply, the Department informed the PAC (December 2014) that instructions were issued (February 2013) to all districts in this regard.
Audit scrutiny revealed that the Department cancelled 39.39 lakh job cards during 2012-16. As a result, the number of job card holders reduced from 119.41 lakh in 2012-13 to 80.02 lakh in 2015-16. However, Audit scrutiny during follow up audit of test checked 57 GPs revealed that the procedure of obtaining application form for registration of HHs and its certification in the prescribed verification form was not followed. Thus, test-checked GPs issued job cards without following prescribed procedure.
During exit conference Government stated (November 2016) that general instructions regarding renewal of job cards have been issued to the districts.
Thus, the Department implemented this recommendation only partially.
3.4.5.3 Dated receipt of job applications not issued to the
beneficiaries
As per Para 5.4 of the scheme guidelines 2008, a written application for work should be submitted by beneficiary to the GP for obtaining employment. This would be recorded in the prescribed application form and employment register. A dated receipt of the application for work must be issued to the applicant. Under MGNREGA, if an applicant for employment under the scheme is not provided employment within 15 days of receipt of his application seeking employment, he shall be entitled to a daily unemployment allowance.
Mention was made in paragraph 2.2.10.2 of Audit Report on General and Social (Non-PSUs) Sectors for the year ended 31 March 2012 (Report No 4 of 2013) that dated receipts of job applications were not issued to the applicants and the employment register was also either not maintained or was incomplete. In the absence of dated receipts coupled with incomplete information in the Employment Register would render it difficult to ascertain the actual number of persons seeking employment.
Audit recommended that the request for work should be obtained from the beneficiaries and dated receipts should be issued to them to enable them to get
GPs did not
follow the
prescribed
procedure for
obtaining
application form
and issue of job
cards.
Chapter III: Compliance Audit
189
unemployment allowance in case of not getting the employment within 15 days. The Department informed the PAC (December 2014) that instructions were issued (February 2013) to all districts regarding issue of dated receipts to all beneficiaries who applied for employment.
During follow up audit of 57 test checked GPs, audit scrutiny revealed that only three GPs36 issued dated receipts and 51 GPs neither obtained applications for work from the beneficiaries nor issued dated receipts to them. Three GPs37 did not produce records for audit citing absence of staff. Thus, in absence of dated receipts the beneficiaries may not be in position to claim unemployment allowance, in case of not getting employment within 15 days.
During exit conference (November 2016), Government stated that instructions were issued (March 2007) for providing acknowledgement to the beneficiaries.
Thus, the Department had implemented the recommendation by issuing instructions to all districts. However, its compliance was not ensured at GP level.
3.4.5.4 Maintenance of essential records
As per Para 9.1.1 of the scheme guidelines 2008, proper maintenance of records is one of the critical success factors in the implementation of MGNREGS. Information on critical inputs, processes, outputs and outcomes has to be meticulously recorded in prescribed registers at the levels of DPC, PO, GPs and other Implementing Agencies (IAs). The computer based Management Information System (MIS) will also capture the same information electronically. In order to facilitate collection of information at various levels, essential records are to be maintained.
Mention was made in paragraph 2.2.15.1 of Audit Report on General and Social (Non-PSUs) Sectors for the year ended 31 March 2012 (Report No 4 of 2013) regarding failure to maintain/incomplete maintenance of essential records by the GPs.
Audit recommended that the maintenance of essential records of employment generation and asset creation should be ensured. Fortnightly reports and a copy of Muster Roll of the works executed by the line departments should be forwarded to the GPs for maintaining the data of employment generation.
The Department assured the PAC (December 2014) that concurrent audit was being conducted from 2013-14 at all levels of executions (Zila Panchayat,
Janpad Panchayat and Gram Panchayat) by Chartered Accountants, which would ensure maintenance of records in prescribed forms.
During scrutiny of records of 57 test checked GPs in follow up audit, it was noticed that the muster rolls of line departments along with GPs were generated on-line. However, essential records of MGNREGS were not
36 GP Khairlanji - Block Khairlanji Dirstict Balaghat, GP Sirawali and GP Talapar of
Block-Kurwai District Vidisha. 37 Secretaries of GPs were not present with records at GPs: (i) Sarangpur -Block
Sohagpur District Shahdol (ii) Raikoba- Block Budhar District Shahdol (iii) Dhumahdol -Block Budhar District Shahdol.
Applications for
work were not
obtained from
beneficiaries
and dated
receipts were
not issued to
them.
Essential
records of
employment
generation and
asset creation
were not
maintained by
GPs.
Audit Report on General and Social Sectors for the year ended 31 March 2016
190
maintained and updated properly by 54 GPs as detailed Appendix 3.4.1 and summarised in Table 3.4.2. Three GPs38 did not produce records for audit citing absence of staff.
Table – 3.4.2: Details of registers not maintained/ updated by test checked GPs
Sl.
No.
Name of Register Registers
maintained
by GPs
Registers not
maintained by
GPs
Registers not
updated By GPs
1. Job Card Register Nil 20 34
2. Employment Register 03 45 06
3. Work Register Nil 37 17
4. Assets Register Nil 43 11
5. Inspection Register Nil 49 05
(Source: Compilation of data of test checked GPs)
During exit conference (November 2016), Government stated that it was difficult to maintain large number of registers manually. Proposal for maintaining seven registers39 as directed by GoI (July 2016) was under consideration.
Thus, the Department did not implement this audit recommendation.
3.4.5.5 Convergence of MGNREGS funds
As per Para 14.1 of the scheme guidelines 2008, the convergence of MGNREGS with funds from other sources for the creation of durable assets is permissible. However, all initiatives of convergence will be within the parameters of NREGA and it is to be ensured that there is a complete ban on contractors.
As per Para 15.7.2 of operational guidelines of MGNREGA, 2013 the data entry for convergence works are to be made during the entry of new work, details of convergence work with name of scheme is to be filled in software.
Mention was made in paragraph 2.2.14.1 of Audit Report on General and Social (Non-PSUs) Sectors for the year ended 31 March 2012 (Report No 4 of 2013) regarding irregular convergence of MGNREGS funds with Mukhya
Mantri Sadak Yojana (MMSY).
Audit recommended that convergence of MGNREGS funds with the funds of other schemes should be done for the generation of additional employment and for providing the benefits of other schemes also to the MGNREGS beneficiaries. Department assured the PAC that efforts would be made to implement audit recommendation for proper execution of the scheme.
38
Secretaries of GPs were not present with records at GPs: (i)Sarangpur-Block Sohagpur District Shahdol (ii) Raikoba- Block Budhar District Shahdol (iii) Dhumahdol -Block Budhar District Shahdol.
39 Three registers are to be maintained manually - (i) Gram Shaba Meeting Register (ii)
Wages Register (iii) Fixed Assets Register and four registers are to be maintained
part manually – (i) Job Card and Household Employment Register (ii) Work Register (iii) Complaint Register and (iv) Material Register.
GPs did not
maintain the data
of additional
employment
generated through
convergence.

Chapter III: Compliance Audit
191
During Follow up Audit of 13 test checked districts, we found that the Department had not sanctioned fresh works in convergence with MMSY during 2012-16. Scrutiny of records of test checked GPs revealed that MGNREGS funds were converged with the works of other rural development schemes. However, the details of additional employment generated through convergence were not maintained by GPs separately.
During exit conference (November 2016), Government stated that instructions would be issued to the districts for maintaining data of additional employment generated through convergence with other schemes.
Thus, the Department implemented the audit recommendation only partially.
3.4.5.6 Grievance Redressal Mechanism
As per Para 11.7 of the scheme guidelines 2008, DPC and PO will be the grievance redressal officer at district and block levels respectively. A system of appeal was to be designed to deal with the grievances at each level. Further, Para 9.1.1 (ix) of the guidelines states that a complaint register will be maintained by the PO/DPC/Gram Panchayats /other implementing agencies.
Mention was made in paragraph 2.2.16.1 of Audit Report on General and Social (Non-PSUs) Sectors for the year ended 31 March 2012 (Report No 4 of 2013) that the complaint registers were not maintained in GPs and a large number of complaints were pending at State and district level.
Audit recommended that grievance redressal mechanism should be strengthened for timely disposal of complaints. The Department informed the PAC (December 2014) that Mahatma Gandhi National Rural Employment Guarantee (Ombudsman appointment, powers and duties) Madhya Pradesh Rules, 2013 had been implemented for transparent and free enquiry of complaints. It further informed that complaint registers were maintained by all GPs.
Follow up Audit revealed that Ombudsmen had been appointed during 2012-16 at divisional level. However, out of 3722 complaints received in SEGC during the period 2007-08 to 2015-16, 1385 complaints were still pending, as detailed in Appendix 3.4.2.
Further scrutiny of records of 57 test checked GPs revealed that four GPs maintained complaint registers and 16 GPs maintained but not updated the complaint register, as detailed in Appendix 3.4.3. The complaint register was not maintained in 34 GPs. Three GPs did not produce records for audit. Social Audit was not conducted in any of the test checked GPs during 2012-13 to 2015-16.
During exit conference (November 2016), Government stated that 64 per cent of total complaints registered were disposed of since 2006-07 and online disposal of MGNREGS complaints were also made through Chief Minister Help Line. Apart from this, complaints were also disposed of during social audit in GPs.
The reply of the Department regarding disposal of complaints in social audit was not based on facts, as social audit was not conducted in test checked GPs.
The complaint
registers were not
maintained in 34
test checked GPs
and a large number
of complaints were
pending for
disposal at SEGC
level.
Audit Report on General and Social Sectors for the year ended 31 March 2016
192
In view of pendency of complaints even for the period 2007-08, disposal of pending complaints was still an issue to be resolved.
Thus, the Department implemented the audit recommendation only partially.
3.4.5.7 Delayed payment of wages
Para 7.1.5 of the scheme guidelines 2008 states that the wages of workers should be paid on a weekly basis and in any case within a fortnight of the date on which the work was done. In the event of any delay in wage payment, workers are entitled to compensation as per the provisions of the Payment of Wages Act, 1936. Compensation costs shall be borne by the State Government.
Mention was made in paragraph 2.2.11.2 of Audit Report on General and Social (Non-PSUs) Sectors for the year ended 31 March 2012 (Report No 4 of 2013) regarding delayed payment of wages. In its reply the Department informed the PAC (December 2014) that Electronic Fund Management System (EFMS) of payment was introduced in the State from 2013-14 to check delayed payment of wages.
Follow up audit revealed that Commissioner, MPSEGC, Bhopal issued detailed guidelines (January 2015) regarding payment of compensation for delayed payment of wages to the beneficiaries. However, as per MIS report40 at SEGC level, there were 1.75 crore delayed transactions of ` 1455.30 crore (84 per cent of total transactions) in 2014-15 and 96.35 lakh delayed transactions of ` 785.59 crore (15 per cent of total transactions) in 2015-16. Further, the amount of due compensation ` 38.10 crore for the year 2014-15 and ` 21.07 crore for the year 2015-16 was not paid to the beneficiaries (August 2016). Further, MIS report41 revealed that an amount of ` 9.18 crore of unskilled and semi-skilled wages was due for payment for the year 2015-16 (January 2017).
During exit conference (November 2016), Government stated that delay in wage payment was due to lack of funds in SEGC accounts, lack of streamlining between NIC, banks and PFMS42 servers and non-availability of core banking facilities in Regional Rural Banks and Central Co-operative Banks.
Thus, the Department could not ensure timely payment of wages to the beneficiaries.
3.4.6 Conclusion and Recommendations
We observed that out of six accepted recommendations made in paragraph 2.2 of the Audit Report on General and Social (Non-PSUs) Sectors for the year ended 31 March 2012 (Report No 4 of 2013). Three recommendations relating to issue of job cards, convergence of MGNREGS funds with other schemes for generation of additional employment and strengthening of grievance redressal mechanism were only partially implemented by the Department,
40
MIS report as on 04 February 2016, furnished by MP SEGC. 41
MIS report as on 13 February 2017. 42 Public Financial Management System.
Compensation for
delayed payment
of wages was not
paid to the
beneficiaries.
Chapter III: Compliance Audit
193
while following three recommendations were not implemented by the Department regarding:
• Conducting regular meetings of General Body of SEGC and its Empowered Committee.
• Obtaining application for work and issue of dated receipt to beneficiaries to enable them to get unemployment allowance in case of not getting the employment within 15 days.
• Ensuring maintenance of essential records of employment generation and asset creation.
Department may ensure effective compliance of all accepted recommendations
while implementation of MGNREGS.
Audit Paragraphs
GENERAL SECTOR
HOME DEPARTMENT
3.5 Short levy of composition amount due to application of pre
revised rates
Levy of composition amount at pre revised rates resulted into short
recovery of composition amount to the tune of `̀̀̀ 83.91 lakh in nine
districts.
Rule 29 of MP Financial Code provided that subject to any special arrangement that may be authorised by competent authority with respect to any particular class of receipts, it was the duty of the departmental Controlling Officers to see that all sums due to Government were regularly and promptly assessed, realized and duly credited in the Consolidated Fund or the Public Account.
Under section 200 of the Motor Vehicles Act 1988 (Act), any offence committed, which is punishable under different sections of the Act, can be compounded for such amount as the State Government may specify by notification in official gazette. In exercise of the powers, conferred by sub-section (1) of Section 200 of the Motor Vehicles Act, 1988 (No. 59 of 1988) and in supersession of Transport Department’s Notification No. F 22-3-2000-VIII, dated 23rd August 2005, the Madhya Pradesh Government (GoMP) vide official gazette No. 110 dated 16th March 2012, fixed the rate of composition amount for different types of offences punishable under different sections of the Act. The rates of composition amount were further revised vide official gazette No. 29 dated 21st January 2013 and No. 101 dated 2nd March 2015.
Para 3.1.12 of the Comptroller and Auditor General of India’s Report No. 1 of 2016 had highlighted short levy and short recovery of Composition amount revised vide Gazette No. 110 dated 16 March 2012 due to absence of a suitable mechanism for ensuring immediate communication of such orders/notifications to implementing wings.
Audit Report on General and Social Sectors for the year ended 31 March 2016
194
During test check of records of office of Superintendents of Police (SP) of three Districts43Audit have seen further lapse in compliance of Gazette notification of March 2012. In these districts, in 19,545 cases of violation of provisions of the Act, composition amount was levied at pre revised rates resulting in short recovery of composition amount of `70.68 lakh. Audit further noticed that regarding Gazette notification of January 2013, in two districts44, in 1,124 cases amount of `4.99 lakh was short levied and similarly in respect of Gazette notification of March 2015, in six45 districts, in 5,442 cases amount of `8.24 lakh was short levied. Thus in respect of 26,111 cases registered for violation of Act, in spite of revision of rates of composition by GoMP official Gazette (March 2012, January 2013 and March 2015), composition amount of ` 83.91 lakh was short recovered. The details of notification-wise and district-wise short levy and recovery of composition amount are shown in the Appendix-3.5.1.
On this being pointed out, SP, Dewas (August 2016) and SP, Bhopal (August 2016) stated that it was not possible to raise the demand for short recovered composition amount.
Matter was reported to the Government (May 2016). In the exit conference (November 2016), the Department verified facts and figures and stated that as per present arrangement government gazette notifications were provided on website for compliance by field units. In respect of orders notified in gazette, additional instructions regarding compliance of orders by police units were issued by Police Headquarter. The Government accepted there were procedural delay of short time in receiving and compliance of levy of rates of composition revised by Government/ Transport department from time to time. This fees was levied as a correctional measure and making general public aware for complying traffic rules. As its purpose was not to earn revenue, it was not justified to treat delay in implementation of revised rates as loss of revenue.
The reply is not acceptable, as Government had not devised a suitable mechanism for ensuring compliance of revised rates without any procedural delay to avoid loss of revenue.
3.6 Cost of police guard not recovered from borrowing
organisations
Due to laxity of Superintendents of Police, Bhopal and Dewas in
collection of cost of police guard and bank guarantee in advance, cost of
police guards supplied to borrowing public sector banks/ undertaking
amounting to `̀̀̀1.87 crore could not be recovered.
Rule 29 of MP Financial Code provides that subject to any special arrangement that may be authorised by competent authority with respect to
43
Chhindwara (May 2015), Dhar (July 2015) and Panna (July 2016). 44 Dewas (August 2015) and Sheopur (October 2015). 45 Bhopal (July 2015), Dewas (August 2015) Gwalior (April 2015), Khargone (August
2015), Sheopur (October 2015) and Ujjain (May 2015).
Chapter III: Compliance Audit
195
any particular class of receipts, it is the duty of the departmental Controlling Officers to see that all sums due to Government are regularly and promptly assessed, realized and duly credited in the Consolidated Fund or the Public Account.
As per Rule 495 Madhya Pradesh Police Regulations, the cost of guards to Government Departments, Railway or individuals shall be recovered from the borrowing authority on bills made out by the Superintendent of Police. Home Department, Government of Madhya Pradesh prescribed (January 2010, further revised in June 2010 and March 2011) the rates of police guards provided on permanent and temporary basis to the Banks/other commercial organizations and individuals which included all the expenses/ emoluments of police guard. The cost of police guard was to be collected in advance on six monthly basis along with one year charges in the form of bank guarantee. The payment was to be received by cheque/draft and deposited in the receipt head of the police department through challan.
Test check of records of the Superintendent of Police (SP), Bhopal(July 2015) and SP, Dewas (August 2015 and August 2016) revealed that police guards were provided to Public Sector Banks, Bharat Heavy Electricals Limited (a Public Sector Undertaking) and Doordarshan on their request. The Government sanctioned the post of policemen for their deployment in these establishments with instructions to collect the expenses incurred on them in advance, from these establishments.
Audit noticed that, the respective SPs did not collect the cost of police guards in advance and also did not follow up for recovery on regular intervals. This resulted in accumulation of charges amounting to ` 1.87 crore (`1.27 crore for SP, Bhopal and `0.60 crore for SP, Dewas) for the period 2010-11 to 2015-16 as detailed in Appendix-3.6.1. Out of ` 1.87 crore, ` 1.38 crore pertain to the period 2011-12 to 2013-14. Bank guarantees equivalent to one year charges were also not takenfrom the borrowing organisations.
Matter was reported to the Government (May 2016). In the exit conference (November 2016), the Department verified the facts and stated that cost of police guards amounting to ` 1.62 crore (` 1.02 crore for SP, Bhopal and ` 0.60 crore for SP, Dewas were still outstanding. Action for recovering the outstanding dues were in progress and meetings would be held with borrowing organisations.
The reply of the Department was not acceptable because the cost of police guards was not collected in advance and bank guarantee was also not taken from the borrowing organisations as per Government orders. Reasons regarding laxity in collection of cost of police guard and bank guarantee in advance were not furnished. Had bank guarantee been taken from the defaulting organisations, it could have been encased for realisation of charges of police guards.

Audit Report on General and Social Sectors for the year ended 31 March 2016
196
SOCIAL SECTOR
FOOD, CIVIL SUPPLIES AND CONSUMER PROTECTION
DEPARTMENT
3.7 Corpus fund for Consumer Welfare not credited with interest
Due to failure to comply with the rules for depositing the State Corpus
Fund for Consumer Welfare, the fund was deprived of the interest
amounting to ` ` ` ` 1.34 crore.
The Consumer Welfare Fund was established (1992) by the Government of India (GoI) for providing financial assistance to registered agencies/ organisations and state governments for undertaking consumer welfare activities. In order to decentralise the sanctioning of consumer awareness programmes/projects, Ministry of Consumer Affairs, Food and Public Distribution, GoI decided (June 2004) to provide seed money as one time grant for setting up of State Consumer Welfare Fund (CWF) in ratio of 50:50 (Centre: State) and for States having more than 25 districts seed money was ` 50 lakh. For further strengthening the State CWF, it was decided (February 2010) that the State which are willing to establish a corpus of ` 10 crore, will be supported by the Central Government by contributing 75 per cent of that amount as Central share from the Central CWF.
The corpus was to be credited in separate account that can generate interest which could be utilised for providing financial assistance to Voluntary Consumer Organisations for activities such as production and distribution of literature and audio-visual material for spreading consumer literacy and awareness building programmes for consumer education; setting up facilities for training and research in Consumer education and related matters and building up infrastructural facilities for organising consumer education activities on a permanent basis at the District/Sub-Division level.
Government of Madhya Pradesh (GoMP), Department of Food, Civil Supplies and Consumer Protection, framed (August 2009) Madhya Pradesh State Consumer Welfare Fund Rules, 2009 (Rules) as per Para 4 (1) of these Rules, the State Consumer Welfare Fund would be established as a non-lapsable fund under the Public Account of the State which would be held in the Government Treasury as an interest bearing Personal Deposit (PD) Account as may be decided by the State Government.
Test check of the records of the Commissioner, Food, Civil Supplies and Consumer Protection (CFCS) (October 2014 and December 2015) revealed that GoMP made a budget provision of ` 22.50 lakh for the State CWF in 2005-06. Subsequently an amount of ` 24.75 lakh was received from GoI in 2006-07 and total amount was deposited in an interest not bearing Personal Deposit (PD) account (A/c No. 41). After receiving GoI's proposal for setting up of Corpus Fund, another PD account (A/c No. 50) was opened (September
Chapter III: Compliance Audit
197
2010) by CFCS under major head ‘8448-Deposits of Local Fund- 120 Other Deposits’ and total amount of ` 10.47 crore46 was deposited in this account.
Audit observed that the new PD account was opened under major head which was categorised as "Deposits not bearing Interest" under "K-Deposits and Advances" as per List of Major and Minor heads of Accounts issued by Controller General of Accounts. As such, treasury did not credit interest in this account later on, Finance department GoMP issued orders (December 2012) to pay interest on the amount deposited in this account at the rates allowed by the State Government from time to time. Subsequently interest ` 1.70 crore was credited in this account only on 01.10.2015 for the period of 07.12.2012 to 31.03.2015. However, from the date of opening of account to issue of orders for paying interest by Finance department (from 28.9.2010 to 6.12.2012) amounting to ` 1.34 crore47 was not credited to the Corpus Fund.
Further scrutiny revealed that no activity was carried out by Department out of fund during 2011-14. The Consumer Welfare Fund Guidelines for Management and Administration, 2015was finalised only after credit of interest. Thus, due to failure to comply with the rules for depositing the State Corpus Fund for Consumer Welfare in an interest bearing account, the fund was deprived of the interest amounting to ` 1.34 crore, delayed the implementation of activities to be carried out of Consumer Welfare Fund. Interest amounting to ` 1.34 crore was yet to be credited.
The matter was reported to the Government (May 2016). In the exit conference (November 2016), the Government verified facts and figures and stated that in view of the observation of audit, a proposal for sanction of payment of interest had been sent by department to the Finance department and sanction was awaited.
MEDICAL EDUCATION DEPARTMENT
3.8 Irregular payments to private printers by using fake
documents
M.Y. Hospital Indore and J. A. Group of Hospitals, Gwalior made
irregular payment of `̀̀̀ 79.50 lakh to private printers by using fake bill
verification letters, certification seal and signature of Government
printing press.
Revenue Department, Government of Madhya Pradesh, Bhopal issued (June 2009) memorandum that all types of departmental printing works should be sent to the Government Printing Press for printing by all the Government Departments. The Controller, Government Printing and Stationery, Madhya Pradesh, Bhopal issued detailed instructions (August 2010) regarding procedure for departmental printing works which provided that demand letter for printing must be sent through speed post/registered post directly to
46
Central share ` 7.50 crore, state share ` 2.50 crore and amount transferred from PD A/c.No.41 ` 47.25 lakh.
47 Interest due from 28.9.10 to 31.3.11 ` 10.57 lakh; 1.4.11 to 31.3.12 ` 73.31 lakh; 1.4.12 to 6.12.12 ` 50.08 lakh .
Audit Report on General and Social Sectors for the year ended 31 March 2016
198
Government printing press by the indenting office. In case, the printing work was to be outsourced by the Government printing press to any registered private printing press then endorsement copy of work order would be sent to indenting office. After receiving printed material from registered private printers, bills of private printers along with the sample of printed material would be sent to Government press for verification by indenting officer. Before making payment to the concerned private printer, the indenter would verify confidentially each verification note of Government press from Controller’s office. Heads of Departments of the indenting offices were responsible for the compliance of these procedure to prevent any fraudulent payments to private printers on the basis of fraudulent verification note.
Further, Controller, Government Printing and Stationery (the Controller), Madhya Pradesh, Bhopal issued orders (September 2012) that printing orders for any type of printing work should be issued well in advance by all the Government departments and its sub-ordinate offices to the Government regional printing press concerned (Indore, Gwalior, Rewa) or Government printing press, Bhopal in terms of geographical demarcation. It was also mentioned that previous system of affixing the certification seal of examination committee on invoices/bills and use of earlier format for issuance of covering letter of bill had been dispensed with vide order dated May 2010.
During test check of records of offices of the Joint Director and Superintendent, Maharaja Yashwantrao Hospital (JD&S, M.Y.H.), Indore (October 2015) and the Joint Director and Superintendent, J.A. Group of Hospitals (JD&S, J.A.H.), Gwalior (February 2016), audit noticed that:
• M.Y. Hospital, Indore paid 195 bills of private printers amounting to ` 56.91 lakh for printing of various forms, booklets, discharge cards and envelops etc. during March 2014 to March 2015. Audit scrutiny revealed that demand letters for printing of material were dispatched and then taken back by stationery clerk from dispatch clerk. Bills of printed material were given by stationery clerk to inward clerk for inward and thereafter taken back. Fake verification notes of Government printing press were certified by the Medical officer in charge of stationery branch and these bills of private printers were passed and paid.
• Similarly, eight bills of private printers amounting to ` 22.59 lakh were paid by J. A. Group of Hospitals during 2014-15 (details are given in Appendix-3.8.1). Audit observed that demand letters dated 24.09.2014 for printing of material were shown to be dispatched on 17.09.2014 in dispatch and expenditure register. Medical officer in charge of store had certified fake verification notes of Government printing press without actually receiving the printed material and bills of private printers were passed and paid. Stock registers with regards to purchases made by J.A. Group of Hospitals, Gwalior through 07 supply orders dated 24.09.2014 were not made available due to which it could not be ensured that printed material was actually received in the hospital.
Audit noticed that indents for above mentioned 203 printing orders were shown to be issued directly to the Controller, whereas these orders should have been issued to concerned Government printing press of Indore and Gwalior. Any evidence of dispatch of these indents to the Controller, was not
Chapter III: Compliance Audit
199
provided by both the Hospitals at the time of audit. Endorsement copies of work orders issued by Government printing press to registered private printers were also not available in the concerned Hospitals. None of 203 bills of private printers had any reference of orders issued from the Government printing press. Audit also observed that payment was made to private printers on the basis of certification seal and signature of examination committee on invoices/bills and covering letter from the office of the Controller whereas this procedure has already been dispensed with since May 2010.
All these facts indicated that both Hospitals had shown apparent compliance with the prescribed procedure for printing of stationary through the Government press, but the relevant documents produced in audit were contradictory.
During cross verification of invoices/bills, verification note on bills and covering letters relating to these 203 bills from office of the Controller, Government Printing and Stationery, M.P., Bhopal, Dy. Controller and Controller stated (January and March 2016) that indents for printing in these cases were not received from JD&S, M.Y.H., Indore and JD&S, J.A.H., Gwalior. As such, there was no question of following the process of issuing printing orders to private printers and verification of their bills in any of these cases. With reference to 195 cases of M.Y.H., Indore, Dy. Controller further stated that all the bill verification letters, certification seal and signature of Government printing press at the back of bills were entirely fake and these bills were not verified by members of the examination committee.
On this being pointed out by audit and after perusal of reply of the Dy. Controller, Government Printing and Stationery, M.P. Bhopal, JD&S, M.Y. Hospital, Indore stated (October 2015 and September 2016) that audit would be intimated after scrutiny. Further, after perusal of the reply of the Controller, Government Printing & Stationary, M.P. Bhopal, JD&S, J.A. Group of Hospitals, Gwalior stated (September 2016) that audit would be intimated after investigation.
Meanwhile, taking the cognizance of objection raised by audit, the Commissioner, Medical Education, MP, Bhopal has constituted (July 2016) an enquiry committee to investigate the matter.
The matter was reported to the Government (June 2016); their reply has not been received (January 2017).
PANCHAYAT AND RURAL DEVELOPMENT DEPARTMENT
3.9 Short imposition of compensation
Six Divisions of Rural Engineering Services short levied compensation
of `̀̀̀ 1.26 crore on contractors for delays in construction of rural road
works under Mukhya Mantri Gram Sadak Yojana.
Mukhya Mantri Gram Sadak Yojana (MMGSY) was introduced by the Government of Madhya Pradesh in 2010-11 for providing connectivity by way of all-weather roads to such unconnected villages which were not to be covered under the Pradhan Mantri Gram Sadak Yojana. Madhya Pradesh Rural Engineering Service (RES), an agency under the Panchayat and Rural
Audit Report on General and Social Sectors for the year ended 31 March 2016
200
Development Department (PRDD) was responsible for construction of roads under the Scheme.
As per Clause 2 under Appendix 2.13 of Madhya Pradesh Works Department Manual and conditions of the contract, time allowed for carrying out the work would be strictly observed by the Contractor and would be reckoned from the day48 on which the order to commence the work is issued to contractor. In the event of the failure of the contractor to execute works according to the timelines mentioned in the contract, the Executive Engineer (EE) had to levy compensation on the contractor at the rates specified in the contract (as detailed in Appendix 3.9.1).
PRDD directed (December 2004) that the sanction for time extension up to one month would be accorded by Executive Engineer and Chief Engineer would be fully competent to accord time extension for more than one month.
PRDD further instructed (April 2005) that detailed speaking orders, mentioning the delayed period and separately showing that period for which contractor was not responsible, should be issued by the Departmental officers in time extension cases and reasonable compensation should be levied as per provisions of the agreement after determining the period of delays for which contractor was responsible.
Scrutiny of records related to works under Mukhya Mantri Gram Sadak
Yojana (MMGSY) in Six49 Divisions of RES revealed that in 33 works50, completion time was extended ranging from three to 28 months for which penalty, amounting to ` 1.32 crore at prescribed rate was to be imposed on contractors as compensation amount whereas only ` 6.46 lakh was imposed resulting in short imposition of penalty amounting to ` 1.26 crore as detailed in Appendix 3.9.2.
Audit noticed that the cases for time extension with reasons (only in some cases) of delay were forwarded by respective EE to Superintending Engineer (SE), without levying any compensation on the contractors, with the recommendation to impose penalty for time extension period. SEs found that contractors were also responsible for time extension period but penalty, at prescribed rates, was not imposed by the SE towards time extension for delay in completion of works. Further, Audit observed that directions of PRDD issued in December 2004 were not incorporated in the conditions of the contract and SEs, though not competent, sanctioned time extension by imposing short penalty for compensation for delayed completion of works by violating the directions of the Department that time extension was to be sanctioned by the Chief Engineer. On audit enquiry the SEs Ujjain and Jabalpur replied (December 2016) that contractor alone was not responsible
48
Fifteenth day for those works where completion period is six months and thirtieth day where completion period is beyond six months.
49 Executive Engineer RES, Dewas (November 2015), Harda (July 2015), Division
No. 1 (October 2015) and Division No. 2 of Jabalpur (October 2015), Balaghat (February 2016) and Division No. 2 Chhindwara (March 2016).
50 EE, Dewas (08 works); EE Harda (03 works); EE Division No. 1 Jabalpur (07 works), EE Division No. 2 Jabalpur (05 works), EE, Balaghat (02 works) and EE, Division No.2, Chhindwara (08 works).
Chapter III: Compliance Audit
201
for delayed completion of works. On the basis of departmental delay, reasons given by the contractors for delayed completion of work (Appendix-3.9.3) and consent of EE concerned thereon, appropriate compensation was levied. But, the period for which contractor was not responsible, was not found to be mentioned in the orders issued by SEs for imposition of compensation.
In the exit conference (November 2016), the Department replied that the procedure for imposing penalty for delayed completion of works is prescribed in Clause 2 under Appendix 2.13 of Works Department Manual 1983 and as per this clause the decision of the SE shall be final. SEs have exercised their powers keeping in mind the land related difficulties, not completion of earth work in MNREGS and un availability of site at time etc.
Reply was not acceptable since SEs were not competent to grant time extensions. Short penalties were imposed by the SEs by ignoring provisions and conditions of the contract, to give undue benefit to the contractors. Further, speaking orders stating the period for which contractor was not responsible were not issued by SEs. Moreover, the reasons given by the contractors for time extension of work were not found to be satisfactory as contractors failed to give proportional progress of works as per Clause 2 of conditions of contract which attracts penalty as per prescribed rates.
Thus in violation of the directions of the Department, SEs un-authorisedly and arbitrarily favoured certain contractors in sanctioning time extension by imposing short penalties as compensation to give undue benefit to the contractors. Short levied amounts were recoverable and suitable action may also be initiated against SEs for their illegal action.
3.10 Extra expenditure
Amount of `̀̀̀ 82.79 lakh excess incurred on execution of works
abandoned by contractors was not recovered by invoking risk and cost
procedures by Executive Engineers, Rural Engineering Services, Panna
and Jabalpur.
The Clause 3 of Appendix 2.13 of Madhya Pradesh Works Department Manual provided for rescinding the contract and forfeiture of security deposit of the contract thereupon in case of work is left incomplete, abandoned or delayed beyond the permitted limit. Clause 3 (c) ibid further provided that "to measure up the work of the contractor and to take unexecuted works out of his hands, and to give it to another contractor to complete them. Any expenses which may be incurred in excess of the sum which would have been paid to the original contractor, if the whole work had been executed by him (of the amount of which excess certificate in writing of the Divisional Officer shall be final and conclusive) shall be borne and paid by the original contractor and may be deducted from any money due to him by Government under the contract or otherwise or from his security deposit or the proceeds of sale thereof or a sufficient part thereof." Further, Clause 2.075 (b) of the Works Department Manual stipulated that, "Work can be ordered to be taken up for execution departmentally and on piece work system upto ` five lakh by Superintending Engineer (SE) and above it by Chief Engineer (CE)".
Audit Report on General and Social Sectors for the year ended 31 March 2016
202
Public Works Department, Government of Madhya Pradesh issued directions (May 2013) that excess cost of remaining works should be determined on the basis of tender rate after execution of contract for acceptance of tender invited for remaining work on risk and cost basis and excess cost should first be recovered, as per provisions of agreement, from the Government amount due to contractor who leave incomplete work then action for recovery through Revenue Recovery Certificate (RRC) should be taken to recover remaining amount.
(A). During test check of records (December 2015) of O/o the Executive Engineer (EE), Rural Engineering Services (RES), Panna it was noticed that work orders were issued (November 2010) to M/s Torus Software Infrastructure Private Ltd., Satna (original contractor) to complete construction work of roads and culverts within 12 months under Package Nos. 0902 and 0908 respectively at 16.11 per cent below SOR for tender cost ` 189.75 lakh and 05.11 per cent below SOR for tender cost ` 179.14 lakh. Original contractor was paid ` 43.08 lakh and ` 54.07 lakh respectively under Package No. 0902 and 0908. The works were not completed even after lapse of two years from due date and works were left uncompleted. The EE, RES, Panna rescinded the contract under Clause 3 and its sub clauses of the agreement under Package Nos. 0902 and 0908 in February 2014 and December 2013 respectively. Superintending Engineer (SE) gave approval (May 2014) for execution of remaining works on piece work system, whereas SE was not competent to give approval in these cases as it required the approval of the CE. Audit further noticed that due to execution of remaining works through piece work system on district SOR in these two packages, an extra cost of ` 53.92 lakh was incurred as compared to the rates of contract to the original contractor as detailed in Appendix-3.10.1 which was recoverable from the original contractor.
(B). Scrutiny of records (October 2015) of O/o the Executive Engineer, Rural Engineering Services, Division No. 2, Jabalpur and further information collected (March 2016) revealed that work orders were issued (December 2010) to M/s R.K. Constructions, Tehsil Panagar, Jabalpur (original contractor) under Package Nos. 3302 and 3310 respectively at 13 per cent below SOR for tender cost ` 126.18 lakh and 0.10 per cent below SOR for tender cost ` 113.31 lakh to complete construction work of roads and culverts within 12 months. The original contractor had not started construction work under Package No. 3302 up to January 2012 and construction work of only two roads were started up to January 2012 under Package No. 3310 whereas nine roads were to be completed and the works were left incomplete. The EE, RES, Division No. 2, Jabalpur rescinded (January 2012) the contracts under the Clause 3 (c). The remaining works of Package No. 3302 were awarded (April 2012) to M/s Rajendra Prasad, Jabalpur on 19.26 per cent above SOR rates and the remaining works of Package No. 3310 were awarded (April 2012) to M/s Maa Rewa Shree Constructions, Jabalpur on 19.50 per cent above SOR rates. The excess amount of ` 37.03 lakh incurred on execution of remaining works was recoverable as risk and cost of the first contractor as detailed in Appendix-3.10.2.
The matter was reported to the Government (June 2016). In the exit conference (November 2016), the Government verified facts and figures of the
Chapter III: Compliance Audit
203
audit observation and stated that in RES, Panna an amount of ` 5.26 lakh deposited by original contractor at the time of contract had been forfeited and an amount of ` 13.30 lakh deducted from contractor’s bill as security deposit, performance security and time extension amount has been retained in Deposit head and action for recovering this amount was in process. The balance amount ` 35.36 lakh would be recovered through RRC. In RES, Jabalpur an amount of ` 2.90 lakh deposited by first contractor as EMD has been recovered and remaining amount ` 34.13 lakh would be recovered through RRC. It has also been stated that as action for recovery through RRC would be taken by Collectors, it might take time. Reply for according approval for execution of remaining works in piece work by SE, Panna was not furnished.
The fact remains that the conditions of contract for recovery of excess cost from the amount due to the first contractor were not adhered to, due to which amount of ` 82.79 lakh towards risk and cost was not recovered from the original contractors. Progress of the works were not monitored by the concerned divisions. After rescinding the works, security deposits, performance security and other amount retained in Deposit head were not forfeited and effective and timely action for recovering the remaining amount through RRC was not ensured. Moreover, approval for execution of remaining works in piece works accorded by SE, Panna was also not in order.
PUBLIC HEALTH AND FAMILY WELFARE DEPARTMENT
3.11 Fraudulent excess payment
J.P. Hospital, Bhopal made fraudulent excess payment of `̀̀̀ 48.67 lakh
to laundry services for washing of linen clothes without actually
verifying the details of linen clothes issued for washing by the concerned
wards.
Rule 193 of Madhya Pradesh Treasury Code (MPTC) provided that the Drawing and Disbursing Officer (DDO) would be responsible for drawing the admissible amount of claim from the treasury and its disbursement. Rule 198 of MPTC provided that the responsibility for an overcharge shall rest primarily with the drawer of the bill, in the event of culpable negligence on his part, recovery may be considered. Further, Rule 121 of Madhya Pradesh Financial Code (MPFC) provided that all material received should be examined, counted, measured or weighed as the case may be; when delivery is taken. The Government servant receiving the stores would also be required to give a certificate that he has actually received the materials and recorded them in the appropriate stock register.
During test check of records (January 2016) and further information collected (May 2016) from office of the Civil Surgeon-cum-Hospital Superintendent (CS), J.P. Hospital, Bhopal related with the washing of linen clothes, audit noticed that linen clothes were given to M/s Mittal Laundry Services, Bhopal (Laundry Service) for washing. The firm submitted bills for the services rendered on monthly basis along with ward wise details of linen clothes washed during the month. The bills submitted by laundry service for washing of linen clothes were passed on the basis of verification letter of Secretary, Rogi Kalyan Samiti (RKS) and paid without actually verifying from concerned
Audit Report on General and Social Sectors for the year ended 31 March 2016
204
wards whether number of linen clothes issued for washing tallied as that of ward wise details enclosed/claimed with the bills.
Audit scrutiny of ward wise details of linen clothes issued for washing (made available by 16 wards) and the ward wise details enclosed with the monthly bills (May 2014 to September 2015) of laundry service revealed that the firm submitted inflated bills for washing of 9,01,382 linen clothes as against the actual number of 2,21,523 linen clothes issued from various wards for washing. Thus, the firm submitted inflated bills for washing of 6,79,859 fictitious number of linen clothes which resulted in fraudulent payment of ` 48.67 lakh to the firm, as detailed in Appendix-3.11.1. The reason due to which DDO relied on verification statement of RKS without verification from concerned ward, was not evident from records. This indicated negligence on the part of the DDO and thus control mechanism as envisaged in the rules was not adhered to, which led to fraudulent payment.
On this being pointed out, the CS, J.P. Hospital, Bhopal stated that (January 2016) after investigation, audit would be intimated. He further stated (October 2016) that an investigating committee had been constituted (May 2016) and investigation report was still awaited.
The matter was reported (June 2016) to the Government. In the exit conference (October 2016), Principal Secretary, Public Health and Family Welfare, GoMP, Bhopal stated that after receipt of the investigation report, reply would be submitted to audit within 15 days and necessary action would be taken.
Thus, the CS, J.P. Hospital, Bhopal failed to exercise internal control and release payments to laundry services without ensuring verification of washed items from wards, which resulted in the fraudulent excess payment of ` 48.67 lakh.
3.12 Suspected embezzlement/fraudulent payment
Codal provisions for preparation of bills, receipt, verification and issue
of stock were not followed/ensured by Civil Surgeon-cum-Hospital
Superintendent, Betul which facilitated payment of `̀̀̀ 7.69 lakh on
fake/fraudulently fabricated bills for supply of LPG cylinders.
Rule 121 of Madhya Pradesh Financial Code (MPFC) provided that all material received should be examined, counted, measured or weighted as the case may be, when delivery is taken, and they should be taken in charge by a responsible Government servant who should see that the quantities are correct and their quality good, and record a certificate to that effect. The Government servant receiving the stores should also be required to give a certificate that he has actually received the materials and recorded them in the appropriate stock register. Further Rule 397 of Madhya Pradesh Treasury Code (MPTC) provided that a reference to the page number of the stock register, in which such supplies or stores have been entered, should be given by the drawing officers on the bills of the suppliers, invoices, etc. It should also be certified that the rates paid are not in excess of accepted or market rates.
Chapter III: Compliance Audit
205
Rule 10 of MPFC envisaged that each Head of the Department is responsible for enforcing financial orders and strict economy at every step. He is responsible for observance of all relevant financial rules and regulations both by his own office and by subordinate disbursing officers. Rule 306 of MPTC provides that disbursing officer must obtain valid quittances for all payments.
Civil Surgeon-cum-Hospital Superintendent (CS), Betul has two domestic gas connections with consumer Nos. 704529 and 600631 from Shivalaya Sona H.P. Gas Service (Gas Agency), Betul to provide cooked food to indoor patients.
During scrutiny (August 2015) of vouchers for the period 08/2013 to 07/2015 of office of the CS, Betul, audit noticed that LPG cylinders were booked telephonically without prior approval of CS. Out of 624 LPG cylinders, 540 LPG cylinders were shown to be purchased by submitting hand written bills of the gas agency. The payment of ` 7.29 lakh for purchase of LPG cylinders was made in bank account of three employees as detailed in Appendix-3.12.1. On cross verification of these supplies with the Gas Agency, Director Gas Agency stated (August 2015) that these hand written bills were not issued by them and payment of supplies made on computerised bills only were received. It was also noticed that 97 out of 540 LPG cylinders which were shown to be purchased on hand written bills costing ` 1.18 lakh were not entered in the stock register, which indicated that cylinders shown to be purchased were not actually received. In the stock register there was no entry regarding release of cylinders. These purchases were fraudulently shown on paper only and payments were made in Bank Account of the employees as detailed in Appendix-3.12.2.
Audit further noticed that during the period 12/2012 to 07/2015 only 84 LPG cylinders were supplied by the Gas Agency for above two connections. On comparing the rate of gas cylinders for these 84 cylinders intimated by the Gas Agency, it was observed that in seven cases higher rates were claimed and number of supplied gas cylinders were manipulated through fraudulently prepared hand written bills and an excess amount of ` 40,369 was fraudulently paid to employees for purchase of 45 LPG cylinders as detailed in Appendix -3.12.3.
Thus, LPG cylinders were purchased and payment was made on the basis of hand written bills without verifying invoices presented for payment and stock entries with the certificate mentioned on the bills. As Gas Agency had denied to supply gas cylinders through hand written bills, the expenditure amounting to ` 7.69 lakh comes under the category of suspected embezzlement.
In the exit conference (October 2016), the Government stated that during investigation it was found that domestic gas bills were tempered and converted into commercial gas bills and excess payment was drawn. An amount of ` 40,369 excess drawn for purchase of LPG cylinders has been deposited through challan. Presently all gas agencies issue computerised bills and issue of handwritten bills by the Gas Agency for supply of LPG cylinder was doubtful, therefore, information regarding verification of handwritten suspected bills has been called for from Gas Agency and amount of fraudulent gas bills would be recovered from the officials after receiving the verification
Audit Report on General and Social Sectors for the year ended 31 March 2016
206
of suspected handwritten bills by the concerned Gas Agency. Disciplinary action was being taken against the erring officials.
It was further stated that letters have been issued to District Food and Civil Supplies officers to streamline the system of supply of gas cylinders to Government hospitals and making payment to Gas Agency through electronic medium.
3.13 Stamp duty short/not levied and registration not done
Government was deprived of revenue of `̀̀̀ 93.76 lakh due to short/non
levy of stamp duty and failure to register lease deeds.
Section 33 (c) of Schedule 1-A of Indian Stamp Act (IS Act), 1899, provides for levy of stamp duty at 8 per cent
51 on conveyance on a lease deed where the lease is granted for a premium in addition to rent fixed at the rates prescribed from time to time therein. Further, as per Article II of Table of Registration fees annexed to the Registration Act, 1908, Registration fee is leviable at three fourth of the stamp duty. Section 17(d) of the Registration Act, 1908 provides that the registration of documents of leases of immovable property from year to year, or for any term exceeding one year, or reserving a yearly rent is compulsory. Besides, Section 33 of the IS Act provides that it would be obligatory on every person in charge of a public office to impound cases which are unduly stamped and initiate action to get it duly stamped.
Para 3.1.3 of the Comptroller and Auditor General of India’s Report No. 3 of 2015 and Para 3.1.6 of C&AG of India’s Report No. 1 of 2016 have highlighted short levy of stamp duty and non-registration of lease deeds by Rogi Kalyan Samitis.
Directorate, Health Services Madhya Pradesh issued direction (August 2014) to all Chief Medical and Health Officer (CMHOs) and Civil Surgeon-cum-Hospital Superintendents (CSs) to estimate the loss incurred and issue notices to all the concerned to deposit the remaining stamp duty. CMHOs and CSs were directed to deposit the balance amount and to submit the compliance report within 15 days.
During scrutiny of records of CMHO Ashok Nagar (July 2015), Civil Hospital Garoth and Community Health Centre Shamgarh under CMHO Mandsaur (March 2015 and July 2016) relating to the allotment of shops, audit noticed that the Rogi Kalyan Samities (RKSs) of these health institutions had rented out shops to private individuals at the highest premium. These RKSs had rented out total 109 shops52 on 35/36-months basis with provisions for further extension of period and revision of rent by 10 to 25 per cent after every three years and as per conditions of auction agreement/ lease deeds were to be executed. In these cases, the allotment was done on premium/offset price in addition to rent fixed for three/ten years, which was revisable from time to time. According to Section 33 (c) ibid, an aggregate stamp duty of ` 53.61 lakh was payable on the basis of premium/offset price on the executable
51
Revised to 7.5 per cent w.e.f. 1 July 1997, 8 per cent w.e.f. 1 July 2002, 7.5 per cent w.e.f. 1 April 2008 and 5.0 per cent w.e.f. 1 April 2011.
52 CMHOs Mandsaur (103 Shops) and Ashok Nagar (06 Shops).
Chapter III: Compliance Audit
207
instruments as detailed in Appendix-3.13.1. Audit noticed that for 50 shops of Civil Hospital, Garoth and five shops of Community Health Centre, Shamgarh under CMHO, Mandsaur no agreement was executed by RKS and for remaining shops the instruments were executed on stamp papers of ` 50 to ` 150 only and stamp duty of ` 5,300 was levied on these instruments resulting in short/non levy of stamp duty of ` 53.56 lakh. Audit further observed that these executable/executed instruments were also required to be registered and Registration fees amounting to ` 40.20 lakh was leviable, which could not be realised. Thus, the Government was deprived of revenue of ` 93.76 lakh. This indicated failure of the CM&HOs and CS in discharging their duties for the purpose of the IS Act inspite of instructions of Directorate, Health Services. The short/non levy was not noticed by the Registration Department because the deeds were not registered by the Public Health and Family Welfare Department.
The matter was reported to the Government (April 2016). In the exit conference (October 2016), the Government verified the fact and figures of audit observation and intimated that as per business rules the recoveries had been handed over to Registration Department and Inspector General Registration has also been intimated accordingly.
Thus due to failure of CMHOs in implementing provisions of IS Act and Registration Act, the Government was deprived of revenue of ` 93.76 lakh due to short/non levy of stamp duty and non-registration of lease deeds.
3.14 Unauthorised expenditure
Unauthorised expenditure of `̀̀̀ 1.39 crore was incurred by Civil
Surgeon-cum-Hospital Superintendents Barwani and Sagar and Civil
Surgeon, Jai Prakash Hospital, Bhopal on outsourcing of excess
cleaning staff in violation of prescribed norms.
The State Government started Kayakalp Abhiyan with main objective to provide tidy arrangements and cleanliness in all the hospitals. The Director, Health Services (DHS), Madhya Pradesh, Bhopal issued directions (April 2013) to strengthen the cleaning arrangements in the Government hospitals which provided that house-keeping facilities would be arranged through outsourcing by open tenders in the Government hospitals of the State. Strength of cleaning staff was prescribed on the basis of number of beds in the hospitals. The number of cleaning staff was to be calculated by deducting the number of cleaning staff already posted in the health institutions by the Department or through any other source. Cleaning staff in excess of the prescribed norms would be deployed only in cases of urgency and under special circumstances by obtaining the prior approval of the next higher authority i.e. Joint Director, Health Services.
During test check of records of the Civil Surgeon cum Hospital Superintendent (CS), Barwani (June 2015) and, Sagar (December 2015) and CS, Jai Prakash Hospital, Bhopal (January 2016), audit noticed that total number of cleaning staff prescribed as per strength of beds in the hospitals was outsourced and number of staff already deployed in these hospitals was not deducted. Thus number of cleaning staff outsourced was in excess of the
Audit Report on General and Social Sectors for the year ended 31 March 2016
208
prescribed norms, as detailed in Appendix-3.14.1 and 3.14.2. Moreover, the approval for deployment of excess cleaning staff was also not taken from the higher authority. Thus, these hospitals incurred unauthorised expenditure of ` 1.39 crore on outsourcing of excess cleaning staff in violation of prescribed norms.
On this being pointed out, the CS, Barwani stated (September 2016) that letter was written (January 2015) to Directorate, Health Services, Bhopal to outsource more employees than prescribed number but approval was still awaited. The CS, Sagar stated (September 2016) that sanction for excess deployment of staff was not obtained. The CS, (J.P. Hospital) Bhopal stated (September 2016) that 90 cleaning staff were working in place of 66 as per verbal instructions of the Principal Secretary, Health. Further, stated that Director Health Services, Bhopal was requested to accord post-facto approval, which was still awaited.
The matter was reported to the Government (June 2016). In the exit conference (October 2016), the Government replied that in district hospital, Barwani as per 400 bedded hospital three cleaning staff were found in excess with ` 3.64 lakh excess expenditure; in district hospital, Bhopal as per 300 bedded hospital, 36 cleaning staff were found in excess with ` 33.91 lakh excess expenditure and in district hospital, Sagar, as per 400 bedded hospital, 12 cleaning staff were in excess with ` 14.98 lakh excess expenditure. Other necessary data were being collected and complete reply would be furnished shortly. However, any order in respect of upgradation of number of beds in district hospitals Barwani and Sagar was not provided.
Reply furnished by the Government was not acceptable as the approval of higher authority for outsourcing of excess cleaning staff was not accorded and in respect of district hospitals Barwani and Sagar deployment of excess cleaning staff by assuming 400 bedded hospital was not justified.
PUBLIC HEALTH ENGINEERING DEPARTMENT
3.15 Undue favour to contractor
The minimum time limit prescribed for submission of tenders through
e-tenders was not adhered to by office of Executive Engineer, Public
Health Engineering, Shivpuri, in awarding departmental works of
estimated cost of `̀̀̀ 2.61 crore which led to undue favour to participating
contractors.
According to order issued (February 1992) by the Engineer-in-Chief, Public Works Department, Madhya Pradesh, Bhopal for construction works costing more than ` two lakh and up to ` 25 lakh it was mandatory to place advertisements in one Hindi and one English news paper of State level besides two local news papers (one Hindi and one English). Engineer-in-chief, Public Health Engineering Department (PHE), Madhya Pradesh, Bhopal re-iterated (June 2005) the directions of the Government that the time limit for receipt of tenders from the date of tender notice should be 15 days in case of first tender call and 10 days in case of second and subsequent tender calls. It was also
Chapter III: Compliance Audit
209
directed that strict compliance of these instructions should be ensured otherwise disciplinary action may be initiated.
Public Works Department, Government of Madhya Pradesh decided (May 2012) that all the tenders should be invited through e-tendering. However, Public Health Engineering Department, exempted (February 2014) departmental construction works (except drilling of tube wells) up to ` two lakh from the process of e-tendering.
During scrutiny of records (March 2015 and June 2016) of office of the Executive Engineer (EE), Public Health Engineering, Shivpuri relating to tendering process it was noticed that during May 2014 to November 2014, e-tenders for 32 departmental construction works of total estimated cost of ` 2.61 crore were invited. Under e-tendering system, bidders were required to download the required documents/tender schedule from the Portal and to prepare and upload the required bid documents to submit their bids online on the Portal along with the scanned copy of Demand Draft of Earnest Money Deposit (EMD) and has to sign digitally. Audit observed that for online submission of these e-tenders, in 28 cases time ranging from only 20 minutes to an hour was allowed, in three cases 14 hours 43 minutes to one day and in one case 10 days’ time was allowed, whereas minimum 15 days’ time was to be allowed for submission of tenders (Details are given in Appendix-3.15.1).
Audit further noticed that e-tendering in most of the cases was processed in late hours around midnight due to which only one to two tenderers could participate in e-tendering of these works and works were awarded to the contractors in the first call. Tender notices were published only in local Hindi news papers and not in the State level news papers. Moreover, very short span of time was allowed for submission through e-tendering (in most of the cases in the midnights) due to which only limited number of tenderers could participate and benefit of competition was not ensured. Thus, prescribed minimum time limit for submission of e-tenders was not adhered to, which led to undue favour to the participating tenderers.
On this being pointed out the EE, Shivpuri stated (March 2015) that several tenders of this type were submitted to higher office and sanctions were accorded without any objection regarding the time limit. He further stated that due to excessive work, dongle and password were handed over to the tender in-charge. Compliance of on-line process would be ensured in the future.
The Department stated (August 2016) that two member’s committee enquired the highlighted irregularities and found that proper purchase time was not allowed. The Executive Engineer unofficially gave his user ID and Password to then Divisional Accounts Officer and Assistant Draftsman. These officials were doing the work of tender on behalf of EE. The EE was also guilty for authorising Divisional Accounts officer to handle the tender in place of an Assistant Engineer. Report has been submitted to the Government for conducting detailed Departmental Enquiry against the concerned officials.
Fact remains that the instructions for allowing minimum time limit for receipt of tenders and thus ensuring wide dissemination was not adhered to, which led to undue favour to the contractors in awarding departmental works through e-tenders in the first call.
Audit Report on General and Social Sectors for the year ended 31 March 2016
210
The matter was reported to the Government (June 2016); their reply has not been received (January 2017).
SCHOOL EDUCATION DEPARTMENT
3.16 Irregular retention of Sarva Shiksha Abhiyan fund
District Project Co-ordinator, Zila Shiksha Kendra, Vidisha released
subsequent instalments for construction works in schools under Sarva
Shiksha Abhiyan, without ensuring evaluation of work done by previous
instalment which led to irregular retention of ` ` ` ` 1.59 crore by
construction agencies.
According to directions issued (September 2005) by Rajya Shiksha Kendra, Madhya Pradesh, Bhopal for construction works in Schools under Sarva
Shiksha Abhiyan (SSA), Zila Shiksha Kendra would release the fund directly to construction agency. Gram Panchayats were made the construction agency for all the village level construction works sanctioned under SSA.
Administrative sanctions for the construction of new schools and improvement of infrastructure of existing school buildings were issued by Zila Shiksha
Kendra according to annual work plans of Sarva Shiksha Abhiyan with the conditions that 50 per cent of construction cost as first installment would be provided in bank account of concerned Gram Panchayats opened for construction work under SSA. The second instalment of 35 per cent was to be released after utilisation of first instalment and evaluation of work by Sub Engineer. Third installment of the remaining 15 per cent was to be released after utilisation of second installment and evaluation by Sub Engineer. Concerned Gram Panchayat was responsible to start the work and complete it within the stipulated time of three/four months.
Test check of records (September 2015) relating to construction of new schools and improvement of infrastructure of existing school buildings in the office of District Project Co-ordinator (DPC), Zila Shiksha Kendra, Vidisha and further information collected (December 2016) in respect of incomplete works, Audit noticed that in seven blocks of the district, for 151 works funds amounting to ` 486.99 lakh were sanctioned during 2007-08 to 2013-14. Total amount of ` 381.19 lakh was provided in three installments53 to Gram
Panchayats for these construction works. The total valuation amount of work done for these incomplete works was ` 196.30 lakh whereas concerned construction agencies i.e. Gram Panchayats withdrew an amount of ` 355.14 lakh from their respective earmarked bank accounts out of total funds of ` 381.19 lakh provided to Gram Panchayats. This indicated that without ensuring the evaluation of constructed work, subsequent instalments were released to construction agencies resulting in irregular withdrawal in excess of evaluation amount by the construction agencies as detailed in Appendix
3.16.1. Excess drawn amount was not recovered from the construction agencies. During joint physical verification it was noticed that out of 151 works, 24 works were not started, for 100 works construction work was
53 ` 250.75 lakh, ` 125.33 lakh and ` 5.11 lakh as first, second and third installment
respectively.
Chapter III: Compliance Audit
211
stopped for three to four years, 22 works were in progress and 05 works were completed for which amount drawn in excess of valuation amount was recoverable (details are given in Appendix 3.16.2). Further, audit noticed that in 13 cases of Block Lateri, the Court had passed orders (June-July 2015) to recover the excess drawn amount from the then office bearers of Gram
Panchayat as arrears of land revenue but the recovery was not made (Appendix 3.16.1). These works were lying incomplete for two to eight years whereas these were to be completed during the same year (year wise detail of incomplete works given in Appendix 3.16.3).
Thus, due to non-observance of instructions of Rajya Shiksha Kendra and lack of supervision and monitoring, subsequent installments were released without ensuring evaluation of work done by the previous installment which led to irregular excess withdrawal of ` 158.84 lakh by the concerned Gram
Panchyats. The excess drawn amount remained un-recovered besides the students were also deprived of the intended benefit of construction of school building/additional rooms.
In the exit conference (November 2016), the Government verified the facts and figures of audit observation and stated that process of recovery by submitting cases to the Hon’ble Court of Sub Divisional Magistrate was under process. Show cause notices have been issued to Assistant Engineers and Sub Engineers concerned for works not started and incomplete works.
As the subsequent instalments were to be released after utilisation of previous installment and evaluation of work done by concerned Sub Engineer and the works were to be completed within a stipulated period of three to four months, laxity on the part of DPC, Zila Shiksha Kendra, Vidisha was obvious. Had DPC, Zila Shiksha Kendra been vigilant about utilisation of funds and monitored the progress of works, irregular retention of ` 158.84 lakh (44.73 per cent of withdrawn amount) by the construction agencies could have been avoided.
TECHNICAL EDUCATION AND SKILL DEVELOPMENT
DEPARTMENT
3.17 Fraudulent payment
Fraudulent double payment amounting to `̀̀̀ 2.25 lakh was made to
Vocational Training Providers for the same training courses by the Chief
Executive Officer, Madhya Pradesh Council for Vocational Education
and Training, Bhopal.
In order to provide vocational training to early school leavers and existing workers, Skill Development Initiative Scheme (SDIS) was launched (May 2007) by Ministry of Labour and Employment, Government of India (GoI). Training under SDIS was provided by various Vocational Training Providers (VTPs) registered under Central Government, State Governments, Public and Private Sector and Industrial Establishments/Institutes etc. Training cost was reimbursed to VTPs as per rate fixed by the Director General of Employment & Training (DGE&T), Ministry of Labour and Employment, GoI from time to

Audit Report on General and Social Sectors for the year ended 31 March 2016
212
time. Para 7.11 of Operations Manual for SDIS issued by DGE&T, provided that after training and assessment, VTPs shall submit bills for payment/ reimbursement of training costs to the concerned Directorate of the State.
Rule-193 of MPTC provided that the Drawing and Disbursing Officer (DDO) would be responsible for drawing the admissible amount of claim from the treasury and its disbursement. Further Rule-198 of MPTC provided that the responsibility for an overcharge shall rest primarily with the drawer of the bill, in the event of culpable negligence on his part, recovery may be considered.
During test check of records (December 2015) related with the training imparted under SDIS in office of the Chief Executive Officer (CEO), Madhya Pradesh Council for Vocational Education and Training (MPCVET), Bhopal audit noticed that for each batch of training an unique Training Batch Number (TBN) was being generated on-line through portal. However no record was found to be maintained in respect of details of participants of training and batch wise attendance sheet of the trainees. Scrutiny of vouchers revealed that double claims towards reimbursement of training cost amounting to ` 2.25 lakh for the same batch of training with same TBN, pertaining to same period and same course were passed and paid to two VTPs54 registered under MPCVET, Bhopal as detailed in the Appendix 3.17.1. In both cases audit observed that claim No. 00388551 amounting to ` 90,000 of Goodwill Advance Academy, Chhindwara was fraudulently manipulated by overwriting on tens digit to make it claim No. 00388531 and was passed and paid. Similarly claim No. 00494591 amounting to ` 1,35,000 of Mousam Gramin
Utthan Samaj Seva Samiti, Sehore was also fraudulently manipulated by overwriting on tens digit to make it claim No. 00494581 and was passed and paid. Thus, DDO could not trace the manipulated bills and amount of ` 2,25,000 (` 90,000 + ` 1,35,000) for double bills were passed and paid to two VTPs for the same training courses which resulted into fraudulent double payment to the tune of ` 2.25 lakh.
On this being pointed out, Additional Director, MPCVET, Bhopal stated (July 2016) that Goodwill Advance Academy, Chhindwara had accepted to receive excess payment for wrong claim and excess paid amount of ` 90,000 has been recovered. Further stated (October 2016) that Mousam Gramin Uthan Samaj
Seva Samiti, Sehore was directed to produce records but the relevant record were not submitted by them due to which investigation could not be done. On receiving the records from the VTP concerned, investigation process would be completed and audit would be intimated accordingly. The Government also endorsed (September 2016) the reply furnished by Additional Director, MPCVET, Bhopal.
Thus, the claim passing authority failed to verify claims with reference to Claim No., Training Batch No., name of the course and course code and the period of training before passing bills which resulted to fraudulent double payment amounting to ` 2.25 lakh to VTPs for the same batches and same course of training conducted during same period.
54
Goodwill Advance Academy, Chhindwara and Mousam Gramin Utthan Samaj Seva Samiti, Sehore.
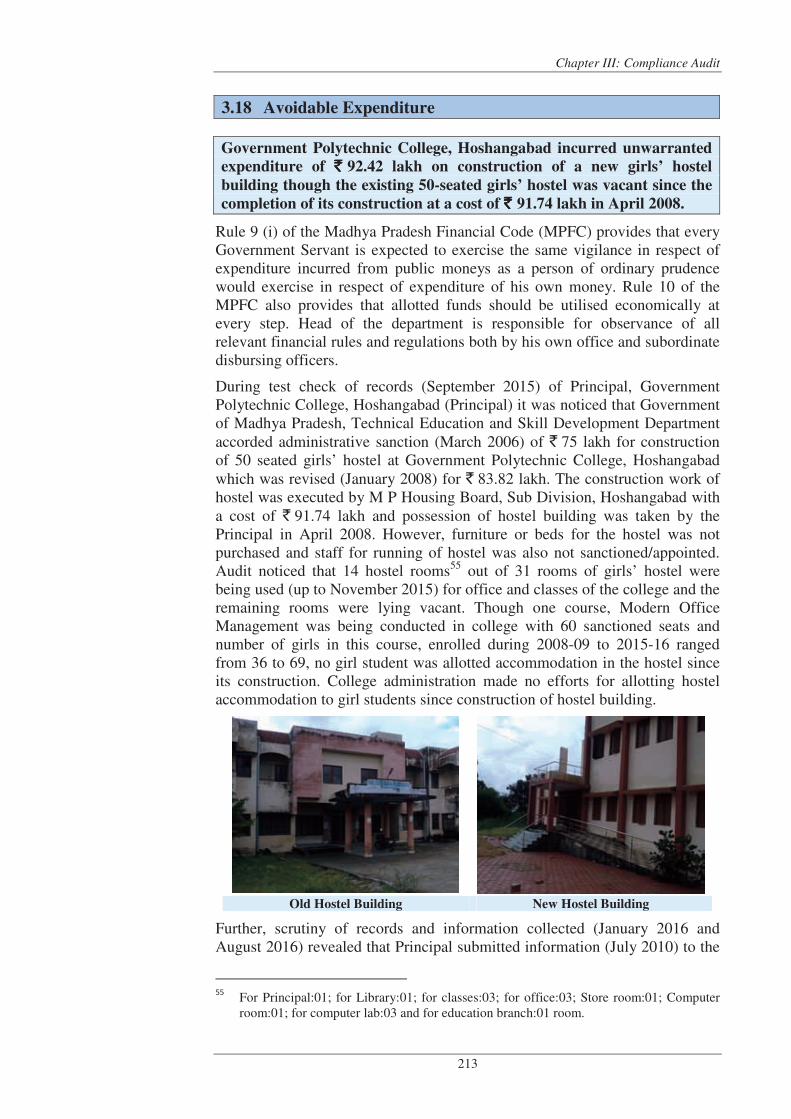
Chapter III: Compliance Audit
213
3.18 Avoidable Expenditure
Government Polytechnic College, Hoshangabad incurred unwarranted
expenditure of `̀̀̀ 92.42 lakh on construction of a new girls’ hostel
building though the existing 50-seated girls’ hostel was vacant since the
completion of its construction at a cost of `̀̀̀ 91.74 lakh in April 2008.
Rule 9 (i) of the Madhya Pradesh Financial Code (MPFC) provides that every Government Servant is expected to exercise the same vigilance in respect of expenditure incurred from public moneys as a person of ordinary prudence would exercise in respect of expenditure of his own money. Rule 10 of the MPFC also provides that allotted funds should be utilised economically at every step. Head of the department is responsible for observance of all relevant financial rules and regulations both by his own office and subordinate disbursing officers.
During test check of records (September 2015) of Principal, Government Polytechnic College, Hoshangabad (Principal) it was noticed that Government of Madhya Pradesh, Technical Education and Skill Development Department accorded administrative sanction (March 2006) of ` 75 lakh for construction of 50 seated girls’ hostel at Government Polytechnic College, Hoshangabad which was revised (January 2008) for ` 83.82 lakh. The construction work of hostel was executed by M P Housing Board, Sub Division, Hoshangabad with a cost of ` 91.74 lakh and possession of hostel building was taken by the Principal in April 2008. However, furniture or beds for the hostel was not purchased and staff for running of hostel was also not sanctioned/appointed. Audit noticed that 14 hostel rooms55 out of 31 rooms of girls’ hostel were being used (up to November 2015) for office and classes of the college and the remaining rooms were lying vacant. Though one course, Modern Office Management was being conducted in college with 60 sanctioned seats and number of girls in this course, enrolled during 2008-09 to 2015-16 ranged from 36 to 69, no girl student was allotted accommodation in the hostel since its construction. College administration made no efforts for allotting hostel accommodation to girl students since construction of hostel building.
Old Hostel Building New Hostel Building
Further, scrutiny of records and information collected (January 2016 and August 2016) revealed that Principal submitted information (July 2010) to the
55 For Principal:01; for Library:01; for classes:03; for office:03; Store room:01; Computer
room:01; for computer lab:03 and for education branch:01 room.
Audit Report on General and Social Sectors for the year ended 31 March 2016
214
Director, Technical Education, Bhopal indicating requirement of another 50 seated girls’ hostel. There was nothing on record to ascertain the justification for projection of new girls’ hostel, as the existing girls' hostel was not utilised since its construction. Technical Education and Skill Development Department, Government of MP accorded administrative approval (January 2012) of ` one crore for construction of 50 bed new Girls' Hostel under Centrally sponsored scheme “Women’s Hostels in Polytechnics” and M.P. Public Works Department was nominated as construction agency. Construction work has already been completed and the building was taken over (January 2016). The utilisation certificate of ` 92.42 lakh was submitted (December 2015) by construction agency.
Thus, the Department sanctioned construction of a new 50-seated girls’ hostel for the College on the basis of erroneously projected requirement for additional 50-seated girls’ hostel, despite the fact that existing 50-seated hostel was without any occupancy since completion of its construction in April 2008. The unwarranted construction of new hostel led to avoidable expenditure of ` 92.42 lakh.
On this being pointed out, the Government replied (June 2016) that girls’ hostel building could not be utilised as only one course was running in the college and admission was taken by only local girl students. It was also stated that the process for starting four new courses was under progress and new girls’ hostel could be used after starting of five courses in the college.
Reply was not acceptable because proper assessment of requirement of hostel was not done before taking decision of construction of new hostel by responsible authorities and an avoidable expenditure of ` 92.42 lakh was incurred on its construction and there was nothing on record regarding justification for construction of new girls’ hostel. Moreover, already existing 50-seated girls’ hostel was not utilised for intended purpose even after more than seven years of its construction, thereby rendering an expenditure of ` 91.74 lakh unfruitful.
TRIBAL WELFARE DEPARTMENT
3.19 Loss of interest
The instructions of the Assistant Commissioner, Tribal Development,
Barwani to the bank to not provide any interest on the amount
deposited in the bank led to loss of `̀̀̀ 1.78 crore to the Public Account.
The Finance Department, Government of Madhya Pradesh (May 2011) issued instructions that it was responsibility of the Drawing and Disbursing Officer to deposit the interest earned on the money withdrawn from the Consolidated Fund and deposited in bank account(s), under the “0049 receipt head”, till 15th April of each financial year unless there were instructions for utilisation of interest for specific scheme.
During test check (April 2016) of records of the Office of Assistant Commissioner, Tribal Development (ACTD), Barwani, and information further collected (October 2016) audit noticed that a saving bank account
Chapter III: Compliance Audit
215
number 023910200011461 in Narmada Jhabua Grameen Bank, Barwani was being operated in name of ACTD. Funds pertaining to various schemes like electrification, Basti Vikas, etc. were deposited in this bank account and as this was a saving bank account, interest was being credited by the bank to this account. Audit observed that while ACTD was in the charge of the office, a letter was issued (July 2012) to the bank by Shri K.B.S. Chauhan, Area Organiser (AO) with the seal of ACTD, to not provide any interest on the amounts deposited in the bank account from 2010-11. The letter was issued without obtaining approval of ACTD. As the account was operated by ACTD and AO was not authorized to operate the account, the bank authorities should have verified the authenticity of the letter by verification of signature on the letter or through obtaining re-confirmation from ACTD before taking any action. But the bank authorities did not verify authenticity of the letter and stopped credit of interest. Bank also made a reverse entry and debited previously accrued and credited interest upto September 2012 amounting to ` 30.89 lakh. Audit found that if the bank would not have reversed the credit entry and stopped further credit of interest, interest amounting to ` 1.78 crore would have been credited to the account till 25.05.2016. Thus in gross violation of instructions of Finance Department, letter was unauthorisedly issued by A.O. with designation and seal of the ACTD to the bank to stop credit of interest which resulted into loss of ` 1.78 crore to the Public Account.
On this being pointed out by the audit, the ACTD accepted (April 2016 and May 2016) the facts and stated that correspondence would be made with the bank for obtaining the interest on the saving account. The bank has intimated (October 2016) that action for credit of interest would be taken after receiving directions from higher office.
The fact remains that the highly irregular action of the Shri K.B.S. Chauhan, Area Organiser in violation of instructions issued by Finance Department, the Government lost interest amounting to ` 1.78 crore on the funds deposited in the bank account and Public Account was deprived of the receipts of ` 1.78 crore. Possibility of collusion between bank authorities and the then Area Organiser also could not be ruled out. No disciplinary action was taken by department against the erring officers for causing this obvious loss to the Government and favouring the Bank.
The matter was reported to the Government (June 2016); their reply has not been received (January 2017).
3.20 Unfruitful Expenditure
Expenditure amounting to `̀̀̀ 3.59 crore incurred on establishment of
2,846 village grain banks in five districts was rendered unfruitful
besides loss of ` ` ` ` 15.75 crore on account of cost of food grains due to not
functioning of these village grain banks.
Ministry of Consumer Affair, Food and Public Distribution, Government of India (GoI) revised (February 2006) the Village Grain Bank scheme. The revised scheme envisaged inclusion of all willing Below Poverty Line and Antyodaya Anna Yojana families in the villages identified by the State Governments as chronically food deficit areas. The main objective of the
Audit Report on General and Social Sectors for the year ended 31 March 2016
216
scheme was to provide safeguard against starvation during the period of natural calamity or during the lean season when the marginalized food insecure households did not have sufficient resources to purchase the rations. Such people in need of food grains would be able to borrow food grains from Village Grain Banks set up within the village. The estimated cost of each grain bank was ` 0.60 lakh56.In Madhya Pradesh, the scheme was implemented by Mission Director, Rajeev Gandhi Khadyan Surksha Mission which was functioning under the administrative control of the Commissioner, Tribal Development Department (CTD). The scheme provided for establishment of one grain bank for every 40 families in tribal areas. The food grains borrowed from the grain banks was to be returned by the beneficiaries (a) in the form of food grains, or (b) in the form of food grains or wages receivables for work, or (c) in cash for maintaining rotation of food grains. Grain Bank Committees were made responsible (February 2006) for implementation of the scheme at village level. Each group of 30-40 families would establish a Grain Bank Committee out of which an Executive Committee consisting of 3 to 5 persons including at least a women was to be formed for effective participation and management of grain bank. Assistant Commissioners, Tribal Development (ACTD)/District Organisor Tribal Welfare (DOTW) and the Chief Executive Officer, Janpad Panchayat would be responsible (November 2006) for implementing the scheme. The monthly progress report was to be sent by the AC to the CTD on the 10th of the subsequent month. Quarterly progress report in respect of operation of grain banks was required to be sent to GoI. The state government was responsible for evaluating the functioning of the grain banks as per the guidelines issued by the GoI.
During scrutiny of records (October 2014 and May 2015) of Mission Director, Rajeev Gandhi Khadyan Surksha Mission, Bhopal, (Director), and further follow up scrutiny (July 2016) audit noticed that the GoI sanctioned 4240 grain banks in 21 districts in the State during 2006-07 to 2010-2011. Since 2011-12, the GoI did not sanction any new grain bank. Scrutiny regarding operational position of grain banks in five57 districts revealed that out of sanctioned 2,972 grain banks, 2,846 grain banks were established by incurring an expenditure of ` 3.59 crore and ` 15.75 crore58 were provided for cost of food grains as detailed in Appendix-3.20.1. Audit found that all 2,846 grain banks of these five districts were not functioning. Audit observed that after distribution of food grains to intended beneficiaries it was not returned by them and there was no record regarding entry in the ration cards at the time of distribution. Functioning of the Scheme was not monitored as monthly progress reports and any information regarding operation of grain banks were
56
Out of ` 0.60 lakh, ` 0.14 lakh for establishment expenses out of which ` 12,200 was central share for cost of storage, training, monitoring and transportation charges; ` 1,800 was to be provided by State govt. on account of transportation charges and rest amount (` 0.46 lakh) for 40 quintals food grain.
57 Mandla (August 2015), Dindori (July 2015), Sehore (May 2015), Jhabua (May
2016), Barwani (May 2016) and Mission Director, Rajeev Gandhi Khadyan Surksha Mission, Bhopal (July 2016).
58 Cost of food grain has been worked out on the basis of UCs furnished by district authorities regarding quantity of food grain utilised for establishment of grain bank sand GoI is economic cost of food grain.
Chapter III: Compliance Audit
217
not available in ACTD/DOTW offices. Monthly progress reports were also not sent to the CTD by ACTDs/ DOTWs. The Directorate has no information regarding the present status of operation of the grain banks in the State. Thus the expenditure amounting to ` 3.59 crore incurred on establishment of 2,846 grain banks was rendered unfruitful besides loss of ` 15.75 crore on account of cost of food grains.
On this being pointed out in the audit the Director stated (October 2014) that there was lack of interest of villagers in Grain Bank operation and the scheme has also become ineffective due to implementation of the Food Security Act. It was further stated (May 2015 and July 2016) that instructions for regular operation and supervision of grain banks were issued at the time of establishment of grain banks. Operational position of the grain banks was not clear as monthly progress reports and information regarding operation of grain banks were not being received from the districts. Letters were being regularly issued to district Collectors regarding grain bank and action was being taken against those district officers who were not furnishing information.
The replies of the Director were not acceptable because functioning of the grain banks was not monitored and evaluated at ACTDs/DOTWs and CTD levels. The village grain banks were established during 2006-07 to 2010-11, i.e. prior to introduction of National Food Security Act (NFSA), which was implemented with effect from September 2013. NFSA had also provided for reforms in targeted public distribution system, which included support to local public distribution models and grain banks.
The matter was reported to the Government (May 2016); their reply has not been received (January 2017).
URBAN DEVELOPMENT AND ENVIRONMENT
DEPARTMENT
3.21 Blockade of funds
Due to abnormal delay in execution of works of core components, the
project “Abatement of Pollution and Environmental Improvement of
Sagar lake”, had been abandoned and an amount of `̀̀̀ 7.70 crore
remained blocked for more than nine years.
National Lake Conservation Plan (NLCP) was being implemented by the Ministry of Environment and Forests, GoI, New Delhi since 2001 for conservation and management of polluted and degraded lakes with the main objective to encourage and assist the State Governments for sustainable management and conservation of lakes.
During test check of records (January 2016) and further information collected (June 2016) from office of the Executive Director, Environmental Planning and Coordination Organisation (EPCO), Bhopal relating to the project Abatement of Pollution and Environmental Improvement of Sagar Lake (Project) under NLCP, audit noticed that National River Conservation Directorate, Ministry of Environment & Forests (NRCD, MoEF), GoI, New Delhi issued (March 2007) Administrative approval and Expenditure Sanction amounting to ` 21.33 crore for the project and released Grant-in-aid of ` 4.00

Audit Report on General and Social Sectors for the year ended 31 March 2016
218
crore towards mobilisation advance. The Scheme was to be shared on 70:30 basis between the Government of India (GoI) and the Government of Madhya Pradesh (GoMP) and scheduled to be completed within 36 months from the date of sanction. The works of project were divided into core components and non-core components. Total 15 works were to be completed under the Scheme. For the project EPCO was nodal agency and implementing agency was Municipal Corporation, Sagar. GoMP released its matching share of ` 426.65 lakh59 to EPCO. EPCO released an amount of ` 5.50 crore60 to the implementing agency, Municipal Corporation, Sagar towards execution of works under the project.
Audit observed that State level Empowered Committee was constituted (August 2007) by GoMP in the Chairmanship of the Principal Secretary, Housing and Environment Department to ensure uninterrupted operation of the project and to ensure timely and qualitative sound execution of works. The committee was required to meet at least once in three months to review and monitor the performance of project. A Steering committee was also constituted (September 2007) by GoMP in the Chairmanship of the Commissioner to co-ordinate execution of the project at field level. The Committee was required to meet at least once in three months and report the progress of work to the Nodal agency EPCO and State level Empowered Committee.
Audit noticed that the works could not be started as the identified land in Wamankhedi for Sewage Treatment Plant (STP) could not be acquired due to substantial rise in the land cost. To setup STP based on advanced Cyclic Activated Sludge Technology another site at Sanjay Drive was selected (September 2008), but this land could not be made available to Municipal Corporation due to land disputes. After three years, Empowered Committee in its meeting dated 24 July 2010 decided that works of core components (sewerage system) would be executed through Public Health Engineering Department as Municipal Corporation was technically not competent to execute the works of core component. Empowered Committee in its meeting dated 23 January 2012 further decided that NLCP sewerage and STP should be integrated with the Urban Infrastructure Development Scheme for Small and Medium Towns (UIDSSMT) and a single STP be set up at the proposed site at village Bhensa, Sagar and Collector Sagar was directed to ensure the availability/acquisition of land for STP at village Bhensa by March 2012. However, the land could not be acquired due to stay order of Hon’ble High Court and the work of sewerage system could not be started. Further, an alternative Government land at village Patharia Hat was reserved by Collector, Sagar for development of STP but the work was not started (October 2016). The status of project was reviewed in a meeting held (May 2014) in NRCD, MoEF, New Delhi and it was decided that as the sewerage works for the Sagar lake project have not started for the last six years, and there was no likelihood of their implementation in the near future, the State Government/Local Body needs to consider taking up these works under the UIDSSMT scheme for the
59 ` 142.23 lakh in 2007-08, ` 142.21 lakh in 2008-09 and ` 142.21 lakh in 2009-10.
60 First Installment: ` 1.00 crore (September 2007); Second Installment: ` 2.00 crore (January 2008) and third Installment: ` 2.50 crore (February 2009).
Chapter III: Compliance Audit
219
town in an integrated manner and deleted them from the scope of the NLCP project. In that eventuality, the funds released by MoEF for the works would need to be refunded back to the Ministry along with the interest accrued and the project brought to a close.
During scrutiny of utilisation certificate submitted to NRCD, MoEF, New Delhi by EPCO for the year ended March 2015 Audit noticed that an amount of ` 1.77 crore was shown as incurred on execution of five non-core components61 by adding centages of ` 79.86 lakh (81.79 per cent) whereas only eight per cent centages were admissible and works of three non-core components were not executed as detailed in Appendix 3.21.1. Moreover the works of core components were even not started which resulted in blockade of money to the tune of ` 7.70 crore for more than nine years. Municipal Corporation, Sagar has refunded (July 2015) the un-utilised fund along with the interest accrued amounting to ` 5.43 crore to EPCO.
Thus, without ascertaining the availability of land, various sites were identified for development of STP which could not be acquired. Due to lackadaisical approach of the department in proper identification and acquisition of land for STP and lack of effective monitoring, works of core components of the project could not be started even after lapse of nine years resulting that the project had been abandoned/closed. Funds amounting to ` 7.70 crore earmarked for execution of core components remained blocked with EPCO and the project could not be operationalised.
On this being pointed out, ED, EPCO stated (July 2016) that core works of interception and diversion of Sewer Pumping Station and STP could not be taken up due to reasons that land for STP could not be acquired, stay order from court and cost escalation.
Reply was not acceptable because due to abnormal delay in acquisition of land works of core component of the project could not be started and the project had been abandoned. Thus the department had lost an opportunity for restoration and conservation of Sagarlake and pollution abatement and environmental improvement of Sagar lake could not be ensured due to lackadaisical approach of the department to acquire the land for such an important issue of pollution abatement of water bodies.
The matter was reported to the Government (June 2016); their reply has not been received (January 2017).
WOMEN AND CHILD DEVELOPMENT DEPARTMENT
3.22 Suspected embezzlement
Suspected embezzlement amounting to `̀̀̀ 1.88 lakh in organisation of
workshops/seminars under Usha Kiran and Ladli Lakshmi Scheme.
Note under Rule 192 of Madhya Pradesh Treasury Code Vol-I provided that cash memo without containing an acknowledgment of the receipt of money from persons named therein would not be treated as receipts within the
61
Lake front development, Catchment Area Treatment, Low Cost Sanitation/Toilet blocks, Floating fountain and monitoring of lake water quality.
Audit Report on General and Social Sectors for the year ended 31 March 2016
220
meaning of Section 2(23) of the Indian Stamp Act (II of 1899). Further, the mere writing of the purchaser’s name and address on a cash memo for delivery purpose would not transform it into an acknowledgment to the purchaser that the money has been paid. Cash memo would not, therefore, be regarded as sub-vouchers in audit unless it contain an acknowledgment of the receipt of money from the person named therein (with stamps affixed when the amount exceeds ` 20 which subsequently revised to ` 5000), or in cases where this is not practicable, they are stamped “paid” and initialed by the Drawing and Disbursing Officer.
Rule 284 of Madhya Pradesh treasury code Vol-I provided that no money shall be drawn from the treasury unless it is required for immediate disbursement. It is serious irregularity to draw advances from the treasury in anticipation of demands or to prevent lapse of budget grants, and persons at fault render themselves liable to disciplinary action for such drawal.
According to instructions issued (March 2008) by Women and Child Development Department, for implementation of Usha Kiran Yojna, ceiling of expenditure was ` 1000 per project for wall painting, ` 3000 per project for hoardings and ` 5000 per block for organising of workshop. The Project Officer, Integrated Child Development Services (POICDS) was designated as Protection Officer and block level workshops were to be organised by Protection Officer.
Test check of the records of the Office of the Women Empowerment Officer (WEO) Chhatarpur (August 2015) and further information collected (October 2015) revealed that the allotment of ` 1.88 lakh62 was made by the Directorate, Women Empowerment, to District Women Empowerment Officer (DWEO)for workshops/seminars and other charges during 2013-14. On the basis of allotment, DWEO prepared sanction order for advance drawal and said amount was withdrawn (October 2013 and December 2013) from the treasury Chhatarpur through four bills and amounts were deposited in personal saving bank account (Account no. 10797167151, State Bank of India, Branch Rajnagar, Chhatarpur) of Shri Pramod Shrivastava, the then DWEO and Drawing and Disbursing Officer (DDO). The amount was entered (October 2013 and December 2013) in cash book as temporary advance, which was shown as adjusted (28 March 2014) in cashbook.
Audit observed that entire amount of temporary advances was adjusted by three cash memos bearing the same date i.e. dated 3.3.2014 relating to lunch packets, wall painting, flex banners and rent of tent, chairs and carpets. However, shop registration number and tax index number were not mentioned in the cash memo. On the cash memos certificate indicating 'paid by me' was not recorded. The bills were verified and ‘passed for payment order’ and stamped 'Paid and cancelled' by DWEO (DDO).
On enquiry by audit, DWEO intimated (October 2015) that any record relating to organisation of workshops/seminars was not available. Further all concerned 13 POs, ICDS intimated (August 2016) that no workshop was
62
Information Education Communication (IEC) head under Ladli Lakshmi Yojna ` 0.36 lakh (September 2013) and Gharelu Hinsa under Usha Kiran Yojna ` 1.52 lakh (December, 2013).
Chapter III: Compliance Audit
221
organised in their project and no record was available regarding the organisation of workshops/seminars. Audit also noticed that though the entire amount of advance was deposited in personal bank account of the then DWEO, bank statement obtained from the bank revealed that only total amount of ` 37,002 was withdrawn during October 2013 to March 2014. Thus unauthorised deposit of Government money in personal saving account, defective cash memos and unavailability of any record relating to organisation of workshops/seminars either in DWEO’s office or in the offices of concerned POs, indicated that Government money may have been embezzled.
The matter was reported to the Government (May 2016). In the exit conference (October 2016), the Commissioner, Women Empowerment Department verified the facts and figures and stated that the matter had been investigated and financial irregularity, involving irregular payment of ` 52,000 for wall paintings was noticed. For this and other financial irregularities charge sheet against Shri Pramod Shrivastava, the then DWEO had been issued and disciplinary action was in progress. However, any clarification regarding organisation of workshops/seminars in 13 blocks was not furnished by the Department.
Gwalior (SAURABH K MALLICK)
Accountant General
(General and Social Sector Audit)
Madhya Pradesh
Countersigned
New Delhi (SHASHI KANT SHARMA)
Comptroller and Auditor General of India
The 14 March 2017
The 15 March 2017


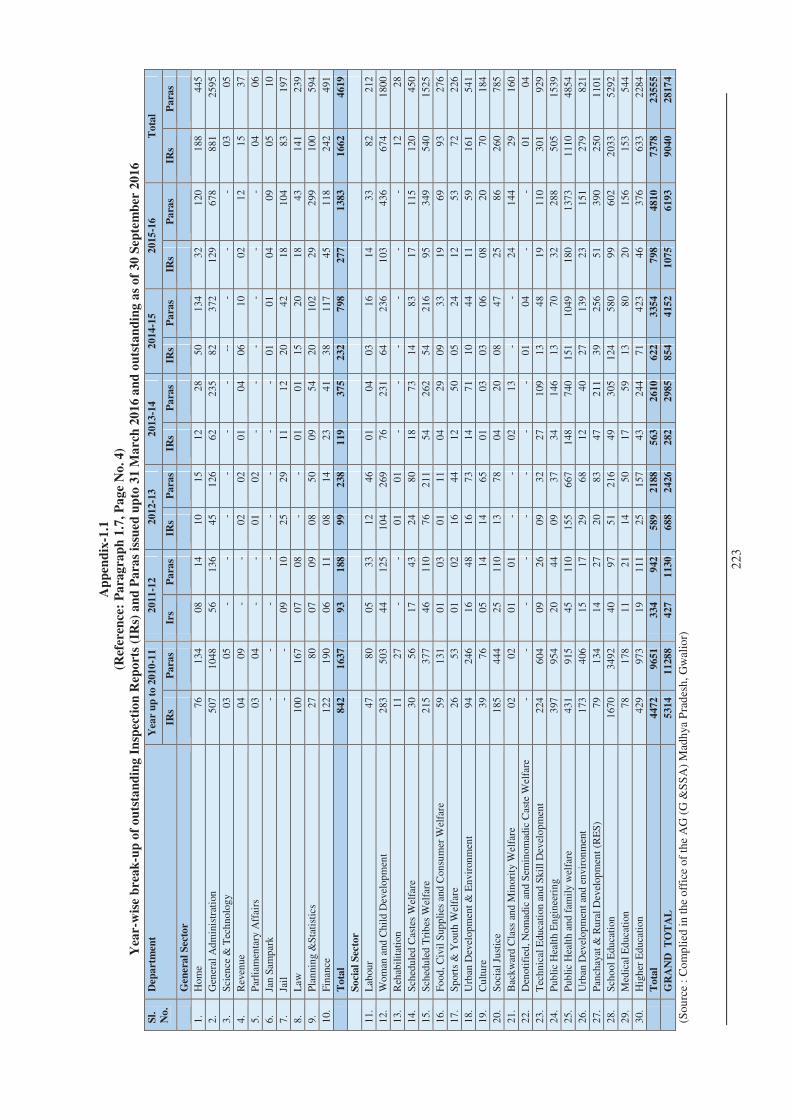
22
3
Ap
pen
dix
-1.1
(Ref
eren
ce:
Pa
rag
rap
h 1
.7, P
ag
e N
o. 4
)
Yea
r-w
ise
bre
ak
-up
of
ou
tsta
nd
ing
In
spec
tio
n R
epo
rts
(IR
s) a
nd
Pa
ras
issu
ed
up
to 3
1 M
arc
h 2
01
6 a
nd
ou
tsta
nd
ing
as
of
30
Sep
tem
ber
20
16
Sl.
No
.
Dep
art
men
t Y
ear
up
to 2
01
0-1
1
2011
-12
2012
-13
2013
-14
2014
-15
2015
-16
To
tal
IRs
Pa
ras
Irs
Pa
ras
IRs
Pa
ras
IRs
Pa
ras
IRs
Pa
ras
IRs
Pa
ras
IRs
Pa
ras
G
ener
al
Sec
tor
1.
Hom
e 7
6 1
34
08
14
10
15
12
28
50
134
3
2 1
20
188
4
45
2.
Gen
eral
Ad
min
istr
atio
n 5
07
104
8 5
6 1
36
45
126
6
2 2
35
82
372
1
29
678
8
81
259
5
3.
Sci
ence
& T
ech
nol
ogy
03
05
- -
- -
- -
--
- -
- 0
3 0
5
4.
Rev
enu
e 0
4 0
9 -
- 0
2 0
2 0
1 0
4 0
6 1
0 0
2 1
2 1
5 3
7
5.
Par
liam
enta
ry A
ffai
rs
03
04
- -
01
02
- -
- -
- -
04
06
6.
Jan
Sam
par
k -
- -
- -
- -
- 0
1 0
1 0
4 0
9 0
5 1
0
7.
Jail
-
- 0
9 1
0 2
5 2
9 1
1 1
2 2
0 4
2 1
8 1
04
83
197
8.
Law
1
00
167
0
7 0
8 -
- 0
1 0
1 1
5 2
0 1
8 4
3 1
41
239
9.
Pla
nni
ng
&S
tati
stic
s 2
7 8
0 0
7 0
9 0
8 5
0 0
9 5
4 2
0 1
02
29
299
1
00
594
10.
F
inan
ce
122
1
90
06
11
08
14
23
41
38
117
4
5 1
18
242
4
91
T
ota
l 8
42
1637
93
188
99
238
119
375
232
798
277
1383
1662
4619
S
oci
al
Sec
tor
11.
L
abou
r 4
7 8
0 0
5 3
3 1
2 4
6 0
1 0
4 0
3 1
6 1
4 3
3 8
2 2
12
12.
W
oman
and
Ch
ild
Dev
elop
men
t 2
83
503
4
4 1
25
104
2
69
76
231
6
4 2
36
103
4
36
674
1
800
13.
R
ehab
ilit
atio
n 1
1 2
7 -
- 0
1 0
1 -
- -
- -
- 1
2 2
8
14.
S
ched
ule
d C
aste
s W
elfa
re
30
56
17
43
24
80
18
73
14
83
17
115
1
20
450
15.
S
ched
ule
d T
rib
es W
elfa
re
215
3
77
46
110
7
6 2
11
54
262
5
4 2
16
95
349
5
40
152
5
16.
F
ood
, C
ivil
Sup
pli
es a
nd C
onsu
mer
Wel
fare
5
9 1
31
01
03
01
11
04
29
09
33
19
69
93
276
17.
S
por
ts &
You
th W
elfa
re
26
53
01
02
16
44
12
50
05
24
12
53
72
226
18.
U
rban
Dev
elop
men
t &
En
viro
nm
ent
94
246
1
6 4
8 1
6 7
3 1
4 7
1 1
0 4
4 1
1 5
9 1
61
541
19.
C
ult
ure
3
9 7
6 0
5 1
4 1
4 6
5 0
1 0
3 0
3 0
6 0
8 2
0 7
0 1
84
20.
S
ocia
l Ju
stic
e 1
85
444
2
5 1
10
13
78
04
20
08
47
25
86
260
7
85
21.
B
ack
war
d C
lass
and
Min
orit
y W
elfa
re
02
02
01
01
- -
02
13
- -
24
144
2
9 1
60
22.
D
enot
ifie
d, N
omad
ic a
nd
Sem
inom
adic
Cas
te W
elfa
re
- -
- -
- -
- -
01
04
- -
01
04
23.
T
ech
nic
al E
duca
tion
an
d S
kill
Dev
elo
pm
ent
224
6
04
09
26
09
32
27
109
1
3 4
8 1
9 1
10
301
9
29
24.
P
ub
lic
Hea
lth
En
gin
eeri
ng
397
9
54
20
44
09
37
34
146
1
3 7
0 3
2 2
88
505
1
539
25.
P
ub
lic
Hea
lth
and
fam
ily
wel
fare
4
31
915
4
5 1
10
155
6
67
148
7
40
151
1
049
180
1
373
111
0 4
854
26.
U
rban
Dev
elop
men
t an
d e
nvi
ron
men
t 1
73
406
1
5 1
7 2
9 6
8 1
2 4
0 2
7 1
39
23
151
2
79
821
27.
P
anch
ayat
& R
ura
l D
evel
opm
ent
(RE
S)
79
134
1
4 2
7 2
0 8
3 4
7 2
11
39
256
5
1 3
90
250
1
101
28.
S
choo
l E
duca
tion
1
670
349
2 4
0 9
7 5
1 2
16
49
305
1
24
580
9
9 6
02
203
3 5
292
29.
M
edic
al E
duc
atio
n 7
8 1
78
11
21
14
50
17
59
13
80
20
156
1
53
544
30.
H
igh
er E
duca
tion
4
29
973
1
9 1
11
25
157
4
3 2
44
71
423
4
6 3
76
633
2
284
T
ota
l 4
472
9651
334
942
589
2188
563
2610
622
3354
798
4810
7378
2355
5
G
RA
ND
T
OT
AL
5
314
1128
8
427
1130
688
2426
282
2985
854
4152
1075
6193
9040
2817
4
(So
urc
e :
Co
mp
lied
in
the
off
ice
of
the
AG
(G
&S
SA
) M
adh
ya P
rad
esh
, G
wal
ior)

Audit Report on General and Social Sectors for the year ended 31 March 2016
224
Appendix-2.1.1
(Reference: Paragraph-2.1.1.1, Page No. 12)
List of expected outcomes at national level in the implementation
framework of NRHM
Framework of Implementation 2005-2012
1. Reduce IMR to 30/1,000 live births by 2012.
2. Reduce Maternal Mortality to 100/100,000 live births by 2012.
3. Reduce TFR to 2.1 by 2012.
4. Malaria Mortality Reduction Rate - 50% up to 2010, additional 10% by 2012.
5. Kala Azar Mortality Reduction Rate - 100% by 2010 and sustaining elimination until 2012.
6. Filaria/Microfilaria Reduction Rate - 70% by 2010, 80% by 2012 and elimination by 2015.
7. Dengue Mortality Reduction Rate - 50% by 2010 and sustaining at that level until 2012.
8. Cataract operations-increasing to 46 lakhs until 2012.
9. Leprosy Prevalence Rate –reduce from 1.8 per 10,000 in 2005 to less that 1 per 10,000 thereafter.
10. Tuberculosis DOTS series - maintain 85% cure rate through entire Mission Period and also sustain planned case detection rate.
11. Upgrading all Community Health Centers to Indian Public Health Standards.
12. Increase utilization of First Referral units from bed occupancy by referred cases of less than 20% to over 75%.
13. Engaging 4,00,000 female Accredited Social Health Activists (ASHAs).
Framework of Implementation 2012-2017
1. Reduce MMR to 1/1,000 live births
2. Reduce IMR to 25/1,000 live births
3. Reduce TFR to 2.1
4. Prevention and reduction of anaemia in women aged 15–49 years
5. Prevent and reduce mortality and morbidity from communicable, non- communicable; injuries and emerging diseases
6. Reduce household out-of-pocket expenditure on total health care expenditure
7. Reduce annual incidence and mortality from Tuberculosis by half
8. Reduce prevalence of Leprosy to <1/10,000 population and incidence to zero in all districts
9. Annual Malaria Incidence to be <1/1,000
10. Less than 1 per cent microfilaria prevalence in all districts
11. Kala-Azar Elimination by 2015, <1 case per 10,000 population in all blocks

Appendices
225
Appendix-2.1.2
(Reference: Paragraph-2.1.3, Page No. 14)
List of sampled districts/CHCs/PHCs/SCs/ASHAs and Beneficiaries
Sl.
No.
Name of
sampled
district/
DHS /DH
Name of
sampled
CHC
Name of
sampled PHC
Name of sampled SC Number
of ASHAs
No. of
Benefi-
ciaries
(1) (2) (3) (4) (5) (6) (7)
Low Performing Districts
1 Anuppur
Jaithari
Lapta Choui, Jariyari, Lapta 07 35
Sindhora Gorasi, Khursa, Sulkhari
07 30
Kotma
Bijuri Bhagta, Bijuri, Perichua
03 30
Chondi Pondi Chondi, Darsagar, Pondi
08 30
2 Dhar
Bakaner
Kalibawadi Dhabya, Lawani, Utawad
07 30
Umarban Badiya, Bhanpura, Petlabad
09 30
Pithampur
Bagdi Bhadkya, Govindpura, Sagadi
08 30
Nalchha Mograbhav, Lunhera, Aali
08 30
Tirla
Satipura Bhuvada, Ghodabhav, Sangvikala
07 31
Khadanbujurg Dilwara, Himatgarh, Salkanpur
09 30
3 Dindori
Bajag
Chanda Bachhargaon, Chanda, Lalpur
09 30
Gadasarai Harra, Sukulpura, Sunhadadar
07 30
Karanjiya
Baharpur Baharpur, Gopalpur, Sadwachhapur
09 30
Gorakhpur Gorakhpur, Mohtara, Sailwara
09 30
4 Tikamgarh
Jatara
Dighora Bamoribarana, Bilgainya, Dighora
13 15
Mohangarh Achhra, Brishbhanpura, Ekbalpura
03 10
Prithivipur
Jiron Bhopalpura, Kakwani, Luharguan
13 11
Simra Dhaura, Simrabhata, Virsagar
13 13
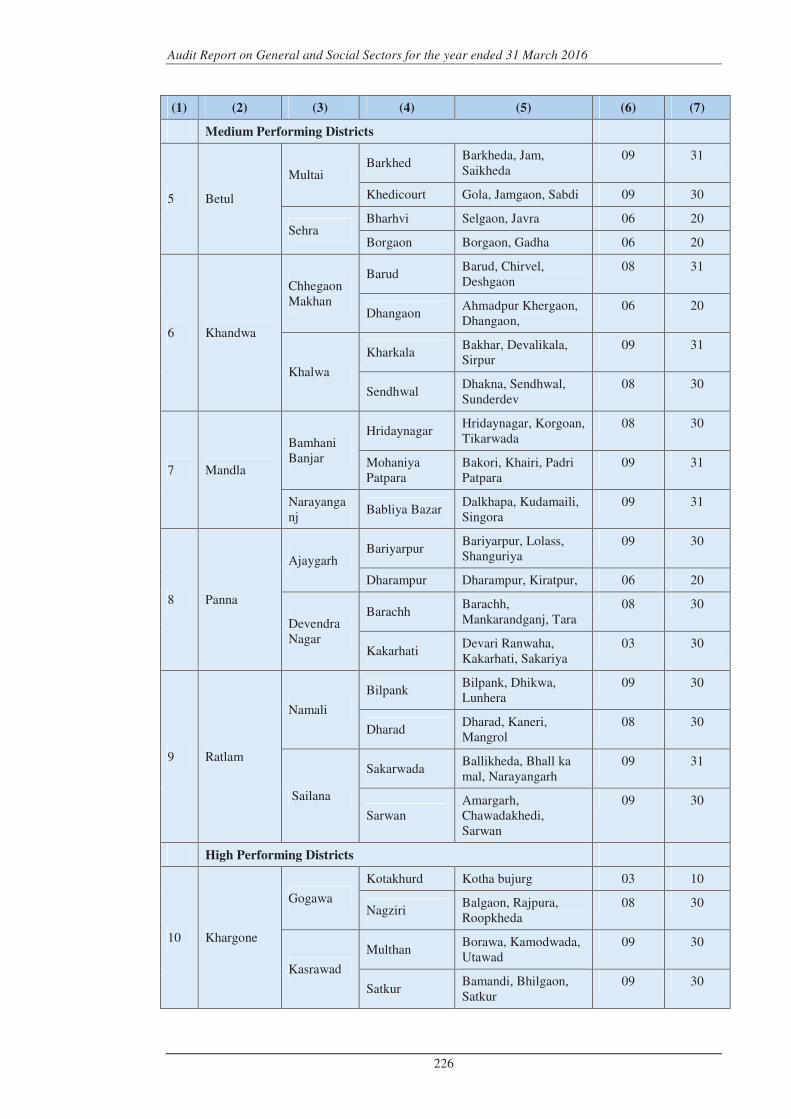
Audit Report on General and Social Sectors for the year ended 31 March 2016
226
(1) (2) (3) (4) (5) (6) (7)
Medium Performing Districts
5 Betul
Multai Barkhed
Barkheda, Jam, Saikheda
09 31
Khedicourt Gola, Jamgaon, Sabdi 09 30
Sehra Bharhvi Selgaon, Javra 06 20
Borgaon Borgaon, Gadha 06 20
6 Khandwa
Chhegaon Makhan
Barud Barud, Chirvel, Deshgaon
08 31
Dhangaon Ahmadpur Khergaon, Dhangaon,
06 20
Khalwa
Kharkala Bakhar, Devalikala, Sirpur
09 31
Sendhwal Dhakna, Sendhwal, Sunderdev
08 30
7 Mandla
Bamhani Banjar
Hridaynagar Hridaynagar, Korgoan, Tikarwada
08 30
Mohaniya Patpara
Bakori, Khairi, Padri Patpara
09 31
Narayanganj
Babliya Bazar Dalkhapa, Kudamaili, Singora
09 31
8 Panna
Ajaygarh Bariyarpur
Bariyarpur, Lolass, Shanguriya
09 30
Dharampur Dharampur, Kiratpur, 06 20
Devendra Nagar
Barachh Barachh, Mankarandganj, Tara
08 30
Kakarhati Devari Ranwaha, Kakarhati, Sakariya
03 30
9 Ratlam
Namali
Bilpank Bilpank, Dhikwa, Lunhera
09 30
Dharad Dharad, Kaneri, Mangrol
08 30
Sailana
Sakarwada Ballikheda, Bhall ka mal, Narayangarh
09 31
Sarwan Amargarh, Chawadakhedi, Sarwan
09 30
High Performing Districts
10 Khargone
Gogawa
Kotakhurd Kotha bujurg 03 10
Nagziri Balgaon, Rajpura, Roopkheda
08 30
Kasrawad
Multhan Borawa, Kamodwada, Utawad
09 30
Satkur Bamandi, Bhilgaon, Satkur
09 30
Appendices
227
(1) (2) (3) (4) (5) (6) (7)
11 Neemuch
Manasa
Kukdeshwar Badkuwa, Bhadwa, Chandrapura
09 30
Mahagarh Antri, Devari Khawasa, Khajuri
09 30
Jeeran
Bisalwaskala Bisalwaskala, Malkheda, Nevad
09 30
Bordiyakala Javi, Revali Devali, Sawan
09 30
12 Raisen
Gairatganj Devnagar Amkheda, Dehgaon, Hinotia
09 08
Sanchi
Deewanganj Banskheda, Jamuniya, Khoa
06 16
Salamatpur Dhakna Chhapna, Salamatpur
05 10
13 Rajgarh
Jeerapur
Goghatpur Goghatpur, Kumda, Pipliya Kulmi
09 30
Machalpur Kodkya, Machalpur, Rajahedi
07 31
Khilchipur
Chhapiheda Bhatkheda, Khajuri Gukul, Ranara
09 30
Somwariya Biaora Kala, Jaitpura kala, Kulikheda
09 30
13 27 52 149 416 1386
Appendix-2.1.3
(Reference: Paragraph- 2.1.7.1, Page No. 19)
Status of ANC services in 13 test-checked districts during 2011-12 to 2015-16
Year Total pregnant
women
registered for
ANC
Registered
within 1st
trimester (12
weeks)
Received 3
ANC check-up
during
pregnancy
Given TT1
during
current
pregnancy
Given TT2
or booster
during
current
pregnancy
Pregnant
women given
100 IFA
tablets
2011-12 434825 231203 346430 310801 371174 362092
2012-13 399441 223977 323977 289659 338464 368479
2013-14 424303 249145 339784 299696 343804 403901
2014-15 437137 295545 366721 329855 363335 430937
2015-16 433521 296606 366448 319228 357302 433651
Total 2129227 1296476
(61%)
1743360
(82%)
1549239 1774079
(83%)
1999060
(94%)
(Source: Data collected from HMIS of DHSs)
Au
dit
Rep
ort
on
Gen
era
l an
d S
ocia
l S
ecto
rs f
or
the y
ea
r end
ed
31 M
arc
h 2
01
6
22
8
Ap
pen
dix
-2.1
.4
(Ref
eren
ce:
Pa
rag
rap
h-2
.1.7
.2,
Pa
ge
No
. 2
0)
Sta
tus
of
del
iver
y c
are
in
th
e S
tate
du
rin
g 2
01
1-1
2 t
o 2
01
5-1
6
Yea
r D
eliv
erie
s O
ut
of
del
iver
ies
in p
ub
lic
inst
itu
tio
n w
om
en
dis
cha
rged
wit
hin
48
ho
urs
Nu
mb
er o
f m
oth
ers
pa
id J
SY
in
cen
tiv
e
for
pu
bli
c
inst
itu
tio
na
l
del
iver
ies
Ho
me
del
iver
ies
att
end
ed b
y
un
tra
ined
SB
A
Ho
me
del
iver
ies
wh
ere
new
bo
rn
wer
e v
isit
ed
wit
hin
24
ho
urs
Pu
bli
c
Inst
itu
tio
ns
Pri
va
te
Inst
itu
tio
ns
Inst
itu
tio
na
l
Del
iver
y
Ho
me
del
iver
ies
To
tal
del
iver
ies
20
11
-12
11
574
12
12
649
4 1
28
390
6 2
06
938
14
908
44
44
444
3 1
07
642
5 1
57
195
11
894
6
20
12
-13
10
636
64
10
129
8 1
16
496
2 2
02
039
13
670
01
40
749
3 9
74
377
14
817
3 1
24
951
20
13
-14
10
963
38
75
444
1
17
178
2 1
86
272
13
580
54
41
553
4 1
00
528
2 1
32
557
10
366
2
20
14
-15
11
051
02
10
671
4 1
21
181
6 1
57
659
13
694
75
14
359
3 9
47
982
11
290
5 1
18
872
20
15
-16
11
156
92
13
900
2 1
25
469
4 1
42
969
13
976
63
11
489
1 9
67
634
11
403
8 1
13
183
To
tal
55
382
08
54
895
2
60
871
60
89
587
7
69
830
37
15
259
54
49
717
00
66
486
8
57
961
4
(S
ou
rce:
Sta
te H
ealt
h S
oci
ety
, H
MIS
)
Ap
pen
dic
es
22
9
Ap
pen
dix
-2.1
.5
(Ref
eren
ce:
Pa
rag
rap
h-
2.1
.8.2
, P
ag
e N
o.
25
)
Sta
tus
of
imm
un
isa
tio
n
Yea
r T
ub
ercu
losi
s (B
CG
) P
oli
o (
OP
V)
DP
T (
Dip
hth
eria
, P
ertu
ssis
,
Tet
nu
s)
Mea
sles
H
epa
titi
s B
Ta
rget
A
chie
vem
ent
Ta
rget
A
chie
vem
ent
Ta
rget
A
chie
vem
ent
Ta
rget
A
chie
vem
ent
Ta
rget
A
chie
vem
ent
20
11
-12
17
214
54
15
017
78
17
214
54
14
297
44
17
214
54
15
751
12
17
214
54
15
677
95
17
214
54
12
404
47
20
12
-13
17
741
92
14
107
94
17
741
92
14
552
36
17
741
92
14
929
20
17
741
92
14
749
36
17
741
92
14
625
60
20
13
-14
18
093
51
14
009
42
18
093
51
14
772
07
18
093
51
14
748
62
18
093
51
14
663
10
18
093
51
14
734
50
20
14
-15
17
768
24
13
708
33
17
768
24
13
894
76
17
768
24
14
585
96
17
768
24
14
454
94
17
768
24
14
519
33
20
15
-16
18
110
86
13
912
30
18
110
86
14
096
12
18
110
86
14
279
38
18
110
86
14
432
50
18
110
86
14
402
73
To
tal
88
929
07
70
755
77
88
929
07
71
612
75
88
929
07
74
294
28
88
929
07
73
977
85
88
929
07
70
686
63
Sh
ort
fall
1
81
73
30
(2
0%
) 1
73
16
32
(1
9%
) 1
46
34
79
(1
6%
) 1
49
51
22
(1
7%
) 1
82
42
44
(2
1%
)
(So
urc
e: S
tate
Hea
lth
So
ciet
y)
Ap
pen
dix
-2.1
.6
(Ref
eren
ce:
Pa
rag
rap
h-
2.1
.8.2
, P
ag
e N
o.
25
)
Sta
tem
ent
sho
win
g a
ge-
wis
e v
acc
ina
tio
n
Yea
r T
arg
et f
or
imm
un
isa
tio
ns
up
to
on
e y
ear
of
ag
e
Act
ua
l
ach
iev
em
en
t
up
to
on
e y
ear
of
ag
e
Sh
ort
fall
T
arg
ets
for
imm
un
isa
tio
ns
ab
ov
e o
ne
& h
alf
yea
r o
f a
ge
Act
ua
l
ach
iev
em
en
t
ab
ov
e o
ne
&
ha
lf y
ear
of
ag
e
Sh
ort
fall
T
arg
et f
or
imm
un
isa
tio
ns
ab
ov
e fi
ve
yea
r
of
ag
e
Act
ua
l
ach
iev
em
en
t
ab
ov
e fi
ve
yea
r
of
ag
e
Sh
ort
fall
20
11
-12
17
214
54
14
810
78
24
037
6 1
46
659
1 1
20
448
8 2
62
103
14
457
31
62
900
8 8
16
723
20
12
-13
17
741
92
14
139
13
36
027
9 1
52
377
2 1
23
590
6 2
87
866
15
015
95
62
762
6 8
73
969
20
13
-14
18
093
51
14
262
80
38
307
1 1
56
854
3 1
23
591
6 3
32
627
15
460
55
68
800
4 8
58
051
20
14
-15
17
768
24
13
853
38
39
148
6 1
54
116
0 1
27
779
1 2
63
369
15
193
90
80
714
1 7
12
249
20
15
-16
18
110
86
14
037
88
40
729
8 1
57
086
0 1
37
806
0 1
92
800
15
486
70
10
468
54
50
181
6 T
ota
l 8
89
29
07
71
103
97
1
78
25
10
(20
%)
76
709
26
63
321
61
1
33
87
65
(17
%)
75
614
41
37
986
33
37
628
08
(50
%)
(Sou
rce:
Sta
te H
ealt
h S
oci
ety
Au
dit
Rep
ort
on
Gen
era
l an
d S
ocia
l S
ecto
rs f
or
the y
ea
r end
ed
31 M
arc
h 2
01
6
23
0
Ap
pen
dix
-2.1
.7
(Ref
eren
ce:
Pa
rag
rap
h 2
.1.9
.2,
Pa
ge
No
. 2
6)
Po
siti
on
of
ma
le a
nd
fem
ale
ste
rili
sati
on
s
Yea
r N
SV
1
La
pro
sco
pic
2
Min
ila
p3
Po
st-p
art
um
ster
iliz
ati
on
4
To
tal
ster
ilis
ati
on
Pla
nn
ed
Ach
iev
ed
Pla
nn
ed
Ach
iev
ed
Pla
nn
ed
Ach
iev
ed
Pla
nn
ed
Ach
iev
ed
Pla
nn
ed
Ach
iev
ed
20
11
-12
70
000
4
54
50
35
000
0 4
31
350
14
000
0 6
96
24
14
000
0 3
03
89
70
000
0 5
94
905
20
12
-13
70
000
1
53
81
35
000
0 2
67
435
14
000
0 5
89
83
14
000
0 2
48
90
70
000
0 4
39
006
20
13
-14
50
000
6
11
0 2
50
000
27
321
2 1
00
000
43
450
1
00
000
20
103
5
00
000
40
072
8
20
14
-15
62
500
5
91
0 3
12
500
29
751
0 1
25
000
44
956
1
25
000
25
710
6
25
000
37
000
0
20
15
-16
50
000
9
92
4 2
50
000
31
993
0 1
00
000
43
369
1
00
000
30
963
5
00
000
40
667
4
To
tal
30
250
0
82
775
(27
%)
15
125
00
15
894
37
(10
5%
)
60
500
0
26
038
2
(43
%)
60
500
0
13
205
5
(22
%)
30
250
00
22
113
13
(73
%)
(So
urc
e: S
tate
Hea
lth
So
ciet
y)
1 T
he
No-
Sca
lpel
vas
ecto
my
is a
tec
hniq
ue
use
d t
o d
o th
e va
sect
omy
thro
ugh
on
e si
ngl
e p
unc
ture
. T
he
pun
ctu
re i
s m
ade
in t
he
scro
tum
and
req
uire
s n
o su
turi
ng
or s
titc
hes
. 2
Lap
aros
cop
ic s
urg
ery,
als
o ca
lled
min
ima
lly i
nva
sive
su
rgery
(M
IS),
band
aid
su
rgery
, or
key
hole
su
rger
y,
is a
mod
ern
su
rgic
al t
echn
iqu
e in
wh
ich
oper
atio
ns
are
per
form
ed f
ar f
rom
th
eir
loca
tion
thro
ugh
sm
all
inci
sion
s (u
sual
ly 0
.5–1
.5 c
m)
else
wh
ere
in t
he
bod
y.
3 M
inil
apar
otom
y, g
ener
ally
ref
erre
d t
o a
s “m
inil
ap,”
is
an a
bdom
inal
su
rgic
al a
ppro
ach
to
the
fall
opia
n
tub
es b
y m
ean
s of
an
in
cisi
on l
ess
than
5 c
m i
n l
engt
h.
As
a st
eril
izat
ion
pro
cedu
re f
or p
erm
anen
tly
oc
clu
din
g th
e fa
llop
ian
tub
es.
4 P
ost
pa
rtu
m s
teri
liza
tio
n i
s st
eril
izat
ion
per
form
ed a
fter
th
e b
irth
of
a ba
by.
Aft
er a
wom
an g
ives
bir
th,
the
fall
opia
n t
ub
es a
nd t
he
stil
l-en
larg
ed u
teru
s ar
e lo
cate
d j
ust
un
der
th
e ab
dom
inal
wal
l b
elo
w t
he
nav
el.
Pos
tpar
tum
ste
rili
zati
on i
dea
lly
is d
one
bef
ore
the
ute
rus
retu
rns
to i
ts n
orm
al l
ocat
ion
, usu
ally
wit
hin
a f
ew h
ours
or
day
s fo
llo
win
g d
eliv
ery.
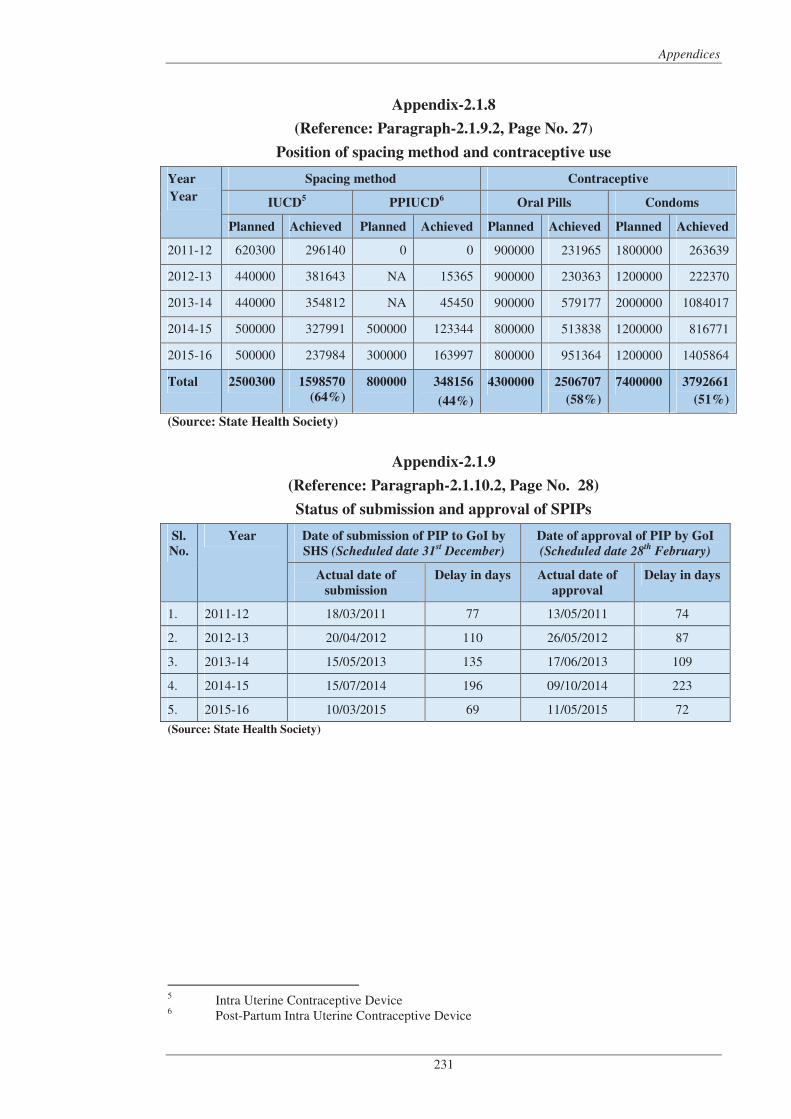
Appendices
231
Appendix-2.1.8
(Reference: Paragraph-2.1.9.2, Page No. 27)
Position of spacing method and contraceptive use
Year
Year
Spacing method Contraceptive
IUCD5 PPIUCD
6 Oral Pills Condoms
Planned Achieved Planned Achieved Planned Achieved Planned Achieved
2011-12 620300 296140 0 0 900000 231965 1800000 263639
2012-13 440000 381643 NA 15365 900000 230363 1200000 222370
2013-14 440000 354812 NA 45450 900000 579177 2000000 1084017
2014-15 500000 327991 500000 123344 800000 513838 1200000 816771
2015-16 500000 237984 300000 163997 800000 951364 1200000 1405864
Total 2500300 1598570
(64%)
800000 348156
(44%)
4300000 2506707
(58%)
7400000 3792661
(51%)
(Source: State Health Society)
Appendix-2.1.9
(Reference: Paragraph-2.1.10.2, Page No. 28)
Status of submission and approval of SPIPs
Sl.
No.
Year Date of submission of PIP to GoI by
SHS (Scheduled date 31st December)
Date of approval of PIP by GoI
(Scheduled date 28th
February)
Actual date of
submission
Delay in days Actual date of
approval
Delay in days
1. 2011-12 18/03/2011 77 13/05/2011 74
2. 2012-13 20/04/2012 110 26/05/2012 87
3. 2013-14 15/05/2013 135 17/06/2013 109
4. 2014-15 15/07/2014 196 09/10/2014 223
5. 2015-16 10/03/2015 69 11/05/2015 72
(Source: State Health Society)
5 Intra Uterine Contraceptive Device 6 Post-Partum Intra Uterine Contraceptive Device
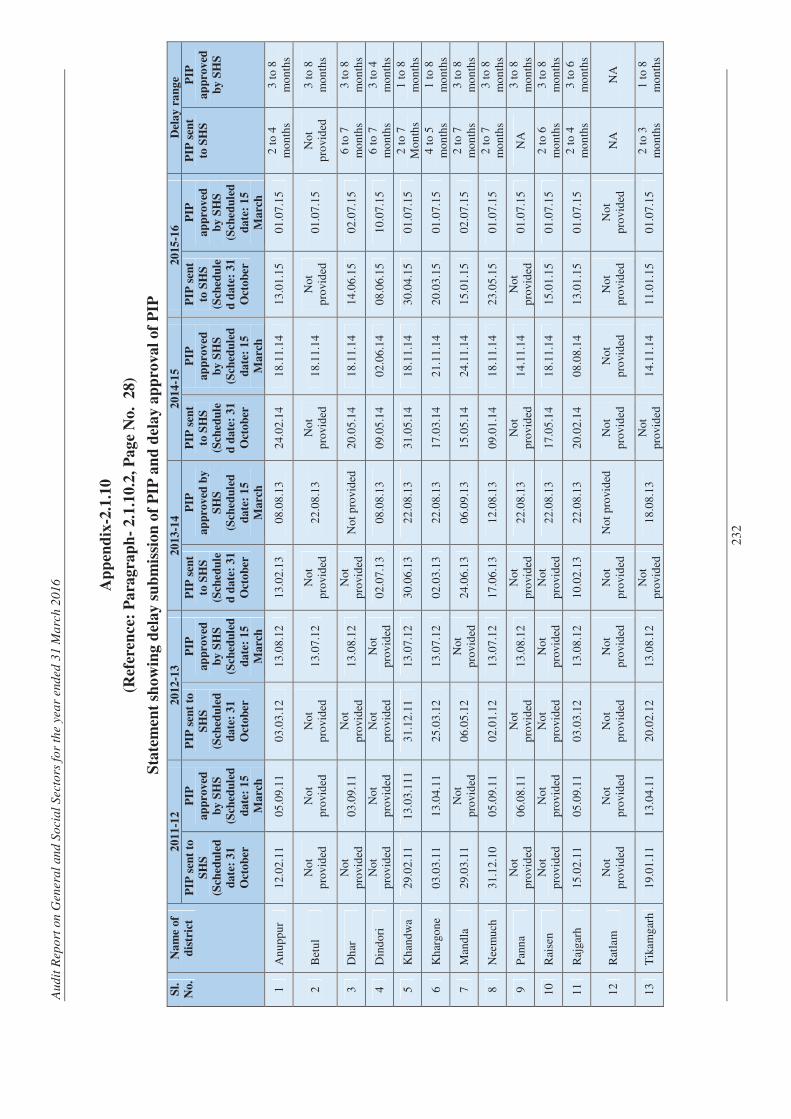
Au
dit
Rep
ort
on
Gen
era
l an
d S
ocia
l S
ecto
rs f
or
the y
ea
r end
ed
31 M
arc
h 2
01
6
23
2
Ap
pen
dix
-2.1
.10
(Ref
eren
ce:
Pa
rag
rap
h-
2.1
.10
.2,
Pa
ge
No
. 2
8)
Sta
tem
ent
sho
win
g d
elay
su
bm
issi
on
of
PIP
an
d d
ela
y a
pp
rov
al
of
PIP
Sl.
No.
Na
me
of
dis
tric
t
20
11
-12
20
12
-13
20
13
-14
20
14
-15
20
15
-16
Del
ay
ra
ng
e
PIP
sen
t to
SH
S
(Sch
ed
ule
d
date
: 3
1
Oct
ob
er
PIP
ap
prov
ed
by
SH
S
(Sch
ed
ule
d
date
: 1
5
Marc
h
PIP
sen
t to
SH
S
(Sch
ed
ule
d
date
: 3
1
Oct
ob
er
PIP
ap
prov
ed
by
SH
S
(Sch
ed
ule
d
date
: 1
5
Marc
h
PIP
sen
t
to S
HS
(Sch
ed
ule
d d
ate
: 3
1
Oct
ob
er
PIP
ap
prov
ed b
y
SH
S
(Sch
ed
ule
d
date
: 1
5
Marc
h
PIP
sen
t
to S
HS
(Sch
ed
ule
d d
ate
: 3
1
Oct
ob
er
PIP
ap
prov
ed
by
SH
S
(Sch
ed
ule
d
date
: 1
5
Marc
h
PIP
sen
t
to S
HS
(Sch
ed
ule
d d
ate
: 3
1
Oct
ob
er
PIP
ap
prov
ed
by
SH
S
(Sch
ed
ule
d
date
: 1
5
Marc
h
PIP
sen
t
to S
HS
PIP
ap
prov
ed
by
SH
S
1
An
up
pu
r 1
2.0
2.1
1 0
5.0
9.1
1 0
3.0
3.1
2 1
3.0
8.1
2 1
3.0
2.1
3 0
8.0
8.1
3 2
4.0
2.1
4 1
8.1
1.1
4 1
3.0
1.1
5 0
1.0
7.1
5 2
to
4
mo
nth
s 3
to
8
mo
nth
s
2
Bet
ul
No
t p
rovi
ded
N
ot
pro
vid
ed
No
t p
rovi
ded
1
3.0
7.1
2 N
ot
pro
vid
ed
22
.08
.13
No
t p
rovi
ded
1
8.1
1.1
4 N
ot
pro
vid
ed
01
.07
.15
No
t p
rovi
ded
3
to
8
mo
nth
s
3
Dh
ar
No
t p
rovi
ded
0
3.0
9.1
1 N
ot
pro
vid
ed
13
.08
.12
No
t p
rovi
ded
N
ot
pro
vid
ed
20
.05
.14
18
.11
.14
14
.06
.15
02
.07
.15
6 t
o 7
m
on
ths
3 t
o 8
m
on
ths
4
Din
dor
i N
ot
pro
vid
ed
No
t p
rovi
ded
N
ot
pro
vid
ed
No
t p
rovi
ded
0
2.0
7.1
3 0
8.0
8.1
3 0
9.0
5.1
4 0
2.0
6.1
4 0
8.0
6.1
5 1
0.0
7.1
5 6
to
7
mo
nth
s 3
to
4
mo
nth
s
5
Kh
and
wa
29
.02
.11
13
.03
.111
3
1.1
2.1
1 1
3.0
7.1
2 3
0.0
6.1
3 2
2.0
8.1
3 3
1.0
5.1
4 1
8.1
1.1
4 3
0.0
4.1
5 0
1.0
7.1
5 2
to
7 M
on
ths
1 t
o 8
m
on
ths
6
Kh
argo
ne
03
.03
.11
13
.04
.11
25
.03
.12
13
.07
.12
02
.03
.13
22
.08
.13
17
.03
.14
21
.11
.14
20
.03
.15
01
.07
.15
4 t
o 5
m
on
ths
1 t
o 8
m
on
ths
7
Man
dla
2
9.0
3.1
1 N
ot
pro
vid
ed
06
.05
.12
No
t p
rovi
ded
2
4.0
6.1
3 0
6.0
9.1
3 1
5.0
5.1
4 2
4.1
1.1
4 1
5.0
1.1
5 0
2.0
7.1
5 2
to
7
mo
nth
s 3
to
8 m
on
ths
8
Nee
mu
ch
31
.12
.10
05
.09
.11
02
.01
.12
13
.07
.12
17
.06
.13
12
.08
.13
09
.01
.14
18
.11
.14
23
.05
.15
01
.07
.15
2 t
o 7
m
on
ths
3 t
o 8
m
on
ths
9
Pan
na
No
t p
rovi
ded
0
6.0
8.1
1 N
ot
pro
vid
ed
13
.08
.12
No
t p
rovi
ded
2
2.0
8.1
3 N
ot
pro
vid
ed
14
.11
.14
No
t p
rovi
ded
0
1.0
7.1
5 N
A
3 t
o 8
m
on
ths
10
Rai
sen
N
ot
pro
vid
ed
No
t p
rovi
ded
N
ot
pro
vid
ed
No
t p
rovi
ded
N
ot
pro
vid
ed
22
.08
.13
17
.05
.14
18
.11
.14
15
.01
.15
01
.07
.15
2 t
o 6
m
on
ths
3 t
o 8
m
on
ths
11
Raj
garh
1
5.0
2.1
1 0
5.0
9.1
1 0
3.0
3.1
2 1
3.0
8.1
2 1
0.0
2.1
3 2
2.0
8.1
3 2
0.0
2.1
4 0
8.0
8.1
4 1
3.0
1.1
5 0
1.0
7.1
5 2
to
4
mo
nth
s 3
to
6
mo
nth
s
12
Rat
lam
N
ot
pro
vid
ed
No
t p
rovi
ded
No
t p
rovi
ded
No
t p
rovi
ded
No
t p
rovi
ded
No
t p
rovi
ded
N
ot
pro
vid
ed
No
t p
rovi
ded
No
t p
rovi
ded
No
t p
rovi
ded
N
A
NA
13
Tik
amg
arh
1
9.0
1.1
1 1
3.0
4.1
1 2
0.0
2.1
2 1
3.0
8.1
2 N
ot
pro
vid
ed
18
.08
.13
No
t p
rovi
ded
1
4.1
1.1
4 1
1.0
1.1
5 0
1.0
7.1
5 2
to
3
mo
nth
s 1
to
8
mo
nth
s
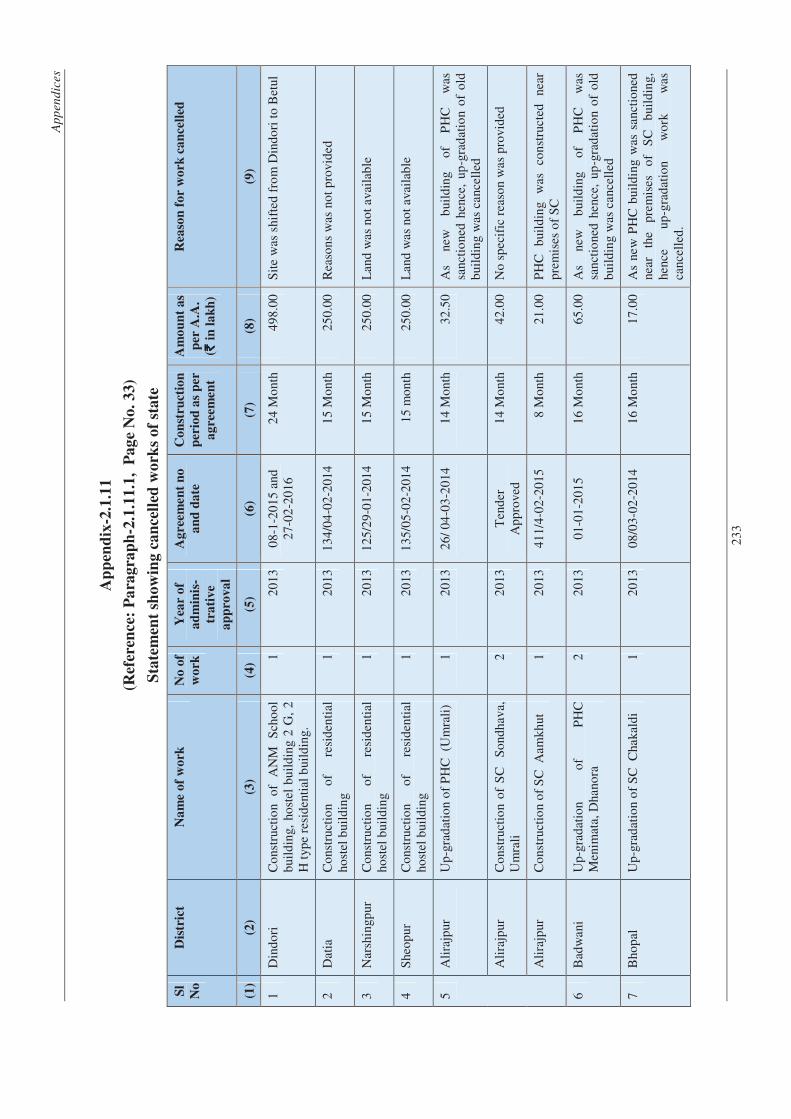
Ap
pen
dic
es
23
3
Ap
pen
dix
-2.1
.11
(Ref
eren
ce:
Pa
rag
rap
h-2
.1.1
1.1
, P
ag
e N
o.
33
)
Sta
tem
ent
sho
win
g c
an
cell
ed w
ork
s o
f st
ate
Sl
No
Dis
tric
t N
am
e o
f w
ork
N
o o
f
wo
rk
Yea
r o
f
ad
min
is-
tra
tiv
e
ap
pro
va
l
Ag
reem
en
t n
o
an
d d
ate
Co
nst
ruct
ion
per
iod
as
per
ag
reem
ent
Am
ou
nt
as
per
A.A
.
(`̀̀̀ i
n l
ak
h)
Rea
son
fo
r w
ork
ca
nce
lled
(1)
(2)
(3)
(4)
(5)
(6)
(7)
(8)
(9)
1
Din
do
ri
Co
nstr
ucti
on
of
AN
M
Sch
oo
l b
uild
ing,
ho
stel
bu
ild
ing
2 G
, 2
H
typ
e re
sid
enti
al b
uild
ing.
1
20
13
08
-1-2
01
5 a
nd
27
-02
-20
16
24
Mo
nth
49
8.0
0 S
ite
was
shi
fted
fro
m D
ind
ori
to
Bet
ul
2
Dat
ia
Co
nstr
ucti
on
of
resi
den
tial
ho
stel
bui
ldin
g
1
20
13
13
4/0
4-0
2-2
014
15
Mo
nth
25
0.0
0 R
easo
ns
was
no
t p
rovi
ded
3
Nar
shin
gpur
C
ons
truc
tio
n o
f re
sid
enti
al
host
el b
uild
ing
1
2
01
3 1
25
/29
-01
-201
4 1
5 M
ont
h 2
50
.00
Lan
d w
as n
ot
avai
lab
le
4
She
op
ur
Co
nstr
ucti
on
of
resi
den
tial
ho
stel
bui
ldin
g
1
20
13
13
5/0
5-0
2-2
014
15
mo
nth
2
50
.00
Lan
d w
as n
ot
avai
lab
le
5
Ali
rajp
ur
Up
-gra
dat
ion
of
PH
C
(Um
rali
) 1
2
01
3 2
6/
04
-03
-20
14
14
Mo
nth
32
.50
As
new
b
uild
ing
o
f P
HC
w
as
sanc
tio
ned
hen
ce,
up-g
rad
atio
n o
f o
ld
bui
ldin
g w
as c
ance
lled
Ali
rajp
ur
Co
nstr
ucti
on
of
SC
S
ond
hav
a,
Um
rali
2
2
01
3 T
end
er
Ap
pro
ved
1
4 M
ont
h 4
2.0
0 N
o s
pec
ific
rea
son
was
pro
vid
ed
Ali
rajp
ur
Co
nstr
ucti
on
of
SC
A
amk
hut
1
2
01
3 4
11
/4-0
2-2
015
8
Mo
nth
2
1.0
0 P
HC
b
uild
ing
was
co
nst
ruct
ed
near
p
rem
ises
of
SC
6
Bad
wan
i U
p-g
rad
atio
n o
f P
HC
M
enim
ata,
Dha
nora
2
2
01
3 0
1-0
1-2
01
5 1
6 M
ont
h 6
5.0
0 A
s ne
w
bui
ldin
g
of
PH
C
was
sa
ncti
one
d h
ence
, up
-gra
dat
ion
of
old
b
uild
ing
was
can
cell
ed
7
Bho
pal
U
p-g
rad
atio
n o
f S
C
Cha
kald
i 1
2
01
3 0
8/0
3-0
2-2
014
1
6 M
ont
h 1
7.0
0 A
s ne
w P
HC
bui
ldin
g w
as s
anct
ione
d
near
th
e p
rem
ises
o
f S
C
bui
ldin
g,
henc
e up
-gra
dat
ion
wo
rk
was
ca
ncel
led
.
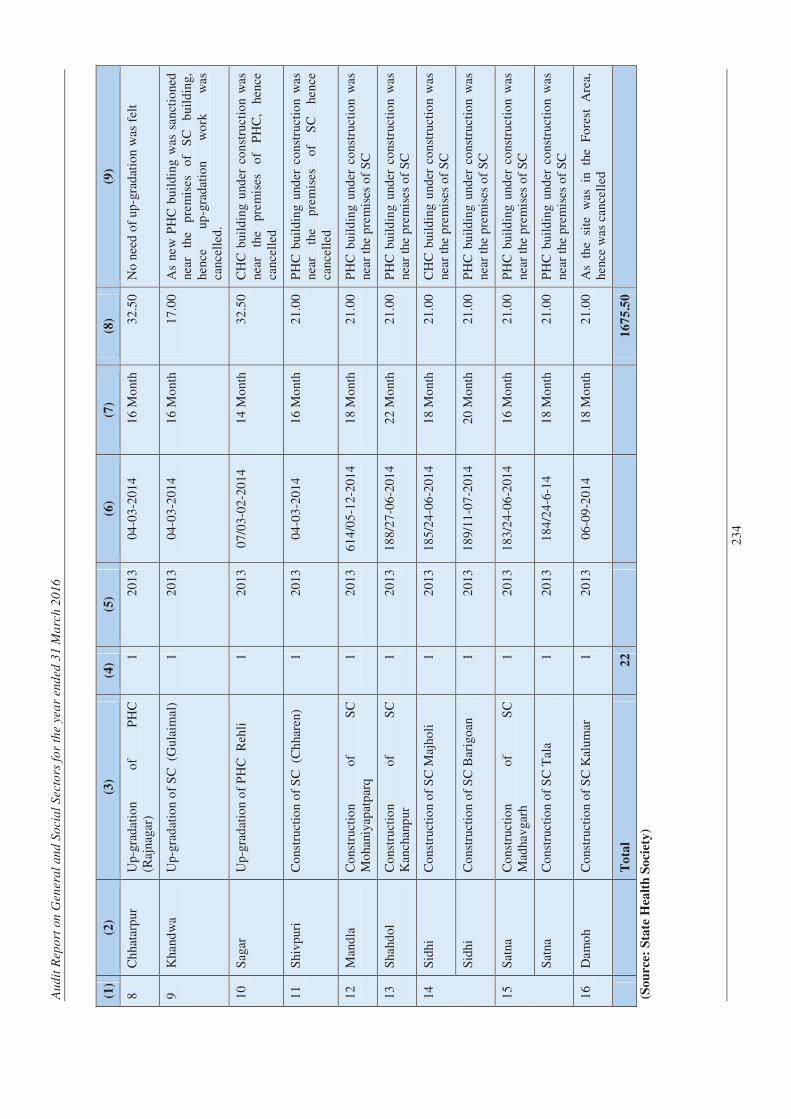
Au
dit
Rep
ort
on
Gen
era
l an
d S
ocia
l S
ecto
rs f
or
the y
ea
r end
ed
31 M
arc
h 2
01
6
23
4
(1)
(2)
(3)
(4)
(5)
(6)
(7)
(8)
(9)
8
Ch
hata
rpur
U
p-g
rad
atio
n o
f P
HC
(R
ajna
gar)
1
2
01
3 0
4-0
3-2
01
4 1
6 M
ont
h 3
2.5
0 N
o n
eed
of
up-g
rad
atio
n w
as f
elt
9
Kha
ndw
a U
p-g
rad
atio
n o
f S
C
(Gul
aim
al)
1
20
13
04
-03
-20
14
16
Mo
nth
17
.00
As
new
PH
C b
uild
ing
was
san
ctio
ned
ne
ar
the
pre
mis
es
of
SC
b
uild
ing,
he
nce
up-g
rad
atio
n w
ork
w
as
canc
elle
d.
10
Sag
ar
Up
-gra
dat
ion
of
PH
C
Reh
li
1
20
13
07
/03
-02
-20
14
14
Mo
nth
32
.50
CH
C b
uild
ing
und
er c
on
stru
ctio
n w
as
near
th
e p
rem
ises
o
f P
HC
, he
nce
canc
elle
d
11
Shi
vpur
i C
ons
truc
tio
n o
f S
C
(Ch
hare
n)
1
20
13
04
-03
-20
14
16
Mo
nth
21
.00
PH
C b
uild
ing
und
er c
ons
truc
tio
n w
as
near
th
e p
rem
ises
o
f S
C
henc
e ca
ncel
led
12
Man
dla
C
ons
truc
tio
n o
f S
C
Mo
hani
yap
atp
arq
1
2
01
3 6
14
/05
-12
-201
4 1
8 M
ont
h 2
1.0
0 P
HC
bui
ldin
g un
der
co
nstr
ucti
on
was
ne
ar t
he p
rem
ises
of
SC
13
Sha
hdo
l C
ons
truc
tio
n o
f S
C
Kan
chan
pur
1
2
01
3 1
88
/27
-06
-201
4 2
2 M
ont
h 2
1.0
0 P
HC
bui
ldin
g un
der
co
nstr
ucti
on
was
ne
ar t
he p
rem
ises
of
SC
14
Sid
hi
Co
nstr
ucti
on
of
SC
Maj
holi
1
2
01
3 1
85
/24
-06
-201
4 1
8 M
ont
h 2
1.0
0 C
HC
bui
ldin
g u
nder
co
nst
ruct
ion
was
ne
ar t
he p
rem
ises
of
SC
Sid
hi
Co
nstr
ucti
on
of
SC
Bar
igo
an
1
20
13
18
9/1
1-0
7-2
014
20
Mo
nth
21
.00
PH
C b
uild
ing
und
er c
ons
truc
tio
n w
as
near
the
pre
mis
es o
f S
C
15
Sat
na
Co
nstr
ucti
on
of
SC
M
adha
vga
rh
1
20
13
18
3/2
4-0
6-2
014
16
Mo
nth
21
.00
PH
C b
uild
ing
und
er c
ons
truc
tio
n w
as
near
the
pre
mis
es o
f S
C
Sat
na
Co
nstr
ucti
on
of
SC
Tal
a 1
2
01
3 1
84
/24
-6-1
4 1
8 M
ont
h 2
1.0
0 P
HC
bui
ldin
g un
der
co
nstr
ucti
on
was
ne
ar t
he p
rem
ises
of
SC
16
Dam
oh
C
ons
truc
tio
n o
f S
C K
alu
mar
1
2
01
3 0
6-0
9-2
01
4 1
8 M
ont
h 2
1.0
0 A
s th
e si
te
was
in
th
e F
ore
st
Are
a,
henc
e w
as c
ance
lled
To
tal
22
1
67
5.5
0
(So
urc
e: S
tate
Hea
lth
So
ciet
y)
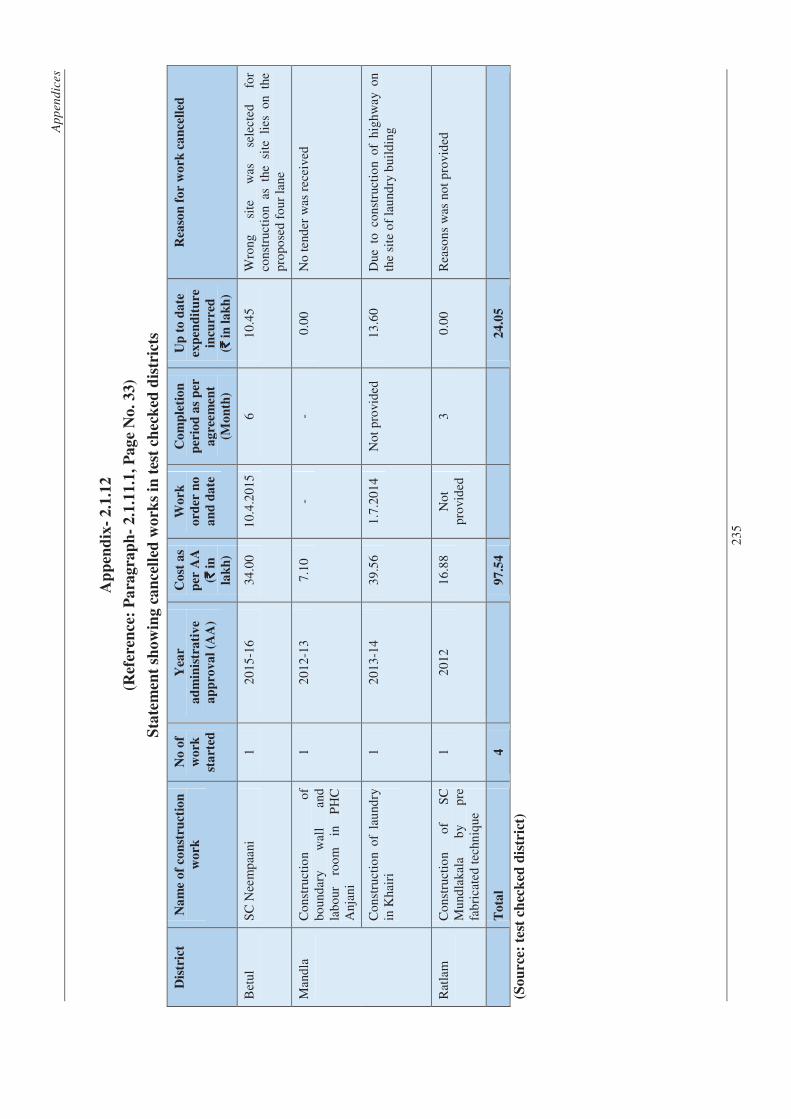
Ap
pen
dic
es
23
5
Ap
pen
dix
- 2
.1.1
2
(Ref
eren
ce:
Pa
rag
rap
h-
2.1
.11
.1,
Pa
ge
No
. 3
3)
Sta
tem
ent
sho
win
g c
an
cell
ed w
ork
s in
tes
t ch
eck
ed d
istr
icts
Dis
tric
t N
am
e o
f co
nst
ruct
ion
wo
rk
No
of
wo
rk
sta
rted
Yea
r
ad
min
istr
ati
ve
ap
pro
va
l (A
A)
Co
st a
s
per
AA
(`̀̀̀ i
n
lak
h)
Wo
rk
ord
er n
o
an
d d
ate
Co
mp
leti
on
per
iod
as
per
ag
reem
ent
(Mo
nth
)
Up
to
da
te
exp
end
itu
re
incu
rred
(`̀̀̀ i
n l
ak
h)
Rea
son
fo
r w
ork
ca
nce
lled
Bet
ul
SC
Nee
mp
aani
1
2
01
5-1
6 3
4.0
0 1
0.4
.20
15
6
10
.45
Wro
ng
site
w
as
sele
cted
fo
r co
nstr
ucti
on
as t
he s
ite
lies
o
n th
e p
ropo
sed
fo
ur l
ane
Man
dla
Co
nstr
ucti
on
of
bo
und
ary
wal
l an
d
lab
our
ro
om
in
P
HC
A
njan
i
1
20
12
-13
7.1
0 -
- 0
.00
No
ten
der
was
rec
eive
d
Co
nstr
ucti
on
of
lau
ndry
in
Kha
iri
1
20
13
-14
39
.56
1.7
.20
14
No
t p
rovi
ded
1
3.6
0 D
ue t
o c
ons
truc
tio
n o
f h
igh
way
on
th
e si
te o
f la
und
ry b
uild
ing
Rat
lam
Co
nstr
ucti
on
of
SC
M
und
laka
la
by
pre
fa
bri
cate
d t
echn
ique
1
20
12
16
.88
No
t p
rovi
ded
3
0
.00
Rea
son
s w
as n
ot
pro
vid
ed
T
ota
l 4
97
.54
24
.05
(So
urc
e: t
est
chec
ked
dis
tric
t)
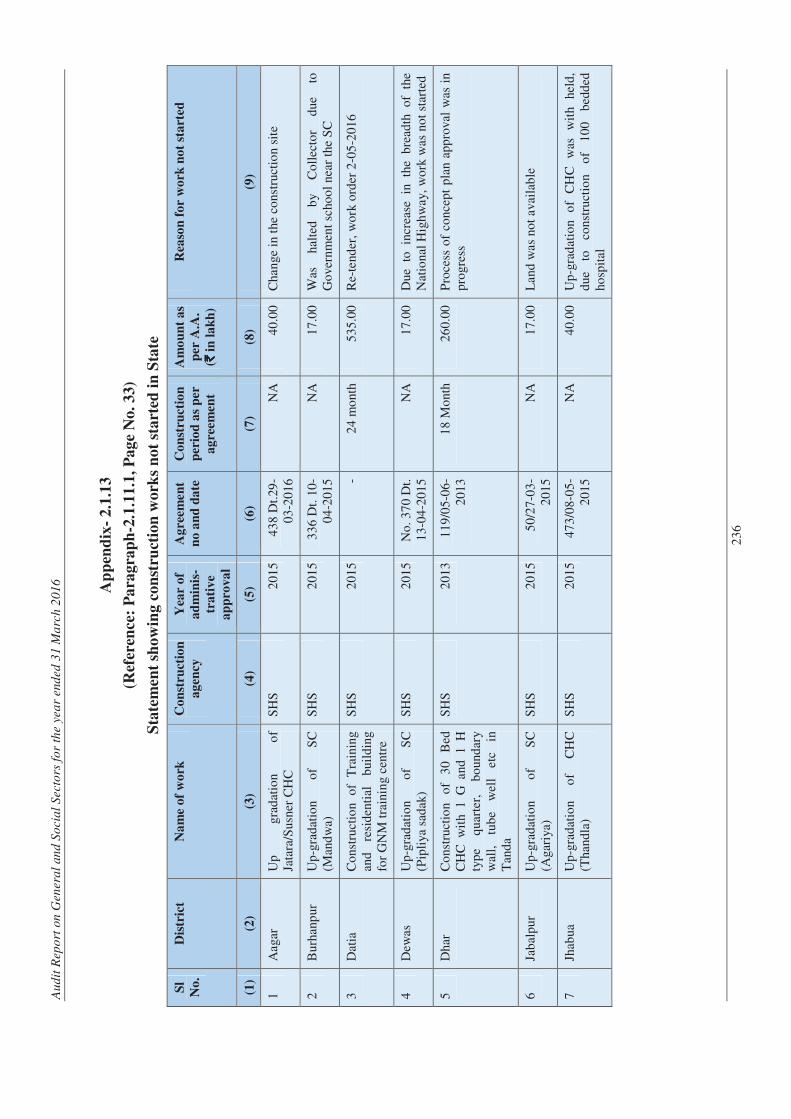
Au
dit
Rep
ort
on
Gen
era
l an
d S
ocia
l S
ecto
rs f
or
the y
ea
r end
ed
31 M
arc
h 2
01
6
23
6
Ap
pen
dix
- 2
.1.1
3
(Ref
eren
ce:
Pa
rag
rap
h-2
.1.1
1.1
, P
ag
e N
o.
33
)
Sta
tem
ent
sho
win
g c
on
stru
ctio
n w
ork
s n
ot
sta
rted
in
Sta
te
Sl
No
.
Dis
tric
t N
am
e o
f w
ork
C
on
stru
ctio
n
ag
ency
Yea
r o
f
ad
min
is-
tra
tiv
e
ap
pro
va
l
Ag
reem
en
t
no
an
d d
ate
Co
nst
ruct
ion
per
iod
as
per
ag
reem
ent
Am
ou
nt
as
per
A.A
.
(`̀̀̀ i
n l
ak
h)
Rea
son
fo
r w
ork
no
t st
art
ed
(1)
(2)
(3)
(4)
(5)
(6)
(7)
(8)
(9)
1
Aag
ar
Up
gr
adat
ion
of
Jata
ra/S
usne
r C
HC
S
HS
2
01
5 4
38
Dt.
29-
03
-20
16
NA
4
0.0
0 C
han
ge i
n th
e co
nstr
ucti
on
site
2
Bur
hanp
ur
Up
-gra
dat
ion
of
SC
(M
and
wa)
S
HS
2
01
5 3
36
Dt.
10
-0
4-2
01
5 N
A
17
.00
Was
ha
lted
b
y C
oll
ecto
r d
ue
to
Go
vern
men
t sc
hoo
l ne
ar t
he S
C
3
Dat
ia
Co
nstr
ucti
on
of
Tra
inin
g
and
re
sid
enti
al
bui
ldin
g
for
GN
M t
rain
ing
cent
re
SH
S
20
15
- 2
4 m
ont
h
53
5.0
0 R
e-te
nder
, w
ork
ord
er 2
-05
-201
6
4
Dew
as
Up
-gra
dat
ion
of
SC
(P
ipli
ya s
adak
) S
HS
2
01
5 N
o.
37
0 D
t.
13
-04
-20
15
NA
1
7.0
0 D
ue
to
incr
ease
in
th
e b
read
th
of
the
Nat
iona
l H
igh
way
, w
ork
was
no
t st
arte
d
5
Dha
r C
ons
truc
tio
n o
f 3
0
Bed
C
HC
wit
h 1
G a
nd 1
H
typ
e q
uart
er,
bo
und
ary
wal
l,
tub
e w
ell
etc
in
Tan
da
SH
S
20
13
11
9/0
5-0
6-
20
13
18
Mo
nth
26
0.0
0 P
roce
ss o
f co
ncep
t p
lan
app
rova
l w
as i
n
pro
gres
s
6
Jab
alp
ur
Up
-gra
dat
ion
of
SC
(A
gari
ya)
SH
S
20
15
50
/27
-03
-2
01
5 N
A
17
.00
Lan
d w
as n
ot
avai
lab
le
7
Jhab
ua
Up
-gra
dat
ion
of
CH
C
(Tha
ndla
) S
HS
2
01
5 4
73
/08
-05
-2
01
5 N
A
40
.00
Up
-gra
dat
ion
of
CH
C
was
w
ith
held
, d
ue
to
cons
truc
tio
n o
f 1
00
b
edd
ed
hosp
ital
Ap
pen
dic
es
23
7
(1)
(2)
(3)
(4)
(5)
(6)
(7)
(8)
(9)
8
Man
dla
C
ons
truc
tio
n o
f R
esid
enti
al
Ho
stel
b
uild
ing
SH
S
20
13
14
0/1
1-0
2-
20
14
15
Mo
nth
25
0.0
0 R
easo
ns
was
no
t p
rovi
ded
9
Mo
rena
C
ons
truc
tio
n o
f 3
0
Bed
C
HC
wit
h 1
G a
nd 1
H
typ
e q
uart
er,
bo
und
ary
wal
l,
tub
e w
ell
etc
in
Sab
alga
rh
SH
S
20
13
90
8/0
4/0
5/2
01
3 1
8 M
ont
h 2
60
.00
Re-
tend
er o
f 5
0 B
edd
ed C
HC
and
wo
rk
ord
er w
as i
ssue
d d
ated
13
/04
/20
16
10
Nar
shin
ghp
ur
Co
nstr
ucti
on
of
trai
nin
g
and
res
iden
tial
bui
ldin
g o
f G
NM
Tra
inin
g C
entr
e
SH
S
20
13
25
-10
-20
14
24
Mo
nth
53
5.0
0 D
ue t
o d
elay
in
site
sel
ecti
on
Co
nstr
ucti
on
of
10
0
bed
ded
MC
H
hosp
ital
in
D
istr
ict
Ho
spit
al
PIU
2
01
5 1
0-0
2-2
01
6 N
A
10
65
.15
Rea
son
s w
as n
ot
pro
vid
ed
11
Rat
lam
U
p-g
rad
atio
n o
f C
HC
P
iplo
d S
HS
2
01
5 4
34
/ 29
-03
-2
01
6 N
A
40
.00
Lay
out
of
the
bui
ldin
g w
as n
ot
fina
lise
d
12
Sag
ar
Up
-gra
dat
ion
of
SC
(W
anni
) S
HS
2
01
5 3
80
/13
-04
-2
01
5 N
A
17
.00
Co
nstr
ucti
on
site
was
cha
nged
13
Ujj
ain
Up
-gra
dat
ion
of
CH
C
(Bar
eli/
Nag
da)
S
HS
2
01
5 4
42
/29
-03
-2
01
6 N
A
40
.00
Co
nstr
ucti
on
site
was
cha
nged
14
Sid
hi
Up
-gra
dat
ion
wo
rks
of
10
0
bed
ded
M
CH
b
uild
ing
PIU
2
01
6 N
A
NA
1
43
6.3
6 T
end
erin
g p
roce
ss w
as i
n p
rog
ress
15
Jab
alp
ur
Up
-gr
adat
ion/
con
stru
ctio
n w
ork
s o
f P
aed
iatr
ic
Sur
gic
al U
nit
PIU
2
01
6 N
A
NA
1
23
.19
Ten
der
ing
pro
cess
was
in
pro
gre
ss
To
tal
46
92
.70
(Sou
rce:
Sta
te H
ealt
h S
oci
ety
)
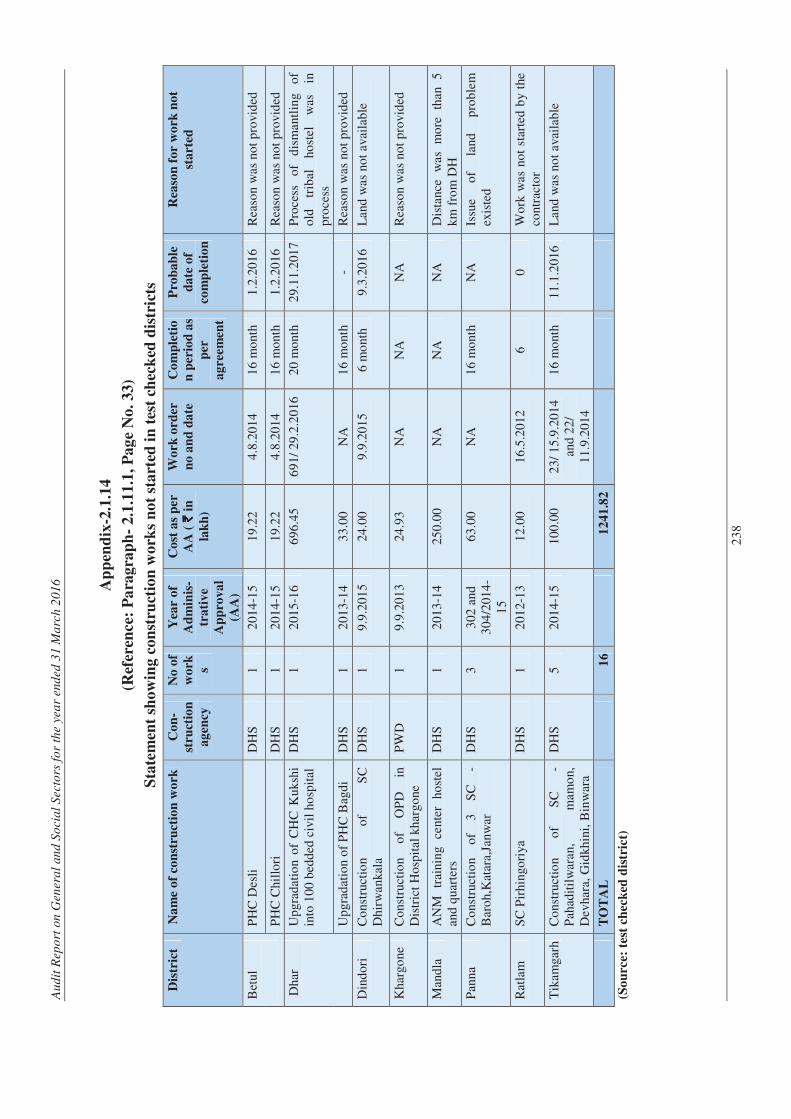
Au
dit
Rep
ort
on
Gen
era
l an
d S
ocia
l S
ecto
rs f
or
the y
ea
r end
ed
31 M
arc
h 2
01
6
23
8
Ap
pen
dix
-2.1
.14
(Ref
eren
ce:
Pa
rag
rap
h-
2.1
.11
.1,
Pa
ge
No
. 3
3)
Sta
tem
ent
sho
win
g c
on
stru
ctio
n w
ork
s n
ot
sta
rted
in
tes
t ch
eck
ed d
istr
icts
D
istr
ict
Na
me
of
con
stru
ctio
n w
ork
C
on
-
stru
ctio
n
ag
ency
No
of
wo
rk s
Yea
r o
f
Ad
min
is-
tra
tiv
e
Ap
pro
va
l
(AA
)
Co
st a
s p
er
AA
( ` ` ` ` i
n
lak
h)
Wo
rk o
rder
no
an
d d
ate
Co
mp
leti
o
n p
erio
d a
s
per
ag
reem
ent
Pro
ba
ble
da
te o
f
com
ple
tio
n
Rea
son
fo
r w
ork
no
t
sta
rted
Bet
ul
PH
C D
esli
D
HS
1
2
01
4-1
5 1
9.2
2 4
.8.2
01
4 1
6 m
ont
h
1.2
.20
16
Rea
son
was
no
t p
rovi
ded
PH
C C
hill
ori
D
HS
1
2
01
4-1
5 1
9.2
2 4
.8.2
01
4 1
6 m
ont
h
1.2
.20
16
Rea
son
was
no
t p
rovi
ded
Dha
r
Up
grad
atio
n o
f C
HC
Kuk
shi
into
10
0 b
edd
ed c
ivil
ho
spit
al
DH
S
1
20
15
-16
69
6.4
5 6
91
/ 29
.2.2
016
2
0 m
ont
h
29
.11.
201
7 P
roce
ss
of
dis
man
tlin
g o
f o
ld
trib
al
host
el
was
in
p
roce
ss
Up
grad
atio
n o
f P
HC
Bag
di
DH
S
1
20
13
-14
33
.00
NA
1
6 m
ont
h
- R
easo
n w
as n
ot
pro
vid
ed
Din
do
ri
Co
nstr
ucti
on
of
SC
D
hirw
anka
la
DH
S
1
9.9
.20
15
24
.00
9.9
.20
15
6 m
ont
h
9.3
.20
16
Lan
d w
as n
ot
avai
lab
le
Kha
rgo
ne
Co
nstr
ucti
on
of
OP
D
in
Dis
tric
t H
osp
ital
kha
rgo
ne
PW
D
1
9.9
.20
13
24
.93
NA
N
A
NA
R
easo
n w
as n
ot
pro
vid
ed
Man
dla
A
NM
tr
aini
ng
cent
er
host
el
and
qua
rter
s D
HS
1
2
01
3-1
4 2
50
.00
NA
N
A
NA
D
ista
nce
was
m
ore
th
an
5
km
fro
m D
H
Pan
na
Co
nstr
ucti
on
of
3
SC
-
Bar
oh,
Kat
ara,
Jan
war
D
HS
3
3
02
and
3
04
/201
4-
15
63
.00
NA
1
6 m
ont
h
NA
Is
sue
of
land
p
rob
lem
ex
iste
d
Rat
lam
S
C P
irhi
ngo
riya
D
HS
1
2
01
2-1
3 1
2.0
0 1
6.5
.20
12
6
0
Wo
rk w
as n
ot
star
ted
by
the
cont
ract
or
Tik
amga
rh
Co
nstr
ucti
on
of
SC
-
Pah
adit
ilw
aran
, m
amo
n,
Dev
hara
, G
idkh
ini,
Bin
war
a
DH
S
5
20
14
-15
10
0.0
0 2
3/
15
.9.2
01
4
and
22
/ 1
1.9
.20
14
16
mo
nth
1
1.1
.20
16
Lan
d w
as n
ot
avai
lab
le
T
OT
AL
16
1
24
1.8
2
(So
urc
e: t
est
chec
ked
dis
tric
t)
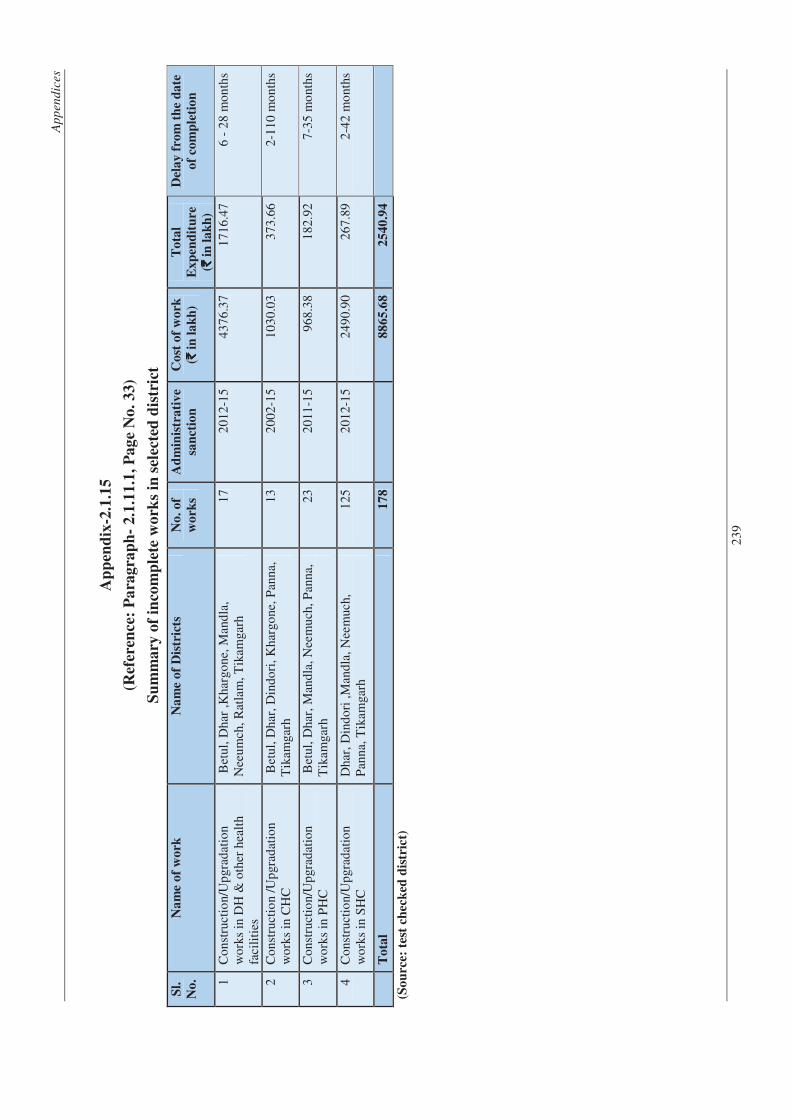
Ap
pen
dic
es
23
9
Ap
pen
dix
-2.1
.15
(Ref
eren
ce:
Pa
rag
rap
h-
2.1
.11
.1,
Pa
ge
No
. 3
3)
Su
mm
ary
of
inco
mp
lete
wo
rks
in s
elec
ted
dis
tric
t
Sl.
No
.
Na
me
of
wo
rk
Na
me
of
Dis
tric
ts
No
. o
f
wo
rks
Ad
min
istr
ati
ve
san
ctio
n
Co
st o
f w
ork
(`̀̀̀ i
n l
ak
h)
To
tal
Ex
pen
dit
ure
(`̀̀̀ i
n l
ak
h)
Del
ay
fro
m t
he
da
te
of
com
ple
tio
n
1
Co
nstr
ucti
on/
Up
grad
atio
n w
ork
s in
DH
& o
ther
hea
lth
faci
liti
es
Bet
ul,
Dha
r ,K
harg
one
, M
and
la,
Nee
um
ch,
Rat
lam
, T
ikam
garh
1
7 2
01
2-1
5
43
76
.37
1
71
6.4
7 6
- 2
8 m
on
ths
2
Co
nstr
ucti
on
/Up
grad
atio
n w
ork
s in
CH
C
Bet
ul,
Dha
r, D
ind
ori
, K
harg
one
, P
anna
, T
ikam
garh
1
3 2
00
2-1
5 1
03
0.0
3 3
73
.66
2-1
10
mo
nth
s
3
Co
nstr
ucti
on/
Up
grad
atio
n w
ork
s in
PH
C
Bet
ul,
Dha
r, M
and
la,
Nee
mu
ch,
Pan
na,
Tik
amga
rh
23
20
11
-15
96
8.3
8 1
82
.92
7-3
5 m
ont
hs
4
Co
nstr
ucti
on/
Up
grad
atio
n w
ork
s in
SH
C
Dha
r, D
ind
ori
,M
and
la,
Nee
muc
h,
Pan
na,
Tik
amga
rh
12
5 2
01
2-1
5 2
49
0.9
0 2
67
.89
2-4
2 m
ont
hs
T
ota
l
1
78
88
65
.68
25
40
.94
(So
urc
e: t
est
chec
ked
dis
tric
t)
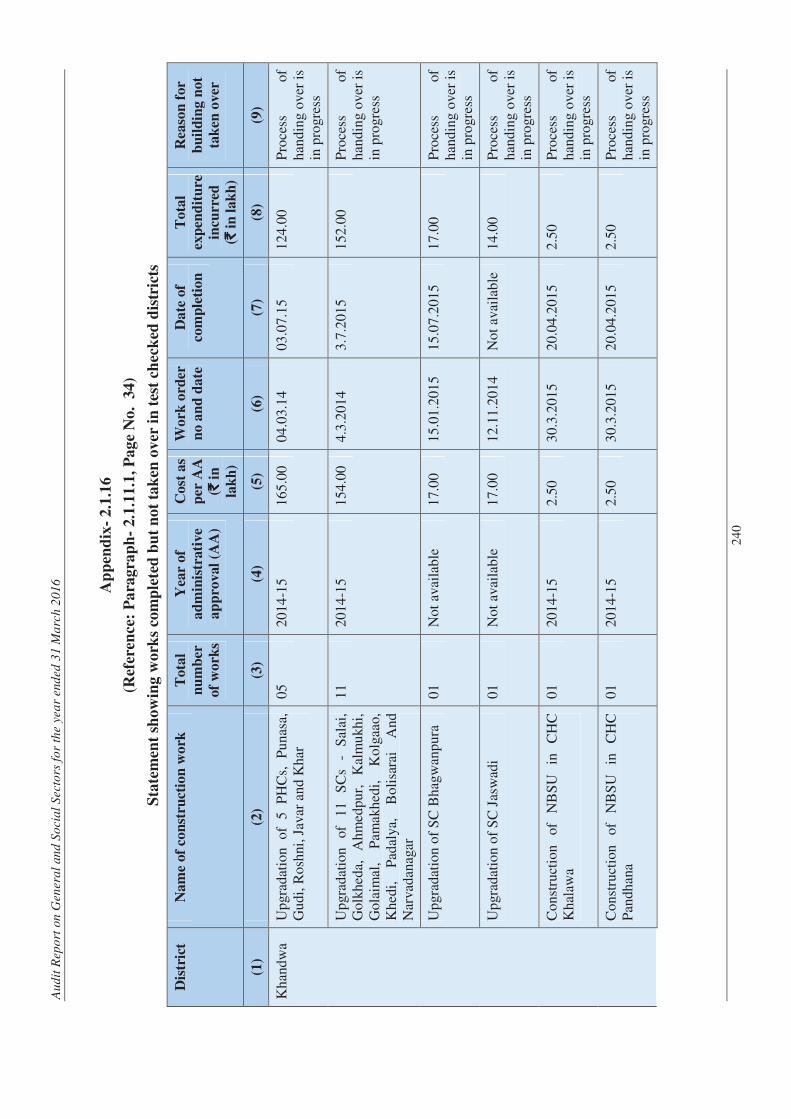
Au
dit
Rep
ort
on
Gen
era
l an
d S
ocia
l S
ecto
rs f
or
the y
ea
r end
ed
31 M
arc
h 2
01
6
24
0
Ap
pen
dix
- 2
.1.1
6
(Ref
eren
ce:
Pa
rag
rap
h-
2.1
.11
.1,
Pa
ge
No
. 3
4)
Sta
tem
ent
sho
win
g w
ork
s co
mp
lete
d b
ut
no
t ta
ken
ov
er i
n t
est
check
ed d
istr
icts
Dis
tric
t N
am
e of
con
stru
ctio
n w
ork
T
ota
l
nu
mb
er
of
wo
rks
Yea
r of
ad
min
istr
ati
ve
ap
pro
val
(AA
)
Co
st a
s
per
AA
(`̀̀̀ i
n
lak
h)
Wo
rk o
rder
no
an
d d
ate
Da
te o
f
com
ple
tio
n
To
tal
exp
end
itu
re
incu
rred
(`̀̀̀ i
n l
ak
h)
Rea
son
for
bu
ild
ing
not
tak
en o
ver
(1)
(2)
(3)
(4)
(5)
(6)
(7)
(8)
(9)
Kh
and
wa
Up
grad
atio
n
of
5
PH
Cs,
P
un
asa,
G
ud
i, R
osh
ni, J
avar
an
d K
har
05
2
01
4-1
5
16
5.0
0 0
4.0
3.1
4 0
3.0
7.1
5 1
24
.00
Pro
cess
of
h
and
ing
ove
r is
in
pro
gres
s
Up
grad
atio
n
of
11
S
Cs
- S
alai
, G
olk
hed
a,
Ah
med
pu
r,
Kal
mu
khi,
G
ola
imal
, P
amak
hed
i,
Ko
lgaa
o,
Kh
edi,
P
adal
ya,
Bo
lisa
rai
An
d N
arva
dan
agar
11
2
01
4-1
5
15
4.0
0 4
.3.2
01
4 3
.7.2
01
5 1
52
.00
Pro
cess
of
h
and
ing
ove
r is
in
pro
gres
s
Up
grad
atio
n o
f S
C B
hag
wan
pu
ra
01
N
ot
avai
lab
le
17
.00
15
.01
.20
15
15
.07
.20
15
17
.00
Pro
cess
of
h
and
ing
ove
r is
in
pro
gres
s
Up
grad
atio
n o
f S
C J
asw
adi
01
N
ot
avai
lab
le
17
.00
12
.11
.20
14
No
t av
aila
ble
1
4.0
0 P
roce
ss
of
han
din
g o
ver
is
in p
rogr
ess
Co
nst
ruct
ion
of
N
BS
U
in
CH
C
Kh
alaw
a 0
1
20
14
-15
2
.50
30
.3.2
01
5 2
0.0
4.2
01
5 2
.50
Pro
cess
of
h
and
ing
ove
r is
in
pro
gres
s
Co
nst
ruct
ion
of
N
BS
U
in
CH
C
Pan
dh
ana
01
2
01
4-1
5
2.5
0 3
0.3
.20
15
20
.04
.20
15
2.5
0 P
roce
ss
of
han
din
g o
ver
is
in p
rogr
ess
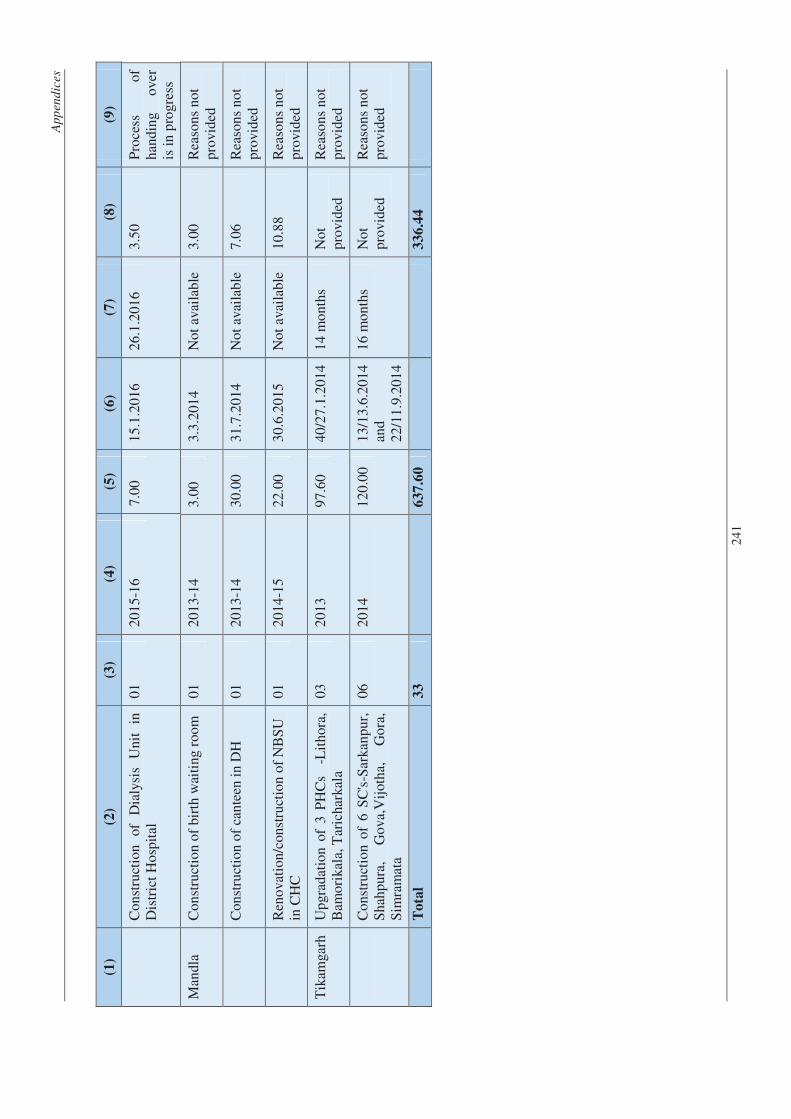
Ap
pen
dic
es
24
1
(1)
(2)
(3)
(4)
(5)
(6)
(7)
(8)
(9)
C
on
stru
ctio
n
of
Dia
lysi
s U
nit
in
D
istr
ict
Ho
spit
al
01
2
01
5-1
6
7.0
0 1
5.1
.20
16
26
.1.2
01
6 3
.50
Pro
cess
o
f h
and
ing
ove
r is
in
pro
gres
s
Man
dla
Co
nst
ruct
ion
of
birt
h w
aiti
ng r
oo
m
01
2
01
3-1
4
3.0
0 3
.3.2
01
4 N
ot
avai
lab
le
3.0
0 R
easo
ns
no
t p
rovi
ded
C
on
stru
ctio
n o
f ca
nte
en i
n D
H
01
2
01
3-1
4
30
.00
31
.7.2
01
4 N
ot
avai
lab
le
7.0
6 R
easo
ns
no
t p
rovi
ded
R
eno
vati
on/
con
stru
ctio
n o
f N
BS
U
in C
HC
0
1
20
14
-15
2
2.0
0 3
0.6
.20
15
No
t av
aila
ble
1
0.8
8 R
easo
ns
no
t p
rovi
ded
Tik
amga
rh
Up
grad
atio
n o
f 3
PH
Cs
-L
ith
ora,
B
amo
rika
la, T
aric
hark
ala
03
2
01
3 9
7.6
0 4
0/2
7.1
.20
14
14
mo
nth
s N
ot
pro
vid
ed
Rea
son
s n
ot
pro
vid
ed
C
on
stru
ctio
n o
f 6
SC
's-S
arka
np
ur,
S
hah
pu
ra,
Go
va,V
ijot
ha,
G
ora
, S
imra
mat
a
06
2
01
4 1
20
.00
13
/13
.6.2
01
4
and
2
2/1
1.9
.20
14
16
mo
nth
s N
ot
pro
vid
ed
Rea
son
s n
ot
pro
vid
ed
T
ota
l 3
3
6
37
.60
33
6.4
4
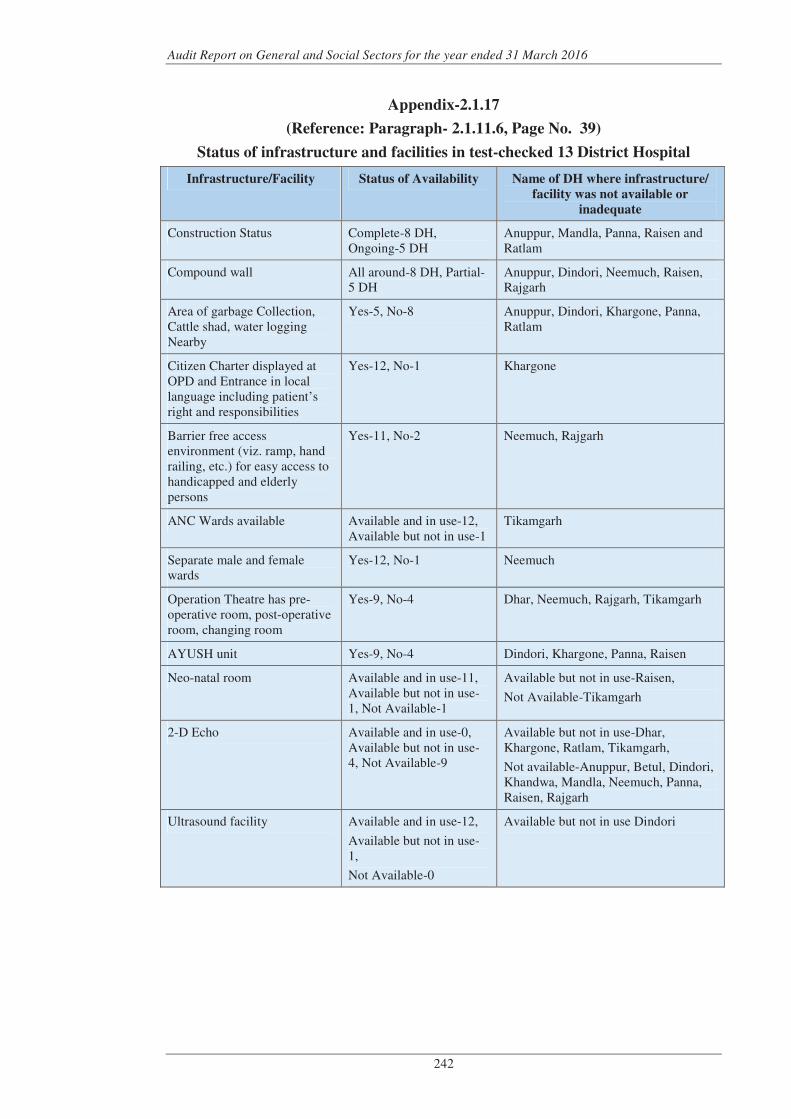
Audit Report on General and Social Sectors for the year ended 31 March 2016
242
Appendix-2.1.17
(Reference: Paragraph- 2.1.11.6, Page No. 39)
Status of infrastructure and facilities in test-checked 13 District Hospital
Infrastructure/Facility Status of Availability Name of DH where infrastructure/
facility was not available or
inadequate
Construction Status Complete-8 DH, Ongoing-5 DH
Anuppur, Mandla, Panna, Raisen and Ratlam
Compound wall All around-8 DH, Partial-5 DH
Anuppur, Dindori, Neemuch, Raisen, Rajgarh
Area of garbage Collection, Cattle shad, water logging Nearby
Yes-5, No-8 Anuppur, Dindori, Khargone, Panna, Ratlam
Citizen Charter displayed at OPD and Entrance in local language including patient’s right and responsibilities
Yes-12, No-1 Khargone
Barrier free access environment (viz. ramp, hand railing, etc.) for easy access to handicapped and elderly persons
Yes-11, No-2 Neemuch, Rajgarh
ANC Wards available Available and in use-12, Available but not in use-1
Tikamgarh
Separate male and female wards
Yes-12, No-1 Neemuch
Operation Theatre has pre-operative room, post-operative room, changing room
Yes-9, No-4 Dhar, Neemuch, Rajgarh, Tikamgarh
AYUSH unit Yes-9, No-4 Dindori, Khargone, Panna, Raisen
Neo-natal room Available and in use-11, Available but not in use-1, Not Available-1
Available but not in use-Raisen,
Not Available-Tikamgarh
2-D Echo Available and in use-0, Available but not in use-4, Not Available-9
Available but not in use-Dhar, Khargone, Ratlam, Tikamgarh,
Not available-Anuppur, Betul, Dindori, Khandwa, Mandla, Neemuch, Panna, Raisen, Rajgarh
Ultrasound facility Available and in use-12,
Available but not in use-1,
Not Available-0
Available but not in use Dindori
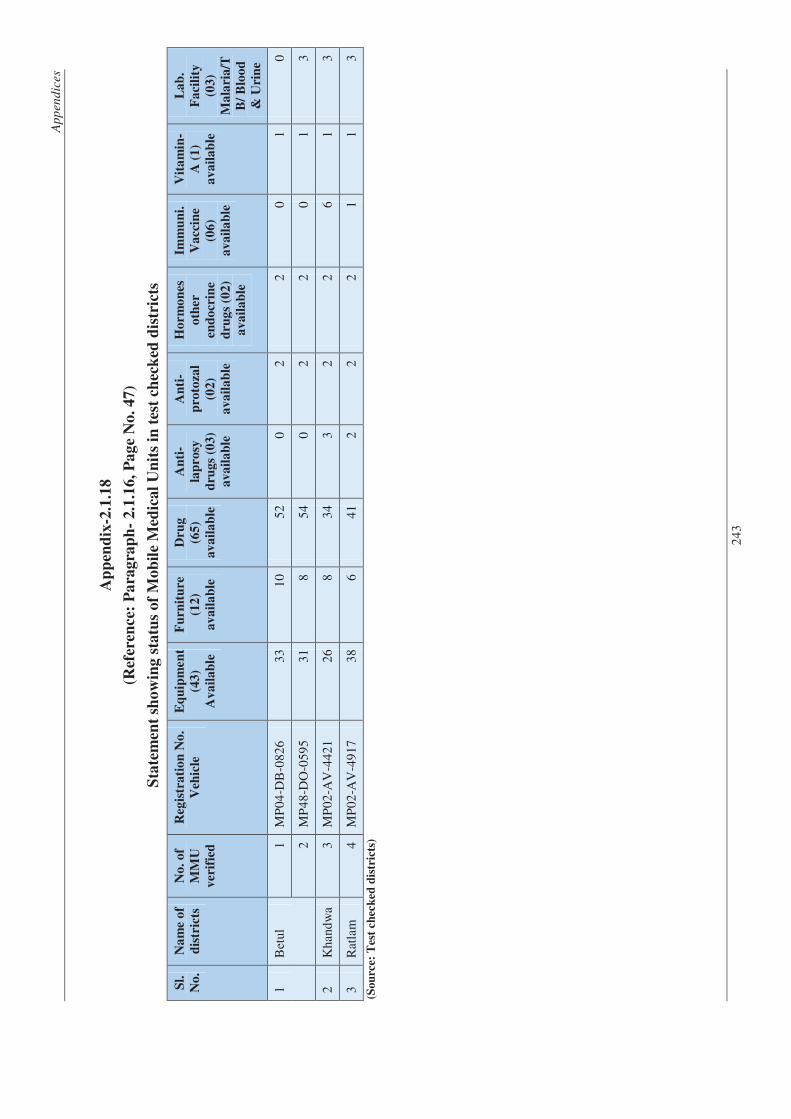
Ap
pen
dic
es
24
3
Ap
pen
dix
-2.1
.18
(Ref
eren
ce:
Pa
rag
rap
h-
2.1
.16
, P
ag
e N
o.
47
)
Sta
tem
ent
sho
win
g s
tatu
s o
f M
ob
ile
Med
ica
l U
nit
s in
tes
t ch
eck
ed d
istr
icts
Sl.
No
.
Na
me
of
dis
tric
ts
No
. o
f
MM
U
ver
ifie
d
Reg
istr
ati
on
No
.
Veh
icle
Eq
uip
men
t
(43
)
Av
ail
ab
le
Fu
rnit
ure
(12
)
av
ail
ab
le
Dru
g
(65
)
av
ail
ab
le
An
ti-
lap
rosy
dru
gs
(03
)
av
ail
ab
le
An
ti-
pro
toza
l
(02
)
av
ail
ab
le
Ho
rm
on
es
oth
er
end
ocr
ine
dru
gs
(02
)
av
ail
ab
le
Imm
un
i.
Va
ccin
e
(06
)
av
ail
ab
le
Vit
am
in-
A (
1)
av
ail
ab
le
La
b.
Fa
cili
ty
(03
)
Ma
lari
a/T
B/
Blo
od
& U
rin
e
1
Bet
ul
1
MP
04
-DB
-08
26
33
10
52
0
2
2
0
1
0
2
MP
48
-DO
-05
95
31
8
54
0
2
2
0
1
3
2
Kha
ndw
a 3
M
P0
2-A
V-4
42
1 2
6 8
3
4 3
2
2
6
1
3
3
Rat
lam
4
M
P0
2-A
V-4
91
7 3
8 6
4
1 2
2
2
1
1
3
(Sou
rce:
Tes
t ch
eck
ed
dis
tric
ts)
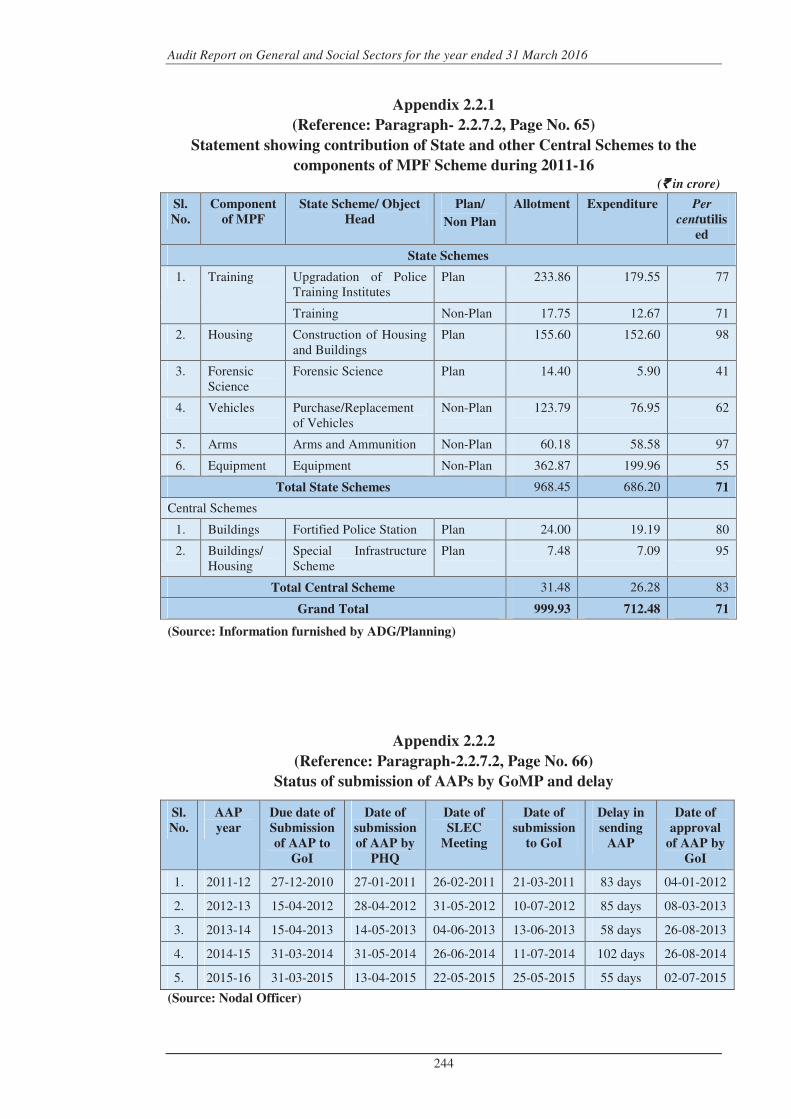
Audit Report on General and Social Sectors for the year ended 31 March 2016
244
Appendix 2.2.1
(Reference: Paragraph- 2.2.7.2, Page No. 65)
Statement showing contribution of State and other Central Schemes to the
components of MPF Scheme during 2011-16 (`̀̀̀ in crore)
Sl.
No.
Component
of MPF
State Scheme/ Object
Head
Plan/
Non Plan
Allotment Expenditure Per
centutilis
ed
State Schemes
1. Training Upgradation of Police Training Institutes
Plan 233.86 179.55 77
Training Non-Plan 17.75 12.67 71
2. Housing Construction of Housing and Buildings
Plan 155.60 152.60 98
3. Forensic Science
Forensic Science Plan 14.40 5.90 41
4. Vehicles Purchase/Replacement of Vehicles
Non-Plan 123.79 76.95 62
5. Arms Arms and Ammunition Non-Plan 60.18 58.58 97
6. Equipment Equipment Non-Plan 362.87 199.96 55
Total State Schemes 968.45 686.20 71
Central Schemes
1. Buildings Fortified Police Station Plan 24.00 19.19 80
2. Buildings/ Housing
Special Infrastructure Scheme
Plan 7.48 7.09 95
Total Central Scheme 31.48 26.28 83
Grand Total 999.93 712.48 71
(Source: Information furnished by ADG/Planning)
Appendix 2.2.2
(Reference: Paragraph-2.2.7.2, Page No. 66)
Status of submission of AAPs by GoMP and delay
Sl.
No.
AAP
year
Due date of
Submission
of AAP to
GoI
Date of
submission
of AAP by
PHQ
Date of
SLEC
Meeting
Date of
submission
to GoI
Delay in
sending
AAP
Date of
approval
of AAP by
GoI
1. 2011-12 27-12-2010 27-01-2011 26-02-2011 21-03-2011 83 days 04-01-2012
2. 2012-13 15-04-2012 28-04-2012 31-05-2012 10-07-2012 85 days 08-03-2013
3. 2013-14 15-04-2013 14-05-2013 04-06-2013 13-06-2013 58 days 26-08-2013
4. 2014-15 31-03-2014 31-05-2014 26-06-2014 11-07-2014 102 days 26-08-2014
5. 2015-16 31-03-2015 13-04-2015 22-05-2015 25-05-2015 55 days 02-07-2015
(Source: Nodal Officer)
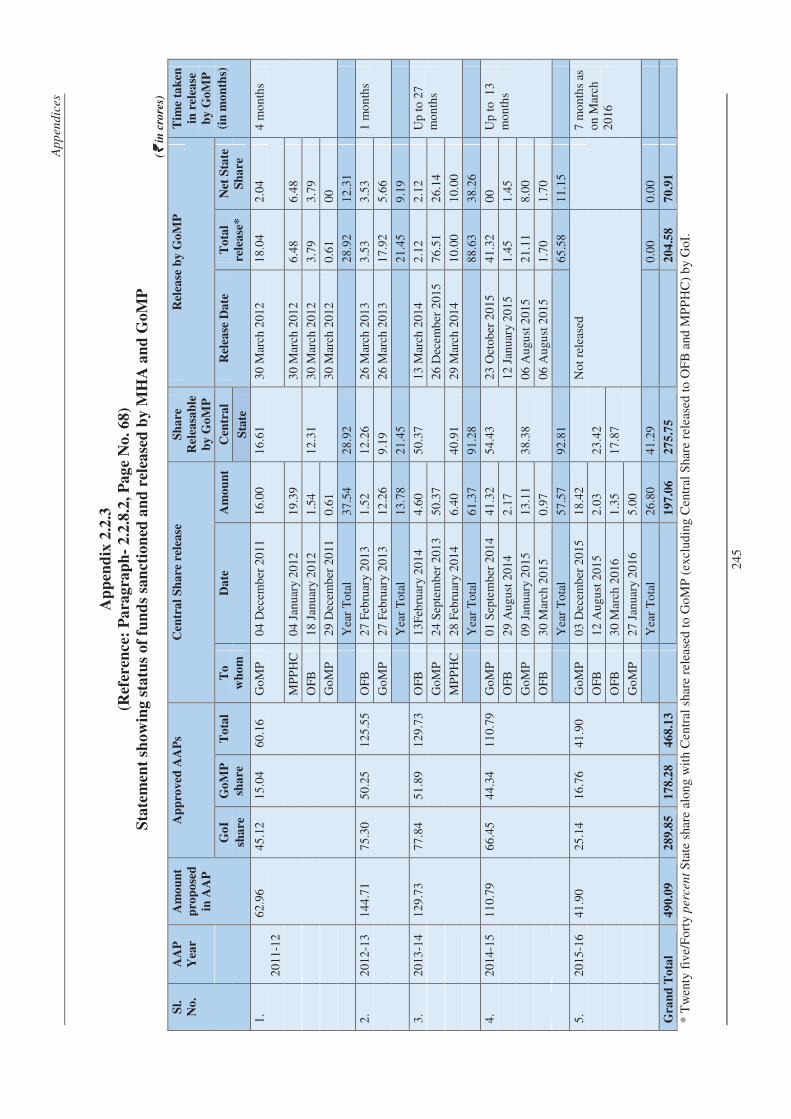
Ap
pen
dic
es
24
5
Ap
pen
dix
2.2
.3
(Ref
eren
ce:
Pa
rag
rap
h-
2.2
.8.2
, P
ag
e N
o.
68
)
Sta
tem
ent
sho
win
g s
tatu
s o
f fu
nd
s sa
nct
ion
ed a
nd
rel
ease
d b
y M
HA
an
d G
oM
P
(`̀̀̀ i
n c
rore
s)
Sl.
No
.
AA
P
Yea
r
Am
ou
nt
pro
po
sed
in A
AP
Ap
pro
ved
AA
Ps
Cen
tra
l S
ha
re r
elea
se
Sh
are
Rel
easa
ble
by
Go
MP
Rel
ease
by
Go
MP
T
ime
tak
en
in r
elea
se
by
Go
MP
(in
mo
nth
s)
G
oI
sha
re
Go
MP
sha
re
To
tal
To
wh
om
Da
te
Am
ou
nt
Cen
tra
l R
elea
se D
ate
T
ota
l
rele
ase
*
Net
Sta
te
Sh
are
S
tate
1.
20
11-1
2
62
.96
45
.12
15
.04
60
.16
Go
MP
0
4 D
ecem
ber
20
11
16
.00
16
.61
30
Mar
ch 2
012
18
.04
2.0
4 4
mo
nth
s
MP
PH
C
04
Jan
uar
y 2
01
2 1
9.3
9 3
0 M
arch
201
2 6
.48
6.4
8
OF
B
18
Jan
uar
y 2
01
2 1
.54
12
.31
30
Mar
ch 2
012
3.7
9 3
.79
Go
MP
2
9 D
ecem
ber
20
11
0.6
1 3
0 M
arch
201
2 0
.61
00
Y
ear
To
tal
37
.54
28
.92
2
8.9
2 1
2.3
1
2.
20
12-1
3 1
44
.71
75
.30
50
.25
12
5.5
5 O
FB
2
7 F
ebru
ary
20
13
1.5
2 1
2.2
6 2
6 M
arch
201
3 3
.53
3.5
3 1
mo
nth
s
Go
MP
2
7 F
ebru
ary
20
13
12
.26
9.1
9 2
6 M
arch
201
3 1
7.9
2 5
.66
Y
ear
To
tal
13
.78
21
.45
2
1.4
5 9
.19
3.
20
13-1
4 1
29
.73
77
.84
51
.89
12
9.7
3 O
FB
1
3F
ebru
ary
20
14
4.6
0 5
0.3
7 1
3 M
arch
201
4 2
.12
2.1
2 U
p t
o 2
7
mo
nth
s
G
oM
P
24
Sep
tem
ber
201
3 5
0.3
7 2
6 D
ecem
ber
20
15
76
.51
26
.14
MP
PH
C
28
Feb
ruar
y 2
01
4 6
.40
40
.91
29
Mar
ch 2
014
10
.00
10
.00
Y
ear
To
tal
61
.37
91
.28
8
8.6
3 3
8.2
6
4.
20
14-1
5 1
10
.79
66
.45
44
.34
11
0.7
9 G
oM
P
01
Sep
tem
ber
201
4 4
1.3
2 5
4.4
3 2
3 O
ctob
er 2
015
4
1.3
2 0
0 U
p t
o 1
3
mo
nth
s
O
FB
2
9 A
ugu
st 2
014
2.1
7 1
2 J
anu
ary
20
15
1.4
5 1
.45
Go
MP
0
9 J
anu
ary
20
15
13
.11
38
.38
06
Au
gust
201
5 2
1.1
1 8
.00
OF
B
30
Mar
ch 2
015
0.9
7 0
6 A
ugu
st 2
015
1.7
0 1
.70
Y
ear
To
tal
57
.57
92
.81
6
5.5
8 1
1.1
5
5.
20
15-1
6 4
1.9
0 2
5.1
4 1
6.7
6 4
1.9
0 G
oM
P
03
Dec
emb
er 2
015
1
8.4
2
No
t re
leas
ed
7
mo
nth
s as
o
n M
arch
2
016
O
FB
1
2 A
ugu
st 2
015
2.0
3 2
3.4
2
OF
B
30
Mar
ch 2
016
1.3
5 1
7.8
7
Go
MP
2
7 J
anu
ary
20
16
5.0
0
Y
ear
To
tal
26
.80
41
.29
0
.00
0.0
0
Gra
nd
To
tal
49
0.0
9
28
9.8
5
17
8.2
8
46
8.1
3
19
7.0
6
27
5.7
5
2
04
.58
70
.91
* T
wen
ty f
ive/
Fo
rty
perc
en
t S
tate
sha
re a
lon
g w
ith
Cen
tral
sha
re r
elea
sed
to
Go
MP
(ex
clud
ing
Cen
tral
Sha
re r
elea
sed
to
OF
B a
nd M
PP
HC
) b
y G
oI.
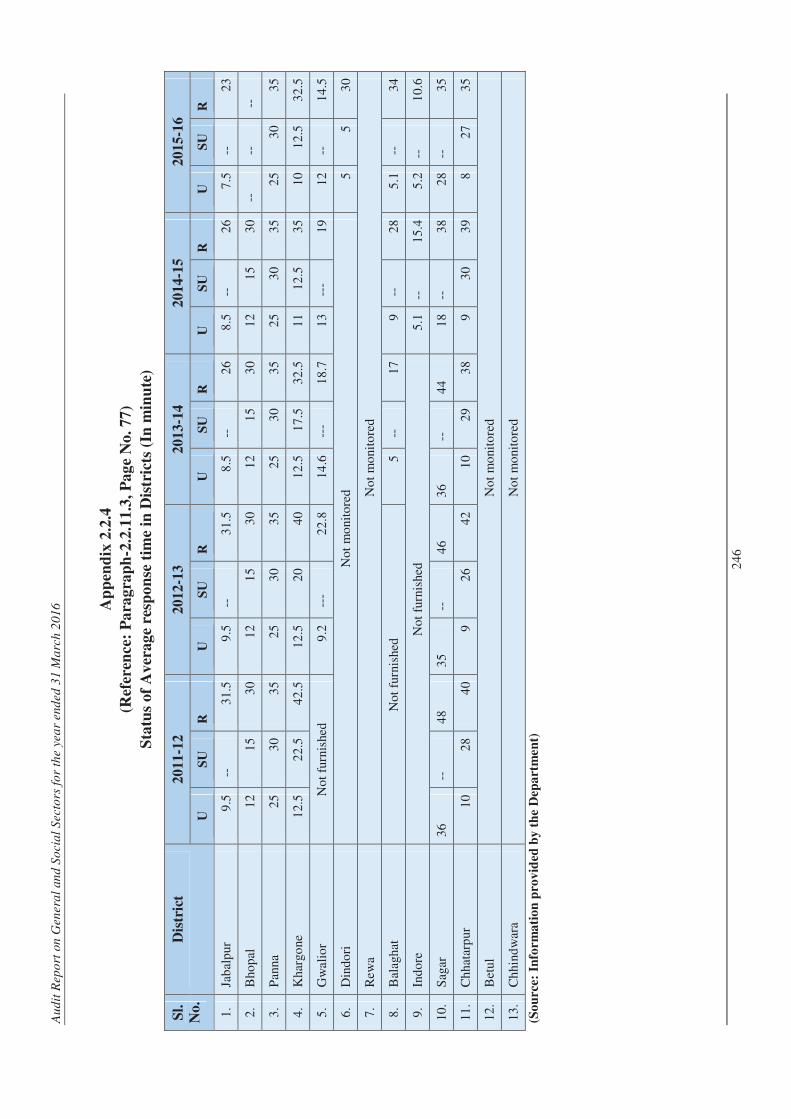
Au
dit
Rep
ort
on
Gen
era
l an
d S
ocia
l S
ecto
rs f
or
the y
ea
r end
ed
31 M
arc
h 2
01
6
24
6
Ap
pen
dix
2.2
.4
(Ref
eren
ce:
Pa
rag
rap
h-2
.2.1
1.3
, P
ag
e N
o.
77
)
Sta
tus
of
Av
era
ge
resp
on
se t
ime
in D
istr
icts
(In
min
ute
)
Sl.
No
.
Dis
tric
t 2
01
1-1
2
20
12
-13
20
13
-14
20
14
-15
20
15
-16
U
SU
R
U
S
U
R
U
SU
R
U
S
U
R
U
SU
R
1.
Jab
alp
ur
9.5
-
- 3
1.5
9
.5
--
31
.5
8.5
-
- 2
6 8
.5
--
26
7.5
-
- 2
3
2.
Bho
pal
1
2 1
5 3
0 1
2 1
5 3
0 1
2 1
5 3
0 1
2 1
5 3
0 -
- -
- -
-
3.
Pan
na
25
30
35
25
30
35
25
30
35
25
30
35
25
30
35
4.
Kha
rgo
ne
12
.5
22
.5
42
.5
12
.5
20
40
12
.5
17
.5
32
.5
11
12
.5
35
10
12
.5
32
.5
5.
Gw
alio
r N
ot
furn
ishe
d
9.2
-
--
22
.8
14
.6
---
1
8.7
1
3 -
--
19
12
--
14
.5
6.
Din
do
ri
No
t m
oni
tore
d
5
5
30
7.
Rew
a N
ot
mo
nito
red
8.
Bal
agha
t N
ot
furn
ishe
d
5
--
17
9
--
28
5.1
-
- 3
4
9.
Ind
ore
N
ot
furn
ishe
d
5.1
--
1
5.4
5
.2
--
10
.6
10
. S
agar
3
6 --
4
8 3
5 --
4
6 3
6 --
4
4 1
8 --
3
8 2
8 --
3
5
11
. C
hha
tarp
ur
10
28
40
9
26
42
10
29
38
9
30
39
8
27
35
12
. B
etul
N
ot
mo
nito
red
13
. C
hhi
ndw
ara
No
t m
oni
tore
d
(So
urc
e: I
nfo
rm
ati
on
pro
vid
ed b
y t
he
Dep
art
men
t)
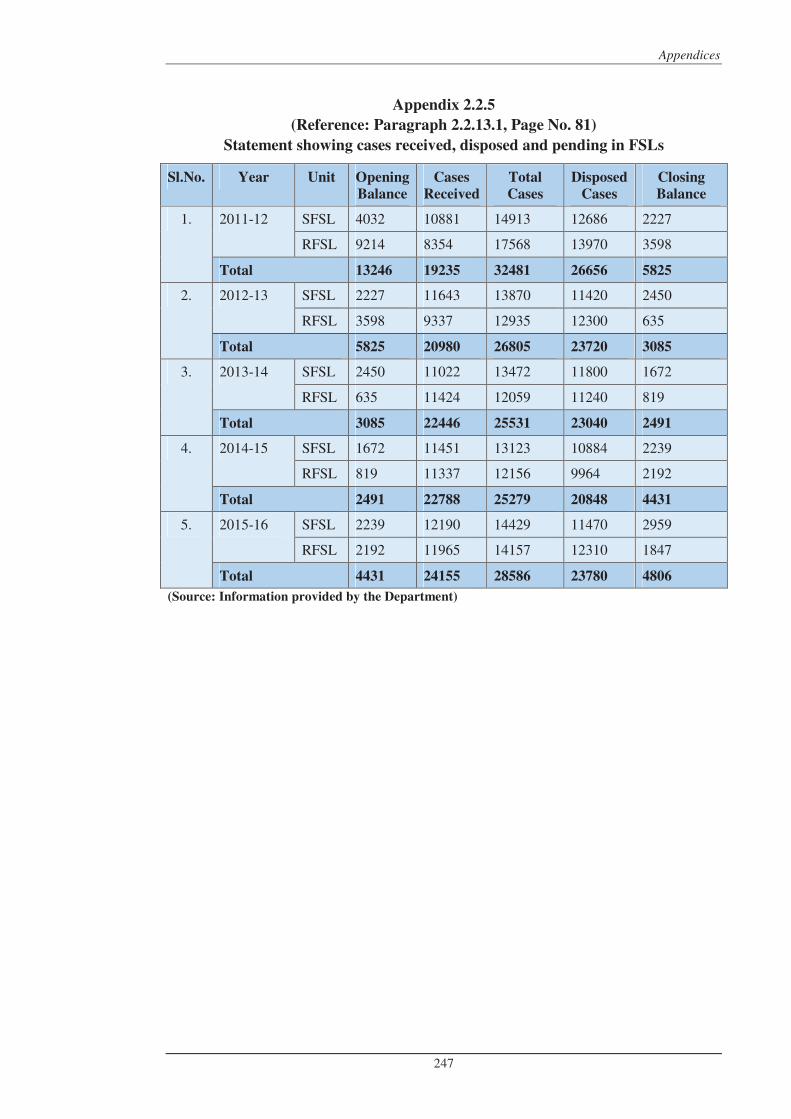
Appendices
247
Appendix 2.2.5
(Reference: Paragraph 2.2.13.1, Page No. 81)
Statement showing cases received, disposed and pending in FSLs
Sl.No. Year Unit Opening
Balance
Cases
Received
Total
Cases
Disposed
Cases
Closing
Balance
1. 2011-12 SFSL 4032 10881 14913 12686 2227
RFSL 9214 8354 17568 13970 3598
Total 13246 19235 32481 26656 5825
2. 2012-13 SFSL 2227 11643 13870 11420 2450
RFSL 3598 9337 12935 12300 635
Total 5825 20980 26805 23720 3085
3. 2013-14 SFSL 2450 11022 13472 11800 1672
RFSL 635 11424 12059 11240 819
Total 3085 22446 25531 23040 2491
4. 2014-15 SFSL 1672 11451 13123 10884 2239
RFSL 819 11337 12156 9964 2192
Total 2491 22788 25279 20848 4431
5. 2015-16 SFSL 2239 12190 14429 11470 2959
RFSL 2192 11965 14157 12310 1847
Total 4431 24155 28586 23780 4806
(Source: Information provided by the Department)
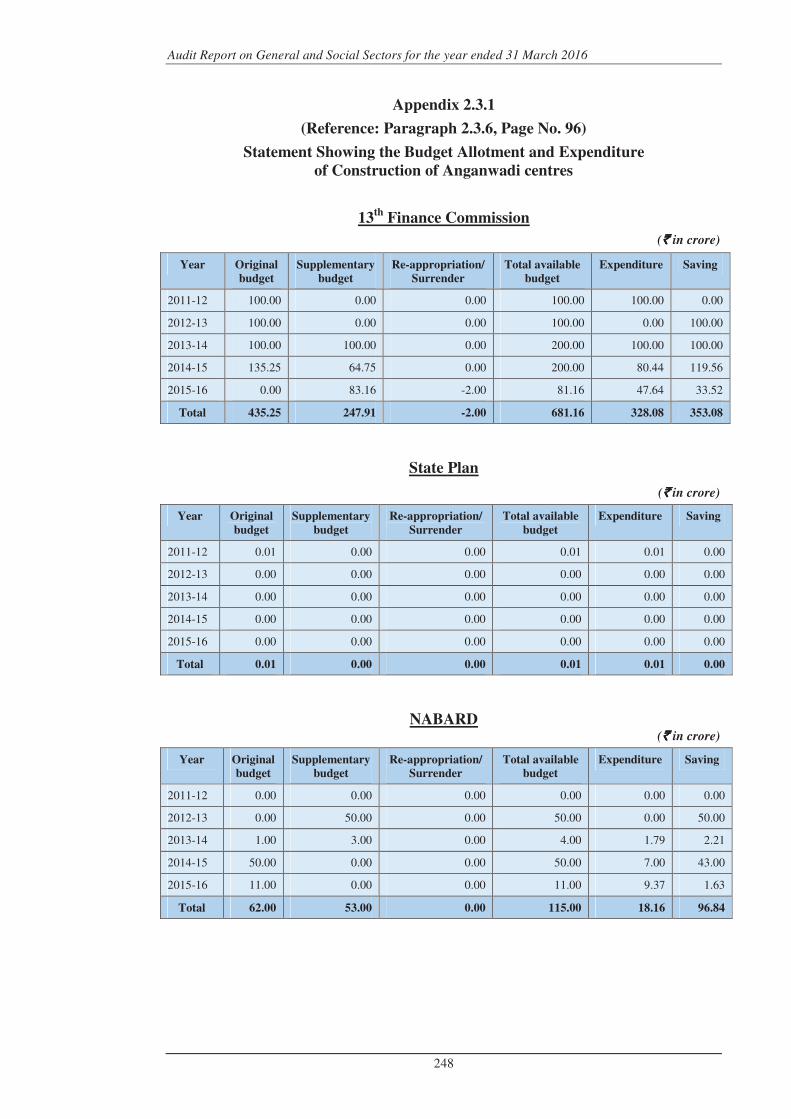
Audit Report on General and Social Sectors for the year ended 31 March 2016
248
Appendix 2.3.1
(Reference: Paragraph 2.3.6, Page No. 96)
Statement Showing the Budget Allotment and Expenditure
of Construction of Anganwadi centres
13th
Finance Commission
(` ` ` ` in crore)
Year Original
budget
Supplementary
budget
Re-appropriation/
Surrender
Total available
budget
Expenditure Saving
2011-12 100.00 0.00 0.00 100.00 100.00 0.00
2012-13 100.00 0.00 0.00 100.00 0.00 100.00
2013-14 100.00 100.00 0.00 200.00 100.00 100.00
2014-15 135.25 64.75 0.00 200.00 80.44 119.56
2015-16 0.00 83.16 -2.00 81.16 47.64 33.52
Total 435.25 247.91 -2.00 681.16 328.08 353.08
State Plan
(`̀̀̀ in crore)
Year Original
budget
Supplementary
budget
Re-appropriation/
Surrender
Total available
budget
Expenditure Saving
2011-12 0.01 0.00 0.00 0.01 0.01 0.00
2012-13 0.00 0.00 0.00 0.00 0.00 0.00
2013-14 0.00 0.00 0.00 0.00 0.00 0.00
2014-15 0.00 0.00 0.00 0.00 0.00 0.00
2015-16 0.00 0.00 0.00 0.00 0.00 0.00
Total 0.01 0.00 0.00 0.01 0.01 0.00
NABARD (` ` ` ` in crore)
Year Original
budget
Supplementary
budget
Re-appropriation/
Surrender
Total available
budget
Expenditure Saving
2011-12 0.00 0.00 0.00 0.00 0.00 0.00
2012-13 0.00 50.00 0.00 50.00 0.00 50.00
2013-14 1.00 3.00 0.00 4.00 1.79 2.21
2014-15 50.00 0.00 0.00 50.00 7.00 43.00
2015-16 11.00 0.00 0.00 11.00 9.37 1.63
Total 62.00 53.00 0.00 115.00 18.16 96.84
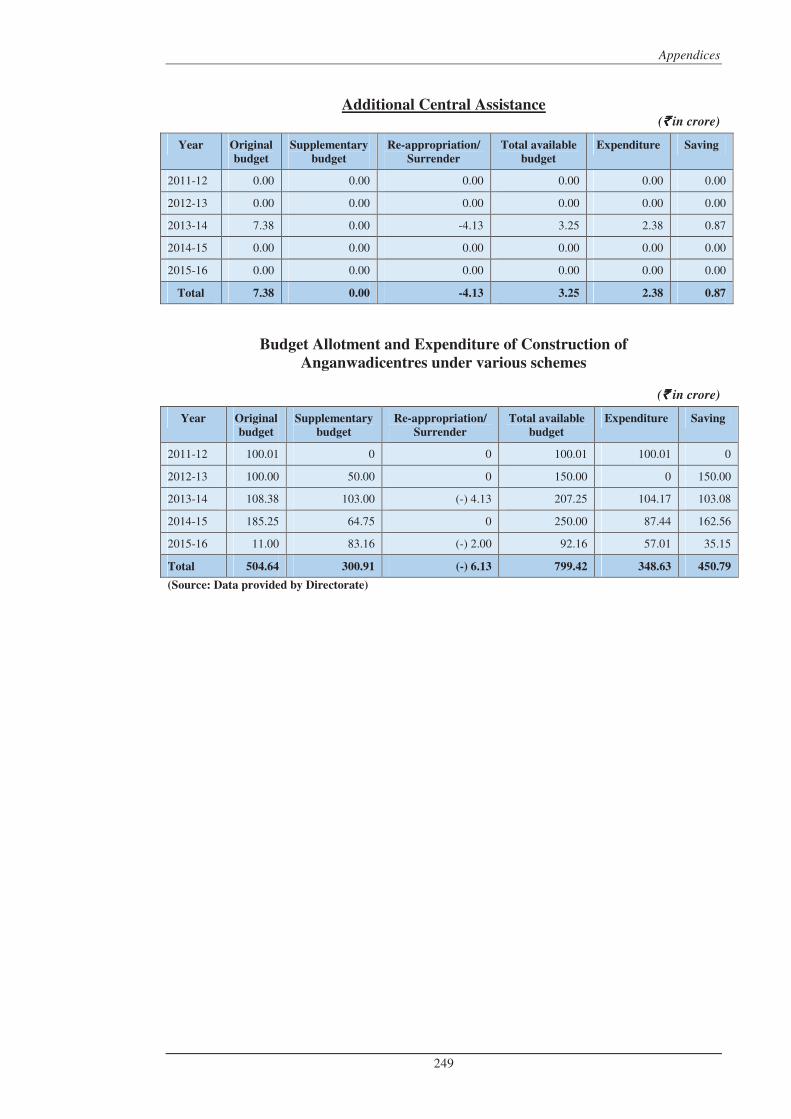
Appendices
249
Additional Central Assistance (`̀̀̀ in crore)
Year Original
budget
Supplementary
budget
Re-appropriation/
Surrender
Total available
budget
Expenditure Saving
2011-12 0.00 0.00 0.00 0.00 0.00 0.00
2012-13 0.00 0.00 0.00 0.00 0.00 0.00
2013-14 7.38 0.00 -4.13 3.25 2.38 0.87
2014-15 0.00 0.00 0.00 0.00 0.00 0.00
2015-16 0.00 0.00 0.00 0.00 0.00 0.00
Total 7.38 0.00 -4.13 3.25 2.38 0.87
Budget Allotment and Expenditure of Construction of
Anganwadicentres under various schemes
(` ` ` ` in crore)
Year Original
budget
Supplementary
budget
Re-appropriation/
Surrender
Total available
budget
Expenditure Saving
2011-12 100.01 0 0 100.01 100.01 0
2012-13 100.00 50.00 0 150.00 0 150.00
2013-14 108.38 103.00 (-) 4.13 207.25 104.17 103.08
2014-15 185.25 64.75 0 250.00 87.44 162.56
2015-16 11.00 83.16 (-) 2.00 92.16 57.01 35.15
Total 504.64 300.91 (-) 6.13 799.42 348.63 450.79
(Source: Data provided by Directorate)
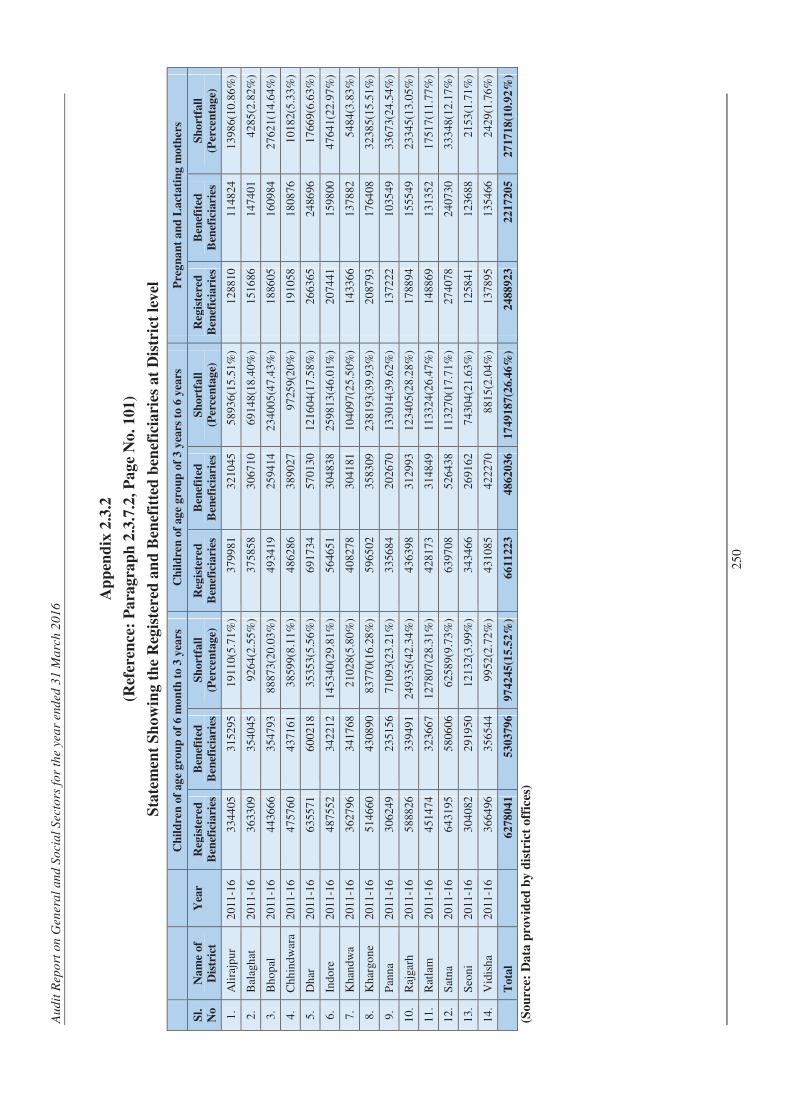
Au
dit
Rep
ort
on
Gen
era
l an
d S
ocia
l S
ecto
rs f
or
the y
ea
r end
ed
31 M
arc
h 2
01
6
25
0
Ap
pen
dix
2.3
.2
(Ref
eren
ce:
Pa
rag
rap
h 2
.3.7
.2,
Pa
ge
No
. 1
01
)
Sta
tem
ent
Sh
ow
ing
th
e R
egis
tered
an
d B
enef
itte
d b
enef
icia
ries
at
Dis
tric
t le
vel
C
hil
dre
n o
f ag
e g
rou
p o
f 6
mon
th t
o 3
yea
rs
Ch
ild
ren
of
ag
e g
rou
p o
f 3
yea
rs t
o 6
yea
rs
Pre
gn
an
t a
nd
Lact
ati
ng
moth
ers
Sl.
No
Na
me
of
Dis
tric
t
Yea
r
Reg
iste
red
Ben
efic
iari
es
Ben
efit
ed
Ben
efic
iari
es
Sh
ort
fall
(Per
cen
tag
e)
Reg
iste
red
Ben
efic
iari
es
Ben
efit
ed
Ben
efic
iari
es
Sh
ort
fall
(Per
cen
tag
e)
Reg
iste
red
Ben
efic
iari
es
Ben
efit
ed
Ben
efic
iari
es
Sh
ort
fall
(Per
cen
tag
e)
1.
Ali
rajp
ur
20
11-1
6 3
344
05
31
5295
1
911
0(5
.71
%)
37
9981
3
210
45
58
936(
15.5
1%
) 1
288
10
11
4824
1
398
6(10
.86
%)
2.
Bal
agh
at
20
11-1
6 3
633
09
35
4045
9
264
(2.5
5%
) 3
758
58
30
6710
6
914
8(18
.40
%)
15
1686
1
474
01
42
85(2
.82
%)
3.
Bh
op
al
20
11-1
6 4
436
66
35
4793
8
887
3(20
.03
%)
49
3419
2
594
14
23
4005
(47
.43
%)
18
8605
1
609
84
27
621(
14.6
4%
)
4.
Ch
hin
dw
ara
20
11-1
6 4
757
60
43
7161
3
859
9(8
.11
%)
48
6286
3
890
27
97
259(
20%
) 1
910
58
18
0876
1
018
2(5
.33
%)
5.
Dh
ar
20
11-1
6 6
355
71
60
0218
3
535
3(5
.56
%)
69
1734
5
701
30
12
1604
(17
.58
%)
26
6365
2
486
96
17
669(
6.6
3%
)
6.
Indo
re
20
11-1
6 4
875
52
34
2212
1
453
40(2
9.8
1%
) 5
646
51
30
4838
2
598
13(4
6.0
1%
) 2
074
41
15
9800
4
764
1(22
.97
%)
7.
Kh
and
wa
20
11-1
6 3
627
96
34
1768
2
102
8(5
.80
%)
40
8278
3
041
81
10
4097
(25
.50
%)
14
3366
1
378
82
54
84(3
.83
%)
8.
Kh
argo
ne
20
11-1
6 5
146
60
43
0890
8
377
0(16
.28
%)
59
6502
3
583
09
23
8193
(39
.93
%)
20
8793
1
764
08
32
385(
15.5
1%
)
9.
Pan
na
20
11-1
6 3
062
49
23
5156
7
109
3(23
.21
%)
33
5684
2
026
70
13
3014
(39
.62
%)
13
7222
1
035
49
33
673(
24.5
4%
)
10
. R
ajga
rh
20
11-1
6 5
888
26
33
9491
2
493
35(4
2.3
4%
) 4
363
98
31
2993
1
234
05(2
8.2
8%
) 1
788
94
15
5549
2
334
5(13
.05
%)
11
. R
atla
m
20
11-1
6 4
514
74
32
3667
1
278
07(2
8.3
1%
) 4
281
73
31
4849
1
133
24(2
6.4
7%
) 1
488
69
13
1352
1
751
7(11
.77
%)
12
. S
atn
a 2
011
-16
64
3195
5
806
06
62
589(
9.7
3%
) 6
397
08
52
6438
1
132
70(1
7.7
1%
) 2
740
78
24
0730
3
334
8(12
.17
%)
13
. S
eon
i 2
011
-16
30
4082
2
919
50
12
132(
3.9
9%
) 3
434
66
26
9162
7
430
4(21
.63
%)
12
5841
1
236
88
21
53(1
.71
%)
14
. V
idis
ha
20
11-1
6 3
664
96
35
6544
9
952
(2.7
2%
) 4
310
85
42
2270
8
815
(2.0
4%
) 1
378
95
13
5466
2
429
(1.7
6%
)
T
ota
l
62
78
04
1
53
03
79
6
97
42
45
(15
.52
%)
66
11
22
3
48
62
03
6
17
49
18
7(2
6.4
6%
) 2
488
92
3
22
17
20
5
27
17
18
(10
.92
%)
(So
urc
e: D
ata
pro
vid
ed b
y d
istr
ict
off
ices
)
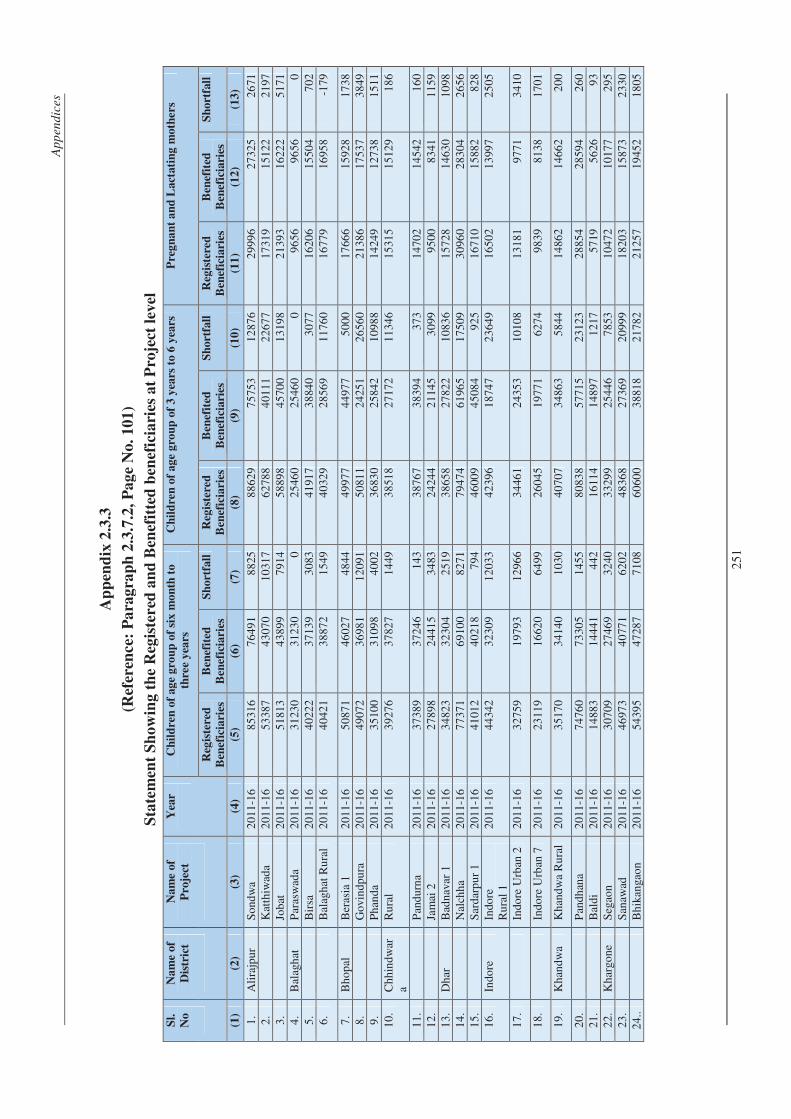
Ap
pen
dic
es
25
1
Ap
pen
dix
2.3
.3
(Ref
eren
ce:
Pa
rag
rap
h 2
.3.7
.2,
Pa
ge
No
. 1
01
)
Sta
tem
ent
Sh
ow
ing
th
e R
egis
tered
an
d B
enef
itte
d b
enef
icia
ries
at
Pro
ject
lev
el
Sl.
No
Na
me
of
Dis
tric
t
Na
me
of
Pro
ject
Yea
r
Ch
ild
ren
of
ag
e g
rou
p o
f si
x m
on
th t
o
thre
e y
ears
Ch
ild
ren
of
ag
e g
rou
p o
f 3
yea
rs t
o 6
yea
rs
Pre
gn
an
t a
nd
Lact
ati
ng
moth
ers
Reg
iste
red
Ben
efic
iari
es
Ben
efit
ed
Ben
efic
iari
es
Sh
ort
fall
R
egis
tere
d
Ben
efic
iari
es
Ben
efit
ed
Ben
efic
iari
es
Sh
ort
fall
R
egis
tere
d
Ben
efic
iari
es
Ben
efit
ed
Ben
efic
iari
es
Sh
ort
fall
(1)
(2)
(3)
(4)
(5)
(6)
(7)
(8)
(9)
(10
) (1
1)
(12
) (1
3)
1.
Ali
rajp
ur
So
ndw
a 2
011
-16
85
316
76
491
88
25
88
629
75
753
12
876
29
996
27
325
26
71
2.
K
atth
iwad
a 2
011
-16
53
387
43
070
10
317
62
788
40
111
22
677
17
319
15
122
21
97
3.
Jo
bat
2
011
-16
51
813
43
899
79
14
58
898
45
700
13
198
21
393
16
222
51
71
4.
Bal
agh
at
Par
asw
ada
20
11-1
6 3
123
0 3
123
0 0
2
546
0 2
546
0 0
9
656
9
656
0
5
.
Bir
sa
20
11-1
6 4
022
2 3
713
9 3
083
4
191
7 3
884
0 3
077
1
620
6 1
550
4 7
02
6.
B
alag
hat
Ru
ral
20
11-1
6 4
042
1 3
887
2 1
549
4
032
9 2
856
9 1
176
0 1
677
9 1
695
8 -1
79
7.
Bh
op
al
Ber
asia
1
20
11-1
6 5
087
1 4
602
7 4
844
4
997
7 4
497
7 5
000
1
766
6 1
592
8 1
738
8
.
Go
vin
dp
ura
2
011
-16
49
072
36
981
12
091
50
811
24
251
26
560
21
386
17
537
38
49
9.
P
han
da
20
11-1
6 3
510
0 3
109
8 4
002
3
683
0 2
584
2 1
098
8 1
424
9 1
273
8 1
511
1
0.
Ch
hin
dw
ara
Ru
ral
20
11-1
6 3
927
6 3
782
7 1
449
3
851
8 2
717
2 1
134
6 1
531
5 1
512
9 1
86
11
.
Pan
dur
na
20
11-1
6 3
738
9 3
724
6 1
43
38
767
38
394
37
3 1
470
2 1
454
2 1
60
12
.
Jam
ai 2
2
011
-16
27
898
24
415
34
83
24
244
21
145
30
99
95
00
83
41
11
59
13
. D
har
B
adn
avar
1
20
11-1
6 3
482
3 3
230
4 2
519
3
865
8 2
782
2 1
083
6 1
572
8 1
463
0 1
098
1
4.
N
alch
ha
20
11-1
6 7
737
1 6
910
0 8
271
7
947
4 6
196
5 1
750
9 3
096
0 2
830
4 2
656
1
5.
S
ard
arp
ur
1 2
011
-16
41
012
40
218
79
4 4
600
9 4
508
4 9
25
16
710
15
882
82
8 1
6.
Indo
re
Indo
re
Ru
ral
1 2
011
-16
44
342
32
309
12
033
42
396
18
747
23
649
16
502
13
997
25
05
17
.
Indo
re U
rban
2
20
11-1
6 3
275
9 1
979
3 1
296
6 3
446
1 2
435
3 1
010
8 1
318
1 9
771
3
410
18
.
Indo
re U
rban
7
20
11-1
6 2
311
9 1
662
0 6
499
2
604
5 1
977
1 6
274
9
839
8
138
1
701
19
. K
han
dw
a K
han
dw
a R
ura
l 2
011
-16
35
170
34
140
10
30
40
707
34
863
58
44
14
862
14
662
20
0
20
.
Pan
dh
ana
20
11-1
6 7
476
0 7
330
5 1
455
8
083
8 5
771
5 2
312
3 2
885
4 2
859
4 2
60
21
.
Bal
di
20
11-1
6 1
488
3 1
444
1 4
42
16
114
14
897
12
17
57
19
56
26
93
22
. K
har
gon
e S
egao
n
20
11-1
6 3
070
9 2
746
9 3
240
3
329
9 2
544
6 7
853
1
047
2 1
017
7 2
95
23
.
San
awad
2
011
-16
46
973
40
771
62
02
48
368
27
369
20
999
18
203
15
873
23
30
24
..
Bh
ikan
gao
n 2
011
-16
54
395
47
287
71
08
60
600
38
818
21
782
21
257
19
452
18
05
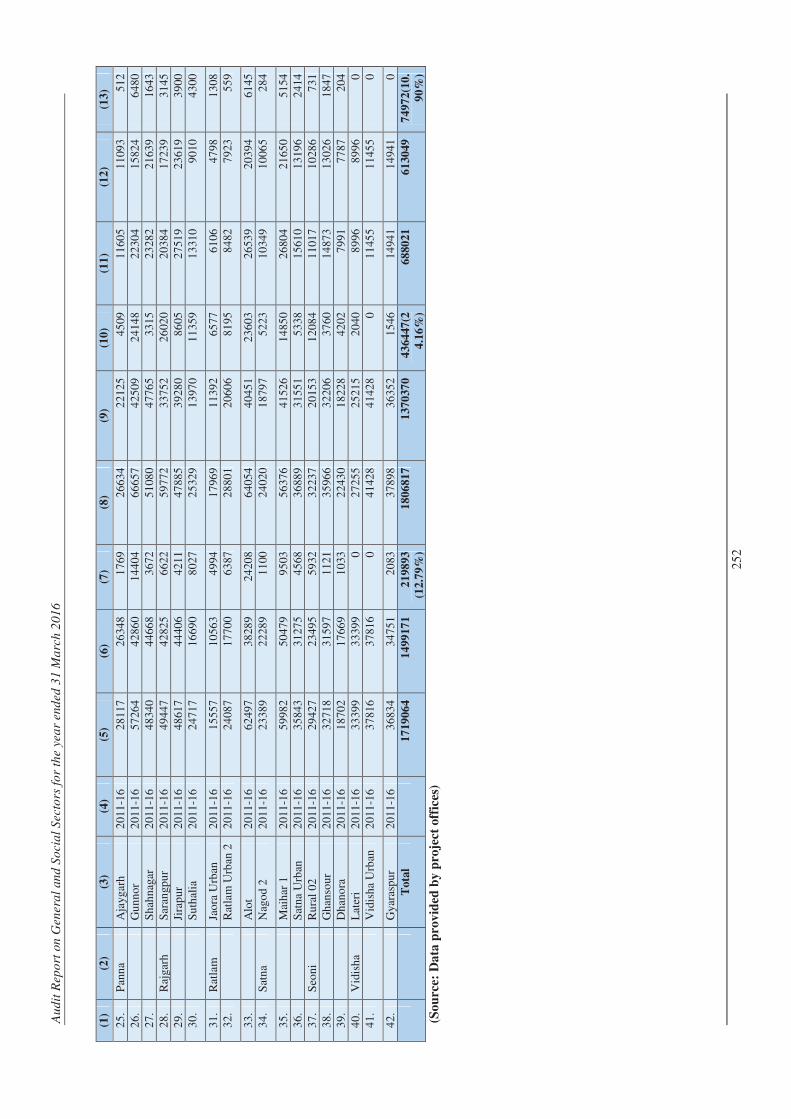
Au
dit
Rep
ort
on
Gen
era
l an
d S
ocia
l S
ecto
rs f
or
the y
ea
r end
ed
31 M
arc
h 2
01
6
25
2
(1)
(2)
(3)
(4)
(5)
(6)
(7)
(8)
(9)
(10
) (1
1)
(12
) (1
3)
25
. P
ann
a A
jayg
arh
2
011
-16
28
117
26
348
17
69
26
634
22
125
45
09
11
605
11
093
51
2 2
6.
G
un
no
r 2
011
-16
57
264
42
860
14
404
66
657
42
509
24
148
22
304
15
824
64
80
27
.
Sh
ahn
agar
2
011
-16
48
340
44
668
36
72
51
080
47
765
33
15
23
282
21
639
16
43
28
. R
ajga
rh
Sar
angp
ur
20
11-1
6 4
944
7 4
282
5 6
622
5
977
2 3
375
2 2
602
0 2
038
4 1
723
9 3
145
2
9.
Ji
rap
ur
20
11-1
6 4
861
7 4
440
6 4
211
4
788
5 3
928
0 8
605
2
751
9 2
361
9 3
900
3
0.
S
uth
alia
2
011
-16
24
717
16
690
80
27
25
329
13
970
11
359
13
310
90
10
43
00
31
. R
atla
m
Jao
ra U
rban
2
011
-16
15
557
10
563
49
94
17
969
11
392
65
77
61
06
47
98
13
08
32
.
Rat
lam
Urb
an 2
2
011
-16
24
087
17
700
63
87
28
801
20
606
81
95
84
82
79
23
55
9
33
.
Alo
t 2
011
-16
62
497
38
289
24
208
64
054
40
451
23
603
26
539
20
394
61
45
34
. S
atn
a N
ago
d 2
2
011
-16
23
389
22
289
11
00
24
020
18
797
52
23
10
349
10
065
28
4
35
.
Mai
har
1
20
11-1
6 5
998
2 5
047
9 9
503
5
637
6 4
152
6 1
485
0 2
680
4 2
165
0 5
154
3
6.
S
atn
a U
rban
2
011
-16
35
843
31
275
45
68
36
889
31
551
53
38
15
610
13
196
24
14
37
. S
eon
i R
ura
l 02
2
011
-16
29
427
23
495
59
32
32
237
20
153
12
084
11
017
10
286
73
1 3
8.
G
han
sou
r 2
011
-16
32
718
31
597
11
21
35
966
32
206
37
60
14
873
13
026
18
47
39
.
Dh
ano
ra
20
11-1
6 1
870
2 1
766
9 1
033
2
243
0 1
822
8 4
202
7
991
7
787
2
04
40
. V
idis
ha
Lat
eri
20
11-1
6 3
339
9 3
339
9 0
2
725
5 2
521
5 2
040
8
996
8
996
0
4
1.
V
idis
ha
Urb
an
20
11-1
6 3
781
6 3
781
6 0
4
142
8 4
142
8 0
1
145
5 1
145
5 0
42
.
Gya
rasp
ur
20
11-1
6 3
683
4 3
475
1 2
083
3
789
8 3
635
2 1
546
1
494
1 1
494
1 0
T
ota
l
17
19
06
4
14
99
17
1
21
98
93
(12
.79
%)
18
06
81
7
13
70
37
0
43
64
47
(2
4.1
6%
)
68
80
21
61
30
49
74
97
2(1
0.
90
%)
(So
urc
e: D
ata
pro
vid
ed b
y p
roje
ct o
ffic
es)
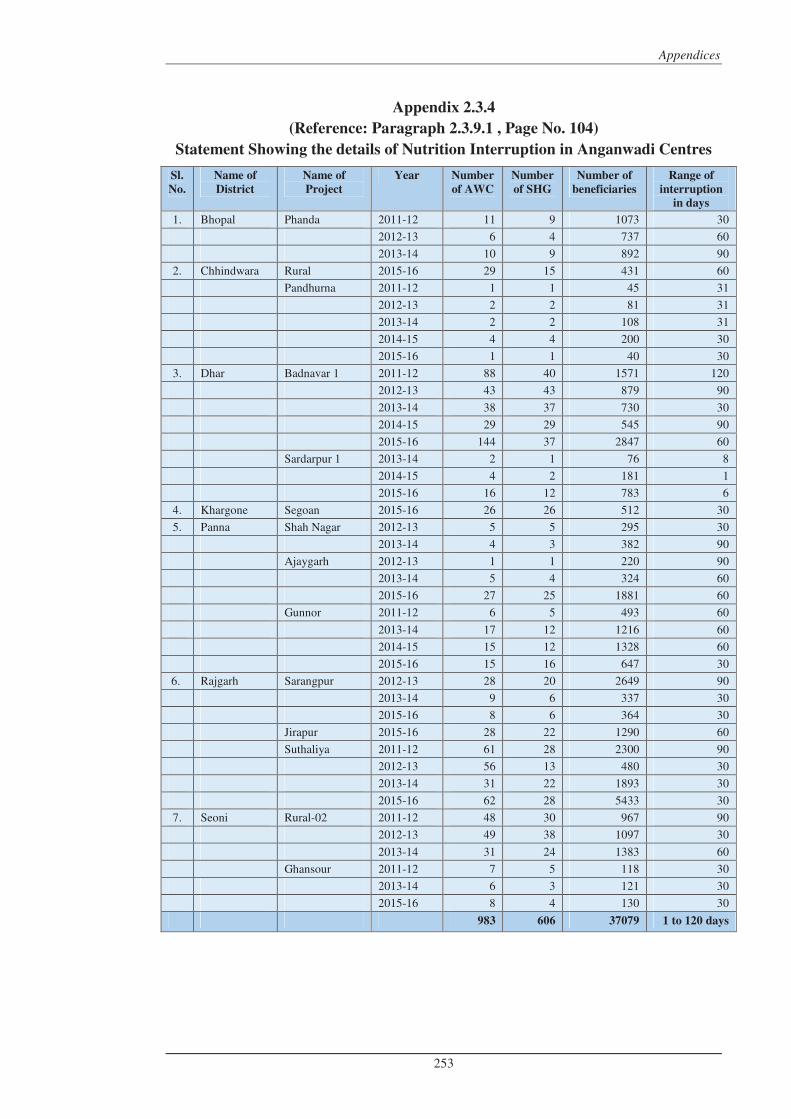
Appendices
253
Appendix 2.3.4
(Reference: Paragraph 2.3.9.1 , Page No. 104)
Statement Showing the details of Nutrition Interruption in Anganwadi Centres
Sl.
No.
Name of
District
Name of
Project
Year Number
of AWC
Number
of SHG
Number of
beneficiaries
Range of
interruption
in days
1. Bhopal Phanda 2011-12 11 9 1073 30
2012-13 6 4 737 60
2013-14 10 9 892 90
2. Chhindwara Rural 2015-16 29 15 431 60
Pandhurna 2011-12 1 1 45 31
2012-13 2 2 81 31
2013-14 2 2 108 31
2014-15 4 4 200 30
2015-16 1 1 40 30
3. Dhar Badnavar 1 2011-12 88 40 1571 120
2012-13 43 43 879 90
2013-14 38 37 730 30
2014-15 29 29 545 90
2015-16 144 37 2847 60
Sardarpur 1 2013-14 2 1 76 8
2014-15 4 2 181 1
2015-16 16 12 783 6
4. Khargone Segoan 2015-16 26 26 512 30
5. Panna Shah Nagar 2012-13 5 5 295 30
2013-14 4 3 382 90
Ajaygarh 2012-13 1 1 220 90
2013-14 5 4 324 60
2015-16 27 25 1881 60
Gunnor 2011-12 6 5 493 60
2013-14 17 12 1216 60
2014-15 15 12 1328 60
2015-16 15 16 647 30
6. Rajgarh Sarangpur 2012-13 28 20 2649 90
2013-14 9 6 337 30
2015-16 8 6 364 30
Jirapur 2015-16 28 22 1290 60
Suthaliya 2011-12 61 28 2300 90
2012-13 56 13 480 30
2013-14 31 22 1893 30
2015-16 62 28 5433 30
7. Seoni Rural-02 2011-12 48 30 967 90
2012-13 49 38 1097 30
2013-14 31 24 1383 60
Ghansour 2011-12 7 5 118 30
2013-14 6 3 121 30
2015-16 8 4 130 30
983 606 37079 1 to 120 days
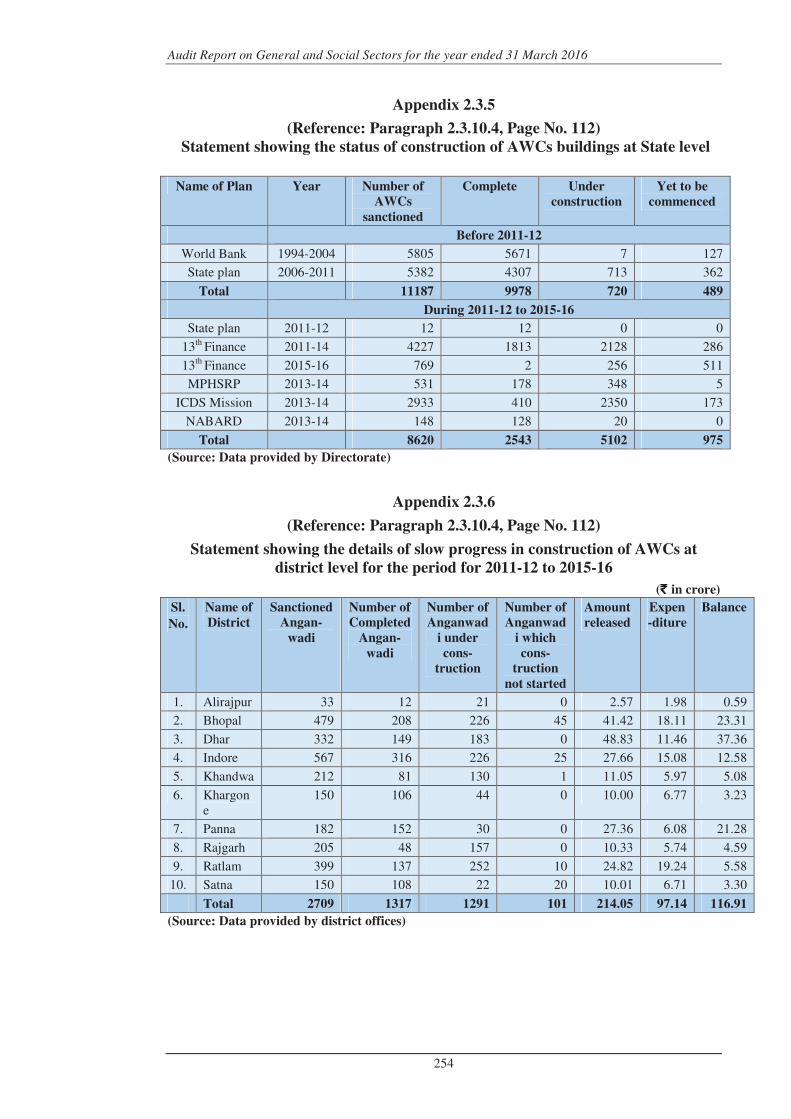
Audit Report on General and Social Sectors for the year ended 31 March 2016
254
Appendix 2.3.5
(Reference: Paragraph 2.3.10.4, Page No. 112)
Statement showing the status of construction of AWCs buildings at State level
Name of Plan Year Number of
AWCs
sanctioned
Complete Under
construction
Yet to be
commenced
Before 2011-12
World Bank 1994-2004 5805 5671 7 127
State plan 2006-2011 5382 4307 713 362
Total 11187 9978 720 489
During 2011-12 to 2015-16
State plan 2011-12 12 12 0 0
13th Finance 2011-14 4227 1813 2128 286
13th Finance 2015-16 769 2 256 511
MPHSRP 2013-14 531 178 348 5
ICDS Mission 2013-14 2933 410 2350 173
NABARD 2013-14 148 128 20 0
Total 8620 2543 5102 975
(Source: Data provided by Directorate)
Appendix 2.3.6
(Reference: Paragraph 2.3.10.4, Page No. 112)
Statement showing the details of slow progress in construction of AWCs at
district level for the period for 2011-12 to 2015-16
(` ` ` ` in crore)
Sl.
No.
Name of
District
Sanctioned
Angan-
wadi
Number of
Completed
Angan-
wadi
Number of
Anganwad
i under
cons-
truction
Number of
Anganwad
i which
cons-
truction
not started
Amount
released
Expen
-diture
Balance
1. Alirajpur 33 12 21 0 2.57 1.98 0.59
2. Bhopal 479 208 226 45 41.42 18.11 23.31
3. Dhar 332 149 183 0 48.83 11.46 37.36
4. Indore 567 316 226 25 27.66 15.08 12.58
5. Khandwa 212 81 130 1 11.05 5.97 5.08
6. Khargone
150 106 44 0 10.00 6.77 3.23
7. Panna 182 152 30 0 27.36 6.08 21.28
8. Rajgarh 205 48 157 0 10.33 5.74 4.59
9. Ratlam 399 137 252 10 24.82 19.24 5.58
10. Satna 150 108 22 20 10.01 6.71 3.30
Total 2709 1317 1291 101 214.05 97.14 116.91
(Source: Data provided by district offices)
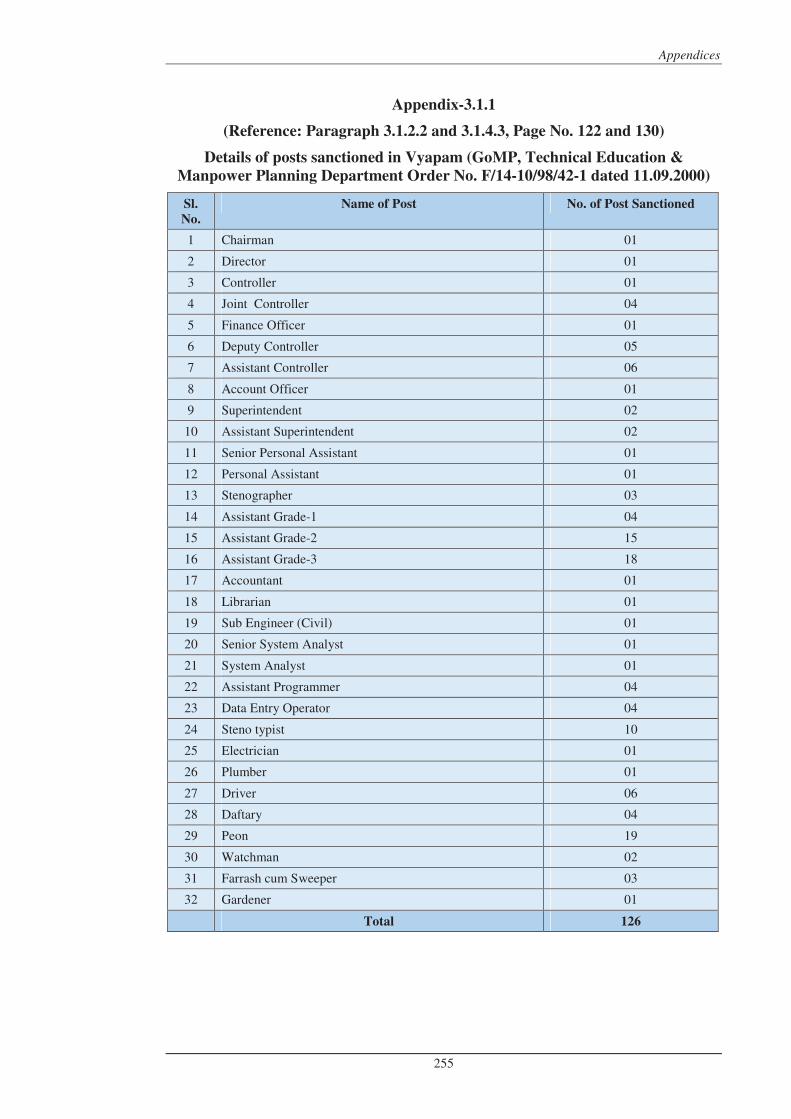
Appendices
255
Appendix-3.1.1
(Reference: Paragraph 3.1.2.2 and 3.1.4.3, Page No. 122 and 130)
Details of posts sanctioned in Vyapam (GoMP, Technical Education &
Manpower Planning Department Order No. F/14-10/98/42-1 dated 11.09.2000)
Sl.
No.
Name of Post No. of Post Sanctioned
1 Chairman 01
2 Director 01
3 Controller 01
4 Joint Controller 04
5 Finance Officer 01
6 Deputy Controller 05
7 Assistant Controller 06
8 Account Officer 01
9 Superintendent 02
10 Assistant Superintendent 02
11 Senior Personal Assistant 01
12 Personal Assistant 01
13 Stenographer 03
14 Assistant Grade-1 04
15 Assistant Grade-2 15
16 Assistant Grade-3 18
17 Accountant 01
18 Librarian 01
19 Sub Engineer (Civil) 01
20 Senior System Analyst 01
21 System Analyst 01
22 Assistant Programmer 04
23 Data Entry Operator 04
24 Steno typist 10
25 Electrician 01
26 Plumber 01
27 Driver 06
28 Daftary 04
29 Peon 19
30 Watchman 02
31 Farrash cum Sweeper 03
32 Gardener 01
Total 126
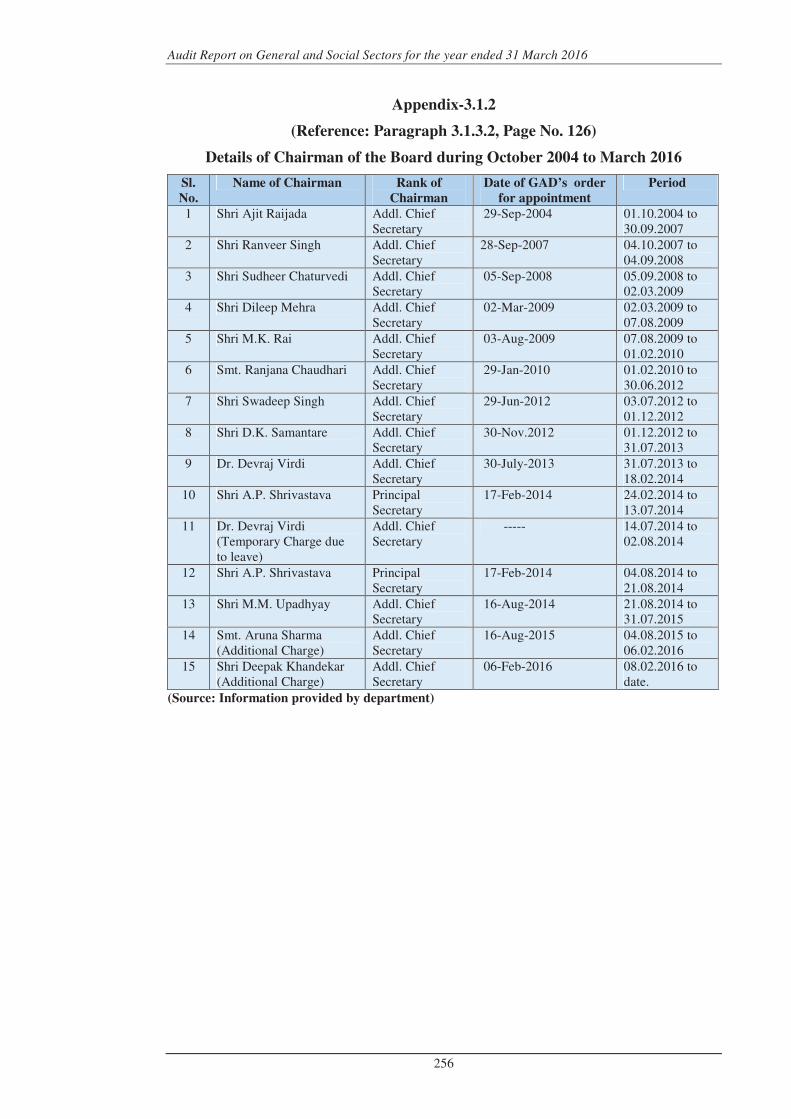
Audit Report on General and Social Sectors for the year ended 31 March 2016
256
Appendix-3.1.2
(Reference: Paragraph 3.1.3.2, Page No. 126)
Details of Chairman of the Board during October 2004 to March 2016
Sl.
No.
Name of Chairman Rank of
Chairman
Date of GAD’s order
for appointment
Period
1 Shri Ajit Raijada Addl. Chief Secretary
29-Sep-2004 01.10.2004 to 30.09.2007
2 Shri Ranveer Singh Addl. Chief Secretary
28-Sep-2007 04.10.2007 to 04.09.2008
3 Shri Sudheer Chaturvedi Addl. Chief Secretary
05-Sep-2008 05.09.2008 to 02.03.2009
4 Shri Dileep Mehra Addl. Chief Secretary
02-Mar-2009 02.03.2009 to 07.08.2009
5 Shri M.K. Rai Addl. Chief Secretary
03-Aug-2009 07.08.2009 to 01.02.2010
6 Smt. Ranjana Chaudhari Addl. Chief Secretary
29-Jan-2010 01.02.2010 to 30.06.2012
7 Shri Swadeep Singh Addl. Chief Secretary
29-Jun-2012 03.07.2012 to 01.12.2012
8 Shri D.K. Samantare Addl. Chief Secretary
30-Nov.2012 01.12.2012 to 31.07.2013
9 Dr. Devraj Virdi Addl. Chief Secretary
30-July-2013 31.07.2013 to 18.02.2014
10 Shri A.P. Shrivastava Principal Secretary
17-Feb-2014 24.02.2014 to 13.07.2014
11 Dr. Devraj Virdi (Temporary Charge due to leave)
Addl. Chief Secretary
----- 14.07.2014 to 02.08.2014
12 Shri A.P. Shrivastava Principal Secretary
17-Feb-2014 04.08.2014 to 21.08.2014
13 Shri M.M. Upadhyay Addl. Chief Secretary
16-Aug-2014 21.08.2014 to 31.07.2015
14 Smt. Aruna Sharma (Additional Charge)
Addl. Chief Secretary
16-Aug-2015 04.08.2015 to 06.02.2016
15 Shri Deepak Khandekar (Additional Charge)
Addl. Chief Secretary
06-Feb-2016 08.02.2016 to date.
(Source: Information provided by department)
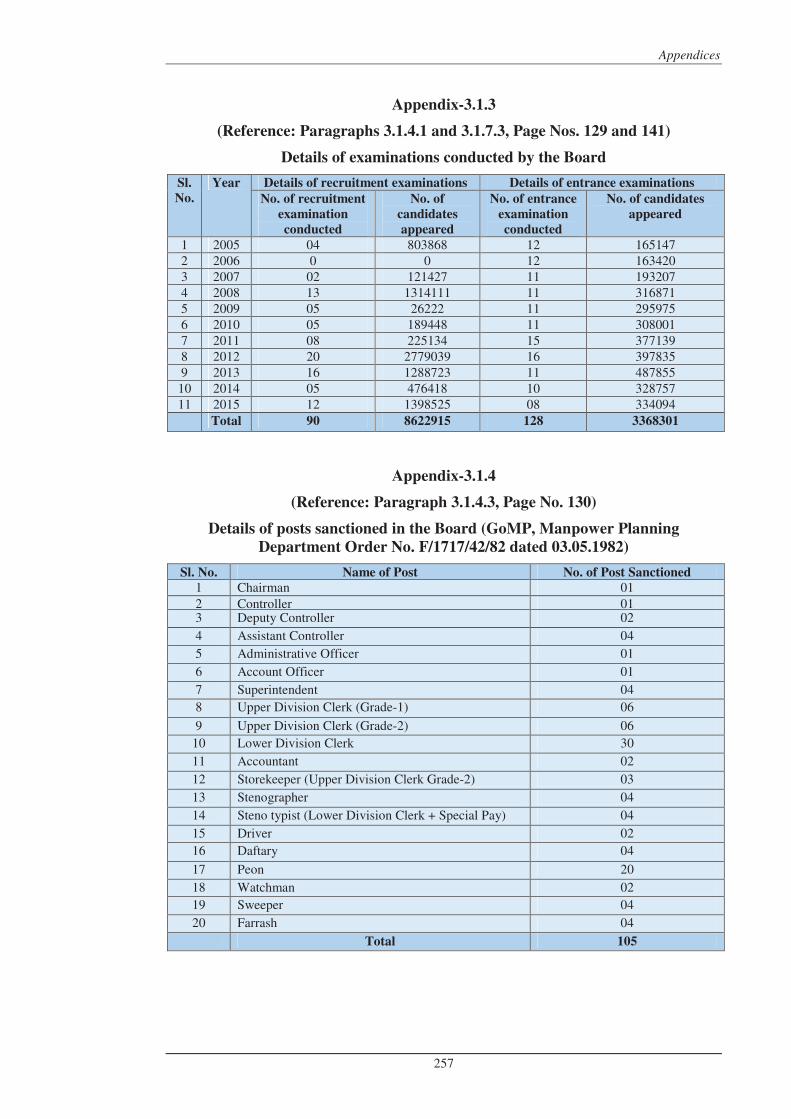
Appendices
257
Appendix-3.1.3
(Reference: Paragraphs 3.1.4.1 and 3.1.7.3, Page Nos. 129 and 141)
Details of examinations conducted by the Board
Sl.
No.
Year Details of recruitment examinations Details of entrance examinations
No. of recruitment
examination
conducted
No. of
candidates
appeared
No. of entrance
examination
conducted
No. of candidates
appeared
1 2005 04 803868 12 165147 2 2006 0 0 12 163420 3 2007 02 121427 11 193207 4 2008 13 1314111 11 316871 5 2009 05 26222 11 295975 6 2010 05 189448 11 308001 7 2011 08 225134 15 377139 8 2012 20 2779039 16 397835 9 2013 16 1288723 11 487855 10 2014 05 476418 10 328757 11 2015 12 1398525 08 334094 Total 90 8622915 128 3368301
Appendix-3.1.4
(Reference: Paragraph 3.1.4.3, Page No. 130)
Details of posts sanctioned in the Board (GoMP, Manpower Planning
Department Order No. F/1717/42/82 dated 03.05.1982)
Sl. No. Name of Post No. of Post Sanctioned
1 Chairman 01 2 Controller 01 3 Deputy Controller 02
4 Assistant Controller 04
5 Administrative Officer 01
6 Account Officer 01
7 Superintendent 04
8 Upper Division Clerk (Grade-1) 06
9 Upper Division Clerk (Grade-2) 06
10 Lower Division Clerk 30
11 Accountant 02
12 Storekeeper (Upper Division Clerk Grade-2) 03
13 Stenographer 04
14 Steno typist (Lower Division Clerk + Special Pay) 04
15 Driver 02
16 Daftary 04
17 Peon 20
18 Watchman 02
19 Sweeper 04
20 Farrash 04
Total 105
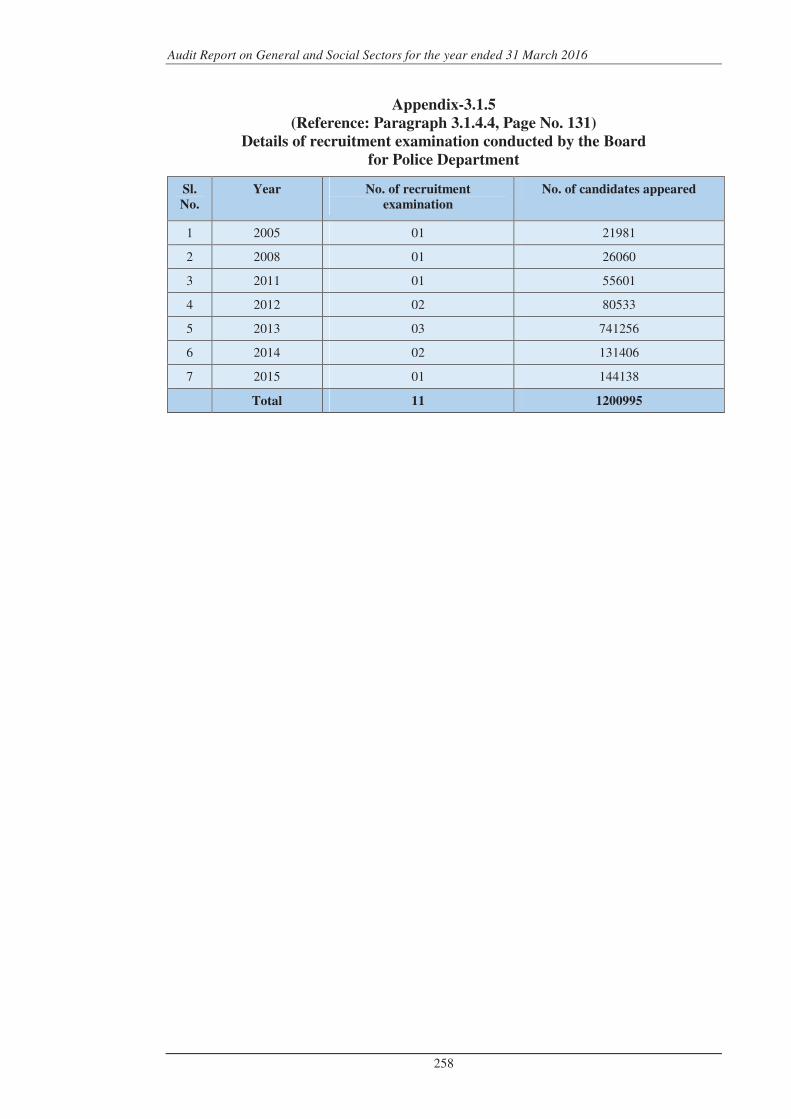
Audit Report on General and Social Sectors for the year ended 31 March 2016
258
Appendix-3.1.5
(Reference: Paragraph 3.1.4.4, Page No. 131)
Details of recruitment examination conducted by the Board
for Police Department
Sl.
No.
Year No. of recruitment
examination
No. of candidates appeared
1 2005 01 21981
2 2008 01 26060
3 2011 01 55601
4 2012 02 80533
5 2013 03 741256
6 2014 02 131406
7 2015 01 144138
Total 11 1200995
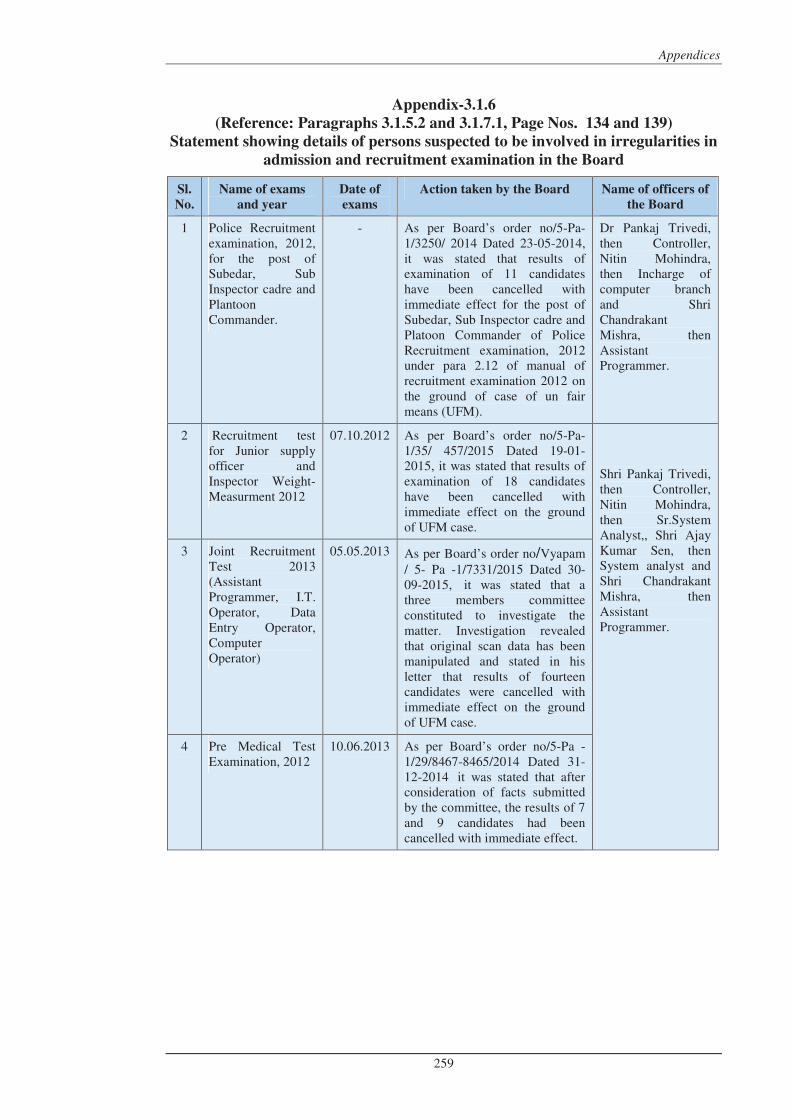
Appendices
259
Appendix-3.1.6
(Reference: Paragraphs 3.1.5.2 and 3.1.7.1, Page Nos. 134 and 139)
Statement showing details of persons suspected to be involved in irregularities in
admission and recruitment examination in the Board
Sl.
No.
Name of exams
and year
Date of
exams
Action taken by the Board Name of officers of
the Board
1 Police Recruitment examination, 2012, for the post of Subedar, Sub Inspector cadre and Plantoon Commander.
- As per Board’s order no/5-Pa-1/3250/ 2014 Dated 23-05-2014, it was stated that results of examination of 11 candidates have been cancelled with immediate effect for the post of Subedar, Sub Inspector cadre and Platoon Commander of Police Recruitment examination, 2012 under para 2.12 of manual of recruitment examination 2012 on the ground of case of un fair means (UFM).
Dr Pankaj Trivedi, then Controller, Nitin Mohindra, then Incharge of computer branch and Shri Chandrakant Mishra, then Assistant Programmer.
2 Recruitment test for Junior supply officer and Inspector Weight-Measurment 2012
07.10.2012 As per Board’s order no/5-Pa-1/35/ 457/2015 Dated 19-01-2015, it was stated that results of examination of 18 candidates have been cancelled with immediate effect on the ground of UFM case.
Shri Pankaj Trivedi, then Controller, Nitin Mohindra, then Sr.System Analyst,, Shri Ajay Kumar Sen, then System analyst and Shri Chandrakant Mishra, then Assistant Programmer.
3 Joint Recruitment Test 2013 (Assistant Programmer, I.T. Operator, Data Entry Operator, Computer Operator)
05.05.2013 As per Board’s order no/Vyapam / 5- Pa -1/7331/2015 Dated 30-09-2015, it was stated that a three members committee constituted to investigate the matter. Investigation revealed that original scan data has been manipulated and stated in his letter that results of fourteen candidates were cancelled with immediate effect on the ground of UFM case.
4 Pre Medical Test Examination, 2012
10.06.2013 As per Board’s order no/5-Pa -1/29/8467-8465/2014 Dated 31-12-2014 it was stated that after consideration of facts submitted by the committee, the results of 7 and 9 candidates had been cancelled with immediate effect.
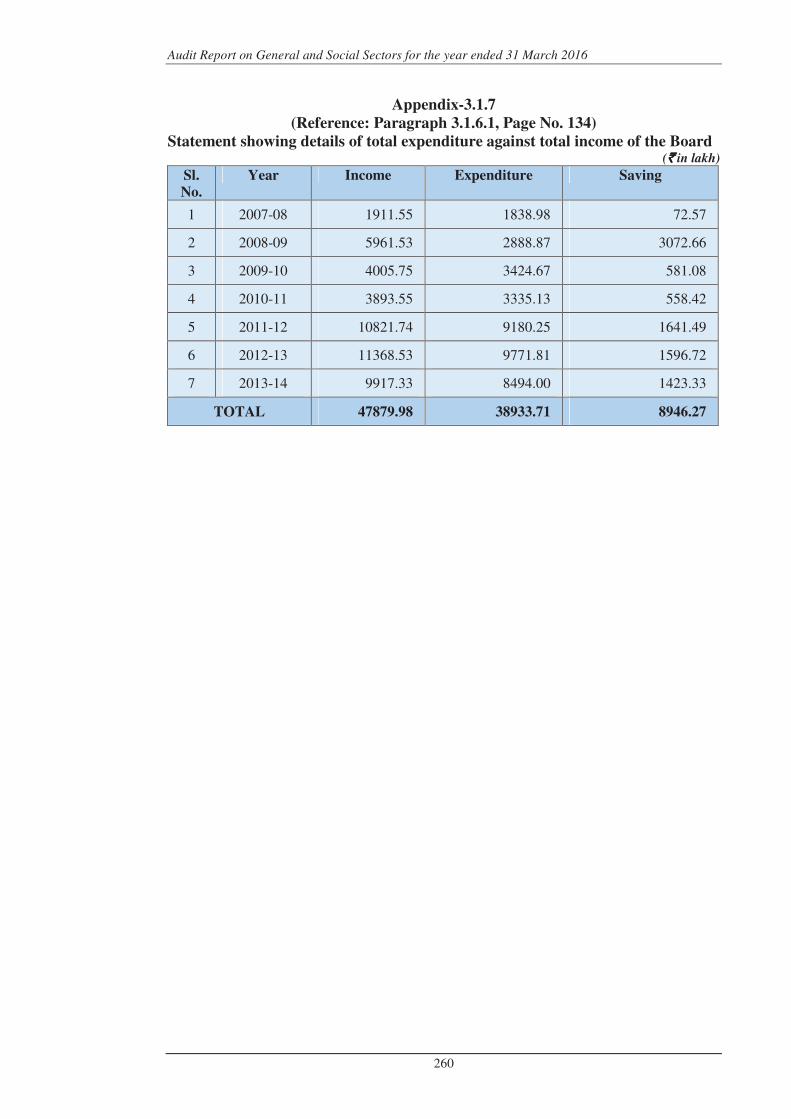
Audit Report on General and Social Sectors for the year ended 31 March 2016
260
Appendix-3.1.7
(Reference: Paragraph 3.1.6.1, Page No. 134)
Statement showing details of total expenditure against total income of the Board
(`̀̀̀ in lakh)
Sl.
No.
Year Income Expenditure Saving
1 2007-08 1911.55 1838.98 72.57
2 2008-09 5961.53 2888.87 3072.66
3 2009-10 4005.75 3424.67 581.08
4 2010-11 3893.55 3335.13 558.42
5 2011-12 10821.74 9180.25 1641.49
6 2012-13 11368.53 9771.81 1596.72
7 2013-14 9917.33 8494.00 1423.33
TOTAL 47879.98 38933.71 8946.27

Appendices
261
Appendix-3.1.8
(Reference: Paragraph 3.1.7.2, Page No. 141)
Statement showing details of action taken by the Board on alleged irregularities
in recruitment examinations
Sl.
No
Name of
examination
and year
Date of
examination
Action taken by the Board
(1) (2) (3) (4)
1 Samvida Shala Shikshak Eligibility Test Group-2, 2011
19.02.2012 As per Board’s order no M.P. Vyapam /5-Pa-1/44/ 2013 Dated 01-01-2014, it was stated that ‘after confirmation of marks of 73 candidates, Vyapam had cancelled the candidature of these 73 candidates.’
2 Samvida Shala Shikshak Eligibility Test Group-3, 2011
22.01.2012 As per Board’s order no M.P. Vyapam/5-Pa-1/40/ 2013 Dated 01-01-2014, it was stated that ‘after confirmation of marks of 84 candidates, Vyapam had cancelled the candidature of these 84 candidates.’
3 Joint Recruitment Test for various posts of MP State Cooperative Dairy Federation, 2012
23.09.2012 As per Board’s order no /5-Pa-1/35/2033/ 2014 Dated 29-03-2014, it was stated that results of 10 candidates had been cancelled on the ground of unfair means cases due to variation in number in data of answer sheet after mapping and results of merit list.
4 Police Recruitment examination, 2012 for the post of Subedar, Sub Inspector cadre and Plantoon Commander.
- As per Board’s order no./Vyapam/5- Pa-1/3250/ 2014 Dated 23-05-2014, it was stated that results of examination of eleven candidates had been cancelled with immediate effect on the ground of unfair means case
5 Police Constable Recruitment Examination, 2012
- As per Board’s order no./ Vyapam/5-Pa-1/3299/ 2014 Dated 26-05-2014, it was stated that results of examination of 34 candidates had been cancelled with immediate effect for Police Constable Recruitment examination, 2012 under para 2.12 of manual of recruitment examination 2012 on the ground of unfair means.
6 Recruitment test for Junior supply officer and Inspector Weight-Measurment 2012
07.10.2012 As per Board’s order no./Vyapam/5-Pa-1/3787/ 2014 Dated 13-06-2014, it was stated that results of examination of 16 candidates had been cancelled with immediate effect under Para 2.11 of Manual of Recruitment Test for Junior Supply Officer and Inspector Weight Measurement 2012 on the ground of unfair means.
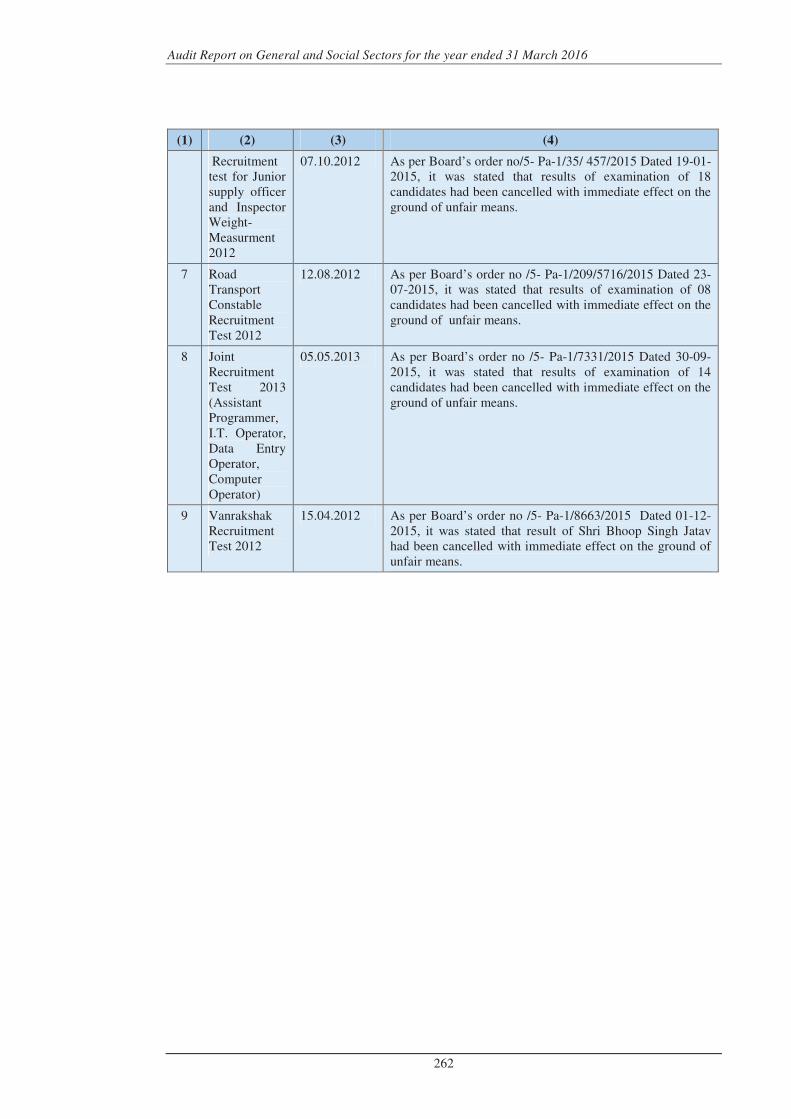
Audit Report on General and Social Sectors for the year ended 31 March 2016
262
(1) (2) (3) (4)
Recruitment test for Junior supply officer and Inspector Weight-Measurment 2012
07.10.2012 As per Board’s order no/5- Pa-1/35/ 457/2015 Dated 19-01-2015, it was stated that results of examination of 18 candidates had been cancelled with immediate effect on the ground of unfair means.
7 Road Transport Constable Recruitment Test 2012
12.08.2012 As per Board’s order no /5- Pa-1/209/5716/2015 Dated 23-07-2015, it was stated that results of examination of 08 candidates had been cancelled with immediate effect on the ground of unfair means.
8 Joint Recruitment Test 2013 (Assistant Programmer, I.T. Operator, Data Entry Operator, Computer Operator)
05.05.2013 As per Board’s order no /5- Pa-1/7331/2015 Dated 30-09-2015, it was stated that results of examination of 14 candidates had been cancelled with immediate effect on the ground of unfair means.
9 Vanrakshak Recruitment Test 2012
15.04.2012 As per Board’s order no /5- Pa-1/8663/2015 Dated 01-12-2015, it was stated that result of Shri Bhoop Singh Jatav had been cancelled with immediate effect on the ground of unfair means.
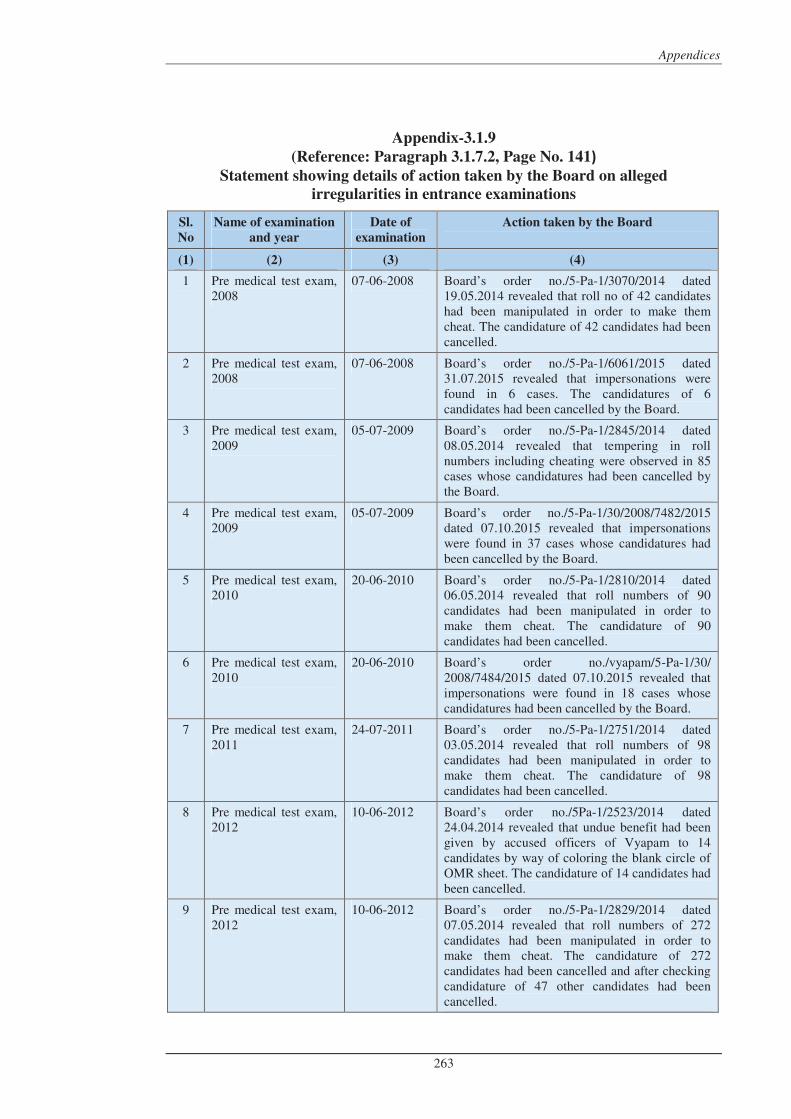
Appendices
263
Appendix-3.1.9
(Reference: Paragraph 3.1.7.2, Page No. 141)
Statement showing details of action taken by the Board on alleged
irregularities in entrance examinations
Sl.
No
Name of examination
and year
Date of
examination
Action taken by the Board
(1) (2) (3) (4)
1 Pre medical test exam, 2008
07-06-2008 Board’s order no./5-Pa-1/3070/2014 dated 19.05.2014 revealed that roll no of 42 candidates had been manipulated in order to make them cheat. The candidature of 42 candidates had been cancelled.
2 Pre medical test exam, 2008
07-06-2008 Board’s order no./5-Pa-1/6061/2015 dated 31.07.2015 revealed that impersonations were found in 6 cases. The candidatures of 6 candidates had been cancelled by the Board.
3 Pre medical test exam, 2009
05-07-2009 Board’s order no./5-Pa-1/2845/2014 dated 08.05.2014 revealed that tempering in roll numbers including cheating were observed in 85 cases whose candidatures had been cancelled by the Board.
4 Pre medical test exam, 2009
05-07-2009 Board’s order no./5-Pa-1/30/2008/7482/2015 dated 07.10.2015 revealed that impersonations were found in 37 cases whose candidatures had been cancelled by the Board.
5 Pre medical test exam, 2010
20-06-2010 Board’s order no./5-Pa-1/2810/2014 dated 06.05.2014 revealed that roll numbers of 90 candidates had been manipulated in order to make them cheat. The candidature of 90 candidates had been cancelled.
6 Pre medical test exam, 2010
20-06-2010 Board’s order no./vyapam/5-Pa-1/30/ 2008/7484/2015 dated 07.10.2015 revealed that impersonations were found in 18 cases whose candidatures had been cancelled by the Board.
7 Pre medical test exam, 2011
24-07-2011 Board’s order no./5-Pa-1/2751/2014 dated 03.05.2014 revealed that roll numbers of 98 candidates had been manipulated in order to make them cheat. The candidature of 98 candidates had been cancelled.
8 Pre medical test exam, 2012
10-06-2012 Board’s order no./5Pa-1/2523/2014 dated 24.04.2014 revealed that undue benefit had been given by accused officers of Vyapam to 14 candidates by way of coloring the blank circle of OMR sheet. The candidature of 14 candidates had been cancelled.
9 Pre medical test exam, 2012
10-06-2012 Board’s order no./5-Pa-1/2829/2014 dated 07.05.2014 revealed that roll numbers of 272 candidates had been manipulated in order to make them cheat. The candidature of 272 candidates had been cancelled and after checking candidature of 47 other candidates had been cancelled.
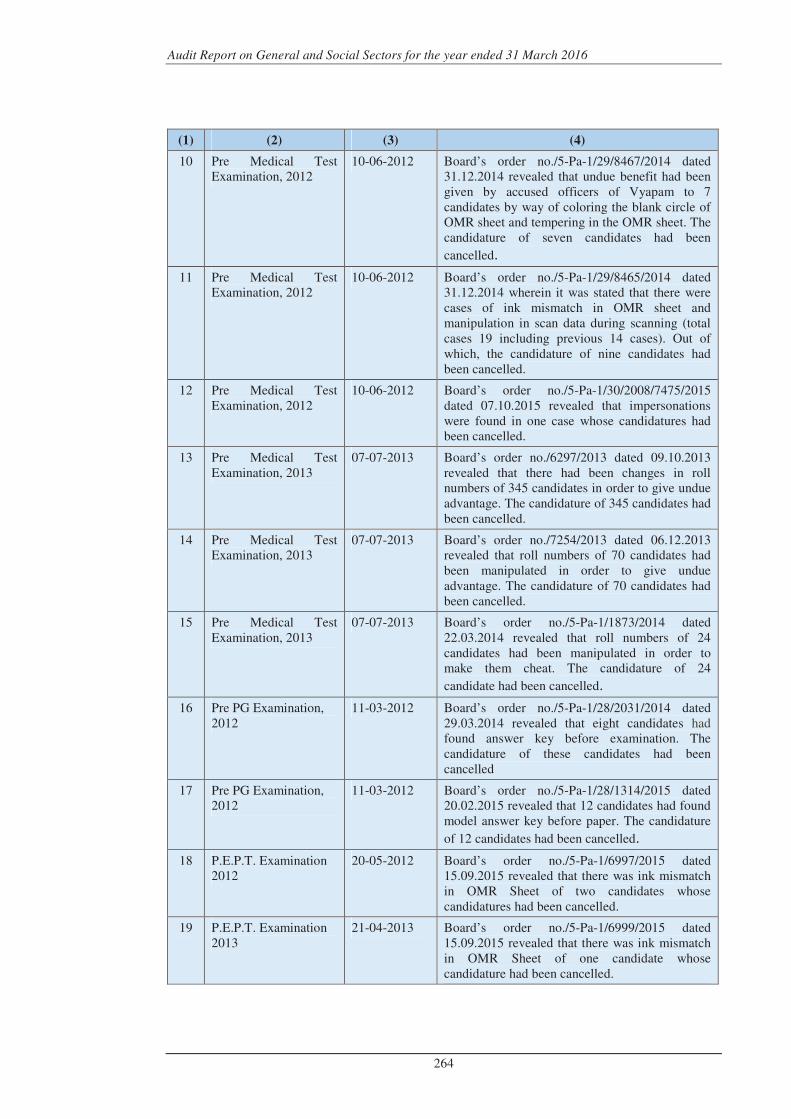
Audit Report on General and Social Sectors for the year ended 31 March 2016
264
(1) (2) (3) (4)
10 Pre Medical Test Examination, 2012
10-06-2012 Board’s order no./5-Pa-1/29/8467/2014 dated 31.12.2014 revealed that undue benefit had been given by accused officers of Vyapam to 7 candidates by way of coloring the blank circle of OMR sheet and tempering in the OMR sheet. The candidature of seven candidates had been
cancelled.
11 Pre Medical Test Examination, 2012
10-06-2012 Board’s order no./5-Pa-1/29/8465/2014 dated 31.12.2014 wherein it was stated that there were cases of ink mismatch in OMR sheet and manipulation in scan data during scanning (total cases 19 including previous 14 cases). Out of which, the candidature of nine candidates had been cancelled.
12 Pre Medical Test Examination, 2012
10-06-2012 Board’s order no./5-Pa-1/30/2008/7475/2015 dated 07.10.2015 revealed that impersonations were found in one case whose candidatures had been cancelled.
13 Pre Medical Test Examination, 2013
07-07-2013 Board’s order no./6297/2013 dated 09.10.2013 revealed that there had been changes in roll numbers of 345 candidates in order to give undue advantage. The candidature of 345 candidates had been cancelled.
14 Pre Medical Test Examination, 2013
07-07-2013 Board’s order no./7254/2013 dated 06.12.2013 revealed that roll numbers of 70 candidates had been manipulated in order to give undue advantage. The candidature of 70 candidates had been cancelled.
15 Pre Medical Test Examination, 2013
07-07-2013 Board’s order no./5-Pa-1/1873/2014 dated 22.03.2014 revealed that roll numbers of 24 candidates had been manipulated in order to make them cheat. The candidature of 24
candidate had been cancelled.
16 Pre PG Examination, 2012
11-03-2012 Board’s order no./5-Pa-1/28/2031/2014 dated 29.03.2014 revealed that eight candidates had found answer key before examination. The candidature of these candidates had been cancelled
17 Pre PG Examination, 2012
11-03-2012 Board’s order no./5-Pa-1/28/1314/2015 dated 20.02.2015 revealed that 12 candidates had found model answer key before paper. The candidature
of 12 candidates had been cancelled.
18 P.E.P.T. Examination 2012
20-05-2012 Board’s order no./5-Pa-1/6997/2015 dated 15.09.2015 revealed that there was ink mismatch in OMR Sheet of two candidates whose candidatures had been cancelled.
19 P.E.P.T. Examination 2013
21-04-2013 Board’s order no./5-Pa-1/6999/2015 dated 15.09.2015 revealed that there was ink mismatch in OMR Sheet of one candidate whose candidature had been cancelled.
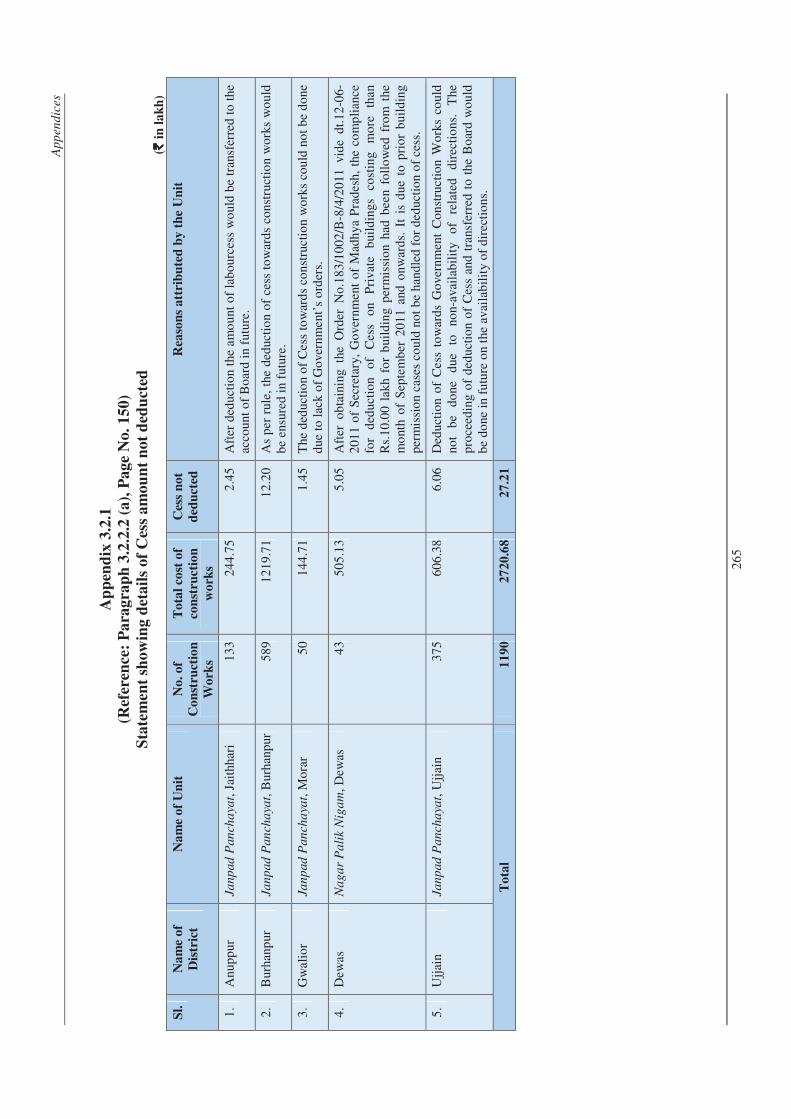
Ap
pen
dic
es
26
5
Ap
pen
dix
3.2
.1
(Ref
eren
ce:
Pa
rag
rap
h 3
.2.2
.2 (
a),
Pa
ge
No
. 1
50
)
Sta
tem
ent
sho
win
g d
eta
ils
of
Ces
s a
mo
un
t n
ot
ded
uct
ed
(` ` ` ` i
n l
ak
h)
Sl.
N
am
e o
f
Dis
tric
t
Na
me
of
Un
it
No
. o
f
Co
nst
ruct
ion
Wo
rks
To
tal
cost
of
con
stru
ctio
n
wo
rks
Ces
s n
ot
ded
uct
ed
Rea
son
s a
ttri
bu
ted
by
th
e U
nit
1.
An
upp
ur
Ja
np
ad
Pan
ch
aya
t, J
aith
hari
1
33
24
4.7
5 2
.45
Aft
er d
educ
tio
n th
e am
ou
nt o
f la
bo
urce
ss w
oul
d b
e tr
ansf
erre
d t
o t
he
acco
unt
of
Bo
ard
in
futu
re.
2.
Bur
hanp
ur
Ja
np
ad
Pan
ch
aya
t, B
urha
npur
5
89
12
19
.71
12
.20
As
per
rul
e, t
he d
educ
tio
n o
f ce
ss t
ow
ard
s co
nstr
ucti
on
wo
rks
wo
uld
b
e en
sure
d i
n fu
ture
.
3.
Gw
alio
r Ja
np
ad
Pan
ch
aya
t, M
ora
r 5
0 1
44
.71
1.4
5 T
he d
educ
tio
n o
f C
ess
tow
ard
s co
nst
ruct
ion
wo
rks
cou
ld n
ot
be
do
ne
due
to
lac
k o
f G
ove
rnm
ent’
s o
rder
s.
4.
Dew
as
Na
ga
r P
ali
k N
iga
m,
Dew
as
43
50
5.1
3 5
.05
Aft
er o
bta
inin
g th
e O
rder
No
.18
3/1
002
/B-8
/4/2
011
vid
e d
t.1
2-0
6-
20
11
of
Sec
reta
ry,
Go
vern
men
t o
f M
adh
ya P
rad
esh,
the
co
mp
lian
ce
for
ded
ucti
on
o
f C
ess
on
Pri
vate
b
uild
ing
s co
stin
g
mo
re
than
R
s.1
0.0
0 l
akh
fo
r b
uild
ing
per
mis
sio
n h
ad b
een
foll
ow
ed f
rom
the
m
ont
h o
f S
epte
mb
er 2
01
1 a
nd o
nw
ard
s. I
t is
due
to
pri
or
bui
ldin
g
per
mis
sio
n ca
ses
coul
d n
ot
be
hand
led
fo
r d
educ
tio
n o
f ce
ss.
5.
Ujj
ain
Ja
np
ad
Pan
ch
aya
t, U
jjai
n 3
75
60
6.3
8 6
.06
Ded
ucti
on
of
Ces
s to
war
ds
Go
vern
men
t C
on
stru
ctio
n W
ork
s co
uld
no
t b
e d
one
d
ue
to
non-
avai
lab
ilit
y o
f re
late
d
dir
ecti
ons
. T
he
pro
ceed
ing
of
ded
ucti
on
of
Ces
s an
d t
rans
ferr
ed t
o t
he B
oar
d w
ou
ld
be
do
ne i
n fu
ture
on
the
avai
lab
ilit
y o
f d
irec
tio
ns.
To
tal
11
90
27
20
.68
27
.21
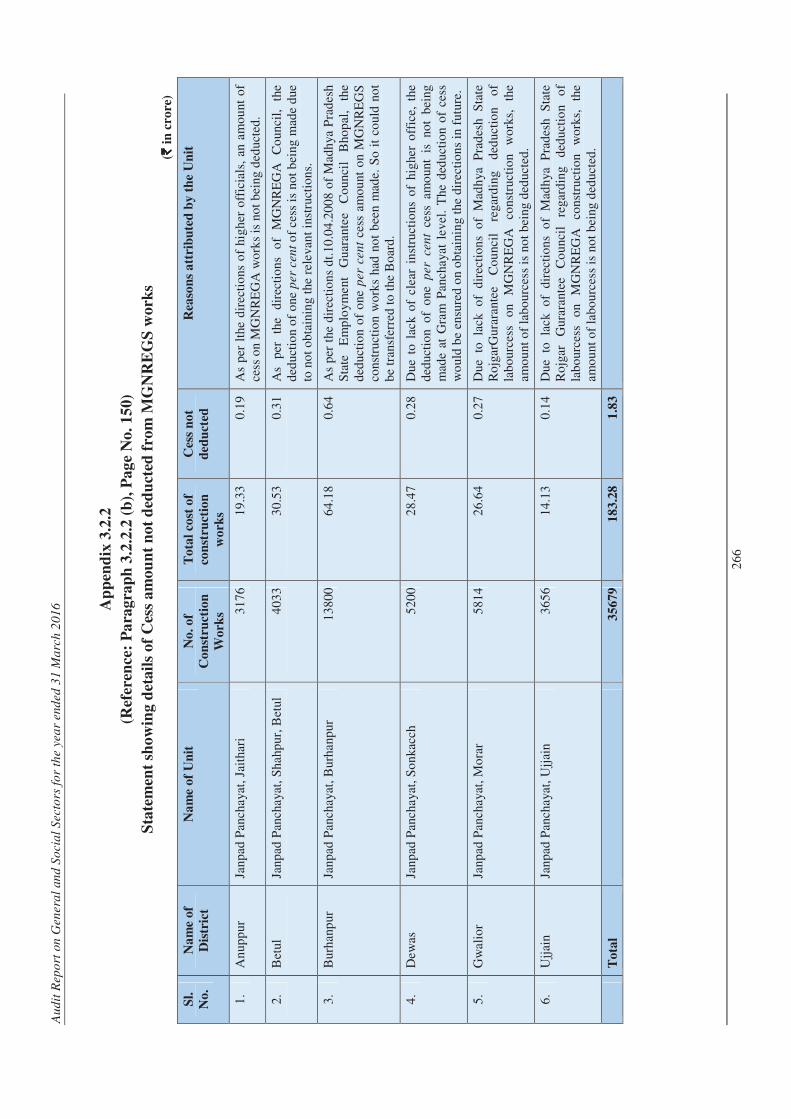
Au
dit
Rep
ort
on
Gen
era
l an
d S
ocia
l S
ecto
rs f
or
the y
ea
r end
ed
31 M
arc
h 2
01
6
26
6
Ap
pen
dix
3.2
.2
(Ref
eren
ce:
Pa
rag
rap
h 3
.2.2
.2 (
b),
Pa
ge
No
. 1
50
)
Sta
tem
ent
sho
win
g d
eta
ils
of
Ces
s a
mo
un
t n
ot
ded
uct
ed f
rom
MG
NR
EG
S w
ork
s
(` ` ` ` i
n c
rore
)
Sl.
No
.
Na
me
of
Dis
tric
t
Na
me
of
Un
it
No
. o
f
Co
nst
ruct
ion
Wo
rks
To
tal
cost
of
con
stru
ctio
n
wo
rks
Ces
s n
ot
ded
uct
ed
Rea
son
s a
ttri
bu
ted
by
th
e U
nit
1.
An
upp
ur
Janp
ad P
anch
ayat
, Ja
itha
ri
31
76
19
.33
0.1
9 A
s p
er l
the
dir
ecti
ons
of
hig
her
off
icia
ls,
an a
mo
unt
of
cess
on
MG
NR
EG
A w
ork
s is
no
t b
eing
ded
ucte
d.
2.
Bet
ul
Janp
ad P
anch
ayat
, S
hahp
ur,
Bet
ul
40
33
30
.53
0.3
1 A
s p
er
the
dir
ecti
on
s o
f M
GN
RE
GA
C
oun
cil,
th
e d
educ
tio
n o
f o
ne p
er
cen
t o
f ce
ss i
s no
t b
eing
mad
e d
ue
to n
ot
ob
tain
ing
the
rele
van
t in
stru
ctio
ns.
3.
Bur
hanp
ur
Janp
ad P
anch
ayat
, B
urha
npur
1
38
00
64
.18
0.6
4 A
s p
er t
he d
irec
tio
ns
dt.
10
.04
.20
08
of
Mad
hya
Pra
des
h
Sta
te
Em
plo
ymen
t G
uara
ntee
C
oun
cil
Bho
pal
, th
e d
educ
tio
n o
f o
ne p
er
cen
t ce
ss a
mo
unt
on
MG
NR
EG
S
cons
truc
tio
n w
ork
s ha
d n
ot
bee
n m
ade.
So
it
coul
d n
ot
be
tran
sfer
red
to
the
Bo
ard
.
4.
Dew
as
Janp
ad P
anch
ayat
, S
on
kacc
h
52
00
28
.47
0.2
8 D
ue t
o l
ack
of
clea
r in
stru
ctio
ns o
f hi
ghe
r o
ffic
e, t
he
ded
ucti
on
of
one
per
cen
t ce
ss a
mo
unt
is n
ot
bei
ng
mad
e at
Gra
m P
anch
ayat
lev
el.
The
ded
ucti
on
of
cess
w
oul
d b
e en
sure
d o
n o
bta
inin
g th
e d
irec
tio
ns
in f
utur
e.
5.
Gw
alio
r Ja
npad
Pan
chay
at,
Mo
rar
58
14
26
.64
0.2
7 D
ue
to
lack
o
f d
irec
tio
ns
of
Mad
hya
P
rad
esh
S
tate
R
ojg
arG
urar
ante
e C
ou
ncil
re
gard
ing
d
educ
tio
n
of
lab
our
cess
o
n M
GN
RE
GA
co
nstr
ucti
on
wo
rks,
th
e am
ou
nt o
f la
bo
urce
ss i
s no
t b
eing
ded
ucte
d.
6.
Ujj
ain
Janp
ad P
anch
ayat
, U
jjai
n 3
65
6 1
4.1
3 0
.14
Due
to
la
ck
of
dir
ecti
on
s o
f M
adh
ya
Pra
des
h
Sta
te
Ro
jgar
G
urar
ante
e C
oun
cil
rega
rdin
g d
educ
tio
n o
f la
bo
urce
ss
on
MG
NR
EG
A
cons
truc
tio
n w
ork
s,
the
amo
unt
of
lab
our
cess
is
not
bei
ng d
educ
ted
.
T
ota
l
35
679
18
3.2
8
1.8
3
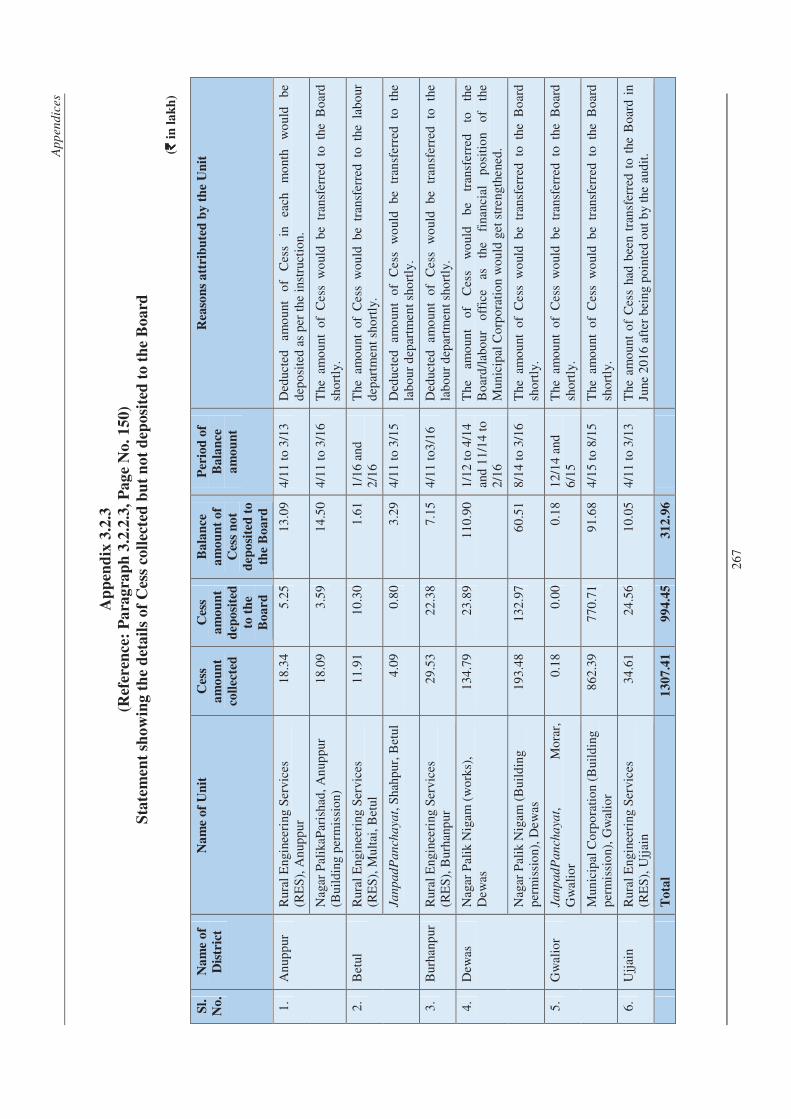
Ap
pen
dic
es
26
7
Ap
pen
dix
3.2
.3
(Ref
eren
ce:
Pa
rag
rap
h 3
.2.2
.3,
Pa
ge
No
. 1
50
)
Sta
tem
ent
sho
win
g t
he
det
ail
s o
f C
ess
coll
ecte
d b
ut
no
t d
epo
site
d t
o t
he
Bo
ard
(` ` ` ` i
n l
ak
h)
Sl.
No
.
Na
me
of
Dis
tric
t
Na
me
of
Un
it
Ces
s
am
ou
nt
coll
ecte
d
Ces
s
am
ou
nt
dep
osi
ted
to t
he
Bo
ard
Ba
lan
ce
am
ou
nt
of
Ces
s n
ot
dep
osi
ted
to
the
Bo
ard
Per
iod
of
Ba
lan
ce
am
ou
nt
Rea
son
s a
ttri
bu
ted
by
th
e U
nit
1.
An
upp
ur
Rur
al E
ngin
eeri
ng S
ervi
ces
(RE
S),
An
upp
ur
18
.34
5.2
5 1
3.0
9 4
/11
to
3/1
3 D
educ
ted
am
ou
nt
of
Ces
s in
ea
ch
mo
nth
wo
uld
b
e d
epo
site
d a
s p
er t
he i
nstr
ucti
on.
Nag
ar P
alik
aPar
isha
d,
An
upp
ur
(Bui
ldin
g p
erm
issi
on)
1
8.0
9 3
.59
14
.50
4/1
1 t
o 3
/16
The
am
ou
nt o
f C
ess
wo
uld
be
tran
sfer
red
to
the
Bo
ard
sho
rtly
.
2.
Bet
ul
Rur
al E
ngin
eeri
ng S
ervi
ces
(RE
S),
Mul
tai,
Bet
ul
11
.91
10
.30
1.6
1 1
/16
and
2
/16
The
am
ou
nt o
f C
ess
wo
uld
be
tran
sfer
red
to
the
lab
our
d
epar
tmen
t sh
ort
ly.
Ja
np
ad
Pa
nch
aya
t, S
hahp
ur,
Bet
ul
4.0
9 0
.80
3.2
9 4
/11
to
3/1
5
D
educ
ted
am
oun
t o
f C
ess
wo
uld
b
e tr
ansf
erre
d
to
the
lab
our
dep
artm
ent
sho
rtly
.
3.
Bur
hanp
ur
Rur
al E
ngin
eeri
ng S
ervi
ces
(RE
S),
Bur
hanp
ur
29
.53
22
.38
7.1
5 4
/11
to3
/16
Ded
ucte
d
amo
unt
of
Ces
s w
oul
d
be
tran
sfer
red
to
th
e la
bo
ur d
epar
tmen
t sh
ort
ly.
4.
Dew
as
Nag
ar P
alik
Nig
am (
wo
rks)
, D
ewas
1
34
.79
23
.89
11
0.9
0 1
/12
to
4/1
4
and
11
/14
to
2/1
6
The
am
oun
t o
f C
ess
wo
uld
b
e tr
ansf
erre
d
to
the
Bo
ard
/lab
our
o
ffic
e as
th
e fi
nanc
ial
po
siti
on
of
the
Mun
icip
al C
orp
ora
tio
n w
ou
ld g
et s
tren
gthe
ned
.
Nag
ar P
alik
Nig
am (
Bui
ldin
g p
erm
issi
on)
, D
ewas
1
93
.48
13
2.9
7 6
0.5
1 8
/14
to
3/1
6 T
he a
mo
unt
of
Ces
s w
oul
d b
e tr
ansf
erre
d t
o t
he B
oar
d sh
ort
ly.
5.
Gw
alio
r Ja
np
ad
Pa
nch
aya
t,
Mo
rar,
G
wal
ior
0.1
8 0
.00
0.1
8 1
2/1
4 a
nd
6/1
5 T
he a
mo
unt
of
Ces
s w
oul
d b
e tr
ansf
erre
d t
o t
he B
oar
d sh
ort
ly.
Mun
icip
al C
orp
ora
tio
n (B
uild
ing
per
mis
sio
n),
Gw
alio
r 8
62
.39
77
0.7
1 9
1.6
8 4
/15
to
8/1
5 T
he a
mo
unt
of
Ces
s w
oul
d b
e tr
ansf
erre
d t
o t
he B
oar
d sh
ort
ly.
6.
Ujj
ain
Rur
al E
ngin
eeri
ng S
ervi
ces
(RE
S),
Ujj
ain
3
4.6
1 2
4.5
6 1
0.0
5 4
/11
to
3/1
3 T
he a
mo
unt
of
Ces
s ha
d b
een
tran
sfer
red
to
the
Bo
ard
in
June
20
16
aft
er b
eing
po
inte
d o
ut b
y th
e au
dit
.
To
tal
13
07
.41
99
4.4
5
31
2.9
6
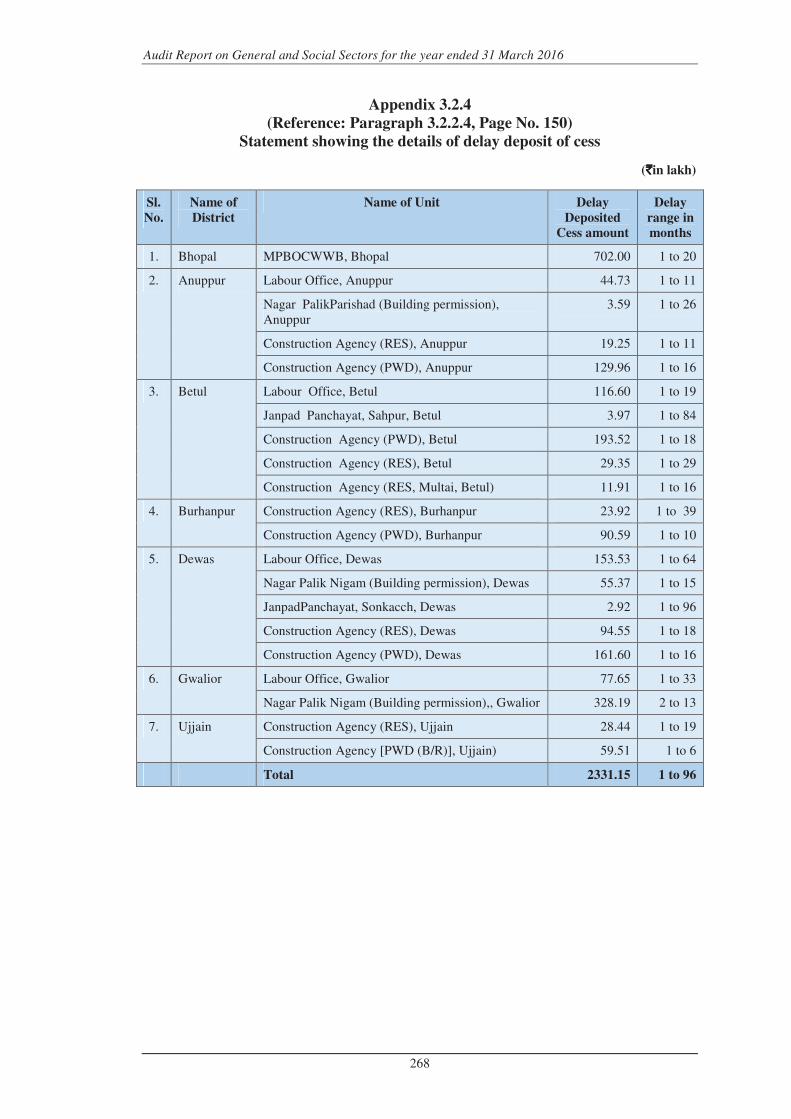
Audit Report on General and Social Sectors for the year ended 31 March 2016
268
Appendix 3.2.4
(Reference: Paragraph 3.2.2.4, Page No. 150)
Statement showing the details of delay deposit of cess
(`̀̀̀in lakh)
Sl.
No.
Name of
District
Name of Unit Delay
Deposited
Cess amount
Delay
range in
months
1. Bhopal MPBOCWWB, Bhopal 702.00 1 to 20
2. Anuppur Labour Office, Anuppur 44.73 1 to 11
Nagar PalikParishad (Building permission), Anuppur
3.59 1 to 26
Construction Agency (RES), Anuppur 19.25 1 to 11
Construction Agency (PWD), Anuppur 129.96 1 to 16
3. Betul Labour Office, Betul 116.60 1 to 19
Janpad Panchayat, Sahpur, Betul 3.97 1 to 84
Construction Agency (PWD), Betul 193.52 1 to 18
Construction Agency (RES), Betul 29.35 1 to 29
Construction Agency (RES, Multai, Betul) 11.91 1 to 16
4. Burhanpur Construction Agency (RES), Burhanpur 23.92 1 to 39
Construction Agency (PWD), Burhanpur 90.59 1 to 10
5. Dewas Labour Office, Dewas 153.53 1 to 64
Nagar Palik Nigam (Building permission), Dewas 55.37 1 to 15
JanpadPanchayat, Sonkacch, Dewas 2.92 1 to 96
Construction Agency (RES), Dewas 94.55 1 to 18
Construction Agency (PWD), Dewas 161.60 1 to 16
6. Gwalior Labour Office, Gwalior 77.65 1 to 33
Nagar Palik Nigam (Building permission),, Gwalior 328.19 2 to 13
7. Ujjain Construction Agency (RES), Ujjain 28.44 1 to 19
Construction Agency [PWD (B/R)], Ujjain) 59.51 1 to 6
Total 2331.15 1 to 96
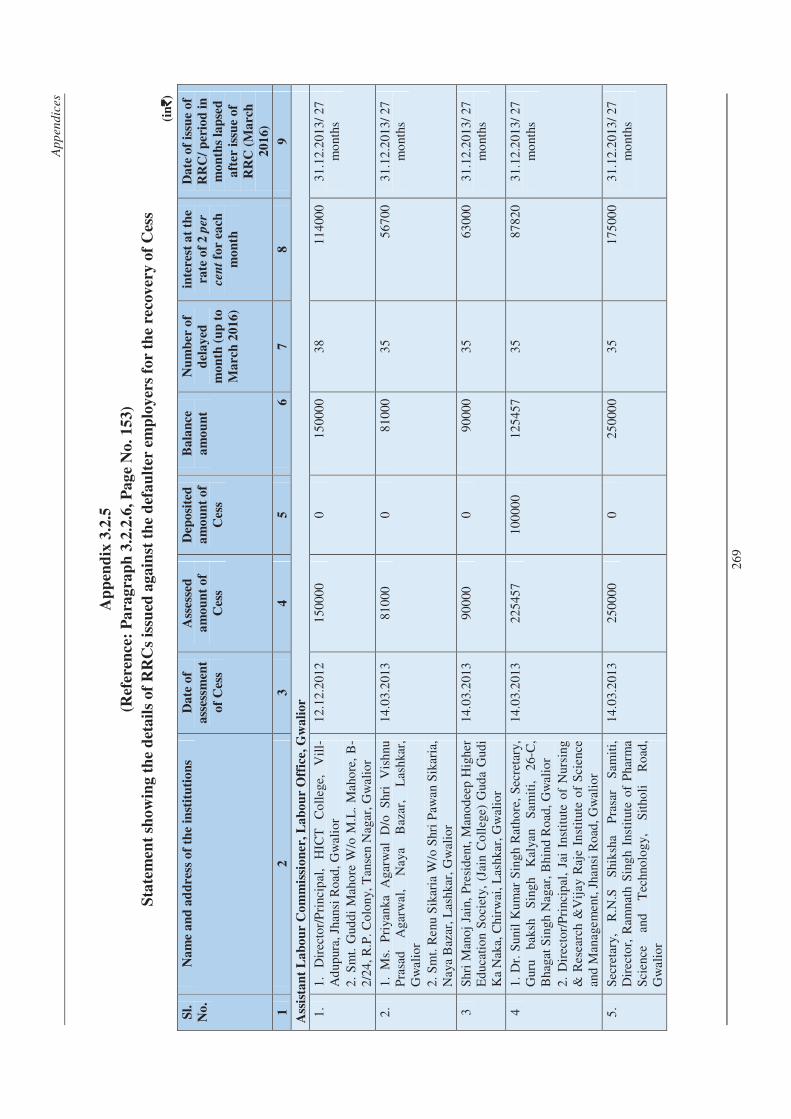
Ap
pen
dic
es
26
9
Ap
pen
dix
3.2
.5
(Ref
eren
ce:
Pa
rag
rap
h 3
.2.2
.6,
Pa
ge
No
. 1
53
)
Sta
tem
ent
sho
win
g t
he
det
ail
s o
f R
RC
s is
sued
ag
ain
st t
he
def
au
lter
em
plo
yer
s fo
r th
e re
cov
ery
of
Ces
s
(in`̀̀̀)
Sl.
No
.
Na
me
an
d a
dd
ress
of
the
inst
itu
tio
ns
Da
te o
f
ass
essm
ent
of
Ces
s
Ass
esse
d
am
ou
nt
of
Ces
s
Dep
osi
ted
am
ou
nt
of
Ces
s
Ba
lan
ce
am
ou
nt
Nu
mb
er o
f
del
ay
ed
mo
nth
(u
p t
o
Ma
rch
20
16
)
inte
rest
at
the
rate
of
2 p
er
cen
t fo
r ea
ch
mo
nth
Da
te o
f is
sue
of
RR
C/
per
iod
in
mo
nth
s la
pse
d
aft
er i
ssu
e o
f
RR
C (
Ma
rch
20
16)
1
2
3
4
5
6
7
8
9
Ass
ista
nt
La
bo
ur
Co
mm
issi
on
er,
La
bo
ur
Off
ice,
Gw
ali
or
1.
1.
Dir
ecto
r/P
rinc
ipal
, H
ICT
C
oll
ege,
V
ill-
Ad
upur
a, J
hans
i R
oad
, G
wal
ior
2
. S
mt.
Gud
di
Mah
ore
W/o
M.L
. M
aho
re,
B-
2/2
4,
R.P
. C
olo
ny,
Tan
sen
Nag
ar,
Gw
alio
r
12
.12.
201
2 1
50
000
0
15
000
0 3
8 1
14
000
31
.12.
201
3/
27
mo
nths
2.
1.
Ms.
P
riya
nka
A
garw
al
D/o
S
hri
Vis
hnu
P
rasa
d
Aga
rwal
, N
aya
Baz
ar,
Las
hka
r,
Gw
alio
r
2.
Sm
t. R
enu
Sik
aria
W/o
Shr
i P
awan
Sik
aria
, N
aya
Baz
ar,
Las
hkar
, G
wal
ior
14
.03.
201
3 8
10
00
0
81
000
3
5 5
67
00
31
.12.
201
3/
27
mo
nths
3
Shr
i M
ano
j Ja
in,
Pre
sid
ent,
Man
od
eep
Hig
her
Ed
ucat
ion
So
ciet
y, (
Jain
Co
lleg
e) G
uda
Gud
i K
a N
aka,
Chi
rwai
, L
ashk
ar,
Gw
alio
r
14
.03.
201
3 9
00
00
0
90
000
3
5 6
30
00
31
.12.
201
3/
27
mo
nths
4
1.
Dr.
Sun
il K
um
ar S
ing
h R
atho
re,
Sec
reta
ry,
Gur
u
bak
sh
Sin
gh
Kal
yan
S
amit
i,
26
-C,
Bha
gat
Sin
gh N
agar
, B
hind
Ro
ad,
Gw
alio
r
2.
Dir
ecto
r/P
rinc
ipal
, Ja
i In
stit
ute
of
Nur
sin
g
& R
esea
rch
&V
ijay
Raj
e In
stit
ute
of
Sci
ence
an
d M
anag
emen
t, J
hans
i R
oad
, G
wal
ior
14
.03.
201
3 2
25
457
10
000
0 1
25
457
35
87
820
3
1.1
2.2
013
/ 27
m
ont
hs
5.
Sec
reta
ry,
R.N
.S
Shi
ksh
a P
rasa
r S
amit
i,
Dir
ecto
r, R
amna
th S
ing
h In
stit
ute
of
Pha
rma
Sci
ence
an
d
Tec
hno
log
y,
Sit
holi
R
oad
, G
wal
ior
14
.03.
201
3 2
50
000
0
25
000
0 3
5 1
75
000
31
.12.
201
3/
27
mo
nths
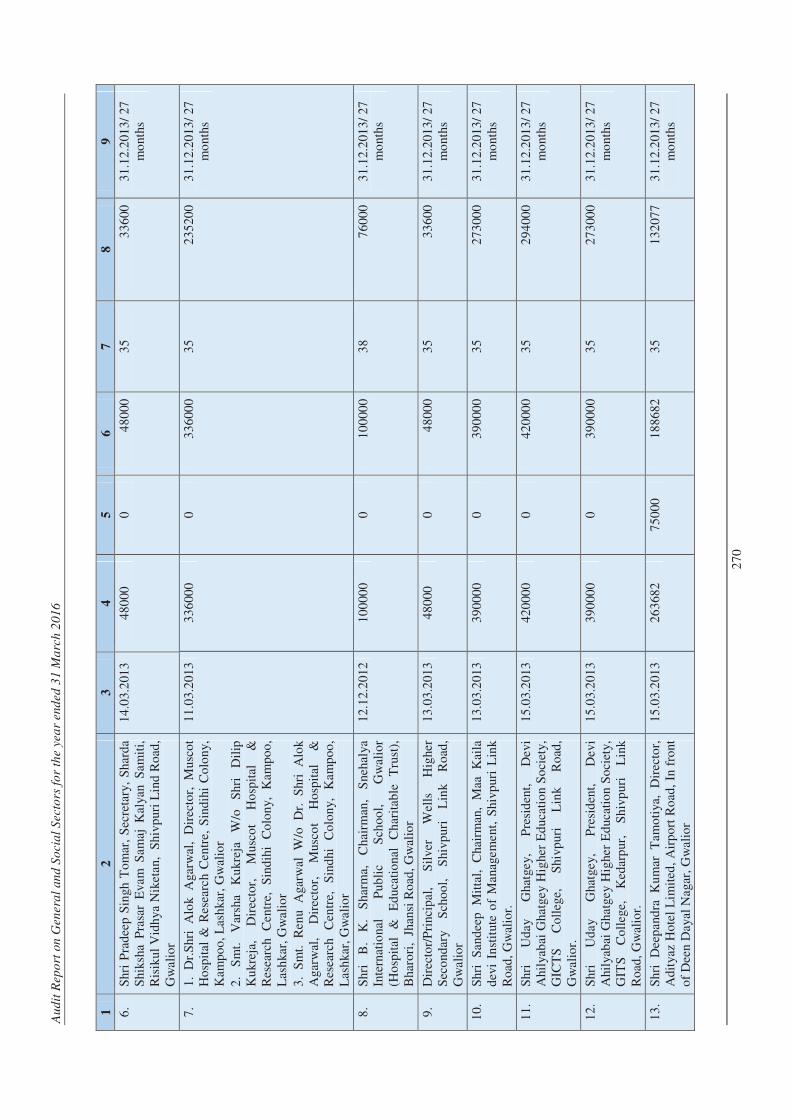
Au
dit
Rep
ort
on
Gen
era
l an
d S
ocia
l S
ecto
rs f
or
the y
ea
r end
ed
31 M
arc
h 2
01
6
27
0
1
2
3
4
5
6
7
8
9
6.
Shr
i P
rad
eep
Sin
gh T
om
ar,
Sec
reta
ry,
Sha
rda
Shi
ksha
Pra
sar
Eva
m S
amaj
Kal
yan
Sam
iti,
R
isik
ul V
idh
ya N
iket
an,
Shi
vp
uri
Lin
d R
oad
, G
wal
ior
14
.03.
201
3 4
80
00
0
48
000
3
5 3
36
00
31
.12.
201
3/
27
mo
nths
7.
1.
Dr.
Shr
i A
lok
Aga
rwal
, D
irec
tor,
M
usco
t H
osp
ital
& R
esea
rch
Cen
tre,
Sin
dih
i C
olo
ny,
K
amp
oo
, L
ashk
ar,
Gw
alio
r
2.
Sm
t.
Var
sha
Ku
krej
a W
/o
Shr
i D
ilip
K
ukr
eja,
D
irec
tor,
M
usco
t H
osp
ital
&
R
esea
rch
Cen
tre,
S
ind
ihi
Co
lon
y,
Kam
po
o,
Las
hka
r, G
wal
ior
3
. S
mt.
R
enu
Aga
rwal
W
/o
Dr.
S
hri
Alo
k
Aga
rwal
, D
irec
tor,
M
usco
t H
osp
ital
&
R
esea
rch
Cen
tre,
S
ind
hi
Co
lon
y,
Kam
po
o,
Las
hka
r, G
wal
ior
11
.03.
201
3 3
36
000
0
33
600
0 3
5 2
35
200
31
.12.
201
3/
27
mo
nths
8.
Shr
i B
. K
. S
harm
a,
Cha
irm
an,
Sne
haly
a In
tern
atio
nal
Pub
lic
Sch
oo
l,
Gw
alio
r (H
osp
ital
&
E
duc
atio
nal
Ch
arit
able
T
rust
),
Bha
rori
, J
hans
i R
oad
, G
wal
ior
12
.12.
201
2 1
00
000
0
10
000
0 3
8 7
60
00
31
.12.
201
3/
27
mo
nths
9.
Dir
ecto
r/P
rinc
ipal
, S
ilve
r W
ells
H
ighe
r S
eco
ndar
y S
cho
ol,
S
hivp
uri
Lin
k R
oad
, G
wal
ior
13
.03.
201
3 4
80
00
0
48
000
3
5 3
36
00
31
.12.
201
3/
27
mo
nths
10
. S
hri
San
dee
p
Mit
tal,
C
hair
man
, M
aa
Kai
la
dev
i In
stit
ute
of
Man
agem
ent,
Shi
vpur
i L
ink
R
oad
, G
wal
ior.
13
.03.
201
3 3
90
000
0
39
000
0 3
5 2
73
000
31
.12.
201
3/
27
mo
nths
11
. S
hri
Ud
ay
Gha
tgey
, P
resi
den
t,
Dev
i A
hily
abai
Gha
tgey
Hig
her
Ed
ucat
ion
So
ciet
y,
GIC
TS
C
oll
ege,
S
hivp
uri
Lin
k R
oad
, G
wal
ior.
15
.03.
201
3 4
20
000
0
42
000
0 3
5 2
94
000
31
.12.
201
3/
27
mo
nths
12
. S
hri
Ud
ay
Gha
tgey
, P
resi
den
t,
Dev
i A
hily
abai
Gha
tgey
Hig
her
Ed
ucat
ion
So
ciet
y,
GIT
S
Co
lleg
e,
Ked
arp
ur,
Sh
ivp
uri
Lin
k
Ro
ad,
Gw
alio
r.
15
.03.
201
3 3
90
000
0
39
000
0 3
5 2
73
000
31
.12.
201
3/
27
mo
nths
13
. S
hri
Dee
pan
dra
K
um
ar
Tam
oti
ya,
Dir
ecto
r,
Ad
itya
z H
ote
l L
imit
ed,
Air
po
rt R
oad
, In
fro
nt
of
Dee
n D
ayal
Nag
ar,
Gw
alio
r
15
.03.
201
3 2
63
682
75
000
1
88
682
35
13
207
7 3
1.1
2.2
013
/ 27
m
ont
hs

Ap
pen
dic
es
27
1
1
2
3
4
5
6
7
8
9
14
. 1
. P
resi
den
t,
Lat
e C
.L.
Ch
ow
ksay
, S
hri
Nat
hu
Sin
gh
Yad
av,
Sm
riti
Shi
ksh
a E
vam
S
amaj
K
alya
n S
amit
i,
Vil
lage
- R
ai,
Chi
tto
ra R
oad
, M
ora
r, G
wal
ior.
2
. D
irec
tor,
L
NA
T
(Gro
up
of
Co
lleg
e),
Vil
lage
- R
ai,
Ch
itto
ra
Ro
ad,
Mo
rar,
G
wal
ior
30
.09.
201
3 5
07
045
0
50
704
5 2
9 2
94
086
11
.06.
201
5/
9
mo
nths
15
. D
irec
tor,
Ja
i L
axm
i N
aray
an
Shi
ksha
E
vam
S
amaj
K
alya
n S
amit
i,
(Lax
mi
nara
yan
Inst
itut
e o
f T
echn
olo
gy)
, V
ill
- R
atw
ai,
Chi
tto
ra R
oad
, M
ora
r, G
wal
ior
30
.09.
201
3 3
28
201
0
32
820
1 2
9 1
90
357
11
.06.
201
5/
9
mo
nths
16
. 1
. M
/s
Ud
ay
Pra
tap
S
har
ma,
A
-46
, G
ovi
ndp
uri,
Gw
alio
r
2.
Exe
cuti
ve
En
gine
er,
Dam
S
afet
y D
ivis
ion,
Gw
alio
r
21
.03.
201
3 3
85
469
0 3
54
386
6 3
10
824
35
21
757
7 1
1.0
6.2
015
/ 9
m
ont
hs
17
. D
irec
tor/
Pri
ncip
al,
Vik
rant
G
roup
o
f In
stit
ute,
(V
ikra
nt E
duc
atio
nal
and
So
cial
W
elfa
re S
oci
ety)
, B
adag
aon
Ro
ad,
Rat
wai
, M
ora
r, G
wal
ior
28
.03.
201
4 4
16
430
50
000
3
66
430
23
16
855
8 1
1.0
6.2
015
/ 9
m
ont
hs
18
. D
irec
tor,
Jai
Shi
v F
oo
d P
rod
ucts
Pri
vate
L
imit
ed,
Kas
hip
ur
Ke
Pas
s,
Vil
l-S
alb
ai,
Bhi
tarw
ar R
oad
, D
abra
, G
wal
ior
23
.11.
201
3 4
98
753
28
389
0 2
14
863
27
11
602
6 1
1.0
6.2
015
/ 9
m
ont
hs
19
. 1
. P
rinc
ipal
, R
ust
amji
In
stit
ute
of
Tec
hno
log
y,
B.S
.F.
Aca
dem
y,
Tak
enp
ur,
Gw
alio
r
2.
Man
ager
, A
dsi
l In
dia
L
imit
ed,
Ad
sil
Ho
use-
18
A,
Sec
tor
-16
A,
No
ida
(U.P
.)
27
.09.
201
2 6
26
100
52
762
3 9
84
77
41
80
751
1
1.0
6.2
015
/ 9
m
ont
hs
Ass
ista
nt
La
bo
ur
Co
mm
issi
on
er,
La
bo
ur
Off
ice,
Ujj
ain
20
. 1
. S
hri
San
jiv
Yad
av
S/o
Shr
i M
oha
n la
l Y
adav
,
2.
Shr
i R
ajen
dra
S/o
Shr
i M
oha
n l
al Y
adav
(P
artn
er)
H
ario
m
Co
ld
Sto
rage
, V
illa
ge
Sur
rasa
, T
ehsi
l-G
hatt
ia,
Ujj
ain
04
.03.
201
3 3
74
70
31
323
6
14
7 3
5 4
30
3 0
9.0
6.2
016
/ 0
m
ont
hs

Au
dit
Rep
ort
on
Gen
era
l an
d S
ocia
l S
ecto
rs f
or
the y
ea
r end
ed
31 M
arc
h 2
01
6
27
2
1
2
3
4
5
6
7
8
9
21
. A
nant
Nar
ayan
Mee
na,
Dir
ecto
r, S
and
eep
ni
Inst
itut
e o
f T
echn
olo
gy
and
S
cien
ce,
Gha
ttia
, U
jjai
n
05
.05.
201
4 1
07
400
0
10
740
0 2
1 4
51
08
09
.06.
201
6/
0
mo
nths
22
. S
hri
Han
i S
eth
Nac
hani
, 2
19
, U
sha
Nag
ar,
Das
hara
M
aid
an
Ke
Sam
ne,
Ind
ore
(C
ons
truc
tio
n
of
com
mer
cial
/res
iden
tial
M
ulti
b
uild
ing
o
n N
anak
hed
a S
tad
ium
S
chem
e)
17
.11.
201
5 1
45
987
5 0
1
45
987
5 3
8
75
93
09
.06.
201
6/
0
mo
nths
23
. S
hri
Dil
eep
R
ohr
a S
/o
Shr
i P
rata
p
Rai
R
ohr
a (C
on
stru
ctio
n o
f F
acto
ry S
hed
(S
hri
Sai
F
ebri
cks)
in
P
lot
No
. 1
2B
, 12
D,
Ind
ustr
ial
Are
a, M
aksh
i R
oad
, U
jjai
n
04
.04.
201
4 2
24
00
0
22
400
2
2 9
85
6 0
9.0
6.2
016
/ 0
m
ont
hs
24
. S
hri
Vij
ay
Mit
tal
S/o
S
hri
Kis
han
Lal
M
itta
l, P
awan
Ku
mar
Mit
tal
S/o
Kis
han
Lal
M
itta
l, S
mt.
Mee
na M
itta
l W
/o S
hri
Vij
ay
Ku
mar
M
itta
l an
d
Sm
t.
Sar
la
Mit
tal
W/o
S
hri
Paw
an
Mit
tal
(Par
tner
),
Bal
aji
Ent
erp
rise
s,
Har
ifat
ak,
Rin
g
Ro
ad,
Ujj
ain
(Co
nstr
ucti
on
o
f M
itta
l A
venu
e at
H
arif
atak
, R
ing
Ro
ad,
Ujj
ain)
18
.02.
201
3 1
26
720
11
864
4 8
07
6 3
6 5
81
5 2
6.1
2.2
013
/ 27
m
ont
hs
25
. S
hri
Sun
il
Ku
mar
S
/o
Shr
i H
iral
al
Jain
, D
irec
tor,
Bo
kem
Hea
lth
Car
e P
vt.
Lim
ited
, P
lot
No
. 8
4,
Ind
ustr
ial
Are
a,
Nag
jhir
i D
ewas
R
oad
, U
jjai
n (C
ons
truc
tio
n o
f F
acto
ry)
at
Plo
t N
o.
84
, In
dus
tria
l A
rea,
N
agjh
iri
Dew
as R
oad
, U
jjai
n
18
.11.
201
4 5
16
404
0
51
640
4 1
5 1
54
921
10
.11.
201
5/
4
mo
nths
26
. S
hri
Rak
esh
Sha
rma
S/o
Shr
i B
hag
wan
Lal
ji
Sha
rma,
C
hari
man
, (C
on
stru
ctio
n o
f Y
atha
rtha
F
utur
isti
cs
Aca
dem
y)
Vil
l-N
ino
ra,
Ind
ore
Ro
ad,
Ujj
ain
30
.09.
201
3 1
33
100
0
13
310
0 2
9 7
71
98
18
.03.
201
4/
23
mo
nths
27
. S
hri
Vik
as
Lak
hoti
a S
/o
Shr
i S
hya
m
Sh
und
er L
akho
tia,
57
6,
Unh
el R
oad
, N
agd
a,
Ujj
ain
(Co
nstr
ucti
on
of
Fac
tory
She
d R
ock
D
ued
Tec
h. P
vt.
Ltd
., U
nhe
l R
oad
, N
agd
a,
Ujj
ain)
11
.01.
201
3 5
29
80
50
000
2
98
0 3
7 2
20
5 1
2.0
4.2
016
/ 0
m
ont
h
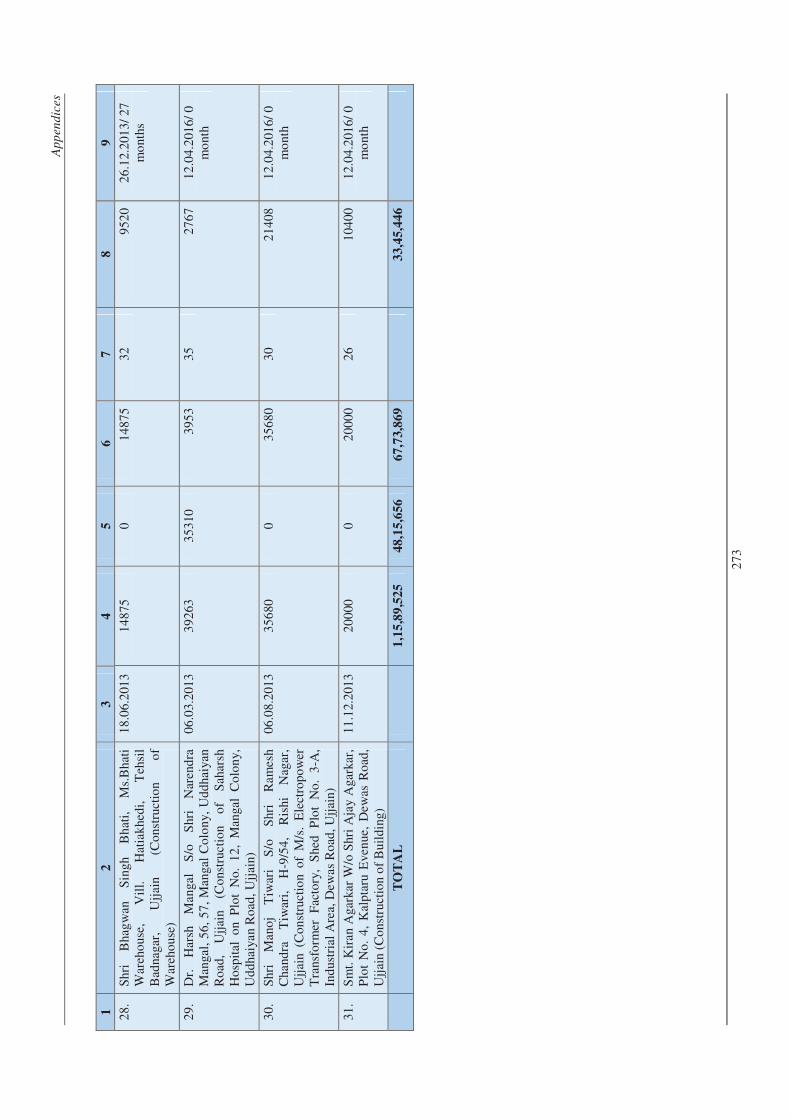
Ap
pen
dic
es
27
3
1
2
3
4
5
6
7
8
9
28
. S
hri
Bha
gw
an
Sin
gh
Bh
ati,
M
s.B
hati
W
areh
ous
e,
Vil
l.
Hat
iak
hed
i,
Teh
sil
Bad
naga
r,
Ujj
ain
(Co
nstr
ucti
on
of
War
eho
use)
18
.06.
201
3 1
48
75
0
14
875
3
2 9
52
0 2
6.1
2.2
013
/ 27
m
ont
hs
29
. D
r.
Har
sh
Man
gal
S/o
S
hri
Nar
end
ra
Man
gal,
56
, 5
7,
Man
gal
Co
lon
y, U
dd
haiy
an
Ro
ad,
Ujj
ain
(Co
nstr
ucti
on
o
f S
ahar
sh
Ho
spit
al o
n P
lot
No
. 1
2,
Man
gal
Co
lon
y,
Ud
dha
iyan
Ro
ad,
Ujj
ain)
06
.03.
201
3 3
92
63
35
310
3
95
3 3
5 2
76
7 1
2.0
4.2
016
/ 0
m
ont
h
30
. S
hri
Man
oj
Tiw
ari
S/o
S
hri
Ram
esh
C
hand
ra
Tiw
ari,
H
-9/5
4,
Ris
hi
Nag
ar,
Ujj
ain
(Co
nst
ruct
ion
of
M/s
. E
lect
rop
ow
er
Tra
nsfo
rmer
F
acto
ry,
She
d
Plo
t N
o.
3-A
, In
dus
tria
l A
rea,
Dew
as R
oad
, U
jjai
n)
06
.08.
201
3 3
56
80
0
35
680
3
0 2
14
08
12
.04.
201
6/
0
mo
nth
31
. S
mt.
Kir
an A
gark
ar W
/o S
hri
Aja
y A
gark
ar,
Plo
t N
o.
4,
Kal
pta
ru E
ven
ue,
Dew
as R
oad
, U
jjai
n (C
ons
truc
tio
n o
f B
uild
ing)
11
.12.
201
3 2
00
00
0
20
000
2
6 1
04
00
12
.04.
201
6/
0
mo
nth
T
OT
AL
1,1
5,8
9,5
25
48
,15,6
56
67
,73,8
69
3
3,4
5,4
46
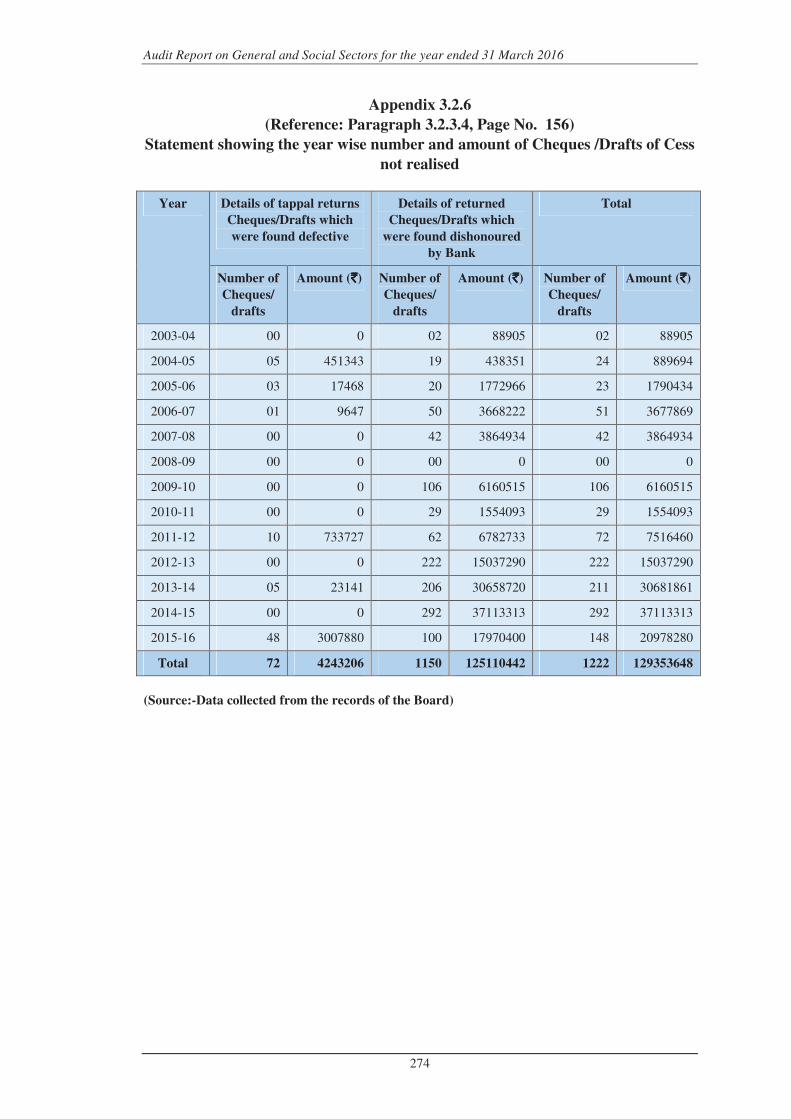
Audit Report on General and Social Sectors for the year ended 31 March 2016
274
Appendix 3.2.6
(Reference: Paragraph 3.2.3.4, Page No. 156)
Statement showing the year wise number and amount of Cheques /Drafts of Cess
not realised
Year Details of tappal returns
Cheques/Drafts which
were found defective
Details of returned
Cheques/Drafts which
were found dishonoured
by Bank
Total
Number of
Cheques/
drafts
Amount (`̀̀̀) Number of
Cheques/
drafts
Amount (`̀̀̀) Number of
Cheques/
drafts
Amount (`̀̀̀)
2003-04 00 0 02 88905 02 88905
2004-05 05 451343 19 438351 24 889694
2005-06 03 17468 20 1772966 23 1790434
2006-07 01 9647 50 3668222 51 3677869
2007-08 00 0 42 3864934 42 3864934
2008-09 00 0 00 0 00 0
2009-10 00 0 106 6160515 106 6160515
2010-11 00 0 29 1554093 29 1554093
2011-12 10 733727 62 6782733 72 7516460
2012-13 00 0 222 15037290 222 15037290
2013-14 05 23141 206 30658720 211 30681861
2014-15 00 0 292 37113313 292 37113313
2015-16 48 3007880 100 17970400 148 20978280
Total 72 4243206 1150 125110442 1222 129353648
(Source:-Data collected from the records of the Board)
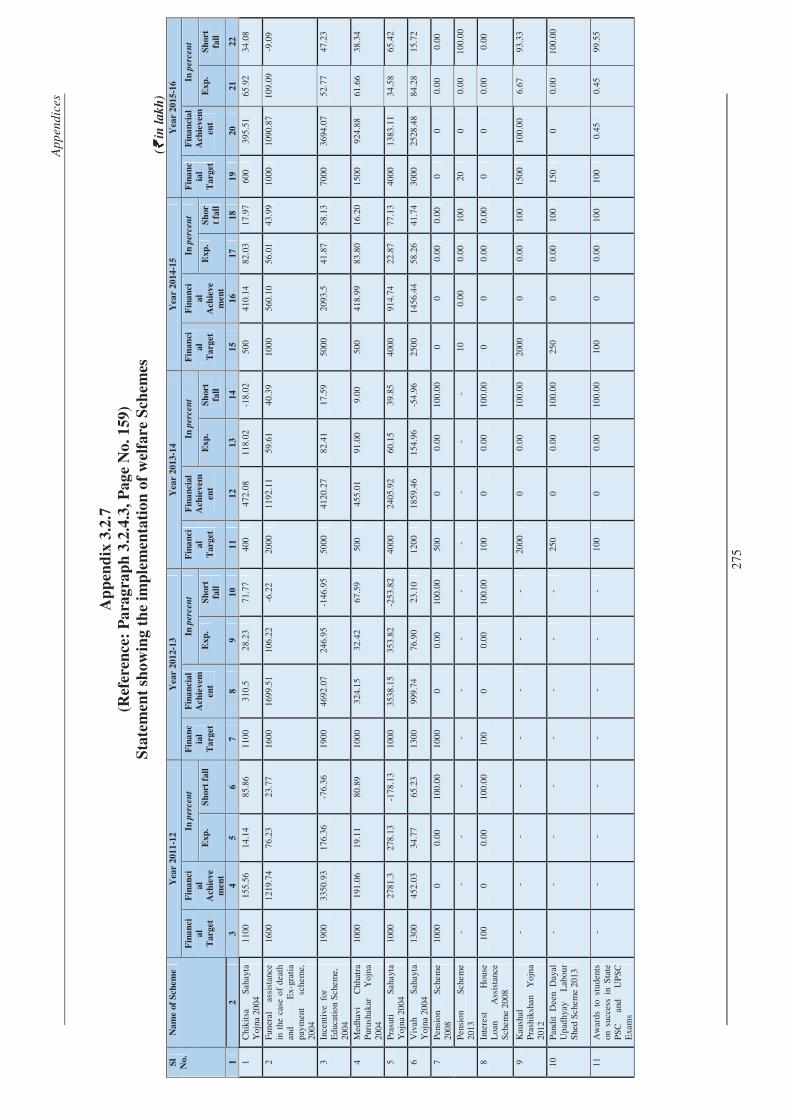
Ap
pen
dic
es
27
5
Ap
pen
dix
3.2
.7
(Ref
eren
ce:
Pa
rag
rap
h 3
.2.4
.3,
Pa
ge
No
. 1
59
)
Sta
tem
ent
sho
win
g t
he
imp
lem
enta
tio
n o
f w
elfa
re S
chem
es
(`̀̀̀ i
n l
ak
h)
Sl
No.
Nam
e of
Sch
em
e
Yea
r 2011-1
2
Yea
r 2012-1
3
Yea
r 2013-1
4
Yea
r 2014-1
5
Yea
r 2015-1
6
Fin
an
ci
al
Targ
et
Fin
an
ci
al
Ach
ieve
men
t
In p
erce
nt
Fin
an
c
ial
Targ
et
Fin
an
cial
Ach
ievem
ent
In p
erce
nt
Fin
an
ci
al
Targ
et
Fin
an
cial
Ach
ievem
ent
In p
erce
nt
Fin
an
ci
al
Targ
et
Fin
an
ci
al
Ach
ieve
men
t
In p
erce
nt
Fin
an
c
ial
Targ
et
Fin
an
cial
Ach
ievem
ent
In p
erce
nt
Exp
. S
hort
fall
E
xp
. S
hort
fall
Exp
. S
hort
fall
Exp
. S
hor
t fa
ll
Exp
. S
hort
fall
1
2
3
4
5
6
7
8
9
10
11
12
13
14
15
16
17
18
19
20
21
22
1
Chik
itsa
S
ahay
ta
Yojn
a 2004
1100
155.5
6
14.1
4
85.8
6
1100
310.5
28.2
3
71.7
7
400
472.0
8
118.0
2
-18.0
2
500
410.1
4
82.0
3
17.9
7
600
395.5
1
65.9
2
34.0
8
2
Funer
al
assi
stan
ce
in t
he c
ase
of
dea
th
and
E
x-g
rati
a pay
men
t sc
hem
e,
2004
1600
1219.7
4
76.2
3
23.7
7
1600
1699.5
1
106.2
2
-6.2
2
2000
1192.1
1
59.6
1
40.3
9
1000
560.1
0
56.0
1
43.9
9
1000
1090.8
7
109.0
9
-9.0
9
3
Ince
ntiv
e f
or
Ed
ucat
ion
Sch
eme,
2004
1900
3350.9
3
176.3
6
-76.3
6
1900
4692.0
7
246.9
5
-146.9
5
5000
4120.2
7
82.4
1
17.5
9
5000
2093.5
41.8
7
58.1
3
7000
3694.0
7
52.7
7
47.2
3
4
Med
havi
Chha
tra
Pur
usha
kar
Y
ojn
a 2004
1000
191.0
6
19.1
1
80.8
9
1000
324.1
5
32.4
2
67.5
9
500
455.0
1
91.0
0
9.0
0
500
418.9
9
83.8
0
16.2
0
1500
924.8
8
61.6
6
38.3
4
5
Pra
suti
S
ahay
ta
Yojn
a 2004
1000
2781.3
278.1
3
-178.1
3
1000
3538.1
5
353.8
2
-253.8
2
4000
2405.9
2
60.1
5
39.8
5
4000
914.7
4
22.8
7
77.1
3
4000
1383.1
1
34.5
8
65.4
2
6
Viv
ah
Sah
ayta
Y
ojn
a 2004
1300
452.0
3
34.7
7
65.2
3
1300
999.7
4
76.9
0
23.1
0
1200
1859.4
6
154.9
6
-54.9
6
2500
1456.4
4
58.2
6
41.7
4
3000
2528.4
8
84.2
8
15.7
2
7
Pen
sio
n S
chem
e 2008
1000
0
0.0
0
100.0
0
1000
0
0.0
0
100.0
0
500
0
0.0
0
100.0
0
0
0
0.0
0
0.0
0
0
0
0.0
0
0.0
0
Pen
sio
n S
chem
e 2013
-
-
-
-
-
-
-
-
-
-
-
-
10
0.0
0
0.0
0
100
20
0
0.0
0
100.0
0
8
Inte
rest
H
ous
e L
oan
A
ssis
tanc
e S
chem
e 2008
100
0
0.0
0
100.0
0
100
0
0.0
0
100.0
0
100
0
0.0
0
100.0
0
0
0
0.0
0
0.0
0
0
0
0.0
0
0.0
0
9
Kau
shal
P
rash
iksh
an
Yojn
a 2012
-
-
-
-
-
-
-
-
2000
0
0.0
0
100.0
0
2000
0
0.0
0
100
1500
100.0
0
6.6
7
93.3
3
10
Pan
dit
D
een
Day
al
Upad
hya
y L
abo
ur
She
d S
chem
e 2013
-
-
-
-
-
-
-
-
250
0
0.0
0
100.0
0
250
0
0.0
0
100
150
0
0.0
0
100.0
0
11
Aw
ards
to s
tuden
ts
on
succ
ess
in S
tate
P
SC
an
d
UP
SC
E
xam
s
-
-
-
-
-
-
-
-
100
0
0.0
0
100.0
0
100
0
0.0
0
100
100
0.4
5
0.4
5
99.5
5
Au
dit
Rep
ort
on
Gen
era
l an
d S
ocia
l S
ecto
rs f
or
the y
ea
r end
ed
31 M
arc
h 2
01
6
27
6
1
2
3
4
5
6
7
8
9
10
11
12
13
14
15
16
17
18
19
20
21
22
12
Sup
er
500
S
chem
e (C
lass
10)
-
-
-
-
-
-
-
-
200
0
0.0
0
100.0
0
125
3.7
5
3.0
0
97.0
0
125
10.5
0
8.4
0
91.6
0
13
Sup
er
500
S
chem
e (C
lass
12)
-
-
-
-
-
-
-
-
200
0
0.0
0
100.0
0
125
1.7
5
1.4
0
98.6
0
125
14.0
0
11.2
0
88.8
0
14
Vya
vsay
ik
Pat
hya
kra
m
Anudan
Yojn
a 2013
-
-
-
-
-
-
-
-
-
-
-
-
100
0.0
0
0.0
0
100
100
1.4
2
1.4
2
98.5
8
15
Muk
hya
M
antr
i N
irm
an
Shr
amik
G
ram
in
Aw
as
Yojn
a 2013
-
-
-
-
-
-
-
-
-
-
-
-
2500
0.0
0
0.0
0
100
2500
0
0.0
0
100.0
0
16
Muk
hya
M
antr
i N
irm
an
Shr
amik
S
hahr
i A
was
Y
ojn
a 2013
-
-
-
-
-
-
-
-
-
-
-
-
500
0.0
0
0.0
0
100
500
0
0.0
0
100.0
0
17
Khil
adi
Pro
tsah
an
yojn
a 2014
-
-
-
-
-
-
-
-
-
-
-
-
-
-
-
-
250
0
0.0
0
100.0
0
18
Auja
r U
pkar
an
Kha
rid
i par
A
nudan
2014
-
-
-
-
-
-
-
-
-
-
-
-
-
-
-
-
1500
4.0
0
0.2
7
99.7
3
19
Coac
hin
g A
nudan
Y
ojn
a 2014
-
-
-
-
-
-
-
-
-
-
-
-
-
-
-
-
500
1.4
2
0.2
8
99.7
2
20
Funer
al
and
ex
-gra
tia
pay
men
t fo
r unre
gis
tere
d
work
ers
in c
ase
of
dea
th/d
isab
ilit
y,
2014
-
-
-
-
-
-
-
-
-
-
-
-
-
-
-
-
500
23.0
8
4.6
2
95.3
8
21
Cyc
le
Anudan
Y
ojn
a 2014
-
-
-
-
-
-
-
-
-
-
-
-
-
-
-
-
2500
25.8
7
1.0
3
98.9
7
22
Do P
ahiy
a V
ahan
K
rayhe
tu
Anudan
Yojn
a 2014
-
-
-
-
-
-
-
-
-
-
-
-
-
-
-
-
100
6.7
0
6.7
0
93.3
0
T
ota
l 9000
8150.6
2
598.7
4
201.2
6
9000
11564.1
2
844.5
4
-44.5
3
16450
10504.8
5
566.1
5
733.8
5
19210
5859.4
1
349.2
4
1050.
76
27570
10204.3
6
449.3
4
1650.6
6
No
te:-
Fin
an
cia
l ta
rget
of `̀̀̀ 8
12
.30
cro
re a
nd
fin
an
cia
l ach
iev
em
ent
of `̀̀̀ 4
62.8
3 c
rore
un
der
th
e v
ari
ou
s sc
hem
es d
uri
ng
20
11
-16
.
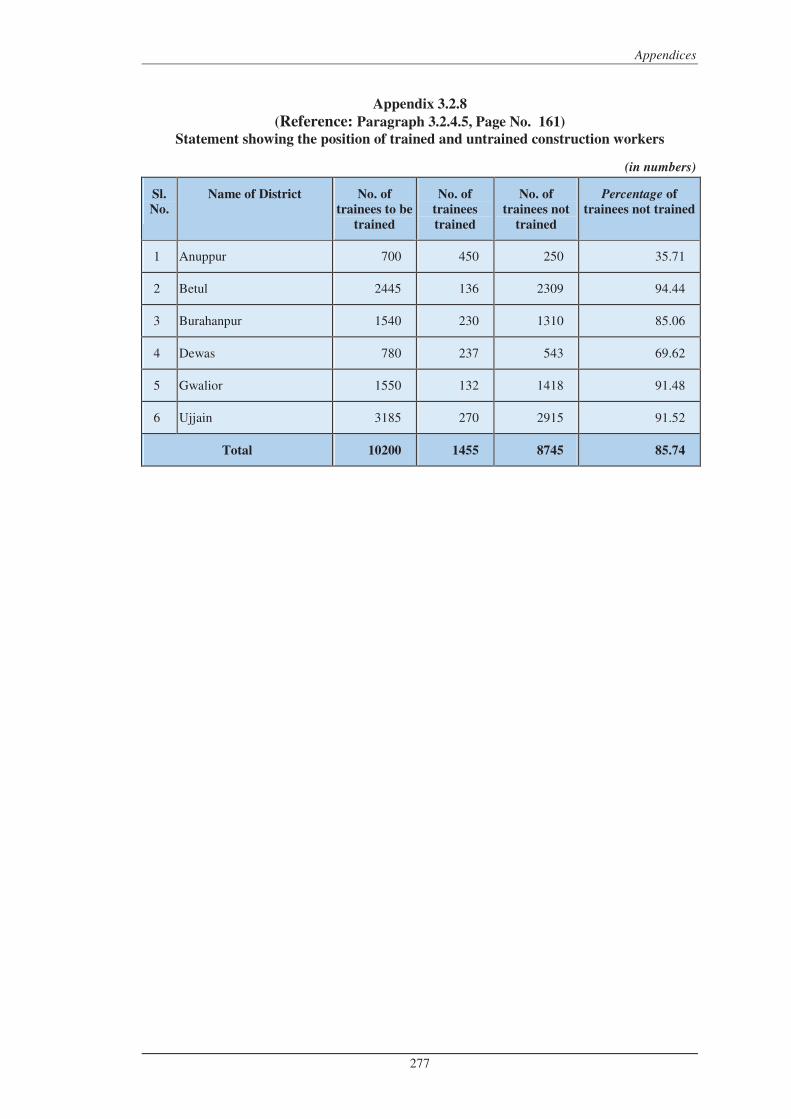
Appendices
277
Appendix 3.2.8
(Reference: Paragraph 3.2.4.5, Page No. 161)
Statement showing the position of trained and untrained construction workers
(in numbers)
Sl.
No.
Name of District No. of
trainees to be
trained
No. of
trainees
trained
No. of
trainees not
trained
Percentage of
trainees not trained
1 Anuppur 700 450 250 35.71
2 Betul 2445 136 2309 94.44
3 Burahanpur 1540 230 1310 85.06
4 Dewas 780 237 543 69.62
5 Gwalior 1550 132 1418 91.48
6 Ujjain 3185 270 2915 91.52
Total 10200 1455 8745 85.74
Au
dit
Rep
ort
on
Gen
era
l an
d S
ocia
l S
ecto
rs f
or
the y
ea
r end
ed
31 M
arc
h 2
01
6
27
8
Ap
pen
dix
3.2
.9
(Ref
eren
ce:
Pa
rag
rap
h 3
.2.4
.7,
Pa
ge
No
. 1
62
)
Det
ail
s o
f ir
reg
ula
riti
es i
n s
an
ctio
n o
f b
enef
its
un
der
fu
ner
al
ass
ista
nce
an
d e
x-g
rati
a p
ay
men
t (f
ak
e d
eath
cer
tifi
cate
s)
(Am
ou
nt
in `̀̀̀
)
Sl.
No
.
Na
me
of
Dis
tric
t N
am
e o
f th
e en
tity
D
eta
ils
of
Dec
ease
d p
erso
n a
s p
er r
eco
rds
of
Na
ga
r P
ali
k N
iga
m
Det
ail
s o
f D
ecea
sed
reg
iste
red
wo
rker
as
per
ma
nip
ula
ted
/fa
ke
dea
th C
erti
fica
te
Am
ou
nt
of
irre
gu
larl
y
pa
id f
un
era
l a
nd
ex-
gra
tia
un
der
th
e S
chem
e
Na
me
of
Dec
ease
d p
erso
n
Reg
istr
ati
on
No
. a
nd
da
te a
s sh
ow
n i
n d
eath
reg
iste
r
Na
me
of
ben
efit
ted
Dec
ease
d
reg
iste
red
wo
rker
Reg
istr
ati
on
No
.
an
d d
ate
as
sho
wn
in m
an
ipu
late
d/f
ak
e
dea
th c
erti
fica
te
(1)
(2)
(3)
(4)
(5)
(6)
(7)
(8)
1
Bet
ul
Nag
ar P
alik
aSar
ni
Bab
ulal
2
96
/20-1
2-2
01
3
Bit
ty B
ai
29
6/2
3-2
-20
13
27
000
2
Ben
i B
ai
Pac
haur
i 1
92
/20-0
8-2
01
3
Cha
ndra
Kal
a 1
92
/17
-02
-201
3 2
70
00
3
Bur
hanp
ur
LO
Bur
hanp
ur
Kas
hi B
ai
90
0/0
1-0
9-2
01
1
Gul
amB
aksh
S/o
M
ehm
oo
dB
aksh
9
00
/06
-05
-201
1 2
70
00
4
Gul
naar
Ban
o
W/o
Mo
h.
Yaa
koo
b
81
2/0
5-0
8-2
01
1
Sha
ban
aban
o W
/o
Sag
irud
din
8
12
/05
-01
-201
2 2
70
00
5
Mo
h.Y
usu
f S
/o
Mo
h. A
jiz
54
9/1
7-0
5-2
01
2
She
kh
Iqb
al
S/o
S
hekh
Nav
ab
54
9/1
7-0
5-2
012
27
000
6
Mo
h.Y
usu
f S
/o
Mo
h. A
jiz
54
9/1
7-0
5-2
01
2
Ah
mad
Ull
a S
/o
Mo
ti U
lla
54
9/1
7-0
5-2
012
27
000
7
--
--
Raf
ikS
ahab
S/o
A
hm
ed S
ahab
9
73
/24
-04
-201
2 2
70
00
8
Mo
h.Y
usu
f S
/o
Mo
h. A
jiz
54
9/1
7-0
5-2
01
2
She
khJa
far
S/o
S
hekh
Gaf
ur
54
9/1
7-0
5-2
012
27
000
9
A.S
alim
S/o
A.
Haf
ij
16
8/0
8-0
2-2
01
2
She
kh K
arim
S/o
S
hekh
Bas
ir
16
8/0
8-0
6-2
012
27
000
10
Kus
um
Bai
W/o
S
alik
Ram
6
33
/08-0
6-2
01
2
Ikab
al a
bas
h S
/o
She
ikh
Ab
aash
6
33
/19
-07
-201
2 2
70
00
Ap
pen
dic
es
27
9
(1)
(2)
(3)
(4)
(5)
(6)
(7)
(8)
11
Gul
shaa
d B
W/o
R
ashi
d K
han
5
49
/17-0
5-2
01
3
Mo
Sad
ik S
/o
Maj
lesa
hab
5
49
/17
-05
-201
3 2
70
00
12
Cha
anu
mal
S/o
S
awan
mal
8
94
/23-0
8-2
01
3
Mo
h. S
adik
S/o
Mo
Y
aasi
n
89
4/1
0-0
6-2
013
27
000
13
Ujj
ain
Nag
ar
Pal
ik
Nig
am U
jjai
n
Ana
ndi
Dev
i A
graw
al W
/o
Nar
ain
Das
17
0/2
1-0
1-2
01
5
Hee
rala
lPar
mar
S/o
P
anna
lal
1
70
/21
-01
-201
5 7
80
00
14
Ku
ndli
k R
ao S
/o
Nar
ain
Rao
2
13
7/2
5-0
7-2
01
5
Kam
al K
isho
re S
/o
Ram
chan
dra
2
13
7/2
1-0
1-2
01
5 2
80
00
15
Pra
kash
Bat
hri
S/o
Bab
u L
al
24
38
/19
-08
-20
14
Jagd
ish
Cha
ndra
S/o
D
hul
ji
24
38
/20
-11
-20
14
78
000
16
Sad
hna
Sin
gh
W/o
Sur
end
ra
Sin
gh
18
57
/27
-06
-20
15
Sap
na W
/o A
tul
18
57
/17
-04
-20
15
78
000
To
tal
58
600
0
Au
dit
Rep
ort
on
Gen
era
l an
d S
ocia
l S
ecto
rs f
or
the y
ea
r end
ed
31 M
arc
h 2
01
6
28
0
Ap
pen
dix
3.2
.10
(Ref
eren
ce:
Pa
rag
rap
h 3
.2.4
.8,
Pa
ge
No
. 1
63
)
Sta
tem
ent
sho
win
g t
he
det
ail
s o
f a
dv
an
ce t
o h
osp
ita
ls n
ot
ad
just
ed
(Am
ou
nt
in `̀̀̀
)
Sl.
No
. N
am
e o
f O
ffic
e w
hic
h
pro
vid
e A
dv
an
ce t
o
Ho
spit
al
Na
me
of
ben
efic
iary
N
am
e o
f H
osp
ita
l C
heq
ue
No
D
ate
A
mo
un
t o
f
Ad
va
nce
Uti
lisa
tio
n
Cer
tifi
cate
/
Ad
just
men
t
(1)
(2)
(3)
(4)
(5)
(6)
(7)
(8)
1
CM
HO
Anu
pp
ur
San
tosh
Ku
mar
Mis
hra
F/o
Sh
ri
Sud
ama
Pra
sad
Mis
hra
Med
ical
Res
earc
h F
oun
dat
ion
Sha
nkar
Net
rala
y C
henn
ai
RT
GS
Ac
no
SB
I 1
04
975
287
01
21
/09
/20
14
67
000
N
ot
Rec
eive
d
2
Ku
Ban
dan
a P
atel
F/o
Shr
i S
atya
Nar
ayan
b P
atel
M
etro
Ho
spit
al a
nd C
ance
r R
esea
rch
Cen
ter
jab
alp
ur
73
438
0 0
1/1
1/2
01
4 9
00
00
No
t R
ecei
ved
K
u B
and
ana
Pat
el F
/o S
hri
Sat
yaN
aray
anb
Pat
el
Met
ro H
osp
ital
and
Can
cer
Res
earc
h C
ente
r ja
bal
pur
7
34
412
03
/07
/20
15
90
000
N
ot
Rec
eive
d
3
Juga
l K
isho
r S
ahu
F/o
Shr
i R
am
Nih
or
Sah
u
Bho
pal
Mem
ori
al H
osp
ital
an
d
Res
earc
h C
ente
r B
hop
al
73
438
9 3
1/1
2/2
01
4 1
00
000
No
t R
ecei
ved
4
An
gat
Sah
u F
o J
agan
nath
Sah
u
Mo
han
All
Har
govi
nd D
as
Pub
lic
Cha
rita
ble
Jab
alp
ur
73
439
8 1
9/0
3/2
01
5 6
00
00
No
t R
ecei
ved
5
Sh
yam
Su
ndar
Fo
Ro
op
Lal
Sen
M
oha
n A
ll H
argo
vind
Das
P
ubli
c C
hari
tab
le J
abal
pur
7
34
402
06
/05
/20
15
10
000
0 N
ot
Rec
eive
d
S
hya
m S
und
ar F
o R
oo
p L
al S
en
Mo
han
All
Har
govi
nd D
as
Pub
lic
Cha
rita
ble
Jab
alp
ur
73
444
1 0
8/0
1/2
01
6 9
90
00
No
t R
ecei
ved
6
Sm
t R
adha
W/o
Pho
olc
hand
Sah
u M
etro
H
osp
ital
an
d
Can
cer
Res
earc
h C
ente
r Ja
bal
pur
7
34
405
06
/05
/20
15
50
000
N
ot
Rec
eive
d
7
Sm
t G
ham
alia
Sah
u W
/o L
akh
an
Sah
u
Met
ro
Ho
spit
al
and
C
ance
r R
esea
rch
Cen
ter
Jab
alp
ur
73
441
0 0
3/0
7/2
01
5 5
00
00
No
t R
ecei
ved
8
Sm
t S
ange
eta
Sah
u W
/o B
adri
S
ahu
M
etro
H
osp
ital
an
d
Can
cer
Res
earc
h C
ente
r ja
bal
pur
7
34
411
03
/07
/20
15
10
000
0 N
ot
Rec
eive
d
9
Cha
mm
an
Lal
Sah
u F
/o B
ej N
ath
Sah
u
Met
ro
Ho
spit
al
and
C
ance
r R
esea
rch
Cen
ter
jab
alp
ur
73
441
3 1
3/0
7/2
01
5 1
00
000
No
t R
ecei
ved
10
T
haku
r S
ing
h F
/o S
alik
Ram
M
etro
H
osp
ital
an
d
Can
cer
Res
earc
h C
ente
r ja
bal
pur
7
34
419
10
/08
/20
15
50
000
N
ot
Rec
eive
d
11
Vin
ayk
um
ar F
/o K
amta
Pra
sad
M
etro
H
osp
ital
an
d
Can
cer
Res
earc
h C
ente
r ja
bal
pur
7
34
420
10
/08
/20
15
10
000
0 N
ot
Rec
eive
d
Ap
pen
dic
es
28
1
(1)
(2)
(3)
(4)
(5)
(6)
(7)
(8)
12
T
arun
Sar
iwan
F/o
Shi
vdas
M
etro
H
osp
ital
an
d
Can
cer
Res
earc
h C
ente
r ja
bal
pur
7
34
421
10
/08
/20
15
10
000
0 N
ot
Rec
eive
d
13
CM
HO
Anu
pp
ur
Ku
Ree
na S
ahu
F/o
Hem
bal
i S
ahu
M
edit
rina
In
stit
ute
of
Med
ical
S
cien
ce N
agp
ur
73
442
9 1
5/1
0/2
01
5 6
50
00
No
t R
ecei
ved
14
An
gad
Pra
sad
Pat
el F
/o R
eva
Sin
gh
M
etro
H
osp
ital
an
d
Can
cer
Res
earc
h C
ente
r ja
bal
pur
7
34
430
15
/10
/20
15
50
000
N
ot
Rec
eive
d
15
Sm
t B
han
mat
i R
atho
r F
/o R
am
Day
al
Ash
ish
Ho
spit
al J
abal
pur
7
34
431
15
/10
/20
15
10
000
0 N
ot
Rec
eive
d
16
Ram
Pra
sad
Rat
hore
F/o
B
udhr
am
Cit
y H
osp
ital
an
d
Res
earc
h
Cen
ter
Jab
alp
ur
73
443
8 2
9/1
2/2
01
5 4
50
00
No
t R
ecei
ved
17
Ku
Raj
nand
ini
F/o
Nar
esh
Pat
el
Met
ro
Ho
spit
al
and
C
ance
r R
esea
rch
Cen
ter
jab
alp
ur
73
444
5 1
9/0
2/2
01
6 1
00
000
No
t R
ecei
ved
18
Pri
tam
Sin
gh
F/o
Ava
dh
Raj
S
ing
h
Ana
nd
Inst
itut
e o
f M
edic
al
Sci
ence
Jab
alp
ur
73
444
6 1
9/0
2/2
01
6 8
80
00
No
t R
ecei
ved
19
Om
Pra
kash
Nay
ak F
/o J
ai S
ing
h N
ayak
M
etro
H
osp
ital
an
d
Can
cer
Res
earc
h C
ente
r ja
bal
pur
7
34
447
19
/02
/20
16
10
000
0 N
ot
Rec
eive
d
20
Dam
an S
ahu
F/o
Jai
pal
Sah
u
Mo
han
All
H
argo
vind
D
as
Pub
lic
Cha
rita
ble
Jab
alp
ur
73
444
8 1
9/0
2/2
01
6 7
50
00
No
t R
ecei
ved
21
Sm
t N
eelm
ani
Mis
hra
W/o
K
rish
na K
ant
Mis
hra
Jaw
ahar
Lal
N
ehru
C
ance
r H
osp
ital
and
Res
earc
h B
hop
al
73
444
9 1
9/0
2/2
01
6 5
00
00
No
t R
ecei
ved
22
Sm
t K
om
alva
ti W
/o D
alb
irya
dav
S
hyo
rtec
Ho
spit
al a
nd C
ance
r R
esea
rch
Cen
ter
Nag
pur
7
34
451
25
/02
/20
16
90
000
N
ot
Rec
eive
d
23
Vis
hesh
ar S
ahu
F/o
Shi
v P
rasa
d
Sah
u
Met
ro
Ho
spit
al
and
C
ance
r R
esea
rch
Cen
ter
jab
alp
ur
73
445
2 2
5/0
2/2
01
6 7
50
00
No
t R
ecei
ved
24
Lal
lu S
ingh
F/o
Ku
nw
ar S
ing
h
Sh
yort
ec H
osp
ital
and
Can
cer
Res
earc
h C
ente
r N
agp
ur
73
445
4 1
4/0
3/2
01
6 1
00
000
No
t R
ecei
ved
25
Sm
t R
am k
ali
F/o
Dev
shar
nSah
u
Met
ro
Ho
spit
al
and
C
ance
r R
esea
rch
Cen
ter
jab
alp
ur
73
445
5 2
5/0
2/2
01
6 5
00
00
No
t R
ecei
ved
26
Sm
t. N
eelm
ani
Mis
hra
W/o
K
rish
na K
ant
Mis
hra
Jaw
ahar
Lal
N
ehru
C
ance
r H
osp
ital
and
Res
earc
h B
hop
al
73
445
7 2
5/0
2/2
01
6 5
00
00
No
t R
ecei
ved
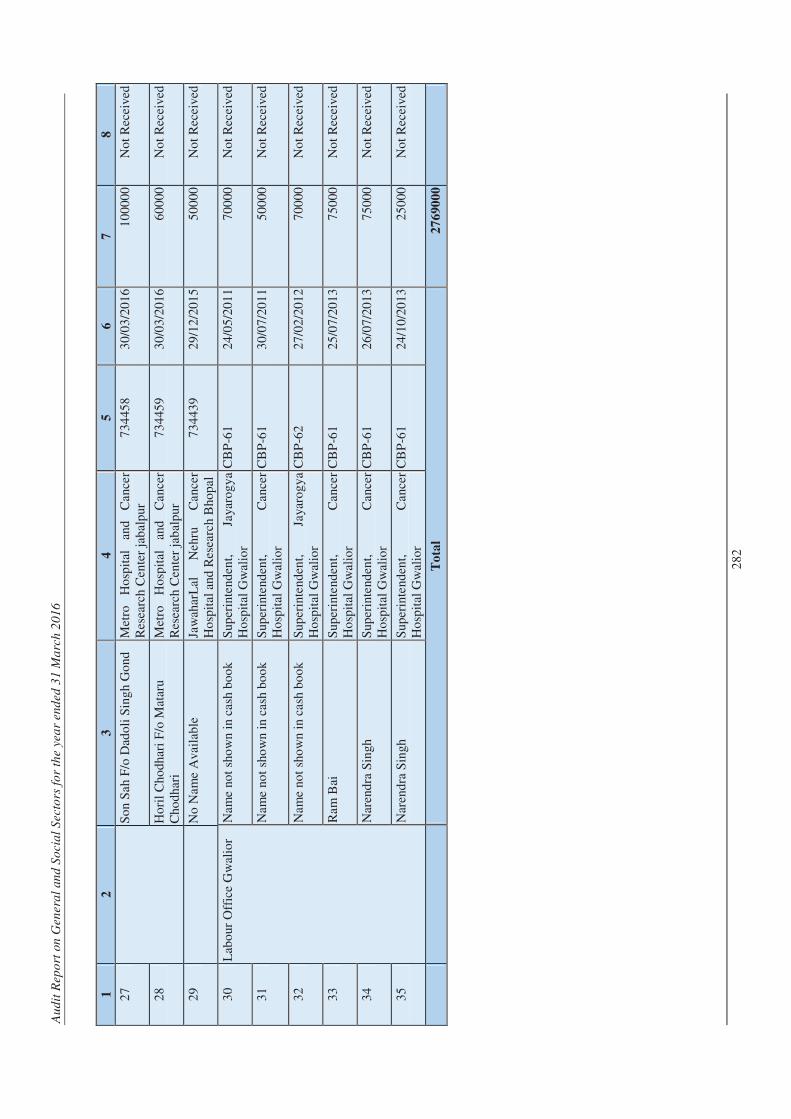
Au
dit
Rep
ort
on
Gen
era
l an
d S
ocia
l S
ecto
rs f
or
the y
ea
r end
ed
31 M
arc
h 2
01
6
28
2
1
2
3
4
5
6
7
8
27
So
n S
ah F
/o D
ado
li S
ing
h G
ond
M
etro
H
osp
ital
an
d
Can
cer
Res
earc
h C
ente
r ja
bal
pur
7
34
458
30
/03
/20
16
10
000
0 N
ot
Rec
eive
d
28
Ho
ril
Cho
dha
ri F
/o M
atar
u C
hod
hari
M
etro
H
osp
ital
an
d
Can
cer
Res
earc
h C
ente
r ja
bal
pur
7
34
459
30
/03
/20
16
60
000
N
ot
Rec
eive
d
29
No
Nam
e A
vail
able
Ja
wah
arL
al
Neh
ru
Can
cer
Ho
spit
al a
nd R
esea
rch
Bho
pal
7
34
439
29
/12
/20
15
50
000
N
ot
Rec
eive
d
30
Lab
our
Off
ice
Gw
alio
r N
ame
not
sho
wn
in
cash
bo
ok
S
uper
inte
nden
t,
Jaya
rog
ya
H
osp
ital
Gw
alio
r C
BP
-61
2
4/0
5/2
01
1 7
00
00
No
t R
ecei
ved
31
Nam
e no
t sh
ow
n i
n ca
sh b
oo
k
Sup
erin
tend
ent,
C
ance
r
Ho
spit
al G
wal
ior
CB
P-6
1
30
/07
/20
11
50
000
N
ot
Rec
eive
d
32
Nam
e no
t sh
ow
n i
n ca
sh b
oo
k
Sup
erin
tend
ent,
Ja
yaro
gy
a
Ho
spit
al G
wal
ior
CB
P-6
2
27
/02
/20
12
70
000
N
ot
Rec
eive
d
33
Ram
Bai
S
uper
inte
nden
t,
Can
cer
H
osp
ital
Gw
alio
r C
BP
-61
2
5/0
7/2
01
3 7
50
00
No
t R
ecei
ved
34
Nar
end
ra S
ingh
S
uper
inte
nden
t,
Can
cer
H
osp
ital
Gw
alio
r C
BP
-61
2
6/0
7/2
01
3 7
50
00
No
t R
ecei
ved
35
Nar
end
ra S
ingh
S
uper
inte
nden
t,
Can
cer
H
osp
ital
Gw
alio
r C
BP
-61
2
4/1
0/2
01
3 2
50
00
No
t R
ecei
ved
To
tal
27
690
00
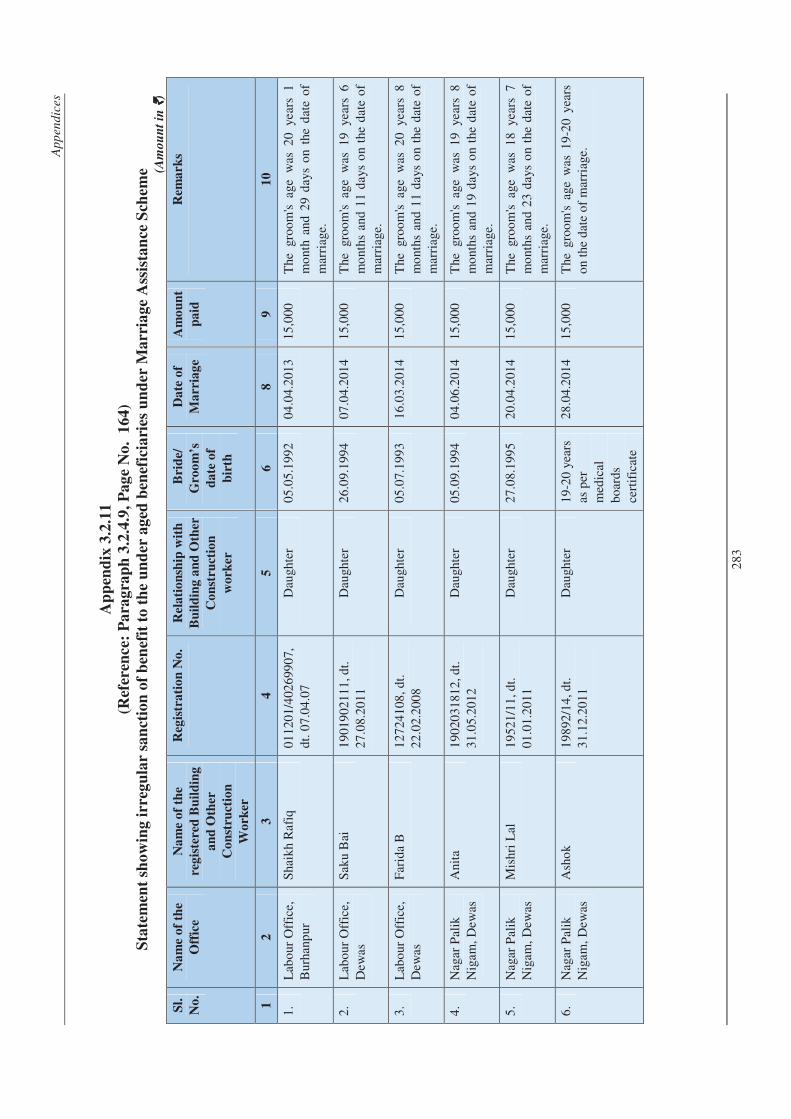
Ap
pen
dic
es
28
3
Ap
pen
dix
3.2
.11
(Ref
eren
ce:
Pa
rag
rap
h 3
.2.4
.9,
Pa
ge
No
. 1
64
)
Sta
tem
ent
sho
win
g i
rreg
ula
r sa
nct
ion
of
ben
efit
to
th
e u
nd
er a
ged
ben
efic
iari
es u
nd
er M
arr
iag
e A
ssis
tan
ce S
chem
e (A
mo
un
t in
`̀̀̀)
Sl.
No
.
Na
me
of
the
Off
ice
Na
me
of
the
reg
iste
red
Bu
ild
ing
an
d O
ther
Co
nst
ruct
ion
Wo
rker
Reg
istr
ati
on
No
. R
ela
tio
nsh
ip w
ith
Bu
ild
ing
an
d O
ther
Co
nst
ruct
ion
wo
rker
Bri
de/
Gro
om
’s
da
te o
f
bir
th
Da
te o
f
Ma
rria
ge
Am
ou
nt
pa
id
Rem
ark
s
1
2
3
4
5
6
8
9
10
1.
Lab
our
Off
ice,
B
urha
npur
Sha
ikh
Raf
iq
01
120
1/4
026
990
7,
dt.
07
.04
.07
Dau
ghte
r 0
5.0
5.1
992
04
.04.
201
3 1
5,0
00
The
gro
om
's a
ge
was
20
ye
ars
1 m
ont
h an
d 2
9 d
ays
on
the
dat
e o
f
mar
riag
e.
2.
Lab
our
Off
ice,
D
ewas
Sak
u B
ai
19
019
021
11
, dt.
2
7.0
8.2
011
Dau
ghte
r 2
6.0
9.1
994
07
.04.
201
4 1
5,0
00
The
gro
om
's a
ge
was
19
ye
ars
6 m
ont
hs a
nd 1
1 d
ays
on
the
dat
e o
f m
arri
age.
3.
Lab
our
Off
ice,
D
ewas
Far
ida
B
12
724
108
, d
t.
22
.02.
200
8
Dau
ghte
r 0
5.0
7.1
993
16
.03.
201
4 1
5,0
00
The
gro
om
's a
ge
was
20
ye
ars
8 m
ont
hs a
nd 1
1 d
ays
on
the
dat
e o
f m
arri
age.
4.
Nag
ar P
alik
N
igam
, D
ewas
Ani
ta
19
020
318
12
, dt.
3
1.0
5.2
012
Dau
ghte
r 0
5.0
9.1
994
04
.06.
201
4 1
5,0
00
The
gro
om
's a
ge
was
19
ye
ars
8 m
ont
hs a
nd 1
9 d
ays
on
the
dat
e o
f
mar
riag
e.
5.
Nag
ar P
alik
N
igam
, D
ewas
Mis
hri
Lal
1
95
21/1
1, d
t.
01
.01.
201
1
Dau
ghte
r 2
7.0
8.1
995
20
.04.
201
4 1
5,0
00
The
gro
om
's a
ge
was
18
ye
ars
7 m
ont
hs a
nd 2
3 d
ays
on
the
dat
e o
f m
arri
age.
6.
Nag
ar P
alik
N
igam
, D
ewas
Ash
ok
1
98
92/1
4, d
t.
31
.12.
201
1
Dau
ghte
r 1
9-2
0 y
ears
as
per
m
edic
al
bo
ard
s ce
rtif
icat
e
28
.04.
201
4 1
5,0
00
The
gro
om
's a
ge w
as 1
9-2
0 y
ears
o
n th
e d
ate
of
mar
riag
e.
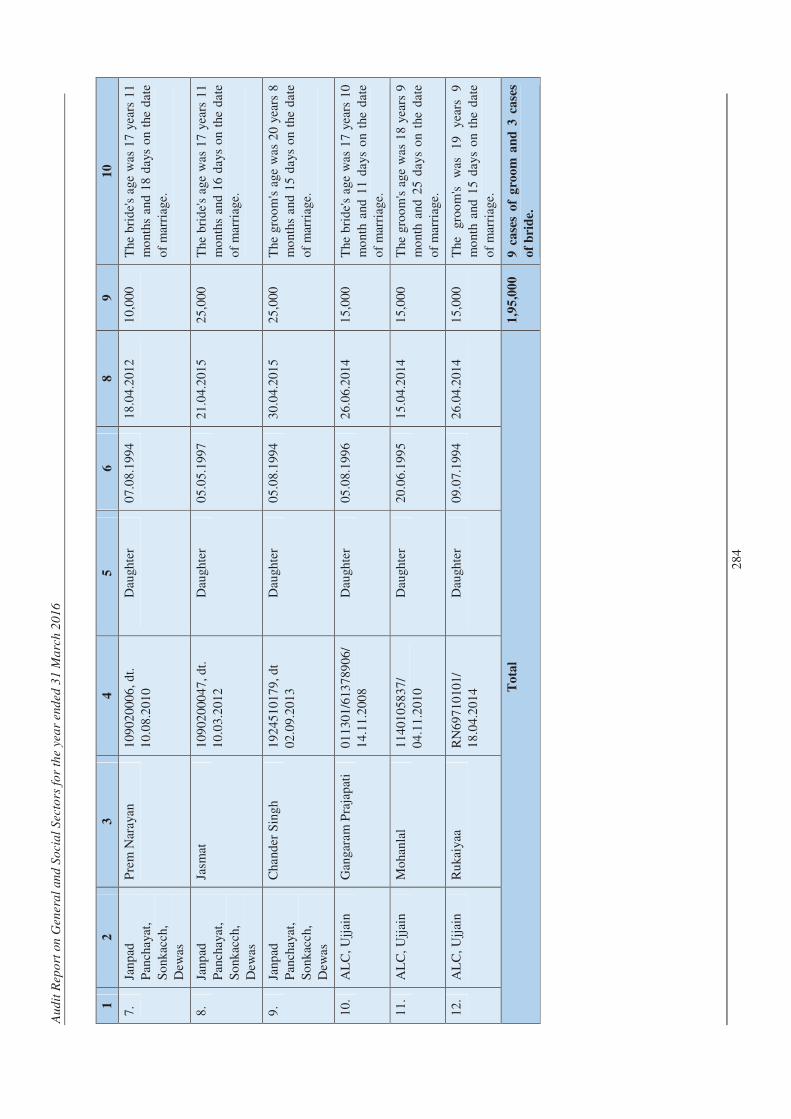
Au
dit
Rep
ort
on
Gen
era
l an
d S
ocia
l S
ecto
rs f
or
the y
ea
r end
ed
31 M
arc
h 2
01
6
28
4
1
2
3
4
5
6
8
9
10
7.
Janp
ad
Pan
chay
at,
So
nkac
ch,
Dew
as
Pre
m N
aray
an
10
902
000
6, d
t.
10
.08.
201
0
Dau
ghte
r 0
7.0
8.1
994
18
.04.
201
2 1
0,0
00
The
bri
de'
s ag
e w
as 1
7 y
ears
11
mo
nths
and
18
day
s o
n th
e d
ate
of
mar
riag
e.
8.
Janp
ad
Pan
chay
at,
So
nkac
ch,
Dew
as
Jasm
at
10
902
000
47
, dt.
1
0.0
3.2
012
Dau
ghte
r 0
5.0
5.1
997
21
.04.
201
5 2
5,0
00
The
bri
de'
s ag
e w
as 1
7 y
ears
11
mo
nths
and
16
day
s o
n th
e d
ate
of
mar
riag
e.
9.
Janp
ad
Pan
chay
at,
So
nkac
ch,
Dew
as
Cha
nder
Sin
gh
1
92
451
017
9, d
t 0
2.0
9.2
013
Dau
ghte
r 0
5.0
8.1
994
30
.04.
201
5 2
5,0
00
The
gro
om
's a
ge w
as 2
0 y
ears
8
mo
nths
and
15
day
s o
n th
e d
ate
of
mar
riag
e.
10
. A
LC
, U
jjai
n G
anga
ram
Pra
jap
ati
01
130
1/6
137
890
6/
14
.11.
200
8
Dau
ghte
r 0
5.0
8.1
996
26
.06.
201
4 1
5,0
00
The
bri
de'
s ag
e w
as 1
7 y
ears
10
mo
nth
and
11
day
s o
n th
e d
ate
of
mar
riag
e.
11
. A
LC
, U
jjai
n M
oha
nlal
1
14
010
583
7/
04
.11.
201
0
Dau
ghte
r 2
0.0
6.1
995
15
.04.
201
4 1
5,0
00
The
gro
om
's a
ge w
as 1
8 y
ears
9
mo
nth
and
25
day
s o
n th
e d
ate
of
mar
riag
e.
12
. A
LC
, U
jjai
n R
uka
iyaa
R
N6
97
10
101
/ 1
8.0
4.2
014
Dau
ghte
r 0
9.0
7.1
994
26
.04.
201
4 1
5,0
00
The
gr
oo
m's
w
as
19
ye
ars
9
mo
nth
and
15
day
s o
n th
e d
ate
of
mar
riag
e.
To
tal
1,9
5,0
00
9 c
ase
s o
f g
roo
m a
nd
3 c
ase
s
of
bri
de.
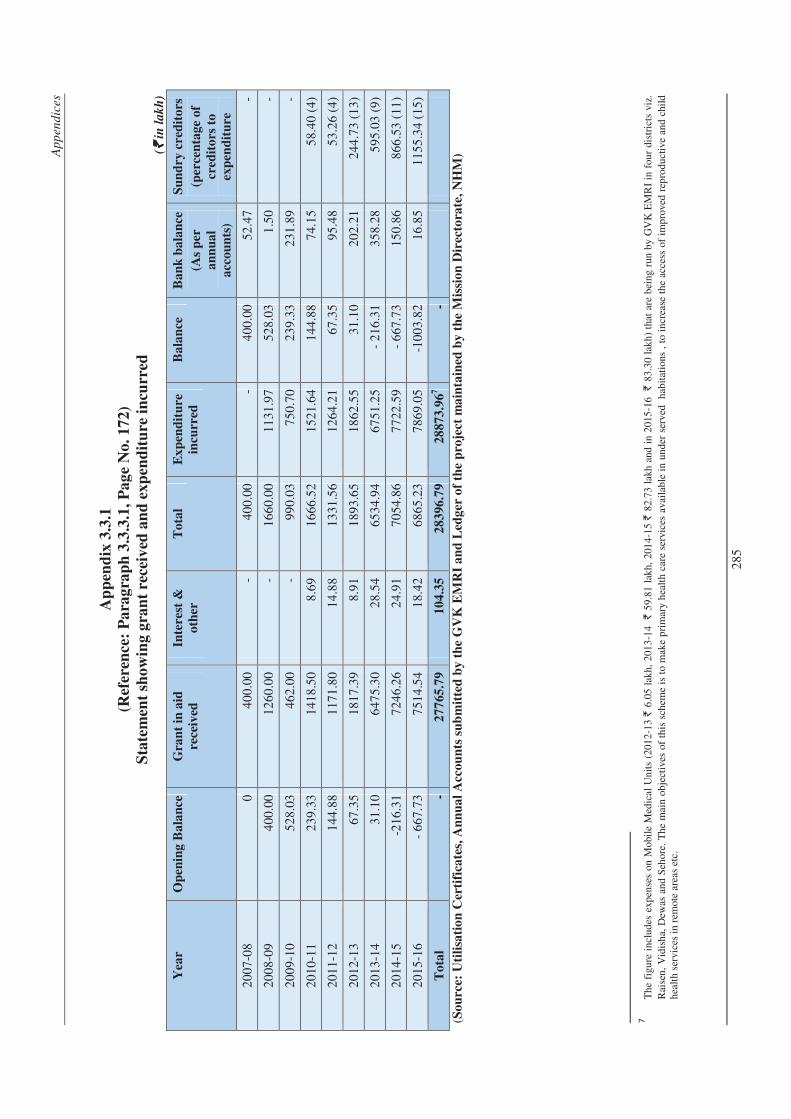
Ap
pen
dic
es
28
5
Ap
pen
dix
3.3
.1
(Ref
eren
ce:
Pa
rag
rap
h 3
.3.3
.1,
Pa
ge
No
. 1
72
)
Sta
tem
ent
sho
win
g g
ran
t re
ceiv
ed a
nd
ex
pen
dit
ure
in
curr
ed
(` ` ` ` i
n l
ak
h)
Yea
r O
pen
ing
Ba
lan
ce
Gra
nt
in a
id
rece
ived
Inte
rest
&
oth
er
To
tal
Ex
pen
dit
ure
incu
rred
Ba
lan
ce
Ba
nk
ba
lan
ce
(As
per
an
nu
al
acc
ou
nts
)
Su
nd
ry c
red
ito
rs
(per
cen
tag
e o
f
cred
ito
rs t
o
exp
end
itu
re
20
07
-08
0
40
0.0
0 -
40
0.0
0 -
40
0.0
0 5
2.4
7 -
20
08
-09
40
0.0
0 1
26
0.0
0 -
16
60
.00
11
31
.97
52
8.0
3 1
.50
-
20
09
-10
52
8.0
3 4
62
.00
- 9
90
.03
75
0.7
0 2
39
.33
23
1.8
9 -
20
10
-11
23
9.3
3 1
41
8.5
0 8
.69
16
66
.52
15
21
.64
14
4.8
8 7
4.1
5 5
8.4
0 (4
)
20
11
-12
14
4.8
8 1
17
1.8
0 1
4.8
8 1
33
1.5
6 1
26
4.2
1 6
7.3
5 9
5.4
8 5
3.2
6 (4
)
20
12
-13
67
.35
18
17
.39
8.9
1 1
89
3.6
5 1
86
2.5
5 3
1.1
0 2
02
.21
24
4.7
3 (
13
)
20
13
-14
31
.10
64
75
.30
28
.54
65
34
.94
67
51
.25
- 2
16
.31
35
8.2
8 5
95
.03
(9
)
20
14
-15
-21
6.3
1 7
24
6.2
6 2
4.9
1 7
05
4.8
6 7
72
2.5
9 -
66
7.7
3 1
50
.86
86
6.5
3 (
11
)
20
15
-16
- 6
67
.73
75
14
.54
18
.42
68
65
.23
78
69
.05
-10
03
.82
16
.85
11
55
.34
(1
5)
To
tal
- 2
77
65
.79
10
4.3
5
28
396
.79
28
873
.96
7
-
(So
urc
e: U
tili
sati
on
Cer
tifi
cate
s, A
nn
ua
l A
cco
un
ts s
ub
mit
ted
by
th
e G
VK
EM
RI
an
d L
edg
er o
f th
e p
roje
ct m
ain
tain
ed b
y t
he
Mis
sio
n D
irec
tora
te,
NH
M)
7
Th
e fi
gure
in
clud
es e
xpen
ses
on M
obil
e M
edic
al U
nit
s (2
012
-13
` 6
.05
lak
h, 2
013
-14
` 5
9.81
lak
h, 2
014
-15 ` 8
2.7
3 l
akh
and
in
201
5-1
6 ` 8
3.3
0 l
akh
) th
at a
re b
ein
g ru
n b
y G
VK
EM
RI
in f
our
dist
rict
s vi
z.
Rai
sen
, V
idis
ha,
Dew
as a
nd
Seh
ore.
Th
e m
ain
ob
ject
ives
of
this
sch
eme
is t
o m
ake
pri
mar
y h
ealt
h c
are
serv
ices
ava
ilab
le i
n u
nd
er s
erv
ed
hab
itat
ions
, t
o in
crea
se t
he
acce
ss o
f im
pro
ved
rep
rod
uct
ive
and
chi
ld
hea
lth
ser
vice
s in
rem
ote
area
s et
c.
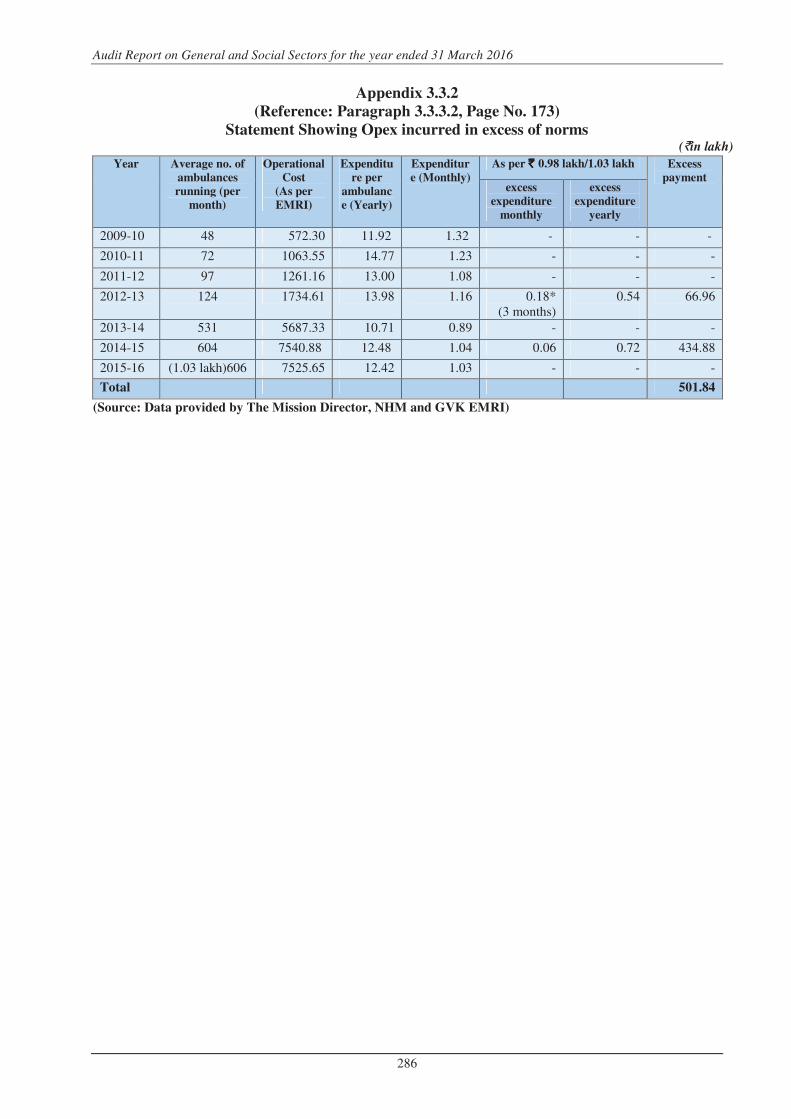
Audit Report on General and Social Sectors for the year ended 31 March 2016
286
Appendix 3.3.2
(Reference: Paragraph 3.3.3.2, Page No. 173)
Statement Showing Opex incurred in excess of norms (`in lakh)
(Source: Data provided by The Mission Director, NHM and GVK EMRI)
Year Average no. of
ambulances
running (per
month)
Operational
Cost
(As per
EMRI)
Expenditu
re per
ambulanc
e (Yearly)
Expenditur
e (Monthly)
As per ` ` ` ` 0.98 lakh/1.03 lakh Excess
payment excess
expenditure
monthly
excess
expenditure
yearly
2009-10 48 572.30 11.92 1.32 - - -
2010-11 72 1063.55 14.77 1.23 - - -
2011-12 97 1261.16 13.00 1.08 - - -
2012-13 124 1734.61 13.98 1.16 0.18* (3 months)
0.54
66.96
2013-14 531 5687.33 10.71 0.89 - - -
2014-15 604 7540.88 12.48 1.04 0.06 0.72 434.88
2015-16 (1.03 lakh)606 7525.65 12.42 1.03 - - -
Total 501.84
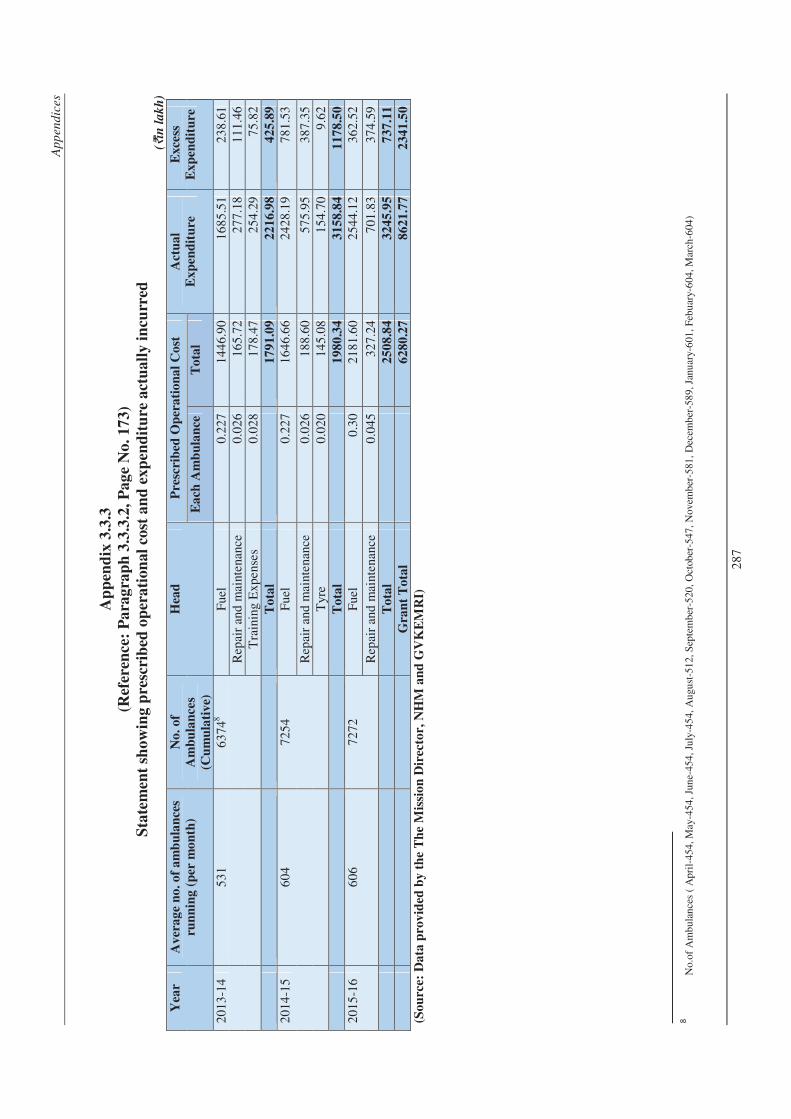
Ap
pen
dic
es
28
7
Ap
pen
dix
3.3
.3
(Ref
eren
ce:
Pa
rag
rap
h 3
.3.3
.2,
Pa
ge
No
. 1
73
)
Sta
tem
ent
sho
win
g p
resc
rib
ed o
per
ati
on
al
cost
an
d e
xp
end
itu
re a
ctu
all
y i
ncu
rred
(`
in l
ak
h)
Yea
r A
ver
ag
e n
o. o
f a
mb
ula
nce
s
run
nin
g (
per
mo
nth
)
No
. o
f
Am
bu
lan
ces
(Cu
mu
lati
ve)
Hea
d
Pre
scri
bed
Op
era
tio
na
l C
ost
A
ctu
al
Ex
pen
dit
ure
Exce
ss
Ex
pen
dit
ure
E
ach
Am
bu
lan
ce
To
tal
20
13
-14
53
1 6
37
48 F
uel
0.2
27
14
46
.90
16
85
.51
23
8.6
1 R
epai
r an
d m
aint
enan
ce
0.0
26
16
5.7
2 2
77
.18
11
1.4
6 T
rain
ing
Exp
ense
s 0
.02
8 1
78
.47
25
4.2
9 7
5.8
2
To
tal
1
79
1.0
9
22
16
.98
42
5.8
9
20
14
-15
60
4 7
25
4 F
uel
0.2
27
16
46
.66
24
28
.19
78
1.5
3
Rep
air
and
mai
nten
ance
0
.02
6 1
88
.60
57
5.9
5 3
87
.35
Tyr
e 0
.02
0 1
45
.08
15
4.7
0 9
.62
T
ota
l
19
80
.34
31
58
.84
11
78
.50
20
15
-16
60
6 7
27
2 F
uel
0.3
0 2
18
1.6
0 2
54
4.1
2 3
62
.52
Rep
air
and
mai
nten
ance
0
.04
5 3
27
.24
70
1.8
3 3
74
.59
T
ota
l
25
08
.84
32
45
.95
73
7.1
1
G
ran
t T
ota
l
62
80
.27
86
21
.77
23
41
.50
(So
urc
e: D
ata
pro
vid
ed b
y t
he
Th
e M
issi
on
Dir
ecto
r, N
HM
an
d G
VK
EM
RI)
8
No.
of A
mb
ula
nce
s (
Ap
ril-
454
, May
-454
, Jun
e-45
4, J
uly
-45
4,
Au
gust
-51
2, S
epte
mb
er-5
20, O
ctob
er-5
47,
Nov
emb
er-5
81,
Dec
emb
er-5
89,
Jan
uar
y-6
01,
Feb
uar
y-6
04, M
arch
-604
)
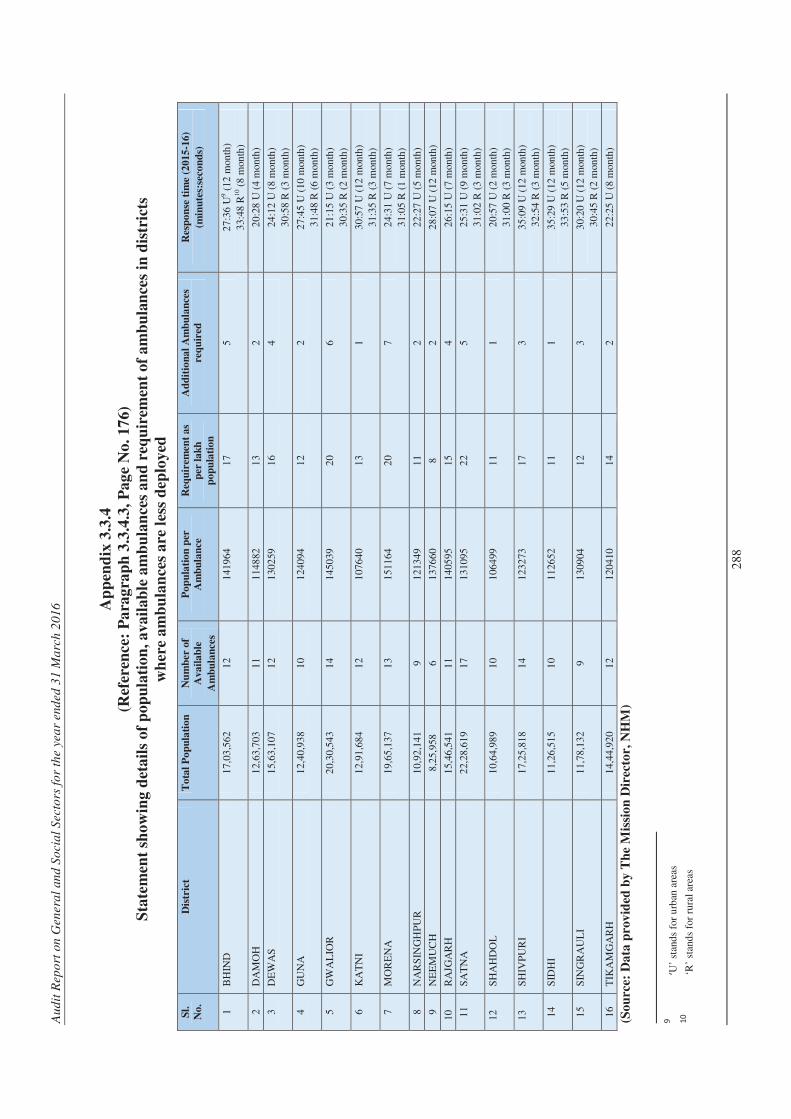
Au
dit
Rep
ort
on
Gen
era
l an
d S
ocia
l S
ecto
rs f
or
the y
ea
r end
ed
31 M
arc
h 2
01
6
28
8
Ap
pen
dix
3.3
.4
(Ref
eren
ce:
Pa
rag
rap
h 3
.3.4
.3,
Pa
ge
No
. 1
76
)
Sta
tem
ent
sho
win
g d
eta
ils
of
po
pu
lati
on
, a
va
ilab
le a
mb
ula
nce
s a
nd
req
uir
emen
t o
f a
mb
ula
nce
s in
dis
tric
ts
wh
ere
am
bu
lan
ces
are
les
s d
eplo
yed
Sl.
No
.
Dis
tric
t T
ota
l P
op
ula
tio
n
Nu
mb
er o
f
Ava
ila
ble
Am
bu
lan
ces
Po
pu
lati
on
per
Am
bu
lan
ce
Req
uir
emen
t a
s
per
la
kh
po
pu
lati
on
Ad
dit
ion
al
Am
bu
lan
ces
req
uir
ed
Res
po
nse
tim
e (2
015
-16
)
(min
ute
s:se
con
ds)
1 B
HIN
D
17,
03,5
62
12
141
964
1
7 5
27
:36
U9 (
12 m
onth
)
33
:48
R1
0 (8
mon
th)
2 D
AM
OH
1
2,63
,70
3 1
1 1
148
82
13
2 2
0:2
8 U
(4
mon
th)
3 D
EW
AS
1
5,63
,10
7 1
2 1
302
59
16
4 2
4:1
2 U
(8
mon
th)
30
:58
R (
3 m
onth
)
4 G
UN
A
12,
40,9
38
10
124
094
1
2 2
27
:45
U (
10 m
onth
)
31
:48
R (
6 m
onth
)
5 G
WA
LIO
R
20,
30,5
43
14
145
039
2
0 6
21
:15
U (
3 m
onth
)
30
:35
R (
2 m
onth
)
6 K
AT
NI
12,
91,6
84
12
107
640
1
3 1
30
:57
U (
12 m
onth
)
31
:35
R (
3 m
onth
)
7 M
OR
EN
A
19,
65,1
37
13
151
164
2
0 7
24
:31
U (
7 m
onth
)
31
:05
R (
1 m
onth
)
8 N
AR
SIN
GH
PU
R
10,
92,1
41
9 1
213
49
11
2 2
2:2
7 U
(5
mon
th)
9 N
EE
MU
CH
8
,25,
958
6 1
376
60
8 2
28
:07
U (
12 m
onth
)
10
RA
JGA
RH
1
5,46
,54
1 1
1 1
405
95
15
4 2
6:1
5 U
(7
mon
th)
11
SA
TN
A
22,
28,6
19
17
131
095
2
2 5
25
:31
U (
9 m
onth
)
31
:02
R (
3 m
onth
)
12
SH
AH
DO
L
10,
64,9
89
10
106
499
1
1 1
20
:57
U (
2 m
onth
)
31
:00
R (
3 m
onth
)
13
SH
IVP
UR
I 1
7,25
,81
8 1
4 1
232
73
17
3 3
5:0
9 U
(12
mon
th)
32
:54
R (
3 m
onth
)
14
SID
HI
11,
26,5
15
10
112
652
1
1 1
35
:29
U (
12 m
onth
)
33
:53
R (
5 m
onth
)
15
SIN
GR
AU
LI
11,
78,1
32
9 1
309
04
12
3 3
0:2
0 U
(12
mon
th)
30
:45
R (
2 m
onth
)
16
TIK
AM
GA
RH
1
4,44
,92
0 1
2 1
204
10
14
2 2
2:2
5 U
(8
mon
th)
(So
urc
e: D
ata
pro
vid
ed b
y T
he
Mis
sio
n D
irec
tor,
NH
M)
9
‘U’
stan
ds
for
urb
an a
reas
1
0
‘R’
stan
ds
for
rura
l ar
eas
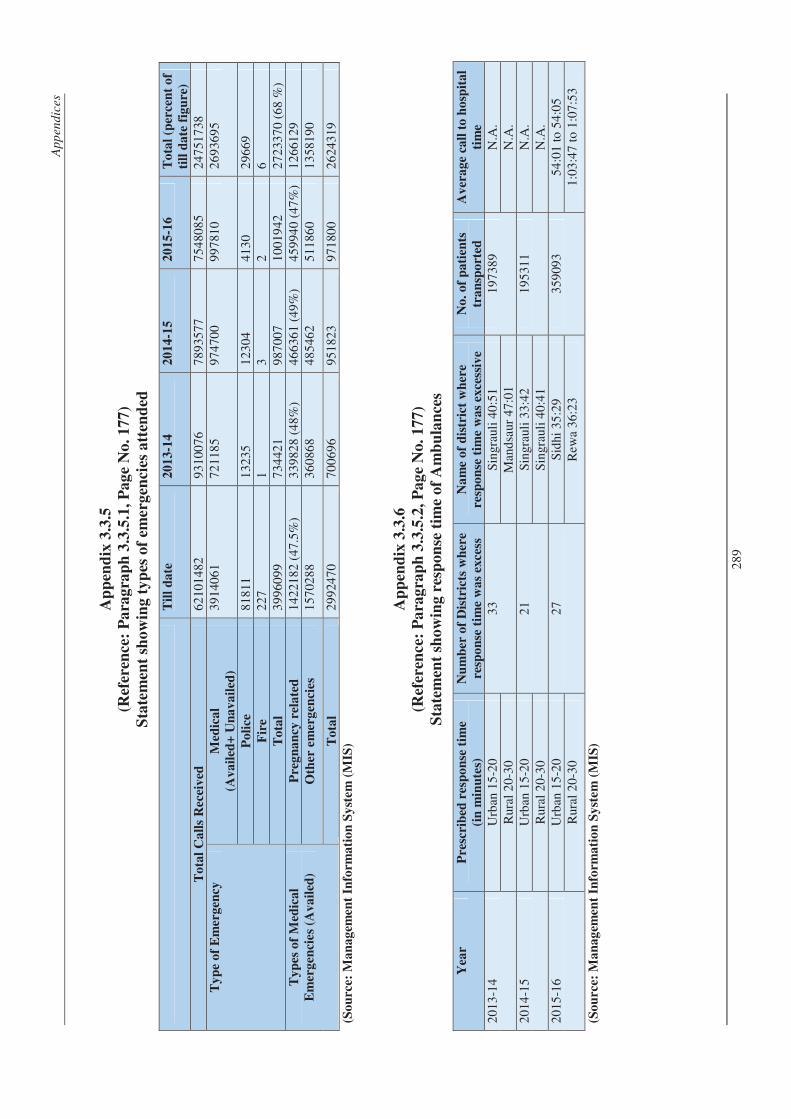
Ap
pen
dic
es
28
9
Ap
pen
dix
3.3
.5
(Ref
eren
ce:
Pa
rag
rap
h 3
.3.5
.1,
Pa
ge
No
. 1
77
)
Sta
tem
ent
sho
win
g t
yp
es o
f em
erg
enci
es a
tten
ded
T
ill
da
te
20
13-1
4
20
14-1
5
20
15-1
6
To
tal
(per
cen
t o
f
till
da
te f
igu
re)
To
tal
Ca
lls
Rec
eiv
ed
62
101
482
9
31
007
6 7
89
357
7 7
54
808
5 2
47
517
38
Ty
pe
of
Em
erg
ency
M
edic
al
(Av
ail
ed+
Un
av
ail
ed)
39
140
61
72
118
5 9
74
700
99
781
0 2
69
369
5
Po
lice
8
18
11
13
235
1
23
04
41
30
29
669
F
ire
22
7 1
3
2
6
T
ota
l 3
99
609
9 7
34
421
98
700
7 1
00
194
2 2
72
337
0 (
68
%)
Ty
pes
of
Med
ica
l
Em
erg
enci
es
(Av
ail
ed)
Pre
gn
an
cy r
ela
ted
1
42
218
2 (
47.
5%
) 3
39
828
(4
8%
) 4
66
361
(4
9%
) 4
59
940
(4
7%
) 1
26
612
9 O
ther
em
erg
enci
es
15
702
88
36
086
8 4
85
462
51
186
0 1
35
819
0
To
tal
29
924
70
70
069
6 9
51
823
97
180
0 2
62
431
9 (S
ou
rce:
Ma
na
gem
ent
Info
rma
tio
n S
yst
em
(M
IS)
Ap
pen
dix
3.3
.6
(Ref
eren
ce:
Pa
rag
rap
h 3
.3.5
.2,
Pa
ge
No
. 1
77
)
Sta
tem
ent
sho
win
g r
esp
on
se t
ime
of
Am
bu
lan
ces
Yea
r P
resc
rib
ed r
esp
on
se t
ime
(in
min
ute
s)
Nu
mb
er o
f D
istr
icts
wh
ere
resp
on
se t
ime
wa
s ex
cess
Na
me
of
dis
tric
t w
her
e
resp
on
se t
ime
wa
s ex
cess
ive
No
. o
f p
ati
ents
tra
nsp
ort
ed
Av
era
ge
call
to
ho
spit
al
tim
e
20
13
-14
Urb
an 1
5-2
0
33
Sin
grau
li 4
0:5
1 1
97
389
N.A
. R
ural
20
-30
M
and
saur
47
:01
N.A
. 2
01
4-1
5 U
rban
15
-20
2
1 S
ingr
auli
33
:42
19
531
1 N
.A.
Rur
al 2
0-3
0
Sin
grau
li 4
0:4
1 N
.A.
20
15
-16
Urb
an 1
5-2
0
27
Sid
hi 3
5:2
9
35
909
3 5
4:0
1 t
o 5
4:0
5 R
ural
20
-30
R
ewa
36
:23
1:0
3:4
7 to
1:0
7:5
3
(So
urc
e: M
an
ag
emen
t In
form
ati
on
Sy
stem
(M
IS)
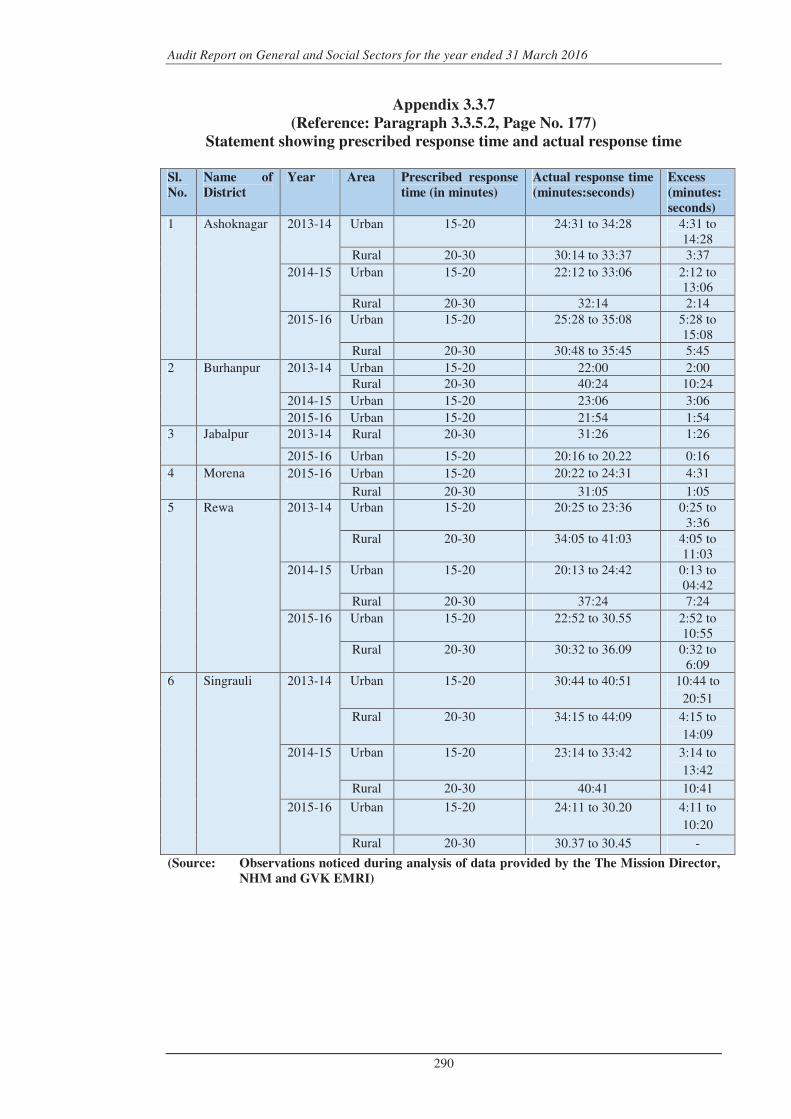
Audit Report on General and Social Sectors for the year ended 31 March 2016
290
Appendix 3.3.7
(Reference: Paragraph 3.3.5.2, Page No. 177)
Statement showing prescribed response time and actual response time
Sl.
No.
Name of
District
Year Area Prescribed response
time (in minutes)
Actual response time
(minutes:seconds)
Excess
(minutes:
seconds)
1 Ashoknagar 2013-14 Urban 15-20 24:31 to 34:28 4:31 to 14:28
Rural 20-30 30:14 to 33:37 3:37
2014-15 Urban 15-20 22:12 to 33:06 2:12 to 13:06
Rural 20-30 32:14 2:14 2015-16 Urban 15-20 25:28 to 35:08 5:28 to
15:08 Rural 20-30 30:48 to 35:45 5:45
2 Burhanpur 2013-14 Urban 15-20 22:00 2:00 Rural 20-30 40:24 10:24
2014-15 Urban 15-20 23:06 3:06
2015-16 Urban 15-20 21:54 1:54 3 Jabalpur 2013-14 Rural 20-30 31:26 1:26
2015-16 Urban 15-20 20:16 to 20.22 0:16
4 Morena 2015-16 Urban 15-20 20:22 to 24:31 4:31
Rural 20-30 31:05 1:05 5 Rewa 2013-14 Urban 15-20 20:25 to 23:36 0:25 to
3:36 Rural 20-30 34:05 to 41:03 4:05 to
11:03 2014-15 Urban 15-20 20:13 to 24:42 0:13 to
04:42 Rural 20-30 37:24 7:24
2015-16 Urban 15-20 22:52 to 30.55 2:52 to 10:55
Rural 20-30 30:32 to 36.09 0:32 to 6:09
6 Singrauli 2013-14 Urban 15-20 30:44 to 40:51 10:44 to
20:51
Rural 20-30 34:15 to 44:09 4:15 to
14:09
2014-15 Urban 15-20 23:14 to 33:42 3:14 to
13:42
Rural 20-30 40:41 10:41
2015-16 Urban 15-20 24:11 to 30.20 4:11 to
10:20
Rural 20-30 30.37 to 30.45 -
(Source: Observations noticed during analysis of data provided by the The Mission Director,
NHM and GVK EMRI)
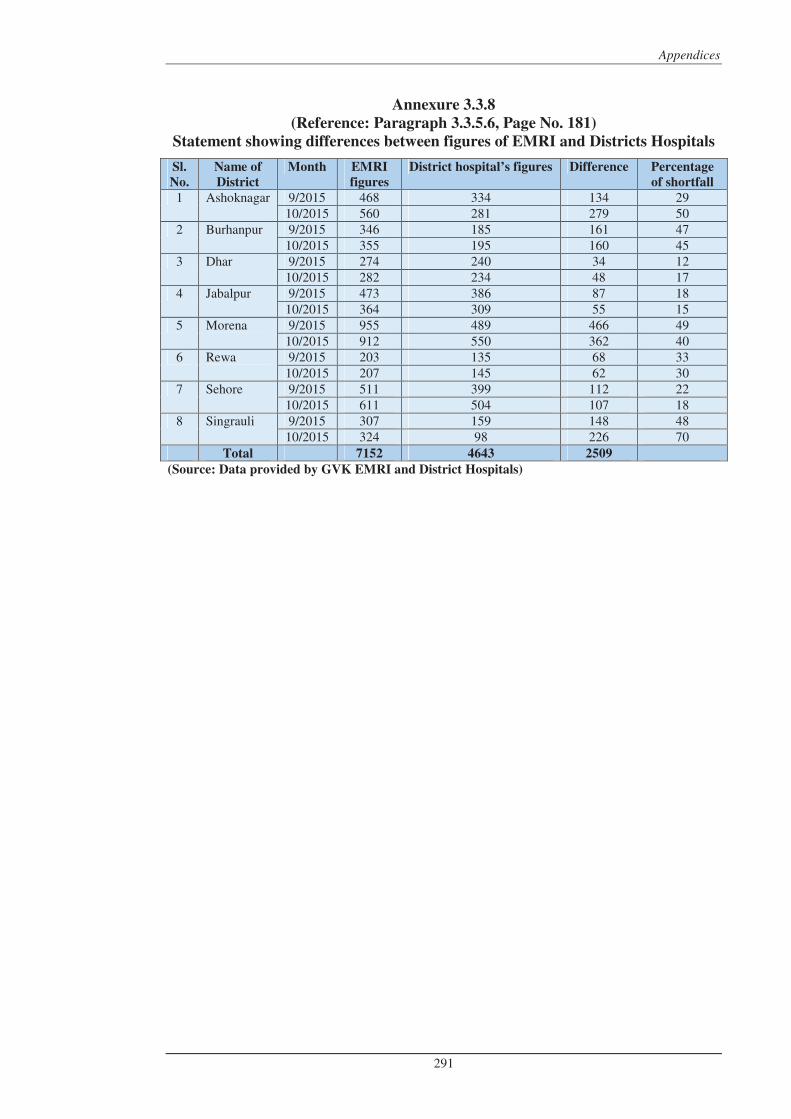
Appendices
291
Annexure 3.3.8
(Reference: Paragraph 3.3.5.6, Page No. 181)
Statement showing differences between figures of EMRI and Districts Hospitals
Sl.
No.
Name of
District
Month EMRI
figures
District hospital’s figures Difference Percentage
of shortfall
1 Ashoknagar 9/2015 468 334 134 29 10/2015 560 281 279 50
2 Burhanpur 9/2015 346 185 161 47 10/2015 355 195 160 45
3 Dhar 9/2015 274 240 34 12 10/2015 282 234 48 17
4 Jabalpur 9/2015 473 386 87 18 10/2015 364 309 55 15
5 Morena 9/2015 955 489 466 49 10/2015 912 550 362 40
6 Rewa 9/2015 203 135 68 33 10/2015 207 145 62 30
7 Sehore 9/2015 511 399 112 22 10/2015 611 504 107 18
8 Singrauli 9/2015 307 159 148 48 10/2015 324 98 226 70
Total 7152 4643 2509
(Source: Data provided by GVK EMRI and District Hospitals)

Au
dit
Rep
ort
on
Gen
era
l an
d S
ocia
l S
ecto
rs f
or
the y
ea
r end
ed
31 M
arc
h 2
01
6
29
2
Ap
pen
dix
3.4
.1
(Ref
eren
ce:
Pa
ra 3
.4.5
.4,
Pa
ge
No
. 1
90
)
Sta
tus
of
esse
nti
al
reco
rd
s o
f em
plo
ym
ent
gen
era
tio
n a
nd
ass
et c
rea
tio
n i
n t
he
test
ch
eck
ed G
ram
Pa
nch
ay
ts
Sl
No
.
Na
me
of
Gra
m
Pa
nch
ay
at
Jo
b C
ard
Reg
iste
r E
mp
loy
men
t R
egis
ter
Wo
rk R
egis
ter
Ass
ets
Reg
iste
r
Insp
ecti
on
Reg
iste
r
Ma
inta
ined
U
pd
ate
d
Ma
inta
ined
U
pd
ate
d
Ma
inta
ined
U
pd
ate
d
Ma
inta
ined
U
pd
ate
d
Ma
inta
ined
U
pd
ate
d
(1)
(2)
(3)
(4)
(5)
(6)
(7)
(8)
(9)
(10
) (1
1)
(12
)
1.
Arr
on
×
×
×
×
×
2.
Naw
ani
×
×
×
×
×
3.
Kan
bar
a ×
×
×
×
×
4.
Kho
rib
eri
×
×
×
×
×
5.
Bha
lew
ada
×
×
×
×
×
6.
Nai
tra
×
×
×
×
×
7.
Mo
hgao
nk
hurd
×
×
×
×
×
8.
Pat
hri
×
×
×
×
×
9.
Kha
irla
nji
×
×
×
×
×
10
. S
elo
tpur
×
×
×
×
×
11
. S
avaj
pan
i
×
×
×
×
×
12
. C
hha
bri
×
×
×
×
×
13
. D
uka
rjhe
la
×
×
×
×
×
14
. N
and
evan
i
×
×
×
×
×
15
Su
khap
ura
×
×
×
×
×
16
. S
ejw
ada
×
×
×
×
×
17
Bil
asp
ur
×
×
×
×
×
18
. K
anjo
li
×
×
×
×
×
19
. M
aith
anap
ahuj
×
×
×
×
×
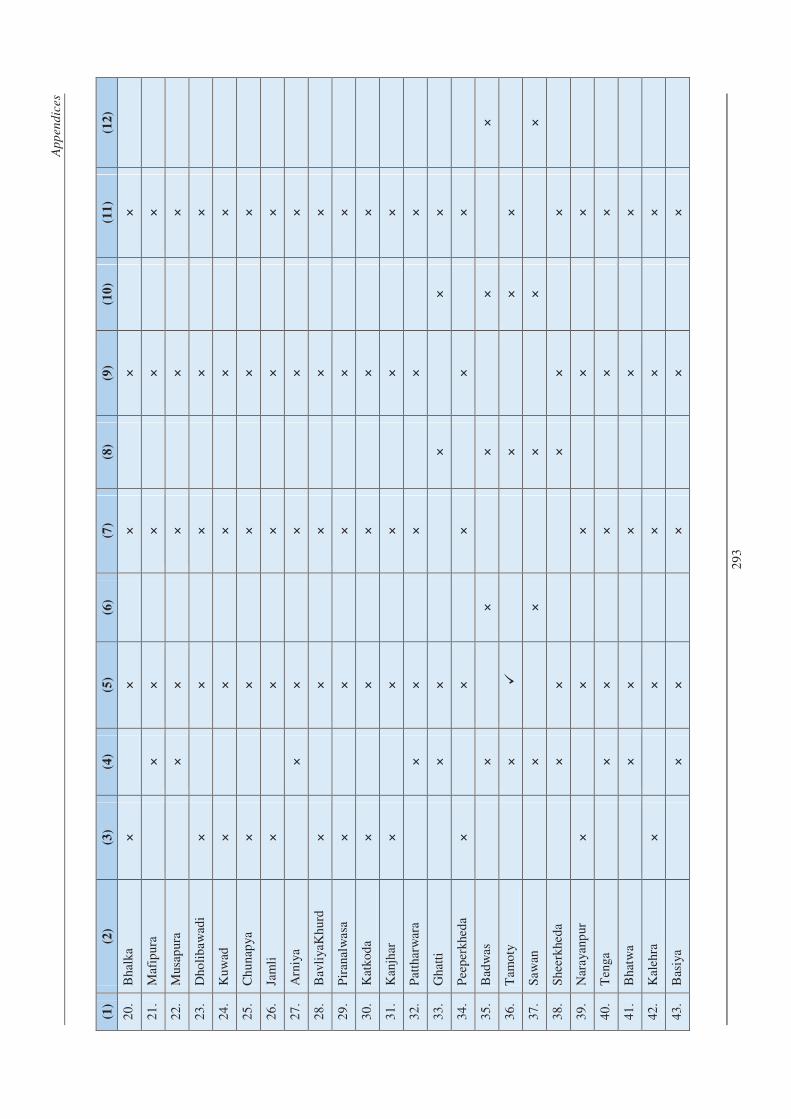
Ap
pen
dic
es
29
3
(1)
(2)
(3)
(4)
(5)
(6)
(7)
(8)
(9)
(10
) (1
1)
(12
)
20
. B
halk
a ×
×
×
×
×
21
. M
afip
ura
×
×
×
×
×
22
. M
usap
ura
×
×
×
×
×
23
. D
holi
baw
adi
×
×
×
×
×
24
. K
uw
ad
×
×
×
×
×
25
. C
hu
nap
ya
×
×
×
×
×
26
. Ja
mli
×
×
×
×
×
27
. A
rniy
a
×
×
×
×
×
28
. B
avli
yaK
hur
d
×
×
×
×
×
29
. P
iran
alw
asa
×
×
×
×
×
30
. K
atko
da
×
×
×
×
×
31
. K
anjh
ar
×
×
×
×
×
32
. P
atth
arw
ara
×
×
×
×
×
33
. G
hatt
i
×
×
×
×
×
34
. P
eep
erkh
eda
×
×
×
×
×
35
. B
adw
as
×
×
×
×
×
36
. T
amo
ty
×
�
×
×
×
37
. S
awan
×
×
×
×
×
38
. S
heer
khe
da
×
×
×
×
×
39
. N
aray
anp
ur
×
×
×
×
×
40
. T
enga
×
×
×
×
×
41
. B
hatw
a
×
×
×
×
×
42
. K
aleh
ra
×
×
×
×
×
43
. B
asiy
a
×
×
×
×
×
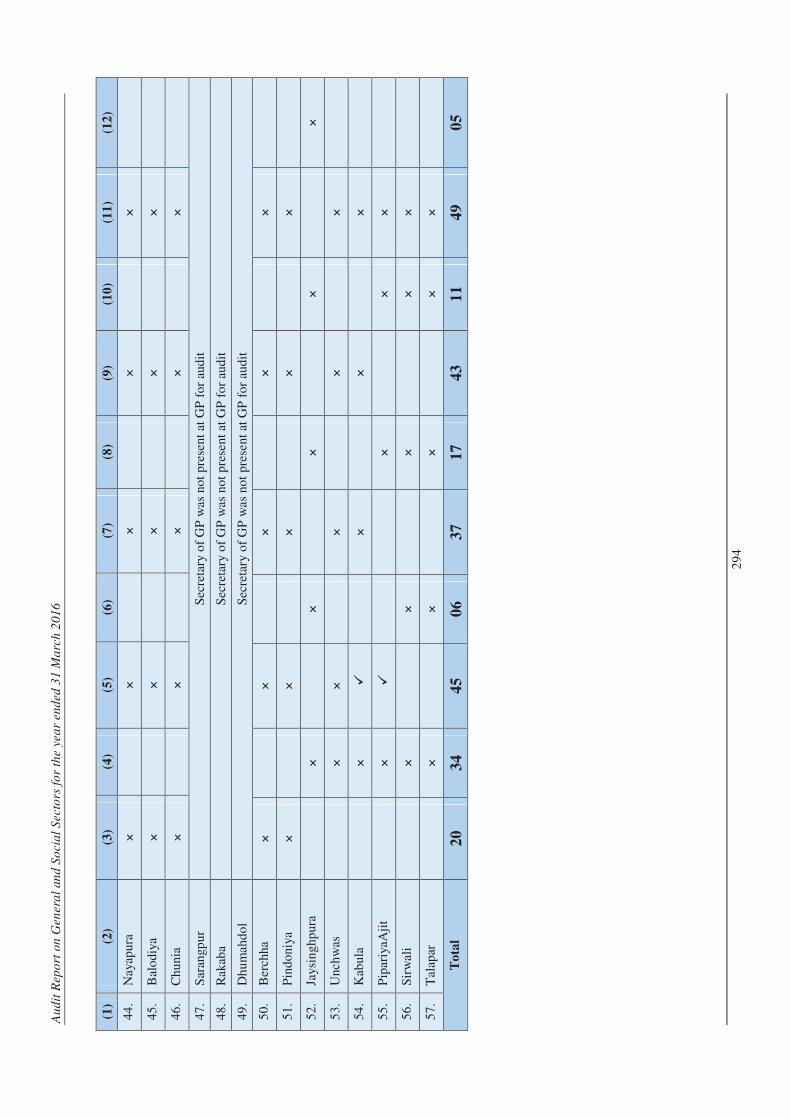
Au
dit
Rep
ort
on
Gen
era
l an
d S
ocia
l S
ecto
rs f
or
the y
ea
r end
ed
31 M
arc
h 2
01
6
29
4
(1)
(2)
(3)
(4)
(5)
(6)
(7)
(8)
(9)
(10
) (1
1)
(12
)
44
. N
ayap
ura
×
×
×
×
×
45
. B
alo
diy
a ×
×
×
×
×
46
. C
hu
nia
×
×
×
×
×
47
. S
aran
gpur
S
ecre
tary
of
GP
was
no
t p
rese
nt a
t G
P f
or
aud
it
48
. R
akab
a S
ecre
tary
of
GP
was
no
t p
rese
nt a
t G
P f
or
aud
it
49
. D
hu
mah
do
l S
ecre
tary
of
GP
was
no
t p
rese
nt a
t G
P f
or
aud
it
50
. B
erch
ha
×
×
×
×
×
51
. P
ind
oni
ya
×
×
×
×
×
52
. Ja
ysin
ghp
ura
×
×
×
×
×
53
. U
nch
was
×
×
×
×
×
54
. K
abul
a
×
�
×
×
×
55
. P
ipar
iyaA
jit
×
�
×
×
×
56
. S
irw
ali
×
×
×
×
×
57
. T
alap
ar
×
×
×
×
×
To
tal
20
3
4
45
0
6
37
1
7
43
1
1
49
0
5
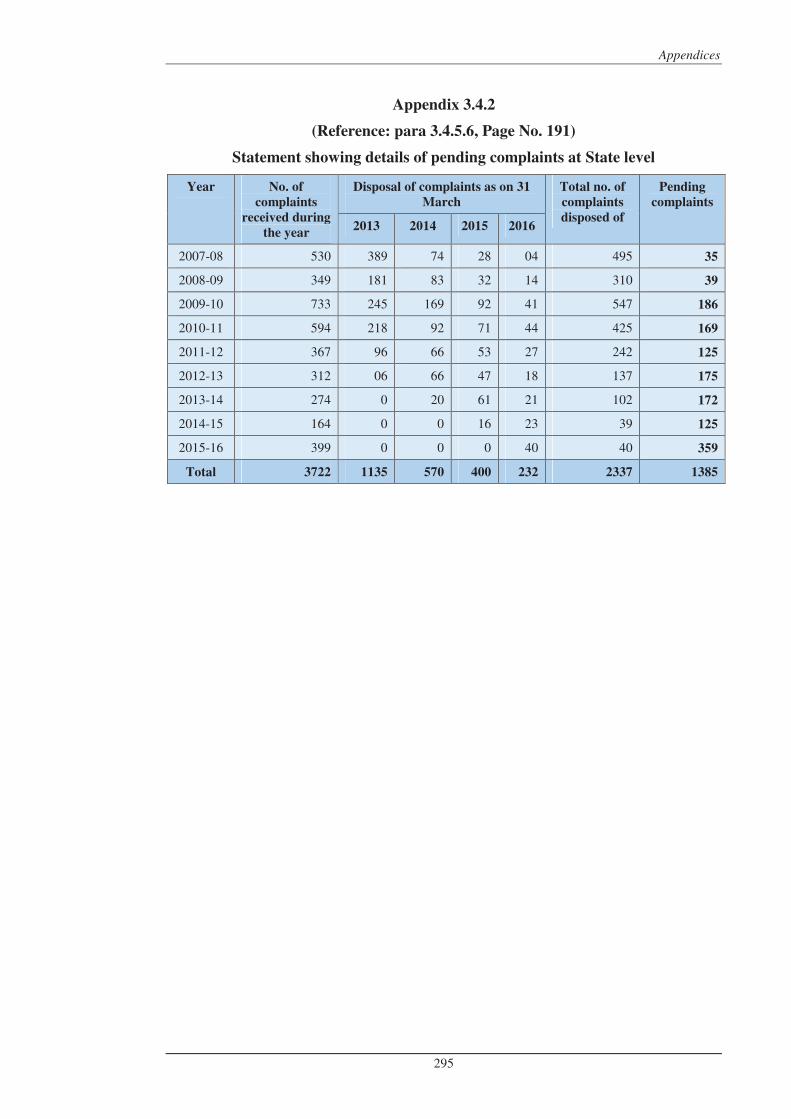
Appendices
295
Appendix 3.4.2
(Reference: para 3.4.5.6, Page No. 191)
Statement showing details of pending complaints at State level
Year No. of
complaints
received during
the year
Disposal of complaints as on 31
March
Total no. of
complaints
disposed of
Pending
complaints
2013 2014 2015 2016
2007-08 530 389 74 28 04 495 35
2008-09 349 181 83 32 14 310 39
2009-10 733 245 169 92 41 547 186
2010-11 594 218 92 71 44 425 169
2011-12 367 96 66 53 27 242 125
2012-13 312 06 66 47 18 137 175
2013-14 274 0 20 61 21 102 172
2014-15 164 0 0 16 23 39 125
2015-16 399 0 0 0 40 40 359
Total 3722 1135 570 400 232 2337 1385
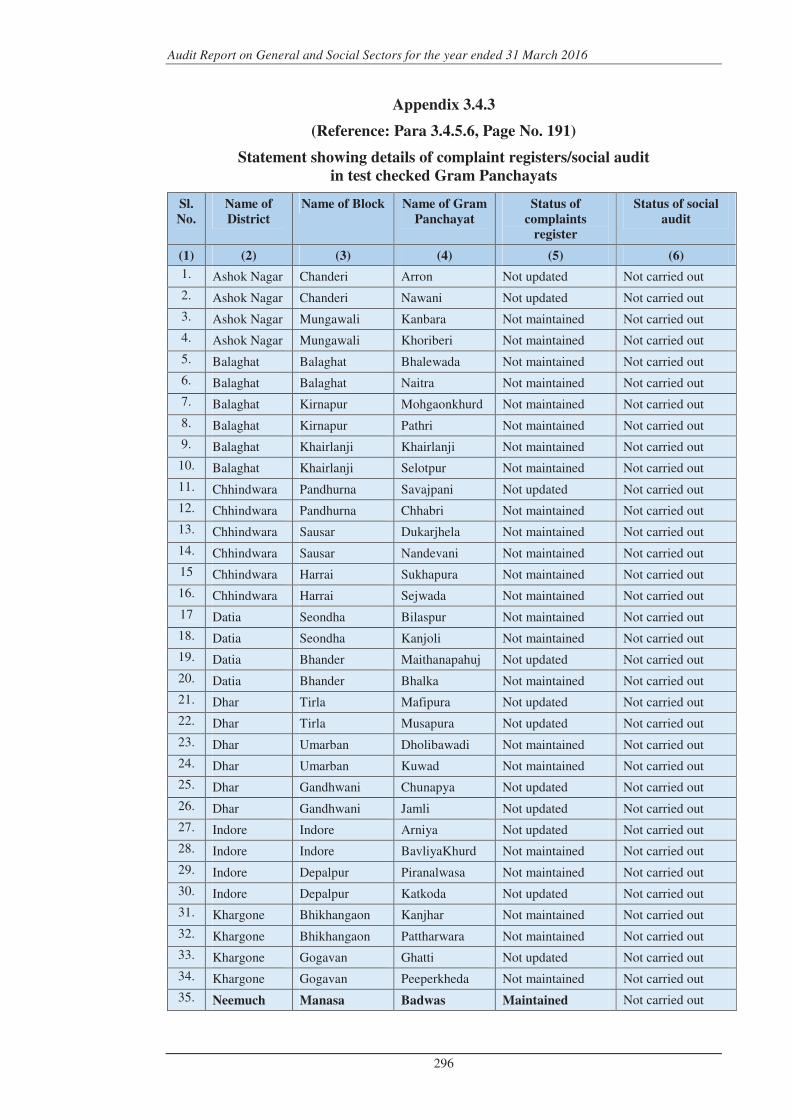
Audit Report on General and Social Sectors for the year ended 31 March 2016
296
Appendix 3.4.3
(Reference: Para 3.4.5.6, Page No. 191)
Statement showing details of complaint registers/social audit
in test checked Gram Panchayats
Sl.
No.
Name of
District
Name of Block Name of Gram
Panchayat
Status of
complaints
register
Status of social
audit
(1) (2) (3) (4) (5) (6)
1. Ashok Nagar Chanderi Arron Not updated Not carried out
2. Ashok Nagar Chanderi Nawani Not updated Not carried out
3. Ashok Nagar Mungawali Kanbara Not maintained Not carried out
4. Ashok Nagar Mungawali Khoriberi Not maintained Not carried out
5. Balaghat Balaghat Bhalewada Not maintained Not carried out
6. Balaghat Balaghat Naitra Not maintained Not carried out
7. Balaghat Kirnapur Mohgaonkhurd Not maintained Not carried out
8. Balaghat Kirnapur Pathri Not maintained Not carried out
9. Balaghat Khairlanji Khairlanji Not maintained Not carried out
10. Balaghat Khairlanji Selotpur Not maintained Not carried out
11. Chhindwara Pandhurna Savajpani Not updated Not carried out
12. Chhindwara Pandhurna Chhabri Not maintained Not carried out
13. Chhindwara Sausar Dukarjhela Not maintained Not carried out
14. Chhindwara Sausar Nandevani Not maintained Not carried out
15 Chhindwara Harrai Sukhapura Not maintained Not carried out
16. Chhindwara Harrai Sejwada Not maintained Not carried out
17 Datia Seondha Bilaspur Not maintained Not carried out
18. Datia Seondha Kanjoli Not maintained Not carried out
19. Datia Bhander Maithanapahuj Not updated Not carried out
20. Datia Bhander Bhalka Not maintained Not carried out
21. Dhar Tirla Mafipura Not updated Not carried out
22. Dhar Tirla Musapura Not updated Not carried out
23. Dhar Umarban Dholibawadi Not maintained Not carried out
24. Dhar Umarban Kuwad Not maintained Not carried out
25. Dhar Gandhwani Chunapya Not updated Not carried out
26. Dhar Gandhwani Jamli Not updated Not carried out
27. Indore Indore Arniya Not updated Not carried out
28. Indore Indore BavliyaKhurd Not maintained Not carried out
29. Indore Depalpur Piranalwasa Not maintained Not carried out
30. Indore Depalpur Katkoda Not updated Not carried out
31. Khargone Bhikhangaon Kanjhar Not maintained Not carried out
32. Khargone Bhikhangaon Pattharwara Not maintained Not carried out
33. Khargone Gogavan Ghatti Not updated Not carried out
34. Khargone Gogavan Peeperkheda Not maintained Not carried out
35. Neemuch Manasa Badwas Maintained Not carried out
Appendices
297
(1) (2) (3) (4) (5) (6)
36. Neemuch Manasa Tamoty Not maintained Not carried out
37. Neemuch Neemuch Sawan Not maintained Not carried out
38. Neemuch Neemuch Sheerkheda Not maintained Not carried out
39. Satna Ram Nagar Narayanpur Not updated Not carried out
40. Satna Ram Nagar Tenga Not updated Not carried out
41. Satna Majhgawan Bhatwa Not maintained Not carried out
42. Satna Majhgawan Kalehra Not maintained Not carried out
43. Sehore Sehore Sheelkheda Records of GP were seized for enquiry hence follow up audit could not be carried out.
44. Sehore Sehore Basiya Not maintained Not carried out
45. Sehore Ichhawar Nayapura Not updated Not carried out
46. Sehore Ichhawar Balodiya Maintained Not carried out
47. Shahdol Sohagpur Chunia Not maintained Not carried out
48. Shahdol Sohagpur Sarangpur Secretary of GP was not present at GP for audit
49. Shahdol Budhar Rakaba Secretary of GP was not present at GP for audit
50. Shahdol Budhar Dhumahdol Secretary of GP was not present at GP for audit
51. Shajapur Shajapur Berchha Not maintained Not carried out
52. Shajapur Shajapur Pindoniya Not maintained Not carried out
53. Shajapur Badod Jaysinghpura Maintained Not carried out
54. Shajapur Badod Unchwas Maintained Not carried out
55. Vidisha Vidisha Kabula Not maintained Not carried out
56. Vidisha Vidisha PipariyaAjit Not maintained Not carried out
57. Vidisha Kurwai Sirwali Not updated Not carried out
58. Vidisha Kurwai Talapar Not updated Not carried out
Total 34 (Not maintained)
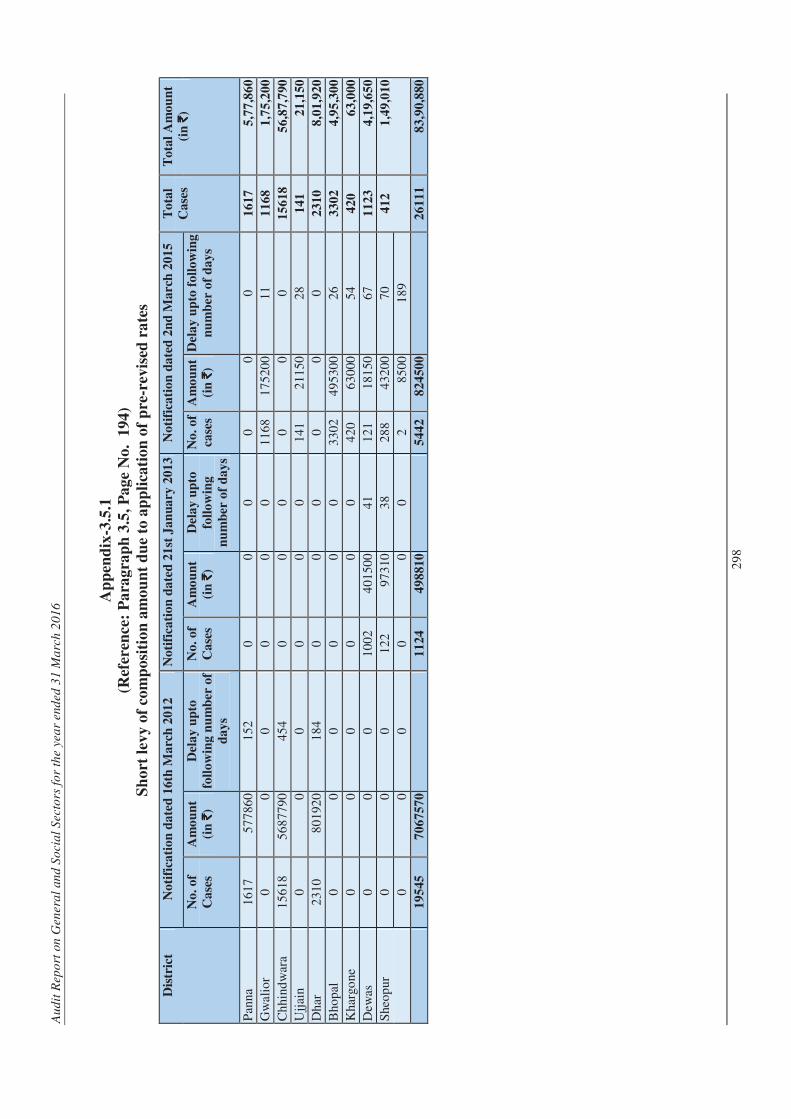
Au
dit
Rep
ort
on
Gen
era
l an
d S
ocia
l S
ecto
rs f
or
the y
ea
r end
ed
31 M
arc
h 2
01
6
29
8
Ap
pen
dix
-3.5
.1
(Ref
eren
ce:
Pa
rag
rap
h 3
.5,
Pa
ge N
o.
19
4)
Sh
ort
lev
y o
f co
mp
osi
tio
n a
mo
un
t d
ue
to a
pp
lica
tio
n o
f p
re-r
evis
ed r
ate
s
Dis
tric
t N
oti
fica
tio
n d
ate
d 1
6th
Ma
rch
20
12
No
tifi
cati
on
da
ted
21
st J
an
ua
ry 2
01
3
No
tifi
cati
on
da
ted
2n
d M
arc
h 2
01
5
To
tal
Ca
ses
To
tal
Am
ou
nt
(in
`̀̀̀)
No
. o
f
Ca
ses
Am
ou
nt
(in
`̀̀̀)
Del
ay
up
to
foll
ow
ing
nu
mb
er o
f
da
ys
No
. o
f
Ca
ses
Am
ou
nt
(in
`̀̀̀)
Del
ay
up
to
foll
ow
ing
nu
mb
er o
f d
ay
s
No
. o
f
case
s
Am
ou
nt
(in
`̀̀̀)
Del
ay
up
to f
oll
ow
ing
nu
mb
er o
f d
ay
s
Pan
na
16
17
57
786
0 1
52
0
0
0
0
0
0
16
17
5,7
7,8
60
Gw
alio
r 0
0
0
0
0
0
1
16
8 1
75
200
11
11
68
1,7
5,2
00
Ch
hind
war
a 1
56
18
56
877
90
45
4 0
0
0
0
0
0
1
56
18
56
,87,7
90
Ujj
ain
0
0
0
0
0
0
14
1 2
11
50
28
14
1
21
,150
Dha
r 2
31
0 8
01
920
18
4 0
0
0
0
0
0
2
31
0
8,0
1,9
20
Bho
pal
0
0
0
0
0
0
3
30
2 4
95
300
26
33
02
4,9
5,3
00
Kha
rgo
ne
0
0
0
0
0
0
42
0 6
30
00
54
42
0
63
,000
Dew
as
0
0
0
10
02
40
150
0 4
1 1
21
18
150
6
7 1
12
3
4,1
9,6
50
She
op
ur
0
0
0
12
2 9
73
10
38
28
8 4
32
00
70
41
2
1,4
9,0
10
0
0
0
0
0
0
2
8
50
0 1
89
1
95
45
70
675
70
1
12
4
49
881
0
54
42
82
450
0
2
61
11
83
,90,8
80
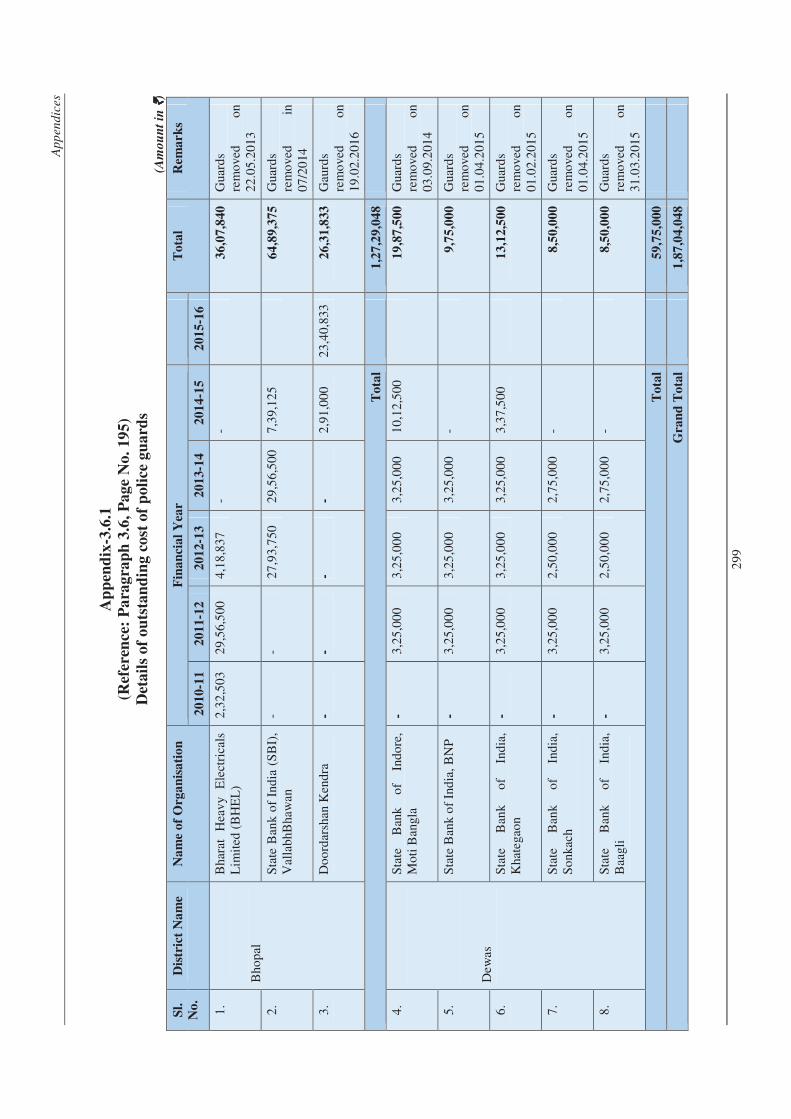
Ap
pen
dic
es
29
9
Ap
pen
dix
-3.6
.1
(Ref
eren
ce:
Pa
rag
rap
h 3
.6,
Pa
ge N
o.
19
5)
Det
ail
s o
f o
uts
tan
din
g c
ost
of
po
lice
gu
ard
s (A
mo
un
t in
`̀̀̀)
Sl.
No
.
Dis
tric
t N
am
e
Na
me
of
Org
an
isa
tio
n
Fin
an
cia
l Y
ear
T
ota
l R
em
ark
s
20
10-1
1
20
11-1
2
20
12-1
3
20
13-1
4
20
14-1
5
20
15-1
6
1.
Bho
pal
Bha
rat
Hea
vy
Ele
ctri
cals
L
imit
ed (
BH
EL
) 2
,32
,50
3 2
9,5
6,5
00
4,1
8,8
37
- -
3
6,0
7,8
40
Gua
rds
rem
ove
d
on
2
2.0
5.2
013
2.
Sta
te B
ank
of
Ind
ia (
SB
I),
Val
lab
hBha
wan
-
- 2
7,9
3,7
50
29
,56,
500
7
,39
,12
5
64
,89,3
75
Gua
rds
rem
ove
d
in
07
/20
14
3.
Do
ord
arsh
an K
end
ra
- -
- -
2,9
1,0
00
23
,40,
833
2
6,3
1,8
33
Gau
rds
rem
ove
d
on
1
9.0
2.2
016
To
tal
1
,27
,29
,04
8
4.
Dew
as
Sta
te
Ban
k o
f In
do
re,
Mo
ti B
angl
a -
3,2
5,0
00
3,2
5,0
00
3,2
5,0
00
10
,12,
500
19
,87,5
00
Gua
rds
rem
ove
d
on
0
3.0
9.2
014
5.
Sta
te B
ank
of
Ind
ia,
BN
P
- 3
,25
,00
0 3
,25
,00
0 3
,25
,00
0 -
9
,75
,00
0
Gua
rds
rem
ove
d
on
0
1.0
4.2
015
6.
Sta
te
Ban
k o
f In
dia
, K
hate
gao
n
- 3
,25
,00
0 3
,25
,00
0 3
,25
,00
0 3
,37
,50
0
13
,12,5
00
Gua
rds
rem
ove
d
on
0
1.0
2.2
015
7.
Sta
te
Ban
k o
f In
dia
, S
onk
ach
-
3,2
5,0
00
2,5
0,0
00
2,7
5,0
00
-
8,5
0,0
00
Gua
rds
rem
ove
d
on
0
1.0
4.2
015
8.
Sta
te
Ban
k o
f In
dia
, B
aagl
i -
3,2
5,0
00
2,5
0,0
00
2,7
5,0
00
-
8,5
0,0
00
Gua
rds
rem
ove
d
on
3
1.0
3.2
015
To
tal
5
9,7
5,0
00
Gra
nd
To
tal
1
,87
,04
,04
8
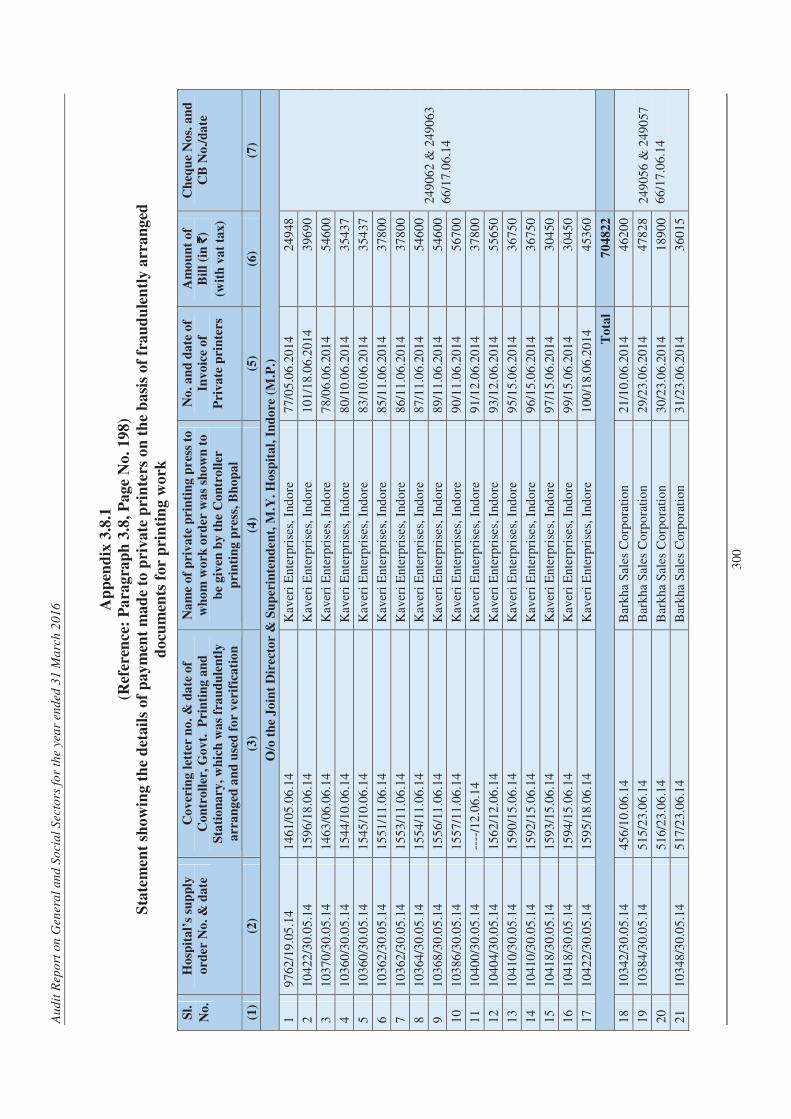
Au
dit
Rep
ort
on
Gen
era
l an
d S
ocia
l S
ecto
rs f
or
the y
ea
r end
ed
31 M
arc
h 2
01
6
30
0
Ap
pen
dix
3.8
.1
(Ref
eren
ce:
Pa
rag
rap
h 3
.8,
Pa
ge N
o.
19
8)
Sta
tem
ent
sho
win
g t
he
det
ail
s o
f p
ay
men
t m
ad
e to
pri
va
te p
rin
ters
on
th
e b
asi
s o
f fr
au
du
len
tly
arr
an
ged
do
cum
ents
fo
r p
rin
tin
g w
ork
Sl.
No
.
Ho
spit
al’
s su
pp
ly
ord
er N
o.
& d
ate
Co
ver
ing
let
ter
no
. &
da
te o
f
Co
ntr
oll
er,
Go
vt.
P
rin
tin
g a
nd
Sta
tio
na
ry, w
hic
h w
as
fra
ud
ule
ntl
y
arr
an
ged
an
d u
sed
fo
r v
erif
ica
tio
n
Na
me
of
pri
va
te p
rin
tin
g p
res
s to
wh
om
wo
rk o
rder
wa
s sh
ow
n t
o
be
giv
en b
y t
he
Co
ntr
oll
er
pri
nti
ng
pre
ss,
Bh
op
al
No
. a
nd
da
te o
f
Inv
oic
e o
f
Pri
va
te p
rin
ters
Am
ou
nt
of
Bil
l (i
n `̀̀̀
)
(wit
h v
at
tax)
Ch
equ
e N
os.
an
d
CB
No
./d
ate
(1)
(2)
(3)
(4)
(5)
(6)
(7)
O/o
th
e J
oin
t D
irec
tor
& S
up
erin
ten
den
t, M
.Y. H
osp
ita
l, I
nd
ore
(M
.P.)
1
97
62
/19
.05
.14
14
61
/05
.06
.14
Kav
eri
Ent
erp
rise
s, I
ndo
re
77
/05
.06
.20
14
24
948
24
906
2 &
24
906
3
66
/17
.06
.14
2
10
422
/30
.05
.14
15
96
/18
.06
.14
Kav
eri
Ent
erp
rise
s, I
ndo
re
10
1/1
8.0
6.2
014
3
96
90
3
10
370
/30
.05
.14
14
63
/06
.06
.14
Kav
eri
Ent
erp
rise
s, I
ndo
re
78
/06
.06
.20
14
54
600
4
10
360
/30
.05
.14
15
44
/10
.06
.14
Kav
eri
Ent
erp
rise
s, I
ndo
re
80
/10
.06
.20
14
35
437
5
10
360
/30
.05
.14
15
45
/10
.06
.14
Kav
eri
Ent
erp
rise
s, I
ndo
re
83
/10
.06
.20
14
35
437
6
10
362
/30
.05
.14
15
51
/11
.06
.14
Kav
eri
Ent
erp
rise
s, I
ndo
re
85
/11
.06
.20
14
37
800
7
10
362
/30
.05
.14
15
53
/11
.06
.14
Kav
eri
Ent
erp
rise
s, I
ndo
re
86
/11
.06
.20
14
37
800
8
10
364
/30
.05
.14
15
54
/11
.06
.14
Kav
eri
Ent
erp
rise
s, I
ndo
re
87
/11
.06
.20
14
54
600
9
10
368
/30
.05
.14
15
56
/11
.06
.14
Kav
eri
Ent
erp
rise
s, I
ndo
re
89
/11
.06
.20
14
54
600
10
10
386
/30
.05
.14
15
57
/11
.06
.14
Kav
eri
Ent
erp
rise
s, I
ndo
re
90
/11
.06
.20
14
56
700
11
10
400
/30
.05
.14
----
/12
.06
.14
Kav
eri
Ent
erp
rise
s, I
ndo
re
91
/12
.06
.20
14
37
800
12
10
404
/30
.05
.14
15
62
/12
.06
.14
Kav
eri
Ent
erp
rise
s, I
ndo
re
93
/12
.06
.20
14
55
650
13
10
410
/30
.05
.14
15
90
/15
.06
.14
Kav
eri
Ent
erp
rise
s, I
ndo
re
95
/15
.06
.20
14
36
750
14
10
410
/30
.05
.14
15
92
/15
.06
.14
Kav
eri
Ent
erp
rise
s, I
ndo
re
96
/15
.06
.20
14
36
750
15
10
418
/30
.05
.14
15
93
/15
.06
.14
Kav
eri
Ent
erp
rise
s, I
ndo
re
97
/15
.06
.20
14
30
450
16
10
418
/30
.05
.14
15
94
/15
.06
.14
Kav
eri
Ent
erp
rise
s, I
ndo
re
99
/15
.06
.20
14
30
450
17
10
422
/30
.05
.14
15
95
/18
.06
.14
Kav
eri
Ent
erp
rise
s, I
ndo
re
10
0/1
8.0
6.2
014
4
53
60
To
tal
70
482
2
18
10
342
/30
.05
.14
45
6/1
0.0
6.1
4 B
arkh
a S
ales
Co
rpo
rati
on
21
/10
.06
.20
14
46
200
24
905
6 &
24
905
7
66
/17
.06
.14
19
10
384
/30
.05
.14
51
5/2
3.0
6.1
4 B
arkh
a S
ales
Co
rpo
rati
on
29
/23
.06
.20
14
47
828
20
5
16
/23.
06
.14
Bar
kha
Sal
es C
orp
ora
tio
n 3
0/2
3.0
6.2
01
4 1
89
00
21
10
348
/30
.05
.14
51
7/2
3.0
6.1
4 B
arkh
a S
ales
Co
rpo
rati
on
31
/23
.06
.20
14
36
015
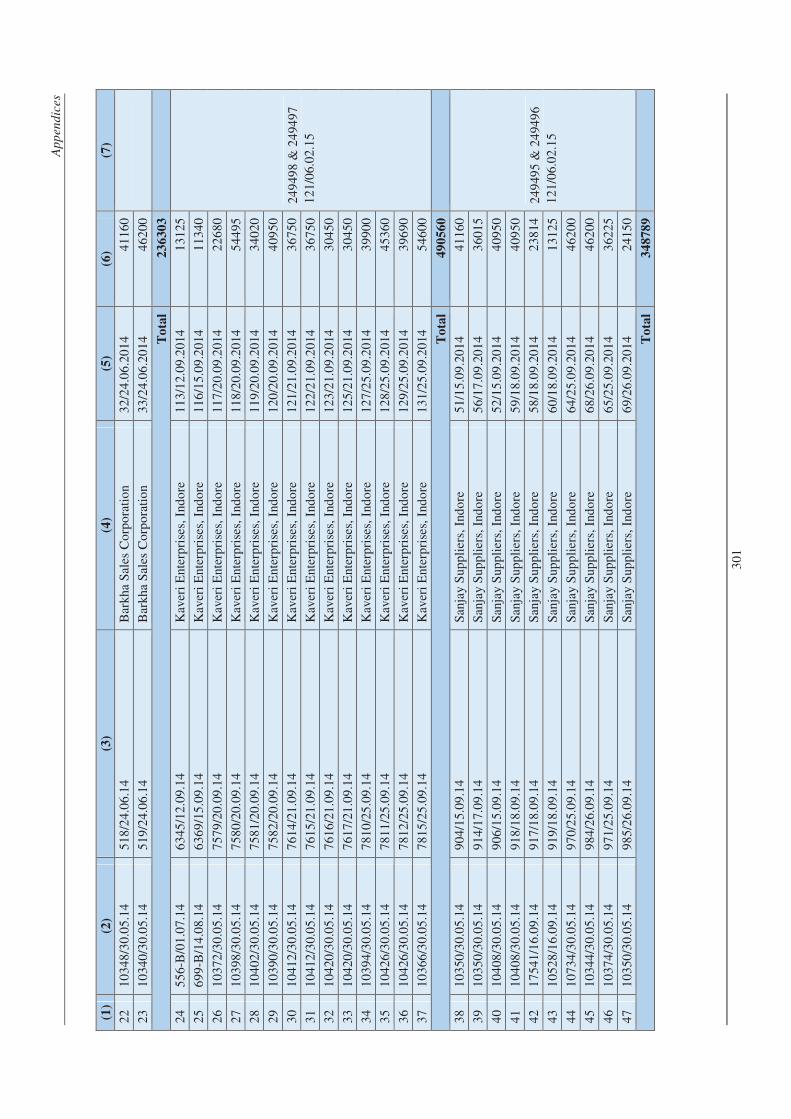
Ap
pen
dic
es
30
1
(1)
(2)
(3)
(4)
(5)
(6)
(7)
22
10
348
/30
.05
.14
51
8/2
4.0
6.1
4 B
arkh
a S
ales
Co
rpo
rati
on
32
/24
.06
.20
14
41
160
23
10
340
/30
.05
.14
51
9/2
4.0
6.1
4 B
arkh
a S
ales
Co
rpo
rati
on
33
/24
.06
.20
14
46
200
To
tal
23
630
3
24
55
6-B
/01
.07
.14
63
45
/12
.09
.14
Kav
eri
Ent
erp
rise
s, I
ndo
re
11
3/1
2.0
9.2
014
1
31
25
24
949
8 &
24
949
7
12
1/0
6.0
2.1
5
25
69
9-B
/14
.08
.14
63
69
/15
.09
.14
Kav
eri
Ent
erp
rise
s, I
ndo
re
11
6/1
5.0
9.2
014
1
13
40
26
10
372
/30
.05
.14
75
79
/20
.09
.14
Kav
eri
Ent
erp
rise
s, I
ndo
re
11
7/2
0.0
9.2
014
2
26
80
27
10
398
/30
.05
.14
75
80
/20
.09
.14
Kav
eri
Ent
erp
rise
s, I
ndo
re
11
8/2
0.0
9.2
014
5
44
95
28
10
402
/30
.05
.14
75
81
/20
.09
.14
Kav
eri
Ent
erp
rise
s, I
ndo
re
11
9/2
0.0
9.2
014
3
40
20
29
10
390
/30
.05
.14
75
82
/20
.09
.14
Kav
eri
Ent
erp
rise
s, I
ndo
re
12
0/2
0.0
9.2
014
4
09
50
30
10
412
/30
.05
.14
76
14
/21
.09
.14
Kav
eri
Ent
erp
rise
s, I
ndo
re
12
1/2
1.0
9.2
014
3
67
50
31
10
412
/30
.05
.14
76
15
/21
.09
.14
Kav
eri
Ent
erp
rise
s, I
ndo
re
12
2/2
1.0
9.2
014
3
67
50
32
10
420
/30
.05
.14
76
16
/21
.09
.14
Kav
eri
Ent
erp
rise
s, I
ndo
re
12
3/2
1.0
9.2
014
3
04
50
33
10
420
/30
.05
.14
76
17
/21
.09
.14
Kav
eri
Ent
erp
rise
s, I
ndo
re
12
5/2
1.0
9.2
014
3
04
50
34
10
394
/30
.05
.14
78
10
/25
.09
.14
Kav
eri
Ent
erp
rise
s, I
ndo
re
12
7/2
5.0
9.2
014
3
99
00
35
10
426
/30
.05
.14
78
11
/25
.09
.14
Kav
eri
Ent
erp
rise
s, I
ndo
re
12
8/2
5.0
9.2
014
4
53
60
36
10
426
/30
.05
.14
78
12
/25
.09
.14
Kav
eri
Ent
erp
rise
s, I
ndo
re
12
9/2
5.0
9.2
014
3
96
90
37
10
366
/30
.05
.14
78
15
/25
.09
.14
Kav
eri
Ent
erp
rise
s, I
ndo
re
13
1/2
5.0
9.2
014
5
46
00
To
tal
49
056
0
38
10
350
/30
.05
.14
90
4/1
5.0
9.1
4 S
anja
y S
upp
lier
s, I
ndo
re
51
/15
.09
.20
14
41
160
24
949
5 &
24
949
6
12
1/0
6.0
2.1
5
39
10
350
/30
.05
.14
91
4/1
7.0
9.1
4 S
anja
y S
upp
lier
s, I
ndo
re
56
/17
.09
.20
14
36
015
40
10
408
/30
.05
.14
90
6/1
5.0
9.1
4 S
anja
y S
upp
lier
s, I
ndo
re
52
/15
.09
.20
14
40
950
41
10
408
/30
.05
.14
91
8/1
8.0
9.1
4 S
anja
y S
upp
lier
s, I
ndo
re
59
/18
.09
.20
14
40
950
42
17
541
/16
.09
.14
91
7/1
8.0
9.1
4 S
anja
y S
upp
lier
s, I
ndo
re
58
/18
.09
.20
14
23
814
43
10
528
/16
.09
.14
91
9/1
8.0
9.1
4 S
anja
y S
upp
lier
s, I
ndo
re
60
/18
.09
.20
14
13
125
44
10
734
/30
.05
.14
97
0/2
5.0
9.1
4 S
anja
y S
upp
lier
s, I
ndo
re
64
/25
.09
.20
14
46
200
45
10
344
/30
.05
.14
98
4/2
6.0
9.1
4 S
anja
y S
upp
lier
s, I
ndo
re
68
/26
.09
.20
14
46
200
46
10
374
/30
.05
.14
97
1/2
5.0
9.1
4 S
anja
y S
upp
lier
s, I
ndo
re
65
/25
.09
.20
14
36
225
47
10
350
/30
.05
.14
98
5/2
6.0
9.1
4 S
anja
y S
upp
lier
s, I
ndo
re
69
/26
.09
.20
14
24
150
To
tal
34
878
9
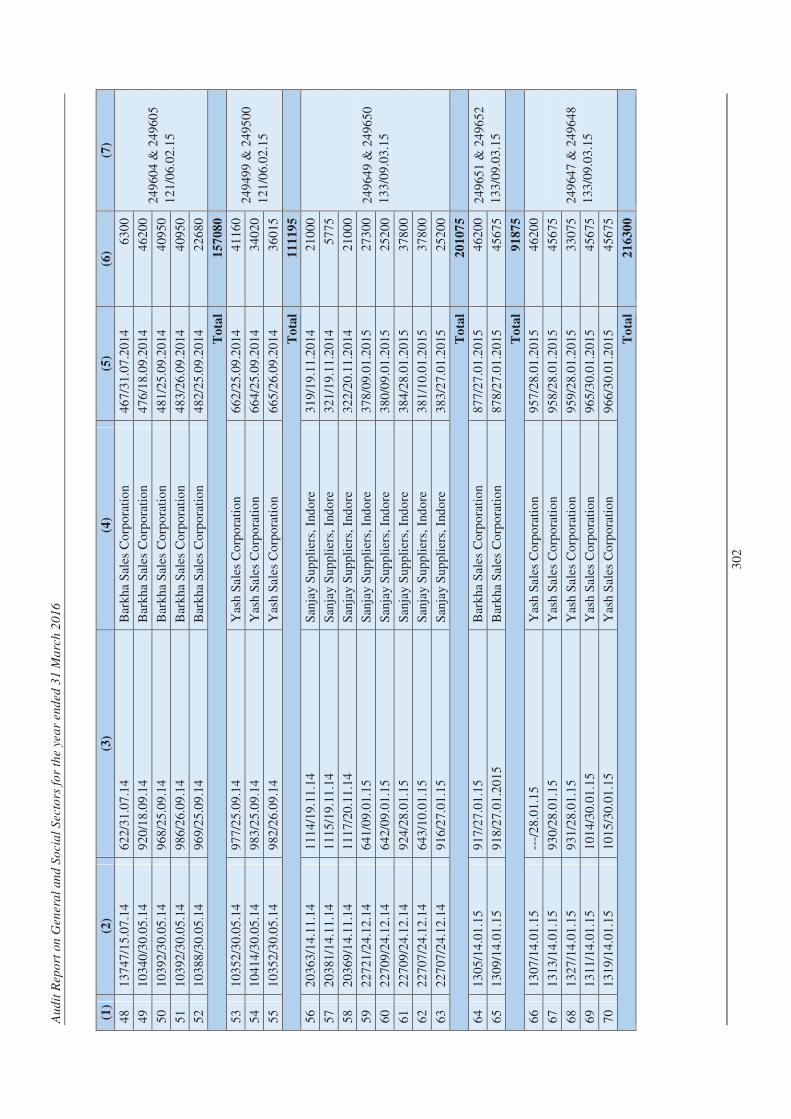
Au
dit
Rep
ort
on
Gen
era
l an
d S
ocia
l S
ecto
rs f
or
the y
ea
r end
ed
31 M
arc
h 2
01
6
30
2
(1)
(2)
(3)
(4)
(5)
(6)
(7)
48
13
747
/15
.07
.14
62
2/3
1.0
7.1
4 B
arkh
a S
ales
Co
rpo
rati
on
46
7/3
1.0
7.2
014
6
30
0
24
960
4 &
24
960
5
12
1/0
6.0
2.1
5
49
10
340
/30
.05
.14
92
0/1
8.0
9.1
4 B
arkh
a S
ales
Co
rpo
rati
on
47
6/1
8.0
9.2
014
4
62
00
50
10
392
/30
.05
.14
96
8/2
5.0
9.1
4 B
arkh
a S
ales
Co
rpo
rati
on
48
1/2
5.0
9.2
014
4
09
50
51
10
392
/30
.05
.14
98
6/2
6.0
9.1
4 B
arkh
a S
ales
Co
rpo
rati
on
48
3/2
6.0
9.2
014
4
09
50
52
10
388
/30
.05
.14
96
9/2
5.0
9.1
4 B
arkh
a S
ales
Co
rpo
rati
on
48
2/2
5.0
9.2
014
2
26
80
To
tal
15
708
0
53
10
352
/30
.05
.14
97
7/2
5.0
9.1
4 Y
ash
Sal
es C
orp
ora
tio
n
66
2/2
5.0
9.2
014
4
11
60
24
949
9 &
24
950
0
12
1/0
6.0
2.1
5 5
4 1
04
14/3
0.0
5.1
4 9
83
/25.
09
.14
Yas
h S
ales
Co
rpo
rati
on
6
64
/25.
09
.20
14
34
020
55
10
352
/30
.05
.14
98
2/2
6.0
9.1
4 Y
ash
Sal
es C
orp
ora
tio
n
66
5/2
6.0
9.2
014
3
60
15
To
tal
11
119
5
56
20
363
/14
.11
.14
11
14
/19
.11
.14
San
jay
Sup
pli
ers,
Ind
ore
3
19
/19.
11
.20
14
21
000
24
964
9 &
24
965
0
13
3/0
9.0
3.1
5
57
20
381
/14
.11
.14
11
15
/19
.11
.14
San
jay
Sup
pli
ers,
Ind
ore
3
21
/19.
11
.20
14
57
75
58
20
369
/14
.11
.14
11
17
/20
.11
.14
San
jay
Sup
pli
ers,
Ind
ore
3
22
/20.
11
.20
14
21
000
59
22
721
/24
.12
.14
64
1/0
9.0
1.1
5 S
anja
y S
upp
lier
s, I
ndo
re
37
8/0
9.0
1.2
015
2
73
00
60
22
709
/24
.12
.14
64
2/0
9.0
1.1
5 S
anja
y S
upp
lier
s, I
ndo
re
38
0/0
9.0
1.2
015
2
52
00
61
22
709
/24
.12
.14
92
4/2
8.0
1.1
5 S
anja
y S
upp
lier
s, I
ndo
re
38
4/2
8.0
1.2
015
3
78
00
62
22
707
/24
.12
.14
64
3/1
0.0
1.1
5 S
anja
y S
upp
lier
s, I
ndo
re
38
1/1
0.0
1.2
015
3
78
00
63
22
707
/24
.12
.14
91
6/2
7.0
1.1
5 S
anja
y S
upp
lier
s, I
ndo
re
38
3/2
7.0
1.2
015
2
52
00
To
tal
20
107
5
64
13
05
/14
.01
.15
91
7/2
7.0
1.1
5 B
arkh
a S
ales
Co
rpo
rati
on
87
7/2
7.0
1.2
015
4
62
00
24
965
1 &
24
965
2
13
3/0
9.0
3.1
5 6
5 1
30
9/1
4.0
1.1
5 9
18
/27.
01
.20
15
Bar
kha
Sal
es C
orp
ora
tio
n 8
78
/27.
01
.20
15
45
675
To
tal
91
875
66
13
07
/14
.01
.15
---/
28
.01
.15
Yas
h S
ales
Co
rpo
rati
on
9
57
/28.
01
.20
15
46
200
24
964
7 &
24
964
8
13
3/0
9.0
3.1
5
67
13
13
/14
.01
.15
93
0/2
8.0
1.1
5 Y
ash
Sal
es C
orp
ora
tio
n
95
8/2
8.0
1.2
015
4
56
75
68
13
27
/14
.01
.15
93
1/2
8.0
1.1
5 Y
ash
Sal
es C
orp
ora
tio
n
95
9/2
8.0
1.2
015
3
30
75
69
13
11
/14
.01
.15
10
14
/30
.01
.15
Yas
h S
ales
Co
rpo
rati
on
9
65
/30.
01
.20
15
45
675
70
13
19
/14
.01
.15
10
15
/30
.01
.15
Yas
h S
ales
Co
rpo
rati
on
9
66
/30.
01
.20
15
45
675
To
tal
21
630
0
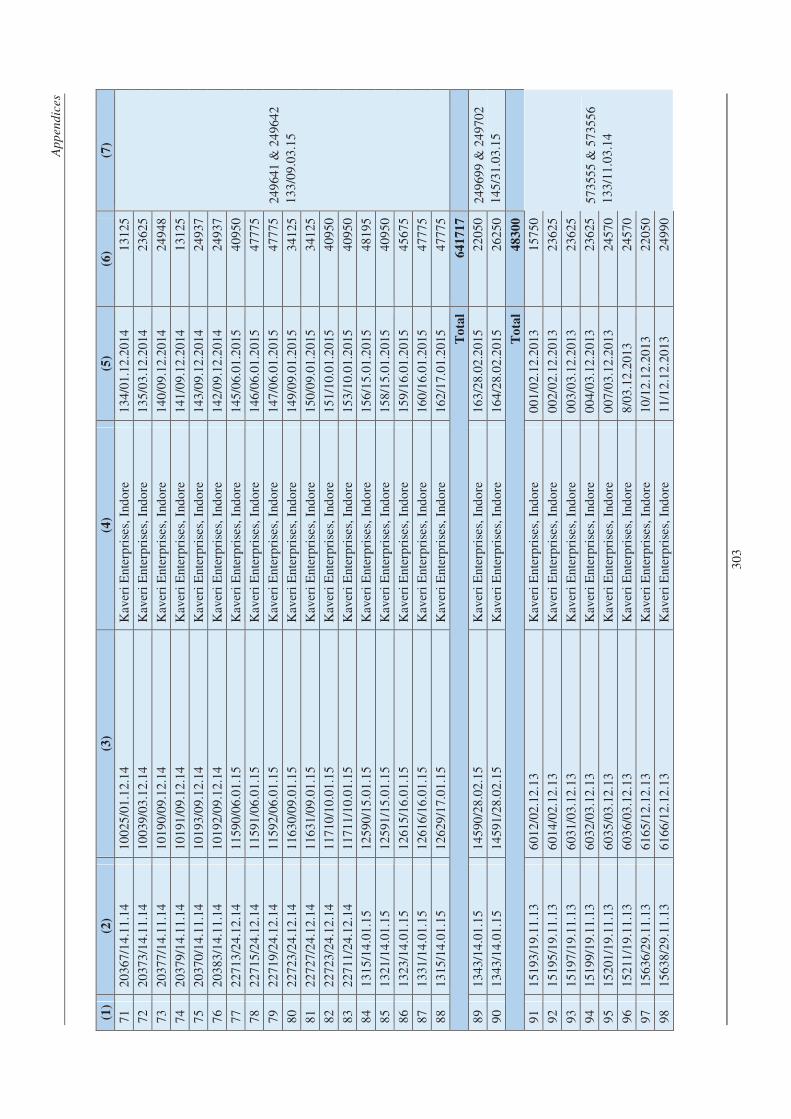
Ap
pen
dic
es
30
3
(1)
(2)
(3)
(4)
(5)
(6)
(7)
71
20
367
/14
.11
.14
10
025
/01
.12
.14
Kav
eri
Ent
erp
rise
s, I
ndo
re
13
4/0
1.1
2.2
014
1
31
25
24
964
1 &
24
964
2
13
3/0
9.0
3.1
5
72
20
373
/14
.11
.14
10
039
/03
.12
.14
Kav
eri
Ent
erp
rise
s, I
ndo
re
13
5/0
3.1
2.2
014
2
36
25
73
20
377
/14
.11
.14
10
190
/09
.12
.14
Kav
eri
Ent
erp
rise
s, I
ndo
re
14
0/0
9.1
2.2
014
2
49
48
74
20
379
/14
.11
.14
10
191
/09
.12
.14
Kav
eri
Ent
erp
rise
s, I
ndo
re
14
1/0
9.1
2.2
014
1
31
25
75
20
370
/14
.11
.14
10
193
/09
.12
.14
Kav
eri
Ent
erp
rise
s, I
ndo
re
14
3/0
9.1
2.2
014
2
49
37
76
20
383
/14
.11
.14
10
192
/09
.12
.14
Kav
eri
Ent
erp
rise
s, I
ndo
re
14
2/0
9.1
2.2
014
2
49
37
77
22
713
/24
.12
.14
11
590
/06
.01
.15
Kav
eri
Ent
erp
rise
s, I
ndo
re
14
5/0
6.0
1.2
015
4
09
50
78
22
715
/24
.12
.14
11
591
/06
.01
.15
Kav
eri
Ent
erp
rise
s, I
ndo
re
14
6/0
6.0
1.2
015
4
77
75
79
22
719
/24
.12
.14
11
592
/06
.01
.15
Kav
eri
Ent
erp
rise
s, I
ndo
re
14
7/0
6.0
1.2
015
4
77
75
80
22
723
/24
.12
.14
11
630
/09
.01
.15
Kav
eri
Ent
erp
rise
s, I
ndo
re
14
9/0
9.0
1.2
015
3
41
25
81
22
727
/24
.12
.14
11
631
/09
.01
.15
Kav
eri
Ent
erp
rise
s, I
ndo
re
15
0/0
9.0
1.2
015
3
41
25
82
22
723
/24
.12
.14
11
710
/10
.01
.15
Kav
eri
Ent
erp
rise
s, I
ndo
re
15
1/1
0.0
1.2
015
4
09
50
83
22
711
/24
.12
.14
11
711
/10
.01
.15
Kav
eri
Ent
erp
rise
s, I
ndo
re
15
3/1
0.0
1.2
015
4
09
50
84
13
15
/14
.01
.15
12
590
/15
.01
.15
Kav
eri
Ent
erp
rise
s, I
ndo
re
15
6/1
5.0
1.2
015
4
81
95
85
13
21
/14
.01
.15
12
591
/15
.01
.15
Kav
eri
Ent
erp
rise
s, I
ndo
re
15
8/1
5.0
1.2
015
4
09
50
86
13
23
/14
.01
.15
12
615
/16
.01
.15
Kav
eri
Ent
erp
rise
s, I
ndo
re
15
9/1
6.0
1.2
015
4
56
75
87
13
31
/14
.01
.15
12
616
/16
.01
.15
Kav
eri
Ent
erp
rise
s, I
ndo
re
16
0/1
6.0
1.2
015
4
77
75
88
13
15
/14
.01
.15
12
629
/17
.01
.15
Kav
eri
Ent
erp
rise
s, I
ndo
re
16
2/1
7.0
1.2
015
4
77
75
To
tal
64
171
7
89
13
43
/14
.01
.15
14
590
/28
.02
.15
Kav
eri
Ent
erp
rise
s, I
ndo
re
16
3/2
8.0
2.2
015
2
20
50
24
969
9 &
24
970
2
14
5/3
1.0
3.1
5 9
0 1
34
3/1
4.0
1.1
5 1
45
91/2
8.0
2.1
5 K
aver
i E
nter
pri
ses,
Ind
ore
1
64
/28.
02
.20
15
26
250
To
tal
48
300
91
15
193
/19
.11
.13
60
12
/02
.12
.13
Kav
eri
Ent
erp
rise
s, I
ndo
re
00
1/0
2.1
2.2
013
1
57
50
57
355
5 &
57
355
6
13
3/1
1.0
3.1
4
92
15
195
/19
.11
.13
60
14
/02
.12
.13
Kav
eri
Ent
erp
rise
s, I
ndo
re
00
2/0
2.1
2.2
013
2
36
25
93
15
197
/19
.11
.13
60
31
/03
.12
.13
Kav
eri
Ent
erp
rise
s, I
ndo
re
00
3/0
3.1
2.2
013
2
36
25
94
15
199
/19
.11
.13
60
32
/03
.12
.13
Kav
eri
Ent
erp
rise
s, I
ndo
re
00
4/0
3.1
2.2
013
2
36
25
95
15
201
/19
.11
.13
60
35
/03
.12
.13
Kav
eri
Ent
erp
rise
s, I
ndo
re
00
7/0
3.1
2.2
013
2
45
70
96
15
211
/19
.11
.13
60
36
/03
.12
.13
Kav
eri
Ent
erp
rise
s, I
ndo
re
8/0
3.1
2.2
013
24
570
97
15
636
/29
.11
.13
61
65
/12
.12
.13
Kav
eri
Ent
erp
rise
s, I
ndo
re
10
/12
.12
.20
13
22
050
98
15
638
/29
.11
.13
61
66
/12
.12
.13
Kav
eri
Ent
erp
rise
s, I
ndo
re
11
/12
.12
.20
13
24
990
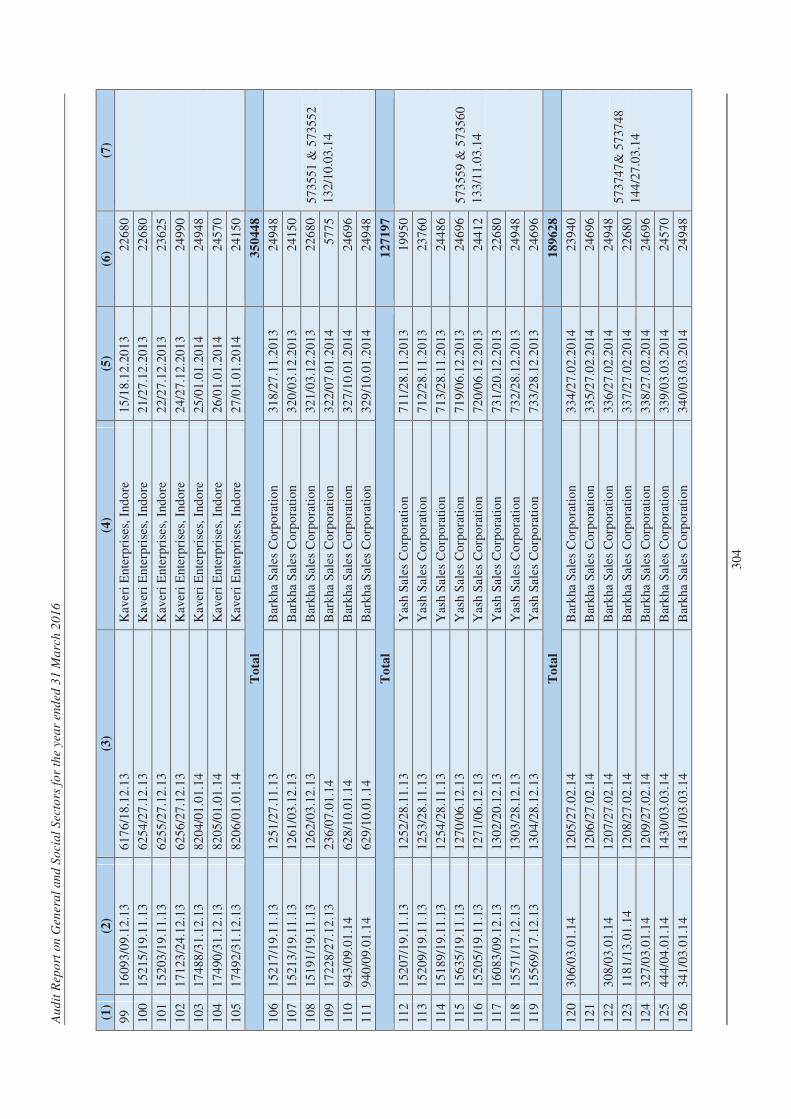
Au
dit
Rep
ort
on
Gen
era
l an
d S
ocia
l S
ecto
rs f
or
the y
ea
r end
ed
31 M
arc
h 2
01
6
30
4
(1)
(2)
(3)
(4)
(5)
(6)
(7)
99
16
093
/09
.12
.13
61
76
/18
.12
.13
Kav
eri
Ent
erp
rise
s, I
ndo
re
15
/18
.12
.20
13
22
680
10
0 1
52
15/1
9.1
1.1
3 6
25
4/2
7.1
2.1
3 K
aver
i E
nter
pri
ses,
Ind
ore
2
1/2
7.1
2.2
01
3 2
26
80
10
1 1
52
03/1
9.1
1.1
3 6
25
5/2
7.1
2.1
3 K
aver
i E
nter
pri
ses,
Ind
ore
2
2/2
7.1
2.2
01
3 2
36
25
10
2 1
71
23/2
4.1
2.1
3 6
25
6/2
7.1
2.1
3 K
aver
i E
nter
pri
ses,
Ind
ore
2
4/2
7.1
2.2
01
3 2
49
90
10
3 1
74
88/3
1.1
2.1
3 8
20
4/0
1.0
1.1
4 K
aver
i E
nter
pri
ses,
Ind
ore
2
5/0
1.0
1.2
01
4 2
49
48
10
4 1
74
90/3
1.1
2.1
3 8
20
5/0
1.0
1.1
4 K
aver
i E
nter
pri
ses,
Ind
ore
2
6/0
1.0
1.2
01
4 2
45
70
10
5 1
74
92/3
1.1
2.1
3 8
20
6/0
1.0
1.1
4 K
aver
i E
nter
pri
ses,
Ind
ore
2
7/0
1.0
1.2
01
4 2
41
50
To
tal
35
044
8
10
6 1
52
17/1
9.1
1.1
3 1
25
1/2
7.1
1.1
3 B
arkh
a S
ales
Co
rpo
rati
on
31
8/2
7.1
1.2
013
2
49
48
57
355
1 &
57
355
2
13
2/1
0.0
3.1
4
10
7 1
52
13/1
9.1
1.1
3 1
26
1/0
3.1
2.1
3 B
arkh
a S
ales
Co
rpo
rati
on
32
0/0
3.1
2.2
013
2
41
50
10
8 1
51
91/1
9.1
1.1
3 1
26
2/0
3.1
2.1
3 B
arkh
a S
ales
Co
rpo
rati
on
32
1/0
3.1
2.2
013
2
26
80
10
9 1
72
28/2
7.1
2.1
3 2
36
/07.
01
.14
Bar
kha
Sal
es C
orp
ora
tio
n 3
22
/07.
01
.20
14
57
75
11
0 9
43
/09.
01
.14
62
8/1
0.0
1.1
4 B
arkh
a S
ales
Co
rpo
rati
on
32
7/1
0.0
1.2
014
2
46
96
11
1 9
40
/09.
01
.14
62
9/1
0.0
1.1
4 B
arkh
a S
ales
Co
rpo
rati
on
32
9/1
0.0
1.2
014
2
49
48
To
tal
12
719
7
11
2 1
52
07/1
9.1
1.1
3 1
25
2/2
8.1
1.1
3 Y
ash
Sal
es C
orp
ora
tio
n
71
1/2
8.1
1.2
013
1
99
50
57
355
9 &
57
356
0
13
3/1
1.0
3.1
4
11
3 1
52
09/1
9.1
1.1
3 1
25
3/2
8.1
1.1
3 Y
ash
Sal
es C
orp
ora
tio
n
71
2/2
8.1
1.2
013
2
37
60
11
4 1
51
89/1
9.1
1.1
3 1
25
4/2
8.1
1.1
3 Y
ash
Sal
es C
orp
ora
tio
n
71
3/2
8.1
1.2
013
2
44
86
11
5 1
56
35/1
9.1
1.1
3 1
27
0/0
6.1
2.1
3 Y
ash
Sal
es C
orp
ora
tio
n
71
9/0
6.1
2.2
013
2
46
96
11
6 1
52
05/1
9.1
1.1
3 1
27
1/0
6.1
2.1
3 Y
ash
Sal
es C
orp
ora
tio
n
72
0/0
6.1
2.2
013
2
44
12
11
7 1
60
83/0
9.1
2.1
3 1
30
2/2
0.1
2.1
3 Y
ash
Sal
es C
orp
ora
tio
n
73
1/2
0.1
2.2
013
2
26
80
11
8 1
55
71/1
7.1
2.1
3 1
30
3/2
8.1
2.1
3 Y
ash
Sal
es C
orp
ora
tio
n
73
2/2
8.1
2.2
013
2
49
48
11
9 1
55
69/1
7.1
2.1
3 1
30
4/2
8.1
2.1
3 Y
ash
Sal
es C
orp
ora
tio
n
73
3/2
8.1
2.2
013
2
46
96
To
tal
18
962
8
12
0 3
06
/03.
01
.14
12
05
/27
.02
.14
Bar
kha
Sal
es C
orp
ora
tio
n 3
34
/27.
02
.20
14
23
940
57
374
7&
57
374
8
14
4/2
7.0
3.1
4
12
1
12
06
/27
.02
.14
Bar
kha
Sal
es C
orp
ora
tio
n 3
35
/27.
02
.20
14
24
696
12
2 3
08
/03.
01
.14
12
07
/27
.02
.14
Bar
kha
Sal
es C
orp
ora
tio
n 3
36
/27.
02
.20
14
24
948
12
3 1
18
1/1
3.0
1.1
4 1
20
8/2
7.0
2.1
4 B
arkh
a S
ales
Co
rpo
rati
on
33
7/2
7.0
2.2
014
2
26
80
12
4 3
27
/03.
01
.14
12
09
/27
.02
.14
Bar
kha
Sal
es C
orp
ora
tio
n 3
38
/27.
02
.20
14
24
696
12
5 4
44
/04.
01
.14
14
30
/03
.03
.14
Bar
kha
Sal
es C
orp
ora
tio
n 3
39
/03.
03
.20
14
24
570
12
6 3
41
/03.
01
.14
14
31
/03
.03
.14
Bar
kha
Sal
es C
orp
ora
tio
n 3
40
/03.
03
.20
14
24
948
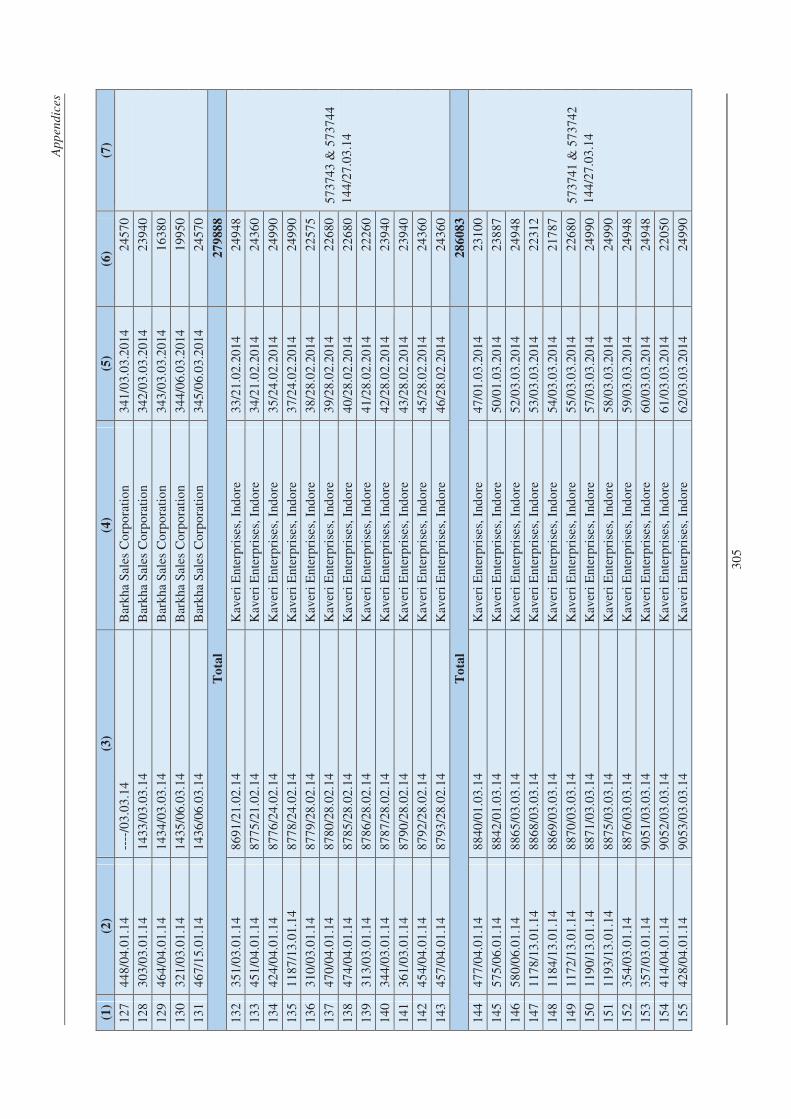
Ap
pen
dic
es
30
5
(1)
(2)
(3)
(4)
(5)
(6)
(7)
12
7 4
48
/04.
01
.14
----
/03
.03
.14
Bar
kha
Sal
es C
orp
ora
tio
n 3
41
/03.
03
.20
14
24
570
12
8 3
03
/03.
01
.14
14
33
/03
.03
.14
Bar
kha
Sal
es C
orp
ora
tio
n 3
42
/03.
03
.20
14
23
940
12
9 4
64
/04.
01
.14
14
34
/03
.03
.14
Bar
kha
Sal
es C
orp
ora
tio
n 3
43
/03.
03
.20
14
16
380
13
0 3
21
/03.
01
.14
14
35
/06
.03
.14
Bar
kha
Sal
es C
orp
ora
tio
n 3
44
/06.
03
.20
14
19
950
13
1 4
67
/15.
01
.14
14
36
/06
.03
.14
Bar
kha
Sal
es C
orp
ora
tio
n 3
45
/06.
03
.20
14
24
570
To
tal
27
988
8
13
2 3
51
/03.
01
.14
86
91
/21
.02
.14
Kav
eri
Ent
erp
rise
s, I
ndo
re
33
/21
.02
.20
14
24
948
57
374
3 &
57
374
4
14
4/2
7.0
3.1
4
13
3 4
51
/04.
01
.14
87
75
/21
.02
.14
Kav
eri
Ent
erp
rise
s, I
ndo
re
34
/21
.02
.20
14
24
360
13
4 4
24
/04.
01
.14
87
76
/24
.02
.14
Kav
eri
Ent
erp
rise
s, I
ndo
re
35
/24
.02
.20
14
24
990
13
5 1
18
7/1
3.0
1.1
4 8
77
8/2
4.0
2.1
4 K
aver
i E
nter
pri
ses,
Ind
ore
3
7/2
4.0
2.2
01
4 2
49
90
13
6 3
10
/03.
01
.14
87
79
/28
.02
.14
Kav
eri
Ent
erp
rise
s, I
ndo
re
38
/28
.02
.20
14
22
575
13
7 4
70
/04.
01
.14
87
80
/28
.02
.14
Kav
eri
Ent
erp
rise
s, I
ndo
re
39
/28
.02
.20
14
22
680
13
8 4
74
/04.
01
.14
87
85
/28
.02
.14
Kav
eri
Ent
erp
rise
s, I
ndo
re
40
/28
.02
.20
14
22
680
13
9 3
13
/03.
01
.14
87
86
/28
.02
.14
Kav
eri
Ent
erp
rise
s, I
ndo
re
41
/28
.02
.20
14
22
260
14
0 3
44
/03.
01
.14
87
87
/28
.02
.14
Kav
eri
Ent
erp
rise
s, I
ndo
re
42
/28
.02
.20
14
23
940
14
1 3
61
/03.
01
.14
87
90
/28
.02
.14
Kav
eri
Ent
erp
rise
s, I
ndo
re
43
/28
.02
.20
14
23
940
14
2 4
54
/04.
01
.14
87
92
/28
.02
.14
Kav
eri
Ent
erp
rise
s, I
ndo
re
45
/28
.02
.20
14
24
360
14
3 4
57
/04.
01
.14
87
93
/28
.02
.14
Kav
eri
Ent
erp
rise
s, I
ndo
re
46
/28
.02
.20
14
24
360
To
tal
28
608
3
14
4 4
77
/04.
01
.14
88
40
/01
.03
.14
Kav
eri
Ent
erp
rise
s, I
ndo
re
47
/01
.03
.20
14
23
100
57
374
1 &
57
374
2
14
4/2
7.0
3.1
4
14
5 5
75
/06.
01
.14
88
42
/01
.03
.14
Kav
eri
Ent
erp
rise
s, I
ndo
re
50
/01
.03
.20
14
23
887
14
6 5
80
/06.
01
.14
88
65
/03
.03
.14
Kav
eri
Ent
erp
rise
s, I
ndo
re
52
/03
.03
.20
14
24
948
14
7 1
17
8/1
3.0
1.1
4 8
86
8/0
3.0
3.1
4 K
aver
i E
nter
pri
ses,
Ind
ore
5
3/0
3.0
3.2
01
4 2
23
12
14
8 1
18
4/1
3.0
1.1
4 8
86
9/0
3.0
3.1
4 K
aver
i E
nter
pri
ses,
Ind
ore
5
4/0
3.0
3.2
01
4 2
17
87
14
9 1
17
2/1
3.0
1.1
4 8
87
0/0
3.0
3.1
4 K
aver
i E
nter
pri
ses,
Ind
ore
5
5/0
3.0
3.2
01
4 2
26
80
15
0 1
19
0/1
3.0
1.1
4 8
87
1/0
3.0
3.1
4 K
aver
i E
nter
pri
ses,
Ind
ore
5
7/0
3.0
3.2
01
4 2
49
90
15
1 1
19
3/1
3.0
1.1
4 8
87
5/0
3.0
3.1
4 K
aver
i E
nter
pri
ses,
Ind
ore
5
8/0
3.0
3.2
01
4 2
49
90
15
2 3
54
/03.
01
.14
88
76
/03
.03
.14
Kav
eri
Ent
erp
rise
s, I
ndo
re
59
/03
.03
.20
14
24
948
15
3 3
57
/03.
01
.14
90
51
/03
.03
.14
Kav
eri
Ent
erp
rise
s, I
ndo
re
60
/03
.03
.20
14
24
948
15
4 4
14
/04.
01
.14
90
52
/03
.03
.14
Kav
eri
Ent
erp
rise
s, I
ndo
re
61
/03
.03
.20
14
22
050
15
5 4
28
/04.
01
.14
90
53
/03
.03
.14
Kav
eri
Ent
erp
rise
s, I
ndo
re
62
/03
.03
.20
14
24
990

Au
dit
Rep
ort
on
Gen
era
l an
d S
ocia
l S
ecto
rs f
or
the y
ea
r end
ed
31 M
arc
h 2
01
6
30
6
(1)
(2)
(3)
(4)
(5)
(6)
(7)
15
6 4
31
/04.
01
.14
90
54
/03
.03
.14
Kav
eri
Ent
erp
rise
s, I
ndo
re
63
/03
.03
.20
14
24
990
15
7 5
61
/06.
01
.14
----
/03
.03
.14
Kav
eri
Ent
erp
rise
s, I
ndo
re
64
/03
.03
.20
14
24
150
15
8 5
69
/06.
01
.14
90
56
/03
.03
.14
Kav
eri
Ent
erp
rise
s, I
ndo
re
65
/03
.03
.20
14
24
150
15
9 1
20
0/1
5.0
1.1
4 9
31
1/0
3.0
3.1
4 K
aver
i E
nter
pri
ses,
Ind
ore
6
6/0
3.0
3.2
01
4 2
49
48
16
0 1
21
1/1
5.0
1.1
4 9
31
4/0
3.0
3.1
4 K
aver
i E
nter
pri
ses,
Ind
ore
6
8/0
3.0
3.2
01
4 2
20
50
16
1 1
21
4/1
5.0
1.1
4 9
31
5/0
3.0
3.1
4 K
aver
i E
nter
pri
ses,
Ind
ore
6
9/0
3.0
3.2
01
4 2
15
77
16
2 1
20
3/1
5.0
1.1
4 9
32
0/0
3.0
3.1
4 K
aver
i E
nter
pri
ses,
Ind
ore
7
0/0
3.0
3.2
01
4 2
35
20
To
tal
45
101
5
16
3 3
18
/03.
01
.14
11
31
/06
.02
.14
Yas
h S
ales
Co
rpo
rati
on
8
77
/06.
02
.20
14
19
950
57
374
5 &
57
374
6
14
4/2
7.0
3.1
4
16
4 1
17
5/1
3.0
1.1
4 1
15
2/1
3.0
2.1
4 Y
ash
Sal
es C
orp
ora
tio
n
87
8/1
3.0
2.2
014
1
99
50
16
5 1
16
9/1
3.0
1.1
4 1
20
2/2
7.0
2.1
4 Y
ash
Sal
es C
orp
ora
tio
n
87
9/2
7.0
2.2
014
1
99
50
16
6 4
22
/04.
01
.14
12
03
/27
.02
.14
Yas
h S
ales
Co
rpo
rati
on
8
80
/27.
02
.20
14
24
675
16
7 1
16
6/1
3.0
1.1
4 1
20
4/2
7.0
2.1
4 Y
ash
Sal
es C
orp
ora
tio
n
88
2/2
7.0
2.2
014
2
44
86
16
8 5
66
/06.
01
.14
14
23
/03
.03
.14
Yas
h S
ales
Co
rpo
rati
on
9
05
/03.
03
.20
14
24
150
16
9 4
40
/04.
01
.14
14
24
/03
.03
.14
Yas
h S
ales
Co
rpo
rati
on
9
06
/03.
03
.20
14
24
570
17
0 4
37
/04.
01
.14
14
25
/03
.03
.14
Yas
h S
ales
Co
rpo
rati
on
9
07
/03.
03
.20
14
24
570
17
1 3
30
/03.
01
.14
14
26
/03
.03
.14
Yas
h S
ales
Co
rpo
rati
on
9
08
/03.
03
.20
14
24
696
17
2 3
70
/03.
01
.14
14
27
/03
.03
.14
Yas
h S
ales
Co
rpo
rati
on
9
09
/03.
03
.20
14
24
696
17
3 3
64
/03.
01
.14
14
28
/03
.03
.14
Yas
h S
ales
Co
rpo
rati
on
9
10
/03.
03
.20
14
24
948
17
4 3
67
/03.
01
.14
14
29
/03
.03
.14
Yas
h S
ales
Co
rpo
rati
on
9
11
/03.
03
.20
14
24
948
17
5 4
60
/04.
01
.14
14
37
/06
.03
.14
Yas
h S
ales
Co
rpo
rati
on
9
12
/06.
03
.20
14
24
570
17
6 3
33
/03.
01
.14
14
38
/06
.03
.14
Yas
h S
ales
Co
rpo
rati
on
9
13
/06.
03
.20
14
24
696
17
7 5
75
/06.
01
.14
14
39
/06
.03
.14
Yas
h S
ales
Co
rpo
rati
on
9
14
/06.
03
.20
14
24
948
17
8 5
89
/06.
01
.14
14
40
/06
.03
.14
Yas
h S
ales
Co
rpo
rati
on
9
15
/06.
03
.20
14
24
696
17
9 5
57
/06.
01
.14
14
41
/06
.03
.14
Yas
h S
ales
Co
rpo
rati
on
9
16
/06.
03
.20
14
24
696
To
tal
40
519
5
18
0 1
20
43/0
2.0
9.1
3 8
10
/10.
09
.13
Yas
h S
ales
Co
rpo
rati
on
4
20
/10.
09
.20
13
24
948
57
354
9 &
57
355
0
13
3/1
1.0
3.1
4
18
1 1
20
41/0
2.0
9.1
3 8
20
/16.
09
.13
Yas
h S
ales
Co
rpo
rati
on
4
21
/16.
09
.20
13
24
570
18
2 1
23
39/0
6.0
9.1
3 8
21
/16.
09
.13
Yas
h S
ales
Co
rpo
rati
on
4
22
/16.
09
.20
13
24
019
18
3 1
23
37/0
6.0
9.1
3 8
22
/16.
09
.13
Yas
h S
ales
Co
rpo
rati
on
4
23
/16.
09
.20
13
23
100
18
4 9
23
-B/2
5.0
9.1
3 --
-/1
9.1
0.1
3 Y
ash
Sal
es C
orp
ora
tio
n
52
0/1
9.1
0.2
013
2
49
48
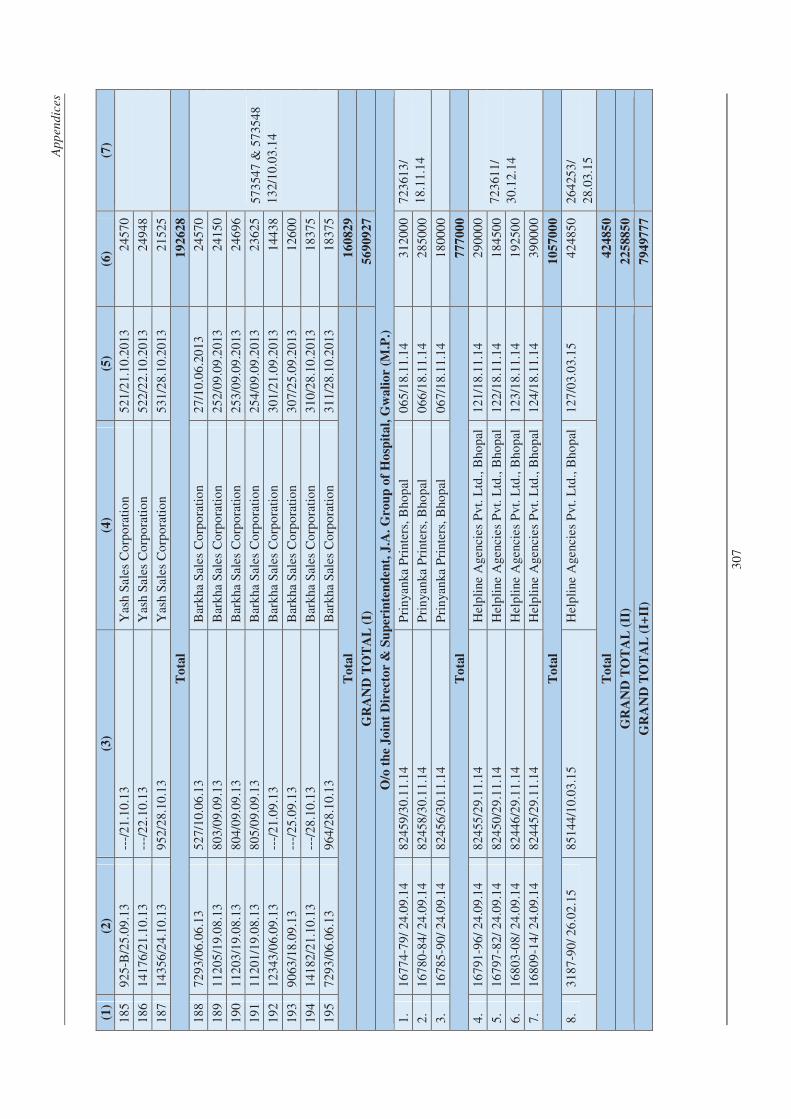
Ap
pen
dic
es
30
7
(1)
(2)
(3)
(4)
(5)
(6)
(7)
18
5 9
25
-B/2
5.0
9.1
3 --
-/2
1.1
0.1
3 Y
ash
Sal
es C
orp
ora
tio
n
52
1/2
1.1
0.2
013
2
45
70
18
6 1
41
76/2
1.1
0.1
3 --
-/2
2.1
0.1
3 Y
ash
Sal
es C
orp
ora
tio
n
52
2/2
2.1
0.2
013
2
49
48
18
7 1
43
56/2
4.1
0.1
3 9
52
/28.
10
.13
Yas
h S
ales
Co
rpo
rati
on
5
31
/28.
10
.20
13
21
525
To
tal
19
262
8
18
8 7
29
3/0
6.0
6.1
3 5
27
/10.
06
.13
Bar
kha
Sal
es C
orp
ora
tio
n 2
7/1
0.0
6.2
01
3 2
45
70
57
354
7 &
57
354
8
13
2/1
0.0
3.1
4
18
9 1
12
05/1
9.0
8.1
3 8
03
/09.
09
.13
Bar
kha
Sal
es C
orp
ora
tio
n 2
52
/09.
09
.20
13
24
150
19
0 1
12
03/1
9.0
8.1
3 8
04
/09.
09
.13
Bar
kha
Sal
es C
orp
ora
tio
n 2
53
/09.
09
.20
13
24
696
19
1 1
12
01/1
9.0
8.1
3 8
05
/09.
09
.13
Bar
kha
Sal
es C
orp
ora
tio
n 2
54
/09.
09
.20
13
23
625
19
2 1
23
43/0
6.0
9.1
3 --
-/2
1.0
9.1
3 B
arkh
a S
ales
Co
rpo
rati
on
30
1/2
1.0
9.2
013
1
44
38
19
3 9
06
3/1
8.0
9.1
3 --
-/2
5.0
9.1
3 B
arkh
a S
ales
Co
rpo
rati
on
30
7/2
5.0
9.2
013
1
26
00
19
4 1
41
82/2
1.1
0.1
3 --
-/2
8.1
0.1
3 B
arkh
a S
ales
Co
rpo
rati
on
31
0/2
8.1
0.2
013
1
83
75
19
5 7
29
3/0
6.0
6.1
3 9
64
/28.
10
.13
Bar
kha
Sal
es C
orp
ora
tio
n 3
11
/28.
10
.20
13
18
375
To
tal
16
082
9
GR
AN
D T
OT
AL
(I)
5
69
09
27
O/o
th
e J
oin
t D
irec
tor
& S
up
erin
ten
den
t, J
.A.
Gro
up
of
Ho
spit
al,
Gw
ali
or
(M.P
.)
1.
16
774
-79
/ 2
4.0
9.1
4 8
24
59/3
0.1
1.1
4 P
rin
yan
ka P
rint
ers,
Bho
pal
0
65
/18.
11
.14
31
200
0 7
23
613
/
18
.11.
14
2.
16
780
-84
/ 2
4.0
9.1
4 8
24
58/3
0.1
1.1
4 P
rin
yan
ka P
rint
ers,
Bho
pal
0
66
/18.
11
.14
28
500
0
3.
16
785
-90
/ 2
4.0
9.1
4 8
24
56/3
0.1
1.1
4 P
rin
yan
ka P
rint
ers,
Bho
pal
0
67
/18.
11
.14
18
000
0
To
tal
77
700
0
4.
16
791
-96
/ 2
4.0
9.1
4 8
24
55/2
9.1
1.1
4 H
elp
line
Age
ncie
s P
vt.
Ltd
., B
hop
al
12
1/1
8.1
1.1
4 2
90
000
72
361
1/
30
.12.
14
5.
16
797
-82
/ 2
4.0
9.1
4 8
24
50/2
9.1
1.1
4 H
elp
line
Age
ncie
s P
vt.
Ltd
., B
hop
al
12
2/1
8.1
1.1
4 1
84
500
6.
16
803
-08
/ 2
4.0
9.1
4 8
24
46/2
9.1
1.1
4 H
elp
line
Age
ncie
s P
vt.
Ltd
., B
hop
al
12
3/1
8.1
1.1
4 1
92
500
7.
16
809
-14
/ 2
4.0
9.1
4 8
24
45/2
9.1
1.1
4 H
elp
line
Age
ncie
s P
vt.
Ltd
., B
hop
al
12
4/1
8.1
1.1
4 3
90
000
To
tal
10
570
00
8.
31
87
-90
/ 2
6.0
2.1
5 8
51
44/1
0.0
3.1
5 H
elp
line
Age
ncie
s P
vt.
Ltd
., B
hop
al
12
7/0
3.0
3.1
5 4
24
850
26
425
3/
28
.03.
15
To
tal
42
485
0
GR
AN
D T
OT
AL
(II
) 2
25
88
50
GR
AN
D T
OT
AL
(I+
II)
79
497
77
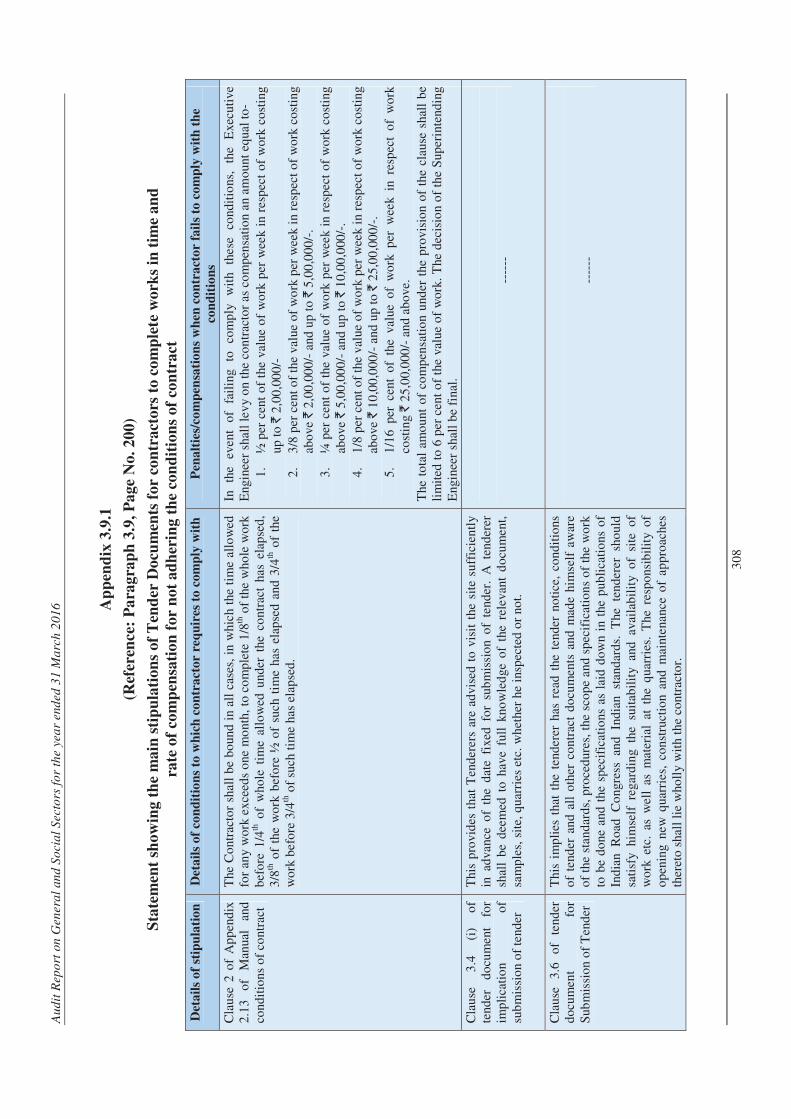
Au
dit
Rep
ort
on
Gen
era
l an
d S
ocia
l S
ecto
rs f
or
the y
ea
r end
ed
31 M
arc
h 2
01
6
30
8
Ap
pen
dix
3.9
.1
(Ref
eren
ce:
Pa
rag
rap
h 3
.9,
Pa
ge N
o.
20
0)
Sta
tem
ent
sho
win
g t
he
ma
in s
tip
ula
tio
ns
of
Ten
der
Do
cum
ents
fo
r co
ntr
act
ors
to
co
mp
lete
wo
rks
in t
ime
an
d
rate
of
com
pen
sati
on
fo
r n
ot
ad
her
ing
th
e co
nd
itio
ns
of
con
tra
ct
Det
ail
s o
f st
ipu
lati
on
D
eta
ils
of
con
dit
ion
s to
wh
ich
co
ntr
act
or
req
uir
es t
o c
om
ply
wit
h
Pen
alt
ies/
com
pen
sati
on
s w
hen
co
ntr
act
or
fail
s to
co
mp
ly w
ith
th
e
con
dit
ion
s
Cla
use
2 o
f A
pp
end
ix
2.1
3
of
Man
ual
and
co
ndit
ions
of
cont
ract
The
Co
ntra
cto
r sh
all
be
bo
und
in
all
case
s, i
n w
hich
the
tim
e al
low
ed
for
any
wo
rk e
xcee
ds
one
mo
nth,
to
co
mp
lete
1/8
th o
f th
e w
hole
wo
rk
bef
ore
1/4
th o
f w
hole
tim
e al
low
ed u
nder
the
co
ntra
ct h
as e
lap
sed
, 3
/8th
of
the
wo
rk b
efo
re ½
of
such
tim
e ha
s el
apse
d a
nd 3
/4th
of
the
wo
rk b
efo
re 3
/4th
of
such
tim
e ha
s el
apse
d.
In
the
even
t o
f fa
ilin
g to
co
mp
ly
wit
h th
ese
cond
itio
ns,
the
Exe
cuti
ve
Eng
inee
r sh
all
lev
y o
n th
e co
ntr
acto
r as
co
mp
ensa
tio
n an
am
oun
t eq
ual
to-
1.
½ p
er c
ent
of
the
valu
e o
f w
ork
per
wee
k in
res
pec
t o
f w
ork
co
stin
g
up t
o `
2,0
0,0
00
/-
2.
3/8
per
cen
t o
f th
e va
lue
of
wo
rk p
er w
eek
in r
esp
ect
of
wo
rk c
ost
ing
abo
ve `
2,0
0,0
00
/- a
nd u
p t
o `
5,0
0,0
00
/-.
3.
¼ p
er c
ent
of
the
valu
e o
f w
ork
per
wee
k in
res
pec
t o
f w
ork
co
stin
g
abo
ve `
5,0
0,0
00
/- a
nd u
p t
o `
10
,00
,000
/-.
4.
1/8
per
cen
t o
f th
e va
lue
of
wo
rk p
er w
eek
in r
esp
ect
of
wo
rk c
ost
ing
abo
ve `
10
,00
,00
0/-
and
up
to
` 2
5,0
0,0
00
/-.
5.
1/1
6 p
er c
ent
of
the
valu
e o
f w
ork
per
wee
k in
res
pec
t o
f w
ork
co
stin
g `
25
,00,
000
/- a
nd a
bo
ve.
The
to
tal
amo
unt
of
com
pen
sati
on
und
er t
he p
rovi
sio
n o
f th
e cl
ause
sha
ll b
e li
mit
ed t
o 6
per
cen
t o
f th
e va
lue
of
wo
rk.
The
dec
isio
n o
f th
e S
uper
inte
ndin
g
Eng
inee
r sh
all
be
fina
l.
Cla
use
3
.4
(i)
of
tend
er
do
cum
ent
for
imp
lica
tio
n o
f su
bm
issi
on
of
tend
er
Thi
s p
rovi
des
tha
t T
end
erer
s ar
e ad
vise
d t
o v
isit
the
sit
e su
ffic
ien
tly
in a
dva
nce
of
the
dat
e fi
xed
fo
r su
bm
issi
on
of
tend
er.
A t
end
erer
sh
all
be
dee
med
to
hav
e fu
ll k
now
led
ge o
f th
e re
leva
nt d
ocu
men
t,
sam
ple
s, s
ite,
qua
rrie
s et
c. w
het
her
he i
nsp
ecte
d o
r no
t.
----
--
Cla
use
3
.6
of
tend
er
do
cum
ent
for
Sub
mis
sio
n o
f T
end
er
Thi
s im
pli
es t
hat
the
tend
erer
has
rea
d t
he t
end
er n
oti
ce,
cond
itio
ns
of
tend
er a
nd a
ll o
ther
co
ntra
ct d
ocu
men
ts a
nd m
ade
him
self
aw
are
of
the
stan
dar
ds,
pro
ced
ures
, th
e sc
op
e an
d s
pec
ific
atio
ns
of
the
wo
rk
to b
e d
one
and
the
sp
ecif
icat
ions
as
laid
do
wn
in t
he p
ubli
cati
ons
of
Ind
ian
Ro
ad
Co
ngre
ss
and
In
dia
n st
and
ard
s.
The
te
nder
er
sho
uld
sa
tisf
y hi
mse
lf r
egar
din
g th
e su
itab
ilit
y an
d a
vail
abil
ity
of
site
of
wo
rk e
tc.
as w
ell
as m
ater
ial
at t
he q
uarr
ies.
The
res
po
nsib
ilit
y o
f o
pen
ing
new
qua
rrie
s, c
on
stru
ctio
n a
nd m
aint
enan
ce o
f ap
pro
ache
s th
eret
o s
hall
lie
who
lly
wit
h th
e co
ntra
cto
r.
----
--
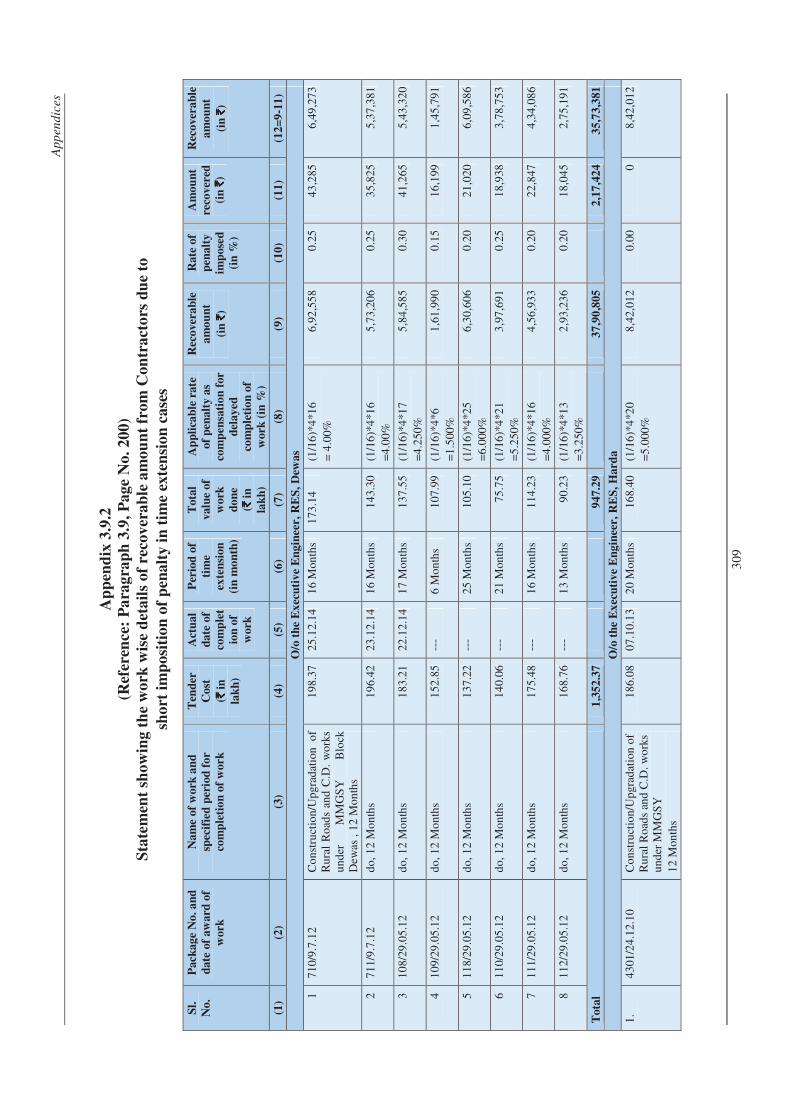
Ap
pen
dic
es
30
9
Ap
pen
dix
3.9
.2
(Ref
eren
ce:
Pa
rag
rap
h 3
.9,
Pa
ge N
o.
20
0)
Sta
tem
ent
sho
win
g t
he
wo
rk w
ise
det
ail
s o
f re
cov
era
ble
am
ou
nt
fro
m C
on
tra
cto
rs d
ue
to
sho
rt i
mp
osi
tio
n o
f p
ena
lty
in
tim
e ex
ten
sio
n c
ase
s
Sl.
No.
Pack
ag
e N
o.
an
d
date
of
aw
ard
of
work
Na
me
of
work
an
d
spec
ifie
d p
erio
d f
or
com
ple
tio
n o
f w
ork
Ten
der
Cost
(`̀̀̀ i
n
lak
h)
Act
ual
date
of
com
ple
t
ion
of
work
Per
iod
of
tim
e
exte
nsi
on
(in
mo
nth
)
Tota
l
valu
e of
work
do
ne
(`̀̀̀ i
n
lak
h)
Ap
pli
cab
le r
ate
of
pen
alt
y a
s
com
pen
sati
on
for
del
ay
ed
com
ple
tio
n o
f
work
(in
%)
Rec
over
ab
le
am
ou
nt
(in
`̀̀̀)
Rate
of
pen
alt
y
imp
ose
d
(in
%)
Am
ou
nt
reco
ver
ed
(in
`̀̀̀)
Rec
over
ab
le
am
ou
nt
(in
`̀̀̀)
(1)
(2)
(3)
(4)
(5)
(6)
(7)
(8)
(9)
(10
) (1
1)
(12
=9
-11
)
O/o
th
e E
xec
uti
ve
En
gin
eer
, R
ES
, D
ewas
1
71
0/9
.7.1
2 C
on
stru
ctio
n/U
pgr
adat
ion
o
f R
ura
l R
oad
s an
d C
.D.
wo
rks
un
der
M
MG
SY
B
lock
D
ewas
, 1
2 M
on
ths
19
8.37
2
5.1
2.1
4 1
6 M
onth
s 1
73.
14
(1/1
6)*
4*1
6
= 4
.00
%
6,9
2,5
58
0.2
5 4
3,2
85
6,4
9,2
73
2
71
1/9
.7.1
2 d
o, 1
2 M
on
ths
19
6.42
2
3.1
2.1
4 1
6 M
onth
s 1
43.
30
(1/1
6)*
4*1
6
=4
.00
%
5,7
3,2
06
0.2
5 3
5,8
25
5,3
7,3
81
3
10
8/29
.05
.12
do
, 12
Mo
nth
s 1
83.
21
22
.12
.14
17
Mon
ths
13
7.55
(1
/16
)*4
*17
=4
.250
%
5,8
4,5
85
0.3
0 4
1,2
65
5,4
3,3
20
4
10
9/29
.05
.12
do
, 12
Mo
nth
s 1
52.
85
---
6 M
on
ths
10
7.99
(1
/16
)*4
*6
=1
.500
%
1,6
1,9
90
0.1
5 1
6,1
99
1,4
5,7
91
5
11
8/29
.05
.12
do
, 12
Mo
nth
s 1
37.
22
---
25
Mon
ths
10
5.10
(1
/16
)*4
*25
=6
.000
%
6,3
0,6
06
0.2
0 2
1,0
20
6,0
9,5
86
6
11
0/29
.05
.12
do
, 12
Mo
nth
s 1
40.
06
---
21
Mon
ths
75
.75
(1/1
6)*
4*2
1
=5
.250
%
3,9
7,6
91
0.2
5 1
8,9
38
3,7
8,7
53
7
11
1/29
.05
.12
do
, 12
Mo
nth
s 1
75.
48
---
16
Mon
ths
11
4.23
(1
/16
)*4
*16
=4
.000
%
4,5
6,9
33
0.2
0 2
2,8
47
4,3
4,0
86
8
11
2/29
.05
.12
do
, 12
Mo
nth
s 1
68.
76
---
13
Mon
ths
90
.23
(1/1
6)*
4*1
3
=3
.250
%
2,9
3,2
36
0.2
0 1
8,0
45
2,7
5,1
91
Tota
l 1
,35
2.3
7
94
7.2
9
3
7,9
0,8
05
2
,17
,42
4
35
,73
,381
O/o
th
e E
xec
uti
ve
En
gin
eer
, R
ES
, H
ard
a
1.
43
01/2
4.1
2.10
Co
nst
ruct
ion/
Up
grad
atio
n o
f R
ura
l R
oad
s an
d C
.D.
wo
rks
un
der
MM
GS
Y
12
Mon
ths
18
6.08
0
7.1
0.1
3 2
0 M
onth
s 1
68.
40
(1/1
6)*
4*2
0
=5
.000
%
8,4
2,0
12
0.0
0 0
8
,42
,01
2
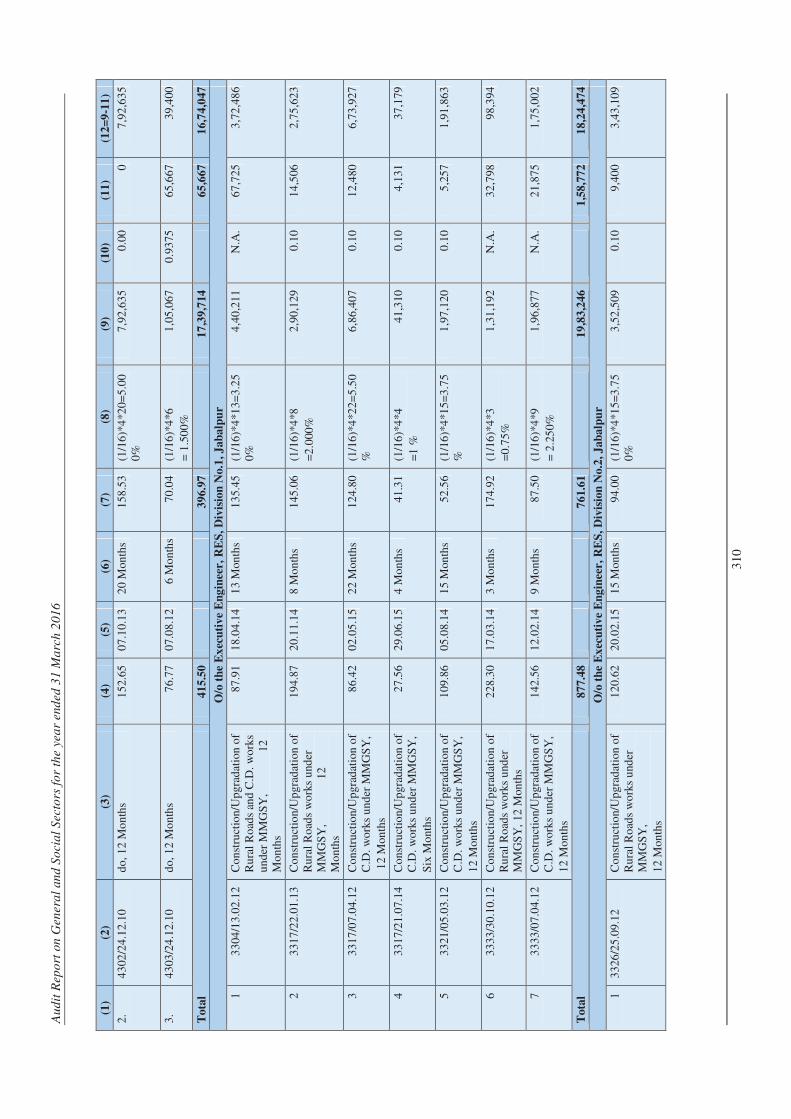
Au
dit
Rep
ort
on
Gen
era
l an
d S
ocia
l S
ecto
rs f
or
the y
ea
r end
ed
31 M
arc
h 2
01
6
31
0
(1)
(2)
(3)
(4)
(5)
(6)
(7)
(8)
(9)
(10
) (1
1)
(12
=9
-11
)
2.
43
02/2
4.1
2.10
do
, 12
Mo
nth
s 1
52.
65
07
.10
.13
20
Mon
ths
15
8.53
(1
/16
)*4
*20
=5
.00
0%
7
,92
,63
5 0
.00
0
7,9
2,6
35
3.
43
03/2
4.1
2.10
do
, 12
Mo
nth
s 7
6.7
7 0
7.0
8.1
2 6
Mo
nth
s 7
0.0
4 (1
/16
)*4
*6
= 1
.50
0%
1,0
5,0
67
0.9
375
6
5,6
67
39
,400
Tota
l 4
15.5
0
39
6.9
7
1
7,3
9,7
14
6
5,6
67
16
,74
,047
O/o
th
e E
xec
uti
ve
En
gin
eer
, R
ES
, D
ivis
ion
No.1
, J
ab
alp
ur
1
33
04/1
3.0
2.12
C
on
stru
ctio
n/U
pgr
adat
ion
of
Ru
ral
Ro
ads
and
C.D
. w
ork
s u
nd
er M
MG
SY
,
12
Mo
nth
s
87
.91
18
.04
.14
13
Mon
ths
13
5.45
(1
/16
)*4
*13
=3
.25
0%
4
,40
,21
1 N
.A.
67
,725
3
,72
,48
6
2
33
17/2
2.0
1.13
C
on
stru
ctio
n/U
pgr
adat
ion
of
Ru
ral
Ro
ads
wo
rks
und
er
MM
GS
Y,
1
2
Mo
nth
s
19
4.87
2
0.1
1.1
4 8
Mo
nth
s 1
45.
06
(1/1
6)*
4*8
=2
.000
%
2,9
0,1
29
0.1
0 1
4,5
06
2,7
5,6
23
3
33
17/0
7.0
4.12
C
on
stru
ctio
n/U
pgr
adat
ion
of
C.D
. w
ork
s u
nd
er M
MG
SY
,
12
Mon
ths
86
.42
02
.05
.15
22
Mon
ths
12
4.80
(1
/16
)*4
*22
=5
.50
%
6,8
6,4
07
0.1
0 1
2,4
80
6,7
3,9
27
4
33
17/2
1.0
7.14
C
on
stru
ctio
n/U
pgr
adat
ion
of
C.D
. w
ork
s u
nd
er M
MG
SY
,
Six
Mo
nth
s
27
.56
29
.06
.15
4 M
on
ths
41
.31
(1/1
6)*
4*4
=1
%
41
,310
0
.10
4,1
31
37
,179
5
33
21/0
5.0
3.12
C
on
stru
ctio
n/U
pgr
adat
ion
of
C.D
. w
ork
s u
nd
er M
MG
SY
,
12
Mon
ths
10
9.86
0
5.0
8.1
4 1
5 M
onth
s 5
2.5
6 (1
/16
)*4
*15
=3
.75
%
1,9
7,1
20
0.1
0 5
,25
7 1
,91
,86
3
6
33
33/3
0.1
0.12
C
on
stru
ctio
n/U
pgr
adat
ion
of
Ru
ral
Ro
ads
wo
rks
und
er
MM
GS
Y,
12
Mon
ths
22
8.30
1
7.0
3.1
4 3
Mo
nth
s 1
74.
92
(1/1
6)*
4*3
=0
.75
%
1,3
1,1
92
N.A
. 3
2,7
98
98
,394
7
33
33/0
7.0
4.12
C
on
stru
ctio
n/U
pgr
adat
ion
of
C.D
. w
ork
s u
nd
er M
MG
SY
,
12
Mon
ths
14
2.56
1
2.0
2.1
4 9
Mo
nth
s 8
7.5
0 (1
/16
)*4
*9
= 2
.25
0%
1,9
6,8
77
N.A
. 2
1,8
75
1,7
5,0
02
Tota
l 8
77.4
8
76
1.6
1
1
9,8
3,2
46
1
,58
,77
2
18
,24
,474
O/o
th
e E
xec
uti
ve
En
gin
eer
, R
ES
, D
ivis
ion
No.2
, J
ab
alp
ur
1
33
26/2
5.0
9.12
C
on
stru
ctio
n/U
pgr
adat
ion
of
Ru
ral
Ro
ads
wo
rks
und
er
MM
GS
Y,
12
Mon
ths
12
0.62
2
0.0
2.1
5 1
5 M
onth
s 9
4.0
0 (1
/16
)*4
*15
=3
.75
0%
3
,52
,50
9 0
.10
9,4
00
3,4
3,1
09
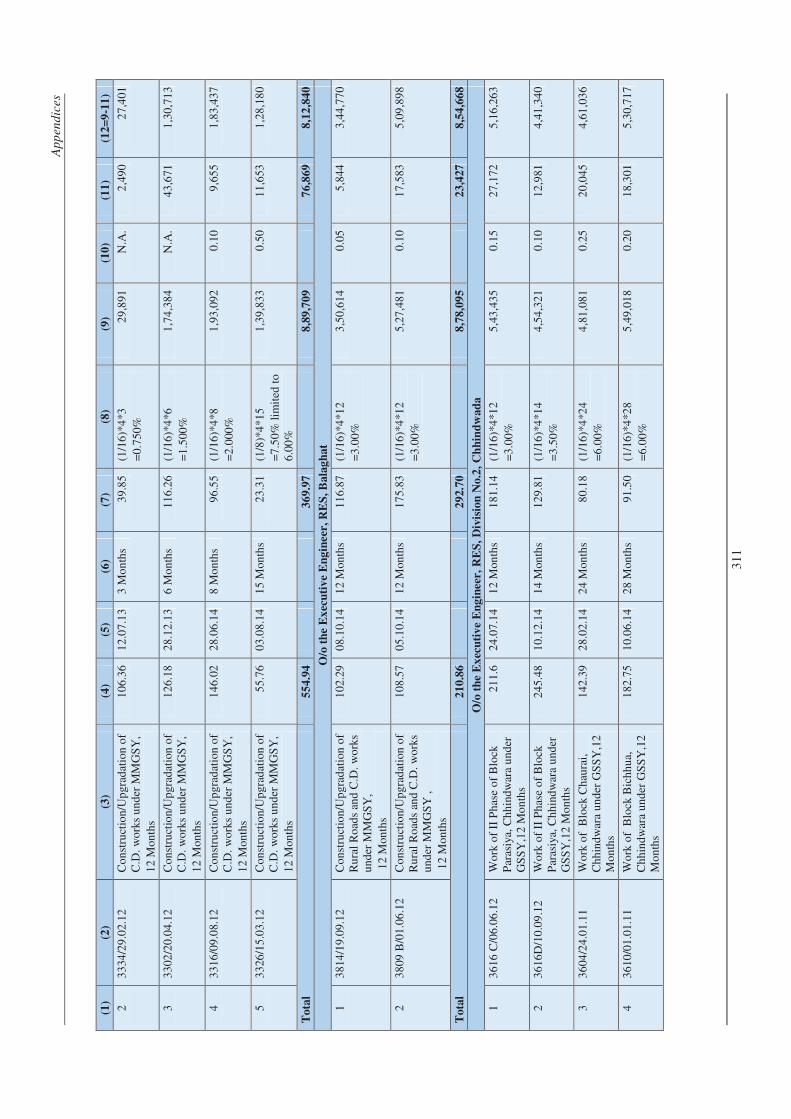
Ap
pen
dic
es
31
1
(1)
(2)
(3)
(4)
(5)
(6)
(7)
(8)
(9)
(10
) (1
1)
(12
=9
-11
)
2
33
34/2
9.0
2.12
C
on
stru
ctio
n/U
pgr
adat
ion
of
C.D
. w
ork
s u
nd
er M
MG
SY
,
12
Mon
ths
10
6.36
1
2.0
7.1
3 3
Mo
nth
s 3
9.8
5 (1
/16
)*4
*3
=0
.750
%
29
,891
N
.A.
2,4
90
27
,401
3
33
02/2
0.0
4.12
C
on
stru
ctio
n/U
pgr
adat
ion
of
C.D
. w
ork
s u
nd
er M
MG
SY
,
12
Mon
ths
12
6.18
2
8.1
2.1
3 6
Mo
nth
s 1
16.
26
(1/1
6)*
4*6
=1
.500
%
1,7
4,3
84
N.A
. 4
3,6
71
1,3
0,7
13
4
33
16/0
9.0
8.12
C
on
stru
ctio
n/U
pgr
adat
ion
of
C.D
. w
ork
s u
nd
er M
MG
SY
,
12
Mon
ths
14
6.02
2
8.0
6.1
4 8
Mo
nth
s 9
6.5
5 (1
/16
)*4
*8
=2
.000
%
1,9
3,0
92
0.1
0 9
,65
5 1
,83
,43
7
5
33
26/1
5.0
3.12
C
on
stru
ctio
n/U
pgr
adat
ion
of
C.D
. w
ork
s u
nd
er M
MG
SY
,
12
Mon
ths
55
.76
03
.08
.14
15
Mon
ths
23
.31
(1/8
)*4
*15
=7
.50
% l
imit
ed t
o
6.0
0%
1,3
9,8
33
0.5
0 1
1,6
53
1,2
8,1
80
Tota
l 5
54.9
4
36
9.9
7
8
,89
,70
9
7
6,8
69
8,1
2,8
40
O/o
th
e E
xec
uti
ve
En
gin
eer
, R
ES
, B
ala
gh
at
1
38
14/1
9.0
9.12
C
on
stru
ctio
n/U
pgr
adat
ion
of
Ru
ral
Ro
ads
and
C.D
. w
ork
s u
nd
er M
MG
SY
,
12
Mon
ths
10
2.29
0
8.1
0.1
4 1
2 M
onth
s 1
16.
87
(1/1
6)*
4*1
2
=3
.00
%
3,5
0,6
14
0.0
5 5
,84
4 3
,44
,77
0
2
38
09 B
/01.
06.1
2 C
on
stru
ctio
n/U
pgr
adat
ion
of
Ru
ral
Ro
ads
and
C.D
. w
ork
s u
nd
er M
MG
SY
,
12
Mon
ths
10
8.57
0
5.1
0.1
4 1
2 M
onth
s 1
75.
83
(1/1
6)*
4*1
2
=3
.00
%
5,2
7,4
81
0.1
0 1
7,5
83
5,0
9,8
98
Tota
l 2
10.8
6
29
2.7
0
8
,78
,09
5
2
3,4
27
8,5
4,6
68
O/o
th
e E
xec
uti
ve
En
gin
eer
, R
ES
, D
ivis
ion
No.2
, C
hh
ind
wad
a
1
36
16 C
/06.
06.1
2 W
ork
of
II P
has
e o
f B
lock
P
aras
iya,
Ch
hin
dw
ara
un
der
G
SS
Y,1
2 M
on
ths
21
1.6
24
.07
.14
12
Mon
ths
18
1.14
(1
/16
)*4
*12
=3
.00
%
5,4
3,4
35
0.1
5 2
7,1
72
5,1
6,2
63
2
36
16D
/10
.09
.12
Wo
rk o
f II
Ph
ase
of
Blo
ck
Par
asiy
a, C
hh
ind
war
a u
nd
er
GS
SY
,12
Mo
nth
s
24
5.48
1
0.1
2.1
4 1
4 M
onth
s 1
29.
81
(1/1
6)*
4*1
4
=3
.50
%
4,5
4,3
21
0.1
0 1
2,9
81
4,4
1,3
40
3
36
04/2
4.0
1.11
W
ork
of
Blo
ck C
hau
rai,
C
hh
ind
war
a u
nd
er G
SS
Y,1
2
Mo
nth
s
14
2.39
2
8.0
2.1
4 2
4 M
onth
s 8
0.1
8 (1
/16
)*4
*24
=6
.00
%
4,8
1,0
81
0.2
5 2
0,0
45
4,6
1,0
36
4
36
10/0
1.0
1.11
W
ork
of
Blo
ck B
ich
hu
a,
Ch
hin
dw
ara
un
der
GS
SY
,12
M
on
ths
18
2.75
1
0.0
6.1
4 2
8 M
onth
s 9
1.5
0 (1
/16
)*4
*28
=6
.00
%
5,4
9,0
18
0.2
0 1
8,3
01
5,3
0,7
17
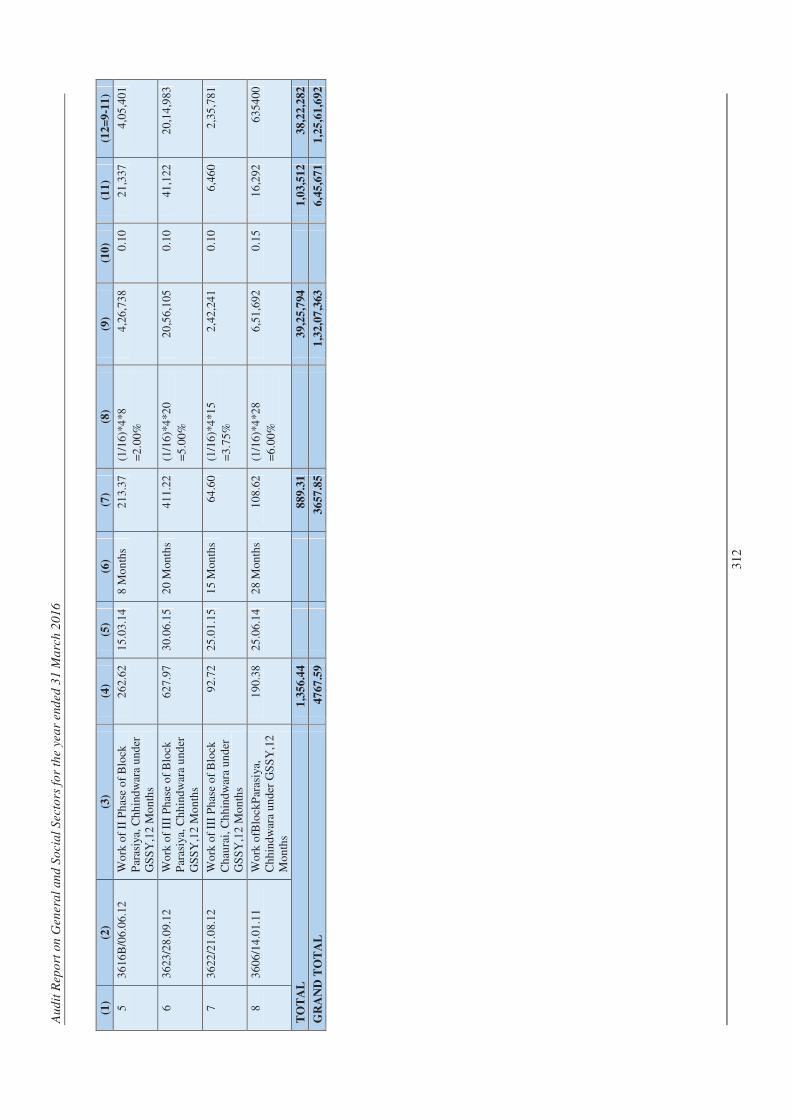
Au
dit
Rep
ort
on
Gen
era
l an
d S
ocia
l S
ecto
rs f
or
the y
ea
r end
ed
31 M
arc
h 2
01
6
31
2
(1)
(2)
(3)
(4)
(5)
(6)
(7)
(8)
(9)
(10
) (1
1)
(12
=9
-11
)
5
36
16B
/06
.06.
12
Wo
rk o
f II
Ph
ase
of
Blo
ck
Par
asiy
a, C
hh
ind
war
a u
nd
er
GS
SY
,12
Mo
nth
s
26
2.62
1
5.0
3.1
4 8
Mo
nth
s 2
13.
37
(1/1
6)*
4*8
=2
.00
%
4,2
6,7
38
0.1
0 2
1,3
37
4,0
5,4
01
6
36
23/2
8.0
9.12
W
ork
of
III
Ph
ase
of
Blo
ck
Par
asiy
a, C
hh
ind
war
a u
nd
er
GS
SY
,12
Mo
nth
s
62
7.97
3
0.0
6.1
5 2
0 M
onth
s 4
11.
22
(1/1
6)*
4*2
0
=5
.00
%
20
,56
,105
0
.10
41
,122
2
0,1
4,9
83
7
36
22/2
1.0
8.12
W
ork
of
III
Ph
ase
of
Blo
ck
Ch
aura
i, C
hh
ind
war
a u
nd
er
GS
SY
,12
Mo
nth
s
92
.72
25
.01
.15
15
Mon
ths
64
.60
(1/1
6)*
4*1
5
=3
.75
%
2,4
2,2
41
0.1
0 6
,46
0 2
,35
,78
1
8
36
06/1
4.0
1.11
W
ork
ofB
lock
Par
asiy
a,
Ch
hin
dw
ara
un
der
GS
SY
,12
M
on
ths
19
0.38
2
5.0
6.1
4 2
8 M
onth
s 1
08.
62
(1/1
6)*
4*2
8
=6
.00
%
6,5
1,6
92
0.1
5 1
6,2
92
63
5400
TO
TA
L
1,3
56
.44
88
9.3
1
3
9,2
5,7
94
1
,03
,51
2
38
,22
,282
GR
AN
D T
OT
AL
4
767
.59
36
57
.85
1
,32
,07
,363
6
,45
,67
1
1,2
5,6
1,6
92
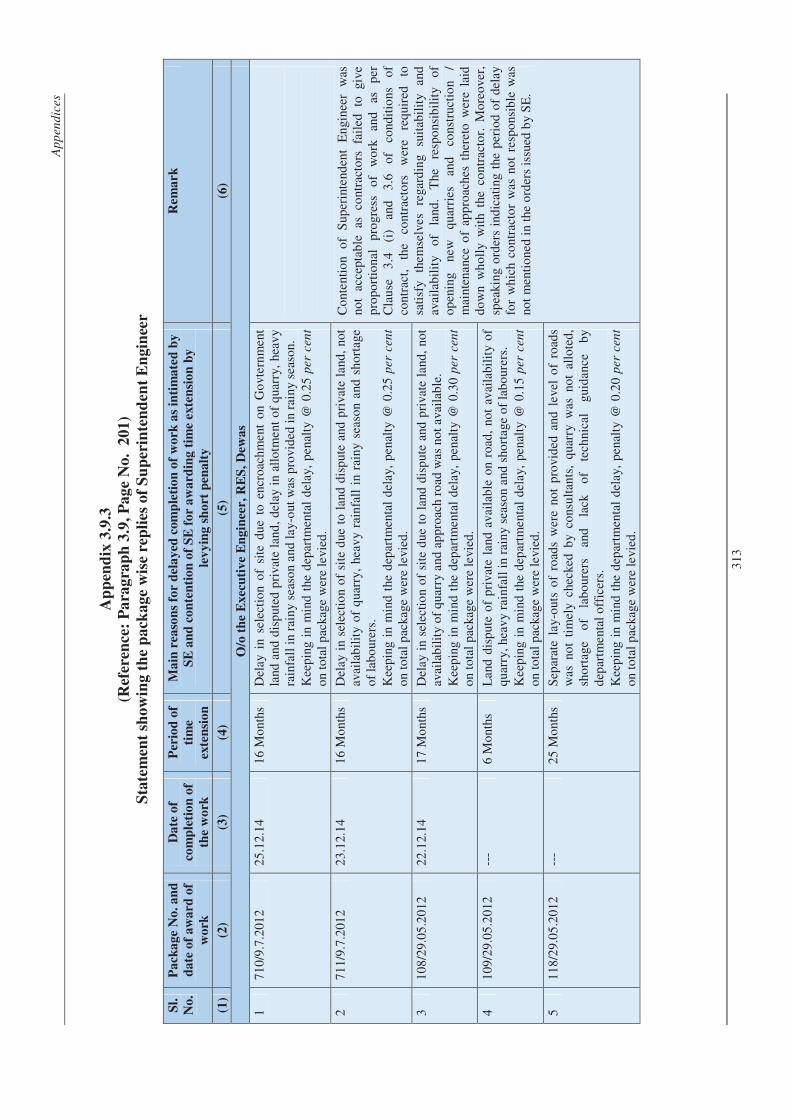
Ap
pen
dic
es
31
3
Ap
pen
dix
3.9
.3
(Ref
eren
ce:
Pa
rag
rap
h 3
.9,
Pa
ge N
o.
20
1)
Sta
tem
ent
sho
win
g t
he
pa
cka
ge
wis
e re
pli
es o
f S
up
erin
ten
den
t E
ngin
eer
Sl.
No
.
Pa
cka
ge
No
. a
nd
da
te o
f aw
ard
of
wo
rk
Da
te o
f
com
ple
tio
n o
f
the
wo
rk
Per
iod
of
tim
e
exte
nsi
on
Ma
in r
easo
ns
for
del
ay
ed c
om
ple
tio
n o
f w
ork
as
inti
ma
ted
by
SE
an
d c
on
ten
tio
n o
f S
E f
or
aw
ard
ing
tim
e exte
nsi
on
by
lev
yin
g s
ho
rt p
ena
lty
Rem
ark
(1)
(2)
(3)
(4)
(5)
(6)
O/o
th
e E
xec
uti
ve
En
gin
eer,
RE
S,
Dew
as
1
71
0/9
.7.2
012
25
.12.
14
16
Mo
nths
D
elay
in
sele
ctio
n o
f si
te d
ue
to e
ncro
ach
men
t o
n G
ovt
ern
men
t la
nd a
nd d
isp
uted
pri
vate
lan
d,
del
ay i
n al
lotm
ent
of
qua
rry,
hea
vy
rain
fall
in
rain
y se
aso
n an
d l
ay-o
ut w
as p
rovi
ded
in
rain
y se
aso
n.
Kee
pin
g in
min
d t
he d
epar
tmen
tal
del
ay,
pen
alty
@ 0
.25
per
cen
t o
n to
tal
pac
kage
wer
e le
vied
.
Co
nten
tio
n
of
Sup
erin
tend
ent
En
gine
er
was
no
t ac
cep
tab
le
as
cont
ract
ors
fa
iled
to
gi
ve
pro
port
iona
l p
rogr
ess
of
wo
rk
and
as
p
er
Cla
use
3
.4
(i)
and
3
.6
of
cond
itio
ns
of
cont
ract
, th
e co
ntra
cto
rs
wer
e re
qui
red
to
sa
tisf
y th
emse
lves
re
gard
ing
su
itab
ilit
y an
d
avai
lab
ilit
y o
f la
nd.
The
re
spo
nsib
ilit
y o
f o
pen
ing
new
q
uarr
ies
and
co
nstr
ucti
on
/ m
aint
enan
ce o
f ap
pro
ache
s th
eret
o w
ere
laid
d
ow
n w
ho
lly
wit
h th
e co
ntra
cto
r. M
ore
ove
r,
spea
king
ord
ers
ind
icat
ing
the
per
iod
of
del
ay
for
wh
ich
co
ntra
cto
r w
as n
ot
resp
ons
ible
was
no
t m
enti
one
d i
n th
e o
rder
s is
sued
by
SE
.
2
71
1/9
.7.2
012
23
.12.
14
16
Mo
nths
D
elay
in
sele
ctio
n o
f si
te d
ue t
o l
and
dis
put
e an
d p
riva
te l
and
, no
t av
aila
bil
ity
of
qua
rry,
hea
vy
rain
fall
in
rain
y se
aso
n an
d s
ho
rtag
e o
f la
bo
urer
s.
Kee
pin
g in
min
d t
he d
epar
tmen
tal
del
ay,
pen
alty
@ 0
.25
per
cen
t o
n to
tal
pac
kage
wer
e le
vied
.
3
10
8/2
9.0
5.2
012
2
2.1
2.1
4 1
7 M
ont
hs
Del
ay i
n se
lect
ion
of
site
due
to
lan
d d
isp
ute
and
pri
vate
lan
d,
not
avai
lab
ilit
y o
f q
uarr
y an
d a
pp
roac
h ro
ad w
as n
ot
avai
lab
le.
Kee
pin
g in
min
d t
he d
epar
tmen
tal
del
ay,
pen
alty
@ 0
.30
per
cen
t o
n to
tal
pac
kage
wer
e le
vied
.
4
10
9/2
9.0
5.2
012
--
- 6
Mo
nths
L
and
dis
put
e o
f p
riva
te l
and
ava
ilab
le o
n ro
ad,
not
avai
labi
lity
of
qua
rry,
hea
vy
rain
fall
in
rain
y se
aso
n an
d s
hort
age
of
lab
our
ers.
K
eep
ing
in m
ind
the
dep
artm
enta
l d
elay
, p
enal
ty @
0.1
5 p
er
cen
t o
n to
tal
pac
kage
wer
e le
vied
.
5
11
8/2
9.0
5.2
012
--
- 2
5 M
ont
hs
Sep
arat
e la
y-o
uts
of
road
s w
ere
not
pro
vid
ed a
nd l
evel
of
road
s w
as n
ot
tim
ely
chec
ked
by
cons
ult
ants
, q
uarr
y w
as n
ot
allo
ted
, sh
ort
age
of
lab
our
ers
and
la
ck
of
tech
nica
l gu
idan
ce
by
dep
artm
enta
l o
ffic
ers.
K
eep
ing
in m
ind
the
dep
artm
enta
l d
elay
, p
enal
ty @
0.2
0 p
er
cen
t o
n to
tal
pac
kage
wer
e le
vied
.
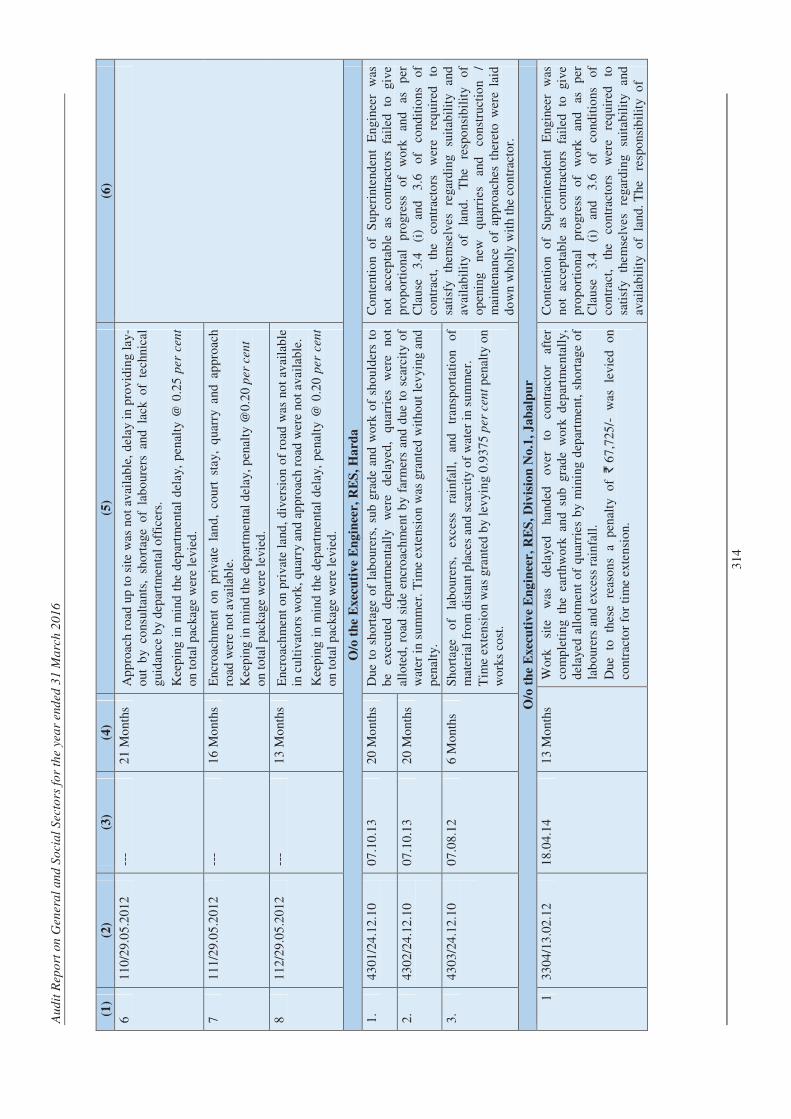
Au
dit
Rep
ort
on
Gen
era
l an
d S
ocia
l S
ecto
rs f
or
the y
ea
r end
ed
31 M
arc
h 2
01
6
31
4
(1)
(2)
(3)
(4)
(5)
(6)
6
11
0/2
9.0
5.2
012
--
- 2
1 M
ont
hs
Ap
pro
ach
road
up
to
site
was
no
t av
aila
ble
, d
elay
in
pro
vid
ing
lay-
out
by
cons
ulta
nts,
sho
rtag
e o
f la
bo
urer
s an
d l
ack
of
tech
nica
l gu
idan
ce b
y d
epar
tmen
tal
off
icer
s.
Kee
pin
g in
min
d t
he d
epar
tmen
tal
del
ay,
pen
alty
@ 0
.25
per
cen
t o
n to
tal
pac
kage
wer
e le
vied
.
7
11
1/2
9.0
5.2
012
--
- 1
6 M
ont
hs
Enc
roac
hm
ent
on
pri
vate
lan
d,
cour
t st
ay,
qua
rry
and
ap
pro
ach
road
wer
e no
t av
aila
ble
. K
eep
ing
in m
ind
the
dep
artm
enta
l d
elay
, p
enal
ty @
0.2
0 p
er
cen
t o
n to
tal
pac
kage
wer
e le
vied
.
8
11
2/2
9.0
5.2
012
--
- 1
3 M
ont
hs
Enc
roac
hm
ent
on
pri
vate
lan
d,
div
ersi
on
of
road
was
no
t av
aila
ble
in
cul
tiva
tors
wo
rk,
qua
rry
and
ap
pro
ach
road
wer
e no
t av
aila
ble
.
Kee
pin
g in
min
d t
he d
epar
tmen
tal
del
ay,
pen
alty
@ 0
.20
per
cen
t o
n to
tal
pac
kage
wer
e le
vied
.
O/o
th
e E
xec
uti
ve
En
gin
eer,
RE
S,
Ha
rda
1.
43
01
/24
.12
.10
07
.10.
13
20
Mo
nths
D
ue t
o s
hort
age
of
lab
our
ers,
sub
gra
de
and
wo
rk o
f sh
ou
lder
s to
b
e ex
ecut
ed
dep
artm
enta
lly
w
ere
del
ayed
, q
uarr
ies
wer
e no
t al
lote
d,
road
sid
e en
cro
achm
ent
by
farm
ers
and
due
to
sca
rcit
y o
f w
ater
in
sum
mer
. T
ime
exte
nsio
n w
as g
rant
ed w
itho
ut l
evyi
ng a
nd
pen
alty
.
Co
nten
tio
n
of
Sup
erin
tend
ent
En
gine
er
was
no
t ac
cep
tab
le
as
cont
ract
ors
fa
iled
to
gi
ve
pro
port
iona
l p
rogr
ess
of
wo
rk
and
as
p
er
Cla
use
3
.4
(i)
and
3
.6
of
cond
itio
ns
of
cont
ract
, th
e co
ntra
cto
rs
wer
e re
qui
red
to
sa
tisf
y th
emse
lves
re
gard
ing
su
itab
ilit
y an
d
avai
lab
ilit
y o
f la
nd.
The
re
spo
nsib
ilit
y o
f o
pen
ing
new
q
uarr
ies
and
co
nstr
ucti
on
/ m
aint
enan
ce o
f ap
pro
ache
s th
eret
o w
ere
laid
d
ow
n w
ho
lly
wit
h th
e co
ntr
acto
r.
2.
43
02
/24
.12
.10
07
.10.
13
20
Mo
nths
3.
43
03
/24
.12
.10
07
.08.
12
6 M
ont
hs
Sho
rtag
e o
f la
bo
urer
s,
exce
ss
rain
fall
, an
d
tran
spo
rtat
ion
of
mat
eria
l fr
om
dis
tant
pla
ces
and
sca
rcit
y o
f w
ater
in
sum
mer
. T
ime
exte
nsi
on
was
gra
nted
by
lev
yin
g 0
.93
75
per
cen
t p
enal
ty o
n
wo
rks
cost
.
O/o
th
e E
xec
uti
ve
En
gin
eer,
RE
S,
Div
isio
n N
o.1
, J
ab
alp
ur
1
33
04
/13
.02
.12
18
.04.
14
13
Mo
nths
W
ork
si
te
was
d
elay
ed
han
ded
o
ver
to
cont
ract
or
afte
r co
mp
leti
ng
the
eart
hw
ork
an
d s
ub g
rad
e w
ork
dep
artm
enta
lly,
d
elay
ed a
llo
tmen
t o
f q
uarr
ies
by
min
ing
dep
artm
ent,
sho
rtag
e o
f la
bo
urer
s an
d e
xces
s ra
infa
ll.
Due
to
th
ese
reas
on
s a
pen
alty
o
f `
67
,725
/-
was
le
vied
o
n co
ntra
cto
r fo
r ti
me
exte
nsi
on.
Co
nten
tio
n
of
Sup
erin
tend
ent
En
gine
er
was
no
t ac
cep
tab
le
as
cont
ract
ors
fa
iled
to
gi
ve
pro
port
iona
l p
rogr
ess
of
wo
rk
and
as
p
er
Cla
use
3
.4
(i)
and
3
.6
of
cond
itio
ns
of
cont
ract
, th
e co
ntra
cto
rs
wer
e re
qui
red
to
sa
tisf
y th
emse
lves
re
gard
ing
su
itab
ilit
y an
d
avai
lab
ilit
y o
f l
and
. T
he
res
po
nsib
ilit
y o
f
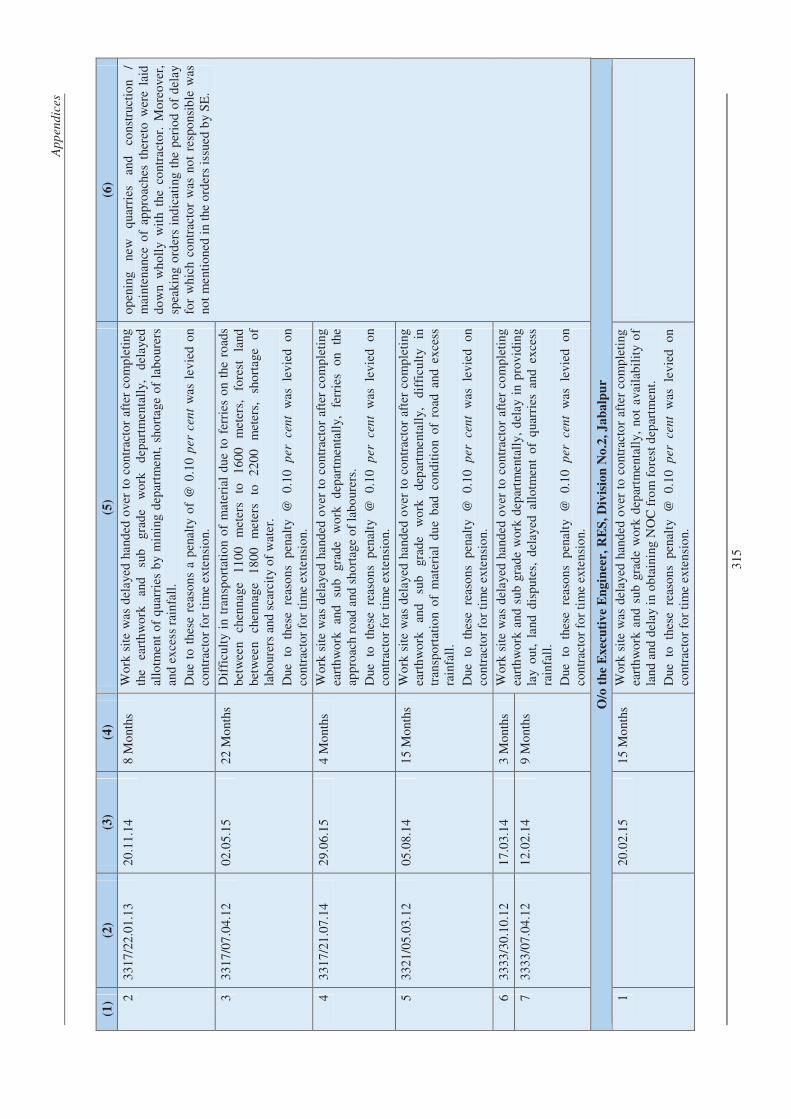
Ap
pen
dic
es
31
5
(1)
(2)
(3)
(4)
(5)
(6)
2
33
17
/22
.01
.13
20
.11.
14
8 M
ont
hs
Wo
rk s
ite
was
del
ayed
han
ded
ove
r to
co
ntra
cto
r af
ter
com
ple
ting
th
e ea
rth
wo
rk
and
su
b
grad
e w
ork
d
epar
tmen
tall
y,
del
ayed
al
lotm
ent
of
qua
rrie
s b
y m
inin
g d
epar
tmen
t, s
hort
age
of
lab
our
ers
and
exc
ess
rain
fall
.
Due
to
the
se r
easo
ns
a p
enal
ty o
f @
0.1
0 p
er
cen
t w
as l
evie
d o
n co
ntra
cto
r fo
r ti
me
exte
nsi
on.
op
enin
g ne
w
qua
rrie
s an
d
cons
truc
tio
n /
mai
nten
ance
of
app
roac
hes
ther
eto
wer
e la
id
do
wn
wh
oll
y w
ith
the
cont
ract
or.
Mo
reo
ver,
sp
eaki
ng o
rder
s in
dic
atin
g t
he p
erio
d o
f d
elay
fo
r w
hic
h c
ont
ract
or
was
no
t re
spo
nsib
le w
as
not
men
tio
ned
in
the
ord
ers
issu
ed b
y S
E.
3
33
17
/07
.04
.12
02
.05.
15
22
Mo
nths
D
iffi
cult
y in
tra
nsp
ort
atio
n o
f m
ater
ial
due
to
fer
ries
on
the
road
s b
etw
een
chen
nage
1
10
0
met
ers
to
16
00
m
eter
s,
fore
st
land
b
etw
een
chen
nage
1
80
0
met
ers
to
22
00
m
eter
s,
sho
rtag
e o
f la
bo
urer
s an
d s
carc
ity
of
wat
er.
Due
to
th
ese
reas
on
s p
enal
ty
@
0.1
0
per
cen
t w
as
lev
ied
o
n co
ntra
cto
r fo
r ti
me
exte
nsi
on.
4
33
17
/21
.07
.14
29
.06.
15
4 M
ont
hs
Wo
rk s
ite
was
del
ayed
han
ded
ove
r to
co
ntra
cto
r af
ter
com
ple
ting
ea
rth
wo
rk
and
su
b
grad
e w
ork
d
epar
tmen
tall
y,
ferr
ies
on
the
app
roac
h ro
ad a
nd s
hort
age
of
lab
our
ers.
Due
to
th
ese
reas
on
s p
enal
ty
@
0.1
0
per
cen
t w
as
lev
ied
o
n co
ntra
cto
r fo
r ti
me
exte
nsi
on.
5
33
21
/05
.03
.12
05
.08.
14
15
Mo
nths
W
ork
sit
e w
as d
elay
ed h
and
ed o
ver
to c
ont
ract
or
afte
r co
mp
leti
ng
eart
hw
ork
an
d
sub
gr
ade
wo
rk
dep
artm
enta
lly,
d
iffi
cult
y in
tr
ansp
ort
atio
n o
f m
ater
ial
du
e b
ad c
ond
itio
n o
f ro
ad a
nd e
xces
s ra
infa
ll.
Due
to
th
ese
reas
on
s p
enal
ty
@
0.1
0
per
cen
t w
as
lev
ied
o
n co
ntra
cto
r fo
r ti
me
exte
nsi
on.
6
33
33
/30
.10
.12
17
.03.
14
3 M
ont
hs
Wo
rk s
ite
was
del
ayed
han
ded
ove
r to
co
ntra
cto
r af
ter
com
ple
ting
ea
rth
wo
rk a
nd s
ub g
rad
e w
ork
dep
artm
enta
lly,
del
ay i
n p
rovi
din
g la
y o
ut,
land
dis
put
es,
del
ayed
all
otm
ent
of
qua
rrie
s an
d e
xces
s ra
infa
ll.
Due
to
th
ese
reas
on
s p
enal
ty
@
0.1
0
per
cen
t w
as
lev
ied
o
n co
ntra
cto
r fo
r ti
me
exte
nsi
on.
7
33
33
/07
.04
.12
12
.02.
14
9 M
ont
hs O
/o t
he
Exec
uti
ve
En
gin
eer,
RE
S,
Div
isio
n N
o.2
, J
ab
alp
ur
1
2
0.0
2.1
5 1
5 M
ont
hs
Wo
rk s
ite
was
del
ayed
han
ded
ove
r to
co
ntra
cto
r af
ter
com
ple
ting
ea
rth
wo
rk a
nd s
ub g
rad
e w
ork
dep
artm
enta
lly,
no
t av
aila
bil
ity
of
land
and
del
ay i
n o
bta
inin
g N
OC
fro
m f
ore
st d
epar
tmen
t.
Due
to
th
ese
reas
on
s p
enal
ty
@
0.1
0
per
cen
t w
as
lev
ied
o
n co
ntra
cto
r fo
r ti
me
exte
nsi
on.
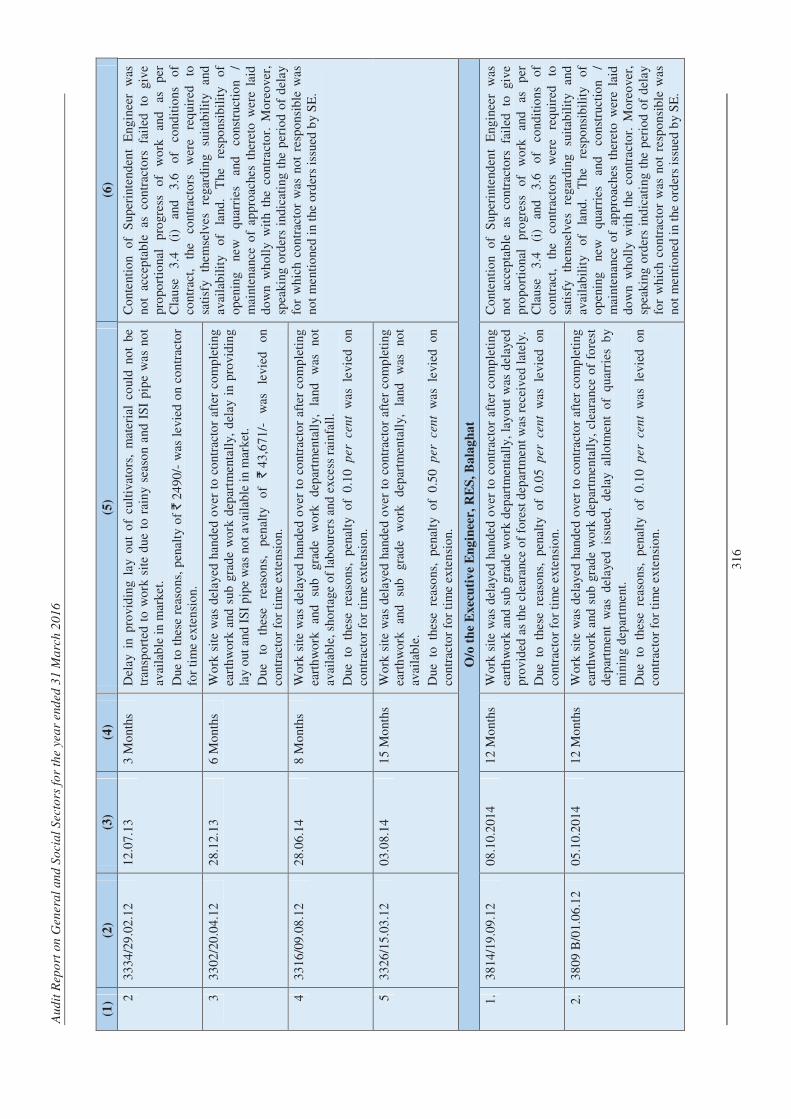
Au
dit
Rep
ort
on
Gen
era
l an
d S
ocia
l S
ecto
rs f
or
the y
ea
r end
ed
31 M
arc
h 2
01
6
31
6
(1)
(2)
(3)
(4)
(5)
(6)
2
33
34
/29
.02
.12
12
.07.
13
3 M
ont
hs
Del
ay i
n p
rovi
din
g la
y o
ut
of
cult
ivat
ors
, m
ater
ial
coul
d n
ot
be
tran
spo
rted
to
wo
rk s
ite
due
to
rai
ny
seas
on
and
IS
I p
ipe
was
no
t av
aila
ble
in
mar
ket.
Due
to
the
se r
easo
ns,
pen
alty
of `
24
90
/- w
as l
evie
d o
n co
ntr
acto
r fo
r ti
me
exte
nsi
on.
Co
nten
tio
n
of
Sup
erin
tend
ent
En
gine
er
was
no
t ac
cep
tab
le
as
cont
ract
ors
fa
iled
to
gi
ve
pro
port
iona
l p
rogr
ess
of
wo
rk
and
as
p
er
Cla
use
3
.4
(i)
and
3
.6
of
cond
itio
ns
of
cont
ract
, th
e co
ntra
cto
rs
wer
e re
qui
red
to
sa
tisf
y th
emse
lves
re
gard
ing
su
itab
ilit
y an
d
avai
lab
ilit
y o
f la
nd.
The
re
spo
nsib
ilit
y o
f o
pen
ing
new
q
uarr
ies
and
co
nstr
ucti
on
/ m
aint
enan
ce o
f ap
pro
ache
s th
eret
o w
ere
laid
d
ow
n w
ho
lly
wit
h th
e co
ntra
cto
r. M
ore
ove
r,
spea
king
ord
ers
ind
icat
ing
the
per
iod
of
del
ay
for
wh
ich
co
ntra
cto
r w
as n
ot
resp
ons
ible
was
no
t m
enti
one
d i
n th
e o
rder
s is
sued
by
SE
.
3
33
02
/20
.04
.12
28
.12.
13
6 M
ont
hs
Wo
rk s
ite
was
del
ayed
han
ded
ove
r to
co
ntra
cto
r af
ter
com
ple
ting
ea
rth
wo
rk a
nd s
ub g
rad
e w
ork
dep
artm
enta
lly,
del
ay i
n p
rovi
din
g
lay
out
and
IS
I p
ipe
was
no
t av
aila
ble
in
mar
ket.
Due
to
th
ese
reas
on
s,
pen
alty
o
f `
43
,67
1/-
w
as
levi
ed
on
cont
ract
or
for
tim
e ex
ten
sio
n.
4
33
16
/09
.08
.12
28
.06.
14
8 M
ont
hs
Wo
rk s
ite
was
del
ayed
han
ded
ove
r to
co
ntra
cto
r af
ter
com
ple
ting
ea
rth
wo
rk
and
su
b
grad
e w
ork
d
epar
tmen
tall
y,
land
w
as
not
avai
lab
le,
sho
rtag
e o
f la
bo
urer
s an
d e
xces
s ra
infa
ll.
Due
to
th
ese
reas
ons
, p
enal
ty
of
0.1
0
per
cen
t w
as
levi
ed
on
cont
ract
or
for
tim
e ex
ten
sio
n.
5
33
26
/15
.03
.12
03
.08.
14
15
Mo
nths
W
ork
sit
e w
as d
elay
ed h
and
ed o
ver
to c
ont
ract
or
afte
r co
mp
leti
ng
eart
hw
ork
an
d
sub
gr
ade
wo
rk
dep
artm
enta
lly,
la
nd
was
no
t av
aila
ble
.
Due
to
th
ese
reas
ons
, p
enal
ty
of
0.5
0
per
cen
t w
as
levi
ed
on
cont
ract
or
for
tim
e ex
ten
sio
n.
O/o
th
e E
xec
uti
ve
En
gin
eer,
RE
S,
Ba
lag
ha
t
1.
38
14
/19
.09
.12
08
.10.
201
4 1
2 M
ont
hs
Wo
rk s
ite
was
del
ayed
han
ded
ove
r to
co
ntra
cto
r af
ter
com
ple
ting
ea
rth
wo
rk a
nd s
ub g
rad
e w
ork
dep
artm
enta
lly,
lay
out
was
del
ayed
p
rovi
ded
as
the
clea
ranc
e o
f fo
rest
dep
artm
ent
was
rec
eive
d l
atel
y.
Due
to
th
ese
reas
ons
, p
enal
ty
of
0.0
5
per
cen
t w
as
levi
ed
on
cont
ract
or
for
tim
e ex
ten
sio
n.
Co
nten
tio
n
of
Sup
erin
tend
ent
En
gine
er
was
no
t ac
cep
tab
le
as
cont
ract
ors
fa
iled
to
gi
ve
pro
port
iona
l p
rogr
ess
of
wo
rk
and
as
p
er
Cla
use
3
.4
(i)
and
3
.6
of
cond
itio
ns
of
cont
ract
, th
e co
ntra
cto
rs
wer
e re
qui
red
to
sa
tisf
y th
emse
lves
re
gard
ing
su
itab
ilit
y an
d
avai
lab
ilit
y o
f la
nd.
The
re
spo
nsib
ilit
y o
f o
pen
ing
new
q
uarr
ies
and
co
nstr
ucti
on
/ m
aint
enan
ce o
f ap
pro
ache
s th
eret
o w
ere
laid
d
ow
n w
ho
lly
wit
h th
e co
ntra
cto
r. M
ore
ove
r,
spea
king
ord
ers
ind
icat
ing
the
per
iod
of
del
ay
for
wh
ich
co
ntra
cto
r w
as n
ot
resp
ons
ible
was
no
t m
enti
one
d i
n th
e o
rder
s is
sued
by
SE
.
2.
38
09
B/0
1.0
6.1
2 0
5.1
0.2
014
12
Mo
nths
W
ork
sit
e w
as d
elay
ed h
and
ed o
ver
to c
ont
ract
or
afte
r co
mp
leti
ng
eart
hw
ork
and
sub
gra
de
wo
rk d
epar
tmen
tall
y, c
lear
ance
of
fore
st
dep
artm
ent
was
del
ayed
iss
ued
, d
elay
all
otm
ent
of
qua
rrie
s b
y m
inin
g d
epar
tmen
t.
Due
to
th
ese
reas
ons
, p
enal
ty
of
0.1
0
per
cen
t w
as
levi
ed
on
cont
ract
or
for
tim
e ex
ten
sio
n.

Ap
pen
dic
es
31
7
(1)
(2)
(3)
(4)
(5)
(6)
O/o
th
e E
xec
uti
ve
En
gin
eer,
RE
S,
Div
isio
n N
o.
2,
Ch
hin
dw
ara
1
36
16
C/0
6.0
6.1
2 2
4.0
7.1
4 1
2 M
ont
hs
Wo
rk s
ite
was
del
ayed
han
ded
ove
r to
co
ntra
cto
r af
ter
com
ple
ting
ea
rth
wo
rk a
nd s
ub g
rad
e w
ork
dep
artm
enta
lly,
cle
aran
ce o
f fo
rest
d
epar
tmen
t w
as d
elay
ed i
ssue
d,
pri
vate
lan
d d
isp
utes
.
Due
to
th
ese
reas
ons
, p
enal
ty
of
0.1
5
per
cen
t w
as
levi
ed
on
cont
ract
or
for
tim
e ex
ten
sio
n.
Co
nten
tio
n
of
Sup
erin
tend
ent
En
gine
er
was
no
t ac
cep
tab
le
as
cont
ract
ors
fa
iled
to
gi
ve
pro
port
iona
l p
rogr
ess
of
wo
rk
and
as
p
er
Cla
use
3
.4
(i)
and
3
.6
of
cond
itio
ns
of
cont
ract
, th
e co
ntra
cto
rs
wer
e re
qui
red
to
sa
tisf
y th
emse
lves
re
gard
ing
su
itab
ilit
y an
d
avai
lab
ilit
y o
f la
nd.
The
re
spo
nsib
ilit
y o
f o
pen
ing
new
q
uarr
ies
and
co
nstr
ucti
on
/ m
aint
enan
ce o
f ap
pro
ache
s th
eret
o w
ere
laid
d
ow
n w
ho
lly
wit
h th
e co
ntra
cto
r. M
ore
ove
r,
spea
king
ord
ers
ind
icat
ing
the
per
iod
of
del
ay
for
wh
ich
co
ntra
cto
r w
as n
ot
resp
ons
ible
was
no
t m
enti
one
d i
n th
eord
ers
issu
ed b
y S
E.
2
36
16
D/1
0.0
9.1
2 1
0.1
2.1
4 1
4 M
ont
hs
Wo
rk s
ite
was
del
ayed
han
ded
ove
r to
co
ntra
cto
r af
ter
com
ple
ting
ea
rth
wo
rk
and
su
b
grad
e w
ork
d
epar
tmen
tall
y,
pri
vate
la
nd
dis
put
es.
D
ue
to
thes
e re
aso
ns,
pen
alty
o
f 0
.10
p
er
cen
t w
as
levi
ed
on
cont
ract
or
for
tim
e ex
ten
sio
n.
3
36
04
/24
.01
.11
28
.02.
14
24
Mo
nths
W
ork
sit
e w
as d
elay
ed h
and
ed o
ver
to c
ont
ract
or
afte
r co
mp
leti
ng
eart
hw
ork
an
d
sub
gr
ade
wo
rk
dep
artm
enta
lly,
d
elay
in
m
easu
rem
ent
of
wo
rks.
Due
to
th
ese
reas
ons
, p
enal
ty
of
0.2
5
per
cen
t w
as
levi
ed
on
cont
ract
or
for
tim
e ex
ten
sio
n.
4
36
10
/01
.01
.11
10
.06.
14
28
Mo
nths
W
ork
sit
e w
as d
elay
ed h
and
ed o
ver
to c
ont
ract
or
afte
r co
mp
leti
ng
eart
hw
ork
an
d
sub
gr
ade
wo
rk
dep
artm
enta
lly,
d
iffi
cult
ies
in
tran
spo
rtin
g m
achi
nery
due
to
im
pas
sab
le h
illy
are
a.
Due
to
th
ese
reas
ons
, p
enal
ty
of
0.2
0
per
cen
t w
as
levi
ed
on
cont
ract
or
for
tim
e ex
ten
sio
n.
5
36
16B
/06
.06
.12
15
.03.
14
8 M
ont
hs
Wo
rk s
ite
was
del
ayed
han
ded
ove
r to
co
ntra
cto
r af
ter
com
ple
ting
ea
rth
wo
rk a
nd s
ub g
rad
e w
ork
dep
artm
enta
lly,
del
ayed
all
otm
ent
of
qua
rry,
del
ayed
per
mis
sio
n o
f fo
rest
dep
artm
ent.
Due
to
th
ese
reas
ons
, p
enal
ty
of
0.1
0
per
cen
t w
as
levi
ed
on
cont
ract
or
for
tim
e ex
ten
sio
n.
6
36
23
/28
.09
.12
30
.06.
15
20
Mo
nths
W
ork
sit
e w
as d
elay
ed h
and
ed o
ver
to c
ont
ract
or
afte
r co
mp
leti
ng
eart
hw
ork
and
sub
gra
de
wo
rk d
epar
tmen
tall
y, d
elay
ed p
erm
issi
on
o
f fo
rest
dep
artm
ent,
cha
nge
of
alig
nm
ent
of
wo
rk.
Due
to
th
ese
reas
ons
, p
enal
ty
of
0.1
0
per
cen
t w
as
levi
ed
on
cont
ract
or
for
tim
e ex
ten
sio
n.
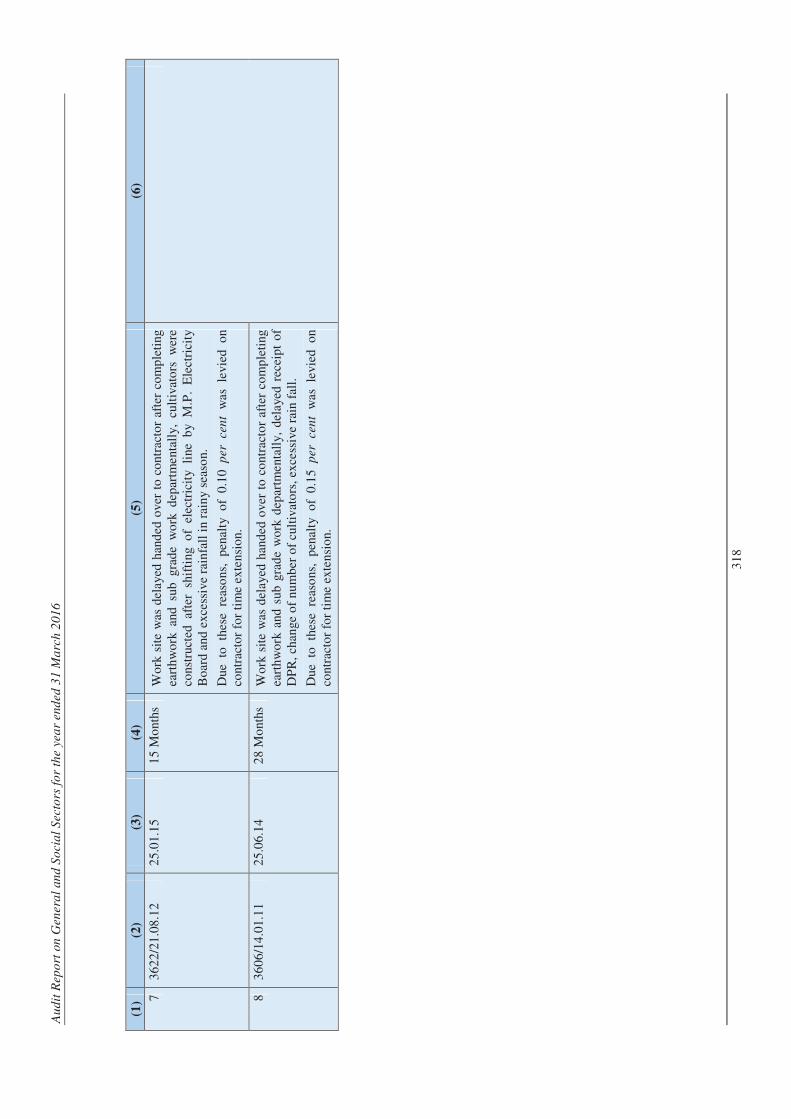
Au
dit
Rep
ort
on
Gen
era
l an
d S
ocia
l S
ecto
rs f
or
the y
ea
r end
ed
31 M
arc
h 2
01
6
31
8
(1)
(2)
(3)
(4)
(5)
(6)
7
36
22
/21
.08
.12
25
.01.
15
15
Mo
nths
W
ork
sit
e w
as d
elay
ed h
and
ed o
ver
to c
ont
ract
or
afte
r co
mp
leti
ng
eart
hw
ork
and
sub
gra
de
wo
rk d
epar
tmen
tall
y, c
ulti
vato
rs w
ere
cons
truc
ted
aft
er s
hift
ing
of
elec
tric
ity
line
by
M.P
. E
lect
rici
ty
Bo
ard
and
exc
essi
ve r
ain
fall
in
rain
y se
aso
n.
Due
to
th
ese
reas
ons
, p
enal
ty
of
0.1
0
per
cen
t w
as
levi
ed
on
cont
ract
or
for
tim
e ex
ten
sio
n.
8
36
06
/14
.01
.11
25
.06.
14
28
Mo
nths
W
ork
sit
e w
as d
elay
ed h
and
ed o
ver
to c
ont
ract
or
afte
r co
mp
leti
ng
eart
hw
ork
and
sub
gra
de
wo
rk d
epar
tmen
tall
y, d
elay
ed r
ecei
pt
of
DP
R,
chan
ge o
f nu
mb
er o
f cu
ltiv
ato
rs,
exce
ssiv
e ra
in f
all.
Due
to
th
ese
reas
ons
, p
enal
ty
of
0.1
5
per
cen
t w
as
levi
ed
on
cont
ract
or
for
tim
e ex
ten
sio
n.
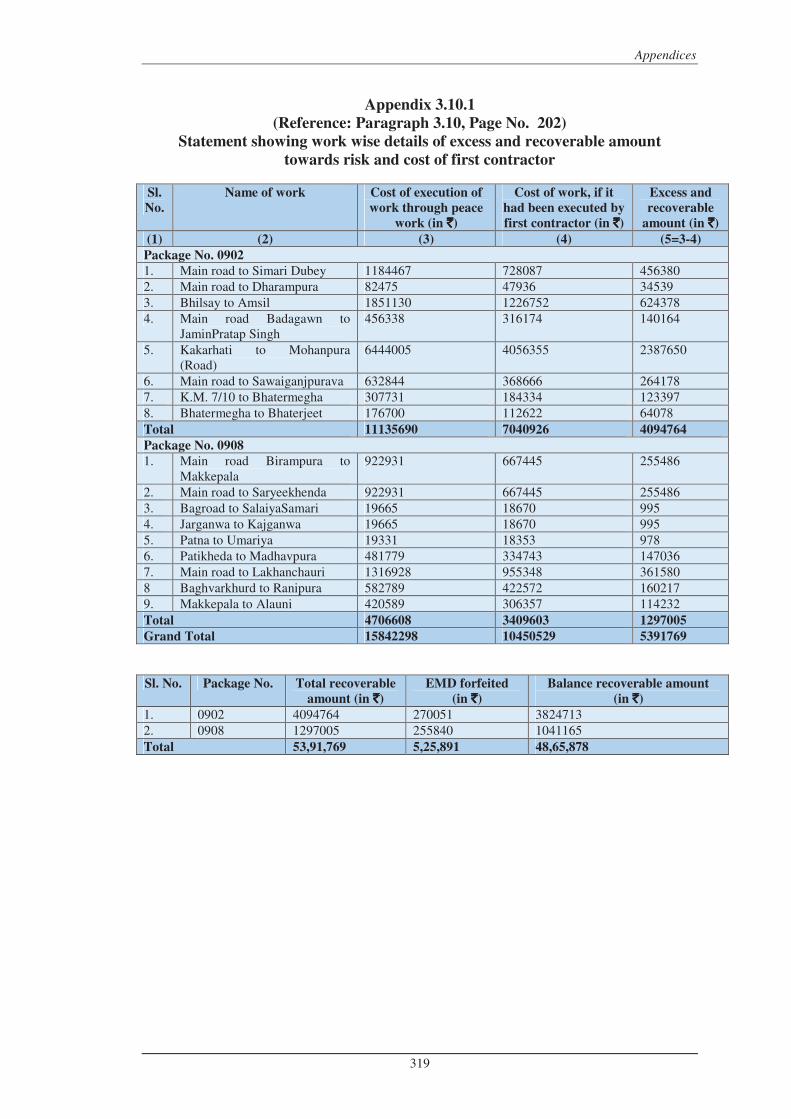
Appendices
319
Appendix 3.10.1
(Reference: Paragraph 3.10, Page No. 202)
Statement showing work wise details of excess and recoverable amount
towards risk and cost of first contractor
Sl.
No.
Name of work Cost of execution of
work through peace
work (in `̀̀̀)
Cost of work, if it
had been executed by
first contractor (in `̀̀̀)
Excess and
recoverable
amount (in `̀̀̀)
(1) (2) (3) (4) (5=3-4)
Package No. 0902
1. Main road to Simari Dubey 1184467 728087 456380 2. Main road to Dharampura 82475 47936 34539 3. Bhilsay to Amsil 1851130 1226752 624378 4. Main road Badagawn to
JaminPratap Singh 456338 316174 140164
5. Kakarhati to Mohanpura (Road)
6444005 4056355 2387650
6. Main road to Sawaiganjpurava 632844 368666 264178 7. K.M. 7/10 to Bhatermegha 307731 184334 123397 8. Bhatermegha to Bhaterjeet 176700 112622 64078 Total 11135690 7040926 4094764
Package No. 0908
1. Main road Birampura to Makkepala
922931 667445 255486
2. Main road to Saryeekhenda 922931 667445 255486 3. Bagroad to SalaiyaSamari 19665 18670 995 4. Jarganwa to Kajganwa 19665 18670 995 5. Patna to Umariya 19331 18353 978 6. Patikheda to Madhavpura 481779 334743 147036 7. Main road to Lakhanchauri 1316928 955348 361580 8 Baghvarkhurd to Ranipura 582789 422572 160217 9. Makkepala to Alauni 420589 306357 114232 Total 4706608 3409603 1297005
Grand Total 15842298 10450529 5391769
Sl. No. Package No. Total recoverable
amount (in `̀̀̀)
EMD forfeited
(in `̀̀̀)
Balance recoverable amount
(in `̀̀̀)
1. 0902 4094764 270051 3824713 2. 0908 1297005 255840 1041165 Total 53,91,769 5,25,891 48,65,878
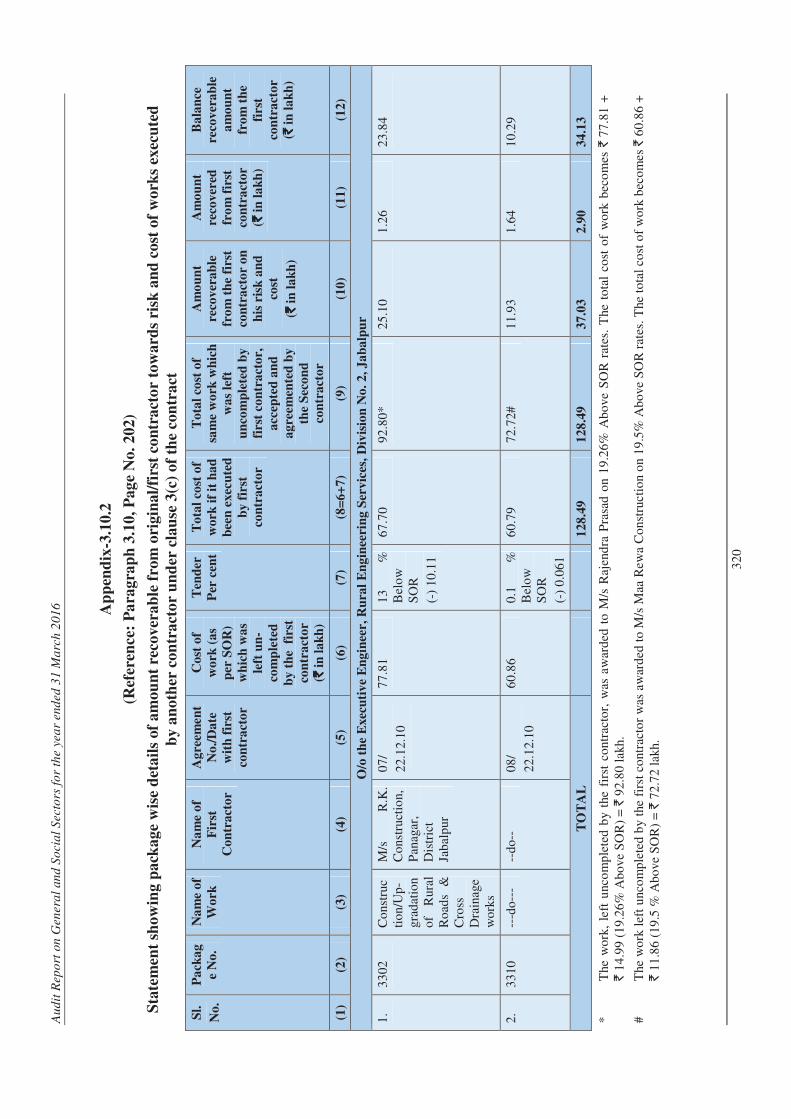
Au
dit
Rep
ort
on
Gen
era
l an
d S
ocia
l S
ecto
rs f
or
the y
ea
r end
ed
31 M
arc
h 2
01
6
32
0
Ap
pen
dix
-3.1
0.2
(Ref
eren
ce:
Pa
rag
rap
h 3
.10
, P
ag
e N
o.
20
2)
Sta
tem
ent
sho
win
g p
ack
ag
e w
ise
det
ail
s of
am
ou
nt
reco
ver
ab
le f
rom
ori
gin
al/
firs
t co
ntr
act
or t
ow
ard
s ri
sk a
nd
co
st o
f w
ork
s ex
ecu
ted
by
an
oth
er c
on
tra
cto
r u
nd
er c
lau
se 3
(c)
of
the
co
ntr
act
Sl.
No
.
Pa
cka
g
e N
o.
Na
me
of
Wo
rk
Na
me
of
Fir
st
Co
ntr
act
or
Ag
reem
en
t
No
./D
ate
wit
h f
irst
con
tra
cto
r
Co
st o
f
wo
rk (
as
per
SO
R)
wh
ich
wa
s
left
un
-
com
ple
ted
by
th
e f
irst
con
tra
cto
r
(`̀̀̀ i
n l
ak
h)
Ten
der
Per
cen
t
To
tal
cost
of
wo
rk i
f it
ha
d
bee
n e
xec
ute
d
by
fir
st
con
tra
cto
r
To
tal
cost
of
sam
e w
ork
wh
ich
wa
s le
ft
un
com
ple
ted
by
firs
t co
ntr
act
or,
acc
epte
d a
nd
ag
reem
ente
d b
y
the
Sec
on
d
con
tra
cto
r
Am
ou
nt
reco
ver
ab
le
fro
m t
he
firs
t
con
tra
cto
r o
n
his
ris
k a
nd
cost
(`̀̀̀ i
n l
ak
h)
Am
ou
nt
reco
ver
ed
fro
m f
irst
con
tra
cto
r
(`̀̀̀ i
n l
ak
h)
Ba
lan
ce
reco
ver
ab
le
am
ou
nt
fro
m t
he
firs
t
con
tra
cto
r
(`̀̀̀ i
n l
ak
h)
(1)
(2)
(3)
(4)
(5)
(6)
(7)
(8=
6+
7)
(9)
(10
) (1
1)
(12
)
O/o
th
e E
xec
uti
ve
En
gin
eer,
Ru
ral
En
gin
eeri
ng
Ser
vic
es,
Div
isio
n N
o.
2,
Ja
ba
lpu
r
1.
33
02
Co
nstr
ucti
on/
Up
-gr
adat
ion
of
Rur
al
Ro
ads
&
Cro
ss
Dra
inag
e w
ork
s
M/s
R
.K.
Co
nstr
ucti
on,
P
anag
ar,
Dis
tric
t Ja
bal
pur
07
/
22
.12.
10
77
.81
13
%
B
elo
w
SO
R
(-)
10
.11
67
.70
92
.80
* 2
5.1
0 1
.26
23
.84
2.
33
10
---d
o--
- --
do
--
08
/
22
.12.
10
60
.86
0.1
%
B
elo
w
SO
R
(-)
0.0
61
60
.79
72
.72#
1
1.9
3 1
.64
10
.29
TO
TA
L
12
8.4
9
12
8.4
9
37
.03
2.9
0
34
.13
*
The
wo
rk,
left
unc
om
ple
ted
by
the
firs
t co
ntra
cto
r, w
as a
war
ded
to
M/s
Raj
end
ra P
rasa
d o
n 1
9.2
6%
Ab
ove
SO
R r
ates
. T
he t
ota
l co
st o
f w
ork
bec
om
es `
77
.81
+
` 1
4.9
9 (
19
.26
% A
bo
ve S
OR
) =
` 9
2.8
0 l
akh.
#
The
wo
rk l
eft
unc
om
ple
ted
by
the
fir
st c
ont
ract
or
was
aw
ard
ed t
o M
/s M
aa R
ewa
Co
nst
ruct
ion
on
19
.5%
Ab
ove
SO
R r
ates
. T
he t
ota
l co
st o
f w
ork
bec
om
es `
60
.86
+
` 1
1.8
6 (
19
.5 %
Ab
ove
SO
R)
= `
72
.72
lak
h.
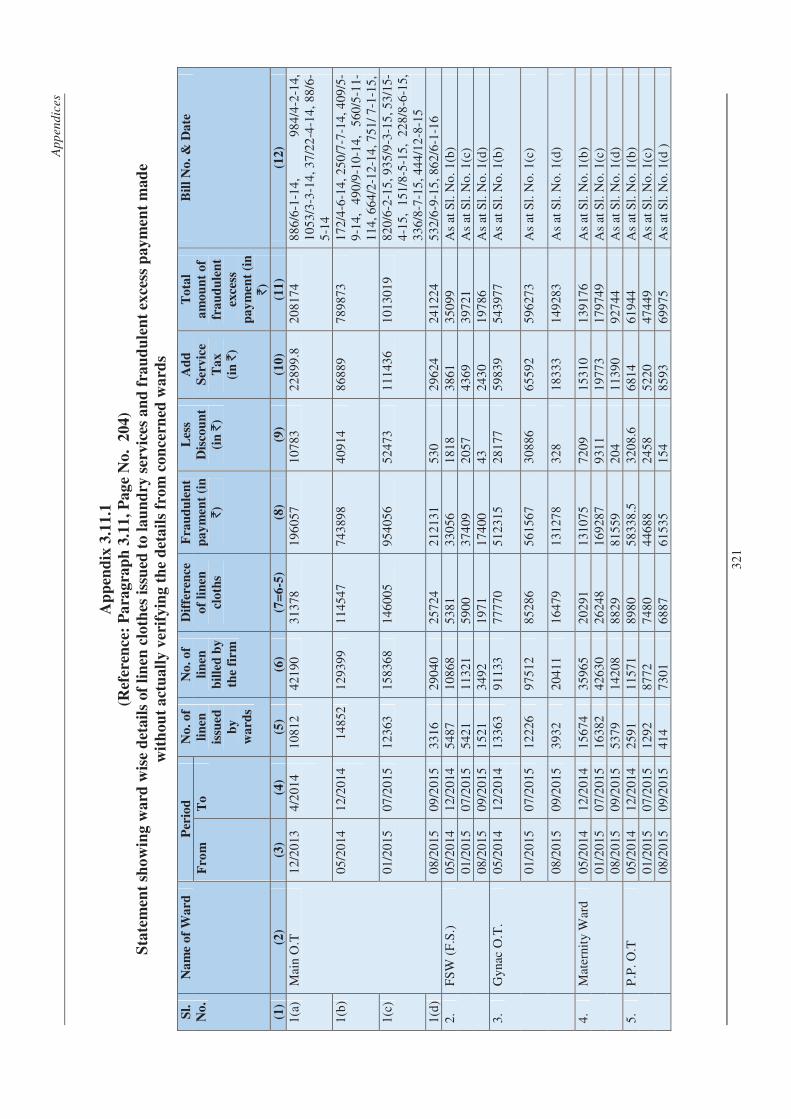
Ap
pen
dic
es
32
1
Ap
pen
dix
3.1
1.1
(Ref
eren
ce:
Pa
rag
rap
h 3
.11
, P
ag
e N
o.
20
4)
Sta
tem
ent
sho
win
g w
ard
wis
e d
eta
ils
of
lin
en c
loth
es i
ssu
ed t
o l
au
nd
ry s
erv
ices
an
d f
rau
du
len
t ex
cess
pa
ym
ent
ma
de
wit
ho
ut
act
ua
lly
ver
ifyin
g t
he
det
ail
s fr
om
co
ncer
ned
wa
rds
Sl.
No
.
Na
me
of
Wa
rd
Per
iod
N
o.
of
lin
en
issu
ed
by
wa
rds
No
. o
f
lin
en
bil
led
by
the
firm
Dif
fere
nce
of
lin
en
clo
ths
Fra
ud
ule
nt
pa
ym
ent
(in
`)
Les
s
Dis
cou
nt
(in
`)
Ad
d
Ser
vic
e
Ta
x
(in
`)
To
tal
am
ou
nt
of
fra
ud
ule
nt
exce
ss
pa
ym
ent
(in
`)
Bil
l N
o.
& D
ate
Fro
m
To
(1)
(2)
(3)
(4)
(5)
(6)
(7=
6-5
) (8
) (9
) (1
0)
(11
) (1
2)
1(a
) M
ain
O.T
1
2/2
013
4
/20
14
1
08
12
42
190
3
13
78
19
605
7 1
07
83
22
899
.8
20
817
4 8
86
/6-1
-14
, 9
84
/4-2
-14,
1
05
3/3
-3-1
4,
37
/22
-4-1
4,
88/6
-5
-14
1
(b)
05
/20
14
12
/20
14
14
852
1
29
399
11
454
7 7
43
898
40
914
8
68
89
78
987
3 1
72
/4-6
-14
, 2
50
/7-7
-14
, 4
09/5
-9
-14
, 4
90
/9-1
0-1
4,
560
/5-1
1-1
14
, 66
4/2
-12
-14
, 751
/ 7
-1-1
5,
1
(c)
01
/20
15
07
/20
15
12
363
1
58
368
14
600
5 9
54
056
52
473
1
11
436
10
130
19
82
0/6
-2-1
5,
93
5/9
-3-1
5,
53
/15-
4-1
5,
151
/8-5
-15
, 2
28
/8-6
-15,
3
36
/8-7
-15
, 44
4/1
2-8
-15
1(d
) 0
8/2
015
0
9/2
015
3
31
6 2
90
40
25
724
2
12
131
53
0 2
96
24
24
122
4 5
32
/6-9
-15
, 86
2/6
-1-1
6 2
. F
SW
(F
.S.)
0
5/2
014
1
2/2
014
5
48
7 1
08
68
53
81
33
056
1
81
8 3
86
1 3
50
99
As
at S
l. N
o.
1(b
) 0
1/2
015
0
7/2
015
5
42
1 1
13
21
59
00
37
409
2
05
7 4
36
9 3
97
21
As
at S
l. N
o.
1(c
) 0
8/2
015
0
9/2
015
1
52
1 3
49
2 1
97
1 1
74
00
43
24
30
19
786
A
s at
Sl.
No
. 1
(d)
3.
Gyn
ac O
.T.
05
/20
14
12
/20
14
1
33
63
91
133
7
77
70
51
231
5 2
81
77
59
839
5
43
977
As
at S
l. N
o.
1(b
)
01
/20
15
07
/20
15
12
226
9
75
12
85
286
5
61
567
30
886
6
55
92
59
627
3 A
s at
Sl.
No
. 1
(c)
08
/20
15
09
/20
15
39
32
20
411
1
64
79
13
127
8 3
28
18
333
1
49
283
As
at S
l. N
o.
1(d
)
4.
Mat
erni
ty W
ard
0
5/2
014
1
2/2
014
1
56
74
35
965
2
02
91
13
107
5 7
20
9 1
53
10
13
917
6 A
s at
Sl.
No
. 1
(b)
01
/20
15
07
/20
15
16
382
4
26
30
26
248
1
69
287
93
11
19
773
1
79
749
As
at S
l. N
o.
1(c
) 0
8/2
015
0
9/2
015
5
37
9 1
42
08
88
29
81
559
2
04
11
390
9
27
44
As
at S
l. N
o.
1(d
) 5
. P
.P.
O.T
0
5/2
014
1
2/2
014
2
59
1 1
15
71
89
80
58
338
.5
32
08
.6
68
14
61
944
A
s at
Sl.
No
. 1
(b)
01
/20
15
07
/20
15
12
92
87
72
74
80
44
688
2
45
8 5
22
0 4
74
49
As
at S
l. N
o.
1(c
) 0
8/2
015
0
9/2
015
4
14
73
01
68
87
61
535
1
54
85
93
69
975
A
s at
Sl.
No
. 1
(d )
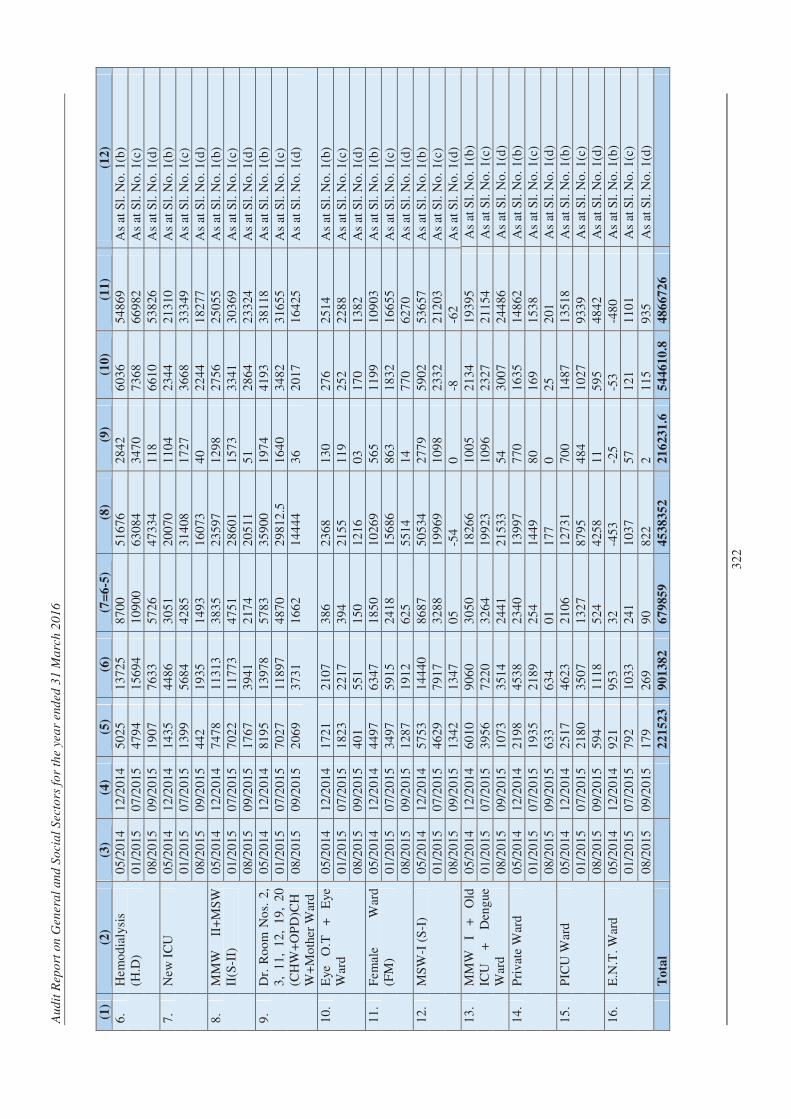
Au
dit
Rep
ort
on
Gen
era
l an
d S
ocia
l S
ecto
rs f
or
the y
ea
r end
ed
31 M
arc
h 2
01
6
32
2
(1)
(2)
(3)
(4)
(5)
(6)
(7=
6-5
) (8
) (9
) (1
0)
(11
) (1
2)
6.
Hem
od
ialy
sis
(H.D
) 0
5/2
014
1
2/2
014
5
02
5 1
37
25
87
00
51
676
2
84
2 6
03
6 5
48
69
As
at S
l. N
o.
1(b
) 0
1/2
015
0
7/2
015
4
79
4 1
56
94
10
900
6
30
84
34
70
73
68
66
982
A
s at
Sl.
No
. 1
(c)
08
/20
15
09
/20
15
19
07
76
33
57
26
47
334
1
18
66
10
53
826
A
s at
Sl.
No
. 1
(d)
7.
New
IC
U
05
/20
14
12
/20
14
14
35
44
86
30
51
20
070
1
10
4 2
34
4 2
13
10
As
at S
l. N
o.
1(b
) 0
1/2
015
0
7/2
015
1
39
9 5
68
4 4
28
5 3
14
08
17
27
36
68
33
349
A
s at
Sl.
No
. 1
(c)
08
/20
15
09
/20
15
44
2 1
93
5 1
49
3 1
60
73
40
22
44
18
277
A
s at
Sl.
No
. 1
(d)
8.
MM
W
II+
MS
W
II(S
-II)
0
5/2
014
1
2/2
014
7
47
8 1
13
13
38
35
23
597
1
29
8 2
75
6 2
50
55
As
at S
l. N
o.
1(b
) 0
1/2
015
0
7/2
015
7
02
2 1
17
73
47
51
28
601
1
57
3 3
34
1 3
03
69
As
at S
l. N
o.
1(c
) 0
8/2
015
0
9/2
015
1
76
7 3
94
1 2
17
4 2
05
11
51
28
64
23
324
A
s at
Sl.
No
. 1
(d)
9.
Dr.
Ro
om
No
s. 2
, 3
, 1
1,
12
, 1
9,
20
(CH
W+
OP
D)C
HW
+M
oth
er W
ard
05
/20
14
12
/20
14
81
95
13
978
5
78
3 3
59
00
19
74
41
93
38
118
A
s at
Sl.
No
. 1
(b)
01
/20
15
07
/20
15
70
27
11
897
4
87
0 2
98
12.5
1
64
0 3
48
2 3
16
55
As
at S
l. N
o.
1(c
) 0
8/2
015
0
9/2
015
2
06
9 3
73
1 1
66
2 1
44
44
36
20
17
16
425
A
s at
Sl.
No
. 1
(d)
10
. E
ye
O.T
+
E
ye
War
d 0
5/2
014
1
2/2
014
1
72
1 2
10
7 3
86
23
68
13
0 2
76
25
14
As
at S
l. N
o.
1(b
) 0
1/2
015
0
7/2
015
1
82
3 2
21
7 3
94
21
55
11
9 2
52
22
88
As
at S
l. N
o.
1(c
) 0
8/2
015
0
9/2
015
4
01
55
1 1
50
12
16
03
17
0 1
38
2 A
s at
Sl.
No
. 1
(d)
11
. F
emal
e W
ard
(F
M)
05
/20
14
12
/20
14
44
97
63
47
18
50
10
269
5
65
11
99
10
903
A
s at
Sl.
No
. 1
(b)
01
/20
15
07
/20
15
34
97
59
15
24
18
15
686
8
63
18
32
16
655
A
s at
Sl.
No
. 1
(c)
08
/20
15
09
/20
15
12
87
19
12
62
5 5
51
4 1
4 7
70
62
70
As
at S
l. N
o.
1(d
) 1
2.
MS
W-I
(S
-I)
05
/20
14
12
/20
14
57
53
14
440
8
68
7 5
05
34
27
79
59
02
53
657
A
s at
Sl.
No
. 1
(b)
01
/20
15
07
/20
15
46
29
79
17
32
88
19
969
1
09
8 2
33
2 2
12
03
As
at S
l. N
o.
1(c
) 0
8/2
015
0
9/2
015
1
34
2 1
34
7 0
5 -5
4
0
-8
-62
A
s at
Sl.
No
. 1
(d)
13
. M
MW
I
+
Old
IC
U
+
Den
gue
W
ard
05
/20
14
12
/20
14
60
10
90
60
30
50
18
266
1
00
5 2
13
4 1
93
95
As
at S
l. N
o.
1(b
) 0
1/2
015
0
7/2
015
3
95
6 7
22
0 3
26
4 1
99
23
10
96
23
27
21
154
A
s at
Sl.
No
. 1
(c)
08
/20
15
09
/20
15
10
73
35
14
24
41
21
533
5
4 3
00
7 2
44
86
As
at S
l. N
o.
1(d
) 1
4.
Pri
vate
War
d 0
5/2
014
1
2/2
014
2
19
8 4
53
8 2
34
0 1
39
97
77
0 1
63
5 1
48
62
As
at S
l. N
o.
1(b
) 0
1/2
015
0
7/2
015
1
93
5 2
18
9 2
54
14
49
80
16
9 1
53
8 A
s at
Sl.
No
. 1
(c)
08
/20
15
09
/20
15
63
3 6
34
01
17
7 0
2
5 2
01
As
at S
l. N
o.
1(d
) 1
5.
PIC
U W
ard
05
/20
14
12
/20
14
25
17
46
23
21
06
12
731
7
00
14
87
13
518
A
s at
Sl.
No
. 1
(b)
01
/20
15
07
/20
15
21
80
35
07
13
27
87
95
48
4 1
02
7 9
33
9 A
s at
Sl.
No
. 1
(c)
08
/20
15
09
/20
15
59
4 1
11
8 5
24
42
58
11
59
5 4
84
2 A
s at
Sl.
No
. 1
(d)
16
. E
.N.T
. War
d 0
5/2
014
1
2/2
014
9
21
95
3 3
2 -4
53
-2
5
-53
-4
80
A
s at
Sl.
No
. 1
(b)
01
/20
15
07
/20
15
79
2 1
03
3 2
41
10
37
57
12
1 1
10
1 A
s at
Sl.
No
. 1
(c)
08
/20
15
09
/20
15
17
9 2
69
90
82
2 2
1
15
93
5 A
s at
Sl.
No
. 1
(d)
T
ota
l
2
21
52
3
90
138
2
67
985
9
45
383
52
21
623
1.6
5
44
61
0.8
4
86
67
26

Appendices
323
Appendix- 3.12.1
(Reference: Paragraph 3.12,Page No. 205)
Statement showing the date wise details of payment made for LPG cylinders
shown to be purchased through suspected hand written bills
Sl.
No
Date of
purchase/de
livery
No. of
cylinder
shown to be
purchased
Rate per
cylinder
(in `)
Total
Amount
(in `)
Bill No. & date Amount paid to
(S/Shri)
(1) (2) (3) (4) (5) (6) (7)
1. 29.12.2012 2 1280.5 2561 336/03.09.2013
Kamlesh Satanker, Assistant Grade III 2. 19.01.2013 8 1241 9928
3. 30.01.2013 3 1228 3684 4. 13.02.2013 8 1228 9824 5. 25.02.2013 8 1228 9824 6. 26.03.2013 8 1116 8928 7. 13.04.2013 12 975 12000
303/26.08.2013
Vijay Kumar Rajurkar, Steward
8. 12.05.2013 8 1000 8000 9. 22.05.2013 8 1000 8000 10. 06.06.2013 10 1000 10000 11. 16.06.2013 9 1000 9000 12. 26.06.2013 9 1000 9000 13. 14.07.2013 8 975 7800 14. 01.08.2013 9 975 8775 303/26.08.2013 Vijay Kumar
Rajurkar, Steward
15. 07.08.2013 8 975 7800
16. 17.08.2013 6 975 5850 327/30.08.2013 Vijay Kumar Rajurkar, Steward
17. 27.08.2013 7 975 6825
18. 05.09.2013 2 1710 3420 351/17.09.2013 Vijay Kumar Rajurkar, Steward
19. 07.09.2013 5 1010 5050
20. 18.09.2013 8 1010 8080 503/20.11.2013
Vijay Kumar Rajurkar, Steward
21. 28.09.2013 4 1090 4360 22. 05.10.2013 2 1050 2100 23. 08.10.2013 8 1090 8720 24. 20.10.2013 5 1090 5450 25. 27.10.2013 8 1090 8720 26. 31.10.2013 8 1090 8720 27. 12.11.2013 9 1035 9315 28. 12.11.2013 9 1035 9315
574/11.12.2013
Vijay Kumar Rajurkar, Steward
29. 21.11.2013 4 1035 4140 30. 05.12.2013 4 1100 4400 31. 06.12.2013 4 1100 4400 32. 07.12.2013 4 1100 4400 33. 10.03.2014 4 1180 4720 734/10.03.2014 Vijay Kumar
Rajurkar, Steward
34. 10.06.2014 5 1688 8440 161/20.06.2014
Vijay Kumar Rajurkar, Steward
35. 15.06.2014 1 1792 1792 36. 27.05.2014 3 1792 5376 37. 04.06.2014 3 1717 5151 38. 05.05.2014 5 1792 8960 39. 10.05.2014 4 1792 7168 40. 14.05.2014 5 1792 8960 41. 20.05.2014 3 1792 5376
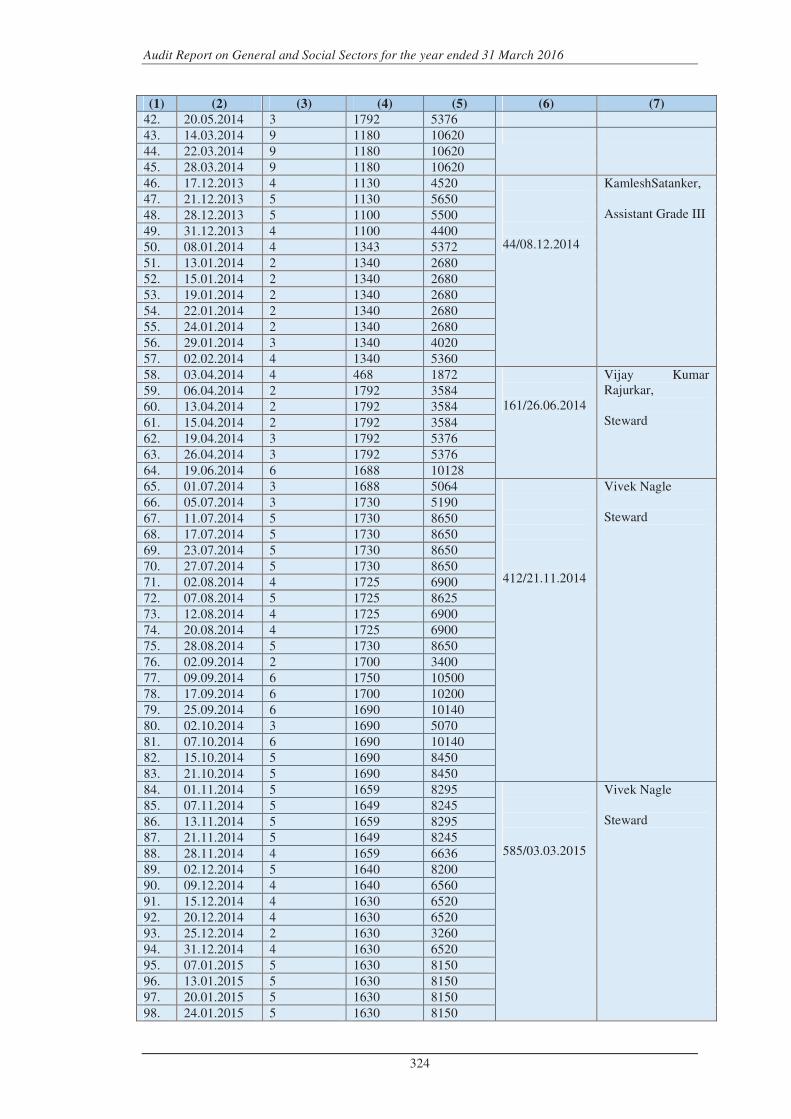
Audit Report on General and Social Sectors for the year ended 31 March 2016
324
(1) (2) (3) (4) (5) (6) (7)
42. 20.05.2014 3 1792 5376 43. 14.03.2014 9 1180 10620 44. 22.03.2014 9 1180 10620 45. 28.03.2014 9 1180 10620 46. 17.12.2013 4 1130 4520
44/08.12.2014
KamleshSatanker, Assistant Grade III
47. 21.12.2013 5 1130 5650 48. 28.12.2013 5 1100 5500 49. 31.12.2013 4 1100 4400 50. 08.01.2014 4 1343 5372 51. 13.01.2014 2 1340 2680 52. 15.01.2014 2 1340 2680 53. 19.01.2014 2 1340 2680 54. 22.01.2014 2 1340 2680 55. 24.01.2014 2 1340 2680 56. 29.01.2014 3 1340 4020 57. 02.02.2014 4 1340 5360 58. 03.04.2014 4 468 1872
161/26.06.2014
Vijay Kumar Rajurkar, Steward
59. 06.04.2014 2 1792 3584 60. 13.04.2014 2 1792 3584 61. 15.04.2014 2 1792 3584 62. 19.04.2014 3 1792 5376 63. 26.04.2014 3 1792 5376 64. 19.06.2014 6 1688 10128 65. 01.07.2014 3 1688 5064
412/21.11.2014
Vivek Nagle Steward
66. 05.07.2014 3 1730 5190 67. 11.07.2014 5 1730 8650 68. 17.07.2014 5 1730 8650 69. 23.07.2014 5 1730 8650 70. 27.07.2014 5 1730 8650 71. 02.08.2014 4 1725 6900 72. 07.08.2014 5 1725 8625 73. 12.08.2014 4 1725 6900 74. 20.08.2014 4 1725 6900 75. 28.08.2014 5 1730 8650 76. 02.09.2014 2 1700 3400 77. 09.09.2014 6 1750 10500 78. 17.09.2014 6 1700 10200 79. 25.09.2014 6 1690 10140 80. 02.10.2014 3 1690 5070 81. 07.10.2014 6 1690 10140 82. 15.10.2014 5 1690 8450 83. 21.10.2014 5 1690 8450 84. 01.11.2014 5 1659 8295
585/03.03.2015
Vivek Nagle Steward
85. 07.11.2014 5 1649 8245 86. 13.11.2014 5 1659 8295 87. 21.11.2014 5 1649 8245 88. 28.11.2014 4 1659 6636 89. 02.12.2014 5 1640 8200 90. 09.12.2014 4 1640 6560 91. 15.12.2014 4 1630 6520 92. 20.12.2014 4 1630 6520 93. 25.12.2014 2 1630 3260 94. 31.12.2014 4 1630 6520 95. 07.01.2015 5 1630 8150 96. 13.01.2015 5 1630 8150 97. 20.01.2015 5 1630 8150 98. 24.01.2015 5 1630 8150
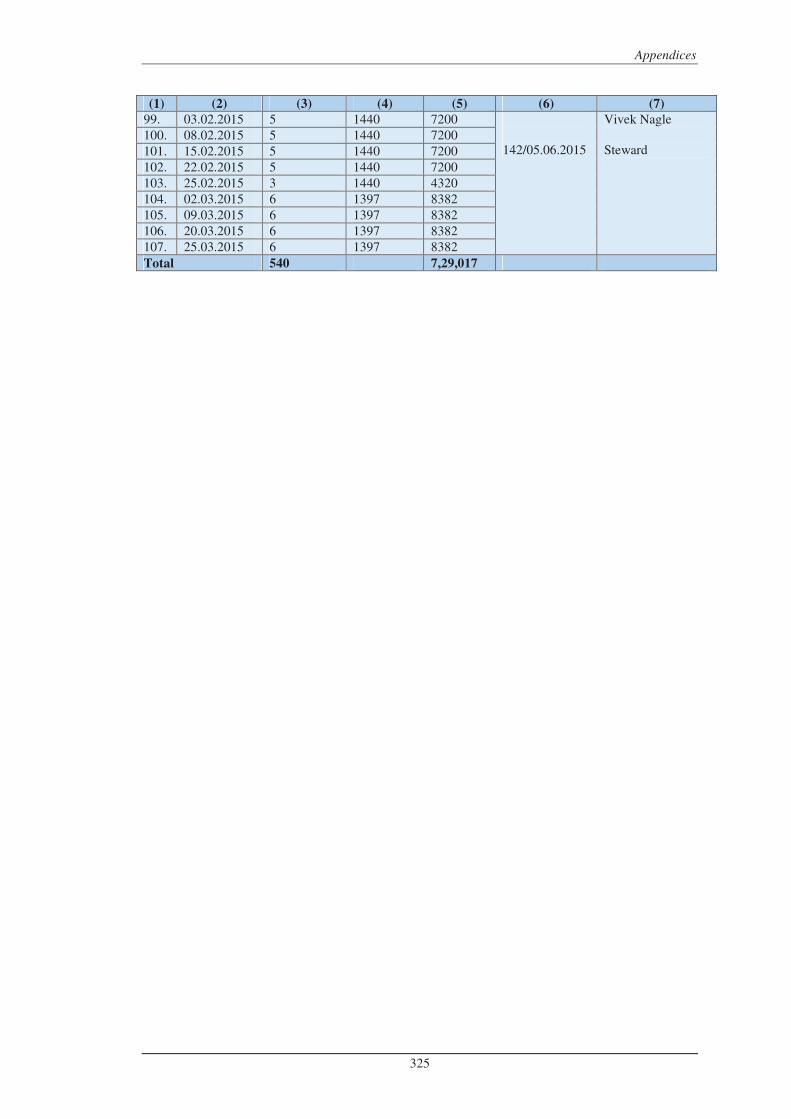
Appendices
325
(1) (2) (3) (4) (5) (6) (7)
99. 03.02.2015 5 1440 7200 142/05.06.2015
Vivek Nagle Steward
100. 08.02.2015 5 1440 7200 101. 15.02.2015 5 1440 7200 102. 22.02.2015 5 1440 7200 103. 25.02.2015 3 1440 4320 104. 02.03.2015 6 1397 8382 105. 09.03.2015 6 1397 8382 106. 20.03.2015 6 1397 8382 107. 25.03.2015 6 1397 8382 Total 540 7,29,017
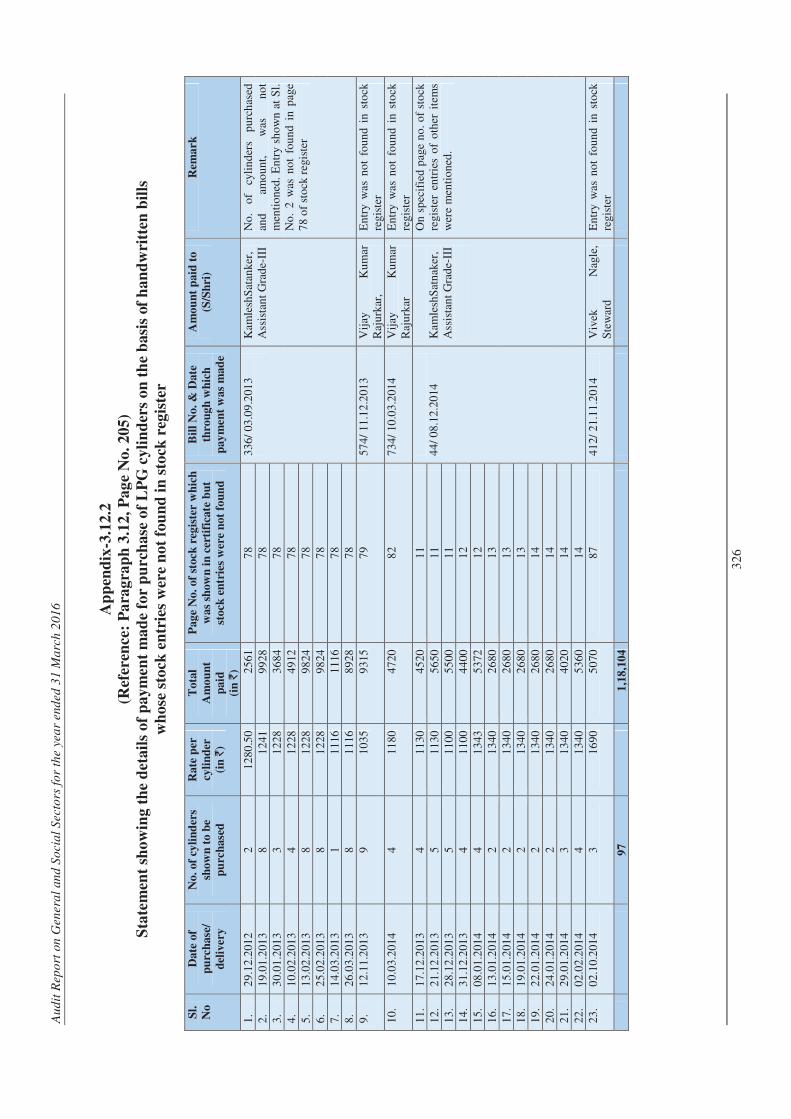
Au
dit
Rep
ort
on
Gen
era
l an
d S
ocia
l S
ecto
rs f
or
the y
ea
r end
ed
31 M
arc
h 2
01
6
32
6
Ap
pen
dix
-3.1
2.2
(Ref
eren
ce:
Pa
rag
rap
h 3
.12
, P
ag
e N
o.
20
5)
Sta
tem
ent
sho
win
g t
he
det
ail
s o
f p
ay
men
t m
ad
e fo
r p
urc
ha
se o
f L
PG
cy
lin
der
s o
n t
he
ba
sis
of
ha
nd
wri
tten
bil
ls
wh
ose
sto
ck e
ntr
ies
wer
e n
ot
fou
nd
in
sto
ck r
egis
ter
Sl.
No
Date
of
pu
rch
ase
/
del
ivery
No.
of
cyli
nd
ers
show
n t
o b
e
pu
rch
ase
d
Rate
per
cyli
nd
er
(in
`)
Tota
l
Am
ou
nt
paid
(in
`)
Pag
e N
o.
of
stock
reg
iste
r w
hic
h
was
show
n i
n c
erti
fica
te b
ut
stock
en
trie
s w
ere
not
fou
nd
Bil
l N
o.
& D
ate
thro
ug
h w
hic
h
pay
men
t w
as
mad
e
Am
ou
nt
paid
to
(S/S
hri
)
Rem
ark
1.
29
.12
.201
2 2
1
280
.50
25
61
78
33
6/ 0
3.0
9.2
013
K
amle
shS
atan
ker,
A
ssis
tan
t G
rad
e-II
I N
o.
of
cyli
nd
ers
pu
rch
ased
an
d
amo
un
t,
was
n
ot
men
tio
ned
. E
ntr
y sh
ow
n a
t S
l.
No
. 2
was
no
t fo
un
d i
n p
age
78
of
sto
ck r
egis
ter
2.
19
.01
.201
3 8
1
241
9
928
7
8 3
. 3
0.0
1.2
013
3
12
28
36
84
78
4.
10
.02
.201
3 4
1
228
4
912
7
8 5
. 1
3.0
2.2
013
8
12
28
98
24
78
6.
25
.02
.201
3 8
1
228
9
824
7
8 7
. 1
4.0
3.2
013
1
11
16
11
16
78
8.
26
.03
.201
3 8
1
116
8
928
7
8 9
. 1
2.1
1.2
013
9
10
35
93
15
79
57
4/ 1
1.1
2.2
013
Vij
ay
Ku
mar
R
aju
rkar
, E
ntr
y w
as n
ot
fou
nd
in
sto
ck
regi
ster
1
0.
10
.03
.201
4 4
1
180
4
720
8
2 7
34/
10
.03
.201
4 V
ijay
K
um
ar
Raj
urk
ar
En
try
was
no
t fo
un
d i
n s
tock
re
gist
er
11
. 1
7.1
2.2
013
4
11
30
45
20
11
44
/ 0
8.12
.20
14
Kam
lesh
Sat
nak
er,
Ass
ista
nt
Gra
de-
III
On
sp
ecif
ied
pag
e n
o.
of
sto
ck
regi
ster
en
trie
s o
f o
ther
ite
ms
wer
e m
enti
on
ed.
12
. 2
1.1
2.2
013
5
11
30
56
50
11
13
. 2
8.1
2.2
013
5
11
00
55
00
11
14
. 3
1.1
2.2
013
4
11
00
44
00
12
15
. 0
8.0
1.2
014
4
13
43
53
72
12
16
. 1
3.0
1.2
014
2
13
40
26
80
13
17
. 1
5.0
1.2
014
2
13
40
26
80
13
18
. 1
9.0
1.2
014
2
13
40
26
80
13
19
. 2
2.0
1.2
014
2
13
40
26
80
14
20
. 2
4.0
1.2
014
2
13
40
26
80
14
21
. 2
9.0
1.2
014
3
13
40
40
20
14
22
. 0
2.0
2.2
014
4
13
40
53
60
14
23
. 0
2.1
0.2
014
3
16
90
50
70
87
41
2/ 2
1.1
1.2
014
Viv
ek
Nag
le,
Ste
war
d
En
try
was
no
t fo
un
d i
n s
tock
re
gist
er
97
1
,18
,10
4
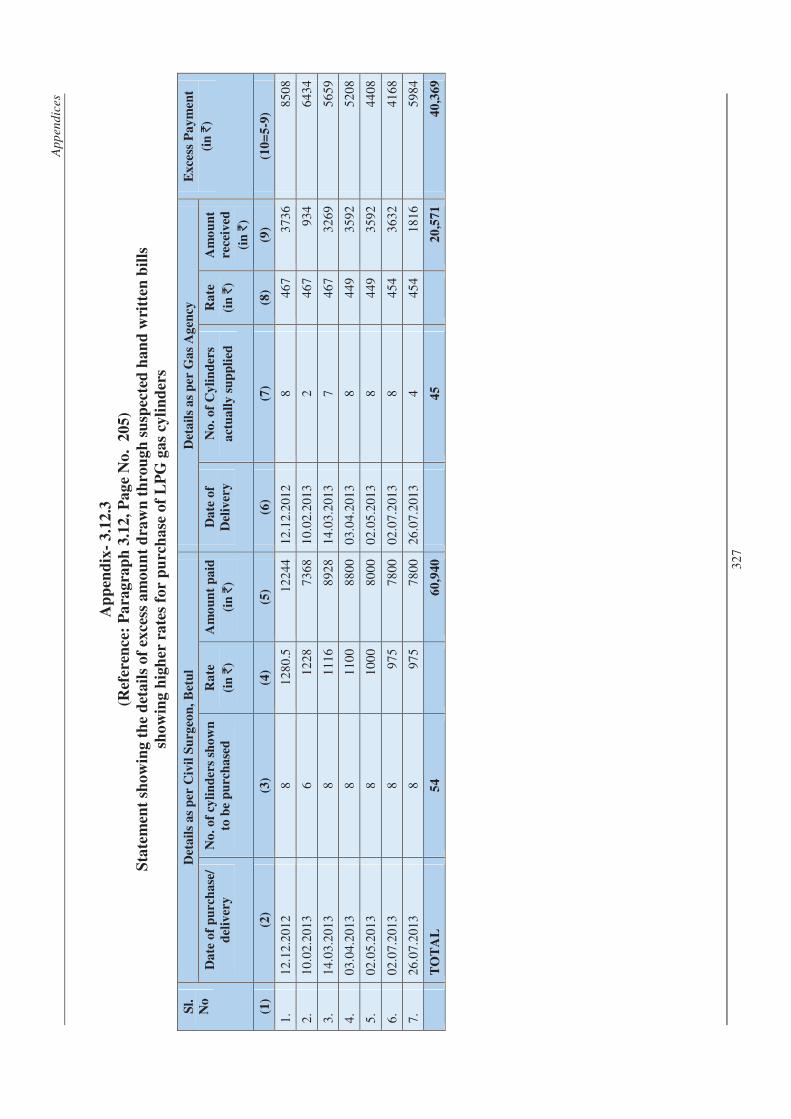
Ap
pen
dic
es
32
7
Ap
pen
dix
- 3
.12
.3
(Ref
eren
ce:
Pa
rag
rap
h 3
.12
, P
ag
e N
o.
20
5)
Sta
tem
ent
sho
win
g t
he
det
ail
s o
f ex
cess
am
ou
nt
dra
wn
th
rou
gh
su
spec
ted
ha
nd
wri
tten
bil
ls
sho
win
g h
igh
er r
ate
s fo
r p
urc
ha
se o
f L
PG
ga
s cy
lin
der
s
Sl.
No
Det
ail
s a
s p
er C
ivil
Su
rgeo
n,
Bet
ul
Det
ail
s a
s p
er G
as
Ag
ency
E
xce
ss P
ay
men
t
(in
`)
Da
te o
f p
urc
ha
se/
del
iver
y
No
. o
f cy
lin
der
s sh
ow
n
to b
e p
urc
ha
sed
Ra
te
(in
`)
Am
ou
nt
pa
id
(in
`)
Da
te o
f
Del
iver
y
No
. o
f C
yli
nd
ers
act
ua
lly
su
pp
lied
Ra
te
(in
`)
Am
ou
nt
rece
ived
(in
`)
(1)
(2)
(3)
(4)
(5)
(6)
(7)
(8)
(9)
(10
=5
-9)
1.
12
.12.
201
2 8
1
28
0.5
1
22
44
12
.12.
201
2 8
4
67
37
36
85
08
2.
10
.02.
201
3 6
1
22
8 7
36
8 1
0.0
2.2
013
2
46
7 9
34
64
34
3.
14
.03.
201
3 8
1
11
6 8
92
8 1
4.0
3.2
013
7
46
7 3
26
9 5
65
9
4.
03
.04.
201
3 8
1
10
0 8
80
0 0
3.0
4.2
013
8
44
9 3
59
2 5
20
8
5.
02
.05.
201
3 8
1
00
0 8
00
0 0
2.0
5.2
013
8
44
9 3
59
2 4
40
8
6.
02
.07.
201
3 8
9
75
78
00
02
.07.
201
3 8
4
54
36
32
41
68
7.
26
.07.
201
3 8
9
75
78
00
26
.07.
201
3 4
4
54
18
16
59
84
T
OT
AL
5
4
6
0,9
40
4
5
2
0,5
71
40
,369
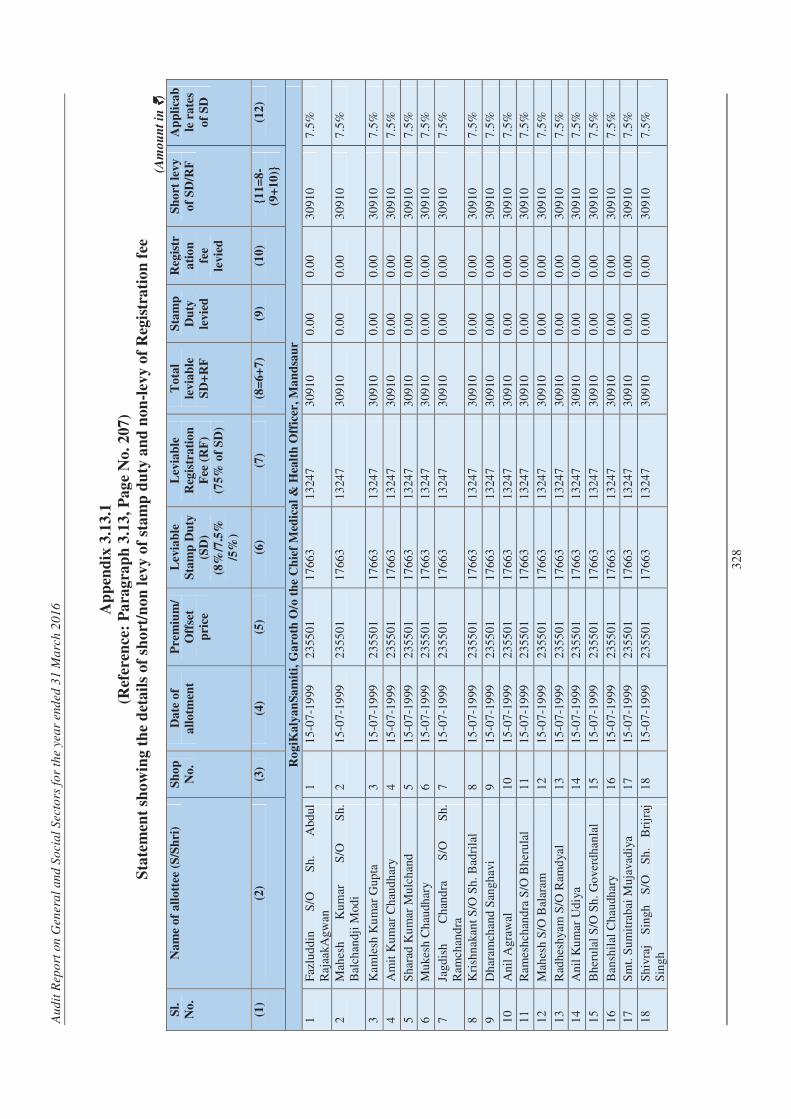
Au
dit
Rep
ort
on
Gen
era
l an
d S
ocia
l S
ecto
rs f
or
the y
ea
r end
ed
31 M
arc
h 2
01
6
32
8
Ap
pen
dix
3.1
3.1
Sta
tem
ent
sho
win
g t
he
det
ail
s o
f sh
ort
/non
lev
y o
f st
am
p d
uty
an
d n
on
-lev
y o
f R
egis
tra
tio
n f
ee
(Am
ou
nt
in `̀̀̀
)
Sl.
No
.
Na
me
of
all
ott
ee (
S/S
hri
) S
ho
p
No
.
Da
te o
f
all
otm
ent
Pre
miu
m/
Off
set
pri
ce
Lev
iab
le
Sta
mp
Du
ty
(SD
)
(8%
/7.5
%
/5%
)
Lev
iab
le
Reg
istr
ati
on
Fee
(R
F)
(75%
of
SD
)
To
tal
levia
ble
SD
+R
F
Sta
mp
Du
ty
levie
d
Reg
istr
ati
on
fee
levie
d
Sh
ort
lev
y
of
SD
/RF
Ap
pli
cab
le r
ate
s
of
SD
(1)
(2)
(3)
(4)
(5)
(6)
(7)
(8=
6+
7)
(9)
(10
) {1
1=
8-
(9+
10
)}
(12
)
Ro
giK
aly
an
Sa
mit
i, G
aro
th O
/o t
he
Ch
ief
Med
ica
l &
Hea
lth
Off
icer
, M
an
dsa
ur
1
Faz
lud
din
S
/O
Sh
. A
bdu
l R
ajaa
kAgw
an
1
15
-07
-19
99
23
550
1 1
766
3 1
324
7 3
091
0 0
.00
0.0
0 3
091
0 7
.5%
2
Mah
esh
K
um
ar
S/O
S
h.
Bal
chan
dji
Mod
i 2
1
5-0
7-1
999
2
355
01
17
663
13
247
30
910
0.0
0 0
.00
30
910
7.5
%
3
Kam
lesh
Ku
mar
Gu
pta
3
1
5-0
7-1
999
2
355
01
17
663
13
247
30
910
0.0
0 0
.00
30
910
7.5
%
4
Am
it K
um
ar C
hau
dh
ary
4
15
-07
-19
99
23
550
1 1
766
3 1
324
7 3
091
0 0
.00
0.0
0 3
091
0 7
.5%
5
Sh
arad
Ku
mar
Mu
lch
and
5
15
-07
-19
99
23
550
1 1
766
3 1
324
7 3
091
0 0
.00
0.0
0 3
091
0 7
.5%
6
Mu
kesh
Ch
audh
ary
6
15
-07
-19
99
23
550
1 1
766
3 1
324
7 3
091
0 0
.00
0.0
0 3
091
0 7
.5%
7
Jagd
ish
C
han
dra
S
/O
Sh
. R
amch
and
ra
7
15
-07
-19
99
23
550
1 1
766
3 1
324
7 3
091
0 0
.00
0.0
0 3
091
0 7
.5%
8
Kri
shn
akan
t S
/O S
h.
Bad
rila
l 8
1
5-0
7-1
999
2
355
01
17
663
13
247
30
910
0.0
0 0
.00
30
910
7.5
%
9
Dh
aram
chan
d S
angh
avi
9
15
-07
-19
99
23
550
1 1
766
3 1
324
7 3
091
0 0
.00
0.0
0 3
091
0 7
.5%
10
An
il A
graw
al
10
15
-07
-19
99
23
550
1 1
766
3 1
324
7 3
091
0 0
.00
0.0
0 3
091
0 7
.5%
11
Ram
esh
chan
dra
S/O
Bh
eru
lal
11
15
-07
-19
99
23
550
1 1
766
3 1
324
7 3
091
0 0
.00
0.0
0 3
091
0 7
.5%
12
Mah
esh
S/O
Bal
aram
1
2 1
5-0
7-1
999
2
355
01
17
663
13
247
30
910
0.0
0 0
.00
30
910
7.5
%
13
Rad
hes
hya
m S
/O R
amd
yal
13
15
-07
-19
99
23
550
1 1
766
3 1
324
7 3
091
0 0
.00
0.0
0 3
091
0 7
.5%
14
An
il K
um
ar U
diy
a 1
4 1
5-0
7-1
999
2
355
01
17
663
13
247
30
910
0.0
0 0
.00
30
910
7.5
%
15
Bh
eru
lal
S/O
Sh
. G
ove
rdh
anla
l 1
5 1
5-0
7-1
999
2
355
01
17
663
13
247
30
910
0.0
0 0
.00
30
910
7.5
%
16
Ban
shil
al C
hau
dhar
y 1
6 1
5-0
7-1
999
2
355
01
17
663
13
247
30
910
0.0
0 0
.00
30
910
7.5
%
17
Sm
t. S
um
itra
bai
Mu
java
diy
a 1
7 1
5-0
7-1
999
2
355
01
17
663
13
247
30
910
0.0
0 0
.00
30
910
7.5
%
18
Sh
ivra
j S
ingh
S
/O
Sh
. B
rijr
aj
Sin
gh
18
15
-07
-19
99
23
550
1 1
766
3 1
324
7 3
091
0 0
.00
0.0
0 3
091
0 7
.5%
(Ref
eren
ce:
Pa
rag
rap
h 3
.13
, P
ag
e N
o.
20
7)
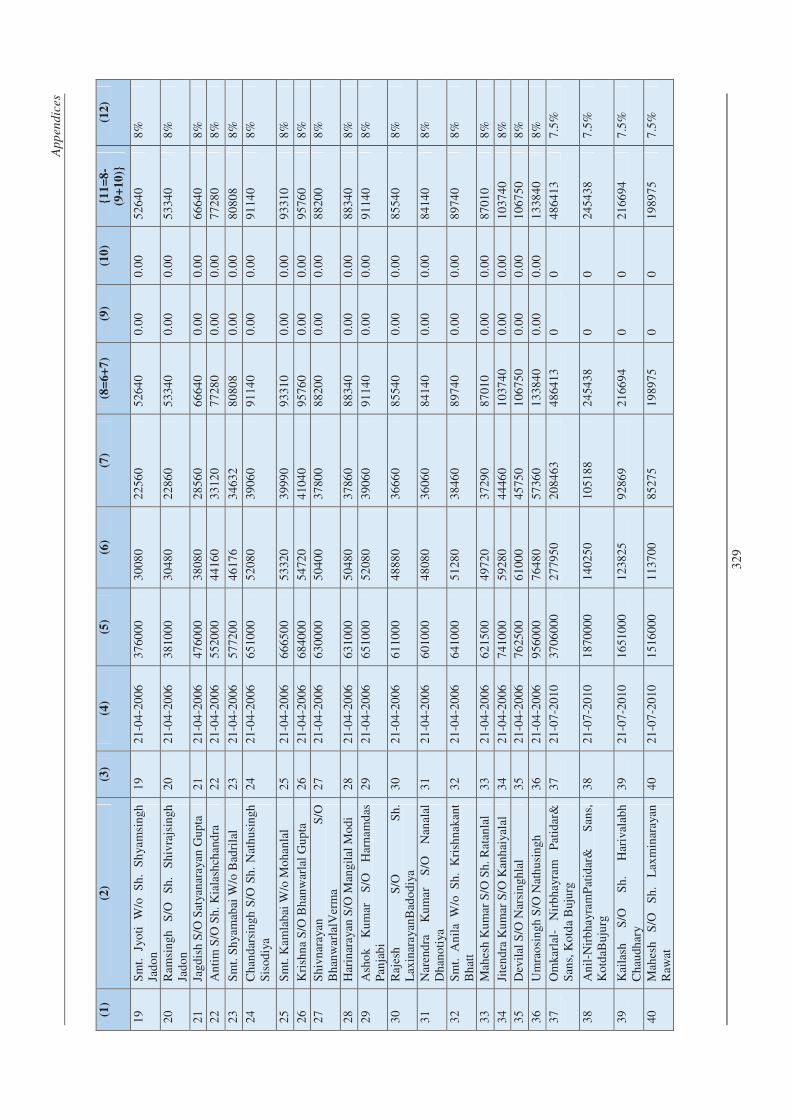
Ap
pen
dic
es
32
9
(1)
(2)
(3)
(4)
(5)
(6)
(7)
(8=
6+
7)
(9)
(10
) {1
1=
8-
(9+
10
)}
(12
)
19
Sm
t.
Jyo
ti
W/o
S
h.
Sh
yam
sin
gh
Jad
on
19
21
-04
-20
06
37
600
0 3
008
0 2
256
0 5
264
0 0
.00
0.0
0 5
264
0 8
%
20
Ram
sin
gh
S/O
S
h.
Sh
ivra
jsin
gh
Jad
on
20
21
-04
-20
06
38
100
0 3
048
0 2
286
0 5
334
0 0
.00
0.0
0 5
334
0 8
%
21
Jagd
ish
S/O
Sat
yan
aray
an G
up
ta
21
21
-04
-20
06
47
600
0 3
808
0 2
856
0 6
664
0 0
.00
0.0
0 6
664
0 8
%
22
An
tim
S/O
Sh
. K
iala
shch
and
ra
22
21
-04
-20
06
55
200
0 4
416
0 3
312
0 7
728
0 0
.00
0.0
0 7
728
0 8
%
23
Sm
t. S
hya
mab
ai W
/o B
adri
lal
23
21
-04
-20
06
57
720
0 4
617
6 3
463
2 8
080
8 0
.00
0.0
0 8
080
8 8
%
24
Ch
and
arsi
ngh
S/O
Sh
. N
ath
usin
gh
Sis
od
iya
24
21
-04
-20
06
65
100
0 5
208
0 3
906
0 9
114
0 0
.00
0.0
0 9
114
0 8
%
25
Sm
t. K
amla
bai
W/o
Mo
han
lal
25
21
-04
-20
06
66
650
0 5
332
0 3
999
0 9
331
0 0
.00
0.0
0 9
331
0 8
%
26
Kri
shn
a S
/O B
han
war
lal
Gu
pta
2
6 2
1-0
4-2
006
6
840
00
54
720
41
040
95
760
0.0
0 0
.00
95
760
8%
27
Sh
ivn
aray
an
S/O
B
han
war
lalV
erm
a 2
7 2
1-0
4-2
006
6
300
00
50
400
37
800
88
200
0.0
0 0
.00
88
200
8%
28
Har
inar
ayan
S/O
Man
gila
l M
od
i 2
8 2
1-0
4-2
006
6
310
00
50
480
37
860
88
340
0.0
0 0
.00
88
340
8%
29
Ash
ok
Ku
mar
S
/O
Har
nam
das
P
anja
bi
29
21
-04
-20
06
65
100
0 5
208
0 3
906
0 9
114
0 0
.00
0.0
0 9
114
0 8
%
30
Raj
esh
S
/O
Sh
. L
axin
aray
anB
ado
diy
a 3
0 2
1-0
4-2
006
6
110
00
48
880
36
660
85
540
0.0
0 0
.00
85
540
8%
31
Nar
end
ra
Ku
mar
S
/O
Nan
alal
D
han
oti
ya
31
21
-04
-20
06
60
100
0 4
808
0 3
606
0 8
414
0 0
.00
0.0
0 8
414
0 8
%
32
Sm
t.
An
ila
W/o
S
h.
Kri
shn
akan
t B
hat
t 3
2 2
1-0
4-2
006
6
410
00
51
280
38
460
89
740
0.0
0 0
.00
89
740
8%
33
Mah
esh
Ku
mar
S/O
Sh
. R
atan
lal
33
21
-04
-20
06
62
150
0 4
972
0 3
729
0 8
701
0 0
.00
0.0
0 8
701
0 8
%
34
Jite
nd
ra K
um
ar S
/O K
anh
aiya
lal
34
21
-04
-20
06
74
100
0 5
928
0 4
446
0 1
037
40
0.0
0 0
.00
10
374
0 8
%
35
Dev
ilal
S/O
Nar
sin
ghla
l 3
5 2
1-0
4-2
006
7
625
00
61
000
45
750
10
675
0 0
.00
0.0
0 1
067
50
8%
36
Um
rao
sin
gh S
/O N
ath
usi
ngh
3
6 2
1-0
4-2
006
9
560
00
76
480
57
360
13
384
0 0
.00
0.0
0 1
338
40
8%
37
Om
karl
al-
Nir
bh
ayra
m
Pat
idar
&
San
s, K
otd
a B
uju
rg
37
21
-07
-20
10
37
060
00
27
795
0 2
084
63
48
641
3 0
0
4
864
13
7.5
%
38
An
il-N
irb
hay
ram
Pat
idar
&
San
s,
Ko
tdaB
uju
rg
38
21
-07
-20
10
18
700
00
14
025
0 1
051
88
24
543
8 0
0
2
454
38
7.5
%
39
Kai
lash
S
/O
Sh
. H
ariv
alab
h C
hau
dhar
y 3
9 2
1-0
7-2
010
1
651
000
1
238
25
92
869
21
669
4 0
0
2
166
94
7.5
%
40
Mah
esh
S
/O
Sh
. L
axm
inar
ayan
R
awat
4
0 2
1-0
7-2
010
1
516
000
1
137
00
85
275
19
897
5 0
0
1
989
75
7.5
%
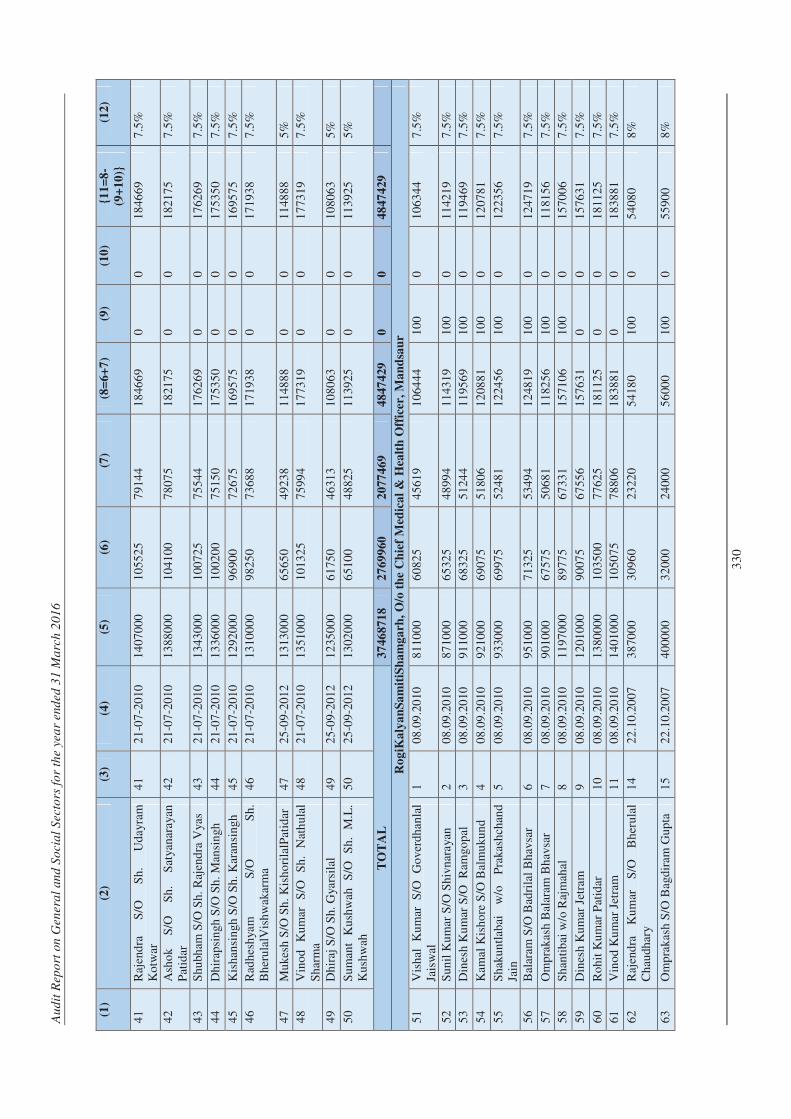
Au
dit
Rep
ort
on
Gen
era
l an
d S
ocia
l S
ecto
rs f
or
the y
ea
r end
ed
31 M
arc
h 2
01
6
33
0
(1)
(2)
(3)
(4)
(5)
(6)
(7)
(8=
6+
7)
(9)
(10
) {1
1=
8-
(9+
10
)}
(12
)
41
Raj
end
ra
S/O
S
h.
Ud
ayra
m
Ko
twar
4
1 2
1-0
7-2
010
1
407
000
1
055
25
79
144
18
466
9 0
0
1
846
69
7.5
%
42
Ash
ok
S/O
S
h.
Sat
yan
aray
an
Pat
idar
4
2 2
1-0
7-2
010
1
388
000
1
041
00
78
075
18
217
5 0
0
1
821
75
7.5
%
43
Sh
ubh
am S
/O S
h.
Raj
end
ra V
yas
43
21
-07
-20
10
13
430
00
10
072
5 7
554
4 1
762
69
0
0
17
626
9 7
.5%
44
Dh
irap
sin
gh S
/O S
h. M
ansi
ngh
4
4 2
1-0
7-2
010
1
336
000
1
002
00
75
150
17
535
0 0
0
1
753
50
7.5
%
45
Kis
han
sin
gh S
/O S
h.
Kar
ansi
ngh
4
5 2
1-0
7-2
010
1
292
000
9
690
0 7
267
5 1
695
75
0
0
16
957
5 7
.5%
46
Rad
hes
hya
m
S/O
S
h.
Bh
eru
lalV
ish
wak
arm
a 4
6 2
1-0
7-2
010
1
310
000
9
825
0 7
368
8 1
719
38
0
0
17
193
8 7
.5%
47
Mu
kesh
S/O
Sh
. K
ish
ori
lalP
atid
ar
47
25
-09
-20
12
13
130
00
65
650
49
238
11
488
8 0
0
1
148
88
5%
48
Vin
od
K
um
ar
S/O
S
h.
Nat
hu
lal
Sh
arm
a 4
8 2
1-0
7-2
010
1
351
000
1
013
25
75
994
17
731
9 0
0
1
773
19
7.5
%
49
Dh
iraj
S/O
Sh.
Gya
rsil
al
49
25
-09
-20
12
12
350
00
61
750
46
313
10
806
3 0
0
1
080
63
5%
50
Su
man
t K
ush
wah
S
/O
Sh
. M
.L.
Ku
shw
ah
50
25
-09
-20
12
13
020
00
65
100
48
825
11
392
5 0
0
1
139
25
5%
TO
TA
L
37
46
871
8
27
69
960
20
77
469
48
47
429
0
0
48
47
429
Ro
giK
aly
an
Sa
mit
iSh
am
ga
rh,
O/o
th
e C
hie
f M
edic
al
& H
ealt
h O
ffic
er,
Ma
nd
sau
r
51
Vis
hal
K
um
ar
S/O
G
ove
rdh
anla
l Ja
isw
al
1
08
.09
.20
10
81
100
0 6
082
5 4
561
9 1
064
44
10
0 0
1
063
44
7.5
%
52
Su
nil
Ku
mar
S/O
Sh
ivn
aray
an
2
08
.09
.20
10
87
100
0 6
532
5 4
899
4 1
143
19
10
0 0
1
142
19
7.5
%
53
Din
esh
Ku
mar
S/O
R
amgo
pal
3
0
8.0
9.2
010
9
110
00
68
325
51
244
11
956
9 1
00
0
11
946
9 7
.5%
54
Kam
al K
ish
ore
S/O
Bal
mu
kun
d
4
08
.09
.20
10
92
100
0 6
907
5 5
180
6 1
208
81
10
0 0
1
207
81
7.5
%
55
Sh
aku
ntl
abai
w
/o
Pra
kash
chan
d Ja
in
5
08
.09
.20
10
93
300
0 6
997
5 5
248
1 1
224
56
10
0 0
1
223
56
7.5
%
56
Bal
aram
S/O
Bad
rila
l B
hav
sar
6
08
.09
.20
10
95
100
0 7
132
5 5
349
4 1
248
19
10
0 0
1
247
19
7.5
%
57
Om
pra
kas
h B
alar
am B
hav
sar
7
08
.09
.20
10
90
100
0 6
757
5 5
068
1 1
182
56
10
0 0
1
181
56
7.5
%
58
Sh
anti
bai
w/o
Raj
mah
al
8
08
.09
.20
10
11
970
00
89
775
67
331
15
710
6 1
00
0
15
700
6 7
.5%
59
Din
esh
Ku
mar
Jet
ram
9
0
8.0
9.2
010
1
201
000
9
007
5 6
755
6 1
576
31
0
0
15
763
1 7
.5%
60
Ro
hit
Ku
mar
Pat
idar
1
0 0
8.0
9.2
010
1
380
000
1
035
00
77
625
18
112
5 0
0
1
811
25
7.5
%
61
Vin
od
Ku
mar
Jet
ram
1
1 0
8.0
9.2
010
1
401
000
1
050
75
78
806
18
388
1 0
0
1
838
81
7.5
%
62
Raj
end
ra
Ku
mar
S
/O
Bh
eru
lal
Ch
audh
ary
14
22
.10
.20
07
38
700
0 3
096
0 2
322
0 5
418
0 1
00
0
54
080
8%
63
Om
pra
kas
h S
/O B
agd
iram
Gu
pta
1
5 2
2.1
0.2
007
4
000
00
32
000
24
000
56
000
10
0 0
5
590
0 8
%
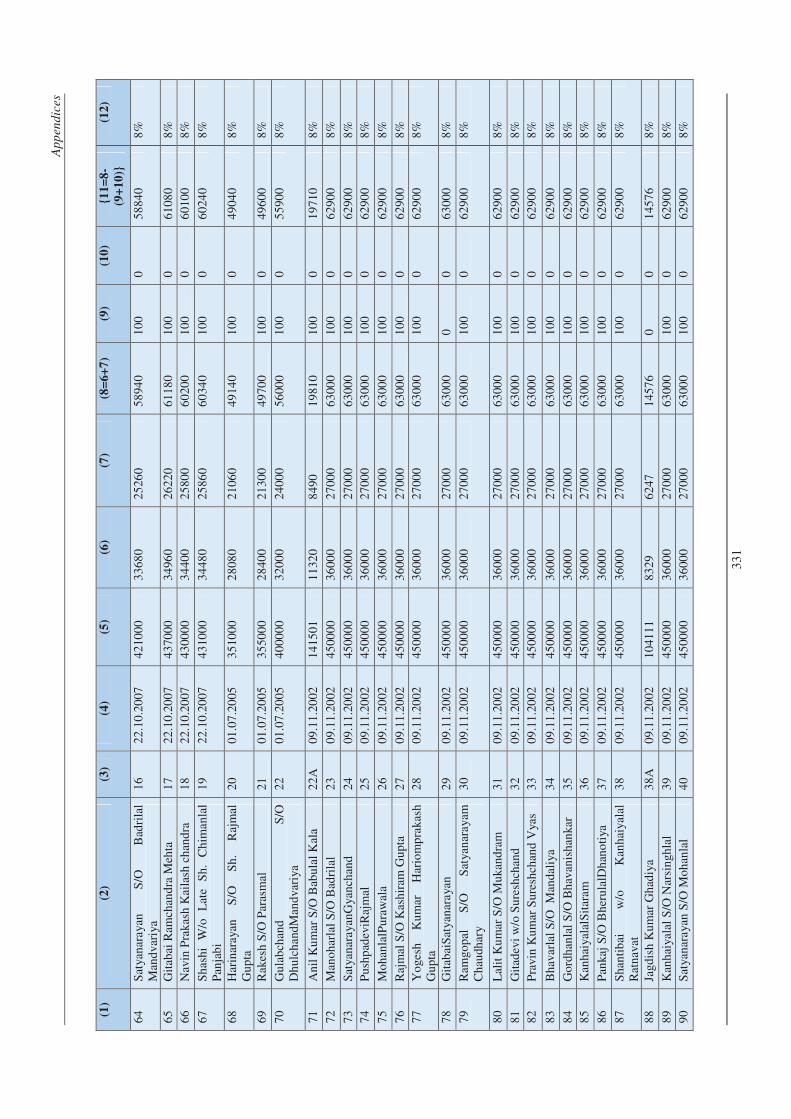
Ap
pen
dic
es
33
1
(1)
(2)
(3)
(4)
(5)
(6)
(7)
(8=
6+
7)
(9)
(10
) {1
1=
8-
(9+
10
)}
(12
)
64
Sat
yan
aray
an
S/O
B
adri
lal
Man
dva
riya
1
6 2
2.1
0.2
007
4
210
00
33
680
25
260
58
940
10
0 0
5
884
0 8
%
65
Git
abai
Ram
chan
dra
Meh
ta
17
22
.10
.20
07
43
700
0 3
496
0 2
622
0 6
118
0 1
00
0
61
080
8%
66
Nav
in P
rak
ash
Kai
lash
ch
and
ra
18
22
.10
.20
07
43
000
0 3
440
0 2
580
0 6
020
0 1
00
0
60
100
8%
67
Sh
ash
i W
/o
Lat
e S
h.
Ch
iman
lal
Pan
jab
i 1
9 2
2.1
0.2
007
4
310
00
34
480
25
860
60
340
10
0 0
6
024
0 8
%
68
Har
inar
ayan
S
/O
Sh
. R
ajm
al
Gu
pta
2
0 0
1.0
7.2
005
3
510
00
28
080
21
060
49
140
10
0 0
4
904
0 8
%
69
Rak
esh
S/O
Par
asm
al
21
01
.07
.20
05
35
500
0 2
840
0 2
130
0 4
970
0 1
00
0
49
600
8%
70
Gu
lab
chan
d S
/O
Dh
ulc
han
dM
and
vari
ya
22
01
.07
.20
05
40
000
0 3
200
0 2
400
0 5
600
0 1
00
0
55
900
8%
71
An
il K
um
ar S
/O B
abu
lal
Kal
a 2
2A
0
9.1
1.2
002
1
415
01
11
320
84
90
19
810
10
0 0
1
971
0 8
%
72
Man
oh
arla
l S
/O B
adri
lal
23
09
.11
.20
02
45
000
0 3
600
0 2
700
0 6
300
0 1
00
0
62
900
8%
73
Sat
yan
aray
anG
yan
chan
d
24
09
.11
.20
02
45
000
0 3
600
0 2
700
0 6
300
0 1
00
0
62
900
8%
74
Pu
shp
adev
iRaj
mal
2
5 0
9.1
1.2
002
4
500
00
36
000
27
000
63
000
10
0 0
6
290
0 8
%
75
Mo
han
lalP
ura
wal
a 2
6 0
9.1
1.2
002
4
500
00
36
000
27
000
63
000
10
0 0
6
290
0 8
%
76
Raj
mal
S/O
Kas
hir
am G
up
ta
27
09
.11
.20
02
45
000
0 3
600
0 2
700
0 6
300
0 1
00
0
62
900
8%
77
Yo
gesh
K
um
ar
Har
iom
pra
kas
h G
up
ta
28
09
.11
.20
02
45
000
0 3
600
0 2
700
0 6
300
0 1
00
0
62
900
8%
78
Git
abai
Sat
yan
aray
an
29
09
.11
.20
02
45
000
0 3
600
0 2
700
0 6
300
0 0
0
6
300
0 8
%
79
Ram
gop
al
S/O
S
atya
nar
ayam
C
hau
dhar
y 3
0 0
9.1
1.2
002
4
500
00
36
000
27
000
63
000
10
0 0
6
290
0 8
%
80
Lal
it K
um
ar S
/O M
uk
and
ram
3
1 0
9.1
1.2
002
4
500
00
36
000
27
000
63
000
10
0 0
6
290
0 8
%
81
Git
adev
i w
/o S
ure
shch
and
32
09
.11
.20
02
45
000
0 3
600
0 2
700
0 6
300
0 1
00
0
62
900
8%
82
Pra
vin
Ku
mar
Su
resh
chan
d V
yas
33
09
.11
.20
02
45
000
0 3
600
0 2
700
0 6
300
0 1
00
0
62
900
8%
83
Bh
avar
lal
S/O
M
and
aliy
a 3
4 0
9.1
1.2
002
4
500
00
36
000
27
000
63
000
10
0 0
6
290
0 8
%
84
Go
rdh
anla
l S
/O B
hav
anis
han
kar
35
09
.11
.20
02
45
000
0 3
600
0 2
700
0 6
300
0 1
00
0
62
900
8%
85
Kan
hai
yala
lSit
aram
3
6 0
9.1
1.2
002
4
500
00
36
000
27
000
63
000
10
0 0
6
290
0 8
%
86
Pan
kaj
S/O
Bh
eru
lalD
han
oti
ya
37
09
.11
.20
02
45
000
0 3
600
0 2
700
0 6
300
0 1
00
0
62
900
8%
87
Sh
anti
bai
w
/o
Kan
hai
yala
l R
atn
avat
3
8 0
9.1
1.2
002
4
500
00
36
000
27
000
63
000
10
0 0
6
290
0 8
%
88
Jagd
ish
Ku
mar
Gh
adiy
a 3
8A
0
9.1
1.2
002
1
041
11
83
29
62
47
14
576
0
0
14
576
8%
89
Kan
hai
yala
l S
/O N
arsi
ngh
lal
39
09
.11
.20
02
45
000
0 3
600
0 2
700
0 6
300
0 1
00
0
62
900
8%
90
Sat
yan
aray
an S
/O M
oh
anla
l 4
0 0
9.1
1.2
002
4
500
00
36
000
27
000
63
000
10
0 0
6
290
0 8
%
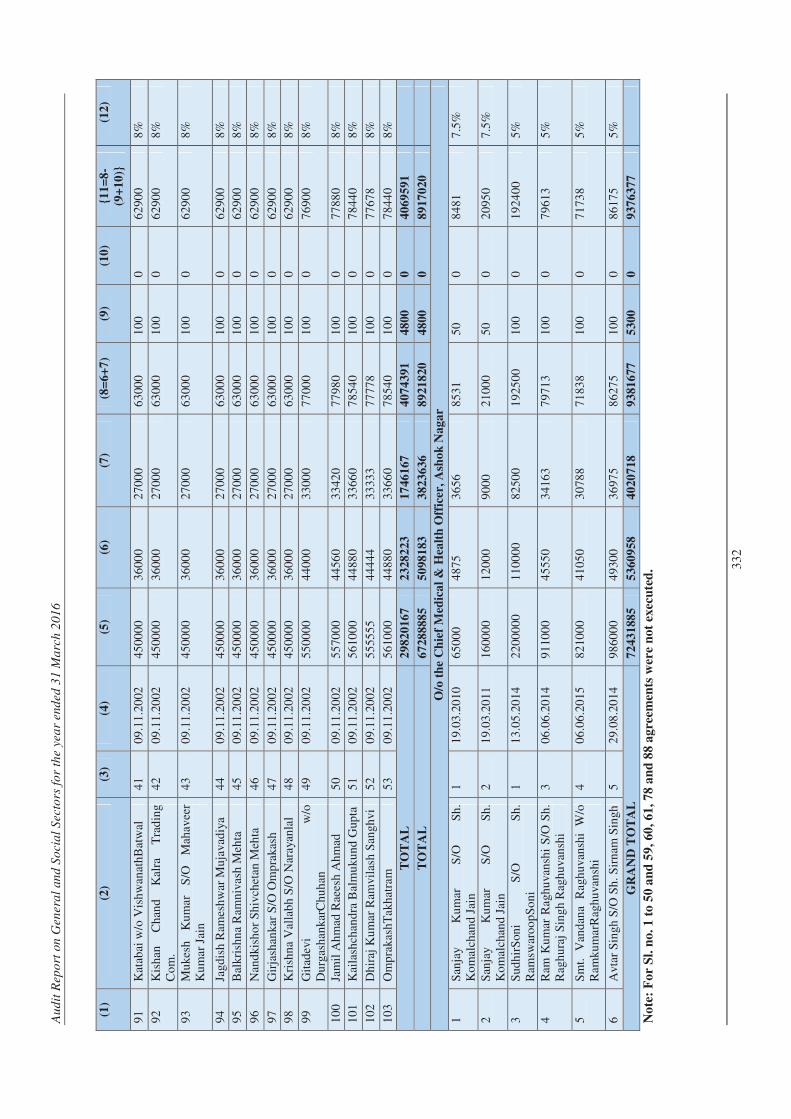
Au
dit
Rep
ort
on
Gen
era
l an
d S
ocia
l S
ecto
rs f
or
the y
ea
r end
ed
31 M
arc
h 2
01
6
33
2
(1)
(2)
(3)
(4)
(5)
(6)
(7)
(8=
6+
7)
(9)
(10
) {1
1=
8-
(9+
10
)}
(12
)
91
Kat
abai
w/o
Vis
hw
anat
hB
atw
al
41
09
.11
.20
02
45
000
0 3
600
0 2
700
0 6
300
0 1
00
0
62
900
8%
92
Kis
han
C
han
d
Kal
ra
Tra
din
g C
om
. 4
2 0
9.1
1.2
002
4
500
00
36
000
27
000
63
000
10
0 0
6
290
0 8
%
93
Mu
kesh
K
um
ar
S/O
M
ahav
eer
Ku
mar
Jai
n
43
09
.11
.20
02
45
000
0 3
600
0 2
700
0 6
300
0 1
00
0
62
900
8%
94
Jagd
ish
Ram
esh
war
Mu
java
diy
a 4
4 0
9.1
1.2
002
4
500
00
36
000
27
000
63
000
10
0 0
6
290
0 8
%
95
Bal
kris
hn
a R
amn
ivas
h M
ehta
4
5 0
9.1
1.2
002
4
500
00
36
000
27
000
63
000
10
0 0
6
290
0 8
%
96
Nan
dki
sho
r S
hiv
chet
an M
ehta
4
6 0
9.1
1.2
002
4
500
00
36
000
27
000
63
000
10
0 0
6
290
0 8
%
97
Gir
jash
anka
r S
/O O
mp
raka
sh
47
09
.11
.20
02
45
000
0 3
600
0 2
700
0 6
300
0 1
00
0
62
900
8%
98
Kri
shn
a V
alla
bh
S/O
Nar
ayan
lal
48
09
.11
.20
02
45
000
0 3
600
0 2
700
0 6
300
0 1
00
0
62
900
8%
99
Git
adev
i w
/o
Du
rgas
han
karC
hu
han
4
9 0
9.1
1.2
002
5
500
00
44
000
33
000
77
000
10
0 0
7
690
0 8
%
10
0 Ja
mil
Ah
mad
Rae
esh
Ah
mad
5
0 0
9.1
1.2
002
5
570
00
44
560
33
420
77
980
10
0 0
7
788
0 8
%
10
1 K
aila
shch
and
ra B
alm
uku
nd
Gup
ta
51
09
.11
.20
02
56
100
0 4
488
0 3
366
0 7
854
0 1
00
0
78
440
8%
10
2 D
hir
aj K
um
ar R
amvi
lash
San
ghvi
5
2 0
9.1
1.2
002
5
555
55
44
444
33
333
77
778
10
0 0
7
767
8 8
%
10
3 O
mp
rak
ash
Tak
hat
ram
5
3 0
9.1
1.2
002
5
610
00
44
880
33
660
78
540
10
0 0
7
844
0 8
%
TO
TA
L
29
82
016
7
23
28
223
17
46
167
40
74
391
48
00
0
40
69
591
TO
TA
L
67
28
888
5
50
98
183
38
23
636
89
21
820
48
00
0
89
17
020
O/o
th
e C
hie
f M
edic
al
& H
ealt
h O
ffic
er,
Ash
ok
Na
ga
r
1
San
jay
Ku
mar
S
/O
Sh
. K
om
alch
and
Jai
n 1
1
9.0
3.2
010
6
500
0 4
875
3
656
8
531
5
0 0
8
481
7
.5%
2
San
jay
Ku
mar
S
/O
Sh
. K
om
alch
and
Jai
n 2
1
9.0
3.2
011
1
600
00
12
000
90
00
21
000
50
0
20
950
7.5
%
3
Su
dh
irS
oni
S/O
S
h.
Ram
swar
oo
pS
on
i 1
1
3.0
5.2
014
2
200
000
1
100
00
82
500
19
250
0 1
00
0
19
240
0 5
%
4
Ram
Ku
mar
Rag
hu
van
shi
S/O
Sh
. R
agh
ura
j S
ingh
Rag
hu
van
shi
3
06
.06
.20
14
91
100
0 4
555
0 3
416
3 7
971
3 1
00
0
79
613
5%
5
Sm
t.
Van
dan
a R
agh
uva
nsh
i W
/o
Ram
kum
arR
agh
uva
nsh
i 4
0
6.0
6.2
015
8
210
00
41
050
30
788
71
838
10
0 0
7
173
8 5
%
6
Avt
ar S
ingh
S/O
Sh
. S
irn
am S
ingh
5
2
9.0
8.2
014
9
860
00
49
300
36
975
86
275
10
0 0
8
617
5 5
%
GR
AN
D T
OT
AL
7
243
188
5
53
60
958
40
20
718
93
81
677
53
00
0
93
76
377
No
te:
Fo
r S
l. n
o. 1
to
50 a
nd
59
, 60
, 61
, 78
an
d 8
8 a
gre
emen
ts w
ere
no
t ex
ecu
ted
.
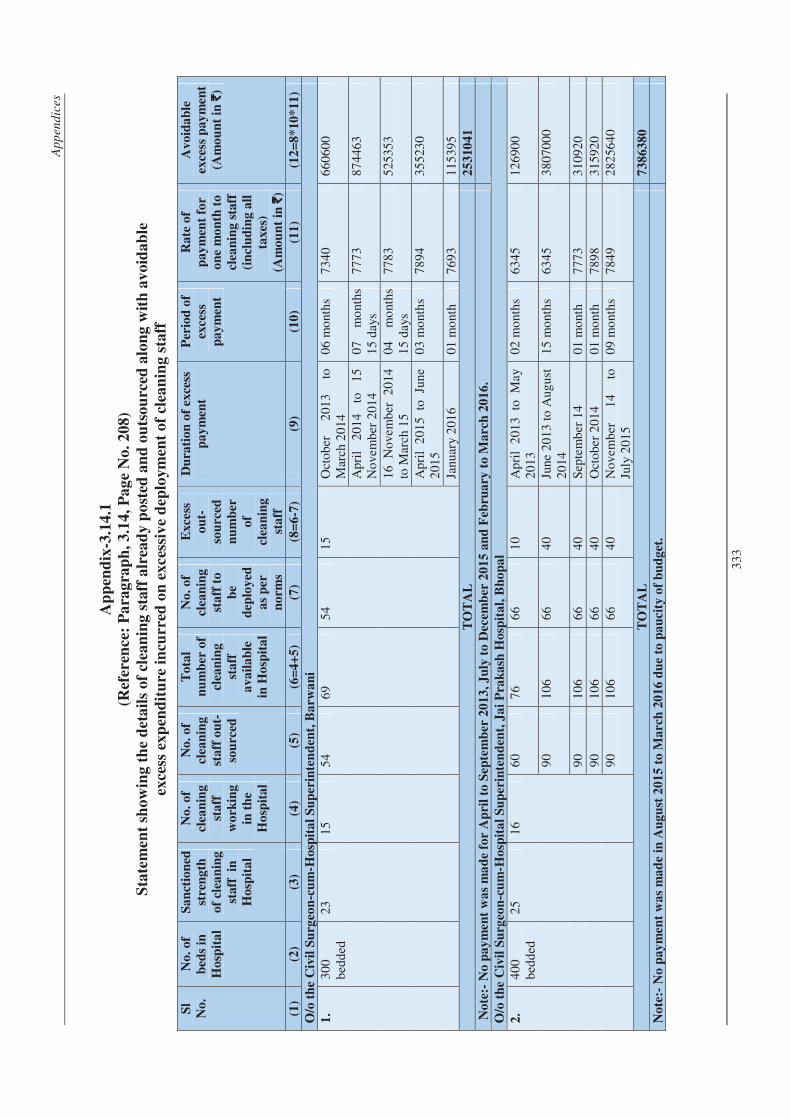
Ap
pen
dic
es
33
3
Ap
pen
dix
-3.1
4.1
(Ref
eren
ce:
Pa
rag
rap
h,
3.1
4,
Pa
ge
No
. 2
08
)
Sta
tem
ent
sho
win
g t
he
det
ail
s o
f cl
ean
ing
sta
ff a
lrea
dy
po
sted
an
d o
uts
ou
rced
alo
ng
wit
h a
vo
ida
ble
exce
ss e
xp
end
itu
re i
ncu
rred
on
ex
ces
siv
e d
eplo
ym
ent
of
clea
nin
g s
taff
Sl
No
.
No
. o
f
bed
s in
Ho
spit
al
Sa
nct
ion
ed
stre
ng
th
of
clea
nin
g
sta
ff
in
Ho
spit
al
No
. o
f
clea
nin
g
sta
ff
wo
rkin
g
in t
he
Ho
spit
al
No
. o
f
clea
nin
g
sta
ff o
ut-
sou
rced
To
tal
nu
mb
er o
f
clea
nin
g
sta
ff
av
ail
ab
le
in H
osp
ita
l
No
. o
f
clea
nin
g
sta
ff t
o
be
dep
loy
ed
as
per
no
rm
s
Exce
ss
ou
t-
sou
rced
nu
mb
er
of
clea
nin
g
sta
ff
Du
rati
on
of
exce
ss
pa
ym
ent
Per
iod
of
exce
ss
pa
ym
ent
Ra
te o
f
pa
ym
ent
for
on
e m
on
th t
o
clea
nin
g s
taff
(in
clu
din
g a
ll
taxes
)
(Am
ou
nt
in `̀̀̀
)
Av
oid
ab
le
exce
ss p
ay
men
t
(Am
ou
nt
in `̀̀̀
)
(1)
(2)
(3)
(4)
(5)
(6=
4+
5)
(7)
(8=
6-7
) (9
) (1
0)
(11
) (1
2=
8*
10
*11
)
O/o
th
e C
ivil
Su
rgeo
n-c
um
-Ho
spit
al
Su
per
inte
nd
ent,
Ba
rwa
ni
1.
30
0
bed
ded
2
3 1
5 5
4 6
9 5
4 1
5 O
cto
ber
2
013
to
M
arch
20
14
06
mo
nth
s 7
34
0 6
60
600
Ap
ril
20
14
to
1
5
No
vem
ber
20
14
07
m
ont
hs
15
day
s 7
77
3 8
74
463
16
N
ove
mb
er
20
14
to M
arch
15
04
m
ont
hs
15
day
s 7
78
3 5
25
353
Ap
ril
20
15
to
Ju
ne
20
15
03
mo
nth
s 7
89
4 3
55
230
Janu
ary
20
16
0
1 m
ont
h
76
93
11
539
5 T
OT
AL
2
53
10
41
No
te:-
No p
ay
men
t w
as
ma
de
for
Ap
ril
to S
epte
mb
er 2
01
3,
Ju
ly t
o D
ecem
ber
20
15
an
d F
ebru
ary
to
Ma
rch
20
16
.
O/o
th
e C
ivil
Su
rgeo
n-c
um
-Ho
spit
al
Su
per
inte
nd
ent,
Ja
i P
rak
ash
Ho
spit
al,
Bh
op
al
2.
40
0
bed
ded
2
5 1
6 6
0 7
6 6
6 1
0 A
pri
l 2
01
3
to
May
2
01
3 0
2 m
ont
hs
63
45
12
690
0
90
10
6 6
6 4
0 Ju
ne 2
01
3 t
o A
ugus
t 2
01
4 1
5 m
ont
hs
63
45
38
070
00
90
10
6 6
6 4
0 S
epte
mb
er 1
4
01
mo
nth
7
77
3 3
10
920
90
10
6 6
6 4
0 O
cto
ber
201
4 0
1 m
ont
h
78
98
31
592
0 9
0 1
06
66
40
No
vem
ber
1
4
to
July
20
15
09
mo
nth
s 7
84
9 2
82
564
0
TO
TA
L
73
863
80
No
te:-
No
pay
men
t w
as
ma
de
in A
ug
ust
20
15
to
Ma
rch
20
16
du
e to
pa
uci
ty o
f b
ud
get
.
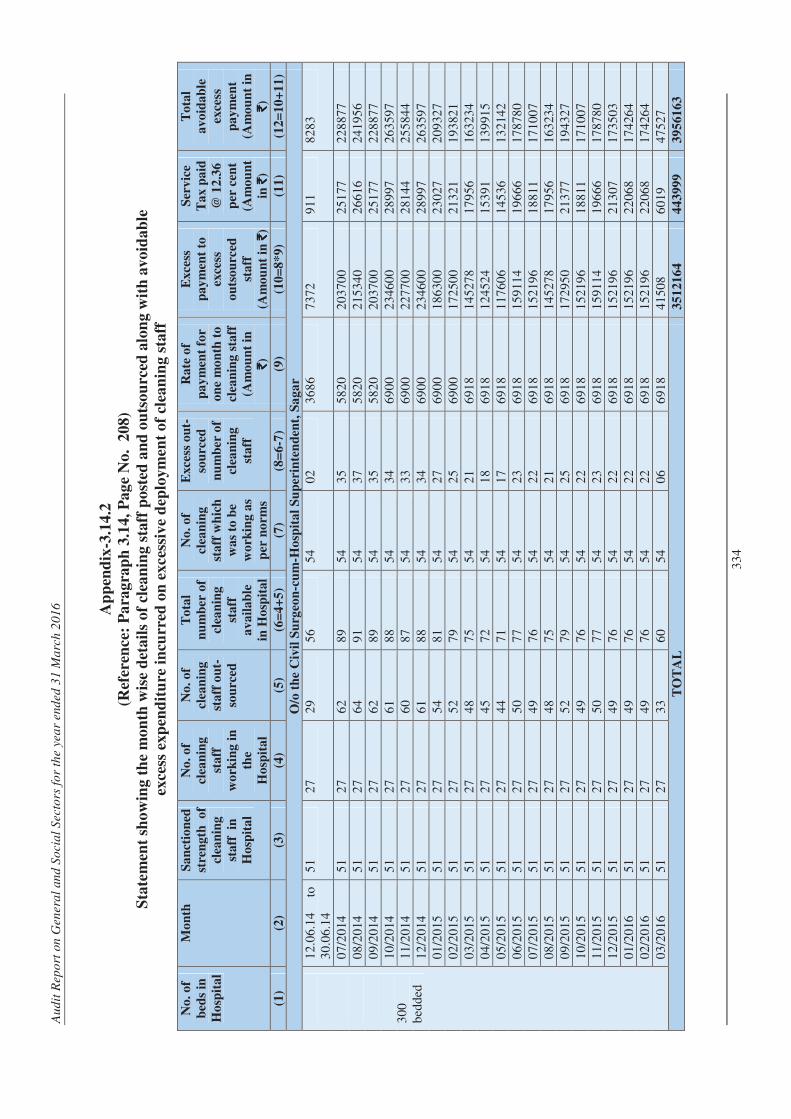
Au
dit
Rep
ort
on
Gen
era
l an
d S
ocia
l S
ecto
rs f
or
the y
ea
r end
ed
31 M
arc
h 2
01
6
33
4
Ap
pen
dix
-3.1
4.2
(Ref
eren
ce:
Pa
rag
rap
h 3
.14
, P
ag
e N
o.
20
8)
Sta
tem
ent
sho
win
g t
he
mo
nth
wis
e d
eta
ils
of
clea
nin
g s
taff
po
sted
an
d o
uts
ou
rced
alo
ng
wit
h a
vo
ida
ble
exce
ss e
xp
end
itu
re i
ncu
rred
on
ex
ces
siv
e d
eplo
ym
ent
of
clea
nin
g s
taff
No
. o
f
bed
s in
Ho
spit
al
Mo
nth
S
an
ctio
ned
stre
ng
th
of
clea
nin
g
sta
ff
in
Ho
spit
al
No
. o
f
clea
nin
g
sta
ff
wo
rkin
g i
n
the
Ho
spit
al
No
. o
f
clea
nin
g
sta
ff o
ut-
sou
rced
To
tal
nu
mb
er o
f
clea
nin
g
sta
ff
av
ail
ab
le
in H
osp
ita
l
No
. o
f
clea
nin
g
sta
ff w
hic
h
wa
s to
be
wo
rkin
g a
s
per
no
rm
s
Exce
ss o
ut-
sou
rced
nu
mb
er o
f
clea
nin
g
sta
ff
Ra
te o
f
pa
ym
ent
for
on
e m
on
th t
o
clea
nin
g s
taff
(Am
ou
nt
in
`̀̀̀)
Exce
ss
pa
ym
ent
to
exce
ss
ou
tso
urc
ed
sta
ff
(Am
ou
nt
in `̀̀̀
)
Ser
vic
e
Ta
x p
aid
@ 1
2.3
6
per
cen
t
(Am
ou
nt
in `̀̀̀
)
To
tal
av
oid
ab
le
exce
ss
pa
ym
ent
(Am
ou
nt
in
`̀̀̀)
(1)
(2)
(3)
(4)
(5)
(6=
4+
5)
(7)
(8=
6-7
) (9
) (1
0=
8*
9)
(11
) (1
2=
10
+1
1)
O/o
th
e C
ivil
Su
rgeo
n-c
um
-Ho
spit
al
Su
per
inte
nd
ent,
Sa
ga
r
30
0
bed
ded
12
.06.
14
to
3
0.0
6.1
4 5
1 2
7 2
9 5
6 5
4 0
2 3
68
6 7
37
2 9
11
82
83
07
/20
14
51
27
62
89
54
35
58
20
20
370
0 2
51
77
22
887
7 0
8/2
014
5
1 2
7 6
4 9
1 5
4 3
7 5
82
0 2
15
340
26
616
2
41
956
09
/20
14
51
27
62
89
54
35
58
20
20
370
0 2
51
77
22
887
7 1
0/2
014
5
1 2
7 6
1 8
8 5
4 3
4 6
90
0 2
34
600
28
997
2
63
597
11
/20
14
51
27
60
87
54
33
69
00
22
770
0 2
81
44
25
584
4 1
2/2
014
5
1 2
7 6
1 8
8 5
4 3
4 6
90
0 2
34
600
28
997
2
63
597
01
/20
15
51
27
54
81
54
27
69
00
18
630
0 2
30
27
20
932
7 0
2/2
015
5
1 2
7 5
2 7
9 5
4 2
5 6
90
0 1
72
500
21
321
1
93
821
03
/20
15
51
27
48
75
54
21
69
18
14
527
8 1
79
56
16
323
4 0
4/2
015
5
1 2
7 4
5 7
2 5
4 1
8 6
91
8 1
24
524
15
391
1
39
915
05
/20
15
51
27
44
71
54
17
69
18
11
760
6 1
45
36
13
214
2 0
6/2
015
5
1 2
7 5
0 7
7 5
4 2
3 6
91
8 1
59
114
19
666
1
78
780
07
/20
15
51
27
49
76
54
22
69
18
15
219
6 1
88
11
17
100
7 0
8/2
015
5
1 2
7 4
8 7
5 5
4 2
1 6
91
8 1
45
278
17
956
1
63
234
09
/20
15
51
27
52
79
54
25
69
18
17
295
0 2
13
77
19
432
7 1
0/2
015
5
1 2
7 4
9 7
6 5
4 2
2 6
91
8 1
52
196
18
811
1
71
007
11
/20
15
51
27
50
77
54
23
69
18
15
911
4 1
96
66
17
878
0 1
2/2
015
5
1 2
7 4
9 7
6 5
4 2
2 6
91
8 1
52
196
21
307
1
73
503
01
/20
16
51
27
49
76
54
22
69
18
15
219
6 2
20
68
17
426
4 0
2/2
016
5
1 2
7 4
9 7
6 5
4 2
2 6
91
8 1
52
196
22
068
1
74
264
03
/20
16
51
27
33
60
54
06
69
18
41
508
6
01
9 4
75
27
TO
TA
L
35
121
64
44
399
9
39
561
63
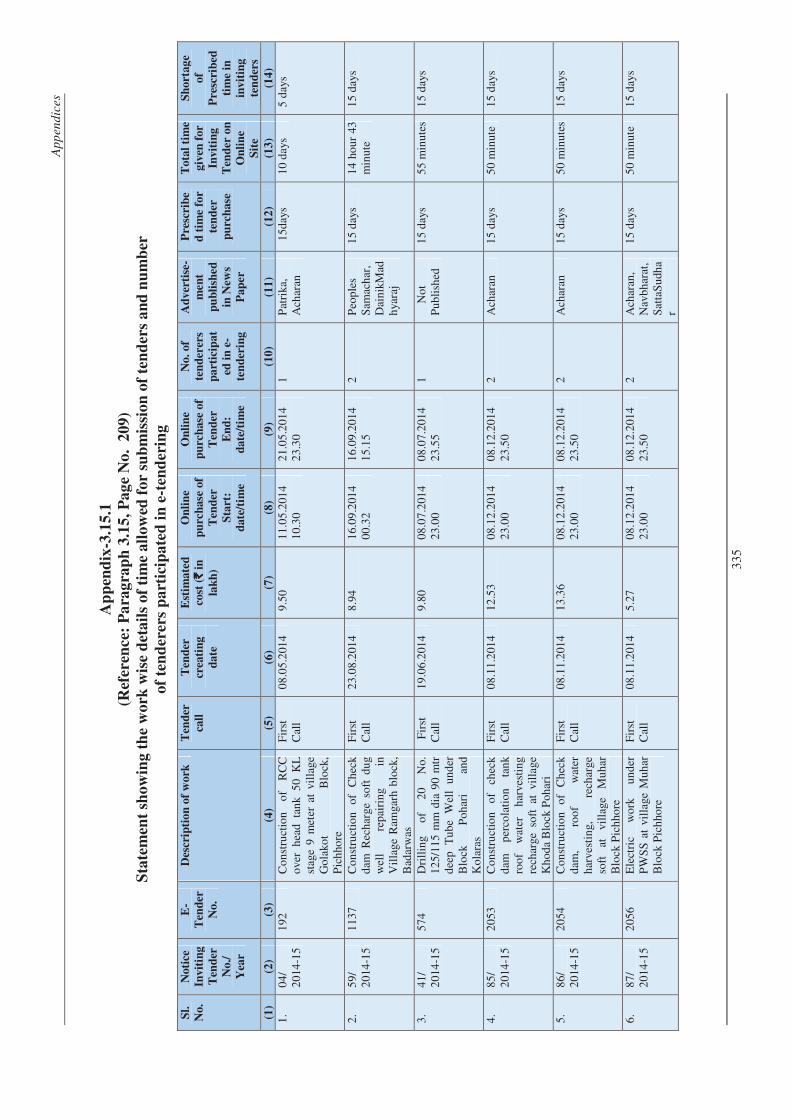
Ap
pen
dic
es
33
5
Ap
pen
dix
-3.1
5.1
(Ref
eren
ce:
Pa
rag
rap
h 3
.15
, P
ag
e N
o.
20
9)
Sta
tem
ent
sho
win
g t
he
wo
rk w
ise
det
ail
s o
f ti
me
all
ow
ed f
or
sub
mis
sio
n o
f te
nd
ers
an
d n
um
ber
of
ten
der
ers
pa
rtic
ipa
ted
in
e-t
end
erin
g
Sl.
No.
Noti
ce
Invit
ing
Ten
der
No./
Yea
r
E-
Ten
der
No.
Des
crip
tio
n o
f w
ork
T
end
er
call
Ten
der
crea
tin
g
date
Est
imate
d
cost
(`̀̀̀ i
n
lak
h)
On
lin
e
pu
rch
ase
of
Ten
der
Sta
rt:
date
/tim
e
On
lin
e
pu
rch
ase
of
Ten
der
En
d:
date
/tim
e
No.
of
ten
der
ers
pa
rtic
ipat
ed i
n e
-
ten
der
ing
Ad
ver
tise
-
men
t
pu
bli
shed
in N
ews
Pap
er
Pre
scri
be
d t
ime
for
ten
der
pu
rch
ase
Tota
l ti
me
giv
en f
or
Invit
ing
Ten
der
on
On
lin
e
Sit
e
Sh
ort
ag
e
of
Pre
scri
bed
tim
e in
invit
ing
ten
der
s
(1)
(2)
(3)
(4)
(5)
(6)
(7)
(8)
(9)
(10
) (1
1)
(12
) (1
3)
(14
)
1.
04
/ 2
014
-15
19
2 C
on
stru
ctio
n
of
RC
C
ove
r h
ead
ta
nk
50
K
L
stag
e 9
met
er a
t vi
llag
e G
ola
kot
Blo
ck,
Pic
hho
re
Fir
st
Cal
l 0
8.0
5.2
014
9.5
0 1
1.0
5.2
014
10
.30
21
.05
.201
4 2
3.3
0 1
P
atri
ka,
Ach
aran
1
5day
s 1
0 d
ays
5 d
ays
2.
59
/ 2
014
-15
11
37
Co
nst
ruct
ion
of
Ch
eck
dam
Rec
har
ge s
oft
du
g w
ell
rep
airi
ng
in
Vil
lage
Ram
garh
blo
ck,
Bad
arw
as
Fir
st
Cal
l 2
3.0
8.2
014
8.9
4 1
6.0
9.2
014
00
.32
16
.09
.201
4 1
5.1
5 2
P
eop
les
Sam
ach
ar,
Dai
nik
Mad
hya
raj
15
day
s 1
4 h
ou
r 43
m
inu
te
15
day
s
3.
41
/ 2
014
-15
57
4 D
rill
ing
of
20
N
o.
12
5/11
5 m
m d
ia 9
0 m
tr
dee
p
Tu
be
Wel
l u
nd
er
Blo
ck
Po
har
i an
d K
ola
ras
Fir
st
Cal
l 1
9.0
6.2
014
9.8
0 0
8.0
7.2
014
23
.00
08
.07
.201
4 2
3.5
5 1
N
ot
Pu
bli
shed
1
5 d
ays
55
min
ute
s 1
5 d
ays
4.
85
/ 2
014
-15
20
53
Co
nst
ruct
ion
o
f ch
eck
d
am
per
cola
tio
n
tan
k ro
of
wat
er
har
vest
ing
re
char
ge s
oft
at
vill
age
Kh
od
a B
lock
Poh
ari
Fir
st
Cal
l
08
.11
.201
4 1
2.5
3 0
8.1
2.2
014
23
.00
08
.12
.201
4 2
3.5
0 2
A
char
an
15
day
s 5
0 m
inu
te
15
day
s
5.
86
/ 2
014
-15
20
54
Co
nst
ruct
ion
of
Ch
eck
dam
, ro
of
wat
er
har
vest
ing,
re
char
ge
soft
at
vi
llag
e M
uh
ar
Blo
ck P
ich
hore
Fir
st
Cal
l 0
8.1
1.2
014
13
.36
08
.12
.201
4 2
3.0
0 0
8.1
2.2
014
23
.50
2
Ach
aran
1
5 d
ays
50
min
ute
s 1
5 d
ays
6.
87
/ 2
014
-15
20
56
Ele
ctri
c w
ork
u
nd
er
PW
SS
at
vill
age
Mu
har
B
lock
Pic
hho
re
Fir
st
Cal
l 0
8.1
1.2
014
5.2
7 0
8.1
2.2
014
23
.00
08
.12
.201
4 2
3.5
0 2
A
char
an,
Nav
bh
arat
, S
atta
Su
dha
r
15
day
s 5
0 m
inu
te
15
day
s
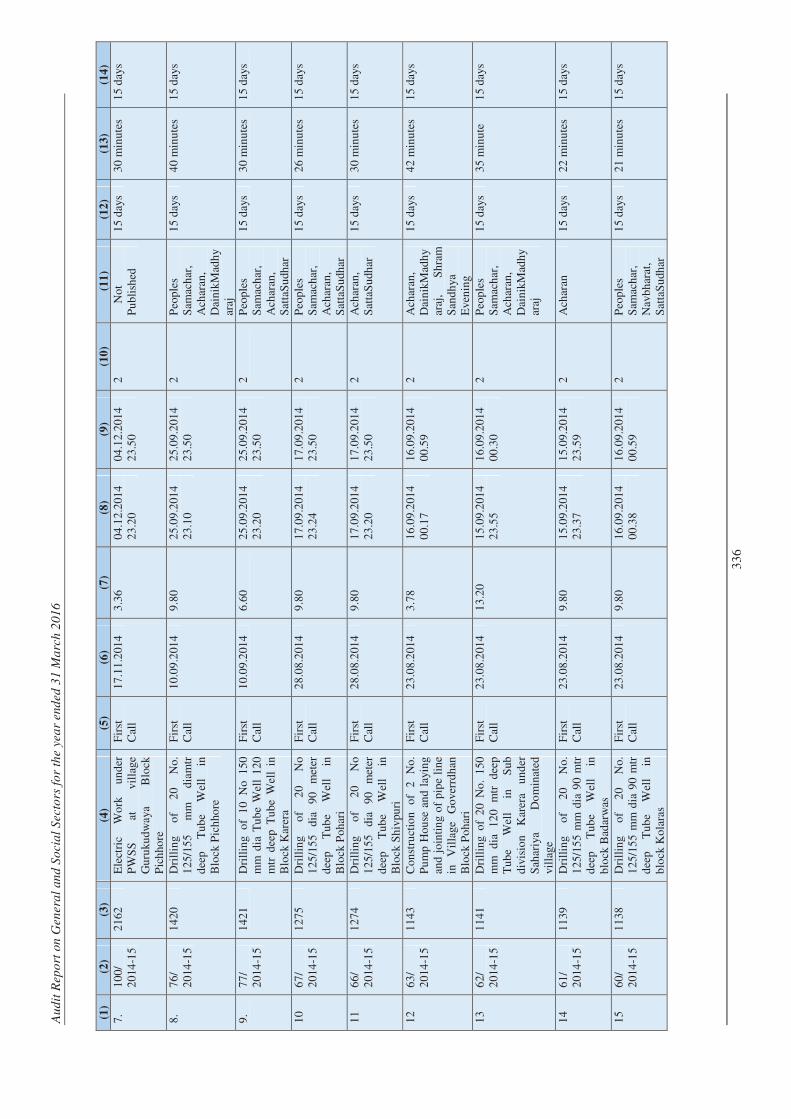
Au
dit
Rep
ort
on
Gen
era
l an
d S
ocia
l S
ecto
rs f
or
the y
ea
r end
ed
31 M
arc
h 2
01
6
33
6
(1)
(2)
(3)
(4)
(5)
(6)
(7)
(8)
(9)
(10
) (1
1)
(12
) (1
3)
(14
)
7.
10
0/
20
14-1
5 2
162
E
lect
ric
Wo
rk
un
der
P
WS
S
at
vill
age
Gu
ruku
dw
aya
Blo
ck
Pic
hho
re
Fir
st
Cal
l 1
7.1
1.2
014
3.3
6 0
4.1
2.2
014
23
.20
04
.12
.201
4 2
3.5
0 2
N
ot
Pu
bli
shed
1
5 d
ays
30
min
ute
s 1
5 d
ays
8.
76
/ 2
014
-15
14
20
Dri
llin
g o
f 2
0
No
. 1
25/
155
m
m
dia
mtr
d
eep
T
ub
e W
ell
in
Blo
ck P
ich
hore
Fir
st
Cal
l 1
0.0
9.2
014
9.8
0 2
5.0
9.2
014
23
.10
25
.09
.201
4 2
3.5
0 2
P
eop
les
Sam
ach
ar,
Ach
aran
, D
ain
ikM
adh
yar
aj
15
day
s 4
0 m
inu
tes
15
day
s
9.
77
/ 2
014
-15
14
21
Dri
llin
g o
f 1
0
No
1
50
mm
dia
Tu
be
Wel
l 1
20
mtr
dee
p T
ub
e W
ell
in
Blo
ck K
arer
a
Fir
st
Cal
l 1
0.0
9.2
014
6.6
0 2
5.0
9.2
014
23
.20
25
.09
.201
4 2
3.5
0 2
P
eop
les
Sam
ach
ar,
Ach
aran
, S
atta
Su
dhar
15
day
s 3
0 m
inu
tes
15
day
s
10
67
/ 2
014
-15
12
75
Dri
llin
g o
f 2
0
No
1
25/
155
dia
9
0 m
eter
d
eep
T
ub
e W
ell
in
Blo
ck P
oh
ari
Fir
st
Cal
l 2
8.0
8.2
014
9.8
0 1
7.0
9.2
014
23
.24
17
.09
.201
4 2
3.5
0 2
P
eop
les
Sam
ach
ar,
Ach
aran
, S
atta
Su
dhar
15
day
s 2
6 m
inu
tes
15
day
s
11
66
/ 2
014
-15
12
74
Dri
llin
g o
f 2
0
No
1
25/
155
dia
9
0 m
eter
d
eep
T
ub
e W
ell
in
Blo
ck S
hiv
puri
Fir
st
Cal
l 2
8.0
8.2
014
9.8
0 1
7.0
9.2
014
23
.20
17
.09
.201
4 2
3.5
0 2
A
char
an,
Sat
taS
udh
ar
15
day
s 3
0 m
inu
tes
15
day
s
12
63
/ 2
014
-15
11
43
Co
nst
ruct
ion
of
2
No
. P
um
p H
ou
se a
nd
lay
ing
an
d j
oin
tin
g o
f p
ipe
lin
e in
V
illa
ge
Go
verr
dh
an
Blo
ck P
oh
ari
Fir
st
Cal
l 2
3.0
8.2
014
3.7
8 1
6.0
9.2
014
00
.17
16
.09
.201
4 0
0.5
9 2
A
char
an,
Dai
nik
Mad
hy
araj
,
Sh
ram
S
and
hya
E
ven
ing
15
day
s 4
2 m
inu
tes
15
day
s
13
62
/ 2
014
-15
11
41
Dri
llin
g o
f 2
0 N
o.
150
m
m
dia
1
20
m
tr
dee
p
Tu
be
Wel
l in
S
ub
div
isio
n
Kar
era
un
der
S
ahar
iya
Do
min
ated
vi
llag
e
Fir
st
Cal
l 2
3.0
8.2
014
13
.20
15
.09
.201
4 2
3.5
5 1
6.0
9.2
014
00
.30
2
Peo
ple
s S
amac
har
, A
char
an,
Dai
nik
Mad
hy
araj
15
day
s 3
5 m
inu
te
15
day
s
14
61
/ 2
014
-15
11
39
Dri
llin
g o
f 2
0
No
. 1
25/
155
mm
dia
90
mtr
d
eep
T
ub
e W
ell
in
blo
ck B
adar
was
Fir
st
Cal
l 2
3.0
8.2
014
9.8
0 1
5.0
9.2
014
23
.37
15
.09
.201
4 2
3.5
9 2
A
char
an
15
day
s 2
2 m
inu
tes
15
day
s
15
60
/ 2
014
-15
11
38
Dri
llin
g o
f 2
0
No
. 1
25/
155
mm
dia
90
mtr
d
eep
T
ub
e W
ell
in
blo
ck K
ola
ras
Fir
st
Cal
l 2
3.0
8.2
014
9.8
0 1
6.0
9.2
014
00
.38
16
.09
.201
4 0
0.5
9 2
P
eop
les
Sam
ach
ar,
Nav
bh
arat
, S
atta
Su
dhar
15
day
s 2
1 m
inu
tes
15
day
s
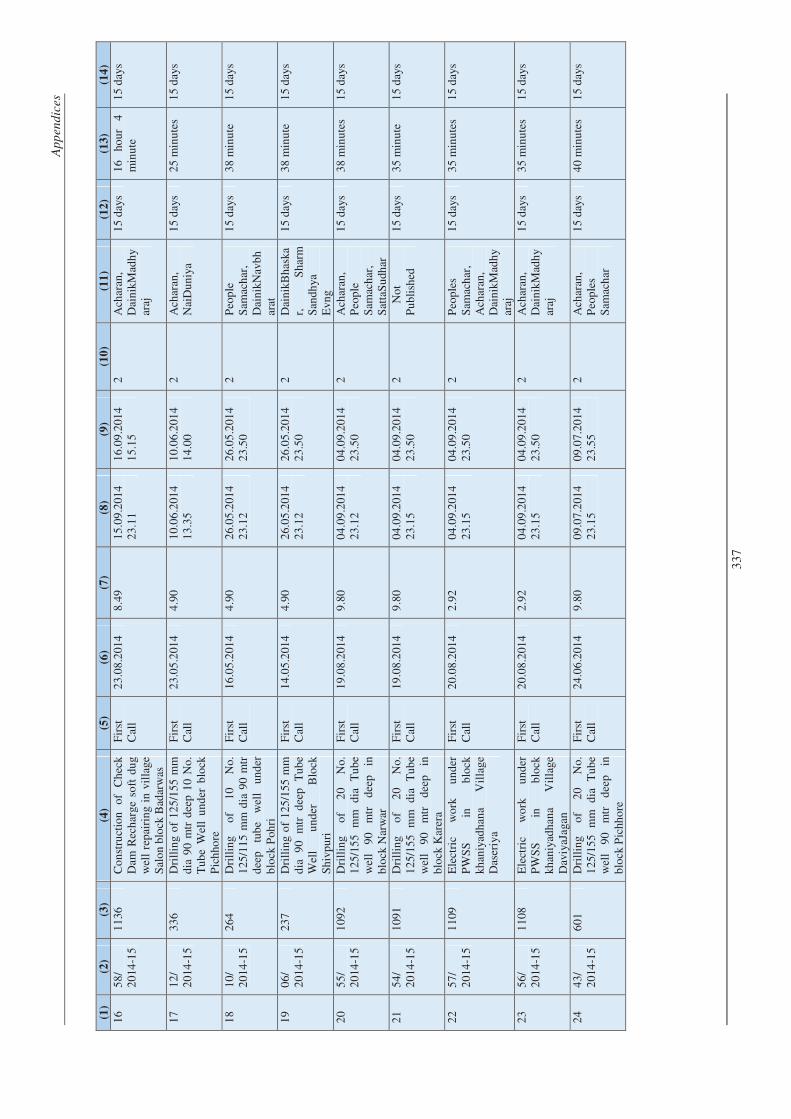
Ap
pen
dic
es
33
7
(1)
(2)
(3)
(4)
(5)
(6)
(7)
(8)
(9)
(10
) (1
1)
(12
) (1
3)
(14
)
16
58
/ 2
014
-15
11
36
Co
nst
ruct
ion
of
Ch
eck
Dam
Rec
har
ge s
oft
du
g w
ell
rep
airi
ng
in v
illa
ge
Sal
on
blo
ck B
adar
was
Fir
st
Cal
l 2
3.0
8.2
014
8.4
9 1
5.0
9.2
014
23
.11
16
.09
.201
4 1
5.1
5 2
A
char
an,
Dai
nik
Mad
hy
araj
15
day
s 1
6
hou
r 4
min
ute
1
5 d
ays
17
12
/ 2
014
-15
33
6 D
rill
ing
of
12
5/1
55 m
m
dia
90
mtr
dee
p 1
0 N
o.
Tu
be
Wel
l u
nd
er b
lock
P
ich
hore
Fir
st
Cal
l 2
3.0
5.2
014
4.9
0 1
0.0
6.2
014
13
.35
10
.06
.201
4 1
4.0
0 2
A
char
an,
Nai
Du
niy
a 1
5 d
ays
25
min
ute
s 1
5 d
ays
18
10
/ 2
014
-15
26
4 D
rill
ing
of
10
N
o.
12
5/11
5 m
m d
ia 9
0 m
tr
dee
p
tub
e w
ell
un
der
b
lock
Poh
ri
Fir
st
Cal
l 1
6.0
5.2
014
4.9
0 2
6.0
5.2
014
23
.12
26
.05
.201
4 2
3.5
0 2
P
eop
le
Sam
ach
ar,
Dai
nik
Nav
bh
arat
15
day
s 3
8 m
inu
te
15
day
s
19
06
/ 2
014
-15
23
7 D
rill
ing
of
12
5/1
55 m
m
dia
9
0
mtr
d
eep
T
ub
e W
ell
un
der
B
lock
S
hiv
pu
ri
Fir
st
Cal
l 1
4.0
5.2
014
4.9
0 2
6.0
5.2
014
23
.12
26
.05
.201
4 2
3.5
0 2
D
ain
ikB
has
kar,
Sh
arm
S
and
hya
E
vng
15
day
s 3
8 m
inu
te
15
day
s
20
55
/ 2
014
-15
10
92
Dri
llin
g o
f 2
0
No
. 1
25/
155
m
m
dia
T
ub
e w
ell
90
m
tr
dee
p
in
blo
ck N
arw
ar
Fir
st
Cal
l 1
9.0
8.2
014
9.8
0 0
4.0
9.2
014
23
.12
04
.09
.201
4 2
3.5
0 2
A
char
an,
Peo
ple
S
amac
har
, S
atta
Su
dhar
15
day
s 3
8 m
inu
tes
15
day
s
21
54
/ 2
014
-15
10
91
Dri
llin
g o
f 2
0
No
. 1
25/
155
m
m
dia
T
ub
e w
ell
90
m
tr
dee
p
in
blo
ck K
arer
a
Fir
st
Cal
l 1
9.0
8.2
014
9.8
0 0
4.0
9.2
014
23
.15
04
.09
.201
4 2
3.5
0 2
N
ot
Pu
bli
shed
1
5 d
ays
35
min
ute
1
5 d
ays
22
57
/ 2
014
-15
11
09
Ele
ctri
c w
ork
u
nd
er
PW
SS
in
b
lock
kh
aniy
adh
ana
Vil
lage
D
aser
iya
Fir
st
Cal
l 2
0.0
8.2
014
2.9
2 0
4.0
9.2
014
23
.15
04
.09
.201
4 2
3.5
0 2
P
eop
les
Sam
ach
ar,
Ach
aran
, D
ain
ikM
adh
yar
aj
15
day
s 3
5 m
inu
tes
15
day
s
23
56
/ 2
014
-15
11
08
Ele
ctri
c w
ork
u
nd
er
PW
SS
in
b
lock
kh
aniy
adh
ana
Vil
lage
D
aviy
aJag
an
Fir
st
Cal
l 2
0.0
8.2
014
2.9
2 0
4.0
9.2
014
23
.15
04
.09
.201
4 2
3.5
0 2
A
char
an,
Dai
nik
Mad
hy
araj
15
day
s 3
5 m
inu
tes
15
day
s
24
43
/ 2
014
-15
60
1 D
rill
ing
of
20
N
o.
12
5/15
5
mm
d
ia
Tu
be
wel
l 9
0
mtr
d
eep
in
b
lock
Pic
hho
re
Fir
st
Cal
l 2
4.0
6.2
014
9.8
0 0
9.0
7.2
014
23
.15
09
.07
.201
4 2
3.5
5 2
A
char
an,
Peo
ple
s S
amac
har
15
day
s 4
0 m
inu
tes
15
day
s
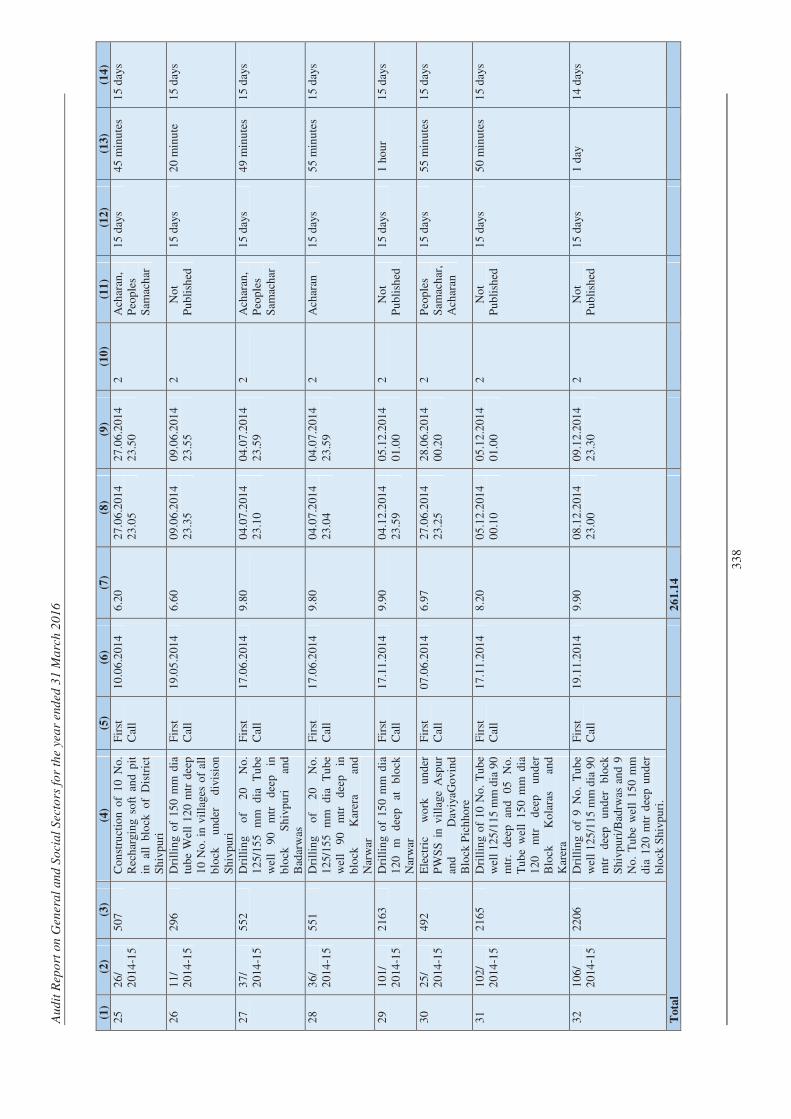
Au
dit
Rep
ort
on
Gen
era
l an
d S
ocia
l S
ecto
rs f
or
the y
ea
r end
ed
31 M
arc
h 2
01
6
33
8
(1)
(2)
(3)
(4)
(5)
(6)
(7)
(8)
(9)
(10
) (1
1)
(12
) (1
3)
(14
)
25
26
/ 2
014
-15
50
7 C
on
stru
ctio
n o
f 1
0 N
o.
Rec
har
gin
g so
ft a
nd
pit
in
all
blo
ck o
f D
istr
ict
Sh
ivp
uri
Fir
st
Cal
l 1
0.0
6.2
014
6.2
0 2
7.0
6.2
014
23
.05
27
.06
.201
4 2
3.5
0 2
A
char
an,
Peo
ple
s S
amac
har
15
day
s 4
5 m
inu
tes
15
day
s
26
11
/ 2
014
-15
29
6 D
rill
ing
of
150
mm
dia
tu
be
Wel
l 1
20
mtr
dee
p
10
No
. in
vil
lage
s o
f al
l b
lock
u
nder
d
ivis
ion
Sh
ivp
uri
Fir
st
Cal
l 1
9.0
5.2
014
6.6
0 0
9.0
6.2
014
23
.35
09
.06
.201
4 2
3.5
5 2
N
ot
Pu
bli
shed
1
5 d
ays
20
min
ute
1
5 d
ays
27
37
/ 2
014
-15
55
2 D
rill
ing
of
20
N
o.
12
5/15
5
mm
d
ia
Tu
be
wel
l 9
0
mtr
d
eep
in
b
lock
S
hiv
puri
an
d B
adar
was
Fir
st
Cal
l 1
7.0
6.2
014
9.8
0 0
4.0
7.2
014
23
.10
04
.07
.201
4 2
3.5
9 2
A
char
an,
Peo
ple
s S
amac
har
15
day
s 4
9 m
inu
tes
15
day
s
28
36
/ 2
014
-15
55
1 D
rill
ing
of
20
N
o.
12
5/15
5
mm
d
ia
Tu
be
wel
l 9
0
mtr
d
eep
in
b
lock
K
arer
a an
d
Nar
war
Fir
st
Cal
l 1
7.0
6.2
014
9.8
0 0
4.0
7.2
014
23
.04
04
.07
.201
4 2
3.5
9 2
A
char
an
15
day
s 5
5 m
inu
tes
15
day
s
29
10
1/
20
14-1
5 2
163
D
rill
ing
of
150
mm
dia
1
20
m
d
eep
at
b
lock
N
arw
ar
Fir
st
Cal
l 1
7.1
1.2
014
9.9
0 0
4.1
2.2
014
23
.59
05
.12
.201
4 0
1.0
0 2
N
ot
Pu
bli
shed
1
5 d
ays
1 h
ou
r 1
5 d
ays
30
25
/ 2
014
-15
49
2 E
lect
ric
wo
rk
un
der
P
WS
S i
n v
illa
ge A
spu
r an
d
Dav
iyaG
ovi
nd
B
lock
Pic
hho
re
Fir
st
Cal
l 0
7.0
6.2
014
6.9
7 2
7.0
6.2
014
23
.25
28
.06
.201
4 0
0.2
0 2
P
eop
les
Sam
ach
ar,
Ach
aran
15
day
s 5
5 m
inu
tes
15
day
s
31
10
2/
20
14-1
5 2
165
D
rill
ing
of
10
No
. T
ub
e w
ell
12
5/1
15 m
m d
ia 9
0
mtr
. d
eep
an
d
05
N
o.
Tu
be
wel
l 1
50
mm
dia
1
20
mtr
d
eep
un
der
B
lock
K
ola
ras
and
K
arer
a
Fir
st
Cal
l 1
7.1
1.2
014
8.2
0 0
5.1
2.2
014
00
.10
05
.12
.201
4 0
1.0
0 2
N
ot
Pu
bli
shed
1
5 d
ays
50
min
ute
s 1
5 d
ays
32
10
6/
20
14-1
5 2
206
D
rill
ing
of
9 N
o.
Tu
be
wel
l 1
25
/115
mm
dia
90
m
tr
dee
p
un
der
b
lock
S
hiv
pu
ri/B
adrw
as a
nd
9
No
. T
ub
e w
ell
15
0 m
m
dia
12
0 m
tr d
eep
un
der
b
lock
Shi
vpu
ri.
Fir
st
Cal
l 1
9.1
1.2
014
9.9
0 0
8.1
2.2
014
23
.00
09
.12
.201
4 2
3.3
0 2
N
ot
Pu
bli
shed
1
5 d
ays
1 d
ay
14
day
s
Tota
l
26
1.1
4
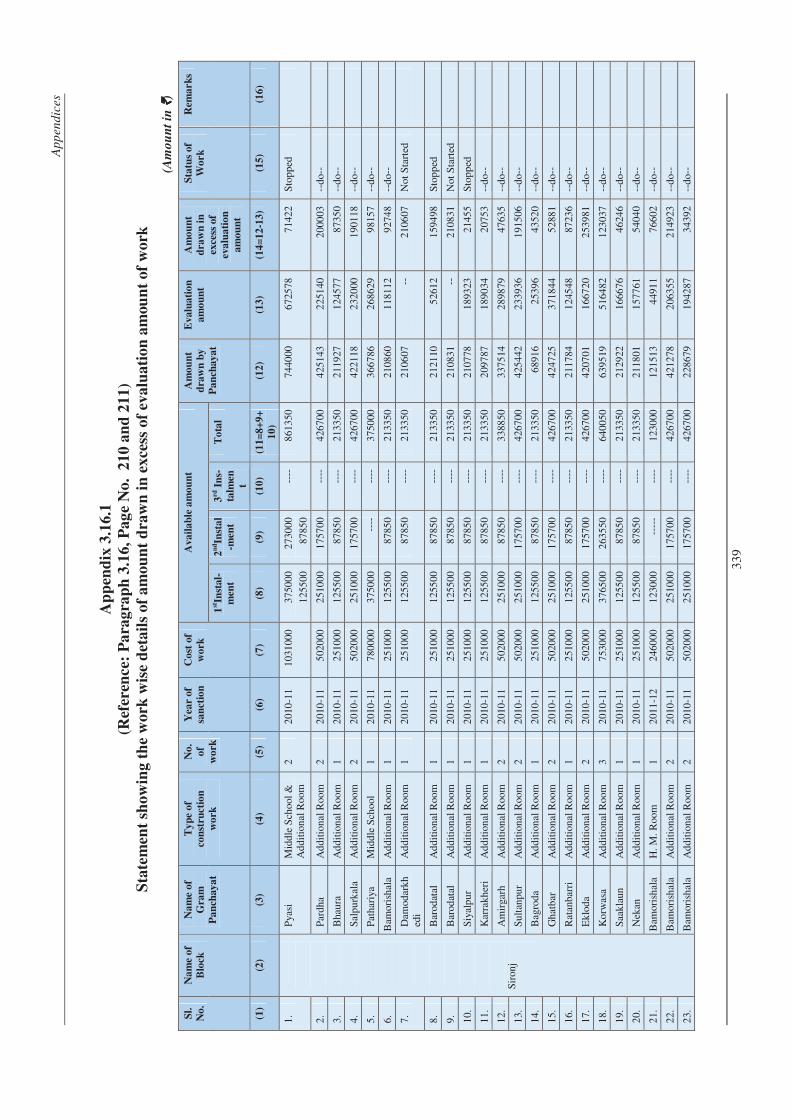
Ap
pen
dic
es
33
9
Ap
pen
dix
3.1
6.1
(Ref
eren
ce:
Pa
rag
rap
h 3
.16
, P
ag
e N
o.
21
0 a
nd
21
1)
Sta
tem
ent
sho
win
g t
he
wo
rk w
ise
det
ail
s o
f a
mo
un
t d
raw
n i
n e
xce
ss o
f ev
alu
ati
on
am
ou
nt
of
wo
rk
(Am
ou
nt
in `̀̀̀
)
Sl.
No
.
Na
me
of
Blo
ck
Na
me
of
Gra
m
Pa
nch
ay
at
Ty
pe
of
con
stru
ctio
n
wo
rk
No
.
of
wo
rk
Yea
r of
san
ctio
n
Co
st o
f
wo
rk
Ava
ila
ble
am
ou
nt
Am
ou
nt
dra
wn
by
Pa
nch
ay
at
Eva
lua
tio
n
am
ou
nt
Am
ou
nt
dra
wn
in
exce
ss o
f
eva
lua
tio
n
am
ou
nt
Sta
tus
of
Wo
rk
Rem
ark
s
1stIn
stal-
men
t
2n
dIn
sta
l
-men
t
3rd I
ns-
talm
en
t
To
tal
(1)
(2)
(3)
(4)
(5)
(6)
(7)
(8)
(9)
(10
) (1
1=
8+
9+
10
)
(12
) (1
3)
(14
=1
2-1
3)
(15
) (1
6)
1.
Sir
onj
Pya
si
Mid
dle
Sch
ool
&
Ad
dit
ion
al R
oom
2
201
0-1
1 1
031
000
375
000
125
500
273
000
878
50
----
8
613
50
744
000
6
725
78
714
22
Sto
pp
ed
2.
Par
dha
A
dd
itio
nal
Roo
m
2 2
010
-11
502
000
2
510
00
175
700
--
--
426
700
4
251
43
225
140
2
000
03
--d
o--
3.
Bha
ura
A
dd
itio
nal
Roo
m
1 2
010
-11
251
000
1
255
00
878
50
----
2
133
50
211
927
1
245
77
873
50
--d
o--
4.
Sal
pu
rkal
a A
dd
itio
nal
Roo
m
2 2
010
-11
502
000
2
510
00
175
700
--
--
426
700
4
221
18
232
000
1
901
18
--d
o--
5.
Pat
hari
ya
Mid
dle
Sch
ool
1
201
0-1
1 7
800
00
375
000
--
--
----
3
750
00
366
786
2
686
29
981
57
--d
o--
6.
Bam
oris
hal
a A
dd
itio
nal
Roo
m
1 2
010
-11
251
000
1
255
00
878
50
----
2
133
50
210
860
1
181
12
927
48
--d
o--
7.
Dam
odar
kh
edi
Ad
dit
ion
al R
oom
1
201
0-1
1 2
510
00
125
500
8
785
0 --
--
213
350
2
106
07
--
210
607
N
ot S
tart
ed
8.
Bar
odat
al
Ad
dit
ion
al R
oom
1
201
0-1
1 2
510
00
125
500
8
785
0 --
--
213
350
2
121
10
526
12
159
498
S
top
ped
9.
Bar
odat
al
Ad
dit
ion
al R
oom
1
201
0-1
1 2
510
00
125
500
8
785
0 --
--
213
350
2
108
31
--
210
831
N
ot S
tart
ed
10.
S
iyal
pu
r A
dd
itio
nal
Roo
m
1 2
010
-11
251
000
1
255
00
878
50
----
2
133
50
210
778
1
893
23
214
55
Sto
pp
ed
11.
K
arra
kh
eri
Ad
dit
ion
al R
oom
1
201
0-1
1 2
510
00
125
500
8
785
0 --
--
213
350
2
097
87
189
034
2
075
3 --
do-
-
12.
A
mir
garh
A
dd
itio
nal
Roo
m
2 2
010
-11
502
000
2
510
00
878
50
----
3
388
50
337
514
2
898
79
476
35
--d
o--
13.
S
ult
anpu
r A
dd
itio
nal
Roo
m
2 2
010
-11
502
000
2
510
00
175
700
--
--
426
700
4
254
42
233
936
1
915
06
--d
o--
14.
B
agro
da
Ad
dit
ion
al R
oom
1
201
0-1
1 2
510
00
125
500
8
785
0 --
--
213
350
6
891
6 2
539
6 4
352
0 --
do-
-
15.
G
hat
bar
A
dd
itio
nal
Roo
m
2 2
010
-11
502
000
2
510
00
175
700
--
--
426
700
4
247
25
371
844
5
288
1 --
do-
-
16.
R
atan
barr
i A
dd
itio
nal
Roo
m
1 2
010
-11
251
000
1
255
00
878
50
----
2
133
50
211
784
1
245
48
872
36
--d
o--
17.
E
klo
da
Ad
dit
ion
al R
oom
2
201
0-1
1 5
020
00
251
000
1
757
00
----
4
267
00
420
701
1
667
20
253
981
--
do-
-
18.
K
orw
asa
Ad
dit
ion
al R
oom
3
201
0-1
1 7
530
00
376
500
2
635
50
----
6
400
50
639
519
5
164
82
123
037
--
do-
-
19.
S
aak
laun
A
dd
itio
nal
Roo
m
1 2
010
-11
251
000
1
255
00
878
50
----
2
133
50
212
922
1
666
76
462
46
--d
o--
20.
N
ekan
A
dd
itio
nal
Roo
m
1 2
010
-11
251
000
1
255
00
878
50
----
2
133
50
211
801
1
577
61
540
40
--d
o--
21.
B
amor
ish
ala
H.
M.
Roo
m
1 2
011
-12
246
000
1
230
00
----
- --
--
123
000
1
215
13
449
11
766
02
--d
o--
22.
B
amor
ish
ala
Ad
dit
ion
al R
oom
2
201
0-1
1 5
020
00
251
000
1
757
00
----
4
267
00
421
278
2
063
55
214
923
--
do-
-
23.
B
amor
ish
ala
Ad
dit
ion
al R
oom
2
201
0-1
1 5
020
00
251
000
1
757
00
----
4
267
00
228
679
1
942
87
343
92
--d
o--
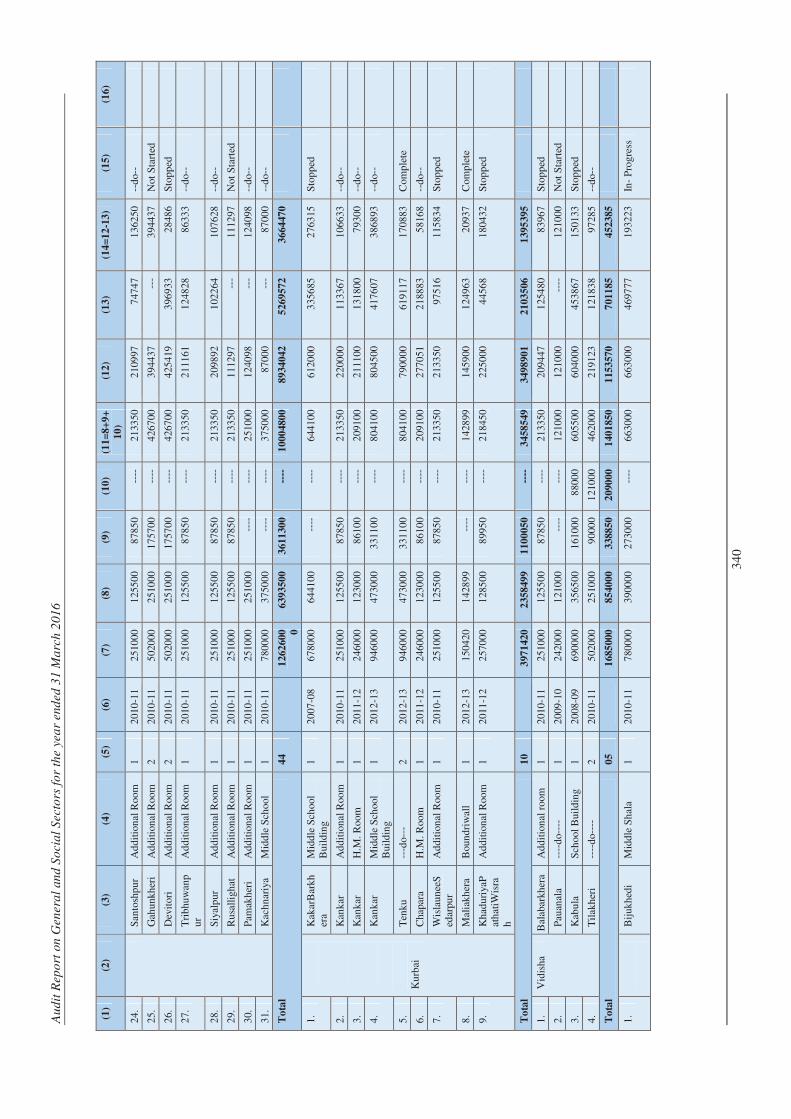
Au
dit
Rep
ort
on
Gen
era
l an
d S
ocia
l S
ecto
rs f
or
the y
ea
r end
ed
31 M
arc
h 2
01
6
34
0
(1)
(2)
(3)
(4)
(5)
(6)
(7)
(8)
(9)
(10
) (1
1=
8+
9+
10
)
(12
) (1
3)
(14
=1
2-1
3)
(15
) (1
6)
24.
San
tosh
pu
r A
dd
itio
nal
Roo
m
1 2
010
-11
251
000
1
255
00
878
50
----
2
133
50
210
997
7
474
7 1
362
50
--d
o--
25.
G
ahu
nkh
eri
Ad
dit
ion
al R
oom
2
201
0-1
1 5
020
00
251
000
1
757
00
----
4
267
00
394
437
--
- 3
944
37
Not
Sta
rted
26.
D
evit
ori
Ad
dit
ion
al R
oom
2
201
0-1
1 5
020
00
251
000
1
757
00
----
4
267
00
425
419
3
969
33
284
86
Sto
pp
ed
27.
T
rib
huw
anp
ur
Ad
dit
ion
al R
oom
1
201
0-1
1 2
510
00
125
500
8
785
0 --
--
213
350
2
111
61
124
828
8
633
3 --
do-
-
28.
S
iyal
pu
r A
dd
itio
nal
Roo
m
1 2
010
-11
251
000
1
255
00
878
50
----
2
133
50
209
892
1
022
64
107
628
--
do-
-
29.
R
usa
llig
hat
A
dd
itio
nal
Roo
m
1 2
010
-11
251
000
1
255
00
878
50
----
2
133
50
111
297
--
- 1
112
97
Not
Sta
rted
30.
P
amak
her
i A
dd
itio
nal
Roo
m
1 2
010
-11
251
000
2
510
00
----
--
--
251
000
1
240
98
---
124
098
--
do-
-
31.
K
ach
nar
iya
Mid
dle
Sch
ool
1 2
010
-11
780
000
3
750
00
----
--
--
375
000
8
700
0 --
- 8
700
0 --
do-
-
To
tal
44
1
262
600 0
6393
500
3611
300
----
1
000
480
0
8934
042
5269
572
3664
470
1.
Ku
rbai
Kak
arB
ark
her
a M
idd
le S
choo
l B
uild
ing
1 2
007
-08
678
000
6
441
00
----
--
--
644
100
6
120
00
335
685
2
763
15
Sto
pp
ed
2.
Kan
kar
A
dd
itio
nal
Roo
m
1 2
010
-11
251
000
1
255
00
878
50
----
2
133
50
220
000
1
133
67
106
633
--
do-
-
3.
Kan
kar
H
.M. R
oom
1
201
1-1
2 2
460
00
123
000
8
610
0 --
--
209
100
2
111
00
131
800
7
930
0 --
do-
-
4.
Kan
kar
M
idd
le S
choo
l B
uild
ing
1 2
012
-13
946
000
4
730
00
331
100
--
--
804
100
8
045
00
417
607
3
868
93
--d
o--
5.
Ten
ku
---d
o---
2
201
2-1
3 9
460
00
473
000
3
311
00
----
8
041
00
790
000
6
191
17
170
883
C
omp
lete
6.
Cha
para
H
.M. R
oom
1
201
1-1
2 2
460
00
123
000
8
610
0 --
--
209
100
2
770
51
218
883
5
816
8 --
do-
-
7.
Wis
lau
nee
Sed
arpu
r A
dd
itio
nal
Roo
m
1 2
010
-11
251
000
1
255
00
878
50
----
2
133
50
213
350
9
751
6 1
158
34
Sto
pp
ed
8.
Mal
iakh
era
Bou
nd
riw
all
1 2
012
-13
150
420
1
428
99
----
--
--
142
899
1
459
00
124
963
2
093
7 C
omp
lete
9.
Kh
adu
riya
Pat
hat
iWis
rah
Ad
dit
ion
al R
oom
1
201
1-1
2 2
570
00
128
500
8
995
0 --
--
218
450
2
250
00
445
68
180
432
S
top
ped
To
tal
10
3
971
420
2358
499
1100
050
----
3
458
549
3498
901
2103
506
1395
395
1.
Vid
isha
B
alab
arkh
era
Ad
dit
ion
al r
oom
1
201
0-1
1 2
510
00
125
500
8
785
0 --
--
213
350
2
094
47
125
480
8
396
7 S
top
ped
2.
Pau
anal
a --
--d
o---
- 1
200
9-1
0 2
420
00
121
000
--
--
----
1
210
00
121
000
--
--
121
000
N
ot S
tart
ed
3.
Kab
ula
S
choo
l B
uild
ing
1 2
008
-09
690
000
3
565
00
161
000
8
800
0 6
055
00
604
000
4
538
67
150
133
S
top
ped
4.
Til
akh
eri
----
do-
---
2 2
010
-11
502
000
2
510
00
900
00
121
000
4
620
00
219
123
1
218
38
972
85
--d
o--
To
tal
05
1
685
000
8540
00
3388
50
2090
00
1401
850
1153
570
7011
85
4523
85
1.
Bij
ukh
edi
Mid
dle
Sh
ala
1 2
010
-11
780
000
3
900
00
273
000
--
--
663
000
6
630
00
469
777
1
932
23
In-
Pro
gre
ss
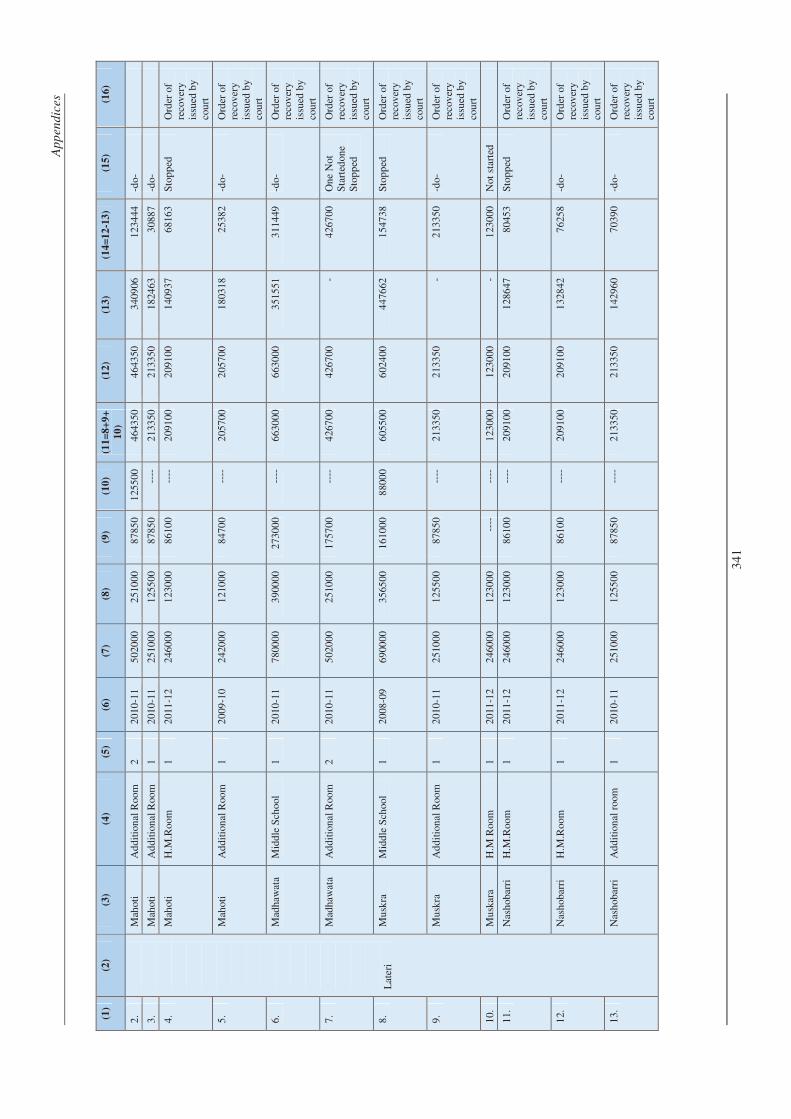
Ap
pen
dic
es
34
1
(1)
(2)
(3)
(4)
(5)
(6)
(7)
(8)
(9)
(10
) (1
1=
8+
9+
10
)
(12
) (1
3)
(14
=1
2-1
3)
(15
) (1
6)
2.
Lat
eri
Mah
oti
Ad
dit
ion
al R
oom
2
201
0-1
1 5
020
00
251
000
8
785
0 1
255
00
464
350
4
643
50
340
906
1
234
44
-do-
3.
Mah
oti
Ad
dit
ion
al R
oom
1
201
0-1
1 2
510
00
125
500
8
785
0 --
--
213
350
2
133
50
182
463
3
088
7 -d
o-
4.
Mah
oti
H.M
.Roo
m
1 2
011
-12
246
000
1
230
00
861
00
----
2
091
00
209
100
1
409
37
681
63
Sto
pp
ed
Ord
er o
f re
cov
ery
issu
ed b
y co
urt
5.
Mah
oti
Ad
dit
ion
al R
oom
1
200
9-1
0 2
420
00
121
000
8
470
0 --
--
205
700
2
057
00
180
318
2
538
2 -d
o-
Ord
er o
f re
cov
ery
issu
ed b
y co
urt
6.
Mad
haw
ata
Mid
dle
Sch
ool
1 2
010
-11
780
000
3
900
00
273
000
--
--
663
000
6
630
00
351
551
3
114
49
-do-
O
rder
of
reco
ver
y is
sued
by
cou
rt
7.
Mad
haw
ata
Ad
dit
ion
al R
oom
2
201
0-1
1 5
020
00
251
000
1
757
00
----
4
267
00
426
700
-
426
700
O
ne
Not
S
tart
edon
e S
top
ped
Ord
er o
f re
cov
ery
issu
ed b
y co
urt
8.
Mu
skra
M
idd
le S
choo
l 1
200
8-0
9 6
900
00
356
500
1
610
00
880
00
605
500
6
024
00
447
662
1
547
38
Sto
pp
ed
Ord
er o
f re
cov
ery
issu
ed b
y co
urt
9.
Mu
skra
A
dd
itio
nal
Roo
m
1 2
010
-11
251
000
1
255
00
878
50
----
2
133
50
213
350
-
213
350
-d
o-
Ord
er o
f re
cov
ery
issu
ed b
y co
urt
10.
M
usk
ara
H.M
Roo
m
1 2
011
-12
246
000
1
230
00
----
--
--
123
000
1
230
00
- 1
230
00
Not
sta
rted
11.
N
ash
obar
ri
H.M
.Roo
m
1 2
011
-12
246
000
1
230
00
861
00
----
2
091
00
209
100
1
286
47
804
53
Sto
pp
ed
Ord
er o
f re
cov
ery
issu
ed b
y co
urt
12.
N
ash
obar
ri
H.M
.Roo
m
1 2
011
-12
246
000
1
230
00
861
00
----
2
091
00
209
100
1
328
42
762
58
-do-
O
rder
of
reco
ver
y is
sued
by
cou
rt
13.
N
ash
obar
ri
Ad
dit
ion
al r
oom
1
201
0-1
1 2
510
00
125
500
8
785
0 --
--
213
350
2
133
50
142
960
7
039
0 -d
o-
Ord
er o
f re
cov
ery
issu
ed b
y co
urt
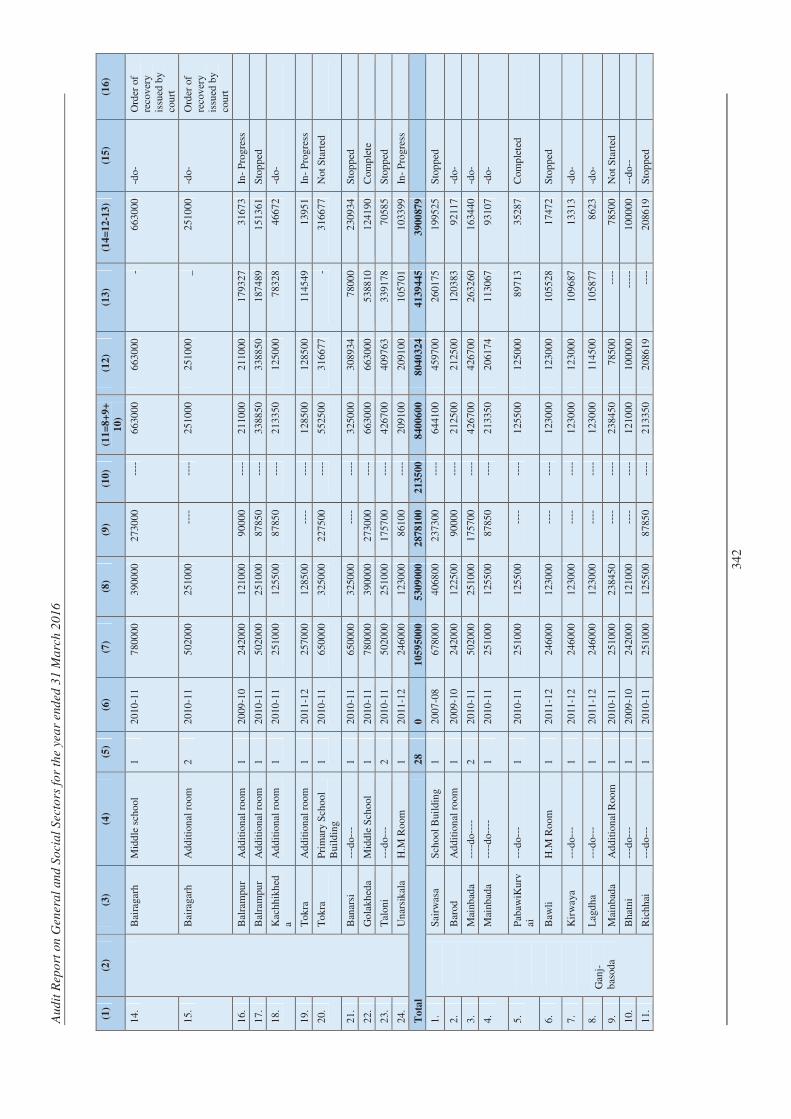
Au
dit
Rep
ort
on
Gen
era
l an
d S
ocia
l S
ecto
rs f
or
the y
ea
r end
ed
31 M
arc
h 2
01
6
34
2
(1)
(2)
(3)
(4)
(5)
(6)
(7)
(8)
(9)
(10
) (1
1=
8+
9+
10
)
(12
) (1
3)
(14
=1
2-1
3)
(15
) (1
6)
14.
Bai
raga
rh
Mid
dle
sch
ool
1 2
010
-11
780
000
3
900
00
273
000
--
--
663
000
6
630
00
- 6
630
00
-do-
O
rder
of
reco
ver
y is
sued
by
cou
rt
15.
B
aira
garh
A
dd
itio
nal
roo
m
2 2
010
-11
502
000
2
510
00
----
--
--
251
000
2
510
00
_ 2
510
00
-do-
O
rder
of
reco
ver
y is
sued
by
cou
rt
16.
B
alra
mpu
r A
dd
itio
nal
roo
m
1 2
009
-10
242
000
1
210
00
900
00
----
2
110
00
211
000
1
793
27
316
73
In-
Pro
gre
ss
17.
B
alra
mpu
r A
dd
itio
nal
roo
m
1 2
010
-11
502
000
2
510
00
878
50
----
3
388
50
338
850
1
874
89
151
361
S
top
ped
18.
K
ach
hik
hed
a A
dd
itio
nal
roo
m
1 2
010
-11
251
000
1
255
00
878
50
----
2
133
50
125
000
7
832
8 4
667
2 -d
o-
19.
T
okra
A
dd
itio
nal
roo
m
1 2
011
-12
257
000
1
285
00
----
--
--
128
500
1
285
00
114
549
1
395
1 In
- P
rog
ress
20.
T
okra
P
rim
ary
Sch
ool
Bui
ldin
g 1
201
0-1
1 6
500
00
325
000
2
275
00
----
5
525
00
316
677
-
316
677
N
ot S
tart
ed
21.
B
anar
si
---d
o---
1
201
0-1
1 6
500
00
325
000
--
--
----
3
250
00
308
934
7
800
0 2
309
34
Sto
pp
ed
22.
G
ola
kh
eda
Mid
dle
Sch
ool
1 2
010
-11
780
000
3
900
00
273
000
--
--
663
000
6
630
00
538
810
1
241
90
Com
ple
te
23.
T
alon
i --
-do-
--
2 2
010
-11
502
000
2
510
00
175
700
--
--
426
700
4
097
63
339
178
7
058
5 S
top
ped
24.
U
nar
sik
ala
H.M
Roo
m
1 2
011
-12
246
000
1
230
00
861
00
----
2
091
00
209
100
1
057
01
103
399
In
- P
rog
ress
To
tal
28
0
1059
500
0
5309
000
2878
100
2135
00
8400
600
8040
324
4139
445
3900
879
1.
Gan
j-b
asod
a
Sai
rwas
a S
choo
l B
uild
ing
1 2
007
-08
678
000
4
068
00
237
300
--
--
644
100
4
597
00
260
175
1
995
25
Sto
pp
ed
2.
Bar
od
Ad
dit
ion
al r
oom
1
200
9-1
0 2
420
00
122
500
9
000
0 --
--
212
500
2
125
00
120
383
9
211
7 -d
o-
3.
Mai
nbad
a --
--d
o---
- 2
201
0-1
1 5
020
00
251
000
1
757
00
----
4
267
00
426
700
2
632
60
163
440
-d
o-
4.
Mai
nbad
a --
--d
o---
- 1
201
0-1
1 2
510
00
125
500
8
785
0 --
--
213
350
2
061
74
113
067
9
310
7 -d
o-
5.
Pab
awiK
urv
ai
---d
o---
1
201
0-1
1 2
510
00
125
500
--
--
----
1
255
00
125
000
8
971
3 3
528
7 C
omp
lete
d
6.
Baw
li
H.M
Roo
m
1 2
011
-12
246
000
1
230
00
----
--
--
123
000
1
230
00
105
528
1
747
2 S
top
ped
7.
Kir
way
a --
-do-
--
1 2
011
-12
246
000
1
230
00
----
--
--
123
000
1
230
00
109
687
1
331
3 -d
o-
8.
Lag
dh
a --
-do-
--
1 2
011
-12
246
000
1
230
00
----
--
--
123
000
1
145
00
105
877
8
623
-do-
9.
Mai
nbad
a A
dd
itio
nal
Roo
m
1 2
010
-11
251
000
2
384
50
----
--
--
238
450
7
850
0 --
--
785
00
Not
Sta
rted
10.
B
hatn
i --
-do-
--
1 2
009
-10
242
000
1
210
00
----
--
--
121
000
1
000
00
----
- 1
000
00
--d
o--
11.
R
ichh
ai
---d
o---
1
201
0-1
1 2
510
00
125
500
8
785
0 --
--
213
350
2
086
19
----
2
086
19
Sto
pp
ed

Ap
pen
dic
es
34
3
(1)
(2)
(3)
(4)
(5)
(6)
(7)
(8)
(9)
(10
) (1
1=
8+
9+
10
)
(12
) (1
3)
(14
=1
2-1
3)
(15
) (1
6)
12.
Kh
aira
da
H.M
Roo
m
1 2
011
-12
257
000
1
285
00
----
--
--
128
500
1
285
00
--
128
500
N
ot s
tart
ed
13.
T
yod
a --
-do-
--
1 2
009
-10
242
000
1
210
00
----
--
--
121
000
1
210
00
---
121
000
--
do-
-
14.
S
atpa
ra
--d
o--
2 2
010
-11
502
000
2
510
00
251
000
--
--
502
000
4
380
00
---
438
000
--
do-
-
T
ota
l
1
6
4
407
000
2385
750
9297
00
----
3
315
450
2865
193
1167
690
1697
503
1.
Nat
eran
En
chd
a A
dd
itio
nal
Roo
m
1 2
009
-10
242
000
1
210
00
----
--
--
121
000
6
000
0 --
- 6
000
0 N
ot S
tart
ed
2.
Th
ana
--d
o--
2 2
010
-11
502
000
2
510
00
----
--
--
251
000
1
000
00
---
100
000
--
do-
-
3.
Ko
lua
--d
o--
1 2
010
-11
251
000
1
210
00
----
--
--
121
000
1
210
00
---
121
000
--
do-
-
4.
Ko
lua
Mid
dle
Sch
ool
Bui
ldin
g 1
200
8-0
9 6
900
00
356
500
1
610
00
----
5
175
00
517
500
--
- 5
175
00
Sto
pp
ed
5.
Sak
rai
Ad
dit
ion
al R
oom
1
201
0-1
1 2
510
00
125
500
--
--
----
1
255
00
111
350
5
774
7 5
360
3 --
do-
-
6.
Mah
u --
do-
- 1
201
0-1
1 2
510
00
125
500
8
785
0 --
--
213
350
1
250
00
112
408
1
259
2 --
do-
-
7.
Mah
u --
do-
- 1
201
0-1
1 2
510
00
125
500
8
785
0 --
--
213
350
2
133
50
---
213
350
N
ot S
tart
ed
8.
Kar
med
i H
.M. R
oom
1
201
1-1
2 2
460
00
123
000
--
--
----
1
230
00
123
000
9
639
9 2
660
1 In
- P
rog
ress
9.
Pip
ald
har
--d
o--
1 2
011
-12
246
000
1
230
00
861
00
----
2
091
00
209
100
1
522
66
568
34
Sto
pp
ed
10.
S
angr
amp
ur
MS
Bui
ldin
g 1
200
8-0
9 6
900
00
356
500
1
610
00
880
00
605
500
4
307
79
360
994
6
978
5 In
- P
rog
ress
11.
R
aikh
eri
Ad
dit
ion
al R
oom
1
200
8-0
9 2
400
00
117
500
--
--
----
1
175
00
180
000
3
995
0 1
400
50
Sto
pp
ed
12.
T
ajk
haju
ri
--d
o--
1 2
009
-10
242
000
1
210
00
----
--
--
121
000
1
194
50
413
17
781
33
--d
o--
13.
H
adaa
--
do-
- 1
201
0-1
1 2
510
00
125
500
8
785
0 --
--
213
350
2
240
00
148
297
7
570
3 In
- P
rog
ress
14.
P
airv
asa
--d
o--
3 2
009
-10
726
000
3
630
00
----
--
--
363
000
3
600
00
291
021
6
897
9 S
top
ped
15.
P
airv
asa
--d
o--
1 2
010
-11
251
000
1
255
00
878
50
----
2
133
50
193
000
6
020
0 1
328
00
--d
o--
16.
P
ipar
iya
--d
o--
2 2
010
-11
502
000
2
517
70
175
700
--
--
427
470
4
750
00
250
476
2
245
24
In-
Pro
gre
ss
17.
R
amp
ura
kala
--
do-
- 2
201
0-1
1 5
020
00
175
700
1
757
00
----
3
514
00
351
400
2
534
76
979
24
--d
o--
18.
R
amp
ura
kala
--
do-
- 1
201
0-1
1 2
510
00
251
000
--
--
----
2
510
00
251
000
1
335
78
117
422
--
do-
-
19.
B
eejh
--
do-
- 1
201
0-1
1 2
510
00
125
500
8
785
0 --
--
213
350
2
117
92
101
141
1
106
51
--d
o--
20.
B
eejh
H
.M. R
oom
1
201
1-1
2 2
460
00
123
000
8
610
0 --
--
209
100
2
078
53
438
97
163
956
S
top
ped
21.
B
eejh
--
do-
- 1
201
1-1
2 2
460
00
123
000
--
--
----
1
230
00
119
859
2
860
8 9
125
1 --
do-
-
22.
S
omb
ara
Ad
dit
ion
al R
oom
2
201
0-1
1 5
020
00
251
000
1
757
00
----
4
267
00
426
700
1
151
45
311
555
--
do-
-
23.
S
omb
ara
H.M
. Roo
m
1 2
011
-12
246
000
1
230
00
861
00
----
2
091
00
208
900
1
366
04
722
96
--d
o--
24.
Bha
rnak
hed
a A
dd
itio
nal
Roo
m
1 2
010
-11
251
000
1
255
00
878
50
----
2
133
50
157
651
4
550
0 1
121
51
--d
o--
25.
B
harn
akh
eda
--d
o--
1 2
010
-11
251
000
1
255
00
878
50
----
2
133
50
195
986
1
051
08
908
78
--d
o--
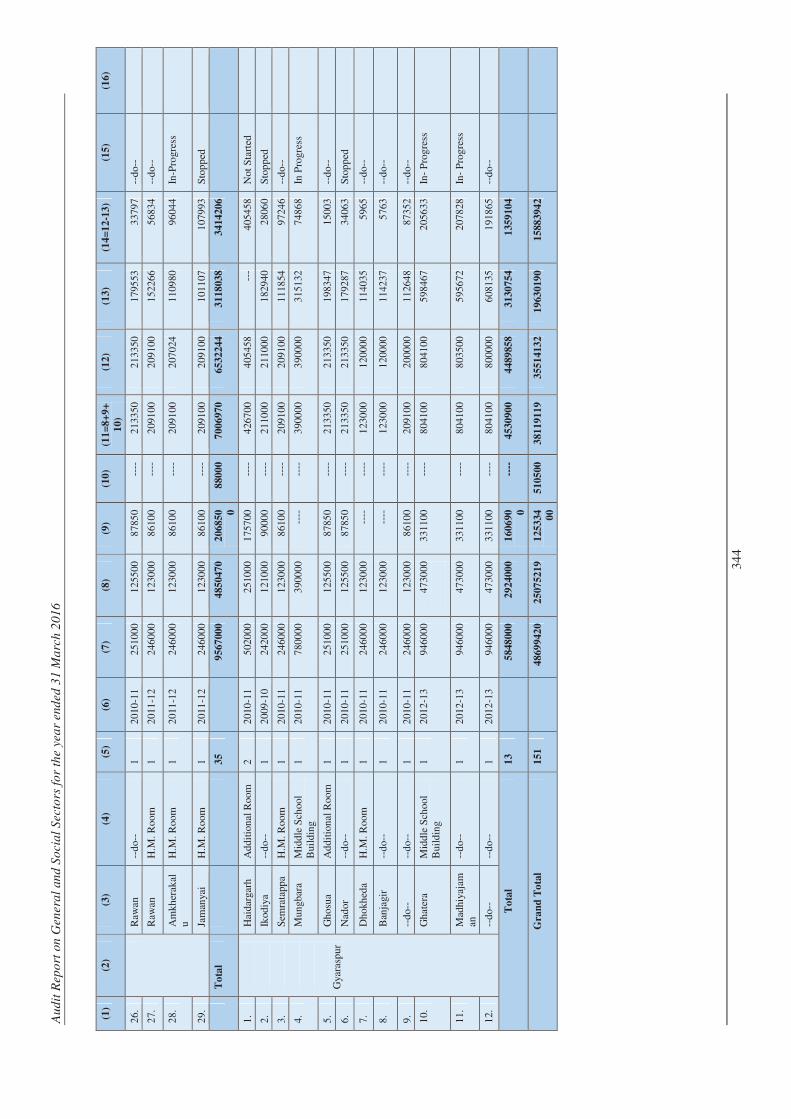
Au
dit
Rep
ort
on
Gen
era
l an
d S
ocia
l S
ecto
rs f
or
the y
ea
r end
ed
31 M
arc
h 2
01
6
34
4
(1)
(2)
(3)
(4)
(5)
(6)
(7)
(8)
(9)
(10
) (1
1=
8+
9+
10
)
(12
) (1
3)
(14
=1
2-1
3)
(15
) (1
6)
26.
Raw
an
--d
o--
1 2
010
-11
251
000
1
255
00
878
50
----
2
133
50
213
350
1
795
53
337
97
--d
o--
27.
R
awan
H
.M. R
oom
1
201
1-1
2 2
460
00
123
000
8
610
0 --
--
209
100
2
091
00
152
266
5
683
4 --
do-
-
28.
A
mk
her
akal
u H
.M. R
oom
1
201
1-1
2 2
460
00
123
000
8
610
0 --
--
209
100
2
070
24
110
980
9
604
4 In
-Pro
gres
s
29.
Ja
man
yai
H.M
. Roo
m
1 2
011
-12
246
000
1
230
00
861
00
----
2
091
00
209
100
1
011
07
107
993
S
top
ped
T
ota
l
3
5
9
567
000
4850
470
2068
50 0
8800
0
7006
970
6532
244
3118
038
3414
206
1.
Gya
rasp
ur
Hai
darg
arh
Ad
dit
ion
al R
oom
2
201
0-1
1 5
020
00
251
000
1
757
00
----
4
267
00
405
458
--
- 4
054
58
Not
Sta
rted
2.
Ikod
iya
--d
o--
1 2
009
-10
242
000
1
210
00
900
00
----
2
110
00
211
000
1
829
40
280
60
Sto
pp
ed
3.
Sem
rata
ppa
H.M
. Roo
m
1 2
010
-11
246
000
1
230
00
861
00
----
2
091
00
209
100
1
118
54
972
46
--d
o--
4.
Mun
gbar
a M
idd
le S
choo
l B
uild
ing
1 2
010
-11
780
000
3
900
00
----
--
--
390
000
3
900
00
315
132
7
486
8 In
Pro
gres
s
5.
Gh
osu
a A
dd
itio
nal
Roo
m
1 2
010
-11
251
000
1
255
00
878
50
----
2
133
50
213
350
1
983
47
150
03
--d
o--
6.
Nad
or
--d
o--
1 2
010
-11
251
000
1
255
00
878
50
----
2
133
50
213
350
1
792
87
340
63
Sto
pp
ed
7.
Dh
okh
eda
H.M
. Roo
m
1 2
010
-11
246
000
1
230
00
----
--
--
123
000
1
200
00
114
035
5
965
--d
o--
8.
Ban
jagi
r --
do-
- 1
201
0-1
1 2
460
00
123
000
--
--
----
1
230
00
120
000
1
142
37
576
3 --
do-
-
9.
--d
o--
--d
o--
1 2
010
-11
246
000
1
230
00
861
00
----
2
091
00
200
000
1
126
48
873
52
--d
o--
10.
G
hat
era
Mid
dle
Sch
ool
Bui
ldin
g 1
201
2-1
3 9
460
00
473
000
331
100
--
--
804
100
8
041
00
598
467
2
056
33
In-
Pro
gre
ss
11.
M
adhi
yaja
man
--
do-
- 1
201
2-1
3 9
460
00
473
000
3
311
00
----
8
041
00
803
500
5
956
72
207
828
In
- P
rog
ress
12.
--
do-
- --
do-
- 1
201
2-1
3 9
460
00
473
000
3
311
00
----
8
041
00
800
000
6
081
35
191
865
--
do-
-
To
tal
13
5
848
000
2924
000
1606
90 0
----
4
530
900
4489
858
3130
754
1359
104
Gra
nd
To
tal
151
4
869
942
0
2507
521
9
1253
34
00
5105
00
3811
911
9
3551
413
2
1963
019
0
1588
394
2
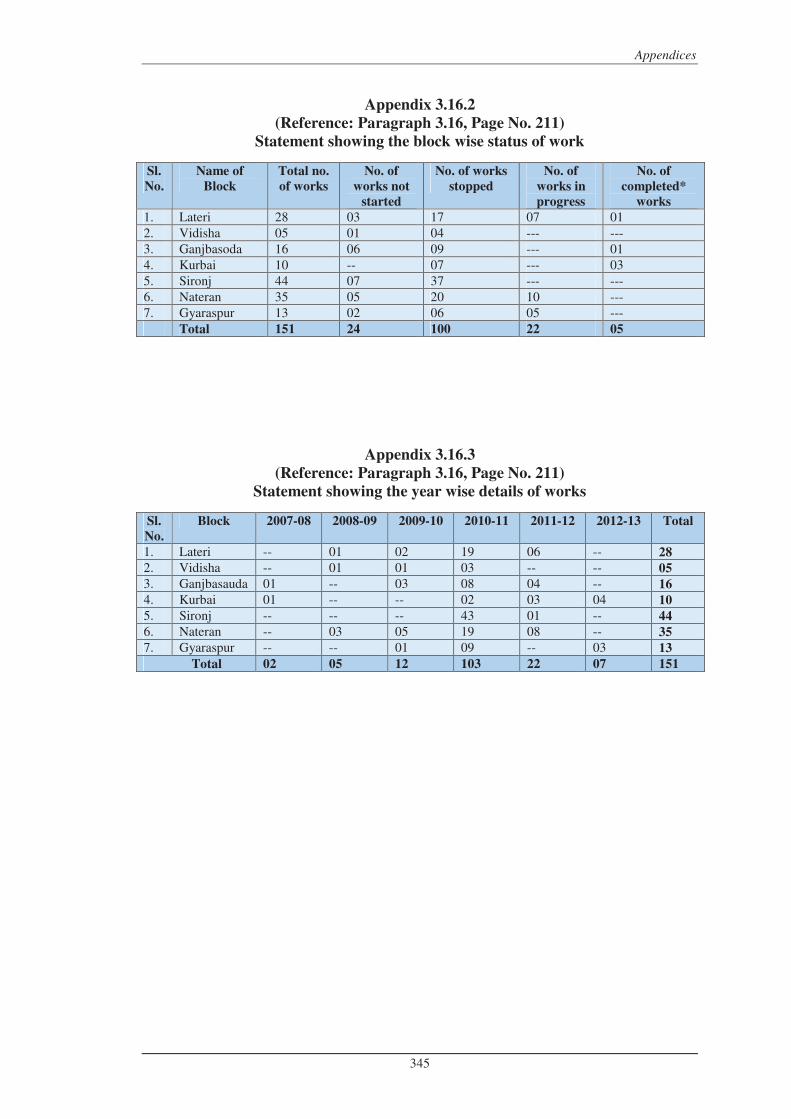
Appendices
345
Appendix 3.16.2
(Reference: Paragraph 3.16, Page No. 211)
Statement showing the block wise status of work
Sl.
No.
Name of
Block
Total no.
of works
No. of
works not
started
No. of works
stopped
No. of
works in
progress
No. of
completed*
works
1. Lateri 28 03 17 07 01 2. Vidisha 05 01 04 --- --- 3. Ganjbasoda 16 06 09 --- 01 4. Kurbai 10 -- 07 --- 03 5. Sironj 44 07 37 --- --- 6. Nateran 35 05 20 10 --- 7. Gyaraspur 13 02 06 05 --- Total 151 24 100 22 05
Appendix 3.16.3
(Reference: Paragraph 3.16, Page No. 211)
Statement showing the year wise details of works
Sl.
No.
Block 2007-08 2008-09 2009-10 2010-11 2011-12 2012-13 Total
1. Lateri -- 01 02 19 06 -- 28
2. Vidisha -- 01 01 03 -- -- 05
3. Ganjbasauda 01 -- 03 08 04 -- 16
4. Kurbai 01 -- -- 02 03 04 10
5. Sironj -- -- -- 43 01 -- 44
6. Nateran -- 03 05 19 08 -- 35
7. Gyaraspur -- -- 01 09 -- 03 13
Total 02 05 12 103 22 07 151
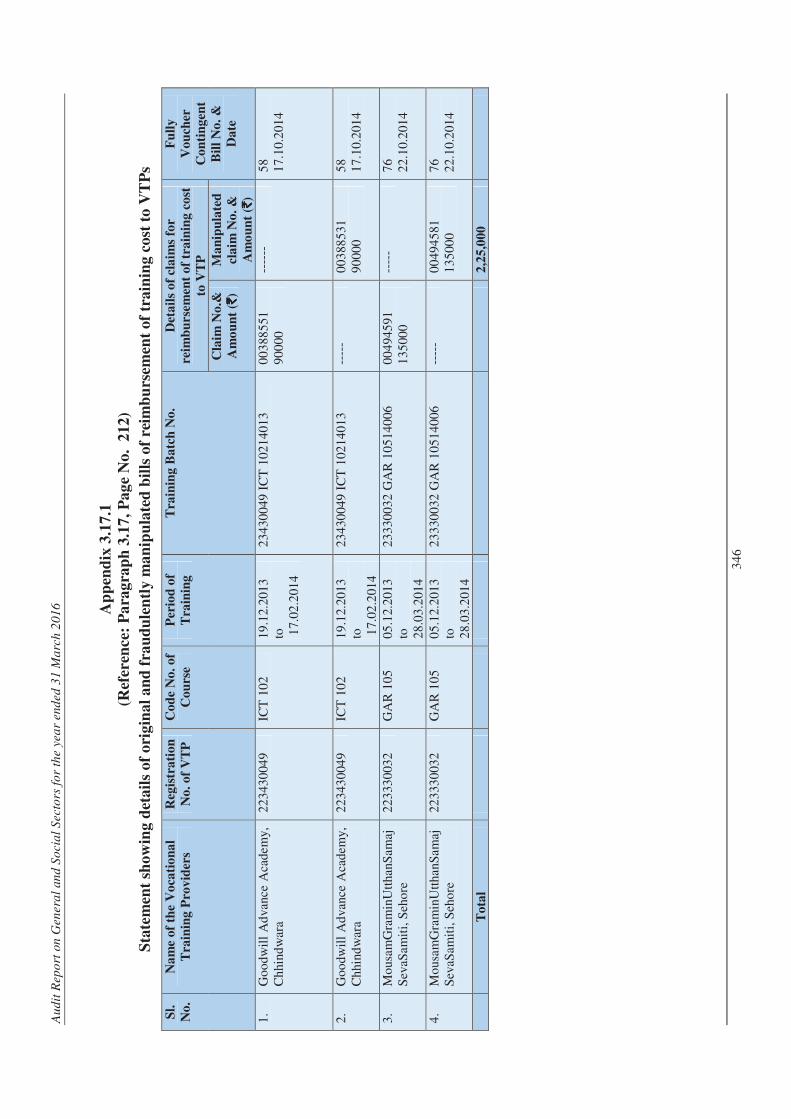
Au
dit
Rep
ort
on
Gen
era
l an
d S
ocia
l S
ecto
rs f
or
the y
ea
r end
ed
31 M
arc
h 2
01
6
34
6
Ap
pen
dix
3.1
7.1
(Ref
eren
ce:
Pa
rag
rap
h 3
.17
, P
ag
e N
o.
21
2)
Sta
tem
ent
sho
win
g d
eta
ils
of
ori
gin
al
an
d f
rau
du
len
tly
ma
nip
ula
ted
bil
ls o
f re
imb
urs
em
ent
of
tra
inin
g c
ost
to
VT
Ps
Sl.
No
.
Na
me
of
the
Vo
cati
on
al
Tra
inin
g P
rov
ider
s
Reg
istr
ati
on
No
. o
f V
TP
Co
de
No
. o
f
Co
urs
e
Per
iod
of
Tra
inin
g
Tra
inin
g B
atc
h N
o.
Det
ail
s o
f cl
aim
s fo
r
reim
bu
rse
men
t o
f tr
ain
ing
co
st
to V
TP
Fu
lly
Vo
uch
er
Co
nti
ng
ent
Bil
l N
o.
&
Da
te
Cla
im N
o.&
Am
ou
nt
(`̀̀̀)
Ma
nip
ula
ted
cla
im N
o.
&
Am
ou
nt
(`̀̀̀)
1.
Go
od
wil
l A
dva
nce
Aca
dem
y,
Ch
hind
war
a 2
23
430
049
ICT
10
2 1
9.1
2.2
013
to
1
7.0
2.2
014
23
430
049
IC
T 1
021
401
3 0
03
885
51
90
000
--
----
5
8 1
7.1
0.2
014
2.
Go
od
wil
l A
dva
nce
Aca
dem
y,
Ch
hind
war
a 2
23
430
049
ICT
10
2 1
9.1
2.2
013
to
1
7.0
2.2
014
23
430
049
IC
T 1
021
401
3 --
---
00
388
531
9
00
00
58
17
.10.
201
4
3.
Mo
usam
Gra
min
Utt
hanS
amaj
Sev
aSam
iti,
Seh
ore
2
23
330
032
GA
R 1
05
0
5.1
2.2
013
to
2
8.0
3.2
014
23
330
032
GA
R 1
05
14
006
0
04
945
91
13
500
0 --
---
76
22
.10.
201
4
4.
Mo
usam
Gra
min
Utt
hanS
amaj
Sev
aSam
iti,
Seh
ore
2
23
330
032
GA
R 1
05
0
5.1
2.2
013
to
2
8.0
3.2
014
23
330
032
GA
R 1
05
14
006
--
---
00
494
581
1
35
000
76
22
.10.
201
4
T
ota
l
2,2
5,0
00
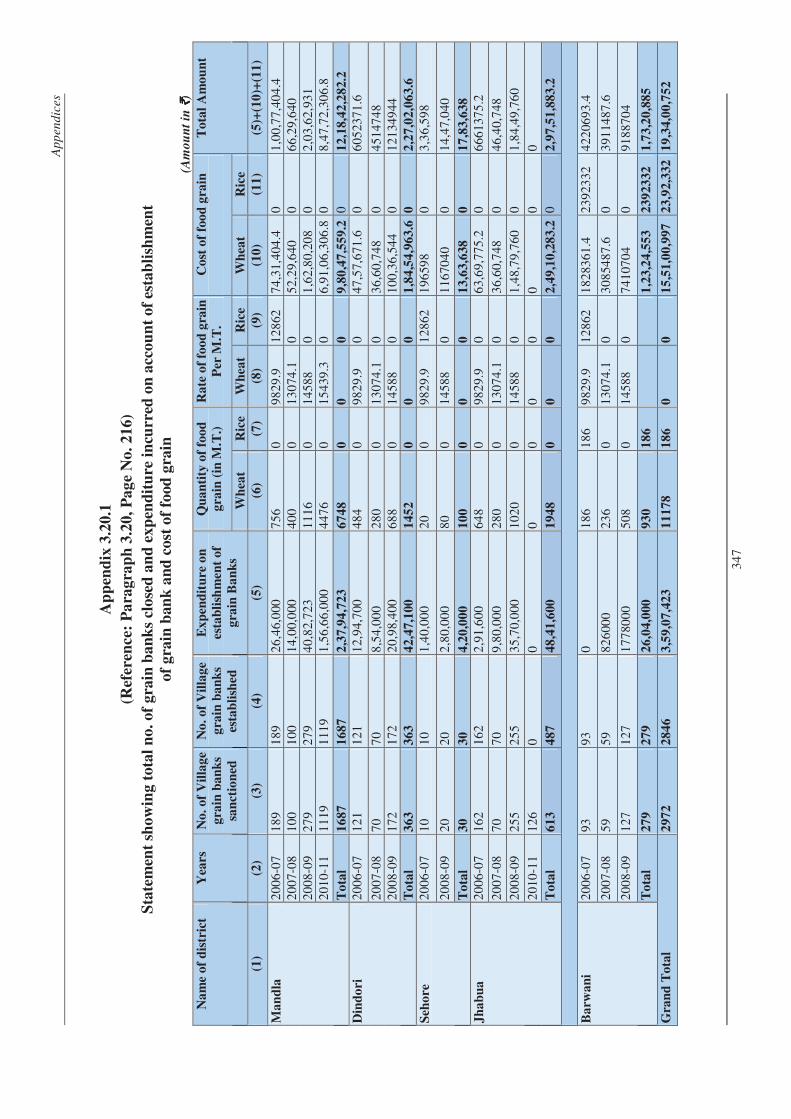
Ap
pen
dic
es
34
7
Ap
pen
dix
3.2
0.1
(Ref
eren
ce:
Pa
rag
rap
h 3
.20
, P
ag
e N
o.
21
6)
Sta
tem
ent
sho
win
g t
ota
l n
o.
of
gra
in b
an
ks
clo
sed
an
d e
xp
end
itu
re i
ncu
rred
on
acc
ou
nt
of
esta
bli
shm
ent
of
gra
in b
an
k a
nd
co
st o
f fo
od
gra
in
(Am
ou
nt
in `̀̀̀
)
Na
me
of
dis
tric
t Y
ears
N
o.
of
Vil
lag
e
gra
in b
an
ks
san
ctio
ned
No
. o
f V
illa
ge
gra
in b
an
ks
esta
bli
shed
Ex
pen
dit
ure
on
esta
bli
shm
ent
of
gra
in B
an
ks
Qu
an
tity
of
foo
d
gra
in (
in M
.T.)
Ra
te o
f fo
od
gra
in
Per
M.T
.
Co
st o
f fo
od
gra
in
To
tal
Am
ou
nt
Wh
eat
Ric
e W
hea
t R
ice
Wh
eat
Ric
e
(1)
(2)
(3)
(4)
(5)
(6)
(7)
(8)
(9)
(10
) (1
1)
(5)+
(10
)+(1
1)
Ma
nd
la
20
06
-07
18
9 1
89
26
,46,
000
7
56
0
98
29
.9
12
862
7
4,3
1,4
04.4
0
1
,00
,77
,40
4.4
2
00
7-0
8 1
00
10
0 1
4,0
0,0
00
40
0 0
1
30
74.1
0
5
2,2
9,6
40
0
66
,29,
640
2
00
8-0
9 2
79
27
9 4
0,8
2,7
23
11
16
0
14
588
0
1
,62
,80
,20
8 0
2
,03
,62
,93
1 2
01
0-1
1 1
11
9 1
11
9 1
,56
,66
,00
0 4
47
6 0
1
54
39.3
0
6
,91
,06
,30
6.8
0
8
,47
,72
,30
6.8
To
tal
16
87
16
87
2,3
7,9
4,7
23
67
48
0
0
0
9,8
0,4
7,5
59
.2
0
12
,18,4
2,2
82.2
Din
do
ri
20
06
-07
12
1 1
21
12
,94,
700
4
84
0
98
29
.9
0
47
,57,
671
.6
0
60
523
71
.6
20
07
-08
70
70
8,5
4,0
00
28
0 0
1
30
74.1
0
3
6,6
0,7
48
0
45
147
48
20
08
-09
17
2 1
72
20
,98,
400
6
88
0
14
588
0
1
00
,36
,54
4 0
1
21
349
44
To
tal
36
3
36
3
42
,47,1
00
14
52
0
0
0
1,8
4,5
4,9
63
.6
0
2,2
7,0
2,0
63
.6
Seh
ore
2
00
6-0
7 1
0 1
0 1
,40
,00
0 2
0 0
9
82
9.9
1
28
62
19
659
8 0
3
,36
,59
8
20
08
-09
20
20
2,8
0,0
00
80
0
14
588
0
1
16
704
0 0
1
4,4
7,0
40
To
tal
30
30
4,2
0,0
00
10
0
0
0
0
13
,63,6
38
0
17
,83,6
38
Jh
ab
ua
2
00
6-0
7 1
62
16
2 2
,91
,60
0 6
48
0
98
29
.9
0
63
,69,
775
.2
0
66
613
75
.2
20
07
-08
70
70
9,8
0,0
00
28
0 0
1
30
74.1
0
3
6,6
0,7
48
0
46
,40,
748
20
08
-09
25
5 2
55
35
,70,
000
1
02
0 0
1
45
88
0
1,4
8,7
9,7
60
0
1,8
4,4
9,7
60
20
10
-11
12
6 0
0
0
0
0
0
0
0
0
To
tal
61
3
48
7
48
,41,6
00
19
48
0
0
0
2,4
9,1
0,2
83
.2
0
2,9
7,5
1,8
83
.2
Ba
rwa
ni
20
06
-07
93
93
0
18
6 1
86
98
29
.9
12
862
1
82
836
1.4
2
39
233
2 4
22
069
3.4
20
07
-08
59
59
82
600
0 2
36
0
13
074
.1
0
30
854
87
.6
0
39
114
87
.6
20
08
-09
12
7 1
27
17
780
00
50
8 0
1
45
88
0
74
107
04
0
91
887
04
To
tal
27
9
27
9
26
,04,0
00
93
0
18
6
1,2
3,2
4,5
53
23
923
32
1,7
3,2
0,8
85
Gra
nd
To
tal
29
72
28
46
3,5
9,0
7,4
23
11
178
18
6
0
0
15
,51,0
0,9
97
23
,92,3
32
19
,34,0
0,7
52
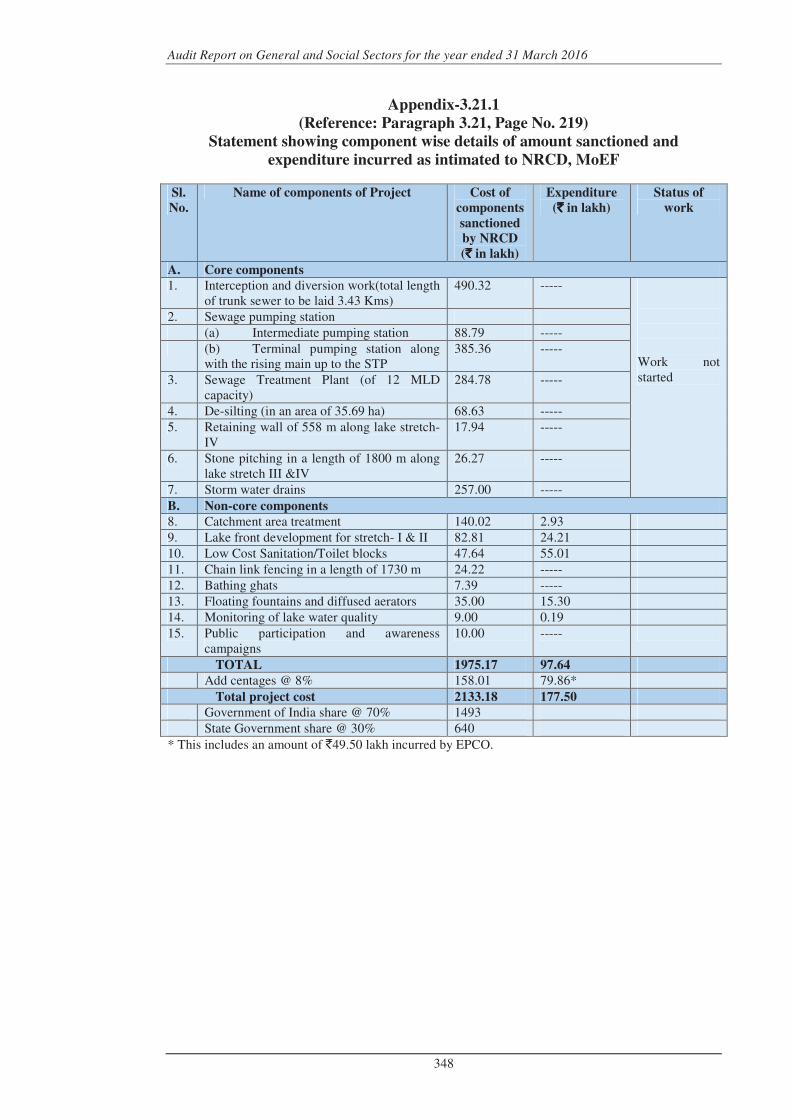
Audit Report on General and Social Sectors for the year ended 31 March 2016
348
Appendix-3.21.1
(Reference: Paragraph 3.21, Page No. 219)
Statement showing component wise details of amount sanctioned and
expenditure incurred as intimated to NRCD, MoEF Sl.
No.
Name of components of Project Cost of
components
sanctioned
by NRCD
(`̀̀̀ in lakh)
Expenditure
(`̀̀̀ in lakh)
Status of
work
A. Core components
1. Interception and diversion work(total length of trunk sewer to be laid 3.43 Kms)
490.32 ----- Work not started
2. Sewage pumping station (a) Intermediate pumping station 88.79 ----- (b) Terminal pumping station along
with the rising main up to the STP 385.36 -----
3. Sewage Treatment Plant (of 12 MLD capacity)
284.78 -----
4. De-silting (in an area of 35.69 ha) 68.63 ----- 5. Retaining wall of 558 m along lake stretch-
IV 17.94 -----
6. Stone pitching in a length of 1800 m along lake stretch III &IV
26.27 -----
7. Storm water drains 257.00 ----- B. Non-core components
8. Catchment area treatment 140.02 2.93 9. Lake front development for stretch- I & II 82.81 24.21 10. Low Cost Sanitation/Toilet blocks 47.64 55.01 11. Chain link fencing in a length of 1730 m 24.22 ----- 12. Bathing ghats 7.39 ----- 13. Floating fountains and diffused aerators 35.00 15.30 14. Monitoring of lake water quality 9.00 0.19 15. Public participation and awareness
campaigns 10.00 -----
TOTAL 1975.17 97.64
Add centages @ 8% 158.01 79.86* Total project cost 2133.18 177.50
Government of India share @ 70% 1493 State Government share @ 30% 640 * This includes an amount of `49.50 lakh incurred by EPCO.
Related Documents